Embed Size (px)
Citation preview

AFGL-TR-88-0098
PRELIMINARY EVALUATIONS OF THE USE OF A 35 GHz RADAR FOR MEASURING CLOUD BASEAND CLOUD TOP HEIGHTS
Kumud R. Biswas and Peter V. HobbsDepartment of Atmospheric SciencesUniversity of WashingtonSeattle, WA 98195 USA
06 June 1988
Final Report1986 August through 1987 December 31
Approved for Public Release; Distribution Unlimited
Prepared forAIR FORCE GEOPHYSICS LABORATORYAIR FORCE SYSTEMS COMMANDUNITED STATES AIR FORCEHANSCOM AIR FORCE BASE, MASSACHUSETTS 01731-5000

"This Technical report has been reviewed and is approved for publication’
^. M^^- ^ Kf’H. ALBERT BROWNContract Manager
^ADONALD D. GRANTHAMBranch Chief
FOR THE COMMANDER
_^_______7, 6^-W^wROBERT A. McCLATCHEY, Dl-re^torAtmospheric Sciences Division
This report has been reviewed by the ESD Public Affai rs Office PA)and is releasable to the National Technical Information Service NTIS
Qualified requestors may obtain additional copies from the DefenseTechnical Information Center All others should apply to the NationalTechnical Information Service
If your address has changed, or if you wish to be removed from themailing list, or if the addressee is no longer employed by yourorganization, please notify AFGL/DAA, Hanscoro AFB, MA 01731 This willassist us in maintaining a current mailing list
Do not return copies of this report unless contractual obligations ornotices on a specific document requi res that it be returned.

mrT.A^TT-rrnSECURITY CLASSIFICATION OF THIS PAGE
REPORT DOCUMENTATION PAGE
Unclassified
2b. DECLASSlFICATlON/DOWNGRADING SCHEDULE
4. PERFORMING ORGANIZAT
Contribution froiResearch Group
University of Washington
DepartmUniversSeattle
8a NAME OP FUNDING/SPONSORINGORGANIZATION
Air Force Geophysics Lab.
Air ForUnitedHanscom
Preliminary Evaluations of the Use of a 35 GHz Radar for Measuring Cloud Base andCloud Top Heights
12. PERSONALBiswas,
13a. TYPE OF REPORTFinal Report
16. SUPPLEMENTARY NOTATION
FIELD
19 ABSTRACT (Continue onTo determine
cloud base and doprojects, have beeradar, and radioso
Comparisons w
evaluating the acelight precipitatiowere within 100very thin clouds wIn light to heavyoften could not de
Cloud base angood agreement pro
DUNCLASSIFIED/UNLIMITED D SAME AS RPT. D OTIC USERS
H. A.
(Oty, State, and ZIP Code)
ent of Atmospheric Sciences AK-40ity of WashingtonWA 98195
Crty, State, and
ce SystemsStates Ail
AFB. MA
AUTHOR(S)Kumud R. and
COSATI CODES
GROUP
Brown
ION RE
m the
ZIP Code)
CommandForce01731-5000
SUB-GROUP
reverse if necessarythe accuracy v
ud top height.n compared tondes.ith in situ aiuracy of then, the heightsm of the heiglere not detectprecipitationtect cloud basd top heightsvided precipit
INDIVIDUAL 22b TELEPHONE (Includt Are* Co*)
PORT NUMBER(S)
Cloud and Aerosol
Hobbs, Peter V.13b TIME COVERED |l4. DATE OF REPORT CYear. Month Day) |lS PAGE COUNTFROM os/1 /Rfi T012/31/8^ 1988/06/06 92
6b OFFICE SYMBOLW applicable)
8b OFFICE SYMBOL(If applicable)
18. SUBJECT TERMS (Continue on reverse
Radar, cloud heights, cei
and identify by block number)with which a vertically-poins, radar data of this type,cloud heights derived from
ircraft observations provide35 GHz radar. In the absencs of cloud bases and cloud thts measured by aircraft flyted by the radar unless theythe 35 GHz radar underesti.
ses.indicated by the 35 GHz radtation was no more than very
(Continued on page ii)
Approved fdistributi
5 MONITORING ORGANIZATION REPORT NUMBER(S)
AFGL-TR-88-0098
7a. NAME OF MONITORING ORGANIZATION
Air ForceGeophysics Laboratory7b ADDRESS (City, State, and ZIP Code)
Hanscom AFBMassachusetts 01731-5000
9 PROCUREMENT INSTRUMENT IDENTIFICATION NUMBERContract F19628-86-C- 0088
10 SOURCE OF FUNDING NUMBERSPROGRAMELEMENT NO
63707F
21. ABSTRACT SECURITY CLASSIFICATIONUnclassified
MARKINGS
/AVAILABILITY OF REPORTor public release;on unlimited
PROJECTNO
2688
if necessary and
lings of cl
ting 35 GHzcollected iiaircraft, a
the most r<e of precipops detecte<ing over th<contained
mated cloud
ar and a 5..light. In
TASKNO
03
identify by block
ouds
radar can detectn earlier research5.5 GHz scanning
eliable means foritation, or in veryd by the 35 GHz radare radar. However,some ice particles.top heights and
5 GHz radar were inheavier precipitation,
22c OFFICE SYMAFGL/LYS
WORK UNITACCESSION NO
FA
number)
XBOL
83 APR edition mayb u**d until xhausfd.All Other ditiomr otaotf.
SECURITY CLASSIFICATION Of THIS PAGE
Unclassified-1-

19. Abstract (Continued)
the accuracy of the 35 GHz radar degraded relative to that of the 5.5 GHz due to attenuation. However, the 35 GHzradar was more accurate than the 5.5 GHz radar in detecting thin ice clouds.
Estimates of cloud heights using radiosonde data was probably ihe least accurate way of evaluating the 35 GHzradar. However, for stratiform clouds, the heights of cloud tops measured by these two techniques agreed to within400 +/- 300 m and for cloud bases to within 120 +/- 90 m.
To further quantify the degree to which a 35 GHz radar can measure cloud heights, it is recommended that adedicated field program be carried out in which a well instrumented research aircraft be flown at various heights over a35 GHz radar in a wide variety of cloud situations.
-u-
ACKNOWLEDGMENTS
We are grateful to all those members of the Cloud and Aerosol Research Group, Atmospheric Sciences
Department, University of Washington, who helped to collect the data used in this study. We thank David Erickson
for help in analyzing the aircraft data from the GALE Project and Kay Dewar for drafting the figures.
-ui-

TABLE OF CONTENTS
AcknowledgmentsList of FiguresList of Tables
1. INTRODUCTION
1.1. Scope of Study
1.2. Data Sources
1.3. Organization of Report
2. PREVIOUS STUDIES USING 35 GHz RADARS
3. CHARACTERISTICS OF THE UNIVERSITY OF WASHINGTON’S 35 GHz RADAR
3.1. Specifications
3.2. Wavelength and Sensitivity
3.3. Beam Width and Horizontal Resolution
3.4. Pulse Length and Vertical Resolution
3.5. Radar Receiver
3.6. Data Display
3.7. Doppler Velocity Information
4. TECHNIQUES OF DATA COLLECTION AND ANALYSIS
4.1. The 35 GHz Radar
4.2. Radiosonde Estimates of Cloud Base and Cloud Top Heights
4.3. Cloud Base and Cloud Top Height from 5.5 GHz Radar
4.4. Cloud Base and Cloud Top Heights from Aircraft Observations
4.5. Rain Intensity
5. CLOUD TYPES STUDIED
5.1. Washington Coast, February 1979
5.2. Washington Coast, November December 1979
5.3. Washington Coast, February 1980
.iv-

TABLE OFCONTENTS (Continued)
5.4. Seattle, Washington, December January 1980 1981
5.5. Washington Coast, January February 1982
5.6. Mid-Atlantic Coast of the United States, January March 1986
6. COMPARISONS OF CLOUD BASE AND CLOUD TOP HEIGHTS MEASUREDWITH THE 35 GHz RADAR AND BY RADIOSONDES
6.1. Observations
6.2 Summary
7. COMPARISONS OF CLOUD BASE AND CLOUD TOP HEIGHTS MEASURED WITH35 GHz AND 5.5 GHz RADARS
7.1. Comparison of Cloud Top Heights from the February 1979 Data Sets
7.2. Comparisons of Cloud Top and Cloud Base Heights from the 1982 Data Sets
7.3. Summary
8. COMPARISONS OF CLOUD BASE AND CLOUD TOP HEIGHTS MEASURED WITHTHE 35 GHz RADAR AND FROM AIRCRAFT
8.1. Observations
8.2. Summary
9. EFFECTS OF PRECIPITATION ON CLOUD TOP HEIGHTS INDICATED BY THE35 GHz RADAR
10. SUMMARY OF RESULTS OF EVALUATION OF THE 35 GHz RADAR FORMEASURING CLOUD HEIGHTS
10.1. Comparison with Radiosondes
10.2. Comparisons with a 5.5 GHz Radar
10.3. Comparisons with Airborne Observations
11. CONCLUDING REMARKS AND RECOMMENDATIONS
List of References
-v-

LIST OF FIGURES
Figure Page
3.1. Color monitor display from the University of Washington’s 35 GHz radar showing a time-height
cross section of digitized reflectivities of cloud and precipitation from 14 February 1980. The
height scale is on the left and the time scale is along the base. Various reflectivity values are
displayed as different colors, with the numerical color code on the right. The color codes can be
converted into dBZ. 9
3.2. Expanded portion of Fig. 3.1 with maximum height reduced to about 9 km and the time scale
expanded by a factor of two. 10
3.3. As for Fig. 3.2, but with weak echoes suppressed to eliminate signals from light precipitation.
Note the emergence of two cloud layers that were hardly distinguishable in Fig. 3.2. 11
3.4. Example of grid point distribution (red dots) for doppler velocity measurements. The grid points
are distributed through the cloud layer. The upper and lower heights and the spacing between the
grid points can be selected by the radar operator. The spectrum of doppler velocities at each grid
point is measured and stored on computer tape. 12
3.5. Doppler velocities measured with the University of Washington’s 35 GHz radar in a precipitation
streamer from an altocumulus cloud layer on 15 January 1982 (a) at cloud level and (b) below
cloud base. The height H (km), time T (hour and minute), and mean doppler velocity v"(cm s’1)are shown alongside each spectrum. Positive and negative values of Vindicate upward and
downward motions, respectively. The PRF of the radar was 4000 Hz. 13
6.1. Comparison of cloud top heights measured by the University of Washington’s 35 GHz radar with
cloud top heights estimated from radiosondes. The radar was located in Seattle from December
1980 to January 1981 and the radiosondes were launched from the radar site. 21
-VI-

LIST OF FIGURES (Continued)
Figure Page
6.2. Comparison of cloud base heights measured by the University of Washington’s 35 GHz radar
with cloud base heights estimated from radiosondes. The radar was located in Seattle from
December 1980 to January 1981 and the radiosondes were launched from radar site. 22
6.3. Comparison of cloud top heights measured by the University of Washington’s 35 GHz radar
with cloud top heights estimated from radiosondes. The radar was located at Pt. Brown, on the
Washington Coast, from January to February 1982 and the radiosondes were launched from the
radar site. The data points are primarily from widespread or stratiform clouds. 23
6.4. As for Fig. 6.3 but for cloud base heights. 25
6.5. Comparison of cloud top heights measured by the University of Washington’s 35 GHz radar
with cloud top heights estimated from radiosonde. The radar was located at Cape Hatteras,
North Carolina, from January to March 1986 and the radiosondes were launched 3 km from
the radar site. Data points are from both convective and stratiform cloud situations. 26
6.6. As for Fig. 6.5 but for cloud base heights.
6.7. As for Fig. 6.5 but for stratiform clouds only.
6.8. As for Fig. 6.6 but for stratiform clouds only.
27
28
29
7.1. Comparison of cloud top heights measured during February 1979 by the University of
Washington’s 35 GHz radar with cloud top heights measured by the NCAR 5.5 GHz radar.
The 35 GHz radar was located at Moclips, on the Washington Coast, and the 5.5 GHz radar
was located 30 km south of Moclips at Pt. Brown. The data points include both convective
and stratiform clouds. 32
7.2. As for Fig. 7.1 but for stratiform clouds only. 33
-Vll-

LIST OF FIGURES (Continued)
Figure Page
7.3. Comparison of cloud top heights measured by the University of Washington’s 35 GHz radar and
the NCAR 5.5 GHz radar for 24 February 1979 when there was relatively heavy precipitation
at the 35 GHz radar site. The 35 GHz radar was located at Moclips, on the Washington Coast,
and the 5.5 GHz radar was located 30 km south of Moclips at Pt. Brown. 34
7.4. Comparison of cloud top heights for stratiform clouds measured by the University of
Washington’s 35 GHz radar with cloud top heights measured by the 5.5 GHz radar. Both radars
were located at Pt. Brown, on the Washington Coast, from January February 1982. 36
7.5. Comparison of cloud base heights for stratiform clouds measured by the University of
Washington’s 35 GHz radar with cloud base heights measured by the 5.5 GHz radar. Both radars
were located at Pt. Brown, on the Washington Coast, from January February 1982. 37
7.6. Comparison of cloud base heights and cloud top heights measured by the University of
Washington’s 35 GHz radar with cloud base heights and cloud top heights measured by the
NCAR 5.5 GHz radar. Both radars were located at PL Brown, on the Washington Coast, in
January 1982. Only data points for non-precipitating cloud layers are plotted. The 35 GHz
radar was operating at maximum sensitivity. 38
7.7. (a) Example of a color display echo pattern from a deep non-precipitating cloud layer measured
by the University of Washington’s vertically-pointing 35 GHz radar between 2200 2215 PST
on 25 January 1982 in the CYCLES Project, (b) Same display as in (a) after eliminating
very light echoes. Note that in (b) the apparent cloud top height has decreased considerably
but the cloud base height remains almost the same. 39
7.8. As for Fig. 7.7 but for the period 2215 2230 PST. 40
-viu-

LIST OF FIGURES (Continued)
Figure Page
7.9. Comparison of cloud top heights measured by the University of Washington’s 35 GHz radar with
cloud top heights measured by the 5.5 GHz radar. Both radars were located at PL Brown, on the
Washington Coast, during January February 1982. The precipitation intensity at the ground
was > 3 mm hr The point on the 1 line was for a marginal rain intensity of 3 mm hr 41
7.10. Comparison of cloud top heights measured by the University of Washington’s 35 GHz radar
with cloud top heights measured by the 5.5 GHz radar. Both radars were located at Pt. Brown,
on the Washington Coast, during January February 1982. Data are for cases when multiple
cloud layers were present and the echo indicated from the 35 GHz radar reached the ground but
there was no recorded precipitation at the ground. 42
7.11. Comparison of cloud base heights measured by the University of Washington’s 35 GHz radar
with cloud base heights measured by the 5.5 GHz radar. The radars were located at PL Brown,
on the Washington Coast, from January to February 1982. Data points are for cases when
multiple cloud layers were present and the echo from the 35 GHz radar reached the ground level,
but there was no recorded precipitation at the ground. 43
8.1. Comparison of cloud top heights indicated by the University of Washington’s 35 GHz radar
with cloud top heights measured from the aircraft The radar was located at Grayland, on the
Washington Coast, from November to December 1979. The data cover a variety of cloud
conditions, including light (but not heavy) precipitation. 47
8.2. Comparison of cloud base heights indicated by the University of Washington’s 35 GHz radar
with cloud base heights measured from aircraft The radar was located at Grayland, on the
Washington Coast, from November to December 1979. The data cover a variety of cloud
conditions. 48
-IX-

LIST OF FIGURES (Continued)
Figure Page
8.3. Radar echo top heights from the University of Washington’s 35 GHz radar plotted against aircraft
flying level over the radar. There was deep cloud above the aircraft in all cases. The radar was
located at Grayland, on the Washington Coast, on December 1979. There was heavy
precipitation at the ground. Means and maxima rainfall intensities ranged from 3.5- 8.1 mm hr’1and 3.5 16.2 mm hr’-, respectively. 49
8.4. Comparison of cloud top height indicated by the University of Washington’s 35 GHz radar with
cloud top heights measured from aircraft. The radar was located at Grayland, on the
Washington Coast, during February 1980 (excluding observations from 14 February 1980). 51
8.5. As for Fig. 8.4 but for selected periods with deep cloud and/or moderate precipitation. 52
8.6. Comparison of cloud top heights indicated by the University of Washington’s 35 GHz radar
with cloud top heights measured from aircraft. The radar was located at Grayland, on the
Washington Coast, on 14 February 1980. There was light intermittent snow at the ground. 53
8.7. Comparison of cloud base heights indicated by the University of Washington’s 35 GHz radar
with cloud base heights measured from aircraft The radar was located at Grayland, on the
Washington Coast, during February 1980. 54
8.8. Comparisons of cloud top heights indicated by the University of Washington’s 35 GHz radar
with cloud top heights measured from aircraft. The radar was located in Seattle, Washington.
from December 1980 to January 1981. 55
8.9. Comparison of cloud base heights indicated by the University of Washington’s 35 GHz radar
with cloud base heights measured from aircraft. The radar was located in Seattle, Washington,
from December 1980 to January 1981. 56
-x-

LIST OF FIGURES (Continued)
Figure
8.10. Comparison of cloud top heights indicated by the University of Washington’s 35 GHz radar
with cloud top heights measured from aircraft. The radar was located at Cape Hatteras,
North Carolina, from January March, 1986. 58
8.11. As for Fig. 8.10 but for cloud base heights. 59
9.1. Variations in cloud top height indicated by the University of Washington’s 35 GHz radar and
rainfall rate at the radar site on December 1979. The radar was located at Grayland, on the
Washington Coast. 63
9.2. Variations in cloud top height indicated by the University of Washington’s 35 GHz radar and
rainfall rate at the radar site on 26 February 1980. The radar was located at Grayland, on the
Washington Coast. 65
9.3. Variations in cloud top height indicated by the University of Washington’s 35 GHz radar, and
rainfall rate at the radar site on 16 January 1982. The radar was located at Pt. Brown, on the
Washington Coast. 67
9.4. Variations in cloud top height indicated by the University of Washington’s 35 GHz radar and
rainfall rate at radar site on 22 January 1982. The radar was located at PL Brown, on the
Washington Coast. 69
9.5. Variations in cloud top height indicated by the University of Washington’s 35 GHz radar and
rainfall rate at the radar site on 12 February 1982. The radar was located at Pt. Brown, on the
Washington Coast. 71
9.6. Variations in cloud top height indicated by the University of Washington’s 35 GHz radar and
rainfall rate at the radar site on 13 February 1982. The radar was located at PL Brown, on the
Washington Coast. 73
-XI-
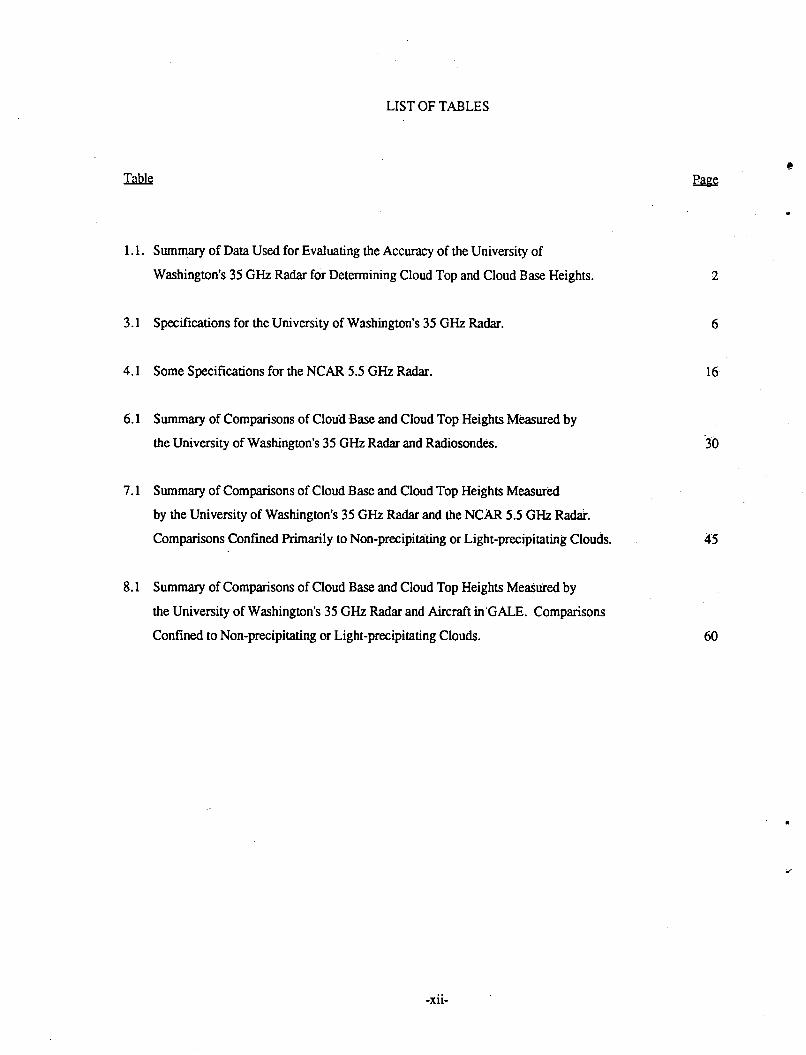
LIST OF TABLES
Table Page
1.1. Summary of Data Used for Evaluating the Accuracy of the University of
Washington’s 35 GHz Radar for Determining Cloud Top and Cloud Base Heights.
3.1 Specifications for the University of Washington’s 35 GHz Radar.
4.1 Some Specifications for the NCAR 5.5 GHz Radar.
6.1 Summary of Comparisons of Cloud Base and Cloud Top Heights Measured by
the University of Washington’s 35 GHz Radar and Radiosondes.
7.1 Summary of Comparisons of Cloud Base and Cloud Top Heights Measured
by the University of Washington’s 35 GHz Radar and the NCAR 5.5 GHz Radar.
Comparisons Confined Primarily to Non-precipitating or Light-precipitating Clouds.
8.1 Summary of Comparisons of Cloud Base and Cloud Top Heights Measured by
the University of Washington’s 35 GHz Radar and Aircraft in GALE. Comparisons
Confined to Non-precipitating or Light-precipitating Clouds.
-Xll-

SECTION 1. INTRODUCTION
1.1. Scope of Study
The Air Force Geophysics Laboratory is involved in developing and evaluating sensors for the automated
measurements of critical weather conditions. The work described in this report, which represents a portion of this
larger study, is concerned with an initial evaluation of the extent to which a 35 GHz (0.86 mm wavelength) radar can
be used to measure cloud base and cloud top heights. This initial evaluation has involved the analysis of data,
gathered in earlier research programs, to assess the accuracy with which the University of Washington’s ground-
based, vertically-pointing 35 GHz radar can detect cloud base and top heights under various weather conditions. This
has been done by comparing the 35 GHz radar measurements with measurements of cloud base and top heights
obtained from aircraft, and also with estimates from radiosondes and a 5.5 GHz (5.5 cm wavelength) radar.
1.2. Data Sources
Since 1974 the Cloud and Aerosol Research (CAR) Group in the Atmospheric Sciences Department at the
University of Washington (U of W) has carried out a series of field programs to study winter cyclonic storms in the
Pacific Northwest (the CYCLES Project). Also, in 1986, the CAR Group participated in a study of winter storms
in North Carolina (the GALE Project). In both these projects a modified Air Force TPQ-11, 35 GHz radar (Paulsen
et al.. 1970) was used on the ground in the vertically-pointing mode to monitor clouds and precipitation.
In both the CYCLES and GALE Projects, data on cloud and precipitation parameters were available from
several other sources, including overflying or nearby research aircraft, radiosondes (sometimes as frequently as every
90 minutes), one or more scanning 5.5 GHz radars, and precipitation gauges. The availabilities of these various data
sources for evaluating the 35 GHz radar are tabulated in Table 1.1.
It should be emphasized that neither the CYCLES nor the GALE field project was designed to evaluate the
accuracy of the 35 GHz radar in determining cloud top and base heights, even though some data suitable for this
purpose were acquired. Consequently, voluminous data sources had to be searched in order to find suitable data for
this study. Also, the data were often not in convenient formats for easy comparison with the 35 GHz radar data.
Nevertheless, as documented in this report, we were able to glean much useful information, which not only provides
an initial evaluation of the capability of a 35 GHz radar for measuring cloud base and top heights but also highlights
topics that need further investigation.
-1-

TABLE 1.1. Summary of Daia Used for Evaluating the Accuracy of the University of Washington’s 35 GHz Radar for Determining Cloud Top and Cloud Base Heights.
Year andTime Period
1986January-March
NCAR’s King Air;
1982JanuaryFebruary
Primary Study Objectivesand Number of
Storms or Cases Studied
Cloud and precipitationstudies (13 storm periods).
Cloud and precipitationstudies and somecomparisons with a 5.5GHz radar (19 storms).
Location of35 GHz Radar
Cape Hatteras,North Carolina
Point Brown, onPacific Coast of
Washington
Total Hoursof RadarOperation
310
308
Radiosonde LaunchedFrom Site?
(Approx. Time IntervalBetween Launches)
Yes(0.5to l2hr)
Yes(2.5 to 3 hr)
Other Radars
of Other Radars
Two 5.5 GHz(NCAR’s CP-3and CP-4)
Two 5.5 GHz(NCAR’s CP-3andCP^)
Supporting [
TotalHours ofOperation
485
ConvairC-131;
292
>aia
InstrumentedAircraft
University ofWashington’s
NOAA’s Sabrclii
NASA’s ER-2
University ofWashington’sB-23; NOAA’s F
Flight HoursOver Region of35 GHz Radar
100
icr;
75
-3
Raingaugcat Site of
35 GHz Radar?
Yes
Yes
Comments
Radiosonde and aircraftdata only analyzed.
Analysis done forradiosonde, one 5.5GHz radar (CP-4) at Pi.Brown and aircraft.
1980- 1981 Cloud and prccipiiation Seattle, at 85 YesDecember studies and some University of (1 day)January verification of (he 35 GHz Washington
radar (8 storms).
University of 20 Yes Radiosonde and aircraftWashington’s B-23 data analyzed.
1980 Study effects of artificial Grayland.on 356 NoFebruary cloud seeding and some Pacific Coast of
verification of 35 GHz radar Washington(13 cases with winter storms,layer clouds and cumulusclouds).
1979 Cloud and precipitation Grayland.on 331 NoNovember studies with winter storms Pacific Coast ofDecember and some calibration of Washington
35 GHz radar (7 storms).
1979 Ctoud and precipitation Moclips, on 214 YesFebruary studies with frontal storms Pacific Coast of (0.5 to 4 hr)March on Pacific Coast Washington
(15 storms).
One 5.5 GHz 265(NCAR’s CP-3)
University of 91 YesWashington’s B-23;University ofWashington’s Navajo;USAFC-130
University of 57 YesWashington’s B-23
University of 121 YesWashington’s B-23;NCAR’s Elecira;USAFsC-130
Most information fromthe University ofWashington aircraft.
Aircraft and someramgaugc data analyzed.
5.5 GHz radar andaircraft data analyzed,Most aircraftinformation fromUniversity ofWashington’s B-23.5.5 GHz radar waslocated at PL Brownon Washington Coast,30 km south of35 GHz radar.

1.3. Organization of Report
In Section 2 of this report we review previous studies that have utilized 35 GHz radars. The technical
characteristics of the U ofW 35 GHz radar are described in Section 3. The ways in which the various data were
collected and analyzed are described in Section 4. Section 5 through Section 9 describe the results of our evaluation
of the 35 GHz radar for measuring cloud base and cloud top heights. Finally, in the last section of this report, the
results of the present study are summarized and recommendations are made for further studies to complete the
evaluation of 35 GHz radars for measuring cloud base and top heights.
-3-

SECTION 2. PREVIOUS STUDIES USING 35 GHz RADARS
Radars operating at frequencies of 35 GHz and 30 GHz were used for a variety of studies in the 1950s and 1960s(e.g., Marshall, 1953; Plank LaL, 1955; Boucher, 1959; Wexler and Atlas, 1959; Harper. 1964, 1966; Stewart,1966). These studies showed that such radars can reveal a variety of interesting cloud features such as cloud heights,precipitation trajectories and patterns, generating cells, melting levels and wind shear.
During the 1960s the U. S. Air Force deployed large numbers of vertically-pointing 35 GHz radars for
continuous measurements of cloud parameters. This network revealed both the potential of such radars and some of
the shortcomings associated with them (Petrocchi and Paulsen, 1966; Paulsen etal.. 1970).Weiss etal, (1979) compared measurements on clouds obtained simultaneously with vertically-pointing 35 and
9.4 GHz radars. They concluded that the 35 GHz radar provided more reliable information on the distribution of
cloud particles, and therefore on cloud-top heights, than a 9.4 GHz radar but that it suffered from greater attenuation.
Hobbs etal. (1981) showed the usefulness of a 35 GHz radar for detecting ice in clouds, including artificial
seeding effects. Hobbs etal. (1985) compared observations with a 35 GHz radar with simultaneous airborne
measurements of cloud structure and showed that the radar could detect clouds in which the diameters of the droplets
do not exceed 27 (im provided there are sufficient concentrations of 10 15 urn diameter droplets. They also noted
that clouds containing only 1 L’1 of 100 (im diameter ice crystals are detectable by the radar.
Some intercomparisons of a 35 GHz radar (in its original Air Force TPQ-11 configuration) with a 5.6 GHz
radar were reported by Super etal. (1986). They reported attenuation of the 35 GHz signal for high altitude clouds (7to 10 km) and degradation of the signal by ice, snow or slush on the antenna dish or radome. Also cloud top heights
determined from the 35 GHz radar were occasionally as much as 1.5 km lower than those indicated by the 5.6 GHzradar. We attribute these deficiencies, in part, to the use of old electronics. Modem solid-state, low-noise,
electronics and improved display systems can overcome some of these problems (see Section 3).Hill (1982) and Hill and Balamos (1982) made some comparisons between cloud top heights detected by a
TPQ-11,35 GHz radar and those derived from limited aircraft observations. The mean difference in cloud top heightsdetected by the radar and those estimated from the radiosondes was +/- 750 m and the corresponding difference between
radar and aircraft estimates was +/- 300 m. The heights derived from the 35 GHz radar were sometimes greater and
sometimes less than the heights obtained from the radiosondes and the aircraft.
Dopplerization of 35 GHz radars have been reported by Pasqualucci etal. (1983), Sauvageot (1982) and Hobbs
SLaL (1985). Weiss etal. (1986) described a new technique for dopplerizing such radars. In a study with 35 GHzand 5.5 GHz doppler radars, Hobbs etal. (1985) found good agreement between the two fields of doppler velocities,
but the 35 GHz radar did better at resolving lower velocities.
-4-

SECTION 3. CHARACTERISTICS OF THE UNIVERSITY OF WASHINGTON’S 35 GHz RADAR
3.1. Specifications
The University of Washington’s 35 GHz radar derives from the U. S. Air Force ANfTPQ-11 radar (Petrocchi
and Paulsen, 1966; Paulsen etal.. 1970). Initially it was used by the University of Washington in its original
configuration for measuring cloud heights (Weiss et al.. 1979). Subsequently, the radar was modernized for the
CYCLES Project by upgrading the electronics (using solid-state electronics for the stable local oscillator and an ultra
low-noise intermediate frequency preamplifier mixer), data-processing and data-display capabilities (Hobbs and Funk,
1984; Hobbs etal.. 1985). Specifications for this radar are given in Table 3.1.
The 35 GHz radar used in the 1986 GALE Project on the East Coast was similar to that used in the CYCLES
Project but it contained a more compact transmitter-receiver, the minimum detectable power of which might have
been slightly different from that listed in Table 3.1. Also, in the GALE Project the radar was only operated at a
pulse repetition frequency (PRF) of 1000 Hz.
3.2. Wavelength and Sensitivity
The reflectivity (i.e., scattering cross-section per unit volume) determines the power returned to the radar by a
target. The reflectivity (Tj) is given by (Battan, 1973);
TT 0T^-L-lk l^ (1)A
where X is the wavelength (in cm) of the radar, k a complex function that is dependent on the dielectric constant off. -a
the reflector, and Zg the effective radar reflectivity factor (in mm m -). Assuming Zg 1 and k 0.91 (for
water), the mean values of T| for water are given by:
10 log r\ -3.5 dB for 5.5 GHz (C-band) (2)
10 log T\ 4.2 dB for 9.4 GHz (X-band) (3)
and. 10 log T| 27.1 dB for 35 GHz (Kg-band) (4)
Thus, other factors being equal, a 35 GHz radar is 23 dB more sensitive than a 9.4 GHz radar and over 30 dB more
sensitive than a 6 GHz radar. However, this advantage of 35 GHz radars is somewhat offset by the fact that the radar
-5-

TABLE 3.1 Specifications for the University of Washington’s 35 GHz Radar.
Frequency (GHz)
Wavelength (cm)
Peak power (kW)
Pulse repetition frequency (Hz)
Pulse duration (ps)
Pulse length (m)
Receiver band width (MHz)
Minimum measurable signal (dBm)
Beam width (deg)
35
0.86
80 (used) 140 (maximum)
1000 or 4000
0.5
150
5
-85
0.26
-6-

constants are not the same for different radars. Also, at 35 GHz there is greater attenuation by water vapor and
hydrometeors than at 5.5 or 9.4 GHz. Recently the expression for the signal-to-noise ratio for weather radars has
been re-examined by Smith (1986) for a variety of scenarios. Smith’s analysis indicates that the \’4 dependency in
Eqn. (1) may not be sufficient to describe the wavelength sensitivities of a radar. Some of these problems may be
overcome by operating at limited ranges. For example, the U ofW 35 GHz radar points vertically upward, so the
maximum range of interest is only 10-20 km. This means that the radar can be operated at a higher PRF,
resulting in greater sensitivity.
3.3. Beam Width and Horizontal Resolution
The antenna of the U ofW 35 GHz radar gives a circular radiation pattern that has a primary beam width (1/2
power point) of 0.26 (0.0045 radians). This results in beam diameters of 4.5 m at a range of 1 km, 25 m at
5 km, and 40 m at 8 km. Thus, the horizontal resolution of the beam is quite high. While this is generally an
advantage, it makes comparison of observations with other radars or with aircraft difficult, since they may not
sample the same target.
3.4. Pulse Length and Vertical Resolution
The vertical resolution of a vertically-pointing radar is roughly equal to one-half of the pulse length of the
radar. The U ofW 35 GHz radar has a pulse length of 150 m (corresponding to a pulse duration of 0.5 us). This
gives a vertical resolution of 75 m. This resolution is fairly good for determining cloud base and cloud top
heights, although the top height might be overestimated by 75 m. Multiple cloud layers will not be revealed as
separate entities unless they are more than 75 m apart The resolution can be improved by going to shorter pulse
lengths, but there are technical limitations. Also, a shorter pulse length results in some loss in sensitivity.
3.5. Radar Receiver
The UofW35 GHz radar receiver consists of an ultra low-noise intermediate frequency (IF) pre-amplifier
mixer, which replaced the original mixer in the TPQ-11. The receiver has an input power-handling capacity of 55
to 60 dB, before the amplifier is saturated. An additional 30 dB of manual attenuation is available (in steps of 1 dB),
which can be used to extend the power-handling capacity to > 85 dB; this provides good detailed reflectivity
information, even with a strong echo.
-7-

3.6. Data Display
On the old TPQ-11 radar, data was recorded on a time-height, grey-scale intensity recorder, which displayed the
intensity of the echo in four shades of grey (Paulsen et al.. 1970). The recorder was an electromechanical system,
and its sensitivity was much less than a CRT display.
In the U ofW 35 GHz radar, the time-height-reflectivity output is digitized and it is displayed in real time on a
color monitor. The data is also recorded on computer tape for subsequent analysis. If necessary, the 60 dB receiver
power span can be handled in 256 steps, thus allowing for very fine resolution in reflectivity measurements.
Generally, however, 10 color steps are used for the 60 dB span.
Figures 3.1 and 3.2 show examples of the reflectivity color displays. The reflectivity scale has been calibrated
to give the dBZ value at any point on the color display. If multiple cloud layers are present, but are not resolved due
to weak echoes between the layers, the heights of the layers can be estimated by artificially suppressing the weak
echoes, as shown on Fig. 3.3. However, this method may not work in moderate to heavy precipitation.
3.7. Doppler Velocity Information
The U ofW 35 GHz radar is dopplerized to provide measurements of particle motions up to 2 m s’^ at a PRF
of 1000 Hz and up to 8 m s"1 at a PRF of 4000 Hz. The velocity information can be gathered from preselected grid
points (as illustrated in Fig. 3.4) in the time-height display and stored on computer tape along with the reflectivitydata. The velocity spectrum at different heights can be displayed on the color monitor or hard copied onto a printer.
The doppler information provides a means for discriminating between rain and cloud particles, and also
determining cloud base heights when there is precipitation below cloud base. Figure 3.5 shows an example of a
doppler velocity spectrum when radar was operating at a PRF of 4000 Hz, so that particle velocities up to 8 m s"1could be measured without ambiguity. The use of doppler data is not discussed further in this report, but it provides
a potential technique for obtaining additional information on cloud heights.
-8-

ElC
t-I0LjJ
I
8
16
14
12-
10
8
6
4
2
0
Figure 3.1. Color monitor display from the University of Washington’s 35 GHz radar showing a time-height cross
section of digitized reflectivities of cloud and precipitation from 14 February 1980. The height scale is on the left
and the time scale is along the base. Various reflectivity values are displayed as different colors, with the numerical
color code on the right. The color codes can be converted into dBZ.
-9-

Figure 3.2. Expanded portion of Fig. 3.1 with maximum height reduced to about 9 km and the time scale expanded
by a factor of two.
-10-

1300 1305
T M E
Figure 3.3. As for Fit;. 3.2. but with weak echoes suppressed to eliminate signals from light precipitation. Note
the emergence of two cloud layers thai were hardly distinguishable in Fig. 3.2.
-11-

0310 031 5
TIM E (PSn
Figure 3.4. Example of grid point distribution (red dots) for doppler velocity measurements. The grid points are
distributed through the cloud layer. The upper and lower heights and the spacing between the grid points can be
selected by the radar operator. The spectrum of doppler velocities at each grid point is measured and stored on
computer tape.
-12-

(ELJ
1UJ>
LJCC
iru
1UJ><LJCC
Figure 3.5. Doppler velocities IT
precipitation streamer from an altocumulus cloud laver on 15 January
cloud base. The heieht H (km).
alongside each spectrum. Positiv
resnectivelv- The PRF of the radar was 4000 Hz.
l.O
0.5-
0-
l.O-
0.5-
0-1.0-
0.5-
0-
I.Oi
0.5-
0 .4 *fl -8 -4 -0
DOPPLER VELOCITY (ms’’)
(a)
1.0-,
0.^ 1o llrtA^^^^^J^1^
I.O-i
Q ^^J^^^^ ’^M
1.0-
0.5-
.?O ff^^-^’1---^/"^^f-
1’0]^i A0 P^*V^-WYWW^AV^^
0 .4 .6 -8 -4 0
OOPPLER VELOCITY (ms")
(b)
icasured with the Universitv of Wasti
time T fhour and minutet. and mean
/e and neeative values of Vindicate unward and downward motions.
A^^^jf^-e^^’
1^^^^J^^^
^^^^-^j^j}^
\f^^f^^^Jf\
^^f^>w^^v\^
H = 3.0T = 0624V = -0.84
H = 2.4T = 06257 = -1.04
H = 2.T = 06277 = -1. 13
H = 1.8T = 06277 = 1.94
H = 1.2T = 0629V = -2.09H = 0.9T = 06297 = -3.16
H = 0.6T = 06307 = -4. 16
H = 0.3T = 06317 = -3.61
H = 0.04T = 06317 =-3.36
linpton’s 35 GHz radar in a
1982 fat at cloud level and (b) below
doooler velocity v"(cm s’1) are shown
-13-

SECTION 4. TECHNIQUES OF DATA COLLECTION AND ANALYSIS
Since the data to be used here derives from field projects that were not designed to check the accuracy or
reliability of the 35 GHz radar, but rather to study clouds and precipitation, it was necessary to survey large amounts
of data for the present study. We describe here the techniques used for collecting and analyzing data from the different
sources.
4.1. The 35 GHz Radar
Whenever the U ofW 35 GHz radar was operating, time-height cross sections of radar reflectivity were collected
on a grey-scale chart recorder and, simultaneously, digitized data were recorded on computer tape (for both on-line
color display and for later detailed analysis). Apart from time periods when very weak and wispy clouds were
overhead (when the radar was operated at its full sensitivity), the reflectivity information was generally normalized to
a 15,000 feet height range (in some cases to 30,000 feet) using the logarithmic mode of amplification of the
receiver. This minimized corrections for range attenuation. In addition, from time to time, depending on conditions,
an additional attenuation (up to 30 dB) was imposed on the input to the radar receiver to avoid saturating the receiver
amplifier. The extent to which this additional attenuation affected the measurements of cloud top height is not
known but, presumably, it would have resulted in an indicated height that was lower than the actual cloud height.
4.2. Radiosonde Estimates of Cloud Base and Cloud Top Heights
Since a large number of radiosondes were launched during both the CYCLES and GALE field projects, we have
attempted to estimate cloud base and cloud top heights from the sounding data for comparison with mean cloud base
and cloud top heights detected by the 35 GHz radar. Cloud tops were assumed to be located at the level where the
sounding indicated that saturation with respect to ice had fallen to about 95%. Cloud base heights were assumed to
be located at the lifting condensation level. Sometimes the lifting condensation level was hard to estimate, since it
depends on the level from which the air parcel is assumed to be lifted. When it was precipitating, the air was often
saturated down to the ground thereby prohibiting any estimate of cloud base height. The cloud top and base heights
estimated from the soundings were probably generally good in widespread stratiform situations but less reliable in
other (more convective) situations.
4.3. Cloud Base and Cloud Top Height From 5.5 GHz Radar
During several of the field projects, a 5.5 GHz scanning radar from the National Center for Atmospheric
Research (NCAR) was located close to the U ofW 35 GHz vertically-pointing radar. The 5.5 GHz radar had a greater
-14-

peak power (over 300 kW) than the 35 GHz radar (80 kW) and the 5.5 GHz radar had highly sensitive receivers
(minimum detectable signal -105 dBm) and suffered negligible attenuation from hydrometeors or water vapor. On
the other hand, because of its lower frequency, the 5.5 GHz radar is not expected to detect non-precipitating clouds as
well as the 35 GHz radar. Specifications for the NCAR 5.5 GHz radar are listed in Table 4.1.
On most occasions the 5.5 and 35 GHz radars were located at the same site, but in the February March 1979
CYCLES Project the 5.5 GHz radar was located 30 km south of the 35 GHz radar. The 5.5 GHz radar was generally
operated in a PPI mode, but, on occasions, it was pointed vertically. When the two radars were at the same site, we
used the highest elevation angle PPI color displays, at intervals of 15 to 30 min, for estimating mean cloud heights
over an area surrounding the 5.5 GHz radar. When the two radars were 30 km apart we used the 5.5 GHz cloud
height information in the direction toward the 35 GHz radar, so that the cloud regions sampled by both radars were
similar.
Data from the 5.5 GHz radar were available on computer tape and on rime lapse 16 mm color movie film.
Estimates of cloud top heights were not difficult, but cloud base heights were sometimes difficult to measure,
particularly when the bases were low, due to low-level ground clutter and receiver noise and because the transmit-
receive switch on the 5.5 GHz radar restricts measurements to targets ^ 1500 m above the radar. Height estimates
were corrected for beam curvature using the US standard atmosphere.
4.4. Cloud Base and Cloud Top Heights From Aircraft Observations
The most reliable method for determining cloud base and cloud top heights was from an aircraft flying over the
vertically-pointing 35 GHz radar. The location of the aircraft relative to the radar was generally determined from
flight track recordings. If these were not available, the flight track was constructed from the VOR-DME data recorded
aboard the aircraft. The position of the aircraft with respect to the cloud was determined from in-flight voice
recordings and the ground-control logs and confirmed by checking on-board cloud microphysical measurements.
The U ofW research aircraft was equipped with three PMS particle measuring probes (15 size channels each)
that measured the sizes of cloud and precipitation particles. The aircraft also had PMS 2-D probes that recorded
images of the types and sizes of cloud and precipitation particles. Additional microphysical data, such as cloud liquid
water content (Johnson-Williams) and ice particle concentrations, were also available. The aircraft flight level was
derived from the on-board pressure record, which was converted to height using sounding data. When sounding data
was not available, the standard pressure-height scale on the pseudo-adiabatic chart was used, after correcting the
height scale with the 500 mb height from the weather chart closest in time to the flight
-15-

TABLE 4.1 Some Specifications for the NCAR 5.5 GHz Radar.
Wavelength (cm)
Peak power (kW)
Pulse repetition frequency (Hz)
Pulse length (us)
Receiver band width (MHz)
Minimum measurable signal (dBm)
Antenna diameter (m)
Beam width (deg)
5.5
316
1000 and 769.2
1
10
-105
3.7
1.05
-16-

4.5. Rain Intensity
A ground-based, tipping bucket raingauge was generally located at the radar site. The rainfall intensity (up to
32 mm hr’1) was recorded on computer tape. These data were used to determine the variations in rainfall intensity
over 5 minute intervals.
-17-

SECTION 5. CLOUD TYPES STUDIED
5.1. Washington Coast. February 1979
We will use data collected at Pt. Brown on the Pacific Coast of Washington State in February 1979 to compare
cloud heights observed with the 35 GHz radar with cloud heights observed by the 5.5 GHz radar which was located at
Moclips 30 km to the north of Pt. Brown.
During this period measurements were obtained in clouds associated with an occlusion (17 February), multiple
cloud layers (20 February), rather uniform wann-frontal clouds (24 26 February), and rather uniform clouds
associated with warm advection (26 February). The cloud types included cumulus, stratocumulus, altocumulus,
altostratus, cirrus, and cirrocumulus.
5.2. Washington Coast. November December 1979
In November December 1979, the 35 GHz radar was located at Grayland, on the Pacific Coast of Washington
State, and the U ofW B-23 aircraft flew over the radar. Both the weather and the cloud types encountered were quite
variable. The clouds include non-precipitating multiple layers associated with a weak cold-frontal system (15
November), low-level clouds (4 December), convective clouds associated with a comma cloud in a polar airstream
(18 November), non-precipitating cloud layers in a pre-frontal system (21 November), upper-level generating cells
associated with a cold-frontal passage in an occluded system (25 November), cumulus, stratocumulus and multiple
diffused middle- and upper-level clouds in a dissipating weather system (29 November), uniform and deep wann-
frontal precipitating clouds (1 December), altostratus and altocumulus clouds, and low-level and thin upper-level
clouds associated with a warm sector of a frontal system (5 December), an extensive band of non-precipitating low
and mid-level clouds and, at times, drizzle from the low clouds (6 December).
5.3. Washington Coast. February 1980
In February 1980, the 35 GHz radar was located at Grayland, on the Pacific Coast of Washington State, and
cloud heights observed with this radar are compared with theUofW B-23 aircraft flying overhead. Varying weather
conditions and cloud types were encountered, they included scattered stratocumulus, cumulus, altocumulus,
altostratus, thin and layered cirrus, cirrocumulus and, at times, deeper altocumulus layers that persisted for long
periods with no precipitation, multiple layered clouds, and deep frontal stratocumulus and nimbostratus with light to
moderate rain. There was even a day (14 February) with intermittent snow at the ground from moderately deep cloud.
-18-
5.4. Seattle. Washington. December January 1980 1981
During December January 1980 1981, the radar was located in Seattle, Washington, and radiosondes were
launched from the same site. Cloud heights observed with the 35 GHz radar were compared with those estimated
from the U ofW B-23 overflying aircraft and from radiosondes launched from the radar site.
The period was characterized by general low- and mid-level clouds (stratocumulus, cumulus, altocumulus and
altostratus), which often formed decks of multiple layers that were often broken or scattered. Cloud tops generally
had a uniform structure, but at times they contained generating cells and fallstreaks. Fallstreaks between layers often
obscured individual cloud layers. Light intermittent precipitation was sometimes present
5.5. Washington Coast. January February 1982
During January February 1982, the 35 GHz radar was located at PL Brown on the Washington Coast. Cloud
heights from the 35 GHz radar were compared with estimates of cloud heights from radiosondes, the 5.5 GHz radar
and from the U ofW B-23 aircraft.
The clouds encountered were isolated cumulus (7 January), upper-level clouds associated with a weak synoptic
system (10 January), shallow rainbands (13 January), deep stratiform clouds in a strong frontal system (15, 16 and
17 January), deep precipitating clouds associated with warm advection (22 January), non-precipitating and
precipitating cloud layers associated with occluded and warm fronts with generating cells (24 25 January),
widespread convective activity with well-defined rainbands composed of cumuliform clouds (26 January), clouds
associated with a warm occlusion (30 January), thin clouds with occasional fallstreaks (8 February), non-frontal
clouds (10 February), postfrontal cumuli (11 February) and multiple layers of non-precipitating and precipitating
clouds associated with warm advection (12- 13 February).
5.6. Mid-Atlantic Coast of the United States. January March 1986
From January 15 through March 15, the radar was located at Cape Hatteras, North Carolina. Cloud heights
from the 35 GHz radar were compared with those from radiosondes, launched 3 km from the radar site, and with
airborne observations.
A variety of weather and cloud conditions were encountered, ranging from scattered cumulus and large
cumulonimbus to widespread and deep stratiform cloud layers.
-19-

SECTION 6. COMPARISONS OF CLOUD BASE AND CLOUD TOP HEIGHTS MEASURED WITH THE 35
GHz RADAR AND BY RADIOSONDES
In this section, data on cloud base and cloud top heights determined from the 35 GHz radar are compared with
estimates of cloud heights from radiosondes launched from or near the radar site.
6.1. Observations
During the period December January 1980 1981 the U ofW 35 GHz radar was located at the University of
Washington in Seattle and radiosondes were launched once a day from the radar site. Out of seven radiosondes
launched during this period, six provided seven estimates of mean cloud top heights (one of the soundings provided
two estimates due to the presence of two cloud layers).
The relation between the cloud top"heights measured by the 35 GHz radar and those deduced from the soundings
are shown in Fig. 6.1. The correlation coefficient between the two sets of data points is 0.96. The mean difference
between the two sets of measurements is about +/- 400 m*, and the standard deviation of the mean difference is
340 m.
Fewer pairs of data points were available for comparing cloud base heights. The comparison is shown in Fig.
6.2. The correlation coefficient is high (0.99), but the mean difference between the two techniques is about
+/- 460 m and the standard deviation of this mean difference is 370 m.
Since .the data set is small, we have not attempted any stratification by cloud type. The cloud conditions were
variable at times, even broken or scattered.
From January February 1982 the U ofW 35 GHz radar was located at PL Brown on the Washington Coast
and several radiosondes were launched on each operational day from-the same site. Ninety-one radiosondes were
launched during this period, but cloud top and cloud base heights for comparison with the radar could.be estimated
from only thirty-one sondes. On most of these occasions there was widespread or stratiform cloud, and on a very few
occasions convective clouds.
The relationship between the radar indicated and radiosonde estimated cloud top heights are shown in Fig. 6.3.
Although the correlation is good (r 0.96), the scatter is rather high. The mean difference between the two sets of
measurements is +/- 460 m and the standard deviation of the mean difference 430 m.
The data set for comparing cloud base heights is fewer in number, because those soundings which were moist
down to the ground, or for which the 35 GHz radar echo reached the ground, could not be used for this purpose. The
*When the difference between two sets of measurements is indicated as being +/-, the data points were distributedon either side of the perfect-fit (1 1) line.
-20-

9
0
<LU
8cc<Q<crNi0 6inCO
CDQLU
5
5 4Q2
3(^LU1 2Q.
Q 1
00 1 2 3 4 5 6 7 8 9
CLOUD TOP HEIGHT ESTIMATED FROM RADIOSONDE (km)
Figure 6.1. Comparison of cloud top heights measured bv the University of Washington’s 35 GHz radar with cloud
top heights estimated from radiosondes. The radar was located in Seattle from December 1980 to January 1981 and
the radiosondes were launched from the radar site.
-21-

-t:
cc<Q<CENI0inCO
CQ
QLU
S0QZ
I
^LUILUCO<CDQ
802<LU
0 1 2 3 4 5 6 7 8 9
CLOUD BASE HEIGHT ESTIMATED FROM RADIOSONDE (km)
Figure 6.2. Comparison of cloud base heights measured bv the University of Washington’s 35 GHz radar with cloud
base heights estimated from radiosondes. The radar was located in Seattle from December 1980 to January 1981 and
the radiosondes were launched from radar site.
-22-

9-<:
GC
8<IT
S 70inCO
>-CDQLU
S0Q
<LU
6
5
2 4t-3:0 3UJI0-
? 2Q
8 10
o0 1 2 3 4 5 6 7 8 9
CLOUD TOP HEIGHT ESTIMATED FROM RADIOSONDE (km)
Figure 6.3. Comparison of cloud top heights measured bv the University of Washington’s 35 GHz radar with cloud
top heights estimated from radiosondes. The radar was located at Pt. Brown, on the Washington Coast, from January
to February 1982 and the radiosondes were launched from the radar site. The data points are primarily from
widespread or stratiform clouds.
-23-

results are shown in Fig. 6.4. The correlation between the two data sets is 0.94, with a mean difference of about
+/- 400 m and a standard deviation of 300 m.
From January March 1986 the U ofW 35 GHz radar was located at Cape Hatteras on the Atlantic Coast of
North Carolina; National Weather Service radiosondes were launched 3 km away. Depending on the weather there
were as many as 7 or 8 radiosondes launched each day, sometimes as frequent as every hour. In total, there were
about fifty-six radiosonde soundings during this period, thirty-seven of which were associated with some type of
cloud echo recorded by the 35 GHz radar. Including cases of multiple cloud layers, there were forty-five comparable
pairs of data points for cloud top height and twenty-three comparable pairs of data points for cloud base height for
comparing the radar and radiosonde estimates. The fewer data points for cloud base height is due primarily to the fact
that if precipitation is present it is either difficult (extended virga) or impossible to detect cloud base heights with the
35 GHz radar.
The relationship between the two sets of measurements for cloud top height is shown in Fig. 6.5. The overall
correlation between the two data sets is 0.89, but considerable scatter is apparent with a mean difference of about
+/- 700 m and a standard deviation of the mean difference of 730 m.
The relationship between the measurements for cloud base height from the two data sets is shown in Fig. 6.6.
The correlation is 0.93, but the scatter is again large; the mean difference in heights is +/- 550 m with a standard
deviation of 670 m.
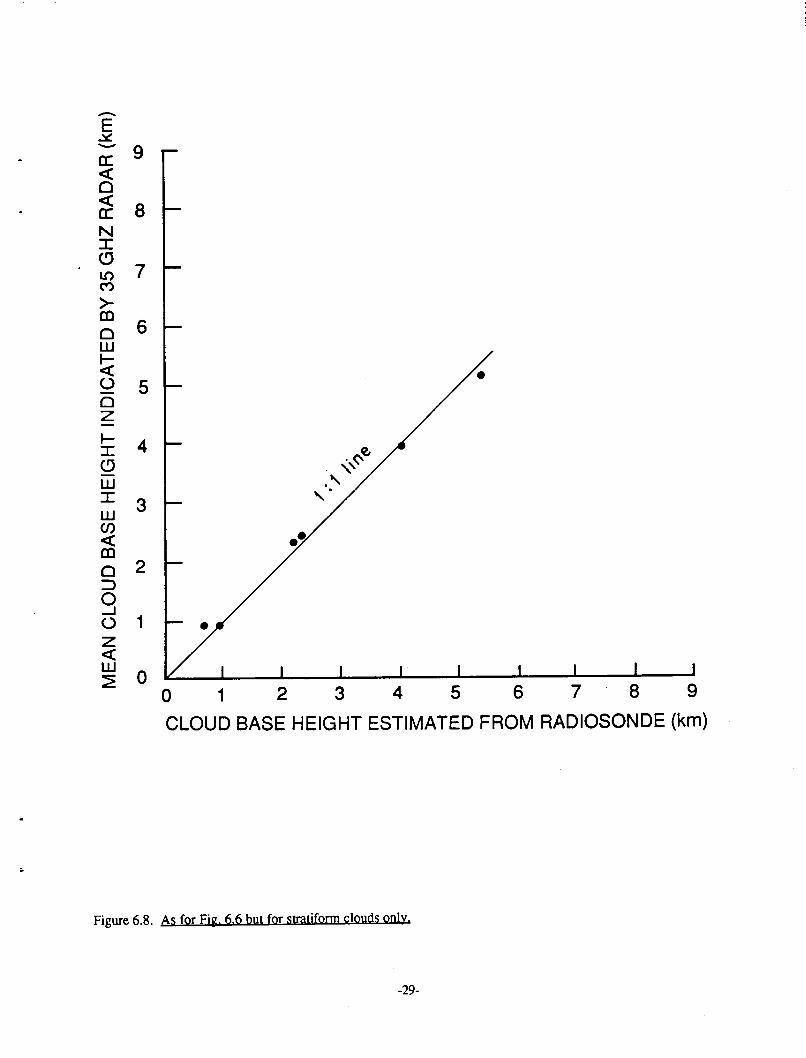
If we restrict our attention to widespread stratiform clouds, the relationships improve (Figs. 6.7 and 6.8). For
cloud top height the correlation is now 0.97 and the mean difference reduces to +/- 380 m with a standard deviation of
300 m. For cloud base height the correlation coefficient between the two data sets for stratiform clouds is 0.99
with a mean difference of +/- 120 m and a standard deviation of 90 m.
6.2 Summary
A summary of the comparisons of cloud base and cloud top heights measured by the U ofW 35 GHz radar and
those derived from radiosondes is contained in Table 6.1. The cloud top heights derived from these two techniques
agree with each other to within 400 (+/- 340 m) 700 (+/- 730 m). In the case of stratiform clouds, the agreement for
cloud tops is to within 400 +/- 300 m and for cloud bases to within 120 +/- 90 m.
In a similar study, but using a more limited data set. Hill and Balamos (1982) obtained a difference of 700 m
between the heights of clouds (excluding deep convection) determined from a 35 GHz radar and from radiosondes.
We did not investigate the effects of heavy precipitation on these comparisons, although a few cases of light to
moderate precipitation, and a few cases of heavy precipitation, are included in the data sets described above.
-24-

-X:
(T 9<Q
8NI0in 7CO
m<-
Q 6LU
s<0 5Q
0 1 2 3 4 5 6 7 8 9
CLOUD BASE HEIGHT ESTIMATED FROM RADIOSONDE (km)
Figure 6.4. As for Fig. 6.3 but for cloud base heights.
-25-

0 1 2 3 4 5 6 7 8 9
CLOUD TOP HEIGHT ESTIMATED FROM RADIOSONDE (km)
Figure 6.5. Compjrison of cloud top heights measured by the University of Washington’s 35 GHz radar with cloud
too heights estimated from radiosonde. The radar was located at Cape Hatteras. North Carolina, from January to
March 1986 and the radiosondes were launched 3 km from the radar site. Data points are from both convective and
stratiform cloud situations.
-26-

0 1 2 3 4 5 6 7 8 9
CLOUD BASE HEIGHT ESTIMATED FROM RADIOSONDE (km)
Figure 6.6. As for Fig. 6.5 but for cloud base heights.
-27-

0 1 2 3 4 5 6 7 8 9CLOUD TOP HEIGHT ESTIMATED FROM RADIOSONDE (km)
Figure 6.7. As for Fig. 6.5 but for stratiform clouds only.
-28-
0 1 2 3 4 5 6 7 8 9
CLOUD BASE HEIGHT ESTIMATED FROM RADIOSONDE (km)
Figure 6.8. As for Fig. 6-6 hut for stratiform clouds only.
-29-

6.1 Summary of Comparisons of Cloud Base and Cloud Top Heights Measured by the University of Washington’s35 GHz Radar and Radiosondes.
Period and Location Data Comparison Number of Correlationpairs of coefficient
data points between the twodata sets
Mean difference in Standard deviationheights between of mean differencethe two data sets in heights
(meters) (meters)
Decemi1980-Seattle,
3er January1981WA
Cloud top heightcomparisons forall clouds.
7 0.96 +/- 400 340
December January1980 1981Seattle. WA
January February1982Pt. Brown, WA
January February1982Pt. Brown, WA
January March1986Cape Hatteras; NC
January -March1986Cape Hatteras, NC
January March1986Cape Hatteras, NC
January March1986Cape Hatteras, NC
Cloud base height 4comparisons forall clouds.
Cloud top height 31comparisons,mostly stratiformclouds.
Cloud.base height 10comparisons,mostly stratiformclouds.
Cloud top height 45comparisons forall clouds.
Cloud base height 23comparisons forall clouds.
Cloud top height 18comparison,stratiform cloudsonly.
Cloud base height 6comparisons,stratiform cloudsonly.
0.99
0.96
0.94
0.89
0.93
0.97
0.99
+/- 460
+/- 500
+/- 400
+/- 700
+/- 550
+/-400
+/- 120
370
400
300
730
700
300
90
-30-

SECTION 7. COMPARISONS OF CLOUD BASE AND CLOUD TOP HEIGHTS MEASURED WITH
35 GHz AND 5.5 GHz RADARS
The University of Washington 35 GHz and the NCAR 5.5 GHz radars were operated close together and
simultaneously during research projects in 1979, 1982 and 1986. In this section, we compare measurements from
these two radars for the 1979 and 1982 projects.
7.1. Comparison of Cloud Top Heights from the February 1979 Data Set
During February 1979 the U ofW 35 GHz radar was located at Moclips on the Washington Coast, and the
NCAR 5.5 GHz radar was located at Pt. Brown on the Washington Coast which is 30 km south of Moclips. Cloud
heights were determined from the highest elevation angle PPI scans of the 5.5 GHz radar along an azimuth pointed
toward Moclips. These heights were then compared with those from the vertically-pointing 35 GHz radar at
Moclips.
Figure 7.1 shows the scatter diagram for the two sets of measurements of cloud top heights. The 102 data
points shown in this figure include both non-convective and convective clouds. As can be seen, there is some scatter
around the 1 1 perfect-fit line but the correlation coefficient is high (r 0.97). The mean difference between the
cloud top heights measured by the two radars is about +/- 260 m with a standard deviation of 230 m.
To improve the chances that the two radars were sampling the same cloud, the comparison can be restricted to
widespread, non-convective cloud. The results for seventy-nine such pairs of such measurements are shown in Fig.
7.2. The correlation coefficient is now 0.99, and the mean difference between the cloud top heights measured by the
two radars is +/- 190 m with a standard deviation of 190 m.
The cloud top heights measured by the two radars differed by greater amounts when heavy precipitation was
present. For example, on 24 February 1979 the rain intensity over the 35 GHz radar was > 3 mm hr’1. The relation
between cloud top heights measured by the two radars on this occasion is shown in Fig. 7.3. In the majority of
cases the cloud top height indicated by the 35 GHz radar was lower (at times over 1000 m lower) than that measured
by the 5.5 GHz radar. This was no doubt due to greater attenuation by precipitation at 35 GHz than at 5.5 GHz.
(See Section 9 for further discussion of the effects of attenuation on cloud heights determined by the 35 GHz radar.)
Too few cloud base measurements from the two radars were available during this period to permit a meaningful
comparison.
7.2. Comparisons of Cloud Top and Cloud Base Heights From me 1982 Data Sets
In 1982 the University of Washington 35 GHz and NCAR 5.5 GHz radars were located alongside each other at
Pt. Brown on the Washington Coast. Cloud height measurements from the 5.5 GHz radar were obtained from the
-31-

9
0
8^CE
<CCN3:0 6inCO
I 5LU
4Q
30LU
^ 2
PQ 1
00 1 2 3 4 5 6 7 8 9
CLOUD TOP HEIGHT INDICATED BY 5.5 GHz RADAR (km)
Figure 7.1. Comparison of cloud top heights measured during February 1979 bv the University of Washington’s 35
GHz radar with cloud top heights measured bv the NCAR 5.5 GHz radar. The 35 GHz radar was located at Moclins.was
on the Washington Coast, and the 5.5 GHz radar was located 30 km south of Moclips at Pt. Brown. The data points
include both convective and stratiform clouds.
-32-

0
9 T-
i 8cc
s 7NI0 6inCO
S 5LU
4Q
3
^LU^ 20
Q 1
00 1 2 3 4 5 6 7 8 9
CLOUD TOP HEIGHT INDICATED BY 5.5 GHz RADAR (km)
Figure 7.2. As for Fig. 7.1 but for stratiform clouds only.
-33-

0 1 2 3 4 5 6 7 8 9
CLOUD TOP HEIGHT INDICATED BY 5.5 GHz RADAR (km)
Figure 7.3. Comparison of cloud top heights measured bv the University of Washington’s 35 GHz radar and the
NCAR 5.5 GHz radar for 24 February 1979 when there was relatively heavy precipitation at the 35 GHz radar site.
The 35 GHz radar was located at Moclips. on the Washington Coast, and the 5.5 GHz radar was located 30 km south
of Moclips at Pt. Brown.
-34-

highest elevation angle PPI scans, and these were compared to cloud heights overhead measured with the vertically-
pointing 35 GHz radar. The comparisons were restricted to widespread stratiform clouds. During this period there
were 151 comparable pairs of cloud top heights measurements from the two radars. The relationship between the
measurements is shown in Fig. 7.4. The overall correlation coefficient is 0.97. The mean difference between cloud
top heights measured by the two radars was about +/- 290 m and the standard deviation of the mean difference
280 m. Note that the difference between the two measurements generally increases with increasing cloud top
height.
The comparison for cloud base heights measured by the two radars is shown in Fig. 7.5. In this case there are
thirty pairs of comparable data points; the number of points is smaller than for cloud top height measurements
because in some cases precipitation extending to the ground made it impossible to measure the cloud base height.
The correlation coefficient between the measurements of cloud base heights from the two radars is 0.99, with a mean
difference of about +/- 230 m.
From 24 26 January 1982, non-precipitating cloud layers were present over Pt. Brown for a considerable
period of time. The 35 GHz radar was operating at its highest sensitivity with no additional electronic attenuation
(since there was no precipitation present to saturate the receiver). Figure 7.6 compares the cloud top and cloud base
heights measured by the two radars during this period. The correlation between the cloud base height measurements
is reasonable good (r 0.79), but the cloud top heights indicated by the 35 GHz radar are consistently higher than
those indicated by the 5.5 GHz radar. Shown in Figs. 7.7(a) and 7.8(a) are color displays from the vertically-
pointing 35 GHz radar. The bases are strongly defined but the tops less so. If the weaker echoes are removed (to
simulate a decrease in radar sensitivity), the apparent cloud top height decreases considerably, as shown in Figs.
7.7(b) and 7.8(b), but there is almost no change in the cloud base height [compare Fig. 7.7(a) with Fig. 7.8(a)].
This simulation shows that the particle sizes and/or particle concentration at cloud top were sufficiently small that
the full sensitivity of the 34 GHz radar was needed to detect the cloud top. It appears, therefore, that the primary
reason why the cloud top heights deduced by the 5.5 GHz radar were lower than those detected by the 35 GHz radar
was the lower sensitivity of the former radar to the small and/or low concentrations of cloud particles at cloud top.
On several occasions simultaneous measurements of cloud top heights were obtained from the two radars when
precipitation rates at the ground were moderately high (> 3 mm hr-1). The relation between the cloud top height
measurements on these occasions is shown on Fig. 7.9. In most cases the 5.5 GHz radar indicates a persistently
higher cloud top height. We attribute this to attenuation of the 35 GHz signal by moderate rain.
Multiple cloud layers were present on several occasions in the 1982 field program. When the two radars were
operating side by side (8, 10, 11 and 12 February) the 35 GHz radar often showed echoes from the lowest cloud layer
reaching the ground, although no precipitation was recorded at the ground. Comparisons of cloud top and cloud base
heights are shown in Figs. 7.10 and 7.11, respectively. The base heights measurements are primarily for upper
cloud layers, since, although no precipitation was recorded at the ground, the 35 GHz radar often showed echoes from
the lower layer reaching the ground. Both cloud top and cloud base heights measured by the two radars are in good
-35-

0 1 2 3 4 5 6 7 8 9CLOUD TOP HEIGHT INDICATED BY 5.5 GHz RADAR (km)
Figure 7.4. Comparison of cloud ton heights for stratiform clouds measured bv the University ofWashinpon’s 35
GHz radar with cloud top heights measured bv the 5.5 GHz radar. Both radars were located at Pt. Brown, on the
Washington Coast, from January February 19S2.
-36-

9
8-^cc<Q<GCNI0 6inCO
>-COQLU
5
S 4Q2
3I-
LU1 2Q-
Q 1
^ 0
CLOUD TOP HEIGHT INDICATED BY 5.5 GHz RADAR (km)
Figure 7.5. Comparison of cloud base heights for stratiform clouds measured by the University of Washington’s 35
GHz radar with cloud base heights measured bv the 5.5 GHz radar. Both radars were located at Pt. Brown, on the
Washington Coast, from January February 1982.
-37-

I0
^ Is s^ QQ <D CE0 N
0 0
S
^O QGi ^UJ oSg Q5 zQ
80
/ Cloud top
1 2 3 4 5 6 7 8CLOUD BASE HEIGHT OR CLOUD TOP HEIGHT
INDICATED BY 5.5 GHz RADAR (km)
Figure 7.6. Comparison of cloud base heights and cloud lop heights measured bv the University of Washington’s 35
GHz radar with cloud base heights and cloud top heights measured by the NCAR 5.5 GHz radar. Both radars were
located at PL Brown, on the Washington Coast, in January 1982. Only data points for non-precipitating cloud
layers are plotted. The 35 GHz radar was operating at maximum sensitivity.
-38-

2200 2205TI ME (PST)
2210 2200 2205
TIME ( PST )2210
Figure 7.7. (a) Example of a color display echo pattern from a deep non-precipitating cloud layer measured by the U ofW vertically-pointing 35 GHz radar
between 2200 2215 PST on 25 January 1982 in the CYCLES Project, fb) Same display as in (a) after eliminating very light echoes. Note that in (b) the
apparent cloud top height has decreased considerably but the cloud base height remains almost the same.

2220
TIME (PST)
2215 2220
TI ME (PST)
2225 2215
Figure 7.8. As for Fig. 7.7 but for the period 2215 2230 PST.

0 1 2 3 4 5 6 7 8 9
CLOUD TOP HEIGHT INDICATED BY 5.5 GHz RADAR (km)
Figure 7.9. Comparison of cloud top heights measured bv the University of Washington’s 35 GHz radar wilh cloud
top heights measured bv the 5.5 GHz radar. Both radars were located at Pt. Brown, on the Washington Coast, during
January February 1982. The precipitation intensity at the ground was > 3 mm hr’1. The point on the line
was for a marginal rain intensity of 3 mm hr’1.
-41-

CLOUD TOP HEIGHT INDICATED BY 5.5 GHz RADAR (km)
Figure 7.10. Comparison of cloud top heights measured bv the University of Washinpon’s 35 GHz radar with cloud
loo heights measured bv the 5.5 GHz radar. Both radars were located at PL Brown, on the Washington Coast..during
January February 1982. Data are for cases when multiple cloud layers were present and the echo indicated from the
35 GHz radar reached the ground but there wax no recorded precipitation at the pound.
-42-

J^
cc<Q<CCNI010CO
CDQLU
Q
I
^LUILU0><CDQ
^0 0 1 2 3 4 5 6 7 8 9
CLOUD BASE HEIGHT INDICATED BY 5.5 GHz RADAR (km)
Figure 7.11. Comparison of cloud base heights measured bv the University of Washington’s 35 GHz radar with
cloud base heights measured by the 5.5 GHz radar. The radars were located at Pt. Brown, on the Washington Coast.
from January to February 1982. Data points are for cases when multiple cloud layers were present and the echo from
the 35 GHz radar reached the ground level, but there was no recorded precipitation at the ground.
-A3-

agreement (r 0.98). The mean difference in the top height measurements is +/- 180 m with a standard deviation in
the mean difference of 150 m; the mean difference in the base heights is +/- 250 m with a standard deviation of 250 m.
7.3. Summary
Table 7.1 summarizes the results described in this section on cloud base and cloud top heights measured
simultaneously by the 35 and 5.5 GHz radars.
It can be seen from Table 7.1 that if we consider all of the measurements there is very good agreement between
the two radars, with a mean difference in height of +/- 100 to +/- 300 m. However, the 35 GHz radar suffers from
considerable attenuation in moderate to heavy precipitation, which can produce underestimates in the heights of the
clouds. Cloud top heights are determined most accurately by the 35 GHz radar when there is either no precipitation
or very light precipitation and the radar is operated at its full sensitivity. Under these conditions, the 35 GHz radar
can determine cloud top heights more accurately than the 5.5 GHz radar.
-44-

TABLE 7.1 Summary of Comparisons of Cloud Base and Cloud Top Heights Measured by the University ofWashington’s 35 GHz Radar and the NCAR 5.5 GHz Radar. Comparisons Confined Primarily to Non-precipitating
or Light-precipitating Clouds.
Period and Location Data Comparison Number of Correlationpairs of coefficient
data points between the twodata sets
Mean difference in Standard deviationheights between ofmean differencethe two data sets in heights
(meters) (meters)
1979MoclipsPt. Brown, WA
1979MoclipsPt. Brown, WA
1982Pt. Brown, WA
1982Pi. Brown, WA
1982Pt. Brown, WA
1982Pt. Brown, WA
Total data set oncloud top heightsfor all cloud types.
Cloud top heights,excludingconvecdve cases.
Cloud top heights,mostly widespread,stratiform clouds.
Cloud base heights,mostly widespread,stratiform clouds.
Cloud top heights,multiple layers.
Cloud base heights,multiple cloud layers(excluding lowest layerfor which echo reachedthe ground).
102
79
151
30
19
11
0.97
0.99
0.97
0.99
0.98
0.98
+/- 270
+/- 192
+/- 290
+/- 90
+/- 180
+/- 240
230
190
280
230
152
240
-45-

SECTION 8. COMPARISONS OF CLOUD BASE AND CLOUD TOP HEIGHTS MEASURED WITH
THE 35 GHz RADAR AND FROM AIRCRAFT
Measurements from aircraft of cloud top and cloud base heights while flying over, or in the general vicinity, of
the U ofW 35 GHz radar provide the best way of evaluating the accuracy with which this radar can measure cloud
heights under various conditions.. Consequently, in this study we have utilized as much data of this type as
possible. However, since field measurements did not form a part of the present study, we have had to resort to using
data from previous field projects in which no specific attempt was made to fly an aircraft over the 35 GHz radar,
although, as it happened, in many instances aircraft did fly over or near the 35 GHz radar. In this Section, the results
obtained from analyzing data from five such field projects are described.
8.1. Observations
During November December 1979 the 35 GHz radar was located at Grayland on the Pacific Coast of
Washington Stale. The UofW B-23 research aircraft often flew over the radar in this project, thus fifty-five pairs of
simultaneous measurements are available for comparison of cloud top heights observed by the 35 GHz radar and the
aircraft. In addition, fourteen pairs of measurements are available on cloud base heights. On most of the occasions
when pairs of measurement were available there was either no precipitation or light precipitation at the ground at the
radar site.
Cloud lop heights measured from the aircraft and those indicated by the 35 GHz radar are shown in Fig. 8.1.
The correlation coefficient between the two sets of measurements is 0.97, with a mean difference between the heights
of +/- 120 m and a standard deviation of the mean difference of 75 m. Figure 8.2 shows the comparison for cloud base
heights. The correlation coefficient is 0.99, with a mean difference between the two heights of +/- 120 m and a
standard deviation of the mean difference of 110 m. At times there were periods of heavy rain over the region, but
the aircraft was never at or near cloud top or base on these occasions. One such day was December 1979 (when the
mean precipitation rate was 3 -8 mm hr"1) and the aircraft flew over the radar several times. The aircraft was in deep
cloud with no sign of cloud top. However, the 35 GHz radar indicated that cloud top was very close to the aircraft
flight level (during this period a manual attenuation of 15 to 20 dB was imposed on the radar receiver to avoid
saturation of the amplifier). Again, this shows that heavy precipitation can strongly attenuate radar echoes at 35
GHz. This situation, although not useful for any quantitative comparisons, is depicted in Fig. 8.3.
During February 1980 the 35 GHz radar was located at Grayland on the Washington Coast. Three supporting
aircraft were available: the U ofW B-23, a leased Navajo aircraft, and a C-130 aircraft from the U.S. Air Force. The
aircraft flew over the 35 GHz radar 160 times (37 times on 14 February and 123 times during the rest of February).
The data sets include a wide range of conditions, from no precipitation to light and moderate precipitation, and one
-46-
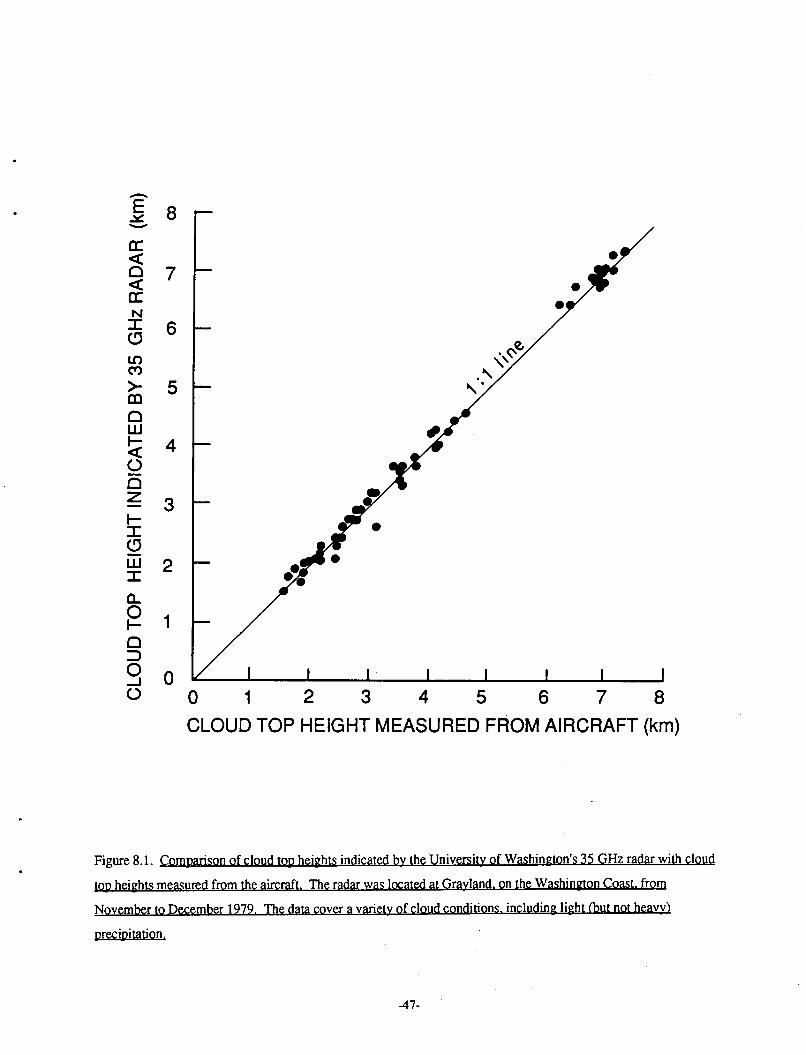
CLOUD TOP HEIGHT MEASURED FROM AIRCRAFT (km)
Figure 8.1. Comparison of cloud top heights indicated bv the University of Washington’s 35 GHz radar with cloud
top heights measured from the aircraft. The radar was located at Gravland. on the Washington Coast, from
November to December 1979. The data cover a variety of cloud conditions, including light (but not heavy)
precipitation.
-47-

0 1 2 3 4 5 6 7 8CLOUD BASE HEIGHT MEASURED FROM AIRCRAFT (km)
Figure8.2. Comparison of cloud base heights indicated bv the University of Washington’s 35 GHz radar with cloud
base heights measured from aircraft The radar was located at Gravland. on the Washington Coast, from November
to December 1979. The data cover a variety of cloud conditions.
-48-

.^
cr<Q<CCNI0inCO
CDQLU
S0Q
(-
0LUIQ-
?Q
0 0 1 2 3 4 5 6 7 8
AIRCRAFT FLYING LEVEL IN CLOUD OVER RADAR (km)
Figure 8.3. Radar echo top heights from the University of Washington’s 35 GHz radar plotted against aircraft Hying
level over the radar. There was deep cloud above the aircraft in all cases. The radar was located at Grayland. on the
Washington Coast, on December 1979. There was heavy precipitation at the ground. Means and maxima rainfall
-1 ,-1intensities ranged from 3.5 8.1 mm hr’1 and 3.5 16.2 mm hr’1. respective!
-49-
day with light intermittent snow (14 February). Excluding data from 14 February, which will be described
separately, forty-two pairs of simultaneous observations of cloud top heights from the radar and from an aircraft are
available. Most of the measurements are for small cumulus, about 1500 m deep, with cloud tops over 7000 m, and
moderate deep stratocumulus, altocumulus and altostratus. The results are shown in Fig. 8.4. The correlation
coefficient between the two data sets is 0.99. The mean difference in the cloud top height measurements by the
aircraft and the radar is about +/- 90 m with a standard deviation of 90 m. Figure 8.5 shows those data points obtained
in deeper clouds and/or moderate precipitation. The correlation coefficient is still 0.99, but the mean difference is
about +/- 120 m and the standard deviation 120 m.
On 14 February there was light intermittent snow showers at ground level from low-level cumulus,
stratocumulus and altocumulus and altostratus. The maximum heights of the clouds during the day was about 5 km.
For this day we have about twenty pairs of simultaneous measurements of cloud top heights from the aircraft and the
35 GHz radar. For most of these measurements there was either no precipitation or light to moderate precipitation
(< 3 mm hr’1) at ground level. The results are shown in Fig. 8.6. The correlation coefficient between the two sets
of measurements is 0.99 with a mean difference of+/- 100m and a standard deviation of 60 m.
Figure 8.7 compares thirteen pairs of observations of cloud base heights measured by the aircraft and the 35
GHz radar in February 1980. The correlation coefficient is 0.99 and the mean difference between the two sets of
observations is +/- 100 m and the standard deviation 180 m.
During December January 1980 1981 the 35 GHz radar was located in Seattle, with support from the-U of
W B-23 aircraft The aircraft flew over the radar 191 times, but cloud top measurements from the aircraft were
available on only fifteen of these occasions. The relation between the measurements of cloud top height from the
.aircraft and from the 35 GHz radar is shown in Fig. 8.8. The correlation coefficient between the two sets of
measurements is 0.99, with a mean difference of +/- 90 m and a standard deviation of the mean difference of 120 m.
The corresponding comparisons for cloud base heights are shown in Fig. 8.9. The correlation coefficient
between the two sets of measurements is 0.99 with a mean difference of about +/- 90 m and a standard deviation of
150 m. Again, the mean difference is very close to the resolution limit of the radar (75 m).
From January February 1982 the 35 GHz radar was located at Pt. Brown, on the Pacific Coast of Washington
State, with support from several aircraft, radiosondes and the NCAR 5.5 GHz radar. However, only the U ofW B-23
aircraft flew in the vicinity of the 35 GHz radar, and on only one occasion (20 January) was cloud top height
measured from the aircraft. On this occasion, the clouds were isolated cumulus. The radar indicated that cloud tops
were at 2400 m and the aircraft measured 2600 m.
On another occasion (10 February) the aircraft passed over the radar in a thin wispy altocumulus layer (at about
4300 m), which contained only water particles, with another cloud layer below that was precipitating. The lower
cloud layer (around 3000 m) was clearly detected by the 35 GHz radar but the upper altocumulus layer was not
detected by the radar. However, shortly after, when ice particles appeared along with the water in the altocumulus (as
indicated by PMS probes on the aircraft), the altocumulus layer was detected by the 35 GHz radar with an echo top
-50-

^(E<Q<CEN
0inCO
>-CDQLU
S0Q
3:
^LUI0.
?Q
^0 0 1 2 3 4 5 6 7 8CLOUD TOP HEIGHT MEASURED FROM AIRCRAFT (km)
Figure 8.4. Comparison of cloud top height indicated bv the University of Washington’s 35 GHz radar with cloud
top heights measured from aircraft. The radar was located at Gravland. on the Washington Coast, during February
1980 (excluding observations from 14 February 1980).
-51-

-^
cr<Q<GCNI0LOCO
>-CDQLU
S0Q
t-
^LU3:Q-
?Q
80 0 1 2 3 4 5 6 7 8
CLOUD TOP HEIGHT MEASURED FROM AIRCRAFT (km)
Figure 8.5. As for Fig. 8.4 but for selected periods with deep cloud and/or moderate precipitation.
-52-

^cc<Q<ccNI0inCO
>-CDQLJJ
<0Q
^LUI0.0
Q
80 0 1 2 3 4 5 6 7 8
CLOUD TOP HEIGHT MEASURED FROM AIRCRAFT (km)
Figure 8.6. Comparison of cloud top heights indicated by the University of Washington’s 35 GHz radar with cloud
top heights measured from aircraft. The radar was located at Gravland. on the Washington Coast, on 14 February
1980. There was light intermittent snow at the ground.
-53-
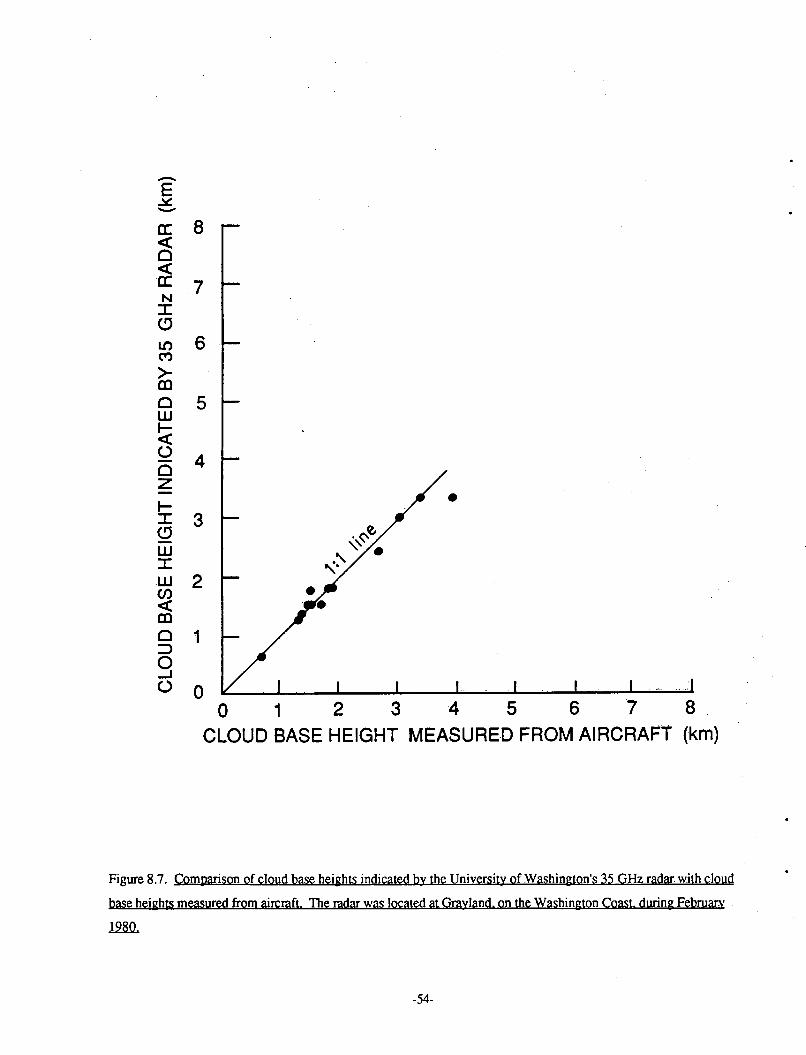
0 1 2 3 4 5 6 7 8
CLOUD BASE HEIGHT MEASURED FROM AIRCRAFT (km)
Figure8.7. Comparison of cloud base heights indicated bv the University of Washington’s 35 GHz radar with cloud
base heights measured from aircraft. The radar was located at Gravland. on the Washington Coast, during February
1980.
-54-

^.
GC<Q<ccNIoLOCO
CDQLU
&0Q-I^LUIQ-
PQ
8d 0 1 2 3 4 5 6 7 8
CLOUD TOP HEIGHT MEASURED FROM AIRCRAFT (km)
Figure 8.8. Comparisons of cloud top heights indicated bv the University of Washington’s 35 GHz radar with cloud
top heights measured from aircraft. The radar was located in Seattle. Washington, from December 1980 to January
1981.
-55-

^L
0 1 2 3 4 5 6 7 8CLOUD BASE HEIGHT MEASURED FROM AIRCRAFT (km)
Figure 8.9. Comparison of cloud base heights indicated bv the University of Washington’s 35 GHz radar with cloud
base heights measured from aircraft. The radar was located in Seattle. Washington- from December 1980 to January
1981.
-56-

height of 4300 4500 m. (A similar response by the 35 GHz radar was seen on 5 December 1979 when the aircraft
flew in a scattered layer of cloud 150 250 m deep composed of supercooled drops. This cloud layer was situated
above a lower layer of cloud, around 1000 m thick, and precipitation was occasionally reaching the ground.
Although the lower cloud layer was detected by the 35 GHz radar, the upper cloud layer was barely detected.
However, when the upper layer was converted into ice by seeding with dry ice, the 35 GHz radar detected the upper
layer.)
During January March 1986 the 35 GHz radar was located on the Atlantic Coast at Cape Hatteras, North
Carolina, while participating in GALE. Several aircraft took pan in GALE (see Table 1.1 in Section 1), but the
emphasis was to fly in mesoscale features of interest and no specific attempt was made to fly over the 35 GHz radar.
However, at times the aircraft flew close to this radar.
Figures 8.10 and 8.11 compare the cloud top and cloud base heights indicated by the 35 GHz radar and measured
from aircraft. The data points are too few to arrive at any definite conclusions. However, the correlation coefficient
between the two sets of measurements of cloud top heights is 0.98 with a mean difference of about +/- 500 m and
250 m standard deviation, where the 35 GHz radar heights were generally greater than those estimated from the
aircraft. The difference between the two data points for base height was about 230 m, with again the radar indicating
the greater height.
8.2. Summary
A summary of the results presented in this section on cloud top and cloud base heights determined from aircraft
and from the U ofW 35 GHz radar is given in Table 8.1. It can be seen that both the cloud top and cloud base
heights indicated by the 35 GHz radar agree very well with those measured from the aircraft. However, the majority
of the measurements were obtained in non-precipitating or light-precipitating clouds. Under these conditions, the
mean difference between the heights of clouds measured by the radar and from the aircraft was about +/- 100 m, which
is close to the theoretical resolution of the radar (75 m).
-57-

-t:
oc<Q<DCNI0inCO
COQLU
50Q
3:0LUIQ-
?o
0 0 1 2 3 4 5 6 7 8
CLOUD TOP HEIGHT MEASURED FROM AIRCRAFT (km)
Figure 8.10. Comparison of cloud top heights indicated bv the University of Washington’s 35 GHz radar with cloud
tOP heights measured from aircraft. The radar was located at Cape Hatteras. North Carolina, from January March.
1986.
-58-
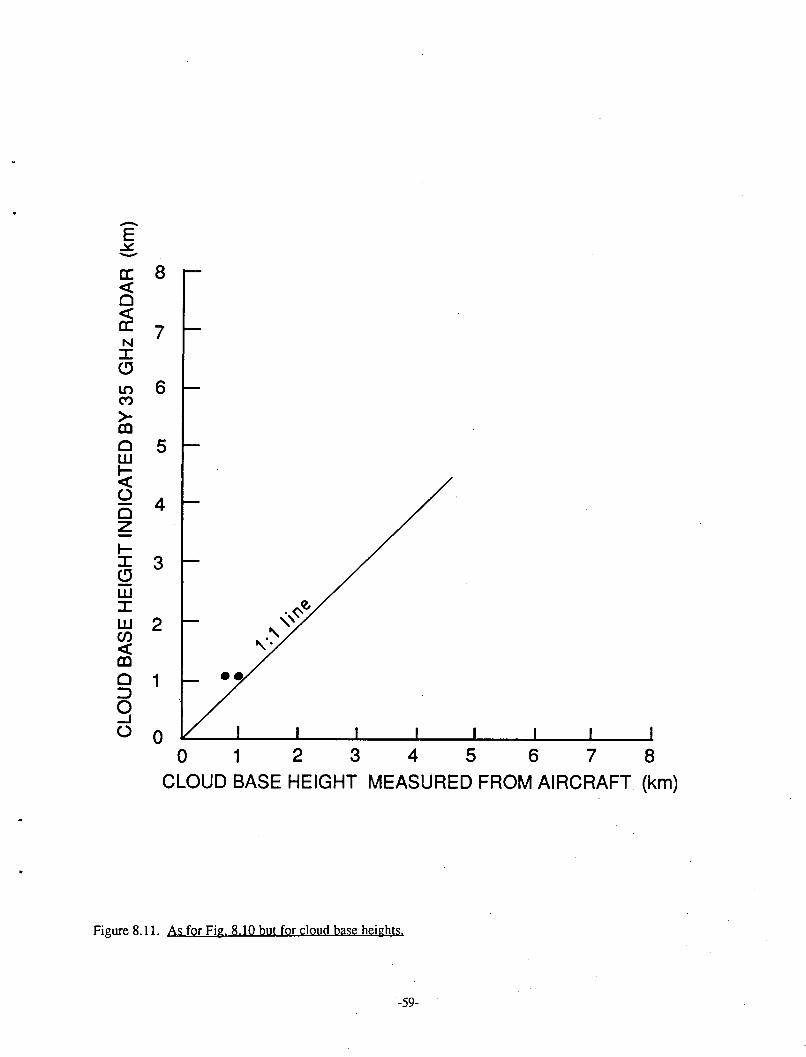
-X:
0 1 2 3 4 5 6 7 8CLOUD BASE HEIGHT MEASURED FROM AIRCRAFT (km)
Figure 8.11. As for Fig. 8.10 but for cloud base heights.
-59-

TABLE 8.1 Summary of Comparisons of Cloud Base and Cloud Top Heights Measured by the University ofWashington’s 35 GHz Radar and Aircraft in GALE. Comparisons Confined to Non-precipitating or Light-
precipitating Clouds.
Year and Location
1979Grayland, Wa
1979Grayland, Wa
1980Grayland, Wa
1980Grayland, Wa
1980Grayland, Wa
1980Grayland, Wa
1980- 1981Seattle, Wa
1986Cape Hatteras, NC
1986Cape Hatteras, NC
Datacomparison
Cloud topheights.
Cloud baseheights.
Cloud topheights,excluding 14February 1980.
Cloud topheightsfor 14February 1980.
Cloud baseheights(all data).
Cloud topheights (deepcloud and/ormoderateprecipitation).
Cloud topheights.
Cloud topheightscomparison.
Cloud topheightscomparison.
Number ofpairs of
data points
55
14
42
20
13
10
15
5
2
Correlationcoefficientbetween thetwo data sets
0.97
0.99
0.99
0.99
0.99
0.99
0.99
0.98
Me
htv
an differencein heightsetween the/o data sets(meters)
+/- 120
+/- 120
+/- 90
+/- 90
+/- 90
+/- 120
+/- 90
+/- 500
+/- 230
Standard deviationofmean difference
in heights(meters)
75
110
90
60
180
120
150
250
-60-

SECTION 9. EFFECTS OF PRECIPITATION ON CLOUD TOP HEIGHTS INDICATED BY
THE 35 GHz RADAR
For most of the data sets described in this report, simultaneous measurements are available from a high-
resolution raingauge located at the radar site. In this section, we use these measurements to carry out a preliminary
study of the effects of rainfall intensity on the detection of cloud heights with the U ofW 35 GHz radar. To reduce
uncertainties, we will confine our attention to widespread layer clouds. We have investigated six such situations
when medium to high-level uniform clouds passed over the radar, producing moderate to heavy precipitation at the
radar site.
One such day was 1 December 1979 when the 35 GHz radar was located at Grayland on the Washington Coast.
Very uniform cloud passed over radar and it produced steady moderate to heavy precipitation (3 8 mm hr’1). The
aircraft flew over the radar several times, but it was in deep cloud and cloud tops could not be discerned, even though
the 35 GHz radar indicated that cloud top was below, or within a very short distance, of the aircraft.
Figure 9.1 shows a histogram of echo top heights from the 35 GHz radar, the dominant rainfall rate, and the
range of rainfall intensities during each 5 minute interval. It can be seen that the radar echo top was lower during the
periods of heavy precipitation from 1610 to 2000 PST, when the rainfall rate was > 3 mm hr"1 and at times
> 16 mm hr’ However, there is no clear relationship between rain intensity and echo top height outside of this
period. (There was 15 to 20 dB overall attenuation imposed on the radar receiver to avoid saturation.)
On 26 February 1980, when the radar was also at Grayland, there was a similar long period of uniform
stratiform cloud that produced periods of moderate to moderately heavy rainfall. Rainfall rates and echo top heights
are shown in Fig. 9.2. The results indicate a qualitative inverse relationship between rainfall rate and the radar-
detected echo top height. This relationship is particularly noticeable whenever the rainfall rate exceeds 3 mm hr’
(15 dB manual attenuation was imposed on the radar receiver to avoid saturation of the receiver amplifier).
On 16 and 22 January 1982, when the radar was located at Pt. Brown on the Washington Coast, there was also
widespread uniform cloud over the radar with almost no convective activity. Rainfall rates were light to moderate
(lighter than on 26 February 1980). Figures 9.3 and 9.4 show data from these two days. For rainfall rates up to at
least 3 mm hr’1 there was generally no noticeable effect of rainfall rate on the cloud top height detected by the
35 GHz radar, even with the relatively deep clouds that were present on 16 January 1982. However, during the
earlier part of 22 January 1982, when the rainfall rate was just above 3 mm hr’ i, there is an indication of an inverse
relationship between the radar-indicated cloud top height and rainfall rate.
Similar observations were made in uniform cloud with virtually no convective activity on 12 and 13 February
1982 when there was light to moderate rain at the radar site for a considerable period of time (Figs. 9.5 and 9.6). On
both days the clouds were deep but the precipitation intensity was not very high. There was some sign of an inverse
relationship between cloud top echo height and rainfall intensity when the latter was of light to moderate intensity,
and particularly when the intensity was ^ 3 mm hr’1.
-61-

?AC:F-C S-ANCAS; --;;.;
DOMINANT RAINFALL RATE AND RANGE (mm hi-’; IN EACH 5 MIN. INTERVAL
Figure 9.1. Variations in cloud top height indicated by the University of Washington’s 35 GHz radar and rainfall rate at the radar site on 1 December 1979. The radar was located at Grayland. on the Washington
Coast.
-63-

PACIFIC STANDARD TIME
16CO
= =-
" 2’in <" >’_! iT
^ +/-i
c
u =
5 S
5 == <oC
101300 1400 1500 1600 1700 1800 ISOO 200
,i-|-I-t-F-f-r-1-1-[MI-’,^Ol. ’^^i-"--r-’^"’i’’^-"L^’i^^l"-"Ml-r-’i~-~--r-’"fr^l’rrrrrrrn i-i f-^n n n-r-i ri n nDOMINANT RAINFALL RATE AND RANGE (n-m hr-1) IN EACH 5 MIN. INTERVAL
figure 9.2. Variations in cloud ton h^h, indicnted hv ^. I Iniv^tv nfWashin.tnn-s 35 GHz. r.dar^ minfnil rate at the mdnr sire on 26 Febmary 19SO. The radar was lornred nt Grayland^heJMN
Q)ast.
-65-

PACIFIC STANDARD TIME
00
cc<
9(TN E^ -^
^ ^ 8" ^UJ C3: UJ1- H>- S 7m
^D iuj 2
i2 6Q U2 <
iu
^ 50UJ 5= u]C- IU A0 ^^ FQ l-3 <2 30
2
0
300 0400 0500 0600 0700 0800 0900
.--------\---------------1---------------1-----------------------------------[
r- ECHO TOP HEIGHTr~~\ /r /
^""^ ^^i r"^^ c-J^^^^^^^ ^^^’--J i-i L-i i-l i-,
^ 1^^^^^^^^^"^ -^ L-- ^-^--i r~~^ l-- -"---^---i i-~~~-’--- [---’-’ -~^-J~~^
f-~~
^-RAINFALL RATE/
// ^-----s^ ^------N^ ^^^y^ s^----s^^^---\^ ^^--^~~-~-^^ ^------’’"’"^^-^" ^’---"’"’~ ^-~----^"^’-----------1--;-----------f----~J~ ^I^ .J-L -A -Al-’.i-li-. l.-^-’. -*’-1 Ml M MtrjlM|(oiGliGi|rO| MiG3lci|MiN3|M MIM Ml Ml Ml Ml Ml Ml UJMJM
^^M K^^I’M ^;Sfe ^^^^^^^^ ^ u^ cn^ o, u^ ^^^^["^L0!0^^ "^^^^^l--.^-^-1 L-.^.-,-]- ,^^^ i^,,-.(^-.^-.L-,t-.L~.-t-^^i-^ ^bc;h^’’^C^^::!c: -::;’::;r3i^t^::’::: -::^’^ ;c: ^i^ir^rr3rr3rr3rr3 OI’MI I\)IMIUIM M|M -^!M[N>iroiM -^it^iMiMiMr--.’--.
^ ^ M M b M ^ ^ b ^ G ^ ^ -: ^ ^ ^ ^ :: b ^ ^ ^ ^ M ^ ^ c. ^ co ^ ^ ^ ^ ^ ^ " M " in ^ ^ ^ ^^ ^ ^ ^ ^ i. ^ ^ M ^ ^ (y ro o col" co u M u u u u\u co u M M|M <a iaicolM M
^^^M^M ^ =: ^ M b ^ ^ b ^ ^ C; c. c. ^ aa^ ^^ ^ ^ ^^b^^^^^^^^^^^^^ssis^^:sis ^^^^
": <E >e-LLI
10 ^ 2
c z8 d s
< inu-
6 i SG: UJ
4 !- 0
^ 12 i ^2 Q
00 G
DOMINANT RAINFALL RATE AND RANGE (mm hi-1) IN EACH 5 MIN. INTERVAL
. v.n^.n^ ,onh^h. indicntedbv.h.ITn.verskvofWash.n^^GHzmd3r ^ ninfnil rate at th, mdnr si.e on l6J3nua^ 19S2. The mdar was locn,ed at PL Bro.n. o^h^ashingtonFigure 9.:
Coast.
-67-

PACIFIC STANDARD TIME
CE<Q
I s0 _!
in <" ^m CC
UJ
^ 1S ju 2
t^y =Q ^^ ^1
luo- uj
? p
^20
120010|
9
8
7
6
5
4
1300 1400
0
1500-L
1600 1700
ECHO TOP HEIGHT
DOMINANT RAINFALL RATE AND RANGE (mm hr-1) IN EACH 5 MIN. INTERVAL
Figure 9.4. Variations in cloud top height indicated by the University of Washington’s 35 GHz radar and rainfall rate at radar site on 22 January 1982. The radar was located at PL Brown, on the Washington Coast.
-69-

PACIFIC STANDARD TIME
1800
DOMINANT RAINFALL RATE AND RANGE (mm hr-1) IN EACH 5 MIN. INTERVAL
Figure 9.5. Variations in cloud top height indicated by the University of Washington’s 35 GHz radar and rainfall rate at the radar site on 12 February 1982. The radar was located at PL Brown, on the Washington
Coast.
-71-

PACIFIC STANDARD TIME
100500 0600
-T""0700 0800
.^
S
9
8
1S ?>
UJ (E
En2
Q Z
t" 2< in
^ I0 Uz <: ^5 ^^ g
I sI su
4
0u (j (j ~4 ca
oo|o>
M Ului|b CD
U U<h~J (J U M M<o|ro
U Ma> b> O M UI
U
la0io
p|oioloo P10 1\J
N-4 01
otufuA|a> d> -4 U ->1 OB 0 MKi :ro|a)|oo|.t. 10 u> uo
oilwl^l-^!o
|ui[bo>*0> M
u 100 0>
^i towu>
Mtn
DOMINANT RAINFALL RATE AND RANGE (mm hr1) IN EACH 5 MIN. INTERVAL
1-igurc 9.6. Variations in cloud top heii;ht indicated hv the 35 011/, radar and rainl’all rate al [lie radar silc on 13 FchriKiry 19K2. The nular w.i.s
at Pi. Brown, on the Washington Coa-st.

These preliminary observations indicate that attenuation begins to degrade the ability of the 35 GHz radar to
detect cloud top heights accurately when the precipitation rate exceeds about 3 mm hr"1.
-74-

SECTION 10. SUMMARY OF RESULTS OF EVALUATION OF THE 35 GHz RADAR
FOR MEASURING CLOUD HEIGHTS
In this report we have used data from radiosondes, a 5.5 GHz radar, and aircraft observations to investigate the
accuracy with which the University of Washington’s 35 GHz radar can be used to determine cloud top and cloud base
heights in various meteorological situations. Although the data used in this evaluation were not collected for the
specific purpose of evaluating the 35 GHz radar, they have provided valuable information that is summarized below.
It should be noted that the aircraft measurements of cloud heights provide the most reliable means for evaluating the
accuracy of the 35 GHz radar, and comparisons with radiosonde data are probably the least reliable.
10.1. Comparison with Radiosondes
Estimates from radiosonde soundings of cloud base and cloud top heights for widespread, stratiform clouds
show good overall correlations with the heights indicated by the 35 GHz radar (see Section 6 for details). For cloud
top heights they agree to within 400 +/- 300 m and for cloud base heights to within 120 +/- 90 m.
For convective clouds, the differences in heights were greater, sometimes > 700 m. This is attributable in pan
to the large natural fluctuations in the heights of convective clouds, which make it difficult to reliably compare two
data sets.
10.2. Comparisons with 5.5 GHz Radar
Cloud base and cloud top heights deduced from the 35 GHz radar and a 5.5 GHz radar were generally in good
agreement, provided that any precipitation was no more than very light. In the case of primarily stratiform clouds,
the mean difference in the cloud top heights detected by the two radars was $ 290 m, and for cloud base heights it
was $ 240 m. For diffuse, thin cloud tops, containing mainly ice particles, the 35 GHz radar was more accurate
than the 5.5 GHz radar in detecting cloud top heights. For cloud bases the heights indicated by the 35 GHz radar
were generally similar to those indicated by the 5.5 GHz radar. In the presence of rain rates ^ 3 mm hr the
performance of the 35 GHz radar suffered because of attenuation by the rain.
10.3. Comparisons with Airborne Observations
When there was no precipitation, or when the precipitation was very light, the heights of cloud bases and cloud
lops detected by the 35 GHz radar were within 100 m of direct measurements of these heights made from aircraft
flying over or in the vicinity of the radar. Hobbs etal. (1985) showed that the 35 GHz radar can detect clouds in
which the diameters of the drops do not exceed 27 ^m provided there are sufficient concentrations of 10 15 \im
-75-

diameter drops; they noted that clouds containing only L of 100 ujn diameter in crystals are also detectable by
such a radar.
Little comparable data was available for heavy precipitating clouds, but the indications are than under these’conditions attenuation by rain will cause a 35 GHz radar to underestimate cloud heights. Also, in the presence of
light to heavy rain, cloud bases can not be readily detected by a 35 GHz radar.
-76-

SECTION 11. CONCLUDING REMARKS AND RECOMMENDATIONS
In this report we have described a retrospective analysis ofdata (collected for other purposes) to assess the
extent to which the University of Washington 35 GHz radar can be used to measure cloud base and cloud top heights.
This analysis indicates that under certain weather conditions this radar may serve well for measuring cloud heights,
but that under other conditions it may underestimate cloud top heights and may not be suitable for measuring cloud
base heights.
To quantify more precisely the accuracy of a 35 GHz radar for determining cloud heights, we recommend that a
field program be carried out that is dedicated to this task. The basic requirements for such a program are flights by an
aircraft, well instrumented for cloud physics research, over a ground-based 35 GHz radar in a wide variety of cloud and
precipitating conditions. Such a study would be considerably strengthened if, in addition to the radar on the ground,
the research aircraft itself carried a 35 GHz radar. By carrying out such a study in a region of the country where many
different types of clouds are common, it should be possible to answer rather quickly most of the remaining questions
concerning the suitability of a 35 GHz radar for measuring cloud heights.
Finally, it should be noted that although the University of Washington 35 GHz radar is a modernized version of
the Air Force’s AN/TPQ-11 radar, it has not been optimized for cloud height measurements. Also, although we have
alluded to the potential for doppler data from such a radar to aid in the measurements of cloud heights, this
possibility remains to be explored in a systematic way.
-77-

LIST OF REFERENCES
1. Paulsen, W. H., Petrocchi, P. J., and Medkan, G., Operational Utilization of the AN/TPO-11. Cloud
Detection Radar. Instrumentation Paper No. 166, U. S. Air Force, Cambridge Research Laboratories,
Bedford, MA, June 1970. AFCRL-70--335 AD709364.
2. Marshall, R. S., "Precipitation Trajectories and Patterns." Journal of Meteorology: Vol. 10, No. 6, pp. 25-
29. February 1953.
3. Plank, V. G., Adas, D., and Paulsen, W. H., "The Nature and Detectability of Clouds and Precipitation as
Determined by 1.25 Centimeter Radar." Journal of Meteorology. Vol. 12, No. 4, pp. 358-377, August
1955.
4. Boucher, R. J., "Synoptic Physical Implications of 1.25 cm Vertical-beam Radar Echoes." Journal of
Meteorology. Vol. 16, No. 3, pp. 312-326, June 1959.
5. Wexler, R.. and Atlas, D., "Precipitation Generating Cells." Journal of Meteorology. Vol. 16, pp. 327-332,
June 1959.
6. Harper, W. G., "Cloud Detection with 8.6 Millimetre Wavelength Radar." Meteorological Magazine. Vol.
93, No. 1108, pp. 337-346, November 1964.
7. Harper, W. G., "Examples of Cloud Detection with 8.66 Millimetre Radar." Meteorological-’Magazine. Vol.
95, No. 1125, pp. 106-112, April 1966.
8. Stewart, J. B., "Further Discussion on the Observation of Cloud With 8.6 Millimetre Radar." Meteorological
Magazine. Vol. 95, No. 1125, pp. 112-114. April 1966.
9. Petrocchi, P. J., and Paulsen, W. H., "Meteorological Significance of Vertical Density Profiles of Clouds and
Precipitation Obtained with the AN/TPQ-11 Radar." Preprint Volume of the 12th A.M.S. Conference
on Radar Meteorology. Norman, OK. October 1966.
10. Weiss, R. R. Sr., Locatelli, J. D., and Hobbs, P. V., "Simultaneous Observations of Cloud and Precipitation
Particles with Vertically Pointing X-band and Ka-band Radars." IEEE Transactions on Geoscience
Electronics. Vol. GE-17, No. 4, pp. 151-153, October 1979.
-78-
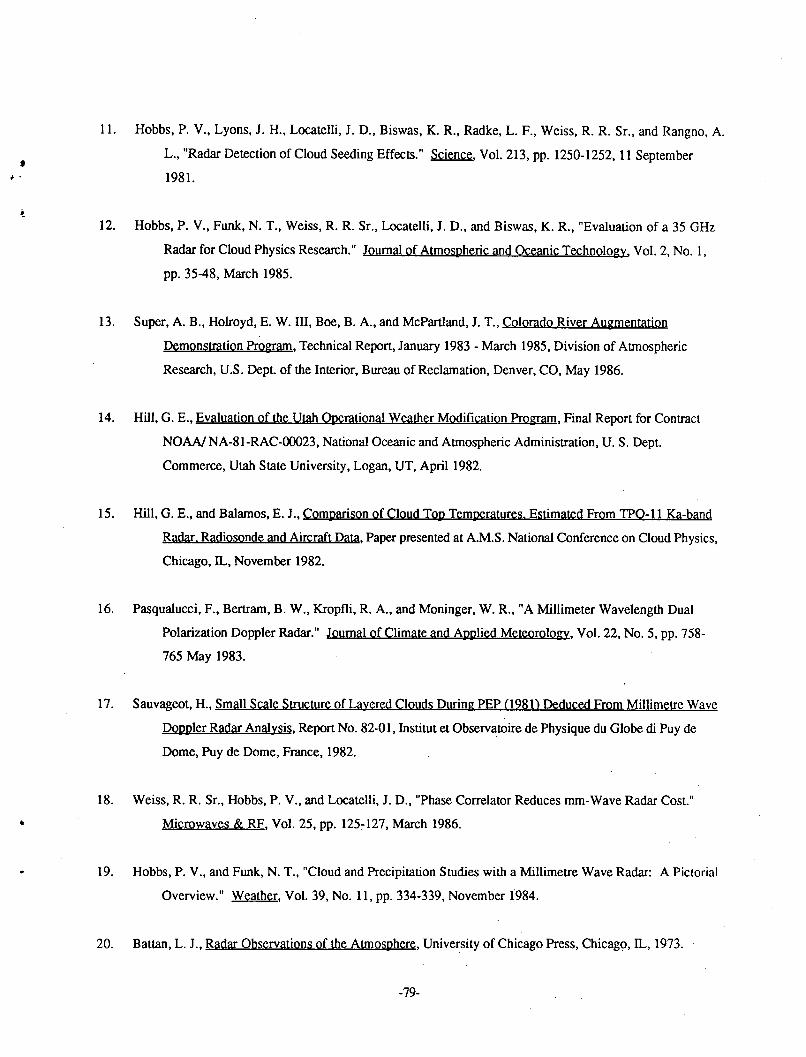
11. Hobbs, P. V., Lyons, J. H., Locatelli, J. D., Biswas, K. R., Radke, L. F., Weiss, R. R. Sr., and Rangno, A.
L., "Radar Detection of Cloud Seeding Effects." Science. Vol. 213, pp. 1250-1252, 11 September
1981.
12. Hobbs, P. V., Funk, N. T., Weiss, R. R. Sr., Locatelli, J. D., and Biswas, K. R., "Evaluation of a 35 GHz
Radar for Cloud Physics Research." Journal of Atmospheric and Oceanic Technology. Vol. 2, No. 1,
pp. 35-48, March 1985.
13. Super, A. B., Holroyd, E. W. Ill, Boe, B. A., and McPartland, J. T., Colorado River Augmentation
Demonstration Program. Technical Report, January 1983 March 1985, Division of Atmospheric
Research, U.S. Dept. of the Interior, Bureau of Reclamation, Denver, CO, May 1986.
14. Hill, G. E., Evaluation of the Utah Operational Weather Modification Program. Final Report for Contract
NOAA/NA-81-RAC-00023, National Oceanic and Atmospheric Administration, U. S. Dept.
Commerce, Utah State University, Logan, UT, April 1982.
15. Hill, G. E., and Balamos, E. J., Comparison of Cloud Top Temperatures. Estimated From TPO-11 Ka-band
Radar. Radiosonde and Aircraft Data. Paper presented at A.M.S. National Conference on Cloud Physics,
Chicago, IL, November 1982.
16. Pasqualucci, F., Bertram, B. W., Kropfli, R. A., and Moninger, W. R., "A Millimeter Wavelength Dual
Polarization Doppler Radar." Journal of Climate and Applied Meteorology. Vol. 22, No. 5, pp. 758-
765 May 1983.
17. Sauvageot. H.. Small Scale Structure of Layered Clouds During PEP (1981) Deduced From Millimetre Wave
Doppler Radar Analysis. Report No. 82-01, Institut el Observatoire de Physique du Globe di Puy de
Dome, Puy de Dome, France, 1982.
18. Weiss, R. R. Sr., Hobbs, P. V., and Locatelli, J. D., "Phase Correlator Reduces mm-Wave Radar Cost."
Microwaves & RF. Vol. 25, pp. 125-127, March 1986.
19. Hobbs, P. V., and Funk, N. T., "Cloud and Precipitation Studies with a Millimetre Wave Radar: A Pictorial
Overview." Weather. Vol. 39, No. 11, pp. 334-339, November 1984.
20. Battan, L. J., Radar Observations of the Atmosphere. University of Chicago Press, Chicago, IL, 1973.
-79-

21. Smith, Paul L., "On the Sensitivity of Weather Radars." Journal of Atmospheric and Oceanic Technology.
Vol. 3, No. 4, pp. 704-713, December 1986.
-80-