Embed Size (px)
Citation preview

British Journal of Industrial Medicine 1992;49:761-768
Evaluation of exposure to polycyclic aromatichydrocarbons in a coke production and a graphiteelectrode manufacturing plant: assessment of urinaryexcretion of 1 -hydroxypyrene as a biologicalindicator of exposure
J P Buchet, J P Gennart, F Mercado-Calderon, J P Delavignette, L Cupers, R Lauwerys
AbstractObjectives-Characterisation of the air-
borne concentration of 13 polycyclic aromatichydrocarbons (PAHs) at various workplaces ina graphite electrode and a coke productionplant. Validation of the urinary excretion of1-hydroxypyrene (hydroxypyrene) as abiological marker of exposure to PAH.Design-Cross sectional study of workers
exposed to PAHs (106 in the graphite electrodeproducing plant and 16 in the coke works).Methods-Personal air sampling during at
least six hours per workshift using a glass fibrefilter and a Chromosorb 102 solid sorbent tubeand analysis of PAHs by high performanceliquid chromatography (HPLC) and spectro-fluorometric detection (SFD). Collection ofspot urine samples before and after the shiftand analysis of 1-hydroxypyrene byHPLC andSFD.Results-The workers most exposed to
PAHs were those occupied at the topside area
of the coke oven plant and those working inthe blending and impregnation areas of thegraphite electrode producing plant (meanairborne concentration of total PAHs: 199 and223 pg/m' respectively). Except for naph-thalene and perylene, the relative proportionofthe different PAHs did not differ between theplants. Pyrene concentration in air was highlycorrelated with the total airborne PAH con-centration (r = 0-83, p < 0-0001) and thecorrelation coefficients between hydroxy-pyrene concentration in postshift urine
samples and pyrene or total PAHs in air were0-67 (p < 00001) and 0-72 (p < 00001) respec-tively. Excretion of hydroxypyrene doubledwhen the exposure to pyrene in air increased10-fold. The half life for the urinary excretionof hydroxypyrene was around 18 hours (95%confidence interval 16-1-19-8). Smoking habitsonly explained 2-3% of the variance inhydroxypyrene excretion compared with 45%for the pyrene concentration in air.Conclusion-The determination of the
urinary excretion of hydroxypyrene in post-shift urine samples can be used as a suitablebiomarker to assess individual exposure toPAHs in coke ovens and in graphite electrodemanufacturing plants.
(British Journal of Industrial Medicine 1992;49:761-768)
Polynuclear aromatic hydrocarbons (PAHs) are
generated when natural or synthetic organicmaterials are burnt in the presence of a suboptimaloxygen supply. Quantities of up to 20 pg/kg occur insome foods (for example, smoked products). Theyare present in ambient air mainly due to their releasefrom motor vehicles, domestic coal or oil fired heatingsystems, and various industrial sources. They arealso found in high concentration in some workplaces(for example, coke ovens, aluminium reductionplants, the steel industry, the asphalt industry,creosote impregnating plants, and gas and petroleumindustries). About 500 PAHs have been detected inthe air but in practice only a few are routinelymeasured. They are lipid soluble compounds and canbe absorbed into the body by all the normal routes.Several PAHs (for example, dibenz(a,h)anthracene,benzo(ax)pyrene) are capable ofproducing tumours innumerous test species and PAHs can induce skin andlung cancer in humans.'
Jongeneelen et al' have reported an increasedurinary excretion of 1 -hydroxypyrene (hydroxy-
Industrial Toxicology and Occupational MedicineUnit, Catholic University ofLouvain, Clos Chapelle-aux-Champs PO Box 30.54, B-1200 Brussels,BelgiumJ P Buchet, J P Gennart, F Mercado-Calderon,J P Delavignette, L Cupers, R Lauwerys
761
on 10 May 2018 by guest. P
rotected by copyright.http://oem
.bmj.com
/B
r J Ind Med: first published as 10.1136/oem
.49.11.761 on 1 Novem
ber 1992. Dow
nloaded from

Buchet, Gennart, Mercado-Calderon, Delavignette, Cupers, Lauwerys
pyrene), the hydroxylated metabolite of pyrene, inthe urine of subjects exposed to mixtures of PAHs.As the proportion of pyrene in airborne mixtures ofPAHs from different sources does not vary greatly, ithas been suggested that the concentration ofhydroxypyrene in urine might be used as a biologicalindicator of overall exposure to PAHs. This studyreports on the relation between the urinary excretionof hydroxypyrene and the intensity of exposure toairborne PAHs in workers from a coke oven and agraphite electrode producing plant.
Materials and methodsSTUDY POPULATIONThe study was carried out in two plants, one produc-ing coke and the other graphite electrodes for thesteel industry, and involved 122 workers. Workersfrom the coke producing plant were divided into twogroups: group Cl (n = 10) included workers on thebench side and group C2 (n = 6) those on the topside of the coke ovens (see 3 for a detailed descriptionof the production process). The main steps ingraphite electrode production are (1) grinding andmixing of raw materials (coke and hot coal tarpitch), (2) pressure moulding of the crude paste,(3) baking, (4) impregnation with liquid tar,(5) graphitisation, and (6) finishing. Workers fromthe graphite electrode plant were divided into sixgroups: group G1 (n = 10), workers engaged inthe end product conditioning (polishing, threadgrooving, rodding); group G2 (n = 25), workers incharge of the second (and last) thermal treatment ofthe electrodes at 2800°C; group G3 (n = 6), workersin charge of the Stein oven for the progressive (1°C/hour) heating of the raw electrodes up to 800°C;group G4 (n = 17), maintenance and repair staff(mainly electricians and mechanics); group G5(n = 14), workers engaged in the grinding andmixing at moderate temperature (150°C) of the rawcomponents (coke and coal tar pitch) and performingthe extrusion of electrodes; group G6 (n = 8),workers in charge of the electrode impregnation(dipping in liquid tar at 280°C to fill the poresresulting from the first thermal treatment). Ware-housemen, clerks, drivers, and shop stewards of bothplants were combined as one group (group LEX,n = 1 1). A group of office workers from the graphiteelectrode producing plant was selected as controls(group REF, n = 15).Each worker provided a urine sample before and
after the workshift during which the airborne con-centration of PAHs was monitored with a personalsampling system. Also, 15 workers from groups G5and G6 ofthe graphite electrode manufacturing plantcollected spot urine samples at 8.00 am, 4.00 pm, and10.00pm during three or four days offwork after a fiveday work period.
AIR SAMPLINGLight PAHs with two or three aromatic rings aremainly present in the vapour phase and can beretained on an adsorbent such as Chromosorb 102whereas heavier compounds are mainly retained on afilter as particulates.4Each worker was thus equipped with a personal air
sampler. Air was aspirated at a flow rate of2 1/min by abattery powered air sampling pump (model 224PCEXR3, SKC Inc, Eighty Four, Pa, USA).Particles were retained on a glass microfibre filter(GFF, Whatman, diameter 3 7 cm) and vapours wereadsorbed on Chromosorb 102 contained in a tube(SKC Inc) placed between the filter and the pump.Tubes and filters were kept in a refrigerated darkroom until analysis (within two weeks). The airsampling lasted up to six hours but in cases of heavypollution, several one or two hour successive sampleswere collected.
DETERMINATION OF PAH CONCENTRATIONSThe adsorbent sections and the filter were extractedwith methanol, chosen because it is readily misciblewith the chromatographic mobile phase and does notinterfere with the detection of PAHs.5 ThirteenPAHs (naphthalene, fluorene, phenanthrene, anthra-cene, fluoranthene, pyrene, benz(a)anthracene,chrysene, benzo(e)pyrene, perylene, benzo(a)pyrene,dibenz(a,h)anthracene, and benzo(g,h,i)perylene)were measured by high performance liquidchromatography and fluorescence detection. AChromSpher PAH column (200 mm length, 3 mminternal diameter) from Chrompack was used.Elution was performed at a flow rate of 0-5 ml/minwith a gradient of water/acetonitrile delivered by twohigh pressure pumps (models 302 and 305, GilsonMedical Electronics (Villiers le Bel, France)). At thestart, the eluent was a 50/50 mixture, it had changedto pure acetonitrile by 15 minutes; pure acetonitrilewas delivered for 12 further minutes and its concen-tration was then reduced to the 50/50 mixture in twominutes; a re-equilibration of the colunm wasallowed for six minutes before the next analysis.Samples were injected with an autosampler(Marathon; Spark, Holland).The detection of PAHs was performed by fluo-
rimetry (821-FPJasco spectrofluorometer, Gynkotekapparatus, Germering bei Munchen, Germany); fornaphthalene, fluorene, and phenanthrene the excita-tion and emission wavelengths were 280 and 350 nm;for the other compounds, 305 and 430 nm.6 StandardPAH mixtures (Alltech Associates, Deerfield IL,USA) were used as reference materials. Results arereported either as the individual sum of each PAHretained on the adsorbent and the filter or as the sumof all PAHs measured (total PAH concentration).Tube breakthrough was considered to have occurredwhen the second sorbent section of the Chromosorb
762
on 10 May 2018 by guest. P
rotected by copyright.http://oem
.bmj.com
/B
r J Ind Med: first published as 10.1136/oem
.49.11.761 on 1 Novem
ber 1992. Dow
nloaded from
Exposure to polycylic aromatic hydrocarbons in a coke production and a graphite electrode nianufacturin2g plant
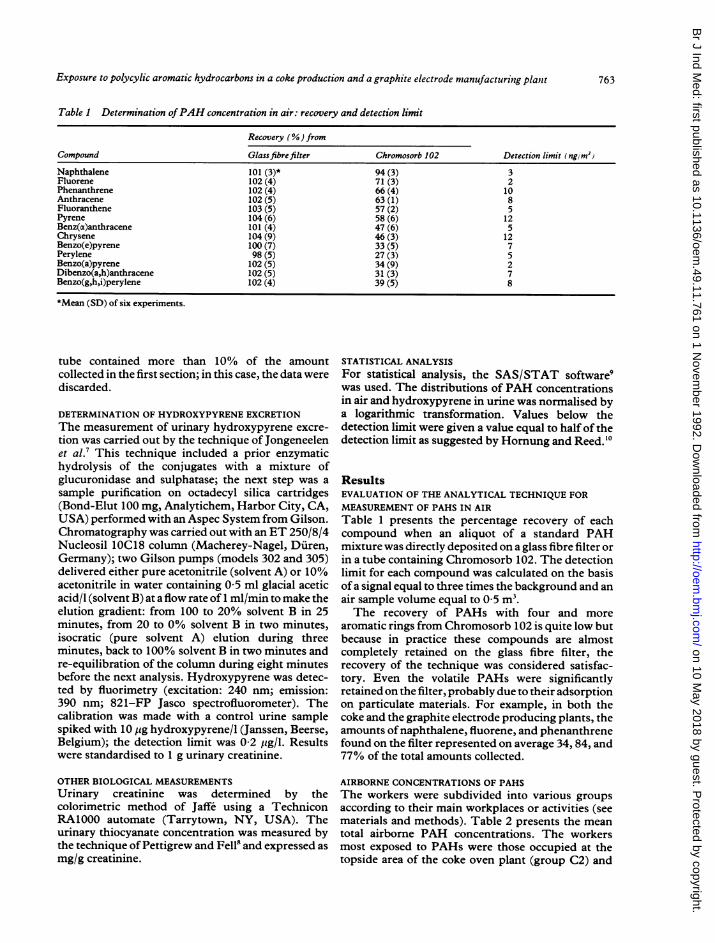
Table I Determination ofPAH concentration in air: recovery and detection limit
Recovery (%) from
Compound Glassfibrefilter Chromosorb 102 Detection limit (ng/m3
Naphthalene 101 (3)* 94 (3) 3Fluorene 102 (4) 71(3) 2Phenanthrene 102 (4) 66 (4) 10Anthracene 102 (5) 63 (1) 8Fluoranthene 103 (5) 57 (2) 5Pyrene 104 (6) 58 (6) 12Benz(a)anthracene 101 (4) 47 (6) 5Chrysene 104 (9) 46 (3) 12Benzo(e)pyrene 100 (7) 33 (5) 7Perylene 98 (5) 27 (3) 5Benzo(a)pyrene 102 (5) 34 (9) 2Dibenzo(a,h)anthracene 102 (5) 31 (3) 7Benzo(g,h,i)perylene 102 (4) 39 (5) 8
*Mean (SD) of six experiments.
tube contained more than 10% of the amountcollected in the first section; in this case, the data werediscarded.
DETERMINATION OF HYDROXYPYRENE EXCRETIONThe measurement of urinary hydroxypyrene excre-tion was carried out by the technique of Jongeneelenet al.7 This technique included a prior enzymatichydrolysis of the conjugates with a mixture ofglucuronidase and sulphatase; the next step was asample purification on octadecyl silica cartridges(Bond-Elut 100 mg, Analytichem, Harbor City, CA,USA) performed with an Aspec System from Gilson.Chromatography was carried out with an ET 250/8/4Nucleosil 1OC18 column (Macherey-Nagel, Duren,Germany); two Gilson pumps (models 302 and 305)delivered either pure acetonitrile (solvent A) or 10%acetonitrile in water containing 0-5 ml glacial aceticacid/l (solvent B) at a flow rate of 1 ml/min to make theelution gradient: from 100 to 20% solvent B in 25minutes, from 20 to 0% solvent B in two minutes,isocratic (pure solvent A) elution during threeminutes, back to 100% solvent B in two minutes andre-equilibration of the column during eight minutesbefore the next analysis. Hydroxypyrene was detec-ted by fluorimetry (excitation: 240 nm; emission:390 nm; 821-FP Jasco spectrofluorometer). Thecalibration was made with a control urine samplespiked with 10 jig hydroxypyrene/l (Janssen, Beerse,Belgium); the detection limit was 0-2 jig/l. Resultswere standardised to 1 g urinary creatinine.
OTHER BIOLOGICAL MEASUREMENTSUrinary creatinine was determined by thecolorimetric method of Jaffe using a TechniconRA1000 automate (Tarrytown, NY, USA). Theurinary thiocyanate concentration was measured bythe technique ofPettigrew and Fell' and expressed asmg/g creatinine.
STATISTICAL ANALYSISFor statistical analysis, the SAS/STAT software9was used. The distributions of PAH concentrationsin air and hydroxypyrene in urine was normalised bya logarithmic transformation. Values below thedetection limit were given a value equal to half of thedetection limit as suggested by Hornung and Reed.'0
ResultsEVALUATION OF THE ANALYTICAL TECHNIQUE FORMEASUREMENT OF PAHS IN AIRTable 1 presents the percentage recovery of eachcompound when an aliquot of a standard PAHmixture was directly deposited on a glass fibre filter orin a tube containing Chromosorb 102. The detectionlimit for each compound was calculated on the basisof a signal equal to three times the background and anair sample volume equal to 0 5 m3.The recovery of PAHs with four and more
aromatic rings from Chromosorb 102 is quite low butbecause in practice these compounds are almostcompletely retained on the glass fibre filter, therecovery of the technique was considered satisfac-tory. Even the volatile PAHs were significantlyretained on the filter, probably due to their adsorptionon particulate materials. For example, in both thecoke and the graphite electrode producing plants, theamounts of naphthalene, fluorene, and phenanthrenefound on the filter represented on average 34, 84, and77% of the total amounts collected.
AIRBORNE CONCENTRATIONS OF PAHSThe workers were subdivided into various groupsaccording to their main workplaces or activities (seematerials and methods). Table 2 presents the meantotal airborne PAH concentrations. The workersmost exposed to PAHs were those occupied at thetopside area of the coke oven plant (group C2) and
763
on 10 May 2018 by guest. P
rotected by copyright.http://oem
.bmj.com
/B
r J Ind Med: first published as 10.1136/oem
.49.11.761 on 1 Novem
ber 1992. Dow
nloaded from

Buchet, Gennart, Mercado-Calderon, Delavignette, Cupers, Lauwerys
Table 2 Mean totalPAH concentrations in various work areasfrom a coke production and a graphite electrodemanufacturing plant
Total PAH concentration (pg/rm3)
Groups No Geometric mean Median (geometric SD) Range
REF 15 03 02 (29) 01-68LEX 11 3-0 3-7 (4 0) 0.1-32 4C1 10 14-2 25-1 (4 3) 0 7-74.2C2 6 198-7 241-2 (4-1) 266-959GI 10 2-8 2-7 (2-1) 10-9.3G2 25 41 4-3 (3-8) 0-2-50-9G3 6 17-4 33-2 (5-9) 100-117G4 17 12-5 11-1(4-0) 06-251G5 14 96-0 87 0 (2-9) 17 7-551G6 8 222-6 255 1 (3-4) 208-1212
those working in the blending and the impregnationareas of the graphite electrode producing plant(group G6).To compare the proportion of the different
airborne PAHs present in both plants, the concentra-tion of each PAH found in each air sample wasexpressed in per cent of the total PAH concentrationfound in the same sample. The arithmetic mean andstandard deviation (SD) were calculated for eachplant separately; Figure 1 summarises the results.The PAH profile was only slightly different betweenthe two plants. A similar distribution was found for11 compounds; only the naphthalene and perylene
60 r
50 1
40
30
20 p
10
0
AB AB AB AB AB AB AB1 2 3 4 5 6 7
AB AB AB AB AB AB8 9 10 11 12 13
Figure 1 Relative abundance of 13 PAHs in the air of (A)a graphite electrode manufacturing and (B) a cokeproduction plant (arithmetic mean + SD). I naphthalene;2 fluorene; 3 phenanthrene; 4 anthracene; 5 fluoranthene;6 pyrene; 7 benz(a) anthracene; 8 chrysene;9 benzo(e)pyrene; 10 perylene; 11 benzo(a)pyrene;12 dibenz(a,h)anthracene; 13 benzo(g,h,i)perylene.
proportions differed between plants. Similarcalculations for pyrene showed that on average thiscompound represented 2 to 8-5% of the total PAHsmeasured at the several workplaces (fig 2A) whereasthe mean contribution of the sum of three carcino-genic compounds (benzanthracene, benzo(a)pyrene,and dibenz(a,h)anthracene) ranged between 5 and12% of the total PAH (fig 2B). Excellent correlationswere found between pyrene in air and total PAHs(n = 122; r = 0 90, p < 0-001) and between pyreneand the sum of the three carcinogenic PAHs(n = 122;r = 083,p < 0001).
EXCRETION OF HYDROXYPYRENEKinetics of elimination of hydroxypyrene in urineFifteen workers from the coke production and thegraphite electrode manufacturing plants providedspot urine samples at the end of a work week and atvarious times during the following rest periodextending up to four days. The hydroxypyreneconcentration was expressed in per cent of theconcentration in the end of shift sample. Table 3presents the concentration of hydroxypyrene in theend of shift sample for each worker and the correla-tion coefficient (with associated p value) of therelation between the percentage (log scale) of theurinary hydroxypyrene concentration and the timeinterval since the end of work. Assuming a first orderelimination model, the half life has been calculatedfrom the slope of the regression line and is given inthe last column. On average, after stopping exposure,the time needed for a 50% reduction of thehydroxypyrene concentration in urine amounts to 18hours with a 95% confidence interval (95% CI)ranging from 16 1 to 19 8 hours.
Relation between the urinary excretion ofhydroxypyrene and exposure to airborne PAHSFor each worker a spot urine sample was collectedbefore and after the workshift during which theconcentration of PAHs in the breathing zone wasmeasured. On an individual basis, the coefficient ofcorrelation of the relation between concentration ofhydroxypyrene in postshift urine samples and pyrene
I
c
-0
764
. ;A ..x
on 10 May 2018 by guest. P
rotected by copyright.http://oem
.bmj.com
/B
r J Ind Med: first published as 10.1136/oem
.49.11.761 on 1 Novem
ber 1992. Dow
nloaded from

Exposure to polycylic aromatic hydrocarbons in a coke production and a graphite electrode manufacturing plant
40
30
g 20
10
0
30
20
10
0
A
REF LEX Cl C2 Gl G2 G3 G4 G5 G6
REFLEX Cl C2 Gl G2 G3 G4 G5 G6
Figure 2 Relative abundance of (A) pyrene and (B) thesum of benz (a) anthracene, benzo (z)pyrene, anddibenz(a,h)anthracene in the air of different work areasfroma coke production and a graphite electrode manufacturingplant (arithmetic mean + SD).
in air amounted to 0-67 (n = 122, p < 0-0001); itwas not significantly greater (r = 0-69, n = 102,p < 0-001) when only the increase in hydroxypyreneconcentration over the shift was taken into considera-tion and corrected for the residual elimination ofhydroxypyrene resulting from previous exposures toPAH. The excretion of hydroxypyrene (end of shiftconcentration) was also significantly correlated withtotal concentration ofPAHs in air samples (n = 122;r = 0 72, log hydroxypyrene (pg/g creatinine)= -0 1132 + 0A4055 log total PAHs (pg/m')). Foreach group ofworkers the geometric means ofthe preand postshift urinary hydroxypyrene concentrationswere calculated for smokers and non-smokersseparately. Table 4 presents the data together withthe corresponding mean pyrene concentrations in airduring the workshift. On a group basis the relation(log scales) between exposure to pyrene and theexcretion of its hydroxylated metabolite in urine washigh but was not significantly different whether the
excretion was expressed as the hydroxypyreneconcentration in urine at the end of the workshift(n = 20; r = 0 74, p < 0-0001) or as the change inconcentration over the shift (n = 20; r = 0-76,p < 0 0001).The change in concentration of hydroxypyrene
over the shift was statistically analysed by a two wayanalysis of variance involving job category, smokinghabits, and a test for interaction. A statisticallysignificant influence (p < 0 0001) ofjob category wasfound but no significant effect of smoking and inter-action terms between both factors. A multivariateregression analysis (log scales) evaluating theincrease over the shift of the urinary hydroxypyreneconcentration as a function of pyrene in air, smokinghabits (coded 0 or 1), and an interaction termbetween both was also performed on the individualworkers or on the group data (table 5). Again the onlyvariable significantly influencing hydroxypyreneexcretion was concentration of pyrene in air.Another attempt to assess the importance of
smoking as a potentially confounding factor forexcretion of hydroxypyrene was made using theconcentration of thiocyanate in urine." Possibleinterference of occupational exposure to hydrogencyanide was negligible because at most it involved 16workers from the coke oven plant where low concen-tration of hydrogen cyanide were sometimes detec-ted.'2 The results of a multivariate regression analysislinking the postshift hydroxypyrene excretion withthe concentration ofpyrene in air during the shift and
zC
'U
a,
.-C)
0)
CX01)c
0._
x0
L-'a
100n= 122r = 0-72p < 0.0001
10
1-0
0-1
0*
* 00
0
.
0
000
0
0o
0-01 0-1 1.0 10 100 1000
Total PAH conc in air (,ug/m')
Figure 3 Relation between hydroxypyrene concentration inpostshift urine and total concentration ofPAHs in air.
765
on 10 May 2018 by guest. P
rotected by copyright.http://oem
.bmj.com
/B
r J Ind Med: first published as 10.1136/oem
.49.11.761 on 1 Novem
ber 1992. Dow
nloaded from

Buchet, Gennart, Mercado-Calderon, Delavignette, Cupers, Lauwerys
Table 3 Elimination kinetics of hydroxypyrene in 15 workers exposed to PAHs
Hydroxypyrene in end No of urine samples Time for 50%of last shift urine collected duringfour reduction in urine
Worker sample (pglg creatinine) days at rest r* p value concentration (h)
1 17 0 6 0 96 0 0028 17 02 12 0 6 0 96 0 0023 18 33 39 7 083 00209 1344 74 6 097 00010 1755 125 6 094 00195 1486 193 6 096 00020 1587 447 7 098 00001 1598 260 7 092 00036 14 19 14 9 7 0 89 0 0068 26-310 66 7 095 00009 1931 1 20 3 5 0 94 0 0161 15 812 114 7 099 00001 16813 13 5 7 0-97 0-0020 18 914 19-9 7 0 90 0-0133 24 415 82 7 097 00020 21 7
*Correlation coefficient of the relation between the urinary hydroxypyrene concentration (expressed in % of the end of shiftconcentration; log scale) and the time interval since the end of work.
the urinary excretion of thiocyanate introduced as
independent variables showed that a linear modelfittedthefindings (logvalues;r2 = 0O47,p < 0 0001);however, thiocyanate excretion only explained 2-3%of the variance in excretion of hydroxypyrene.
DiscussionHigh PAH concentrations were found in the air ofthecoke oven plant; at the topside, median and geometricmean values were 241 and 199 ig total PAHs/m3respectively and they were one order of magnitudelower on the benchside (25 (median) and 14(geometric mean) ug/m3). At both locations,however, the airborne concentrations of PAHsshowed a great variation between workers (the
geometric standard deviation of the measurementsexceeded 4). Naphthalene, phenanthrene, perylene,fluoranthene, and fluorene were the most abundantPAHs in the air of the coke oven plant: theyrepresented 34, 18, 13, 7 5, and 7% of the totalamount respectively. Benzo(a)pyrene, the carcin-ogenic PAH representative, occurred at a concentra-tion equal to 2% of the total amount of PAHs-thatis, between 0-002 and 2 pg/m3 (geometric mean 0 04)on the benchside and between 0-8 and 31-8 yg/M3(geometric mean 5 85) on the topside of the cokefactory. Pyrene represented about 3% of the totalamount ofPAHs in the air of the coke oven plant; itsconcentration ranged between 0-01 and 2-86 (geo-metric mean 0-07) and between 1-53 and 88-3 pg/m3(geometric mean 9-44) in the bench and topside areas
respectively.
Table 4 Hydroxypyrene concentration in pre and postshift urine samples
Hydroxypyrene concentration (pg/g creatinine)* Pyrene in
Group Smoking habits No Preshift sample Postshift sample air (ug/m3)*REF NS 9 015 0 33 0 01
S 6 032 036 002LEW NS 5 0-28 0-35 0-03
S 6 094 099 0-16Ci NS 4 2 27 2-36 005
S 6 046 1-45 009C2 NS 3 467 1091 15 87
S 3 3 22 1172 5 62GI NS 3 085 107 010
S 7 088 1 06 004G2 NS 8 0 55 1 10 005
S 17 1 21 1 52 0 05G3 NS 2 5-28 4 94 0 20
S 4 315 604 039G4 NS 15 160 233 021
S 2 267 726 0 13G5 NS 5 3-23 5-75 10 75
S 9 434 547 352G6 NS 3 613 7 99 27 27
S 5 621 958 3*35
*Geometric mean.N = non smoker; S = smoker.
766
on 10 May 2018 by guest. P
rotected by copyright.http://oem
.bmj.com
/B
r J Ind Med: first published as 10.1136/oem
.49.11.761 on 1 Novem
ber 1992. Dow
nloaded from

'Exposure to polycylic aromatic hydrocarbons in a coke production and a graphite electrode manufacturing plant
Table 5 Multiple regression analysis of the increase in concentration of hydroxypyrene in urine over the shift as afunction ofconcentration ofpyrene in air, smoking habits, and interaction between both factors
Regression coefficient SE Partial r' p value
Model based on individual worker:Intercept 0-00963 0-0958 - 0 9202Pyrene in air 0 31904 0-0641 0-35326 0 0001Smoking habits 0 02308 0-1325 0-00034 0 8621Interaction -0 00218 0-0979 0 00000 0 9823
Model based on group means:Intercept 0-094175 0-11003 - 0A4055Pyrene in air 0A482439 0-08763 0-75243 0 0001Smoking habits 0-130552 0167440 0-01004 0A4477Interaction 0-023620 0-148937 000039 0-8761
The PAH concentrations found in this study are inagreement with previous observations reviewed bythe International Agency for Research on Cancer3especially with regard to benzo(i)pyrene concentra-tion. More recently, however, Jongeneelen et al'3have reported lower PAH concentrations at two cokeovens of a steel plant; pyrene and benzo(ot)pyrenemean concentrations were around 2 and 1 pg/m3 andthe most abundant PAHs were fluoranthene andbenzo(o)anthracene. Naphthalene was not measured.
In the graphite electrode producing plant, the aircontamination by PAHs in the blending zone (groupG5) and in the impregnation zone (group G6) wasdistinctly higher than in the other work zones; atthese two locations the exposure conditions weresimilar to those found at the topside of coke ovenswhereas in the other workplaces (groups GI to G4)concentrations of PAs were closer to those found atthe benchside of the coke factory (table 2). The mostabundant PAHs were the same in the air of thegraphite electrode producing plant as in that of thecoke ovens. Benzo(x)pyrene and pyrene represented3-5 and 6% of the total PAH amount respectively.The geometric means (and ranges) ofbenzo(i)pyreneconcentrations at the workplaces corresponding togroups Gl to G6 were 0 03 (0 002-04), 0 03 (0 002-0 5), 0-04 (0-002-1-88), 0 21 (0-002-7 53), 5 40 (0 57-25-1), and 6 22 (0 83-72 9) Mg/m3 respectively. Ineight similar plants, Lafontaine et al 14 found that thebenzo(x)pyrene concentration was the highest (up to130 pg/m3) in the workplaces where raw materialswere prepared and electrodes extruded and dipped inliquid tar (corresponding to groups G5 and G6 in ourstudy) and the lowest (up to 1 pg/M3) during gra-phitation (group G2 in our study). Similar observa-tions were made in Sweden by Lindstedt and Sollen-berg'5; benzo(oc)pyrene concentration was below0 1 pg/M3 in the graphitation area, below 1-3 pg/m3near the baking oven (group G3 in our study), andbelow 40 pg/M3 in the impregnation area (group G6in the present study). Pyrene has been detected in theair of all workplaces studied. Its relative abundanceranged from 2 to 8-5% of total PAHs. In spite of thislow proportion, the concentration of pyrene was
highly correlated with the total amount of PAHs inair (r = 0-83, p < 0 0001). Jongeneelen et al '3 forcoke ovens and Tolos et al 6 for an aluminium plantreported similar high correlations (r = 0-88 and 0-82,respectively) confirming the validity of the choice ofpyrene as a representative component of mixtures ofPAHs. We found, moreover, that the sum of theconcentrations of the carcinogenic PAH ben-zo(Q)pyrene, benz(o)anthracene, and dibenz(a,h)anthracene was highly correlated with the totalconcentration of PAHs in air (r = 0 9, p < 0-0001)and with that ofpyrene alone (r = 0 82, p < 0-0001).As already mentioned, the amount ofPAHs collec-
ted by personal samplers worn by different workers atthe same workplace differed greatly, sometimes byseveral orders ofmagnitude, making a correct evalua-tion ofthe risk ofoverexposure difficult on the basis ofair measurements. As suggested by Jongeneelen etal '3 the urinary metabolite of pyrene was measuredand its concentration in spot samples of postshifturine was shown to be highly correlated with theatmospheric concentration of pyrene (r = 0-66, p <0-0001) and with that of total PAHs (r = 0-72, p <0-0001); the second correlation was slightly higherprobably because the overall workplace contamina-tion was more adequately evaluated by themeasurement of 13 PAHs than by that of pyrenealone. Our results agree with those recently reportedby Tolos et al 16; among 18 workers exposed to PAHsderived from coal tar pitch, they found a Spearmancorrelation coefficient of 0-61 between the change inconcentration of urinary hydroxypyrene andenvironmental pyrene. The fact that Jongeneelen etal '3 did not find a good correlation between the end ofshift concentration of hydroxypyrene in urine andpyrene in air among coke oven workers was probablydue to the small number of subjects.Among subjects sustaining a low exposure to PAH,
smoking habits may cause a distinct increase in theexcretion of hydroxypyrene in urine'3 but the differ-ence in excretion between smokers and non-smokersdisappears as the intensity of exposure to PAHincreases. In the present study, the relative contribu-tion of smoking to the variance of the hydroxypyrene
767
on 10 May 2018 by guest. P
rotected by copyright.http://oem
.bmj.com
/B
r J Ind Med: first published as 10.1136/oem
.49.11.761 on 1 Novem
ber 1992. Dow
nloaded from

Buchet, Gennart, Mercado-Calderon, Delavignette, Cupers, Lauwerys
excretion in urine was negligible by comparison withthat of the exposure to PAHs. A similar lack ofsignificant effect of smoking on the excretion ofhydroxypyrene was also found by Tolos et al'6 inworkers from a plant producing aluminium.
ConclusionsThe present study confirms that the determination ofhydroxypyrene concentrations in urine can be usedas a suitable biomarker to assess individual exposureto PAHs in two different occupational settings. As thePAH exposure displays a high variability amongworkers at the same workplaces, the evaluation ofhealth risk must ideally combine an environmentalmonitoring to detect emission sources and a bio-logical monitoring (urinary excretion of hydroxy-pyrene) to take into account individual factors such aspersonal working habits, absorption routes (inhala-tion, skin contact, oral intake in smokers) and the useof personal protective equipment.The half life for the urinary excretion of hydroxy-
pyrene amounts to 18 hours indicating a possibleaccumulation of pyrene in the body during a workweek. Therefore its measurement should preferablybe performed in a urine sample collected at the end ofthe week.
AppendixConversion of units; hydroxypyrene, 1 jug = 4-58nmol; creatinine, 1 g = 8 84 mmol; 1 jug hydroxy-pyrene/g creatinine = 0 518 imol hydroxypyrene/mol creatinine.
This study was financially supported by the EuropeanCommunity of Coal and Steel and the Belgian State(Prime Minister's Service-Science Policy Office).
Requests for reprints to: Professor R Lauwerys,Industrial Toxicology and Occupational MedicineUnit, Catholic University of Louvain, 30.54, ClosChapelle-aux-Champs, 1200 Brussels, Belgium.
1 International Agency for Research on Cancer. Monographs on theevaluation of the carcinogenic risk of chemicals to humans. Vol32. Polynuclear aromatic compounds, part 1, Chemical, environ-mental and experimental data. Lyon: IARC, 1983.
2 Jongeneelen FJ, Bos RP, Anzion RB, Theuws JLG, HendersonPT. Biological monitoring ofpolycyclic aromatic hydrocarbonmetabolites in urine. Scand J Work Environ Health 1986;12:137-43.
3 International Agency for Research on Cancer. Monographs on theevaluation of the carcinogenic risk of chemicals to humans. Vol34. Polynuclear aromatic compounds,part 3, industrial exposuresin aluminium production, coal gasification, coke production andiron and steelfounding. Lyon: IARC, 1984.
4 Lesage J, Perrault G, Durand P. Evaluation ofworker exosure topolycyclic aromatic hydrocarbons. Am Ind Hyg Assoc J1987;48:753-9.
5 Lankmajr EP, Muller K. Polycyclic aromatic hydrocarbons inthe environment, high-performance liquid chromatographyusing chemically modified columns. J Chromatogr 1979;170:139-46.
6 Das BS. Applications of HPLC to the analysis of polycyclicaromatic hydrocarbons in environmental samples. In:Lawrence JF. Liquid chromatography in environmentalanalysis. Totowa, NJ: Humana Press, 1984.
7 Jongeneelen FJ, Anzion RBM, Henderson PTh. Determinationof hydroxylated metabolites of polycyclic aromatic hydro-carbons in urine. J Chromatogr 1987;413:227-32.
8 Pettigrew AR, Fell GS. Simplified colorimetric determination ofthiocyanate in biological fluids, and its application to investiga-tion of the toxic amblyopias. Clin Chem 1972;18:996-1000.
9 SAS/STAT Guidefor personal computers version 6. Cary, NorthCarolina: SAS Institute Inc, 1987.
10 Horning RW, Reed L. Estimation of average concentration inthe presence of nondetectable values. Applied Occupationaland Environmental Hygiene 1990;5:46-5 1.
11 Ngogang J, Eben-Moussi E, Raisonnier A. Le thiocyanatesalivaire, urinaire et plasmatique des fumeurs et des non-fumeurs. Pathol Biol 1983;31:155-60.
12 Masek V. Hydrogen cyanide in the air of coking plant workingenvironmnent. Zentralblatt Arbeitsmedizin Arbeitsschutz 1974;24:101-5. (In German).
13 Jongeneelen FJ, Van Leeuwen FE, Oosterink S, et al. Ambientand biological monitoring of coke oven workers: determinantsof the internal dose of polycyclic aromatic hydrocarbons. Br JInd Med 1990;47:454-61.
14 Lafontaine M, Attenont H, Truy S. Exosition aux hydro-carbures polycycliques aromatiques dans l'industrie pro-ductrice d'electrodes en carbone. Cahiers de Notes Documen-taires 1988;132:453-7.
15 Lindstedt G, Sollenberg J. Polycyclic aromatic hydrocarbons inthe occupational environment. Scand J Work Environ Health1982;8: 1-19.
16 Tolos WP, Shaw PB, Lowry LK, Mackenzie BA, Deng JF,Markel HL. 1 Pyrenol: a biomarker for occupational exposureto polycyclic aromatic hydrocarbons. Applied Occupationaland Environmental Hygiene 1990;5:303-9.
Accepted 27 January 1992
768
on 10 May 2018 by guest. P
rotected by copyright.http://oem
.bmj.com
/B
r J Ind Med: first published as 10.1136/oem
.49.11.761 on 1 Novem
ber 1992. Dow
nloaded from