Embed Size (px)
Citation preview

Evaluation of Results Based Aid in Rwandan Education - Year Two
May 2015
Submitted by
Upper Quartilein association with
Institute of Policy Analysis and Research - Rwanda
Evaluation Report

P0 6084 Evaluation of Results Based Aid in Rwandan Education – Year Two Evaluation Report
Table of contents
List of Acronyms
Glossary of Terms
Executive Summary ................................................................................................................................. i
1 Introduction and Background .......................................................................................................... 1
1.1 Introduction .............................................................................................................................. 1
1.2 Evaluation purpose and scope of work ................................................................................... 1
1.3 Context of the evaluation ........................................................................................................ 4
1.4 Summary of year one evaluation findings ............................................................................... 6
2 Methodology .................................................................................................................................... 7
2.1 Methodological approach ........................................................................................................ 7
2.2 Methods ................................................................................................................................... 9
2.3 Limitations and challenges of the research ........................................................................... 16
2.4 Research ethics .................................................................................................................... 18
3 The evaluation findings ................................................................................................................. 19
3.1 Introduction ............................................................................................................................ 19
3.2 Impact-related findings .......................................................................................................... 19
3.3 Process-related findings ........................................................................................................ 35
3.4 Has value for money been achieved? ................................................................................... 42
4 Conclusions and (interim) lessons learned ................................................................................... 46
4.1 Introduction ............................................................................................................................ 46
4.2 Conclusions of the year two evaluation ................................................................................ 46
4.3 Interim lessons learned ......................................................................................................... 50
5 Recommendations ........................................................................................................................ 51
Bibliography .......................................................................................................................................... 53
Appendix 1 – List of those consulted .................................................................................................... 56
Appendix 2 – Alternative theories of change ........................................................................................ 57
Prepared by Upper Quartile:
Paul Clist (Quantitative Research Lead), Brendan Whitty (Qualitative Research Lead), Joseph
Holden (Value for Money Lead), Pamela Abbot and IPAR-Rwanda (District and School Level
Research team), Eric Woods (Education Sector Specialist), Kathleen Latimer (Evaluator and Project
Manager) and Chris Boyd (Project Director).

P0 6084 Evaluation of Results Based Aid in Rwandan Education – Year Two Evaluation Report
List of acronyms
12 YBE Twelve year basic education
9 YBE Nine year basic education
CEFR Common European Framework for Reference
CGD Center for Global Development
DDG Deputy Director General
DEO District Education Officer
DFID Department for International Development
DFID-ESDG DFID- Education Service Delivery Grant
DFID-R DFID-Rwanda
DG Director General
DP Development Partner
EC European Commission
ECD Early Childhood Development
EDC Education Development Centre
EDPRS Economic Development Poverty Reduction Strategy
EGMA Early Grade Mathematics Assessment
EGRA Early Grade Reading Assessment
EICV Integrated Household Living Conditions Survey or Enquête Intégrale sur les Conditions de Vie des ménages
EL English Language
EMI English as the Medium of Instruction
EMIS Education Management Information System
ESSP Education Sector Strategic Plan
EvD Evaluation Department
FGD Focus Group Discussion
FY Financial Year
GBP Great British Pound (£)
GoR Government of Rwanda
HEART Health, Education and Advice Resource Team
HMG Her Majesty’s Government
ICAI Independent Commission for Aid Impact
ICT Information and Communications Technology
IF Innovation Fund
INSET In-Service Teacher Training
IPAR-Rwanda Institute of Public Policy Analysis and Research – Rwanda
JRES Joint Review of the Education Sector
KI Key Informant
KII Key Informant Interview
LARS Learning Assessment in Rwandan Schools
M&E Monitoring and Evaluation
MDG Millennium Development Goal
MINALOC Ministry of Local Government
MINECOFIN Ministry of Finance and Economic Planning
MINEDUC Ministry of Education
MoU Memorandum of Understanding
NGO Non-Governmental Organisation
NPV Net Present Value
P1,P2 etc Primary 1, Primary 2

P0 6084 Evaluation of Results Based Aid in Rwandan Education – Year Two Evaluation Report
PbR Payment by Results
PEA Political Economy Analysis
PFM Public Financial Management
PTA Parent Teacher Association
PTR Pupil: Teacher Ratio
PV Present Value
RBA Results Based Aid
RC Results Compact
REAP Rwanda English in Action Programme
REB Rwanda Education Board
RESP Rwanda Education Sector Programme
RWF Rwandan Franc
S1, S2 etc Secondary 1, Secondary 2
SBM School Based Mentor
SBMP School Based Mentor Programme
SBS Sector Budget Support
SEO Sector Education Officer
SMT [Government of Rwanda, Education] Senior Management Team
SWAp Sector-Wide Approach
TA Technical Assistance
TAF Technical Assistance Fund
TDM Teacher Development and Management
TOC Theory of Change
TOR Terms of Reference
TVET Technical and Vocational Education and Training
TWG Technical Working Group
UQ Upper Quartile
USAID United States Agency for International Development
VfM Value for Money
VM Vice Mayor
VSO Voluntary Service Overseas
WHO World Health Organisation

P0 6084 Evaluation of Results Based Aid in Rwandan Education – Year Two Evaluation Report
Glossary of terms
The aim in this report is to strike a balance between providing sufficient detail so as to allow an
assessment of the quality and breadth of the technical work undertaken, and providing sufficient
clarity so as to allow a non-specialist reader to understand the key messages in the report.
In order to aid the non-technical reader a glossary of key terms is provided here. Throughout the text,
SMALL CAPS are used to denote a term that appears below.
COEFFICIENT– The estimated COEFFICIENT describes the strength of the effect that a one unit
increase in the INDEPENDENT VARIABLE has on the DEPENDENT VARIABLE.
DEPENDENT VARIABLE – In crude terms, the thing we are trying to explain.
DUMMY– A VARIABLE which takes the value 1 when a condition is met, and 0 otherwise. For
example, a year DUMMY for 2012 takes the value 1 when the year is 2012, and 0 otherwise. In
this example, the COEFFICIENT would measure the effect of it being 2012 relative to the base year.
INDEPENDENT VARIABLE(S) - In crude terms, the thing(s) we are using to explain the DEPENDENT
VARIABLE.
NET PRESENT VALUE (NPV) – The total current value of future activities, minus any related costs
OBSERVATION – One data point. If we have data on the population of each Rwandan district for
one year, we have 30 OBSERVATIONS (as there are 30 districts). If we have it for two years, we
have 60 OBSERVATIONS.
OUT-OF-SAMPLE PREDICTION – This helps us test the accuracy of our model. We first run the model
on a subset of data, deliberately excluding some OBSERVATIONS (specific years or districts). We
then use those COEFFICIENTS to ‘predict’ the excluded OBSERVATIONS. We can then compare the
prediction with the known outcome.
PRESENT VALUE – The total current value of future activities. For example, £200 in one year’s time
may have a present value of £150, as a person would be willing to trade off some of the amount
in order to receive it earlier.
SIGNIFICANT – The measure of how likely it is to see an effect purely through chance. To be
SIGNIFICANT at the 1% level means that once in 100 times you would see the effect and it would
purely be due to chance. The other typical SIGNIFICANCE levels are 5% and 10%. The smaller the
level of SIGNIFICANCE, the more confidence the evaluator can have in the evidence.
SPECIFICATION– The list of INDEPENDENT VARIABLES included in a specific model and the type of
estimation technique used.
VARIABLE – An indicator or measurement, such as population or teacher numbers.

P0 6084 Evaluation of Results Based Aid in Rwandan Education – Year Two Evaluation Report
i
Executive Summary
Introduction Upper Quartile has been commissioned to
undertake a three-year mixed-method process
and impact evaluation of the Results Based
Aid (RBA) pilot in Rwandan education,
considering if, how and in what circumstances
the pilot contributed to the results envisaged in
the Memorandum of Understanding (MoU)
between the Department for International
Development (DFID) and the Government of
Rwanda (GoR). This second year evaluation
report builds on the year one report (Upper
Quartile, 2014). The final evaluation report will
be submitted in mid-2015.
Purpose of the evaluation The purpose of the evaluation is to determine
any contribution of the RBA pilot to additional
learners completing key stages in primary and
secondary education1 and additional teachers
becoming competent in the use of English as
the medium of instruction.2
The evaluation considers the response of the
recipient (GoR) and other key actors to RBA;
the various factors that impact on the agreed
‘results’, and seeks to identify ‘lessons learned’
to aid understanding and improvement of RBA
in Rwanda and elsewhere. This year two
report presents findings in relation to 2013
completion data (corresponding to the second
year of pilot implementation).3
Methodology The methodological approach to the evaluation
is ‘realist’; exploring questions about what
works, for whom, in what circumstances and
why. The impact evaluation component is
premised on the findings of an econometric
model which explores trends in, and the
factors affecting, completion with the aim of
identifying any RBA effect. The process
evaluation was approached by means of a
1 ‘Completion’ is defined as additional learners sitting key
stage examinations in the sixth grade of primary school (P6), the third and sixth grades of secondary school (S3 and S6). 2 ‘Competency’ has been defined as additional teachers reaching level B1 proficiency in the Common European Framework for Reference (CEFR) scale. A baseline sample survey was undertaken by the British Council in 2012 with a follow-up sample survey administered in November/ December 2014. 3 Findings relating to improvements in English language
proficiency will be presented in the year three report when data become available.
process study. The aim was to unpack policy
processes related to completion/English
language proficiency, and the role of RBA
within them to identify if and how RBA
influenced the actions of GoR.
The year two evaluation included in-depth
modelling of the potential value for money
(VfM) of RBA. This research will contribute to
the theoretical debate around payment by
results (PbR) mechanisms.
The framework for research and analysis is
provided by a set of seven macro-evaluation
questions posed in year one.4 These are:
Impact-related questions:
What has been achieved?
Has the RBA approach contributed to impact in relation to the envisaged results?
What factors have impacted on the achievement of the RBA results?
Process-related questions:
How is the RBA approach perceived in Rwandan education?
How did government respond to RBA?
Additional evaluation questions:
Has value for money been achieved?
What lessons have been learned to inform RBA in Rwanda and elsewhere?
The mixed-method evaluation approach is
summarised below in Table E1.
Table E1 – The evaluation approach
Method Approach
Econometric modelling
Modelling drawing on national level secondary data sources to identify any effect of RBA over and above what may have been expected (in terms of completion) in the absence of RBA.
VfM analysis
Considers the cost-effectiveness of RBA relative to not providing RBA. Using national level secondary data sources and standard practice for assessing VfM, two different counterfactuals were constructed.
Qualitative research
Semi-structured interviews were conducted with national level stakeholders to study the responses of GoR institutions to RBA. The research attempted to track these responses down through the education system, conducting interviews with district education officials in 4 districts and interviews/ focus group discussions with school Principals, school-based mentors, teachers, parents and students in a purposive sample of 8 schools (2 in each district).
4 The EQs form the evaluation framework due to the fact
that there was no established theory of change for the RBA pilot at the outset. This approach was agreed with DFID in the evaluation inception phase.

P0 6084 Evaluation of Results Based Aid in Rwandan Education – Year Two Evaluation Report
ii
This year two evaluation report collates
findings and conclusions on the macro-level
evaluation questions against a deduced theory
of change for RBA in Rwandan education;
considering the hypothesis that the RBA pilot,
through an incentive not present in other forms
of aid, will elicit a response from GoR to
achieve RBA results.
Impact-related findings
Completion
The RBA payment in 2014 (relating to 2013
completion data) was £1,883,420 GBP.
Payment was made to GoR on the basis of
improved completion (in terms of the absolute
number of examination sitters in comparison to
the previous year) at the third and sixth grades
of secondary school (S3 and S6).
Although performance at the sixth grade of
primary school (P6) dipped by just under 2% in
2013, a positive payment was also achieved at
the P6 level on the basis of improvement
across the pilot as a whole (2011-13).
In the second year of the RBA pilot (2013)
econometric modelling showed that GoR
achieved SIGNIFICANTLY above trend
completion at the S3 level. This was true for
both male and female students at S3.
Quantitative analysis linked this improvement
to increased access, increased retention (in
particular a remarkable improvement in
converting S3 enrolees to S3 completers in
2013) and improved transition (an increase in
the number of S2 enrolees who went on to S3
in 2012).
This positive improvement was not replicated
at P6 and S6 where the econometric analysis
found completion to be either negligibly or
SIGNIFICANTLY below trend.
Having established that 2013 completion at the
S3 level was SIGNIFICANTLY above trend, the
evaluation analysis sought to explain this
increase.
Qualitative research at national and sub-
national level explored the means by which
GoR has sought to increase completion and
any potential linkages to RBA.
The evaluation found no identifiable effect of
the RBA agreement on GoR actions or
messaging. RBA supported the pre-existing
emphasis on completion rather than providing
an incentive for additional action. The
evaluation in year two has not been able to
offer a firm explanation for the increased
completion at S3, but it does not appear to be
a result of any specific response from GoR to
RBA.
In keeping with findings from year one of the
evaluation, the research in year two
highlighted the wide range of factors that are
seen to affect completion and which may act
as facilitators or inhibitors to progress in further
improving completion rates.
Evidence suggests that strategic policy
changes (particularly the introduction and roll-
out of 9 (and latterly 12) Year Basic Education)
have had large and beneficial impacts on
completion rates. At the district and school
level concerted action to reduce drop-out and
repetition is also perceived to be impacting on
completion. Other factors affecting completion
were found to include gender, wealth, school
resources, literacy and (qualitatively) issues/
perceptions of educational quality. Addressing
such issues requires sustained investment and
intervention in, and beyond, the education
sector. The evaluation therefore questions the
time horizon of the RBA pilot.
Finally, the issue of education quality emerged
through the district and school-based fieldwork
and there was a perception among some
consultees that the focus on completion may
negatively affect quality. Educational quality is
currently a high priority in Rwanda and both
GoR and donors recognise the challenge. The
evaluation makes no suggestion that RBA has
impacted negatively. Questions over the
interface between completion and quality do
however lead to questions about the efficacy
of completion as the incentivised measure and
as a means to achieve DFID’s goal - improved
and equitable learning outcomes contributing
to Rwanda’s future knowledge-based and
skilled economy (DFID, 2011c),
English language
In year two of the evaluation it was not
possible to comment on achievements in
relation to English language proficiency, or any
possible RBA effect. The evaluation did
however begin to build a picture of the factors
influencing efforts to improve English language
proficiency. This will be further explored in
year three when follow-up data from the
sample survey of teachers’ proficiency in
English becomes available.

P0 6084 Evaluation of Results Based Aid in Rwandan Education – Year Two Evaluation Report
iii
Process-related findings
At higher levels of GoR, RBA has generally
been positively received. The modality is a
good fit with the established results-driven
culture of GoR. It is perceived largely as
‘business as usual’ and additional financing for
GoR to pursue their pre-existing agenda. This
is in contrast to the deduced theory of change
which assumes an incentive for additional
action. The evaluation hence sought to
understand why this was.
The evaluation found that RBA is little known
outside of the highest levels of GoR
(specifically higher levels of the Ministry of
Education and the Rwanda Education Board)
and that features of the way in which RBA
funding is handled may work against its
effectiveness as an incentive for additional
action.
The lack of observed effect at the national
level essentially ‘breaks the chain’ of the
deduced theory of change. Nevertheless the
year two research followed the remainder of
the links to understand how and why
messaging on completion and English
language proficiency were communicated from
the ‘centre’, down through the education
system, to districts and schools. This was
important to gain key learning for future RBA
pilots in Rwanda and elsewhere and to
address the evaluation questions set by DFID.
In the case of completion, the evaluation found
that Rwanda’s imihigo system (a management
control and accountability mechanism) has
been effective in mainstreaming messages on
completion and incentivising action to promote
completion at district and school-level. This
system pre-dates RBA and there is no
evidence that RBA has altered or influenced
the approach of GoR.
In the case of English language,
communication, management control and
accountability is constituted not through
imihigo but by inspections and mentors’ line
management. Qualitative research suggested
that these processes typically lacked the same
strength as imihigo; explaining the fact that
priority given to English language proficiency
at district and school level was less than that
granted to completion (despite both being firm
and long-standing priorities of GoR).
In considering the response of GoR to RBA,
there is an important distinction between
completion and English language.
The English language indicator was included
in the RBA agreement at the behest of GoR,
and against the initial wishes of DFID. The
baseline survey of language proficiency, a
requirement of the RBA agreement, returned
poor results which appear to have shocked
GoR and other education sector stakeholders.
The suggestion of the evaluation evidence is
that, as a result bringing deficiencies into view,
attention on indicators of English language
proficiency has intensified, opening the space
for dialogue and debate and increasing focus
on the need for policy action. The impact of
GoR’s activities will be considered in the year
three evaluation.
Value for Money (VfM) findings
Greater emphasis was placed on VfM in year
two of the evaluation. The analysis concluded
that aid spent in the Rwandan education
sector represents excellent VfM, as do the
‘additional completers’ in 2013 (as
demonstrated by the econometric modelling).5
It stands that if additional completion was
attributable to RBA then, under certain
circumstances, RBA would represent VfM in
comparison to other aid modalities; the VfM
models found the extra costs of evaluation and
verification associated with RBA was heavily
outweighed by the future benefits of ‘additional
completers’.
Overall, while RBA is seen to have reinforced
GoR efforts, the combined evidence base
does not suggest that completion outcomes
would have been different in the absence of
RBA. In saying this, the fact remains that aid to
Rwandan education represents good VfM;
DFID’s investment, whether via RBA or SBS
appears sound.
Conclusions and (interim) lessons
learned
In relation to the above trend increase in
completion at S3, the evaluation provides no
specific explanation. It was unclear to all
stakeholders how this has come about and
which specific policies and actions may be
responsible. There was however little doubt
5 Certain assumptions withstanding.

P0 6084 Evaluation of Results Based Aid in Rwandan Education – Year Two Evaluation Report
iv
that success was due to pre-existing GoR
priorities rather than RBA itself.
The evaluation concludes that both the RBA
measure and the S3 success were caused by
a common source: GoR priority. From this it
can be inferred that RBA successfully
reinforced GoR’s efforts, potentially
contributing to the observed achievements.
However, there is no evidence that this would
not also have been achieved in the absence of
RBA or indeed that RBA is offering anything
over and above aid provided via sector budget
support (SBS) modalities in this context. This
conclusion will be revisited in the year three
evaluation.
In relation to English language, in this case
there is evidence that RBA has worked more
as some proponents would wish. Although it is
as yet too early to comment on achievements
in relation to English language proficiency, the
RBA baseline survey appears to have sent a
strong signal of current performance resulting
in intensified policy focus and, possibly, a
contribution to a more holistic future approach
to GoR’s policy implementation efforts. It is not
possible to say whether or not the RBA
baseline survey would have had the same
catalytic effect if it had not been incentivised.
The year two evaluation findings and
conclusions lead the evaluators to offer the
following tentative, emerging lessons learned:
Emerging lesson 1: Alignment of RBA
with pre-existing government priorities may
remove/reduce the potential incentive for
additional action to achieve results.
Emerging lesson 2: Where the financial
incentive is perceived as small, transient
and/or where it is not visible at the
operational level, this may remove/reduce
the potential incentive for additional action
to achieve results.
Emerging lesson 3: The existence (or
implementation) of sufficient management
controls and accountability mechanisms to
ensure communication, compliance and
action on policy priorities set by the ‘centre’
will facilitate success.
Emerging lesson 4: For RBA to be a
useful modality in measuring progress
towards the outcome sought, ‘results’ must
be as close as possible to that outcome.
Recommendations
As the RBA agreement will soon expire, the
evaluation team pose tentative
recommendations to inform DFID-R decision
making. Four options were considered:
Option 1: Maintain the status quo;
Option 2: Scale-up the existing agreement;
Option 3: Inclusion of an indicator of
learning outcomes;
Option 4: Shift the focus of the programme
towards incentivising improvement in
English language proficiency.
The tentative recommendation is for a revised
RBA programme reflecting a combination of
options 3 and 4 to be developed and piloted.

P0 6084 Evaluation of Results Based Aid in Rwandan Education – Year Two Evaluation Report
1
1 Introduction and Background 1.1 Introduction
Upper Quartile (UQ) in association with the Institute of Policy Analysis and Research - Rwanda
(IPAR-Rwanda) are pleased to submit this second year report of the evaluation of the Results Based
Aid (RBA) in Rwandan Education pilot. This report builds on, and should be read in conjunction with,
the year one evaluation report (Upper Quartile, 2014). This report is presented to the Government of
Rwanda (GoR) and the UK Department for International Development (DFID).
1.2 Evaluation purpose and scope of work
1.2.1 Evaluation purpose
Upper Quartile has been commissioned to undertake a mixed-methods process and impact
evaluation of the RBA pilot in Rwandan education (2012-2014), considering if, how and in what
circumstances the RBA pilot contributed to the results envisaged in the Memorandum of
Understanding (MoU) agreed between DFID and the GoR.
The overarching purpose of the evaluation is to determine any contribution of the RBA pilot to
additional learners completing key stages in primary and secondary education6 and additional
teachers becoming competent in the use of English as the medium of instruction.7
The evaluation will consider the response of the recipient (GoR) and other key actors to RBA; the
influence of the various factors that impact on achievement of the agreed results, and identify ‘lessons
learned’ to improve the RBA pilot in Rwanda, about the effectiveness of RBA more generally and
about how RBA could be transferred to other contexts.
1.2.2 Scope of work
The evaluation focuses on the RBA pilot. It is noted that RBA is embedded in DFID’s wider Rwanda
Education Sector Programme (RESP) and, while this is not an evaluation of the RESP, it is necessary
at points to discuss the RESP and RBA’s role within it.
1.2.3 Deviations from the original terms of reference
The original evaluation terms of reference (TOR) (see Annex 1) remain valid in steering the delivery of
the evaluation in terms of its overall purpose and scope of work. The evaluation continues to take a
realist perspective as its overarching methodological approach and the assessment of impact remains
premised on the findings of an econometric modelling exercise, reinforced with qualitative primary
data collection at national, district and school level. There are a number of deviations from the TOR,
agreed in full with DFID, which should be highlighted. These are:
Evaluation questions - The TOR pose a number of evaluation questions (see Appendix 2
embedded within the TOR). These were altered during the evaluation inception phase (see section
1.2.5 below). The agreed evaluation questions provide the overarching evaluation framework and
structure of this year two evaluation report. This is in keeping with the year one evaluation report
and was agreed with DFID Rwanda.
The analysis framework - Paragraph 21 of the TOR states that the service provider should “use
the current RESP theory of change (ToC) model as a framework to unpack” the response of GoR
to RBA. It has been agreed with DFID that the RESP ToC is not an appropriate framework for
analysis - the RBA pilot is contained within the RESP and there is not an RBA specific ToC (either
nested within the RESP or stand-alone). As noted in section 1.2.2 above, the evaluation team
6 ‘Completion’ is defined in the RBA agreement in terms of additional learners sitting key stage examinations in the sixth grade
of primary school (P6) and the third and sixth grades of secondary school (S3 and S6). 7 ‘Competency’ has been defined in terms of additional teachers reaching level B1 proficiency in relation to the Common European Framework for Reference (CEFR) scale. A baseline sample survey of teachers’ proficiency was undertaken by the British Council in 2012 with a follow-up sample survey administered in November/December 2014.

P0 6084 Evaluation of Results Based Aid in Rwandan Education – Year Two Evaluation Report
2
accept the need to acknowledge the RESP and RBA’s role within it. Comment will be made where
necessary and where evidence allows. The RESP ToC does not however form the analytical
framework of this evaluation. This deviation also applies to paragraph 28 of the TOR.
As an alternative to the RESP, in year one of this evaluation the team proposed a simplistic
‘deduced’ ToC for RBA in Rwandan education. At the request of the DFID Evaluation Reference
Group8, this deduced ToC informed the evaluation research and analysis in year two.
In addition, this year two report has also given consideration to work by the Center for Global
Development (Perakis & Savedoff 2012; Perakis & Savedoff 2015) on alternative theories of
change for payment by results (PbR) programmes. These frameworks are considered in the
synthesis and discussion of evaluation findings (see Ch4 Conclusions and (interim) lessons
learned and Appendix 2).
The focus and scope of qualitative research envisaged in Upper Quartile’s original tender
(based on our interpretation of the requirements of the TOR and subsequent discussions with
DFID-R) has shifted. This change in focus has brought concurrent changes in the methods
employed. In year two of the evaluation there has been a shift in emphasis ‘towards the centre’
with more of a focus at the national level; RBA is after all an incentive for government to drive
change. The aim was to allow more in-depth examination of how the GoR’s strategic priorities,
policy and programming, behaviours and messaging may, or may not, have changed in relation to
RBA-related results, and how GoR’s management control systems have attempted to increase
completion and teachers’ proficiency in English. The process for undertaking this research is
described in full in the year two qualitative research concept note (Whitty, 2014) provided as
Annex 3. This concept note was approved by DFID and supersedes proposals in Upper Quartile’s
original tender (Upper Quartile, 2012 [unpublished]) and inception phase report (Upper Quartile,
2013 [unpublished]).
1.2.4 Additions to the original terms of reference
In year two the evaluation was granted a contract extension to allow more in-depth consideration and
modelling of value for money (VfM). As RBA is a relatively new aid instrument there is no agreed
methodology for assessing VfM. This additional research will contribute to the debate on VfM
assessment. The terms of reference for the VFM assessment are included as Annex 2.
As specified in paragraph 10 of the additional TOR, the evaluation team produced a revised approach
paper for evaluating VfM. This paper modified the options outlined in paragraph 8, Table 1 of the TOR
into two broad models (A and B). Model A covers option 1 in the TOR and model B covers options 2
to 4. Given the work involved in exploring the cost effectiveness of the RBA pilot, it was proposed by
the evaluation team, and agreed by DFID, not to focus on other elements of efficiency and economy
as outlined in section 12 of the TOR. The agreed approach to the VfM assessment is detailed in full in
the RBA Rwanda VfM Approach paper provided as Annex 4.
1.2.5 Evaluation questions
During the evaluation inception phase in April 2013, the evaluation team engaged in an iterative
process to determine the evaluation questions. This process involved the lead evaluators, the DFID
Rwanda Education Adviser and the DFID Lead on Payment by Results (PbR) Approaches. The final
evaluation question set, which differs from the questions posed in the original TOR (see also section
1.2.3), offers a balance between areas of interest to DFID Rwanda and to DFID’s central PbR
function. The evaluation is intended to answer seven macro-level questions (Table 1). These macro
evaluation questions provide the structure for this year two evaluation report.9
8 This evaluation has been supported throughout by a Reference Group comprising DFID Evaluation Department (EvD)
Advisers in the UK and Rwanda, the DFID Leads on Payment by Results (PbR) and a representative from the Center for Global Development (CGD); the think tank that has championed PbR approaches. 9 The ordering of the evaluation questions differs from the year one report in order to aid the flow of the document.

P0 6084 Evaluation of Results Based Aid in Rwandan Education – Year Two Evaluation Report
3
Table 1 – The evaluation questions
Impact-related evaluation questions Process-related evaluation questions
Q1. What has been achieved? Q4. How is the RBA approach perceived in Rwandan
education?
Q2. Has RBA contributed to impact in relation to the
envisaged results? Q5. How did government respond to RBA?
Q3. What factors have impacted on the achievement of
RBA results?
Additional evaluation questions
Q6. Has value for money been achieved?
Q7. What lessons have been learned to inform RBA in Rwanda and elsewhere?
1.2.6 Evaluation timing
The evaluation is taking place over a three year period. The inception phase was completed between
April-July 2013 with the evaluation implementation phase running from July 2013 - June 2015. The
first annual evaluation report was finalised in March 2013. The final (third year) evaluation report is
due in June 2015. It is likely that a no-cost contract extension to September 2015 will be sought. This
will allow for delays in finalising this year two report and allow for sequential implementation of the
quantitative and qualitative methods.10
This will be discussed and agreed with DFID-Rwanda.
1.2.7 Evaluation audiences
The evaluation has a number of target audiences and the evaluation findings will be used in different
ways by each. It is envisaged that the evaluation will be used by:
GoR, including the Ministry of Education (MINEDUC) to refine education policy;
The Rwanda Education Board (REB) to refine the approach to implementation of the RESP,
develop and refine strategies to increase the numbers of learners completing P6, S3 and S6 and
to enhance teachers’ proficiency in English as the language of instruction;
By development partners of the GoR in developing and implementing programmes that are likely
to impact on the two envisaged RBA results;
By DFID-Rwanda (DFID-R) to learn lessons from the implementation of RBA and thereby to
enhance its support to the education sector in Rwanda; and
By DFID, HMG and the wider development community to improve understanding of how RBA/
PbR approaches can best be designed and implemented to maximise the impact of development
spend.
1.2.8 Transparency and lesson learning
In line with DFID guidelines (DFID, 2013a), which refer to the need to fill knowledge gaps and to
improve the effectiveness of aid delivery, the RBA evaluation findings and recommendations are
intended to generate lessons to improve RBA in Rwandan education, improve RBA designs more
generally and contribute to satisfying the principle of transparency.
Evidence gathered in year two of the evaluation led to rich discussions across the team during the
research and analysis process. A triangulation and discussion process was employed across the
team to reconcile the findings of qualitative and quantitative research strands.
10
This has not been possible in previous years due to considerable delays in the release of official EMIS data. Sequential
implementation will ensure that the qualitative research in the final year of the evaluation is firmly focused on the areas of interest to DFID as they emerge from the econometric modelling.

P0 6084 Evaluation of Results Based Aid in Rwandan Education – Year Two Evaluation Report
4
1.3 Context of the evaluation
1.3.1 Introduction to Payment by Results
Failure to deliver tangible and transparent results is a recurring criticism of development assistance.
To counter this criticism DFID is increasingly making use of Payment by Results (PbR) mechanisms
with the aim of increasing accountability and value for money (VfM) from the development budget.
PbR is a form of financing that makes payments contingent on the results achieved. There is no
common definition of PbR in the development sector but DFID includes in its operational description
any programme where payments are made after the achievement of pre-agreed results11
(DFID,
2014a). By paying on delivery of results PbR is intended to drive progress in DFID’s priority areas
(DFID, 2014a). ‘Results’ in PbR contracts may be both ‘outputs’ and ‘outcomes’. It is apparent from
DFID’s 2014 PbR strategy that the organisation is keen to do more in the way of outcome-based
PbR).12
There are different models of PbR in place in the UK and elsewhere. DFID differentiates the models
on the basis of the organisation receiving the payments. DFID recognises three main types of PbR:
payments from funders to partner governments are classified as Results Based Aid (this is the model
that the current evaluation is assessing); payments from funders or government to service providers
(for example to clinics for an agreed number of vaccinations) are classified as Results Based
Financing; and the final, newly emerging, model is that of Development Impact Bonds whereby
payment is made to investors on delivery of specified results. Whichever form it takes, there are two
essential characteristics of DFID’s PbR contracts (Clist and Verschoor, 2014: 4):
There is a risk transfer (from DFID to a partner organisation) as payment depends on a result,
not an action; and
Payment is contingent on independently verified results.
In the case of the RBA pilot in Rwandan education, the principle of recipient discretion is also a
feature; the recipient (GoR) has space to decide how results are achieved.
1.3.2 Conceptualising Payment by Results
There is currently a theoretical debate about the goals of PbR: whether it is to increase the efficiency
of aid spend or to create autonomy while retaining accountability. The former is underpinned
theoretically by the principal-agent model and is understood as incentivising the behaviour of the
agent (in this case the GoR) by payment for achievement of results desired by the principal (in this
case DFID)13
(Clist & Dercon, 2014; Clist & Verschoor, 2014).
The alternative view, championed by the Center for Global Development (CGD), is that focusing on
an ultimate outcome creates greater autonomy for the agent to innovate and to experiment. The
assumption is that, in complex environments, the agent is the best-placed actor to innovate and learn
(CGD, 2014). In this, RBA is considered similar to budget support modalities with the distinction lying
in the retention of a fine-grained accountability, where payment is made only for success in achieving
results, as opposed to hollow policy reforms (isomorphic mimicry) (see for example Andrews, 2013).
In the case of the RBA pilot in Rwanda, both interpretations are drawn on within published material
(see for example the DFID RESP Business Case (DFID, 2011c)). These two views of PbR’s main
mechanism are not mutually exclusive and may reinforce each other. We return to this discussion in
Chapter 4 in relation to the evaluation conclusions and lessons learned.
11
As opposed to input/activity based contracting or upfront payment to fund future activities. 12
The 2014 strategy ‘Sharpening Incentives to Perform: DFID’s strategy for Payment by Results’ states that “...payments should be linked to outcomes or outputs...but may also be for an intermediate output or process if it can be shown that this is a measurable improvement in performance for the recipient. Payment on the basis of outcomes are a particularly important and innovative form of PbR, one that DFID is keen to do more of” (DFID, 2014a P6 Figure 1: The Results Chain). 13
These are standard terms in economic literature used to describe actors in most types of contracts between two parties.

P0 6084 Evaluation of Results Based Aid in Rwandan Education – Year Two Evaluation Report
5
1.3.3 The Results Based Aid pilot in Rwandan education
The RBA pilot forms part of DFID’s £74.98 million GBP Rwanda Education Sector Programme
(RESP). The RESP is embedded in GoR’s Education Sector Strategic Plan (ESSP) (MINEDUC,
2013); the sector wide approach (SWAp) that is currently guiding all education sector planning and
spending in Rwanda. RBA results are related to the priorities of the ESSP.
The RBA agreement in Rwanda is stipulated in the Memorandum of Understanding (MoU) between
the GoR and DFID. This was agreed in October 2012. The MoU specifies an overall budget for the
RBA pilot up to a maximum of nine million GBP, with an expected disbursement schedule up to a
maximum of three million GBP per year for three years from 2013 (with the first payment being
allocated to results achieved in 2012). It was later agreed that any shortfall in a given payment year
could be rolled over to subsequent years.
The RBA agreement is intended by DFID to help drive change in the education sector in ways that are
agreed government priorities. RBA is additional funding for GoR. It is intended to incentivise
improvements in completion at key stages and improvements in teacher competency in English.
The final GoR-DFID agreement (DFID & GoR, 2012) sets out four results to be incentivised via RBA.
It stipulates that RBA payments will be effected as follows:
For each additional child sitting the P6 exam above the previous year’s results, DFID will pay the
GoR £50 GBP. In addition to this payment, in years 2014 and 2015, DFID will also pay the GoR
£10 for each additional child sitting the P6 examination above 2011 levels;
For each additional child sitting the S3 exam above the previous year’s results, DFID will pay the
GoR £100 GBP. In addition, in years 2014 and 2015, DFID will also pay the GoR £10 GBP for
each additional child sitting the S3 examination above 2011 levels;
For each additional child sitting the S6 exam above the previous year’s results, DFID will pay the
GoR £50 GBP. In addition, in years 2014 and 2015, DFID will also pay the GoR £10 GBP for
each additional child sitting the S6 examination above 2011 levels; and
In 2015 DFID will pay the GoR £50 GBP per additional teacher competent to use English as the
medium of instruction. This will be based on a baseline assessment in 2012 and a follow-up
assessment conducted in 2014. Any payment due will be made in 2015 based on independently
verified results and subject to available funds within the £9 million GBP three year ceiling.
RBA is not a stand-alone aid modality, it is embedded within DFID’s wider Rwanda Education Sector
Programme (RESP). The DFID RESP Business Case states that the Results Compact (also referred
to as RBA) “will reward a year-on-year increase in learning achievement of girls and boys at key
stages in their schooling. This component will ensure the focus of MINEDUC is on improving learning
outcomes, not just increasing enrolment” (DFID, 2011c). The RBA indicator of completion may
therefore be considered as a proxy for learning outcomes (the assumption being that student
retention leading to completion is some measure of learning) as an indicator closer to the end goal
was not considered practical.14
In relation to the measure of English language proficiency, in 2012 the British Council undertook a
survey involving a sample of 557 teachers to ascertain baseline levels of English proficiency in
relation to the six levels of the Common European Framework for Reference (CEFR) (Council for
Europe, undated). A follow up survey was undertaken in November/December 2014 with data
expected to be available to the evaluators in Q1 2015. Payment will be made to the GoR in May 2015
for each additional teacher who has reached level B1 English proficiency. This data will be reported in
the year three evaluation report.
14
Records documenting the RBA negotiations show that a measure of educational quality and learning outcomes was not considered feasible as an RBA indicator as there was no agreed quality standard (assessments are norm referenced, not criterion referenced) and there was no baseline for an agreed standard. Further, there were multiple possible measurement tools and, at that point, there was no annual measurement of learning outcomes undertaken. Inclusion of learning outcomes as an indicator would have required a representative primary research sample study of schools to be undertaken annually.

P0 6084 Evaluation of Results Based Aid in Rwandan Education – Year Two Evaluation Report
6
All of the above stated payments are subject to the independent verification of the results.15
Payments
are calculated at the province level and by gender. Payment is received for positive results. No
penalty is applied for negative results (e.g. GoR does not lose money if the number of examination
sitters decreases for a given gender in a given province).
The first payment to the GoR (for results achieved in 2012) was made in May 2013, and came to
£1.16 million GBP. The second payment (made in May 2014 for results achieved in 2013) was £1.88
million GBP (DFID 2014b, HEART 2014). The final payment of this pilot is due to be made in May
2015 (for completion and English language results achieved in 2014).
1.4 Summary of year one evaluation findings
The year one evaluation drew limited conclusions on the impact and effectiveness of RBA in the
context of Rwandan education and highlighted mixed findings in relation to the reaction of
government. A summary of the year one findings is presented below. Further detail is available in the
year one evaluation report (Upper Quartile, 2014).
The headline finding from the year one evaluation was that the RBA pilot did not make a SIGNIFICANT
contribution to the observed increase in completion in 2012 (14,371 additional female students
and 3,742 males). This was established through analysis of results from two econometric models and
corroborated by the qualitative fieldwork.
Having established that there was no observable impact from RBA in year one, the evaluation went
on to consider the factors impacting on completion. It was established that a combination of late
entry16
, temporary withdrawal and repetition means that a high proportion of Rwandan children leave
school before they have completed the primary phase. Further, on-time completion in both primary
and secondary education is very low. This is in spite of significant achievements in relation to
enrolment at both primary and secondary levels following the introduction of free primary education in
2003 and 9-year basic education (9YBE) in 2009. Factors impacting on completion were divided into
two broad groups: educational factors (including strategic priorities for education, teaching quality
and school resources) and child and community-based factors (including socioeconomic,
demographic and child motivational factors).
Poverty was considered an indirect cause of non-completion as parents in the poorer consumption
quintiles were not able to pay the same level of financial contributions to schools as those in the
wealthiest17
. This was perceived to impact negatively on the quality of education that schools were
able to provide. While increased numbers of teachers had a positive effect on completion, the year
one evaluation highlighted that attention was needed to improve teacher morale and attendance as
well as their proficiency in English. Finally, although the general picture in relation to gender equity in
Rwanda was positive, female learners were shown to be at greater risk of non-completion in certain
districts (specifically those with low levels of literacy and high proportions of schools ‘experiencing
problems’ that are largely related to poor availability of teaching resources).
While not detecting any tangible impact as a result of RBA in year one, the evaluation noted a positive
response from those in higher level positions at MINEDUC and REB, with messages being sent down
through the system regarding both completion and teachers’ proficiency in English. The evaluation
also noted a high level of GoR ownership of the RBA agreement and good strategic alignment of RBA
results with existing GoR priorities.18
15
Independent verification is being undertaken by HEART. 16
24% of seven-year-olds and 10% of eight-year-olds were not in school in 2010/11 (EICV-3). 17
It is noted that since the year one evaluation report parental contributions to supplement the government capitation fee have been stopped. 18
This raises a question over the extent to which it will be possible for evaluation to disentangle any impact of RBA from that arising as result of existing government policy - EDPRS2 and the ESSP.

P0 6084 Evaluation of Results Based Aid in Rwandan Education – Year Two Evaluation Report
7
2 Methodology
2.1 Methodological approach
The approach to the evaluation of RBA in Rwandan education stems from a realist perspective,
rooted in the recognition that outcomes are affected positively and negatively by the real world context
in which they occur (Pawson and Tilley, 1997 & Stern et al, 2012). Realist evaluation recognises the
complexity of interventions in the social world and the difficulty of isolating the impact of a single
intervention, seeking instead to explore what works, for whom, in what circumstances and why.
Three key points to note about the realist approach which have informed the methods used in the
evaluation of RBA are:
The intervention requires the active participation and buy-in of stakeholders – the
evaluation approach takes account of the different characteristics and incentives of stakeholders,
and recognises that outcomes may differ based on these. As programmes only work through
stakeholder reasoning, the evaluation must try to understand the way in which the RBA pilot is
interpreted by different stakeholders and how this influences activities and pursuit of outcomes;
Understanding that the programme is embedded in an on-going social, political and
economic context – RBA may be an effective incentive in some contexts and not in others;
The programme cannot be isolated or kept constant – the evaluation approach recognises
change as a continuous process. The evaluation must seek to understand how observed
changes in completion and teachers’ proficiency in English come about in a dynamic system.
2.1.1 The relevant theories of change (ToC)
The realist approach to evaluation frames programmes as ‘theories incarnate’; programmes are
essentially testing a theory (or theories) about what might bring about change. However, there is no
RBA-specific ToC in Rwanda. Indeed the principle of recipient discretion, which is a feature of the
pilot in Rwanda, may be considered at odds with a theory-based evaluation approach.
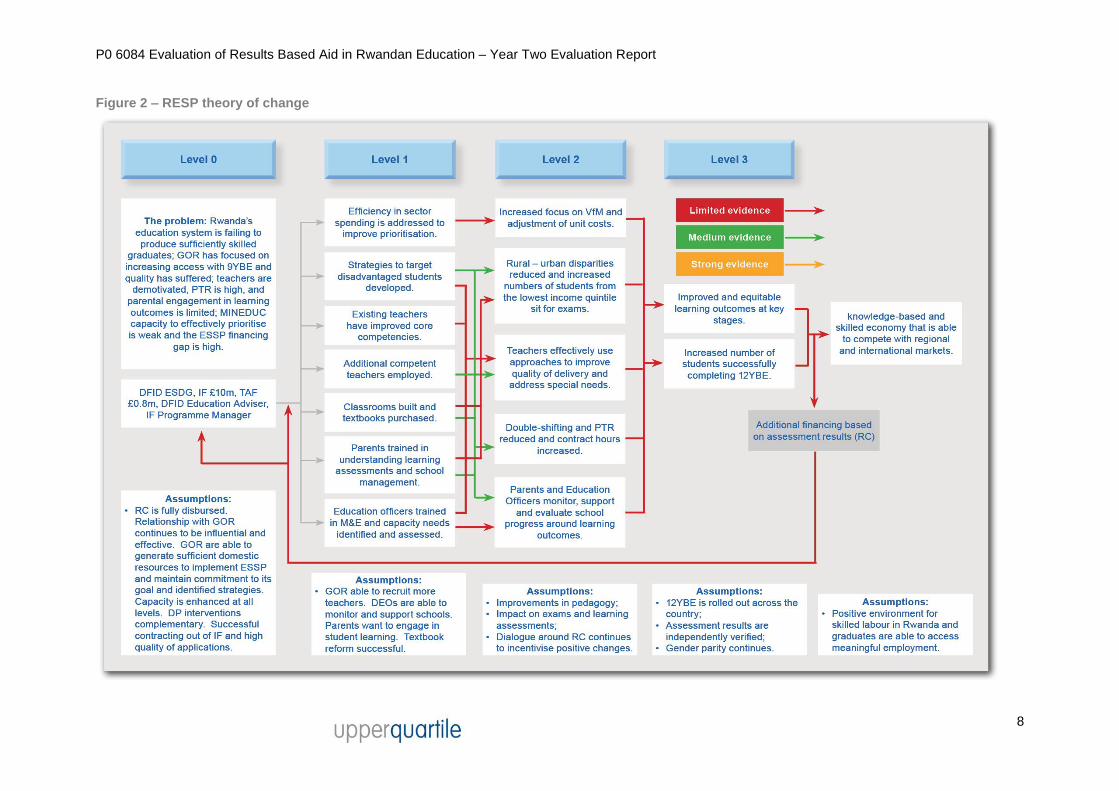
For the purpose of the evaluation, the Upper Quartile team deduced a simplistic ToC for the RBA pilot
in Rwanda (Figure 1) – this should be viewed as a subsidiary ToC embedded within the wider RESP
ToC (Figure 2). This simple ToC helped to inform the research and analysis process in year two of the
evaluation.
Figure 1 – Deduced theory of change for RBA in Rwandan education
Source: Developed from Upper Quartile, 2014
P0 6084 Evaluation of Results Based Aid in Rwandan Education – Year Two Evaluation Report
8
Figure 2 – RESP theory of change

P0 6084 Evaluation of Results Based Aid in Rwandan Education – Year Two Evaluation Report
9
In addition, Perakis and Savedoff, 2015 note multiple theories of change posited by funders in relation
to the design of their PbR programmes. The four key theories identified can be summarised as19
:
Pecuniary interest – Countries will change their priorities in pursuit of the money promised by the
RBA agreement;
Attention - Politicians and bureaucrats have limited time and attention. Because funds are linked
to outcomes, politicians and bureaucrats will pay more attention to results and manage things
differently than they would otherwise. Essentially, performance funding makes results visible in a
way that improves management;
Accountability - RBA agreements make outcomes visible to citizens in funding and receiving
countries, allowing them to hold their government accountable for performance;
Recipient discretion – By linking payments to outcomes rather than inputs, funders give
recipients wider latitude to design and implement strategies of their own making. Using this
discretion is more compatible with responding to local knowledge, building local capacity,
innovating and adapting.
As stated above, there is no agreed ToC for the RBA pilot in Rwanda, hence this evaluation report is
structured around the framework provided by the macro-evaluation questions (as agreed in year one)
with a synthesis informed by the deduced ToC. Year two evaluation findings, as they relate to the four
theories posed by Perakis and Savedoff, 2015 is considered in Ch 4 and in Appendix 2.
2.2 Methods
The evaluation of RBA in Rwanda is taking place over three years. In line with the realist approach,
the evaluation methods are flexible and are evolving to meet the needs of the study and the client
group. Table 2 summaries the methods used in both years of the evaluation to date (and those
planned for year three). The table demonstrates how each of the methods complements one another
and meet the needs of the research.
Table 2 - Method overview
Method Description Strengths Weaknesses
Years
1 2 3
Econometric modelling (P. Clist)
Modelling exercise drawing on national level secondary data to identify any effect of RBA over and above what may be expected in its absence.
Possible to identify SIGNIFICANT change.
Objectivity.
Reliability.
Cannot answer the ‘how’ & ‘why’ questions.
Cannot control for all confounding factors.
Value for money (VfM) analysis (J. Holden)
Considers cost-effectiveness of RBA relative to not providing RBA using national level secondary data and standard VfM practice to construct two counterfactuals.
Objective basis for considering cost-effectiveness of RBA.
Contribution to the theoretical debate.
Recognised approach allows comparison with other interventions.
Built on number of contestable assumptions.
Context & Political Economy Analysis (B. Whitty)
Desk-based review to situate the RBA pilot within an understanding of the prevailing political and economic processes in Rwanda.
Combined with KIIs to explore incentives, relationships, distribution & contestation of power.
Considers how RBA functions as an incentive.
Desk based analysis may fail to uncover subtle and ongoing change that is not formally documented.
National level KIIs (B.Whitty)
Semi-structured interviews with national stakeholders to study the response of GoR to the RBA agreement.
Insight into stakeholder understanding of RBA and reasoning around incentives.
Subjectivity.
Researcher presence may influence findings.
District & school-based KIIs & FGDs (B.Whitty)
Semi-structured interviews with district/sector education officials, Principals & English language mentors; FGDs with teachers, parents & students.
Possible to uncover complexities of what works, where, why and how.
Subjectivity.
Context dependent.
Small sample limits ‘generalisability’
Researcher presence may influence findings.
19 The ToC deduced by Upper Quartile is essentially loose enough to encompass elements of all four CGD propositions.

P0 6084 Evaluation of Results Based Aid in Rwandan Education – Year Two Evaluation Report
10
Table 3 shows how the chosen methods combine to address the evaluation questions. These are
lead methods in relation to each question but it is noted that no method stood in isolation.
Table 3 - Addressing the evaluation questions
Evaluation Questions
Eco
nom
etr
ic
mo
delli
ng
VfM
Co
nte
xt
ma
ppin
g/
PE
A
Na
tio
nal K
IIs
Dis
tric
t /
scho
ol K
IIs/
FG
Ds
Impact-related questions:
1. What has been achieved?
2. Has RBA contributed to impact in relation to the envisaged results?
3. What factors have impacted on the achievement of RBA results?
Process-related questions:
4. How is the RBA approach perceived in Rwandan education?
5. How did government respond to RBA?
Additional evaluation questions:
6. Has value for money been achieved?
7. What lessons have been learned to inform RBA in Rwanda and elsewhere?
Sections 2.2.1 and 2.2.2 provide further detail on the core evaluation methods used in year two. The
limitations of the methods are discussed in section 2.3.
2.2.1 Quantitative research
2.2.1.1 Econometric modelling
The impact evaluation component of the research is based around an econometric modelling
exercise to identify what has been achieved in terms of completion and the factors impacting on
completion with the aim of isolating any RBA effect.
As the RBA pilot in Rwanda is being implemented nationally, it was not possible to establish treatment
and control groups to identify any impact of RBA in an experimental evaluation. The econometric
modelling essentially establishes an artificial counterfactual, modelling trends in completion at key
stages of education and controlling for various influencing factors to understand what would have
been expected in the absence of RBA.20
OUT-OF-SAMPLE predictions are used to test the accuracy of
the models. The econometric modelling in year two builds on the year one findings. The data
limitations persist (see section 2.3), but are eased slightly by one extra year of data (2013).
Two econometric models using publicly available data have been developed. The two models act as a
check on each other since a conclusion supported by both provides a stronger evidence base than a
conclusion based on just one set of assumptions.
Model 1 builds a counterfactual by relying upon time trends and recent district performance in
completion to project into the future. Model 1 does not use district characteristics, but instead
relies on district DUMMIES, a time-trend and year-DUMMIES. The advantage of Model 1 is that it
requires very little data and can thus exploit a longer time series;
Model 2 takes a different approach as it uses as much data on district and time differences as
possible, including data such as the number of classrooms and teachers in each district. In year
two of the evaluation, in response to feedback from the DFID reference group,21
Model 2 has
20
It is not possible to fully control for all factors, especially national-level changes which coincide with RBA. Qualitative research helps understand the influence (or not) of RBA.
21 The DFID reference group suggested that all results used cluster-corrected standard errors. Model 2a is able to do this, but
model 2b is not. A large econometric literature exists on the ideal approach with no settled view. The evaluators believe the range of options chosen represent best practice.
P0 6084 Evaluation of Results Based Aid in Rwandan Education – Year Two Evaluation Report
11
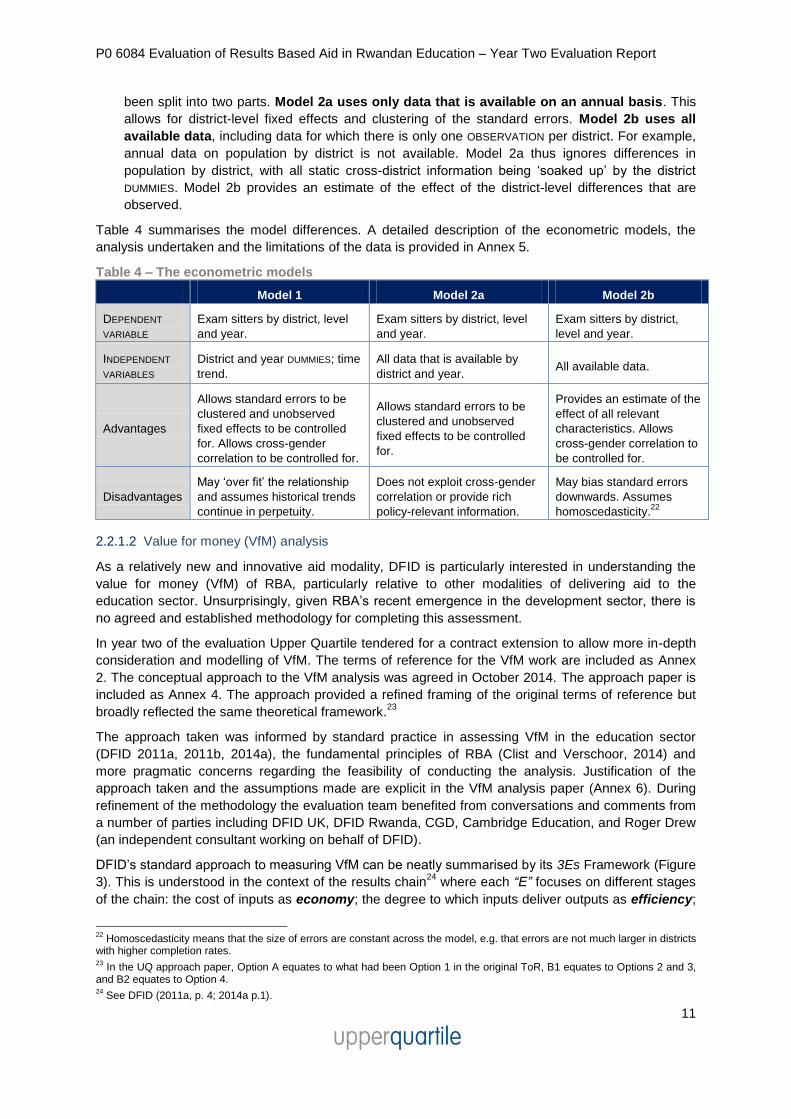
been split into two parts. Model 2a uses only data that is available on an annual basis. This
allows for district-level fixed effects and clustering of the standard errors. Model 2b uses all
available data, including data for which there is only one OBSERVATION per district. For example,
annual data on population by district is not available. Model 2a thus ignores differences in
population by district, with all static cross-district information being ‘soaked up’ by the district
DUMMIES. Model 2b provides an estimate of the effect of the district-level differences that are
observed.
Table 4 summarises the model differences. A detailed description of the econometric models, the
analysis undertaken and the limitations of the data is provided in Annex 5.
Table 4 – The econometric models
Model 1 Model 2a Model 2b
DEPENDENT
VARIABLE
Exam sitters by district, level
and year.
Exam sitters by district, level
and year.
Exam sitters by district,
level and year.
INDEPENDENT
VARIABLES
District and year DUMMIES; time
trend.
All data that is available by
district and year. All available data.
Advantages
Allows standard errors to be
clustered and unobserved
fixed effects to be controlled
for. Allows cross-gender
correlation to be controlled for.
Allows standard errors to be
clustered and unobserved
fixed effects to be controlled
for.
Provides an estimate of the
effect of all relevant
characteristics. Allows
cross-gender correlation to
be controlled for.
Disadvantages
May ‘over fit’ the relationship
and assumes historical trends
continue in perpetuity.
Does not exploit cross-gender
correlation or provide rich
policy-relevant information.
May bias standard errors
downwards. Assumes
homoscedasticity.22
2.2.1.2 Value for money (VfM) analysis
As a relatively new and innovative aid modality, DFID is particularly interested in understanding the
value for money (VfM) of RBA, particularly relative to other modalities of delivering aid to the
education sector. Unsurprisingly, given RBA’s recent emergence in the development sector, there is
no agreed and established methodology for completing this assessment.
In year two of the evaluation Upper Quartile tendered for a contract extension to allow more in-depth
consideration and modelling of VfM. The terms of reference for the VfM work are included as Annex
2. The conceptual approach to the VfM analysis was agreed in October 2014. The approach paper is
included as Annex 4. The approach provided a refined framing of the original terms of reference but
broadly reflected the same theoretical framework.23
The approach taken was informed by standard practice in assessing VfM in the education sector
(DFID 2011a, 2011b, 2014a), the fundamental principles of RBA (Clist and Verschoor, 2014) and
more pragmatic concerns regarding the feasibility of conducting the analysis. Justification of the
approach taken and the assumptions made are explicit in the VfM analysis paper (Annex 6). During
refinement of the methodology the evaluation team benefited from conversations and comments from
a number of parties including DFID UK, DFID Rwanda, CGD, Cambridge Education, and Roger Drew
(an independent consultant working on behalf of DFID).
DFID’s standard approach to measuring VfM can be neatly summarised by its 3Es Framework (Figure
3). This is understood in the context of the results chain24
where each “E” focuses on different stages
of the chain: the cost of inputs as economy; the degree to which inputs deliver outputs as efficiency;
22
Homoscedasticity means that the size of errors are constant across the model, e.g. that errors are not much larger in districts with higher completion rates. 23
In the UQ approach paper, Option A equates to what had been Option 1 in the original ToR, B1 equates to Options 2 and 3, and B2 equates to Option 4. 24
See DFID (2011a, p. 4; 2014a p.1).

P0 6084 Evaluation of Results Based Aid in Rwandan Education – Year Two Evaluation Report
12
the outcomes delivered from given outputs as effectiveness; and the outcomes or impact for a given
cost, as cost effectiveness. The results chain is commonly used to assess the VfM of projects and
programmes delivered by DFID – where costs are linked to clearly defined activities and outputs
aiming for pre-defined outcomes.
Figure 3 - The 3Es in the results chain
As aid provided via RBA does not necessarily constitute a ring-fenced fund to pay for specific
activities or outputs, the results-chain approach is difficult to follow through when assessing the VfM
of RBA. The approach chosen for the VfM analysis therefore seeks to assess the cost effectiveness
of the resources that go into RBA by analysing how the RBA disbursed contributes to outcomes for
the education sector as a whole. The approach is set out in detail in Annex 4.
Given the nature of this evaluation, which considers RBA as an aid modality, the VfM approach
explored the cost effectiveness of RBA relative to a counterfactual of not providing RBA. There
are two components to this, based on two different counterfactuals. Both of these are assessed in the
VfM analysis:
A: The VfM of aid spent on RBA, compared to the counterfactual of not providing that aid to
education: This counterfactual looks at the value of a given amount of aid to education within a
given year – in this case 2013. The model assumes that aid contributes a portion of the benefits of
total education expenditure in that year, and that this portion is equivalent to the share of the
expenditure that this aid represents.25
The benefits are offset by the cost of the aid provided.
B: The VfM of aid spent on RBA, compared to the counterfactual of providing that aid to
education via a more traditional instrument – such as sector budget support (SBS) – This
counterfactual looks at the value of education provided in subsequent years (e.g. beyond 2013),
which is potentially attributable to the RBA incentive. In other words, the future years of education
gained by ‘additional completers’ at P6, S3 and S6. This is important as each further year of
education that these sitters gain will lead to greater benefits in terms of future economic and social
returns. The model tries to estimate these benefits against the costs of the extra years of
education provided.
There are two methods of estimating how many additional students complete. The first method
considers the increase in completion over and above the previous year (Model B1). This is the
figure upon which the RBA payment is calculated. The second method uses figures generated by
the evaluation’s econometric model; the statistically SIGNIFICANT increase in completion (if any) that
has been detected (Model B2). Both models offset the benefits generated against the extra
verification and evaluation costs associated with RBA. These costs are not assumed to be
required for SBS.26
25 For example if the aid in question constituted 2 per cent of total education expenditure, it would be assumed to contribute 2 per cent of the total benefits.In reality, in 2013, the aid disbursement from RBA constituted 0.42 per cent of total education sector expenditure. 26 The cost of the aid itself is not used to offset benefits for model B, as the counterfactual for B is that the aid is provided anyway. The test is of the means of providing that aid, i.e. RBA vs. SBS.

P0 6084 Evaluation of Results Based Aid in Rwandan Education – Year Two Evaluation Report
13
The overall VfM of RBA can then be viewed as the combination of these two tests (A+B). That is, the
effectiveness relative to the cost of the aid itself (A); and the effectiveness of RBA relative to providing
aid in another form (B).27
The variable of most interest in looking at RBA as opposed to other aid modalities will be B, as this
could be taken to be the narrower test of the hypothesis i.e. that RBA functions through an incentive
effect that is not present in other forms of aid. For example, while most SBS is usually disbursed
regardless of results, as a PbR mechanism, RBA is only paid if certain results are achieved.
Annex 6 provides a detailed summary of the methods and assumptions employed to deduce the costs
and benefits for both scenarios used in the VfM analysis.
2.2.2 Qualitative research
The econometric modelling and VfM exercises explore changes in the numbers of completers at key
stages of education, the cost, and potential returns, of the investment that has achieved this.
However, the econometric modelling and VfM exercises are unable to establish the extent to which
results are products of GOR policy and action in general, or of RBA specifically. Additional qualitative
research is therefore necessary. The qualitative research helps us to understand:
Why, how, in what circumstance and with what effect RBA and its behavioural incentives have
contributed to any observed change;
The extent to which RBA has been facilitated or inhibited by factors and conditions at play in the
wider education sector/GoR structures; and
If any unintended or unanticipated effects have accrued.
As RBA is an incentive to government, the qualitative research in year two focused on establishing
how GoR reacted to the RBA agreement, the ways and extent to which RBA-related messaging has
been transferred down through the education system, how and why this messaging may (or may not)
have affected implementation at district- and school-level.
In this sense it is important to understand a). how RBA is perceived and has been acted upon at the
higher levels of government and the education sector (particularly MINEDUC and REB) b). the actions
and behaviour changes of GoR, MINEDUC and REB in response to the RBA pilot and c). the
management systems, controls, accountability processes and power relations at play within GoR and
the wider education sector which influence the way in which various actors are incentivised to
respond to Government directives.
In year two of the evaluation the qualitative research was approached by means of a process study
with three related components – initial desk-based review (building on the desk-review undertaken in
year one of the evaluation); national level key informant interviews (KIIs); district and school-level KIIs
and Focus Group Discussions (FGDs).
Unpacking education sector process and the role of RBA within them is necessary for understanding
if and how RBA influenced the actions of GoR. It is therefore complementary to the quantitative work:
while the latter establishes the numbers of completers, the qualitative explains the extent to which any
changes may be attributable to RBA. The qualitative work does not and cannot attempt to explain all
observed changes in completion; rather it aimed to establish vital links and the degree to which RBA
may be said to have influenced a process of change. The research instruments are attached as
Annex 7.
2.2.2.1 Desk-based review
The desk review focused on identifying areas of policy, process and behaviour change in the
education sector since the introduction of RBA in 2012 (and specifically since the year one research).
An overview of government strategic priorities, programmes and management control processes
relevant to each of the two RBA results (completion and teacher proficiency in English), but
27
The combination of A+B will be either A+B1 or A+B2. The B1 and B2 tests cannot be added together as they are two different methods to measure the same outcome.

P0 6084 Evaluation of Results Based Aid in Rwandan Education – Year Two Evaluation Report
14
encompassing the broader governance, public financial management (PFM), umuhigo/imihigo,28
and
institutional set-up was produced. This was used to determine the context in Rwanda against which
change in priorities, behaviours or management control processes might be understood.
2.2.2.2 National level key informant interviews (KIIs)
Semi-structured in-depth interviews were conducted with national level stakeholders to study the
reactions and practical responses of key GoR institutions to the RBA agreement. As RBA is an
incentive for GoR, and specifically MINEDUC/REB, the aim of these interviews was to understand, in
a decentralised system, whether (how and with what results) GoR has attempted to influence and
change behaviours at district and school level in relation to completion and teachers’ competence in
English. Initially 27 individual semi-structured KIIs were conducted. KIs were selected based on the
relevance of their role to the transfer of RBA funds through the government PFM systems and/or
responsibility for education sector policy and programming relating to completion or English
proficiency. The sample is outlined in Table 5.
Table 5 – National level key informant interviews
Organisation/ Department Reason for inclusion No. KIs
Ministry of Education (MINEDUC) Officials
Overall responsibility for education sector policy and programming. 4
Rwanda Education Board (REB) Officials
Responsible for development of education sector policy and programming in specific areas relevant to completion and teacher proficiency in English.
4
Ministry of Finance (MINECOFIN) Officials
Responsible for managing public finances, including RBA funds. 4
Ministry of Local Government (MINALOC) Officials
Responsible for decentralisation– completion and teacher proficiency in English are achieved through actions of decentralised entities.
2
DFID respondents29
Responsible for designing and managing the RBA agreement from DFID’s side.
1
Respondents working in education sector
Local and international experts able to give additional perspectives on the operation of the Rwandan education sector.
12
Note: A full anonymous list of KIs is provided at Appendix 1.
In addition, a group follow-up discussion was held with the education Senior Management Team
(SMT) in February 2015. This involved the Minister of Education, the Permanent Secretary of
MINEDUC, the Director General (DG) of REB and a number of REB’s Deputy Director Generals
(DDGs) among others.30
2.2.2.3 District and school level key informant interviews (KIIs) and Focus Group Discussions (FGDs)
At the district level, semi-structured in-depth KIIs were conducted with those officials forming the
spine of education provision at the district level. This included District Education Officers (DEOs),
Sector Education Officers (SEOs), Vice Mayors (VMs) for Social Affairs and, where relevant, school
Inspectors (inspectors are based at the province level). The sample is shown in Table 6.
Table 6 – District level key informant interviews
Role Reason for inclusion No. KIs
DEOs Responsible for implementing education policy/ programming at the district level. 4
SEOs Responsible for implementing education policy/ programming at the sector level. 4
VM for Social Affairs Responsible for district level policy-setting in the education sector. 3
School Inspectors Responsible for inspecting the schools within the province. 1
Note: The fourth Mayor was not available during the period that the team was in the district.
Note: Inspectors operate at the province level. Two of the districts were province capitals: of these, only one of
the Inspectors was available during the time the team was in the district.
28
Imihigo is the plural Kinyarwanda of Umuhigo, which means “vow to deliver”. It was institutionalised by President Kagame in 2006, in the form of performance contracts which are signed annually by government employees and citizens. 29
Responses from DFID and NGO staff were used to triangulate the data collected during interviews with GoR officials. 30
Note: Some of these KIs had also been consulted in the initial KI interviews.

P0 6084 Evaluation of Results Based Aid in Rwandan Education – Year Two Evaluation Report
15
Four districts were visited in year two of the evaluation. Justification for the decision to visit only four
districts was largely on resource grounds – it was agreed with DFID that the focus of the qualitative
research in year two would shift towards the centre of GoR. Consequently, the resources available for
district and school-based research were reduced.
A purposive selection method was adopted focusing on outliers that may potentially highlight
government implementation as a factor in completion rates. The starting point was to identify where
change had happened. The greatest change in the previous year occurred in S3 completion.31
Since
the year one evaluation identified poverty as playing an important indirect role in completion, S3
completion was compared against poverty indicators.
The qualitative research sample in year two comprised: two relatively poor districts but with high
completion improvements (the intention was to explore through what means these districts had
overcome poverty to gain such improvements and the role of government policy/ programming and
messaging in this); a wealthy district with relatively poor performance (this district was to act as a
counterpoint to the first two locations); a fourth district in the Central province where it was assumed
that proximity to the central government and unusual wealth of the population would offer the fewest
barriers to successful implementation of government policy/programming, adoption of messaging and
achievement of priorities.32
The sample was agreed in advance with REB. The sample cannot be considered fully representative
and as such there are limitations associated with the data (see section 2.3). An overview of the district
level sample in terms of key characteristics is shown in Table 7.
Table 7 – District sample summary characteristics (based on 2012 data)
District Province Wealth Quintile
Completion Quintile (S3
2012 data)
% increase in completion
at S3 (2011-13)
A Central 1 1 73%
B Western 4 1 40%
C Southern 4 2 32%
D Western 1 4 10%
Interviews at district level were conducted to ascertain if and how the priorities and plans set at the
‘centre’ (MINEDUC/REB) were being communicated, interpreted and implemented at the sub-national
level. The interviews focused on three areas in particular: (1) understanding shifting priorities at the
district level (including resource allocation, communication and management linkages to the GoR
hierarchy); (2) understanding shifting approaches to completion measures adopted, the drivers and
reasons for adopting these measures and perceptions of these measures; and (3) approaches to
improving teachers’ proficiency in English taking the same approach as at (2).
Two schools were selected in each of the four districts. Selection criteria were simple to apply and to
agree with district officials.33
The key criteria were essentially that one school was to be close to the
district centre and one further away (with distance assumed as a proxy for communicability of policy
and ease of supervision). All schools were 9YBE schools.
At the school level, semi-structured key informant interviews (KIIs) were conducted with school
Principals and school-based English language mentors. Focus group discussions (FGDs) were
conducted with students (7-9 per FGD), parents (8 per FGD) and teachers (8 per FGD). The school
level fieldwork employed the same design as that used at the district level, interrogating the three
31
It is important to note that the year two qualitative research took place before data for the econometric modelling exercise was made available to the team. The selection of Districts and schools took account of the econometric findings in year one of the evaluation. 32
Selection of an outlier was also important for practical concerns regarding the testing of the research instrument. 33
Each team had four days in each district to arrange and conduct an extensive research schedule covering district and school level interviews and focus groups: easy-to-apply criteria was therefore preferred.

P0 6084 Evaluation of Results Based Aid in Rwandan Education – Year Two Evaluation Report
16
focal areas outlined above with the aim of ascertaining if, and how, the priorities, plans and
messages set at the centre were implemented at the school level. The FGDs also sought to
understand the perceived effects of this implementation.
Table 8 – School level key informant interviews and focus group discussions
Role Reason for inclusion No. of KIIs/
FDGs
School Principals (KII) Responsible for management of school, including achievement of completion.
8
Mentors (KII) Responsible for improving teachers’ English proficiency in, typically, two schools.
4
Teachers (FGD) Frontline officials responsible for teaching in English and implementing government policy/ programming in the classroom.
8
Students (FGD) Students’ perspective on the changes in approach to completion and English competency, for triangulation of ‘official’ perspectives and suggestions about effect of policy/ programming and messaging.
8
Parents (FGD) Parents’ perspective on the changes in approach to completion and English competency, for triangulation of ‘official’ perspectives and suggestions about effect of policy/ programming and messaging.
8
School Community Liaison Volunteers
Volunteers responsible for supporting community efforts to reduce drop-out and repetition and school liaison with the community.
2
Note: It was not always possible to speak with School Community Liaison Volunteers as they are not school-
based and may not have been available during the fieldwork visit.
Across all the qualitative research strands, the period where the actions of GoR and wider education
sector stakeholders have been studied is from February 2012 – present (time of drafting, February
2015). This is because the influence of the RBA negotiation phase may have generated action from
the government, and because reforms that have taken place since the exams of 2013 (the year
relevant to the RBA results reported in year two) may be instructive to the final year’s evaluation.
It is noted that while the qualitative research in year two builds on the evidence base from year one,
the focus is slightly different. This shift is captured in the qualitative research concept note at Annex 3.
2.3 Limitations and challenges of the research
In year two the evaluation team identified various limitations and challenges of the evaluation
approach. Many of these, especially those associated with the econometric model, persist from year
one (although some are eased slightly by one extra year of data).
2.3.1 Limitations of the econometric modelling
The main limitation of the econometric model is the lack of robust data. Recovering a valid
counterfactual for a programme that was rolled out nationally requires certain assumptions to be
made: essentially that trends continue (Model 1) or that enough information can be observed that the
counterfactual can reliably be reconstructed (Model 2).
The main difficulties are year-specific fluctuations in results as the model must distinguish
between random variation, RBA-effects and other year-specific effects. For example, the cohort
of S3 sitters in 2011 was at a different level to previous years (given the genocide in 1994,
anyone born in 1994 would be 17 in 2011). These year-specific effects are difficult for the model
to robustly handle as the number of years which we can observe such factors is small. The main
approach to mitigate these problems is the use of multiple models;
Some of the publicly available data are only generated by the Education Management
Information System data (EMIS) at district level, whereas other data are only available by year
and are not disaggregated. Further, data for student enrolments in primary schools were
available from 2010 whereas data for secondary school students were only available from 2011;

P0 6084 Evaluation of Results Based Aid in Rwandan Education – Year Two Evaluation Report
17
As detailed in the year one report (Upper Quartile, 2014), OUT-OF-SAMPLE tests showed that
SPECIFICATIONS using only the small number of VARIABLES which cover the period from 2008-2011
do not perform well. The team instead used a greater number of VARIABLES but, due to poor data
availability, were limited to the period 2011-2013. This meant that it was only possible to use the
number of examination sitters for the baseline and the year corresponding to the first RBA
payment. In spite of this limitation, when the accuracy of the prediction is tested the model is
shown to perform well.
2.3.2 Limitations of the VfM analysis
The VfM analysis is in part based on the results of the econometric modelling. It is therefore subject to
the above limitations. In particular, test B2 of the VfM approach – the VfM of RBA compared to other
forms of aid – is built directly from the econometric modelling. Other limitations include:
The model extrapolates from the present to the future in a linear manner. This means that
discontinuous change is excluded from the model as a possibility. The model therefore ignores
the chance that the introduction of RBA is itself a discontinuity which might change the variables
of interest. For example, if there were perverse incentives created by RBA then the variables of
interest (drop-out, progression etc) may also change, thereby biasing the model’s estimates;
There may be other barriers to education for those who tend to drop-out that make them different
to those who generally progress. Students who previously dropped-out are those who may now
finish P6, S3 or S6 (the ‘additional completers’). However, if, for example, these students are
more likely to experience higher rates of poverty than their peers, then even if they sit the final
exams they may still be less likely to progress than their peers. This would mean that the model
overstates the benefits from additional sitters at these grades;
Returns to education estimates for Rwanda are out-of-date. As returns estimates drive the
overall economic returns, if returns have declined significantly in recent years, perhaps due to an
increasing supply of skilled labour in the labour market, then the model may overstate the
benefits. The modelling has sought the most recent data available and sensitivity analysis has
been conducted;
The quality of education is not controlled for and any detailed judgement on the quality of
education is out of the remit of this evaluation. In as much as returns to education are driven by
the quality and not the quantity of education, if quality is not improving then the model is likely to
overstate the benefits.
2.3.3 Limitations of the qualitative approach
Interviews were limited by the availability of key respondents. Given schedules and workloads,
and in spite of many attempts, it was not possible to consult on a one-to-one basis with the
Permanent Secretary of MINEDUC or to get extended time with the Director General of REB.
Both of these consultees were however included in the additional group discussion with the
education SMT in February 2015. The focus of this meeting was validating and further exploring
the emerging findings. Thankfully group discussion saw all key members contribute at length and
with apparent freedom (e.g. some divergent opinions were expressed);
In year two there were only resources available to visit four districts and eight schools within
those districts. With such a small number the selection was not representative, but rather chosen
to unpack how government policy, programming and messaging may have driven changes in
district implementation.
Delays in receiving official EMIS data meant that, for the second year, the qualitative research
had to proceed in advance of the econometric analysis. Sampling and lines of inquiry for the
qualitative research where informed by the year one evaluation findings and discussions with
DFID-R. Additional qualitative research was conducted in February 2015 to attempt to fill gaps in
understanding in relation to the year two econometric findings.

P0 6084 Evaluation of Results Based Aid in Rwandan Education – Year Two Evaluation Report
18
Overall, the evaluation team feel that the reported limitations and challenges have been sufficiently
recognised and mitigated so as to not undermine the robustness of findings in this year two report.
2.4 Research ethics
All research carried out by Upper Quartile and IPAR-Rwanda is subject to the provisions of the
Research Governance and Ethics Policy which conforms to best international practice; including the
requirements of the UK Economic and Social Research Council.
All IPAR researchers who conducted primary research have completed training in research ethics.
Ethical considerations were reviewed before fieldwork commenced.
All informants, including children, were required to give verbal informed consent to participate and in
the case of the latter, a responsible adult was also asked to give consent. Only children aged 10
years and over were included as informants. With the exception of senior REB and MINEDUC
officials, who granted permission to be identified, no individual is named in the report and the names
of schools and districts have been removed. Once interview data were entered electronically they
were stored with restricted access.
All members of the evaluation team and consortium member organisations are fully independent.
IPAR-Rwanda is an independent think tank based in Kigali; Upper Quartile is an independent
consulting firm based in the United Kingdom.

P0 6084 Evaluation of Results Based Aid in Rwandan Education – Year Two Evaluation Report
19
3 The evaluation findings 3.1 Introduction
This chapter presents year two evaluation findings and discussion of the emerging evidence base.
The findings are structured around six of the seven macro level evaluation questions presented in
section 1.2.5 and are discussed in turn in relation to impact (section 3.2), process (section 3.3) and
value for money (section 3.4). Evaluation question seven - ‘What lessons have been learned to inform
RBA in Rwanda and elsewhere? – is considered in the synthesis and interpretation of findings
(Chapter 4: Conclusions and (interim) lessons learned). The report structure was approved by DFID.
3.2 Impact-related findings
The discussion begins with presentation of the year two evaluation findings relating to the impact of
the RBA pilot in its second year of implementation (2013). The findings respond to three of the
seven macro level evaluation questions. Specifically:
What has been achieved?
Has RBA contributed to impact in relation to the envisaged results?
What factors have impacted on the achievement of RBA results?
In year two of the evaluation the focus in terms of achievement is once again on completion as follow-
up data regarding improvement in English language proficiency is not yet available.
3.2.1 What has been achieved?34
Table 9 shows the absolute numbers of exam sitters (completers) at the three key stages of education
that are a focus for the RBA pilot. Performance in 2013 is presented alongside data for 2011 and
2012. Headlines from Table 9 are that in 2013:
Performance at the P6 level dipped by just under 2% on the previous year;
The largest increase was at the S3 level where there was a 16% increase in the number of exam
sitters in comparison to the previous year;
S6 saw a 7% increase in the number of exam sitters in comparison to the previous year.
Across the pilot as a whole (2011-2013) there has been an increase in the absolute number of exam
sitters at all levels. The increase is greatest for female students at the S3 level.35
Table 9 - Exam sitters by grade, gender and year, 2011-2013
Primary 6 Secondary 3 Secondary 6
Male Female Total Male Female Total Male Female Total
2011 70,548 84,406 154,954 38,043 39,377 77,420 24,535 22,023 46,558
2012 74,877 91,276 166,153 37,754 42,836 80,590 24,237 26,065 50,302
2013 73,552 89,542 163,094 44,227 49,505 93,732 26,689 27,102 53,791
2012-
2013
Change
2012-13 -2% -2% -2% +17% +16% +16% 10% +4% +7%
2011-
2013
Change
2011-13 + 4% +6% +5% +16% +24% +21% +9% 23% +16%
Source: EMIS (2014)
34
In year two of the evaluation (as in year one) this evaluation question is addressed in relation to completion only. 35
It is noted that absolute figures alone cannot give a true sense of the extent to which completion rates are changing in Rwanda. This discussion is taken forward in section 3.2.2.

P0 6084 Evaluation of Results Based Aid in Rwandan Education – Year Two Evaluation Report
20
The Health Education and Advice Resource Team (HEART) (2014), contracted to independently
verify results, reported high levels of agreement between exam records and the records kept by
schools in relation to 2013 results.36
The most common discrepancies related to the misclassification
of students’ gender. However, there were misclassifications both ways so this was not felt to be
systematic.
At P6 and S3 there were some errors regarding the number of students; these errors were quite
small. Also at P6 and S3 there was an overstatement of the number of students sitting for exams (by
0.2%). No discrepancies were found at S6. This is a small discrepancy rate and one of the known
issues with the data relates to students moving school.
The RBA payment in 2014, relating to 2013 results against data for 2011 and 2012, was £1,883,420
GBP. An overview of this payment is shown in Table 10. For full details of the calculation see HEART
(2014). An overview of the payment calculation is shown in Box 1. Unsurprisingly, the bulk of the
payment comes from the strong improvement at the S3 level.
Table 10 - Payment Overview (all values in £ GBP)
Level
2013 - 2012 Improvement
2013 - 2011 Improvement
Total
P6 £2,550 £87,830 £90,380
S3 £1,314,200 £163,120 £1,477,320
S6 £232,050 £83,670 £315,720
TOTAL £1,548,800 £334,620 £1,883,420
Source: HEART (2014)
It is noted that there was a positive payment for P6 in
spite of the fact that completion declined nationally in
the year 2012-13. This was partly a result of
calculations being made at the level of province and
gender, with any negatives being discarded.
For example, at the P6 level, the Kigali province saw
7,884 female exam sitters in 2013, compared to
8,168 in 2012 and 8,228 in 2011. Because the
performance in 2013 was below both 2012 and
2011, no payment was made. The drop was not
used in any other calculation, and so the positive
payment for P6 is a consequence of some province-
gender pairs which saw improvements. It is also
noted that across the pilot as a whole to date (2011-
2013) there has been an increase in P6 completion,
albeit a smaller increase than for other grades.
The payment calculation method has an effect on the size of the payment. If the payment was
calculated purely on the basis of national changes for the two genders combined, the 2013 payment
would have been £244,230 GBP lower. In other words, 13% of the overall figure is due to
disaggregating at the province-gender level, rather than looking only at aggregate numbers. There is no
obviously superior method of calculation and so this is not meant as a comment on the appropriateness
of the formula; merely to note that the formula affects the payment.
36
This is in keeping with findings in relation to 2012 data (see Upper Quartile, 2014: 23)
Box 1 - The RBA payment calculation 2014
(relating to 2013 data)
Where for a given province and gender there
was an improvement above the 2011
baseline for the first time, a payment of £50
GBP was applied for P6 and S6.
Where for a given province and gender there
was an improvement above the 2011
baseline for the first time, a payment of £100
GBP was applied for S3.
Where performance at P6, S3 and S6 was
above the 2011 baseline but not above the
2012 result, a payment of £10 GBP was
applied.

P0 6084 Evaluation of Results Based Aid in Rwandan Education – Year Two Evaluation Report
21
3.2.2 Has the RBA approach contributed to impact in relation to the envisaged results?37
Absolute completion figures, the basis upon which the RBA is paid (see Table 9), do not in
themselves show if completion rates are rising or the extent to which there may or may not be an RBA
effect present. To explore these questions we must turn to the findings of the econometric modelling
exercise. Key findings are as follows:
Finding 1 At the P6 and S6 levels, in 2013 there is unambiguous evidence that completion was either negligibly or SIGNIFICANTLY below trend, despite GoR efforts and the support of RBA.
Finding 2
At the S3 level, in 2013 there is evidence that GoR achieved SIGNIFICANTLY above trend completion for both genders. Much of this improvement can be traced to an increase in the percentage of enrollers who took the final S3 exam.
Finding 3
The evaluation has found no identifiable effect of the RBA agreement on GoR actions at the level of policy or practice. RBA has supported the emphasis on completion rather than providing an incentive to drive change by shaping GoR’s actions, behaviours or messaging.
3.2.2.1 The econometric findings
Table 11 summarises results from the econometric modelling. The results for P6 and S6 are
straightforward. For both years in which RBA payments were made, completion was found to be
below the counterfactual (that is the level of completion predicted by the model in the absence of the
RBA intervention). This stands for both male and female students. In some cases RBA-years were
found to be SIGNIFICANTLY below trend (see tables 4, 5, 7 and 9 in the econometric report at Annex 5).
At the P6 level this is despite the year one evaluation finding that the baseline (2011) was also below
trend (see Upper Quartile, 2014).
Table 11 - Summary of results by model
Level P6 S3 S6
Summary statistics
Fell in 2013 Strong improvement in 2013, in line with large cohort
Slow Improvement
Model 1 RBA years SIGNIFICANTLY below trend.
RBA years slightly below trend for males.
RBA years slightly below trend for males.
Model 2a RBA years below trend. 2011 was a SIGNIFICANTLY poor year.
Males are on trend. Significant improvement for females in both RBA years, especially strong in 2013.
RBA years slightly below trend.
Model 2b RBA years below trend – SIGNIFICANTLY so for boys. 2011 SIGNIFICANTLY poor.
Strong and significant 2013 performance for both genders. A SIGNIFICANTLY below trend performance for boys in 2012 (if a relatively small effect size).
SIGNIFICANTLY below trend for both genders in 2013, and for boys in 2012. RBA years are always below trend.
In the case of S3, completion was found to be below trend for 2012 (as reported in the year one
evaluation report). However, the picture at S3 is more positive when 2013 data is considered. In 2013
there were large increases in the number of S3 exam sitters (see Table 9) and the various models
agree that this positive improvement was above trend, often SIGNIFICANTLY so. The size of the
SIGNIFICANT effect is in the order of 10,000 extra S3 sitters (see Annex 5 for more detail).
A caveat is needed. Data limitations mean that there is only one year of OBSERVATIONS pre-RBA. This
drastically reduces the ability to control for cohort size and it is known that the introduction of 9YBE
and 12YBE have had large and beneficial effects for cohort sizes at secondary level. The findings of
the model can however be usefully explored, and reinforced, using more basic statistics.
In Table 12 the large number of S3 exam sitters in 2013 is shown alongside the relevant enrolments.
There are two clear observations to note. Firstly, the numbers in bold show that the P6 cohort in
37
In year two of the evaluation (as in year one) this evaluation question is addressed in relation to completion only.

P0 6084 Evaluation of Results Based Aid in Rwandan Education – Year Two Evaluation Report
22
201038
was larger than the year before or after in each grade (assuming progression without repeats
or drop outs). Secondly, a remarkably high number of those enrolled at S3 took the S3 exam in 2013;
only 242 students in all of Rwanda are counted as having enrolled but did not sit the exam. This can
be compared to the preceding year where 5,789 S3 students enrolled but did not take the exam, or
expressed as an increase from 93.3% to 99.7% of enrolees completing.
Given that each additional exam sitter at S3 attracts a tariff of £100 GBP through RBA, the ability for
such a high percentage of ‘enrollers’ to be ‘sitters’ represents a substantial portion of the RBA
payment in 2013. This performance is close to the maximum possible increase in S3 exam sitters
given S3 enrolments and suggests a targeted effort to achieve it.
Analysis also shows that the percentage of S2’s who went on to complete S3 in 2013 increased
slightly from 76% (2012) to 77% (2013).
When considered together, these two changes illuminate the mechanism by which GoR saw such a
large increase in S3 performance in 2013.
Table 12 - Enrolments by Grades P6-S3, 2010-2013
Year P6 S1 S2 S3 S3 Exam sitters
2010 184,840 133,064 104,029 61,706 .
2011 172,549 146,475 113,446 81,821 77,420
2012 184,200 144,784 121,633 86,379 80,590
2013 181,013 147,547 120,001 93,974 93,732 Source: various EMIS documents.
Calculations using summary statistics imply that around 6,000 of the extra S3 exam sitters can be
attributed to an increase in the percentage of enrolees completing39
, around 1,300 can be attributed to
greater progression from S2 to S340
, and around 6,000 can be attributed to the larger cohort.41
These calculations are provided merely as a rule-of-thumb, to guide the interpretation of the increase.
They should not be over interpreted or relied upon too heavily. Reassuringly however, they do
suggest that cohort size is not the only factor behind higher S3 completion rates.
But are these RBA effects? In relation to the evaluation question – Has the RBA approach
contributed to impact in relation to the envisaged results? – the evidence is inconclusive. The
econometric analysis has observed an increase in completion at S3 over and above what may have
been expected in the absence of RBA. However, from the econometric analysis alone it is not
possible to discount other possible explanatory factors. Further, the econometric analysis cannot
explain why an above trend increase is observed at S3 and not at P6 and S6. Quantitative results
must therefore be interpreted alongside the qualitative evidence.
3.2.2.2 Qualitative evidence on the quantitative results
When the RBA agreement was negotiated and signed in 2012 the ESSP 2010 (MINEDUC, 2010b)
was the overarching strategy governing GoR’s approach in the education sector.42
This was in turn
linked to the Economic Development and Poverty Reduction Strategy II (EDPRS II) and Vision 2020;
the strategies guiding activity for GoR as a whole.
38
The group of pupils who would be expected to reach S3 in 2013. 39
Calculated as the increase in the completion rate multiplied by the number enrolled at S3. 40
Calculated as the increase in the progression rate, multiplied by the 2012 S2 enrolment, multiplied by the completion rate of those in S3. 41
Calculated by the increase in the cohort size at the P5 level, multiplied by the progression and completion rates. 42
The narrative is that education is vital to Rwanda becoming a middle income country since it lacks other resources. The aim was to create a workforce that could work regionally.

P0 6084 Evaluation of Results Based Aid in Rwandan Education – Year Two Evaluation Report
23
ESSP 2010 marked an attempt to consolidate the considerable success in increasing access to
education (MINEDUC 2010a, MINEDUC 2010b);43
moving from access to completion as a priority
(MINEDUC 2010a). This was in line with Rwanda’s long standing commitment to achieving the
Millennium Development Goals (MDGs) and Education for All.44
As highlighted in the year one evaluation report, completion was already a central priority for GoR
prior to the conceptualisation and implementation of the RBA agreement (formulated
concurrently with the ESSP which also had DFID input). Indeed, the DFID RESP Business Case
(DFID, 2011c) was specifically designed to support ESSP. It is clear from documentary review
(published and unpublished documents) and discussion with KIs that there was intended to be close
alignment between the goals of the GoR and those of DFID. This is in keeping with commitments
under the Paris Declaration for Aid Effectiveness (OECD, 2005).
In the period since the RBA agreement was signed the policy environment has changed. The major
shift has been adoption of the new ESSP 2013-18 (MINEDUC, 2013) which places quality of
education at the centre. This document put the goal of “improving the quality of education and
training” and “strengthening the relevance of education … to meet labour market demands” alongside
that of expanding access (targeting hitherto unreached students with special educational needs and
extending to 12YBE).45
ESSP 2013-18 marked an effort to bring quality and relevance, on top of
completion and access.
When consulted as part of the year two evaluation fieldwork, the DG of REB talked of completion as
sitting in a complex range of factors as “one of many hills on the map of ESSP 2013-18”.
The picture at the highest policy level is therefore one where the RBA agreement has had no
discernible effect: the government was fixed on this course, and DFID intended specifically to support
it. In this respect year two findings mirror those of year one.
This opinion was reinforced by other KIs, including the Permanent Secretary of MINEDUC, in group
discussions with the education SMT. The consistent finding from all national level KIs was that they
could not identify any specific policy development or changes as a result of RBA (see Box 2).
Box 2 - Quotes from national level KIs
“In designing RBA we started with the ESSP indicators” Permanent Secretary, MINEDUC (2015)
There is no specific policy, it is through a combination of many things that we have sought to achieve
this [completion]” – KI Interview, REB official (2015)
Having established that RBA has not generated a ‘response’ per se (see deduced ToC at Figure 1)
from GoR in terms of policy development in either year of the pilot to date, it is necessary to look at
other potential processes of change to explore if RBA has impacted in other ways (for example
through new/renewed action or changes in behaviour or messaging)
KI interviews and FGD research at district and school level highlighted aspects of GoR messaging,
administrative measures and programming which district and school level staff associated with GoR
efforts to increase completion. These included: the programme of school-feeding; the continued
development of school infrastructure; community-based approaches to encouraging children to
remain in school, and a move towards automatic progression (with implementation through a 10% cap
on repetition).46
43
Net enrolment in 2009 was measured as 94%, having grown at an average of 4% per annum since 1998. 44
The MDGs are fully integrated into Rwanda’s development strategy. 45
Among its outcomes ESSP 2013 includes strengthening TVET, improving teacher quality, higher education, school readiness for pre-school children, science and technical education and Adult Basic Education. 46
The interviews suggested that these interventions in particular address completion. Other priorities were also discussed, many of which had some relationship to completion. KIs variously mentioned ECD and TVET; the quality of education inputs, including the parent/teacher ratio, materials and incentivisation of teachers.

P0 6084 Evaluation of Results Based Aid in Rwandan Education – Year Two Evaluation Report
24
These measures appeared relatively consistently across all four districts, although there was some
variation in the emphasis on different elements (particularly the emphasis on the use of police to bring
children back to school in District C).
Table 13 overleaf provides a breakdown of district and school level findings. The main factor that
appears to distinguish districts B and C (poorer districts with reasonable S3 completion gains) from D
(wealthier district with lower completion) was the degree to which schools prioritised the pursuit and
return of dropouts.
Overall however there was substantial
consistency between and within districts in
the mix of measures employed to address
completion.
While the measures noted above (with the
exception of the school-feeding programme)
have been apparent for some time, KI
interviews suggested renewed efforts linking
them to completion more recently (see Box
3).
The evaluation has found no evidence that
RBA was mentioned or was a consideration
in the process of formulating or implementing
these approaches or in the communication of
priorities to districts and schools.47
Instead, RBA can be seen in terms of
reinforcing pre-existing priorities, providing
encouragement and endorsement to achieve
completion through implementation of GoR’s
own plans and approaches. There is no
evidence that the situation in the absence of
RBA would have been different; RBA has
occurred concurrent to existing GoR action.48
47
Government retreats emerged as key moments in operationalising the ESSP and refocusing the priorities of the sector. The School Feeding Programme emerged from the 2014 Government Retreat. The DG REB noted that these were the events bringing together senior officials “to review progress in the previous year and project forward for the next year”; suggesting that there have been at least two where education and the quality of education had been on the agenda. 48
Note: In spite of two anecdotal quotes suggesting a contribution of RBA to increased attention on completion, see Box 3, no
KIs were able to provide firm examples to demonstrate this contribution, to articulate how or why RBA may have contributed. When probed, the view of GoR KIs was that RBA has not prompted additional action or any specific response. This issue merits further investigation in year three of the evaluation.
Box 3 - Quotes demonstrating focus on
completion
“Beginning from last year the district prioritised the
reduction of drop out. This was among the targets
of the district Imihigo [2013-2014]; this has been
their main concern and they have tried to achieve it
at a high level.” KI interview, Vice Mayor (2014)
“The rate of repetition has also reduced; this was
mainly due to the law from the central government
of automatic promotion.” Teacher FGD, (2014)
“The school has reduced the rate of drop out
compared to two or three years ago, the school
principal and teachers were not concerned whether
students were attending school or not, but now it is
their main concern.” Student FGD (2014)
“Since the introduction of RBA we have been
linking efforts to try and achieve improvement” KI
interview, REB official (2015)
"The mind-set has now been focussed RBA is
seen as a learning process to assist us to achieve
our own aims ...it provided a fresh momentum...like
a bell ringing" KI interview, REB official (2014)

P0 6084 Evaluation of Results Based Aid in Rwandan Education – Year Two Evaluation Report
25
Table 13 – District and school level findings
District Wealth Quintile
Completion Quintile 49
(2011-13)
% increase in S3
completion (2011-13)
Priority given to completion at district level and measures adopted
School level action on completion
Priority given to EL proficiency at district level and measures
adopted
School level action on EL proficiency
A 1 1 73%
Reducing drop-out and implementation of school-feeding were prioritised at district and sector level, alongside a
range of other priorities (e.g. infrastructure, supplies, access, TVET, adult literacy and quality of education).
A similar approach was taken in both schools. Each emphasised engagement with parents, follow-up on registration of
children, reductions in parental contributions and school feeding. One
also emphasised infrastructure development.
Employment of qualified teachers was identified as a priority, but English was not specifically mentioned (no resources were said to be specifically allocated).
Action in relation to EL proficiency was focused on the mentor’s teaching
programmes. It was noted that English was not part of inspection or
Imihigo.
B 4 1 40%
Infrastructure was cited as the main priority by district officials, with retention and access thereafter. Sector officials cited reducing drop-out and repetition (through automatic promotion) as their
priorities to improve completion.
Both schools cited reducing drop-out, education for all and school feeding as
the main priorities in relation to completion. This was followed by access
and educational quality. Both schools cited action around engagement with parents – fining them if their children
drop-out and community engagement to bring learners who drop-out back to school – and automatic promotion.
EL proficiency was communicated as part of
district priorities in relation to quality of education;
dictionaries provided but no further resources
mentioned.
Schools confirmed that English language
proficiency was identified as a priority at district and
school level. In one school respondents
noted that the mentor’s time availability was insufficient for their
needs.
C 4 2 32%
District officials listed EDPRS priorities (including TVET, quality of education
and infrastructure). The specific measures cited concerned follow-up of absentees and automatic promotion; with the focus firmly on completion.
Consistent with findings at district level, both schools cited the need for heavy
follow-up with parents and communities to reduce drop-out (ultimately resorting to police involvement); and the adoption of
automatic promotion.
Interviewees at the district level did not stress English as a priority until prompted.
One school suggested that English language was not identified as a
priority; the other did so when prompted (this
school identified mentors as being the only
resources available).
D 1 4 10%
Retention and school feeding were mentioned among a list of other
EDPRS commitments. The specific measures cited concerned encouraging
parents to send children to school, warning employers not to employ
children, inspections and school-level imihigo and the 10% cap on repetition.
For both schools, ensuring education for all and reducing drop-out were identified
as priorities. School-feeding was identified as the main change in the past
two years. Measures to increase completion included follow-up with
parents and continuous examinations.
Interviews at the district level suggested English
language proficiency was a district level priority only
when prompted.
Only one school cited English language
proficiency as a priority within the district – and the mentor suggested that teachers do not
always attend training.
49
HEART(2014)

P0 6084 Evaluation of Results Based Aid in Rwandan Education – Year Two Evaluation Report
26
3.2.2.3 Synthesis of qualitative and quantitative evidence
How can the increase in S3 completion that is highlighted by the quantitative work be
understood and reconciled with the qualitative evidence? The puzzle is especially challenging as
it needs to account for positive effects at S3 but no effects at the other levels. At this interim stage the
evaluation cannot offer definitive answers. Indeed, at a meeting of the education SMT some were
surprised that S3 performance was not in line with that of P6 and S6. Even those who stated they
were not surprised were unable to give a reason for this differential effect. A number of possible
explanations were posed but no-one expressed certainty and no-one was able to make an explicit link
to RBA.
The prevailing view was that completion is being driven by a combination of policies and approaches
as opposed to any single intervention. This is encapsulated in the previously cited comments of a
REB official [“There is no specific policy, it is through a combination of many things that we have
sought to achieve this [completion]” – KI Interview, REB official (2015)]. Among the potential
explanations for the observed increase at S3 were:
The influence of town hall meetings where REB directly addressed district officials and school
staff to raise awareness of GoR priorities in relation to enrolment, completion, drop-out and
repetition; particularly that support/ follow-up should be provided to help retain children in school.
This was not directly related to RBA, but RBA supported the emphasis of the messages
transmitted. Town Hall meetings were mentioned in group consultation with the education SMT
(by a DDG REB and the Permanent Secretary of MINEDUC). One REB DDG also suggested
that the effect of action to reduce drop-out may manifest itself particularly strongly at S3
as this is a key transition point for young people and their future life chances (it was also
mentioned that there was less room for increase at P6 as completion was already at a relatively
high base).
GoR recently stopped the practice of ranking schools on the basis of results. A senior
official in MINEDUC mentioned that this may have the effect of supporting automatic progression
by reducing the number of children who are made to repeat (as schools are less concerned
about ranking). This was discounted by another MINEDUC official, and by the evaluators, as an
explanatory factor in 2013 as the change is too recent to have realistically impacted on the S3
completion rates observed.
Impact of TVET expansion as a factor encouraging completion. Over the period 2010-13
GoR has invested significantly in TVET (effectively doubling the number of enrolees, teachers,
centres and admin staff). EMIS data (2014) shows that in 2013 15,592 students enrolled in TVET
(including 10,058 male students). A senior representative of MINEDUC (speaking at the
education SMT meeting), raised the possibility that enhanced options for progression to TVET
following junior secondary may have encouraged completion at S3 among those who previously
would have dropped-out. This is a credible possibility supported in part by the evaluation’s
qualitative investigations.50
However, at this point the evaluation data in support (or otherwise) of
this possibility is inconclusive and there is no evidence to link the expansion of TVET to RBA (in
consultation with MINEDUC/ REB, TVET was always framed as a GoR led priority; no additional
action as a result of RBA is evident).
It was clear from each individual KI, and the range of opinions offered, that there is currently little
robust evidence regarding the effectiveness of individual policies and approaches focusing on
completion. The majority of KIs mentioned the policies/ approaches that they were most involved with,
and there was limited overlap between different KIs. As such, the increase in S3 completion cannot
be robustly linked to any specific action, and none of the policies/approaches or actions discussed
50
TVET was cited as a priority in two of the districts and by a Sector Officer in a third district; one NGO official made comments to the effect that the ability to move on to TVET schools may be incentivising students. This line of enquiry was not prioritised at school level as all schools visited were 9YBE schools.

P0 6084 Evaluation of Results Based Aid in Rwandan Education – Year Two Evaluation Report
27
can be robustly linked to RBA. Instead, it seems that a number of factors have coincided to produce
the observed increase at S3. Section 3.2.3 goes on to consider some of these factors in more detail.
3.2.3 What factors have impacted on achievement of RBA results?
3.2.2.4 English language proficiency
Finding 4 Repetition, most common in the early grades, does not merely delay completion at P6, it makes it much less likely.
Finding 5
Progress in key indicators at primary level (falling levels of repetition and lower drop-out, and increased completion (albeit below trend)) is tempered by a drop in transition from P6 to S1. There is no evidence to suggest this is an unintended consequence of RBA.
Finding 6
The factors affecting completion at both primary and secondary level remain similar to those reported in year one of the evaluation. These include gender, wealth, school resources, literacy and issues/ perceptions of educational quality.
The previous section established that 2013 did see an above trend increase in completion at S3.
However, there is no evidence of a specific link to RBA. In this section the evaluation considers the
range of factors that are shown to, or are perceived to, have impacted on completion.
This wider discussion is necessary to understand the complexity of the picture; where and for whom
additional barriers to completion exist. The analysis in this section is intended to place the evaluation
findings in context.51
It begins by exploring issues of repetition, drop-out and progression - all
inextricably linked to completion – and areas which have been a focus of GoR action.
Repetition, drop-out and progression – Exploring
trends around repetition, drop-out and progression is
important in order to understand ‘completion’. Table 9
(previously) showed the numbers of students taking
exams at each of the three levels of education that are
a focus for RBA. Figure 4 and figure 5 plot enrolment
by grade and year for primary and secondary school.
A key observation when looking at Table 9 and Figure
4 in the round is the sheer imbalance at primary
school; over 600,000 students enrolled in P1 but only
around 160,000 took the P6 exam.52
Figure 4 also suggests that repetition is most common
in the early years of education, as P1 consistently has
more than 50% more enrolees than P3.53
This
observation is in keeping with evidence presented in
the DFID RESP Business Case (DFID, 2011c).54
Box 4 summarises the analysis on repetition, drop-out
and progression, recalling the message from the year
one evaluation report that repetition in early years
does not merely delay completion, it makes it
51
Many of the issues explored are the same as those highlighted in year one of the evaluation. The aim here is not to repeat what was said in year one. The data presented is intended to highlight new findings and reinforce year one findings that are emerging particularly strongly. 52
As noted in the year one evaluation report, there are three options for every student in every year: repetition, drop out or progression. Completion at any level is best understood as the culmination of a series of progressions (or non-drop out and non-repetition). 53
In other words P1 and P2 must logically have a large number of repeaters, as these cannot be cohort size effects (which would show up through much larger annual changes). 54
The RESP Business Case (section 1.4) cites figures from MINEDUC to demonstrate “high levels of repetition, particularly in early grades” (Primary repetition rate 15.3% (girls 14.9%); drop-out rate 15.2% (girls 14.7%)).
Box 4 - Analysis of data on repetition,
drop-out and progression
At primary level for the period 2009-2012,
EMIS data paint a mixed picture:
Promotion rose slightly (73.8% to
76.4%);
Repetition rates fell (14% to 12.5%);
The dropout rate fell slightly (12.2% to
11.1%);
The % of 12-year olds that are in P6
(the appropriate grade assuming on
time enrolment and progression without
repetition or drop-out) fell from 74.5% in
2008 to 69%;
The % of P6 students who went on to
S1 the following year dropped
dramatically from 95% to 74.4%.

P0 6084 Evaluation of Results Based Aid in Rwandan Education – Year Two Evaluation Report
28
much less likely. The implication of this is that to improve completion at P6, the trends of repetition
and drop-out in early years must first be addressed.55
Analysis of trends on repetition, drop-out and
progression also highlighted a worrying drop in transition rates from P6 (an RBA incentivised grade)
to S1 (a non-incentivised grade). This may merit further investigation in year three of the evaluation. It
is noted however that there is no evidence to suggest that this is related to any perverse incentive or
unintended consequence of RBA.
Figure 4 – Primary enrolment, by year and grade56
Source: EMIS 2014
At secondary school level (over the period 2010 to 2013) there has been much more movement in the
fundamental numbers of enrolees; with an inevitable impact on completion at S3 and S6 (partly as a
result of the cohort effect). The most striking trend in Figure 5 is the large number of students who
joined S3 in 2011, moved up to S4 in 2012 and were in S5 in 2013.
This cohort reflects strategic policy changes in Rwanda with the introduction of 9YBE in 2009. It would
be expected that this would lead to a larger S1 cohort in 2009, filtering through to a large S3 cohort in
2011 and resulting in a large S6 dividend in 2014; the final year of the current RBA agreement.
55
This conclusion comes from triangulating the evidence base. This includes household surveys which ask those who have completed how often they repeated, the answer being not very often at all. This is consistent with a lot of completers not repeating at all. 56
Note: Disparities between the analysis in Box 5 and Figures 4 and 5 are a result of data availability and time lag.

P0 6084 Evaluation of Results Based Aid in Rwandan Education – Year Two Evaluation Report
29
Figure 5 – Primary enrolment, by year and grade
Source: EMIS 2014
In addition to 9YBE57
, the evaluation’s qualitative investigations highlighted other measures focusing
on repetition and drop-out that are likely to have a direct impact on completion.
Significantly, GoR has shifted towards a policy of automatic progression (implemented through a cap
on repetition). The cap on repetition (set at 10%) was reported across all of the districts and schools
visited as part of the evaluation fieldwork in 2014.
Available data on actual levels of repetition has a lag of two years on this year’s qualitative
investigations.58
The most recent data (Table 14) show that repetition rates at primary school have
been falling (although they remain in excess of 10%). Secondary school repetition rates, which have
tended to be much lower, have also fallen in recent years. The maximum 10% repetition rate may well
have been achieved in 2014; this will not become clear for a few years. What is clear is that
repetition is falling in Rwanda at primary and secondary level.
57
And 12 YBE which is now being rolled out. 58
The only available data comes from EMIS, which is available with a lag of around nine months from the end of the school year. However, EMIS data only provides information on repeaters for the preceding year. So, for example, to discover the repetition rates for the 2011 school year, the data is available in 2013, as EMIS finds out in 2012 which students are currently repeating, and makes the data available in 2013.

P0 6084 Evaluation of Results Based Aid in Rwandan Education – Year Two Evaluation Report
30
Table 14 - Repetition Rates
In relation to drop-out, there was evidence from the year two qualitative fieldwork of district and
school-level action encompassing a cross-community approach to combat drop-out (different
schools and districts emphasised work with the police, interactions with potential employers of school
drop-outs, and working with parents (see also Table 13 and Box 5)). This cross-community approach
was mentioned briefly by a national level KI from REB who commented on encouragement given to
schools (via the mechanism of Town Hall meetings) to take a community level approach to reducing
drop-out. Such approaches, if successful, will undoubtedly affect completion as reducing drop-out and
repetition is akin to increasing completion.
Primary Secondary Lower Secondary Upper Secondary
2007 17.7% 8.4%
2008 15.3% 6.0%
2009 14.0% 4.4%
2010 13.0% 3.8%
2011 12.7% 5.8% 1.6%
2012 12.5% 6.2% 1.7%
Box 5 - Comments on approaches to reducing drop-out
“[There are] many initiatives to engage parents, teachers and students, [to encourage students] to
stay in school” KI interview, REB Official (2015)
“S3 is the year of doing the national exam. Students shouldn’t be able to drop-out as S3...we should
try to convince them that they should stay as they are about to cross a level to a new level. It is a
time when students choose their future” KI interview, REB Official (2015)
“When a child has dropped [out], a teacher seeks ways to approach him/her through collaboration
with the community” FGD Teachers (2014)
“Central government set a policy to curb drop-out that mobilises all organizations to engage for
example the national police. District, sector and the school formed a team for drop-out and visit
children who dropped out and take them back to school. Through meeting at district/sector level we
are always reminded to face the challenges and avoid any drop-out.” KI Interview, Principal (2014)
"Recently drop out cases have been a problem but due to the intervention of police, parents are
encouraging students to keep their studies until they finish: the people do not fear the negative
impact of the drop-out cases but they only fear the sanctions" KI Interview, Principal (2014)
"Roll-call/attendance list is daily verified to check if all the students have attended the class. Anti-
drop-out clubs have been set up and they meet every Friday of the week and give out the list of the
students who did not attend class in that specific week. Sector/cell council meetings which are
being chaired every month have put pressure on the parents who have students who dropped out
to bring them back to schools. The school meeting sat and appointed someone in charge of drop-
out cases in the school who should follow up.” KI Interview, Principal (2014)
"The district follows up drop-out cases by visiting students together with sector leaders and school
leaders and they get to know the reasons why students stopped school and find out solutions. Anti-
drop-out clubs were set up in all schools composed of teachers and students... the district and
police get involved [to] find solutions." KI Interview, SEO (2014)
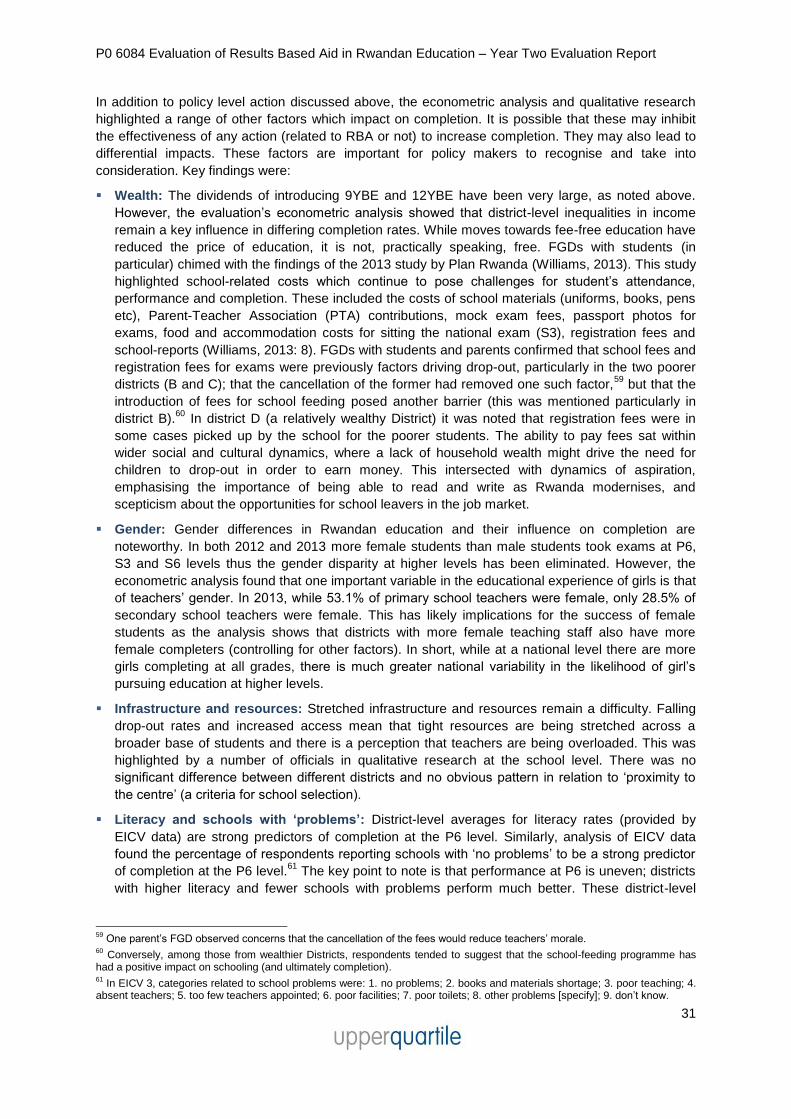
P0 6084 Evaluation of Results Based Aid in Rwandan Education – Year Two Evaluation Report
31
In addition to policy level action discussed above, the econometric analysis and qualitative research
highlighted a range of other factors which impact on completion. It is possible that these may inhibit
the effectiveness of any action (related to RBA or not) to increase completion. They may also lead to
differential impacts. These factors are important for policy makers to recognise and take into
consideration. Key findings were:
Wealth: The dividends of introducing 9YBE and 12YBE have been very large, as noted above.
However, the evaluation’s econometric analysis showed that district-level inequalities in income
remain a key influence in differing completion rates. While moves towards fee-free education have
reduced the price of education, it is not, practically speaking, free. FGDs with students (in
particular) chimed with the findings of the 2013 study by Plan Rwanda (Williams, 2013). This study
highlighted school-related costs which continue to pose challenges for student’s attendance,
performance and completion. These included the costs of school materials (uniforms, books, pens
etc), Parent-Teacher Association (PTA) contributions, mock exam fees, passport photos for
exams, food and accommodation costs for sitting the national exam (S3), registration fees and
school-reports (Williams, 2013: 8). FGDs with students and parents confirmed that school fees and
registration fees for exams were previously factors driving drop-out, particularly in the two poorer
districts (B and C); that the cancellation of the former had removed one such factor,59
but that the
introduction of fees for school feeding posed another barrier (this was mentioned particularly in
district B).60
In district D (a relatively wealthy District) it was noted that registration fees were in
some cases picked up by the school for the poorer students. The ability to pay fees sat within
wider social and cultural dynamics, where a lack of household wealth might drive the need for
children to drop-out in order to earn money. This intersected with dynamics of aspiration,
emphasising the importance of being able to read and write as Rwanda modernises, and
scepticism about the opportunities for school leavers in the job market.
Gender: Gender differences in Rwandan education and their influence on completion are
noteworthy. In both 2012 and 2013 more female students than male students took exams at P6,
S3 and S6 levels thus the gender disparity at higher levels has been eliminated. However, the
econometric analysis found that one important variable in the educational experience of girls is that
of teachers’ gender. In 2013, while 53.1% of primary school teachers were female, only 28.5% of
secondary school teachers were female. This has likely implications for the success of female
students as the analysis shows that districts with more female teaching staff also have more
female completers (controlling for other factors). In short, while at a national level there are more
girls completing at all grades, there is much greater national variability in the likelihood of girl’s
pursuing education at higher levels.
Infrastructure and resources: Stretched infrastructure and resources remain a difficulty. Falling
drop-out rates and increased access mean that tight resources are being stretched across a
broader base of students and there is a perception that teachers are being overloaded. This was
highlighted by a number of officials in qualitative research at the school level. There was no
significant difference between different districts and no obvious pattern in relation to ‘proximity to
the centre’ (a criteria for school selection).
Literacy and schools with ‘problems’: District-level averages for literacy rates (provided by
EICV data) are strong predictors of completion at the P6 level. Similarly, analysis of EICV data
found the percentage of respondents reporting schools with ‘no problems’ to be a strong predictor
of completion at the P6 level.61
The key point to note is that performance at P6 is uneven; districts
with higher literacy and fewer schools with problems perform much better. These district-level
59
One parent’s FGD observed concerns that the cancellation of the fees would reduce teachers’ morale. 60
Conversely, among those from wealthier Districts, respondents tended to suggest that the school-feeding programme has had a positive impact on schooling (and ultimately completion). 61
In EICV 3, categories related to school problems were: 1. no problems; 2. books and materials shortage; 3. poor teaching; 4. absent teachers; 5. too few teachers appointed; 6. poor facilities; 7. poor toilets; 8. other problems [specify]; 9. don’t know.

P0 6084 Evaluation of Results Based Aid in Rwandan Education – Year Two Evaluation Report
32
characteristics appear to be more of a barrier to girls’ completion. This finding inevitably leads to a
discussion of educational quality.
Quality of education: There are multiple
studies which consider the effect of sector inputs
on educational quality (see Park, 2008; William
and Somers, 2001; and World Bank, 2011) and
it is recognised that quality of education is an
important factor in student attendance,
engagement, learning outcomes and, by
inference, completion.
Educational quality is a multi-faceted issue and
it is outside the bounds of this evaluation to offer
in-depth analysis on the quality of Rwandan
education (except in instances where RBA may
be an influencing factor). Given the significance
of the issue, some comment is however
required.
Educational quality is a high priority in Rwanda,
occupying a central position in the current ESSP
2013-18 (see Box 6). This represents a change
in focus from previous iterations of education
policy.
Quality deficits have been recognised by donors for some time, and enhancing quality is central to
the rationale underpinning DFID’s RESP. The RESP Business Case (DFID, 2011c) noted that
“significant challenges around the quality of education remain” and that these have been
exacerbated by rapid expansion of access to basic education (made possible by the introduction of
double-shifting), high teacher: pupil ratios, low teacher salaries, and insufficient teacher training.
In discussions about completion, concerns over the quality of education were a recurring theme in
qualitative research at school-level and there was a belief among teachers and parents that the
focus on completion (manifested through the cap on repetition) was having a detrimental effect on
quality (as a result of progressing students who were not considered to have met the grade and
increasing pressure on teaching staff).62
To counter these points it is important to note that there is an evidence base in support of
automatic progression in order to aid sector efficiency, student moral, retention and achievement
(see for example Ndaruhutse et al, 2008). The evaluation’s qualitative research (albeit with a small
sample of districts and schools) shows that at grass roots level staff have not been adequately
sensitised to these changes (which often go against embedded norms and existing teaching
practice).
Comment on the negative perceptions emerging through the qualitative fieldwork are included here
to provide a flavour of feeling at the school-level. The evaluators acknowledge the broad range of
measures underway to enhance educational quality in Rwanda including: revision of the
curriculum; the continued development of school infrastructure; development of in-service and pre-
service teacher training; and the new English as a Medium of Instruction (EMI) strategy. That said,
the evaluation is unable to rule out the possibility that a focus on completion may have negative
effects on quality as the perception of local level KIs was strongly voiced.
62
Teachers talked about having to provide tuition before and after school so that pupils would be ready to progress/ pass the exams and of having to provide remedial tuition and exams to ensure the 90% progression rate.
Box 6 - Extract from ESSP 2013-18
(MINEDUC, 2013 p23-24) [emphasis added]
“The key challenge for the sector during
EDPRS II lies in consolidating, advancing
and accelerating quality improvement
measures that have been initiated over
recent years, such as improvements in
textbook procurement, and the monitoring of
learning achievement. Further reductions in
average class sizes and pupil-teacher ratios,
an improved curriculum supported by better
and more readily available teaching and
learning materials, improved examination and
assessment systems, are all important....A
higher calibre of teaching recruits and
teachers, who are better trained, better
equipped and resourced, better supported
and managed are all strategies outlined in
Chapter 3, to address the challenge of quality
improvements”
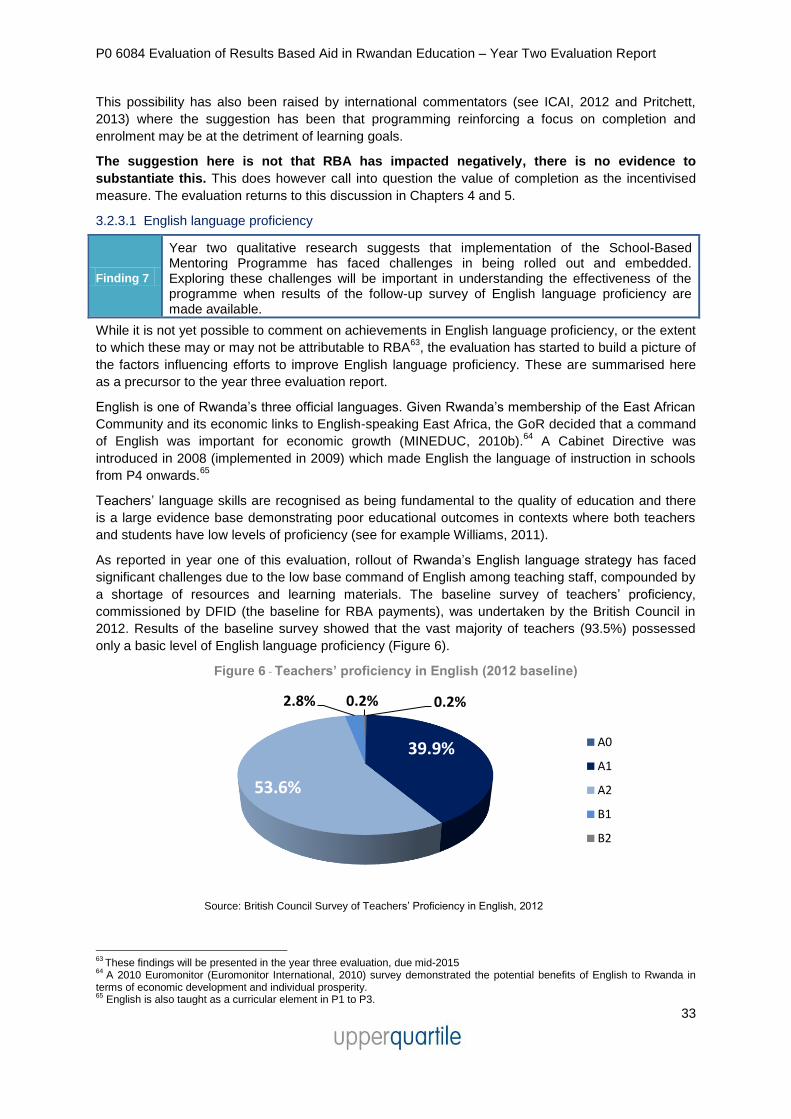
P0 6084 Evaluation of Results Based Aid in Rwandan Education – Year Two Evaluation Report
33
0.2%
39.9%
53.6%
2.8% 0.2%
A0
A1
A2
B1
B2
This possibility has also been raised by international commentators (see ICAI, 2012 and Pritchett,
2013) where the suggestion has been that programming reinforcing a focus on completion and
enrolment may be at the detriment of learning goals.
The suggestion here is not that RBA has impacted negatively, there is no evidence to
substantiate this. This does however call into question the value of completion as the incentivised
measure. The evaluation returns to this discussion in Chapters 4 and 5.
3.2.3.1 English language proficiency
Finding 7
Year two qualitative research suggests that implementation of the School-Based Mentoring Programme has faced challenges in being rolled out and embedded. Exploring these challenges will be important in understanding the effectiveness of the programme when results of the follow-up survey of English language proficiency are made available.
While it is not yet possible to comment on achievements in English language proficiency, or the extent
to which these may or may not be attributable to RBA63
, the evaluation has started to build a picture of
the factors influencing efforts to improve English language proficiency. These are summarised here
as a precursor to the year three evaluation report.
English is one of Rwanda’s three official languages. Given Rwanda’s membership of the East African
Community and its economic links to English-speaking East Africa, the GoR decided that a command
of English was important for economic growth (MINEDUC, 2010b).64
A Cabinet Directive was
introduced in 2008 (implemented in 2009) which made English the language of instruction in schools
from P4 onwards.65
Teachers’ language skills are recognised as being fundamental to the quality of education and there
is a large evidence base demonstrating poor educational outcomes in contexts where both teachers
and students have low levels of proficiency (see for example Williams, 2011).
As reported in year one of this evaluation, rollout of Rwanda’s English language strategy has faced
significant challenges due to the low base command of English among teaching staff, compounded by
a shortage of resources and learning materials. The baseline survey of teachers’ proficiency,
commissioned by DFID (the baseline for RBA payments), was undertaken by the British Council in
2012. Results of the baseline survey showed that the vast majority of teachers (93.5%) possessed
only a basic level of English language proficiency (Figure 6).
Figure 6 - Teachers’ proficiency in English (2012 baseline)
Source: British Council Survey of Teachers’ Proficiency in English, 2012
63
These findings will be presented in the year three evaluation, due mid-2015 64
A 2010 Euromonitor (Euromonitor International, 2010) survey demonstrated the potential benefits of English to Rwanda in terms of economic development and individual prosperity. 65
English is also taught as a curricular element in P1 to P3.

P0 6084 Evaluation of Results Based Aid in Rwandan Education – Year Two Evaluation Report
34
From 2012 to the time of drafting this report, the School-Based Mentoring Programme (SBMP) was at
the core of efforts to improve English language skills and teaching practice of grade P1 – S3
teachers.66
The SBMP has been overseen by a joint MINEDUC and development partner taskforce;
the Teacher Development and Management Technical Working Group (TDM TWG).67
The SBMP places mentors in schools (with the aim of achieving one mentor per two schools).
Mentors receive training and supervision from senior mentors appointed to the district. The dual aims
of the programme are for 85% of teachers to achieve English language proficiency (undefined at the
time the strategy was drafted but latterly set at level B1); and for 80% of teachers to be using learner
centred teaching methods by 2017.
This is an area in which there is a weak evidence base, both in terms of the level of proficiency
required and also what works in enhancing English language (EL) skills. In a discussion paper
commissioned by DFID on behalf of GoR in 2013, it was noted that:
“in developed countries it is assumed that teachers delivering a curriculum will have high
levels of competence (C1 in CEFR, or above) in the language of instruction...[ ]...outside this
context there is a lack of primary research investigating precisely what levels of competence
are required for effective English as the Medium of Instruction (EMI) teaching to take place”
(Wilson, Colquhoun, and Masterjerb, 2013).
This paper went on to state that the use of mentoring as the primary intervention to improve language
proficiency was both innovative and untested in terms of large-scale EL development (Wilson
Colquhoun, and Masterjerb, 2013) Consultation with KIs as part of the evaluation’s primary research
highlighted some scepticism from donors around the potential effectiveness of the SBMP as a sole
intervention to improve EL proficiency.
The qualitative research in year two of the evaluation suggests that the SBMP has faced challenges
in being rolled out and embedded. These may affect achievement of RBA results. This will be
explored further in year three when the results of the follow-up survey of teachers’ English language
proficiency are available.
In considering the factors impacting on EL
proficiency and the potential role of RBA, it
is noted that the strategic approach of GoR
has developed over the course of the RBA
pilot.
In 2014 GoR introduced the new National
Strategy for Teachers’ In-Service Training
to support English as the Medium of
Instruction (EMI). The new strategy is a
holistic approach seeking to improve EMI
skills with mentors considered as one part
of the approach (as opposed to a stand-
alone intervention). Core components of
the strategy are set out in Box 7.
In section 3.3.2 we consider the
development of this strategy in terms of
GoR’s response to RBA.
66
The original approach was intensive courses during school holidays. 67
In 2014 this working group was renamed the ‘Teacher Professional Development Technical Working Group’.
Box 7 - Components of the 2014 EMI strategy
1. Structured training materials to support blended
approach to EMI.
2. Cohort of EMI Trainers recruited and trained in
delivering regular face-to-face training at district
level. SBMs trained to support teachers training at
school-level.
3. In-service EMI training programme including: face-
to-face training by EMI trainers and SBMs; peer
group and self-study supported by SBMs; training in
use of supportive technology.
4. National media component to support EMI rolled out
at national and district level.
5. Communication strand to support the strategy rolled
out at national and district level.

P0 6084 Evaluation of Results Based Aid in Rwandan Education – Year Two Evaluation Report
35
3.2.4 Recapping the impact-related findings
Finding 1 At the P6 and S6 levels, in 2013 there is unambiguous evidence that completion was either negligibly or SIGNIFICANTLY below trend, despite GoR efforts and the support of RBA.
Finding 2
At the S3 level, in 2013 there is evidence that GoR achieved SIGNIFICANTLY above trend completion for both genders. Much of this improvement can be traced to an increase in the percentage of enrollers who took the final S3 exam.
Finding 3
The evaluation has found no identifiable effect of the RBA agreement on GoR actions at the level of policy or practice. RBA has supported the emphasis on completion rather than providing an incentive to drive change by shaping GoR’s actions, behaviours or messaging.
Finding 4 Repetition, most common in the early grades, does not merely delay completion at P6, it makes it much less likely.
Finding 5
Progress in key indicators at primary level (falling levels of repetition and lower drop-out, and increased completion (albeit below trend)) is tempered by a drop in transition from P6 to S1. There is no evidence to suggest this is an unintended consequence of RBA.
Finding 6
The factors affecting completion at both primary and secondary level remain similar to those reported in year one of the evaluation. These include gender, wealth, school resources, literacy and issues/perceptions of educational quality.
Finding 7
Year two qualitative research suggests that implementation of the School-Based Mentoring Programme has faced challenges in being rolled out and embedded. Exploring these challenges will be important in understanding the effectiveness of the programme when results of the follow-up survey of English language proficiency are made available.
3.3 Process-related findings
This section presents the process-related findings of the year two evaluation. These are structured
around two of the seven macro evaluation questions. Specifically:
How is the RBA approach perceived in Rwandan education?
What response has there been on the part of GoR to the RBA intervention?
3.3.1 How is the RBA approach perceived in Rwandan education?
Finding 8
There is an established results-driven culture in Rwanda. RBA is a ‘good fit’ with this and is hence perceived largely as ‘business as usual’ at the highest levels of Government.
Finding 9
The RBA pilot is little known outside of the highest levels of MINEDUC/ REB and features of the way in which RBA funding is handled may work against its effectiveness as an incentive for additional action.
In year one of the evaluation it was reported that the RBA pilot had been positively received by high
level national stakeholders.
“The RBA agreement is deemed to be consistent with GoR policies, and a high degree of
GoR ownership is evident at a senior level” (Upper Quartile, 2014: 40)
This finding was largely confirmed in year two of the evaluation. As section 3.2.2 illustrated, RBA
results were aligned with GoR priorities and RBA has reinforced GoR’s drive to pursue their existing
goals.
Rwanda is a results-driven country. Imihigo, a performance management tool, was introduced in
2006. Through the Imihigo system government ministers (on behalf of their ministries) and District
Mayors (on behalf of their citizens) sign an annual performance contract with the President. Imihigo
was intended to increase effectiveness and ensure accountability of public agencies and institutions in
their implementation of national programmes, thereby accelerating socio-economic development
P0 6084 Evaluation of Results Based Aid in Rwandan Education – Year Two Evaluation Report
36
(IPAR-Rwanda, 2014). Government officials, employees and citizens also sign umuhigo which include
measurable targets.68
For employees, imihigo is the equivalent of a performance contract (similar to
that signed by many employees in the UK).
Given this context, RBA as a results driven aid modality was not a major shift for Rwanda and
appears to be viewed as ‘business as usual’ at the higher levels of GoR. Comments by KIs back up
this assertion. For example, the Permanent Secretary of MINEDUC commented “performance
contracting; that is what we have as a country”. She went on to say “our population was already highly
motivated to achieve results”.
The year two evaluation research confirmed the year one finding that knowledge of RBA is limited to a
handful of people; DFID, the Permanent Secretary of MINEDUC and the senior leadership of REB, in
particular.69
One KI from the international community who is involved in policy and coordination
meetings with the GoR noted that RBA was “never” mentioned. When asked about RBA specifically,
outside of the group of senior ministry officials, the evaluators found little more than a vague idea of
what RBA was. For example, within MINEDUC, one official remembered that the DFID adviser had
presented a slide on RBA at the Joint Review of the Education Sector (JRES); they noted that they
had no prior knowledge of the programme. Similarly, at district level, three of the four DEOs
interviewed said they had heard about RBA but that it was not explained in detail; it did not appear to
be a concern for them.
The fact that awareness of RBA is low outside of GoR senior level education officials is not
necessarily an issue for the success of the pilot. Awareness of the funding mechanism among
education sector staff further down the chain is not a requirement of the MoU (note the principle of
recipient discretion) nor is it a necessary prerequisite for success within RBA theory (the key issue is
the incentive for government to drive change in the way it sees fit).70
However, lack of awareness, coupled with the lack of explicit RBA-related activity at the centre,
provides some insight into how RBA is viewed and has been acted upon as a modality. The inference
here is that RBA is viewed by government in the same vein as Sector Budget Support (SBS); it is
simply another part of the funding pot available to pursue their strategic objectives. Given the
evidence in section 3.2.2, that RBA results were aligned with pre-existing GoR focal areas, this is not
surprising.
Nevertheless, in theory RBA works via an incentive mechanism which is not present in other aid
modalities. The obvious incentive is the financial reward available on achievement of results - how
then is this incentive perceived by GoR?
Qualitative research in year two of the evaluation highlighted several points regarding the manner by
which MINEDUC is incentivised by RBA which might reduce the potential incentive of the RBA
payment at the operational level. These are:
RBA is a relatively small sum of money: RBA is a pilot and was described by a senior official as
“one of the smaller programmes”. At a maximum of £3 million GBP per year, it is at its greatest only
2% of the overall budget allocated to MINEDUC for 2013-14, and, in reality, is more likely to be
around 1%.71
RBA incentives are small and appear to be perceived as such.
RBA is submerged in the budgeting process: The amount of RBA funds are not directly addressed
in the education sector’s planning. Revenue, including DFID RBA revenue, is handled centrally by the
68
There are essentially two levels of Imihigo – those signed by the Ministry of Education and the Districts with the President (district ones by the Mayor on behalf of all residents in the district) and those signed by employees with their line manager and by all citizens with their village leader. 69
Although even among this group there was some misunderstanding of RBA results and processes with ‘enrolment’ mentioned by more than one KI at the education SMT meeting attended by the evaluation team in February 2015 and one senior REB official suggesting erroneously that RBA funds would be paid directly to schools. 70
This is however contrary to the RESP ToC which includes an assumption of dialogue around the ‘results compact’ that incentivises positive changes. 71
Budget FY 2013/2014 by agency, MINEDUC, is £149,239,144, at an exchange rate of RFW 1000 to the pound.
P0 6084 Evaluation of Results Based Aid in Rwandan Education – Year Two Evaluation Report
37
Ministry of Finance (MINECOFIN).72
The budget is set as part of the government budgeting process
and the activities to be funded are determined by the envelope set by that process. A senior
MINEDUC official involved in formulating the budget stated that “I do not know and I do not care”
[about the details of donor agreements]. His focus was firmly on the overall percentage increase of
the available budget envelope, and how to plan for that in line with the ESSP.
Attitude to funding: a MINEDUC official suggested that activities were adjusted in year to
accommodate available funds, and that fluctuations were normal. He said “don’t think about the
budget, just try to achieve it, is the Rwandan way’”. There was also some suggestion that officials feel
they are doing what they can. This fed into hints of resignation at likely fluctuations in donor funds:
“when the money comes in, we can utilise it.” In this sense RBA was seen as another modality
causing fluctuating revenue, to which the government would adjust as necessary.
The above points focus on the role of financial incentives in shaping perceptions of RBA, but are there
also other incentives?
Donor relations – The UK is the second largest bilateral donor to Rwanda. Over the period 2011-
2015 DFID was expected to provide a total £55 million GBP to the education sector. Officials in GoR
(MINEDUC and REB) and their DFID counterparts appear to have a close working relationship and
this is valued by GoR. As such it is conceivable that development and maintenance of this
relationship acts as an incentive for GoR which influences perceptions of RBA. This was not explicit in
the qualitative research findings but when consulted, KIs from within GoR often found it hard to
separate RBA from the wider context of policy discussions within which DFID plays a role.
3.3.2 What response has there been on the part of GoR to the RBA intervention?
The previous section established that at higher levels of government RBA has been positively
received, although in many ways it is seen as ‘business as usual’ rather than a fundamentally different
aid modality. In this section we consider the response of GoR to RBA, tracking the messages on RBA
results - completion and English language proficiency - down through the education system to
understand the processes by which change may be brought about in Rwanda. Findings are presented
separately in relation to completion and English language proficiency.
3.3.2.1 Completion
Finding 10
The Imihigo system has been effective in mainstreaming messages on completion and incentivising action to promote completion at district and school-level. This system pre-dates RBA.
This year two evaluation presents findings suggesting that, in relation to completion, RBA has not
triggered a specific response from GoR, in terms of strategic priorities, policy, programming or
messaging to enhance RBA results. Instead, RBA has reinforced existing government priorities and
approaches and supported the pre-existing emphasis on completion. This has been conveyed to
districts and schools via existing channels and management control mechanisms. It is important to
understand these mechanisms when thinking about if and how RBA may work with different indicators
or in different country contexts. Figure 7 outlines the basic flow of funds and accountability between
education sector institutions and actors in Rwanda.
72
External finance liaises with DFID for the funding, sending in disbursement requests directly with the required paperwork stipulated by the Memorandum of Understanding. They provide the projected funding to ‘Macro’ Division, who formulate the overall resource envelope for a budget which is then used by Budget Division to formulate the resource envelopes for individual ministries.

P0 6084 Evaluation of Results Based Aid in Rwandan Education – Year Two Evaluation Report
38
Figure 7 – Flow of funds and accountability
Source: Upper Quartile, qualitative fieldwork 2014
In Rwanda’s decentralised system the District Education Officer (DEO) is the key intermediary
between the district, Sector Education Officers (SEOs) and Principals. The DEO is accountable to the
district, which has the authority to hire and fire; although the district has to respond to MINEDUC
requests for information and requirements.
Education sector messages, guidelines and targets tend to be communicated to schools via district
level meetings called by the DEO. The DEO should hence be pivotal in the communication of
messaging on completion from MINEDUC/REB down to district officials and schools. If the evaluation
was to highlight a significant change as a result of RBA, we may expect to find it here.
As Table 13 (see section 3.2.2) highlighted, all of the districts visited commented on measures to
increase completion (albeit sometimes indirectly) as being among their priorities and actions. There
was no discernible pattern or difference between district level responses or ordering of priorities in
relation to completion rates.73
Rwanda’s imihigo system has been an effective way by which completion (through a focus on
reducing drop-out and repetition) was introduced into district, sector and school level priorities. In all
four of the districts visited the Vice Mayors for Social Affairs, DEOs, and SEOs indicated that targets
73
In terms of priorities at district and school level, officials tended to mention completion in the mix of concerns. In one district
completion was only mentioned in the context of the specific measures they were bringing in (as opposed to among their broad
priorities). For another, it was identified as the foremost priority by the Vice Mayor and Sector officials, albeit that the DEO
ranked it behind infrastructure, improving access and TVET. For officials in the other two districts, completion was among a
range of other priorities.

P0 6084 Evaluation of Results Based Aid in Rwandan Education – Year Two Evaluation Report
39
for drop-out rates were encapsulated in their imihigo. The evaluators were also told that these targets
were introduced to school Principals’ imihigo, and followed up by regular school-level evaluations,
where resources were available.
From the DEO to SEO, Principals and teachers, the
qualitative primary research suggested that existing
management enforcement and accountability processes
were powerful motivators.
On the positive side, district and school level
interviewees consistently mentioned prizes, pride, and
reputational and possible career advantage to be gained
from being a high-performing district, sector, school,
teacher or student. On the negative side, the threat of
being reprimanded for doing poorly was also powerful
(see Box 8).
Overall, the efficacy of these processes appears
dependent on the regularity and probability of oversight
and enforcement (see Box 8). While implementation is
not consistent (resource and capacity issues being the
main constraint), the management control systems
themselves do seem to be relatively effective.
GoR has sought to mainstream messages on
completion and incentivise action to increase completion
via these existing mechanisms. This approach would
likely have been the same in the absence of RBA given
that completion was an existing priority.
3.3.2.2 Teachers’ proficiency in English
Finding 11
The attention given to English language proficiency has intensified, with increased focus on the need for policy action. RBA is seen to have had an indirect influence in reinforcing GoR’s focus as a result of bringing deficiencies sharply into view. It remains to be seen what this will mean for RBA results in the current pilot.
Finding 12
There is some limited evidence that RBA has contributed to Rwanda’s future English language approach by prompting action which culminated in the new national strategy for EMI. This will be considered further in year three of the evaluation.
As with completion, English language proficiency is another long-standing GoR priority. Both the
priority, and the SBMP as the major (initial) vehicle of implementation, emerged before signature of
the RBA agreement.
In contrast to completion, English language as an RBA indicator was included at the insistence of
GoR, specifically REB.74
Qualitative interviews with national level KIs pointed to two reasons for this.
Firstly, the conceptual design for RBA was ongoing around the same time as the British Council’s
Rwanda English in Action programme (REAP)75
was coming to a close. One REB KI commented that
they were “almost overwhelmed” when the British Council project closed given the scale of the
challenge ahead. The inclusion of EL as an RBA indicator provided an opportunity to keep this policy
74
This is apparent from the review of documents charting the RBA design process and from consultation with KIs within DFID. 75
REAP (2009-2011) was a £250,000 GBP DFID funded programme to support MINEDUC improve the quality of English teaching through capacity building, teacher training and the development of teaching and learning materials.
Box 8 – Quotes from district and school
level KIs
“If I am performing well, I am marketing myself; everyone knows there’s a good person there – there may be opportunities” KI Interview: District level
official (2014)
“There is competition everywhere in the country, school principals work hard to develop their schools because they want to keep their jobs, they are afraid if they don’t they will get fired” FGD Parents
(2014)
“When no inspections are conducted teachers really don’t care about any of it. Inspections are conducted in at least one school per week. Since I have to come up with the transport fare on my own, I mostly visit the schools nearby seeing as getting to some schools would require me to part with RWF12,000 of my own money.” KI interview: SEO
(2014)

P0 6084 Evaluation of Results Based Aid in Rwandan Education – Year Two Evaluation Report
40
priority firmly on the agenda. This finding was supported by comments from one NGO official who
said that EL (alongside completion) had been “put [...] high on the agenda for years to come”. 76
Secondly, GoR (specifically REB), recognise that in Rwanda’s decentralised system the achievement
of results is often “dependent on the efforts of those at the frontline” (KI, REB official, 2015). EL
proficiency may have been considered as something more directly within the control of REB given
that they were simultaneously pursing the SBMP.77
As part of the RBA agreement a sample survey, serving as a baseline of English language proficiency
against which payment could be disbursed, was required. This was administered by the British
Council in 2012. The results of this survey were lower than those reported in ESSP 2010.78
Qualitative interviews with national level KIs suggested a mixed response to this survey. One of
REB’s DDGs commented that the survey results were lower than some may have expected, but that
his Department was not surprised that teachers’, at that time, were not confident in expressing
themselves in English. Overall he felt that the results had been “informative and generally accurate”.
Other respondents (including a KI from the international community) suggested that the survey and
the shockwaves that it generated prompted a greater focus on English language proficiency within
GoR. This KI commented that it was a time of “soul-searching”. It was also suggested that the
incentivised nature of the survey gave the data greater weight in policy circles.
“the baseline tests were a wake-up call...until then English proficiency was the elephant in the
room'. The RBA agreement was highly influential, resulting in a greater sense of urgency. The
presentation of the results of the baseline test in February 2013 was a significant moment, and
since then the profile of English proficiency has been raised in donor discussions.” KI Interview:
International NGO (2014)
The message from international KIs is that the attention given to indicators of English proficiency
intensified following the baseline survey, and focused GoR on the need for greater policy action. This
action has since taken place on two fronts.
Firstly, GoR has continued roll-out of the SBMP across the country. As section 3.2.3.2 discussed,
implementation has been challenging and the evaluation’s qualitative research (albeit involving a
small sample) highlighted mixed views in terms of the priority assigned to EL skills at district and
school level. In contrast to completion, communication of GoR messages on EL skills are constituted,
not by the imihigo system, but by inspections and mentors’ line management.79
Qualitative research
suggested that these processes typically lack the same strength as imihigo. Key points are noted in
Box 9. Indeed, one sector official also observed that if an activity was not in their umuhigo, officials
might not respond as directed. Essentially, weaker systems of accountability may allow a lack of
responsiveness to central priorities. These findings will be revisited and developed further in the year
three evaluation in light of results from the follow-up survey of teachers’ proficiency in English
While the SBMP was in place by the time the RBA MoU was signed, there is some evidence to
suggest that RBA has contributed to Rwanda’s future EL approach through a series of actions which
have led to the development of a new, costed national strategy for Teachers’ In-Service Training to
support English as the Medium of Instruction (EMI). Key points in the process are shown in the
timeline at Figure 8. These findings will be explored further in year three of the evaluation.
76 Internal papers discussing the negotiation processes confirm this, observing that the rationale for adding the indicator included ‘to kick start the monitoring of the SBMP’ and ‘to incentivise staff to improve its design and implementation’. 77
This was a challenge for DFID as it indicated differing views of ‘results’ between DFID and GoR. DFID considered EL proficiency as an ‘output’ (or as an ‘outcome’ of the SBMP). In terms of ‘outcomes’ sought by RBA, DFID were keen to adhere to the definition proposed by CGD 2011 which emphasised the need for “‘results’ to be defined in terms of the ultimate ‘outcome’ of the education system”. 78
Which was based on the 2009 REAP baseline assessment. 79
It is noted that at least one inspector stated that he/she was not proficient in English. This is likely the case for other SEOs.

P0 6084 Evaluation of Results Based Aid in Rwandan Education – Year Two Evaluation Report
41
The new strategy, which is now guiding
GoRs activity in relation to EL development
(and the pursuit of donor support),
presents a holistic approach to enhancing
teachers’ skills for English as the medium
of instruction. The strategy combines the
existing mentoring approach with support
from dedicated EMI trainers, the use of
supportive technology, peer group and
self-study.
One KI from an international donor agency
suggested that development of the new
strategy had been contentious as it
impinges on existing national and donor
programmes. This was however presented
in a positive light as this contestation has
opened the discussion and resulted in
development of a more holistic and
evidence-based approach.
As the initiator of the survey that prompted
dialogue, RBA is considered to have
contributed to this process. This line of
enquiry will be followed up in the year three
evaluation.
Figure 8 – Timeline detailing development of the new EMI strategy (actions potentially
stemming from RBA [NB. These are preliminary findings to be further explored in year three])
2012 The RBA baseline survey, administered by the British Council, brought English language deficiencies sharply into view and highlighted the scale of the EL challenge.
June 2013
Production of a short discussion paper, presented to the MINEDUC SMT, which collated the evidence base on EL development and made initial recommendations for a way forward (this paper also informed the RBA indicator for EL proficiency).
July – August 2013
Consultants facilitated meetings with key stakeholders culminating in a workshop held in Kigali on 1 August and a presentation to REB (9 August). The workshop sought comments on the strengths and challenges of current approaches to developing EL proficiency. The presentation considered short and medium term training needs.
September 2013
Production of a consultancy report, commissioned by DFID at the request of GoR (and REB), outlining potential approaches to in-service teacher training (INSET), likely costs and timescales to achieve the necessary level of proficiency.
June 2014 Submission of the new costed national Strategy for In-Service Training to support EMI.
TIM
EL
INE
Box 9 – Observations on management control and
accountability mechanisms for EL proficiency
The inspection process for monitoring teacher
improvement in English appears weak; seven
out of eight schools noted that English was not
evaluated through the inspection process. The only
district where English was evaluated was within
Kigali where English is spoken much more
frequently.
For teachers, accountability occurs through the
performance of their pupils in exams, but not
directly for their performance in English. In one
school (in a rural district in the fourth quintile in
terms of poverty/extreme poverty, but in the second
quintile in terms of percentage improvements in S3
completion), teachers signed an agreement stating
that they would always teach in English. In every
other school teachers either said that they had no
direct accountability and no incentive to improve
their English (three schools) or they did not address
the subject in focus groups (four schools).
Mentors report to the Principal. This was often
not considered a useful relationship because many
Principals themselves have weak English.

P0 6084 Evaluation of Results Based Aid in Rwandan Education – Year Two Evaluation Report
42
3.3.3 Recapping the process-related findings
Finding 8
There is an established results-driven culture in Rwanda. RBA is a ‘good fit’ with this and is hence perceived largely as ‘business as usual’ at the highest levels of Government.
Finding 9
The RBA pilot is little known outside of the highest levels of MINEDUC/REB and features of the way in which RBA funding is handled may work against its effectiveness as an incentive for additional action.
Finding 10
The Imihigo system has been effective in mainstreaming messages on completion and incentivising action to promote completion at district and school-level. This system pre-dates RBA.
Finding 11
The attention given to English language proficiency has intensified, with increased focus on the need for policy action. RBA is seen to have had an indirect influence in reinforcing GoR’s focus as a result of bringing deficiencies sharply into view. It remains to be seen what this will mean for RBA results in the current pilot.
Finding 12
There is some limited evidence that RBA has contributed to Rwanda’s future English language approach by prompting action which culminated in the new national strategy for EMI. This will be considered further in year three of the evaluation.
3.4 Has value for money been achieved?
3.4.1 Introduction
The degree to which RBA provides VfM to DFID and the British taxpayer is a key question for its
efficacy as an aid instrument. Specifically, questions regarding how much benefit is derived from
DFID support to education through the GoR, what the best means of delivering that aid is, and
whether a PbR incentive delivers more relative to its cost than other forms of aid, are critical to our
understanding of whether RBA provides VfM.
Before presenting the findings of the VfM analysis some discussion is required. The VfM analysis
estimates the returns that may be expected from DFID investment in Rwandan education; essentially
what RBA funds have achieved. As section 3.2.2 has demonstrated, to date this evaluation has not
established a clear link between RBA and additional completion. We cannot say that RBA has
achieved anything over and above what would have been achieved if the same funds had been
disbursed via SBS. In providing funds via RBA, DFID may be seen as ensuring accountability to HMG
(i.e. it has paid out against a ‘result’). This alone may be justification for the RBA modality for some.
Headline findings of the VfM analysis are:
Finding 13 Overall, aid spent in the Rwandan education sector represents excellent VfM. This
result is robust to various sensitivity tests and is subject to standard assumptions.
Finding 14
If additional completion (detected through the econometric modelling) was attributable
to RBA, the VfM model suggests that this would represent excellent VfM, with
estimations showing that the extra costs of evaluation and verification associated with
RBA are heavily outweighed by economic returns of the additional completers.
Finding 15 In year two of the evaluation additional completion is considered largely coincidental to
RBA; no causal or significant contributory link has been established.
3.4.2 The VfM approach
Measuring the VfM of aid to education is a complex task. This is because the benefits in terms of
returns to education come only when those educated are in employment, and accrue for many years
afterwards. Modelling these benefits requires estimates of how long each individual stays in
education, when they will enter and exit the labour market, and what their returns in terms of wages

P0 6084 Evaluation of Results Based Aid in Rwandan Education – Year Two Evaluation Report
43
will be in future. Before setting out the findings, the VfM approach is recapped in Box 10. For further
detail see Annex 4 and Annex 6.
Box 10 – Recapping the VfM approach
The approach to the VfM analysis considers the cost effectiveness of RBA relative to not providing
RBA. Two specific counterfactuals are considered.
A: The VfM of aid spent on RBA compared to the counterfactual of not providing that aid to
education; and
B: The VfM of aid spent on RBA compared to the counterfactual of providing that aid to education
by a more traditional instrument (e.g. SBS). The VfM model presents two versions of test B. B1
uses the benefits derived from the number of ‘extra completers’ (the figure upon which the RBA
design pays out upon). In 2013 this was 16,631 completers, split between S3 and S6. B2 uses the
econometric model to estimate the number of ‘additional completers’ (the statistically SIGNIFICANT
level of change). In 2013 this was 10,608 ‘additional sitters’, all at S3.80
The overall VfM of RBA is considered as:
VFM = A+B
Option A represents benefits associated with the education received in 2013. The model assumes
that aid contributes a portion of the benefits of total education expenditure in that year, and that
portion is equivalent to the share of expenditure the aid represents. RBA constituted 0.42 per cent of
total education expenditure in 2013, so 0.42 per cent of the benefits modeled are assumed to be
due to that aid. These benefits are offset by the cost of the aid provided.
Option B represents benefits associated with subsequent years of education (2014, 2015 and
beyond) due to the fact that additional students have completed P6, S3, S6 and therefore,
theoretically, progress. The costs in option B include those associated with the additional years of
education; public and private costs of educating the additional students; and the additional
verification and evaluation costs associated with RBA.
The variable of most interest in considering RBA as opposed to other aid modalities is B, as this could
be taken as the narrower test of the hypothesis - that RBA functions through an incentive effect that is
not present in other forms of aid.81
The VfM models were built using existing data on the Rwandan education system, with the key
VARIABLES being the rate of drop-out, the rate of repetition and the rate of progression between
grades. This was used to calculate when individuals would finish their education – including in what
year, how old they are, and how many years of education they would have received at that point in
time. This information was combined with data on economic returns in terms of wage rates for
different amounts of education. The models then assess returns over time (until these individuals are
predicted to leave the labour market).
3.4.3 The VfM findings
The VfM models demonstrate the PRESENT VALUE (PV) of the benefits and costs generated from aid to
education disbursed by RBA in Rwanda in 2013. The high level results are presented in Table 15.82
Additional notes to guide interpretation of the findings are set out in Box 12. Summary results are:
80
Note: The benefits suggested will only accrue if a causal link between additional completion and RBA can be demonstrated. This requires interpretation of findings in conjunction with other strands of the research. 81
For example, while SBS is usually disbursed regardless of results, as a PbR mechanism RBA is only paid if certain results are achieved. The assumption that RBA provides something additional to SBS through an incentive, or other, forms the hypothesis tested by the econometric model. Model B2 can only provide a positive benefit if the econometric model finds positive results. 82
This includes the cost of disbursed aid for 2013, £1.9 million for test A; the cost of verification in 2013, £90,000 for test B; and a third of the cost of the three-year evaluation of the RBA pilot, £144,000.

P0 6084 Evaluation of Results Based Aid in Rwandan Education – Year Two Evaluation Report
44
Test A: The overall results for Test A found the PV of benefits to be £14 million GBP, with the PV
of costs simply the £1.9 million GBP disbursed in RBA in 2013. This implies a NPV of £12.1
million GBP, and a benefit-cost ratio of 7.4. This suggests that aid to education does
provide overall VfM, even when significantly discounting future returns to education.83
Test B1: The overall results for test B1 found very large benefits, with the c.13,000 extra
completers at S3 and over 3,000 extra completers at S6 generating a PV of benefits of over £160
million GBP. This was offset against the additional costs of this education from both public and
private sources (estimated at over £30 million GBP), as well as the relatively small evaluation
and verification costs associated with RBA. This generated a NPV for test B1 of £133 million
GBP, with a benefit-cost ratio of 5.3. While built on a large number of assumptions, these
returns suggest that RBA would be very good VfM if these completers are viewed as additional
i.e. if the RBA mechanism was considered to have generated this additional completion. For test
B1, which considers the absolute number of additional completers (the figure against which the
RBA payment is made), this is not likely to be particularly robust.
Test B2: The overall findings for test B2 (the test using the findings of the econometric model)
were that the PV of benefits generated by the 10,608 additional completers at S3 (see section
3.2.2) came to over £107 million GBP. This was offset against the estimated £20 million GBP of
costs that their projected additional years of education will accrue, as well as the verification and
evaluation costs for RBA. This generated a NPV of £87 million GBP, and a benefit-cost ratio
of 5.2. This is a smaller NPV than for test B1, but is much more robust, as the numbers are
built from the econometric modelling which was designed to calculate the extent to which
increased completion could be viewed as ‘additional’. Once again it follows that if this
additional completion is attributable to RBA (a more plausible scenario than that of test B1), then
RBA would represent excellent VfM.
Combining the two models gives an overall assessment of the potential VfM of RBA, with a benefit-
cost ratio above 5 for both A+B1 and A+B2, and a NET PRESENT VALUE of £144 million GBP and £99
million GBP for the two combinations respectively.
Sensitivity tests change the magnitude of such effects, but the positive VfM conclusion is left
unchanged by altering the rates of return to education, the discount rate and real wage growth.
Assumptions, such as transition rates and quality of education remaining stable are important (see
Box 11 and Annex 6).
In reality this discussion is academic as, by the criteria defined, VfM can only really be argued to have
been achieved if both the quantitative and qualitative evidence was to corroborate the view that
‘additional completion’ (i.e. that detected by the econometric model) was attributable to RBA, or
indeed that RBA had been a contributing factor. In this year two evaluation, this is not the case. While
RBA is seen to have reinforced GoR efforts, the combined evidence base does not suggest that
completion outcomes would have been different in the absence of RBA. Nevertheless, the fact
remains that aid to the Rwandan education sector represents good value for money overall;
DFIDs investment, whether via RBA or SBS appears sound.
83
The estimates are based on the idea that this aid pays for 0.42 per cent of the benefits measured in the model, i.e. the percentage that the aid itself represents.

P0 6084 Evaluation of Results Based Aid in Rwandan Education – Year Two Evaluation Report
45
Table 15 - Summary of results from VfM assessment of RBA for 2013 (GBP million)
PV benefits PV costs NPV B-C ratio
Test A (VfM of aid to education)
Benefits attributable to the 2013 year of education 14.0
RBA disbursed in 2013
1.9
Overall NPV for test A 14.0 1.9 12.1 7.4
Test B1 (VfM of RBA compared to SBS, assuming ‘extra’ sitters to be attributable to RBA)
Benefits from extra sitters: P6 - -
Benefits from extra sitters: S3 132.8 25.1 107.7 5.3
Benefits from extra sitters: S6 30.1 5.4 24.7 5.6
Evaluation costs and verification costs
0.2
Overall NPV for test B1 162.9 30.7 132.2 5.3
Test B2 (VfM of RBA compared to SBS, assuming econometrically-modelled ‘additional’ sitters are attributable to RBA)
Benefits from additional sitters: P6 - -
Benefits from additional sitters: S3 107.2 20.2 87.0 5.3
Benefits from additional sitters: S6 - -
Evaluation costs and verification costs
0.2
Overall NPV for test B2 107.2 20.5 86.7 5.2
Tests A and B combined
Overall A+B1 176.9 32.5 144.4 5.4
Overall A+B2 121.2 22.3 98.9 5.4
Note: Slight discrepancies in Table 15 are due to rounding.
Box 11 - Additional notes on VfM modelling
Sensitivity analysis found that estimated returns remained significant and positive even when a
number of assumptions (the discount rate, drop-out rate, transition rate, rates of return and real
wage growth) were made more stringent. The lowest value of NPV for models A, B1 and B2 within
the sensitivity analysis were £3 million, £40 million, and £26 million respectively.
The underlying assumption of relatively constant educational quality was not firmly investigated
given the difficulty of doing so (beyond simply assuming lower rates of return on education).
Much of the assumed benefit in the model is derived from the implied extra years of schooling over
and above the incentivised year. If extra schooling for additional completers was found to be lower
than for other students – i.e. ‘additional completers’ were subsequently more likely to drop-out than
other students - then the size of the benefits would fall. This will be explored further in year three
when data on continued progression (or drop-out) for the 2013 S3 cohort will be available.
VfM analysis sought to estimate potential non-economic benefits as a result of additional years in
education. Research literature points to non-economic benefits including reduced health inequalities
reduced child mortality and increased citizen engagement (DFID, 2013b). Due to data availability,
the analysis focused on child mortality. Making a variety of assumptions, the number of additional
S3 sitters in 2013 (Test B) could lead to around 150 more under-5 year-olds surviving in coming
years due to the effect of maternal education on reducing the child mortality rate. This estimate
should be treated with caution due the number of assumptions involved.
The essence of the assumptions made by the VfM models are that current trends will continue into
the future. In reality change can be discontinuous. With respect to RBA it is very important to note
the central assumption that RBA itself does not represent a discontinuity – i.e. RBA does not change
behaviour around other aspects of the system that would impact on educational outcomes. This is
particularly relevant with respect to the quality of education, which is likely to be the main underlying
driver of economic and non-economic returns to education.

P0 6084 Evaluation of Results Based Aid in Rwandan Education – Year Two Evaluation Report
46
4 Conclusions and (interim) lessons learned 4.1 Introduction
This chapter provides a synthesis of the evaluation’s key findings in relation to impact and process-
related questions. The evidence is considered in relation to the deduced theory of change for RBA in
Rwandan education (Upper Quartile, 2014) and alternative views posed by the Center for Global
Development (CGD) with the aim of generating ‘lessons learned’ to inform future iterations of RBA in
Rwanda and elsewhere.
4.2 Conclusions of the year two evaluation
4.2.1 Completion
In the second year of the RBA pilot (2013) GoR achieved SIGNIFICANTLY above trend completion at the
S3 level. This was true for both male and female students at S3. Quantitative analysis linked this
improvement to increased access, increased retention (in particular the remarkable improvement in
converting S3 enrolees to S3 completers in 2013) and improved transition (an increase in the
number of S2 enrolees who went on to S3 in 2012) [evaluation finding 2]. This positive improvement was
not replicated at P6 and S6 where completion was either negligibly or SIGNIFICANTLY below trend [evaluation finding 1].
Are these RBA effects? In years one and two of the evaluation it has not been possible to link RBA
to any specific actions of GoR or to any change in implementation approaches at district and school-
level. Completion was a long-standing priority for GoR as reflected in the ESSP, and RBA indicators
were purposefully aligned with this. RBA has supported the existing agenda within GoR, reinforcing
decision-making processes and providing encouragement and endorsement for the drive to achieve
completion; a drive that pre-dates RBA. This drive is evident across a range of programmes and
approaches at district and school level, for example through school and cross-community action to
reduce drop-out; automatic progression and a cap on repetition; continued development of
infrastructure and school-feeding [evaluation finding 3].
In 2013, success at S3 (the grade with the highest RBA tariff) was achieved at a level that has not
been seen in previous years. From this it could be inferred that RBA successfully reinforced GoR’s
own agenda. There is however no evidence that this would not also have been achieved in the
absence of RBA; we cannot confirm any additional benefit as a result of RBA and it is perfectly
plausible that the combined efforts of GoR on many fronts within the education sector is responsible
for the increase (and that this has no relation to RBA). This issue will be taken up again in year three
of the evaluation.
So why has RBA not provided an incentive for additional action to date? The deduced ToC for
RBA in Rwandan education (restated at Figure 9 below) hypothesises that the RBA pilot, through an
incentive not present in other forms of aid, will elicit a ‘response’ from GoR to achieve RBA results.
This ‘response’ (be it a change in strategic priorities, policy or programme reform, enhanced
messaging or another action or behaviour change) will be communicated explicitly or implicitly by
GoR to districts and then on to schools with the aim of achieving RBA results.
This ToC is premised on the principal-agent model (see Clist and Verschoor, 2014)84
but also chimes
with elements of alternative ToCs posed by Perakis and Savedoff (2015)85
. In the deduced ToC the
impact sought is “improved completion as a result of improving outcomes along some or all elements
of the RESP results chain”.86
The principle of recipient discretion is applicable in the ToC and, as
such, there are no assumptions or stipulations about how results may be achieved.
84
An alternative theory of increased attention upon the measured results, proposed by Perakis and Savedoff (2015), would work in a similar way. 85
ToCs 1, 2 and 4 (see Appendix 2) all infer some form of additional or complementary action or response by Government as
a result of RBA. 86
Note: English language proficiency was not included in this deduced TOC due to the lesser focus put on this by DFID in the early stages of the evaluation.

P0 6084 Evaluation of Results Based Aid in Rwandan Education – Year Two Evaluation Report
47
Figure 9 – Deduced theory of change for RBA in Rwandan education (restated from Figure 1)
At the national level of the theory of change, the evidence in year two is that RBA has not triggered a
specific or additional response from GoR; the view of GoR stakeholders is that activity has followed
the same course as it would have in the absence of RBA. This is mainly due to the alignment of RBA
results with pre-existing GoR priorities. This alignment was intended by DFID and was clearly
incorporated into the RBA design phase. It cannot therefore be said (at this stage of the evaluation)
that RBA has provided an incentive to GoR to work differently or to focus further attention on
completion in order to achieve results. Indeed, the evidence suggests that the GoR is doing what it
can, through its existing management processes and drive, to increase completion.
This is in agreement with the situation described by Clist and Dercon (2014) whereby close alignment
between principal and agent removes the benefit of additional incentivisation. Furthermore, in the
case of the RBA pilot in Rwanda, the level of financial incentive is perceived as small and has been
submerged in the budgeting process. This further appears to work against RBA’s effectiveness as an
incentive for additional action [evaluation finding 9].
The lack of effect observed at the national level of the ToC essentially ‘breaks the chain’ of the
deduced theory of change. Nevertheless the year two research followed the remainder of the links to
understand how and why messaging on completion was communicated from the ‘centre’, down
through the education system to district and school level. This was considered important to gain key
learning for future RBA pilots in Rwanda and elsewhere and to address the other evaluation questions
that have been set by DFID.
Through this process the evaluation found that Rwanda’s imihigo system has been used by GOR to
mainstream messages and incentivise action to promote completion (through targets to reduce drop-
out and repetition) at district and school level [evaluation finding 10]. Imihigo is considered a relatively
strong and functioning management control system and it has been effective in this context. This
assumption of the deduced ToC is hence accepted.
An emerging lesson for future RBA pilots may be the requirement for sufficient management controls
at different levels of the system as a facilitator of success (or the time and incentives to successfully
create them). However, the evaluation has also highlighted that Rwanda was a results-oriented
country prior to RBA and there is no evidence that GoR’s approach has been altered as a result of
RBA [evaluation finding 8]. It is unclear, from the evidence available, how RBA may or may not function
in a country that was less results oriented to start with.

P0 6084 Evaluation of Results Based Aid in Rwandan Education – Year Two Evaluation Report
48
In addition to considering the effectiveness of RBA as an incentive (in a stand-alone sense), the
evaluation also sought to identify the external factors which affect completion and which may
therefore facilitate or inhibit the functioning of RBA. Year two findings, in line with those of year one,
demonstrated that the factors affecting completion are multiple and complex. For example, repetition
in early grades impacts on completion at P6; and district-level and demographic characteristics
(wealth, gender, teachers’ gender, literacy and ‘in-school’ problems) are strong predictors of
completion. Addressing such issues requires long-term intervention and investment in, and beyond,
the education sector [evaluation findings 4, 5 and 6]. There is a limit to what it is possible to achieve within
the timescale of the current RBA agreement.
Figure 10 assembles the evidence base against the deduced ToC.
Figure 10: Evidence confirming or rejecting the deduced ToC
ToC ELEMENTS THE EMERGING EVIDENCE
CRITICAL ASSUMPTIONS
(a). The incentive effect of RBA (be this financial or another incentive) is sufficient to elicit a response.
NOT ACCEPTED: Features of the way in which RBA funds are
handled in Rwanda appear to act against the effectiveness of the
financial incentive (the most commonly accepted incentive for
PbR programmes (Clist & Verschoor, 2014). It is possible (there is
limited evidence) to suggest that the value placed by GoR on
DFID support (financial and technical) acts as an incentive to
GoR. There is no evidence that the RBA modality has changed
‘aid relations’ in this context per se.
(b). Management control and accountability mechanisms are strong enough to ensure compliance with GoR messaging at different levels of the education system.
ACCEPTED: The Imihigo system has proven effective in
mainstreaming completion (through targets to reduce drop-out
and repetition) into the priorities of district and school level
officials. Where the system falters, due to lack of oversight,
resource constraints are the main issue (‘implementation’ rather
than ‘theory’ failure)
(c). Sufficient time and resource is available to allow GoR to address underlying issues impacting RBA results.
PARTIALLY ACCEPTED: Econometric modelling and qualitative
research suggests that wider and deep-rooted factors may limit
continued completion gains or ‘quick wins’. Such factors take time
to adjust. This may not be possible within the RBA timescale.
The RBA pilot elicits a response from GOR to achieve RBA results.
GOR’s response is communicated explicitly or implicitly to districts and then on to schools with the aim of achieving RBA results.
NATIONAL LEVEL
DISTRICT AND SCHOOL LEVEL
NATIONAL LEVEL
NO EVIDENCE: RBA has not elicited a specific response from GoR
to increase completion. Completion was a long-standing priority for
GoR and there is no evidence that their approach has changed as a
result of RBA
DISTRICT AND SCHOOL LEVEL
SOME EVIDENCE: GoR has continued to pursue the pre-existing
priority of completion through programmes and approaches which are not directly related to RBA. In terms of the communication process however, the ToC is perceived to hold true. GoR has communicated explicit and implicit messages down through the system to districts and schools as theorised.

P0 6084 Evaluation of Results Based Aid in Rwandan Education – Year Two Evaluation Report
49
The foregoing discussion has considered RBA in isolation. However, RBA is not a stand-alone
modality; it is embedded within DFID’s wider Rwanda Education Sector Programme (RESP). Within
the RESP ToC (see Figure 2 in Chapter 2) RBA sits above level three outcomes87
and is intended to
contribute to the overarching goal of creating a “knowledge-based and skilled economy able to
compete with regional and international markets” (impact level).
As discussed previously, the RBA indicator of completion is considered by some as a proxy for
learning outcomes. The evaluation has questioned the validity of this measure and hence the value of
incentivising completion as a means to achieve DFID’s goal. The tentative lesson is that unless the
measure is able to accurately capture something which is valuable in and of itself, there are
potentially negative distortionary effects which will be difficult to observe. For valid reasons learning
outcomes were not considered feasible as the RBA indicator at the time the RBA programme was
developed. As Chapter 5 discusses, this may not be the case for future iterations of RBA in Rwanda.
4.2.2 Teachers’ proficiency in English
Similar to findings on completion, English language proficiency (and the School Based Mentor
Programme as the major vehicle of implementation) was already on GoR’s agenda prior to the
conceptualisation of RBA. In contrast however, English as an RBA indicator was included in the MoU
at the insistence of GoR, and against the initial wishes of DFID. Again, RBA can be understood in
terms of reinforcing and supporting GoR’s pre-existing priorities and approaches, as opposed to
setting or changing the agenda.
The baseline survey of English language proficiency undertaken in 2012 presented a negative picture
of progress which appears to have shocked both GoR and the NGO community. This resulted in
intensification of attention on indicators of language proficiency and increased focus on the need for
action [evaluation finding 11]. Action on English language has since taken place on two fronts; continued
roll-out of the SBMP and development of a new national strategy for Teachers’ In-Service Training to
support English as the Medium of Instruction (EMI).
In this case RBA appears to have pushed English language proficiency up the agenda, and made
improvement in this area of greater concern. This in turn is considered to have opened the space for
dialogue and development of a future approach to EMI.
While it is too early to make conclusive statements, the emerging evidence base on English language
proficiency resonates to some extent with Perakis and Savedoff (2015). In their analysis, Perakis and
Savedoff propose that funding linked to Outcomes may increase the attention granted by politicians
and bureaucrats on the drive to achieve particular results and that this will encourage them to manage
things differently than they otherwise would.
This evaluation has presented some evidence that by making results visible (via the baseline survey),
RBA prompted action (intensified attention on indicators of EL proficiency and the need for policy
action).
That is not to say that this would not have been achieved in the absence of RBA – there is not enough
evidence to either confirm or reject this statement. RBA can however be considered a catalyst in the
process.
In relation to the other theories of change posed by Perakis and Savedoff (2015), the evaluation to
date has found no evidence to validate these theories in Rwanda. An analysis table is presented in
Appendix 2.
4.2.3 Conclusions on the theory of change
Considering the conclusions presented in section 4.2 in the round, what can be said about the
functioning of RBA in Rwanda in relation to the simplified hypothesis of the deduced theory of change
87 RESP level three outcomes are ‘increased number of students successfully completing 12YBE’; and ‘improved and equitable learning outcomes at key stages’.

P0 6084 Evaluation of Results Based Aid in Rwandan Education – Year Two Evaluation Report
50
- that RBA via an incentive effect not present in other forms of aid will elicit a response from GoR to
achieve results.
In relation to completion, at this year two evaluation stage, the hypothesis cannot be confirmed. The
evidence points to a situation in which GoR priorities are aligned with RBA and where GoR priorities
and actions have influenced results (with a significant increase in completion at S3 observed in 2013).
RBA was implemented concurrently, supporting the drive to achieve completion. It is likely that similar
results would have been achieved in the absence of RBA.
In relation to English, the inclusion of English language proficiency as an RBA result was at the
insistence of GoR; in this case the specific RBA indicator was very much determined by GoR priorities
and GOR priorities and actions (i.e. the roll out of the SBMP) have attempted to influence results.
However, it is also suggested that RBA, as a result of highlighting deficiencies in English language
proficiency, focused the attention of GoR and catalysed action (i.e. events culminating the new EMI
strategy) in an attempt to improve future results. The impact of these activities are still to be
determined.
When it comes to teasing out linkages between GoR/RBA goals and GoR actions, the ‘post hoc ergo
propter hoc’ fallacy is worth considering: just because A preceded B does not mean A caused B.
The RBA measures were undoubtedly influenced by pre-existing GoR priorities, either lightly (in the
case of completion) or heavily (in the case of English). A naïve observer could conclude that any
progress against these measures was simply due to them being GoR priority rather than any RBA
effect. This is clearly unsatisfactory as policy priorities change and implementation may in turn be
influenced by the RBA agreement (something the evaluation will again investigate in year three).
Rather, there are several possible interactions between GoR priorities, RBA goals and GoR
implementation.
In the Perakis and Savedoff (2015) view of RBA, the main mechanism for change is through attention
and information. In this case, it may be that the GoR priority influenced the adoption of specific RBA
goals, with the information then, in turn, influencing GoR policy and implementation. This resonates
with emerging findings on English language proficiency, where the measure was included at GoR’s
behest, but the information was surprising and the information signal was met with increased
attention.
In the case of completion, while RBA’s existence and performance at S3 in 2013 are correlated, the
most likely explanation is that both were influenced by pre-existing GoR priorities. It is unclear (to all
stakeholders) which specific actions are responsible for success at S3, but there is little doubt that
success was not specifically related to RBA. Both the RBA measure and the S3 success were caused
by a common source i.e. GoR priority.
4.3 Interim lessons learned
Concrete answers to this evaluation question will only emerge in year three, the final year of the
evaluation, when detailed cumulative findings from across all research strands are collated and
analysed. At this stage the points below should be viewed as tentative emerging lessons or
observations to inform, and be further explored through, the year three research.
Emerging lesson 1: Alignment of RBA with pre-existing government priorities may
remove/reduce the potential incentive for additional action to achieve results.
Emerging lesson 2: Where the financial incentive is perceived as small, transient and/or where
it is not visible at the operational level, this may remove/reduce the potential incentive for
additional action to achieve results.
Emerging lesson 3: The existence (or implementation) of sufficient management controls and
accountability mechanisms to ensure communication, compliance and action on policy priorities
set by the ‘centre’ will facilitate success.

P0 6084 Evaluation of Results Based Aid in Rwandan Education – Year Two Evaluation Report
51
Emerging lesson 4: For RBA to be a useful modality in measuring progress towards the
outcome sought, ‘results’ must be as close as possible to that outcome.
5 Recommendations
As the RBA agreement will expire soon (at present no payment is contingent upon 2015
performance), the evaluation team are making tentative recommendations to DFID-R, on the basis of
the evidence presented, to inform their future decision making on the RBA agreement. Four main
options for the programme are considered:
Option 1: Maintain the status quo and extend RBA in its current form with tariffs and details
remaining constant;
Option 2: Scale-up the existing RBA agreement in terms of time and/or financial incentive in
order to overcome perceived inhibitors to effectiveness (specifically the small scale and transient
nature of the programme);
Option 3: Inclusion of an indicator on learning outcomes as a means of testing RBA in
relation to the desired outcome of the education system. This may be included in the programme
alongside or instead of the existing indicator on completion;
Option 4: Shift the focus of the RBA programme towards incentivising improvement in
English language proficiency, the area in which RBA appears to have gained some traction to
date.
The options are presented in Figure 11. Several other options may also be sensible to consider.
These include stopping RBA altogether, replacing the current SBS+RBA strategy with an ‘all RBA’
approach and rebranding RBA as part of a variable tranche of SBS.
At this stage, on the basis of the evidence available, the recommendation of the evaluators is that
a revised programme reflecting a combination of options 3 and 4 (Figure 11) be developed and
piloted.

P0 6084 Evaluation of Results Based Aid in Rwandan Education – Year Two Evaluation Report
52
Figure 11 – Options for the RBA agreement in Rwanda going forward (tentative)
OPTION 1: Status Quo
To date there is no conclusive evidence that RBA has improved completion - no ‘additional’ completion in 5 out of 6 indicators and no clear link to RBA to explain the increase at S3 in 2013.
Evidence that the specifics of the RBA agreement are little known and poorly understood, even at higher levels of GoR.
RBA is perceived as small.
The current time horizon is not sufficient to allow true innovation or structural change, possibly reinforcing some of the detrimental effects of focusing on completion (see for example ICAI, 2012).
Given the influence of DFID-R in key policy discussions, the value added of RBA so far, over and above SBS, is unclear.
OPTION 2: Scale-up the existing programme
Increasing the money available may overcome the perception that RBA is small and generate a larger response from GoR. However, there is no evidence that more money would increase the response (i.e. this cannot be confirmed by the qualitative research). Also, the possibility of distortion (inherent within RBA programmes) should not be ignored if consideration is given to greater financial incentives (it is noted that there are already some negative perceptions around the push for completion at district and school level).
Another way to increase the saliency of RBA may be to agree it over a longer time horizon. This may be sensible given the likely time horizon required to meet ESSP/ RESP goals of a more highly skilled population, and the time needed to try different approaches.
Pragmatically, it may difficult for DFID to agree contracts that span multiple spending reviews. If this option was considered DFID may consider a longer contract with a mid-way break point.
OPTION 3: Inclusion of an indicator on learning outcomes
In its current form RBA has potential to reinforce a focus on completion at the possible detriment of learning goals (ICAI, 2012, Pritchett, 2013). Although at present there is no evidence that this is the case.
While unfeasible in 2012, inclusion of a measure of learning outcomes is now a possibility. Indeed there are several options and these should be investigated early in the process if DFID were to consider this option (e.g. a DFID instigated measure, the Learning Assessment in Rwandan Schools (LARS) supported by UNICEF; or the Early Grade Reading/ Mathematics Assessment (EGRA/ EGMA) supported by USAID).
While a learning measure addresses many of the potential problems that are apparent with the completion measure (as it is closer to the desired outcome), it does not sidestep the issue of time horizon. As such, if this option were considered, the evaluators would also recommend that a longer time-horizon is sought (see option 2).
OPTION 4: Shift the focus of the RBA programme
This may appear a surprising recommendation given that teacher’s proficiency in English was introduced to the RBA agreement at the behest of the GoR, and that it is not strictly an ‘outcome’ (as inferred in DFID’s PbR strategy).
However, the evaluators feel that this is a potential option for a number of reasons:
This is an area in which RBA appears to have made a contribution to date (i.e. there is evidence that RBA resulted in increased ‘attention’ of GoR in the drive to achieve results).
Teacher’s proficiency in English is a necessary, if not sufficient, condition to improve educational quality and hence learning outcomes. It could therefore be considered an ‘intermediate outcome’.
This is a contested policy area where hard data is likely to be of use. Work undertaken in Rwanda already has highlighted the lack of evidence over what works in this area. Visible data will provide useful insight.
The outcome can sensibly be expected to alter within the short time horizon which is, pragmatically, a constraint for DFID-R.

P0 6084 Evaluation of Results Based Aid in Rwandan Education – Year Two Evaluation Report
53
Bibliography Andrews, M. (2013) The Limits of Institutional Reform in Development. Cambridge University Press:
Cambridge.
Center for Global Development (2014) 12 Principles for Payment by Results (PbR) in the real world,
available at: http://www.cgdev.org/blog/12-principles-payment-results-pbr-real-world-0.
Clist, P. & Dercon, S. (2014) 12 Principles for Payment by Results (PbR) in International
Development, available at: http://r4d.dfid.gov.uk/pdf/outputs/Misc_Infocomm/clist-dercon-PbR.pdf.
Clist, P & Verschoor, A. (2013) The Conceptual Basis of Payment by Results. University of East
Anglia.
Clist, P., and Verschoor, A. (2014) The Conceptual Basis of Payment by Results. University of East
Anglia.
Council of Europe (undated) Common European Framework of Reference for Languages (CEFR).
Department for International Development (2011a) DFID’s Approach to Value for Money (VfM).
Department for International Development (2011b) Implementing DFID’s strengthened approach to
budget support: Technical Note.
Department for International Development (2011c) Rwanda Education Sector Programme (RESP)
2011-12 to 2014-15: Business Case, Department for International Development: London.
Department for International Development (2013a) Evaluation Handbook. Department for
International Development: London.
Department for International Development (2013b) Education Position Paper: Improving Learning,
Expanding Opportunities, Department for International Development: London.
Department for International Development (2014a) Policy Paper - Payment by Results Strategy:
Sharpening Incentives to Perform. Department for International Development: London, June 2014.
Department for International Development (2014b). Development Tracker - Rwanda Education Sector
Program [GB-1-202377] [Online]. Available at: http://devtracker.dfid.gov.uk/projects/GB-1-
202377/transactions/.
Department for International Development and the Government of Rwanda (2012). Results-Based Aid
Pilot in the Education Sector: Annex to Memorandum of Understanding. Kigali.
EMIS (2014) 2013 Education Statistical Yearbook, available at:
http://www.mineduc.gov.rw/fileadmin/user_upload/2013_Rwanda_Education_Statistics.pdf.
Euromonitor International (2010) The Benefits of the English Language for Individuals and Societies:
Quantitative Indicators from Cameroon, Nigeria, Rwanda, Bangladesh and Pakistan. A custom report
compiled by Euromonitor International for the British Council. London.
Government of Rwanda, Ministry of Education (MINEDUC) (2010a) Appraisal: Education Sector
Strategic Plan (ESSP) 2010-2015.
Government of Rwanda, Ministry of Education (MINEDUC) (2010b) Education Sector Strategic Plan
(ESSP) 2010-2015.
Government of Rwanda, Ministry of Education (MINEDUC) (2013) Education Sector Strategic Plan
(ESSP) 2013-14 to 2017-18 [Approved Draft].
HEART (2014) Independent Verification Of Educational Data For A Pilot Of Results-Based Aid (Rba)
In Rwanda: Second Annual Verification Report For Student Completion Results.
Independent Commission for Aid Impact (ICAI) (2012) DFID’s Education Programmes in Three East
African Countries.

P0 6084 Evaluation of Results Based Aid in Rwandan Education – Year Two Evaluation Report
54
IPAR-Rwanda (2014) Evaluation of Ministry and District Performance Contracts (Imihigo Evaluation)
2013-2014.
Ndaruhutse, S., Brannelly, L., Latham, M., and Penson, P. (2008) Grade repetition in primary schools
in Sub-Saharan Africa: an evidence base for change; CfBT Education Trust, Reading Berkshire.
Organisation for Economic Cooperation and Development (2005) The Paris Declaration on Aid
Effectiveness. Paris: Organisation for Economic Cooperation and Development.
Park, H. (2008) ‘The Varied Educational Effects of Parent-Child Communication: A Comparative
Study of Fourteen Countries’. Comparative Education Review 52 (2).
Pawson, R. and Tilley, N. (1997) Realistic Evaluation. London: Sage.
Perakis, R., and Savedoff, W. (2012) Payment by Results: One Size Doesn’t Fit All: Center for Global
Development (CGD) Blog, 11/20/14. Available at: http://international.cgdev.org/blog/payment-results-
one-size-doesnt-fit-all
Perakis, R., and Savedoff, W. (2015) Does Results-Based Aid Change Anything? Pecuniary Interests,
Attention, Accountability and Discretion in Four Case Studies: Center for Global Development (CGD)
Policy Paper 052, February 2015. Available at: http://www.cgdev.org/sites/default/files/CGD-Policy-
Paper-52-Perakis-Savedoff-Does-Results-Based-Aid-Change-Anything.pdf
Pritchett, L. (2013) The Rebirth of Education: Schooling Ain’t Learning, Center for Global
Development: Washington DC.
Stern, S., et al., (2012) ‘Broadening the range of designs and methods for impact evaluations’,
Department for International Development: Working Paper 38. London.
Upper Quartile (2013) Evaluation of Results Based Aid in Rwandan Education: Inception Phase
Report (unpublished).
Upper Quartile (2014) Evaluation of Results Based Aid in Rwandan Education: 2013 Evaluation
Report.
Whitty, B., (2014) Evaluation of Results Based Aid in Rwandan Education: Qualitative Research
Concept Note (unpublished).
William, J. and Somers, M. (2001) ‘Family, Classrooms and School Effects on Children’s Educational
Outcomes in Latin America’. School Effectiveness and School Improvement, 12(4): 409-445.
Williams, E. (2011) Language Policy, Politics, and Development in Africa. Dreams and Realities:
Developing Countries and the English Language. H. Coleman. London, British Council: 41 – 58.
Williams, T.P. (2013) ‘At What Cost? The untoward costs of children’s schooling in Rwanda: An in-
depth case study’, available at:
http://www.academia.edu/4355590/At_what_cost_The_untoward_costs_of_childrens_education_in_R
wanda
Wilson, J., Colquhoun, H., and Masterjerb, P. (2013). Skills Development for English as a Medium of
Instruction in Rwandan Schools. CfBT/ HEART.
World Bank (2011) Making Schools Work: New Evidence on Accountability Reforms. Washington DC.

P0 6084 Evaluation of Results Based Aid in Rwandan Education – Year Two Evaluation Report
55
APPENDICES

P0 6084 Evaluation of Results Based Aid in Rwandan Education – Year Two Evaluation Report
56
Appendix 1 – List of those consulted National level interviews
Permanent Secretary MINEDUC
Acting Director, Policy Making and Evaluation MINEDUC
Director General of Planning MINEDUC (two interviews)
Statistician EMIS Department MINEDUC
Director General Science, Technology and Research MINEDUC
Director General REB
Head of Education Quality and Standards REB
Head of Teacher Development and Management REB (two interviews)
Head of Examination and Accreditation REB
Director General National Budget MINECOFIN (two interviews)
External Resources Mobilisation Expert MINECOFIN
Director General External Financing MINECOFIN
Officer, External Financing, DFID portfolio MINECOFIN
Director General Planning M&E MINALOC
Permanent Secretary MINALOC
Chief of Party Education Development Centre
Head of Projects British Council
Basic Education Advisor USAID
Basic Education Advisor USAID
Africa Regional Advisor Girl Hub
Deputy Country Director Girl Hub
Director of Programmes Wellspring Foundation
Manager Innovation for Education Rwanda Fund
Policy and institutional adviser Innovation for Education Rwanda Fund
Education Programme Manager Plan International
Project Manager Plan International
Head of Education VSO Rwanda
District and school level interviews
Interviews District 1 District 2 District 3 District 4 Total interviews/ FDGs
V/Mayor 1 1 1 0 3
DEO 1 1 1 1 4
SEO 1 1 1 1 4
Principals 2 2 2 2 8
Mentors 0 0 2 2 4
FGD Students (7-9 per FGD) 2 2 2 2 8
FGD Parents(8 per FGD) 2 2 2 2 8
FGD Teachers (8 per FGD) 2 2 2 2 8
Community Education Officer 0 0 0 2 2
Inspector 0 0 0 1 1
Total 11 11 13 15 50

P0 6084 Evaluation of Results Based Aid in Rwandan Education – Year Two Evaluation Report
57
Appendix 2 – Alternative theories of change88
(1) Pecuniary interest (2) Attention (3) Accountability
(4) Recipient discretion (as a means of facilitating
innovation)
NO EVIDENCE IDENTIFIED
SOME EVIDENCE IDENTIFIED
NO EVIDENCE IDENTIFIED
NO EVIDENCE IDENTIFIED
No evidence has been
identified to suggest that
GoR changed its priorities
in order to pursue
payment under RBA.
DFID are clear that this
was never envisaged for
the RBA agreement in
Rwanda.
Completion:
Some evidence that RBA
supported existing
emphasis on completion
No evidence identified to
suggest ‘additional’
attention (i.e. over and
above the existing focus)
No evidence identified to
suggest that attention
elicited an ‘additional’
response from GoR in
pursuit of results.
English language:
Some evidence that
results of the EL baseline
survey (a requirement of
RBA) brought EL
deficiencies (although
widely known) sharply
into view.
Some evidence that this
visibility at the highest
levels prompted dialogue
on EL proficiency, current
approaches to developing
EL skills and the ways by
which results could be
improved.
Dialogue involving GoR,
Donors and NGOs has
resulted in development
of a new approach to
raising proficiency in EMI
The impact of activity on
indicators of EL
proficiency is still unclear.
At district and school
level, completion has
been introduced as a
priority for officials (via
targets relating to drop-
out and repetition)
included in their Imihigo.
Officials are held to
account for achievement
of these targets. Financial
(in terms of career
opportunity) and non-
financial incentives are
motivators for action.
This system pre-dates
RBA and GoR was
considered results-
oriented prior to RBA.
In the public space RBA
does not appear to have
acted as a mechanism to
increase accountability.
RBA results are not
widely publicised as a
means for civil society to
hold government to
account.
In relation to completion,
while the principle of
recipient discretion has
been applied (i.e. GoR
has chosen how to
pursue results) there is
no evidence to suggest
that GoR has adapted its
activities in response to
RBA or that there has
been additional
innovation or trialling of
new approaches to
achieve results.
Over the course of the
RBA pilot, GoR has
continued to develop its
future approach to EMI.
However, development of
the new EMI strategy was
heavily supported by
DFID (at the request of
GoR). If it is accepted
that RBA has contributed
to the new EMI approach,
ToC 2 perhaps offers a
more realistic
assessment of this
process.
RBA funds in Rwanda are
handled in such a way
that there is little
difference at the
operational level between
funds received through
RBA and those through
SBS. This is not
necessarily a problem for
the RBA pilot, the point is
simply that RBA has not
provided any additional
scope for innovation over
and above SBS.
88
Adapted from Perakis, R., and Savedoff, W. (2015)