Embed Size (px)
Citation preview
EVALUATION REPORTINDIA FINANCIAL INSTITUTIONS REFORM AND EXPANSION–DEBT AND INFRASTRUCTURE EX-POST EVALUATION WASH Ex-Post Evaluation Series—Water Communications and Knowledge Management (CKM) Project
September 2018
THIS DOCUMENT WAS PREPARED BY ECODIT LLC AND SOCIAL IMPACT, INC. FOR USAID UNDER THE WATER CKM PROJECT IDIQ NO. AID-OAA-I-14-00069; TASK ORDER NO. AID-OAA-TO-15-00046.
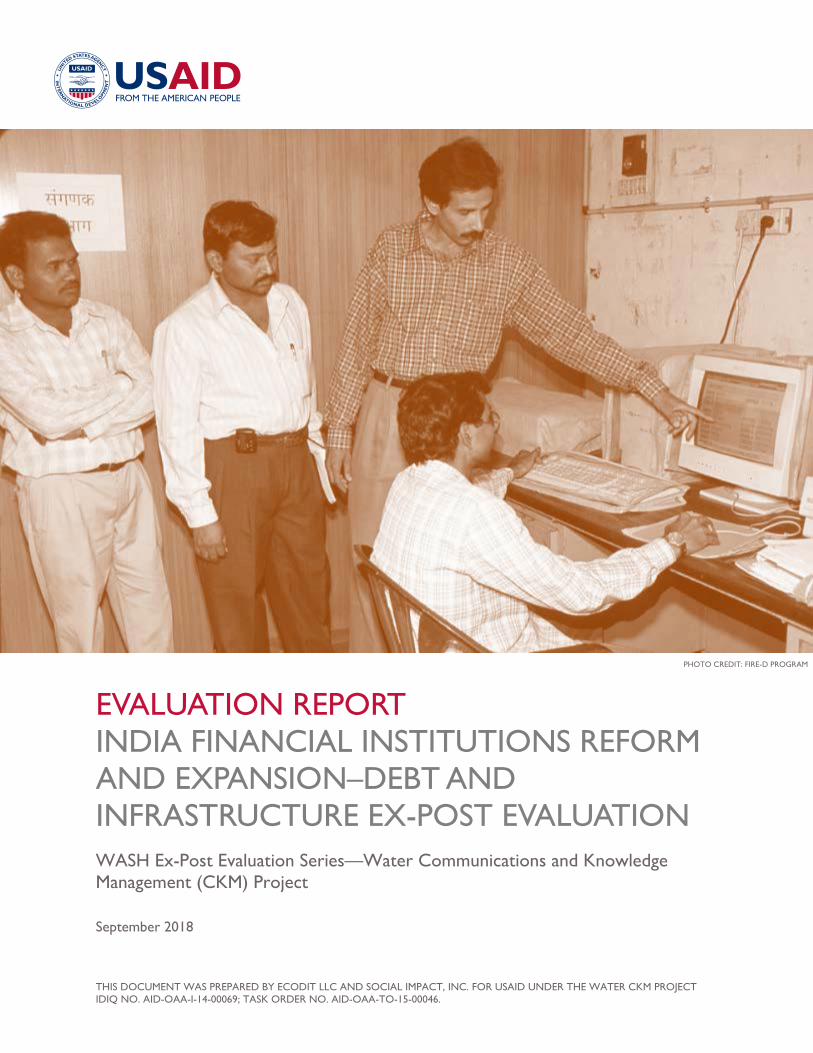
PHOTO CREDIT: FIRE-D PROGRAM
USAID.GOV E3/WATER CKM: FIRE-D EX-POST EVALUATION | i
AUTHORITY Prepared for USAID under the Water and Development Indefinite Delivery Indefinite Quantity Contract No. AID-OAA-I-14-00069, Task Order No. AID-OAA-TO-15-00046, awarded September 17, 2015, entitled “Water Communications and Knowledge Management (CKM) Project.”
This report is made possible by the support of the American people through the United States Agency for International Development (USAID). The contents of this report are the sole responsibility of ECODIT LLC and do not necessarily reflect the views of USAID or the United States Government.
This report was prepared by the Water CKM project team, comprised of ECODIT LLC and Social Impact Inc.
ACKNOWLEDGMENTS The evaluation team would like to thank the many people who generously contributed their time to provide input into both evaluation planning and the development of this report. Specifically, USAID/India colleagues Anand Rudra, Mark Peters, and RK Srinivasan as well as USAID Water, Sanitation and Hygiene Finance (WASH-FIN) colleagues Steve Sena and Sam Huston provided highly valuable local and sectoral context that improved the relevance of evaluation targets, objectives, and findings. Annette Fay contributed helpful preliminary planning support. The evaluation team is especially grateful to those who graciously agreed to give their time for interviews amid busy schedules. These people are listed in Annex C.
ii | E3/WATER CKM: FIRE-D EX-POST EVALUATION USAID.GOV
TABLE OF CONTENTS
Authority ...................................................................................................................................................................................... i
Acknowledgments .................................................................................................................................................................. ii
Acronyms .................................................................................................................................................................................... v
Executive Summary ........................................................................................................................................................... vii
Purpose and Overview ......................................................................................................................................................... vii
Design ....................................................................................................................................................................................... vii
Key Findings ............................................................................................................................................................................ viii
Key Implications and Recommendations .......................................................................................................................... xi
Introduction ............................................................................................................................................................................... 1
Project Background ................................................................................................................................................................. 1
Urban Water and Sanitation in India ................................................................................................................................... 3
Evaluation Questions ............................................................................................................................................................ 4
Methodology .............................................................................................................................................................................. 4
Sampling ...................................................................................................................................................................................... 5
Data Collection Methods ....................................................................................................................................................... 5
Analysis ....................................................................................................................................................................................... 7
Limitations ................................................................................................................................................................................. 7
Findings ........................................................................................................................................................................................ 8
Evaluation Question 1: WatSan Service Access ..................................................................................................................... 17
Evaluation Question 2: Governance, Planning, and Project Development. ...................................................................... 20
Evaluation Question 3: Financial Stability ......................................................................................................................... 27
Evaluation Question 4: Infrastructure Financing Mechanisms ..................................................................................... 31
Evaluation Question 5: Social Inclusion ............................................................................................................................ 34
Conclusions ............................................................................................................................................................................. 35
Recommendations............................................................................................................................................................... 41
Evaluation Report Annexes ............................................................................................................................................ 43
Annex A: Evaluation Inception Report ............................................................................................................................. 45
Annex B: Data Collection Tools ........................................................................................................................................ 77
Annex C: List of Respondents ............................................................................................................................................ 96
Annex D: FIRE-D Achievements at Evaluation Sites ..................................................................................................... 99
Annex E: Documents Reviewed ...................................................................................................................................... 101
USAID.GOV E3/WATER CKM: FIRE-D EX-POST EVALUATION | iii
FIGURES Figure 1. Summary of FIRE-D WatSan Access ............................................................................................................ viii Figure 2. FIRE-D Evaluation Map ....................................................................................................................................... 2 Figure 3. FIRE-D Framework Summary ........................................................................................................................... 3 Figure 4. FIRE-D and GoI Water and Sanitation Scheme Timelines ......................................................................... 4 Figure 5. Bangalore Water and Sanitation Access (data source: SAAP and SLB reports) ................................. 9 Figure 6. Bhubaneswar Water and Sanitation Access (data source: SLB reports) .............................................. 10 Figure 7. Lucknow Water and Sanitation Access (data source: SLB reports, CDP)........................................... 11 Figure 8. Tiruppur Water and Sanitation Access (data source: SLB report, SAAP) ........................................... 12 Figure 9. Pune Water and Sanitation Access (data source: Performance Assessment System) ..................... 13 Figure 10. Sangli Water and Sanitation Access (data source: Performance Assessment System) .................. 13 Figure 11. Estimated Population Growth by City ........................................................................................................ 17 Figure 12. Sangli Community Latrine Constructed with FIRE-D Support ............................................................. 27 Figure 13. Bhubaneswar Own-Source Revenue (Million INR) ................................................................................. 29 Figure 14. Bhubaneswar Own-Source Revenue (% of Total Revenue) .................................................................. 29
TABLES Table 1. Qualitative Interviews Completed .................................................................................................................... 6 Table 2. High-Level Summary of Current Evaluation Site Conditions ................................................................... 16
BOXES Box 1. Tracing the FIRE-D Thumbprint Through Government Schemes ............................................................. 20
iv | E3/WATER CKM: FIRE-D EX-POST EVALUATION USAID.GOV
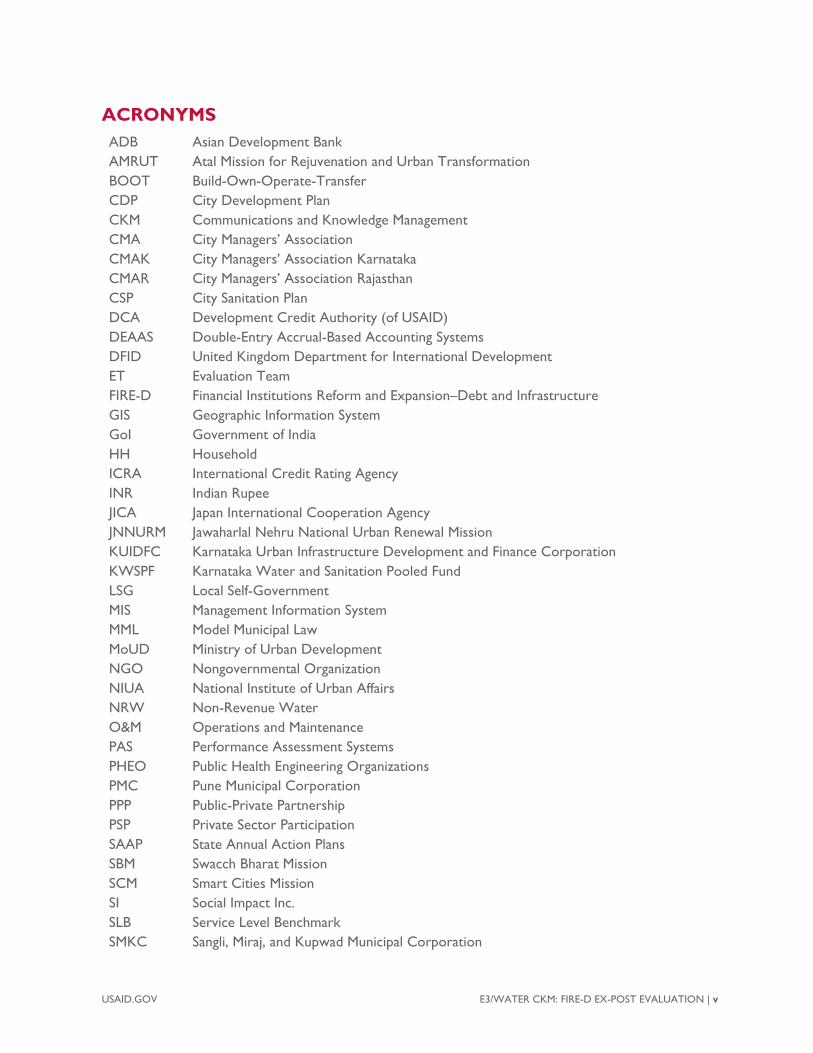
ACRONYMS ADB Asian Development Bank AMRUT Atal Mission for Rejuvenation and Urban Transformation BOOT Build-Own-Operate-Transfer CDP City Development Plan CKM Communications and Knowledge Management CMA City Managers’ Association CMAK City Managers’ Association Karnataka CMAR City Managers’ Association Rajasthan CSP City Sanitation Plan DCA Development Credit Authority (of USAID) DEAAS Double-Entry Accrual-Based Accounting Systems DFID United Kingdom Department for International Development ET Evaluation Team FIRE-D Financial Institutions Reform and Expansion–Debt and Infrastructure GIS Geographic Information System GoI Government of India HH Household ICRA International Credit Rating Agency INR Indian Rupee JICA Japan International Cooperation Agency JNNURM Jawaharlal Nehru National Urban Renewal Mission KUIDFC Karnataka Urban Infrastructure Development and Finance Corporation KWSPF Karnataka Water and Sanitation Pooled Fund LSG Local Self-Government MIS Management Information System MML Model Municipal Law MoUD Ministry of Urban Development NGO Nongovernmental Organization NIUA National Institute of Urban Affairs NRW Non-Revenue Water O&M Operations and Maintenance PAS Performance Assessment Systems PHEO Public Health Engineering Organizations PMC Pune Municipal Corporation PPP Public-Private Partnership PSP Private Sector Participation SAAP State Annual Action Plans SBM Swacch Bharat Mission SCM Smart Cities Mission SI Social Impact Inc. SLB Service Level Benchmark SMKC Sangli, Miraj, and Kupwad Municipal Corporation
USAID.GOV E3/WATER CKM: FIRE-D EX-POST EVALUATION | v
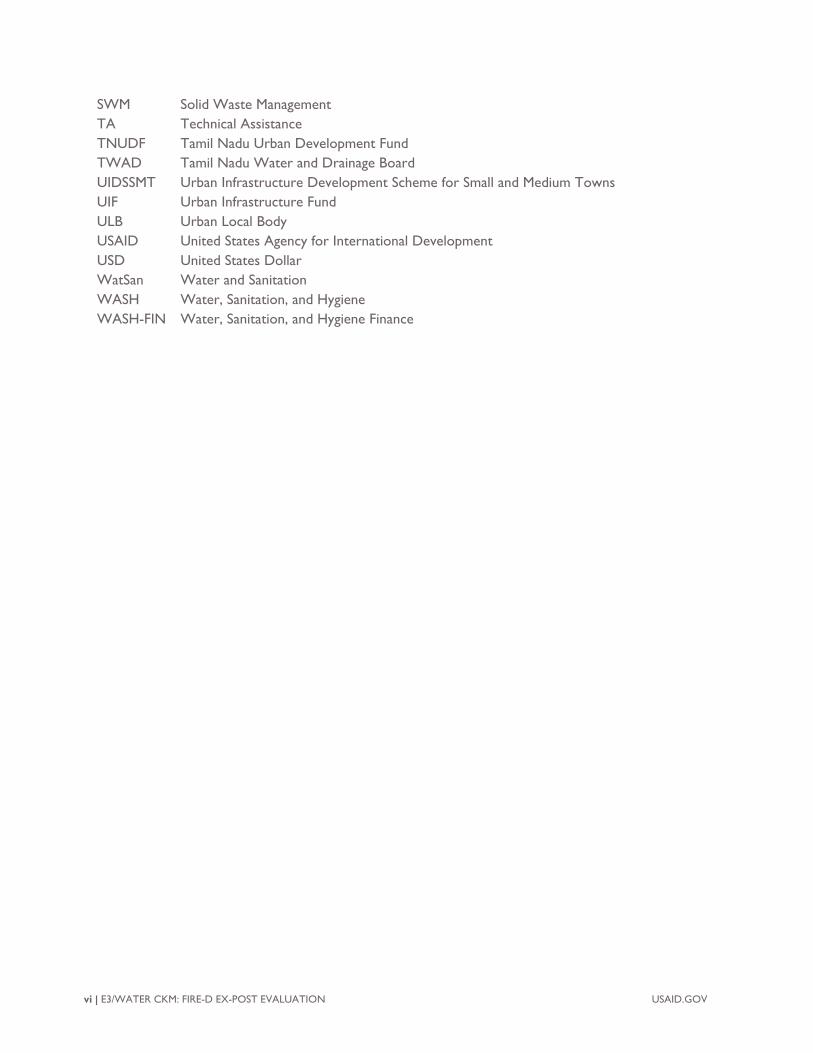
SWM Solid Waste Management TA Technical Assistance TNUDF Tamil Nadu Urban Development Fund TWAD Tamil Nadu Water and Drainage Board UIDSSMT Urban Infrastructure Development Scheme for Small and Medium Towns UIF Urban Infrastructure Fund ULB Urban Local Body USAID United States Agency for International Development USD United States Dollar WatSan Water and Sanitation WASH Water, Sanitation, and Hygiene WASH-FIN Water, Sanitation, and Hygiene Finance
vi | E3/WATER CKM: FIRE-D EX-POST EVALUATION USAID.GOV
EXECUTIVE SUMMARY
PURPOSE AND OVERVIEW
Rapid urbanization in resource-constrained countries like India places massive pressures on infrastructure, and long-term solutions are needed to meet growing safe water and sanitation (WatSan)1 demand. USAID has invested in urban WatSan activities across Asia, Africa, and the Middle East that aim to address these needs, but there is seldom opportunity to validate whether its approaches yielded sustainable outcomes. This report details findings from an ex-post evaluation that examines the long-term outcomes of USAID’s Financial Institutions Reform and Expansion–Debt and Infrastructure (FIRE-D) activity in India seven years after its close. It identifies the long-term value of various governance and financial reforms as well as efforts to expand market-based WatSan financing. These findings are meant to inform USAID activity design improvements in India and other urban water, sanitation, and hygiene contexts.
USAID funded the FIRE-D activity, implemented by TCG International, over three phases from 1994 to 2011. It partnered with India’s central, state, and city governments to “develop sustainable urban environmental services and to ensure the poor have access to those services.”2 FIRE-D provided varied technical assistance at the national level and in 16 states across India. It worked to expand WatSan access to the poor in particular by integrating their perspectives into project planning processes. The first phase (1994–1999) used the model of commercially viable infrastructure projects and private sector participation demonstration projects to develop systems of citywide infrastructure. The second phase (1999–2004) supported state-level agencies to develop important large-scale urban reforms and to institutionalize better project development practices. The third phase (2005–2011) worked on piloting infrastructure projects, financial tools, and governance reforms, which were then shared, along with lessons learned, for incorporation into a major Government of India (GoI) urban development scheme called the Jawaharlal Nehru National Urban Renewal Mission (JNNURM).3 The government subsequently overhauled and relaunched this scheme in 2015 as the Atal Mission for Rejuvenation and Urban Transformation (AMRUT). AMRUT, which adopted many of the same reform incentives as JNNURM, is presently one of the most influential funders of urban WatSan infrastructure in India.
DESIGN
This evaluation addressed five questions and four sub-questions, which are displayed with corresponding results under Key Findings below. For this ex-post evaluation, a six-person evaluation team (ET) conducted 49 key informant interviews as well as a review of government documents to collect quantitative data on WatSan access and financial stability. The team purposively selected six states and six cities where FIRE-D conducted various activities using selection criteria developed collaboratively with USAID. The sample—which includes Uttar Pradesh State and Lucknow City, Rajasthan State (no city-level activities completed), Karnataka State and Bangalore City, Odisha State and Bhubaneswar City, Maharashtra State and Pune and Sangli cities, Tamil Nadu State and Tiruppur City—represents a wide variety of contexts, FIRE-D interventions, and perceived levels of present-day success. In Delhi and across evaluation sites, ET members interviewed stakeholder groups representing national, state, and
1 Throughout this report “water” refers to piped utility water, and “sanitation” refers narrowly to sewerage and toilets. While solid waste management and drainage are typically considered components of sanitation, they did not fall within this evaluation’s scope. In cases where these components emerge in the report, they are referenced separately. 2 TCG International. 2011. FIRE-D Brochure. 3 JNNURM was a massive central government umbrella scheme that supplied grants for urban infrastructure development projects and prompted various governance and financial reforms at the state and city levels.
USAID.GOV E3/WATER CKM: FIRE-D EX-POST EVALUATION | vii
municipal government; utilities; nongovernmental organizations (NGOs) that advocate for the poor and slum dwellers; other donors; former FIRE-D implementers; and USAID.
The ET coded the qualitative data using MAXQDA software and applied thematic analysis to deductively examine themes across city, state, and national level data. The ET triangulated data across sources to ensure reliability of the findings. Several limitations influenced the results. These include incomplete and inconsistent WatSan access and budget data, recall bias, limited depth of discussions with high-level key informants, and challenges with attribution.
KEY FINDINGS
EVALUATION QUESTION 1 & 1A: In FIRE-D–supported cities, how has the level of municipal WatSan service access overall, and for the poor/informal settlement dwellers, changed since project close? Why?
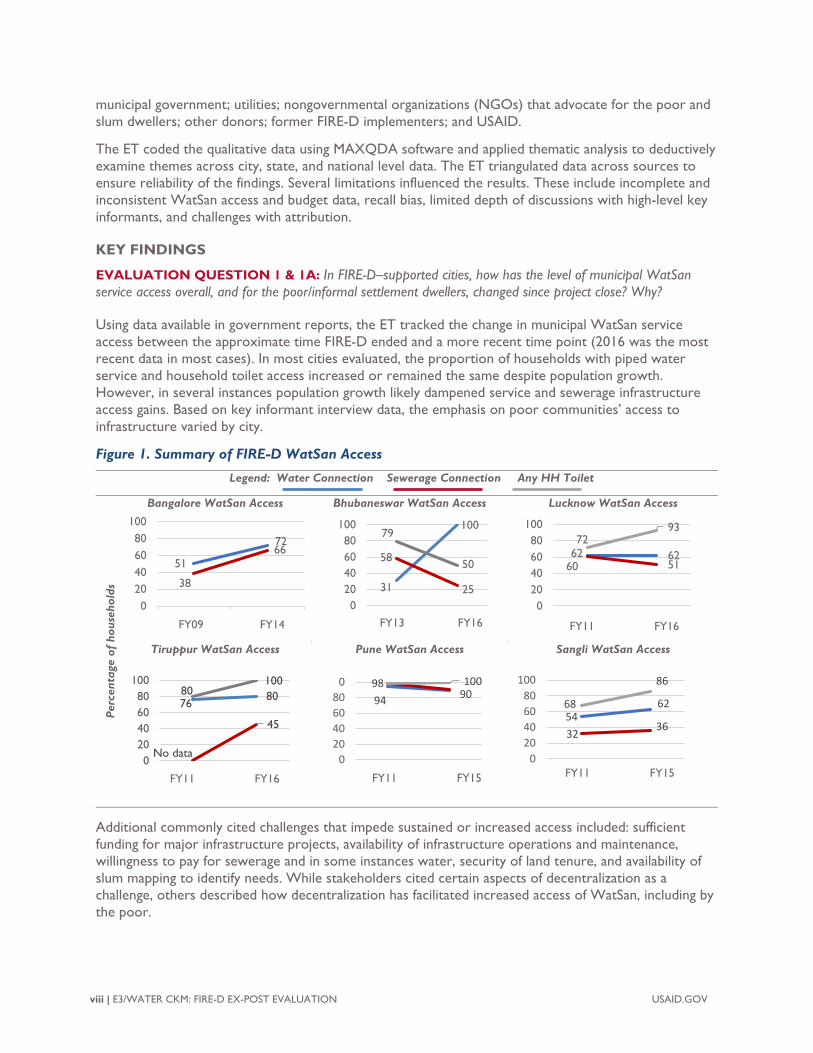
Using data available in government reports, the ET tracked the change in municipal WatSan service access between the approximate time FIRE-D ended and a more recent time point (2016 was the most recent data in most cases). In most cities evaluated, the proportion of households with piped water service and household toilet access increased or remained the same despite population growth. However, in several instances population growth likely dampened service and sewerage infrastructure access gains. Based on key informant interview data, the emphasis on poor communities’ access to infrastructure varied by city.
Figure 1. Summary of FIRE-D WatSan Access
Legend: Water Connection Sewerage Connection Any HH Toilet
Perc
enta
ge o
f ho
useh
olds
Bangalore WatSan Access Bhubaneswar WatSan Access Lucknow WatSan Access
7680
No data
45
80100
020406080
100
2014 2016
Tiruppur WatSan Access
1094 9098 100
020406080
2011-12 2015-16
0
Pune WatSan Access
5462
3236
68
86
020406080
100
Sangli WatSan Access
Additional commonly cited challenges that impede sustained or increased access included: sufficient funding for major infrastructure projects, availability of infrastructure operations and maintenance, willingness to pay for sewerage and in some instances water, security of land tenure, and availability of slum mapping to identify needs. While stakeholders cited certain aspects of decentralization as a challenge, others described how decentralization has facilitated increased access of WatSan, including by the poor.
viii | E3/WATER CKM: FIRE-D EX-POST EVALUATION USAID.GOV
51
72
38
66
020406080
100
2009 2014
31
100
58
25
79
50
020406080
100
2013 2016
62 6260 51
7293
020406080
100
2011 2016
2011-12 2015-16
FY09 FY14 FY13 FY16 FY11 FY16
FY11 FY16 FY11 FY15 FY11 FY15
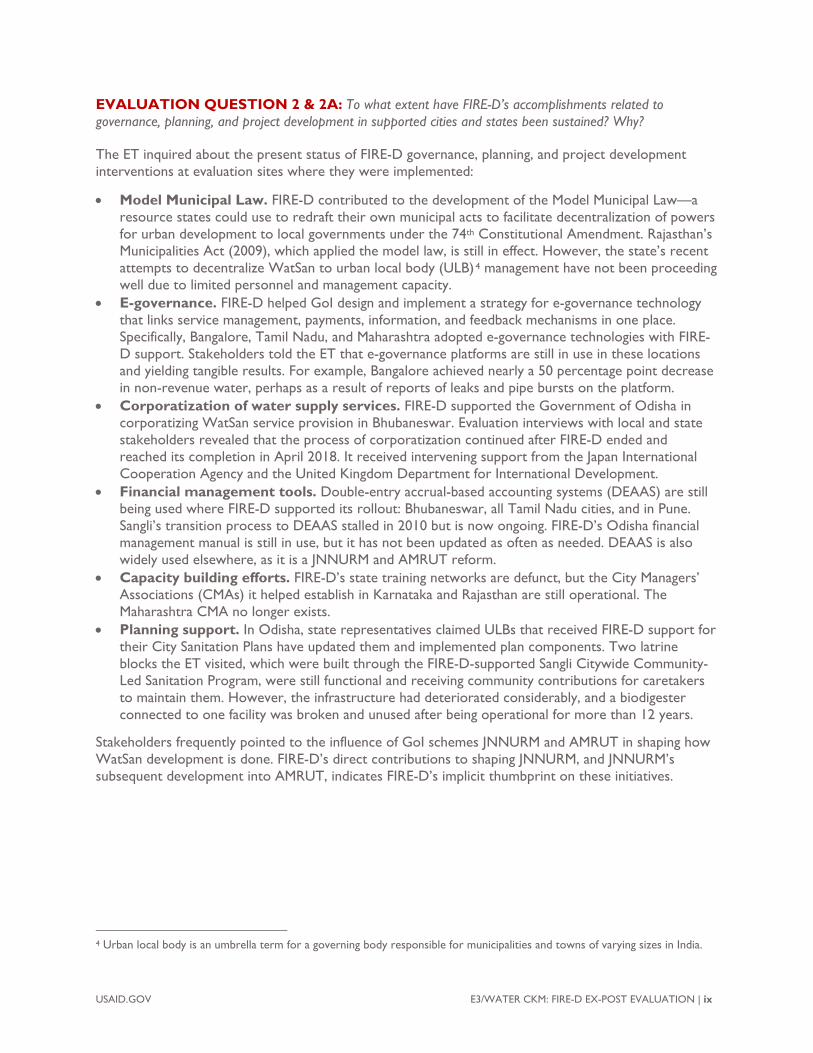
EVALUATION QUESTION 2 & 2A: To what extent have FIRE-D’s accomplishments related to governance, planning, and project development in supported cities and states been sustained? Why?
The ET inquired about the present status of FIRE-D governance, planning, and project development interventions at evaluation sites where they were implemented:
• Model Municipal Law. FIRE-D contributed to the development of the Model Municipal Law—aresource states could use to redraft their own municipal acts to facilitate decentralization of powersfor urban development to local governments under the 74th Constitutional Amendment. Rajasthan’sMunicipalities Act (2009), which applied the model law, is still in effect. However, the state’s recentattempts to decentralize WatSan to urban local body (ULB)4 management have not been proceedingwell due to limited personnel and management capacity.
• E-governance. FIRE-D helped GoI design and implement a strategy for e-governance technologythat links service management, payments, information, and feedback mechanisms in one place.Specifically, Bangalore, Tamil Nadu, and Maharashtra adopted e-governance technologies with FIRE-D support. Stakeholders told the ET that e-governance platforms are still in use in these locationsand yielding tangible results. For example, Bangalore achieved nearly a 50 percentage point decreasein non-revenue water, perhaps as a result of reports of leaks and pipe bursts on the platform.
• Corporatization of water supply services. FIRE-D supported the Government of Odisha incorporatizing WatSan service provision in Bhubaneswar. Evaluation interviews with local and statestakeholders revealed that the process of corporatization continued after FIRE-D ended andreached its completion in April 2018. It received intervening support from the Japan InternationalCooperation Agency and the United Kingdom Department for International Development.
• Financial management tools. Double-entry accrual-based accounting systems (DEAAS) are stillbeing used where FIRE-D supported its rollout: Bhubaneswar, all Tamil Nadu cities, and in Pune.Sangli’s transition process to DEAAS stalled in 2010 but is now ongoing. FIRE-D’s Odisha financialmanagement manual is still in use, but it has not been updated as often as needed. DEAAS is alsowidely used elsewhere, as it is a JNNURM and AMRUT reform.
• Capacity building efforts. FIRE-D’s state training networks are defunct, but the City Managers’Associations (CMAs) it helped establish in Karnataka and Rajasthan are still operational. TheMaharashtra CMA no longer exists.
• Planning support. In Odisha, state representatives claimed ULBs that received FIRE-D support fortheir City Sanitation Plans have updated them and implemented plan components. Two latrineblocks the ET visited, which were built through the FIRE-D-supported Sangli Citywide Community-Led Sanitation Program, were still functional and receiving community contributions for caretakersto maintain them. However, the infrastructure had deteriorated considerably, and a biodigesterconnected to one facility was broken and unused after being operational for more than 12 years.
Stakeholders frequently pointed to the influence of GoI schemes JNNURM and AMRUT in shaping how WatSan development is done. FIRE-D’s direct contributions to shaping JNNURM, and JNNURM’s subsequent development into AMRUT, indicates FIRE-D’s implicit thumbprint on these initiatives.
4 Urban local body is an umbrella term for a governing body responsible for municipalities and towns of varying sizes in India.
USAID.GOV E3/WATER CKM: FIRE-D EX-POST EVALUATION | ix
x | E3/WATER CKM: FIRE-D EX-POST EVALUATION USAID.GOV
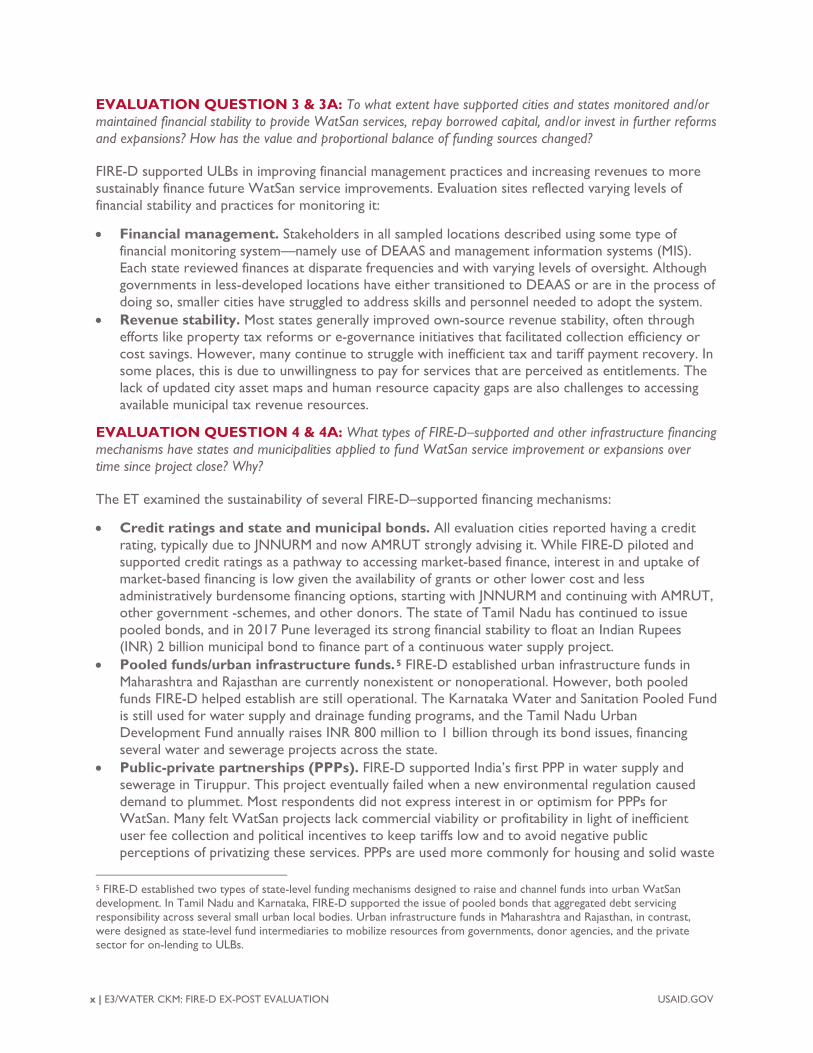
EVALUATION QUESTION 3 & 3A: To what extent have supported cities and states monitored and/or maintained financial stability to provide WatSan services, repay borrowed capital, and/or invest in further reforms and expansions? How has the value and proportional balance of funding sources changed?
FIRE-D supported ULBs in improving financial management practices and increasing revenues to more sustainably finance future WatSan service improvements. Evaluation sites reflected varying levels of financial stability and practices for monitoring it:
• Financial management. Stakeholders in all sampled locations described using some type offinancial monitoring system—namely use of DEAAS and management information systems (MIS).Each state reviewed finances at disparate frequencies and with varying levels of oversight. Althoughgovernments in less-developed locations have either transitioned to DEAAS or are in the process ofdoing so, smaller cities have struggled to address skills and personnel needed to adopt the system.
• Revenue stability. Most states generally improved own-source revenue stability, often throughefforts like property tax reforms or e-governance initiatives that facilitated collection efficiency orcost savings. However, many continue to struggle with inefficient tax and tariff payment recovery. Insome places, this is due to unwillingness to pay for services that are perceived as entitlements. Thelack of updated city asset maps and human resource capacity gaps are also challenges to accessingavailable municipal tax revenue resources.
EVALUATION QUESTION 4 & 4A: What types of FIRE-D–supported and other infrastructure financing mechanisms have states and municipalities applied to fund WatSan service improvement or expansions over time since project close? Why?
The ET examined the sustainability of several FIRE-D–supported financing mechanisms:
• Credit ratings and state and municipal bonds. All evaluation cities reported having a creditrating, typically due to JNNURM and now AMRUT strongly advising it. While FIRE-D piloted andsupported credit ratings as a pathway to accessing market-based finance, interest in and uptake ofmarket-based financing is low given the availability of grants or other lower cost and lessadministratively burdensome financing options, starting with JNNURM and continuing with AMRUT,other government -schemes, and other donors. The state of Tamil Nadu has continued to issuepooled bonds, and in 2017 Pune leveraged its strong financial stability to float an Indian Rupees(INR) 2 billion municipal bond to finance part of a continuous water supply project.
• Pooled funds/urban infrastructure funds.5 FIRE-D established urban infrastructure funds inMaharashtra and Rajasthan are currently nonexistent or nonoperational. However, both pooledfunds FIRE-D helped establish are still operational. The Karnataka Water and Sanitation Pooled Fundis still used for water supply and drainage funding programs, and the Tamil Nadu UrbanDevelopment Fund annually raises INR 800 million to 1 billion through its bond issues, financingseveral water and sewerage projects across the state.
• Public-private partnerships (PPPs). FIRE-D supported India’s first PPP in water supply andsewerage in Tiruppur. This project eventually failed when a new environmental regulation causeddemand to plummet. Most respondents did not express interest in or optimism for PPPs forWatSan. Many felt WatSan projects lack commercial viability or profitability in light of inefficientuser fee collection and political incentives to keep tariffs low and to avoid negative publicperceptions of privatizing these services. PPPs are used more commonly for housing and solid waste
5 FIRE-D established two types of state-level funding mechanisms designed to raise and channel funds into urban WatSan development. In Tamil Nadu and Karnataka, FIRE-D supported the issue of pooled bonds that aggregated debt servicing responsibility across several small urban local bodies. Urban infrastructure funds in Maharashtra and Rajasthan, in contrast, were designed as state-level fund intermediaries to mobilize resources from governments, donor agencies, and the private sector for on-lending to ULBs.
USAID.GOV E3/WATER CKM: FIRE-D EX-POST EVALUATION | xi
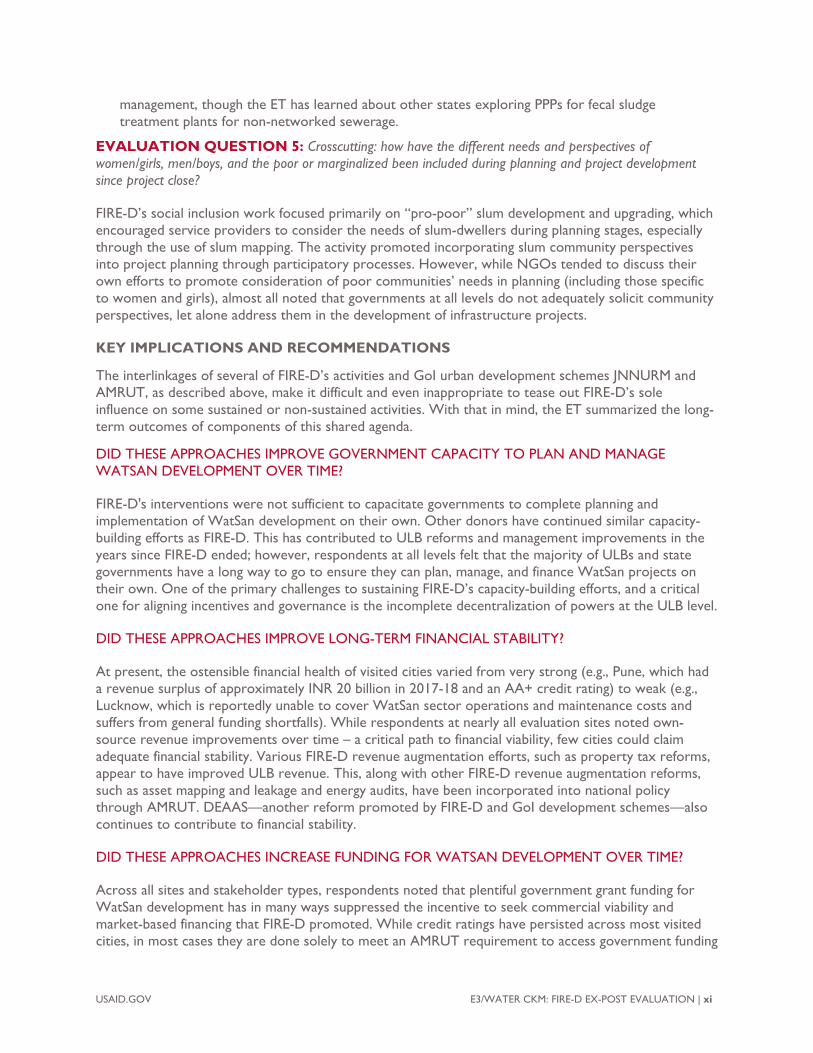
management, though the ET has learned about other states exploring PPPs for fecal sludge treatment plants for non-networked sewerage.
EVALUATION QUESTION 5: Crosscutting: how have the different needs and perspectives of women/girls, men/boys, and the poor or marginalized been included during planning and project development since project close?
FIRE-D’s social inclusion work focused primarily on “pro-poor” slum development and upgrading, which encouraged service providers to consider the needs of slum-dwellers during planning stages, especially through the use of slum mapping. The activity promoted incorporating slum community perspectives into project planning through participatory processes. However, while NGOs tended to discuss their own efforts to promote consideration of poor communities’ needs in planning (including those specific to women and girls), almost all noted that governments at all levels do not adequately solicit community perspectives, let alone address them in the development of infrastructure projects.
KEY IMPLICATIONS AND RECOMMENDATIONS
The interlinkages of several of FIRE-D’s activities and GoI urban development schemes JNNURM and AMRUT, as described above, make it difficult and even inappropriate to tease out FIRE-D’s sole influence on some sustained or non-sustained activities. With that in mind, the ET summarized the long-term outcomes of components of this shared agenda.
DID THESE APPROACHES IMPROVE GOVERNMENT CAPACITY TO PLAN AND MANAGE WATSAN DEVELOPMENT OVER TIME?
FIRE-D's interventions were not sufficient to capacitate governments to complete planning and implementation of WatSan development on their own. Other donors have continued similar capacity-building efforts as FIRE-D. This has contributed to ULB reforms and management improvements in the years since FIRE-D ended; however, respondents at all levels felt that the majority of ULBs and state governments have a long way to go to ensure they can plan, manage, and finance WatSan projects on their own. One of the primary challenges to sustaining FIRE-D’s capacity-building efforts, and a critical one for aligning incentives and governance is the incomplete decentralization of powers at the ULB level.
DID THESE APPROACHES IMPROVE LONG-TERM FINANCIAL STABILITY?
At present, the ostensible financial health of visited cities varied from very strong (e.g., Pune, which had a revenue surplus of approximately INR 20 billion in 2017-18 and an AA+ credit rating) to weak (e.g., Lucknow, which is reportedly unable to cover WatSan sector operations and maintenance costs and suffers from general funding shortfalls). While respondents at nearly all evaluation sites noted own-source revenue improvements over time – a critical path to financial viability, few cities could claim adequate financial stability. Various FIRE-D revenue augmentation efforts, such as property tax reforms, appear to have improved ULB revenue. This, along with other FIRE-D revenue augmentation reforms, such as asset mapping and leakage and energy audits, have been incorporated into national policy through AMRUT. DEAAS—another reform promoted by FIRE-D and GoI development schemes—also continues to contribute to financial stability.
DID THESE APPROACHES INCREASE FUNDING FOR WATSAN DEVELOPMENT OVER TIME?
Across all sites and stakeholder types, respondents noted that plentiful government grant funding for WatSan development has in many ways suppressed the incentive to seek commercial viability and market-based financing that FIRE-D promoted. While credit ratings have persisted across most visited cities, in most cases they are done solely to meet an AMRUT requirement to access government funding
rather than as a pathway to market finance. The availability of cheaper and less administratively burdensome capital through government schemes and donor funds is a more attractive prospect, especially given fears around the commercial viability of WatSan. Likewise, fears that WatSan projects lack commercial viability as well as limited successful examples have also stymied interest in PPPs for WatSan.
DID THESE APPROACHES INCREASE INCLUSIVE WATSAN ACCESS OVER TIME?
GoI funding programs have been major drivers in expanding access to WatSan over the past seven years, along with selected donor capital investment projects. Market-based financing contributed to a lesser extent, due to these other funding sources. It is difficult to quantify the influence of governance reforms or operational efficiencies on service expansion, though the pathway is logical.
In many places, despite the infusion of public funds, rapid urban population growth has outpaced the ability to align infrastructure with demand. Among and within states, varying approaches have been tried to provide access. Service expansions in recent years do not comprehensively meet the needs of the poor/slum dwellers. The variation seen in slums’ access rates in sampled locations is related to several barriers that a range of respondents identified. These include lack of land rights, inconsistent inclusion in planning processes, limited slum mapping efforts to identify access needs, and inadequate land for infrastructure. Finally, the strategy to increase slum access to WatSan infrastructure has improved due to GoI funding programs (JNNURM, AMRUT, etc.). However, in many states a reliance on subsidies makes sustainable revenue recovery systems among this population a challenge.
Although some representatives purport to champion inclusive development, government stakeholders lack understanding of the specific needs of women and girls according to officials and NGOs the ET interviewed. By extension, these needs are inadequately incorporated into the planning and execution of WatSan infrastructure development. NGOs continue to play an important role in advocating for women, girls, and other disadvantaged groups; however, without the support of government officials, their efforts will fail to provide adequate services for marginalized members of society.
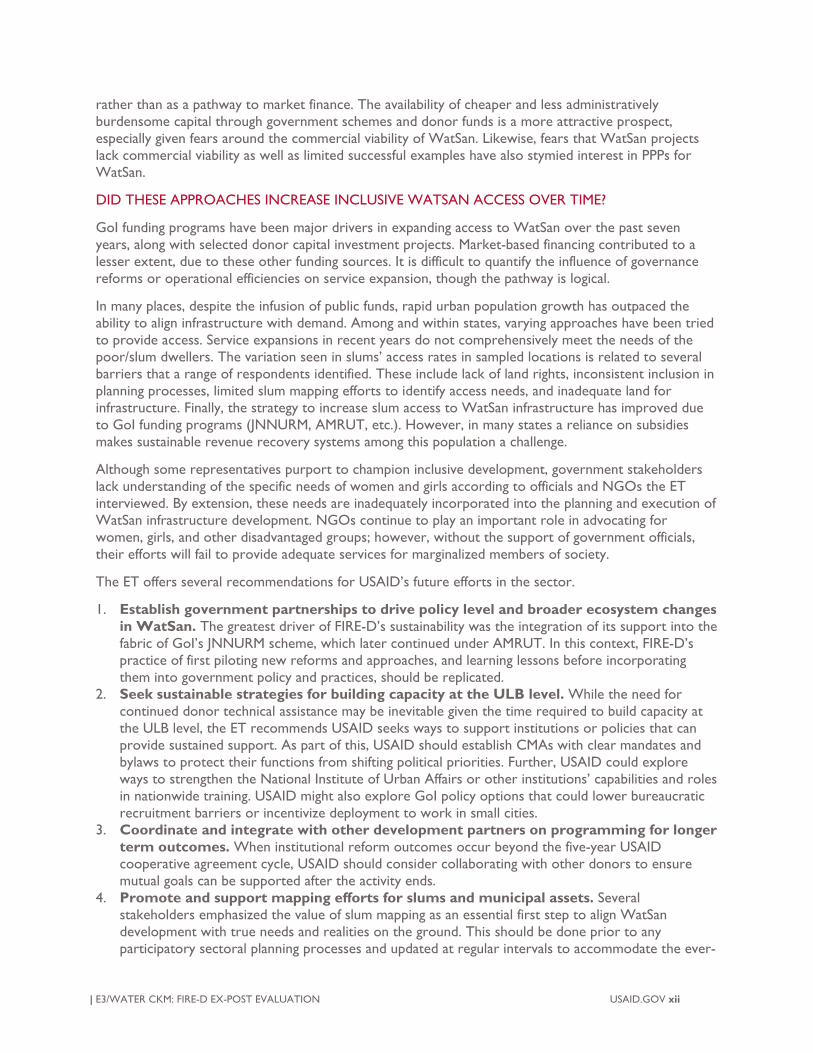
The ET offers several recommendations for USAID’s future efforts in the sector.
1. Establish government partnerships to drive policy level and broader ecosystem changesin WatSan. The greatest driver of FIRE-D’s sustainability was the integration of its support into thefabric of GoI’s JNNURM scheme, which later continued under AMRUT. In this context, FIRE-D’spractice of first piloting new reforms and approaches, and learning lessons before incorporatingthem into government policy and practices, should be replicated.
2. Seek sustainable strategies for building capacity at the ULB level. While the need forcontinued donor technical assistance may be inevitable given the time required to build capacity atthe ULB level, the ET recommends USAID seeks ways to support institutions or policies that canprovide sustained support. As part of this, USAID should establish CMAs with clear mandates andbylaws to protect their functions from shifting political priorities. Further, USAID could exploreways to strengthen the National Institute of Urban Affairs or other institutions’ capabilities and rolesin nationwide training. USAID might also explore GoI policy options that could lower bureaucraticrecruitment barriers or incentivize deployment to work in small cities.
3. Coordinate and integrate with other development partners on programming for longerterm outcomes. When institutional reform outcomes occur beyond the five-year USAIDcooperative agreement cycle, USAID should consider collaborating with other donors to ensuremutual goals can be supported after the activity ends.
4. Promote and support mapping efforts for slums and municipal assets. Severalstakeholders emphasized the value of slum mapping as an essential first step to align WatSandevelopment with true needs and realities on the ground. This should be done prior to anyparticipatory sectoral planning processes and updated at regular intervals to accommodate the ever-
| E3/WATER CKM: FIRE-D EX-POST EVALUATION USAID.GOV xii
USAID.GOV E3/WATER CKM: FIRE-D EX-POST EVALUATION | xiii
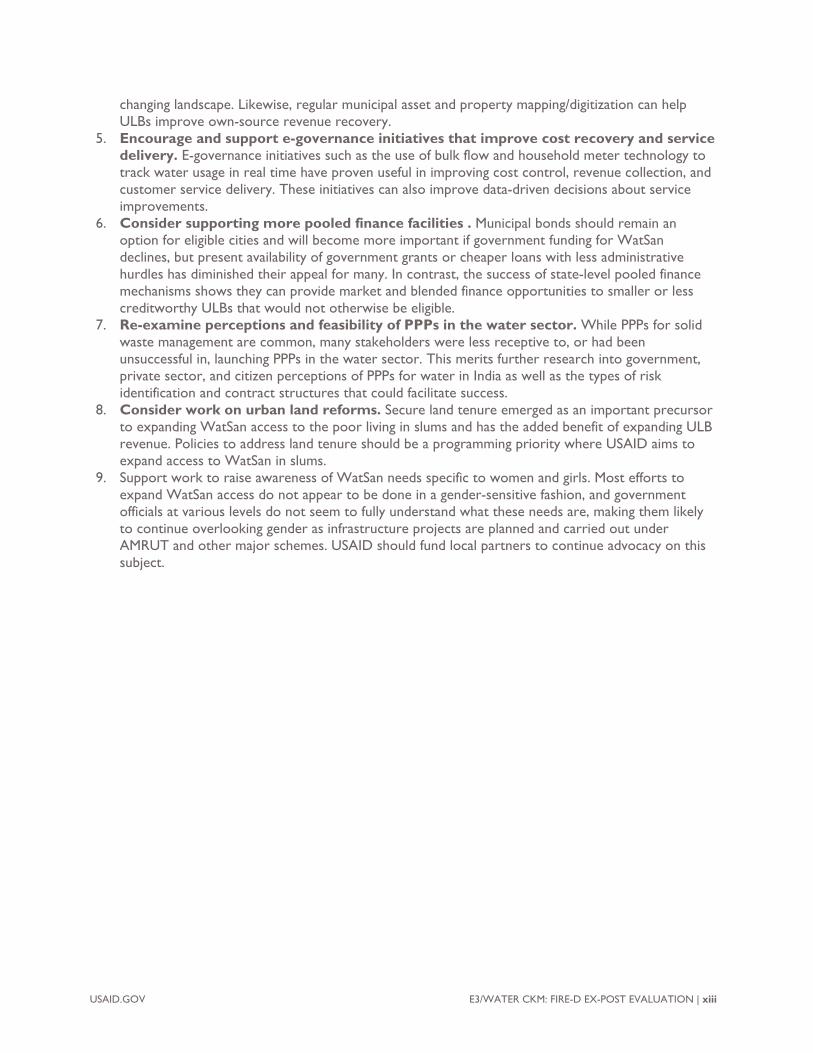
changing landscape. Likewise, regular municipal asset and property mapping/digitization can help ULBs improve own-source revenue recovery.
5. Encourage and support e-governance initiatives that improve cost recovery and servicedelivery. E-governance initiatives such as the use of bulk flow and household meter technology totrack water usage in real time have proven useful in improving cost control, revenue collection, andcustomer service delivery. These initiatives can also improve data-driven decisions about serviceimprovements.
6. Consider supporting more pooled finance facilities . Municipal bonds should remain anoption for eligible cities and will become more important if government funding for WatSandeclines, but present availability of government grants or cheaper loans with less administrativehurdles has diminished their appeal for many. In contrast, the success of state-level pooled financemechanisms shows they can provide market and blended finance opportunities to smaller or lesscreditworthy ULBs that would not otherwise be eligible.
7. Re-examine perceptions and feasibility of PPPs in the water sector. While PPPs for solidwaste management are common, many stakeholders were less receptive to, or had beenunsuccessful in, launching PPPs in the water sector. This merits further research into government,private sector, and citizen perceptions of PPPs for water in India as well as the types of riskidentification and contract structures that could facilitate success.
8. Consider work on urban land reforms. Secure land tenure emerged as an important precursorto expanding WatSan access to the poor living in slums and has the added benefit of expanding ULBrevenue. Policies to address land tenure should be a programming priority where USAID aims toexpand access to WatSan in slums.
9. Support work to raise awareness of WatSan needs specific to women and girls. Most efforts toexpand WatSan access do not appear to be done in a gender-sensitive fashion, and governmentofficials at various levels do not seem to fully understand what these needs are, making them likelyto continue overlooking gender as infrastructure projects are planned and carried out underAMRUT and other major schemes. USAID should fund local partners to continue advocacy on thissubject.
INTRODUCTION India’s rapid urbanization has exacerbated infrastructure capacity in an already resource-constrained environment. The growing demand for safe water and sanitation (WatSan)6 in urban India requires sustainable development strategies. USAID has invested heavily in India’s urban development, as it has invested in WatSan development across countries in Asia, Africa, and the Middle East, but little is known about the long-term sustainability of approaches to improve access in urban areas. Donors seldom have the opportunity to revisit closed activities to understand what does and does not work in the long term. This report details results of an ex-post evaluation of the Indo-US Financial Institutions Reform and Expansion Program–Debt (FIRE-D) activity in India. It is the fourth study of an evaluation series examining whether and why USAID’s completed water, sanitation, and hygiene (WASH) activities have or have not been sustained. The first three evaluations have been completed in Madagascar, Indonesia, and Ethiopia.7 Findings from this evaluation will contribute to a growing knowledge base about the role of various governance and financial reforms as well as efforts to expand private and market-based WatSan financing to develop and sustain urban WatSan services.
PROJECT BACKGROUND
FIRE-D was a three-phased, USAID–funded activity that ran from 1994 to 2011 and was implemented by TCG International. The activity worked in tandem with India’s central, state, and city governments to “develop sustainable urban environmental services and to ensure the poor have access to those services.”8 The activity’s goals were tied to the following objectives9:
1. Increasing the participation of cities, the private sector, and community organizations in thedevelopment and delivery of commercially viable and socially inclusive urban infrastructureservices
2. Improving the ability of city and state governments, infrastructure agencies, and urbanprofessionals to plan and manage urban growth, mobilize resources, and improve infrastructureservices
3. Supporting development of an urban infrastructure finance system
FIRE-D addressed infrastructure development broadly across all sectors; however, this evaluation focuses solely on WatSan infrastructure development. Over the course of three activity phases, FIRE-D concentrated technical assistance (TA) in the states of Andhra Pradesh, Bihar, Chandigarh, Gujarat, Himachal Pradesh, Karnataka, Madhya Pradesh, Maharashtra, Odisha, Punjab, Rajasthan, Tamil Nadu, Tripura, Uttarakhand, Uttar Pradesh, and West Bengal (Figure 2). Annex A: Evaluation Inception Report details FIRE-D activities by location and project phase. The first phase (1994–1999) used the model of commercially viable infrastructure projects and private sector participation demonstration projects to develop a system of citywide infrastructure. Minimal state involvement at this phase prevented the implementation of large-scale urban projects. Recognizing the need for a favorable underlying governance and financial framework to support these things, the second phase (1999–2004) supported state-level agencies to develop important, large-scale urban reforms, and to institutionalize better project development and finance practices.
6 Throughout this report, “water” refers to piped utility water, and “sanitation” refers narrowly to sewerage and toilets. While solid waste management and drainage are typically considered components of sanitation, they did not fall within this evaluation’s scope. In cases where these components emerge in the report, they are referenced separately. 7 Reports are available at https://www.globalwaters.org/resources/ExPostEvaluations 8 TCG International. 2011. FIRE-D Brochure. 9 Ibid.
1 | E3/WATER CKM: FIRE-D EX-POST EVALUATION USAID.GOV
USAID.GOV E3/WATER CKM: FIRE-D EX-POST EVALUATION | 2
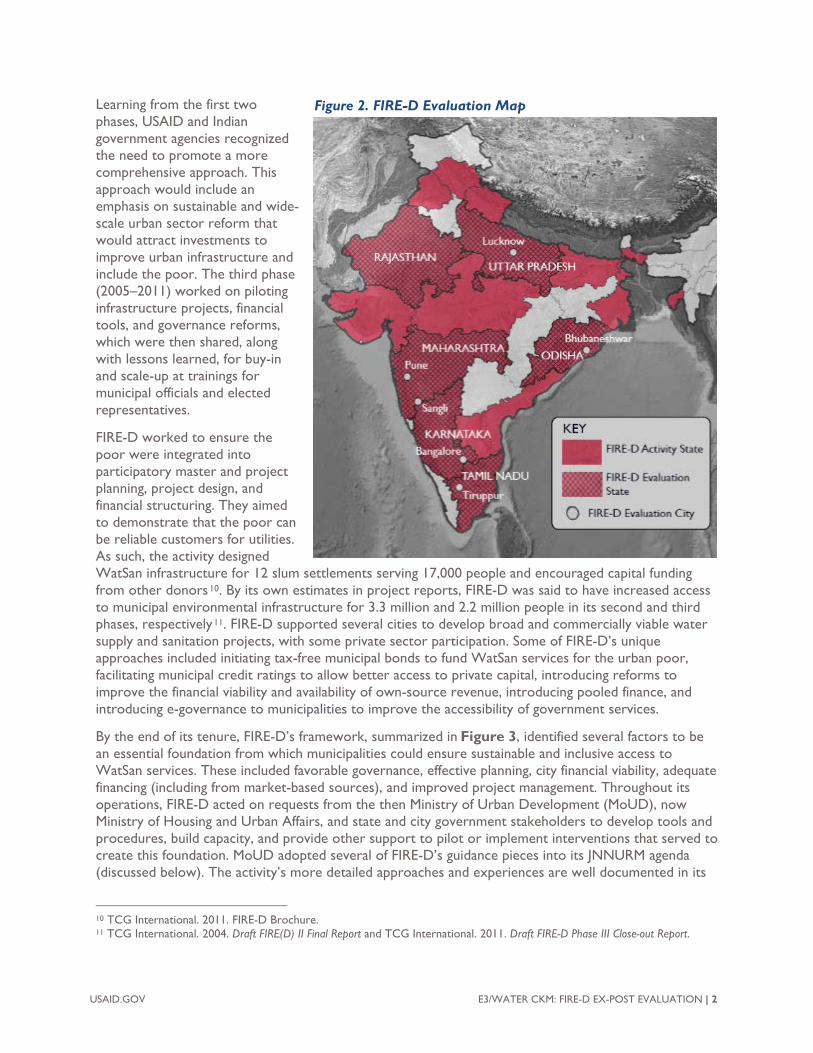
Learning from the first two Figure 2. FIRE-D Evaluation Map phases, USAID and Indian government agencies recognized the need to promote a more comprehensive approach. This approach would include an emphasis on sustainable and wide-scale urban sector reform that would attract investments to improve urban infrastructure and include the poor. The third phase (2005–2011) worked on piloting infrastructure projects, financial tools, and governance reforms, which were then shared, along with lessons learned, for buy-in and scale-up at trainings for municipal officials and elected representatives.
FIRE-D worked to ensure the poor were integrated into participatory master and project planning, project design, and financial structuring. They aimed to demonstrate that the poor can be reliable customers for utilities. As such, the activity designed WatSan infrastructure for 12 slum settlements serving 17,000 people and encouraged capital funding from other donors10. By its own estimates in project reports, FIRE-D was said to have increased access to municipal environmental infrastructure for 3.3 million and 2.2 million people in its second and third phases, respectively11. FIRE-D supported several cities to develop broad and commercially viable water supply and sanitation projects, with some private sector participation. Some of FIRE-D’s unique approaches included initiating tax-free municipal bonds to fund WatSan services for the urban poor, facilitating municipal credit ratings to allow better access to private capital, introducing reforms to improve the financial viability and availability of own-source revenue, introducing pooled finance, and introducing e-governance to municipalities to improve the accessibility of government services.
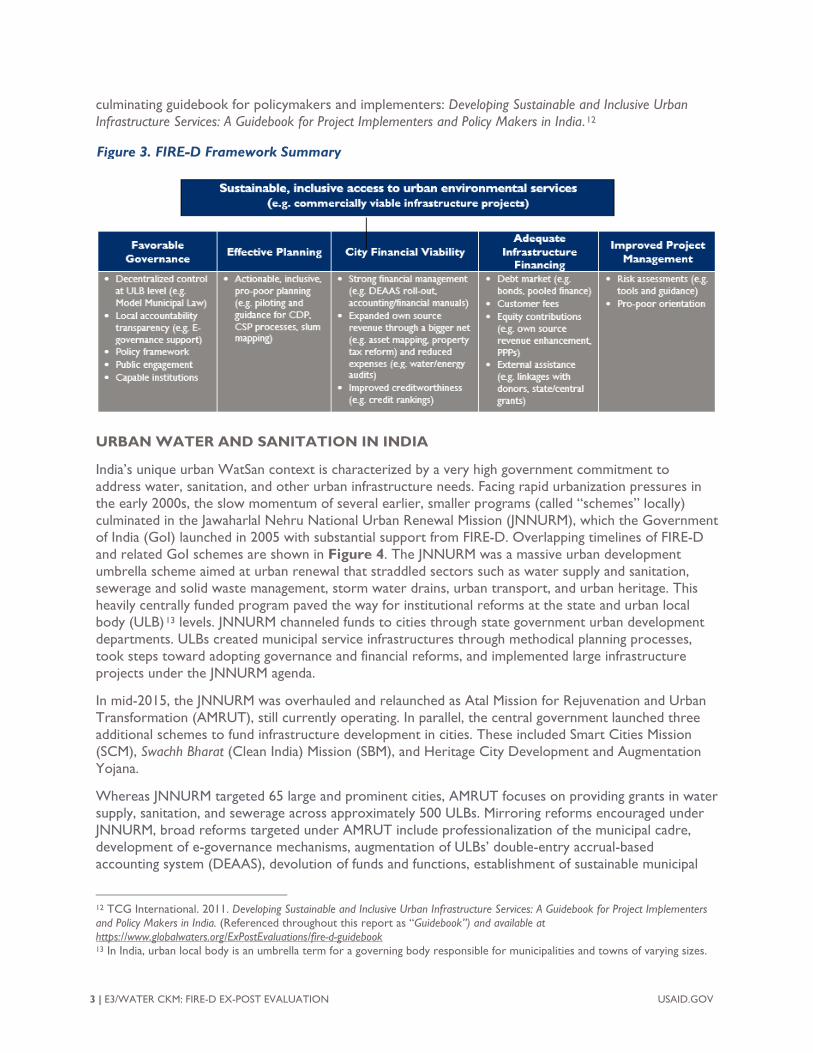
By the end of its tenure, FIRE-D’s framework, summarized in Figure 3, identified several factors to be an essential foundation from which municipalities could ensure sustainable and inclusive access to WatSan services. These included favorable governance, effective planning, city financial viability, adequate financing (including from market-based sources), and improved project management. Throughout its operations, FIRE-D acted on requests from the then Ministry of Urban Development (MoUD), now Ministry of Housing and Urban Affairs, and state and city government stakeholders to develop tools and procedures, build capacity, and provide other support to pilot or implement interventions that served to create this foundation. MoUD adopted several of FIRE-D’s guidance pieces into its JNNURM agenda (discussed below). The activity’s more detailed approaches and experiences are well documented in its
10 TCG International. 2011. FIRE-D Brochure. 11 TCG International. 2004. Draft FIRE(D) II Final Report and TCG International. 2011. Draft FIRE-D Phase III Close-out Report.
3 | E3/WATER CKM: FIRE-D EX-POST EVALUATION USAID.GOV
culminating guidebook for policymakers and implementers: Developing Sustainable and Inclusive Urban Infrastructure Services: A Guidebook for Project Implementers and Policy Makers in India. 12
URBAN WATER AND SANITATION IN INDIA
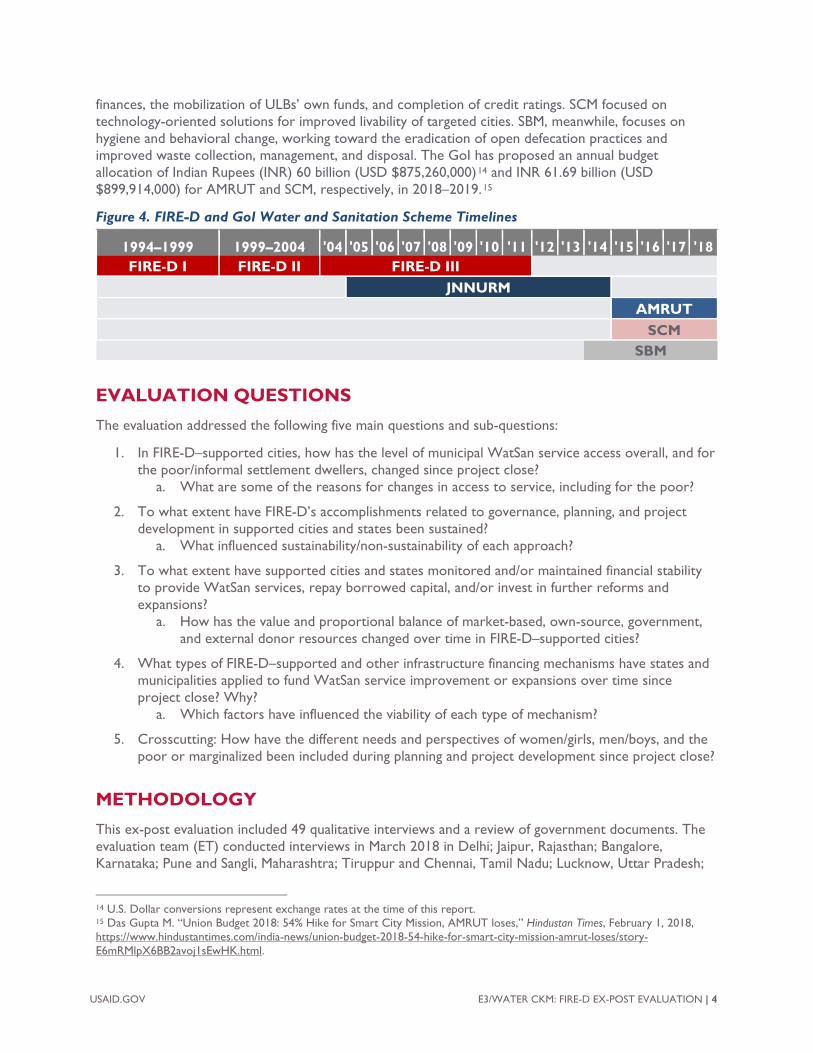
India’s unique urban WatSan context is characterized by a very high government commitment to address water, sanitation, and other urban infrastructure needs. Facing rapid urbanization pressures in the early 2000s, the slow momentum of several earlier, smaller programs (called “schemes” locally) culminated in the Jawaharlal Nehru National Urban Renewal Mission (JNNURM), which the Government of India (GoI) launched in 2005 with substantial support from FIRE-D. Overlapping timelines of FIRE-D and related GoI schemes are shown in Figure 4. The JNNURM was a massive urban development umbrella scheme aimed at urban renewal that straddled sectors such as water supply and sanitation, sewerage and solid waste management, storm water drains, urban transport, and urban heritage. This heavily centrally funded program paved the way for institutional reforms at the state and urban local body (ULB)13 levels. JNNURM channeled funds to cities through state government urban development departments. ULBs created municipal service infrastructures through methodical planning processes, took steps toward adopting governance and financial reforms, and implemented large infrastructure projects under the JNNURM agenda.
In mid-2015, the JNNURM was overhauled and relaunched as Atal Mission for Rejuvenation and Urban Transformation (AMRUT), still currently operating. In parallel, the central government launched three additional schemes to fund infrastructure development in cities. These included Smart Cities Mission (SCM), Swachh Bharat (Clean India) Mission (SBM), and Heritage City Development and Augmentation Yojana.
Whereas JNNURM targeted 65 large and prominent cities, AMRUT focuses on providing grants in water supply, sanitation, and sewerage across approximately 500 ULBs. Mirroring reforms encouraged under JNNURM, broad reforms targeted under AMRUT include professionalization of the municipal cadre, development of e-governance mechanisms, augmentation of ULBs’ double-entry accrual-based accounting system (DEAAS), devolution of funds and functions, establishment of sustainable municipal
12 TCG International. 2011. Developing Sustainable and Inclusive Urban Infrastructure Services: A Guidebook for Project Implementers and Policy Makers in India. (Referenced throughout this report as “Guidebook”) and available at https://www.globalwaters.org/ExPostEvaluations/fire-d-guidebook 13 In India, urban local body is an umbrella term for a governing body responsible for municipalities and towns of varying sizes.
Figure 3. FIRE-D Framework Summary
USAID.GOV E3/WATER CKM: FIRE-D EX-POST EVALUATION | 4
finances, the mobilization of ULBs’ own funds, and completion of credit ratings. SCM focused on technology-oriented solutions for improved livability of targeted cities. SBM, meanwhile, focuses on hygiene and behavioral change, working toward the eradication of open defecation practices and improved waste collection, management, and disposal. The GoI has proposed an annual budget allocation of Indian Rupees (INR) 60 billion (USD $875,260,000)14 and INR 61.69 billion (USD $899,914,000) for AMRUT and SCM, respectively, in 2018–2019.15
Figure 4. FIRE-D and GoI Water and Sanitation Scheme Timelines
1994–1999 1999–2004 '04 '05 '06 '07 '08 '09 '10 '11 '12 '13 '14 '15 '16 '17 '18 FIRE-D I FIRE-D II FIRE-D III
JNNURM AMRUT
SCM SBM
EVALUATION QUESTIONS The evaluation addressed the following five main questions and sub-questions:
1. In FIRE-D–supported cities, how has the level of municipal WatSan service access overall, and forthe poor/informal settlement dwellers, changed since project close?
a. What are some of the reasons for changes in access to service, including for the poor?
2. To what extent have FIRE-D’s accomplishments related to governance, planning, and projectdevelopment in supported cities and states been sustained?
a. What influenced sustainability/non-sustainability of each approach?
3. To what extent have supported cities and states monitored and/or maintained financial stabilityto provide WatSan services, repay borrowed capital, and/or invest in further reforms andexpansions?
a. How has the value and proportional balance of market-based, own-source, government,and external donor resources changed over time in FIRE-D–supported cities?
4. What types of FIRE-D–supported and other infrastructure financing mechanisms have states andmunicipalities applied to fund WatSan service improvement or expansions over time sinceproject close? Why?
a. Which factors have influenced the viability of each type of mechanism?
5. Crosscutting: How have the different needs and perspectives of women/girls, men/boys, and thepoor or marginalized been included during planning and project development since project close?
METHODOLOGY This ex-post evaluation included 49 qualitative interviews and a review of government documents. The evaluation team (ET) conducted interviews in March 2018 in Delhi; Jaipur, Rajasthan; Bangalore, Karnataka; Pune and Sangli, Maharashtra; Tiruppur and Chennai, Tamil Nadu; Lucknow, Uttar Pradesh;
14 U.S. Dollar conversions represent exchange rates at the time of this report. 15 Das Gupta M. “Union Budget 2018: 54% Hike for Smart City Mission, AMRUT loses,” Hindustan Times, February 1, 2018, https://www.hindustantimes.com/india-news/union-budget-2018-54-hike-for-smart-city-mission-amrut-loses/story-E6mRMlpX6BB2avoj1sEwHK.html.
and Bhubaneswar, Odisha. Both American and Indian nationals comprised the six-person ET, collectively bringing extensive experience across WASH, India urban planning, evaluation, and gender studies disciplines. ET members Leslie Greene Hodel, Sujit Kumar Mridha, Abhirup Bhunia, Debanjana Das, and Gabrielle Plotkin contributed to planning and data collection. Holly Dentz and Leslie Greene Hodel performed data analysis. All team members contributed to report authorship. Additional information about the evaluation team is available in the body of Annex A, the Inception Report.
SAMPLING
To gain an in-depth perspective across state and ULB governments and utilities, evaluation activities focused on six states and six cities spread across them. The ET determined eligibility of FIRE-D–supported cities and states if they received substantial support (defined as application of FIRE-D principles for planning, financial management, project development, or adoption of FIRE-D-supported financing mechanisms) during the activity’s second or third phase. The study excluded the first phase because the FIRE-D approach had not been fully developed and its timeframe was too distant. Within this group of eligible locations, the ET purposively selected Uttar Pradesh and Rajasthan states in consultation with USAID/India in order to most effectively inform current programming. The ET also purposively selected other states, and supported cities within these states, based on their likelihood of generating a diversity of perspectives and levels of success since the end of FIRE-D and based on the availability of supporting documentation of FIRE-D activities. Across the sample, the ET aimed to include at least two small/medium-sized cities to provide a contrasting perspective to large cities. The final evaluation sites selected included: Uttar Pradesh State and Lucknow City, Rajasthan State (no city-level activities completed under FIRE-D), Karnataka State and Bangalore City, Odisha State and Bhubaneswar City, Maharashtra State and Pune and Sangli cities, Tamil Nadu State and Tiruppur City.
Typical ex-post evaluations avoid data collection in locations that received follow-on support for similar activities from external donors (known as sample contamination). However, the ET recognized that municipalities’ FIRE-D–supported success in governance reform and financial stability might naturally lead them to capture additional development funding from other donors, which was an intended program outcome in some places. Following this logic, the selection of only locations that had not received subsequent support would likely bias the study toward poor performers. Conversely, it is possible that follow-on support from external donors for governance and financial reforms is a signal that FIRE-D accomplishments in these areas were not sustained. Therefore, to select only cities that did have follow-on work might also bias the sample toward more sustainable cities and states, thereby missing opportunities to learn about why these sites needed additional support. With both scenarios in mind, external follow-on support for similar projects did not generally affect sites’ eligibility for this particular evaluation; however, the ET sought to ensure inclusion of some evaluation sites without follow-on work to ensure a variety of perspectives. The ET confirmed during interviews that other donors had not intervened in Tiruppur or Sangli since FIRE-D ended, though they may have indirectly benefitted from state-level support. Interviews and analysis acknowledge the milieu of other donor activities and seek to learn from the reasons continued donor engagement has been necessary.
DATA COLLECTION METHODS
Data collection consisted of conducting qualitative key informant interviews or group interviews with several key stakeholder groups at the national, state, and municipality levels as well as gathering secondary quantitative data regarding WatSan access and financial stability.
Qualitative Interviews. The team began with general landscaping interviews at the national level in Delhi with USAID and former FIRE-D implementing staff to verify the evaluation team’s understanding of FIRE-D interventions and accomplishments in selected sites, and to capture opinions and interests about sustainability of FIRE-D achievements. The ET then interviewed relevant parties at national ministries,
5 | E3/WATER CKM: FIRE-D EX-POST EVALUATION USAID.GOV
credit rating agencies, donor agencies, and advocacy groups. The ET targeted donors known to be actively implementing similar activities in selected cities and states to better understand the driving forces behind their interventions, their needs assessment in supported locations, and how their work is, or is not, complementary to FIRE-D’s achievements. The ET also spoke to staff at advocacy organizations’ national offices about the current status of urban WatSan planning and service delivery from the perspective of poor, vulnerable, and slum dwellers. Interviews targeted those within each organization in the best position to provide responses. Though familiarity with the FIRE-D activity was considered an asset, it was not required.
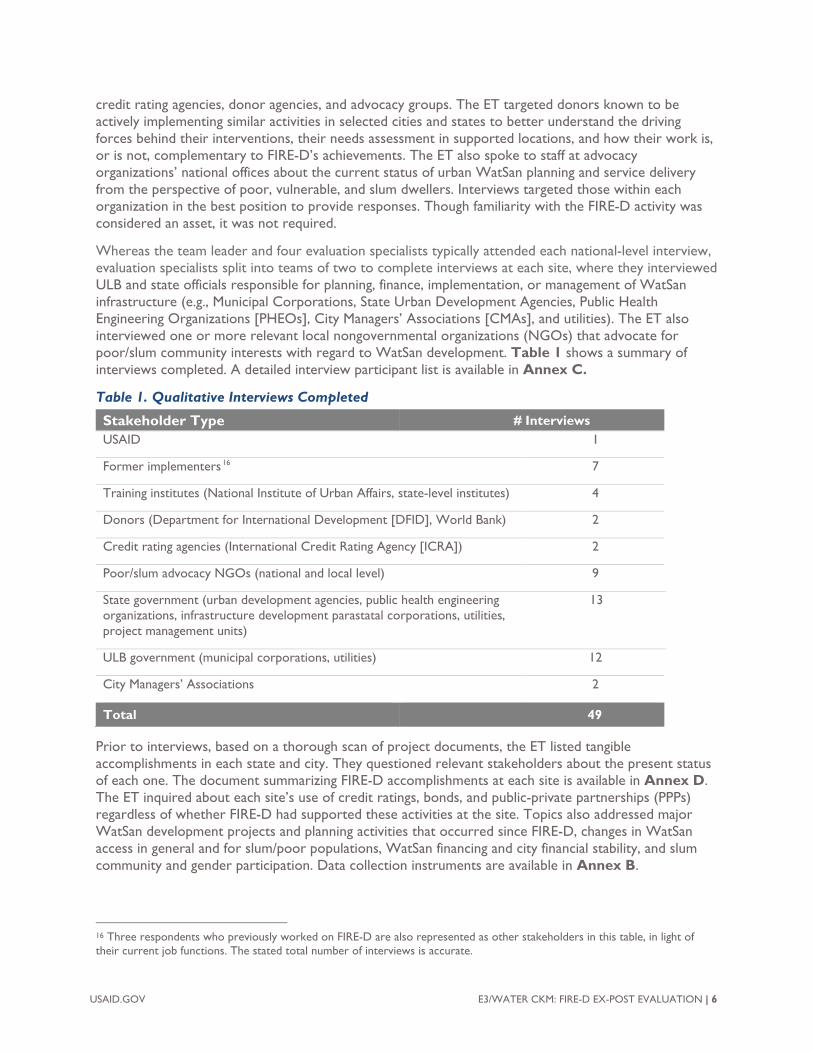
Whereas the team leader and four evaluation specialists typically attended each national-level interview, evaluation specialists split into teams of two to complete interviews at each site, where they interviewed ULB and state officials responsible for planning, finance, implementation, or management of WatSan infrastructure (e.g., Municipal Corporations, State Urban Development Agencies, Public Health Engineering Organizations [PHEOs], City Managers’ Associations [CMAs], and utilities). The ET also interviewed one or more relevant local nongovernmental organizations (NGOs) that advocate for poor/slum community interests with regard to WatSan development. Table 1 shows a summary of interviews completed. A detailed interview participant list is available in Annex C.
Table 1. Qualitative Interviews Completed
Stakeholder Type # Interviews USAID 1
Former implementers16 7
Training institutes (National Institute of Urban Affairs, state-level institutes) 4
Donors (Department for International Development [DFID], World Bank) 2
Credit rating agencies (International Credit Rating Agency [ICRA]) 2
Poor/slum advocacy NGOs (national and local level) 9
State government (urban development agencies, public health engineering organizations, infrastructure development parastatal corporations, utilities, project management units)
13
ULB government (municipal corporations, utilities) 12
City Managers’ Associations 2
Total 49
Prior to interviews, based on a thorough scan of project documents, the ET listed tangible accomplishments in each state and city. They questioned relevant stakeholders about the present status of each one. The document summarizing FIRE-D accomplishments at each site is available in Annex D. The ET inquired about each site’s use of credit ratings, bonds, and public-private partnerships (PPPs) regardless of whether FIRE-D had supported these activities at the site. Topics also addressed major WatSan development projects and planning activities that occurred since FIRE-D, changes in WatSan access in general and for slum/poor populations, WatSan financing and city financial stability, and slum community and gender participation. Data collection instruments are available in Annex B.
16
their current job functions. The stated total number of interviews is accurate.
USAID.GOV E3/WATER CKM: FIRE-D EX-POST EVALUATION | 6
Three respondents who previously worked on FIRE-D are also represented as other stakeholders in this table, in light of
Secondary Data. The ET also sought official state and city planning documents to obtain WatSan access data for Evaluation Question 1 and financial data in support of Evaluation Questions 3 and 3a. Prior to and during interviews and through multiple follow-up calls and email requests, the ET requested documents with at a minimum the most current data on percentage of the population served by utility water and sewerage connections as well as the same figures from 2011 (when FIRE-D ended) to provide two time points to track progress since activity closure. Where these data were not available, the ET sought information from the closest time points to these targets. In the same way, the ET requested budgetary and financial data to reflect own-source revenue and fund allocation by source. Documents sought included Service Level Benchmark (SLB) reports, State Annual Action Plans (SAAPs), Service Level Improvement Plans, City Development Plans (CDPs), and an online Performance Assessment System (PAS).17
ANALYSIS
The ET digitally recorded and took detailed notes of interviews. They also held daily debrief sessions and used the recordings to crosscheck incomplete portions of the notes. The team leader reviewed all final notes for quality. The ET developed the codebook based on the evaluation questions and refined it through iterative discussions with coders before formal codebook application. Four coders applied analytic codes in MAXQDA 12 software, which two ET members reviewed for consistency and addressed discrepancies, recoding data as needed for consistent coding application. Two ET members used applied thematic analysis to deductively examine themes across the city, state, and national level data using complex coding queries and lexical searches. Analysts shared preliminary results with the larger ET, which triangulated findings with other data sources, identified any deviant cases, and any other aspects requiring further analysis. The ET selected this approach to answer specific evaluation questions and allow for triangulation. This process allowed the ET analysts to maintain rigor and validate findings, conclusions, and recommendations.
LIMITATIONS
This evaluation provides rich and broad-reaching information about a variety of FIRE-D activities across six very different states. However, readers should consider a few key limitations and the influence they may have on the validity of results.
Incomplete and Inconsistent WatSan Access and Budget Data. The ET relied on city and state-level government reports to provide WatSan access and budgetary data to support Evaluation Questions 1, 3, and 3a. Unfortunately, these numbers proved highly difficult to obtain because no national compilation is available, online resources are scant, and most figures are buried within printed documents housed in ULB offices. Very few stakeholders provided these documents. The ET only obtained budgetary data to support Evaluation Questions 3 and 3a from Bhubaneswar. The ET managed to locate two WatSan access data points for each city from a variety of documents including SLB reports, SAAPs, and CDPs. The ET used PAS data for Maharashtra cities. However, while the team sought at a minimum data for 2011 and 2017, available data diverged from this in nearly all cases. The latest data points came from 2016 for all cities except Bangalore, which provided data from 2014—the most recent accessible. The ET was able to obtain 2011 comparison data for all cities except Bangalore (2009), Bhubaneswar (2013), and Tiruppur (2014). It is important to also recognize that the methods used to measure access in each city are not documented or necessarily consistent across cities. The ET did not independently verify the validity of access results and therefore must take them at face value.
Recall Bias. Part of the interviews at the city and state level involved questions about what is currently happening with activities FIRE-D completed. In some cases, respondents may have either been present
17 PAS is a Bill and Melinda Gates–funded accountability resource. (http://www.pas.org.in).
7 | E3/WATER CKM: FIRE-D EX-POST EVALUATION USAID.GOV
at the time of FIRE-D’s involvement or subsequently learned about it. This helped to bridge between FIRE-D’s work and what happened thereafter. In other cases, respondents had no recollection of the activity outcome in question, which implied a lack of sustainability, and could therefore provide no information about what led to that status. This limited the ET’s ability to trace a pathway between events. For example, the ET did not interview any respondents familiar with the urban infrastructure fund that FIRE-D established in Rajasthan, so it could not glean any useful information about what factors led to its lack of sustainability.
Limited In-Depth Discussion. Many government officials had limited time to participate in interviews, and so a planned one-hour session could be condensed to as little as 15 to 30 minutes. When time-constrained, the ET covered critical ground without probing topics in depth. Some targeted groups did not agree to an interview, citing time constraints. For example, a representative from the Ministry of Housing and Urban Affairs, the critical agency responsible for urban development activities including AMRUT, could only meet with the ET on the last day for five minutes. Due to these constraints, some explanations for selected topics are less detailed.
Challenges with Attribution. Ideally this evaluation would help identify which of FIRE-D’s activities led to any sustained outcomes. However, the urban sector in India is incredibly complex with numerous factors influencing it. While the FIRE-D thumbprint is clear in some cases and noted in this report, in other cases linkages over time are difficult to trace. In addition, one has to consider the influence of other donors, who have been applying similar technical assistance approaches as those of FIRE-D over time. Teasing out the degree to which FIRE-D’s support contributed to sustained outcomes is difficult, though useful lessons are still there. In the report the ET acknowledges this complex context.
FINDINGS Evaluation findings are presented below with two different lenses: a case study lens and an evaluation question lens. First, site profiles detail basic results by location. States and their respective WatSan development practices vastly differ across India and merit a case-by-case review to better understand how the state’s context fits together with each FIRE-D component. Site profiles characterize evaluation cities and states, including their WatSan access levels, based on the best official data available to the ET.18 The profile notes each documented FIRE-D intervention at this site alongside present-day conditions that the ET identified through interviews. This includes whether the FIRE-D activity was sustained as well as other general conditions or practices relevant to FIRE-D domains of interest. Information in these profiles is not meant to imply attribution of present conditions to listed FIRE-D activities. Rather, it is meant to identify the status of activities similar to those FIRE-D addressed in this or other locations. Following the site profiles, Table 2 simplifies site-specific findings into a high-level matrix that can serve as a quick reference while reading this report. Finally, the report summarizes findings across sites according to evaluation question.
18 See Limitations section
USAID.GOV E3/WATER CKM: FIRE-D EX-POST EVALUATION | 8
9 | E3/WATER CKM: FIRE-D EX-POST EVALUATION USAID.GOV
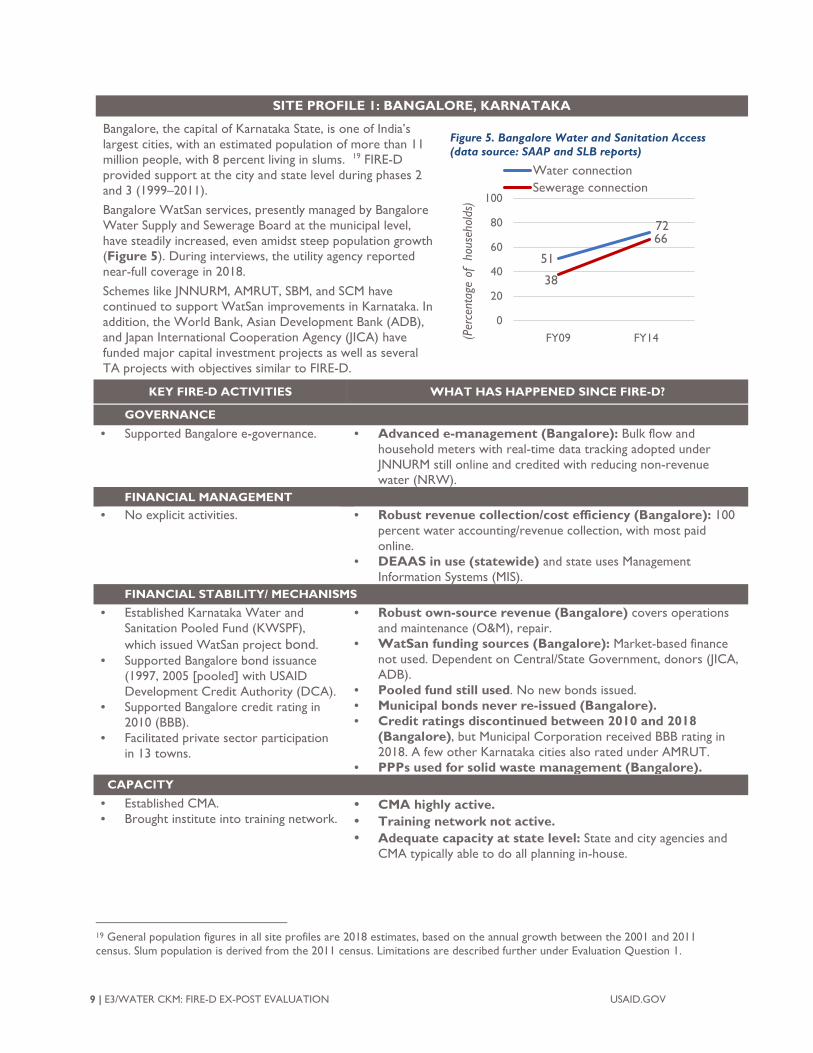
SITE PROFILE 1: BANGALORE, KARNATAKA
Bangalore, the capital of Karnataka State, is one of India’s largest cities, with an estimated population of more than 11 million people, with 8 percent living in slums. 19 FIRE-D provided support at the city and state level during phases 2 and 3 (1999–2011). Bangalore WatSan services, presently managed by Bangalore Water Supply and Sewerage Board at the municipal level, have steadily increased, even amidst steep population growth (Figure 5). During interviews, the utility agency reported near-full coverage in 2018. Schemes like JNNURM, AMRUT, SBM, and SCM have continued to support WatSan improvements in Karnataka. In addition, the World Bank, Asian Development Bank (ADB), and Japan International Cooperation Agency (JICA) have funded major capital investment projects as well as several TA projects with objectives similar to FIRE-D.
Figure 5. Bangalore Water and Sanitation Access (data source: SAAP and SLB reports)
KEY FIRE-D ACTIVITIES WHAT HAS HAPPENED SINCE FIRE-D?
GOVERNANCE • Supported Bangalore e-governance. • Advanced e-management (Bangalore): Bulk flow and
household meters with real-time data tracking adopted under JNNURM still online and credited with reducing non-revenue water (NRW).
FINANCIAL MANAGEMENT • No explicit activities. • Robust revenue collection/cost efficiency (Bangalore): 100
percent water accounting/revenue collection, with most paid online.
• DEAAS in use (statewide) and state uses Management Information Systems (MIS).
FINANCIAL STABILITY/ MECHANISMS • Established Karnataka Water and
Sanitation Pooled Fund (KWSPF), which issued WatSan project bond.
• Supported Bangalore bond issuance (1997, 2005 [pooled] with USAID Development Credit Authority (DCA).
• Supported Bangalore credit rating in 2010 (BBB).
• Facilitated private sector participation in 13 towns.
• Robust own-source revenue (Bangalore) covers operations and maintenance (O&M), repair.
• WatSan funding sources (Bangalore): Market-based finance not used. Dependent on Central/State Government, donors (JICA, ADB).
• Pooled fund still used. No new bonds issued. • Municipal bonds never re-issued (Bangalore). • Credit ratings discontinued between 2010 and 2018
(Bangalore), but Municipal Corporation received BBB rating in 2018. A few other Karnataka cities also rated under AMRUT.
• PPPs used for solid waste management (Bangalore). CAPACITY
• Established CMA. • Brought institute into training network.
• CMA highly active. • Training network not active. • Adequate capacity at state level: State and city agencies and
CMA typically able to do all planning in-house.
19 General population figures in all site profiles are 2018 estimates, based on the annual growth between the 2001 and 2011 census. Slum population is derived from the 2011 census. Limitations are described further under Evaluation Question 1.
51
72
38
66
0
20
40
60
80
100
2009 2014(Per
cent
age
of h
ouse
hold
s)
Water connectionSewerage connection
FY09 FY14
USAID.GOV E3/WATER CKM: FIRE-D EX-POST EVALUATION | 10
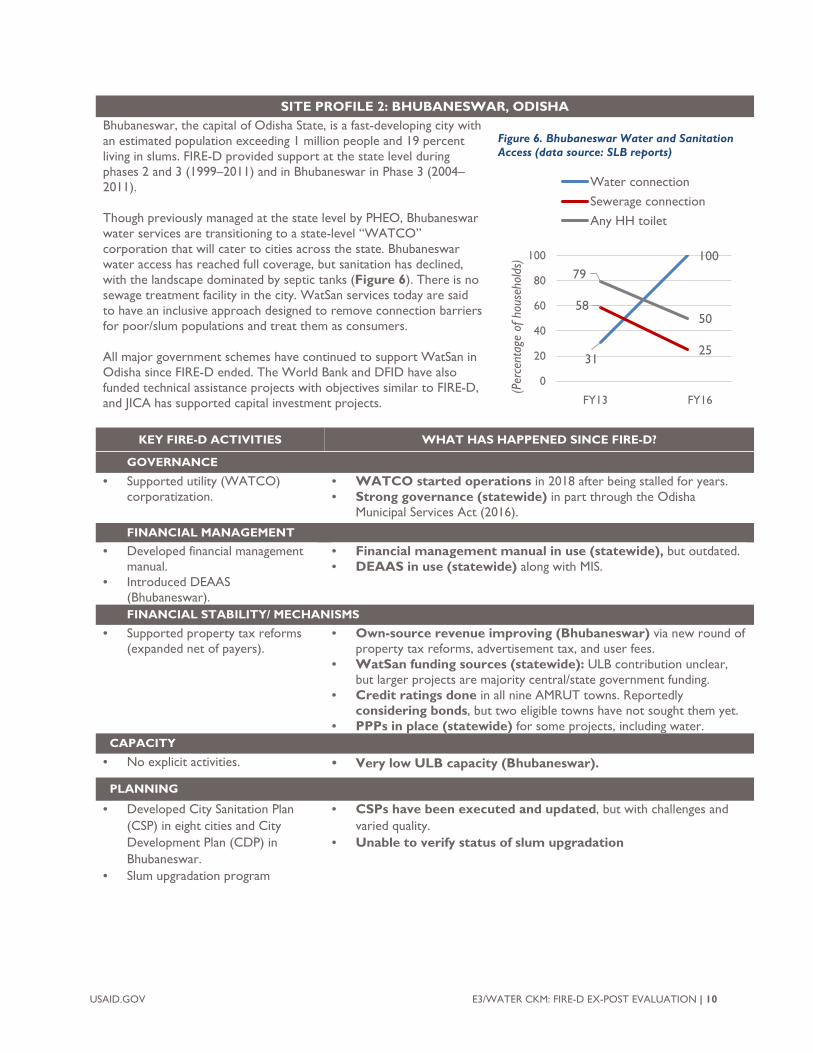
SITE PROFILE 2: BHUBANESWAR, ODISHA Bhubaneswar, the capital of Odisha State, is a fast-developing city with an estimated population exceeding 1 million people and 19 percent living in slums. FIRE-D provided support at the state level during phases 2 and 3 (1999–2011) and in Bhubaneswar in Phase 3 (2004–2011). Though previously managed at the state level by PHEO, Bhubaneswar water services are transitioning to a state-level “WATCO” corporation that will cater to cities across the state. Bhubaneswar water access has reached full coverage, but sanitation has declined, with the landscape dominated by septic tanks (Figure 6). There is no sewage treatment facility in the city. WatSan services today are said to have an inclusive approach designed to remove connection barriers for poor/slum populations and treat them as consumers. All major government schemes have continued to support WatSan in Odisha since FIRE-D ended. The World Bank and DFID have also funded technical assistance projects with objectives similar to FIRE-D, and JICA has supported capital investment projects.
Figure 6. Bhubaneswar Water and Sanitation Access (data source: SLB reports)
KEY FIRE-D ACTIVITIES WHAT HAS HAPPENED SINCE FIRE-D?
GOVERNANCE • Supported utility (WATCO)
corporatization. • WATCO started operations in 2018 after being stalled for years. • Strong governance (statewide) in part through the Odisha
Municipal Services Act (2016).
FINANCIAL MANAGEMENT • Developed financial management
manual. • Introduced DEAAS
(Bhubaneswar).
• Financial management manual in use (statewide), but outdated. • DEAAS in use (statewide) along with MIS.
FINANCIAL STABILITY/ MECHANISMS • Supported property tax reforms
(expanded net of payers). • Own-source revenue improving (Bhubaneswar) via new round of
property tax reforms, advertisement tax, and user fees. • WatSan funding sources (statewide): ULB contribution unclear,
but larger projects are majority central/state government funding. • Credit ratings done in all nine AMRUT towns. Reportedly
considering bonds, but two eligible towns have not sought them yet. • PPPs in place (statewide) for some projects, including water.
CAPACITY
• No explicit activities. • Very low ULB capacity (Bhubaneswar).
PLANNING
• Developed City Sanitation Plan (CSP) in eight cities and City Development Plan (CDP) in Bhubaneswar.
• Slum upgradation program
• CSPs have been executed and updated, but with challenges and varied quality.
• Unable to verify status of slum upgradation
31
100
58
25
79
50
0
20
40
60
80
100
2013 2016
(Per
cent
age
of h
ouse
hold
s)
Water connectionSewerage connectionAny HH toilet
FY13 FY16
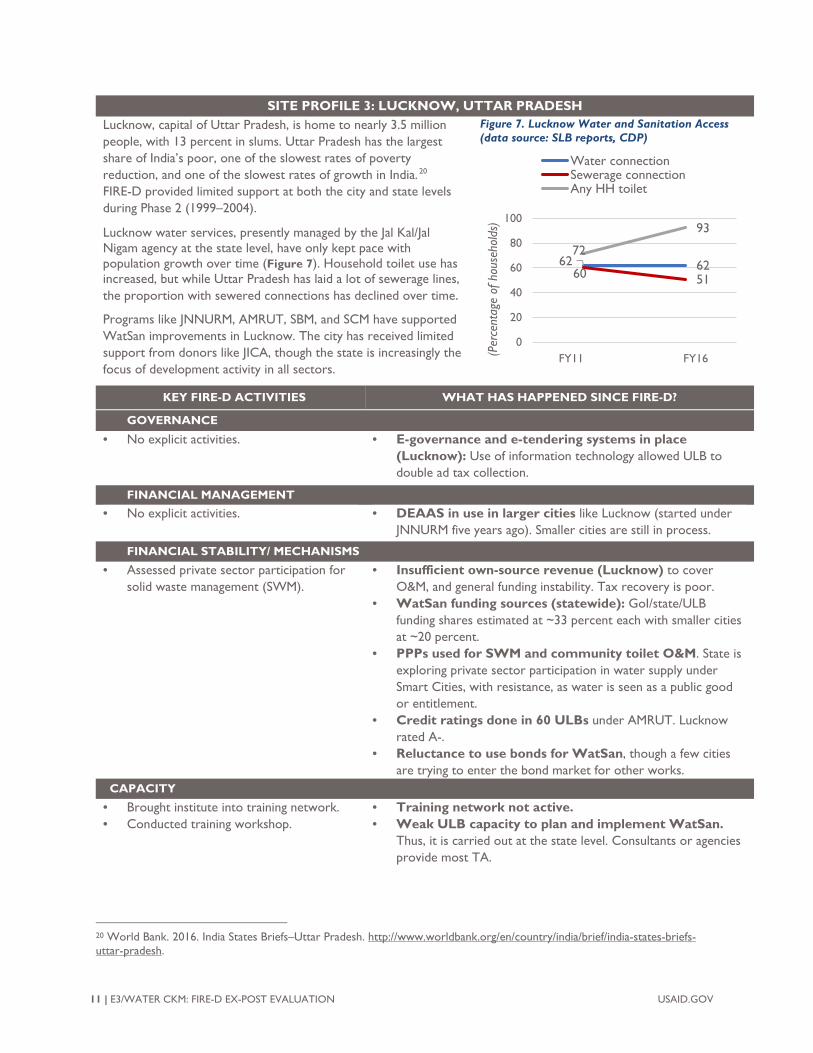
SITE PROFILE 3: LUCKNOW, UTTAR PRADESH Lucknow, capital of Uttar Pradesh, is home to nearly 3.5 million people, with 13 percent in slums. Uttar Pradesh has the largest share of India’s poor, one of the slowest rates of poverty reduction, and one of the slowest rates of growth in India. 20 FIRE-D provided limited support at both the city and state levels during Phase 2 (1999–2004).
Lucknow water services, presently managed by the Jal Kal/Jal Nigam agency at the state level, have only kept pace with population growth over time (Figure 7). Household toilet use has increased, but while Uttar Pradesh has laid a lot of sewerage lines, the proportion with sewered connections has declined over time.
Programs like JNNURM, AMRUT, SBM, and SCM have supported WatSan improvements in Lucknow. The city has received limited support from donors like JICA, though the state is increasingly the focus of development activity in all sectors.
Figure 7. Lucknow Water and Sanitation Access (data source: SLB reports, CDP)
KEY FIRE-D ACTIVITIES WHAT HAS HAPPENED SINCE FIRE-D?
GOVERNANCE • No explicit activities. • E-governance and e-tendering systems in place
(Lucknow): Use of information technology allowed ULB todouble ad tax collection.
FINANCIAL MANAGEMENT • No explicit activities. • DEAAS in use in larger cities like Lucknow (started under
JNNURM five years ago). Smaller cities are still in process.
FINANCIAL STABILITY/ MECHANISMS • Assessed private sector participation for
solid waste management (SWM).• Insufficient own-source revenue (Lucknow) to cover
O&M, and general funding instability. Tax recovery is poor.• WatSan funding sources (statewide): GoI/state/ULB
funding shares estimated at ~33 percent each with smaller citiesat ~20 percent.
• PPPs used for SWM and community toilet O&M. State isexploring private sector participation in water supply underSmart Cities, with resistance, as water is seen as a public goodor entitlement.
• Credit ratings done in 60 ULBs under AMRUT. Lucknowrated A-.
• Reluctance to use bonds for WatSan, though a few citiesare trying to enter the bond market for other works.
CAPACITY
• Brought institute into training network.• Conducted training workshop.
• Training network not active.• Weak ULB capacity to plan and implement WatSan.
Thus, it is carried out at the state level. Consultants or agenciesprovide most TA.
20 World Bank. 2016. India States Briefs–Uttar Pradesh. http://www.worldbank.org/en/country/india/brief/india-states-briefs-uttar-pradesh.
11 | E3/WATER CKM: FIRE-D EX-POST EVALUATION USAID.GOV
62 6260 51
72
93
0
20
40
60
80
100
2011 2016(Per
cent
age
of h
ouse
hold
s)
Water connectionSewerage connectionAny HH toilet
FY11 FY16
USAID.GOV E3/WATER CKM: FIRE-D EX-POST EVALUATION | 12
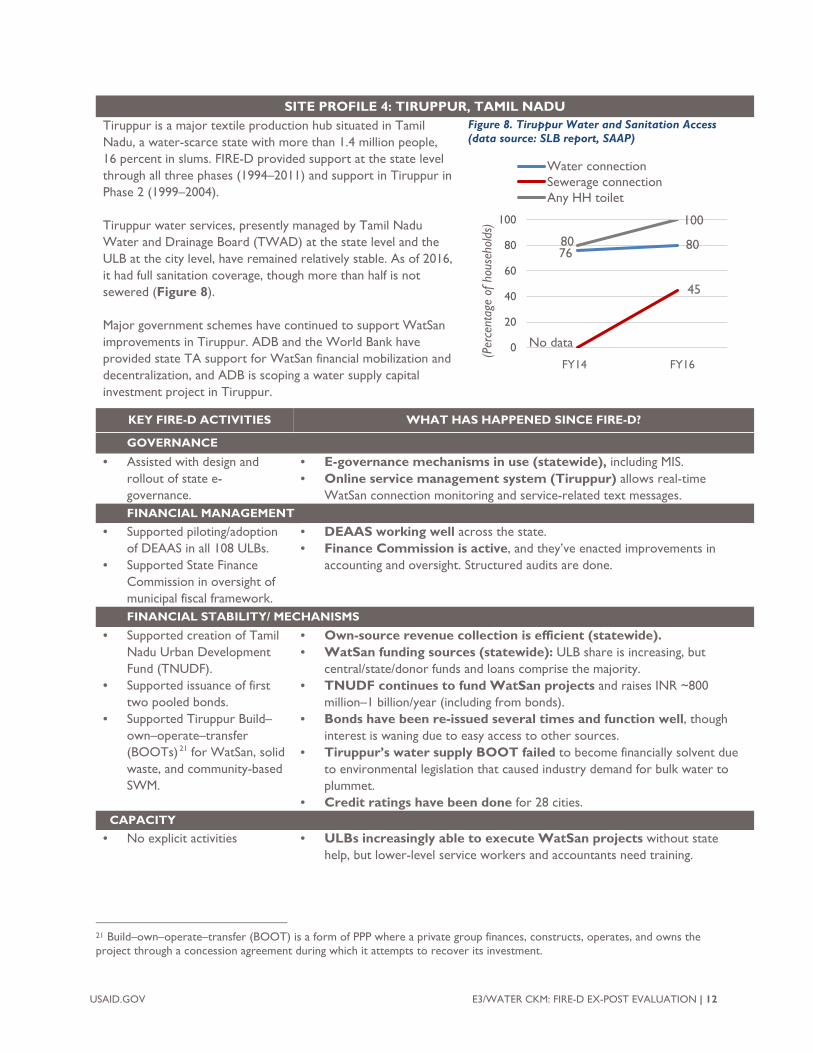
SITE PROFILE 4: TIRUPPUR, TAMIL NADU Tiruppur is a major textile production hub situated in Tamil Nadu, a water-scarce state with more than 1.4 million people, 16 percent in slums. FIRE-D provided support at the state level through all three phases (1994–2011) and support in Tiruppur in Phase 2 (1999–2004). Tiruppur water services, presently managed by Tamil Nadu Water and Drainage Board (TWAD) at the state level and the ULB at the city level, have remained relatively stable. As of 2016, it had full sanitation coverage, though more than half is not sewered (Figure 8). Major government schemes have continued to support WatSan improvements in Tiruppur. ADB and the World Bank have provided state TA support for WatSan financial mobilization and decentralization, and ADB is scoping a water supply capital investment project in Tiruppur.
Figure 8. Tiruppur Water and Sanitation Access (data source: SLB report, SAAP)
KEY FIRE-D ACTIVITIES WHAT HAS HAPPENED SINCE FIRE-D?
GOVERNANCE • Assisted with design and
rollout of state e-governance.
• E-governance mechanisms in use (statewide), including MIS. • Online service management system (Tiruppur) allows real-time
WatSan connection monitoring and service-related text messages. FINANCIAL MANAGEMENT
• Supported piloting/adoption of DEAAS in all 108 ULBs.
• Supported State Finance Commission in oversight of municipal fiscal framework.
• DEAAS working well across the state. • Finance Commission is active, and they’ve enacted improvements in
accounting and oversight. Structured audits are done.
FINANCIAL STABILITY/ MECHANISMS • Supported creation of Tamil
Nadu Urban Development Fund (TNUDF).
• Supported issuance of first two pooled bonds.
• Supported Tiruppur Build–own–operate–transfer (BOOTs)21 for WatSan, solid waste, and community-based SWM.
• Own-source revenue collection is efficient (statewide). • WatSan funding sources (statewide): ULB share is increasing, but
central/state/donor funds and loans comprise the majority. • TNUDF continues to fund WatSan projects and raises INR ~800
million–1 billion/year (including from bonds). • Bonds have been re-issued several times and function well, though
interest is waning due to easy access to other sources. • Tiruppur’s water supply BOOT failed to become financially solvent due
to environmental legislation that caused industry demand for bulk water to plummet.
• Credit ratings have been done for 28 cities. CAPACITY • No explicit activities • ULBs increasingly able to execute WatSan projects without state
help, but lower-level service workers and accountants need training.
21 Build–own–operate–transfer (BOOT) is a form of PPP where a private group finances, constructs, operates, and owns the project through a concession agreement during which it attempts to recover its investment.
7680
No data
45
80
100
0
20
40
60
80
100
2014 2016
(Per
cent
age
of h
ouse
hold
s)
Water connectionSewerage connectionAny HH toilet
FY14 FY16
13 | E3/WATER CKM: FIRE-D EX-POST EVALUATION USAID.GOV
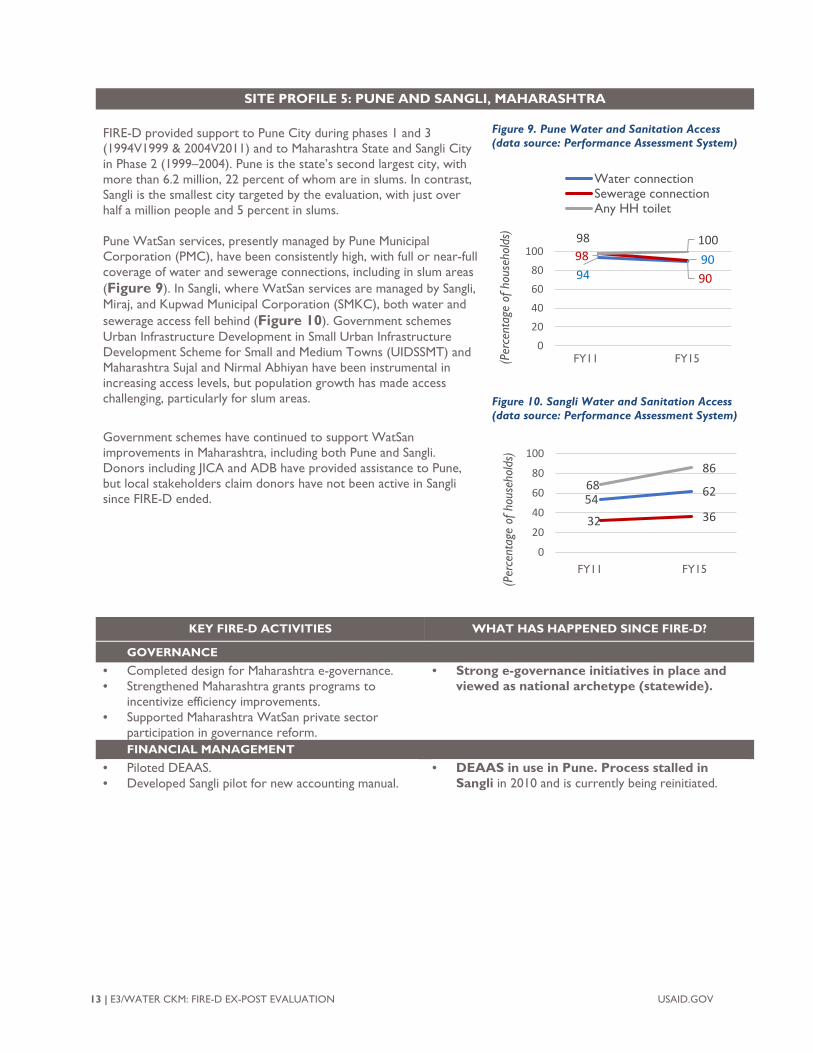
SITE PROFILE 5: PUNE AND SANGLI, MAHARASHTRA FIRE-D provided support to Pune City during phases 1 and 3 (1994V1999 & 2004V2011) and to Maharashtra State and Sangli City in Phase 2 (1999–2004). Pune is the state’s second largest city, with more than 6.2 million, 22 percent of whom are in slums. In contrast, Sangli is the smallest city targeted by the evaluation, with just over half a million people and 5 percent in slums. Pune WatSan services, presently managed by Pune Municipal Corporation (PMC), have been consistently high, with full or near-full coverage of water and sewerage connections, including in slum areas (Figure 9). In Sangli, where WatSan services are managed by Sangli, Miraj, and Kupwad Municipal Corporation (SMKC), both water and sewerage access fell behind (Figure 10). Government schemes Urban Infrastructure Development in Small Urban Infrastructure Development Scheme for Small and Medium Towns (UIDSSMT) and Maharashtra Sujal and Nirmal Abhiyan have been instrumental in increasing access levels, but population growth has made access challenging, particularly for slum areas.
Government schemes have continued to support WatSan improvements in Maharashtra, including both Pune and Sangli. Donors including JICA and ADB have provided assistance to Pune, but local stakeholders claim donors have not been active in Sangli since FIRE-D ended.
Figure 9. Pune Water and Sanitation Access (data source: Performance Assessment System)
Figure 10. Sangli Water and Sanitation Access (data source: Performance Assessment System)
KEY FIRE-D ACTIVITIES WHAT HAS HAPPENED SINCE FIRE-D?
• GOVERNANCE • Completed design for Maharashtra e-governance. • Strengthened Maharashtra grants programs to
incentivize efficiency improvements. • Supported Maharashtra WatSan private sector
participation in governance reform.
• Strong e-governance initiatives in place and viewed as national archetype (statewide).
FINANCIAL MANAGEMENT • Piloted DEAAS. • Developed Sangli pilot for new accounting manual.
• DEAAS in use in Pune. Process stalled in Sangli in 2010 and is currently being reinitiated.
949098
90
98 100
020406080
100
2011-12 2015-16(Per
cent
age
of h
ouse
hold
s)
Water connectionSewerage connectionAny HH toilet
FY11 FY15
54 62
32 36
6886
0
20
40
60
80
100
2011-12 2015-16
(Per
cent
age
of h
ouse
hold
s)
FY11 FY15
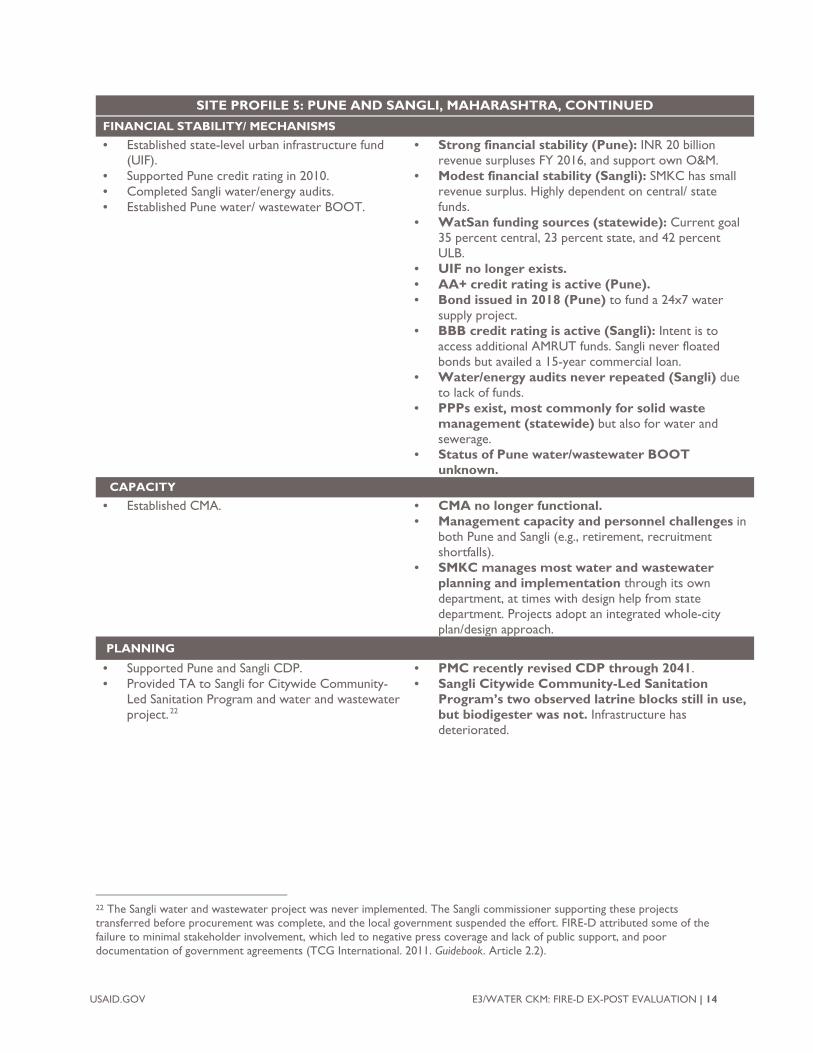
USAID.GOV E3/WATER CKM: FIRE-D EX-POST EVALUATION | 14
SITE PROFILE 5: PUNE AND SANGLI, MAHARASHTRA, CONTINUED
FINANCIAL STABILITY/ MECHANISMS • Established state-level urban infrastructure fund
(UIF).• Supported Pune credit rating in 2010.• Completed Sangli water/energy audits.• Established Pune water/ wastewater BOOT.
• Strong financial stability (Pune): INR 20 billionrevenue surpluses FY 2016, and support own O&M.
• Modest financial stability (Sangli): SMKC has smallrevenue surplus. Highly dependent on central/ statefunds.
• WatSan funding sources (statewide): Current goal35 percent central, 23 percent state, and 42 percentULB.
• UIF no longer exists.• AA+ credit rating is active (Pune).• Bond issued in 2018 (Pune) to fund a 24x7 water
supply project.• BBB credit rating is active (Sangli): Intent is to
access additional AMRUT funds. Sangli never floatedbonds but availed a 15-year commercial loan.
• Water/energy audits never repeated (Sangli) dueto lack of funds.
• PPPs exist, most commonly for solid wastemanagement (statewide) but also for water andsewerage.
• Status of Pune water/wastewater BOOTunknown.
CAPACITY
• Established CMA. • CMA no longer functional.• Management capacity and personnel challenges in
both Pune and Sangli (e.g., retirement, recruitmentshortfalls).
• SMKC manages most water and wastewaterplanning and implementation through its owndepartment, at times with design help from statedepartment. Projects adopt an integrated whole-cityplan/design approach.
PLANNING
• Supported Pune and Sangli CDP.• Provided TA to Sangli for Citywide Community-
Led Sanitation Program and water and wastewaterproject. 22
• PMC recently revised CDP through 2041.• Sangli Citywide Community-Led Sanitation
Program’s two observed latrine blocks still in use,but biodigester was not. Infrastructure hasdeteriorated.
22 The Sangli water and wastewater project was never implemented. The Sangli commissioner supporting these projects transferred before procurement was complete, and the local government suspended the effort. FIRE-D attributed some of the failure to minimal stakeholder involvement, which led to negative press coverage and lack of public support, and poor documentation of government agreements (TCG International. 2011. Guidebook. Article 2.2).
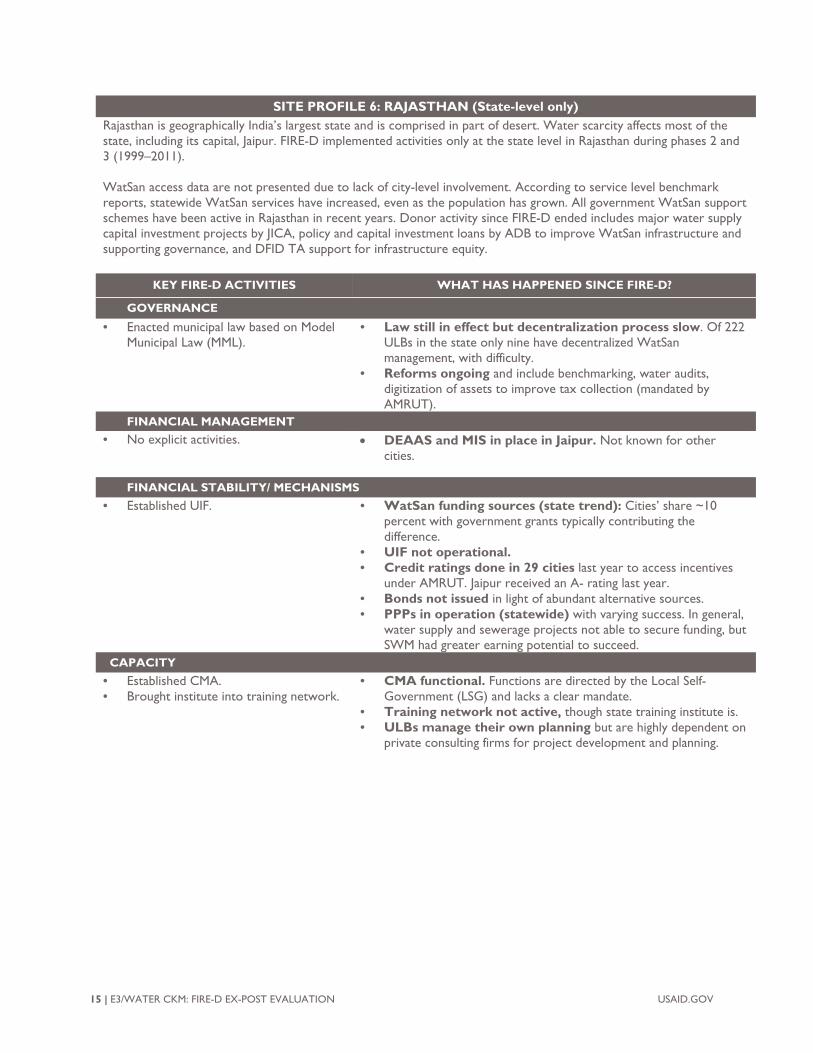
15 | E3/WATER CKM: FIRE-D EX-POST EVALUATION USAID.GOV
SITE PROFILE 6: RAJASTHAN (State-level only) Rajasthan is geographically India’s largest state and is comprised in part of desert. Water scarcity affects most of the state, including its capital, Jaipur. FIRE-D implemented activities only at the state level in Rajasthan during phases 2 and 3 (1999–2011). WatSan access data are not presented due to lack of city-level involvement. According to service level benchmark reports, statewide WatSan services have increased, even as the population has grown. All government WatSan support schemes have been active in Rajasthan in recent years. Donor activity since FIRE-D ended includes major water supply capital investment projects by JICA, policy and capital investment loans by ADB to improve WatSan infrastructure and supporting governance, and DFID TA support for infrastructure equity.
KEY FIRE-D ACTIVITIES WHAT HAS HAPPENED SINCE FIRE-D?
GOVERNANCE • Enacted municipal law based on Model
Municipal Law (MML). • Law still in effect but decentralization process slow. Of 222
ULBs in the state only nine have decentralized WatSan management, with difficulty.
• Reforms ongoing and include benchmarking, water audits, digitization of assets to improve tax collection (mandated by AMRUT).
FINANCIAL MANAGEMENT • No explicit activities. • DEAAS and MIS in place in Jaipur. Not known for other
cities.
FINANCIAL STABILITY/ MECHANISMS • Established UIF. • WatSan funding sources (state trend): Cities’ share ~10
percent with government grants typically contributing the difference.
• UIF not operational. • Credit ratings done in 29 cities last year to access incentives
under AMRUT. Jaipur received an A- rating last year. • Bonds not issued in light of abundant alternative sources. • PPPs in operation (statewide) with varying success. In general,
water supply and sewerage projects not able to secure funding, but SWM had greater earning potential to succeed.
CAPACITY • Established CMA. • Brought institute into training network.
• CMA functional. Functions are directed by the Local Self-Government (LSG) and lacks a clear mandate.
• Training network not active, though state training institute is. • ULBs manage their own planning but are highly dependent on
private consulting firms for project development and planning.
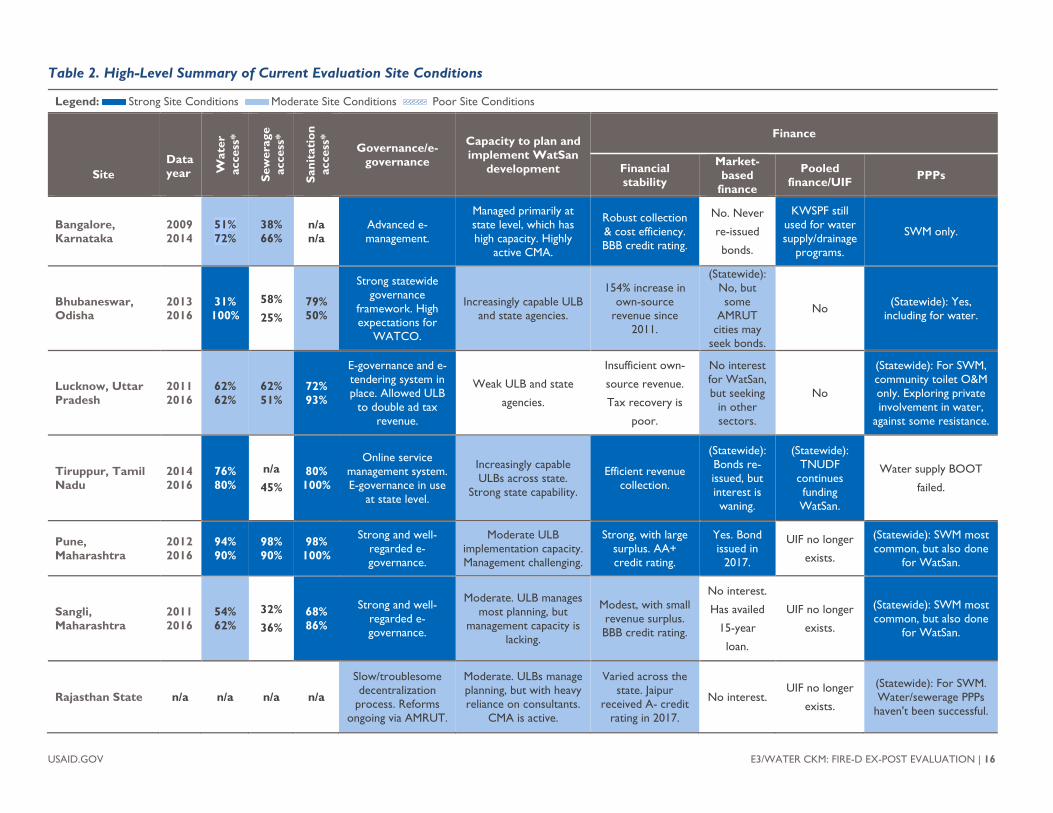
USAID.GOV E3/WATER CKM: FIRE-D EX-POST EVALUATION | 16
Table 2. High-Level Summary of Current Evaluation Site Conditions
Legend: Strong Site Conditions Moderate Site Conditions Poor Site Conditions
Site
Data year W
ater
ac
cess
*
Sew
erag
e ac
cess
*
Sani
tati
on
acce
ss*
Governance/e-governance
Capacity to plan and implement WatSan
development
Finance
Financial stability
Market-based
finance
Pooled finance/UIF PPPs
Bangalore, Karnataka
2009 2014
51% 72%
38% 66%
n/a n/a
Advanced e-management.
Managed primarily at state level, which has high capacity. Highly
active CMA.
Robust collection & cost efficiency. BBB credit rating.
No. Never
re-issued
bonds.
KWSPF still used for water supply/drainage
programs.
SWM only.
Bhubaneswar, Odisha
2013 2016
31% 100%
58% 25%
79% 50%
Strong statewide governance
framework. High expectations for
WATCO.
Increasingly capable ULB and state agencies.
154% increase in own-source
revenue since 2011.
(Statewide): No, but some
AMRUT cities may
seek bonds.
No (Statewide): Yes, including for water.
Lucknow, Uttar Pradesh
2011 2016
62% 62%
62% 51%
72% 93%
E-governance and e-tendering system in place. Allowed ULB
to double ad tax revenue.
Weak ULB and state
agencies.
Insufficient own-
source revenue.
Tax recovery is
poor.
No interest for WatSan, but seeking
in other sectors.
No
(Statewide): For SWM, community toilet O&M only. Exploring private involvement in water,
against some resistance.
Tiruppur, Tamil Nadu
2014 2016
76% 80%
n/a 45%
80% 100%
Online service management system. E-governance in use
at state level.
Increasingly capable ULBs across state.
Strong state capability.
Efficient revenue collection.
(Statewide): Bonds re-issued, but interest is waning.
(Statewide): TNUDF
continues funding WatSan.
Water supply BOOT
failed.
Pune, Maharashtra
2012 2016
94% 90%
98% 90%
98% 100%
Strong and well-regarded e-governance.
Moderate ULB implementation capacity. Management challenging.
Strong, with large surplus. AA+ credit rating.
Yes. Bond issued in
2017.
UIF no longer
exists.
(Statewide): SWM most common, but also done
for WatSan.
Sangli, Maharashtra
2011 2016
54% 62%
32% 36%
68% 86%
Strong and well-regarded e-governance.
Moderate. ULB manages most planning, but
management capacity is lacking.
Modest, with small revenue surplus. BBB credit rating.
No interest.
Has availed
15-year
loan.
UIF no longer
exists.
(Statewide): SWM most common, but also done
for WatSan.
Rajasthan State n/a n/a n/a n/a
Slow/troublesome decentralization
process. Reforms ongoing via AMRUT.
Moderate. ULBs manage planning, but with heavy reliance on consultants.
CMA is active.
Varied across the state. Jaipur
received A- credit rating in 2017.
No interest. UIF no longer
exists.
(Statewide): For SWM. Water/sewerage PPPs
haven't been successful.
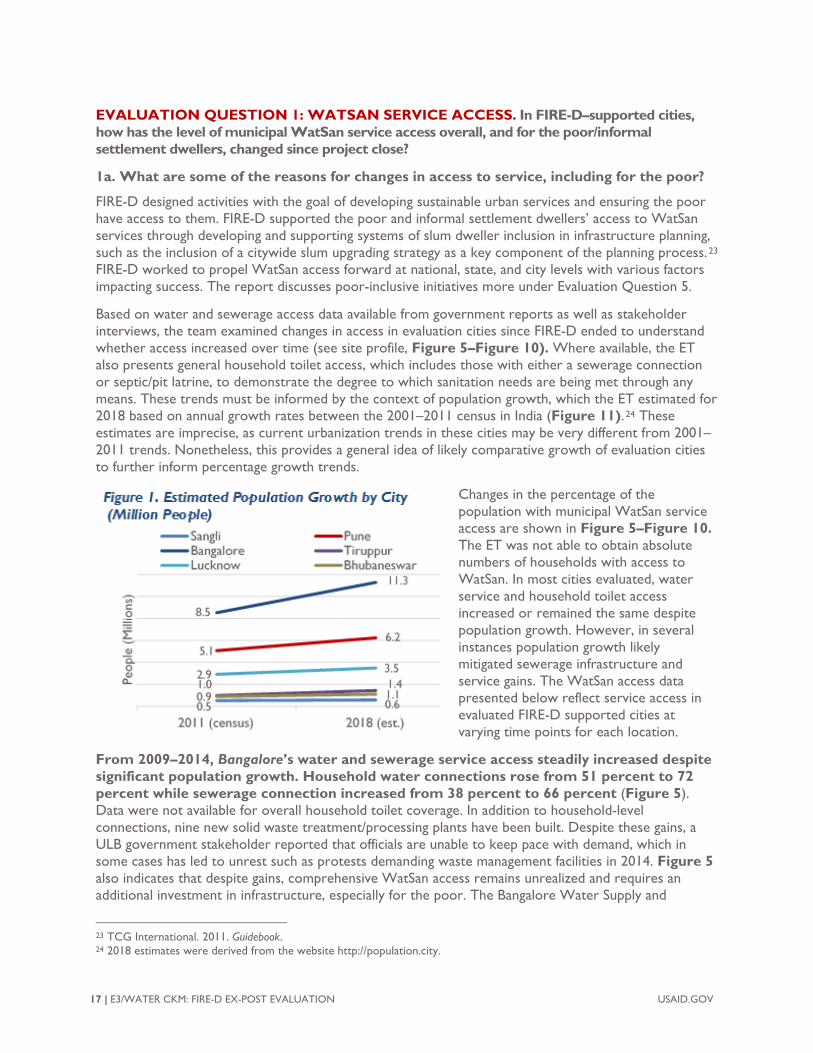
EVALUATION QUESTION 1: WATSAN SERVICE ACCESS. In FIRE-D–supported cities, how has the level of municipal WatSan service access overall, and for the poor/informal settlement dwellers, changed since project close?
1a. What are some of the reasons for changes in access to service, including for the poor?
FIRE-D designed activities with the goal of developing sustainable urban services and ensuring the poor have access to them. FIRE-D supported the poor and informal settlement dwellers’ access to WatSan services through developing and supporting systems of slum dweller inclusion in infrastructure planning, such as the inclusion of a citywide slum upgrading strategy as a key component of the planning process. 23 FIRE-D worked to propel WatSan access forward at national, state, and city levels with various factors impacting success. The report discusses poor-inclusive initiatives more under Evaluation Question 5.
Based on water and sewerage access data available from government reports as well as stakeholder interviews, the team examined changes in access in evaluation cities since FIRE-D ended to understand whether access increased over time (see site profile, Figure 5–Figure 10). Where available, the ET also presents general household toilet access, which includes those with either a sewerage connection or septic/pit latrine, to demonstrate the degree to which sanitation needs are being met through any means. These trends must be informed by the context of population growth, which the ET estimated for 2018 based on annual growth rates between the 2001–2011 census in India (Figure 11). 24 These estimates are imprecise, as current urbanization trends in these cities may be very different from 2001–2011 trends. Nonetheless, this provides a general idea of likely comparative growth of evaluation cities to further inform percentage growth trends.
Changes in the percentage of the population with municipal WatSan service access are shown in Figure 5–Figure 10. The ET was not able to obtain absolute numbers of households with access to WatSan. In most cities evaluated, water service and household toilet access increased or remained the same despite population growth. However, in several instances population growth likely mitigated sewerage infrastructure and service gains. The WatSan access data presented below reflect service access in evaluated FIRE-D supported cities at varying time points for each location.
From 2009–2014, Bangalore’s water and sewerage service access steadily increased despite significant population growth. Household water connections rose from 51 percent to 72 percent while sewerage connection increased from 38 percent to 66 percent (Figure 5). Data were not available for overall household toilet coverage. In addition to household-level connections, nine new solid waste treatment/processing plants have been built. Despite these gains, a ULB government stakeholder reported that officials are unable to keep pace with demand, which in some cases has led to unrest such as protests demanding waste management facilities in 2014. Figure 5 also indicates that despite gains, comprehensive WatSan access remains unrealized and requires an additional investment in infrastructure, especially for the poor. The Bangalore Water Supply and
23 TCG International. 2011. Guidebook. 24 2018 estimates were derived from the website http://population.city.
17 | E3/WATER CKM: FIRE-D EX-POST EVALUATION USAID.GOV
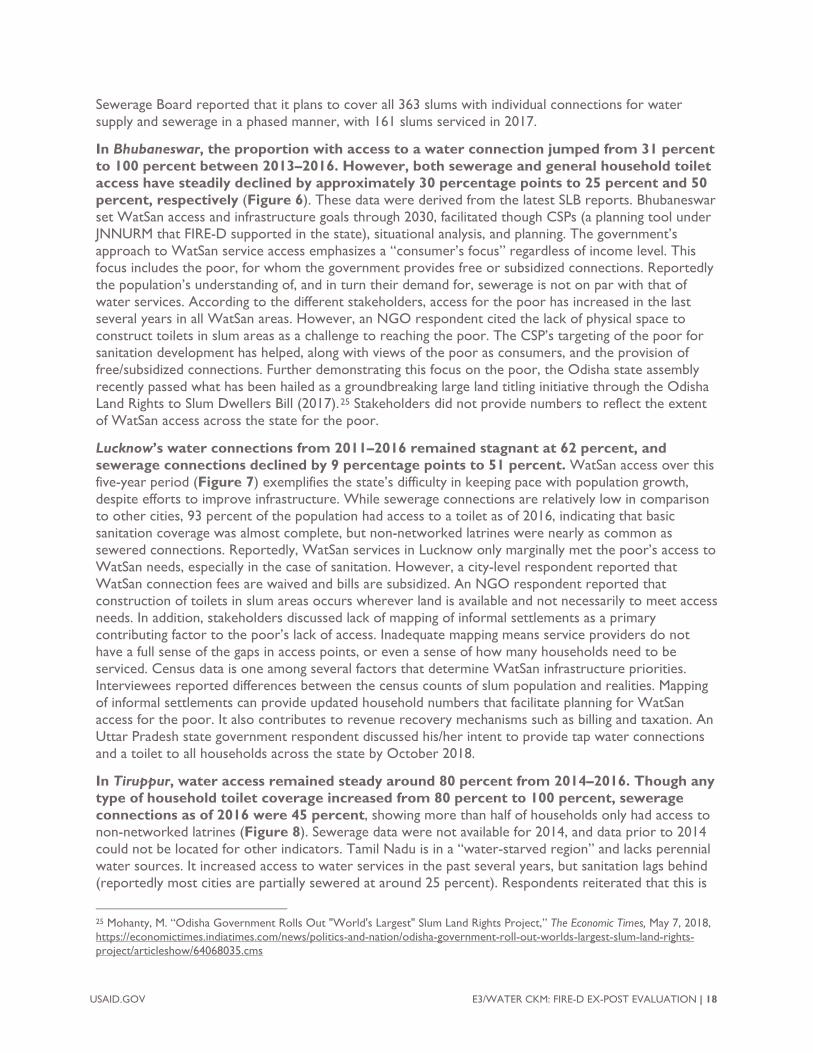
Sewerage Board reported that it plans to cover all 363 slums with individual connections for water supply and sewerage in a phased manner, with 161 slums serviced in 2017.
In Bhubaneswar, the proportion with access to a water connection jumped from 31 percent to 100 percent between 2013–2016. However, both sewerage and general household toilet access have steadily declined by approximately 30 percentage points to 25 percent and 50 percent, respectively (Figure 6). These data were derived from the latest SLB reports. Bhubaneswar set WatSan access and infrastructure goals through 2030, facilitated though CSPs (a planning tool under JNNURM that FIRE-D supported in the state), situational analysis, and planning. The government’s approach to WatSan service access emphasizes a “consumer’s focus” regardless of income level. This focus includes the poor, for whom the government provides free or subsidized connections. Reportedly the population’s understanding of, and in turn their demand for, sewerage is not on par with that of water services. According to the different stakeholders, access for the poor has increased in the last several years in all WatSan areas. However, an NGO respondent cited the lack of physical space to construct toilets in slum areas as a challenge to reaching the poor. The CSP’s targeting of the poor for sanitation development has helped, along with views of the poor as consumers, and the provision of free/subsidized connections. Further demonstrating this focus on the poor, the Odisha state assembly recently passed what has been hailed as a groundbreaking large land titling initiative through the Odisha Land Rights to Slum Dwellers Bill (2017).25 Stakeholders did not provide numbers to reflect the extent of WatSan access across the state for the poor.
Lucknow’s water connections from 2011–2016 remained stagnant at 62 percent, and sewerage connections declined by 9 percentage points to 51 percent. WatSan access over this five-year period (Figure 7) exemplifies the state’s difficulty in keeping pace with population growth, despite efforts to improve infrastructure. While sewerage connections are relatively low in comparison to other cities, 93 percent of the population had access to a toilet as of 2016, indicating that basic sanitation coverage was almost complete, but non-networked latrines were nearly as common as sewered connections. Reportedly, WatSan services in Lucknow only marginally met the poor’s access to WatSan needs, especially in the case of sanitation. However, a city-level respondent reported that WatSan connection fees are waived and bills are subsidized. An NGO respondent reported that construction of toilets in slum areas occurs wherever land is available and not necessarily to meet access needs. In addition, stakeholders discussed lack of mapping of informal settlements as a primary contributing factor to the poor’s lack of access. Inadequate mapping means service providers do not have a full sense of the gaps in access points, or even a sense of how many households need to be serviced. Census data is one among several factors that determine WatSan infrastructure priorities. Interviewees reported differences between the census counts of slum population and realities. Mapping of informal settlements can provide updated household numbers that facilitate planning for WatSan access for the poor. It also contributes to revenue recovery mechanisms such as billing and taxation. An Uttar Pradesh state government respondent discussed his/her intent to provide tap water connections and a toilet to all households across the state by October 2018.
In Tiruppur, water access remained steady around 80 percent from 2014–2016. Though any type of household toilet coverage increased from 80 percent to 100 percent, sewerage connections as of 2016 were 45 percent, showing more than half of households only had access to non-networked latrines (Figure 8). Sewerage data were not available for 2014, and data prior to 2014 could not be located for other indicators. Tamil Nadu is in a “water-starved region” and lacks perennial water sources. It increased access to water services in the past several years, but sanitation lags behind (reportedly most cities are partially sewered at around 25 percent). Respondents reiterated that this is
25 Mohanty, M. “Odisha Government Rolls Out "World's Largest" Slum Land Rights Project,” The Economic Times, May 7, 2018, https://economictimes.indiatimes.com/news/politics-and-nation/odisha-government-roll-out-worlds-largest-slum-land-rights-project/articleshow/64068035.cms
USAID.GOV E3/WATER CKM: FIRE-D EX-POST EVALUATION | 18
true in slum areas as well. An NGO respondent also brought attention to the scarcity of space in slum areas for sewerage networks and indicated that they thought that the government was doing its part to address these challenges. Cities in Tamil Nadu source water from long distances, sometimes using desalination plants. The state reported improvements in state-level piped water access (e.g., reaching ~50-60 percent of the population), but challenges remain to reach the “last person.” Houses of 500 ft2 or less receive water and sewerage subsidies in some locations. According to a state financing respondent, the treatment of sewerage and water declined and is likely attributable to population growth outpacing infrastructure development.
In Maharashtra, Pune has maintained very high levels of WatSan service access, including in slums, with all overall indicators at or above 90 percent between 2012–2016 (Figure 9). Respondents identified that almost every household has a connection to a water tap and access to toilets (household and community), with many slum households directly connected to a sewerage system due to a long history of slum engagement. In addition, there is a robust solid waste management system in place. Respondents reported that the reduction in water and sewerage connections by 4 and 8 percentage points, respectively, between 2012–2016 was due to population growth outpacing demand.
Sangli, Maharashtra water connection access increased marginally from 54 to 62 percent between 2012–2016 while sewerage connections were low at 36 percent, representing only a 4 percentage point increase over the period (Figure 10). Overall household toilet access increased from 68 percent to 86 percent, meaning most toilets are not connected to sewerage lines. The difference in WatSan access between Pune and Sangli illustrates the challenges small cities face due to lower capacity and resources alongside a lack of political support from state government.
The ET assessed Rajasthan’s state-level access qualitatively, as FIRE-D did not have city-level involvement. According to stakeholders, access to WatSan increased substantially (including for the poor) even as population increased. Approximately 100 cities transitioned to underground sewerage. In addition, access to consistent water supply has improved due to capital infrastructure development such as a JICA–supported transition from underground to surface source water supply. However, cities do not typically provide household water connections in slum areas because of insecure land tenure. In addition, government regulations and seasonal variation in supply further exacerbate challenges in water access and consistent water supply for the poor. Efforts to partially address such challenges include the use of free community standpoints and private water tanker contractors in summer months when supply is most constrained.
The WatSan access data presented reflect service access in evaluated FIRE-D cities at varying time points per city only up to 2016, making inter-city comparisons challenging. Water access has increased in Bangalore, Bhubaneswar, and Tiruppur whereas it remained relatively constant in Sangli and Lucknow and slightly declined in Pune, though still near full coverage. With the exception of Lucknow, the indicator for access to any household toilet has increased or remained steady over the last several years, likely influenced by intensive GoI efforts to achieve sanitation coverage through programs like SBM. The gap in sewered connections reflects more difficult infrastructure requirements. With the exception of Bangalore, which saw a spike, and Sangli, with a marginal increase in sewerage connections, all other cities (Bhubaneswar, Lucknow, Pune) had a decrease in the proportion of households with access.
Several overarching themes emerged from interviews with stakeholders across states and cities. First, population growth, at times due to expansion of city boundaries, outpaced infrastructure development in several cases, with implications for the percent of population with access to WatSan services. In addition, the emphasis within discussions on poor communities’ access to infrastructure varied by city. For example, Maharashtra, Tamil Nadu, Odisha, and Uttar Pradesh had a strong pro-poor focus, but Karnataka and Rajasthan less so. Commonly cited challenges that impede sustained or increased access included: insufficient funding for major infrastructure projects; lack of infrastructure operations and
19 | E3/WATER CKM: FIRE-D EX-POST EVALUATION USAID.GOV
maintenance or availability of O&M funds; lack of willingness to pay for sewerage and in some instances water connections (some see these as an entitlement that should be free); and inadequate slum mapping to identify needs. NGOs across several states and national-level respondents noted that it is critical to address land tenure issues and space constraints in slum areas to expand WatSan access.
According to interviews with stakeholders at the national level, decentralization plays a key role in facilitating access in cities. But the process also presents challenges because GoI requirements do not align with human resources capacity and technical proficiency at the local level. This has resulted in a cyclical reliance on consultants. Some stakeholders also pointed to challenges related to delays in enacting decentralization of service provision and planning to the ULB level, which was mandated in India’s 74th Constitutional Amendment Act, 1992, and operationalized with FIRE-D support. Some local decision-makers complained that they were involved too late during infrastructure planning processes and generally had constrained autonomy. These issues potentially impacted ULBs’ abilities to effectively plan and implement infrastructure improvements aligned with local needs.
EVALUATION QUESTION 2: GOVERNANCE, PLANNING, AND PROJECT DEVELOPMENT. To what extent have FIRE-D’s accomplishments related to governance, planning, and project development in supported cities and states been sustained?
2b: What influenced sustainability/non-sustainability of each approach?
FIRE-D worked to improve state and ULB infrastructure planning and project development through activities such as introducing supportive governance improvements, strengthening financial management, introducing capacity building support mechanisms, and supporting infrastructure planning processes under JNNURM. The ET followed up on selected activities that FIRE-D had completed at each site to understand whether they had been sustained, and which factors may have contributed to the sustainability. The team tracks the sustainability of financial mechanisms such as municipal bonds, credit ratings, and PPPs under Evaluation Question 4.
Across all of the components detailed below, respondents frequently point to the influence of GoI schemes JNNURM and AMRUT in shaping how WatSan development is done. FIRE-D’s direct contributions to developing JNNURM, and JNNURM’s subsequent re-creation as AMRUT indicates a sustainable influence from FIRE-D, though not explicit (Box 1).
Box 1. Tracing the FIRE-D Thumbprint Through Government Schemes
USAID.GOV E3/WATER CKM: FIRE-D EX-POST EVALUATION | 20
GOVERNANCE
FIRE-D believed sustainable infrastructure development required a foundation of good governance. Specific governance-oriented activities at selected evaluation sites included decentralization support, e-governance, and corporatizing one water utility.
Decentralization (Model Municipal Law). To support decentralization as a cornerstone of improved WatSan development, and in accordance with India’s 74th Constitutional Amendment, MoUD asked FIRE-D in 2003 to work with the National Institute of Urban Affairs (NIUA) and the Times Research Foundation to develop the MML. This law enables states to tailor their own municipal acts to facilitate decentralization of powers for urban development to local governments. Among selected evaluation sites, Rajasthan is the only one documented to have used the MML. It served as a template for its Rajasthan Municipalities Act (2009) which transferred functions to local government, introduced unit area–based land taxes, promoted improved accounting and related accountability, mandated transparency, encouraged PPPs, and formed bodies for local participation. In contrast to the decentralization objective, the Government of Rajasthan retained water supply and sewerage functions at the state level unless municipalities demonstrated capacity, as this was not thought to be a core ULB function.26
The ET learned that the Rajasthan Municipalities Act is still in effect, and respondents in state government noted that decentralization is now expanding to cover WatSan functions. However, out of 222 municipalities in Rajasthan, only nine ULBs have decentralized these functions, and a state government respondent claimed all decentralization efforts were going very poorly due to limited personnel and management capacity.
Beyond the MML, the status and realization of decentralization varies by state, and it is generally acknowledged that the process will take time. Respondents across states touched on different impacts of decentralization. For example, in Uttar Pradesh, a respondent discussed the positive impacts that decentralization had in empowering panchayats27 in rural areas to voice their needs. The Karnataka Urban Water Supply and Drainage Board noted that the 74th Constitutional Amendment mandating decentralization led to confusion about bulk water provisioning roles. Therefore, the board issued alternative guidance that it would be responsible for bulk provision whereas ULBs would take up distribution to consumers.
Three primary themes that emerged from a broad spectrum of respondent interviews across evaluation sites related to ULB financial control, decision-making autonomy, and capacity challenges. Respondents cited revenue recovery and the ability to control finances as a missing but key component of ULBs’ ability to actualize decentralized power. A national-level respondent cited the lack of decision-making autonomy and shared the opinion that there is not much of a decentralized urban vision except in Karnataka. In addition, two national-level respondents cited the reform agendas and vision held at the central level as a barrier to decentralization. Several respondents from different states reinforced this view and cited the continued need for actual decentralized power. Currently, this is not happening, with states (and to a lesser extent central government) playing a large role in infrastructure planning and projections. Several state-level respondents also indicated that a common theme is the lack of capacity at the ULB level, where both personnel and training are needed to implement projects. Also, respondents indicated that states are playing a large role in managing staff instead of ULB governments.
E-Governance. In line with GoI initiatives supporting e-governance, FIRE-D helped MoUD design theprocess and implementation strategy for e-governance technology that links service management,
26 TCG International. 2011. Guidebook. Article 1.3. 27 Panchayats are elected village-level government bodies.
21 | E3/WATER CKM: FIRE-D EX-POST EVALUATION USAID.GOV
payments, information, and feedback mechanisms in one place. This approach was thought to enhance data flow, local government decision-making, accountability to customers, and ultimately efficiency in operations. 28 Project records indicate FIRE-D supported design and/or rollout of e-governance at evaluation sites in Bangalore, Tamil Nadu, and Maharashtra. As shown in its site profile, Bangalore presently has very advanced and effective usage of meters, online payment, and real-time data tracking, which has been operational since it was adopted under JNNURM (the ET presumes with FIRE-D support). Not only has this been sustained, but respondents credited these tools with supporting a reduction in NRW from 51 percent to 27 percent. Maharashtra’s current e-governance initiatives such as online billing, service tracking, and complaint mechanisms are robust and nationally esteemed,29 and Tamil Nadu continues to use similar e-governance mechanisms. In Tiruppur, stakeholders noted an online WatSan service management system where residents can request a connection and monitor or request services in real time using mobile text messages. It is challenging to assess the sustainability of FIRE-D’s efforts because their specific activities or platforms were not documented, and therefore, it is not clear which present conditions tie to FIRE-D. AMRUT has continued to promote e-governance initiatives. Nonetheless, the fact that numerous stakeholders pointed to positive outcomes of e-governance on revenue and collection efficiency helps to validate this general approach.
Corporatization of Water Supply Services. Beginning in 2006, FIRE-D supported the Government of Odisha in a WatSan corporatization pilot to serve Bhubaneswar that embodied FIRE-D’s multipronged reform approach to address financial management, financial mobilization, and service regulation. FIRE-D completed assessments and facilitated a number of changes, including legal framing with a goal of improving efficiency under a government-owned corporate entity. The idea was that a specialized entity with a business-minded approach could focus and more efficiently address skills, systems, finance, and service needs. This case is well documented in the implementer’s culminating guidebook.30 While progress was made, according to this document and evaluation interviews, the corporatization process was laden with numerous administrative and political hurdles such that it was clear corporatization would not be achieved by the time FIRE-D ended in 2011. One major challenge was strong political resistance to any notion of water privatization. Through this effort, FIRE-D implementers learned about the need for both legal and political approval for corporatization, the importance of employee support for any changes in compensation plans, the long time required to complete fixed asset valuation, and the need for continuous employee training over several years. At the conclusion of FIRE-D, several corporatization requirements were still pending. The effort still had not garnered political backing for a mechanism to revise tariffs, a regulatory framework for contracts, and basic local government capacity to manage performance contracts. ET interviews with local and state stakeholders revealed that the process of corporatization continued after FIRE-D ended, but it only reached its finalization six years later, with the state PHEO handing off operations to the corporatized entity, called the WATCO, in April 2018. WATCO has functional autonomy through a board of directors and has plans to achieve sustainable cost recovery within three years.
Several factors contributed to the eventual completion of this process. Inter-donor coordination proved helpful. As the activity was closing, FIRE-D orchestrated a hand-off to JICA to continue unfinished work on WATCO development, seeing it would be a very long-term outcome. DFID has also been highly involved in supporting improved WATCO functions as part of its large Odisha government capacity building TA program that began in 2014 to support adoption of reforms mandated by AMRUT and other government schemes. WATCO’s perseverance as well as its stated intent to apply USAID’s accounting, budgeting, and costing manuals might also be credited in part to the fact that a former FIRE-D consultant later became WATCO’s chief utility management consultant. His presence as a consistent champion for corporatization and FIRE-D approaches likely aided the process. An Odisha respondent
28 TCG International. 2011. Guidebook. Article 4.5. 29 More information available at http://www.doingbusinessinmaharashtra.org/egovernance_policy.aspx 30 TCG International. 2011. Guidebook. Article 4.4.
USAID.GOV E3/WATER CKM: FIRE-D EX-POST EVALUATION | 22
also noted that the corporatization process languished after the proactive secretary with whom FIRE-D worked left office. Following several election cycles in which elected officials did not prioritize corporatization, the new incumbent secretary has proactively supported it. His consistent tenure over the past three years has also provided stability to facilitate the transition.
FINANCIAL MANAGEMENT
Double-Entry Accrual-Based Accounting System. In support of its tenet of city financial viability, FIRE-D implemented accounting reforms across several ULBs and state government bodies. In 1999, MoUD asked FIRE-D to develop and pilot DEAAS in Tamil Nadu municipalities; the World Bank–funded Urban Development Project implemented the system. This led to FIRE-D introducing DEAAS to Maharashtra and several other locations. In addition, FIRE-D collaborated with the Institute of Chartered Accountants of India to develop a manual called the “Technical Guide on Accounting and Financial Reporting by Urban Local Bodies in India.”31 The ET followed up on the status of these reforms where implemented under FIRE-D and inquired about their application more broadly in India.
Among evaluation sites, project records showed that FIRE-D directly introduced DEAAS in Bhubaneswar,32 to all Tamil Nadu ULBs, and to selected Maharashtra ULBs. The ET confirmed that DEAAS was still being used in Bhubaneswar, all Tamil Nadu ULBs, and in Pune. While Sangli began the transition process, it stalled in 2010 due to disagreements with the private agency hired for the purpose. This agency departed, taking with it all of the ULB’s past financial data needed to establish DEAAS. The process of double entry is now being reinitiated. Large Uttar Pradesh ULBs like Lucknow, some Karnataka ULBs including Bangalore, and Jaipur, Rajasthan, also use DEAAS. The major impetus for proliferation of DEAAS is the GoI decision to mandate that ULBs use DEAAS to secure additional financial incentives under JNNURM and now AMRUT.
Manuals. Beyond the national accounting manual, FIRE-D also developed a financial management manual for Odisha and trained state utility staff on its use. It also piloted an accounting manual in Sangli. A former FIRE-D implementer claimed the national accounting manual is still in use, though the ET was not able to confirm this with other stakeholders. An Odisha respondent said FIRE-D’s financial manual is still in use, but it is outdated and hasn’t been updated regularly as needed.
CAPACITY BUILDING
Many of FIRE-D’s activities aimed to address government capacity gaps at the local level to institutionalize the reform agenda and plan and manage WatSan infrastructure development. USAID issued a grant to NIUA to complete knowledge dissemination, research, and policy promotion related to FIRE-D’s work.33 It also established CMAs and developed an urban management training network.
General Capacity Levels. Looking at the broad capacity landscape across all evaluation sites, the common sentiment among respondents was that government capacity to plan and manage urban WatSan development has improved over time since FIRE-D ended, but it remains low in many places. Since FIRE-D ended, state and local governments have consistently relied on TA support from other donors to facilitate adoption of government-mandated reforms. Credit rating agency, donor, and government representatives alike noted that while they have made progress, capacity-building support from external groups will be needed for years to come, given the magnitude of change required to attain self-sufficiency. In general, capacity gaps are seen in finance, project structuring, design, O&M,
31 TCG International. 2011. Guidebook. Article 4.2. 32 In its final report, FIRE-D noted that Bhubaneswar had not yet fully adopted DEAAS due to significant political and bureaucratic delays, and the ULB was still operating single-entry cash-based accounting at the time FIRE-D ended (TCG International. 2011. FIRE-D Phase III Draft Close Out Report.). 33 TCG International. 2011. Guidebook. Article 2.1.
23 | E3/WATER CKM: FIRE-D EX-POST EVALUATION USAID.GOV
engineering, and IT, although it varies across ULBs. Government bodies in larger cities are typically better equipped. Many government bodies with limited internal capacity to complete specialized technical planning or project design functions reported that they opted to engage consulting firms to carry out these functions. FIRE-D acknowledged that consultants are a reasonable way for cities to complete specialized tasks; however, it cautioned against relying on consultants alone for key planning processes like City Development Plans.34 Several national-level respondents also touched on the role of special purpose vehicles—legal entities established to fulfill specified functions such as project implementation—to fill capacity gaps to allow for project planning, management, and responsible management of funds.
The ET inquired about the degree to which ULBs and states complete their own WatSan development plans or project plans, as an indicator of high capacity. The depth of responses varied, as some respondents were not aware of capacity across all areas of planning and management at both the ULB and state levels. Therefore, summaries below may be an incomplete picture of these sites.
Karnataka appears to have strong capacity, as a variety of state agencies typically take on WatSan planning and project development functions alone. One advantage is the strong role the Karnataka Urban Infrastructure Development and Finance Corporation (KUIDFC) plays. This parastatal financial institution supports infrastructure planning, project design and implementation, financing, and other technical needs for cities. Given its specialized function, it is able to attract and retain highly qualified staff with sufficient expertise to carry out WatSan development across the state.
In Odisha, through intensive capacity support from DFID over the past several years across the state, a stakeholder noted that Bhubaneswar government stakeholders have demonstrated highly impressive and creative planning, resource leveraging, and prioritization for housing and Smart Cities Mission projects, which has been a model for other Odisha cities. However, the ULB struggles with daily management functions. A Bhubaneswar government respondent noted that weak ULB capacity creates a cycle in which it is difficult to attract capable staff from the state level. This was one impetus for establishing a corporatized WATCO. Odisha is trying to create a state-level municipal cadre with DFID support to provide specialized skills for ULB management.
In Uttar Pradesh, stakeholders noted very low capacity across the state and perennial recruitment challenges. Capacity to plan and execute development projects is weak, and Lucknow’s low-level staff capacity to manage things like finances and technology is limited. Although it has an entity responsible for training, it is not always timely or geared to meet new and emerging challenges.
In Tamil Nadu, a state government respondent noted that cities across the state are increasingly taking on WatSan project execution on their own without wanting to run it through the TWAD, a state agency that provides specialized planning and implementation support to ULBs. At the state level, while TWAD outsources complex projects like a desalination plant, the board has otherwise been able to prepare project documents like detailed project reports and contractor request for proposals on its own. However, a Tiruppur government representative noted it outsourced a recent detailed project report to a consultant. A TWAD representative said the capacity gap for ULBs is more pronounced in sewerage than in water supply and pertains to low-level job roles on the ground. Meanwhile, the Tamil Nadu Urban Finance and Infrastructure Development Corporation is responsible for designing the financial aspects of complex and large projects.
34 TCG International. 2011. Guidebook. Chapter 3.
USAID.GOV E3/WATER CKM: FIRE-D EX-POST EVALUATION | 24
Maharashtra stakeholders reported an increasing ability to plan and manage new development, but with challenges. SMKC manages most of its own WatSan infrastructure, though on-the-ground management capacity is challenging in terms of number of personnel and expertise. Pune Municipal Corporation has managed project implementation more so than planning; however, a city-level stakeholder noted major challenges with implementation due to lack of solid waste management professionals and civil and environmental engineers. Staff capacity building is a strong need, though bureaucratic rules restricting recruitment has stifled Pune’s ability to ensure adequate staffing.
Rajasthan ULBs often complete their own planning, but with heavy use of consultants. Consultant support for discrete planning or design activities is not necessarily problematic and could be a viable long-term strategy to overcome ingrained capacity challenges within ULB and state institutions.
Training Networks. Project records showed FIRE-D brought training institutes from Karnataka, Uttar Pradesh, and Rajasthan into the urban management training network. The ET confirmed that this network is no longer active, and stakeholders at state training institutes were not familiar enough to explain why it ended.
City Manager Associations. In its second phase, FIRE-D introduced CMAs as a state-level networking forum to allow urban management professionals and officials to exchange reform experiences and learn from each other. Local government members were to use CMAs as a unified platform for peer learning, training, technical assistance, and advocacy of common goals. Specific functions included capacitating and training the state government, facilitating development of human resource improvement plans for ULBs, and preparing state- and city-level plans and SLBs, especially in the WatSan sector.35
Among evaluation sites, FIRE-D established CMAs in Rajasthan, Karnataka, and Maharashtra. Through interviews with CMA members and other state and local government stakeholders, the ET learned that over the years the role of CMAs has diversified, and its manifestation has differed across states. The Maharashtra CMA has been disbanded and is no longer functional. Unfortunately, no respondents had institutional memory to explain why it failed.
The CMA Karnataka (CMAK) assumes the most active role among the three examples. It plays a proactive role in capacity building and learning across the WatSan sector. All 277 cities supply members to CMAK, and the institution financially sustains itself through membership fees. CMAK engages with the ULBs in both technical and training capacities. It actively trains state and ULB officials under both government schemes and specific projects. Trainings facilitate the handholding process for specific government schemes such as SBM and AMRUT. CMAK conducts project-specific trainings on sectoral domains such as solid waste management and water efficiency. It has also been instrumental in the development of the State Sanitation Strategy, the second stage of the CSPs, a manual for SLBs, documentation of best practices across cities, and organization of exposure visits of sanitation workers to foreign cities. CMAK representatives noted some challenges. Its bylaws fail to accord it an independent status, which restricts its autonomy and increases its dependence on strong leadership and independent capacities of the authorities. Accordingly, the CMAK went through several years of low functionality under a less engaged board. However, the CMAK revived itself through changes in leadership and personnel since 2013, and currently functions well and effectively. Further, the lack of alternate sources of funds also constrains CMAK’s level of activity. While membership fees sustain basic activities, additional activities such as exposure visits to other cities require alternative funding, which is not always available.
35 TCG International. 2011. Guidebook. Article 7.1.
25 | E3/WATER CKM: FIRE-D EX-POST EVALUATION USAID.GOV
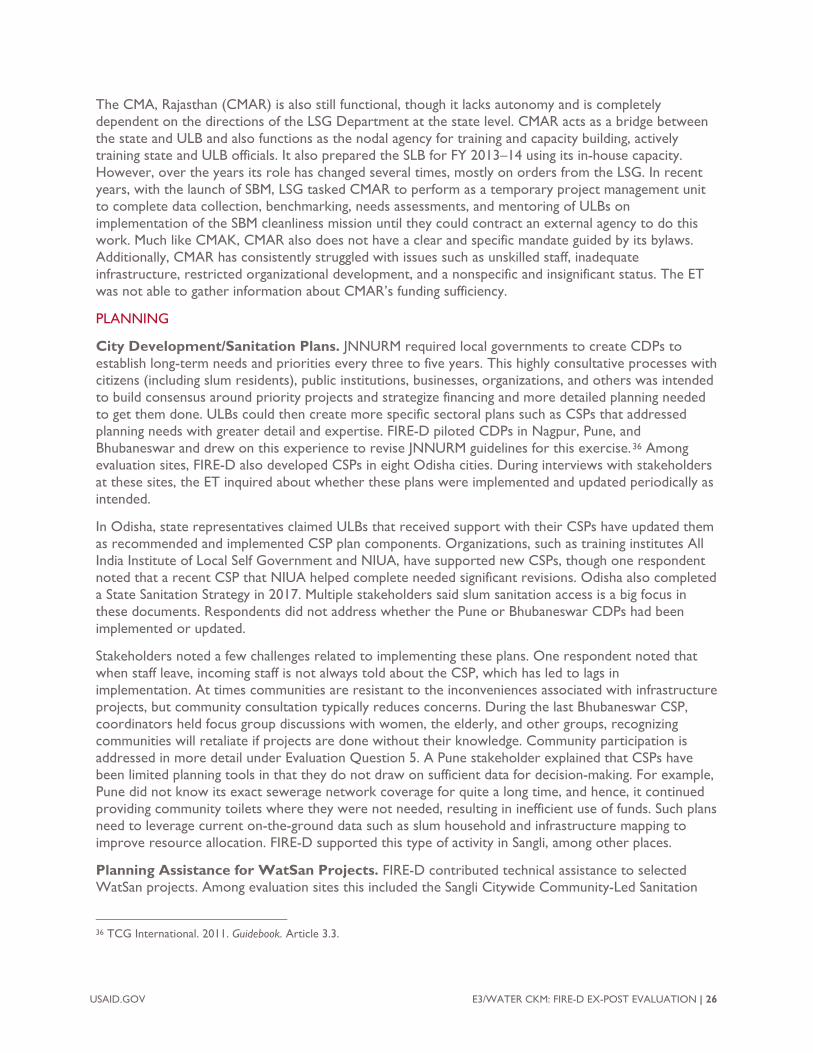
The CMA, Rajasthan (CMAR) is also still functional, though it lacks autonomy and is completely dependent on the directions of the LSG Department at the state level. CMAR acts as a bridge between the state and ULB and also functions as the nodal agency for training and capacity building, actively training state and ULB officials. It also prepared the SLB for FY 2013–14 using its in-house capacity. However, over the years its role has changed several times, mostly on orders from the LSG. In recent years, with the launch of SBM, LSG tasked CMAR to perform as a temporary project management unit to complete data collection, benchmarking, needs assessments, and mentoring of ULBs on implementation of the SBM cleanliness mission until they could contract an external agency to do this work. Much like CMAK, CMAR also does not have a clear and specific mandate guided by its bylaws. Additionally, CMAR has consistently struggled with issues such as unskilled staff, inadequate infrastructure, restricted organizational development, and a nonspecific and insignificant status. The ET was not able to gather information about CMAR’s funding sufficiency.
PLANNING
City Development/Sanitation Plans. JNNURM required local governments to create CDPs to establish long-term needs and priorities every three to five years. This highly consultative processes with citizens (including slum residents), public institutions, businesses, organizations, and others was intended to build consensus around priority projects and strategize financing and more detailed planning needed to get them done. ULBs could then create more specific sectoral plans such as CSPs that addressed planning needs with greater detail and expertise. FIRE-D piloted CDPs in Nagpur, Pune, and Bhubaneswar and drew on this experience to revise JNNURM guidelines for this exercise.36 Among evaluation sites, FIRE-D also developed CSPs in eight Odisha cities. During interviews with stakeholders at these sites, the ET inquired about whether these plans were implemented and updated periodically as intended.
In Odisha, state representatives claimed ULBs that received support with their CSPs have updated them as recommended and implemented CSP plan components. Organizations, such as training institutes All India Institute of Local Self Government and NIUA, have supported new CSPs, though one respondent noted that a recent CSP that NIUA helped complete needed significant revisions. Odisha also completed a State Sanitation Strategy in 2017. Multiple stakeholders said slum sanitation access is a big focus in these documents. Respondents did not address whether the Pune or Bhubaneswar CDPs had been implemented or updated.
Stakeholders noted a few challenges related to implementing these plans. One respondent noted that when staff leave, incoming staff is not always told about the CSP, which has led to lags in implementation. At times communities are resistant to the inconveniences associated with infrastructure projects, but community consultation typically reduces concerns. During the last Bhubaneswar CSP, coordinators held focus group discussions with women, the elderly, and other groups, recognizing communities will retaliate if projects are done without their knowledge. Community participation is addressed in more detail under Evaluation Question 5. A Pune stakeholder explained that CSPs have been limited planning tools in that they do not draw on sufficient data for decision-making. For example, Pune did not know its exact sewerage network coverage for quite a long time, and hence, it continued providing community toilets where they were not needed, resulting in inefficient use of funds. Such plans need to leverage current on-the-ground data such as slum household and infrastructure mapping to improve resource allocation. FIRE-D supported this type of activity in Sangli, among other places.
Planning Assistance for WatSan Projects. FIRE-D contributed technical assistance to selected WatSan projects. Among evaluation sites this included the Sangli Citywide Community-Led Sanitation
36 TCG International. 2011. Guidebook. Article 3.3.
USAID.GOV E3/WATER CKM: FIRE-D EX-POST EVALUATION | 26
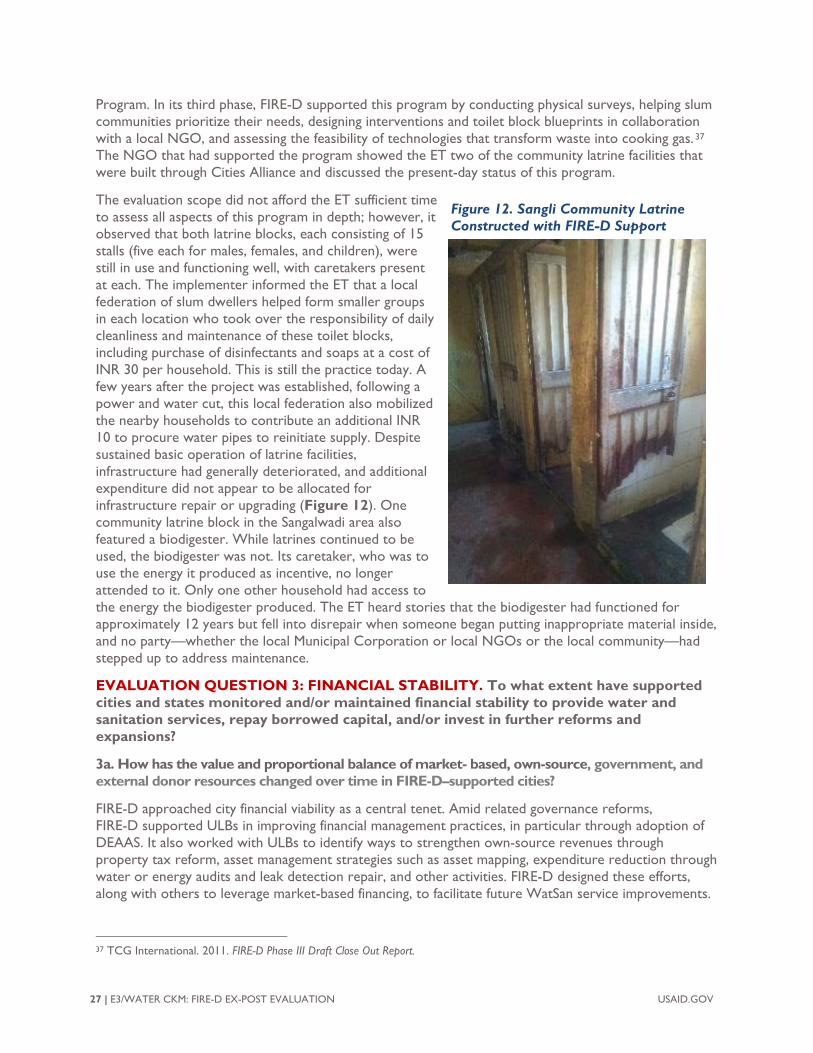
Program. In its third phase, FIRE-D supported this program by conducting physical surveys, helping slum communities prioritize their needs, designing interventions and toilet block blueprints in collaboration with a local NGO, and assessing the feasibility of technologies that transform waste into cooking gas. 37 The NGO that had supported the program showed the ET two of the community latrine facilities that were built through Cities Alliance and discussed the present-day status of this program.
The evaluation scope did not afford the ET sufficient time to assess all aspects of this program in depth; however, it observed that both latrine blocks, each consisting of 15 stalls (five each for males, females, and children), were still in use and functioning well, with caretakers present at each. The implementer informed the ET that a local federation of slum dwellers helped form smaller groups in each location who took over the responsibility of daily cleanliness and maintenance of these toilet blocks, including purchase of disinfectants and soaps at a cost of INR 30 per household. This is still the practice today. A few years after the project was established, following a power and water cut, this local federation also mobilized the nearby households to contribute an additional INR 10 to procure water pipes to reinitiate supply. Despite sustained basic operation of latrine facilities, infrastructure had generally deteriorated, and additional expenditure did not appear to be allocated for infrastructure repair or upgrading (Figure 12). One community latrine block in the Sangalwadi area also featured a biodigester. While latrines continued to be used, the biodigester was not. Its caretaker, who was to use the energy it produced as incentive, no longer attended to it. Only one other household had access to the energy the biodigester produced. The ET heard stories that the biodigester had functioned for approximately 12 years but fell into disrepair when someone began putting inappropriate material inside, and no party—whether the local Municipal Corporation or local NGOs or the local community—had stepped up to address maintenance.
EVALUATION QUESTION 3: FINANCIAL STABILITY. To what extent have supported cities and states monitored and/or maintained financial stability to provide water and sanitation services, repay borrowed capital, and/or invest in further reforms and expansions?
3a. How has the value and proportional balance of market- based, own-source, government, and external donor resources changed over time in FIRE-D–supported cities?
FIRE-D approached city financial viability as a central tenet. Amid related governance reforms, FIRE-D supported ULBs in improving financial management practices, in particular through adoption of DEAAS. It also worked with ULBs to identify ways to strengthen own-source revenues through property tax reform, asset management strategies such as asset mapping, expenditure reduction through water or energy audits and leak detection repair, and other activities. FIRE-D designed these efforts, along with others to leverage market-based financing, to facilitate future WatSan service improvements.
37 TCG International. 2011. FIRE-D Phase III Draft Close Out Report.
27 | E3/WATER CKM: FIRE-D EX-POST EVALUATION USAID.GOV
Figure 12. Sangli Community LatrineConstructed with FIRE-D Support
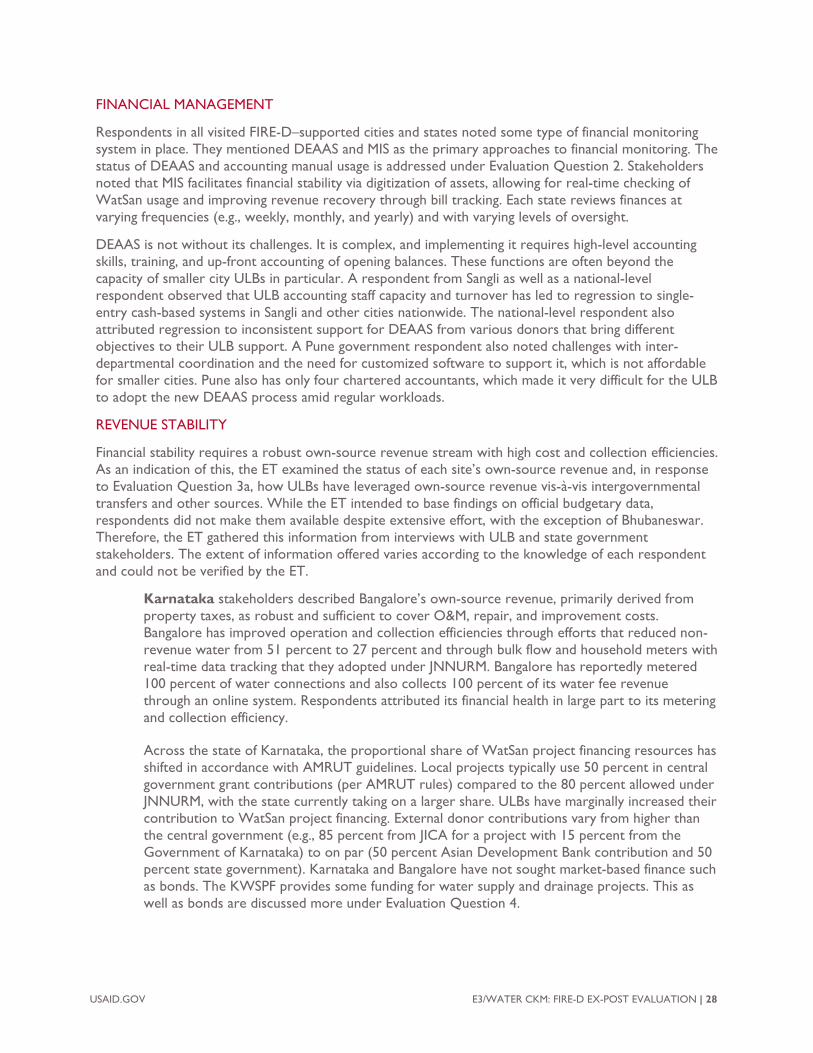
FINANCIAL MANAGEMENT
Respondents in all visited FIRE-D–supported cities and states noted some type of financial monitoring system in place. They mentioned DEAAS and MIS as the primary approaches to financial monitoring. The status of DEAAS and accounting manual usage is addressed under Evaluation Question 2. Stakeholders noted that MIS facilitates financial stability via digitization of assets, allowing for real-time checking of WatSan usage and improving revenue recovery through bill tracking. Each state reviews finances at varying frequencies (e.g., weekly, monthly, and yearly) and with varying levels of oversight.
DEAAS is not without its challenges. It is complex, and implementing it requires high-level accounting skills, training, and up-front accounting of opening balances. These functions are often beyond the capacity of smaller city ULBs in particular. A respondent from Sangli as well as a national-level respondent observed that ULB accounting staff capacity and turnover has led to regression to single-entry cash-based systems in Sangli and other cities nationwide. The national-level respondent also attributed regression to inconsistent support for DEAAS from various donors that bring different objectives to their ULB support. A Pune government respondent also noted challenges with inter-departmental coordination and the need for customized software to support it, which is not affordable for smaller cities. Pune also has only four chartered accountants, which made it very difficult for the ULB to adopt the new DEAAS process amid regular workloads.
REVENUE STABILITY
Financial stability requires a robust own-source revenue stream with high cost and collection efficiencies. As an indication of this, the ET examined the status of each site’s own-source revenue and, in response to Evaluation Question 3a, how ULBs have leveraged own-source revenue vis-à-vis intergovernmental transfers and other sources. While the ET intended to base findings on official budgetary data, respondents did not make them available despite extensive effort, with the exception of Bhubaneswar. Therefore, the ET gathered this information from interviews with ULB and state government stakeholders. The extent of information offered varies according to the knowledge of each respondent and could not be verified by the ET.
Karnataka stakeholders described Bangalore’s own-source revenue, primarily derived from property taxes, as robust and sufficient to cover O&M, repair, and improvement costs. Bangalore has improved operation and collection efficiencies through efforts that reduced non-revenue water from 51 percent to 27 percent and through bulk flow and household meters with real-time data tracking that they adopted under JNNURM. Bangalore has reportedly metered 100 percent of water connections and also collects 100 percent of its water fee revenue through an online system. Respondents attributed its financial health in large part to its metering and collection efficiency.
Across the state of Karnataka, the proportional share of WatSan project financing resources has shifted in accordance with AMRUT guidelines. Local projects typically use 50 percent in central government grant contributions (per AMRUT rules) compared to the 80 percent allowed under JNNURM, with the state currently taking on a larger share. ULBs have marginally increased their contribution to WatSan project financing. External donor contributions vary from higher than the central government (e.g., 85 percent from JICA for a project with 15 percent from the Government of Karnataka) to on par (50 percent Asian Development Bank contribution and 50 percent state government). Karnataka and Bangalore have not sought market-based finance such as bonds. The KWSPF provides some funding for water supply and drainage projects. This as well as bonds are discussed more under Evaluation Question 4.
USAID.GOV E3/WATER CKM: FIRE-D EX-POST EVALUATION | 28
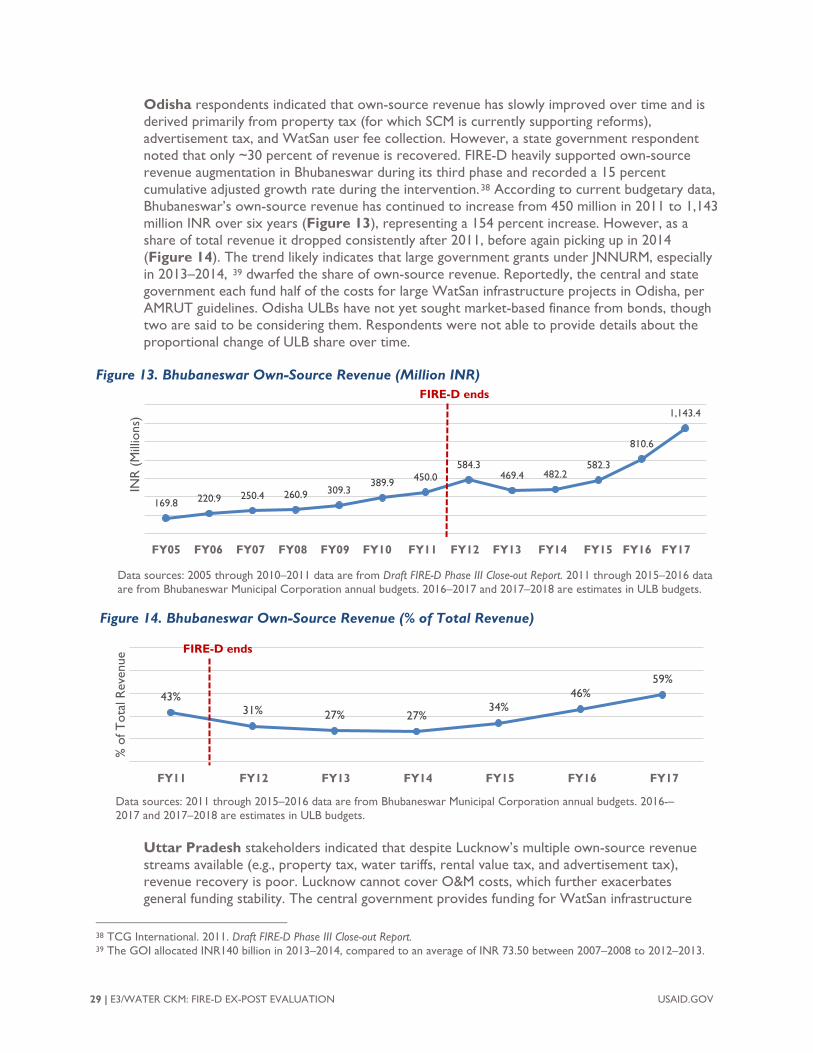
Odisha respondents indicated that own-source revenue has slowly improved over time and is derived primarily from property tax (for which SCM is currently supporting reforms), advertisement tax, and WatSan user fee collection. However, a state government respondent noted that only ~30 percent of revenue is recovered. FIRE-D heavily supported own-source revenue augmentation in Bhubaneswar during its third phase and recorded a 15 percent cumulative adjusted growth rate during the intervention.38 According to current budgetary data, Bhubaneswar’s own-source revenue has continued to increase from 450 million in 2011 to 1,143 million INR over six years (Figure 13), representing a 154 percent increase. However, as a share of total revenue it dropped consistently after 2011, before again picking up in 2014 (Figure 14). The trend likely indicates that large government grants under JNNURM, especially in 2013–2014, 39 dwarfed the share of own-source revenue. Reportedly, the central and state government each fund half of the costs for large WatSan infrastructure projects in Odisha, per AMRUT guidelines. Odisha ULBs have not yet sought market-based finance from bonds, though two are said to be considering them. Respondents were not able to provide details about the proportional change of ULB share over time.
Figure 13. Bhubaneswar Own-Source Revenue (Million INR)
Figure 14. Bhubaneswar Own-Source Revenue (% of Total Revenue)
Uttar Pradesh stakeholders indicated that despite Lucknow’s multiple own-source revenue streams available (e.g., property tax, water tariffs, rental value tax, and advertisement tax), revenue recovery is poor. Lucknow cannot cover O&M costs, which further exacerbates general funding stability. The central government provides funding for WatSan infrastructure
38 TCG International. 2011. Draft FIRE-D Phase III Close-out Report. 39 The GOI allocated INR140 billion in 2013–2014, compared to an average of INR 73.50 between 2007–2008 to 2012–2013.
29 | E3/WATER CKM: FIRE-D EX-POST EVALUATION USAID.GOV
169.8 220.9 250.4 260.9 309.3389.9 450.0
584.3469.4 482.2
582.3
810.6
1,143.4
2005 2006 2007 2008 2009 2010 2011 2012 2013 2014 2015 2016 2017
INR
(Mill
ions
)
43%31% 27% 27%
34%46%
59%
2011 2012 2013 2014 2015 2016 2017
% o
f Tot
al R
even
ue FIRE-D ends
FIRE-D ends
Data sources: 2011 through 2015–2016 data are from Bhubaneswar Municipal Corporation annual budgets. 2016-–2017 and 2017–2018 are estimates in ULB budgets.
FY05 FY06 FY07 FY08 FY09 FY10 FY11 FY12 FY13 FY14 FY15 FY16 FY17
Data sources: 2005 through 2010–2011 data are from Draft FIRE-D Phase III Close-out Report. 2011 through 2015–2016 data are from Bhubaneswar Municipal Corporation annual budgets. 2016–2017 and 2017–2018 are estimates in ULB budgets.
FY11 FY12 FY13 FY14 FY15 FY16 FY17
development. Respondents estimated that the central, state, and ULB funding share for WatSan projects is relatively even, but smaller ULBs contribute less (~20 percent). The ET was not able to capture the proportional change in funding sources over time. This state has not sought market-based funding for WatSan.
The Tamil Nadu respondent noted highly efficient own-source revenue recovery from property taxes, water tariffs, and connection charges, which provide a portion of WatSan infrastructure funding. However, water tariffs are flat rate (not based on consumption) and have not been raised for a long time. In Tiruppur, ULB officials saw user charge collection as satisfactory, given the city’s industrial base.40 ULBs are responsible for increasing portions of WatSan project financing (47 percent in one example); however, most projects rely predominantly on central government, state, and donor funds or commercial bank term loans. TNUDF continues to raise funds from the market through pooled bond issues on a regular basis; however, this represents a small share of total WatSan expenditure.
Maharashtra evaluation cities had varying levels of financial stability. Overall, Pune has strong financial health and is able to support O&M, having recorded a revenue surplus of INR 20 billion in FY 2016. It has improved its own-source revenue recovery systems and has reached 85 percent property tax collection efficiency. Its local body tax on the entry of goods into the state at one point generated 70 percent of revenue. Pune’s financial stability has enabled it to finance part of a water project with a municipal bond (discussed under Evaluation Question 4). Sangli derives the majority of its revenue from property tax, and revenue recovery is 60 percent to 70 percent. SMKC has recorded a minimal revenue surplus.
Across the state, ULBs have generally increased their shares in WatSan infrastructure projects from 10 percent to 25 percent, and the state government has also increased its share. The Address under EQ4 central government remains the majority funder with scheme rules guiding its share (80 percent per JNNURM/UIDSSMT has become 50 percent per SBM and AMRUT). Reportedly, the current goal is to shift central government funding to 35 percent, state to 23 percent, and ULB to 42 percent.
Rajasthan respondents noted several positive steps the state is taking to improve revenue capture and cost efficiency. It is benchmarking all 222 towns and using geographic information systems (GIS) to digitize properties to improve tax collection as mandated by AMRUT. It has outsourced the information technology component of this effort. Rajasthan has also done water audits to reduce leakages in light of regional water scarcity, with bilateral donor support from Australia. These efforts have reportedly led to a jump in revenue realization by INR 5 billion in the last few years. The state also has an online payment system that incentivizes people to pay bills on time, which has also aided in revenue recovery. Rajasthan’s capital, Jaipur’s 2017 credit rating increased one small step from BBB+ to A-, indicating this city’s finances are relatively stable and moderately improving.
Respondents noted that ULBs’ share of WatSan development expenditures is increasing, but not more than ~10 percent with central government schemes or donors like JICA contributing the difference. To date the state has not sought market-based WatSan funding.
Financial stability and revenue generation are critical to maintaining and expanding services. The majority of sites noted improvements to financial stability over the past several years. Some attributed this to a combination of factors including improvements to own-source revenue collection efficiency, often through tax reforms and asset mapping. However, most state-level and a few city and national-level
40 Tirupur has high living standards, with the third-highest per capita income in the state (Government of Tamil Nadu. 2017. Tamil Nadu Human Development Report.)
USAID.GOV E3/WATER CKM: FIRE-D EX-POST EVALUATION | 30
stakeholders cited remaining payment recovery limitations. For example, a Sangli Government stakeholder cited the value of having engaged a firm to use GIS satellite mapping in 2012 to improve property tax collection; however, the high expense (INR 15 million) and lack of GIS experts on staff has meant the ULB could not repeat this exercise to expand its net of payers as the city grew. At the national level and in Odisha and Tamil Nadu, respondents shared that lack of political will among elected politicians to raise taxes impeded substantive revenue recovery. In addition, utility respondents in Karnataka, Odisha, and Uttar Pradesh cited the public's varying views on payment for WatSan services as a challenge to recovering or increasing WatSan tariffs. State-level respondents in Uttar Pradesh, Maharashtra, and Tamil Nadu noted lost revenue when the poor or those opposed to WatSan tariffs illegally tap infrastructure or rely on community taps. NGOs, municipal, state, and national-level respondents also discussed human resource capacity and training gaps that revenue recovery management agencies faced.
To move to stable funding, collection inefficiencies and public perceptions of WatSan tariff increases need to be addressed. Broadly, in cities with strong funding or where strengthening is occurring (e.g., Bangalore and Pune) the ET observed high levels or a sharp increase in access to WatSan services over time. Whereas in cities with weaker revenue recovery (e.g., Lucknow and Sangli, Figure 6–Figure 10) less progress is being made in improving access. This is not to imply a causal linkage of these factors alone, but the trends suggest FIRE-D’s approach to supporting city financial stability as a foundation was useful.
EVALUATION QUESTION 4: INFRASTRUCTURE FINANCING MECHANISMS. What types of FIRE-D–supported and other infrastructure financing mechanisms have states and municipalities applied to fund water and sanitation service improvement or expansions over time since project close?
4a: Which factors have influenced the viability of each type of mechanism?
One of FIRE-D’s core objectives was to leverage market-based financing for infrastructure development to ensure commercially viability and, by extension, sustainability. The activity supported efforts to measure ULB creditworthiness through credit ratings as a precursor to municipal bond issuance. FIRE-D issued India’s first municipal bond without a state guarantee in Ahmedabad in 1998 and championed this financial mechanism throughout the activity. 41 It also promoted pooled and specialized infrastructure funding mechanisms and PPPs.
Credit Rating and Municipal Bonds. Among evaluation sites, FIRE-D supported market-based financing in Pune (support to credit rating in 2010); Tamil Nadu state (support to creation of the TNUDF, and subsequent issue of two pooled bonds); Karnataka state (formation of KWSPF for pooled bonds); and Bangalore (support to bond issues in 1997 and 2005, with the latter receiving a USAID DCA guarantee, plus support to credit rating in 2010).
Under India’s current urban policy framework, AMRUT requires ULBs and towns to undergo a credit rating. This is one of the government’s reform criteria for incentive funding. As such, all the sample ULBs reported having a credit rating. However, the interest in—and uptake of—market-based financing is low, except in Tamil Nadu, which has continued to issue pooled bonds, and Pune City in Maharashtra, which has recently floated an INR 2 billion bond (together with INR 9.9 billion from JICA for a project totaling 35 billion).42 Reasons include perceived low financial viability of WatSan projects, unattractive
41 TCG International. 2011. Guidebook. Article 2.3. 42 Data from interviews confirmed in "Pune Civic Body Raises ₹200 Crore Via Municipal Bond Issue, First In 14 Years," The Hindu Business Line, June 20, 2017. https://www.thehindubusinessline.com/news/national/pune-civic-body-raises-200-crore-via-municipal-bond-issue-first-in-14-years/article9731455.ece
31 | E3/WATER CKM: FIRE-D EX-POST EVALUATION USAID.GOV
terms vis-à-vis available commercial loans, small size of potential fund mobilization compared to large capital requirement in water supply/sewerage, and easy availability of government grants through schemes such as AMRUT and SCM.
Smaller city ULBs such as Tiruppur and Sangli seem to have completed credit ratings to fulfil the central government’s guidelines under AMRUT rather than as part of a plan to raise funds through a subsequent bond issuance. Often, credit ratings are virtually noninvestment grade, indicating the need to improve financial stability, auditing practices, operating efficiency, and financial management. A relatively good credit rating, by itself, also has failed to translate into actual market financing. For example, Lucknow has an investment-grade credit rating of A- but reported they have no plans to enter the bond market to fund WatSan projects, though the ULB may seek a bond for a housing project. In contrast, Pune Municipal Corporation has an active credit rating—a prerequisite for bonds, which they issued in 2012–2013 and 2016. High loan rates in Pune were one of the reasons bonds were more appealing.43 The PMC also has a high credit rating of AA+, making investment attractive. In June 2017, PMC floated municipal bonds to raise the first tranche of INR 2 billion for a continuous, around-the-clock water supply project.
In Tamil Nadu, 28 ULBs have reportedly completed credit ratings, and bonds continue to function well and have been issued several times, although interest is waning. FIRE-D had particular success with its pooled funding mechanisms—which aggregate multiple small ULBs’ debt servicing obligations—in tapping the bond market in the state. Karnataka had success with the same model. The KWSPF, which FIRE-D conceptualized and supported, raised INR 1 billion in bonds in 2005 for its first project—the Greater Bangalore Water Supply and Sewerage Project. It continues to operate and pay dividends on this initial bond, though it has not issued new bonds. KUIDFC manages the fund. While all nine AMRUT cities in the state of Odisha have a credit rating, none have issued bonds, and Bhubaneswar government stakeholders had no plans to do so. Bangalore—which was the first ULB to issue municipal bonds in India—discontinued credit ratings after 2004 but again undertook them in 2010 with FIRE-D support. Currently, Bangalore Municipal Corporation has a rating of BB, but no plans to issue bonds for WatSan are in the works. A stakeholder in Bangalore said bonds are not viable without state guarantees, and a respondent from a credit rating agency also noted that guarantees, whether from USAID’s DCA or another entity, are certainly useful in launching bonds.
In summary, while both small and large ULBs are actively pursuing credit ratings, they do not often translate to market debt issuances. Among FIRE-D states and ULBs that received active support on credit ratings and bonds, Tamil Nadu and Karnataka have successfully institutionalized the idea of market-based financing. But debt funds represent a very small share of total funding in the sector, mainly because government grants are abundantly available, and commercial loans or loans from donor agencies are often cheaper and do not require high accountability in ULB finances. A KUIDFC representative said term loans are more affordable than municipal bonds. Likewise, a state government representative in Tamil Nadu said that schemes like JNNURM (now AMRUT) that provide grants negatively affect the incentive for raising resources. Stakeholders in Rajasthan and Uttar Pradesh voiced the same view of how abundant grants can crowd out market finance.
Pooled Funds/Urban Infrastructure Funds. To facilitate market borrowing, FIRE-D established state-level pooled funding mechanisms that united smaller ULBs to create scale and build investor confidence. This took the shape of a pooled finance entity or state-level UIF. Key beneficiaries of FIRE-D support in this area were Karnataka and Tamil Nadu (pooled funds) and Maharashtra and Rajasthan
43 PMC’s bond servicing rate is 7.59 percent against 9.1 percent for a Housing and Urban Development Corporation loan.
USAID.GOV E3/WATER CKM: FIRE-D EX-POST EVALUATION | 32
(UIFs)44. Both UIFs are currently nonexistent or nonoperational, and institutional memory of these funds is lacking.
Pooled funds continue to perform well in Karnataka and Tamil Nadu. Pooled funds are still available via KWSPF and used for water supply and drainage funding programs. The fund mechanism has promoted additional programs such as the Chief Minister’s Small and Medium Town Development Program Phase 1 (starting 2009–2010) and Nagarotthan (starting 2011–2012). Under Phase 2 of the program, it raised INR 5 million in bank loans for projects through March 2016 and released over INR 3 million in loans. ICRA continues to be the agency for rating and revalidation of these programs. KWSPF has not continued with new bond issues. TNUDF manages to raise about INR 800 million to 1 billion annually through its pooled bond issues, financing several water and sewerage projects for cities across the state. A state government respondent noted that TNUDF has become the front running financial instrument through which external donor finance flows into the sector. Tamil Nadu modeled its new Alternative Investment Fund as a UIF, although this does not cater to WatSan infrastructure.
Pooled funds have been successful due to their role as a state-level financial intermediary with specialized technical staff and resources, which allow them to access debt markets regularly. The finances of a pooled entity are also stronger. All these factors lend credibility to the state-level fundraising entity. As a result, private institutions and development donors are more willing to engage through a pooled fund. Furthermore, the capacity gaps among ULB functionaries are subsumed by this new entity. While this still does not address the ULB’s capability to raise private finance, pooled finance entities can be used for capacity building of ULBs to prepare them for longer term financial sustainability. Overall, the FIRE-D–supported pooled fund mechanisms to tap debt markets have been sustained in FIRE-D evaluation locations where these were implemented, but they have yet to be emulated nationally.
Public-Private Partnerships. Among the evaluation’s sample states, FIRE-D’s support for PPPs mainly included institutional arrangements for private sector participation in 13 small cities in Karnataka, supporting India’s first PPP in water supply and sewerage in Tiruppur, and other PPP projects in Tamil Nadu cities. While the Tiruppur PPP failed to become financially viable, due to project-specific reasons beyond the control of implementers, it had important lessons for the state. Tiruppur’s water supply BOOT failed due to the enaction of environmental legislation in the state requiring industries to reuse water, causing industry demand (and hence revenue) for bulk water to plummet. The cost of water proved to be prohibitive compared to other available sources. To stay afloat, the entity receives heavy government subsidies, and the state water and drainage board (TWAD) currently buys the water at more than double the market price. The state has continued to use PPPs particularly in solid waste management, sewerage, and water reclamation. Examples include a sewage treatment plant in Alandur and a seawater desalination plant in Chennai. Coimbatore City is also currently implementing a 24–7 water supply project in PPP mode under the Smart Cities Mission.
Bangalore is using PPPs for SWM but not for water supply or sewerage. In terms of policy frameworks, currently both the SCM as well as AMRUT schemes recommend and encourage ULBs to tap alternate funding mechanisms including PPPs, indicating possible imprints of FIRE-D’s early interventions in current policy thinking and formulation. However, often at the level of state urban development departments and ULBs, PPPs in WatSan are not seen as a very feasible model, even in states where funding limitations are a concern. WatSan infrastructure is costlier than that of SWM, and SWM provides more monetization options through recycling and waste-to-energy technology. For example, in Uttar Pradesh, PPPs are being used in SWM, but not seen as viable for WatSan. Both Lucknow and Uttar Pradesh
44 FIRE-D also helped to establish a Pooled Finance Development Fund at the central government level, in part through answering ministry queries based on the Karnataka and Tamil Nadu pooled fund pilot experiences (TCG International. 2011. Draft FIRE-D Phase III Close-out Report.)
33 | E3/WATER CKM: FIRE-D EX-POST EVALUATION USAID.GOV

USAID.GOV E3/WATER CKM: FIRE-D EX-POST EVALUATION | 34
government representatives did not see privatization as feasible or desirable within their constituency, the majority of which considers WatSan services as public goods and therefore expect it to be provided by the state. Likewise, in Odisha, PPPs are being considered in areas such as housing, but not in WatSan. In Maharashtra, too, where Pune fared well in tapping the bond market, PPPs are only operational in SWM, while Rajasthan reportedly failed to secure funding for water supply and sewerage PPPs. A Rajasthan government representative also pointed out that such mechanisms make an insignificant dent on the total funding requirement. Though this was not mentioned by stakeholders at the evaluation sites, the ET did learn that some other states are considering PPPs for fecal sludge treatment plants for non-networked sanitation, with Andhra Pradesh and Telangana having issued tenders for such work.
The predominant reason why stakeholders at targeted evaluation sites do not see PPPs for water and sewerage as feasible at present are low commercial viability and/or profitability, or often simply a lack of a strong successful precedent. Given low user fee collection in many cities, and political incentives to keep tariffs low, most PPPs in water in India have been in bulk water supply projects, which do not directly depend on the project’s commercial sustainability. As with municipal bonds, the success of PPPs will also, therefore, depend on ULBs’ revenue collection efficiency, tariff rationalization, and structuring of commercially viable infrastructure projects, including credit enhancements.
EVALUATION QUESTION 5: SOCIAL INCLUSION. How have the different needs and perspectives of women/girls, men/boys, and the poor or marginalized been included during planning and project development since project close?
FIRE-D promoted “social inclusion” as one of its 10 programming principles for better development outcomes. The activity’s Guidebook notes that “Service providers should pay special attention to providing public services to segments of society that are normally excluded, such as the poor, migrants, lower castes, or tribal people, because they systematically have greater difficulty accessing regular services.” However, the activity’s social inclusion work focused primarily on “pro-poor” slum development rather than singling out the needs of different subgroups (e.g., women/girls, men/boys, etc.). This primarily entailed getting service providers to consider the needs of slum dwellers during planning stages, especially through the use of mapping. In later years, FIRE-D promoted the incorporation of marginalized community perspectives into project planning through participatory processes. 45
An NGO respondent that had worked with FIRE-D did not feel the activity had much influence on government reforms related to poverty inclusion; however, the respondent viewed its direct technical assistance work in specific cities to improve inclusion through slum mapping and developing slum upgradation plans as highly beneficial to poor communities. Several stakeholders from NGOs and some government positions affirmed this latter point. Examining the current level of social inclusion, respondents provided a wide range of perspectives with respect to project planning and development. For example, while NGOs tended to discuss their own efforts to promote consideration of poor communities’ needs in planning, almost all of them noted that local, state, or national-level governments did not do an adequate job of soliciting community perspectives, let alone addressing them in the development of infrastructure projects. In contrast, most government officials interviewed noted that they effectively obtain such perspectives through locally elected officials (i.e., ward councilors)—a process some NGOs noted to be ineffective. The ET encountered one exception in Odisha, which very recently institutionalized a participatory process of project development and monitoring in slum areas that requires the signoff of multiple representatives to ensure that infrastructure projects are completed in consultation with the communities they aim to serve. This is perhaps reflective of the Odisha government’s more progressive view of slum dwellers’ rights, evidenced by its new land tenure policy
45 TCG International. 2011. Guidebook. Article 3.2.
35 | E3/WATER CKM: FIRE-D EX-POST EVALUATION USAID.GOV
noted above. Maharashtra has a memorandum of understanding with an NGO to gather data and map six slums, and it also is working on accountability systems and participatory processes in slums.
A gender assessment completed prior to FIRE-D’s third phase indicated FIRE-D had not sufficiently addressed gender needs at that point and proposed several recommendations for how to do so in the third phase46; however, the ET was not able to discern a clear programmatic approach to addressing different gender needs according to the activity’s concluding report or interviews with former implementers. Looking at how gender is presently addressed at the evaluation sites, NGO representatives noted several needs specific to women and girls that are often overlooked in WatSan project development. These include their need for privacy, cleanliness, and convenient locations. For example, one NGO staff detailed how the lack of community toilets outside slums adversely affects domestic workers—predominantly women of lower castes—who are often prohibited from using the toilets in their place of work and thus resort to open defecation out of necessity. Another NGO representative commented that government officials have a poor understanding of gender issues around WatSan. None of the government officials the ET interviewed described how they incorporate these needs into planning. Instead, all examples of incorporation of gender issues through participatory methods (e.g., mapping, focus group discussions, and transect walks) came from NGOs who continue to use these tools to identify and advocate for the needs of women and girls.
CONCLUSIONS FIRE-D hypothesized that in order to have sustainable, poor-inclusive access to urban WatSan government stakeholders must have a foundation of favorable governance (decentralized with supportive policies; capable institutions, accountability, and transparency); effective inclusive planning; city financial viability (strong financial management and expanded own-source revenue leading to overall creditworthiness); diverse infrastructure financing options (including market-based and own-source financing, and credit enhancements); and improved project management. This evaluation focused on a limited number of carefully selected locations and intervention components. The ET aimed to learn whether the implementation approaches and/or related results were sustained over the past seven years.
It is important to recognize that FIRE-D partnered with the GoI for nearly all activities, particularly in Phase 3 (2004–2011), to help design the GoI’s own JNNURM agenda and shape its rollout and implementation strategies. While FIRE-D pilots introduced activities like DEAAS and municipal bonds, GoI, alongside other donors, brought FIRE-D in to test and/or operationalize newer initiatives. This integrated work partnership approach makes it difficult and even irrelevant to tease out FIRE-D’s sole influence on some sustained or non-sustained activities. FIRE-D’s work cannot easily be isolated from the GoI’s implementation of its own agenda. With that in mind, the sections below summarize components of this shared agenda that have or have not endured over time and then further discuss the outcomes.
TO WHAT EXTENT WERE FIRE-D OUTCOMES SUSTAINED?
In all cities evaluated, the proportion of households with piped water service either increased or remained relatively stable several years after FIRE-D ended, despite population growth. Bhubaneswar experienced the greatest improvement, from 31 percent to 100 percent within three years. In contrast, among evaluation sites, Bhubaneswar also had the greatest decline in the proportion of households with sewerage connections. Sewerage connections increased in Bangalore and remained at relatively steady levels in Pune and Sangli. Lucknow experienced a slight reduction in sewerage coverage; however, its
46 Junction Social. 2006. Integrating Gender into FIRE(D) III. Final Report.
nearly 20 percentage point increase in overall household toilet access indicates improvements in non-sewered sanitation.
Below, the ET summarizes findings regarding several FIRE-D intervention components that are still operational today, though some have disappeared.
Governance and Financial Management. Most governance reforms and accounting practices that FIRE-D supported are now widespread across India due to the GoI adopting FIRE-D practices into JNNURM, and then most JNNURM reforms into its AMRUT scheme. These include DEAAS, city credit ratings, e-governance initiatives, property tax and cost recovery improvements, and inclusive planning processes. AMRUT guidelines for reform47 also include setting up state-level financial intermediaries for pooled finance and municipal bonds, which FIRE-D had heavily supported. Variations exist among sampled locations where activities have been sustained. For example, while DEAAS has become commonplace, many smaller city ULBs struggle, including Sangli, which is still attempting to adopt it. Also, though many states reported that they have completed credit ratings across AMRUT–supported cities, they have not necessarily been updated regularly. This is discussed further below. Overall, FIRE-D's choice to work closely with the GoI on developing the JNNURM reform agenda proved to be the key, most highly effective factor in sustaining incentives for state and city governments to adopt improved practices. However, this has all been dependent on the GoI’s continued strong prioritization and funding of urban and WatSan development.
Finally, the efforts to support decentralization in Rajasthan—primarily through the development of the MML—have not taken hold given larger challenges in the country with the implementation of the 74th Constitutional Amendment. Political influences also stalled the corporatization activity in Odisha for several years, though it is now operational in part due to support from other donors.
Capacity Building. While City Managers’ Associations established with FIRE-D support have flourished in Karnataka and Rajasthan, the one in Maharashtra disbanded. The persistence of the former two CMAs was in part due to the occasional presence of dedicated leaders who ensured the associations remained active and added value through training functions. FIRE-D’s urban training network did not persist, but the ET was not able to ascertain the reasons why.
Planning. Odisha ULBs that completed CSPs with FIRE-D support reported having implemented and updated them as recommended, likely due to ongoing JNNURM program requirements. However, in some cases a lack of supportive data affected the quality and utility of these documents. The ET could not determine the status of Pune or Bhubaneswar City Development Plans completed with FIRE-D support.
Community latrine blocks built through the FIRE-D-supported Sangli Citywide Community-Led Sanitation Program still function and receive basic maintenance from caretakers. FIRE-D’s choice to work with local respected federations appears to have supported long-term sustainability, as the ET found evidence of their continued work to organize community contributions to ensure sustained maintenance before handing management to the local community. This was not sufficient, however, to ensure larger-scale upgrades and repairs be made at the sites the ET visited. Facilities the ET observed had experienced deterioration over the years, most notably a biodigester that was no longer functional due to lack of interest or support for maintenance and repair.
Financing Mechanisms. FIRE-D–supported mechanisms to finance WatSan development had mixed sustainability. Urban infrastructure funds in Maharashtra and Rajasthan were discontinued for unknown reasons. Bangalore did not renew bonds that FIRE-D previously supported, and most ULBs have
47 GoI, Ministry of Urban Development. 2015. AMRUT Mission Statement & Guidelines. Accessed at: https://amrut.gov.in/writereaddata/AMRUT%20Guidelines%20.pdf
USAID.GOV E3/WATER CKM: FIRE-D EX-POST EVALUATION | 36
indicated a lack of interest in bonds. Some notable exceptions, however, include Tamil Nadu’s pooled fund, which has issued new bonds. Likewise, Pune, which received FIRE-D support for a credit rating, is now floating a new bond.
PPPs, which FIRE-D explored in some locations, have continued, particularly in the realm of solid waste management. The ET identified the failed Tiruppur BOOT as the main PPP example outside of the solid waste sector; however, its failure was largely tied to external factors not adequately identified through risk assessments. The project’s success hinged on an assumed level of demand for water that ultimately did not materialize due to changes in environmental regulations requiring water recycling, which reduced water demand.
DID FIRE-D APPROACHES IMPROVE GOVERNMENT CAPACITY TO PLAN AND MANAGE WATSAN DEVELOPMENT OVER TIME?
Given widespread observations that government capacity is inadequate despite improvements, particularly at the ULB level, it is clear that FIRE-D did not sufficiently capacitate local governments to plan and implement WatSan development on their own. State governments hoping to achieve AMRUT or SCM–mandated reforms have often engaged other donors to provide technical assistance on similar issues as those FIRE-D supported. This has contributed to ULB reforms and management improvements in the years since FIRE-D ended. Multiple stakeholders attributed this consistent donor presence to the magnitude of support needed to bring local governments to capacity, and in many locations, respondents representing all stakeholder types felt there is still a long way to go to get city and state governments to a place where they can plan, manage, and finance WatSan development on their own. They see the reform agenda as a long process, as did USAID during FIRE-D’s tenure.
FIRE-D's strategic coordination with other donors to facilitate continuity of capacity support proved valuable in forming the corporatized water utility parastatal agency in Odisha (i.e., WATCO), where outcomes were expected on a longer timeline than FIRE-D could address. FIRE-D's coordination and hand-off with JICA, along with continued state support from DFID, likely helped facilitate the ultimate corporatization of WATCO. Such coordination may be a reasonable model for institutional reform activities where outcomes can occur on a longer time scale than a typical five-year USAID cooperative agreement allows. Most respondents had high expectations for the WATCO’s ability to better manage WatSan development moving forward.
Despite the enormity of the challenge of capacitating state and city government officials on multiple functions related to WatSan infrastructure, the ET found two strong examples of how the activity did this in a sustainable fashion through the establishment of CMAs in Karnataka and Rajasthan. They have played an active role in administering training, promoting learning, developing tools, and facilitating planning efforts. However, as CMA representatives noted in both states, and perhaps the failure of the Maharashtra CMA evidenced, to ensure the success of these bodies, they must be established with a clear mandate and bylaws that protect their functions so they are not vulnerable to the shifting interests of revolving leadership.
One of the primary challenges to sustaining FIRE-D’s capacity-building efforts to carry out various reforms is the incomplete decentralization of powers at the ULB level. FIRE-D expected decentralization to empower ULBs in decision-making for WatSan needs and in adopting ways to recover revenue. However, several respondents indicated that decentralization has had mixed impacts and has not been implemented fully or in the right spirit, as the central or state government urban development ministries often direct ULB decisions. True decentralization, according to respondents, includes not only ULBs’ political empowerment but also sufficient training and staffing. This will enable ULBs to position themselves to effectively plan and manage WatSan development that addresses local needs and realities.
37 | E3/WATER CKM: FIRE-D EX-POST EVALUATION USAID.GOV
Thus, the incomplete decentralization process both challenged the sustainability of capacity building and affected the relevance of the topics that FIRE-D sought to promote.
DID FIRE-D APPROACHES IMPROVE LONG-TERM FINANCIAL STABILITY?
Lacking quantitative data on revenue streams and surpluses, the ET relied on interview respondents’ comments about the level of city financial stability. As such, this assessment does not definitively characterize stability across sites and may be subject to inconsistent descriptions during interviews. FIRE-D tended to work in locations with a reasonable level of baseline capacity at the start of the activity, and the nature of finance-related support varied widely from accounting practices to own-source revenue augmentation to no finance-related support at all (as in Lucknow). At present, the ostensible financial health of visited cities varied from very strong (e.g., Pune, which has INR 20 billion revenue surplus in 2016 and an AA+ credit rating) to poor, such as in Lucknow, which is reportedly unable to cover sector O&M costs and suffers from general funding shortfalls. While respondents at nearly all evaluation sites noted own-source revenue increases over time, only few ULBs could claim adequate financial stability to cover O&M and invest in other projects. Financial stability depended on a combination of issues, including efficiency of tax and tariff collection, human resource capacity/training for accounting in particular, and the public’s willingness to pay for WatSan services (and related political will of politicians to levy WatSan fees as well as consumers’ illegal tapping of lines to avoid tariffs).
Various resource mobilization efforts such as property tax reforms appear to have been successful in improving ULB revenue across several sites. Property tax typically comprises the largest portion of ULB revenues, and several stakeholders noted the value of right-sizing the net of payers as well as collection efficiency in both taxes and customer tariffs, often through improved technology. This, along with other FIRE-D revenue augmentation reforms such as asset mapping and leakage and energy audits have been incorporated into national policy through AMRUT.
Maharashtra’s robust e-governance system, which FIRE-D helped to design, has likely played some role in improving Pune’s revenue base. A clear differentiating factor for Pune is its near-100 percent WatSan access levels since 2011. Starting from such a positive point likely provided Pune an advantage in having to only invest in infrastructure development projects that address continuous service improvements and increasing population demand over the past seven years rather than struggling to overcome a large access gap as most other cities have had to do.
Though respondents did not articulate how DEAAS has specifically affected financial stability, none disputed its value to their operations, and most noted that they are now at a point where they implement it without challenges. Sangli and national-level stakeholders did note, however, that it is difficult to retain the accounting expertise required to implement it over the long term. Particularly smaller city ULBs need more support for accounting transitions, which may need to include customized software and longer term support from qualified agencies. Despite challenges in implementation since the activity’s close, this accounting reform is expected to continue supporting the financial health across the country as all ULBs embrace the practice.
DID FIRE-D APPROACHES INCREASE FUNDING FOR WATSAN DEVELOPMENT OVER TIME?
FIRE-D followed a logic that improving city financial stability would in turn enable cities to obtain a credit rating that proves their creditworthiness and then access low-interest, market-based financing for WatSan projects. This sequence did continue to play out in evaluation sites in Tamil Nadu and Pune, which FIRE-D supported in pooled bond issuance and credit ratings, respectively. However, across all sites and stakeholder types, respondents noted that plentiful government grant funding for WatSan development through schemes like JNNURM, AMRUT, SBM, and SCM has in many ways suppressed the
USAID.GOV E3/WATER CKM: FIRE-D EX-POST EVALUATION | 38
incentive to seek commercial viability and market-based financing. This was even true for Tamil Nadu respondents, who said the appetite for bonds is starting to wane.
While credit ratings, initially intended as a step toward accessing market funding, have persisted across most visited cities, in many cases they are done solely to meet an AMRUT requirement to access government funding rather than as a pathway to market finance. Bangalore, which FIRE-D supported through two bond issues and a 2010 credit rating, has not reissued bonds in light of other available funds with more favorable terms and fewer accounting requirements. Likewise, the Karnataka pooled fund has not continued to issue bonds as it did under FIRE-D. Besides government grants, the present market in many states allows ULBs to access commercial or donor loans with more favorable terms than bonds, which impose high accounting and administrative hurdles.. Some ULBs are exploring the bond market for other sectors but fear WatSan will not attract investors, given common political challenges with revenue collection. Though Tamil Nadu and Pune prove cycles of market-based financing can, in fact, be sustained over time, the current Indian climate is not very conducive to municipal bonds for WatSan—at least not as a major source of funding compared to other available sources. Most stakeholders did not have an appetite for them in the WatSan sector, and they have not been a major source of funding for WatSan projects at evaluation sites.
Pooled funds in particular, which FIRE-D established in Tamil Nadu and Karnataka, have proven effective at consistently raising funds for WatSan infrastructure development over the long term. Their ability to aggregate debt servicing liability across several ULBs that would not otherwise be eligible for bonds has resulted in favorable credit ratings and investor confidence, both of which have enabled TNUDF and KWSPF to continue financing WatSan development. Furthermore, as sector-focused, state-level entities, they have managed to retain professional staff with specialized skills. This model is particularly useful for smaller ULBs or those without a strong revenue base. These have been the most successful among the market-based finance mechanisms FIRE-D promoted. Though pooled bonds are minor revenue sources compared to government grants, particularly in Tamil Nadu they have proven to be a valuable supplementary funding source that serves to bolster local financial stability and embody the spirit of the 74th Constitutional Amendment regarding decentralized control. Such diversification of revenue sources may be especially helpful in the future, as the present level of government funding for WatSan development is not guaranteed in perpetuity. In addition, Tamil Nadu and other locations accessing debt markets may experience spillover operational or efficiency benefits from the discipline required to attain creditworthiness.
FIRE-D envisioned PPPs would help bridge funding gaps. Highly rooted in local circumstances, the Tiruppur water BOOT’s failure does not easily translate into broad conclusions. Overall, PPPs have been commonly used in solid waste management where products can be more easily monetized, but stakeholder responses to the notion of PPPs in water or sewerage ranged from dismissal to resistance to indifference. Though WatSan–sector PPPs exist in several states, many stakeholders at evaluation-targeted sites still felt that negative public opinion about privatization of these services and challenges with cost recovery made them less appealing for this sector. ULBs must gain financial stability to instill confidence in private sector partners, and political leadership is also important, given sensitivities surrounding water access as a basic right and doubts regarding the entry of private players in social sectors. Given that high-level policy support for PPPs through AMRUT has not translated to ULBs using this mechanism in all sectors, this merits a more detailed look at various perspectives on what it would take to make WatSan PPPs viable.
DID FIRE-D APPROACHES INCREASE INCLUSIVE WATSAN ACCESS OVER TIME?
Overall it is primarily GoI funding programs (JNNURM, AMRUT, SBM) that have driven expansions in access to WatSan over the past seven years, along with selected donor capital investment projects. Market-based financing has succeeded in expanding access after FIRE-D ended through bonds and
39 | E3/WATER CKM: FIRE-D EX-POST EVALUATION USAID.GOV
pooled funds noted above; however, they are minor amid government sources. It is highly difficult to quantify the influence of governance reforms or operational efficiencies on service expansion, though there is a logical indirect influence.
Rapid urban population growth has outpaced the ability of many ULBs to align infrastructure with demand. Among and within states varying approaches have been used to provide access. Lucknow seems to have invested more in non-sewered toilet access than sewerage expansion in the past few years, and Bhubaneswar does not seem to have kept pace with either. Some ULBs prioritized household taps while others community tap stands. It is important to address state- and city-specific land availability, hydrology, population dynamics, and other aspects with a big picture lens and with substantial supporting mapping data. It is critical to define a way to determine if the planned infrastructure is optimal for the city. This is an example of where decentralized decision-making powers are needed.
Migration from rural to urban areas has caused slum populations to surge with a significant impact on WatSan access and infrastructure requirements. Service expansions in recent years do not comprehensively meet the needs of the poor/slum dwellers. FIRE-D promoted inclusion and consultation of the poor in development planning processes. The ET did not find strong evidence of FIRE-D’s influence on ensuring this process continued across India, and while Service Level Improvement Plans (via AMRUT) have incorporated checklists that are meant to ensure service access in slums is accounted for, this seems to be a bit of a “box-checking” exercise, and there remains a large variance in slum access to WatSan services and infrastructure type by location. For example, in Bhubaneswar and Pune most households have subsidized household taps, whereas in other locations community and household taps are mixed to meet water needs. Sanitation infrastructure in slums also varies among sewerage connections, septic tank systems for household toilets, and community toilets (where land is scarce). The variation seen in slums’ access is related to several barriers that a range of respondents identified. These include lack of clarity of land rights, inconsistent inclusion in the planning process (because of different perspectives of officials on what constitutes inclusion), sometimes limited mapping of slums to identify access needs, and lack of physical space for infrastructure. Several stakeholders hailed FIRE-D’s technical assistance in areas such as slum mapping as helpful in promoting inclusive slum development; however, these activities naturally require updating, which has not been institutionalized and done consistently. In addition, a reliance on subsidies makes sustainable revenue recovery systems among this population a challenge. Many slum residents are not willing to pay, and some subsequently use illegal tapping. Many ULBs continue to face funding limitations for O&M in light of challenges such as tax/tariff collection, which threatens not only revenue loss but also customers’ loss of faith in service provision. Finally, the strategy to increase slum access to WatSan infrastructure has improved due to GoI funding programs (JNNURM, AMRUT, etc.); however, in many states a reliance on subsidies makes it a challenge to establish sustainable revenue recovery systems among this population. Despite mandates of poor/slum inclusion, insufficient systems are in place to do so.
Although some representatives purport to champion inclusive development, the government’s understanding of women’s and girls’ specific needs is poor according to officials and NGOs. By extension, these needs are inadequately incorporated into the planning and execution of WatSan infrastructure development. NGOs continue to play an important role in advocating for women, girls, and other disadvantaged groups; however, without supportive government officials, their efforts will fail to provide adequate services for marginalized members of society.
USAID.GOV E3/WATER CKM: FIRE-D EX-POST EVALUATION | 40
RECOMMENDATIONS Drawing on findings and conclusions presented above, the ET offers several recommendations for USAID’s future efforts in the sector.
1. Establish government partnerships to drive policy-level and broader ecosystem changesin WatSan. The greatest driver of FIRE-D’s sustainability appears to be its integration into thefabric of GoI’s JNNURM scheme, which later continued under AMRUT. Naturally, governmentpolicies and nationwide initiatives are likely to have broad-reaching and long-lasting effects and are,therefore, excellent targets for USAID technical support. FIRE-D’s practice of first piloting newapproaches before incorporating them into government practices appeared to work well and shouldbe replicated. According to implementers, long-term relationship building with GoI ministriesthroughout FIRE-D’s long tenure helped the GoI to see the activity as a trusted partner to call onfor support.
2. Seek sustainable strategies for building capacity at the ULB level. Stakeholders of all typesand from all sites reiterated concerns about insufficient ULB capacity. While continued donor TAmay be an inevitable need, the ET recommends USAID also seek ways to support institutions orpolicies that can provide sustained support. Toward this end, USAID should establish CMAs withclear mandates and bylaws. CMAs had been a worthwhile investment for FIRE-D in light of theircontinued capacity-building functions; however, with revolving leadership, bylaws and a clearlydocumented mandate are needed to protect their functions from shifting priorities. Further, USAIDcould explore ways to strengthen NIUA’s or other institutions’ capabilities and role in nationwidetraining. To the extent that some ULBs struggle to recruit or retain qualified personnel, USAIDmight explore GoI policy options that could lower bureaucratic recruitment barriers or incentivizedeployment to work in small cities.
3. Coordinate and integrate with other development partners on programming for long-term institutional reform outcomes. When outcomes, particularly in the domain ofinstitutional reform, realistically will occur on a longer timeframe than a five-year USAID agreementallows, USAID should consider collaborating with other donors to ensure mutual goals can besupported after the USAID activity ends.
4. Promote and support mapping efforts for slums and municipal assets. Severalstakeholders noted that slum mapping, which FIRE-D supported in some locations, is an essentialfirst step to ensure WatSan development is aligned with true needs and realities on the ground. Thisshould be done prior to any participatory sectoral planning processes, and regular update intervalsshould be institutionalized to accommodate the ever-changing landscape. Likewise, several noted thevalue of municipal asset and property mapping/digitization as a strategy for ULBs to improve own-source revenue recovery. USAID could explore ways to support policies or institutions that ensureULBs are supported with regular skilled mapping services.
5. Encourage and support e-governance initiatives that improve cost recovery and servicedelivery. E-governance initiatives such as the use of bulk flow and household meter technology totrack water usage in real time have proven useful in improving cost control and revenue collectionand facilitating better customer service delivery. These initiatives also provide local governments amore informed basis from which to make further service improvements.
6. Consider supporting more pooled finance facilities. Municipal bonds should remain an optionfor eligible ULBs, and they will indeed become more important if government funding priorities shift.However, present availability of government grants or cheaper loans with less administrative hurdleshas diminished their appeal in many places. Most ULBs barely attained investment-grade credit
41 | E3/WATER CKM: FIRE-D EX-POST EVALUATION USAID.GOV
ratings, if at all, and will first need to reach better financial stability before considering bonds on their own. However, state-level pooled mechanisms can provide WatSan finance opportunities to smaller or less financially stable ULBs that would not otherwise be eligible for market-based funds. The success of these mechanisms in Tamil Nadu and Karnataka illustrates that they can be a valuable tool, even in the present grant-heavy funding climate in India.
7. Re-examine perceptions and feasibility of PPPs in the water sector. While PPPs for solidwaste management are common, many stakeholders were less receptive to or had beenunsuccessful in garnering private sector involvement in the water sector. The scope of thisevaluation did not permit examination of multiple water sector examples, and this merits furtherresearch into government, private sector, and citizen perceptions of PPPs for water in India as wellas the types of risk identification and contract structures that could facilitate success.
8. Consider work on urban land reforms. Secure land tenure emerged as an important precursorto expanding WatSan access to the poor living in slums and has the added benefit of expanding ULBrevenue. Without this, ULBs and other utility agencies will not adequately prioritize these areaswhile planning and investing in infrastructure. Policies to address land tenure should be aprogramming priority where USAID aims to expand access to WatSan in slums. It may be instructiveto observe whether and how Odisha’s recent land tenure policy and other poor-inclusive practiceselicit improvements in WatSan access to the poor over time.
9. Support work to raise awareness of WatSan needs specific to women and girls. Despitegains in access to WatSan facilities, most efforts do not appear to be done in a gender-sensitivefashion. Government officials at various levels do not have a full understanding of what these needsare and thus are likely to continue overlooking them as large infrastructure projects are planned andcarried out under the auspices of AMRUT and other major schemes. USAID should fund localpartners to continue advocacy on this subject and encourage adoption of gender-sensitive planningprocesses.
USAID.GOV E3/WATER CKM: FIRE-D EX-POST EVALUATION | 42
EVALUATION REPORT ANNEXES INDIA FINANCIAL INSTITUTIONS REFORM AND EXPANSION–DEBT AND INFRASTRUCTURE EX-POST EVALUATION WASH Ex-Post Evaluation Series – Water Communications and Knowledge Management (CKM) Project
September 2018
43 | E3/WATER CKM: FIRE-D EX-POST EVALUATION ANNEXES USAID.GOV
SUKHMINDER DOSANJ FOR USAID
PHOTO CREDIT: FIRE-D PROGRAM
TABLE OF CONTENTS
Annex A: Evaluation Inception Report……………………………………………………..……………...45 Annex B: Data Collection Tools…………………………………………………………….…………......77 Annex C: List of Respondents……………………………………………………………………….....….98 Annex D: FIRE-D Achievements at Evaluation Sites……………………………………………………....99 Annex E: Documents Reviewed……………………………………………………………………….....101
USAID.GOV E3/WATER CKM: FIRE-D EX-POST EVALUATION ANNEXES | 44
INCEPTION REPORT INDIA FINANCIAL INSTITUTIONS REFORM AND EXPANSION–DEBT AND INFRASTRUCTURE EX-POST EVALUATION
WASH Ex-Post Evaluation Series—Water Communications and Knowledge Management (CKM) Project
February 22, 2018
45 | E3/WATER CKM: FIRE-D EX-POST EVALUATION ANNEXES USAID.GOV
ANNEX A: EVALUATION INCEPTION REPORT
PHOTO: TCG
TABLE OF CONTENTS I. Introduction 49 II. Background on ex-post evaluation series 49 III. Activity context 49 IV. Evaluation design methodology 53 V. Evaluation design limitations and risks 63 VI. Utilization plan 63 VII. Team composition and management plan 64
ANNEXES Annex A. Fire-D Activities by Location & Phase with Contamination Summary 67 Annex B: Schedule of deliverables 74 Annex C: Work plan 75
FIGURES Figure 1: Map of India 50 Figure 2. FIRE-D Framework for Developing Sustainable and Inclusive Urban Infrastructure 52
TABLES Table 1. States and Cities Selected for Data Collection 55 Table 2. Evaluation Design Matrix 59 Table 3. Interview Quantities by Stakeholder Group 65
USAID.GOV E3/WATER CKM: FIRE-D EX-POST EVALUATION ANNEXES | 46
ACRONYMS ADB Asian Development Bank
AMRUT Atal Mission for Rejuvenation and Urban Transformation
BOOT Build-Own-Operate-Transfer
BSUP Basic Services for Urban Poor
CAP Crosscutting Agra Project
CBO Community-Based Organization
CDP City Development Plan
CKM Communications and Knowledge Management
CMA City Managers Association
CSP City Sanitation Plan
CVIP Commercially Viable Infrastructure Project
DFID United Kingdom Department for International Development
ET Evaluation Team
FIRE-D Financial Institutions Reform and Expansion–Debt and Infrastructure
GI Group Interview
GoI Government of India
HRIDAY Heritage City Development and Augmentation Yojana HUDCO Housing and Urban Development Corporation
IDIQ Indefinite Delivery/Indefinite Quantity
IFC International Finance Corporation
JNNURM Jawaharlal Nehru National Urban Renewal Mission KII Key Informant Interview
MoHUA Ministry of Housing and Urban Affairs
MoUD Ministry of Urban Development
NGO Nongovernmental Organization
NIUA National Institute of Urban Affairs
PHEO Public Health Engineering Organizations
PSP Private Sector Participation
SAAP State Annual Action Plans SBM-U Swacch Bharat Mission (Urban) SCM Smart Cities Mission
SI Social Impact Inc.
SIT Sustainability Index Tool
SLB Service Level Benchmark
SLIP Service Level Improvement Plans STEM Shahad Temghar Water Authority
SUDA State Urban Development Agencies
47 | E3/WATER CKM: FIRE-D EX-POST EVALUATION ANNEXES USAID.GOV

SWM Solid Waste Management
UIF Urban Infrastructure Fund
UIG Urban Infrastructure and Governance ULB Urban Local Body
USAID United States Agency for International Development
USAID/E3 Bureau for Economic Growth, Education and Environment
WASH Water, Sanitation, and Hygiene
WASH-FIN Water, Sanitation, and Hygiene Finance
WATER CKM Water Communications and Knowledge Management (CKM) Project
USAID.GOV E3/WATER CKM: FIRE-D EX-POST EVALUATION ANNEXES | 48
I. INTRODUCTIONThe Water Communications and Knowledge Management (CKM) Project is pleased to present this inception report for the Financial Institutions Reform and Expansion–Debt and Infrastructure (FIRE-D) Activity ex-post evaluation. This document clarifies the evaluation purpose and questions, describes the evaluation team composition, presents the team’s proposed data collection and data analysis plans, indicates known limitations, and reviews the schedule of deliverables.
II. BACKGROUND ON EX-POST EVALUATION SERIESOn September 17, 2015, USAID signed a contract with ECODIT for the Bureau for Economic Growth, Education and Environment (USAID/E3) Water CKM Project (AID-OAA-TO-15-00046), a five-year, $15 million task order under the Water and Development IDIQ. Under this contract, ECODIT is implementing knowledge management and communication services in support of the Water and Development Strategy and any follow-on water strategy. The project supports USAID’s E3 Water Office and its partners in increasing water program knowledge and data capture; enhancing knowledge creation and knowledge sharing internally and among a wide range of external water sector stakeholders working in the water sector; and improving communication and outreach through diverse stakeholder engagement. As part of Task 1.1, Knowledge and Data Capture, ECODIT and its subcontractor, Social Impact (SI), are conducting a series of ex-post performance evaluations of USAID water activities (Task 1.1.1) to further USAID’s understanding of why its completed water, sanitation, and hygiene (WASH) activities have or have not been sustained. The series of evaluations builds on lessons learned from the development of the Sustainability Index Tool (SIT) and its application in several countries. The first three evaluations have been completed in Madagascar, Indonesia, and Ethiopia. The fourth focuses on the FIRE-D activity in India. Findings from this evaluation will contribute to a knowledge base about the role of governance reform and financial options in sustaining and expanding urban water and sanitation services.
III. ACTIVITY CONTEXTFIRE-D was a three-phased USAID-funded activity that ran from 1994 to 2011 and was implemented by TCG International. The activity worked in tandem with India’s central, state, and city governments to ensure access to improved water and sanitation services through the encouragement of good urban governance focused on serving the urban poor.48
The activity’s goals were tied to the following objectives49:
4. Increasing the participation of cities, the private sector, and community organizations in thedevelopment and delivery of commercially viable and socially inclusive urban infrastructureservices
5. Improving the ability of city and state governments, infrastructure agencies, and urbanprofessionals to plan and manage urban growth, mobilize resources, and improve infrastructureservices
6. Supporting development of an urban infrastructure finance system
Over the course of three activity phases, FIRE-D concentrated technical assistance in the states of Andhra Pradesh, Bihar, Chandigarah, Gujarat, Himachal Pradesh, Karnataka, Madhya Pradesh, Maharashtra, Odisha, Punjab, Rajasthan, Tamil Nadu, Tripura, Uttarakhand, Uttar Pradesh, and West Bengal (Figure 1). Annex A details FIRE-D activities by location and project phase. The first phase (1994–1999) used the model of commercially viable infrastructure projects (CVIPs) and private sector
48 TCG International. 2011. India Financial Institutions Reform and Expansion Project FIRE-D Phase III Draft Close-Out Report. 49 FIRE-D Brochure
49 | E3/WATER CKM: FIRE-D EX-POST EVALUATION ANNEXES USAID.GOV
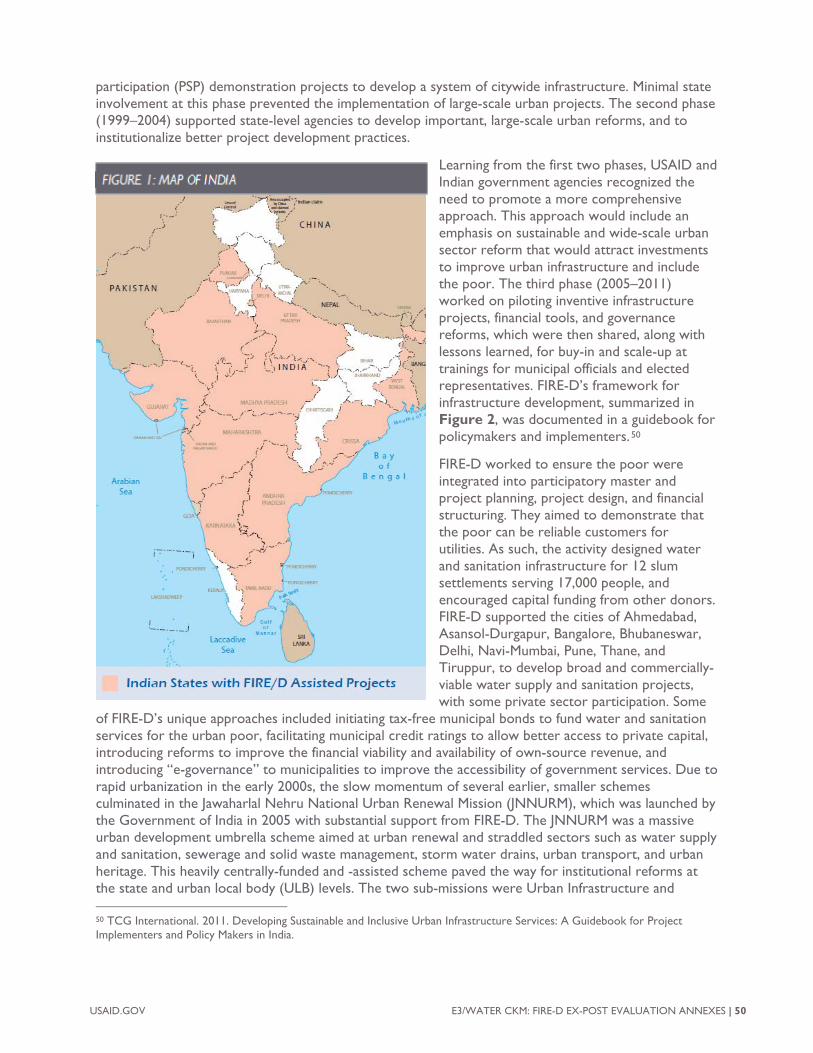
participation (PSP) demonstration projects to develop a system of citywide infrastructure. Minimal state involvement at this phase prevented the implementation of large-scale urban projects. The second phase (1999–2004) supported state-level agencies to develop important, large-scale urban reforms, and to institutionalize better project development practices.
Learning from the first two phases, USAID and Indian government agencies recognized the need to promote a more comprehensive approach. This approach would include an emphasis on sustainable and wide-scale urban sector reform that would attract investments to improve urban infrastructure and include the poor. The third phase (2005–2011) worked on piloting inventive infrastructure projects, financial tools, and governance reforms, which were then shared, along with lessons learned, for buy-in and scale-up at trainings for municipal officials and elected representatives. FIRE-D’s framework for infrastructure development, summarized in Figure 2, was documented in a guidebook for policymakers and implementers. 50
FIRE-D worked to ensure the poor were integrated into participatory master and project planning, project design, and financial structuring. They aimed to demonstrate that the poor can be reliable customers for utilities. As such, the activity designed water and sanitation infrastructure for 12 slum settlements serving 17,000 people, and encouraged capital funding from other donors. FIRE-D supported the cities of Ahmedabad, Asansol-Durgapur, Bangalore, Bhubaneswar, Delhi, Navi-Mumbai, Pune, Thane, and Tiruppur, to develop broad and commercially-viable water supply and sanitation projects, with some private sector participation. Some
of FIRE-D’s unique approaches included initiating tax-free municipal bonds to fund water and sanitation services for the urban poor, facilitating municipal credit ratings to allow better access to private capital, introducing reforms to improve the financial viability and availability of own-source revenue, and introducing “e-governance” to municipalities to improve the accessibility of government services. Due to rapid urbanization in the early 2000s, the slow momentum of several earlier, smaller schemes culminated in the Jawaharlal Nehru National Urban Renewal Mission (JNNURM), which was launched by the Government of India in 2005 with substantial support from FIRE-D. The JNNURM was a massive urban development umbrella scheme aimed at urban renewal and straddled sectors such as water supply and sanitation, sewerage and solid waste management, storm water drains, urban transport, and urban heritage. This heavily centrally-funded and -assisted scheme paved the way for institutional reforms at the state and urban local body (ULB) levels. The two sub-missions were Urban Infrastructure and
50 TCG International. 2011. Developing Sustainable and Inclusive Urban Infrastructure Services: A Guidebook for Project Implementers and Policy Makers in India.
USAID.GOV E3/WATER CKM: FIRE-D EX-POST EVALUATION ANNEXES | 50
Governance (UIG), and Basic Services for Urban Poor (BSUP). In 2014-15, the JNNURM was overhauled and re-launched as four separate schemes (currently operating). These are the Atal Mission for Rejuvenation and Urban Transformation (AMRUT), Heritage City Development and Augmentation Yojana (HRIDAY), Smart Cities Mission (SCM) and Swacch Bharat Mission (Urban) (SBM-U). AMRUT commands a focus on water supply, sanitation and sewerage across 500-odd towns and cities. Broad reforms targeted under AMRUT include professionalization of municipal cadre, development of e-governance mechanisms, augmentation of double entry accounting of ULBs, devolution of funds and functions, sustainable municipal finances, and the mobilization of own funds through completion of credit ratings. The SCM is focused on technology-oriented solutions for improved livability of targeted cities, while Hriday seeks to effect holistic development of selected heritage cities of India. The SBM-U, meanwhile, focuses on hygiene and behavioral change, working towards the eradication of open defecation practices and improved waste collection, management and disposal. The Government of India (GoI) has proposed an annual budgetary allocation of Rs 60 billion and Rs 61.69 billion for AMRUT and SCM, respectively, in 2018-19.
51 | E3/WATER CKM: FIRE-D EX-POST EVALUATION ANNEXES USAID.GOV
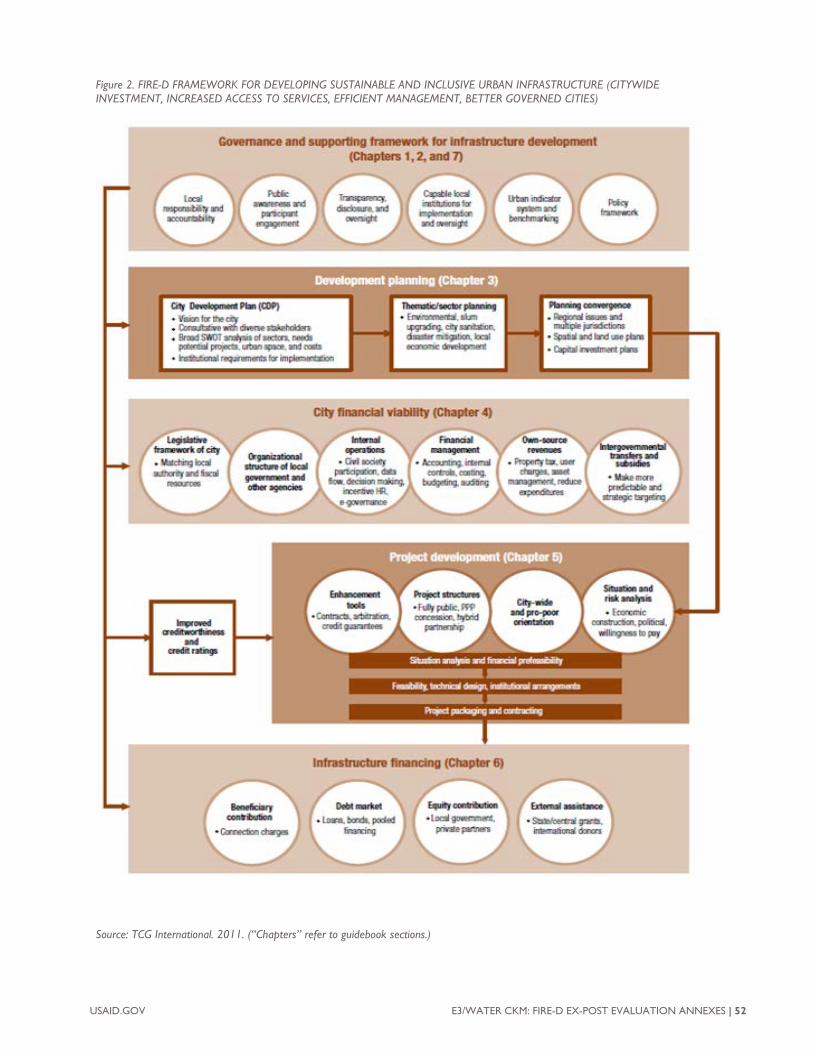
Figure 2. FIRE-D FRAMEWORK FOR DEVELOPING SUSTAINABLE AND INCLUSIVE URBAN INFRASTRUCTURE (CITYWIDE INVESTMENT, INCREASED ACCESS TO SERVICES, EFFICIENT MANAGEMENT, BETTER GOVERNED CITIES)
Source: TCG International. 2011. (“Chapters” refer to guidebook sections.)
USAID.GOV E3/WATER CKM: FIRE-D EX-POST EVALUATION ANNEXES | 52
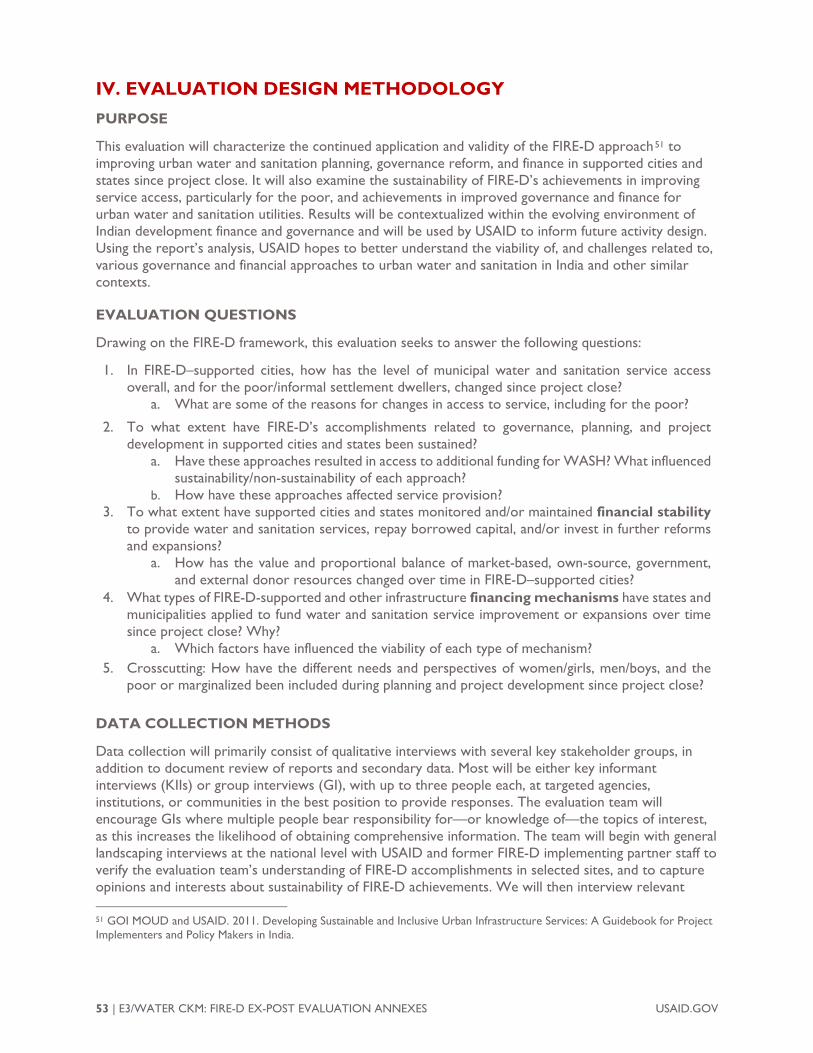
IV. EVALUATION DESIGN METHODOLOGYPURPOSE
This evaluation will characterize the continued application and validity of the FIRE-D approach51 to improving urban water and sanitation planning, governance reform, and finance in supported cities and states since project close. It will also examine the sustainability of FIRE-D’s achievements in improving service access, particularly for the poor, and achievements in improved governance and finance for urban water and sanitation utilities. Results will be contextualized within the evolving environment of Indian development finance and governance and will be used by USAID to inform future activity design. Using the report’s analysis, USAID hopes to better understand the viability of, and challenges related to, various governance and financial approaches to urban water and sanitation in India and other similar contexts.
EVALUATION QUESTIONS
Drawing on the FIRE-D framework, this evaluation seeks to answer the following questions:
1. In FIRE-D–supported cities, how has the level of municipal water and sanitation service accessoverall, and for the poor/informal settlement dwellers, changed since project close?
a. What are some of the reasons for changes in access to service, including for the poor?
2. To what extent have FIRE-D’s accomplishments related to governance, planning, and projectdevelopment in supported cities and states been sustained?
a. Have these approaches resulted in access to additional funding for WASH? What influencedsustainability/non-sustainability of each approach?
b. How have these approaches affected service provision?3. To what extent have supported cities and states monitored and/or maintained financial stability
to provide water and sanitation services, repay borrowed capital, and/or invest in further reformsand expansions?
a. How has the value and proportional balance of market-based, own-source, government,and external donor resources changed over time in FIRE-D–supported cities?
4. What types of FIRE-D-supported and other infrastructure financing mechanisms have states andmunicipalities applied to fund water and sanitation service improvement or expansions over timesince project close? Why?
a. Which factors have influenced the viability of each type of mechanism?5. Crosscutting: How have the different needs and perspectives of women/girls, men/boys, and the
poor or marginalized been included during planning and project development since project close?
DATA COLLECTION METHODS
Data collection will primarily consist of qualitative interviews with several key stakeholder groups, in addition to document review of reports and secondary data. Most will be either key informant interviews (KIIs) or group interviews (GI), with up to three people each, at targeted agencies, institutions, or communities in the best position to provide responses. The evaluation team will encourage GIs where multiple people bear responsibility for—or knowledge of—the topics of interest, as this increases the likelihood of obtaining comprehensive information. The team will begin with general landscaping interviews at the national level with USAID and former FIRE-D implementing partner staff to verify the evaluation team’s understanding of FIRE-D accomplishments in selected sites, and to capture opinions and interests about sustainability of FIRE-D achievements. We will then interview relevant
51 GOI MOUD and USAID. 2011. Developing Sustainable and Inclusive Urban Infrastructure Services: A Guidebook for Project Implementers and Policy Makers in India.
53 | E3/WATER CKM: FIRE-D EX-POST EVALUATION ANNEXES USAID.GOV
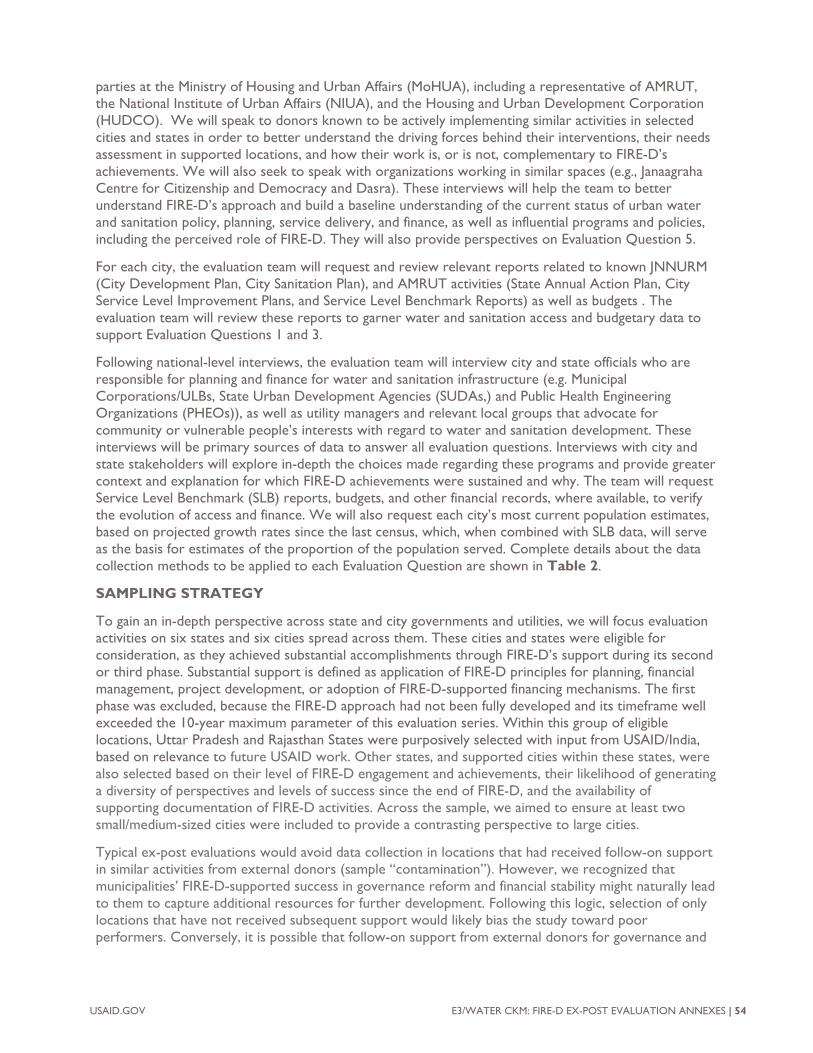
parties at the Ministry of Housing and Urban Affairs (MoHUA), including a representative of AMRUT, the National Institute of Urban Affairs (NIUA), and the Housing and Urban Development Corporation (HUDCO). We will speak to donors known to be actively implementing similar activities in selected cities and states in order to better understand the driving forces behind their interventions, their needs assessment in supported locations, and how their work is, or is not, complementary to FIRE-D’s achievements. We will also seek to speak with organizations working in similar spaces (e.g., Janaagraha Centre for Citizenship and Democracy and Dasra). These interviews will help the team to better understand FIRE-D’s approach and build a baseline understanding of the current status of urban water and sanitation policy, planning, service delivery, and finance, as well as influential programs and policies, including the perceived role of FIRE-D. They will also provide perspectives on Evaluation Question 5.
For each city, the evaluation team will request and review relevant reports related to known JNNURM (City Development Plan, City Sanitation Plan), and AMRUT activities (State Annual Action Plan, City Service Level Improvement Plans, and Service Level Benchmark Reports) as well as budgets . The evaluation team will review these reports to garner water and sanitation access and budgetary data to support Evaluation Questions 1 and 3.
Following national-level interviews, the evaluation team will interview city and state officials who are responsible for planning and finance for water and sanitation infrastructure (e.g. Municipal Corporations/ULBs, State Urban Development Agencies (SUDAs,) and Public Health Engineering Organizations (PHEOs)), as well as utility managers and relevant local groups that advocate for community or vulnerable people’s interests with regard to water and sanitation development. These interviews will be primary sources of data to answer all evaluation questions. Interviews with city and state stakeholders will explore in-depth the choices made regarding these programs and provide greater context and explanation for which FIRE-D achievements were sustained and why. The team will request Service Level Benchmark (SLB) reports, budgets, and other financial records, where available, to verify the evolution of access and finance. We will also request each city’s most current population estimates, based on projected growth rates since the last census, which, when combined with SLB data, will serve as the basis for estimates of the proportion of the population served. Complete details about the data collection methods to be applied to each Evaluation Question are shown in Table 2.
SAMPLING STRATEGY
To gain an in-depth perspective across state and city governments and utilities, we will focus evaluation activities on six states and six cities spread across them. These cities and states were eligible for consideration, as they achieved substantial accomplishments through FIRE-D’s support during its second or third phase. Substantial support is defined as application of FIRE-D principles for planning, financial management, project development, or adoption of FIRE-D-supported financing mechanisms. The first phase was excluded, because the FIRE-D approach had not been fully developed and its timeframe well exceeded the 10-year maximum parameter of this evaluation series. Within this group of eligible locations, Uttar Pradesh and Rajasthan States were purposively selected with input from USAID/India, based on relevance to future USAID work. Other states, and supported cities within these states, were also selected based on their level of FIRE-D engagement and achievements, their likelihood of generating a diversity of perspectives and levels of success since the end of FIRE-D, and the availability of supporting documentation of FIRE-D activities. Across the sample, we aimed to ensure at least two small/medium-sized cities were included to provide a contrasting perspective to large cities.
Typical ex-post evaluations would avoid data collection in locations that had received follow-on support in similar activities from external donors (sample “contamination”). However, we recognized that municipalities’ FIRE-D-supported success in governance reform and financial stability might naturally lead to them to capture additional resources for further development. Following this logic, selection of only locations that have not received subsequent support would likely bias the study toward poor performers. Conversely, it is possible that follow-on support from external donors for governance and
USAID.GOV E3/WATER CKM: FIRE-D EX-POST EVALUATION ANNEXES | 54
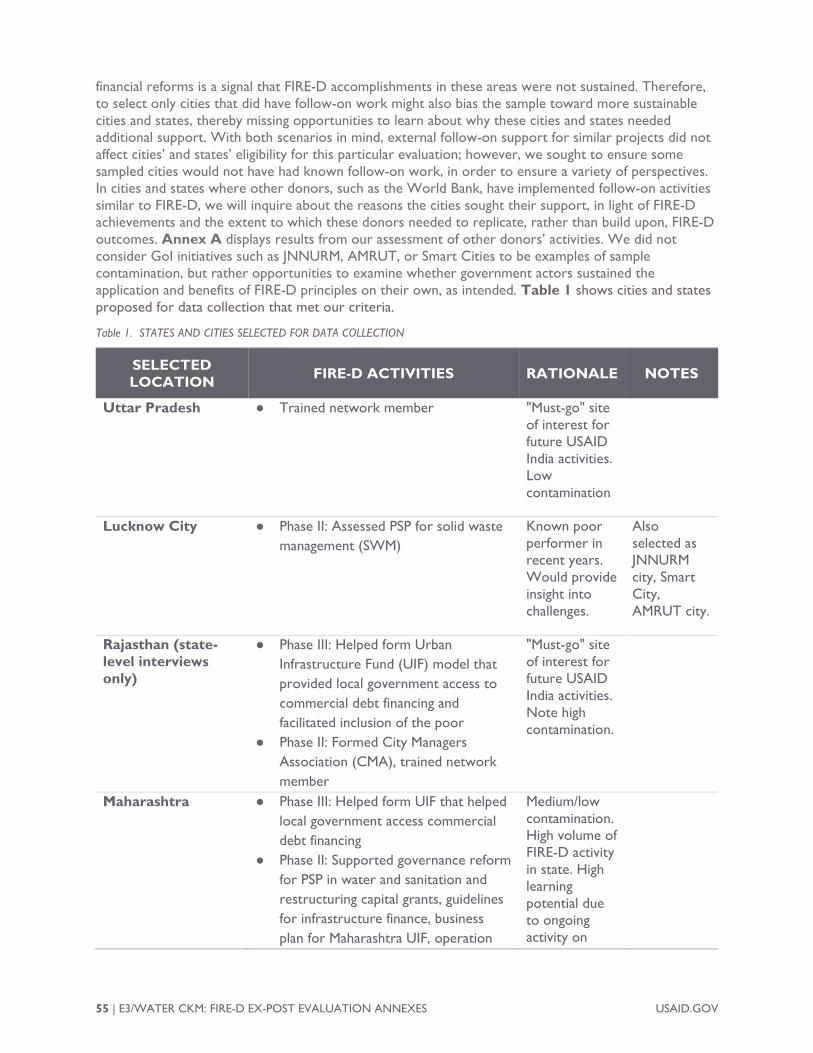
55 | E3/WATER CKM: FIRE-D EX-POST EVALUATION ANNEXES USAID.GOV
financial reforms is a signal that FIRE-D accomplishments in these areas were not sustained. Therefore, to select only cities that did have follow-on work might also bias the sample toward more sustainable cities and states, thereby missing opportunities to learn about why these cities and states needed additional support. With both scenarios in mind, external follow-on support for similar projects did not affect cities’ and states’ eligibility for this particular evaluation; however, we sought to ensure some sampled cities would not have had known follow-on work, in order to ensure a variety of perspectives. In cities and states where other donors, such as the World Bank, have implemented follow-on activities similar to FIRE-D, we will inquire about the reasons the cities sought their support, in light of FIRE-D achievements and the extent to which these donors needed to replicate, rather than build upon, FIRE-D outcomes. Annex A displays results from our assessment of other donors’ activities. We did not consider GoI initiatives such as JNNURM, AMRUT, or Smart Cities to be examples of sample contamination, but rather opportunities to examine whether government actors sustained the application and benefits of FIRE-D principles on their own, as intended. Table 1 shows cities and states proposed for data collection that met our criteria.
Table 1. STATES AND CITIES SELECTED FOR DATA COLLECTION
SELECTED LOCATION
FIRE-D ACTIVITIES RATIONALE NOTES
Uttar Pradesh ● Trained network member "Must-go" site of interest for future USAID India activities. Low contamination
Lucknow City ● Phase II: Assessed PSP for solid wastemanagement (SWM)
Known poor performer in recent years. Would provide insight into challenges.
Also selected as JNNURM city, Smart City, AMRUT city.
Rajasthan (state-level interviews only)
● Phase III: Helped form UrbanInfrastructure Fund (UIF) model thatprovided local government access tocommercial debt financing andfacilitated inclusion of the poor
● Phase II: Formed City ManagersAssociation (CMA), trained networkmember
"Must-go" site of interest for future USAID India activities. Note high contamination.
Maharashtra ● Phase III: Helped form UIF that helpedlocal government access commercialdebt financing
● Phase II: Supported governance reformfor PSP in water and sanitation andrestructuring capital grants, guidelinesfor infrastructure finance, businessplan for Maharashtra UIF, operation
Medium/low contamination. High volume of FIRE-D activity in state. High learning potential due to ongoing activity on
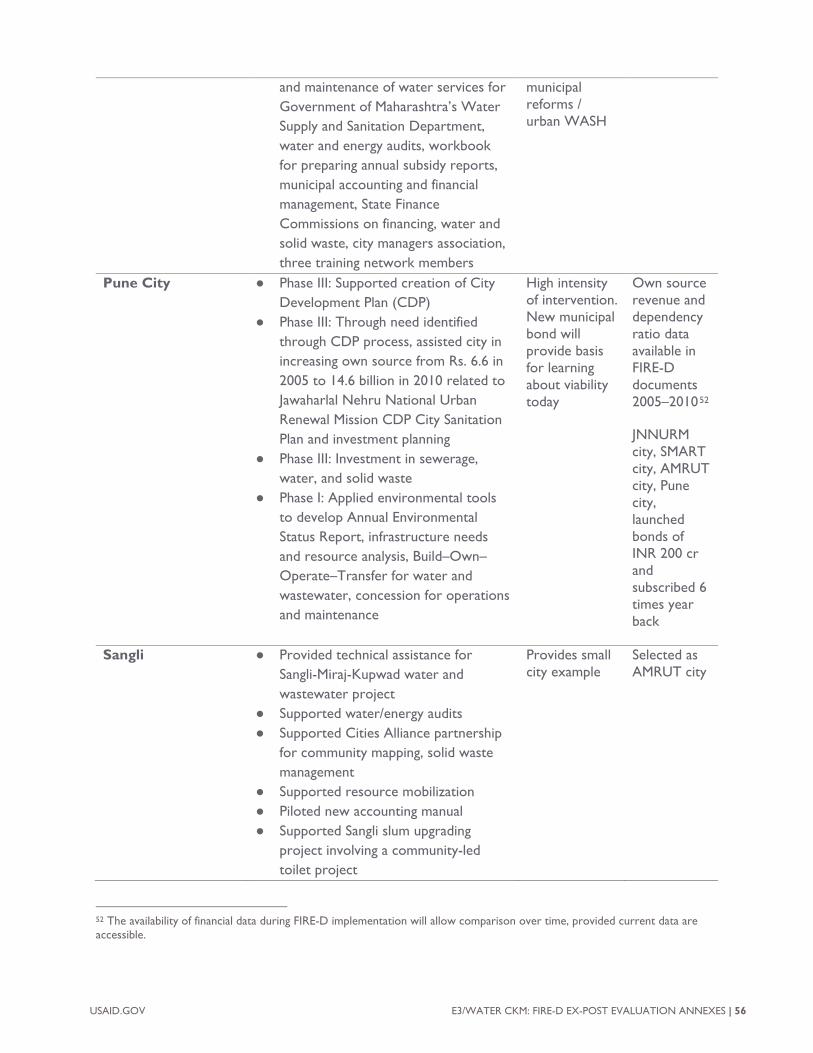
and maintenance of water services for Government of Maharashtra’s Water Supply and Sanitation Department, water and energy audits, workbook for preparing annual subsidy reports, municipal accounting and financial management, State Finance Commissions on financing, water and solid waste, city managers association, three training network members
municipal reforms / urban WASH
Pune City ● Phase III: Supported creation of CityDevelopment Plan (CDP)
● Phase III: Through need identifiedthrough CDP process, assisted city inincreasing own source from Rs. 6.6 in2005 to 14.6 billion in 2010 related toJawaharlal Nehru National UrbanRenewal Mission CDP City SanitationPlan and investment planning
● Phase III: Investment in sewerage,water, and solid waste
● Phase I: Applied environmental toolsto develop Annual EnvironmentalStatus Report, infrastructure needsand resource analysis, Build–Own–Operate–Transfer for water andwastewater, concession for operationsand maintenance
High intensity of intervention. New municipal bond will provide basis for learning about viability today
Own source revenue and dependency ratio data available in FIRE-D documents 2005–201052
JNNURM city, SMART city, AMRUT city, Pune city, launched bonds of INR 200 cr and subscribed 6 times year back
Sangli ● Provided technical assistance forSangli-Miraj-Kupwad water andwastewater project
● Supported water/energy audits● Supported Cities Alliance partnership
for community mapping, solid wastemanagement
● Supported resource mobilization● Piloted new accounting manual● Supported Sangli slum upgrading
project involving a community-ledtoilet project
Provides small city example
Selected as AMRUT city
52 The availability of financial data during FIRE-D implementation will allow comparison over time, provided current data are accessible.
USAID.GOV E3/WATER CKM: FIRE-D EX-POST EVALUATION ANNEXES | 56
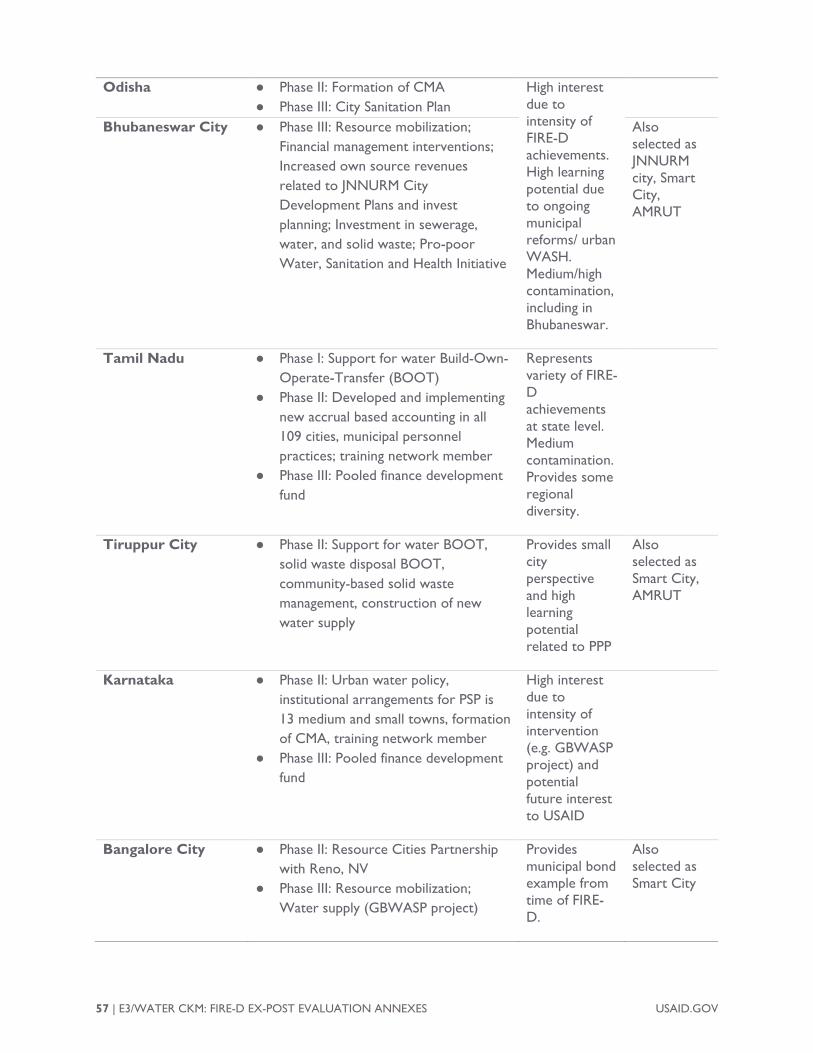
57 | E3/WATER CKM: FIRE-D EX-POST EVALUATION ANNEXES USAID.GOV
Odisha ● Phase II: Formation of CMA● Phase III: City Sanitation Plan
High interest due to intensity of FIRE-D achievements. High learning potential due to ongoing municipal reforms/ urban WASH. Medium/high contamination, including in Bhubaneswar.
Bhubaneswar City ● Phase III: Resource mobilization;Financial management interventions;Increased own source revenuesrelated to JNNURM CityDevelopment Plans and investplanning; Investment in sewerage,water, and solid waste; Pro-poorWater, Sanitation and Health Initiative
Also selected as JNNURM city, Smart City, AMRUT
Tamil Nadu ● Phase I: Support for water Build-Own-Operate-Transfer (BOOT)
● Phase II: Developed and implementingnew accrual based accounting in all109 cities, municipal personnelpractices; training network member
● Phase III: Pooled finance developmentfund
Represents variety of FIRE-D achievements at state level. Medium contamination. Provides some regional diversity.
Tiruppur City ● Phase II: Support for water BOOT,solid waste disposal BOOT,community-based solid wastemanagement, construction of newwater supply
Provides small city perspective and high learning potential related to PPP
Also selected as Smart City, AMRUT
Karnataka ● Phase II: Urban water policy,institutional arrangements for PSP is13 medium and small towns, formationof CMA, training network member
● Phase III: Pooled finance developmentfund
High interest due to intensity of intervention (e.g. GBWASP project) and potential future interest to USAID
Bangalore City ● Phase II: Resource Cities Partnershipwith Reno, NV
● Phase III: Resource mobilization;Water supply (GBWASP project)
Provides municipal bond example from time of FIRE-D.
Also selected as Smart City
DATA ANALYSIS
The evaluation team will take detailed notes and record audio of all interviews to support recollection of topics discussed, contingent upon respondents’ consent. The team anticipates several government officials will not consent to audio recordings. At the conclusion of each day, interview partners will review and expand upon their notes to ensure they capture all elements of the interview. Following all data collection, the team will finalize a codebook reflecting the evaluation questions and additional themes that emerge from interviews and apply thematic codes to each interview’s detailed notes. The team will apply document crosstabs, examine frequencies of particular viewpoints, and highlight key quotations to support their analysis. Each interview’s notes will be double coded by two trained individuals, and inter-rater reliability will be tested on a sample of interview notes. The evaluation team will analyze and triangulate all relevant stakeholders’ perspectives to ensure conclusions for each evaluation question reflect multiple perspectives.
The team will review the most recent JNNURM, AMRUT, or other city and state planning documents using a checklist of reforms and approaches promoted by FIRE-D, in an effort to identify evidence of continued application of principles promoted by FIRE-D (e.g. participation, transparency, financial management, decentralization). This will be used to triangulate findings from interviews and will be summarized in the report. To determine changes in the number and proportion of population served by utilities, the team will compare the numbers known at endline through project reports or government records with Service Level Benchmark and financial record data from present-day and intervening years. Specific analysis methods for each evaluation question are described in Table 2.
PLAN FOR GENDER AND SOCIAL ANALYSIS
Evaluation Question 1 examines the inclusion of the poor and informal settlement dwellers in municipal water and sanitation services. The team will document the extent to which these vulnerable populations have access to these services. Evaluation Question 7 will examine gender and social group inclusion during development planning and project design. The team will determine the extent to which male and female, poor, and marginalized perspectives are considered and consulted during these processes. Through interviews with relevant Community-Based Organizations (CBOs) supporting community interests in water and sanitation services, the team will also assess social and gender equity in service access and repayment capability. The interviews at MOUD will target those most able to speak about governance, planning, and finance of urban development projects, independent of gender; however, the evaluation team will make note of the number of women in these positions to assess their inclusion in urban planning processes.
USAID.GOV E3/WATER CKM: FIRE-D EX-POST EVALUATION ANNEXES | 58
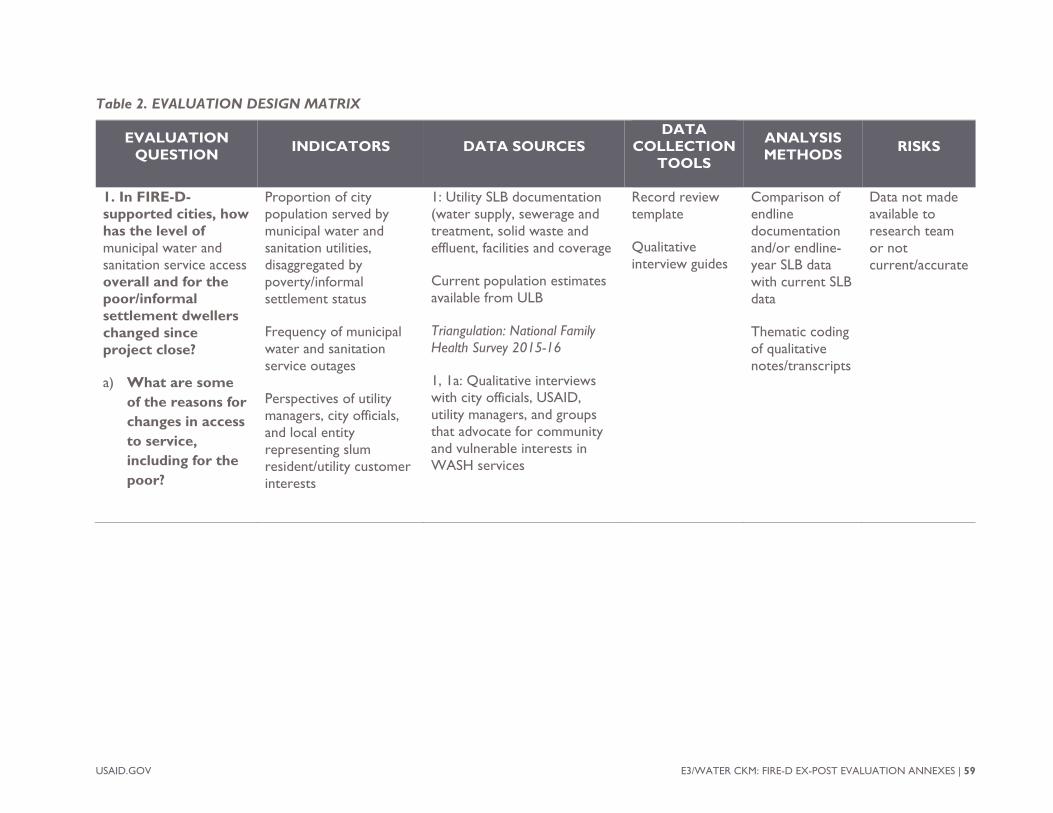
USAID.GOV E3/WATER CKM: FIRE-D EX-POST EVALUATION ANNEXES | 59
Table 2. EVALUATION DESIGN MATRIX
EVALUATION QUESTION INDICATORS DATA SOURCES
DATA COLLECTION
TOOLS
ANALYSIS METHODS RISKS
1. In FIRE-D-supported cities, howhas the level ofmunicipal water andsanitation service accessoverall and for thepoor/informalsettlement dwellerschanged sinceproject close?
a) What are someof the reasons forchanges in accessto service,including for thepoor?
Proportion of city population served by municipal water and sanitation utilities, disaggregated by poverty/informal settlement status
Frequency of municipal water and sanitation service outages
Perspectives of utility managers, city officials, and local entity representing slum resident/utility customer interests
1: Utility SLB documentation (water supply, sewerage and treatment, solid waste and effluent, facilities and coverage
Current population estimates available from ULB
Triangulation: National Family Health Survey 2015-16
1, 1a: Qualitative interviews with city officials, USAID, utility managers, and groups that advocate for community and vulnerable interests in WASH services
Record review template
Qualitative interview guides
Comparison of endline documentation and/or endline-year SLB data with current SLB data
Thematic coding of qualitative notes/transcripts
Data not made available to research team or not current/accurate
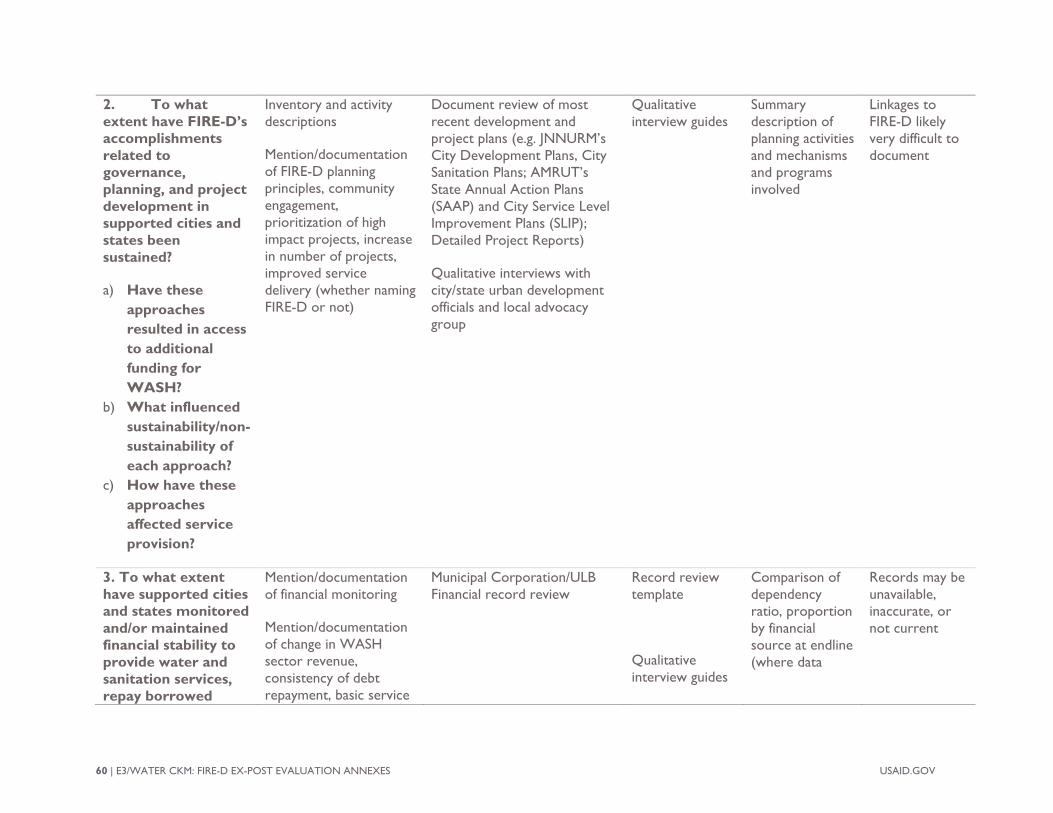
60 | E3/WATER CKM: FIRE-D EX-POST EVALUATION ANNEXES USAID.GOV
2. To whatextent have FIRE-D’saccomplishmentsrelated togovernance,planning, and projectdevelopment insupported cities andstates beensustained?
a) Have theseapproachesresulted in accessto additionalfunding forWASH?
b) What influencedsustainability/non-sustainability ofeach approach?
c) How have theseapproachesaffected serviceprovision?
Inventory and activity descriptions
Mention/documentation of FIRE-D planning principles, community engagement, prioritization of high impact projects, increase in number of projects, improved service delivery (whether naming FIRE-D or not)
Document review of most recent development and project plans (e.g. JNNURM’s City Development Plans, City Sanitation Plans; AMRUT’s State Annual Action Plans (SAAP) and City Service Level Improvement Plans (SLIP); Detailed Project Reports)
Qualitative interviews with city/state urban development officials and local advocacy group
Qualitative interview guides
Summary description of planning activities and mechanisms and programs involved
Linkages to FIRE-D likely very difficult to document
3. To what extenthave supported citiesand states monitoredand/or maintainedfinancial stability toprovide water andsanitation services,repay borrowed
Mention/documentation of financial monitoring
Mention/documentation of change in WASH sector revenue, consistency of debt repayment, basic service
Municipal Corporation/ULB Financial record review
Record review template
Qualitative interview guides
Comparison of dependency ratio, proportion by financial source at endline (where data
Records may be unavailable, inaccurate, or not current
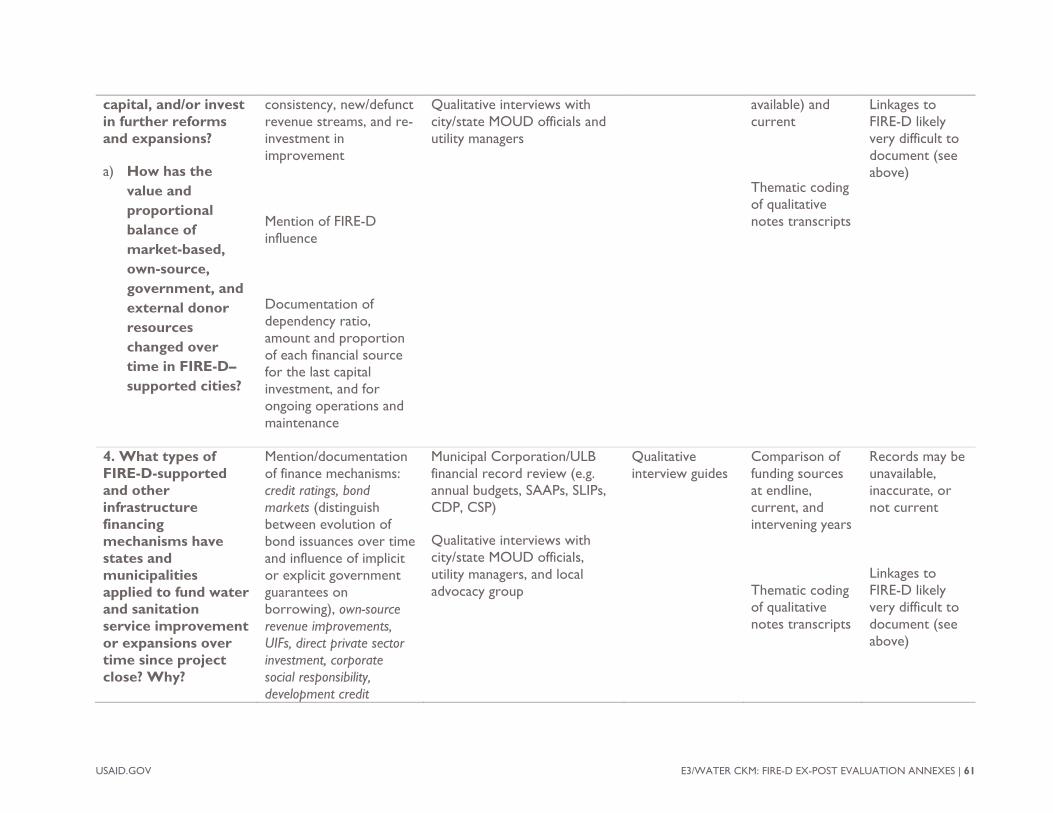
USAID.GOV E3/WATER CKM: FIRE-D EX-POST EVALUATION ANNEXES | 61
capital, and/or invest in further reforms and expansions?
a) How has thevalue andproportionalbalance ofmarket-based,own-source,government, andexternal donorresourceschanged overtime in FIRE-D–supported cities?
consistency, new/defunct revenue streams, and re-investment in improvement
Mention of FIRE-D influence
Documentation of dependency ratio, amount and proportion of each financial source for the last capital investment, and for ongoing operations and maintenance
Qualitative interviews with city/state MOUD officials and utility managers
available) and current
Thematic coding of qualitative notes transcripts
Linkages to FIRE-D likely very difficult to document (see above)
4. What types ofFIRE-D-supportedand otherinfrastructurefinancingmechanisms havestates andmunicipalitiesapplied to fund waterand sanitationservice improvementor expansions overtime since projectclose? Why?
Mention/documentation of finance mechanisms: credit ratings, bond markets (distinguish between evolution of bond issuances over time and influence of implicit or explicit government guarantees on borrowing), own-source revenue improvements, UIFs, direct private sector investment, corporate social responsibility, development credit
Municipal Corporation/ULB financial record review (e.g. annual budgets, SAAPs, SLIPs, CDP, CSP)
Qualitative interviews with city/state MOUD officials, utility managers, and local advocacy group
Qualitative interview guides
Comparison of funding sources at endline, current, and intervening years
Thematic coding of qualitative notes transcripts
Records may be unavailable, inaccurate, or not current
Linkages to FIRE-D likely very difficult to document (see above)
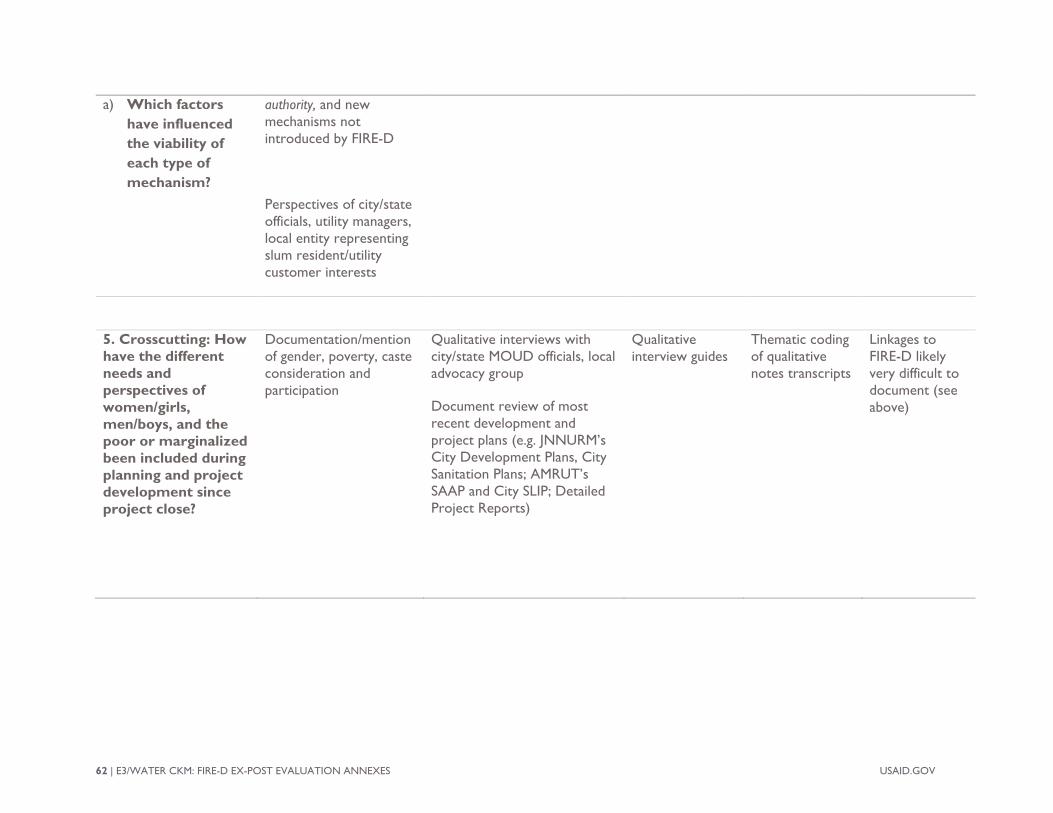
62 | E3/WATER CKM: FIRE-D EX-POST EVALUATION ANNEXES USAID.GOV
a) Which factorshave influencedthe viability ofeach type ofmechanism?
authority, and new mechanisms not introduced by FIRE-D
Perspectives of city/state officials, utility managers, local entity representing slum resident/utility customer interests
5. Crosscutting: Howhave the differentneeds andperspectives ofwomen/girls,men/boys, and thepoor or marginalizedbeen included duringplanning and projectdevelopment sinceproject close?
Documentation/mention of gender, poverty, caste consideration and participation
Qualitative interviews with city/state MOUD officials, local advocacy group
Document review of most recent development and project plans (e.g. JNNURM’s City Development Plans, City Sanitation Plans; AMRUT’s SAAP and City SLIP; Detailed Project Reports)
Qualitative interview guides
Thematic coding of qualitative notes transcripts
Linkages to FIRE-D likely very difficult to document (see above)
V. EVALUATION DESIGN LIMITATIONS AND RISKSFollowing the completion of FIRE-D, India has been inundated by initiatives to improve governance and finance around urban water and sanitation. Not only have major donors such as The World Bank and DFID conducted projects similar to FIRE-D, but government initiatives such as Swachh Bharat, Smart Cities, and AMRUT have transformed both incentives and the enabling environment for urban WASH improvements. To some degree, these initiatives may have emerged, in part, due to FIRE-D’s work. The current environment is shaped by many factors that will make it difficult to link observed practices to FIRE-D influence alone. While we will attempt to interview those with whom FIRE-D directly engaged, we anticipate this will not be possible in many cases due to staff turnover, further decreasing the evaluation team’s ability to pinpoint FIRE-D’s specific influence. An inability to link outcomes to FIRE-D is not necessarily problematic, as the purpose of the evaluation, in its broadest sense, is to improve understanding of the viability and challenges related to the sustainability of various governance and financial approaches to urban water and sanitation in India. Lessons about any governance or finance approach observed through interviews, independent of which entity caused it, is valuable to serve this purpose. Several evaluation questions rely on review of reports and official record data; however, it is possible that records will not be consistently or accurately kept, and may not be available to the evaluation team for particular cities or states. To mitigate this, the team will include a request for reports and record data when making appointments with these stakeholders to increase the likelihood they can locate and bring relevant records to the interview. The evaluation team will note irregularities or gaps in record data that may influence their reliability, and will triangulate these data, to the extent possible, with other data sources. If record data are not usable in certain sites, the team will rely on qualitative responses to provide a general impression of these outcomes. Finally, India presents a fairly unique context with its national WASH policy initiatives, private investment climate, and other factors. Findings from this evaluation may not have broad external validity to be applicable to other countries. The evaluation team will attempt to identify the likelihood of external validity in the report.
VI. UTILIZATION PLANThe evaluation team will present preliminary findings to USAID/India in Delhi at the conclusion of data collection. The evaluation team will then deliver a draft evaluation report to E3/W and USAID/India for comments prior to finalization to ensure it accurately portrays activities and clearly and effectively presents findings and recommendations. The evaluation team recommends that former implementers and key staff of the USAID WASH-FIN contract mechanism also review the draft report, as their contextual input will be invaluable for improvements in the final report. To encourage wider utilization and ultimate compilation with other synthesis “chapters” to come later in the evaluation series, the report will be succinct and will highlight actionable recommendations for the intended users of the evaluation.
If desired, the evaluation team will also give a public webinar presentation of the final report findings. The Water CKM team will post the final report to Globalwaters.org, USAID’s Development Experience Clearinghouse, and collaborate with E3/W to facilitate dissemination to key stakeholders, including USAID missions, USAID/Washington staff, implementing partners, and Indian Government counterparts. A short evaluation brief will be written following approval of the final report, as well as a blog post on the Globalwaters.org website to share findings more broadly.
Findings from this evaluation, and future evaluation series chapters, will be of interest to the wider WASH community and will be distributed broadly to inform sectoral discussion on sustainability. The Water CKM team will work with E3/W to identify additional channels and timing for dissemination of findings. Potential channels may include conferences, brown bags, and webinars for those in the water and sanitation sector. The Water CKM team will also explore different formats for sharing findings with E3/W beyond the standard report format.
USAID.GOV E3/WATER CKM: FIRE-D EX-POST EVALUATION ANNEXES | 63
VII. TEAM COMPOSITION AND MANAGEMENT PLANTEAM COMPOSITION
The evaluation team will consist of individuals that provide sufficient collective expertise to address all technical knowledge related to evaluation, urban WASH, financing, and urban planning in India. Though the team composition and individual roles may shift among members, below is an illustrative listing of a team for this evaluation.
▪ Leslie Hodel, Team Leader (SI), will lead background research and planning; coordinate datacollection planning, training, and piloting; lead data analysis; and co-author the evaluation report.
▪ Holly Dentz, Evaluation Specialist (SI), will conduct data collection in the field, providetechnical guidance and field coordination support to the local team, and will support analysis andreport writing.
▪ Sujit Mridha, Senior WASH Evaluation Specialist, is an expert in urban planning in Indiawith urban WASH, finance, and qualitative evaluation experience. This person will providestrategic and contextual input to the evaluation design, assist in leading local team training, conductdata collection, and support analysis and report writing.
▪ Abhirup Bhunia, WASH Evaluation Specialist, is an expert in urban planning in India withurban WASH, finance, and qualitative evaluation experience. He will provide feedback onevaluation tools and methods, conduct data collection, and assist with data analysis and reportwriting as needed.
▪ Debanjana Das, WASH Evaluation Specialist, is an expert in qualitative research and genderstudies with experience in the WASH sector. She will lead team training on qualitative methods,review data collection instruments, conduct data collection, and assist with analysis and reportwriting as needed.
▪ Gabrielle Plotkin, Evaluation Specialist, is an evaluation expert with extensive global fieldexperience. She will conduct data collection and assist with data analysis and report writing asneeded.
▪ Ankita Rawat, Logistician, will support the evaluation team in scheduling interviews andarranging local travel logistics.
▪ Devendra Dhapola, Logistician, has extensive expertise in the urban WASH sector. He willsupport the evaluation team’s planning by identifying sample contamination, noting othergovernment initiatives and related documents in selected cities, and identifying interview targets.
EVALUATION TIMELINE
The evaluation team estimates each interview will last 1.5 hours. The team estimates completion of three interviews on average per team, per day. Schedule availability of respondents and travel logistics may reduce or increase this estimate. Within each state and city, the team anticipates up to 2-3 interviews with the official(s) responsible for WASH development planning and finance at the state level, and another 2-3 interviews at the city level with Municipal Corporations/ULBs and utilities. Within each city, the team will interview representatives at the water and/or sanitation authorities, depending on which was involved in FIRE-D projects and subsequent government projects. Also within each city, the team will target one to two local groups that advocate for water and sanitation utility access on behalf of the poor and informal settlement dwellers (e.g. community-based organizations, NGOs, or if no organization can be identified, Ward government representatives).
64 | E3/WATER CKM: FIRE-D EX-POST EVALUATION ANNEXES USAID.GOV
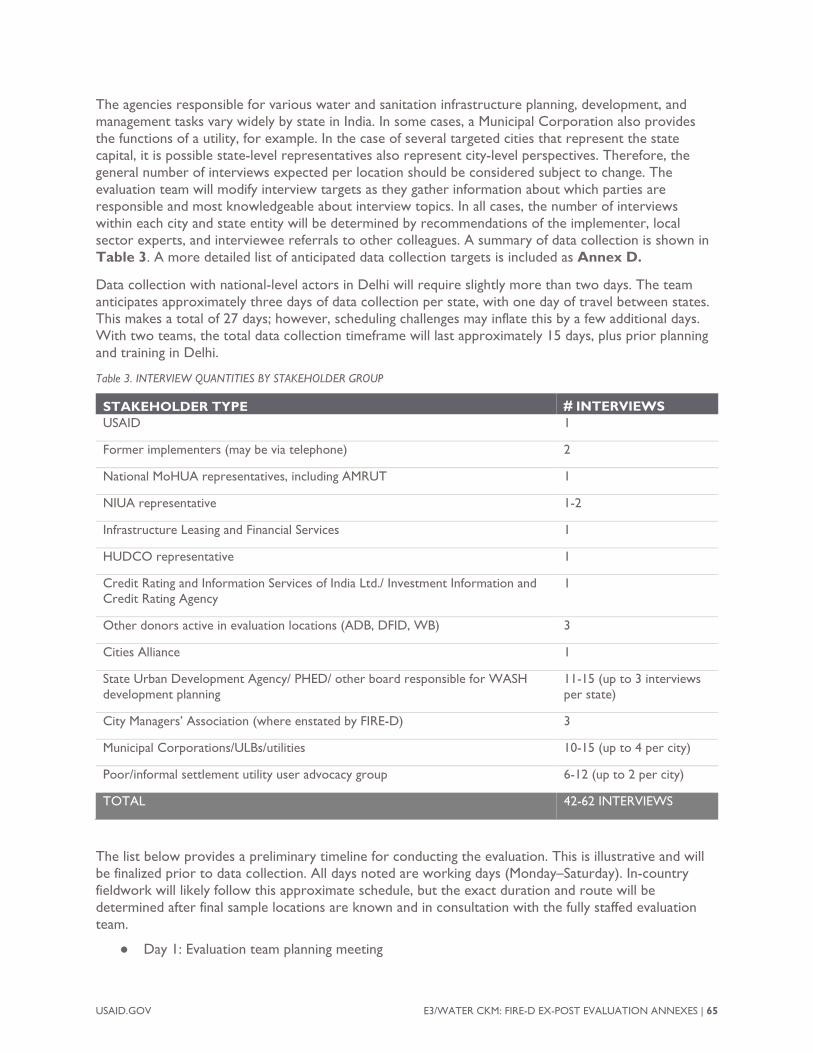
The agencies responsible for various water and sanitation infrastructure planning, development, and management tasks vary widely by state in India. In some cases, a Municipal Corporation also provides the functions of a utility, for example. In the case of several targeted cities that represent the state capital, it is possible state-level representatives also represent city-level perspectives. Therefore, the general number of interviews expected per location should be considered subject to change. The evaluation team will modify interview targets as they gather information about which parties are responsible and most knowledgeable about interview topics. In all cases, the number of interviews within each city and state entity will be determined by recommendations of the implementer, local sector experts, and interviewee referrals to other colleagues. A summary of data collection is shown in Table 3. A more detailed list of anticipated data collection targets is included as Annex D.
Data collection with national-level actors in Delhi will require slightly more than two days. The team anticipates approximately three days of data collection per state, with one day of travel between states. This makes a total of 27 days; however, scheduling challenges may inflate this by a few additional days. With two teams, the total data collection timeframe will last approximately 15 days, plus prior planning and training in Delhi.
Table 3. INTERVIEW QUANTITIES BY STAKEHOLDER GROUP
STAKEHOLDER TYPE # INTERVIEWS USAID 1
Former implementers (may be via telephone) 2
National MoHUA representatives, including AMRUT 1
NIUA representative 1-2
Infrastructure Leasing and Financial Services 1
HUDCO representative 1
Credit Rating and Information Services of India Ltd./ Investment Information and Credit Rating Agency
1
Other donors active in evaluation locations (ADB, DFID, WB) 3
Cities Alliance 1
State Urban Development Agency/ PHED/ other board responsible for WASH development planning
11-15 (up to 3 interviewsper state)
City Managers’ Association (where enstated by FIRE-D) 3
Municipal Corporations/ULBs/utilities 10-15 (up to 4 per city)
Poor/informal settlement utility user advocacy group 6-12 (up to 2 per city)
TOTAL 42-62 INTERVIEWS
The list below provides a preliminary timeline for conducting the evaluation. This is illustrative and will be finalized prior to data collection. All days noted are working days (Monday–Saturday). In-country fieldwork will likely follow this approximate schedule, but the exact duration and route will be determined after final sample locations are known and in consultation with the fully staffed evaluation team.
● Day 1: Evaluation team planning meeting
USAID.GOV E3/WATER CKM: FIRE-D EX-POST EVALUATION ANNEXES | 65
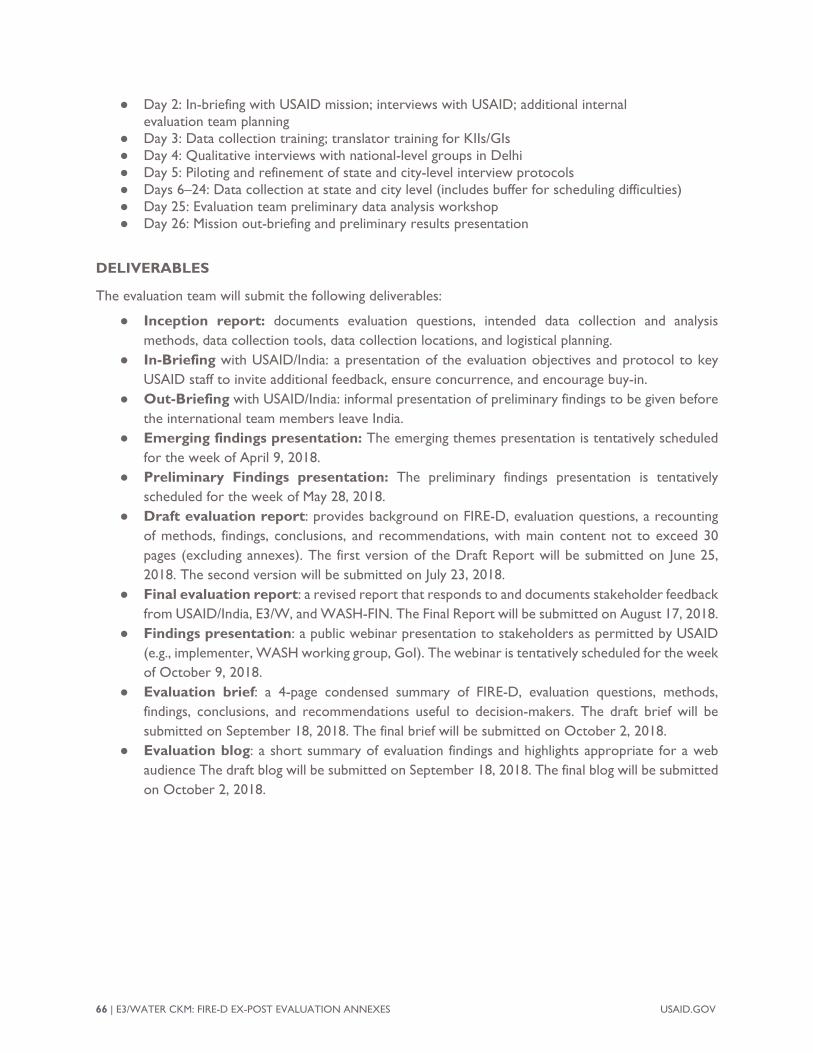
● Day 2: In-briefing with USAID mission; interviews with USAID; additional internalevaluation team planning
● Day 3: Data collection training; translator training for KIIs/GIs● Day 4: Qualitative interviews with national-level groups in Delhi● Day 5: Piloting and refinement of state and city-level interview protocols● Days 6–24: Data collection at state and city level (includes buffer for scheduling difficulties)● Day 25: Evaluation team preliminary data analysis workshop● Day 26: Mission out-briefing and preliminary results presentation
DELIVERABLES
The evaluation team will submit the following deliverables:
● Inception report: documents evaluation questions, intended data collection and analysismethods, data collection tools, data collection locations, and logistical planning.
● In-Briefing with USAID/India: a presentation of the evaluation objectives and protocol to keyUSAID staff to invite additional feedback, ensure concurrence, and encourage buy-in.
● Out-Briefing with USAID/India: informal presentation of preliminary findings to be given beforethe international team members leave India.
● Emerging findings presentation: The emerging themes presentation is tentatively scheduledfor the week of April 9, 2018.
● Preliminary Findings presentation: The preliminary findings presentation is tentativelyscheduled for the week of May 28, 2018.
● Draft evaluation report: provides background on FIRE-D, evaluation questions, a recountingof methods, findings, conclusions, and recommendations, with main content not to exceed 30pages (excluding annexes). The first version of the Draft Report will be submitted on June 25,2018. The second version will be submitted on July 23, 2018.
● Final evaluation report: a revised report that responds to and documents stakeholder feedbackfrom USAID/India, E3/W, and WASH-FIN. The Final Report will be submitted on August 17, 2018.
● Findings presentation: a public webinar presentation to stakeholders as permitted by USAID(e.g., implementer, WASH working group, GoI). The webinar is tentatively scheduled for the weekof October 9, 2018.
● Evaluation brief: a 4-page condensed summary of FIRE-D, evaluation questions, methods,findings, conclusions, and recommendations useful to decision-makers. The draft brief will besubmitted on September 18, 2018. The final brief will be submitted on October 2, 2018.
● Evaluation blog: a short summary of evaluation findings and highlights appropriate for a webaudience The draft blog will be submitted on September 18, 2018. The final blog will be submittedon October 2, 2018.
66 | E3/WATER CKM: FIRE-D EX-POST EVALUATION ANNEXES USAID.GOV
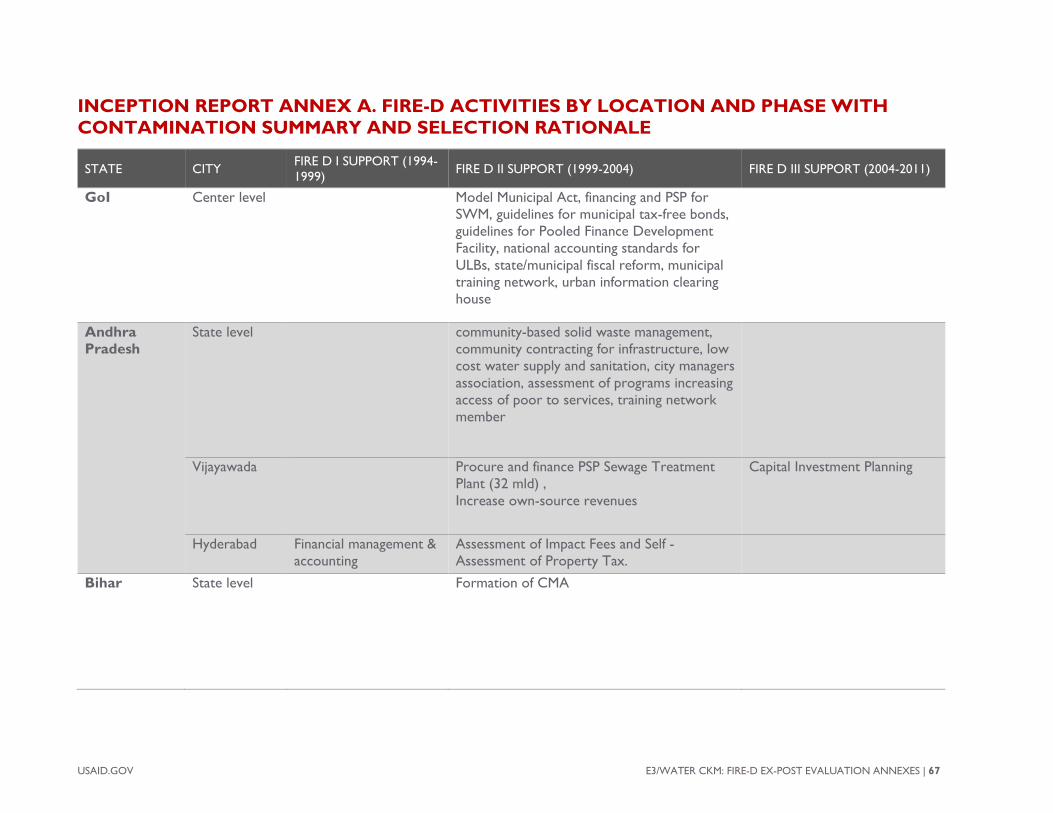
USAID.GOV E3/WATER CKM: FIRE-D EX-POST EVALUATION ANNEXES | 67
INCEPTION REPORT ANNEX A. FIRE-D ACTIVITIES BY LOCATION AND PHASE WITH CONTAMINATION SUMMARY AND SELECTION RATIONALE
STATE CITY FIRE D I SUPPORT (1994-1999) FIRE D II SUPPORT (1999-2004) FIRE D III SUPPORT (2004-2011)
GoI Center level Model Municipal Act, financing and PSP for SWM, guidelines for municipal tax-free bonds, guidelines for Pooled Finance Development Facility, national accounting standards for ULBs, state/municipal fiscal reform, municipal training network, urban information clearing house
Andhra Pradesh
State level community-based solid waste management, community contracting for infrastructure, low cost water supply and sanitation, city managers association, assessment of programs increasing access of poor to services, training network member
Vijayawada Procure and finance PSP Sewage Treatment Plant (32 mld) , Increase own-source revenues
Capital Investment Planning
Hyderabad Financial management & accounting
Assessment of Impact Fees and Self -Assessment of Property Tax.
Bihar State level Formation of CMA
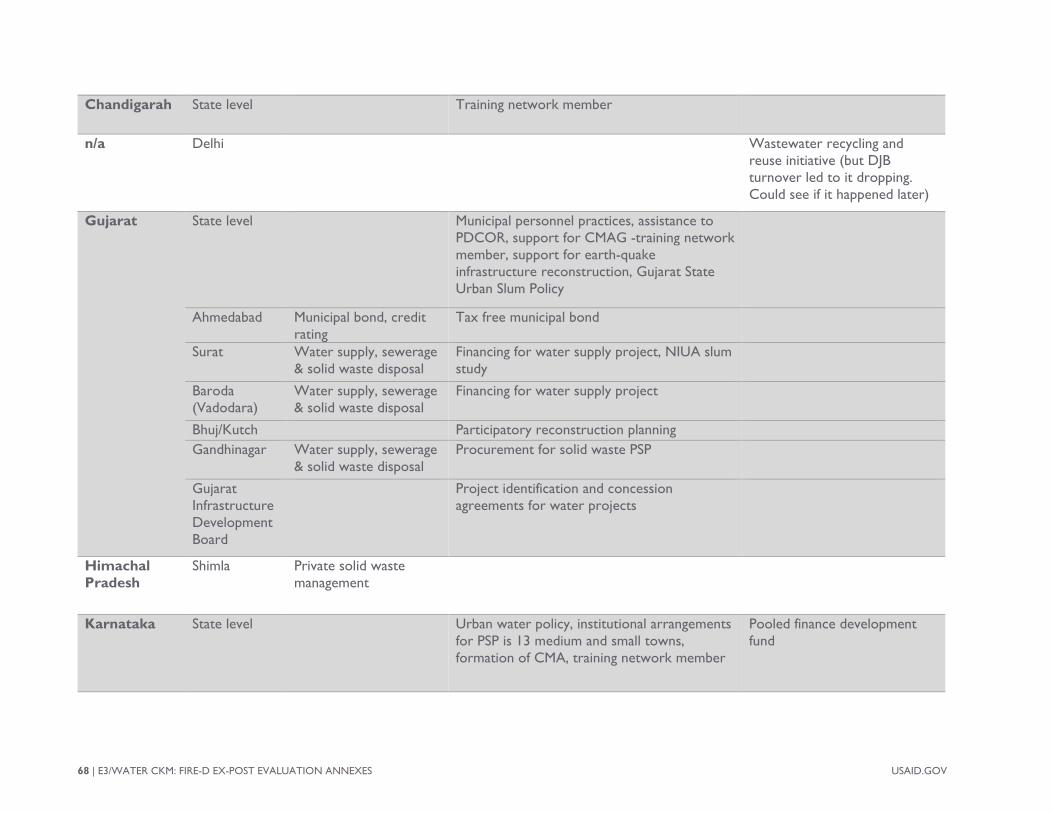
68 | E3/WATER CKM: FIRE-D EX-POST EVALUATION ANNEXES USAID.GOV
Chandigarah State level Training network member
n/a Delhi Wastewater recycling and reuse initiative (but DJB turnover led to it dropping. Could see if it happened later)
Gujarat State level Municipal personnel practices, assistance to PDCOR, support for CMAG -training network member, support for earth-quake infrastructure reconstruction, Gujarat State Urban Slum Policy
Ahmedabad Municipal bond, credit rating
Tax free municipal bond
Surat Water supply, sewerage & solid waste disposal
Financing for water supply project, NIUA slum study
Baroda (Vadodara)
Water supply, sewerage & solid waste disposal
Financing for water supply project
Bhuj/Kutch Participatory reconstruction planning Gandhinagar Water supply, sewerage
& solid waste disposal Procurement for solid waste PSP
Gujarat Infrastructure Development Board
Project identification and concession agreements for water projects
Himachal Pradesh
Shimla Private solid waste management
Karnataka State level Urban water policy, institutional arrangements for PSP is 13 medium and small towns, formation of CMA, training network member
Pooled finance development fund
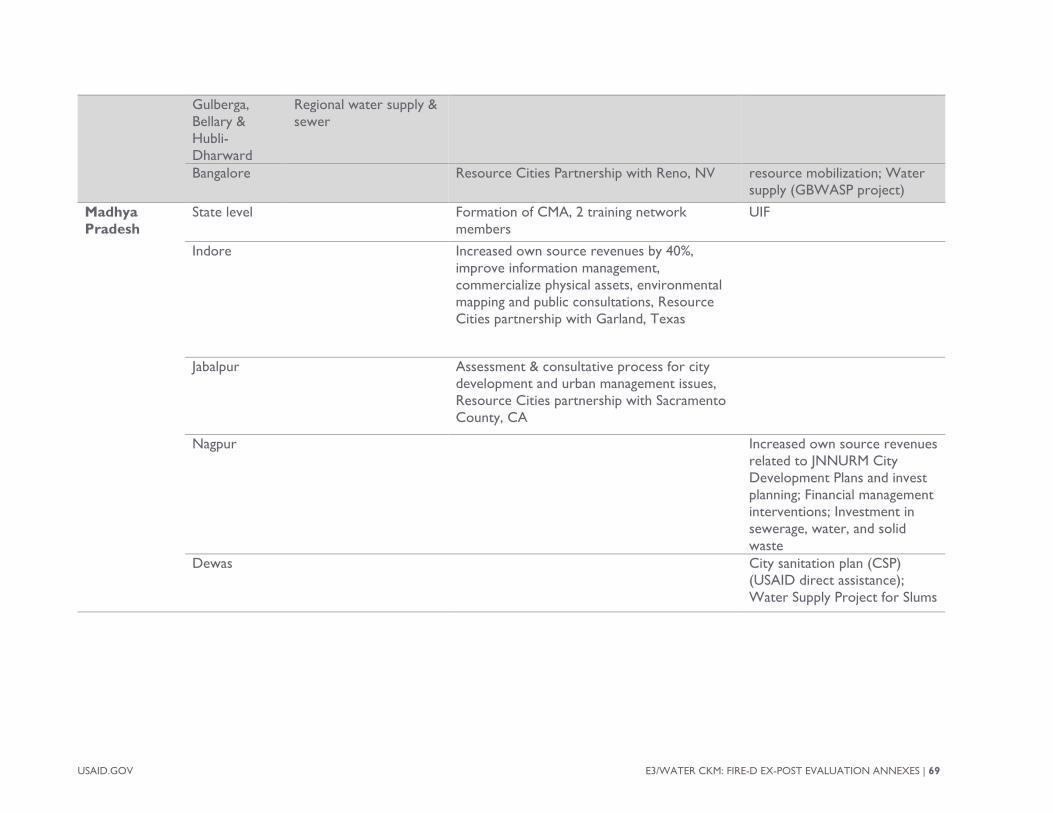
USAID.GOV E3/WATER CKM: FIRE-D EX-POST EVALUATION ANNEXES | 69
Gulberga, Bellary & Hubli-Dharward
Regional water supply & sewer
Bangalore Resource Cities Partnership with Reno, NV resource mobilization; Water supply (GBWASP project)
Madhya Pradesh
State level Formation of CMA, 2 training network members
UIF
Indore Increased own source revenues by 40%, improve information management, commercialize physical assets, environmental mapping and public consultations, Resource Cities partnership with Garland, Texas
Jabalpur Assessment & consultative process for city development and urban management issues, Resource Cities partnership with Sacramento County, CA
Nagpur Increased own source revenues related to JNNURM City Development Plans and invest planning; Financial management interventions; Investment in sewerage, water, and solid waste
Dewas City sanitation plan (CSP) (USAID direct assistance); Water Supply Project for Slums
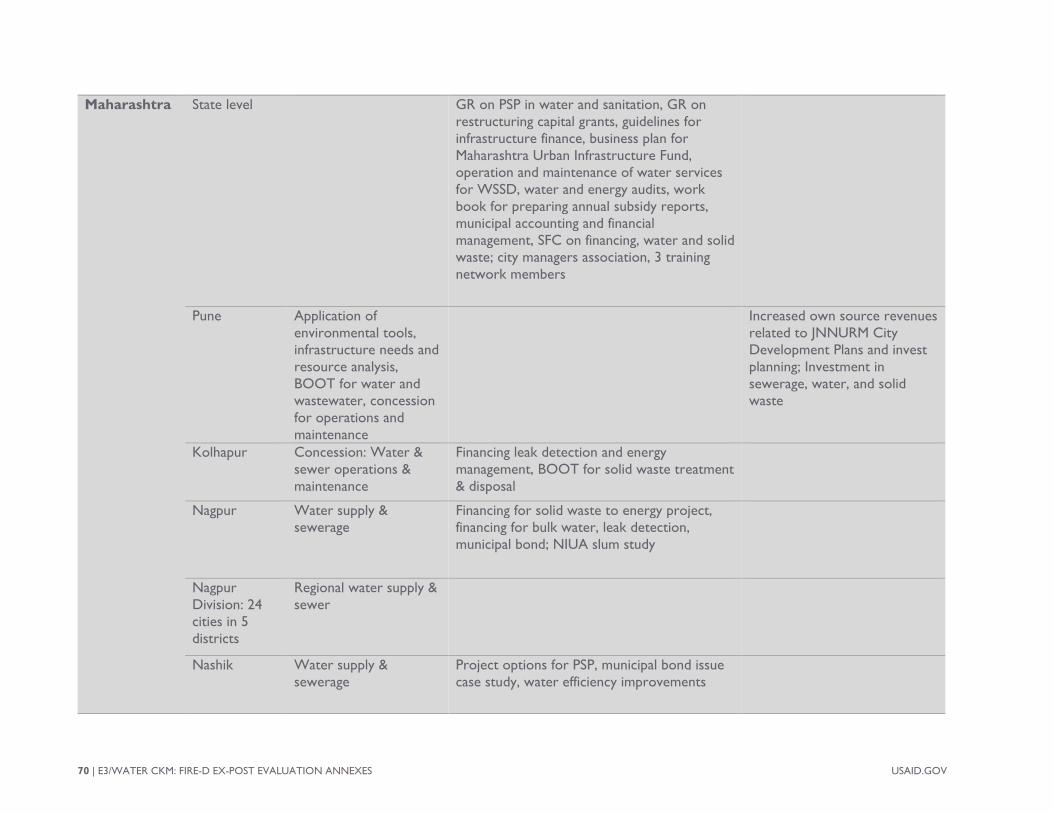
70 | E3/WATER CKM: FIRE-D EX-POST EVALUATION ANNEXES USAID.GOV
Maharashtra State level GR on PSP in water and sanitation, GR on restructuring capital grants, guidelines for infrastructure finance, business plan for Maharashtra Urban Infrastructure Fund, operation and maintenance of water services for WSSD, water and energy audits, work book for preparing annual subsidy reports, municipal accounting and financial management, SFC on financing, water and solid waste; city managers association, 3 training network members
Pune Application of environmental tools, infrastructure needs and resource analysis, BOOT for water and wastewater, concession for operations and maintenance
Increased own source revenues related to JNNURM City Development Plans and invest planning; Investment in sewerage, water, and solid waste
Kolhapur Concession: Water & sewer operations & maintenance
Financing leak detection and energy management, BOOT for solid waste treatment & disposal
Nagpur Water supply & sewerage
Financing for solid waste to energy project, financing for bulk water, leak detection, municipal bond; NIUA slum study
Nagpur Division: 24 cities in 5 districts
Regional water supply & sewer
Nashik Water supply & sewerage
Project options for PSP, municipal bond issue case study, water efficiency improvements
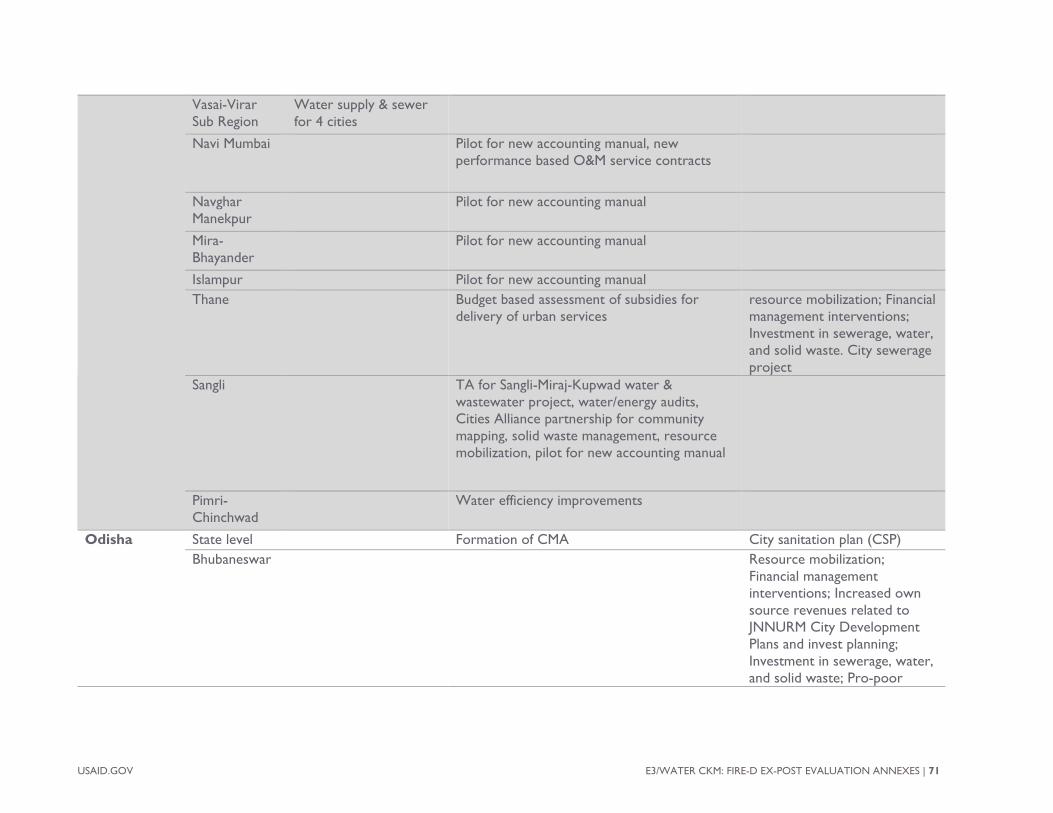
USAID.GOV E3/WATER CKM: FIRE-D EX-POST EVALUATION ANNEXES | 71
Vasai-Virar Sub Region
Water supply & sewer for 4 cities
Navi Mumbai Pilot for new accounting manual, new performance based O&M service contracts
Navghar Manekpur
Pilot for new accounting manual
Mira-Bhayander
Pilot for new accounting manual
Islampur Pilot for new accounting manual Thane Budget based assessment of subsidies for
delivery of urban services resource mobilization; Financial management interventions; Investment in sewerage, water, and solid waste. City sewerage project
Sangli TA for Sangli-Miraj-Kupwad water & wastewater project, water/energy audits, Cities Alliance partnership for community mapping, solid waste management, resource mobilization, pilot for new accounting manual
Pimri-Chinchwad
Water efficiency improvements
Odisha State level Formation of CMA City sanitation plan (CSP) Bhubaneswar Resource mobilization;
Financial management interventions; Increased own source revenues related to JNNURM City Development Plans and invest planning; Investment in sewerage, water, and solid waste; Pro-poor
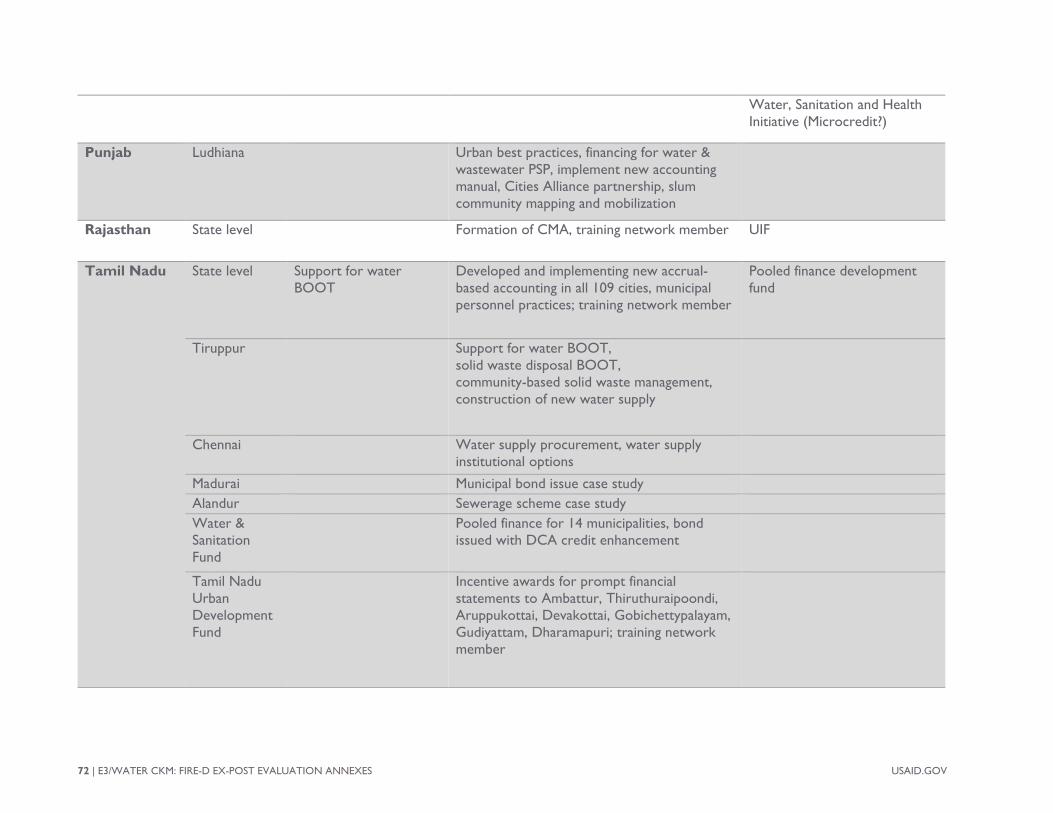
72 | E3/WATER CKM: FIRE-D EX-POST EVALUATION ANNEXES USAID.GOV
Water, Sanitation and Health Initiative (Microcredit?)
Punjab Ludhiana Urban best practices, financing for water & wastewater PSP, implement new accounting manual, Cities Alliance partnership, slum community mapping and mobilization
Rajasthan State level Formation of CMA, training network member UIF
Tamil Nadu State level Support for water BOOT
Developed and implementing new accrual-based accounting in all 109 cities, municipal personnel practices; training network member
Pooled finance development fund
Tiruppur Support for water BOOT, solid waste disposal BOOT, community-based solid waste management, construction of new water supply
Chennai Water supply procurement, water supply institutional options
Madurai Municipal bond issue case study Alandur Sewerage scheme case study Water & Sanitation Fund
Pooled finance for 14 municipalities, bond issued with DCA credit enhancement
Tamil Nadu Urban Development Fund
Incentive awards for prompt financial statements to Ambattur, Thiruthuraipoondi, Aruppukottai, Devakottai, Gobichettypalayam, Gudiyattam, Dharamapuri; training network member
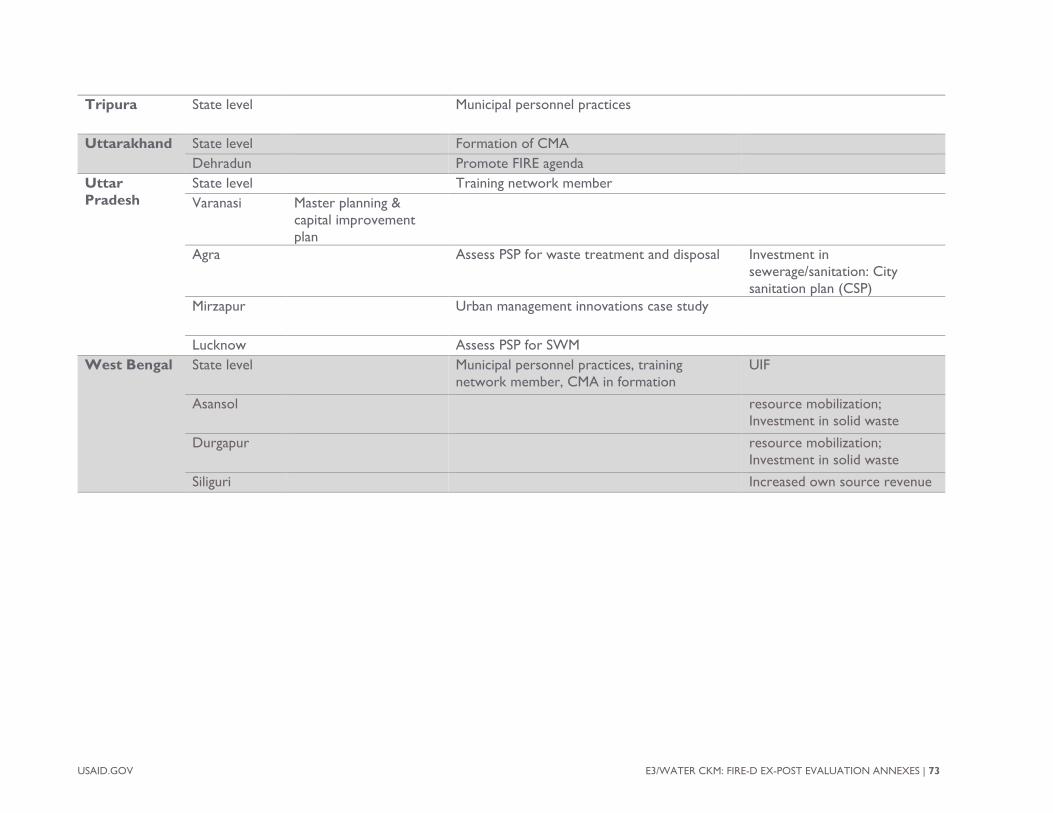
USAID.GOV E3/WATER CKM: FIRE-D EX-POST EVALUATION ANNEXES | 73
Tripura State level Municipal personnel practices
Uttarakhand State level Formation of CMA Dehradun Promote FIRE agenda
Uttar Pradesh
State level Training network member Varanasi Master planning &
capital improvement plan
Agra Assess PSP for waste treatment and disposal Investment in sewerage/sanitation: City sanitation plan (CSP)
Mirzapur Urban management innovations case study
Lucknow Assess PSP for SWM West Bengal State level Municipal personnel practices, training
network member, CMA in formation UIF
Asansol resource mobilization; Investment in solid waste
Durgapur resource mobilization; Investment in solid waste
Siliguri Increased own source revenue
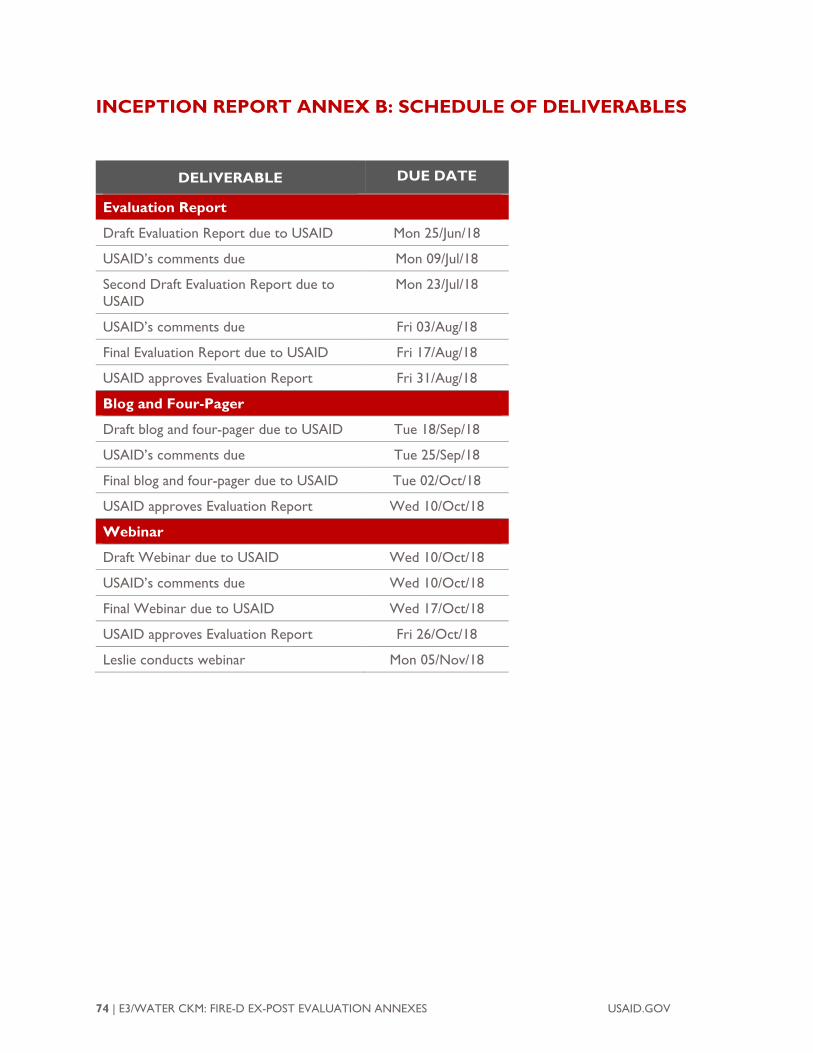
74 | E3/WATER CKM: FIRE-D EX-POST EVALUATION ANNEXES USAID.GOV
INCEPTION REPORT ANNEX B: SCHEDULE OF DELIVERABLES
DELIVERABLE DUE DATE
Evaluation Report
Draft Evaluation Report due to USAID Mon 25/Jun/18
USAID’s comments due Mon 09/Jul/18
Second Draft Evaluation Report due to USAID
Mon 23/Jul/18
USAID’s comments due Fri 03/Aug/18
Final Evaluation Report due to USAID Fri 17/Aug/18
USAID approves Evaluation Report Fri 31/Aug/18
Blog and Four-Pager
Draft blog and four-pager due to USAID Tue 18/Sep/18
USAID’s comments due Tue 25/Sep/18
Final blog and four-pager due to USAID Tue 02/Oct/18
USAID approves Evaluation Report Wed 10/Oct/18
Webinar
Draft Webinar due to USAID Wed 10/Oct/18
USAID’s comments due Wed 10/Oct/18
Final Webinar due to USAID Wed 17/Oct/18
USAID approves Evaluation Report Fri 26/Oct/18
Leslie conducts webinar Mon 05/Nov/18
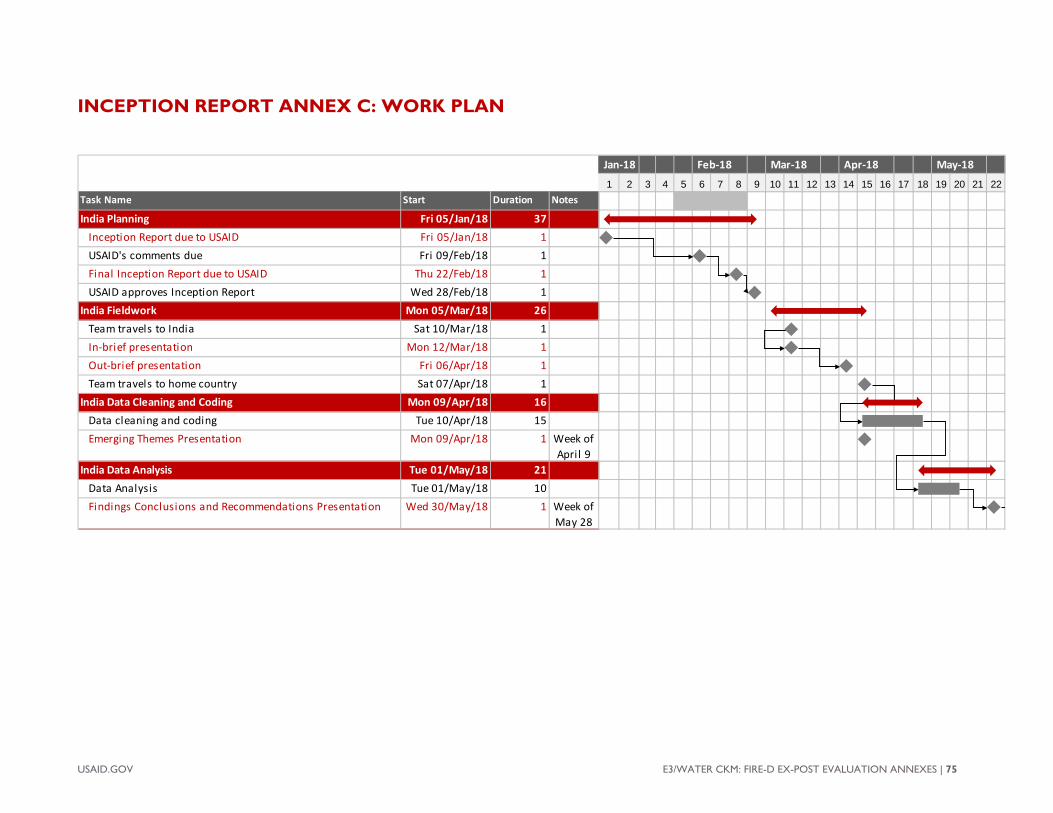
USAID.GOV E3/WATER CKM: FIRE-D EX-POST EVALUATION ANNEXES | 75
INCEPTION REPORT ANNEX C: WORK PLAN
Jan-18 Feb-18 Mar-18 Apr-18 May-18
1 2 3 4 5 6 7 8 9 10 11 12 13 14 15 16 17 18 19 20 21 22Task Name Start Duration Notes
India Planning Fri 05/Jan/18 37Inception Report due to USAID Fri 05/Jan/18 1USAID's comments due Fri 09/Feb/18 1Final Inception Report due to USAID Thu 22/Feb/18 1USAID approves Inception Report Wed 28/Feb/18 1
India Fieldwork Mon 05/Mar/18 26Team travels to India Sat 10/Mar/18 1In-brief presentation Mon 12/Mar/18 1Out-brief presentation Fri 06/Apr/18 1Team travels to home country Sat 07/Apr/18 1
India Data Cleaning and Coding Mon 09/Apr/18 16Data cleaning and coding Tue 10/Apr/18 15Emerging Themes Presentation Mon 09/Apr/18 1 Week of
April 9India Data Analysis Tue 01/May/18 21
Data Analysis Tue 01/May/18 10Findings Conclusions and Recommendations Presentation Wed 30/May/18 1 Week of
May 28
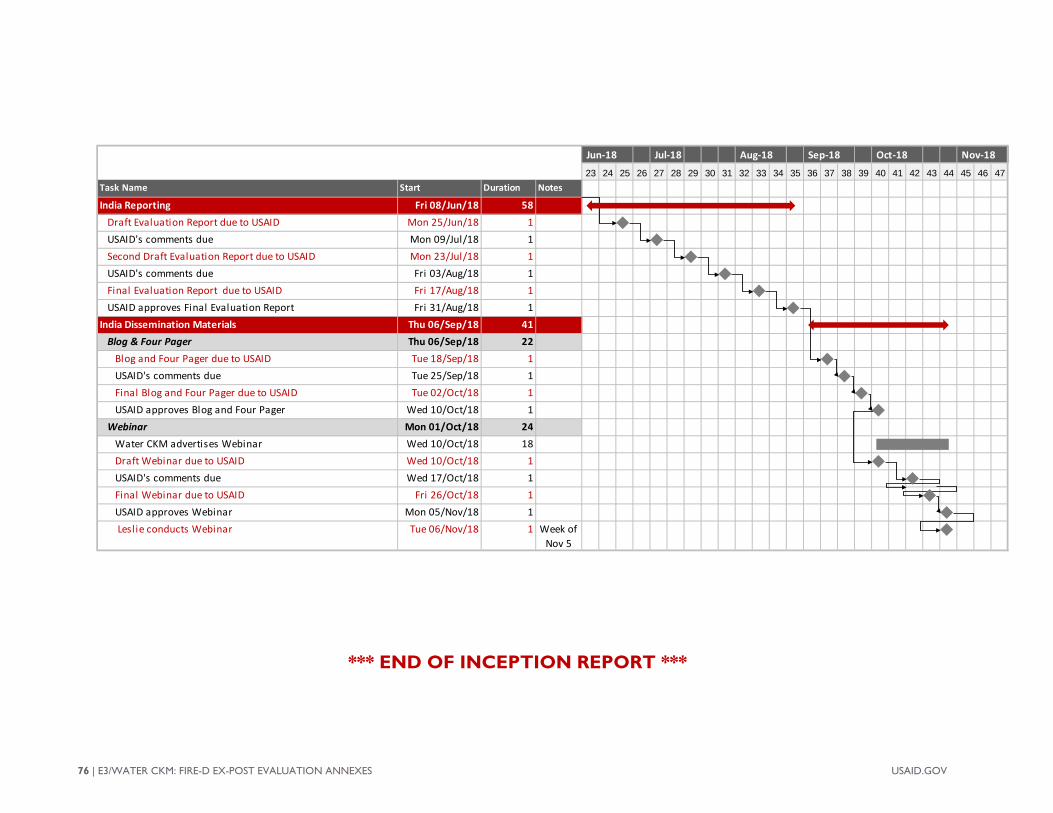
76 | E3/WATER CKM: FIRE-D EX-POST EVALUATION ANNEXES USAID.GOV
*** END OF INCEPTION REPORT ***
Jun-18 Jul-18 Aug-18 Sep-18 Oct-18 Nov-18
23 24 25 26 27 28 29 30 31 32 33 34 35 36 37 38 39 40 41 42 43 44 45 46 47Task Name Start Duration Notes
India Reporting Fri 08/Jun/18 58Draft Evaluation Report due to USAID Mon 25/Jun/18 1USAID's comments due Mon 09/Jul/18 1Second Draft Evaluation Report due to USAID Mon 23/Jul/18 1USAID's comments due Fri 03/Aug/18 1Final Evaluation Report due to USAID Fri 17/Aug/18 1USAID approves Final Evaluation Report Fri 31/Aug/18 1
India Dissemination Materials Thu 06/Sep/18 41Blog & Four Pager Thu 06/Sep/18 22
Blog and Four Pager due to USAID Tue 18/Sep/18 1USAID's comments due Tue 25/Sep/18 1Final Blog and Four Pager due to USAID Tue 02/Oct/18 1USAID approves Blog and Four Pager Wed 10/Oct/18 1
Webinar Mon 01/Oct/18 24Water CKM advertises Webinar Wed 10/Oct/18 18Draft Webinar due to USAID Wed 10/Oct/18 1USAID's comments due Wed 17/Oct/18 1Final Webinar due to USAID Fri 26/Oct/18 1USAID approves Webinar Mon 05/Nov/18 1 Leslie conducts Webinar Tue 06/Nov/18 1 Week of
Nov 5
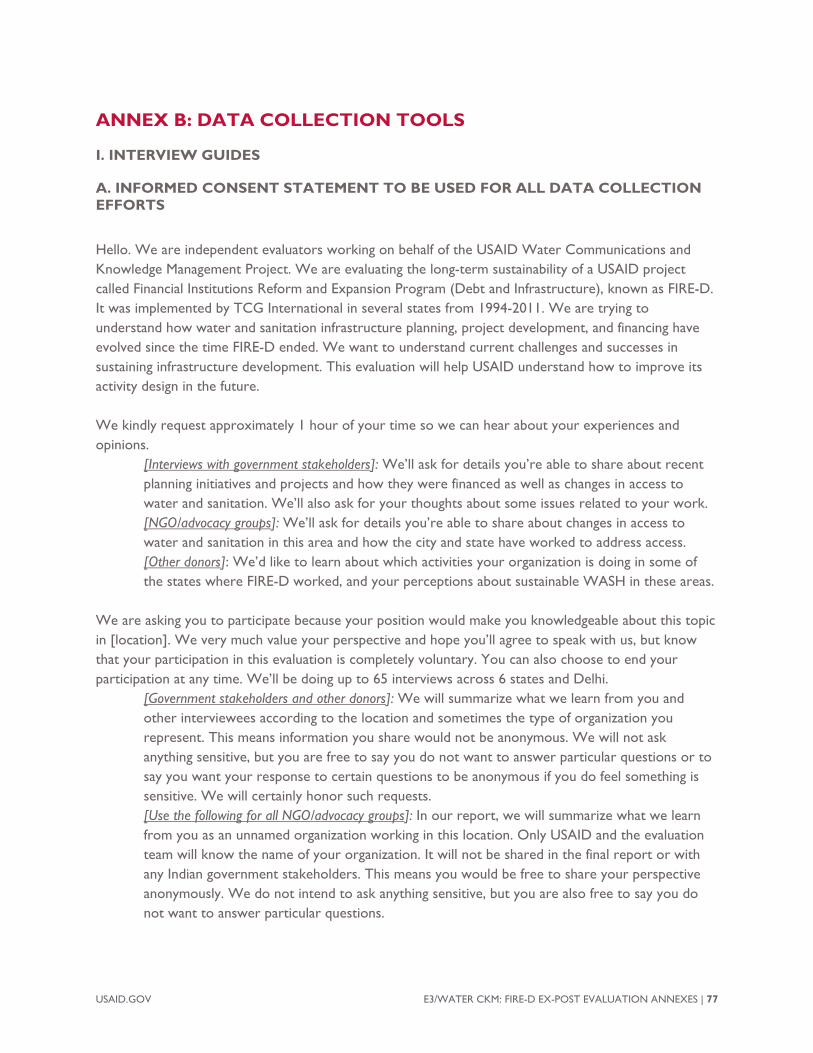
ANNEX B: DATA COLLECTION TOOLS
I. INTERVIEW GUIDES
A. INFORMED CONSENT STATEMENT TO BE USED FOR ALL DATA COLLECTIONEFFORTS
Hello. We are independent evaluators working on behalf of the USAID Water Communications and Knowledge Management Project. We are evaluating the long-term sustainability of a USAID project called Financial Institutions Reform and Expansion Program (Debt and Infrastructure), known as FIRE-D. It was implemented by TCG International in several states from 1994-2011. We are trying to understand how water and sanitation infrastructure planning, project development, and financing have evolved since the time FIRE-D ended. We want to understand current challenges and successes in sustaining infrastructure development. This evaluation will help USAID understand how to improve its activity design in the future.
We kindly request approximately 1 hour of your time so we can hear about your experiences and opinions.
[Interviews with government stakeholders]: We’ll ask for details you’re able to share about recent planning initiatives and projects and how they were financed as well as changes in access to water and sanitation. We’ll also ask for your thoughts about some issues related to your work. [NGO/advocacy groups]: We’ll ask for details you’re able to share about changes in access to water and sanitation in this area and how the city and state have worked to address access. [Other donors]: We’d like to learn about which activities your organization is doing in some of the states where FIRE-D worked, and your perceptions about sustainable WASH in these areas.
We are asking you to participate because your position would make you knowledgeable about this topic in [location]. We very much value your perspective and hope you’ll agree to speak with us, but know that your participation in this evaluation is completely voluntary. You can also choose to end your participation at any time. We’ll be doing up to 65 interviews across 6 states and Delhi.
[Government stakeholders and other donors]: We will summarize what we learn from you and other interviewees according to the location and sometimes the type of organization you represent. This means information you share would not be anonymous. We will not ask anything sensitive, but you are free to say you do not want to answer particular questions or to say you want your response to certain questions to be anonymous if you do feel something is sensitive. We will certainly honor such requests. [Use the following for all NGO/advocacy groups]: In our report, we will summarize what we learn from you as an unnamed organization working in this location. Only USAID and the evaluation team will know the name of your organization. It will not be shared in the final report or with any Indian government stakeholders. This means you would be free to share your perspective anonymously. We do not intend to ask anything sensitive, but you are also free to say you do not want to answer particular questions.
USAID.GOV E3/WATER CKM: FIRE-D EX-POST EVALUATION ANNEXES | 77
Our final report will be shared with USAID and eventually posted online.
Do you have any questions? Do you agree to participate? Yes / No In order to ensure we capture everything correctly in our notes, is it OK if we record this conversation? We will not share the recordings or transcripts with anyone outside of the evaluation team. Yes / No
78 | E3/WATER CKM: FIRE-D EX-POST EVALUATION ANNEXES USAID.GOV

B. KEY INFORMANT/GROUP INTERVIEW – ADVOCACY GROUP
Stakeholder represented: ____________________________ State: ____________________________ City: _______________________ (if applicable)
Name: ____________________________ Title: __________________________ M/F Tel Number: ____________________
Name: ____________________________ Title: __________________________ M/F Tel Number: ____________________
Name: ____________________________ Title: __________________________ M/F Tel Number: ____________________
Date of Interview: ___________________ Time of Interview: ____________________ Name of Interviewer:_________________ Name of Note-taker: __________________ Audio recorder # and file: _____
MUST READ THE CONSENT STATEMENT AND GAIN CONSENT FROM ALL RESPONDENTS BEFORE PROCEEDING
INTRODUCTION
1. What is your role at this organization? How many years here?What is the driving focus of your organization? (e.g. slum dwellers rights? Women?)
ACCESS
2. **How has the level of municipal water and sanitation service access to urban water/sanitationservices in [domain] changed since [FIRE -D end year]?Probe: Is this a widespread feeling in this community? Who disagrees?
3. **What about access for the poor and informal settlement dwellers(improved/deteriorated)? Other marginal groups?Probe on expansion to include them and reasons why/why not.
4. **What are the reasons for these changes?Probe on effect of any project achievements in improving efficiency, technology, other.
5. What types of financial options have been available to the poor and informal settlement dwellersto help them access utility connections since [FIRE-D end year]?Probe: on bonds, loans, inclusive schemes
6. From your perspective, what are the challenges to expanding access to the poor and informalsettlement dwellers?Probe: How have those challenges changed over time?
7. How reliable are they in paying for regular service?
FIRE-D FOLLOW-UP
8. How familiar are you with FIRE-D? What specific projects are you familiar with [within yourdomain]?
USAID.GOV E3/WATER CKM: FIRE-D EX-POST EVALUATION ANNEXES | 79
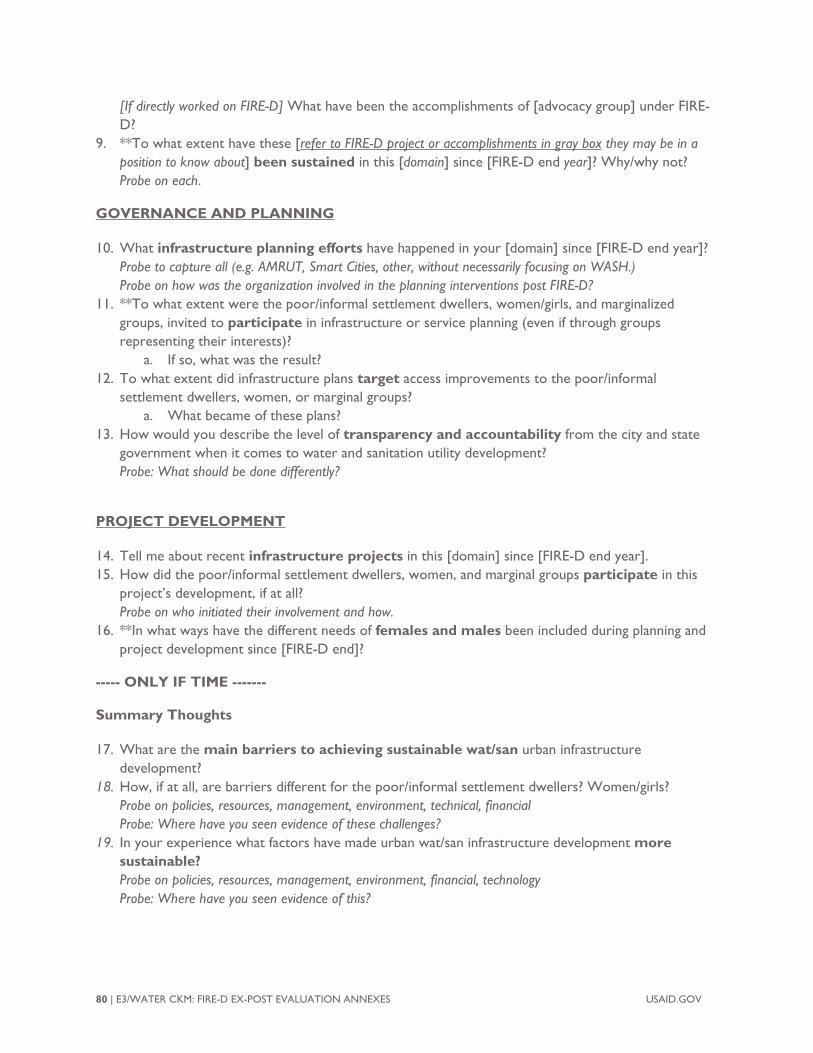
[If directly worked on FIRE-D] What have been the accomplishments of [advocacy group] under FIRE-D?
9. **To what extent have these [refer to FIRE-D project or accomplishments in gray box they may be in aposition to know about] been sustained in this [domain] since [FIRE-D end year]? Why/why not?Probe on each.
GOVERNANCE AND PLANNING
10. What infrastructure planning efforts have happened in your [domain] since [FIRE-D end year]?Probe to capture all (e.g. AMRUT, Smart Cities, other, without necessarily focusing on WASH.)Probe on how was the organization involved in the planning interventions post FIRE-D?
11. **To what extent were the poor/informal settlement dwellers, women/girls, and marginalizedgroups, invited to participate in infrastructure or service planning (even if through groupsrepresenting their interests)?
a. If so, what was the result?12. To what extent did infrastructure plans target access improvements to the poor/informal
settlement dwellers, women, or marginal groups?a. What became of these plans?
13. How would you describe the level of transparency and accountability from the city and stategovernment when it comes to water and sanitation utility development?Probe: What should be done differently?
PROJECT DEVELOPMENT
14. Tell me about recent infrastructure projects in this [domain] since [FIRE-D end year].15. How did the poor/informal settlement dwellers, women, and marginal groups participate in this
project’s development, if at all?Probe on who initiated their involvement and how.
16. **In what ways have the different needs of females and males been included during planning andproject development since [FIRE-D end]?
----- ONLY IF TIME -------
Summary Thoughts
17. What are the main barriers to achieving sustainable wat/san urban infrastructuredevelopment?
18. How, if at all, are barriers different for the poor/informal settlement dwellers? Women/girls?Probe on policies, resources, management, environment, technical, financialProbe: Where have you seen evidence of these challenges?
19. In your experience what factors have made urban wat/san infrastructure development moresustainable?Probe on policies, resources, management, environment, financial, technologyProbe: Where have you seen evidence of this?
80 | E3/WATER CKM: FIRE-D EX-POST EVALUATION ANNEXES USAID.GOV
USAID.GOV E3/WATER CKM: FIRE-D EX-POST EVALUATION ANNEXES | 81
C. KEY INFORMANT INTERVIEW – CITY-LEVEL URBAN DEVELOPMENT AGENCY
Stakeholder represented: ____________________________ State: ____________________________ City: _______________________ (if applicable)
Name: ____________________________ Title: __________________________ M/F Tel Number: ____________________
Name: ____________________________ Title: __________________________ M/F Tel Number: ____________________
Name: ____________________________ Title: __________________________ M/F Tel Number: ____________________
Date of Interview: ___________________ Time of Interview: ____________________ Name of Interviewer:_________________ Name of Note-taker: __________________ Audio recorder # and file: _____
MUST READ THE CONSENT STATEMENT AND GAIN CONSENT FROM ALL RESPONDENTS BEFORE PROCEEDING
INTRODUCTION 1. What is your role at [organization]? What activities do you work on related to water and
sanitation utility development or services? Probe on involvement in planning processes, project design, finance, management, training, etc.
2. What kind of water or sanitation infrastructure planning or projects have happened in [city/state] in the past 7 years? Probe on year and which scheme it came under. Get answers for both plans and projects.
a. Was anything supported by external donors and groups other than GoI? Why? b. Has there been any discontinuation (disruption or non-extension) of projects? Why? c. **To what extent were women, the poor and marginal groups consulted during the planning
and project development processes? REFORMS & GOVERNANCE 3. What was the state of things in this [domain] before these projects were planned and
implemented? Were there any conditions in place that made it easier to implement these projects?
a. Anything that made it harder? !! Probe on governance practices, financial stability, policies, finance options, policies like Model Municipal Law (2003), JNNURM
Reports needed from this stakeholder:
1. CDPs, CSPs, SLIPs, SAAP 2. Service Level Benchmark reports for each year since FIRE-D ended 3. Budgets, own source revenue numbers
4. FIRE-D ended in [year] in this [domain]. How familiar are you with FIRE-D? What specific results are you familiar with [within your domain]? Any challenges you recall?
Wait for response. Then PROBE on familiarity with documented FIRE-D achievements [see box above for help].
5. **[Status of FIRE-D outcomes]: I understand this [domain] at one point had [name relevant FIRE-D outcome from box above]. What is the status of that now?
a. **What led to this being [sustained/not sustained]? b. **Are there any ways this affects water or sanitation service provision? Explain
Probe extensively on each item from list. 6. **What types of reforms has your [domain] taken on since [year FIRE-D ended]?
a. What prompted those reforms? b. Do you use double entry accrual-based accounting? c. Reforms related to own source revenue? (e.g. Property tax reform, asset mapping)? d. [Other FIRE-D reforms]
i. What challenges have you faced in continuing with these reforms? 7. What is this city’s credit rating? When was it rated?
a. What prompted the rating? b. **How has the application of credit ratings affected the way you approach water and
sanitation sector development? 8. **Among these issues we’ve discussed, what has been most helpful to support continued water
and sanitation service improvements? What has been least helpful? FINANCE 9. How did you finance WASH infrastructure projects since [FIRE-D end]? Please, specify
projects/scheme-wise. **Probe: For most recent 1-2 projects, probe on proportion from central/state/city government; own source revenue; private sector; loans; bonds; others. Probe: on whether FIRE-D promoted sources in this location were used and why/why not.
a. As a share of total municipal funds available / expenditure, how have funds available / expenditure on WASH changed over the last [years since FIRE-D ended]? Why?
10. **To what extent is financial stability monitored in [your domain]? Probe: accounting practices, MIS, meetings?
11. **What has been the state of your revenue in the past 7 years with respect to water and sanitation utilities? Probe on own source versus other sources
a. Has the ULB recorded any surplus or increase in revenue post FIRE-D? b. Which initiatives/projects led to the current state of your own-source revenue?
Probe on user fees, tariffs, or other revenue sources c. What challenges have you faced with revenue?
ACCESS 12. **How has access to urban water/sanitation services in [city] changed since [FIRE -D end
year]? Why? Probe on effect of any project achievements in improving efficiency, technology, other. a. **What about access for the poor and informal settlement dwellers
(improved/deteriorated)? b. **What are reasons for these changes?
Probe: financial options for poor to access? c. **Do you see any linkage between the current level of access and reforms you’ve
undertaken? Explain
82 | E3/WATER CKM: FIRE-D EX-POST EVALUATION ANNEXES USAID.GOV
Probe extensively on each item from list.
REPORTS TO REQUEST 1. SERVICE LEVEL BENCHMARK REPORTS 2. BUDGETS & FINANCIAL RECORDS SHOWING:
a. PROPORTION OF FINANCE of recent project from each source b. OWN SOURCE REVENUE amounts for past 5 years (at least this year)
3. CDPs, CSPs, SLIPs, SAAPs ----- ONLY IF TIME -------
1. To what extent, if at all, is there interest in commercially viable infrastructure projects (CVIPs) in the past 7 years? Why?
a. Can you point to examples of successful CVIPs? What made them successful? b. Tell me about challenges with CVIPs or failed CVIPs. What caused it?
On both probe for more examples. Clarify whether CVIP was FIRE-D project or something after it ended.
2. What are the main barriers to achieving sustainable wat/san urban infrastructure development? a. How, if at all, are barriers different for the poor/informal settlement dwellers? Women/girls?
Probe on policies, resources, management, environment, technical, financial Probe: Where have you seen evidence of these challenges?
USAID.GOV E3/WATER CKM: FIRE-D EX-POST EVALUATION ANNEXES | 83
D. KEY INFORMANT/GROUP INTERVIEW – CITY MANAGERS ASSOCIATION
Stakeholder represented: ____________________________ State: ____________________________ City: _______________________ (if applicable)
Name: ____________________________ Title: __________________________ M/F Tel Number: ____________________
Name: ____________________________ Title: __________________________ M/F Tel Number: ____________________
Name: ____________________________ Title: __________________________ M/F Tel Number: ____________________
Date of Interview: ___________________ Time of Interview: ____________________ Name of Interviewer:_________________ Name of Note-taker: __________________ Audio recorder # and file: _____
MUST READ THE CONSENT STATEMENT AND GAIN CONSENT FROM ALL RESPONDENTS BEFORE PROCEEDING
INTRODUCTION
1. What is your role at [person’s own agency]? What activities do you work on related to water and sanitation utility development or services? Probe on involvement in planning processes, project design, finance, management, training, etc.
2. When and why was this CMA instituted? 3. What are the current roles/focus of this CMA? 4. Who is involved and active? 5. How often do you interact? 6. What activities does this CMA do?
*Probe on trainings, meeting topics, policy making at state, knowledge sharing, technical/analytical work a. What was the result of these activities? b. How have activities or roles changed over the past 7 years?
7. What sorts of ideas have you discussed through the CMA, internally or with stakeholders? a. What was the result of these exchanges? b. Changes in the past 7 years?
8. What would you say is the value of having this CMA, if anything? Please give specific examples.
9. Is there anything you’ve gained through your CMA engagement that has changed something you’ve done back in your city? Describe. (It is relevant only if the respondent served in city agency/role earlier).
10. What, if anything, would you like to improve about the CMA? Why?
84 | E3/WATER CKM: FIRE-D EX-POST EVALUATION ANNEXES USAID.GOV
Reports needed from this stakeholder:
1. CDPs, CSPs, SLIPs, SAAP 2. Service Level Benchmark reports for each year since FIRE-D ended 3. Budgets
FIRE-D FOLLOW-UP 11. FIRE-D ended in [year] in this [domain]. How familiar are you with FIRE-D? What specific
results are you familiar with [within your domain]? Any challenges you recall? Wait for response. Then PROBE on familiarity with documented FIRE-D achievements [see box above for help].
12. [Status of FIRE-D outcomes]: I understand this state at one point had [name relevant FIRE-D state-level outcomes from box above]. What is the status of that now? Why?
a. What has been the outcome of this? Probe extensively on each item from list.
USAID.GOV E3/WATER CKM: FIRE-D EX-POST EVALUATION ANNEXES | 85
E. KEY INFORMANT/GROUP INTERVIEW – CREDIT RATING AGENCY
Stakeholder represented: ____________________________ State: ____________________________ City: _______________________ (if applicable)
Name: ____________________________ Title: __________________________ M/F Tel Number: ____________________
Name: ____________________________ Title: __________________________ M/F Tel Number: ____________________
Name: ____________________________ Title: __________________________ M/F Tel Number: ____________________
Date of Interview: ___________________ Time of Interview: ____________________ Name of Interviewer:_________________ Name of Note-taker: __________________ Audio recorder # and file: _____
MUST READ THE CONSENT STATEMENT AND GAIN CONSENT FROM ALL RESPONDENTS BEFORE PROCEEDING
FIRE-D Follow-up
1. How familiar are you with the work FIRE-D did to support municipal credit ratings and different types of bonds to finance urban water and sanitation projects?
a. To what extent are these mechanisms still used today? b. Probe on whether valuable, good/bad results, etc.
2. From your experience in municipal credit rating, please tell us about the key criteria / indicators you have generally considered to arrive at assignment of ratings? Probe points: accounting standards, transparency, quality of service delivery, revenue streams, etc.
a. How have criteria changed since 2011, if at all? b. Is the criteria you follow uniform for all ULBs, irrespective of size, and for all sectors? Tell
us specifically about considerations for the water / san sector. c. Why do you think bigger municipal corporations (such as Pune, Ahmedabad, Hyderabad,
etc.) have managed to do better in raising finances so far? d. Do you think the Pooled Finance model (used in Tamil Nadu and Karnataka by FIRE-D) has
been successful in helping smaller ULBs access the capital market better? How so? e. Probe: scalability pan-India, risks, pros and cons
3. In your opinion, which types of city government financial reforms have been positive in the last seven years?
a. To what extent do you think FIRE-D contributed to these reforms? b. What pending reforms according to you should the ULBs implement to be able to tap
capital markets well – before and after an investment grade rating is achieved by an ULB? 4. In the last seven years, have you downgraded or suspended municipal bond ratings? If yes, how
frequently? What are the drivers of such action? a. Probe points: non-disclosure, debt obligations, cash flow scenario, etc. b. How have third party / state guarantees (e.g. USAID guaranteed bonds under FIRE-D in
Tamil Nadu) typically impacted outcomes of bond issuances in India? Please elaborate. i. Probe points: pros and cons, future usability, risks, etc.
86 | E3/WATER CKM: FIRE-D EX-POST EVALUATION ANNEXES USAID.GOV
5. Currently, an estimated 1% of all ULB fund requirement in India is financed through bonds. What in your opinion should this share have been by now (two decades since the first bond issue), and what factors have impeded strong uptake?
a. Probe points: rating grades, private placements only, regulatory issues, record keeping standards, etc.
6. Do you have any additional thoughts which are unique to tapping the bond market to fund sustainable urban water and sanitation infrastructure? Are there any key differentiators vis-à-vis urban WASH as far as raising capital from the market goes?
a. Probe points: perceived potential for returns on WASH projects, public good image, etc.
USAID.GOV E3/WATER CKM: FIRE-D EX-POST EVALUATION ANNEXES | 87
F. KEY INFORMANT/GROUP INTERVIEW – FORMER IMPLEMENTER
Stakeholder represented: ____________________________ State: ____________________________ City: _______________________ (if applicable)
Name: ____________________________ Title: __________________________ M/F Tel Number: ____________________
Name: ____________________________ Title: __________________________ M/F Tel Number: ____________________
Name: ____________________________ Title: __________________________ M/F Tel Number: ____________________
Date of Interview: ___________________ Time of Interview: ____________________ Name of Interviewer:_________________ Name of Note-taker: __________________ Audio recorder # and file: _____
MUST READ THE CONSENT STATEMENT AND GAIN CONSENT FROM ALL RESPONDENTS BEFORE PROCEEDING
Introductions:
1. What is your current job position? 2. What was your role with FIRE-D?
Probe on length of time working there 3. We’re trying to identify aspects of FIRE-D’s accomplishments that were and were not sustained.
What do you think has been sustained, if anything? Why? Probe for examples. Probe on existence of hard evidence linking FIRE-D to sustained outcomes.
4. What do you think has not been sustained? Why? Probe for examples
5. Various additional clarification questions about approach and goals of each activity 6. Verification of the list of FIRE-D accomplishments (what’s missing? Major versus minor interventions?)
88 | E3/WATER CKM: FIRE-D EX-POST EVALUATION ANNEXES USAID.GOV
G. KEY INFORMANT/GROUP INTERVIEW – NIUA
Stakeholder represented: ____________________________ State: ____________________________ City: _______________________ (if applicable)
Name: ____________________________ Title: __________________________ M/F Tel Number: ____________________
Name: ____________________________ Title: __________________________ M/F Tel Number: ____________________
Name: ____________________________ Title: __________________________ M/F Tel Number: ____________________
Date of Interview: ___________________ Time of Interview: ____________________ Name of Interviewer:_________________ Name of Note-taker: __________________ Audio recorder # and file: _____
MUST READ THE CONSENT STATEMENT AND GAIN CONSENT FROM ALL RESPONDENTS BEFORE PROCEEDING
Introductions: 1. What is your role at NIUA? 2. What is NIUA’s role in urban wat/san sector? 3. How familiar are you with FIRE-D? What specific accomplishments are you familiar with with regard
to NIUA’s domain? a. Wait for response. Then PROBE on familiarity with documented FIRE-D achievements [see box
above for help].
Institutional capacity 4. At the level of the city governments, what is the level of institutional capacity to plan and manage
water and sanitation development? How has that changed in the last seven years? Probe: on human resources – staff strength and skills, fund / financial management, O&M, project management, technology adoption, infrastructure, etc.
a. How has the level of capacity affected cities’ ability to carry out these functions? Get new financing.
b. If knows FIRE-D: To what extent do you think capacities achieved through FIRE-D support by 2011 have been valuable?
5. In what ways have institutional capacity translated into inclusive access to quality wat/san services? a. What have been the key learnings from FIRE-D in this regard? What kind of efforts do you
envisage in the future to further improve the institutional capacities of ULBs? b. What role do different stakeholders (donors, governments, private sector), including
advocacy organizations like yourself, play towards such efforts? 6. What are the extant individual capacity gaps amongst ULB functionaries in India? How have they
changed over the last seven years? a. To what extent has FIRE-D helped plug these?
Probe: financial/revenue, engineering, public health, town planning, administration, soft skills, etc.
USAID.GOV E3/WATER CKM: FIRE-D EX-POST EVALUATION ANNEXES | 89
Planning and Project Development 7. Which policies and / or governance principles related to municipal water and sanitation access have
been most influential in promoting commercially viable WASH infrastructure development the past 7 years in India? Why?
(after free responses): Probe on Model Municipal Law (2003), JNNURM a. How have they influenced access for the poor?
Summary thoughts 8. To what extent do you think FIRE-D contributed to more sustainable WASH infrastructure
development in [domain]? How so? 9. What are the main barriers to achieving sustainable wat/san urban infrastructure development?
a. What about for development that expands access for the poor/informal settlements? Probe on policies, resources, management, skills
Probe: Where have you seen evidence of these challenges?
90 | E3/WATER CKM: FIRE-D EX-POST EVALUATION ANNEXES USAID.GOV
FIRE-D Good Governance Conditions
• Transparency and Accountability improved (e.g. open MIS, grievance redressal system, Metropolitan Area Network on service coverage)
• Improvements to city financial management • Institutional capacity improvements done • Local empowerment and mechanisms for devolved planning • Developed systems for Urban indicators and Benchmarking
FIRE-D Planning Principles
• Sustainability assessments - i) Project/Infra/Finance; ii) Enviro/Social) • Social Inclusion (e.g., cover the poor and other marginalized segments at par with rest of the
population for service delivery mandates) • Whole city approach (consistent with urban growth) • Multi-stakeholder participation, including the poor • Clear policy signals • Planning is responsive to assessment of market trends
H. KEY INFORMANT/GROUP INTERVIEW – OTHER DONORS
Stakeholder represented: ____________________________ State: ____________________________ City: _______________________ (if applicable)
Name: ____________________________ Title: __________________________ M/F Tel Number: ____________________
Name: ____________________________ Title: __________________________ M/F Tel Number: ____________________
Name: ____________________________ Title: __________________________ M/F Tel Number: ____________________
Date of Interview: ___________________ Time of Interview: ____________________ Name of Interviewer:_________________ Name of Note-taker: __________________ Audio recorder # and file: _____
MUST READ THE CONSENT STATEMENT AND GAIN CONSENT FROM ALL RESPONDENTS BEFORE PROCEEDING
Introduction
1. What is your role at [organization]? 2. How familiar are you with FIRE-D?
Ensure common understanding of broad FIRE-D objectives around governance reform, finance, CVIPs. 3. Show states in gray box and note their projects we are already aware of. We’re interested in knowing
about any projects focused on governance reform, capacity building, and financing for
urban WASH infrastructure that occurred since FIRE-D ended in these states. Are there any [donor] projects that we missed here? Probe for details on each and sources/websites for more information
Governance & finance enabling environment Try to repeat the following questions for each affected state.
USAID.GOV E3/WATER CKM: FIRE-D EX-POST EVALUATION ANNEXES | 91
Year FIRE-D ended in relevant states:
• Karnataka (Bangalore): 2011 • Maharashtra (Pune, Sangli): 2011 • Odisha (Bhubaneswar): 2011 • Rajasthan: 2011 • Tamil Nadu (Tiruppur): 2011 • Uttar Pradesh (Lucknow): 2004
[List of donor’s projects in this state]
4. What prompted the development of these projects? Probe for each state: why they targeted this location, measured needs, state of affairs in these states at baseline
5. When these projects started, how conducive was the governance and policy environment to foster WASH infrastructure improvements in [state/city]? Probe: What specifically was helpful? Detrimental?
Probe after their free response on FIRE-D governance principles and supported policies a. What was the state of government capacity to plan and manage projects?
6. When these projects started, how conducive was the financial environment to foster WASH infrastructure improvements in [state/city]?
Probe: What specifically was helpful? Detrimental? Probe after free response on FIRE-D supported mechanisms in those states.
7. How has access to water/sanitation service in [locations] changed since 2011? a. Describe the reasons for these changes b. What about access for the poor and informal settlement dwellers? Probe on expansion to
include them and reasons why/why not. 8. FIRE-D worked to achieve commercially viable water/san infrastructure projects (CVIP). What role
do you see CVIPs playing in the WASH section in India? a. Is this something your office is striving for? Why? b. Can you point to examples of successful CVIPs? What made them successful? c. Tell me about challenging or failed CVIPs. What caused it?
9. What will it take to get city and state governments to fly on their own without external donor support when it comes to urban wat/san infrastructure?
a. Should that be the goal, in your opinion? b. Why hasn’t this happened yet in [locations]?
10. To what extent do you think FIRE-D contributed to more sustainable WASH infrastructure development in [states/cities]? How so?
a. What could have been done differently to ensure sustainability? Probe on perceived legacy
---- ONLY IF TIME ------- Summary thoughts 11. What are the main barriers to achieving sustainable water and sanitation urban infrastructure
development in India? a. How, if at all, are barriers different for the poor/informal settlement dwellers?
Women/girls? Probe on policies, resources, management, environment, technical Probe: Where have you seen evidence of these challenges?
12. In your experience what factors have made urban water and sanitation infrastructure development more sustainable? Probe on policies, resources, management, environment, [other SIT factors] Probe: Where have you seen the effects of this?
92 | E3/WATER CKM: FIRE-D EX-POST EVALUATION ANNEXES USAID.GOV
I. KEY INFORMANT/GROUP INTERVIEW – STATE URBAN DEVELOPMENT AGENCIES
Stakeholder represented: ____________________________ State: ____________________________ City: _______________________ (if applicable)
Name: ____________________________ Title: __________________________ M/F Tel Number: ____________________
Name: ____________________________ Title: __________________________ M/F Tel Number: ____________________
Name: ____________________________ Title: __________________________ M/F Tel Number: ____________________
Date of Interview: ___________________ Time of Interview: ____________________ Name of Interviewer:_________________ Name of Note-taker: __________________ Audio recorder # and file: _____
MUST READ THE CONSENT STATEMENT AND GAIN CONSENT FROM ALL RESPONDENTS BEFORE PROCEEDING
INTRODUCTION 1. What is your role at [organization]? What activities do you work on related to water and
sanitation utility development or services? Probe on involvement in planning processes, project design, finance, management, training, etc.
2. What kind of water or sanitation infrastructure planning or projects have happened in [city/state] in the past 7 years? Probe on year and which scheme it came under. Get answers for both plans and projects.
a. Was anything supported by external donors and groups other than GoI? Why? b. Has there been any discontinuation (disruption or non-extension) of projects? Why? c. **To what extent were women, the poor and marginal groups consulted during the planning
and project development processes? REFORMS & GOVERNANCE 3. What was the state of things in this [domain] before these projects were planned and
implemented? Were there any conditions in place that made it easier to implement these projects?
a. Anything that made it harder? !! Probe on governance practices, financial stability, policies, finance options, policies like Model Municipal Law (2003), JNNURM
4. FIRE-D ended in [year] in this [domain]. How familiar are you with FIRE-D? What specific results are you familiar with [within your domain]? Any challenges you recall?
Wait for response. Then PROBE on familiarity with documented FIRE-D achievements [see box above for help].
5. **[Status of FIRE-D outcomes]: I understand this [domain] at one point had [name relevant FIRE-D outcome from box above]. What is the status of that now?
USAID.GOV E3/WATER CKM: FIRE-D EX-POST EVALUATION ANNEXES | 93
a. **What led to this being [sustained/not sustained]? b. **Are there any ways this affects water or sanitation service provision? Explain
Probe extensively on each item from list.
6. **What types of reforms has your [domain] taken on since [year FIRE-D ended]? a. What prompted those reforms? b. Do you use double entry accrual-based accounting? c. Reforms related to own source revenue? (e.g. Property tax reform, asset mapping)? d. [Other FIRE-D reforms]
i. What challenges have you faced in continuing with these reforms?
7. How many cities have gotten credit ratings? a. What prompted the rating? b. **How has the application of credit ratings affected the way you approach water and
sanitation sector development?
8. **Among these issues we’ve discussed, what has been most helpful to support continued water and sanitation service improvements? What has been least helpful?
FINANCE 9. How did you finance WASH infrastructure projects since [FIRE-D end]? Please, specify
projects/scheme-wise. **Probe: For most recent 1-2 projects, probe on proportion from central/state/city government; own source revenue; private sector; loans; bonds; others. Probe: on whether FIRE-D promoted sources in this location were used and why/why not.
a. As a share of total municipal funds available / expenditure, how have funds available / expenditure on WASH changed over the last [years since FIRE-D ended]? Why?
10. **To what extent is financial stability monitored in [your domain]?
Probe: accounting practices, MIS, meetings?
11. **What has been the state of your revenue in the past 7 years with respect to water and sanitation utilities? Probe on own source versus other sources
a. Has [name our targeted city in this state] recorded any surplus or increase in revenue post FIRE-D?
b. Which initiatives/projects led to the current state of your own-source revenue? Probe on user fees, tariffs, or other revenue sources
c. What challenges have you faced with revenue? REPORTS TO REQUEST 1. SERVICE LEVEL BENCHMARK REPORTS 2. BUDGETS & FINANCIAL RECORDS SHOWING:
a. PROPORTION OF FINANCE of recent project from each source b. OWN SOURCE REVENUE amounts for past 5 years (at least this year)
3. CDPs, CSPs, SLIPs, SAAPs ----- ONLY IF TIME -------
94 | E3/WATER CKM: FIRE-D EX-POST EVALUATION ANNEXES USAID.GOV
1. To what extent, if at all, is there interest in commercially viable infrastructure projects (CVIPs) in the past 7 years? Why?
a. Can you point to examples of successful CVIPs? What made them successful? b. Tell me about challenges with CVIPs or failed CVIPs. What caused it?
On both probe for more examples. Clarify whether CVIP was FIRE-D project or something after it ended.
2. What are the main barriers to achieving sustainable wat/san urban infrastructure development? a. How, if at all, are barriers different for the poor/informal settlement dwellers? Women/girls?
Probe on policies, resources, management, environment, technical, financial Probe: Where have you seen evidence of these challenges?
USAID.GOV E3/WATER CKM: FIRE-D EX-POST EVALUATION ANNEXES | 95
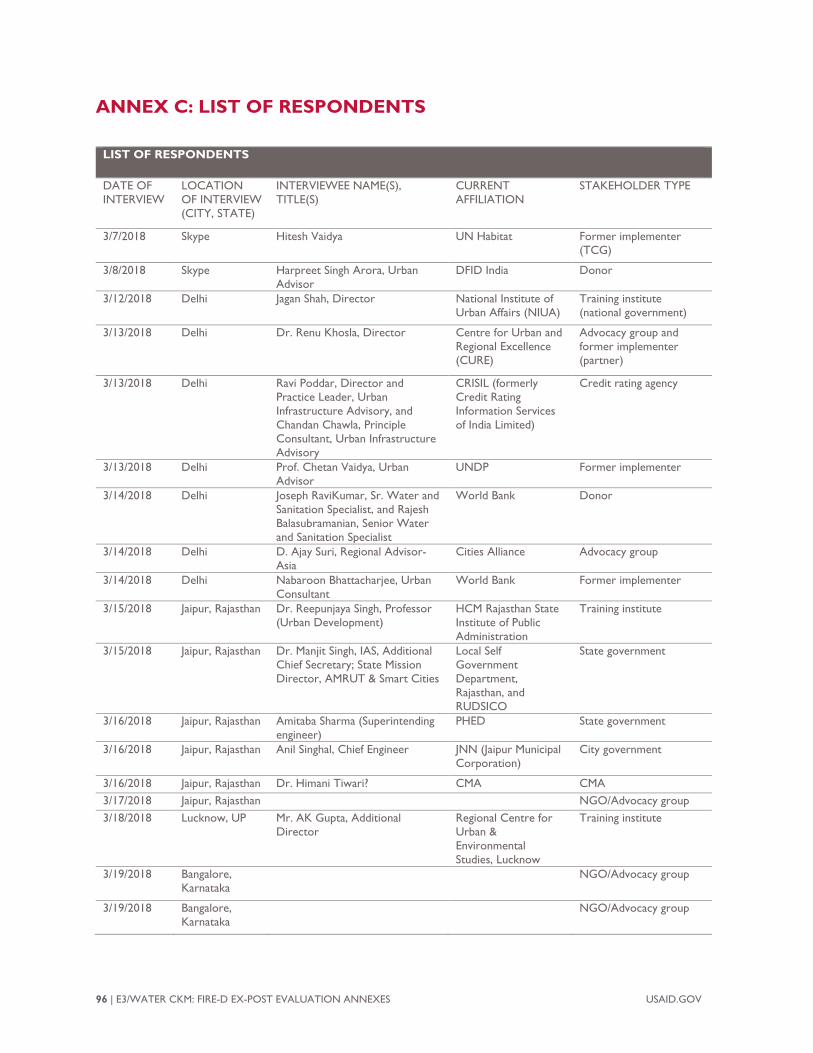
96 | E3/WATER CKM: FIRE-D EX-POST EVALUATION ANNEXES USAID.GOV
ANNEX C: LIST OF RESPONDENTS
LIST OF RESPONDENTS
DATE OF INTERVIEW
LOCATION OF INTERVIEW (CITY, STATE)
INTERVIEWEE NAME(S), TITLE(S)
CURRENT AFFILIATION
STAKEHOLDER TYPE
3/7/2018 Skype Hitesh Vaidya UN Habitat Former implementer (TCG)
3/8/2018 Skype Harpreet Singh Arora, Urban Advisor
DFID India Donor
3/12/2018 Delhi Jagan Shah, Director National Institute of Urban Affairs (NIUA)
Training institute (national government)
3/13/2018 Delhi Dr. Renu Khosla, Director Centre for Urban and Regional Excellence (CURE)
Advocacy group and former implementer (partner)
3/13/2018 Delhi Ravi Poddar, Director and Practice Leader, Urban Infrastructure Advisory, and Chandan Chawla, Principle Consultant, Urban Infrastructure Advisory
CRISIL (formerly Credit Rating Information Services of India Limited)
Credit rating agency
3/13/2018 Delhi Prof. Chetan Vaidya, Urban Advisor
UNDP Former implementer
3/14/2018 Delhi Joseph RaviKumar, Sr. Water and Sanitation Specialist, and Rajesh Balasubramanian, Senior Water and Sanitation Specialist
World Bank Donor
3/14/2018 Delhi D. Ajay Suri, Regional Advisor- Asia
Cities Alliance Advocacy group
3/14/2018 Delhi Nabaroon Bhattacharjee, Urban Consultant
World Bank Former implementer
3/15/2018 Jaipur, Rajasthan Dr. Reepunjaya Singh, Professor (Urban Development)
HCM Rajasthan State Institute of Public Administration
Training institute
3/15/2018 Jaipur, Rajasthan Dr. Manjit Singh, IAS, Additional Chief Secretary; State Mission Director, AMRUT & Smart Cities
Local Self Government Department, Rajasthan, and RUDSICO
State government
3/16/2018 Jaipur, Rajasthan Amitaba Sharma (Superintending engineer)
PHED State government
3/16/2018 Jaipur, Rajasthan Anil Singhal, Chief Engineer JNN (Jaipur Municipal Corporation)
City government
3/16/2018 Jaipur, Rajasthan Dr. Himani Tiwari? CMA CMA 3/17/2018 Jaipur, Rajasthan NGO/Advocacy group 3/18/2018 Lucknow, UP Mr. AK Gupta, Additional
Director Regional Centre for Urban & Environmental Studies, Lucknow
Training institute
3/19/2018 Bangalore, Karnataka
NGO/Advocacy group
3/19/2018 Bangalore, Karnataka
NGO/Advocacy group
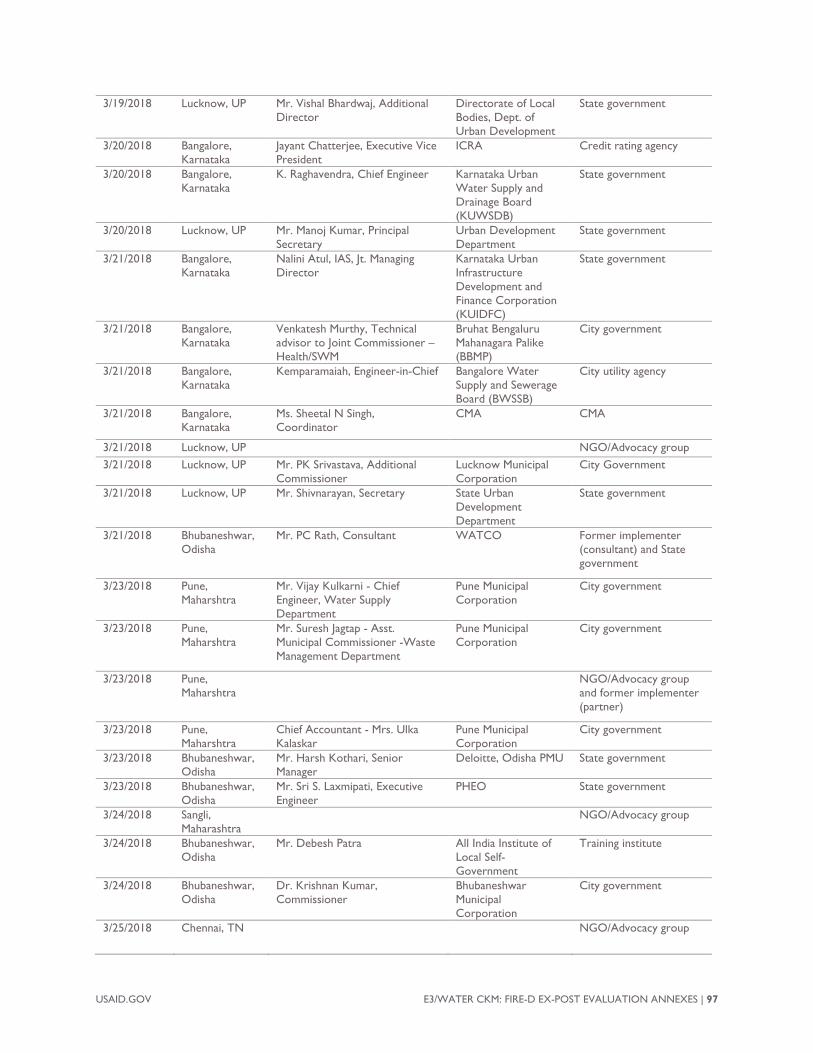
USAID.GOV E3/WATER CKM: FIRE-D EX-POST EVALUATION ANNEXES | 97
3/19/2018 Lucknow, UP Mr. Vishal Bhardwaj, Additional Director
Directorate of Local Bodies, Dept. of Urban Development
State government
3/20/2018 Bangalore, Karnataka
Jayant Chatterjee, Executive Vice President
ICRA Credit rating agency
3/20/2018 Bangalore, Karnataka
K. Raghavendra, Chief Engineer Karnataka Urban Water Supply and Drainage Board (KUWSDB)
State government
3/20/2018 Lucknow, UP Mr. Manoj Kumar, Principal Secretary
Urban Development Department
State government
3/21/2018 Bangalore, Karnataka
Nalini Atul, IAS, Jt. Managing Director
Karnataka Urban Infrastructure Development and Finance Corporation (KUIDFC)
State government
3/21/2018 Bangalore, Karnataka
Venkatesh Murthy, Technical advisor to Joint Commissioner –Health/SWM
Bruhat Bengaluru Mahanagara Palike (BBMP)
City government
3/21/2018 Bangalore, Karnataka
Kemparamaiah, Engineer-in-Chief Bangalore Water Supply and Sewerage Board (BWSSB)
City utility agency
3/21/2018 Bangalore, Karnataka
Ms. Sheetal N Singh, Coordinator
CMA CMA
3/21/2018 Lucknow, UP NGO/Advocacy group 3/21/2018 Lucknow, UP Mr. PK Srivastava, Additional
Commissioner Lucknow Municipal Corporation
City Government
3/21/2018 Lucknow, UP Mr. Shivnarayan, Secretary State Urban Development Department
State government
3/21/2018 Bhubaneshwar, Odisha
Mr. PC Rath, Consultant WATCO Former implementer (consultant) and State government
3/23/2018 Pune, Maharshtra
Mr. Vijay Kulkarni - Chief Engineer, Water Supply Department
Pune Municipal Corporation
City government
3/23/2018 Pune, Maharshtra
Mr. Suresh Jagtap - Asst. Municipal Commissioner -Waste Management Department
Pune Municipal Corporation
City government
3/23/2018 Pune, Maharshtra
NGO/Advocacy group and former implementer (partner)
3/23/2018 Pune, Maharshtra
Chief Accountant - Mrs. Ulka Kalaskar
Pune Municipal Corporation
City government
3/23/2018 Bhubaneshwar, Odisha
Mr. Harsh Kothari, Senior Manager
Deloitte, Odisha PMU State government
3/23/2018 Bhubaneshwar, Odisha
Mr. Sri S. Laxmipati, Executive Engineer
PHEO State government
3/24/2018 Sangli, Maharashtra
NGO/Advocacy group
3/24/2018 Bhubaneshwar, Odisha
Mr. Debesh Patra All India Institute of Local Self-Government
Training institute
3/24/2018 Bhubaneshwar, Odisha
Dr. Krishnan Kumar, Commissioner
Bhubaneshwar Municipal Corporation
City government
3/25/2018 Chennai, TN NGO/Advocacy group
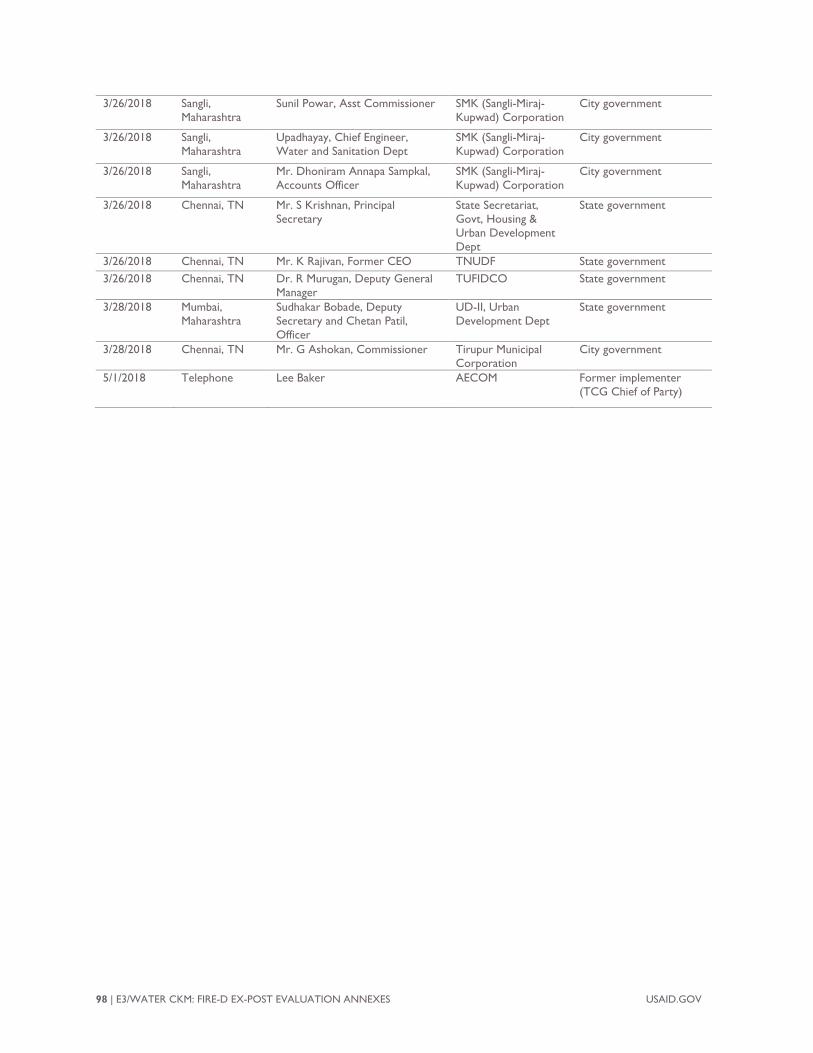
98 | E3/WATER CKM: FIRE-D EX-POST EVALUATION ANNEXES USAID.GOV
3/26/2018 Sangli, Maharashtra
Sunil Powar, Asst Commissioner SMK (Sangli-Miraj-Kupwad) Corporation
City government
3/26/2018 Sangli, Maharashtra
Upadhayay, Chief Engineer, Water and Sanitation Dept
SMK (Sangli-Miraj-Kupwad) Corporation
City government
3/26/2018 Sangli, Maharashtra
Mr. Dhoniram Annapa Sampkal, Accounts Officer
SMK (Sangli-Miraj-Kupwad) Corporation
City government
3/26/2018 Chennai, TN Mr. S Krishnan, Principal Secretary
State Secretariat, Govt, Housing & Urban Development Dept
State government
3/26/2018 Chennai, TN Mr. K Rajivan, Former CEO TNUDF State government 3/26/2018 Chennai, TN Dr. R Murugan, Deputy General
Manager TUFIDCO State government
3/28/2018 Mumbai, Maharashtra
Sudhakar Bobade, Deputy Secretary and Chetan Patil, Officer
UD-II, Urban Development Dept
State government
3/28/2018 Chennai, TN Mr. G Ashokan, Commissioner Tirupur Municipal Corporation
City government
5/1/2018 Telephone Lee Baker AECOM Former implementer (TCG Chief of Party)
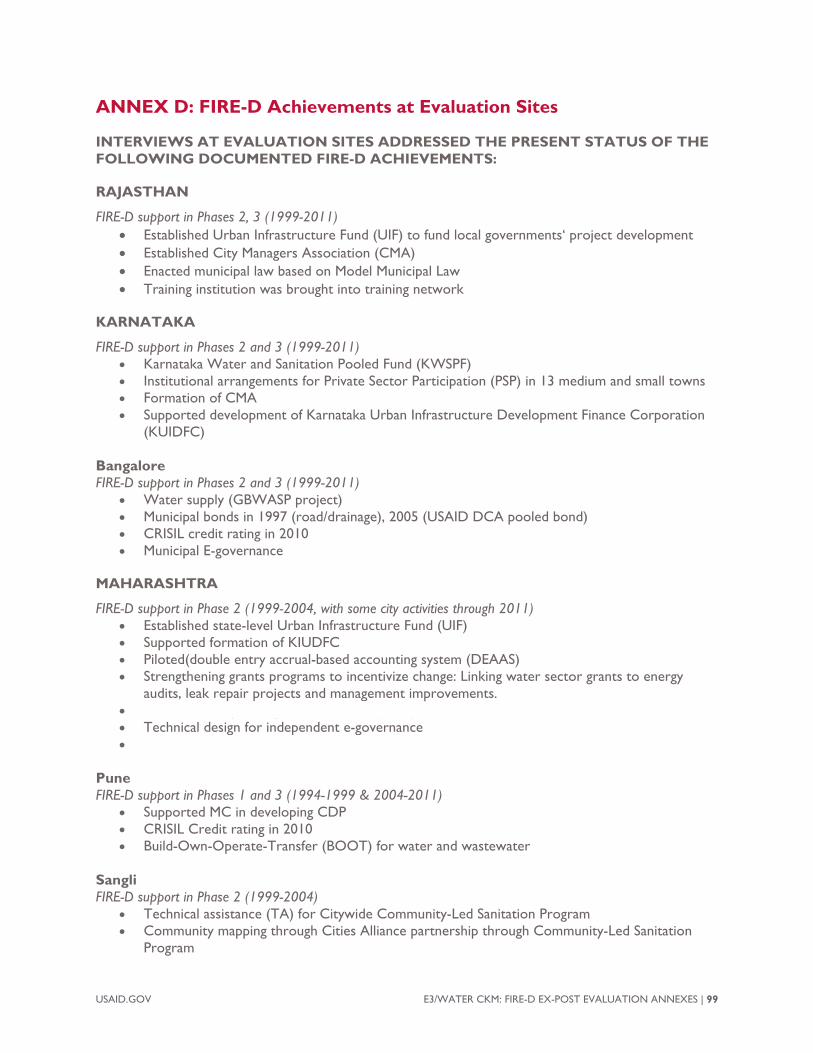
ANNEX D: FIRE-D Achievements at Evaluation Sites
INTERVIEWS AT EVALUATION SITES ADDRESSED THE PRESENT STATUS OF THE FOLLOWING DOCUMENTED FIRE-D ACHIEVEMENTS:
RAJASTHAN
FIRE-D support in Phases 2, 3 (1999-2011) • Established Urban Infrastructure Fund (UIF) to fund local governments‘ project development • Established City Managers Association (CMA) • Enacted municipal law based on Model Municipal Law • Training institution was brought into training network
KARNATAKA
FIRE-D support in Phases 2 and 3 (1999-2011) • Karnataka Water and Sanitation Pooled Fund (KWSPF) • Institutional arrangements for Private Sector Participation (PSP) in 13 medium and small towns • Formation of CMA • Supported development of Karnataka Urban Infrastructure Development Finance Corporation
(KUIDFC)
Bangalore FIRE-D support in Phases 2 and 3 (1999-2011)
• Water supply (GBWASP project) • Municipal bonds in 1997 (road/drainage), 2005 (USAID DCA pooled bond) • CRISIL credit rating in 2010 • Municipal E-governance
MAHARASHTRA
FIRE-D support in Phase 2 (1999-2004, with some city activities through 2011) • Established state-level Urban Infrastructure Fund (UIF) • Supported formation of KIUDFC • Piloted(double entry accrual-based accounting system (DEAAS) • Strengthening grants programs to incentivize change: Linking water sector grants to energy
audits, leak repair projects and management improvements. • Established City Managers Association (CMA) • Technical design for independent e-governance • Governance reform on PSP in water and sanitation
Pune FIRE-D support in Phases 1 and 3 (1994-1999 & 2004-2011)
• Supported MC in developing CDP • CRISIL Credit rating in 2010 • Build-Own-Operate-Transfer (BOOT) for water and wastewater
Sangli FIRE-D support in Phase 2 (1999-2004)
• Technical assistance (TA) for Citywide Community-Led Sanitation Program • Community mapping through Cities Alliance partnership through Community-Led Sanitation
Program
USAID.GOV E3/WATER CKM: FIRE-D EX-POST EVALUATION ANNEXES | 99
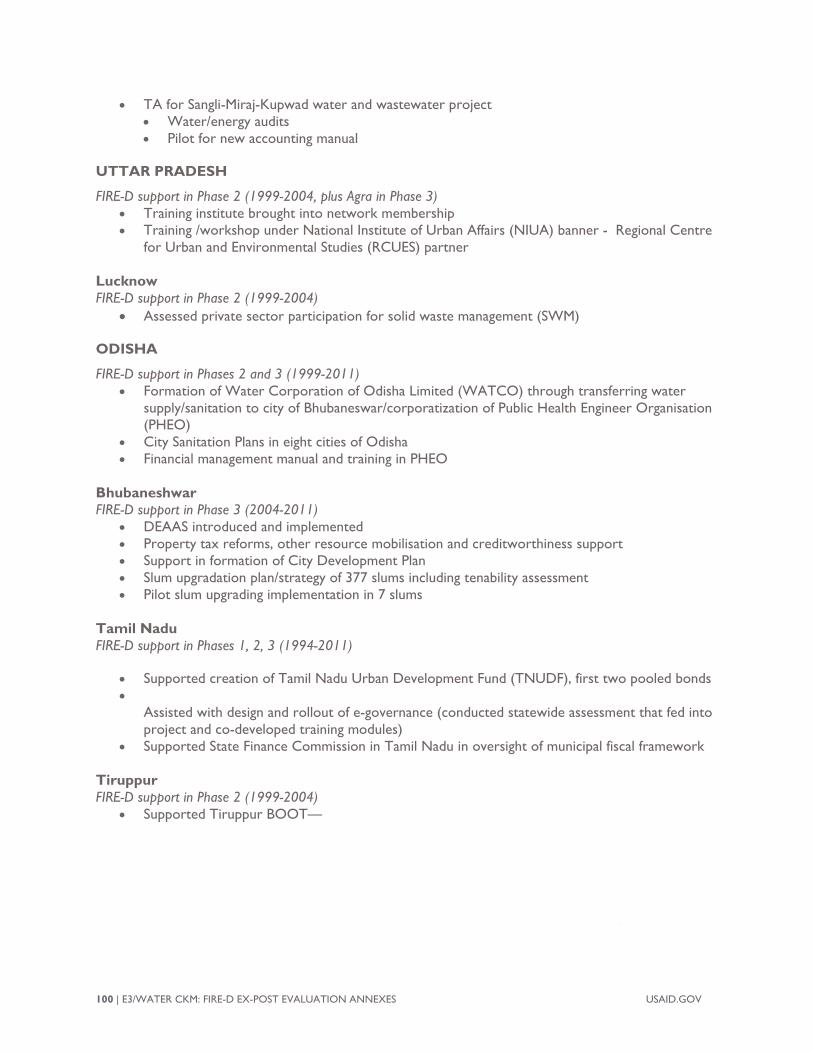
• TA for Sangli-Miraj-Kupwad water and wastewater project • Water/energy audits • Pilot for new accounting manual
UTTAR PRADESH
FIRE-D support in Phase 2 (1999-2004, plus Agra in Phase 3) • Training institute brought into network membership • Training /workshop under National Institute of Urban Affairs (NIUA) banner - Regional Centre
for Urban and Environmental Studies (RCUES) partner Lucknow FIRE-D support in Phase 2 (1999-2004)
• Assessed private sector participation for solid waste management (SWM)
ODISHA
FIRE-D support in Phases 2 and 3 (1999-2011) • Formation of Water Corporation of Odisha Limited (WATCO) through transferring water
supply/sanitation to city of Bhubaneswar/corporatization of Public Health Engineer Organisation (PHEO)
• City Sanitation Plans in eight cities of Odisha • Financial management manual and training in PHEO
Bhubaneshwar FIRE-D support in Phase 3 (2004-2011)
• DEAAS introduced and implemented • Property tax reforms, other resource mobilisation and creditworthiness support • Support in formation of City Development Plan • Slum upgradation plan/strategy of 377 slums including tenability assessment • Pilot slum upgrading implementation in 7 slums
Tamil Nadu FIRE-D support in Phases 1, 2, 3 (1994-2011)
• Supported creation of Tamil Nadu Urban Development Fund (TNUDF), first two pooled bonds • Supported piloting/adoption of DEAAS in all 108 urban local bodies (ULBs) • Assisted with design and rollout of e-governance (conducted statewide assessment that fed into
project and co-developed training modules) • Supported State Finance Commission in Tamil Nadu in oversight of municipal fiscal framework
Tiruppur FIRE-D support in Phase 2 (1999-2004)
• Supported Tiruppur BOOT—India’s first public-private partnership for water supply and sewerage
• Supported city to undertake Capital Investment Planning, which helps cities cope with growing responsibilities and limited financial resources by prioritizing their financial investment demands and opportunities; enables cities to better plan and recover costs of urban environmental infrastructure over the medium term
• Support for solid waste disposal BOOT and community-based solid waste management
100 | E3/WATER CKM: FIRE-D EX-POST EVALUATION ANNEXES USAID.GOV
ANNEX E: DOCUMENTS REVIEWED Bhawan, Vigyan. “AMRUT & Smart Cities.” National Workshop on Accelerating Implementation of
Urban Missions, PowerPoint Presentation, New Delhi, December 8, 2017. College of India, Hyderbad. 2015. Odisha State Annual Action Plan 2015-2016. Government of Odisha. http://amrut.gov.in/writereaddata/orissa_new.pdf. Community Consulting International. 1998. Final Report of the MSS Contractor: Indo-US Financial Institutions Reform and Expansion (FIRE) Project – Debt/Infrastructure Component. USAID. Das Gupta, Moushumi. “Union Budget 2018: 54% hike for smart city mission, AMRUT loses.” Hindustan
Times, February 1, 2018, https://www.hindustantimes.com/india-news/union-budget-2018-54-hike-for smart-city-mission-amrut-loses/story-E6mRMlpX6BB2avoj1sEwHK.html
Department of Local Self Government. 2015. State Annual Action Plan – Rajasthan 2015-2016.
Government of Rajasthan. http://amrut.gov.in/writereaddata/Final_SAAP_Rajasthan.pdf. Department of Local Self Government. 2016. State Annual Action Plan – Rajasthan 2016-2017. Government of Rajasthan. http://amrut.gov.in/writereaddata/saap/SAAP2016-17Rajasthan.pdf Department of Local Self Government. 2017. State Annual Action Plan – Rajasthan 2017-2020. Government of Rajasthan. http://amrut.gov.in/writereaddata/saap/Saap17_20/Rajasthan.pdf. Department of Urban Development. 2015. Uttar Pradesh State Annual Action Plan 2015-2016. Government
of Uttar Pradesh. http://amrut.gov.in/writereaddata/SAAP-%20UTTAR%20PRADESH.pdf. Department of Urban Development. 2016. Uttar Pradesh State Annual Action Plan 2016-2017. Government of Uttar Pradesh. http://amrut.gov.in/writereaddata/saap/SAAP2016-17UP.pdf. Desmond, Kathleen. 2012. The Past and Future of USAID Housing and Urban Programs. Silver Spring: City Partners International. DFID. 2017. Annual Review of the Odisha Support to Urban Infrastructure Programme (OSUIP), 2016-2017. Directorate of Municipal Administration. 2016. Karnataka State Annual Action Plan 2016-17. Government of Karnataka. http://amrut.gov.in/writereaddata/saap/Karnataka.pdf. Directorate of Municipal Administration. 2017. Karnataka State Annual Action Plan 2017-20. Government of Karnataka. http://amrut.gov.in/writereaddata/saap/Saap17_20/Karnataka.pdf. Engineers India Limited. 2016. Odisha State Annual Action Plan 2016-2017. Government of Odisha. http://amrut.gov.in/writereaddata/saap/OdishaSAAP2016-17.pdf. Government of Karnataka. 2015. Karnataka State Annual Action Plan 2015-16. http://amrut.gov.in/writereaddata/SAAP-AMRUT_Karnataka.pdf. Government of Tamil Nadu. 2017. Tamil Nadu Human Development Report. “India needs to curb borrowing by profligate state governments.” The Economist, May 11, 2017. Accessed
USAID.GOV E3/WATER CKM: FIRE-D EX-POST EVALUATION ANNEXES | 101
November 30, 2017. https://www.economist.com/leaders/2017/05/11/india-needs-to-curb-borrowing-by-profligate-state-governments.
Junction Social. 2006. Integrating Gender into FIRE(D) III Final Report. Indo-USAID FIRE(D) Project, USAID. Kothandaraman, Prabakar & Kumar, K. 2007. Case Study: Water for All: New Tirupur Area Development Corporation Ltd. (NTADCL). Growing Inclusive Markets. UNDP. Meera Mohanty, “Odisha government rolls out "world's largest" slum land rights project.” The Economic
Times, May 7, 2018. www.economictimes.indiatimes.com/articleshow/64068035.cms?utm_source=contentofinterest&utm_medium=text&utm_campaign=cppst.
Ministry of Housing and Urban Affairs. “Service Level Benchmarks.” Government of India. Retrieved from http://mohua.gov.in/cms/Service-Level-Benchmarks.php. Ministry of Urban Development. 2015. AMRUT Mission Statement & Guidelines. Government of India. Retrieved from https://amrut.gov.in/writereaddata/AMRUT%20Guidelines%20.pdf Ministry of Urban Development. 2017. Final 3rd STATE ANNUAL ACTION PLAN (3rd SAAP) FOR FY: 2017-
18 To FY2019-20 OF UTTAR PRADESH. Government of Uttar Pradesh. http://amrut.gov.in/writereaddata/saap/Saap17_20/UttarPradesh.pdf.
Ministry of Urban Development. 2017. Swachh Survekshan 2017. Government of India. Ministry of Urban Development. Handbook of Service Level Benchmarking. Government of India. Retrieved from https://www.wsp.org/sites/wsp.org/files/publications/service_benchmarking_india.pdf. Performance Assessment System (PAS). CEPT University. http://www.pas.org.in. “Population by City.” www.population.city/india. Senes Consultants India Pvt. Lit. 2015. Final Report : Revised City Development Plan, Lucknow City – 2040. Lucknow Municipal Corporation. http://lmc.up.nic.in/pdf/Final%20CDP%20-%20Volume%20I.pdf. State Mission Director for Housing & Urban Development Department. 2017. Odisha State Annual Action
Plan (SAAP-III) FY 2017-18. Government of Odisha. http://amrut.gov.in/writereaddata/saap/Saap17_20/Odisha.pdf.
Tamil Nadu Urban Finance and Infrastructure Development Corporation. 2015. Tamil Nadu State Annual
Action Plan 2015-2016. Government of Tamil Nadu. http://amrut.gov.in/writereaddata/SAAP_report_final.pdf.
Tamil Nadu Urban Finance and Infrastructure Development Corporation. 2016. Tamil Nadu State Annual
Action Plan FY2016-2017. Government of Tamil Nadu. http://amrut.gov.in/writereaddata/saap/Tamil_NaduSAAP2016-17.pdf.
Tamil Nadu Urban Finance and Infrastructure Development Corporation. 2017. Tamil Nadu State Annual
Action Plan FY2017-2020. Government of Tamil Nadu. http://amrut.gov.in/writereaddata/saap/Saap17_20/TamilNadu.pdf
102 | E3/WATER CKM: FIRE-D EX-POST EVALUATION ANNEXES USAID.GOV
TCG International, LLC. 2011. Indo-USAID Financial Institutions Reform and Expansion Project/ Debt Market
Component (FIRE/D Project). Brochure. USAID. TCG International, LLC. 2008. FIRE(D) Final Report (Draft). USAID TCG International, LLC. 2010. India Excerpts for 2009 USAID Water Report to Congress - Draft for Discussion. Indo-USAID FIRE(D) Project, USAID. TCG International, LLC. 2011. Developing Sustainable and Inclusive Urban Infrastructure Services: A
Guidebook for Project Implementers and Policy Makers in India. Indo-US Financial Institutions Reform and Expansion Program—Debt & Infrastructure. USAID.
TCG International, LLC. 2011. India Financial Institutions Reform and Expansion Project – Draft FIRE-D
PHASE III Close Out Report. Indo-USAID FIRE(D) Project, USAID. Urban Development Department. 2015. Maharashtra State Annual Action Plan (2015-2016). Government of Maharashtra. http://amrut.gov.in/writereaddata/MaharashtaSAAP.pdf. Urban Development Department. 2016. Maharashtra State Annual Action Plan (2016-2017). Government of Maharashtra. http://amrut.gov.in/writereaddata/saap/Maharashtra2016-2017.pdf. Urban Development Department. 2017. Maharashtra State Annual Action Plan (FY2017-2018).
Government of Maharashtra. http://amrut.gov.in/writereaddata/saap/Saap17_20/Maharashtra.pdf. Voyangs Solutions Pvt. Ltd.. 2012. Revising / Updating the City Development Plan (CDP) of Pune City – 2041
under JNNURM – Final Draft CDP. Pune Municipal Corporation. Retrieved from https://pmc.gov.in/sites/default/files/project-glimpses/Draft_City_Development_Plan_for_Pune_City_2041_Vol-1.pdf.
World Bank. 2016. India States Briefs – Uttar Pradesh. Retrieved from http://www.worldbank.org/en/country/india/brief/india-states-briefs-uttar-pradesh.
USAID.GOV E3/WATER CKM: FIRE-D EX-POST EVALUATION ANNEXES | 103