Embed Size (px)
Citation preview
Evaluation Report - Online Census Option
Evaluation Report
Online Census Option
Evaluation Report "Any references to data within this report should not be used or published elsewhere without the express permission of the General Manager Census, Statistics New Zealand."
Online Census Option for
Statistics New Zealand
© Statistics New Zealand 2005
11/06/2008 Commercial In Confidence Page 1 of 44
L:\WEB SITE\Left Side\Other Publications\Census\2010\Online Census Option for Statistics New Zealand.doc
Evaluation Report - Online Census Option
11/06/2008 Commercial In Confidence Page 2 of 44
L:\WEB SITE\Left Side\Other Publications\Census\2010\Online Census Option for Statistics New Zealand.doc
Table of Contents
1 DOCUMENT CONTROL ..................................................................................................3 1.1 Revisions since previous edition ................................................................................ 3 1.2 Distribution list............................................................................................................ 3 1.3 Document cross-reference......................................................................................... 3 1.4 Rounding.................................................................................................................... 4
2 INTRODUCTION ............................................................................................................5
3 BACKGROUND.............................................................................................................5 3.1 Overview – Online Census Option ............................................................................. 5 3.2 Overview – March 2003 Test ..................................................................................... 6 3.3 Overview – November 2003 Test............................................................................... 6 3.4 Overview – March 2005 Dress Rehearsal ................................................................. 6
4 OBJECTIVES................................................................................................................7 4.1 2006 Census Aims..................................................................................................... 7
5 FINDINGS ....................................................................................................................7 5.1 Demographics ............................................................................................................ 7 5.2 Respondent Behaviour............................................................................................. 15 5.3 Technical Analysis ................................................................................................... 29 5.4 Public Perception ..................................................................................................... 32
6 WHAT WORKED WELL ...............................................................................................35 6.1 Online Census Option .............................................................................................. 35 6.2 Help Resources........................................................................................................ 36 6.3 MIS Reporting .......................................................................................................... 36
7 ISSUES......................................................................................................................37 7.1 External Issues......................................................................................................... 37 7.2 Internal Issues.......................................................................................................... 40
8 RESOURCE SAVINGS..................................................................................................41 8.1 Less Paper Forms Printed ....................................................................................... 41 8.2 Savings on Processing............................................................................................. 42 8.3 Storage of Paper Forms........................................................................................... 42 8.4 Distribution of Forms ................................................................................................ 42 8.5 Collection of Forms .................................................................................................. 42 8.6 Distribute an Internet PIN to Every Household ........................................................ 43
9 SUMMARY OF KEY RECOMMENDATIONS ......................................................................44
10 CONCLUSION.............................................................................................................44
Evaluation Report - Online Census Option
11/06/2008 Commercial In Confidence Page 3 of 44
L:\WEB SITE\Left Side\Other Publications\Census\2010\Online Census Option for Statistics New Zealand.doc
1 Document Control
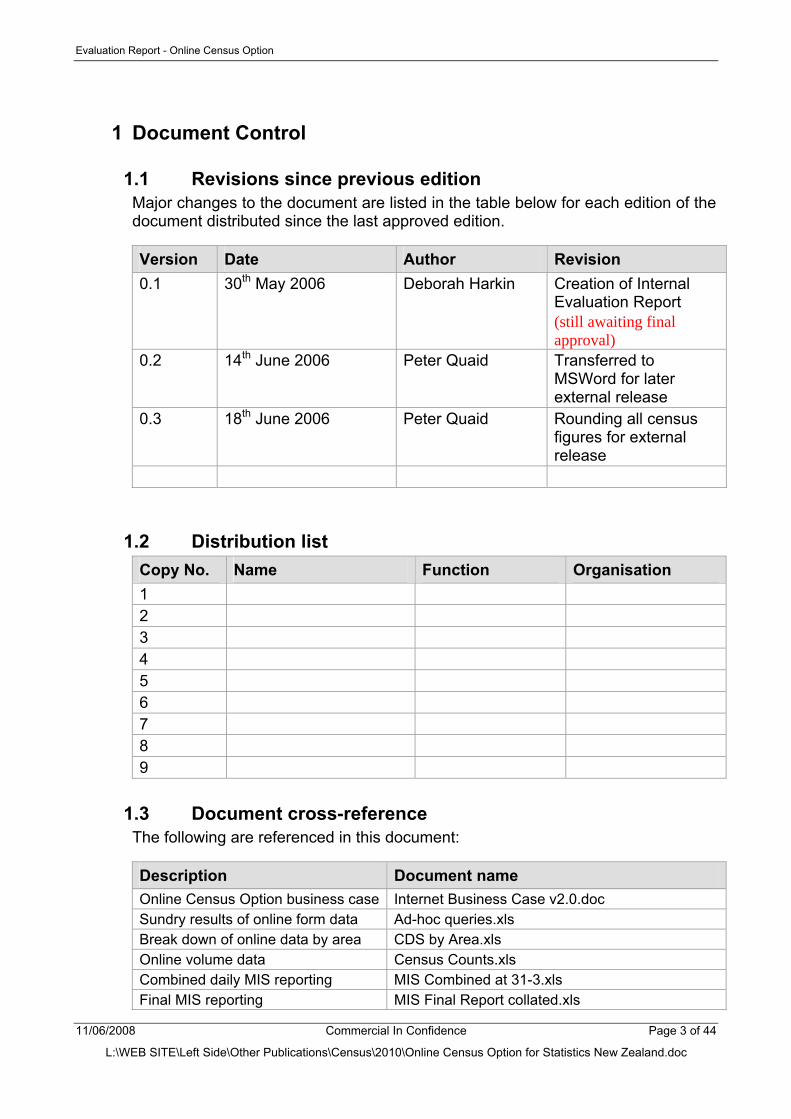
1.1 Revisions since previous edition Major changes to the document are listed in the table below for each edition of the document distributed since the last approved edition.
Version Date Author Revision 0.1 30th May 2006 Deborah Harkin Creation of Internal
Evaluation Report (still awaiting final approval)
0.2 14th June 2006 Peter Quaid Transferred to MSWord for later external release
0.3 18th June 2006 Peter Quaid Rounding all census figures for external release
1.2 Distribution list Copy No. Name Function Organisation 1 2 3 4 5 6 7 8 9
1.3 Document cross-reference The following are referenced in this document:
Description Document name Online Census Option business case Internet Business Case v2.0.doc Sundry results of online form data Ad-hoc queries.xls Break down of online data by area CDS by Area.xls Online volume data Census Counts.xls Combined daily MIS reporting MIS Combined at 31-3.xls Final MIS reporting MIS Final Report collated.xls
Evaluation Report - Online Census Option
11/06/2008 Commercial In Confidence Page 4 of 44
L:\WEB SITE\Left Side\Other Publications\Census\2010\Online Census Option for Statistics New Zealand.doc
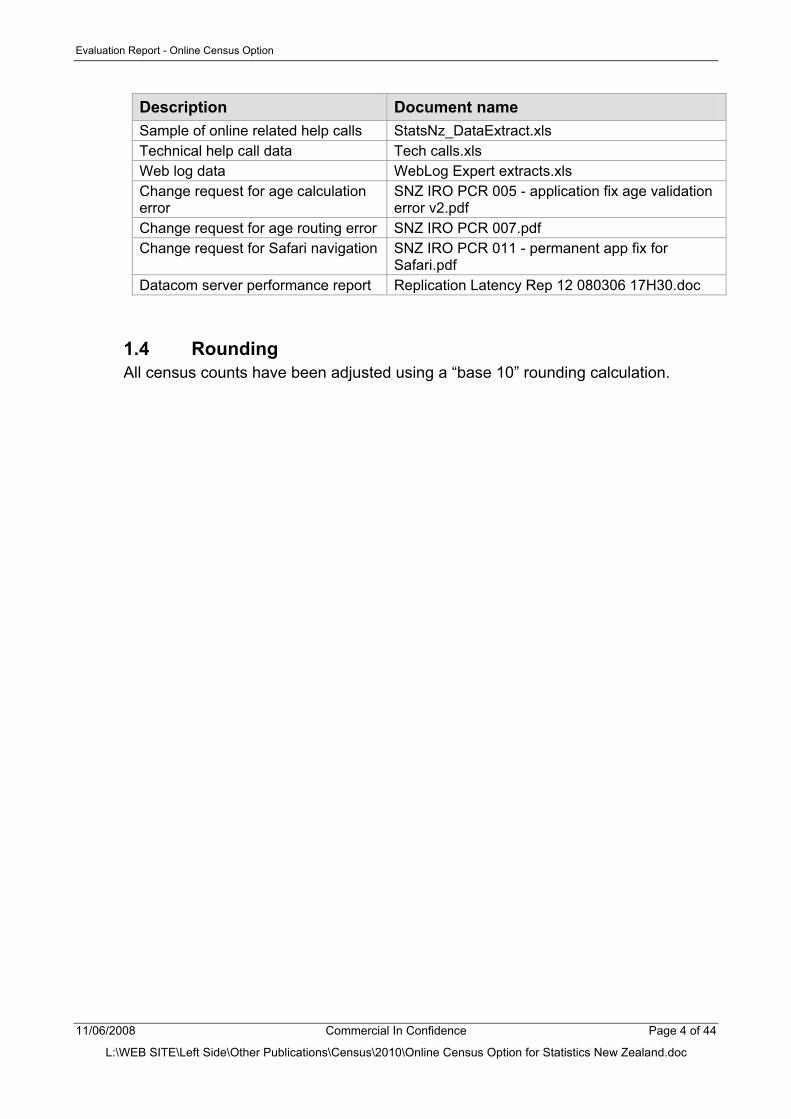
Description Document name Sample of online related help calls StatsNz_DataExtract.xls Technical help call data Tech calls.xls Web log data WebLog Expert extracts.xls Change request for age calculation error
SNZ IRO PCR 005 - application fix age validation error v2.pdf
Change request for age routing error SNZ IRO PCR 007.pdf Change request for Safari navigation SNZ IRO PCR 011 - permanent app fix for
Safari.pdf Datacom server performance report Replication Latency Rep 12 080306 17H30.doc
1.4 Rounding All census counts have been adjusted using a “base 10” rounding calculation.
Evaluation Report - Online Census Option
11/06/2008 Commercial In Confidence Page 5 of 44
L:\WEB SITE\Left Side\Other Publications\Census\2010\Online Census Option for Statistics New Zealand.doc
2 Introduction
The 2006 Online Census Option was very successful. This was the first time that an option to complete a census online had been offered in New Zealand. Overall, no major issues with the system occurred throughout the census period. However, highlighted in this document are several initiatives that could be carried out for the 2011 Census, to further improve the Online Census Option. From a statistical perspective the motivation for having an online option for the 2006 Census was to try to improve participation in the New Zealand Census of Population and Dwellings (Census) and to improve the census data quality. The 2006 Census aimed to build capability for the 2011 Census and beyond. In the future an online census will reduce costs and free resources to maximise value for money. As this was the first time that submitting a census form online was offered, the actual level of uptake was unknown. Overall online form submissions resulted in an uptake above 7% of all collected forms. Almost 400,000 forms were received online. Of these, approximately 287,000 were individual forms and approximately 104,000 dwelling forms. There were around 500 Māori language forms completed and approximately 1,100 Non-Private Dwelling Individual forms submitted. In addition, over 50 forms were submitted using the Screen Reader version of the online form. The ratio of individual forms to dwelling forms was 2.7. Note that the online uptake is directly related to the forms collected, therefore the uptake rate may change as form numbers are finalised. The Online Census Option was available from the 17th February until the 31st March 2006 (43 days). The peak time for form submissions was between 7:30pm and 9:30pm, with an average session time of 26 minutes. Eighty-seven percent of households that filled out census forms online filled out the dwelling form and all corresponding individual forms online. Public perception of the online census was overall very positive.
3 Background
3.1 Overview – Online Census Option The Online Census Option is a web based application that was designed in-house, by the questionnaire design consultancy and census online form teams, to allow the New Zealand public to fill out their census forms online for the first time in 2006. The final application development was outsourced to Datacom Systems Limited, a New Zealand IT company. Respondents accessed the system through a secure website, using a unique household identification number (from their census form) and a PIN (personal identification number) that was handed to them by the collector on request. Respondents could complete their forms in Māori or English and received a receipt on submission. To aid form completion, online assistance was provided in the form of help notes and general census information.
Evaluation Report - Online Census Option
11/06/2008 Commercial In Confidence Page 6 of 44
L:\WEB SITE\Left Side\Other Publications\Census\2010\Online Census Option for Statistics New Zealand.doc
Prior to the 2006 Census there were three field tests:
3.2 Overview – March 2003 Test The purpose of the March 2003 Test was to prove feasibility of an online response option using a Statistics New Zealand prototype. This offered respondents the first ever opportunity to respond to a New Zealand census questionnaire via the Internet and results show that 13.3% of households submitted data via this method. This testing exercise only provided Statistics NZ with qualitative measures, but allowed the project to continue into quantitative testing in November 2003.
3.3 Overview – November 2003 Test The November 2003 test was the second field test to be carried out, in order to supplement the information gained from March 2003 test. This second field test provided quantitative measures. The November 2003 test was limited to testing Statistics New Zealand's internally developed prototype. The November 2003 test had a sample size of 8,000 households from across New Zealand (Auckland, Wellington, Waikato, Nelson and Canterbury). This sample was chosen to produce results that were nationally representative and would provide good quality information for future planning. The sample was spread across urban and rural areas and used varying collection methods (internet, mail back, pick-up), with the traditional pick-up method acting as a control group for comparison with the other modes. The primary objectives of the November test were:
• To test the online form • To understand the impact of mode • To assess how data quality is affected by method of collection • To test the respondent management system (RMS)
The uptake of e-forms and mail back was tested in both urban and rural areas. Enhancements made to the RMS system were also to be evaluated, as communication between the processing centre and field are vital for the success of online and mail back forms. The uptake of the Online Census Option was 16.5% and this led to a business case for funding from Treasury, for the 2006 Census.
3.4 Overview – March 2005 Dress Rehearsal Datacom were contracted in July 2004 to develop a production system for deployment in the "Dress Rehearsal" which was held 12 months prior to the census, on 8 March 2005. The Dress Rehearsal was carried out to test the production application and the integration with the field enumeration process. From an online form perspective the Dress Rehearsal aimed to produce qualitative and
Evaluation Report - Online Census Option
11/06/2008 Commercial In Confidence Page 7 of 44
L:\WEB SITE\Left Side\Other Publications\Census\2010\Online Census Option for Statistics New Zealand.doc
quantitative measures, so we could measure the effectiveness of the Online Census Option as well as the integration of the application with its infrastructure. This was the first full test of the production version of the Online Census Option. The sample population used contained approximately 13,000 households. This was not a nationally representative sample, covering areas of differing deprivation levels.
The Dress Rehearsal received an overall online uptake of 5.7%. This was consistent with expectations.
4 Objectives
4.1 2006 Census Aims
1. To provide a successful online response option for the 2006 Census. This would build the technical knowledge capability for the 2011 Census, when the online option should be more widely used.
2. To investigate ways to reduce future costs associated with the census and free resources to maximise value for money.
3. To validate feasibility of an online option for survey data collection. 4. To improve participation in the census process from a statistical perspective. 5. To improve aspects of census data quality.
5 Findings
5.1 Demographics Uptake As this was the first time that an online census form was offered, the level of uptake was unknown. Overall online form submissions resulted in an uptake above 7% of total collected forms. Almost 400,000 forms were received online. Of these, approx. 287,000 were individual forms and approx. 104,000 were dwelling forms. The ratio of individual forms to dwelling forms was 2.75. This ratio compares well to the projected ratio of 2.7 used in planning. The uptake was lower then expected. To reduce the risk of over taxing the system, the online form was not actively promoted. The infrastructure was constructed large enough to cope with a worst case scenario of a 35% uptake. The census team agreed early on that the only promotion would be on the doorstep and through selected high usage internet sites. Although the collectors were trained to offer an online PIN to all households, it has become apparent from the Research New Zealand survey that this was not always the case. Initial results suggest that only 66% of respondents were offered an online PIN. Including the Online Census Option in the promotion of the 2011 Census should increase the percentage of online uptake. A marketing campaign promoting the online option over the paper form, should increase the potential uptake even further. For instance, we could promote the 2011 Census as an online event with an additional option to complete on paper.
Evaluation Report - Online Census Option
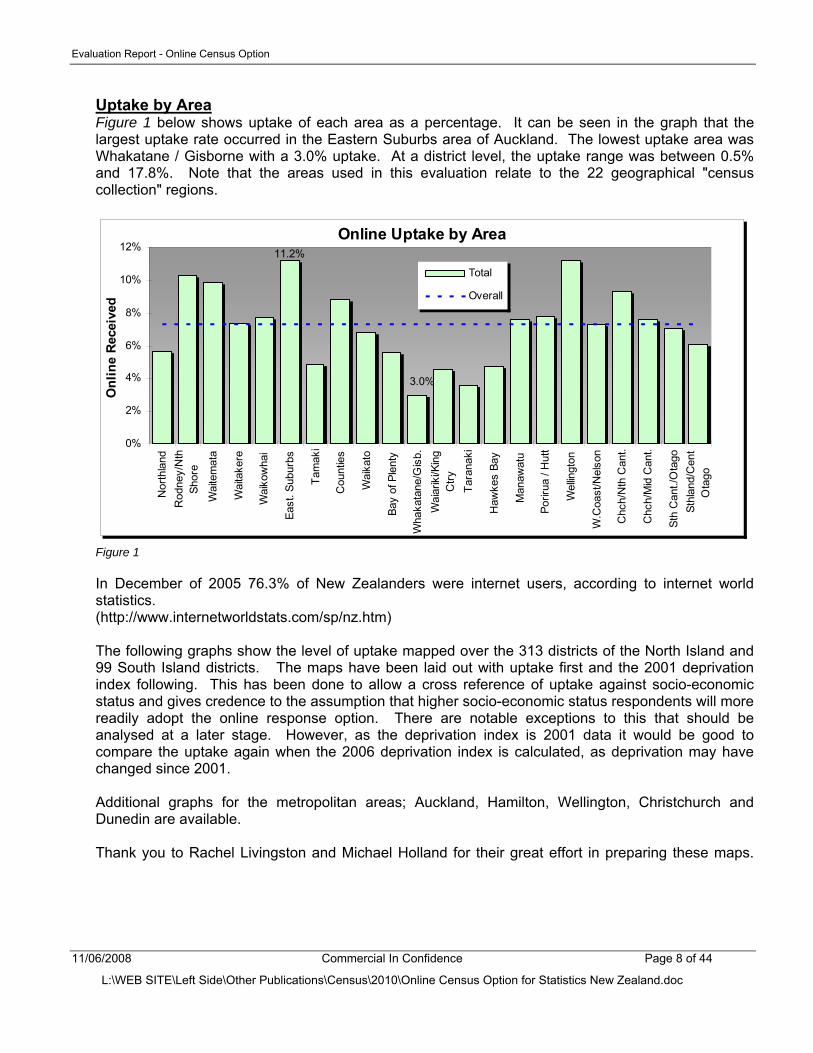
Uptake by Area Figure 1 below shows uptake of each area as a percentage. It can be seen in the graph that the largest uptake rate occurred in the Eastern Suburbs area of Auckland. The lowest uptake area was Whakatane / Gisborne with a 3.0% uptake. At a district level, the uptake range was between 0.5% and 17.8%. Note that the areas used in this evaluation relate to the 22 geographical "census collection" regions.
Online Uptake by Area 11.2%
3.0%
0%
2%
4%
6%
8%
10%
12%
Nor
thla
ndR
odne
y/N
thSh
ore
Wai
tem
ata
Wai
take
re
Wai
kow
hai
East
. Sub
urbs
Tam
aki
Cou
ntie
s
Wai
kato
Bay
of P
lent
y
Wha
kata
ne/G
isb.
Wai
arik
i/Kin
gC
tryTa
rana
ki
Haw
kes
Bay
Man
awat
u
Porir
ua /
Hut
t
Wel
lingt
on
W.C
oast
/Nel
son
Chc
h/N
th C
ant.
Chc
h/M
id C
ant.
Sth
Can
t./O
tago
Sthl
and/
Cen
tO
tago
Onl
ine
Rec
eive
d
Total
Overall
Figure 1 In December of 2005 76.3% of New Zealanders were internet users, according to internet world statistics. (http://www.internetworldstats.com/sp/nz.htm) The following graphs show the level of uptake mapped over the 313 districts of the North Island and 99 South Island districts. The maps have been laid out with uptake first and the 2001 deprivation index following. This has been done to allow a cross reference of uptake against socio-economic status and gives credence to the assumption that higher socio-economic status respondents will more readily adopt the online response option. There are notable exceptions to this that should be analysed at a later stage. However, as the deprivation index is 2001 data it would be good to compare the uptake again when the 2006 deprivation index is calculated, as deprivation may have changed since 2001. Additional graphs for the metropolitan areas; Auckland, Hamilton, Wellington, Christchurch and Dunedin are available. Thank you to Rachel Livingston and Michael Holland for their great effort in preparing these maps.
11/06/2008 Commercial In Confidence Page 8 of 44
L:\WEB SITE\Left Side\Other Publications\Census\2010\Online Census Option for Statistics New Zealand.doc
Evaluation Report - Online Census Option
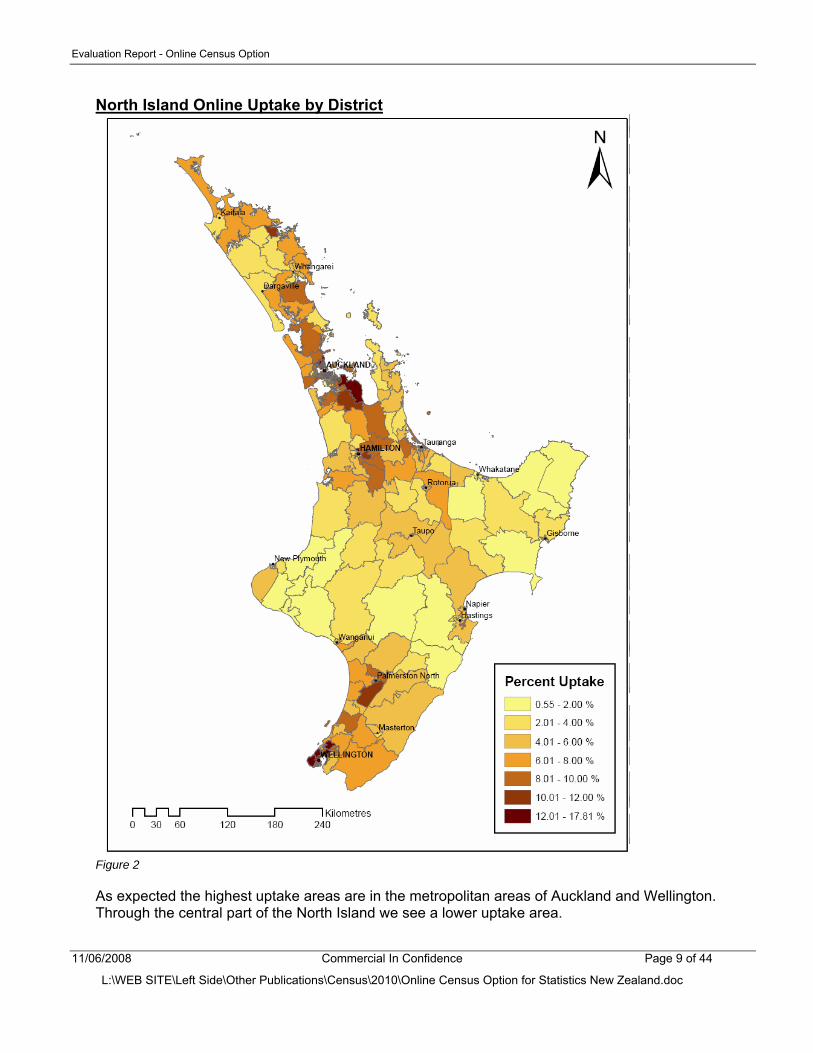
North Island Online Uptake by District
Figure 2 As expected the highest uptake areas are in the metropolitan areas of Auckland and Wellington. Through the central part of the North Island we see a lower uptake area.
11/06/2008 Commercial In Confidence Page 9 of 44
L:\WEB SITE\Left Side\Other Publications\Census\2010\Online Census Option for Statistics New Zealand.doc
Evaluation Report - Online Census Option
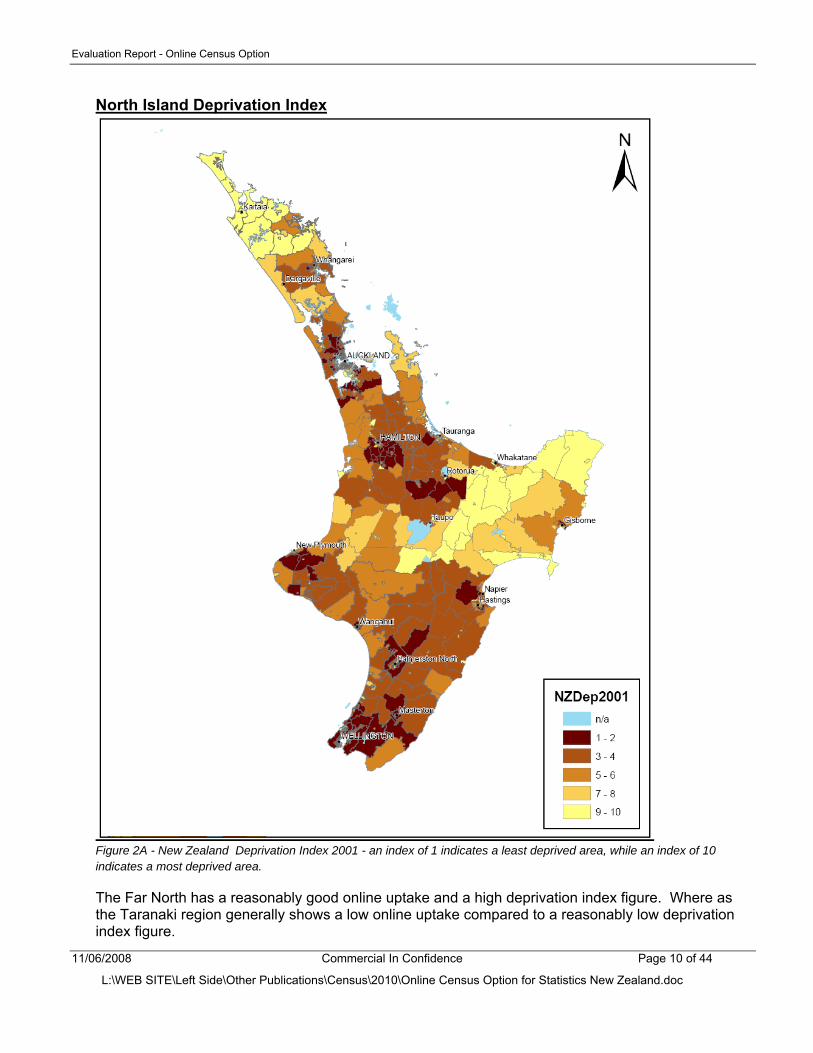
North Island Deprivation Index
Figure 2A - New Zealand Deprivation Index 2001 - an index of 1 indicates a least deprived area, while an index of 10 indicates a most deprived area. The Far North has a reasonably good online uptake and a high deprivation index figure. Where as the Taranaki region generally shows a low online uptake compared to a reasonably low deprivation index figure.
11/06/2008 Commercial In Confidence Page 10 of 44
L:\WEB SITE\Left Side\Other Publications\Census\2010\Online Census Option for Statistics New Zealand.doc
Evaluation Report - Online Census Option
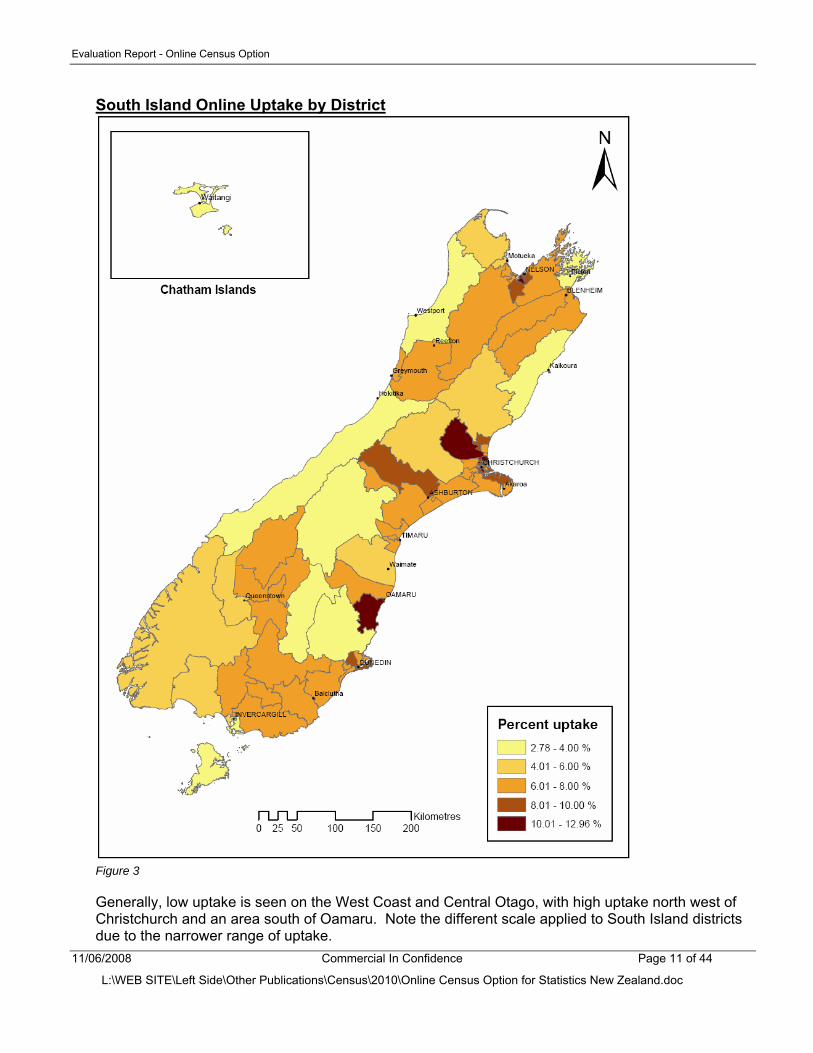
South Island Online Uptake by District
Figure 3 Generally, low uptake is seen on the West Coast and Central Otago, with high uptake north west of Christchurch and an area south of Oamaru. Note the different scale applied to South Island districts due to the narrower range of uptake.
11/06/2008 Commercial In Confidence Page 11 of 44
L:\WEB SITE\Left Side\Other Publications\Census\2010\Online Census Option for Statistics New Zealand.doc
Evaluation Report - Online Census Option
South Island Deprivation Index
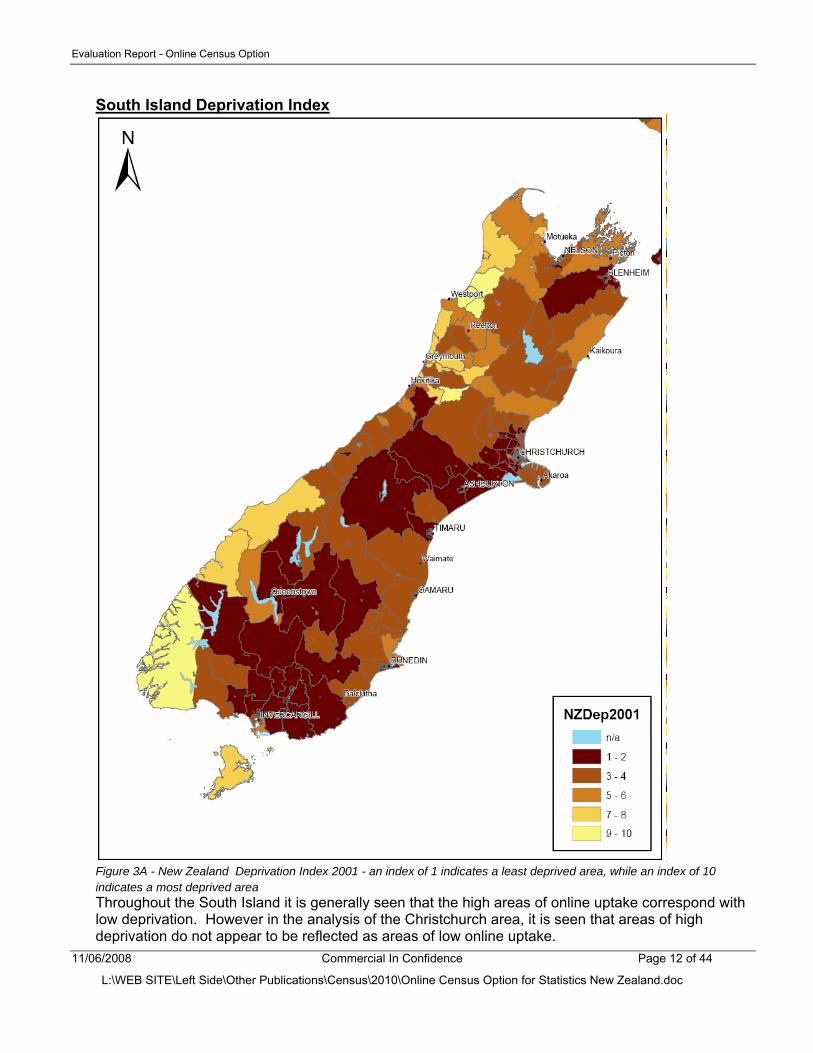
Figure 3A - New Zealand Deprivation Index 2001 - an index of 1 indicates a least deprived area, while an index of 10 indicates a most deprived area Throughout the South Island it is generally seen that the high areas of online uptake correspond with low deprivation. However in the analysis of the Christchurch area, it is seen that areas of high deprivation do not appear to be reflected as areas of low online uptake.
11/06/2008 Commercial In Confidence Page 12 of 44
L:\WEB SITE\Left Side\Other Publications\Census\2010\Online Census Option for Statistics New Zealand.doc
Evaluation Report - Online Census Option
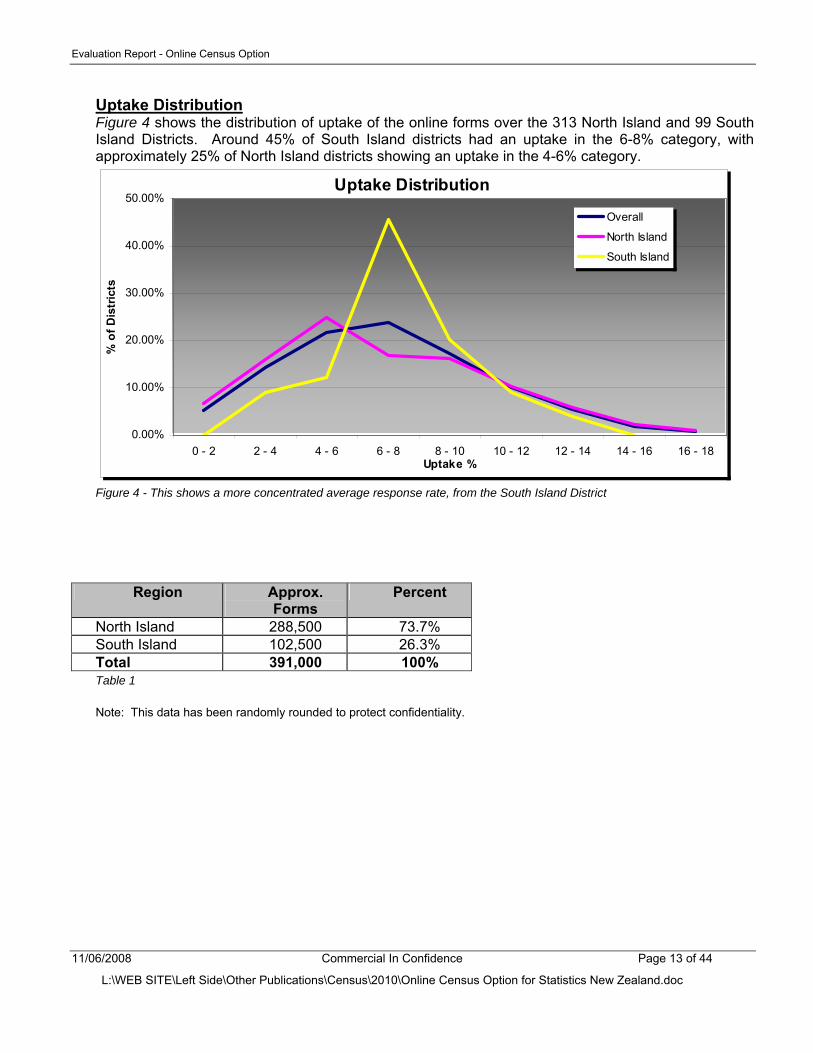
Uptake Distribution Figure 4 shows the distribution of uptake of the online forms over the 313 North Island and 99 South Island Districts. Around 45% of South Island districts had an uptake in the 6-8% category, with approximately 25% of North Island districts showing an uptake in the 4-6% category.
Uptake Distribution
0.00%
10.00%
20.00%
30.00%
40.00%
50.00%
0 - 2 2 - 4 4 - 6 6 - 8 8 - 10 10 - 12 12 - 14 14 - 16 16 - 18Uptake %
% o
f Dis
tric
ts
Overall
North Island
South Island
Figure 4 - This shows a more concentrated average response rate, from the South Island District
Region Approx. Forms
Percent
North Island 288,500 73.7% South Island 102,500 26.3% Total 391,000 100% Table 1
Note: This data has been randomly rounded to protect confidentiality.
11/06/2008 Commercial In Confidence Page 13 of 44
L:\WEB SITE\Left Side\Other Publications\Census\2010\Online Census Option for Statistics New Zealand.doc
Evaluation Report - Online Census Option
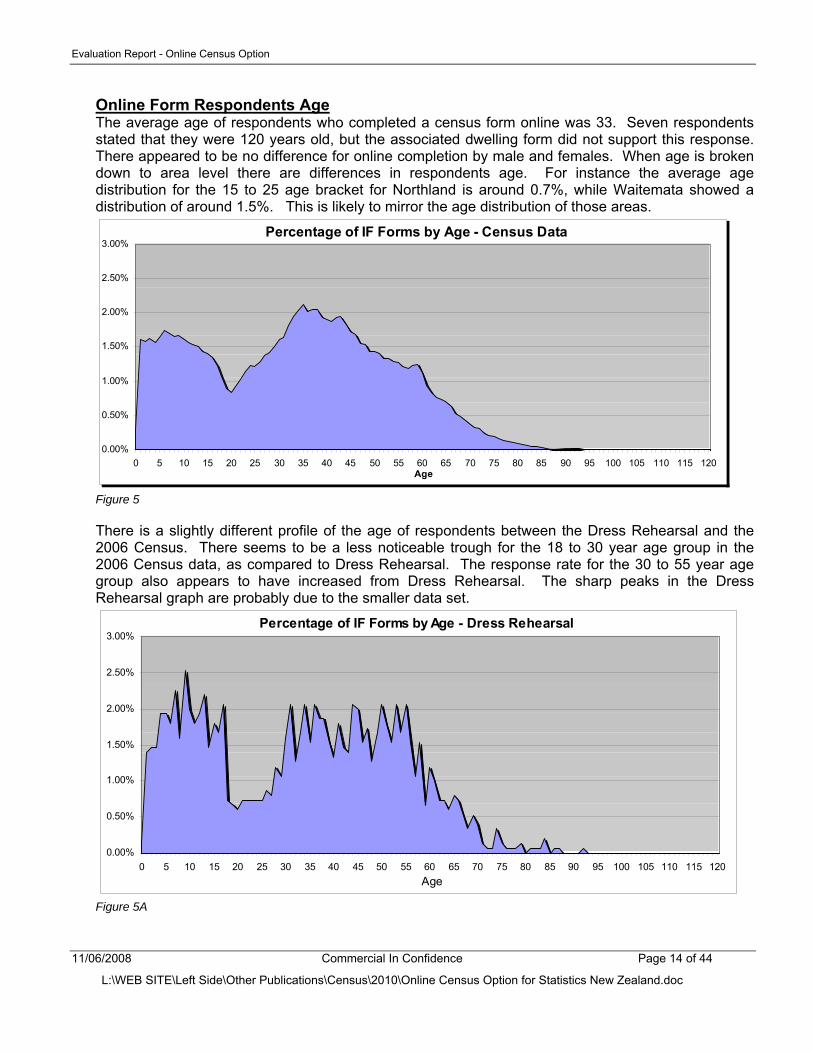
Online Form Respondents Age The average age of respondents who completed a census form online was 33. Seven respondents stated that they were 120 years old, but the associated dwelling form did not support this response. There appeared to be no difference for online completion by male and females. When age is broken down to area level there are differences in respondents age. For instance the average age distribution for the 15 to 25 age bracket for Northland is around 0.7%, while Waitemata showed a distribution of around 1.5%. This is likely to mirror the age distribution of those areas.
Percentage of IF Forms by Age - Census Data
0.00%
0.50%
1.00%
1.50%
2.00%
2.50%
3.00%
0 5 10 15 20 25 30 35 40 45 50 55 60 65 70 75 80 85 90 95 100 105 110 115 120Age
Figure 5 There is a slightly different profile of the age of respondents between the Dress Rehearsal and the 2006 Census. There seems to be a less noticeable trough for the 18 to 30 year age group in the 2006 Census data, as compared to Dress Rehearsal. The response rate for the 30 to 55 year age group also appears to have increased from Dress Rehearsal. The sharp peaks in the Dress Rehearsal graph are probably due to the smaller data set.
Percentage of IF Forms by Age - Dress Rehearsal
0.00%
0.50%
1.00%
1.50%
2.00%
2.50%
3.00%
0 5 10 15 20 25 30 35 40 45 50 55 60 65 70 75 80 85 90 95 100 105 110 115 120Age
Figure 5A
11/06/2008 Commercial In Confidence Page 14 of 44
L:\WEB SITE\Left Side\Other Publications\Census\2010\Online Census Option for Statistics New Zealand.doc
Evaluation Report - Online Census Option
Note that these figures relate to the individuals who had their details recorded via the Online Census Option, not necessarily the people who completed the form(s). (These figures might be used for later comparison with the overall response by age data.)
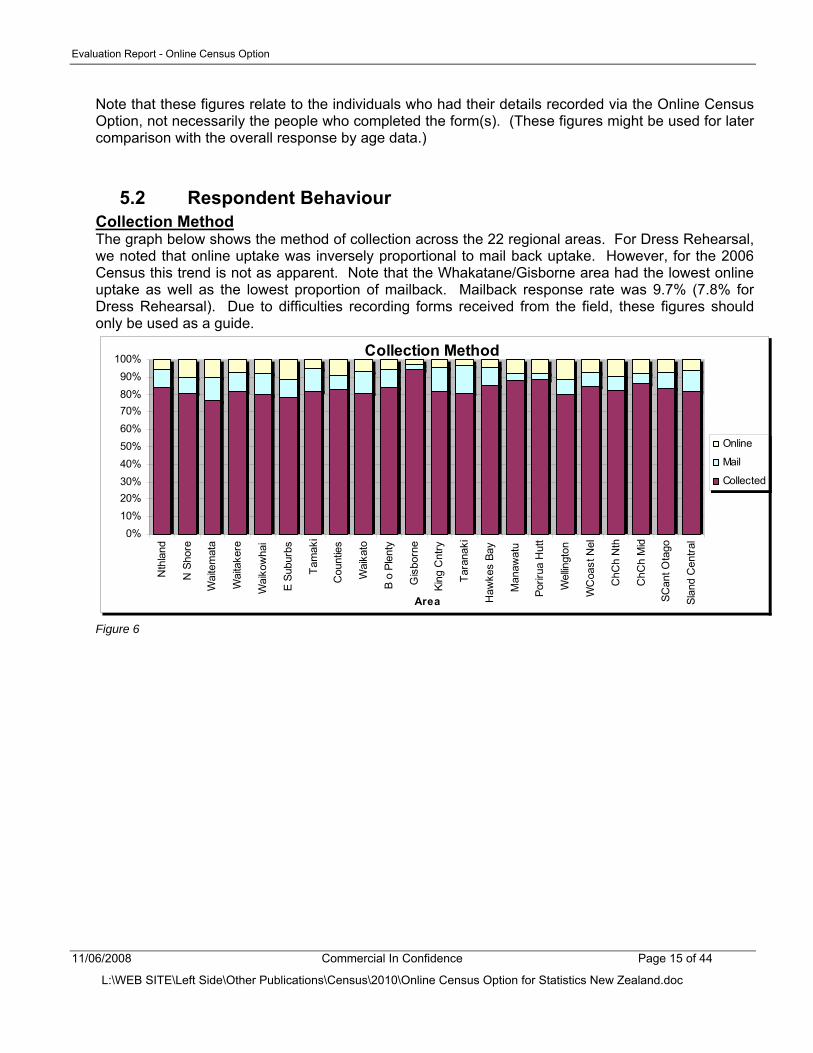
5.2 Respondent Behaviour Collection Method The graph below shows the method of collection across the 22 regional areas. For Dress Rehearsal, we noted that online uptake was inversely proportional to mail back uptake. However, for the 2006 Census this trend is not as apparent. Note that the Whakatane/Gisborne area had the lowest online uptake as well as the lowest proportion of mailback. Mailback response rate was 9.7% (7.8% for Dress Rehearsal). Due to difficulties recording forms received from the field, these figures should only be used as a guide.
Collection Method
0%10%20%30%40%50%60%70%80%90%
100%
Nth
land
N S
hore
Wai
tem
ata
Wai
take
re
Wai
kow
hai
E Su
burb
s
Tam
aki
Cou
ntie
s
Wai
kato
B o
Plen
ty
Gis
born
e
King
Cnt
ry
Tara
naki
Haw
kes
Bay
Man
awat
u
Porir
ua H
utt
Wel
lingt
on
WC
oast
Nel
ChC
h N
th
ChC
h M
id
SCan
t Ota
go
Slan
d C
entra
l
Area
Online
Collected
Figure 6
11/06/2008 Commercial In Confidence Page 15 of 44
L:\WEB SITE\Left Side\Other Publications\Census\2010\Online Census Option for Statistics New Zealand.doc
Evaluation Report - Online Census Option
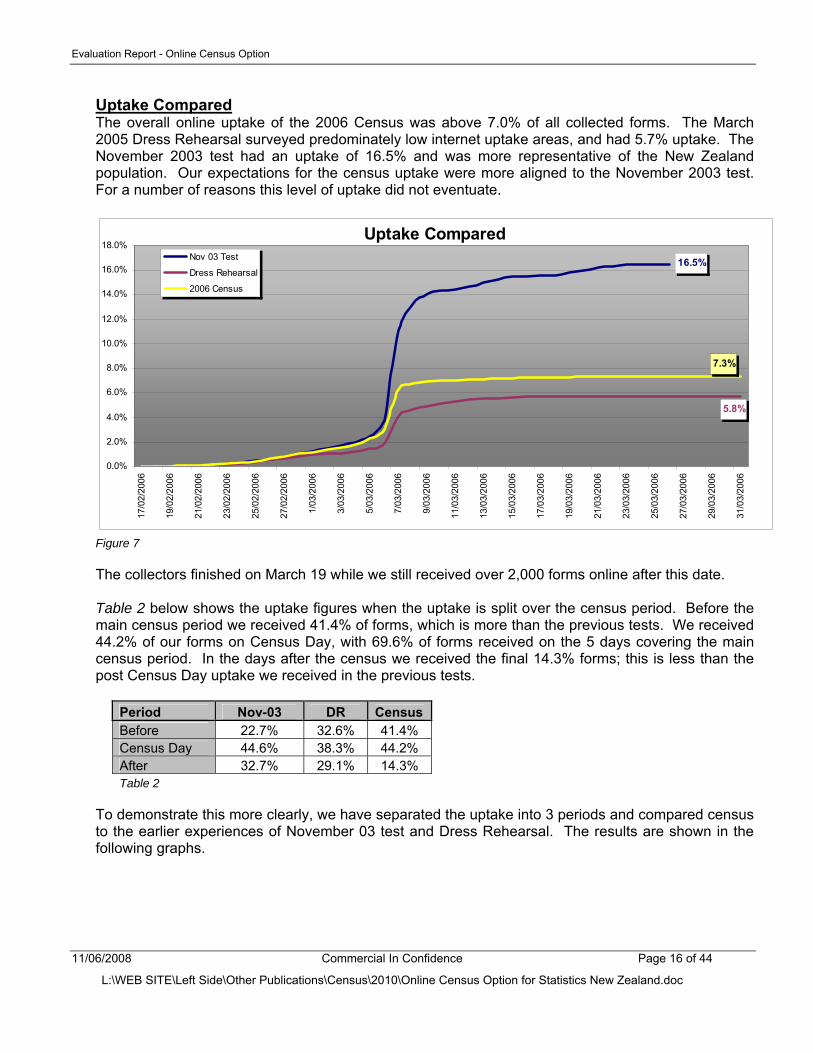
Uptake Compared The overall online uptake of the 2006 Census was above 7.0% of all collected forms. The March 2005 Dress Rehearsal surveyed predominately low internet uptake areas, and had 5.7% uptake. The November 2003 test had an uptake of 16.5% and was more representative of the New Zealand population. Our expectations for the census uptake were more aligned to the November 2003 test. For a number of reasons this level of uptake did not eventuate.
Uptake Compared16.5%
5.8%
7.3%
0.0%
2.0%
4.0%
6.0%
8.0%
10.0%
12.0%
14.0%
16.0%
18.0%
17/0
2/20
06
19/0
2/20
06
21/0
2/20
06
23/0
2/20
06
25/0
2/20
06
27/0
2/20
06
1/03
/200
6
3/03
/200
6
5/03
/200
6
7/03
/200
6
9/03
/200
6
11/0
3/20
06
13/0
3/20
06
15/0
3/20
06
17/0
3/20
06
19/0
3/20
06
21/0
3/20
06
23/0
3/20
06
25/0
3/20
06
27/0
3/20
06
29/0
3/20
06
31/0
3/20
06
Nov 03 Test
Dress Rehearsal
2006 Census
Figure 7 The collectors finished on March 19 while we still received over 2,000 forms online after this date. Table 2 below shows the uptake figures when the uptake is split over the census period. Before the main census period we received 41.4% of forms, which is more than the previous tests. We received 44.2% of our forms on Census Day, with 69.6% of forms received on the 5 days covering the main census period. In the days after the census we received the final 14.3% forms; this is less than the post Census Day uptake we received in the previous tests.
Period Nov-03 DR Census Before 22.7% 32.6% 41.4% Census Day 44.6% 38.3% 44.2% After 32.7% 29.1% 14.3% Table 2
To demonstrate this more clearly, we have separated the uptake into 3 periods and compared census to the earlier experiences of November 03 test and Dress Rehearsal. The results are shown in the following graphs.
11/06/2008 Commercial In Confidence Page 16 of 44
L:\WEB SITE\Left Side\Other Publications\Census\2010\Online Census Option for Statistics New Zealand.doc
Evaluation Report - Online Census Option
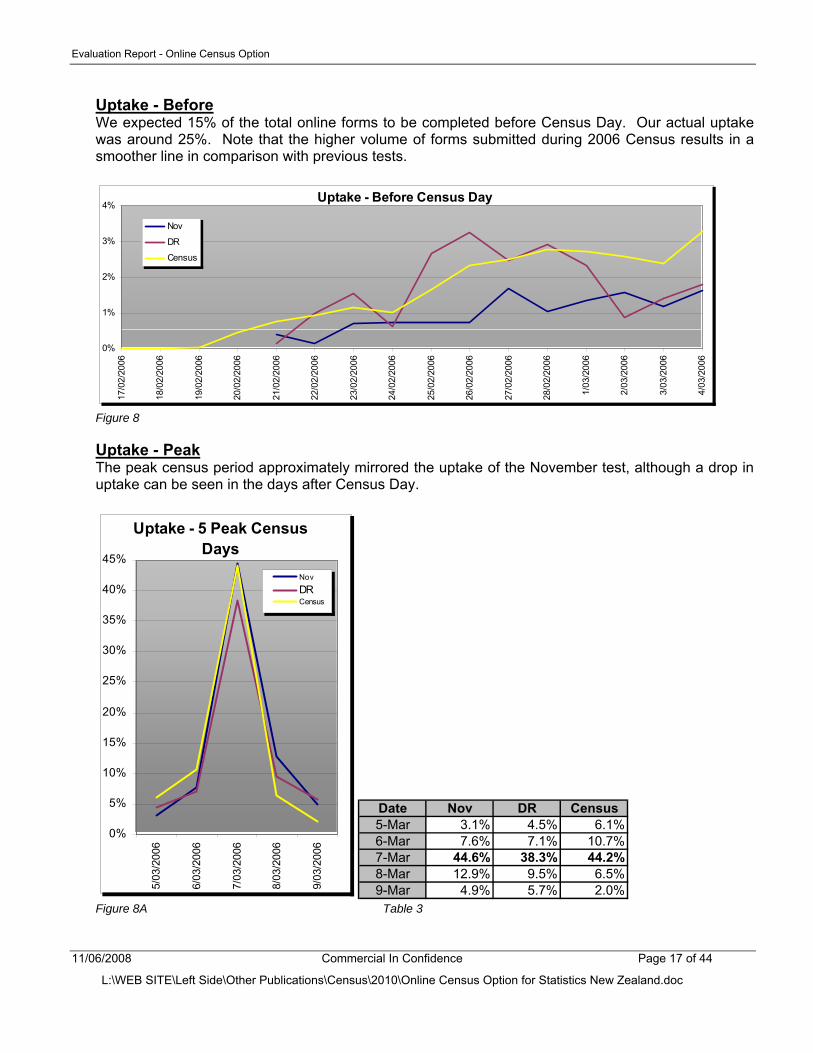
Uptake - Before We expected 15% of the total online forms to be completed before Census Day. Our actual uptake was around 25%. Note that the higher volume of forms submitted during 2006 Census results in a smoother line in comparison with previous tests.
Uptake - Before Census Day
0%
1%
2%
3%
4%
17/0
2/20
06
18/0
2/20
06
19/0
2/20
06
20/0
2/20
06
21/0
2/20
06
22/0
2/20
06
23/0
2/20
06
24/0
2/20
06
25/0
2/20
06
26/0
2/20
06
27/0
2/20
06
28/0
2/20
06
1/03
/200
6
2/03
/200
6
3/03
/200
6
4/03
/200
6
Nov
DR
Census
Figure 8 Uptake - Peak The peak census period approximately mirrored the uptake of the November test, although a drop in uptake can be seen in the days after Census Day.
Uptake - 5 Peak Census Days
0%
5%
10%
15%
20%
25%
30%
35%
40%
45%
5/03
/200
6
6/03
/200
6
7/03
/200
6
8/03
/200
6
9/03
/200
6
Nov
DRCensus
Date Nov DR Census5-Mar 3.1% 4.5% 6.1%6-Mar 7.6% 7.1% 10.7%7-Mar 44.6% 38.3% 44.2%8-Mar 12.9% 9.5% 6.5%9-Mar 4.9% 5.7% 2.0%
Figure 8A Table 3
11/06/2008 Commercial In Confidence Page 17 of 44
L:\WEB SITE\Left Side\Other Publications\Census\2010\Online Census Option for Statistics New Zealand.doc
Evaluation Report - Online Census Option
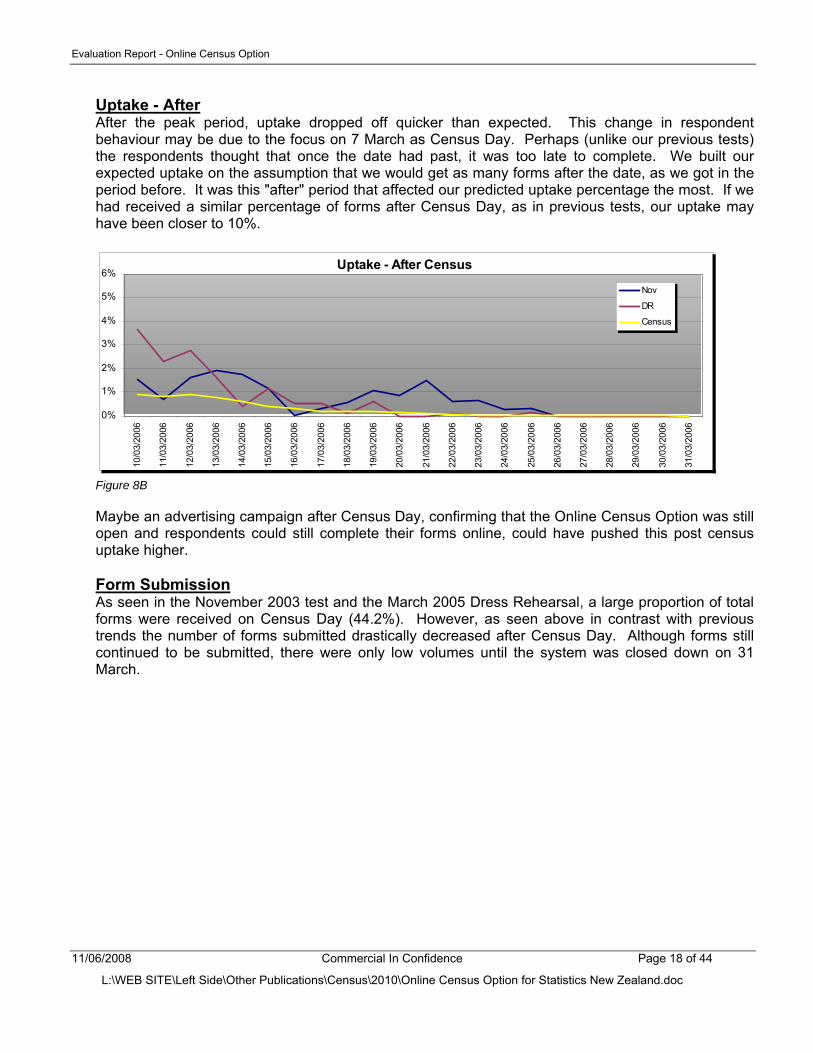
Uptake - After After the peak period, uptake dropped off quicker than expected. This change in respondent behaviour may be due to the focus on 7 March as Census Day. Perhaps (unlike our previous tests) the respondents thought that once the date had past, it was too late to complete. We built our expected uptake on the assumption that we would get as many forms after the date, as we got in the period before. It was this "after" period that affected our predicted uptake percentage the most. If we had received a similar percentage of forms after Census Day, as in previous tests, our uptake may have been closer to 10%.
Uptake - After Census
0%
1%
2%
3%
4%
5%
6%
10/0
3/20
06
11/0
3/20
06
12/0
3/20
06
13/0
3/20
06
14/0
3/20
06
15/0
3/20
06
16/0
3/20
06
17/0
3/20
06
18/0
3/20
06
19/0
3/20
06
20/0
3/20
06
21/0
3/20
06
22/0
3/20
06
23/0
3/20
06
24/0
3/20
06
25/0
3/20
06
26/0
3/20
06
27/0
3/20
06
28/0
3/20
06
29/0
3/20
06
30/0
3/20
06
31/0
3/20
06
Nov
DR
Census
Figure 8B Maybe an advertising campaign after Census Day, confirming that the Online Census Option was still open and respondents could still complete their forms online, could have pushed this post census uptake higher. Form Submission As seen in the November 2003 test and the March 2005 Dress Rehearsal, a large proportion of total forms were received on Census Day (44.2%). However, as seen above in contrast with previous trends the number of forms submitted drastically decreased after Census Day. Although forms still continued to be submitted, there were only low volumes until the system was closed down on 31 March.
11/06/2008 Commercial In Confidence Page 18 of 44
L:\WEB SITE\Left Side\Other Publications\Census\2010\Online Census Option for Statistics New Zealand.doc
Evaluation Report - Online Census Option
Total Online Forms by Day
0
20,000
40,000
60,000
80,000
100,000
120,000
140,000
160,000
180,000
17/0
2/06
19/0
2/06
21/0
2/06
23/0
2/06
25/0
2/06
27/0
2/06
1/03
/06
3/03
/06
5/03
/06
7/03
/06
9/03
/06
11/0
3/06
13/0
3/06
15/0
3/06
17/0
3/06
19/0
3/06
21/0
3/06
23/0
3/06
25/0
3/06
27/0
3/06
29/0
3/06
31/0
3/06
Num
ber
Individual
Dw elling
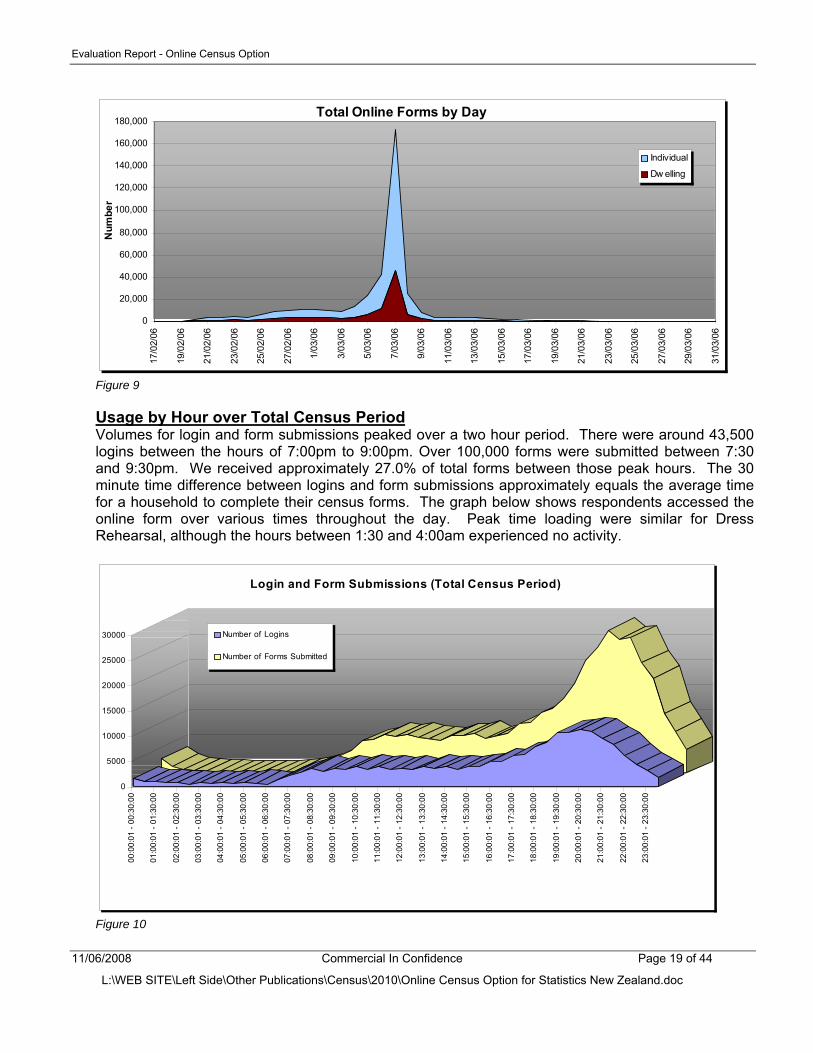
Figure 9 Usage by Hour over Total Census Period Volumes for login and form submissions peaked over a two hour period. There were around 43,500 logins between the hours of 7:00pm to 9:00pm. Over 100,000 forms were submitted between 7:30 and 9:30pm. We received approximately 27.0% of total forms between those peak hours. The 30 minute time difference between logins and form submissions approximately equals the average time for a household to complete their census forms. The graph below shows respondents accessed the online form over various times throughout the day. Peak time loading were similar for Dress Rehearsal, although the hours between 1:30 and 4:00am experienced no activity.
0
5000
10000
15000
20000
25000
30000
00:0
0:01
- 00
:30:
00
01:0
0:01
- 01
:30:
00
02:0
0:01
- 02
:30:
00
03:0
0:01
- 03
:30:
00
04:0
0:01
- 04
:30:
00
05:0
0:01
- 05
:30:
00
06:0
0:01
- 06
:30:
00
07:0
0:01
- 07
:30:
00
08:0
0:01
- 08
:30:
00
09:0
0:01
- 09
:30:
00
10:0
0:01
- 10
:30:
00
11:0
0:01
- 11
:30:
00
12:0
0:01
- 12
:30:
00
13:0
0:01
- 13
:30:
00
14:0
0:01
- 14
:30:
00
15:0
0:01
- 15
:30:
00
16:0
0:01
- 16
:30:
00
17:0
0:01
- 17
:30:
00
18:0
0:01
- 18
:30:
00
19:0
0:01
- 19
:30:
00
20:0
0:01
- 20
:30:
00
21:0
0:01
- 21
:30:
00
22:0
0:01
- 22
:30:
00
23:0
0:01
- 23
:30:
00
Login and Form Submissions (Total Census Period)
Number of Logins
Number of Forms Submitted
Figure 10
11/06/2008 Commercial In Confidence Page 19 of 44
L:\WEB SITE\Left Side\Other Publications\Census\2010\Online Census Option for Statistics New Zealand.doc
Evaluation Report - Online Census Option
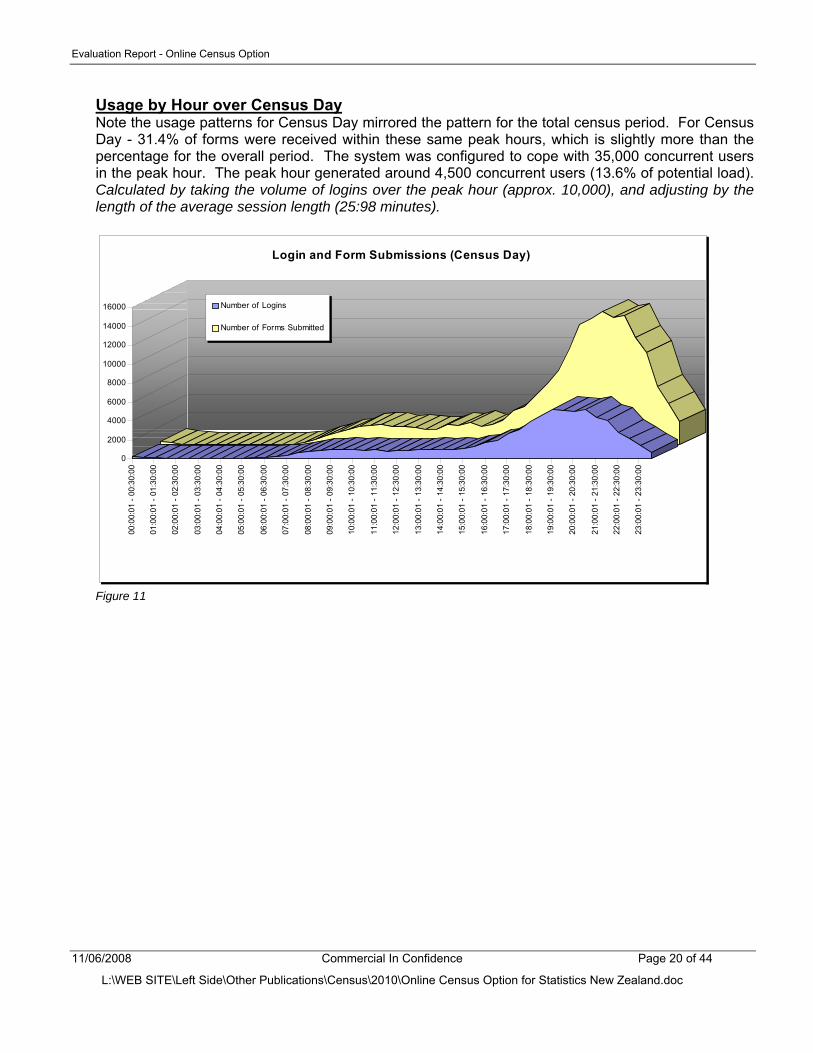
Usage by Hour over Census Day Note the usage patterns for Census Day mirrored the pattern for the total census period. For Census Day - 31.4% of forms were received within these same peak hours, which is slightly more than the percentage for the overall period. The system was configured to cope with 35,000 concurrent users in the peak hour. The peak hour generated around 4,500 concurrent users (13.6% of potential load). Calculated by taking the volume of logins over the peak hour (approx. 10,000), and adjusting by the length of the average session length (25:98 minutes).
0
2000
4000
6000
8000
10000
12000
14000
16000
00:0
0:01
- 00
:30:
00
01:0
0:01
- 01
:30:
00
02:0
0:01
- 02
:30:
00
03:0
0:01
- 03
:30:
00
04:0
0:01
- 04
:30:
00
05:0
0:01
- 05
:30:
00
06:0
0:01
- 06
:30:
00
07:0
0:01
- 07
:30:
00
08:0
0:01
- 08
:30:
00
09:0
0:01
- 09
:30:
00
10:0
0:01
- 10
:30:
00
11:0
0:01
- 11
:30:
00
12:0
0:01
- 12
:30:
00
13:0
0:01
- 13
:30:
00
14:0
0:01
- 14
:30:
00
15:0
0:01
- 15
:30:
00
16:0
0:01
- 16
:30:
00
17:0
0:01
- 17
:30:
00
18:0
0:01
- 18
:30:
00
19:0
0:01
- 19
:30:
00
20:0
0:01
- 20
:30:
00
21:0
0:01
- 21
:30:
00
22:0
0:01
- 22
:30:
00
23:0
0:01
- 23
:30:
00
Login and Form Submissions (Census Day)
Number of Logins
Number of Forms Submitted
Figure 11
11/06/2008 Commercial In Confidence Page 20 of 44
L:\WEB SITE\Left Side\Other Publications\Census\2010\Online Census Option for Statistics New Zealand.doc
Evaluation Report - Online Census Option
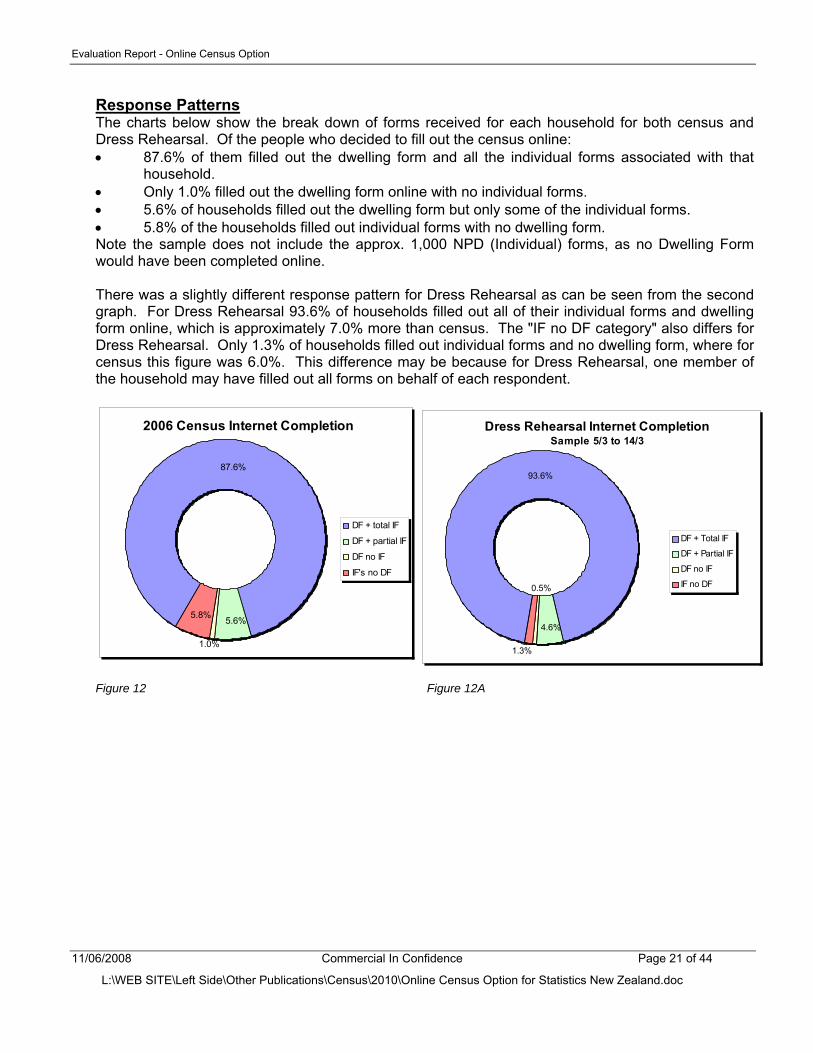
Response Patterns The charts below show the break down of forms received for each household for both census and Dress Rehearsal. Of the people who decided to fill out the census online: • 87.6% of them filled out the dwelling form and all the individual forms associated with that
household. • Only 1.0% filled out the dwelling form online with no individual forms. • 5.6% of households filled out the dwelling form but only some of the individual forms. • 5.8% of the households filled out individual forms with no dwelling form. Note the sample does not include the approx. 1,000 NPD (Individual) forms, as no Dwelling Form would have been completed online. There was a slightly different response pattern for Dress Rehearsal as can be seen from the second graph. For Dress Rehearsal 93.6% of households filled out all of their individual forms and dwelling form online, which is approximately 7.0% more than census. The "IF no DF category" also differs for Dress Rehearsal. Only 1.3% of households filled out individual forms and no dwelling form, where for census this figure was 6.0%. This difference may be because for Dress Rehearsal, one member of the household may have filled out all forms on behalf of each respondent.
2006 Census Internet Completion
87.6%
1.0%
5.6%5.8%
DF + total IF
DF + partial IF
DF no IF
IF's no DF
Dress Rehearsal Internet CompletionSample 5/3 to 14/3
93.6%
0.5%
4.6%
1.3%
DF + Total IF
DF + Partial IF
DF no IF
IF no DF
Figure 12 Figure 12A
11/06/2008 Commercial In Confidence Page 21 of 44
L:\WEB SITE\Left Side\Other Publications\Census\2010\Online Census Option for Statistics New Zealand.doc
Evaluation Report - Online Census Option
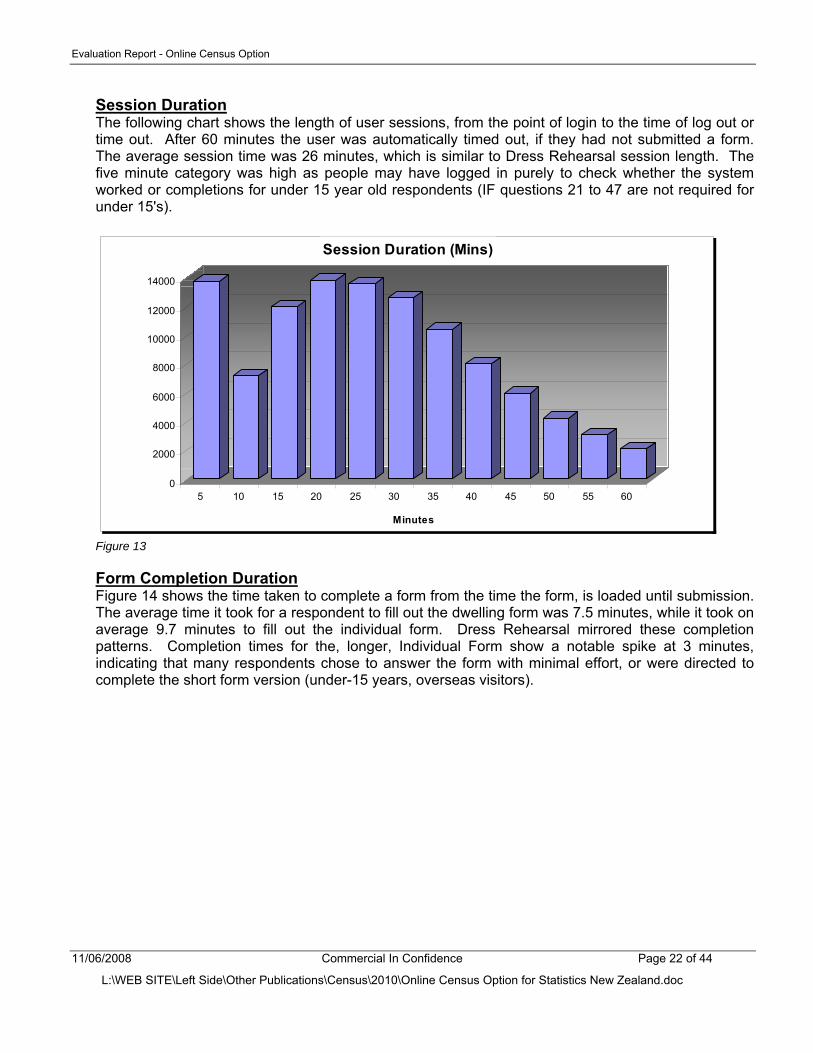
Session Duration The following chart shows the length of user sessions, from the point of login to the time of log out or time out. After 60 minutes the user was automatically timed out, if they had not submitted a form. The average session time was 26 minutes, which is similar to Dress Rehearsal session length. The five minute category was high as people may have logged in purely to check whether the system worked or completions for under 15 year old respondents (IF questions 21 to 47 are not required for under 15's).
0
2000
4000
6000
8000
10000
12000
14000
5 10 15 20 25 30 35 40 45 50 55 60
Minutes
Session Duration (Mins)
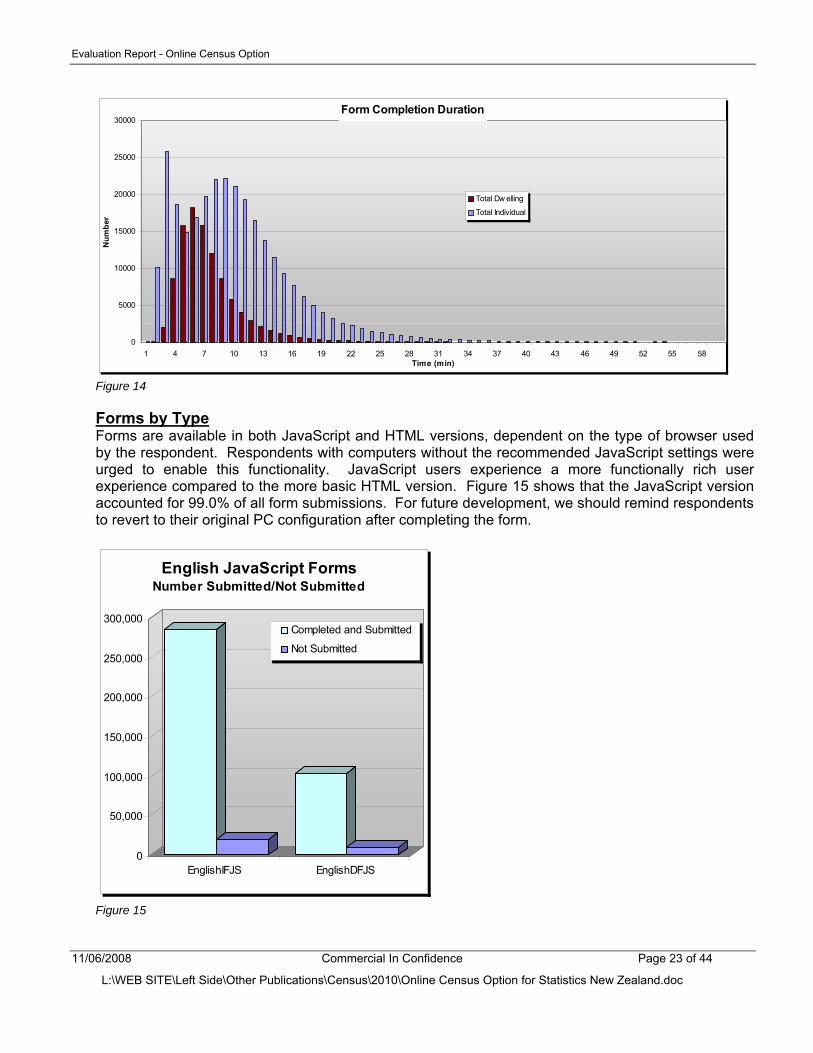
Figure 13 Form Completion Duration Figure 14 shows the time taken to complete a form from the time the form, is loaded until submission. The average time it took for a respondent to fill out the dwelling form was 7.5 minutes, while it took on average 9.7 minutes to fill out the individual form. Dress Rehearsal mirrored these completion patterns. Completion times for the, longer, Individual Form show a notable spike at 3 minutes, indicating that many respondents chose to answer the form with minimal effort, or were directed to complete the short form version (under-15 years, overseas visitors).
11/06/2008 Commercial In Confidence Page 22 of 44
L:\WEB SITE\Left Side\Other Publications\Census\2010\Online Census Option for Statistics New Zealand.doc
Evaluation Report - Online Census Option
Form Completion Duration
0
5000
10000
15000
20000
25000
30000
1 4 7 10 13 16 19 22 25 28 31 34 37 40 43 46 49 52 55 58Time (min)
Num
ber
Total Dw elling
Total Individual
Figure 14 Forms by Type Forms are available in both JavaScript and HTML versions, dependent on the type of browser used by the respondent. Respondents with computers without the recommended JavaScript settings were urged to enable this functionality. JavaScript users experience a more functionally rich user experience compared to the more basic HTML version. Figure 15 shows that the JavaScript version accounted for 99.0% of all form submissions. For future development, we should remind respondents to revert to their original PC configuration after completing the form.
0
50,000
100,000
150,000
200,000
250,000
300,000
EnglishIFJS EnglishDFJS
English JavaScript Forms Number Submitted/Not Submitted
Completed and Submitted
Not Submitted
Figure 15
11/06/2008 Commercial In Confidence Page 23 of 44
L:\WEB SITE\Left Side\Other Publications\Census\2010\Online Census Option for Statistics New Zealand.doc
Evaluation Report - Online Census Option
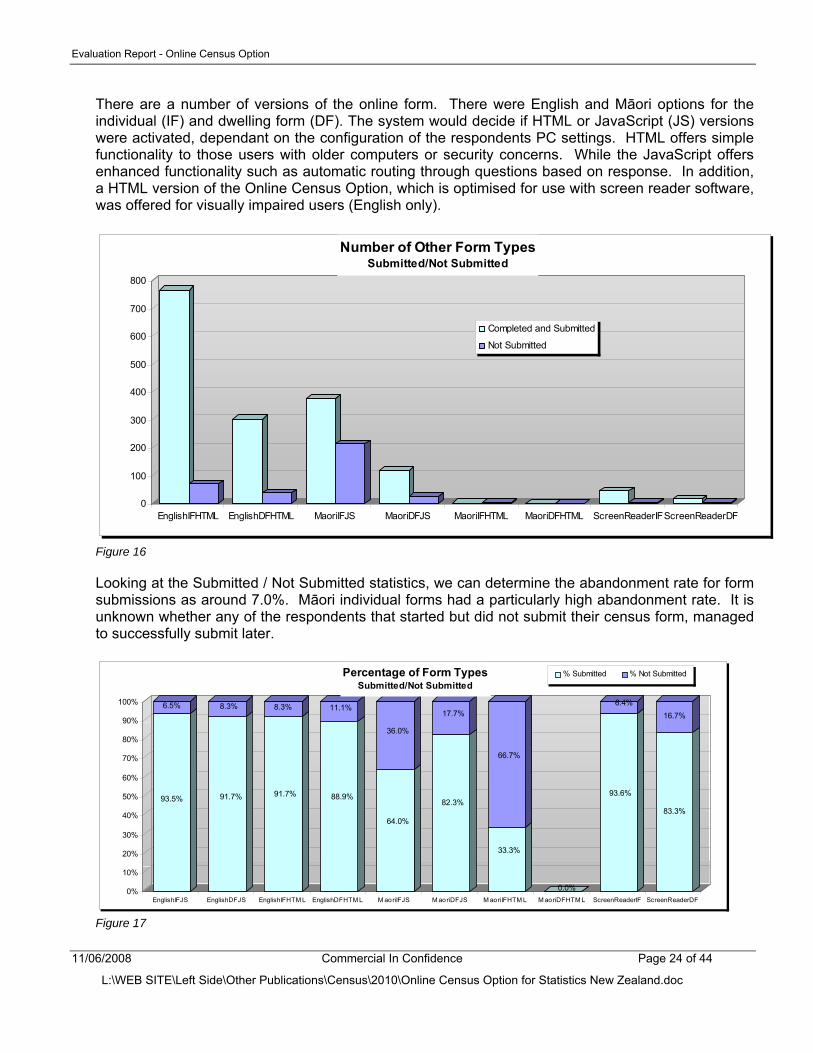
There are a number of versions of the online form. There were English and Māori options for the individual (IF) and dwelling form (DF). The system would decide if HTML or JavaScript (JS) versions were activated, dependant on the configuration of the respondents PC settings. HTML offers simple functionality to those users with older computers or security concerns. While the JavaScript offers enhanced functionality such as automatic routing through questions based on response. In addition, a HTML version of the Online Census Option, which is optimised for use with screen reader software, was offered for visually impaired users (English only).
0
100
200
300
400
500
600
700
800
EnglishIFHTML EnglishDFHTML MaoriIFJS MaoriDFJS MaoriIFHTML MaoriDFHTML ScreenReaderIFScreenReaderDF
Number of Other Form TypesSubmitted/Not Submitted
Completed and Submitted
Not Submitted
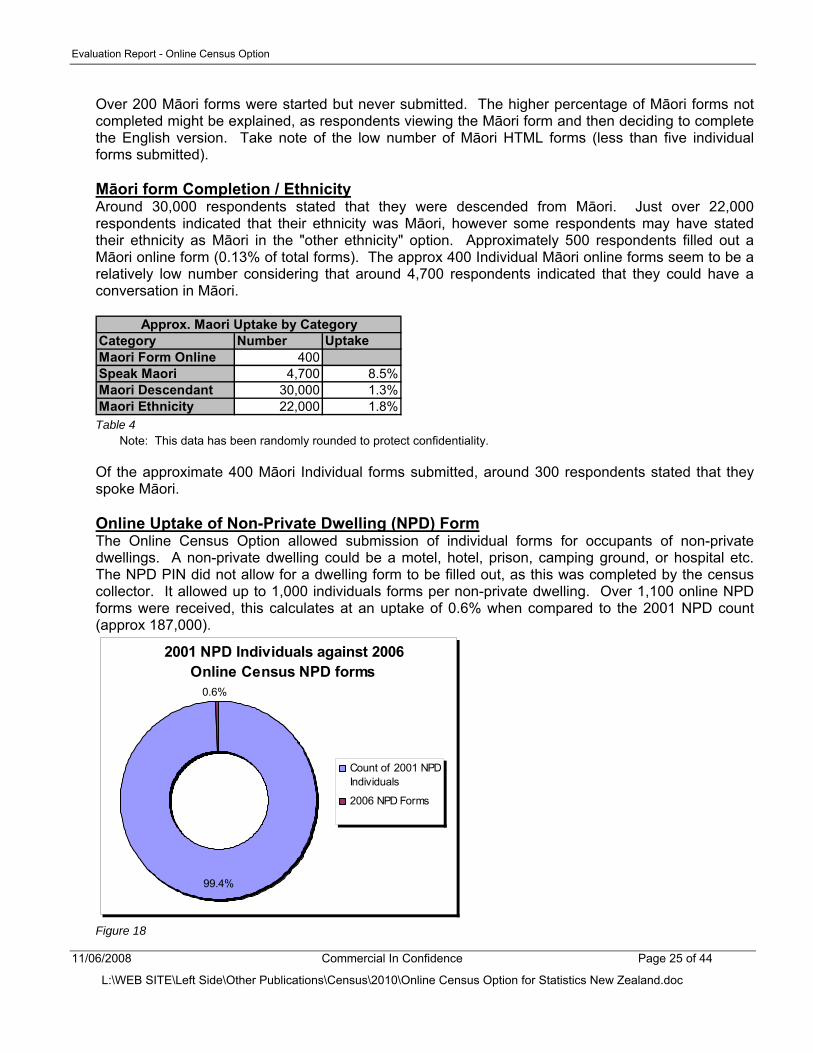
Figure 16 Looking at the Submitted / Not Submitted statistics, we can determine the abandonment rate for form submissions as around 7.0%. Māori individual forms had a particularly high abandonment rate. It is unknown whether any of the respondents that started but did not submit their census form, managed to successfully submit later.
93.5%
6.5%
91.7%
8.3%
91.7%
8.3%
88.9%
11.1%
64.0%
36.0%
82.3%
17.7%
33.3%
66.7%
0.0%
93.6%
6.4%
83.3%
16.7%
0%
10%
20%
30%
40%
50%
60%
70%
80%
90%
100%
EnglishIFJS EnglishDFJS EnglishIFHTM L EnglishDFHTM L M aoriIFJS M aoriDFJS M aoriIFHTM L M aoriDFHTM L ScreenReaderIF ScreenReaderDF
Percentage of Form TypesSubmitted/Not Submitted
% Submitted % Not Submitted
Figure 17
11/06/2008 Commercial In Confidence Page 24 of 44
L:\WEB SITE\Left Side\Other Publications\Census\2010\Online Census Option for Statistics New Zealand.doc
Evaluation Report - Online Census Option
Over 200 Māori forms were started but never submitted. The higher percentage of Māori forms not completed might be explained, as respondents viewing the Māori form and then deciding to complete the English version. Take note of the low number of Māori HTML forms (less than five individual forms submitted). Māori form Completion / Ethnicity Around 30,000 respondents stated that they were descended from Māori. Just over 22,000 respondents indicated that their ethnicity was Māori, however some respondents may have stated their ethnicity as Māori in the "other ethnicity" option. Approximately 500 respondents filled out a Māori online form (0.13% of total forms). The approx 400 Individual Māori online forms seem to be a relatively low number considering that around 4,700 respondents indicated that they could have a conversation in Māori.
Category Number UptakeMaori Form Online 400Speak Maori 4,700 8.5%Maori Descendant 30,000 1.3%Maori Ethnicity 22,000 1.8%
Approx. Maori Uptake by Category
Table 4
Note: This data has been randomly rounded to protect confidentiality.
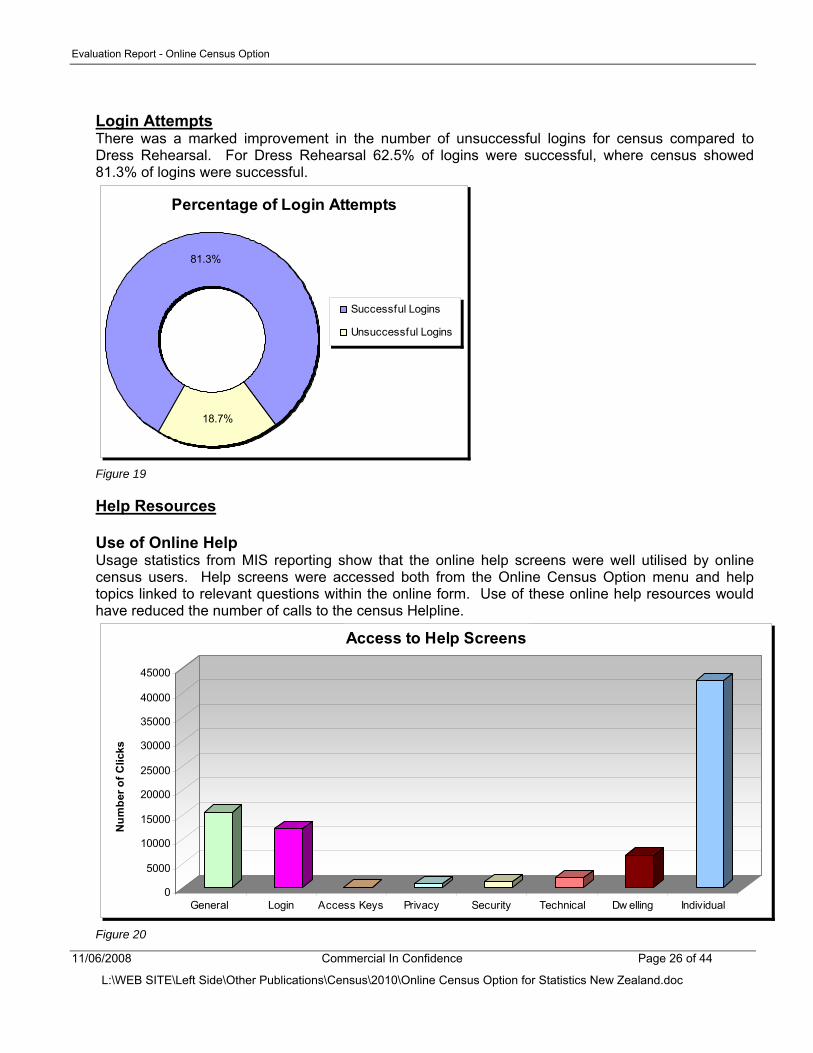
Of the approximate 400 Māori Individual forms submitted, around 300 respondents stated that they spoke Māori. Online Uptake of Non-Private Dwelling (NPD) Form The Online Census Option allowed submission of individual forms for occupants of non-private dwellings. A non-private dwelling could be a motel, hotel, prison, camping ground, or hospital etc. The NPD PIN did not allow for a dwelling form to be filled out, as this was completed by the census collector. It allowed up to 1,000 individuals forms per non-private dwelling. Over 1,100 online NPD forms were received, this calculates at an uptake of 0.6% when compared to the 2001 NPD count (approx 187,000).
2001 NPD Individuals against 2006 Online Census NPD forms
99.4%
0.6%
Count of 2001 NPDIndividuals
2006 NPD Forms
Figure 18
11/06/2008 Commercial In Confidence Page 25 of 44
L:\WEB SITE\Left Side\Other Publications\Census\2010\Online Census Option for Statistics New Zealand.doc
Evaluation Report - Online Census Option
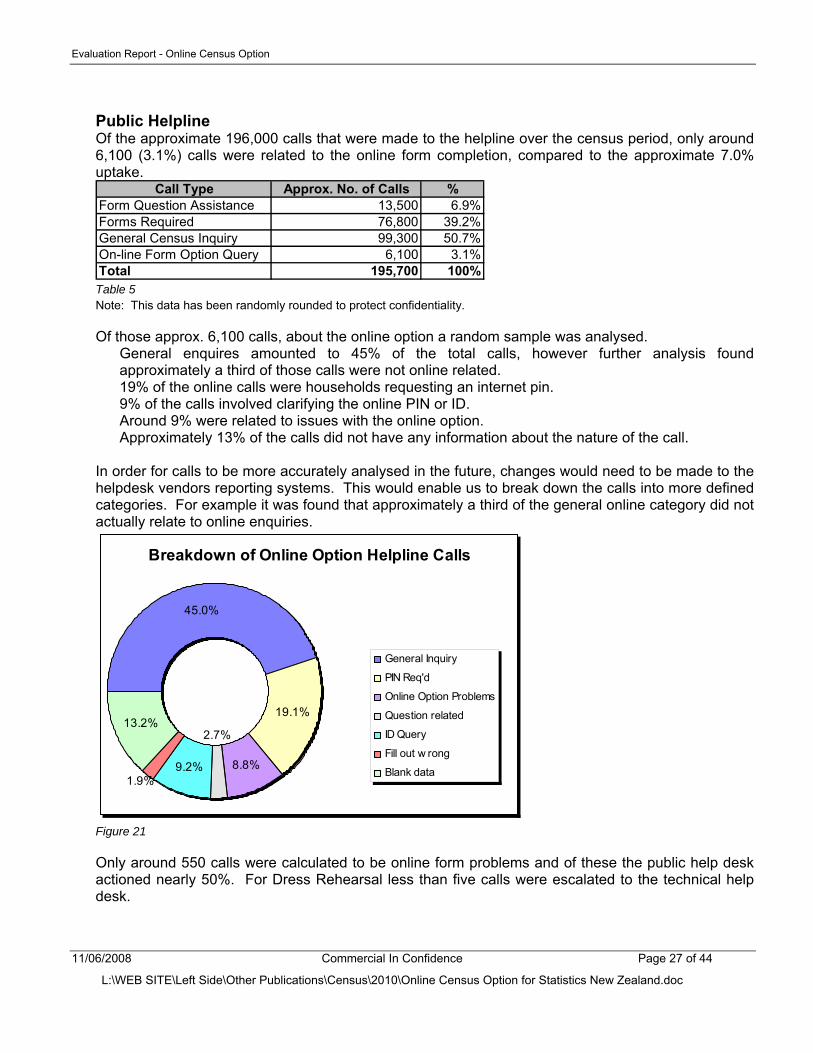
Login Attempts There was a marked improvement in the number of unsuccessful logins for census compared to Dress Rehearsal. For Dress Rehearsal 62.5% of logins were successful, where census showed 81.3% of logins were successful.
Percentage of Login Attempts
81.3%
18.7%
Successful Logins
Unsuccessful Logins
Figure 19 Help Resources Use of Online Help Usage statistics from MIS reporting show that the online help screens were well utilised by online census users. Help screens were accessed both from the Online Census Option menu and help topics linked to relevant questions within the online form. Use of these online help resources would have reduced the number of calls to the census Helpline.
0
5000
10000
15000
20000
25000
30000
35000
40000
45000
Num
ber o
f Clic
ks
General Login Access Keys Privacy Security Technical Dw elling Individual
Access to Help Screens
Figure 20
11/06/2008 Commercial In Confidence Page 26 of 44
L:\WEB SITE\Left Side\Other Publications\Census\2010\Online Census Option for Statistics New Zealand.doc
Evaluation Report - Online Census Option
Public Helpline Of the approximate 196,000 calls that were made to the helpline over the census period, only around 6,100 (3.1%) calls were related to the online form completion, compared to the approximate 7.0% uptake.
Call Type Approx. No. of Calls %Form Question Assistance 13,500 6.9%Forms Required 76,800 39.2%General Census Inquiry 99,300 50.7%On-line Form Option Query 6,100 3.1%Total 195,700 100% Table 5 Note: This data has been randomly rounded to protect confidentiality.
Of those approx. 6,100 calls, about the online option a random sample was analysed.
General enquires amounted to 45% of the total calls, however further analysis found approximately a third of those calls were not online related. 19% of the online calls were households requesting an internet pin. 9% of the calls involved clarifying the online PIN or ID. Around 9% were related to issues with the online option. Approximately 13% of the calls did not have any information about the nature of the call.
In order for calls to be more accurately analysed in the future, changes would need to be made to the helpdesk vendors reporting systems. This would enable us to break down the calls into more defined categories. For example it was found that approximately a third of the general online category did not actually relate to online enquiries.
Breakdown of Online Option Helpline Calls
45.0%
19.1%
8.8%9.2%1.9%
13.2%2.7%
General Inquiry
PIN Req'd
Online Option Problems
Question related
ID Query
Fill out w rong
Blank data
Figure 21 Only around 550 calls were calculated to be online form problems and of these the public help desk actioned nearly 50%. For Dress Rehearsal less than five calls were escalated to the technical help desk.
11/06/2008 Commercial In Confidence Page 27 of 44
L:\WEB SITE\Left Side\Other Publications\Census\2010\Online Census Option for Statistics New Zealand.doc
Evaluation Report - Online Census Option
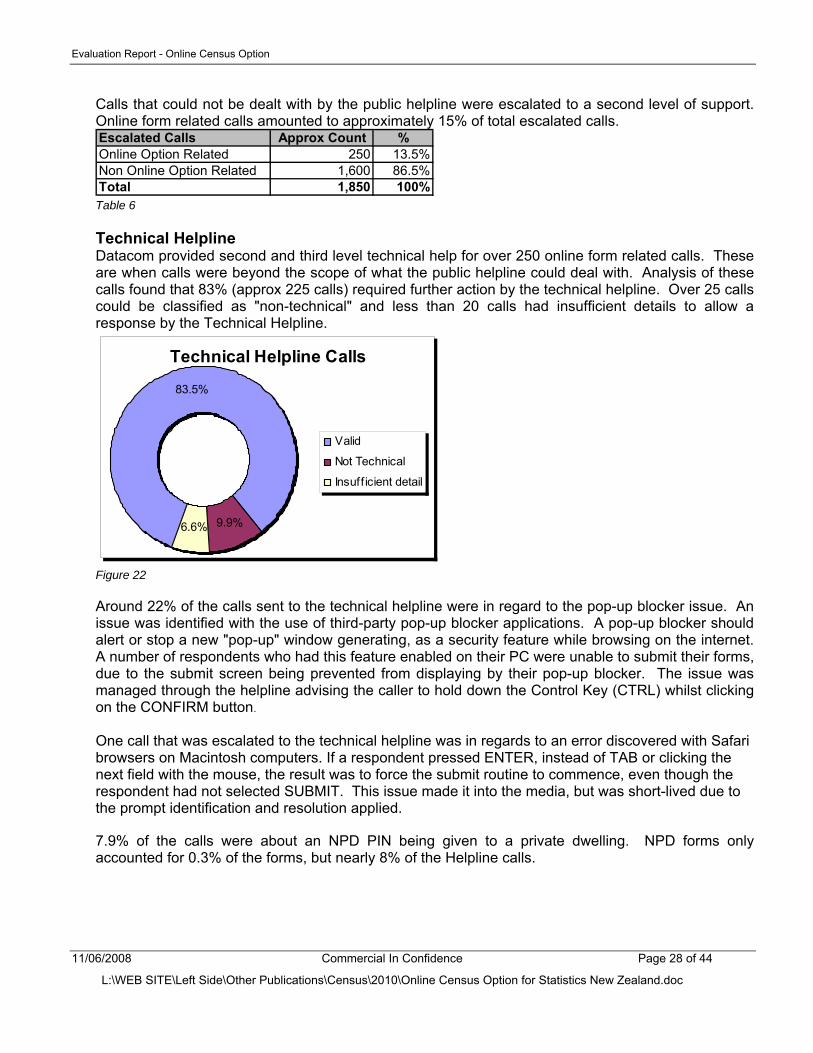
Calls that could not be dealt with by the public helpline were escalated to a second level of support. Online form related calls amounted to approximately 15% of total escalated calls. Escalated Calls Approx Count %Online Option Related 250 13.5%Non Online Option Related 1,600 86.5%Total 1,850 100% Table 6 Technical Helpline Datacom provided second and third level technical help for over 250 online form related calls. These are when calls were beyond the scope of what the public helpline could deal with. Analysis of these calls found that 83% (approx 225 calls) required further action by the technical helpline. Over 25 calls could be classified as "non-technical" and less than 20 calls had insufficient details to allow a response by the Technical Helpline.
Technical Helpline Calls
83.5%
9.9%6.6%
Valid
Not Technical
Insuff icient detail
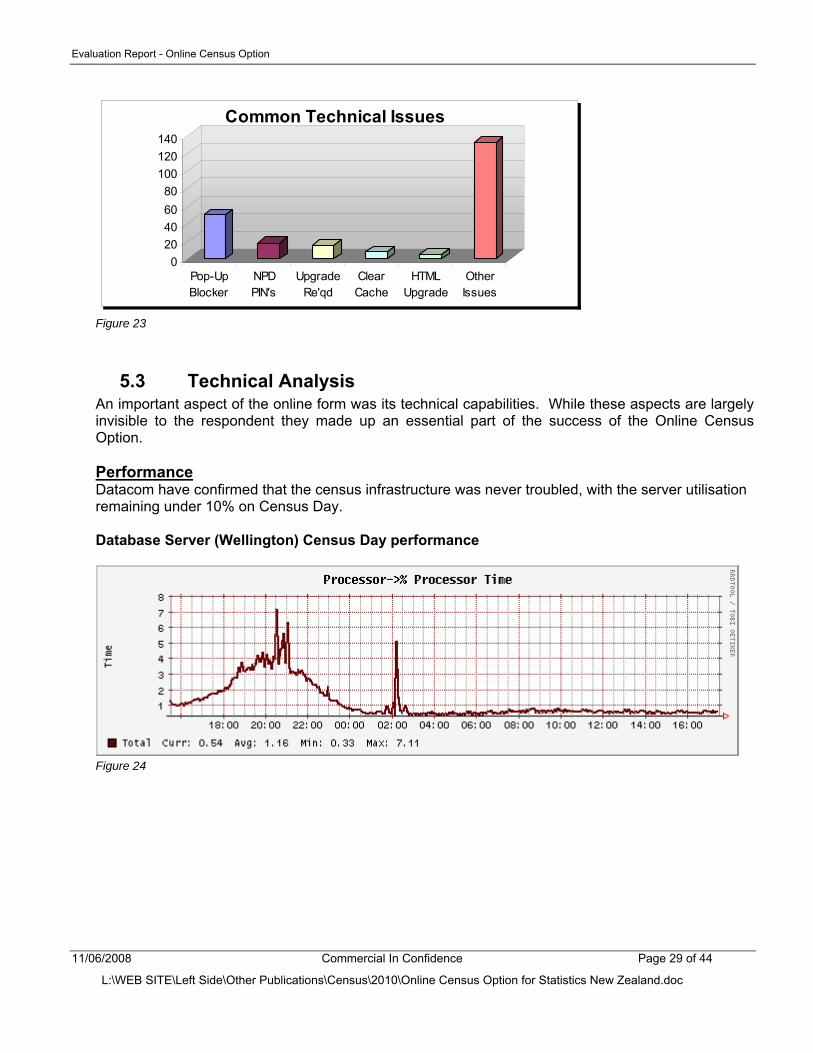
Figure 22 Around 22% of the calls sent to the technical helpline were in regard to the pop-up blocker issue. An issue was identified with the use of third-party pop-up blocker applications. A pop-up blocker should alert or stop a new "pop-up" window generating, as a security feature while browsing on the internet. A number of respondents who had this feature enabled on their PC were unable to submit their forms, due to the submit screen being prevented from displaying by their pop-up blocker. The issue was managed through the helpline advising the caller to hold down the Control Key (CTRL) whilst clicking on the CONFIRM button. One call that was escalated to the technical helpline was in regards to an error discovered with Safari browsers on Macintosh computers. If a respondent pressed ENTER, instead of TAB or clicking the next field with the mouse, the result was to force the submit routine to commence, even though the respondent had not selected SUBMIT. This issue made it into the media, but was short-lived due to the prompt identification and resolution applied. 7.9% of the calls were about an NPD PIN being given to a private dwelling. NPD forms only accounted for 0.3% of the forms, but nearly 8% of the Helpline calls.
11/06/2008 Commercial In Confidence Page 28 of 44
L:\WEB SITE\Left Side\Other Publications\Census\2010\Online Census Option for Statistics New Zealand.doc
Evaluation Report - Online Census Option
020406080
100120140
Pop-UpBlocker
NPDPIN's
UpgradeRe'qd
ClearCache
HTMLUpgrade
OtherIssues
Common Technical Issues
Figure 23
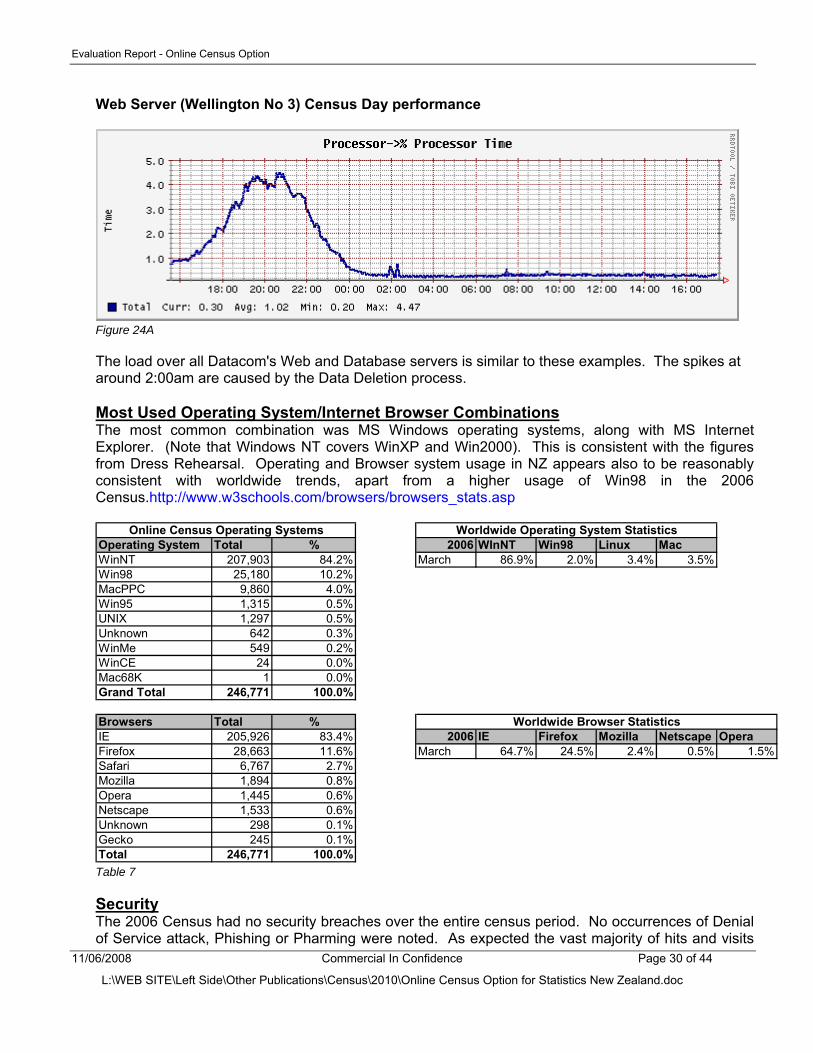
5.3 Technical Analysis An important aspect of the online form was its technical capabilities. While these aspects are largely invisible to the respondent they made up an essential part of the success of the Online Census Option. Performance Datacom have confirmed that the census infrastructure was never troubled, with the server utilisation remaining under 10% on Census Day. Database Server (Wellington) Census Day performance
Figure 24
11/06/2008 Commercial In Confidence Page 29 of 44
L:\WEB SITE\Left Side\Other Publications\Census\2010\Online Census Option for Statistics New Zealand.doc
Evaluation Report - Online Census Option
Web Server (Wellington No 3) Census Day performance
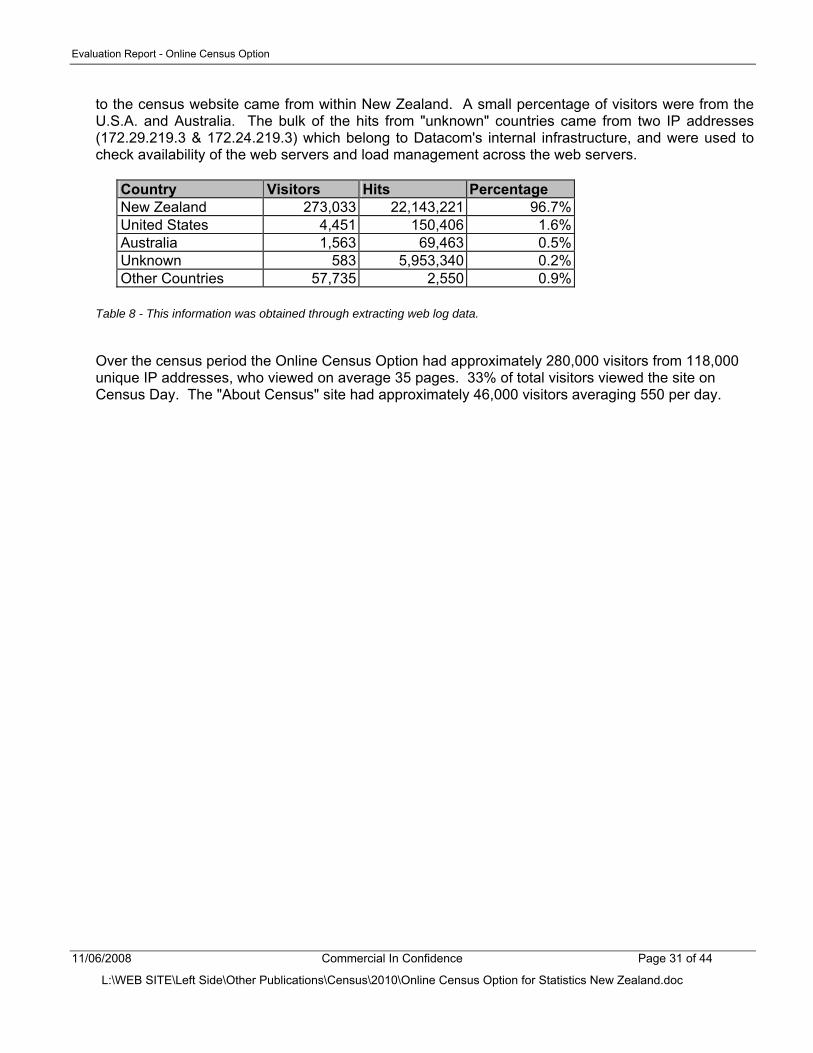
Figure 24A The load over all Datacom's Web and Database servers is similar to these examples. The spikes at around 2:00am are caused by the Data Deletion process. Most Used Operating System/Internet Browser Combinations The most common combination was MS Windows operating systems, along with MS Internet Explorer. (Note that Windows NT covers WinXP and Win2000). This is consistent with the figures from Dress Rehearsal. Operating and Browser system usage in NZ appears also to be reasonably consistent with worldwide trends, apart from a higher usage of Win98 in the 2006 Census.http://www.w3schools.com/browsers/browsers_stats.asp
Operating System Total % 2006 WInNT Win98 Linux MacWinNT 207,903 84.2% March 86.9% 2.0% 3.4% 3.5%Win98 25,180 10.2%MacPPC 9,860 4.0%Win95 1,315 0.5%UNIX 1,297 0.5%Unknown 642 0.3%WinMe 549 0.2%WinCE 24 0.0%Mac68K 1 0.0%Grand Total 246,771 100.0%
Browsers Total %IE 205,926 83.4% 2006 IE Firefox Mozilla Netscape OperaFirefox 28,663 11.6% March 64.7% 24.5% 2.4% 0.5% 1.5%Safari 6,767 2.7%Mozilla 1,894 0.8%Opera 1,445 0.6%Netscape 1,533 0.6%Unknown 298 0.1%Gecko 245 0.1%Total 246,771 100.0%
Online Census Operating Systems Worldwide Operating System Statistics
Worldwide Browser Statistics
Table 7 Security The 2006 Census had no security breaches over the entire census period. No occurrences of Denial of Service attack, Phishing or Pharming were noted. As expected the vast majority of hits and visits
11/06/2008 Commercial In Confidence Page 30 of 44
L:\WEB SITE\Left Side\Other Publications\Census\2010\Online Census Option for Statistics New Zealand.doc
Evaluation Report - Online Census Option
11/06/2008 Commercial In Confidence Page 31 of 44
L:\WEB SITE\Left Side\Other Publications\Census\2010\Online Census Option for Statistics New Zealand.doc
to the census website came from within New Zealand. A small percentage of visitors were from the U.S.A. and Australia. The bulk of the hits from "unknown" countries came from two IP addresses (172.29.219.3 & 172.24.219.3) which belong to Datacom's internal infrastructure, and were used to check availability of the web servers and load management across the web servers.
Country Visitors Hits Percentage New Zealand 273,033 22,143,221 96.7% United States 4,451 150,406 1.6% Australia 1,563 69,463 0.5% Unknown 583 5,953,340 0.2% Other Countries 57,735 2,550 0.9%
Table 8 - This information was obtained through extracting web log data. Over the census period the Online Census Option had approximately 280,000 visitors from 118,000 unique IP addresses, who viewed on average 35 pages. 33% of total visitors viewed the site on Census Day. The "About Census" site had approximately 46,000 visitors averaging 550 per day.
Evaluation Report - Online Census Option
11/06/2008 Commercial In Confidence Page 32 of 44
L:\WEB SITE\Left Side\Other Publications\Census\2010\Online Census Option for Statistics New Zealand.doc
5.4 Public Perception Press Coverage Related to the Online Census Overall press coverage was positive and well managed by respondent communications. Right first time - The New Zealand Listener "The online census form was easier to fill out than the paper version." Greater Risk of Virus - Greymouth Evening Star "Respondent wary of using JavaScript to fill out online form as may download a virus". Online census shows e-government here to stay - NZ Herald "Taking part in the inaugural online census on Tuesday was surprisingly pleasant." 2006 Census helpline probed - The Press - Related to Mac Safari issue. "Helpline worker told a Christchurch woman the census online form was causing major problems and should not have gone live." Online census Forms Trickle in - NZ InfoTech Weekly "Hundreds of people have already filled in their census forms online, ahead of the official Census Day of Tuesday week. Online debut for census expected to be a big hit - NZ Herald "The basic consensus among the Telco’s and internet providers is that an electronic form is fairly light use of the internet. Our web servers will be under pressure but we can manage the load." Online census prompts security warning - Computerworld "Statistics New Zealand will be providing tight security for the country’s first online census but warns that users will need to do their part if they want to ensure their data stays confidential." Census system overload but no data lost - Computerworld Related to Respondent Management System not online form however title may have misled public perception. Press Coverage not Related to the Census but may have Affected Uptake Demand for U2 tickets leads to overload This article was not related to the online census form. However it is about the perception that the U2 ticket website crashed. This could have had an effect on the uptake as people may have thought that the online census website may "crash" like the U2 website. Varsity website security fails - The Press Although this article is not related to the online form, uptake may have been affected as the public may have lost faith in website security. Staff Survey A Statistics NZ staff survey was carried out in order to get some preliminary results of whether respondents were offered an internet. Of the 389 respondents, 85% were offered the internet PIN and 11% were not offered the PIN. Ideally all households should have been offered the internet PIN which would have enabled them to complete their census forms online. 59% of respondents who were offered an internet PIN selected one.
Evaluation Report - Online Census Option
11/06/2008 Commercial In Confidence Page 33 of 44
L:\WEB SITE\Left Side\Other Publications\Census\2010\Online Census Option for Statistics New Zealand.doc
Research New Zealand Survey First Findings A phone based survey of public attitudes to the census was carried out by Research New Zealand with approximately 1,500 participants. The survey was run between 6 and 29 April 2006. The following interim findings were found in regards to the Online Census Option.
Awareness 74% of respondents stated that they were aware that this year, people had the option of filling out the census online. Of those respondents who said that they were aware of the online form, 66% reported that their household had been offered an internet PIN. 43% of respondents who stated that they were not aware of the online census, said that they would have filled out their census forms online if they had known that they could. 19% of respondents who were aware of the online form stated that someone in their household had taken an internet.
PIN Usage Only 200 respondents said that their household took a PIN, however 79% of these respondents said that someone in their household used the PIN to complete forms online.
Socio economic
There appears to be a relationship between household income and whether or not a household is offered a PIN. Respondents with a household income of $20,000 or less were significantly less likely to report that their household was offered a PIN. In comparison with households who had an income of $100,000 or more were significantly more likely to report being offered an internet PIN.
Ease of Use 97% of respondents who had personally filled out their form online reported that it was easy/very easy to do.
Security 47% of the total respondents stated that they were confident/very confident that only Statistics New Zealand staff can see their census forms in the internet.
Future 51% of respondents said that they were likely/very likely to fill out their census forms online in the future. Those respondents that said that they were unlikely/very unlikely to complete their census form online in the future because:
• Confidentiality or security reasons • They were used to or preferred paper forms • They didn't know how to use computers • They did not have computer access • They were not 'Internet savvy'.
Those respondents that said that they were likely/very likely to complete their census form online in the future because:
• Convenience • Beliefs that it would be very easy to do • No worries regarding when or how to return the forms (no need to
wait for them to be collected) • It would be less time consuming • No paperwork
Table 9
Evaluation Report - Online Census Option
11/06/2008 Commercial In Confidence Page 34 of 44
L:\WEB SITE\Left Side\Other Publications\Census\2010\Online Census Option for Statistics New Zealand.doc
Screen reader Accessibility Feedback We had approximately 60 forms submitted through the screen reader version of the online form. Comments from users of the screen reader version of the online form: • "The only problem we had was right at the very beginning. The nice census enumerators
did not read me the number on the top right of the form, just the PIN in the envelope." • "Presuming you could log in, there was nothing at all difficult about these forms. I filled out
most of it without going out of browser mode." • "A small number of people who attempted to use the form did have difficulties but they
themselves felt that this was as much to do with their own skills with using the internet and their screen-readers as it was to do with the form, and I do think this is borne out by the rest of the feedback we received in march."
• "The experience of filling out something like this on your own can be very rewarding and this one was certainly very empowering."
• "I would think the forms did comply with all the accessibility guidelines and in my view there was nothing at all that I found inaccessible."
• "It was not a problem to fill out our forms online and I did the three individual forms and the dwelling form all in one hour."
Mac Hall of Fame • The Online Census Option made the NZ Mac Community "Hall of Fame". "I suddenly
thought: But do they support Mac users? Do they what! The Census 2006 site is a shining example of a Mac Friendly website that becomes an instant "Hall of Fame-er"."
Blog Articles Found over the Census Period
Positive Feedback: • "It was very quick and easy, and the server was lightning fast and very responsive on
every page load. Well done Statistics NZ - its nice to see a web based system implemented so well. It was even very idiot proof, with auto capitalisation of certain codes, and auto-tabbing to successive input boxes once they were full. It was very intuitive & simple, and even the most interwebby-thing phobic people should have coped well with it."
• "It was a pleasant experience and I was impressed at all the usability and accessibility issues they’d thought through."
• "That was another example of a highly-responsive site despite high load." • I did mine on the internet, it's far easier to fill and understand than the paper form. It grey
out the area you don't need to fill in. • Absolutely agreed on the function and functionality of the census website too. Great
syntax and you wouldn't have known it was under load. Who did the work? •
Negative Feedback: • "The only problem here was that they wouldn't allow 2 people to do it at the same time -
said that there was already a session open using our details, and to wait 10 mins." • "I was not asked if I wanted to fill mine out online. I wasn't told it was an option." • "Strange and long website address". "Tabbing - the main form of navigation between form
fields on the web - was inconsistent and in some cases, simply broken. ...And a big blooper - on several steps the tab key would leap-frog over whole sections I'm sure I was meant to fill out (in once case it jumped over 20 questions!). The census was mad on pop-ups - pop-ups for error messages, pop-ups for the privacy policy, pop-ups for help, pop-ups for questions - it was pop-ups pop-ups pop-ups all over the place."
Evaluation Report - Online Census Option
11/06/2008 Commercial In Confidence Page 35 of 44
L:\WEB SITE\Left Side\Other Publications\Census\2010\Online Census Option for Statistics New Zealand.doc
• This one from one of our collectors - "The paper forms are also in case the whole thing crashes...which it will if everyone does theirs online on the 7 March (census night). That's why we tell everyone who wants the Online Census Option to do it early. ...If 1 million people tried to fill in their forms online on the 7th...it won’t happen. It will crash the server. The online census is a new thing and I don't think they realise how many people will actually do it online."
• "Well, I'd have to say that I'm less than impressed with the first attempt to complete census forms online. I figure that just about everyone here will have done theirs online - so how many had problems? All of the forms in our household were done online, and only the Dwelling form was received (and confirmation given) - neither of the personal forms was received, even though they were both completed, and these were done on two different systems, two different browsers, two different networks."
• "I was going to fill it in online but by the time I had flicked through the paper copy I thought, What’s the point firing up the comp when I can do it all right here with a pen?"
Computerworld Excellence Awards • The Online Census Option has been named as a finalist in the Computerworld Excellence
Awards 2006, under the category of "Excellence in the use of IT in Government".
6 What Worked Well
6.1 Online Census Option Uptake - The overall uptake for form submissions was above 7%. This was a little lower then expected considering that during the March 2005 Dress Rehearsal (when predominately low uptake areas were sampled) there was an uptake of 5.6%. In addition, a more geographically representative sample tested in November 2003, showed an uptake of around 16.5%. It was however above the 5% threshold and consequently gives credibility to lessons learned. Performance - Nearly 45% of the nearly 400,000 total forms were received on Census Day. Between 8:00pm and 10:00pm was when the most forms were received and the average user session was 26 minutes. No reports of delays in loading or completing the online forms were received. Security - During the census period there were no security breaches and no loss of data which proves that the online form was secure. This is a major achievement in the success of the Online Census Option. Availability - The online form was available 24 hours a day over the entire census period from 8:30am 17 February until midnight 31 March 2006. User Satisfaction - From the first findings of the Research New Zealand Survey it was found that 97% of respondents that were surveyed and had filled out the online form found it easy to do. Anecdotal evidence from internet blogs also suggests that the public who used the Online Census Option were more than satisfied with the experience.
Evaluation Report - Online Census Option
11/06/2008 Commercial In Confidence Page 36 of 44
L:\WEB SITE\Left Side\Other Publications\Census\2010\Online Census Option for Statistics New Zealand.doc
Text Alert - We had reliable up to date reporting of total form submissions during the census period in the form of text messages and emails, which were sent hourly to relevant census executives. This allowed reporting to be carried out as required. Additionally this system meant that any issues that occurred with the Census Data Store database could be highlighted immediately. Audit Trail - The system was designed so that if respondents claimed that they had filled out their census forms online it could be checked. By entering details from the respondent we could see if an Internet ID had ever been used, by checking whether a PIN had ever been linked to it. Access through the Census Data Store database allowed the identification of the number and type of forms that had been submitted. Usability - The Online Census Option rated highly on usability both from feedback and by e-Gov Watch (an external web consultancy organisation). http://www.e-govwatch.org.nz/results/census.html Data Deletion - Data deletion was in the main a successful process. The period of data deletion was extremely useful as it allowed a window when the application could be redeployed to fix the issue.
6.2 Help Resources
The addition of up to date census information in the associated "About Census" site and intuitive online help topics embedded in the questionnaire forms, appeared to reduce the number of calls to the census Helpline. Around 196,000 calls were put through to the help desk over the census period. Call volumes were managed quite easily meaning quality assistance could be given to those respondents with actual issues. Another valuable resource utilised by the helpdesk was the ID/PIN Validation application. During the Dress Rehearsal phase it was discovered that there was a need to be able to validate whether the respondents online form ID & PIN combination was both valid and previously unused within the Help desk environment. The application was developed by the IMS team and all our business requirements were met or exceeded. This meant that public helpdesk operators were able to efficiently use this system to maximise the number of users who could access the system. Without this tool the public helpdesk would have had to escalate these calls through to the Technical Helpline or Statistics NZ staff.
6.3 MIS Reporting MIS reporting during the Dress Rehearsal phase was not an automated process, with Datacom supplying us daily text files containing the information. For the 2006 Census the IMS team developed a MIS Reports application that would read the daily (and end of census) reports direct from the database, where they were posted. The application would extract the information out to MS Excel workbooks, ready for immediate manual formatting and publication. Therefore the quality and timeliness of these important reports were improved with this application.
Evaluation Report - Online Census Option
11/06/2008 Commercial In Confidence Page 37 of 44
L:\WEB SITE\Left Side\Other Publications\Census\2010\Online Census Option for Statistics New Zealand.doc
Unfortunately, for Census 2006 there was a small discrepancy between the number of forms actually submitted and the number reported in MIS.
7 Issues
7.1 External Issues (Issues evident to the Respondent)
Pop-up Blockers Summary - An issue was identified with the use of third-party pop-up blocker applications. A pop-up blocker should alert or stop a new "pop-up" window generating, as a security feature while browsing on the internet. A number of respondents who had this feature enabled on their computer were unable to submit their forms, due to the submit screen being prevented from displaying by their pop-up blocker. This issue was highlighted to us via the helpdesk on census night. Web log analysis has shown that there were around 100 (less than 0.1% of forms submitted) submit screens that did not load completely. This should reflect the number of times where this issue occurred. Resolution - The helpline were advised to tell the caller to hold down the Control Key (CTRL) whilst clicking on the CONFIRM button. This resolved the issue for most respondents. However, there were issues getting this information to all the helpline operators during the peak period. Impact - 22% of the calls sent to the technical helpline were related to the pop-up blocker issue. Lesson Learnt - If the issue had been discovered earlier, perhaps we could have requested a quick fix. This may have involved a text message beside the submit button that would have alerted the respondent if the submit screen did not come up, to hold down the CONTROL key while clicking SUBMIT. This way the information would have got through to the respondents without failure. For 2011 this issue needs to be reviewed. It may be that pop-up screens should be avoided Age Calculation Error Summary - An issue was identified on 23/02/06 in regards to routing for Question 20 of the Individual Form. Respondents who stated their age to be under 15 would be routed from question IF Q20 to the end of the form. An error occurred when the system calculated the respondent’s age from the input date of birth. Datacom state that the problem was caused by the month value being incorrectly parsed as an octal (base 8) number when it has a leading zero. The problem only occurred in the months of August and September in 1991, when a leading zero is specified in front of the month and in the JavaScript version of the application. As testing would have been undertaken around the cut-over point of 07/03/06, it would not have been expected to identify an issue some 5 to 6 months outside the scope. Resolution - The issue was resolved by adjusting to a base 10 calculation and implemented immediately. Impact - Given that Question 20 is central to the form routing, which determines whether or not the respondent needs to complete the rest of the form, this logic needed to be working correctly. This issue had a very minor effect on how the online census ran, as only one call went through to the Technical Helpdesk in regards to this issue. Lesson Learnt - For future reference it is essential that testing is done thoroughly to prevent unnecessary issues like this occurring.
Evaluation Report - Online Census Option
11/06/2008 Commercial In Confidence Page 38 of 44
L:\WEB SITE\Left Side\Other Publications\Census\2010\Online Census Option for Statistics New Zealand.doc
Age Routing Error Summary - In investigating the issue above, a second error was discovered regarding routing based on age. Routing for IF Q20 was based (in error) on the variable date of the day the form is filled in by the respondent. This date needed to be fixed to the date of census - 7 March 2006. Resolution - Datacom immediately amended the application by changing the validation date of the IF Q20 over/under 15 routing question to midnight 7 March 2006, so that anyone with a birth date of 7 March 1991 or earlier would be recognised as being over 15. Impact - Given that the Question 20 is central to the form routing, which determines whether or not the respondent needs to complete the rest of the form, this logic needed to be working correctly. This issue had a very minor effect on how the online census ran, as only one call went through to the Datacom in regards to this issue. Lesson Learnt - For future reference, it is essential that testing is done thoroughly to prevent unnecessary issues like this occurring. Navigation Issue within Safari Browser Summary - An error was discovered with Safari browsers on Macintosh computers where a respondent pressed ENTER, instead of TAB or clicking the next field with the mouse, on either the Individual or Dwelling forms. The result was to force the submit routine to commence, even though the respondent had not selected SUBMIT. Resolution - As an interim step to stop users from submitting forms inadvertently, Datacom immediately changed the application to send Safari users on the Mac down the HTML path. As a permanent fix of the solution, the application was updated the next day to handle an enter event on all text fields with the forms. Impact - This issue made it into the media, but was short-lived due to the prompt identification and resolution applied. Lesson Learnt - All combinations of operating systems and browsers need to be tested and that more focus should be applied to keyboard navigation. Keyboard Navigation Summary - In early February we found some issues with the keyboard navigation on browsers, other then Internet Explorer. This potentially affected about 15% of users. This issue was discovered because of the Mac Safari Navigation issue. Resolution - It was agreed that the risk of changing the system was too high and therefore these potential issues remained in the live system. Impact - No known impact on respondents however this issue was mentioned in a blog. http://www.zefamedia.co.nz/blog/2006/3/5/holding-the-online-census-to-account.html Lesson Learnt - Ensure that keyboard navigation across all browser types is thoroughly tested. Duplication of Online Individual Forms Summary – During the processing phase around 550 online forms were deleted from the input processing system due to duplication. While a number would have been duplicated against paper forms, a significant percentage were Individual Forms that were duplicated with another online form (around 250 forms or 64%). These forms were duplicated despite the Summary screen indicating that a form for the same individual had already been successfully submitted. Resolution - None Impact –Duplicate forms needed to be identified, manually analysed and then deleted during the processing phase. It was recognised early on in the project that it was easier to duplicate an online form than it was to duplicate a paper form.
Evaluation Report - Online Census Option
11/06/2008 Commercial In Confidence Page 39 of 44
L:\WEB SITE\Left Side\Other Publications\Census\2010\Online Census Option for Statistics New Zealand.doc
While the occurrence of this duplication was relatively low, it may have had an impact of respondent perception. Respondents will not realise that all responses are reconciled and duplicated responses deleted during our processing. They may feel their “extra” form(s) will corrupt our population data counts, therefore lessening the accuracy of the Census. Lesson Learnt – Despite our assumption that displaying the details of completed forms beside the links that initiated the creation of new forms would reduce the number of duplicated online forms, a reasonable number of respondents still managed to submit duplicated data. Thought may have to be given to adding a validation process that may warn the respondent if they attempt to submit a form with a similar name to one that has already been received - for that household. Alternatively the form initiation process could be enhanced to allow the respondent to select a particular name from a listing mapped from earlier input within the dwelling form. Availability of Internet PIN Summary - The online form option may not have been available to all respondents, as a PIN was not always offered on the doorstep. Resolution - None. Impact - Approximately 19% of online form related helpline calls were respondents requesting a PIN. Lesson Learnt - It has been suggested that each household could be given the internet PIN envelope in the 2011 Census. This would provide a number of benefits including; • easier delivery message for the collectors ("here is your census pack") • further reduce the number of calls to the helpline • increase the uptake percentage. If every household were provided with a PIN, then advertising could focus on the fact that responding online is an option that can be made at any time. Now that the risks of over stressing an unproven system have been satisfied, this delivery method appears to be a good option for 2011. NPD PIN Allocation Summary - An issue occurred where private dwellings were incorrectly allocated a NPD PIN which meant that they could not fill out a dwelling form online. For non-private dwellings a separate PIN was allocated, which did not allow for a dwelling form to be filled out. Resolution - None. Impact - 8% of calls that were directed to the technical helpline involved respondents being given a NPD PIN, when they were a private dwelling. A similar percentage of calls would have been handled by the public Helpline. Therefore a new private dwelling PIN had to be sent. Lesson Learnt - There were only approximately 1200 NPD submissions. For 2011 it needs to be assessed whether the NPD PIN is worth the extra load on collectors (both physically and in their delivery scripting) to manage the delivery of NPD PIN's. Trans-gender Summary - An issue was identified that affected trans-gender respondents when filling out the census online. If you stated that you are a male in question 3 of the JavaScript form, then question 25 (how many babies have you given birth to) was automatically greyed out. The issue was that the system routing assumed that only females can give birth, was proven to be incorrect. Resolution - No resolution during operational phase. The respondent was asked to fill out their form on paper. Impact - As far as we are aware this issue only affected one respondent. Lesson Learnt - When designing the 2011 online census form, this issue needs to be considered.
Evaluation Report - Online Census Option
11/06/2008 Commercial In Confidence Page 40 of 44
L:\WEB SITE\Left Side\Other Publications\Census\2010\Online Census Option for Statistics New Zealand.doc
Display of Street Number and Flat in Online Census Option Summary Summary - A problem occurred with the way that the street number and flat number of the dwelling form was shown in the summary on the online form. For example if "2" was input into the Street field and "A" in the Flat Number, then the summary displayed as 157/A South Street. (Correct) But, if the respondent input "2" as the Street Number and "5" as the Flat number, it displayed as 2/5 South Street (being number 2 South Street /Flat 5) - which was potentially confusing. Resolution - We did not alter the display of the street and flat name. Output data was not affected because flat number was not taken through to processing. Impact - This was raised through the public helpdesk, but should not have had impact on output data. Lesson Learnt - It should be noted when developing 2011 Census online form that people have expectations about how their address is displayed.
7.2 Internal Issues (Issues not evident to the Respondent)
Processing of Street Number and Flat Number Summary - When processing the online census data it was discovered that the Street Number and Flat number information were difficult to ascertain. Within the raw online census data stored for processing, the Street, Flat, Street name, Suburb, City and Country information is stored as a text string with each component separated by a comma. However, during processing these commas are stripped out meaning that it became hard to ascertain were the street number ended and the flat number started. For example, if a respondent input 22 South Street, Flat 5, it would be displayed in processing as 225 South Street. The processing team could not ascertain whether it was 2 South, Flat 25, 225 South or 22 South, Flat 5. Resolution - This issue was resolved by removing the Flat Number information from the data selected for processing, as the flat number was not required to validate the address details. The adjusted data was then correctly reprocessed. Impact - The application that takes the internet raw data through to processing had to be modified. Lesson Learnt - The raw data should be separated by a non-standard character (not a comma). MIS Reporting Summary - There is approximately a small discrepancy (less than 0.1%) between the number of forms actually submitted and the number reported in MIS. Resolution - None. Impact - This has meant that the MIS analysis that we have carried out is not entirely in-line with actual data. Lesson Learnt - Specify with the vendor that the management information needs to be accurate. Datacom's Website Availability Check Routine Summary - Datacom ran a "Website Availability Check Routine" approximately every 2 minutes over their 8 web servers. There was a 2 hour period for data deletion where only one Data Centre was operational, therefore the adjustment was halved. The issue was that Datacom could not provide us with the exact number of logins that occurred. Resolution - No resolution as could not alter the "Website Availability Check Routine" once operational phase had begun. Impact - This meant our MIS reporting had to be manually adjusted and therefore was not totally accurate (in this area).
Evaluation Report - Online Census Option
11/06/2008 Commercial In Confidence Page 41 of 44
L:\WEB SITE\Left Side\Other Publications\Census\2010\Online Census Option for Statistics New Zealand.doc
Lesson Learnt - To rectify for the 2011 Census, it needs to be stated in our requirements to Datacom that we need exact number of logins. Daylight Savings Summary - No MIS report was available for 19/03/06, due to daylight savings adjustments. Turning the clocks back one hour for daylight savings time resulted in a negative session length being calculated for respondents who logged on (and remained logged on) in the hour proceeding the clock change. Resolution - Datacom resolved this issue on the Monday 20/03. Impact - This issue had no impact on respondent use of the online form. The only impact was that we did not get 19/03/06 MIS report until the afternoon of 20/03. Lesson Learnt - Daylight savings needs to be allowed for when providing MIS reports. Processing Person Numbers Summary - Person numbers are used to reconcile the number of Individual forms against the number of occupants stated on the Dwelling form. For paper forms, the collector will add a sequential person number to each of the Individual forms received over the doorstep, to correspond with the order of occupants from the Dwelling form. Mail back forms are treated in the same way. Online forms are automatically allocated a person number based on the date and time they are submitted. This means that there could be a discrepancy between the order of the occupants from the Dwelling form and the person number order of the Individual Forms. Resolution - This issue was identified during processing of the Dress Rehearsal forms and a process was proposed to re-align the IF person numbers to match the DF occupants, based on the respective names. However this proposal was rejected due to priority of other changes required. Impact - The impact of having to manually align the IF person numbers to the DF form has been felt by the processing teams, with around 50% of the online forms having to be adjusted. The reasonably low uptake meant that this was a relatively small issue. Lesson Learnt - It would be proposed that this automatic alignment of person numbers would be included for the 2011 Census.
8 Resource Savings
Significant resource savings can be expected for 2011 and beyond, in terms of materials, personnel and processing time, a result of deploying the Online Census Option.
8.1 Less Paper Forms Printed Potential savings - There may be future potential to print fewer forms relative to uptake shown for the previous census. Respondents that indicate that they want to complete their census online may not be given a complete set of paper forms. Options could be to give them no forms or a single individual and dwelling form per household. If no forms were given we would have to look at alternative ways to distribute the Internet ID. Potential risks - Printing less forms means a greater risk that there are not enough forms to distribute. Forms not available in the household could mean an increase demand on helpline resources. An initial decision made to fill out online, may change due to numerous factors e.g.
Evaluation Report - Online Census Option
11/06/2008 Commercial In Confidence Page 42 of 44
L:\WEB SITE\Left Side\Other Publications\Census\2010\Online Census Option for Statistics New Zealand.doc
negative media of online security, respondents change their mind about wanting to fill out the census online. Not distributing forms may be perceived negatively by respondents as diminished service.
8.2 Savings on Processing Potential savings - Online forms do not need to be scanned or smart key processed (repair of unreadable scanned characters). A 30 second time saving per household for online forms, results in an approximate saving of 116 man days. Also Māori online forms do not go through bilingual repair (collating answers from Māori and English combined form). These factors would result in significant savings in the areas of personnel, hardware and time. Potential risks - Online uptake is another variable that could impact the risk of over or under estimating processing resources required. There is also a risk that the online data quality is not to the required standard. However this risk should have been mitigated by the successful processing of 2006 online data.
8.3 Storage of Paper Forms Potential savings - A significant part of the resource exposure is storage of the paper forms after printing, before distribution to respondents, after collection, during processing and during archiving period. Storage resources would include storage space, transportation of forms and handling. With more online responses, less space is required to store paper forms. Potential risks - Risks for the electronic data appear to relate to the archiving project. Current requirements state that census forms must be held for 100 years. Without this requirement there would be no need to retain the raw data from the online responses, as these responses are included as part of the total census electronic data set. Storing the online data electronically creates a risk that in a number of years time it may not be able to be retrieved. Storing online data on paper reduces the cost benefit of collecting the data electronically.
8.4 Distribution of Forms Potential savings - By identifying households who indicate they would complete their form online, fewer resources would be required to distribute the forms. Households who indicate they will complete online would not require a "collector" to deliver census forms. Identification of households who wish to complete online would possibly require registration prior to census. Potential risks - There is risk of respondents changing their mind, meaning that they would not have the option to fill out the census on paper. Creating a new process to accept the pre-registration creates its own risks and would require additional resources.
8.5 Collection of Forms Potential savings - Households who complete all their census forms online do not require a collector to visit. The higher the uptake the fewer resources required for this collection phase.
Evaluation Report - Online Census Option
11/06/2008 Commercial In Confidence Page 43 of 44
L:\WEB SITE\Left Side\Other Publications\Census\2010\Online Census Option for Statistics New Zealand.doc
Potential risks - The Respondent Management System must continue to advise field staff of online completion efficiently, to avoid unnecessary collector visits.
8.6 Distribute an Internet PIN to Every Household Potential savings - In the 2006 Census internet PIN's were printed for 1.25 million private households (approximately 80%) and 300,000 non-private dwellings. However PIN's were not offered to every household, resulting in a surplus of unused PIN's. By distributing a PIN to every household we maximise the potential of return of the investment of printing the PIN's. In the interim results of the Research New Zealand post census survey 34% indicated that their household had not been offered an internet PIN. Respondents who were not offered a PIN could have called the help desk and requested one to be delivered to them. Approximately 19% of online form related helpline calls were PIN requests. By distributing a PIN to every household we also minimise calls to the helpline regarding respondents needing a PIN. Potential risks - Printing a PIN for every household is an additional cost. However for the 2006 Census it would have only cost approximately $30,000 more to print enough PIN's for every household.
Evaluation Report - Online Census Option
11/06/2008 Commercial In Confidence Page 44 of 44
L:\WEB SITE\Left Side\Other Publications\Census\2010\Online Census Option for Statistics New Zealand.doc
9 Summary of Key Recommendations
Recommendations Provide an online option for the 2011 Census. Consider actively promoting the online option. Consider distributing an internet PIN to every household. Consider allowing households to register their wish to complete online prior to census. Consider printing fewer forms for respective districts relative to uptake shown for the previous census. Ensure testing includes criteria to satisfy particular routing and validation circumstances. Review the use of online option for NPD's. Ensure third party applications (pop-up blockers) are considered in development of the form. Street Number and Flat number raw data should be separated by a non-standard character. Ensure keyboard navigation is considered over a wide range of browsers. Automatic alignment of the IF person numbers to match the DF occupants, based on the respective names. Specify with the vendor that the management information needs to be accurate. Daylight savings needs to be allowed for when providing MIS reports. Consider respondents expectations about how their address should be displayed when designing the summary page. Helpdesk vendor to have more defined categories to classify calls. Ensure respondents are reminded to revert to their original PC configuration. Consider trans-gender respondents when designing form routing.
Table 10
10 Conclusion
Through the knowledge we have gained from the 2006 Census, we have built capability for the 2011 Census and beyond. This was the first time that we have offered an Online Census Option and respondent behaviour was unknown. Success can be measured from the fact that the respondents’ online census data remained secure throughout the collection process. There were no performance issues in loading or submitting the forms. Feedback shows us that the majority of online census users were more than satisfied how easy it was to complete their forms online. With the satisfaction of the above criteria and an uptake of above 7%, the online option project was a success. With this success, we can proceed with more knowledge and confidence. This will allow Statistics New Zealand to move forward with planning an online option in 2011, with a focus on reducing costs and freeing valuable resources. Therefore with the success of the online option for the 2006 Census it is recommend that in 2011 an online option is offered again and actively promoted.


![CAYMAN ISLANDS - assets.kpmg€¦ · Cayman Islands CRS Guidance Notes Version 2.0 Release Date: [] March 2017 4 F. The Cayman Islands Competent Authority The Cayman Islands Competent](https://img.pdfslide.us/doc/110x75/5f63986e8b3dfd5eb1349e01/cayman-islands-cayman-islands-crs-guidance-notes-version-20-release-date-.jpg)