Embed Size (px)
Citation preview

Evaluation of Written Prescription Information Provided in Community
Pharmacies: A National Study
Bonnie L. Svarstad, Ph.D.
Jeanine K. Mount, Ph.D. and R.Ph.
University of Wisconsin - Madison

Study done in cooperation with...
• FDA• National Association of Boards of Pharmacy • National expert panel

National Expert Panel
• 16 experts• Nominated by seven pharmacy organizations• Pharmacy practitioners and experts in
pharmacotherapy and communications • Faculty at 9 pharmacy colleges and universities

Panelists• Mary Amato
• Heidi Anderson-Harper
• Robert Beardsley
• C. A. Bond
• Marie Gardner
• Betty Dong
• Carole Kimberlin
• Duane Kirking
• Sharlea Leatherwood
• Matt Osterhaus
• Anthony Provenzano
• Mary Pubentz
• Betsy Sleath
• Jenene Spencer
• Judith Sommers Hanson
• Gayle Dichter
• Bonnie Svarstad, Chair
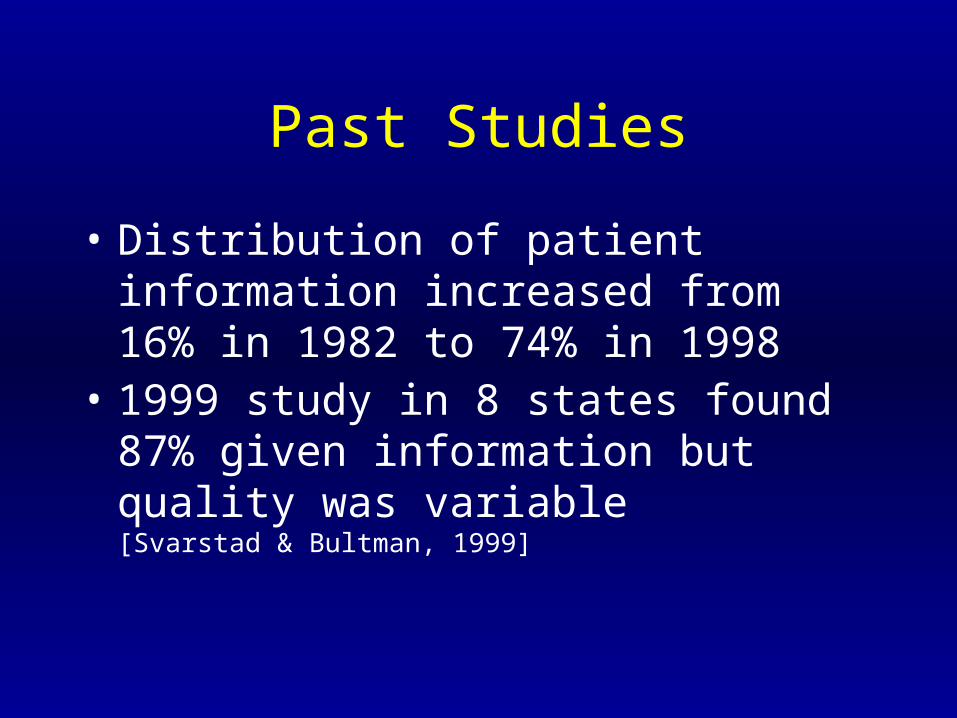
Past Studies
• Distribution of patient information increased from 16% in 1982 to 74% in 1998
• 1999 study in 8 states found 87% given information but quality was variable
[Svarstad & Bultman, 1999]
How does this study differ?
• Pharmacies sampled from national list
• Professional shoppers visited pharmacies
• Experts and consumers rated information
• Additional analyses performed
Primary Aims of Study • What percent of patients are given written
prescription information?
• How do experts rate this information?
• How do consumers rate this information?
• How well does information adhere to criteria for useful medication information?
Secondary Aims of Study
• How do expert/consumer ratings compare?
• Do ratings vary by consumer background?
• Do ratings vary by pharmacy type?
• Do ratings vary by leaflet characteristics?

Objectives for Today
• Review study design and procedures
• Review evaluation criteria and forms
• Present results:- Leaflet distribution and ratings
- Factors that might influence ratings

Study Design
• Shoppers acting as patients presented four prescriptions at each pharmacy
• Patient information leaflets mailed to UW
• Expert panelists rated leaflets
• Consumer panelists rated leaflets
• Rating forms mailed to UW for analysis
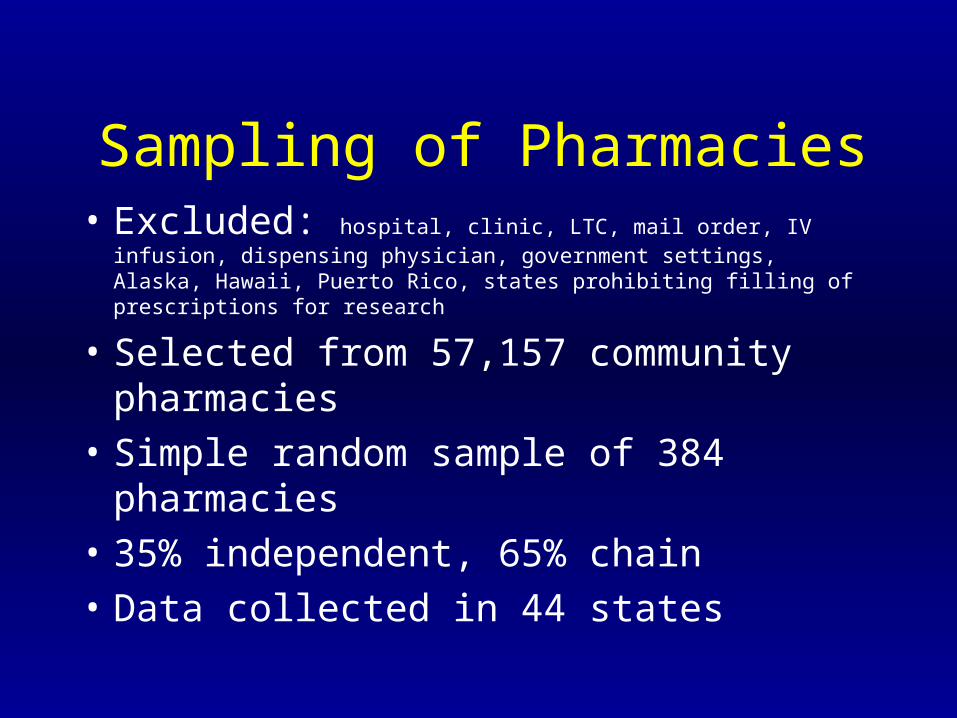
Sampling of Pharmacies
• Excluded: hospital, clinic, LTC, mail order, IV infusion, dispensing physician, government settings, Alaska, Hawaii, Puerto Rico, states prohibiting filling of prescriptions for research
• Selected from 57,157 community pharmacies
• Simple random sample of 384 pharmacies
• 35% independent, 65% chain
• Data collected in 44 states
Observer Protocol
• Shoppers hired by professional shopper firm
• 72% of visits by females
• 66% of visits by persons 45 years or older
• Mean age = 50
Standard Scenario
• Presented new prescriptions for atenolol, glyburide, atorvastatin, nitroglycerin SL
• Did not ask questions or initiate talk
• If asked, patient-observer reported:- new diagnoses: heart disease,
diabetes - no prior use of study drugs
Observer Protocol (cont.)
• Shopper mailed materials to shopper firm
• Firm removed pharmacy/pharmacist names
• All leaflets, brochures, other information items mailed to researchers
• All items referred to as “leaflets”
Expert Evaluation Forms
• Each form included 8 general criteria and 62-63 sub-criteria
• Eight criteria from 1996 Action Plan for “useful” information
• Sub-criteria based on approved labeling
• Forms revised until all panelists approved
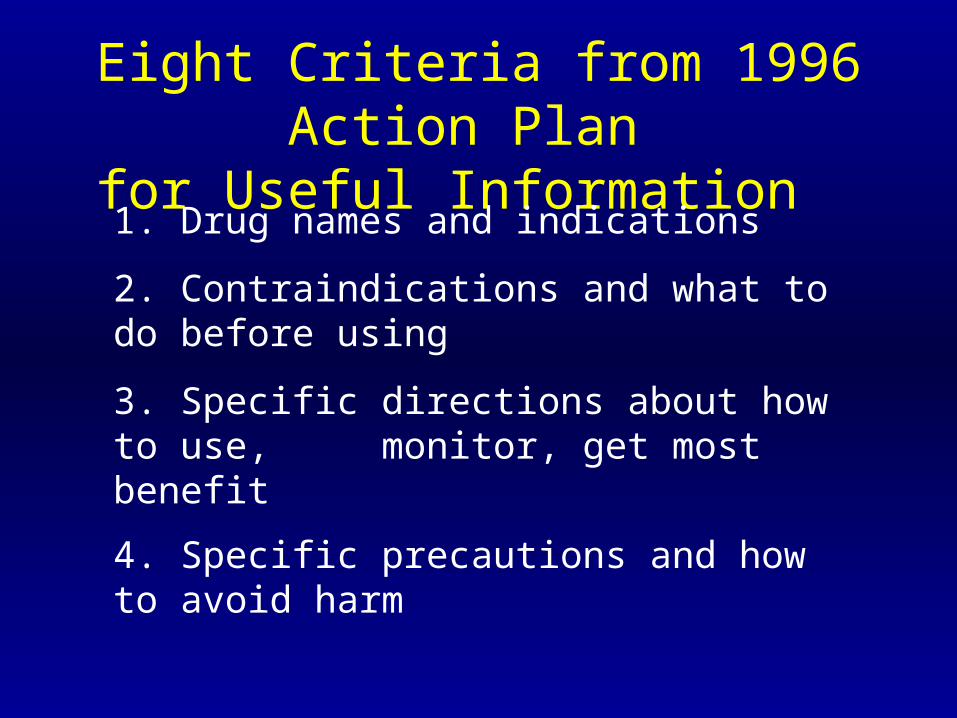
Eight Criteria from 1996 Action Plan
for Useful Information 1. Drug names and indications
2. Contraindications and what to do before using
3. Specific directions about how to use, monitor, get most benefit
4. Specific precautions and how to avoid harm
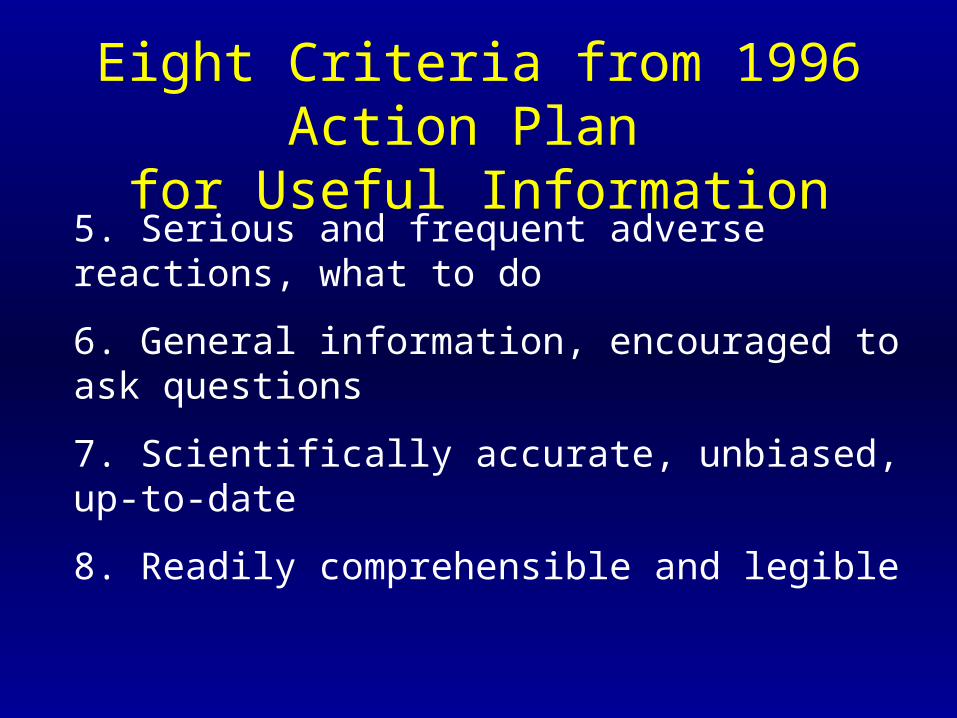
Eight Criteria from 1996 Action Plan
for Useful Information5. Serious and frequent adverse reactions, what to do
6. General information, encouraged to ask questions
7. Scientifically accurate, unbiased, up-to-date
8. Readily comprehensible and legible
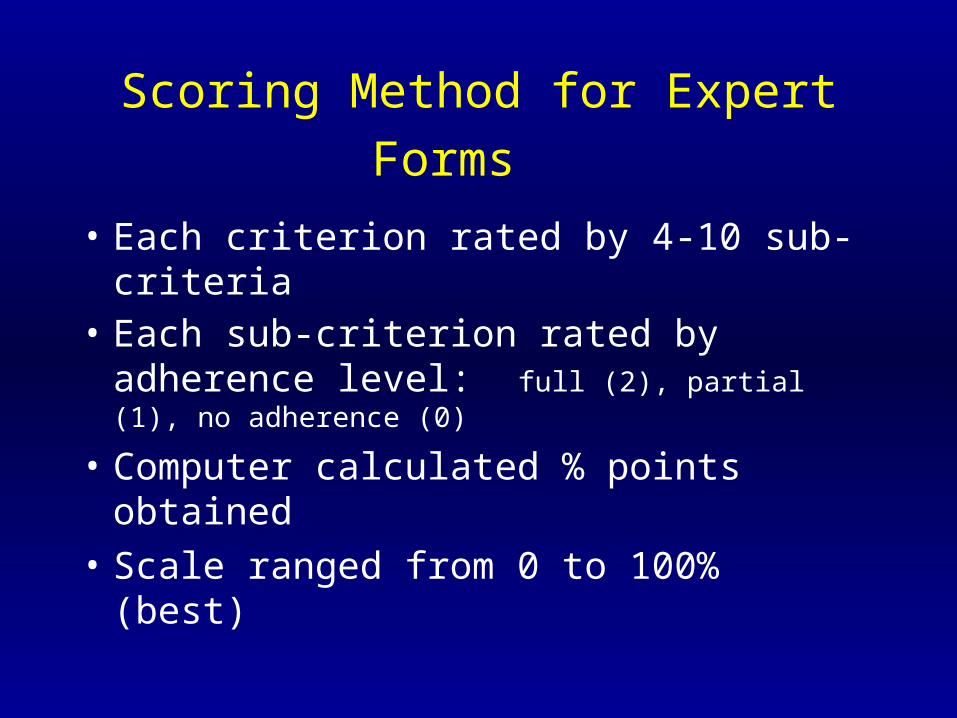
Scoring Method for Expert Forms
• Each criterion rated by 4-10 sub-criteria • Each sub-criterion rated by adherence level:
full (2), partial (1), no adherence (0)
• Computer calculated % points obtained
• Scale ranged from 0 to 100% (best)
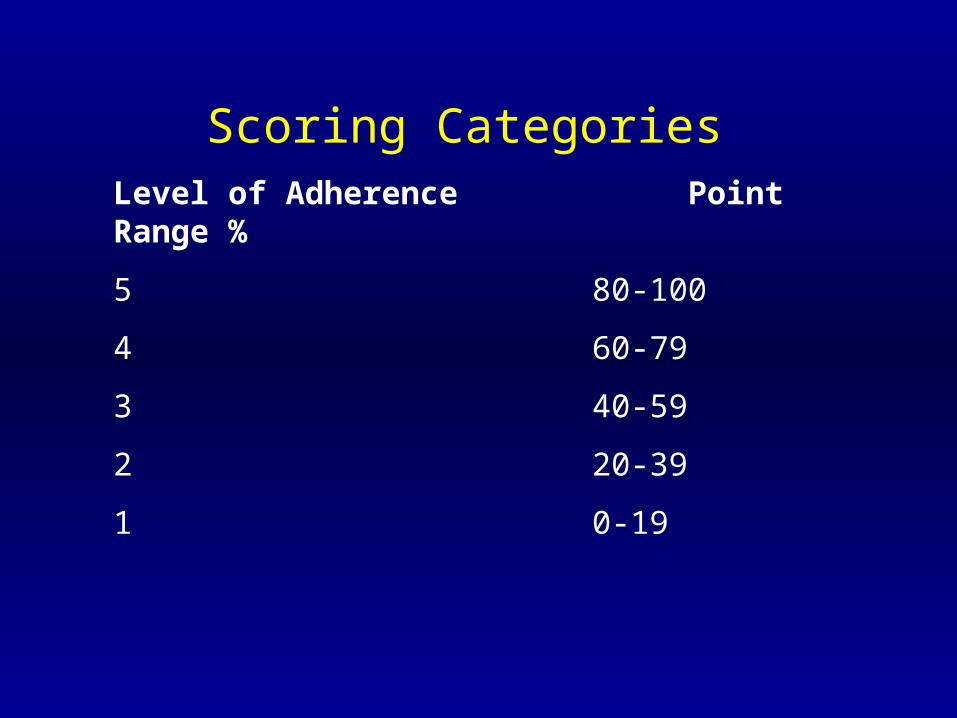
Scoring Categories Level of Adherence Point Range %
5 80-100
4 60-79
3 40-59
2 20-39
1 0-19
Inter-rater Reliability
• Experts assigned to one of four drug groups
• Independently rated same sub-set of leaflets
• Good inter-rater reliability obtained
• Pearson r for overall adherence = 0.90-0.97
Expert Rating Process
• Each expert assigned to one of four drugs
• Each leaflet rated by one expert
• Experts rated 1,367 pharmacy-generated leaflets and 31 manufacturer-generated leaflets (mean = 87 per expert)

Consumer Evaluation Form
• 1-page form with 12 items
• Based on 1996 Action Plan and Krass et al
• Items scored 1 (poor) to 5 (good)
• Overall scale ranged from 0 - 100% (best)

Scoring Categories for Consumer Form Level of Adherence Point Range %
5 80-100
4 60-79
3 40-59
2 20-39
1 0-19
Three Legibility Items
• Poor-good print size
• Poor-good print quality
• Poor-good spacing between lines
Six Comprehensibility Items
• Poorly-well organized
• Poor-good length
• Unclear-clear
• Unhelpful-helpful
• Incomplete-complete
• Hard-easy to find important information
Three Summary Items
• Hard-easy to read
• Hard-easy to understand
• Not useful-useful
Test-Retest Reliability
• Nine consumers independently rated 18 leaflets at two sessions
• Good test-retest reliability obtained
• Pearson r for overall score = 0.82
Consumer Rating Process
• Recruited 154 consumer raters in 11 states
• Recruited at senior centers, clinics, work and social organizations
• Facilitator met with 8-15 raters per session
• Each rater independently rated ~ 10 leaflets
Rater Characteristics
• Mean age = 61 yrs (20-89 yrs)
• 68% female, 89% white
• 77% used medication daily
• 8% not completed high school, 38% completed high school, 54% beyond h.s.
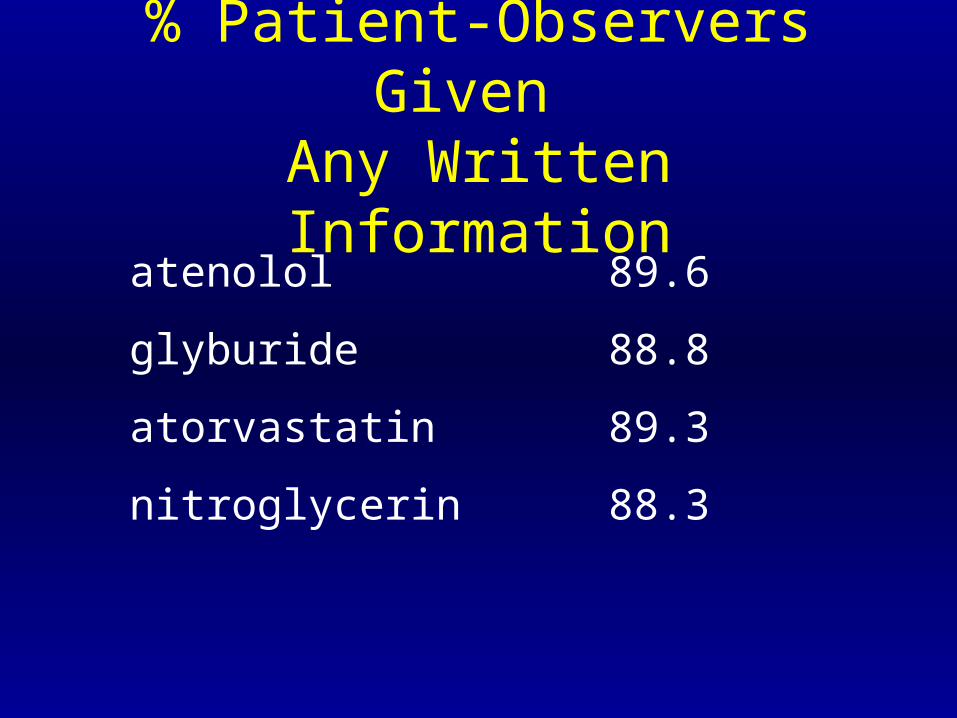
% Patient-Observers Given Any Written Information
atenolol 89.6
glyburide 88.8
atorvastatin 89.3
nitroglycerin 88.3
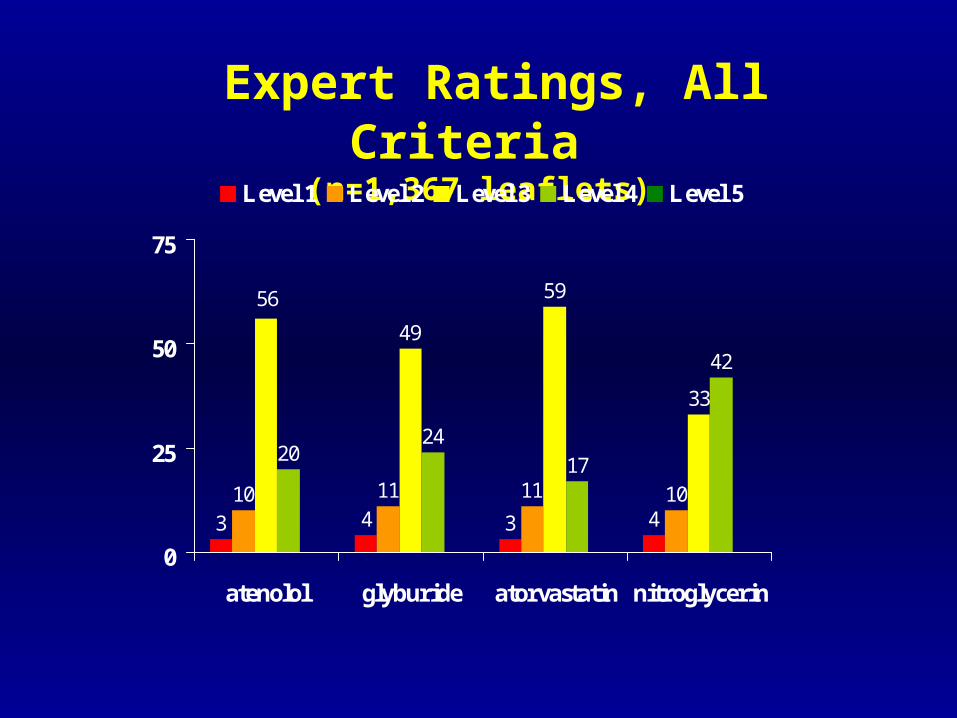
Expert Ratings, All Criteria (n=1,367 leaflets)
3 4 3 410 11 11 10
33
2024
17
42
59
49
56
0
25
50
75
atenolol glyburide atorvastatin nitroglycerin
Level 1 Level 2 Level 3 Level 4 Level 5
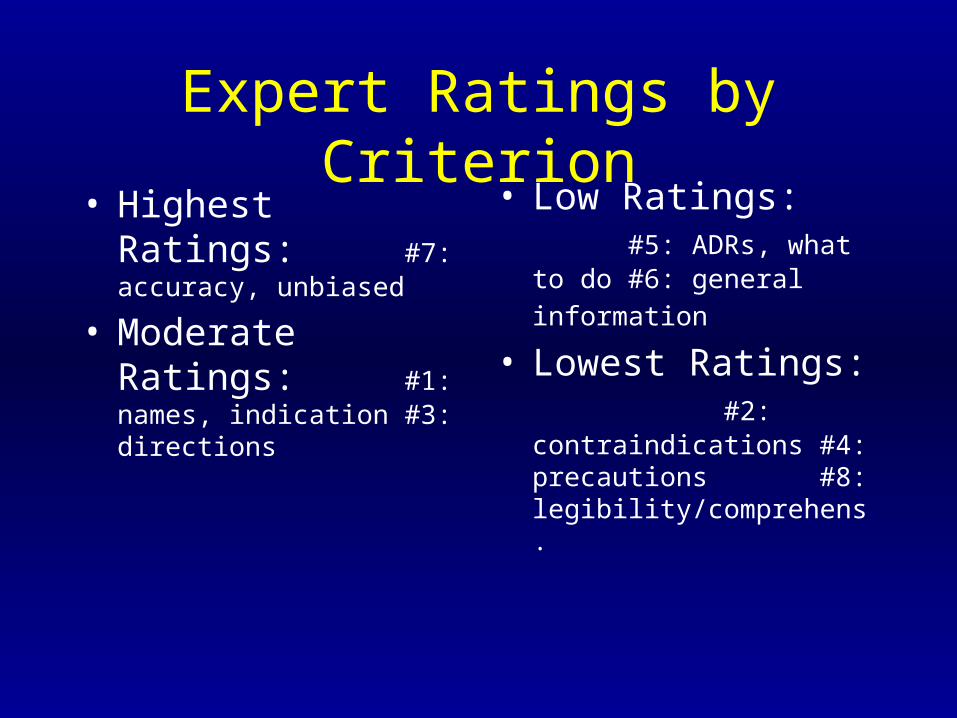
Expert Ratings by Criterion• Highest Ratings: #7:
accuracy, unbiased
• Moderate Ratings: #1: names, indication#3: directions
• Low Ratings:#5: ADRs, what to do#6: general
information
• Lowest Ratings:#2: contraindications#4: precautions#8:
legibility/comprehens.
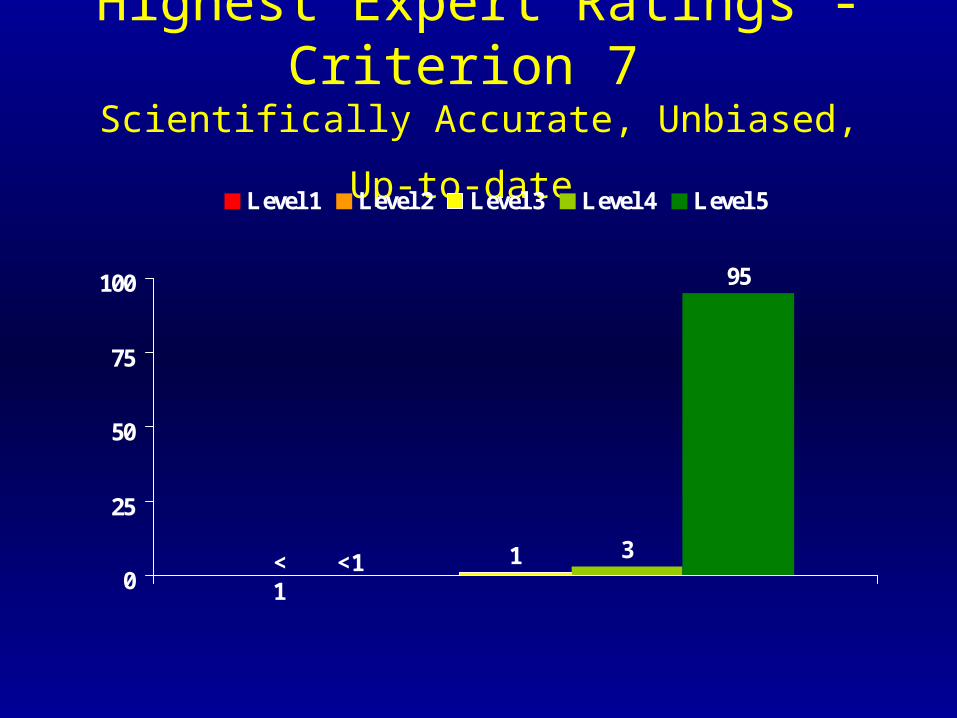
Highest Expert Ratings - Criterion 7 Scientifically Accurate, Unbiased, Up-to-date
1 3
95
0
25
50
75
100
Level 1 Level 2 Level 3 Level 4 Level 5
<1<1
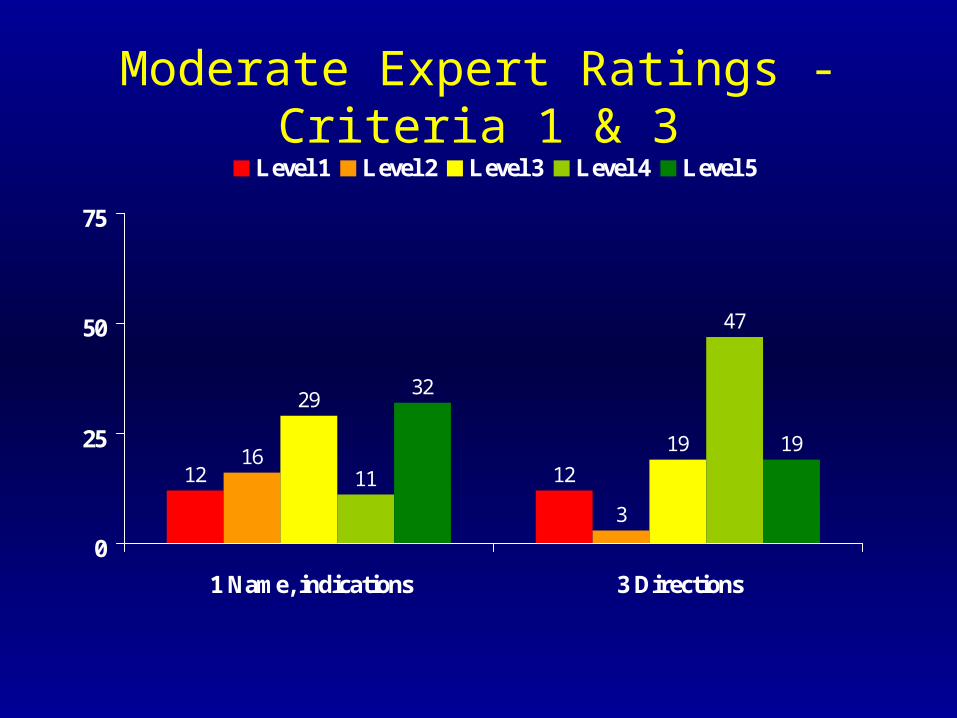
Moderate Expert Ratings - Criteria 1 & 3
12 1216
3
29
19
11
47
32
19
0
25
50
75
1 Name, indications 3 Directions
Level 1 Level 2 Level 3 Level 4 Level 5
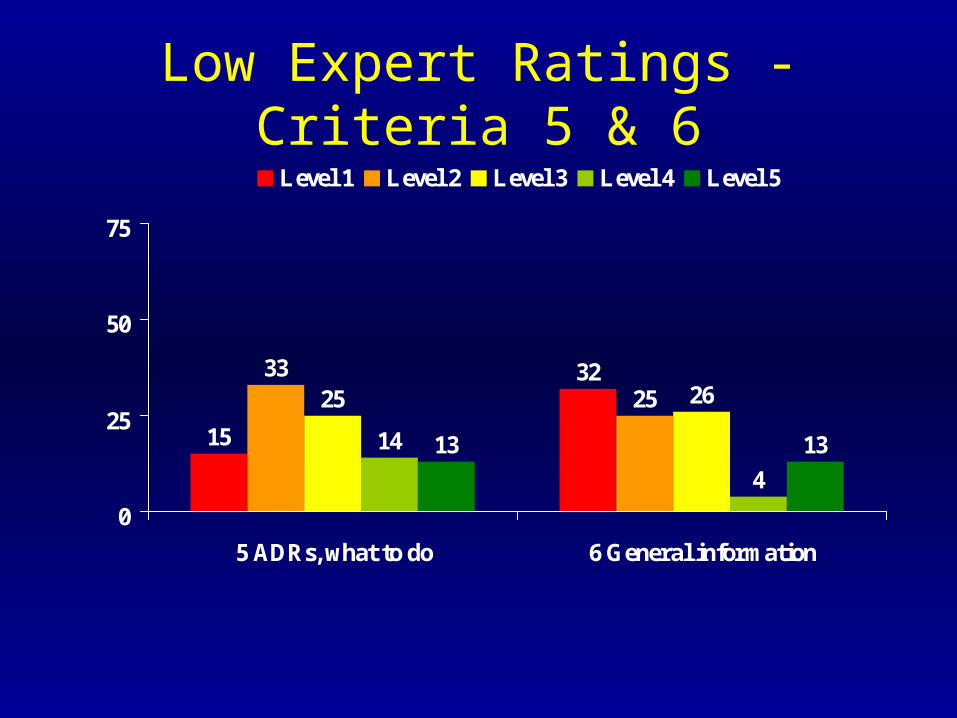
Low Expert Ratings - Criteria 5 & 6
15
32332525 26
14
4
13 13
0
25
50
75
5 ADRs, what to do 6 General information
Level 1 Level 2 Level 3 Level 4 Level 5
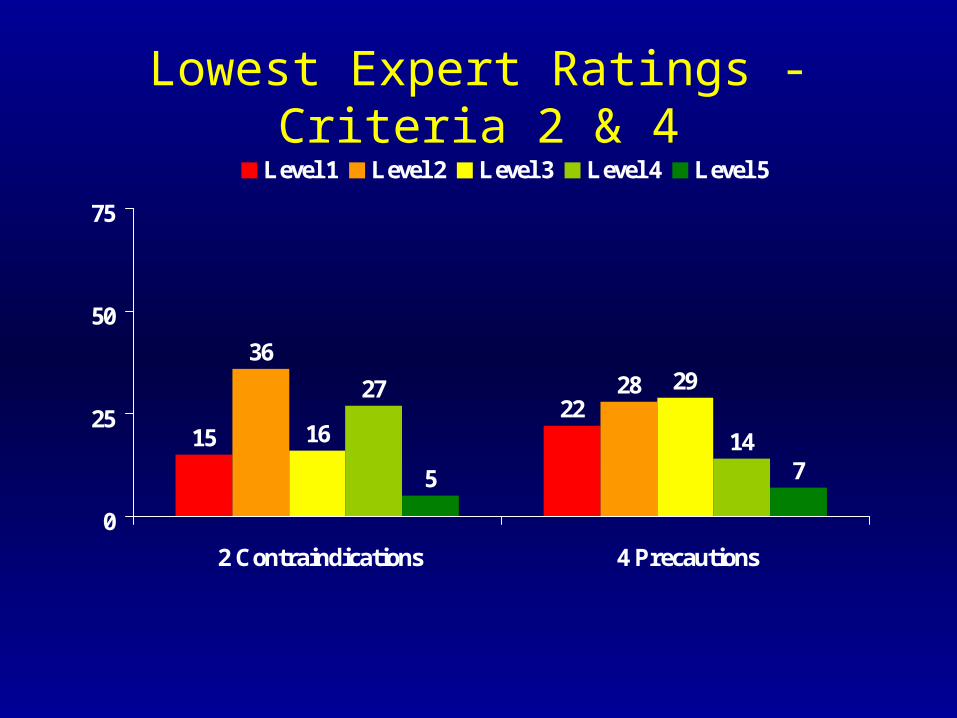
Lowest Expert Ratings - Criteria 2 & 4
1522
3628
16
2927
14
5 7
0
25
50
75
2 Contraindications 4 Precautions
Level 1 Level 2 Level 3 Level 4 Level 5
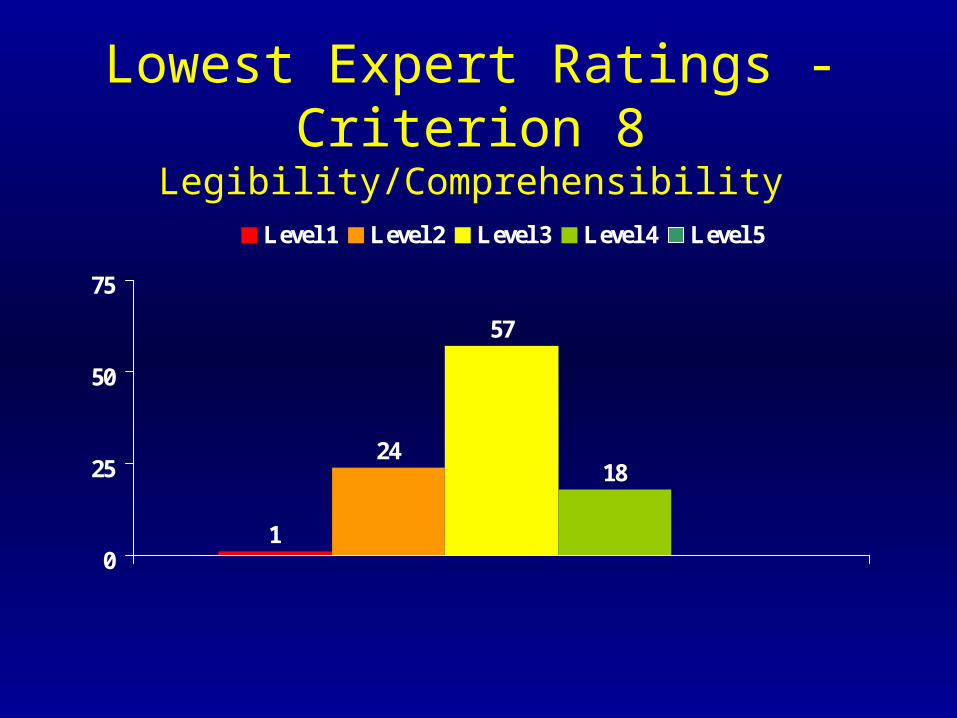
Lowest Expert Ratings - Criterion 8Legibility/Comprehensibility
1
24
57
18
0
25
50
75
Level 1 Level 2 Level 3 Level 4 Level 5
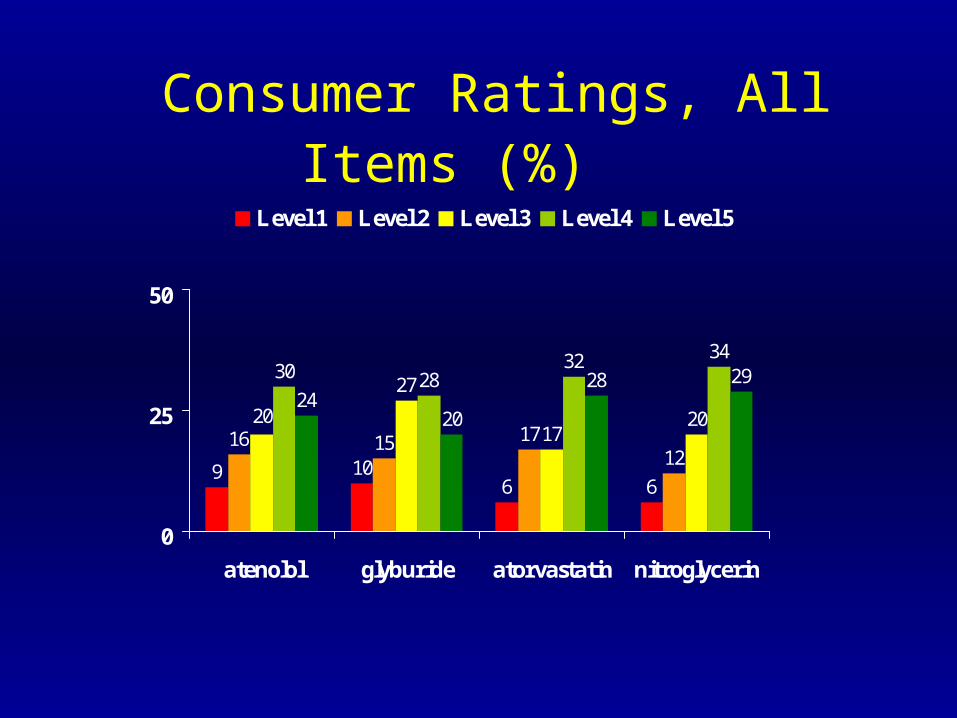
Consumer Ratings, All Items (%)
9 106 6
16 15 1712
20
30 2832 34
2420
28 29
17
27
20
0
25
50
atenolol glyburide atorvastatin nitroglycerin
Level 1 Level 2 Level 3 Level 4 Level 5
Consumer Scores by Item • Scores varied by item • Lowest scores: print size, print quality, spacing,
overall readability • Moderate-high scores: easy to understand, useful• 36% of leaflets given low ratings on readability
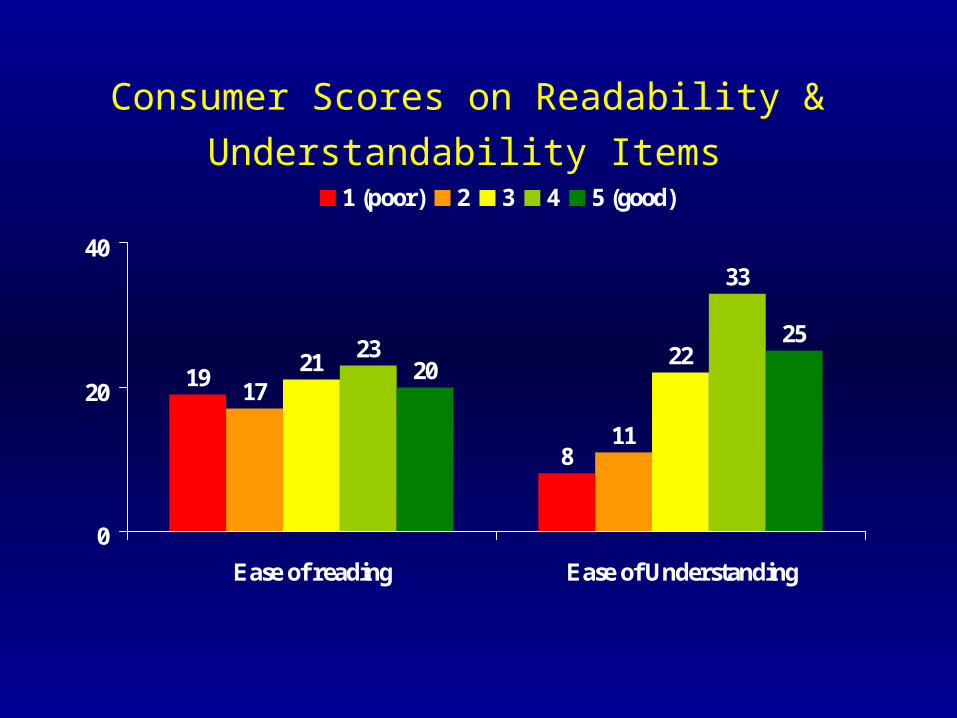
Consumer Scores on Readability &
Understandability Items
19
8
17
11
21 2223
33
20
25
0
20
40
Ease of reading Ease of Understanding
1 (poor) 2 3 4 5 (good)
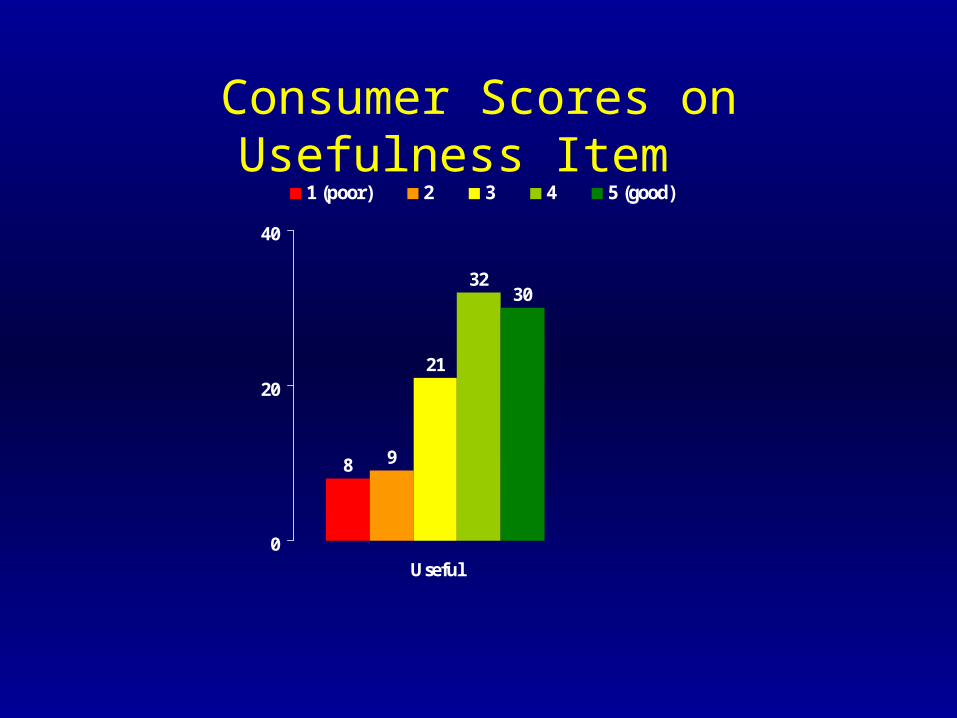
Consumer Scores on Usefulness Item
8 9
21
3230
0
20
40
Useful
1 (poor) 2 3 4 5 (good)
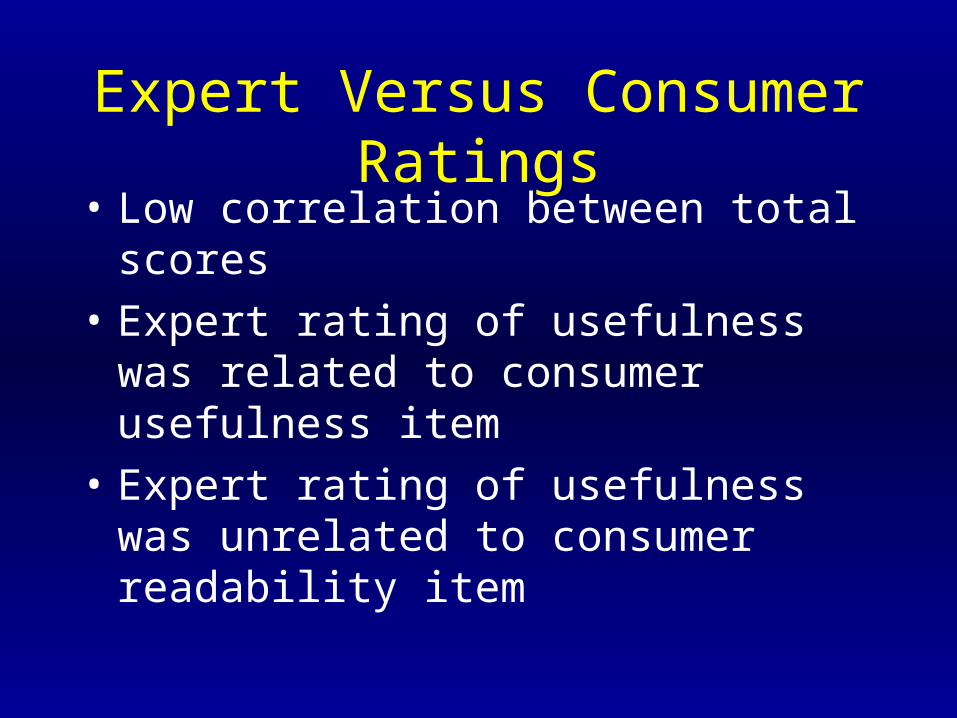
Expert Versus Consumer Ratings• Low correlation between total scores
• Expert rating of usefulness was related to consumer usefulness item
• Expert rating of usefulness was unrelated to consumer readability item
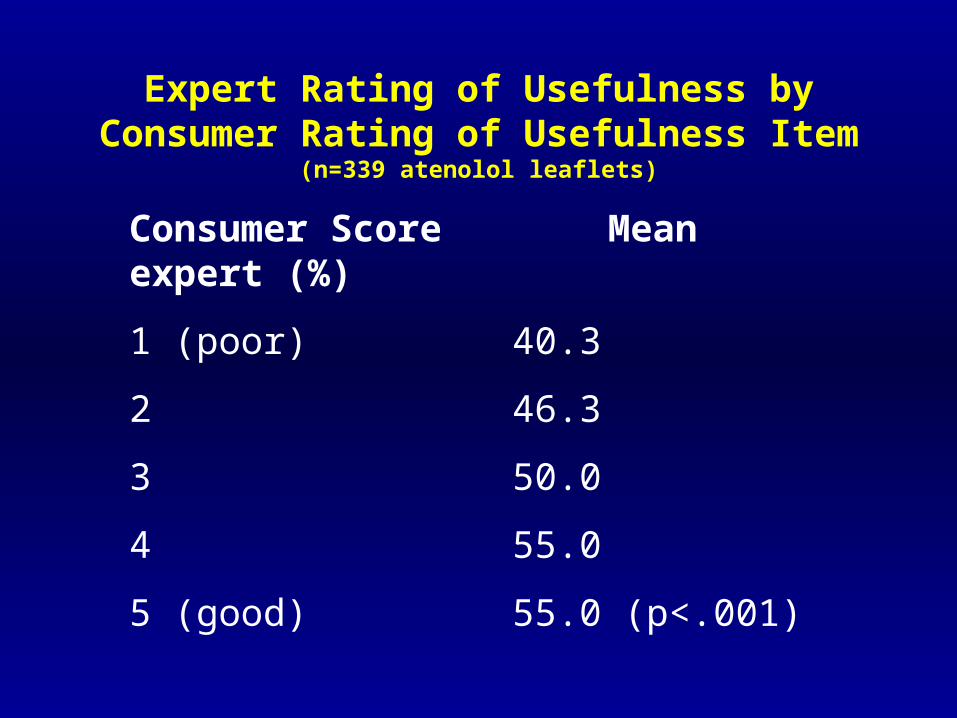
Expert Rating of Usefulness by Consumer Rating of Usefulness Item (n=339 atenolol leaflets)
Consumer Score Mean expert (%)
1 (poor) 40.3
2 46.3
3 50.0
4 55.0
5 (good) 55.0 (p<.001)
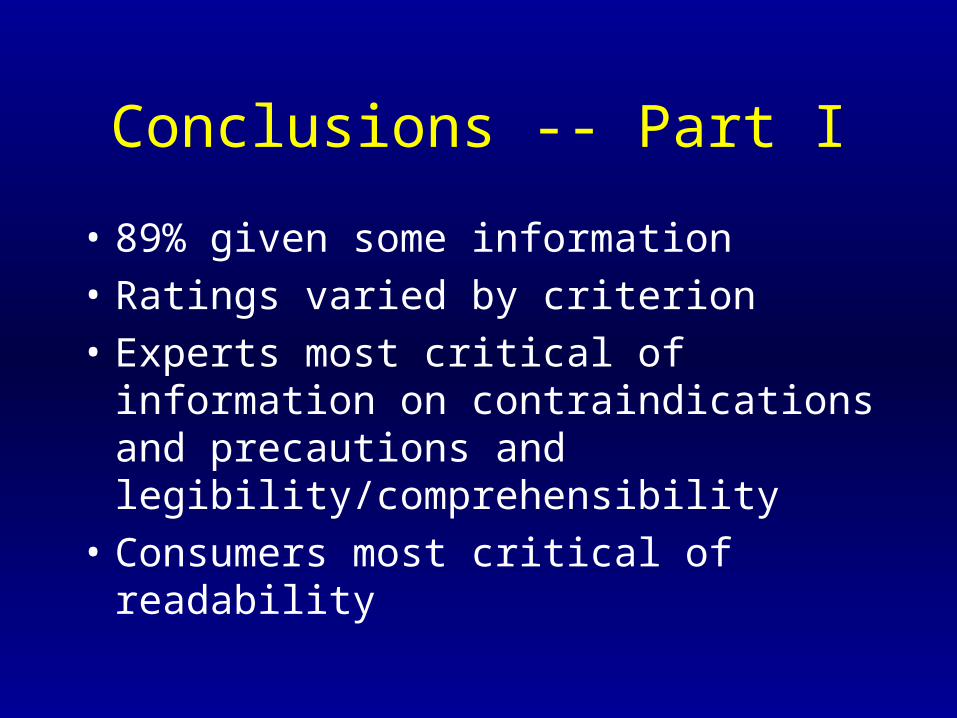
Conclusions -- Part I
• 89% given some information
• Ratings varied by criterion
• Experts most critical of information on contraindications and precautions and legibility/comprehensibility
• Consumers most critical of readability
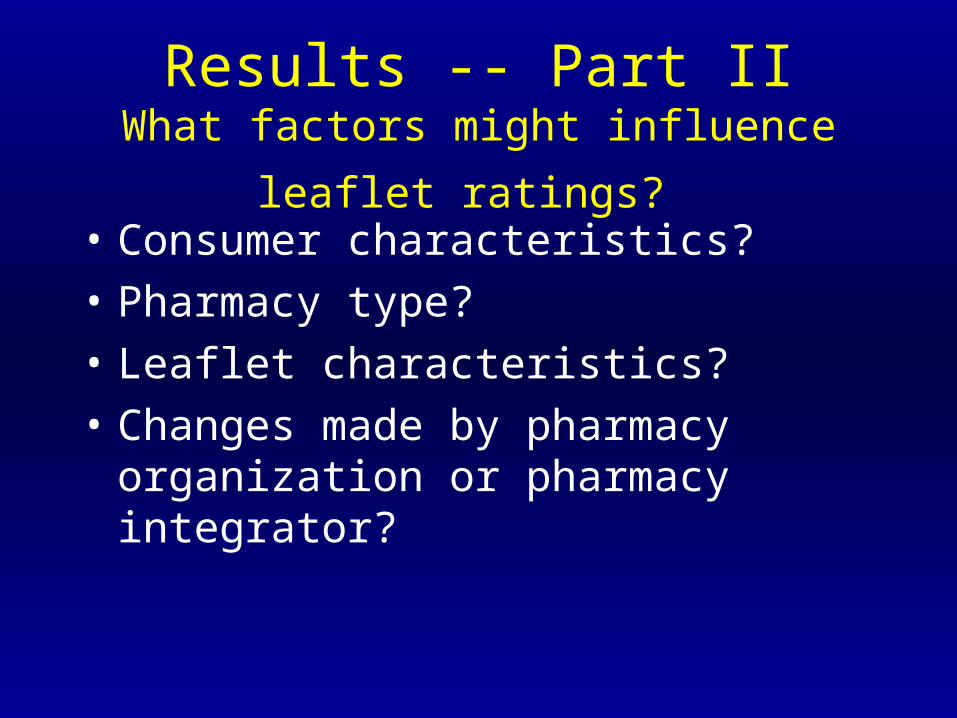
Results -- Part IIWhat factors might influence leaflet ratings? • Consumer characteristics?
• Pharmacy type?
• Leaflet characteristics?
• Changes made by pharmacy organization or pharmacy integrator?
Leaflet Ratings by Consumer Characteristics
• Ratings unrelated to gender, age, education, current drug use
• White raters gave higher scores than non-white raters for nitroglycerin leaflets
• Race unrelated to other ratings
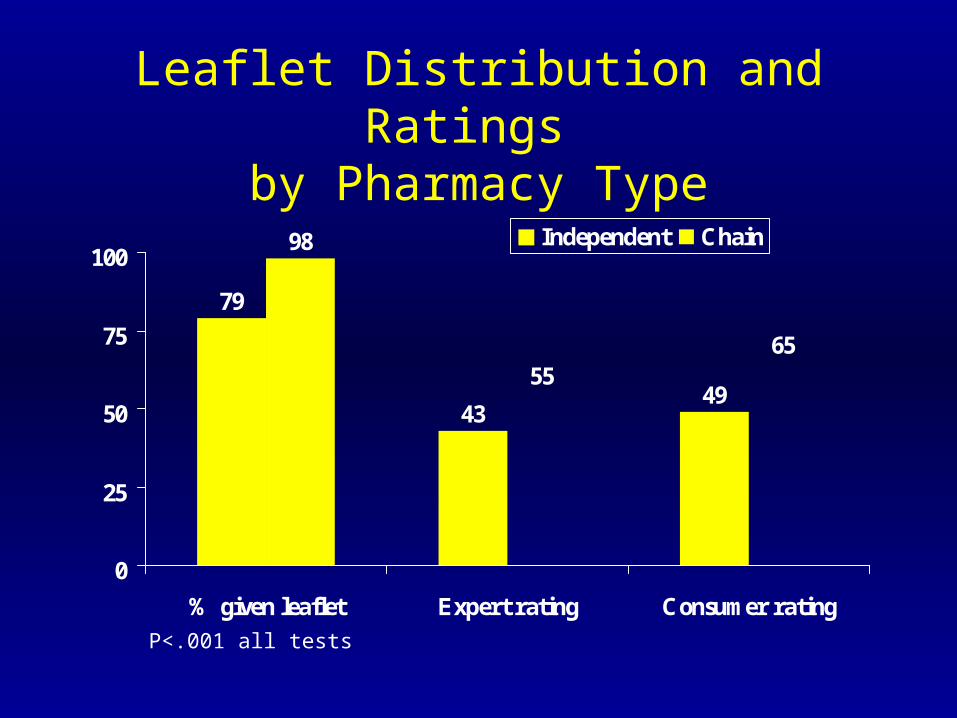
Leaflet Distribution and Ratings by Pharmacy Type
79
4349
98
5565
0
25
50
75
100
% given leaflet Expert rating Consumer rating
Independent Chain
P<.001 all tests
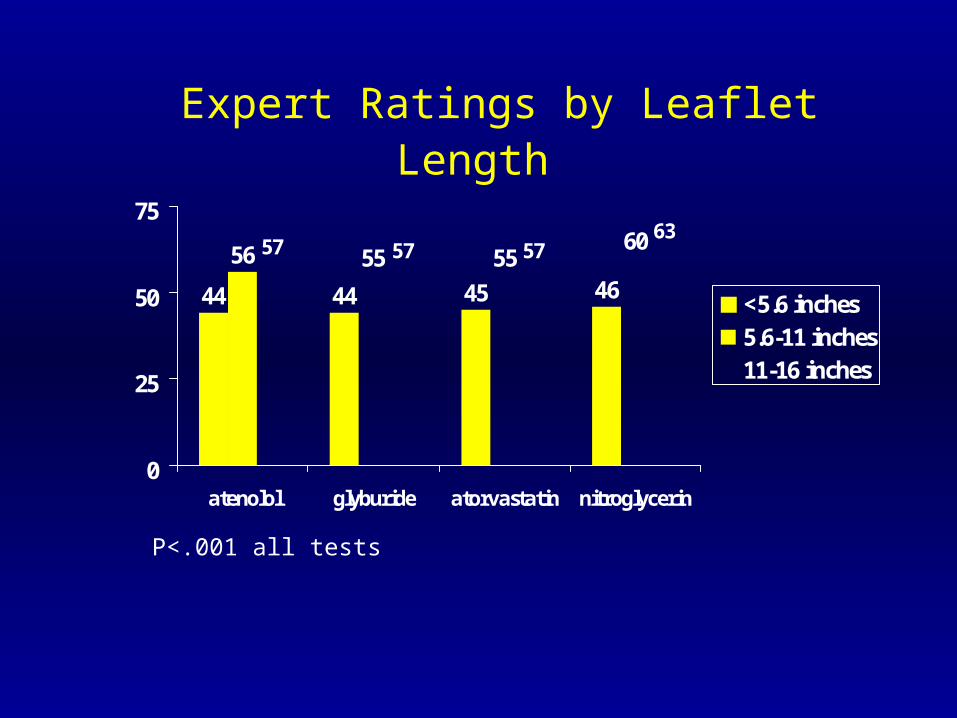
Expert Ratings by Leaflet Length
44 44 45 46
56 55 5560 63
57 57 57
0
25
50
75
atenolol glyburide atorvastatin nitroglycerin
<5.6 inches5.6-11 inches11-16 inches
P<.001 all tests
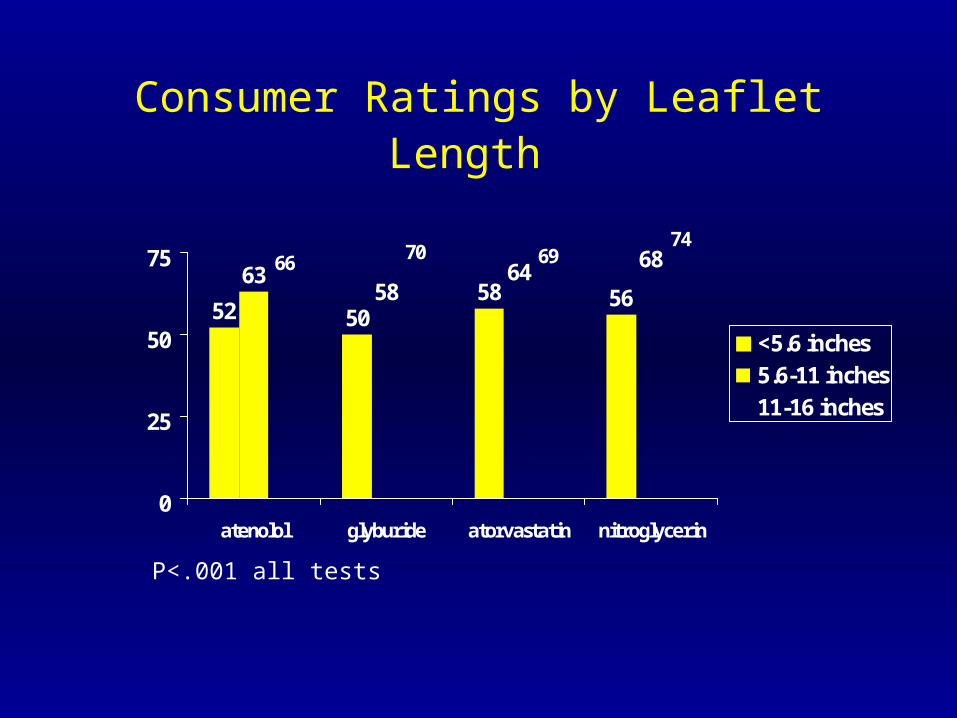
Consumer Ratings by Leaflet Length
52 5058 56
6358
6468
74697066
0
25
50
75
atenolol glyburide atorvastatin nitroglycerin
<5.6 inches
5.6-11 inches
11-16 inches
P<.001 all tests
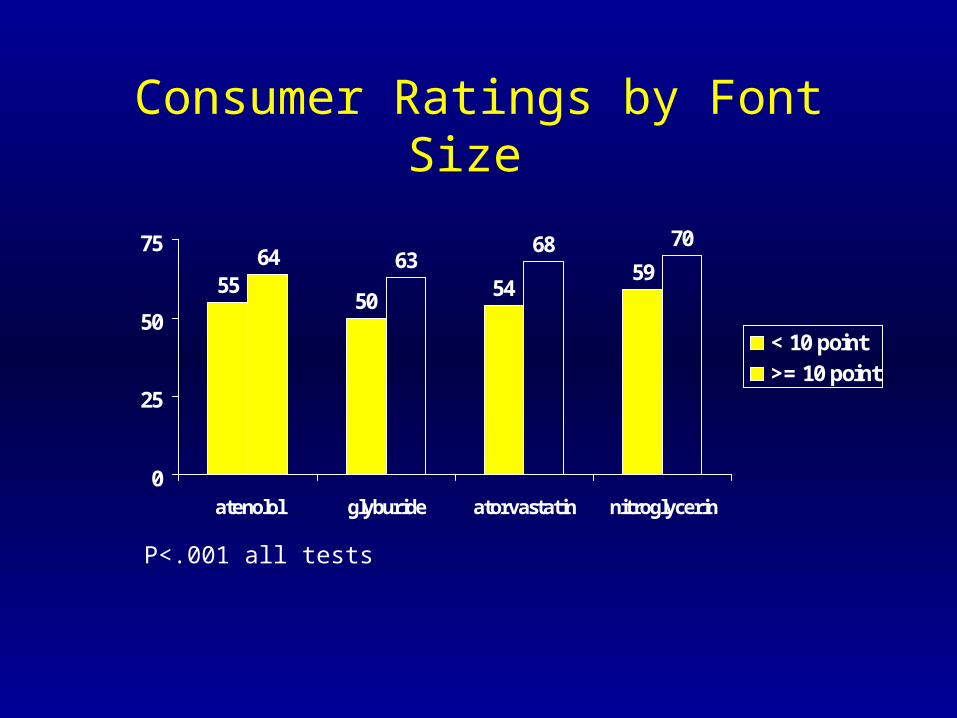
Consumer Ratings by Font Size
5550
5459
64 6368 70
0
25
50
75
atenolol glyburide atorvastatin nitroglycerin
< 10 point
>= 10 point
P<.001 all tests
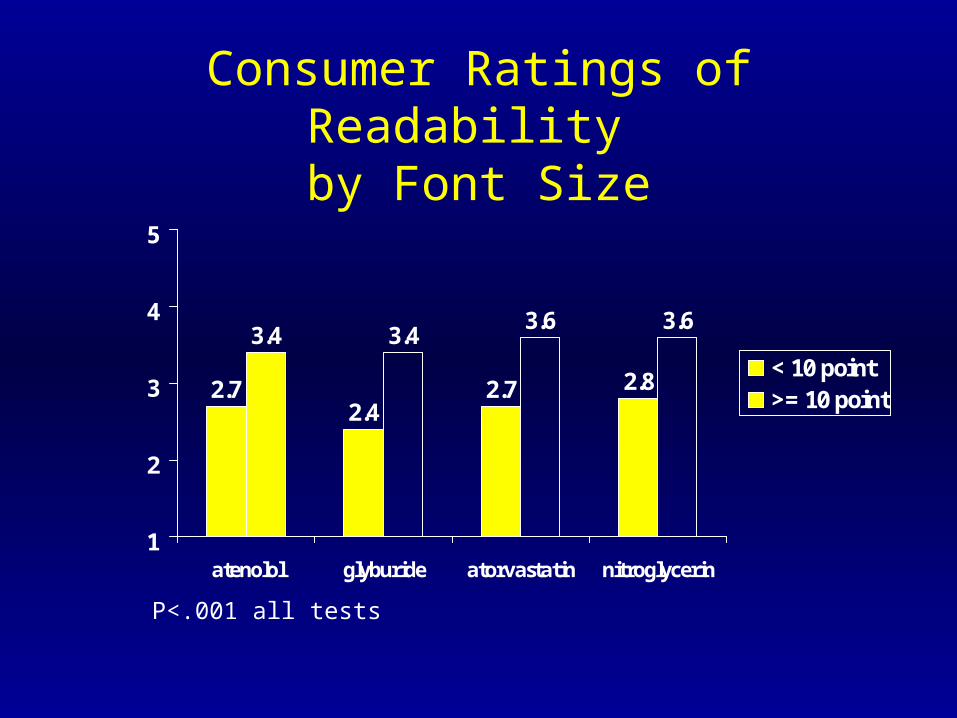
Consumer Ratings of Readability by Font Size
2.72.4
2.7 2.8
3.4 3.43.6 3.6
1
2
3
4
5
atenolol glyburide atorvastatin nitroglycerin
< 10 point>= 10 point
P<.001 all tests
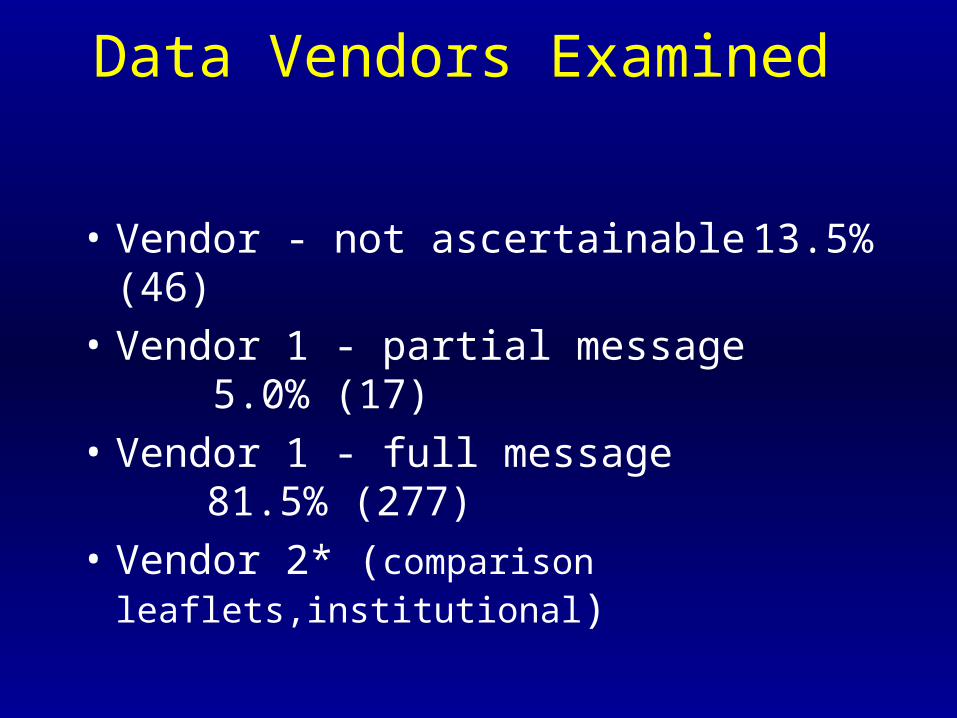
Data Vendors Examined
• Vendor - not ascertainable 13.5% (46)
• Vendor 1 - partial message 5.0% (17)
• Vendor 1 - full message 81.5% (277)
• Vendor 2* (comparison leaflets,institutional)
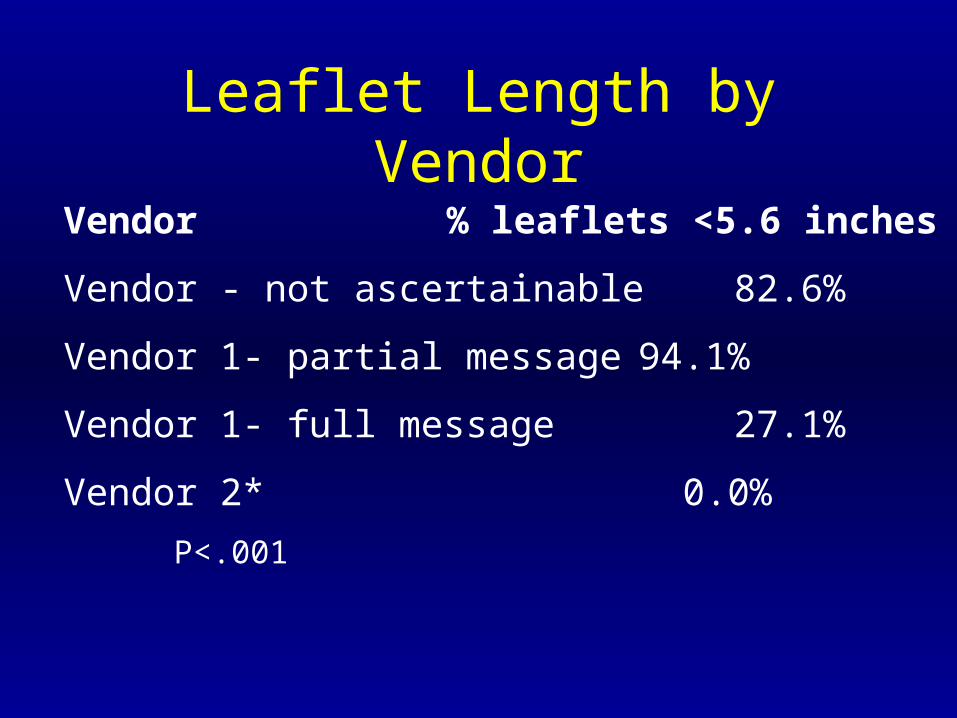
Leaflet Length by Vendor
Vendor % leaflets <5.6 inches
Vendor - not ascertainable 82.6%
Vendor 1- partial message 94.1%
Vendor 1- full message 27.1%
Vendor 2* 0.0%
P<.001
Results By Data Vendor
• Substantial variability by data vendor
• Highest: Vendor 1 and Vendor 2
• Lowest: Partial messages and unidentified vendors
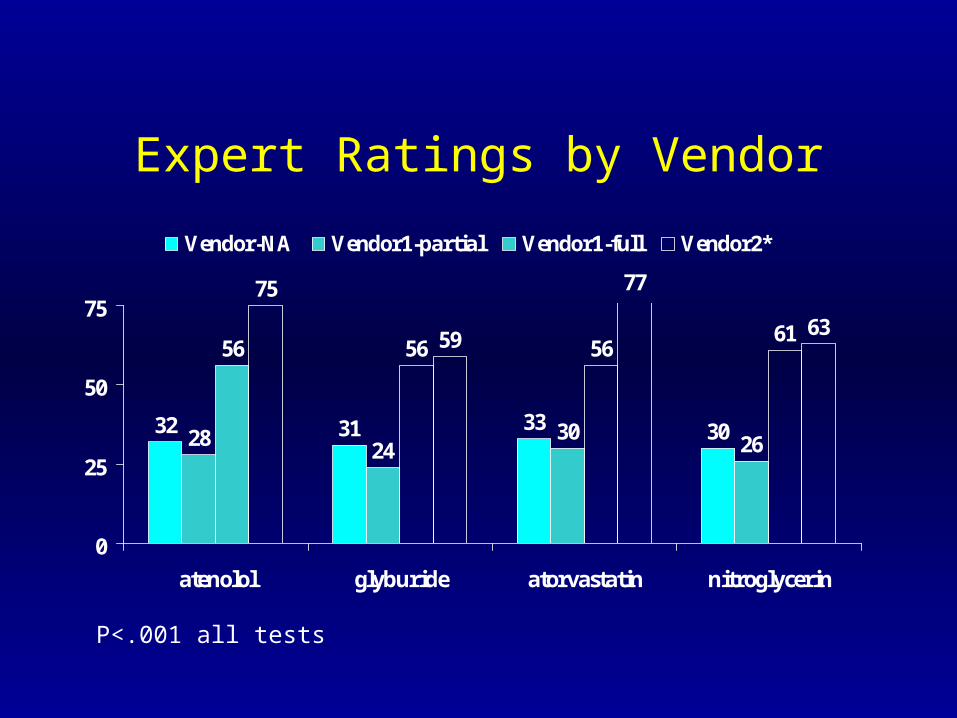
Expert Ratings by Vendor
32 31 33 302824
3026
56 56 5661
75
59
77
63
0
25
50
75
atenolol glyburide atorvastatin nitroglycerin
Vendor-NA Vendor1-partial Vendor1-full Vendor2*
P<.001 all tests
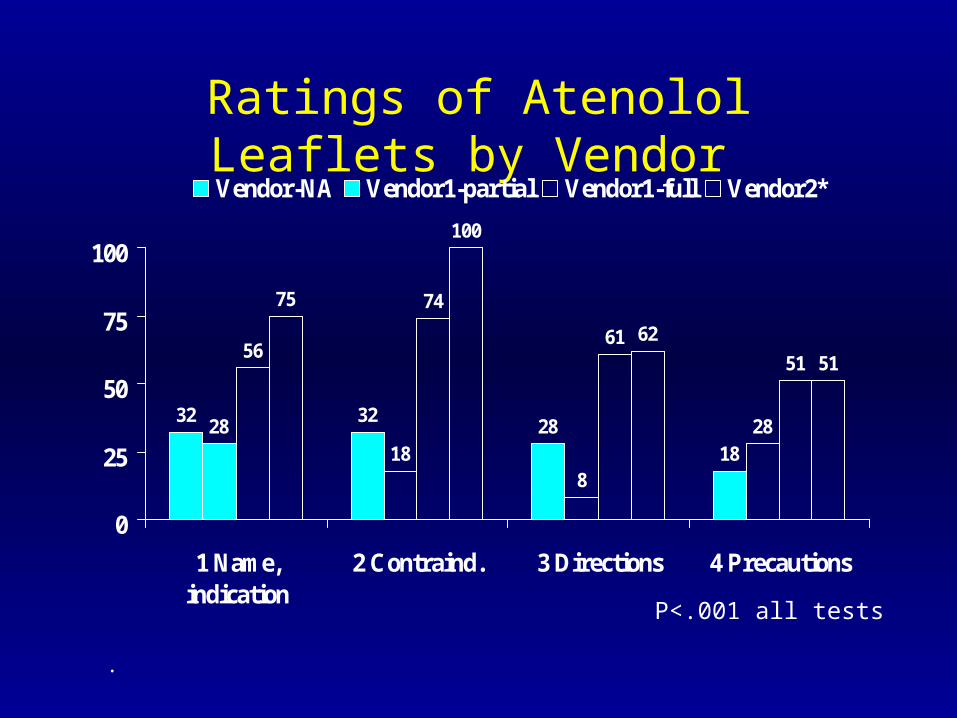
Ratings of Atenolol Leaflets by Vendor
32 3228
1828
188
28
56
74
6151
75
100
62
51
0
25
50
75
100
1 Name,indication
2 Contraind. 3 Directions 4 Precautions
Vendor-NA Vendor1-partial Vendor1-full Vendor2*
.
P<.001 all tests
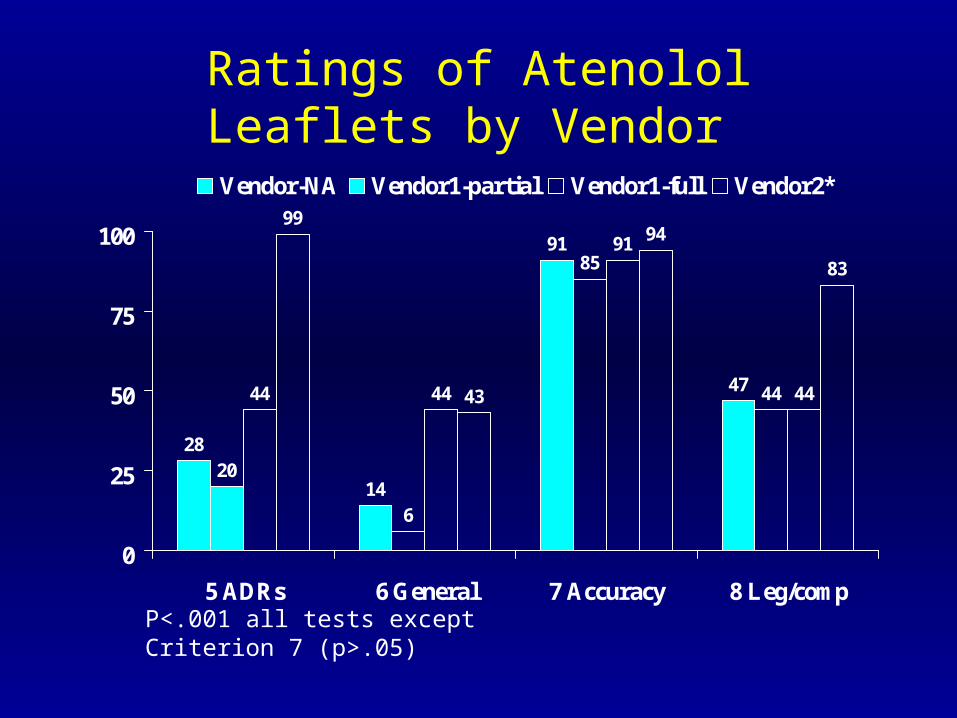
Ratings of Atenolol Leaflets by Vendor
28
14
91
47
20
6
85
4444 44
91
44
99
43
94
83
0
25
50
75
100
5 ADRs 6 General 7 Accuracy 8 Leg/comp
Vendor-NA Vendor1-partial Vendor1-full Vendor2*
P<.001 all tests except Criterion 7 (p>.05)
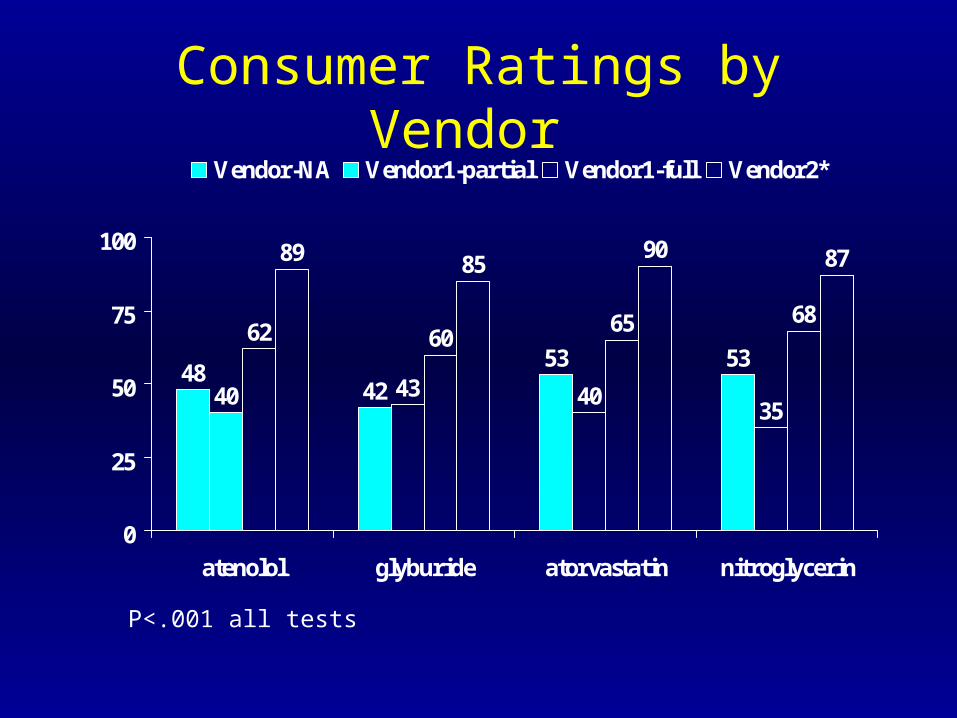
Consumer Ratings by Vendor
4842
53 53
40 43 4035
62 6065 68
89 8590 87
0
25
50
75
100
atenolol glyburide atorvastatin nitroglycerin
Vendor-NA Vendor1-partial Vendor1-full Vendor2*
P<.001 all tests
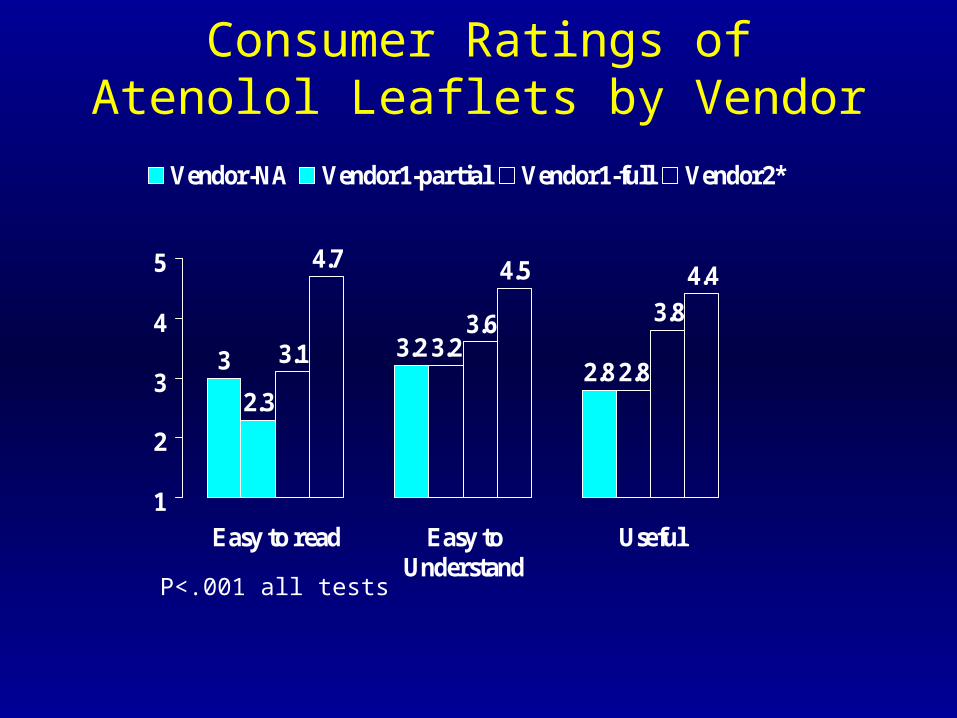
Consumer Ratings of Atenolol Leaflets by Vendor
3 3.22.8
2.3
3.22.8
3.13.6 3.8
4.7 4.5 4.4
1
2
3
4
5
Easy to read Easy toUnderstand
Useful
Vendor-NA Vendor1-partial Vendor1-full Vendor2*
P<.001 all tests
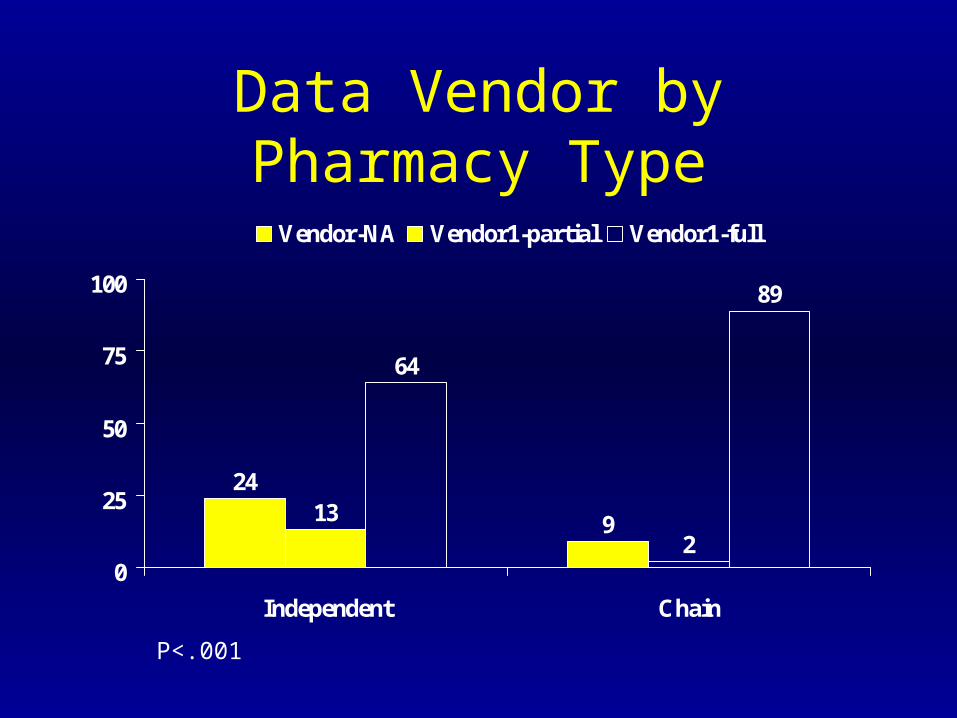
Data Vendor by Pharmacy Type
24
9132
64
89
0
25
50
75
100
Independent Chain
Vendor-NA Vendor1-partial Vendor1-full
P<.001
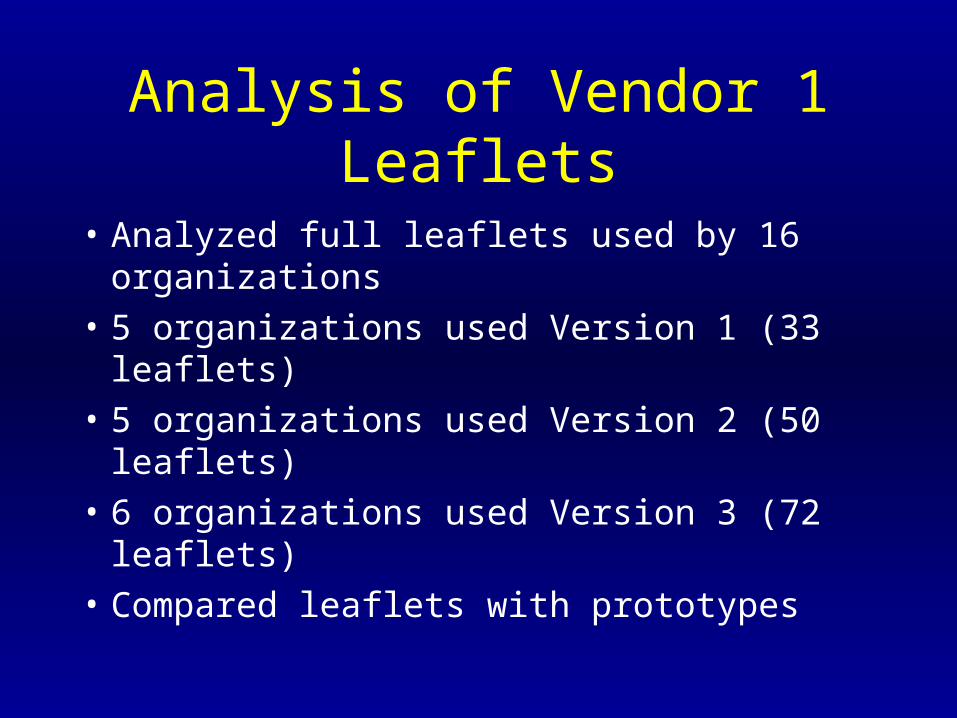
Analysis of Vendor 1 Leaflets
• Analyzed full leaflets used by 16 organizations
• 5 organizations used Version 1 (33 leaflets)
• 5 organizations used Version 2 (50 leaflets)
• 6 organizations used Version 3 (72 leaflets)
• Compared leaflets with prototypes
Results • Ratings varied by leaflet version
• No prototype fully met criteria
• Some organizations added and deleted information from prototype
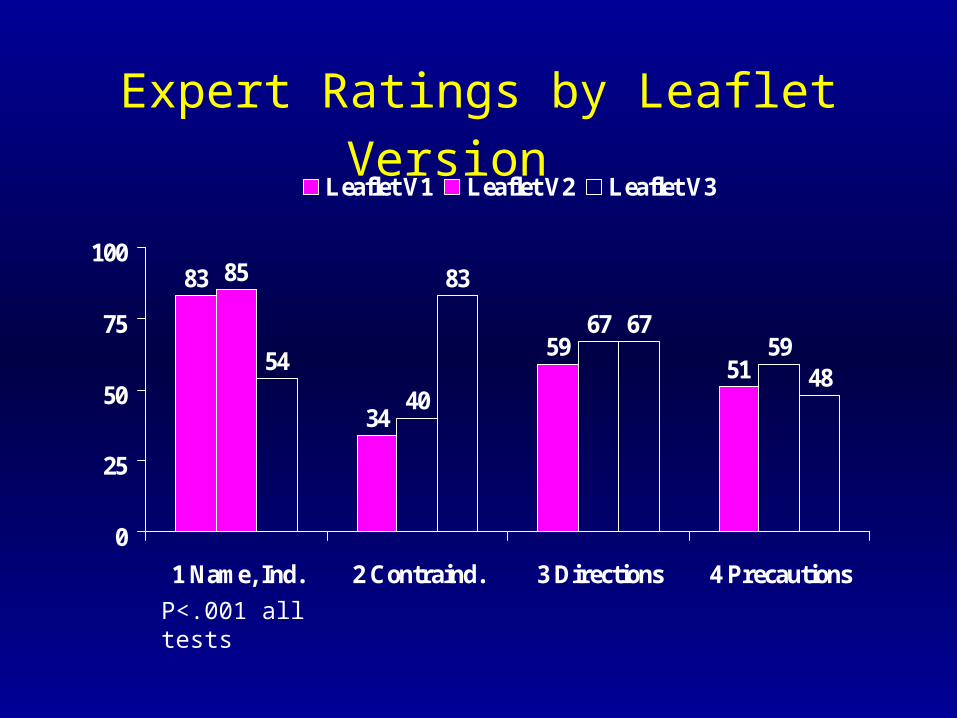
Expert Ratings by Leaflet Version
83
34
5951
85
40
6759
54
83
67
48
0
25
50
75
100
1 Name, Ind. 2 Contraind. 3 Directions 4 Precautions
Leaflet V1 Leaflet V2 Leaflet V3
P<.001 all tests
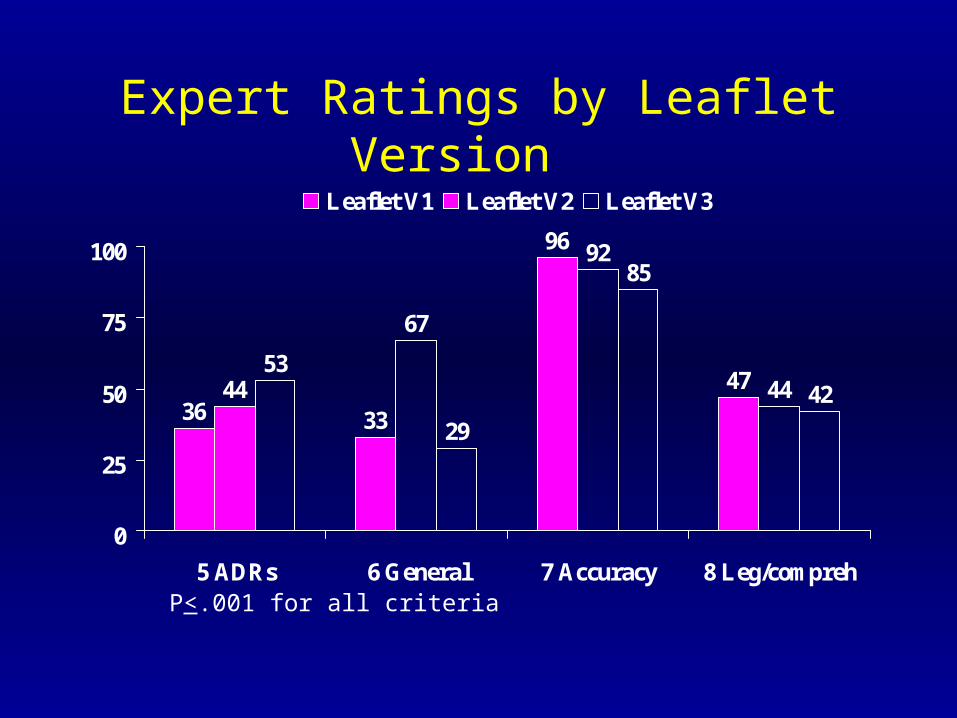
Expert Ratings by Leaflet Version
36 33
96
4744
67
92
4453
29
85
42
0
25
50
75
100
5 ADRs 6 General 7 Accuracy 8 Leg/compreh
Leaflet V1 Leaflet V2 Leaflet V3
P<.001 for all criteria
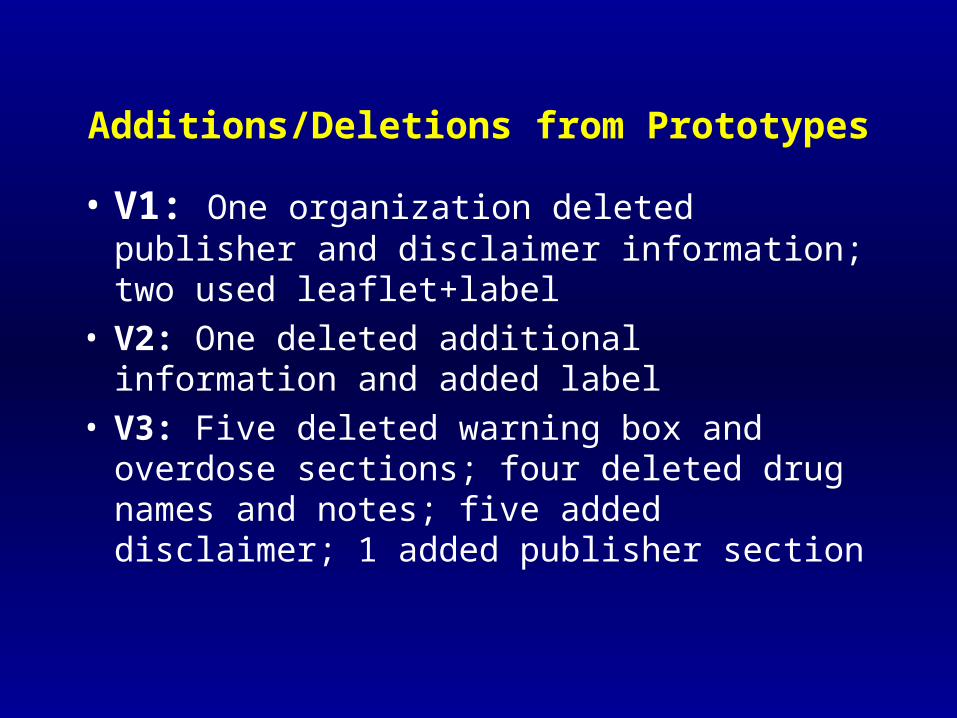
Additions/Deletions from Prototypes
• V1: One organization deleted publisher and disclaimer information; two used leaflet+label
• V2: One deleted additional information and added label
• V3: Five deleted warning box and overdose sections; four deleted drug names and notes; five added disclaimer; 1 added publisher section
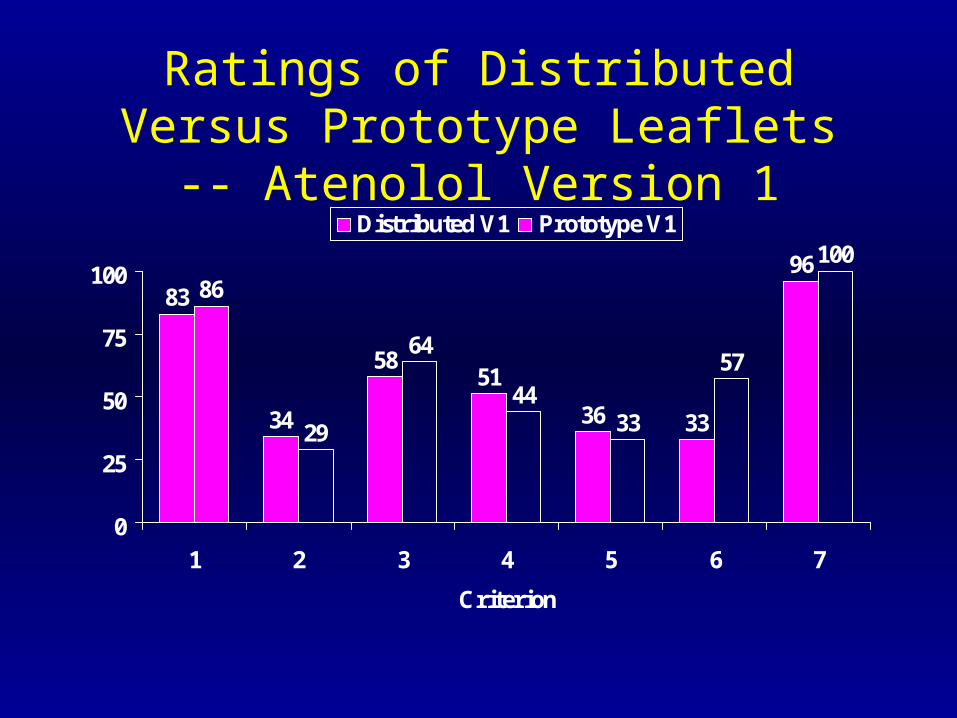
Ratings of Distributed Versus Prototype Leaflets -- Atenolol Version 1
83
34
5851
36 33
9686
29
64
4433
57
100
0
25
50
75
100
1 2 3 4 5 6 7
Criterion
Distributed V1 Prototype V1
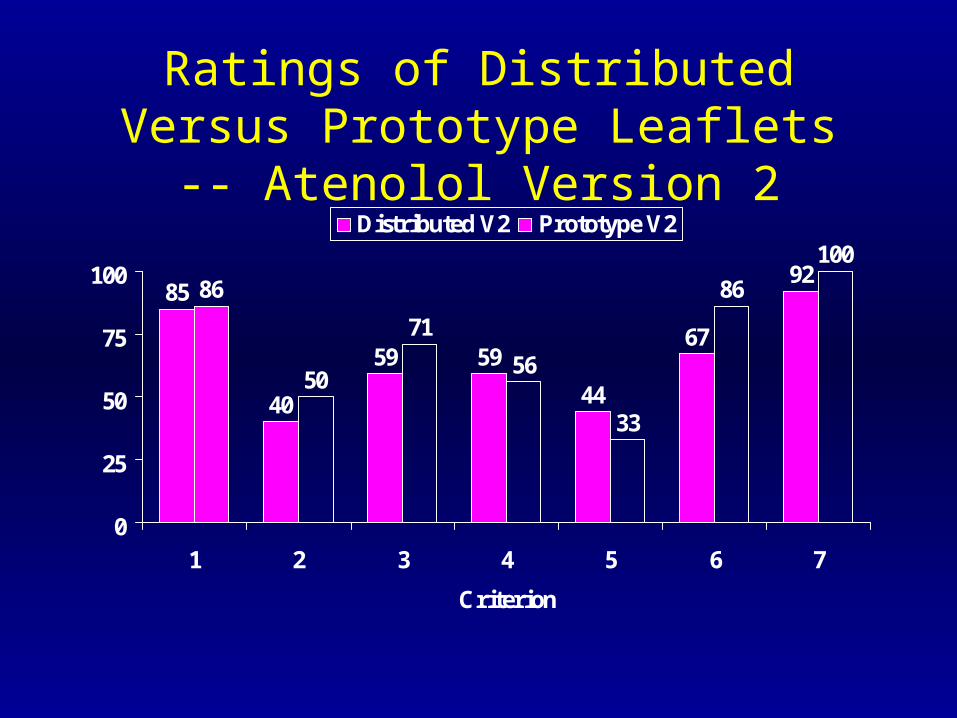
Ratings of Distributed Versus Prototype Leaflets -- Atenolol Version 2
85
40
59 59
44
67
9286
50
71
56
33
86
100
0
25
50
75
100
1 2 3 4 5 6 7
Criterion
Distributed V2 Prototype V2
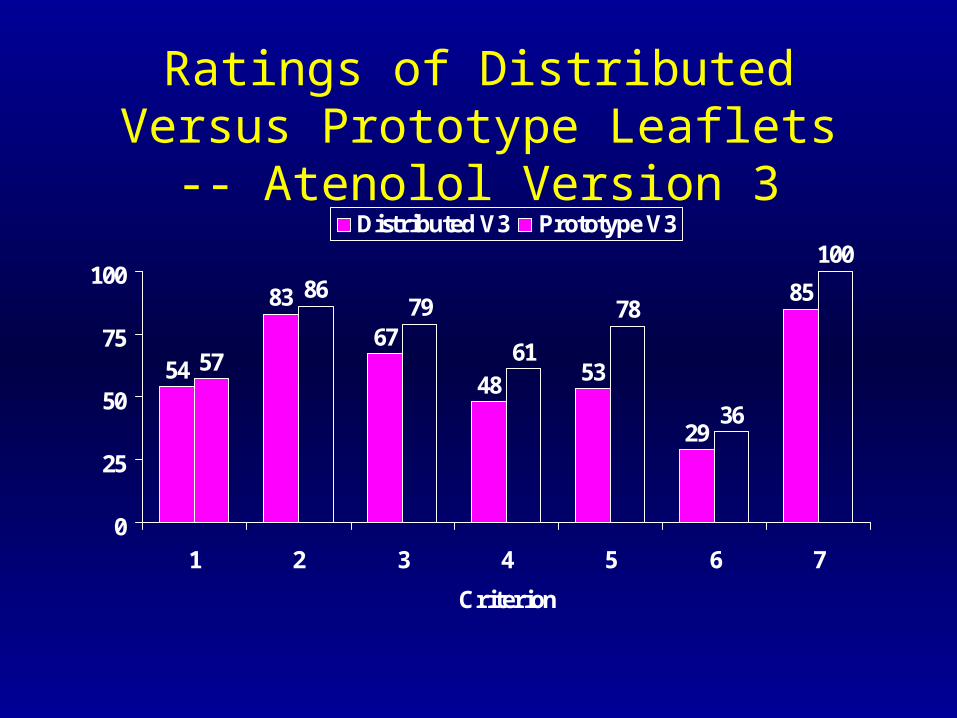
Ratings of Distributed Versus Prototype Leaflets -- Atenolol Version 3
54
83
67
48 53
29
85
57
8679
61
78
36
100
0
25
50
75
100
1 2 3 4 5 6 7
Criterion
Distributed V3 Prototype V3
Conclusions (1)
• Highest ratings for scientific accuracy and being nonpromotional
• Lowest ratings for contraindications and precautions
Conclusions (2)
• Lowest ratings for leaflets:- < 5.5 inches long or
- font size < 10 point
• Lowest ratings for leaflets from: - independent pharmacies
- unidentified vendors
Conclusions (3)
• No prototype fully met criteria– Experts, consumers both critical of legibility
• Pharmacy organizations can influence ratings by – selecting vendor and leaflet version – modifying leaflets themselves
Examples
• Leaflets with low versus high ratings
• Leaflets from different vendors
• Changes made by pharmacy organizations or integrators