Embed Size (px)
Citation preview
Evaluation of Watershed Management Practices on receiving water quality
using SWAT model
2010.08.04Jang, Jae Ho
- 2010 International SWAT Conference -

Division of Climate Change, Environmental Strategy Research Group Korea Environment Institute
Outline of Presentation
Model Preparation and Application
Watershed Management Measures
Conclusion and Future Study
2
3
4
Research Background and Objectives1

Division of Climate Change, Environmental Strategy Research Group Korea Environment Institute
Research Backgroundand Objectives

Division of Climate Change, Environmental Strategy Research Group Korea Environment Institute
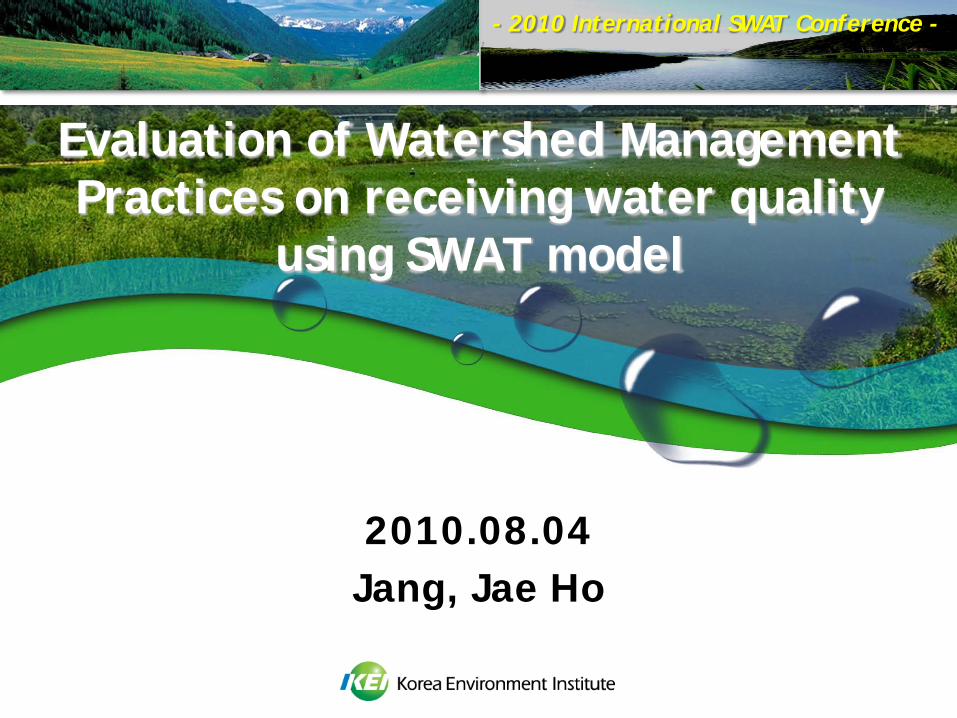
Research Background
Nature Problem
Significantly improved by restoration efforts
Environmental groups
Government plan
Porum and symposium Advertisement Cleaning

Division of Climate Change, Environmental Strategy Research Group Korea Environment Institute
Nature Problem
Research Background
Achievement’2012 WQ GoalBOD 3.7 mg/L
Riparianzone
ExpansionWWTPs
[Sewerage 87%]
ReductionNPS Pollution
Load
Master Plan for Water Environmentfor Kyeongan Stream watershedby KMOE
Division of Climate Change, Environmental Strategy Research Group Korea Environment Institute
Field monitor to assess watershed: time consuming, uncertainty
Alternative measure: Computer modeling
Research Background
Nature Problem

Division of Climate Change, Environmental Strategy Research Group Korea Environment Institute
Research Objectives
Complicated watershed-scale
Model selection & application
Mod
el s
elec
tion
Objections
4대강 사업 수질관리 기후변화 대응 전략Assistance of Watershed Management Plan and Policy
Continuous, long-term simulation
Verification of SWAT applicability
Modification of BASINS view for South Korea
Flow and pollutant transportation
Point and nonpoint source
Widely used in home and abroad
SWAT model
Evaluation of pollution loads
Model input data and setting
Evaluation of BMPs for prevention of water pollution
Division of Climate Change, Environmental Strategy Research Group Korea Environment Institute
Model Preparation andApplication

Division of Climate Change, Environmental Strategy Research Group Korea Environment Institute
Modification for application of Korea
BASINS modification
Original initial datasets Modified initial datasets
HydrologyReach File, V1Cataloging Unit CodeAccounting Unit BoundariesCataloging Unit BoundariesObserved Data StationsWater QualityWater Quality ObservationWDM Weather DataUSGS GageBacteriaWeather Station AreaNAWQA Study Area UnitBoundariesPoint Sources & WithdrawalsPermit Compliance SystemPoliticalUrban Area NameEPA Region BoundariesState BoundariesUrban Area Boundaries
TransportationMajor RoadsSoil, Land use/CoverLand Use IndexManaged Area DatabaseSoil index
HydrologyRiver fileDrainage areaMulti-Purpose DamWatershed boundariesObserved Data StationsWater quality (KMOE)Weather Station SiteWater Level StationWater Flow Station (TMDL)WQ Observation (TMDL)Thissen PolygonsSpecial manage RegionPoint Sources & WithdrawalsWWTPPoliticalUrban Area NameboundaryTMDL watershedSI-DO boundariesUrban area BoundariesTransportationMajor RoadsSoil, Land Use/CoverLand Use mapManaged Area DatabaseSoil Map
Model Preparation

Division of Climate Change, Environmental Strategy Research Group Korea Environment Institute
Model input data availability
Input data Source of data and InformationHydrology boundary conditions
River fileWatershed boundaries
National Geographic Information Institute(Hydrologic unit map)
GIS dataLand Use map
Soil Map
Digital Elevation Model
Environmental Geographic Information System(1:25,000 scale in shape-polygon format)
National Institute of Agricultural Science andTechnology (1:25,000 digital detailed soil map)
Ministry of Environment (MOE)(Resolution 30m × 30m)
Observed dataFlow and Water quality data
Weather data
MOE (8-day intervals data at two monitoring stations during 2004 - 2008)
Korea Meteorological Administration (3 stations)
Point Sources MOE (Daily discharge flow from WWTPs)
Model Preparation
Division of Climate Change, Environmental Strategy Research Group Korea Environment Institute
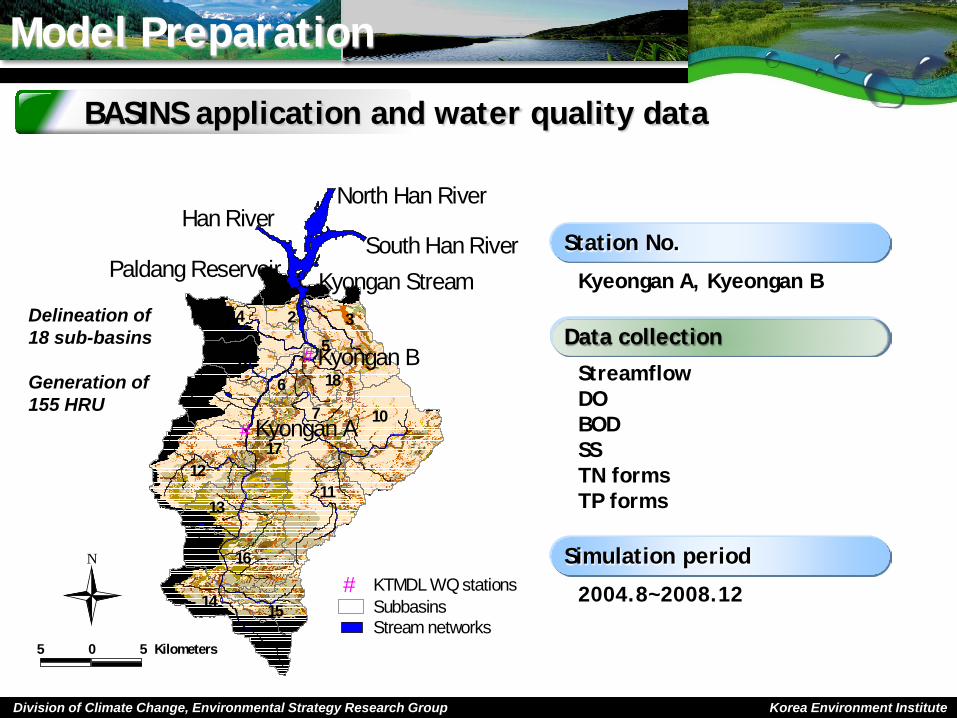
BASINS application and water quality data
Model Preparation
N
# KTMDL WQ stationsSubbasinsStream networks
#
#
97
34
10
11
16
12
8
14
13
1
17
15
18
2
5
6
Kyongan A
Kyongan B
North Han River
South Han RiverKyongan Stream
Han River
Paldang Reservoir
5 0 5 Kilometers
Station No.
Data collection
Kyeongan A, Kyeongan B
StreamflowDOBODSSTN formsTP forms
Simulation period
2004.8~2008.12
Delineation of 18 sub-basins
Generation of155 HRU

Division of Climate Change, Environmental Strategy Research Group Korea Environment Institute
Modeling process
Good simulation
Graphical comparisons and statistical tests
O.K.
Model simulation tolerance(Donigian, 2000): O/S ratio, NSE, % difference
2002 - 2003 : stabilization 2004 - 2006 : calibration 2007 - 2008 : validation
Model Application

Division of Climate Change, Environmental Strategy Research Group Korea Environment Institute
Hydrology simulation results
Model Application
Calibration (2004~2006)
Validation (2007~2008)
Kyeoungan A
Kyeoungan A
Kyeoungan B
Kyeoungan B
% diff. : 11.14NSE : 0.76
% diff. : 2.96, NSE : 0.79
% diff. : 11.07NSE : 0.93
% diff. : 0.45, NSE : 0.96

Division of Climate Change, Environmental Strategy Research Group Korea Environment Institute
SS simulation results
Model Application
Calibration & Validation (2004~2008)
% diff. : 22.46 % diff. : 8.75 % diff. : 5.68 % diff. : 1.28

Division of Climate Change, Environmental Strategy Research Group Korea Environment Institute
TN and TP simulation results
Model Application
Calibration & Validation (2004~2008)
% diff. : 4.7 % diff. : 15.8 % diff. : 21.9 % diff. : 4.8
% diff. : 4.7 % diff. : 15.8 % diff. : 21.9 % diff. : 4.8

Division of Climate Change, Environmental Strategy Research Group Korea Environment Institute
Model Application
NPS pollution ratio
SS Average 90.6 %
TN Average 55.0 %
TP Average 28.5 %
Assessment of Pollutant load

Division of Climate Change, Environmental Strategy Research Group Korea Environment Institute
Assessment of Pollutant load
Model Application
Monthly pollutants load
41 mg/L
9.1 mg/L 0.41 mg/L
2.1 mg/L
0.08 mg/L

Division of Climate Change, Environmental Strategy Research Group Korea Environment Institute
Watershed Management Measures
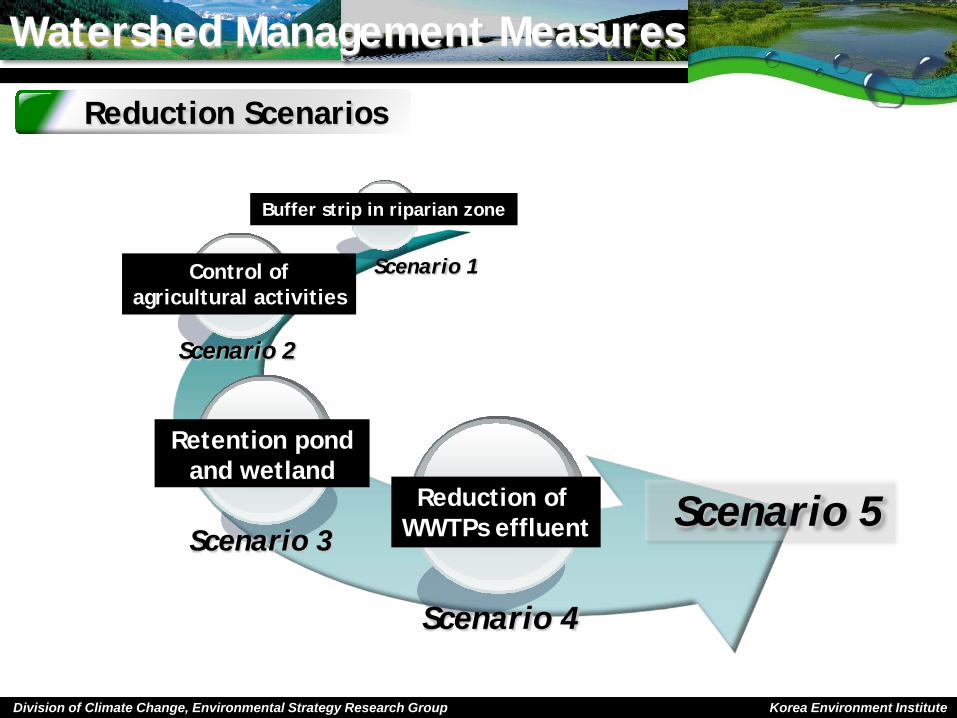
Division of Climate Change, Environmental Strategy Research Group Korea Environment Institute
Scenario 5Reduction of WWTPs effluent
Retention pond and wetland
Control ofagricultural activities
Scenario 4
Scenario 3
Scenario 2
Buffer strip in riparian zone
Scenario 1
Reduction Scenarios
Watershed Management Measures

Division of Climate Change, Environmental Strategy Research Group Korea Environment Institute
S1-Riparian Buffer Strip
Land-use Residential Agriculture Forest Pasture Barren Wetland Water Total
Area(km2) 2.80 9.75 21.04 0.81 1.05 0.04 0.33 35.82 (6.1%)
Alteration area Agriculture + Barren : 10.08 km2
Pasture : 2 km2 (20%)
Change

Division of Climate Change, Environmental Strategy Research Group Korea Environment Institute
S2-BMPs for Agricultural Activities
Reducing Fertilization
Plant growth-related factors-Input major crop data: paddy, cabbage, corn, soybean(cultivation, planting, fertilization, irrigation, and harvesting )
Reduce the standard amount of fertilizer
up to 60%
“Alternative Water Resource Project”
Treated Wastewater Reuse for Agriculture
Same amount of crop as 40% of Standard fertilization

Division of Climate Change, Environmental Strategy Research Group Korea Environment Institute
Sub-basin 2 4 5 7 8 12 13 16 17 18
% Upland 11.4 10.6 19.8 12.8 10.4 13.7 12.7 13.9 15.0 14.4
SYLDa 0.50 1.10 3.64 2.29 2.91 2.51 2.85 3.17 3.18 4.61
Planting and Structural BMPs
a : SYLD (sediment yield, ton/ha·yr)
SYLD ranges BMPs application Sub-basins
2 > Grassed swale, Planting 2, 4
2~4 Grassed swale, Contour farming,Parallel terrace, Filter strip
5, 7, 8, 12, 13, 16, 17
4<Grassed swale, Contour farming,
Parallel terrace, Filter strip,Farm pond, Grade stabilization structure
18
Soil erosion yield in sub-basins
BMPs application as Soil erosion yield
S2-BMPs for Agricultural Activities
By NAAS report

Division of Climate Change, Environmental Strategy Research Group Korea Environment Institute
Representative SWAT parameter
BMP Function Variables (Input file)
Value with no BMP
Value with BMPsin good condition
Grassed swale/Planting
Increase channel cover CH_COV 1.0 0.25
Reduce channel erodibility CH_EROD 0.6 0.15
Increasing channel roughness CH_N2 0.14∼0.28 0.24
Contour farming/Parallel terrace
Reduce overland flow CN2 83 62
Reduce sheet erosing USLE_P 1.0 0.54
Field border Increase sediment trapping FILTERW 0 5
Farm retention pond Present pothole
POT_FR 0 0.3
POT_TILE 0 0.1
POT_VOLX 0 0.05
Grade stabilizationstructure
Reduce gully erosion CH_EROD 0.6 0.15
Decrease cover factor USLE_C Assigned by SWAT 0.05
Planting and Structural BMPs
Representation BMPs with SWAT
S2-BMPs for Agricultural Activities

Division of Climate Change, Environmental Strategy Research Group Korea Environment Institute
S3-Retention Ponds and Wetlands
Representation of wetland
Wetland : 0.3~0.5 m in depth50 m X 400 m (2ha)
Pond : 1.5~2.0 m in depth50 m X 100 m (0.5ha)
Capacity : 0.6 X 10⁴ m3 (normal season)1.25 X 10⁴ m3 (rainy season)
Capacity : 0.75 X 10⁴ m3 (normal season)1.0 X 10⁴ m3 (rainy season)

Division of Climate Change, Environmental Strategy Research Group Korea Environment Institute
S3-Retention Pond and Wetland
Representation of wetland
Variable Name Definition Values
IPND1 Beginning month of mid-year nutrient settling "season" January
IPND2 Ending month of mid-year nutrient settling "season" December
WET_FR Fraction of sub-basin area that drains into wetland 0.02
WET_SED Initial sediment concentration in wetland water 20 mg L-1
WET_NSED Equilibrium sediment concentration in wetland water 5.00 mg L-1
WET_K Hydraulic conductivity of bottom of wetlands 0.03 mm hr-1
PSETLW1 Phosphorus settling rate in wetlands for months IPND1 through IPND2 0.7 m yr-1
PSETLW2 Phosphorus settling rate in wetlands for months other than IPND1-PND2 0.7 m yr-1
NSETLW1 Nitrogen settling rate in wetlands for months IPND1 through IPND2 0.3 m yr-1
NSETLW2 Nitrogen settling rate in wetlands for months other than IPND1-IPND2 0.3 m yr-1

Division of Climate Change, Environmental Strategy Research Group Korea Environment Institute
S3-Retention Pond and Wetland
Representation of pond
Variable Name Definition Values
PND_FR Fraction of sub-basin area that drains into ponds 0.01
PND_SED Initial sediment concentration in pond water 20 mg L
PND_NSED Equilibrium sediment concentration in pond water 5.00 mg L-1
PND_K Hydraulic conductivity of bottom of ponds0.01 mm hr-
1
PSETL1 Phosphorus settling rate in pond for months IPND1 through IPND2 0.7 m yr-1
PSETL2 Phosphorus settling rate in pond for months other than IPND1-IPND2 0.7 m yr-1
NSETL1 Nitrogen settling rate in pond for months IPND1 through IPND2 0.3 m yr-1
NSETL2 Nitrogen settling rate in pond for months other than IPND1-IPND2 0.3 m yr-1
CHLA Chlorophyll a production coefficient for ponds 1.00
SECCI Water clarity coefficient for ponds 1.00
NDTARG Number of days need to reach target storage from current pond storage 6 days
WUPND Average daily water removal from the pond for the month (104 m3 day-1) 0.3

Division of Climate Change, Environmental Strategy Research Group Korea Environment Institute
Sub-basins
Treatment plants
Capacity(m3 day-1)
Extensioncapacity
Advancedtreatment
13 Yongina 48,000 SS : 50% TN : 30%, TP : 30%
12 Ohphoa 7,000 SS : 50% TN : 30%, TP : 30%
7 Konjiamb 20,000 SS : 50% -
18 Kwangjua 5,000 SS : 50% TN : 30%, TP : 30%
4 Kyonganb 25,000 SS : 50% -
S4-Point Source Reduction
Reduction of WWTPs effluent
a : High effluent concentration of WWTPsb : WWTPs are above 20,000 m3/day of wastewater treatment capacity

Division of Climate Change, Environmental Strategy Research Group Korea Environment Institute
BMPs Results with SWAT

Division of Climate Change, Environmental Strategy Research Group Korea Environment Institute
BMPs Results with SWAT
No BMPs Scenario1 Scenario2 Scenairo3 Scenario4 Scenario5
SS Load(kg day-1) 12,482,821 10,893,567 9,198,252 12,001,671 10,094,213 4,087,902
Conc.(mg L-1) 12.72 11.45 10.27 12.01 10.00 7.36
Efficiency (%) - 12.5 27.9 4.4 20.3 64.3
TN Load(kg day-1) 1,792,960 1,691,642 1,627,892 1,775,987 1,492,383 1,214,915
Conc.(mg L-1) 4.86 4.65 4.50 4.83 4.21 3.61
Efficiency (%) - 5.5 9.3 1.0 16.7 32.2
TP Load(kg day-1) 80,501 75,816 68,332 79,489 66,686 49,221
Conc.(mg L-1) 0.245 0.233 0.216 0.242 0.211 0.169
Efficiency (%) - 5.9 14.8 1.3 17.3 38.7
Annual pollutant load reduction
Scenario 5 > Scenario 2 and Scenario 4 > Scenario 1 > Scenario 3

Division of Climate Change, Environmental Strategy Research Group Korea Environment Institute
Conclusion and Future study

Division of Climate Change, Environmental Strategy Research Group Korea Environment Institute
Conclusion and Future studies
• Modification of the database for BASINS
• Good calibration and validation in the KSW
• Useful to simulate and evaluate pollutant load in the
watershed-scale
• Representation of BMPs into appropriate with SWAT
• Useful to propose the integrated watershed
management strategy
• Analysis of BMPs cost-benefit effect
• Water quality impacts on Climate Change

Division of Climate Change, Environmental Strategy Research Group Korea Environment Institute
Thank you for attention !!