Embed Size (px)
Citation preview

www.nucleide.org
Evaluation of uncertainties, the classical approach (GUM) and their application in radionuclide
metrology
Philippe CassetteLaboratoire national Henri Becquerel, France
2
PHYSICISTS VS. STATISTICIANS
“If your experiment needs statistics, you ought to have done a better experiment “ Ernest Rutherford (1871 – 1937)
« Life is only good for two things : developping mathematics and teaching mathematics»Siméon Denis Poisson, 1781-1840
Between these two extreme opinions, there is perhaps a way. If it is true that metrology is too serious to be left to statisticians, a reasonable use of statistical tools could help in doing good measurements…

3
La bible, le GUM
The holy Bible: the GUM
4
HISTORICAL PERSPECTIVE
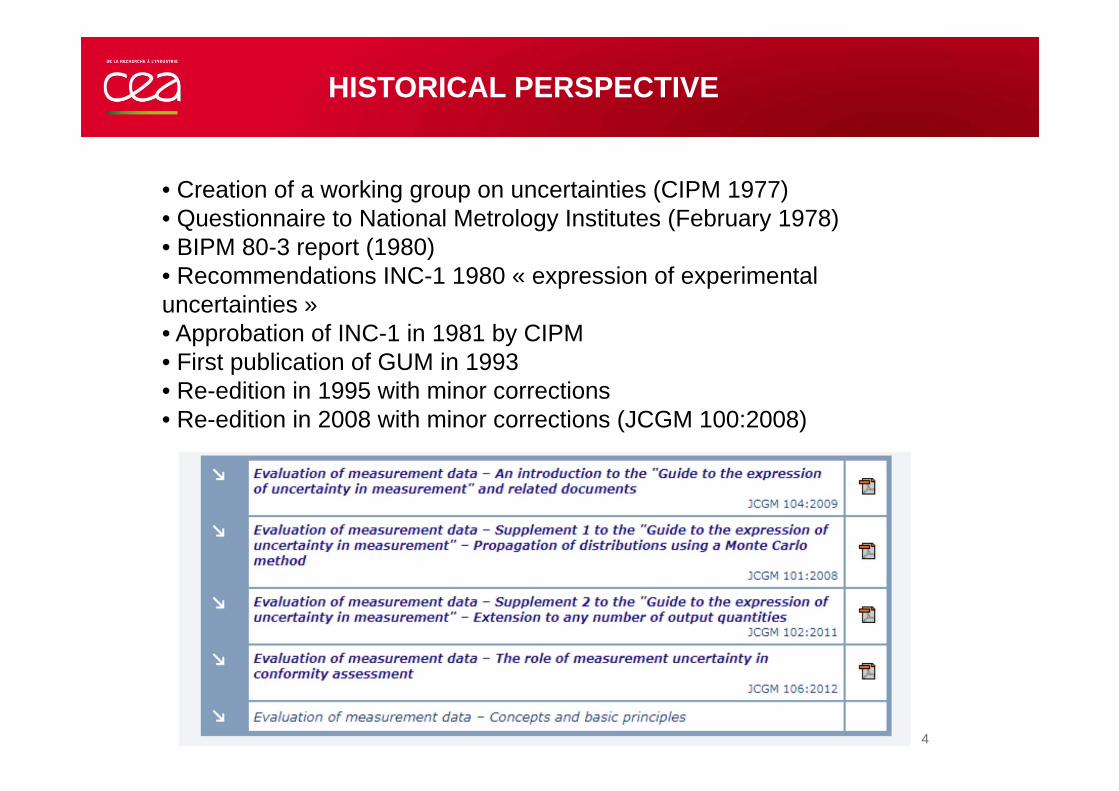
• Creation of a working group on uncertainties (CIPM 1977)• Questionnaire to National Metrology Institutes (February 1978)• BIPM 80-3 report (1980)• Recommendations INC-1 1980 « expression of experimental uncertainties »• Approbation of INC-1 in 1981 by CIPM• First publication of GUM in 1993• Re-edition in 1995 with minor corrections• Re-edition in 2008 with minor corrections (JCGM 100:2008)
5
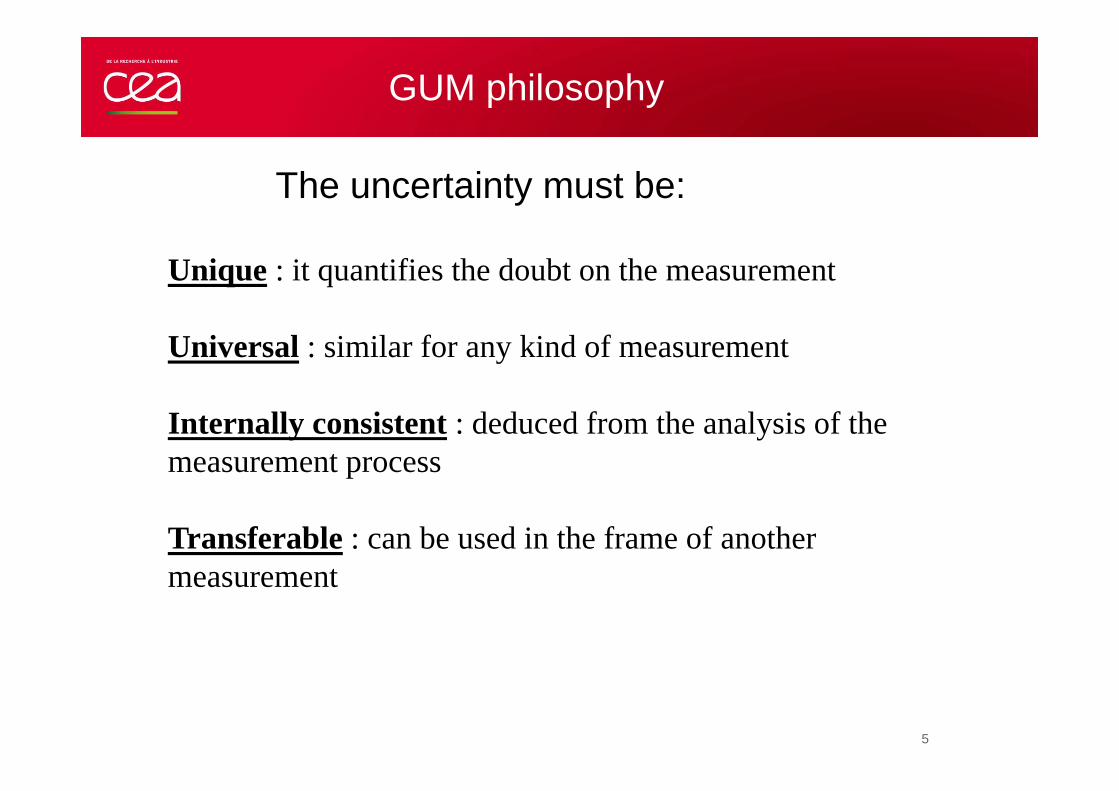
Unique : it quantifies the doubt on the measurement
Universal : similar for any kind of measurement
Internally consistent : deduced from the analysis of the measurement process
Transferable : can be used in the frame of another measurement
GUM philosophy
The uncertainty must be:
6
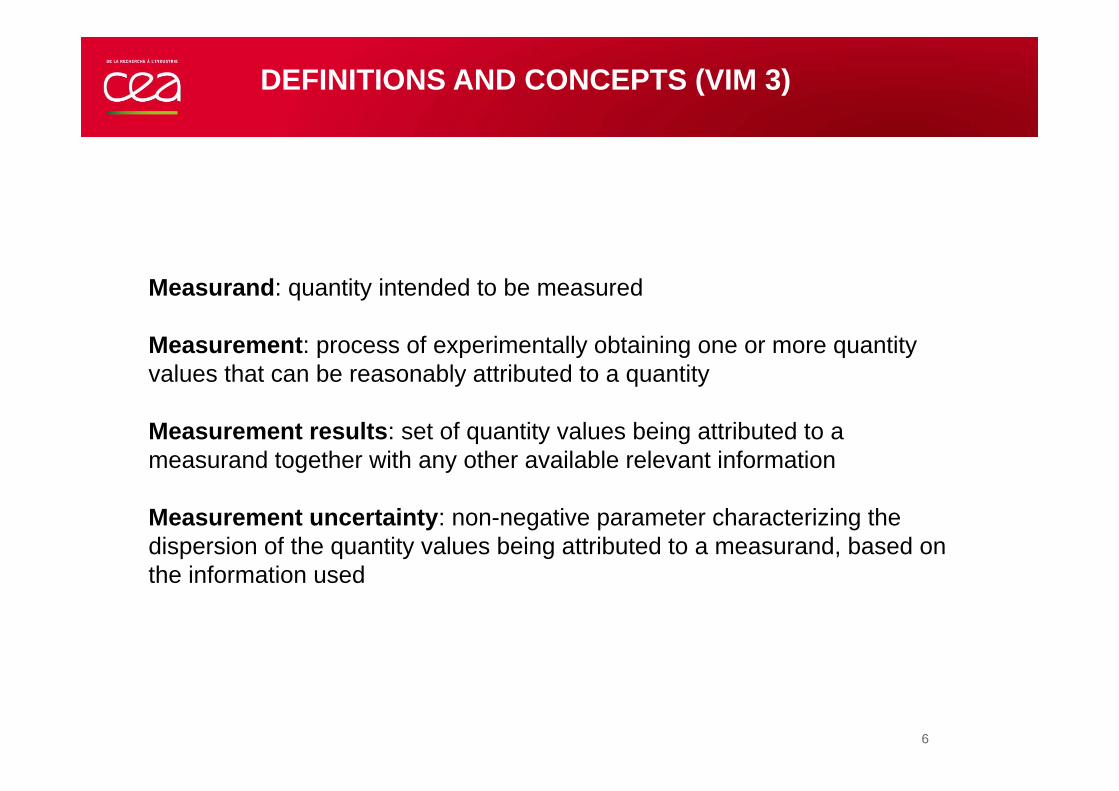
DEFINITIONS AND CONCEPTS (VIM 3)
Measurand: quantity intended to be measured
Measurement: process of experimentally obtaining one or more quantity values that can be reasonably attributed to a quantity
Measurement results: set of quantity values being attributed to a measurand together with any other available relevant information
Measurement uncertainty: non-negative parameter characterizing the dispersion of the quantity values being attributed to a measurand, based on the information used
7
DEFINITIONS AND CONCEPTS
The result of a measurement is a random variable…… and must be treated accordingly
Reminder : errors and uncertainties are not equivalent:
Measurement error: measured quantity value minus a reference quantity value
If a systematic error is suspected, it must be corrected… this does not suppress the doubt, thus the uncertainty on the result
UNCERTAINTY = DOUBT
8
The result of a measurement is a random variable (RV)
The value of the measurement is the expectation of this RV
Uncertainty is the doubt on the result… it is related to the dispersion of the RV, so to its variance
The main goal of uncertainty evaluation is the determination of the optimum estimator of the variance of the measurement (even if the expression of this uncertainty can depend on its practical use)
Summary
9
STEPS OF UNCERTAINTY EVALUATION
• Definition of the measurand (very important!)
• Identification of the parameters of influence (experimental data, correction coefficients…)
• Relation between the input parameters and the result (transfer function)
• Evaluation of the variance of each input parameter, and the covariances between these parameters
• Propagation of variances and covariances to obtain the combined standard uncertainty
• If necessary, expand the uncertainty
• Express the measurement result and its associated uncertainty
“ A measurement without uncertainty is not a measurement ” (me)
10
DEFINITION OF THE MEASURAND
• Before measuring, define precisely and exhaustively the measurand (this is not a trivial task!)
• Include in the definition all the parameters which could have a significant influence on the results
• Think about the possible use of the measurement results, to avoid any ambiguity on the definition of the measurand
11
EVALUATION OF INPUT QUANTITIES
Experimental data:• Count rates, masses, volumes, peak area,…
Physical parameters of influence:• Temperature, pressure, humidity, density…
Correction factors:• Calibration coefficients, detection efficiency, coincidence summing…
Standards:• Of activity, masses, time, frequency…
Theoretical data:• Emission intensities, equilibrium factors, decay scheme data…
12
TRANSFER FUNCTION
),...,( 21 nxxxfy
y is the measurement result and the xi are the input quantities (experimental data, coefficients, decay data…)
13
STANDARD UNCERTAINTY OF INPUT PARAMETERS
Each input quantity is considered as a random variableThe standard deviation of each input quantity can be evaluated by 2 methods:
Type A evaluation method: repetition of the measurement and calculation of the experimental standard deviation of the mean of a quantity
Type B evaluation method: evaluation of the standard deviation of the input quantity by scientific judgment based on all the available information on the possible variability of this quantity. This information can include:
• previous measurement data• experience with or general knowledge of the behavior and properties of
relevant materials and instruments• manufacturer's specifications• data provided in calibration and other certificates• uncertainties assigned to reference data taken from handbooks
14
TYPE A EVALUATION METHOD
• Independent repeated measurements
• Calculation of the arithmetic mean (if similar measurements)
• Calculation of the experimental variance and standard deviation
• Calculation of the standard deviation of the mean
If the measurement is repeated under the same conditions (i.e. if the measurement concerns the same measurand)… the standard deviation of the arithmetic mean is a good estimator of the standard uncertainty of the input quantity
15
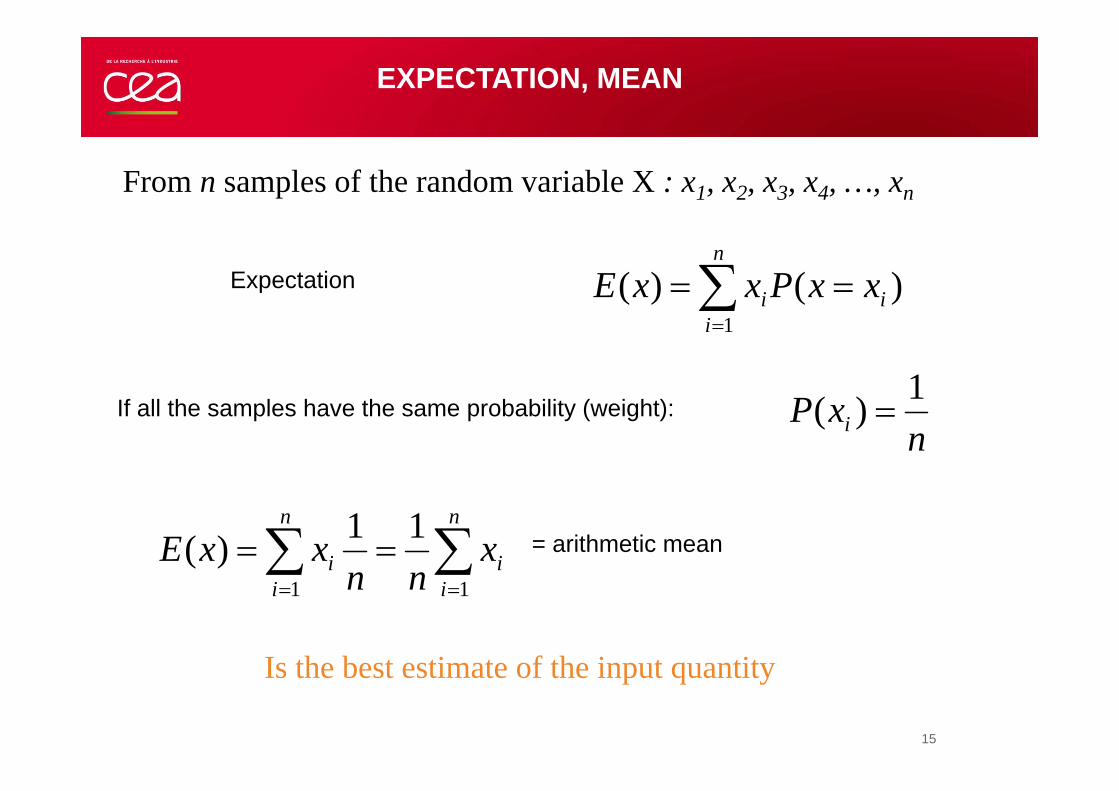
From n samples of the random variable X : x1, x2, x3, x4, …, xn
Is the best estimate of the input quantity
n
iii xxPxxE
1)()(Expectation
If all the samples have the same probability (weight):n
xP i1)(
n
i
n
iii x
nnxxE
1 1
11)( = arithmetic mean
EXPECTATION, MEAN
16
2
1)(ix
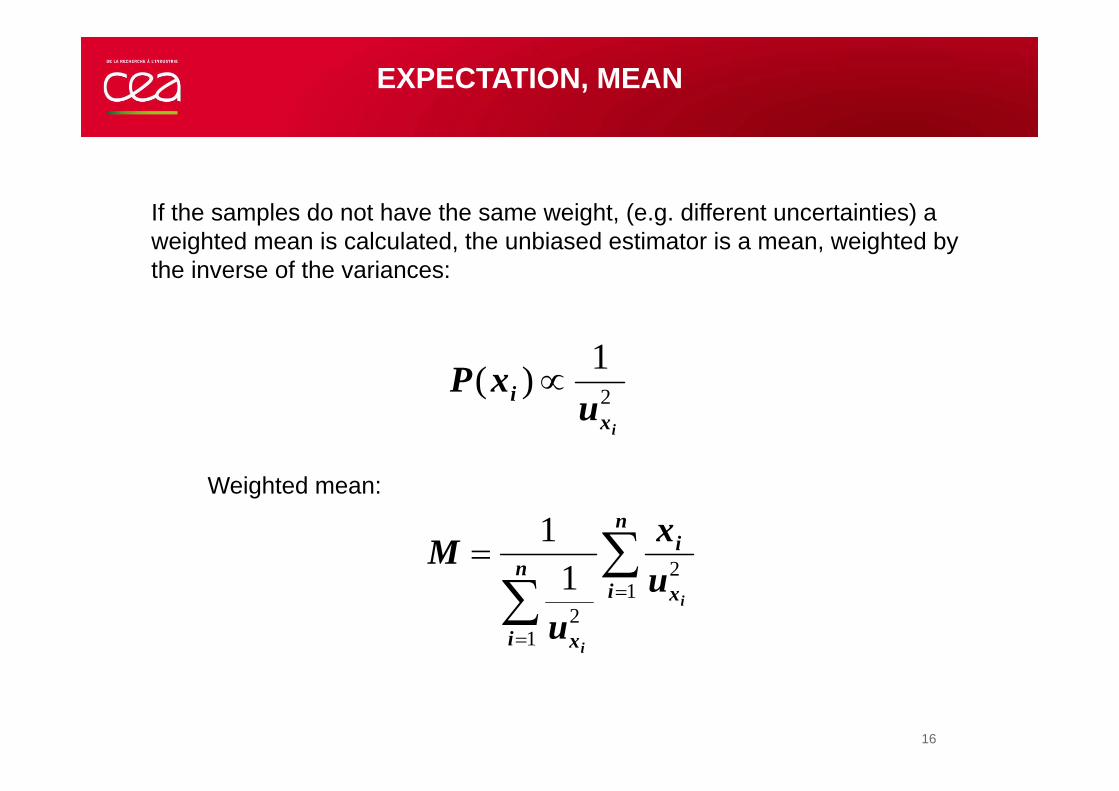
i uxP
If the samples do not have the same weight, (e.g. different uncertainties) a weighted mean is calculated, the unbiased estimator is a mean, weighted by the inverse of the variances:
Weighted mean:
n
i x
in
i x
i
i
ux
u
M1
2
121
1
EXPECTATION, MEAN
17
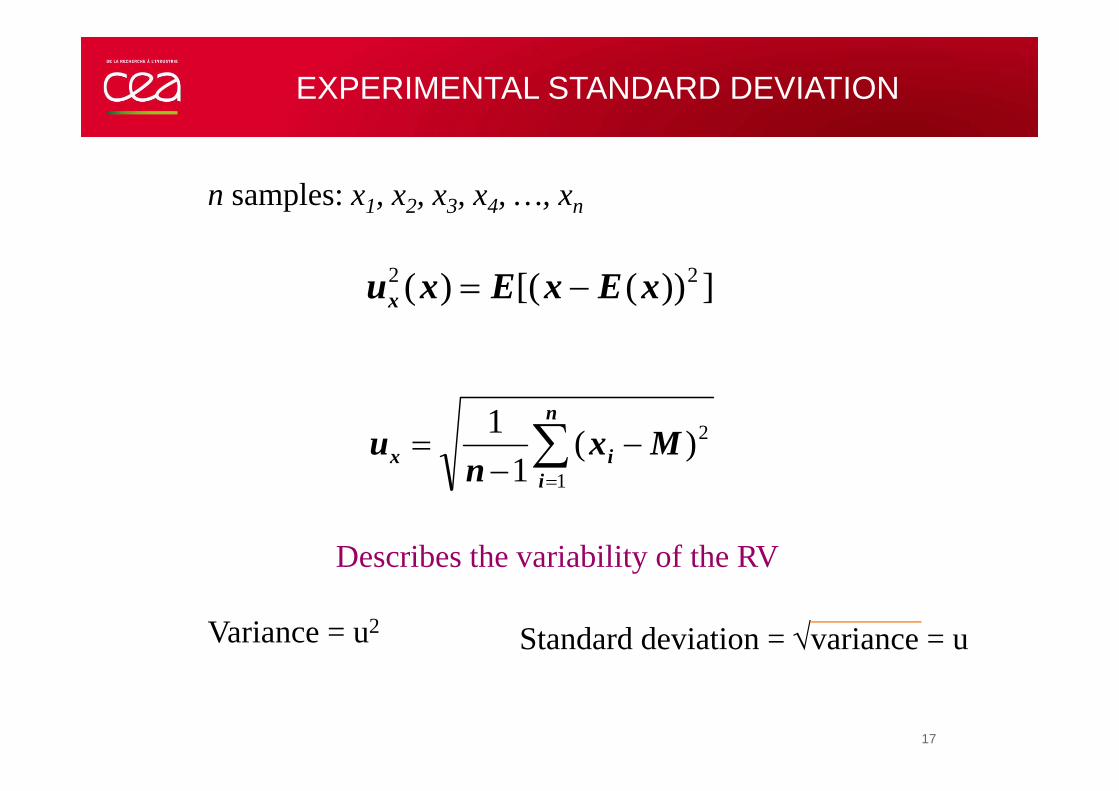
EXPERIMENTAL STANDARD DEVIATION
2
1)(
11 Mx
nu
n
iix
Describes the variability of the RV
n samples: x1, x2, x3, x4, …, xn
Variance = u2 Standard deviation = variance = u
]))([()( 22 xExExux
18
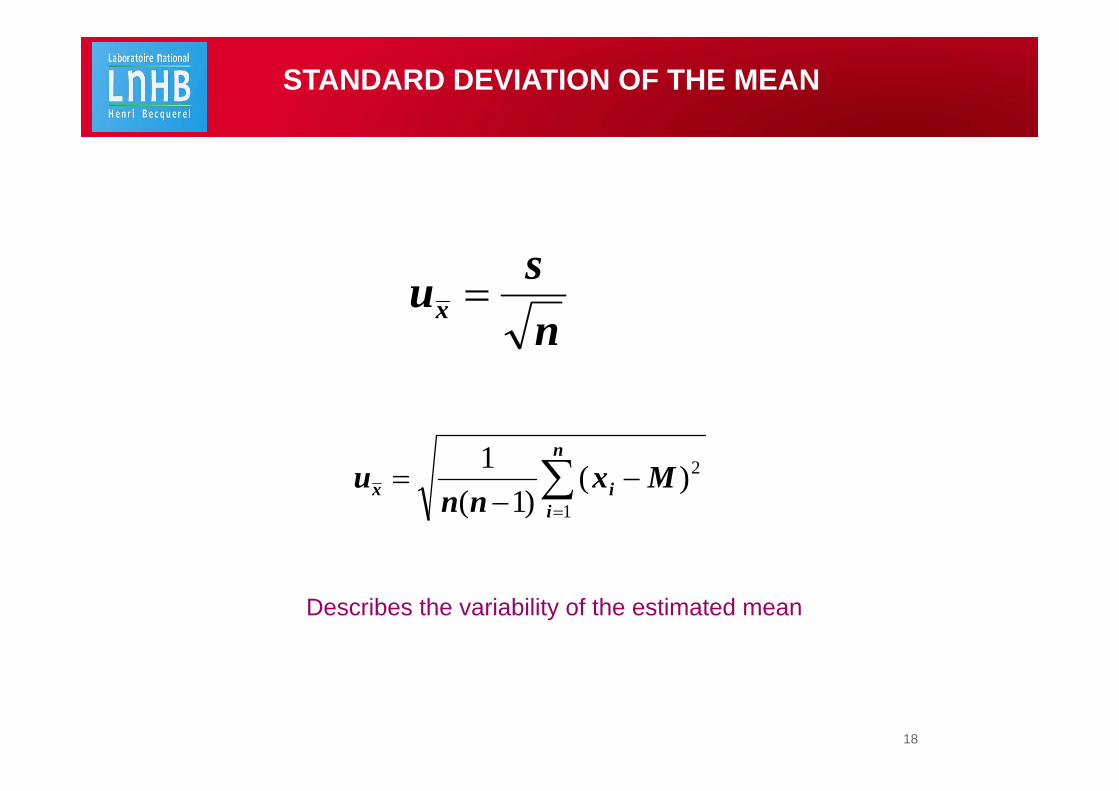
STANDARD DEVIATION OF THE MEAN
nsux
Describes the variability of the estimated mean
2
1)(
)1(1 Mx
nnu
n
iix
19
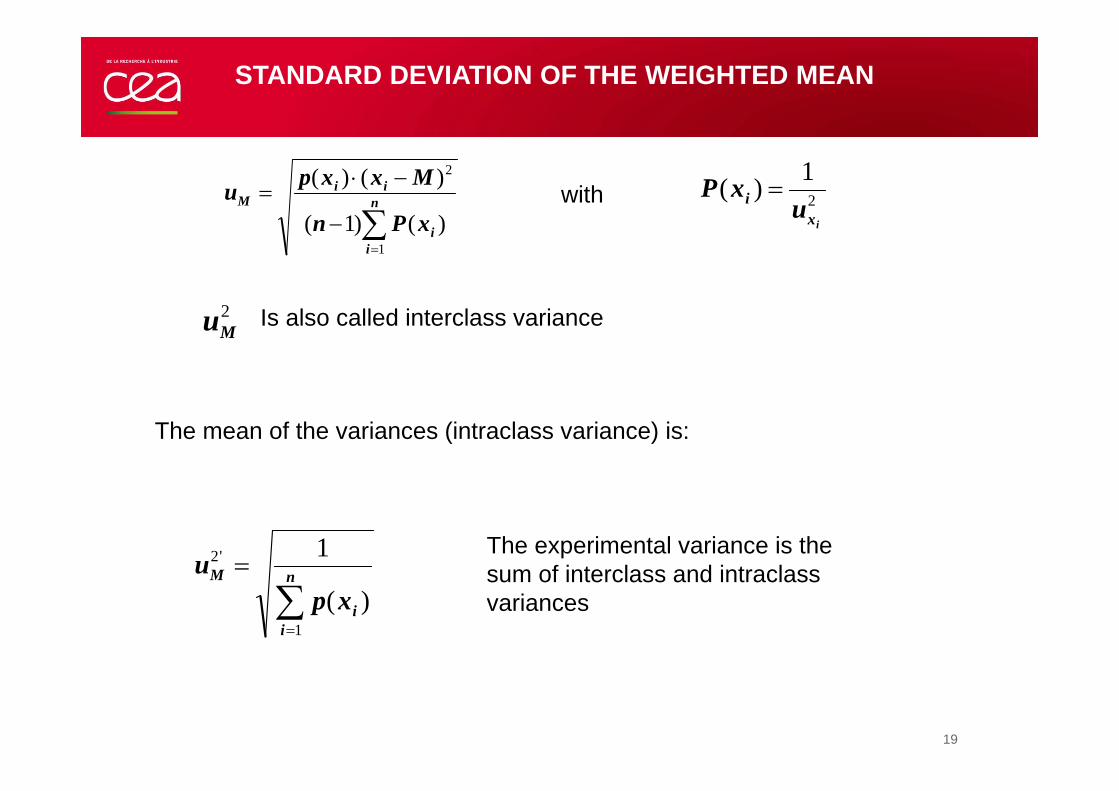
STANDARD DEVIATION OF THE WEIGHTED MEAN
n
ii
iiM
xPn
Mxxpu
1
2
)()1(
)()(2
1)(ix
i uxP
n
ii
M
xpu
1
'2
)(
1
with
Is also called interclass variance
The mean of the variances (intraclass variance) is:
2Mu
The experimental variance is the sum of interclass and intraclassvariances
20
The experimental standard deviation gives the dispersion of the measurements. When the number of measurements increases, it does not vary significantly, but is more precisely known…
The standard deviation of the mean gives the dispersion of the estimated mean.When the number of measurements increases, it decreases (as the inverse of the square root of the number of measurements)
EXPERIMENTAL STANDARD DEVIATION OR STANDARD DEVIATION OF THE MEAN?
21
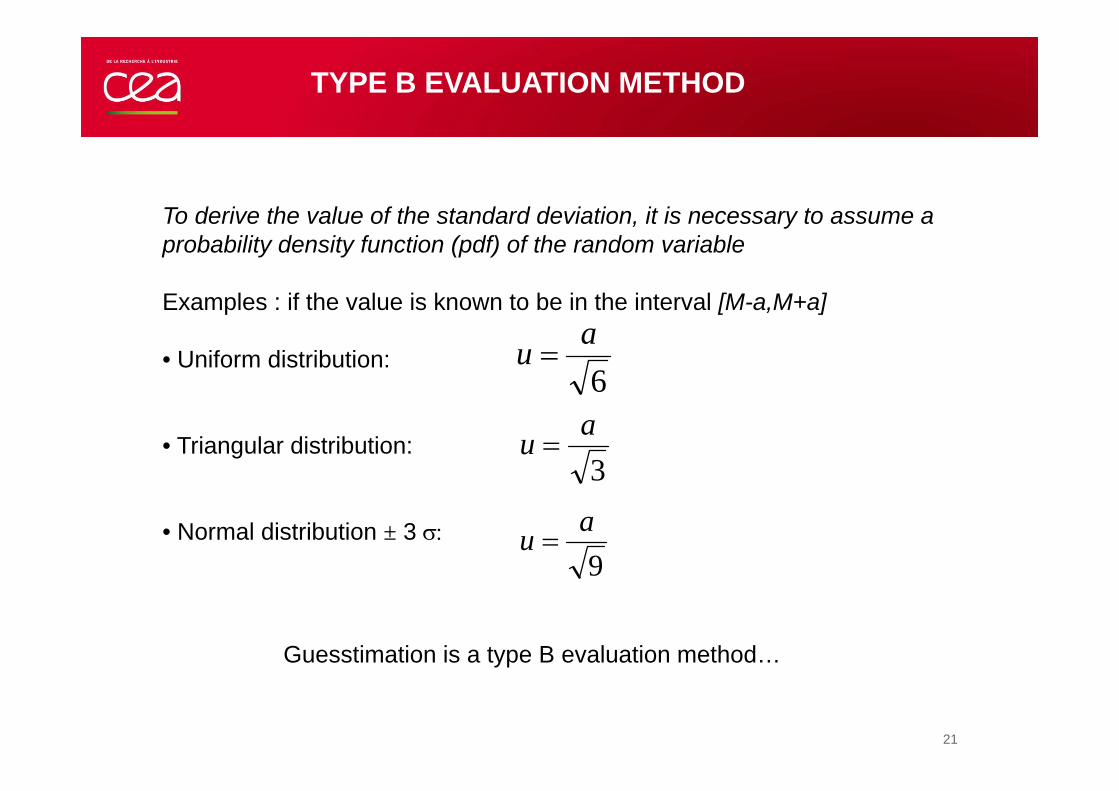
TYPE B EVALUATION METHOD
3au
6au
To derive the value of the standard deviation, it is necessary to assume a probability density function (pdf) of the random variable
Examples : if the value is known to be in the interval [M-a,M+a]
• Uniform distribution:
• Triangular distribution:
• Normal distribution ± 3
Guesstimation is a type B evaluation method…
9au
22
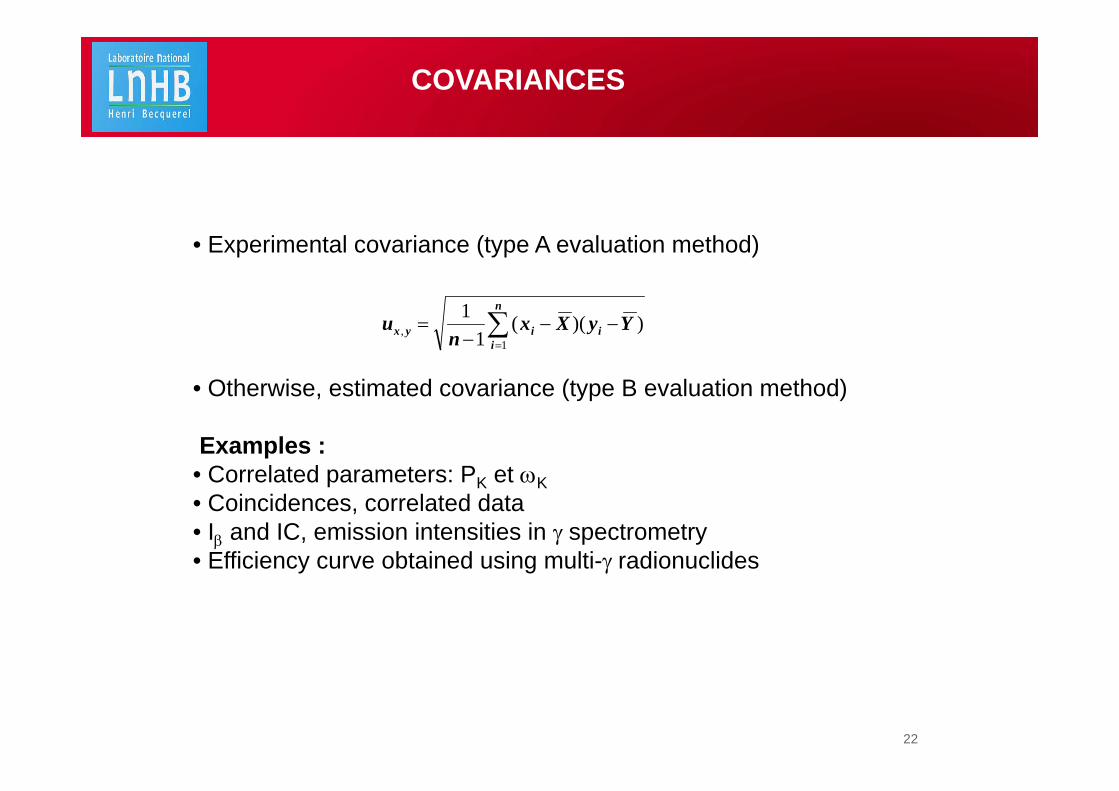
COVARIANCES
• Experimental covariance (type A evaluation method)
• Otherwise, estimated covariance (type B evaluation method)
Examples : • Correlated parameters: PK et K• Coincidences, correlated data• I and IC, emission intensities in spectrometry• Efficiency curve obtained using multi-radionuclides
))((1
11
, YyXxn
u i
n
iiyx
23
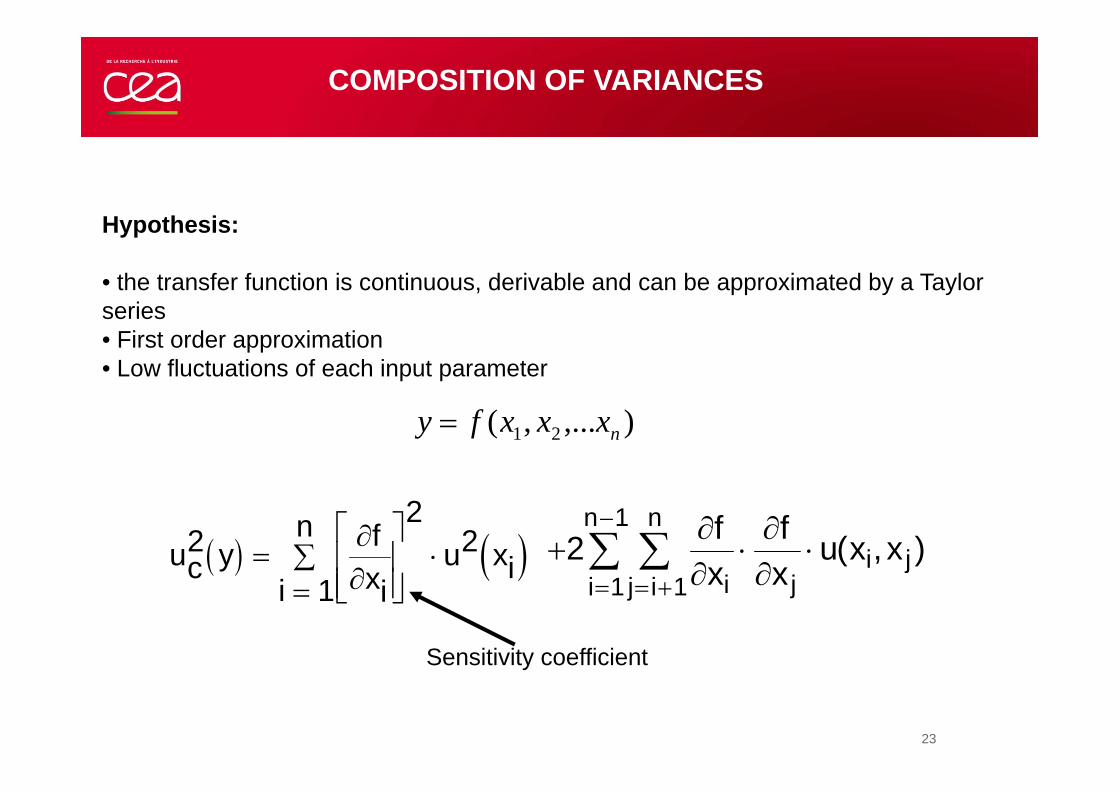
COMPOSITION OF VARIANCES
Hypothesis:
• the transfer function is continuous, derivable and can be approximated by a Taylor series• First order approximation• Low fluctuations of each input parameter
),...,( 21 nxxxfy
uc2 y f
xii
nu xi
1
22
211
1
fx
fx
u x xij i
n
i
n
ji j( , )
Sensitivity coefficient
24
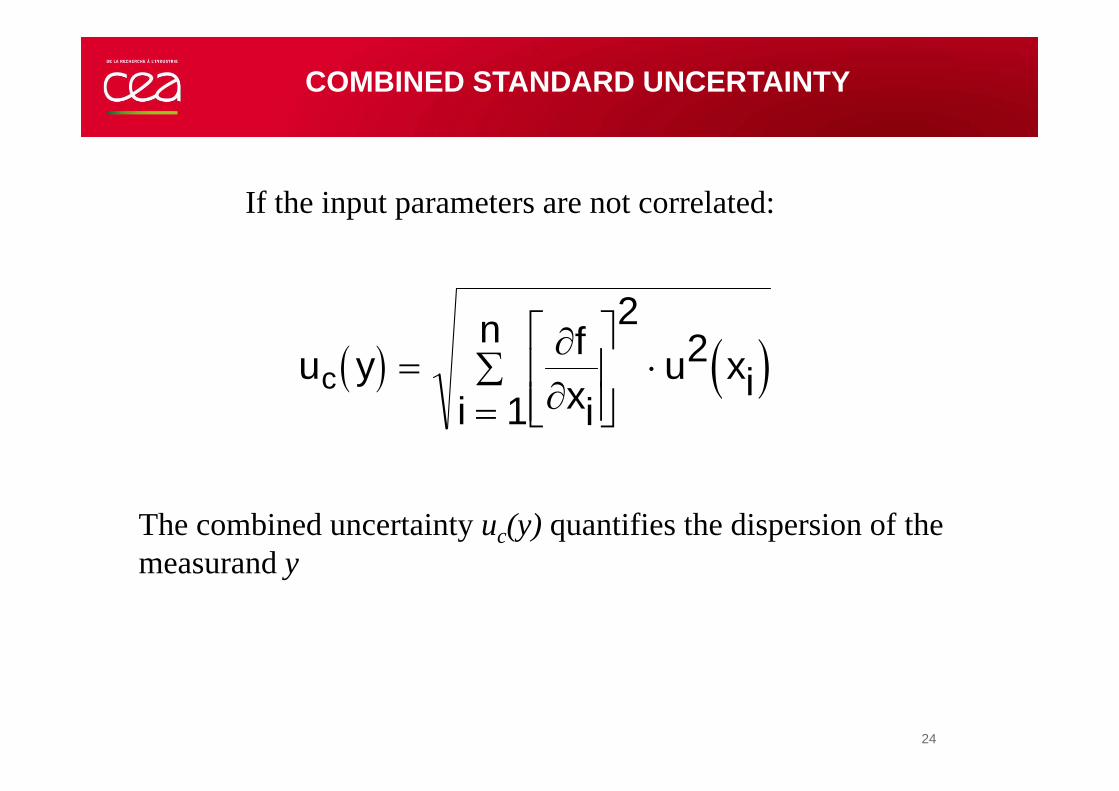
If the input parameters are not correlated:
uc y fxii
nu xi
1
22
The combined uncertainty uc(y) quantifies the dispersion of the measurand y
COMBINED STANDARD UNCERTAINTY
25
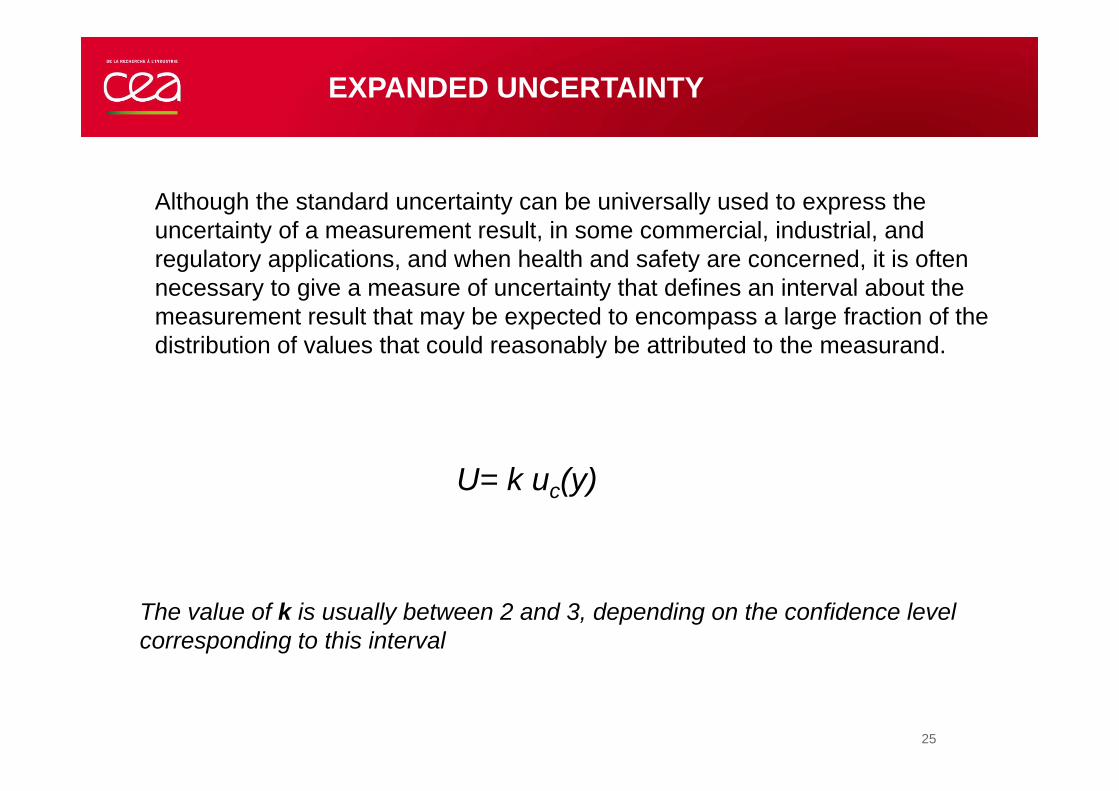
EXPANDED UNCERTAINTY
The value of k is usually between 2 and 3, depending on the confidence level corresponding to this interval
Although the standard uncertainty can be universally used to express the uncertainty of a measurement result, in some commercial, industrial, and regulatory applications, and when health and safety are concerned, it is often necessary to give a measure of uncertainty that defines an interval about the measurement result that may be expected to encompass a large fraction of the distribution of values that could reasonably be attributed to the measurand.
U= k uc(y)
26
Expression of the uncertainty
Uncertainty can be expressed as:
• standard uncertainty (square root of the variance) • or k times the standard uncertainty (k must be stated)• or by the determination of a confidence interval, with associated probability,
after assuming the statistical distribution of the results, and considering the effective degrees of freedom
The GUM is a consensual document, and no strict rule is given on the way to express the uncertainties, even if the Gaussian distribution of the results is sometimes implicit and allows a simple calculation of confidence intervals
From a statistical point of view, the GUM mixes frequential and Bayesian definitions of probabilities. The GUM supplement 1 is based on a Bayesian approach.
Nevertheless, even if “pure statisticians” can be frustrated, the GUM approach works and gives a sound way to express uncertainties
27
In metrology of radioactivity
• For international comparisons, the uncertainty is generally reported as a standard uncertainty (CIPM recommendation)
• For calibration certificates, the accreditation bodies generally impose expanded uncertainties (k=2)… even if this does no give any supplementary information versus the standard uncertainty*
• Thus, in practice, the determination of the standard uncertainty is the main goal of uncertainty evaluation, and we will see that GUM is perfectly suitable for that
* Supplementary information (if any) is thus implicit, preventing the necessity of justification. Nevertheless, one can consider that this approach is not a sign of intellectual probity…
28
CONFIDENCE INTERVAL
If one wants to derive the confidence interval from the standard uncertainty, it is necessary to assume a statistical distribution of the results
Generally, this distribution is unknown… but the central limit theorem can be evoked as an argument for using a Gaussian distribution!
Warning: the statistical distribution of the mean of a RV could differ from the distribution of the RV:
Examples: • Poisson distribution: the distribution of the evaluated mean is Gaussian• Gaussian distribution: the distribution of the evaluated mean is a Student distribution with degrees of freedom
29
NUMBER OF DEGREES OF FREEDOM
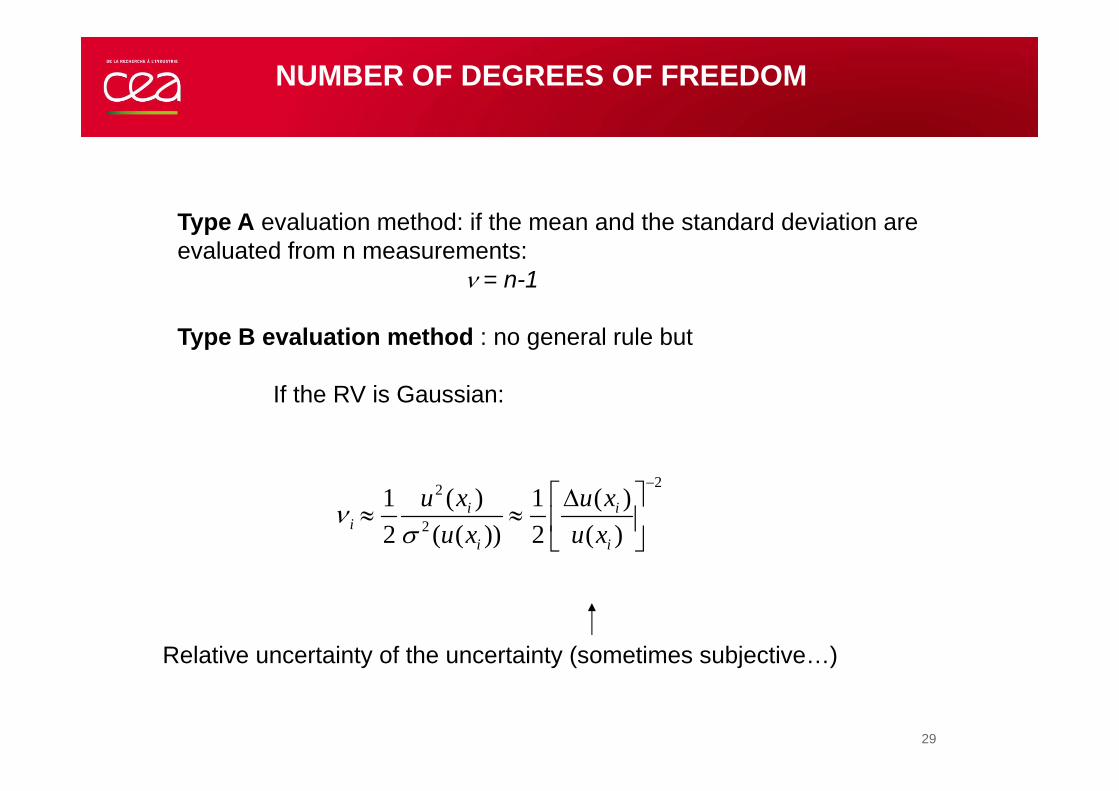
Type A evaluation method: if the mean and the standard deviation are evaluated from n measurements:
= n-1
Type B evaluation method : no general rule but
If the RV is Gaussian:
22
2
( ) ( )1 12 ( ( )) 2 ( )
i ii
i i
u x u xu x u x
Relative uncertainty of the uncertainty (sometimes subjective…)
30
EFFECTIVE NUMBER OF DEGREES OF FREEDOM
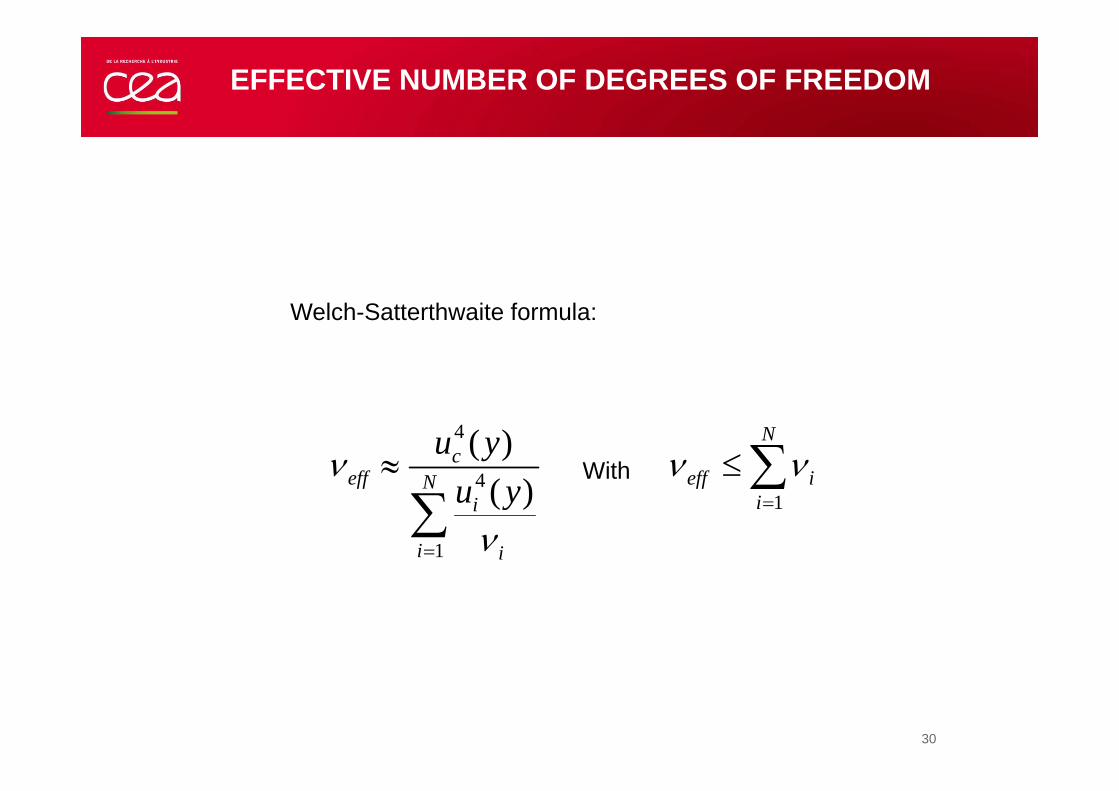
Welch-Satterthwaite formula:
4
41
1
( )( )
Nc
eff eff iNii
i i
u y avecu y
With
31
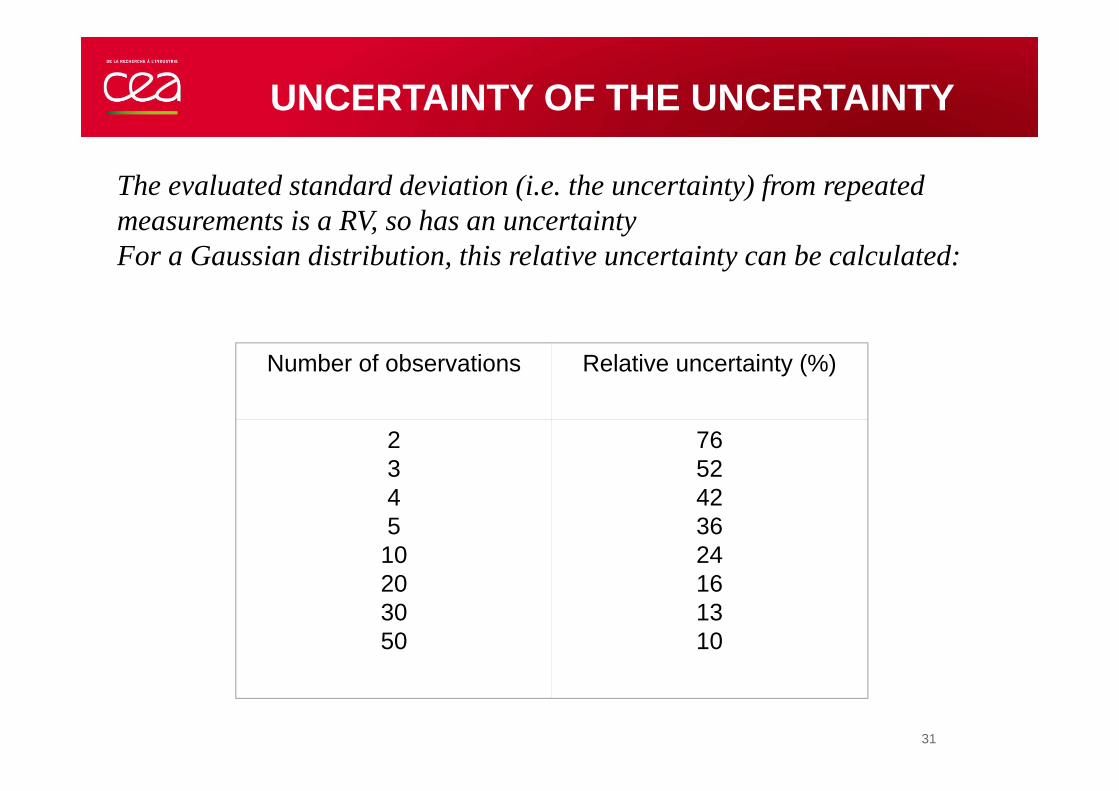
UNCERTAINTY OF THE UNCERTAINTY
The evaluated standard deviation (i.e. the uncertainty) from repeated measurements is a RV, so has an uncertaintyFor a Gaussian distribution, this relative uncertainty can be calculated:
Number of observations Relative uncertainty (%)
234510203050
7652423624161310
32
CONSEQUENCES
• Uncertainty must be rounded
• Bear in mind that the uncertainty of the uncertainty also concerns all its applications, e.g. :
• the boundaries of the confidence intervals,• the decision thresholds and detection limits…
Exercise 1: what are the boundaries of a confidence interval with a probability of 95,5 % of a Gaussian RV derived from the measurement of 10 samples ?
Comment: what is the point of giving a Student factor with 3 significant digits? (the one who never saw a 1.96 factor in the calculation of detection limits can blame me!)
33
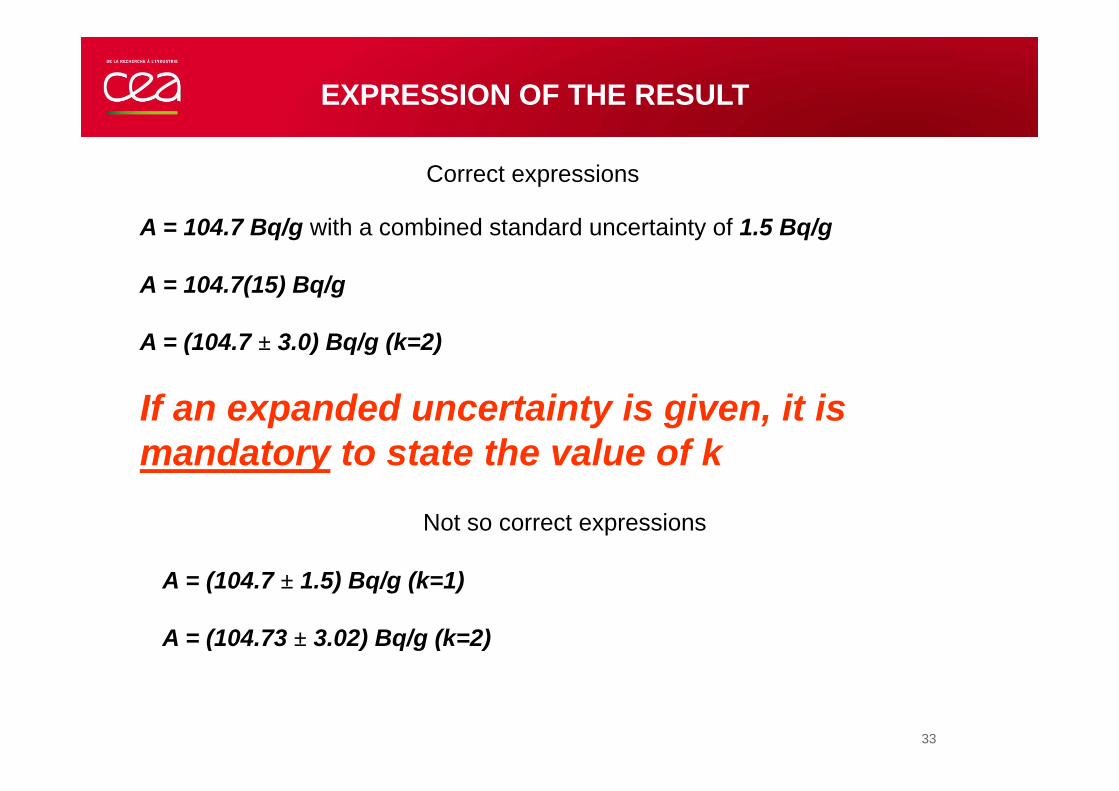
EXPRESSION OF THE RESULT
A = 104.7 Bq/g with a combined standard uncertainty of 1.5 Bq/g
A = 104.7(15) Bq/g
A = (104.7 ± 3.0) Bq/g (k=2)
If an expanded uncertainty is given, it is mandatory to state the value of k
Correct expressions
Not so correct expressions
A = (104.7 ± 1.5) Bq/g (k=1)
A = (104.73 ± 3.02) Bq/g (k=2)
34
ON THE GOOD USE OF THE GUM
Although the GUM provides a framework for assessing uncertainty, it cannot substitute for critical thinking, intellectual honesty and professional skill.
The evaluation of uncertainty is neither a routine task nor a purely mathematical one; it depends on detailed knowledge of the nature of the measurand and of the measurement.
The quality and utility of the uncertainty quoted for the result of a measurement therefore ultimately depend on the understanding, critical analysis, and integrity of those who contribute to the assignment of its value.
35
Gaussian implicit hypothesis in the GUM?
• Gaussian hypothesis is not needed to use type A evaluation methods (the estimators of the mean and of the variance are unbiased and of minimum variance, even if the distribution is unknown)
• Gaussian hypothesis is not imposed for type B evaluation methods
• Gaussian hypothesis is not necessary for the propagation of variances
• Gaussian hypothesis is not required if the uncertainty is expressed as a standard or expanded uncertainty… but in this case the expanded uncertainty does not give more information than the standard uncertainty
36
PRACTICAL EXAMPLE: MEASUREMENT OF A RADIOACTIVE SOLUTION
Activity determination of the activity of a solution
n sources are prepared
Each source is measured m times
Why n sources, how to choose n ?
Why m measurements of each source, how to choose m ?
What are the uncertainties in each case ?
Questions:
37
WHY n SOURCES ?
1. When an activity measurement is made from a sampling process, is the sampling representative of the measurand?
2. Is there a hidden variability in the source fabrication?
To answer the following questions:
38
REPRESENTATIVITY OF THE SAMPLE?
Several samples giving several sources. It can be expected that any sampling bias will be cancelled out when using the mean, for a large number of samples
Generally this is not obvious, but if there is a variability in the sampling process, there is little chance that the samples are similar. Thus in this case an extra variance should be observed
Practical reasons: solution inhomogeneity or source instability

39
HIDDEN VARIABILITY IN THE SOURCE PREPARATION PROCESS?
Example : evaporation during the weighing process, droplet losses during the pycnometer manipulation
This can be checked through the preparation and measurement of several sources, If there is a variability in the source preparation process, an extra variance of the results should be observed
How?
Compare the experimental variance of the counting rate of different sources with the counting rate of one source for the same counting time and taking into account the weighing uncertaintyIf the results are consistent (within say 30%), no extra variabilityIf the results are not consistent, look for possible variability
40
HOW TO CHOOSE THE NUMBER OF SOURCES n?
n=1 : for lazy (and happy) people
n=2 : in case of significant differences, how to conclude?
n=3 : one can vote, 2 against 1, but difficult to justify…
n=5 : minimum sample for sound comparison
n=10 or more: statistical tools can be used…
But of course, there are other constraints (available time, manpower, cost, etc.)
41
WHY m repetitions?
It is better to repeat m times a measurement of duration t, instead of one measurement of duration mt
The statistical uncertainty is the same but this gives the possibility to calculate the experimental standard deviation (and the experimental covariances)
This provides a good way to check that there is no extra variability in the measurement process and allow the detection of:
• Non-steady noise (e.g. parasitic pulses)• Instrument shift (e.g. from variation of ambient conditions)• Allow the use of type A evaluation method of uncertainties
Comment: if x pulses are recorded: • considering x as the variance supposes a hypothesis on the pdf (Poisson)
and is a type B evaluation method• Repeating the measurement and using the experimental variance is a type
A evaluation method
42
EXPERIMENTAL STANDARD DEVIATION OR STANDARD DEVIATION OF THE MEAN?
If the measurements are made under strictly similar conditions (i.e. if the measurand is the same and observed fluctuations are under statistical control), the standard deviation of the mean must be used
If there is a hidden variability (from source preparation or from instrumental instability), and if this variability cannot be fixed, it is safer to consider the experimental standard deviation
In each case it is pertinent to compare the observed standard deviation with the expected uncertainty (i.e. considering all the known sources of uncertainty: weighing, counting statistics…)
43
WHAT IS MORE PRECISE, TYPE A OR TYPE B EVALUATIONMEHODS?
This question is only pertinent if the choice is possible (e.g. for a counting process)
Type A evaluation method:
• No hypothesis needed, but not very accurate if the number of repetitions is small (remember about 25% uncertainty of the uncertainty for 10 repetitions in case of Gaussian distribution)
• Gives useful experimental information on the variability of the measurement process
Type B evaluation method:
• Could be accurate if there is a good justification on the pdf to use. • For counting processes, Poisson distribution is generally acceptable. In
the presence of dead-time, the variance is lower than the Poisson variance
If you are Bayesian, type B is the only way!
44
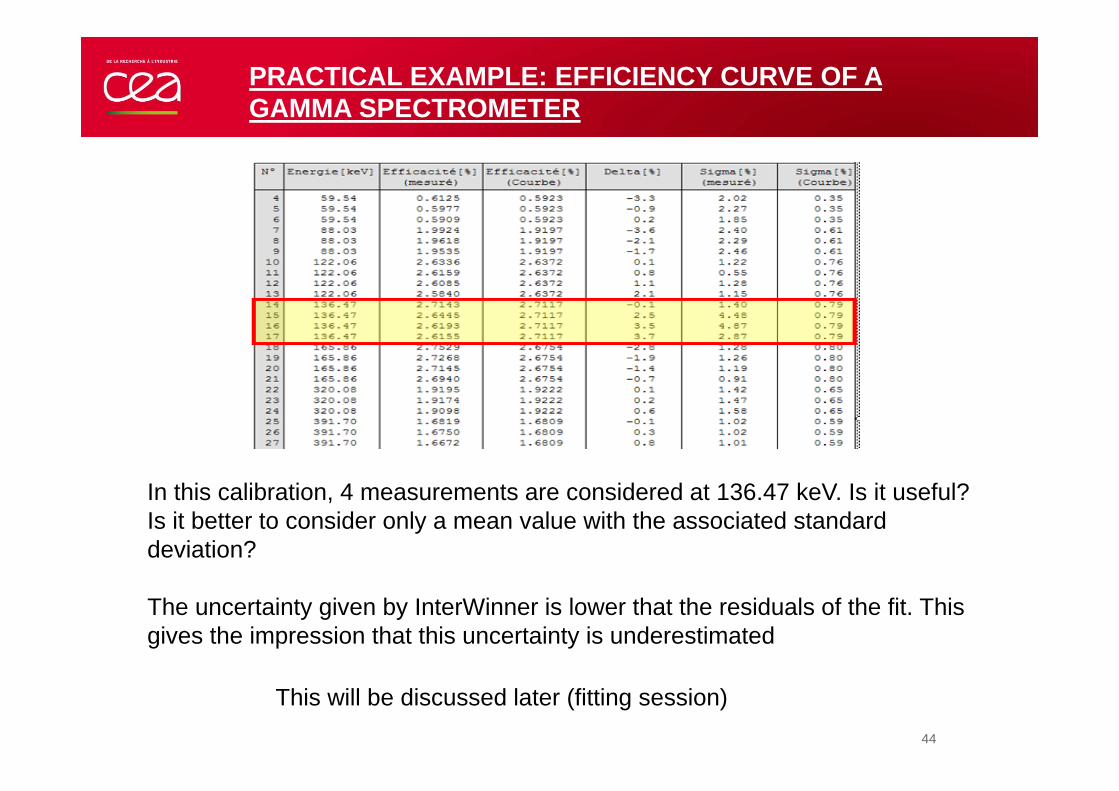
PRACTICAL EXAMPLE: EFFICIENCY CURVE OF A GAMMA SPECTROMETER
In this calibration, 4 measurements are considered at 136.47 keV. Is it useful? Is it better to consider only a mean value with the associated standard deviation?
The uncertainty given by InterWinner is lower that the residuals of the fit. This gives the impression that this uncertainty is underestimated
This will be discussed later (fitting session)

45
EVOLUTION OF THE GUM
Various documents: see https://www.bipm.org/en/publications/guides/gum.html
46
REVISION OF THE GUM
In 2015-2016, the JCGM attempted to revise the GUM:
Goal: make it more internally consistent, on a Bayesian frame
Consultation of the members: (BIPM, CEI, IFCC, ILAC, ISO, UICPA, UIPPA et OIML)
Consultation of the users and the NMIs
Major rejection of the new text
Actual situation: status quo… but a new revision is under way
We hope that the JCGM learned the lessons of the first revision process

47
Thank you for your attention


![[XLS]fta.mofcom.gov.cnfta.mofcom.gov.cn/dongmeng/annex/wenlaijiangshui.xls · Web view- Lac 1301.20.00 - Gum Arabic 1301.90.10 - - Gum benjamin 1301.90.20 - - Gum damar 1301.90.30](https://img.pdfslide.us/doc/110x75/5aaa14e37f8b9a95188daa0e/xlsfta-view-lac-13012000-gum-arabic-13019010-gum-benjamin-13019020.jpg)