Embed Size (px)
Citation preview
4th International Conference on Earthquake Geotechnical Engineering
June 25-28, 2007 Paper No. 1359
EVALUATION OF UNCERTAINTIES IN DYNAMIC PROPERTIES
Robert PYKE 1, Joseph LAIRD2, and John NORTH3
ABSTRACT
Evolving best practice for conducting site response and soil-structure interaction (SSI) analyses requires incorporation in the analyses of uncertainties in the key properties and the thickness of the principal strata. This paper describes site characterization and dynamic properties studies conducted for a new facility at the Los Alamos National Laboratory in Los Alamos, New Mexico, with particular emphasis on the quantification of uncertainties. The facility is planned on a mesa underlain by volcanic tuffs with occasional sedimentary interbeds. Because of the potential significance of a nonwelded tuff unit to the site response and SSI analyses, particular emphasis was given to the characterization of this geomechanical unit. Shear and compression wave velocities were measured in the upper 150 feet by downhole and crosshole surveys and resonant column / torsional shear (RCTS) tests were performed on eight samples of the nonwelded tuff unit that were obtained using a large diameter Pitcher sampler. Excellent agreement was obtained between the shear wave velocities that were measured in the downhole and crosshole surveys and the scatter in these measurements and in the shear modulus reduction and material damping curves obtained from the RCTS results was minimal. The calculated coefficient of variation (COV) values were significantly lower than those that might have been assumed in the absence of careful site-specific studies. Sources of systematic and random errors that might impact all of the measurements are discussed. The value of carefully conducted site investigations and laboratory testing in reducing uncertainties is self-evident.
Keywords: dynamic properties, site characterization, uncertainties, volcanic tuff, site response
INTRODUCTION Evolving best practice for conducting site response and soil structure interaction analyses requires incorporation in the analyses of uncertainties in the thickness of the principal strata and the key properties. This paper describes site characterization and dynamic properties studies for a new facility at the Los Alamos National Laboratory (LANL) in Los Alamos, New Mexico, U.S.A. with particular emphasis on the quantification of uncertainties.
The mostly below-grade facility is planned on a mesa of the Pajarito Plateau underlain by volcanic tuffs with occasional sedimentary interbeds. The near-surface Bandelier Tuff ranges from nonwelded through moderately welded to strongly welded. At the planned location of the new facility an approximately 50-feet thick nonwelded tuff layer that is sandwiched between two more highly welded tuff layers is found at a depth of about 75 feet below the ground surface. This layer sits at a depth of about 15 to 20 feet below the planned foundation depth of the proposed new facility. This nonwelded tuff layer has the density of loose sand, although its dynamic and geomechanical properties are more similar to those of a medium dense to dense sand due to factors such as particle deposition, angularity and mineralogy. 1 Consultant, Lafayette, California, U.S.A., Email: [email protected] 2 Lead Geotechnical Engineer, Kleinfelder, Inc., Albuquerque, New Mexico, U.S.A., Email: [email protected] 3 Principal Geotechnical Engineer, Kleinfelder, Inc., Albuquerque, New Mexico, U.S.A., Email: [email protected]
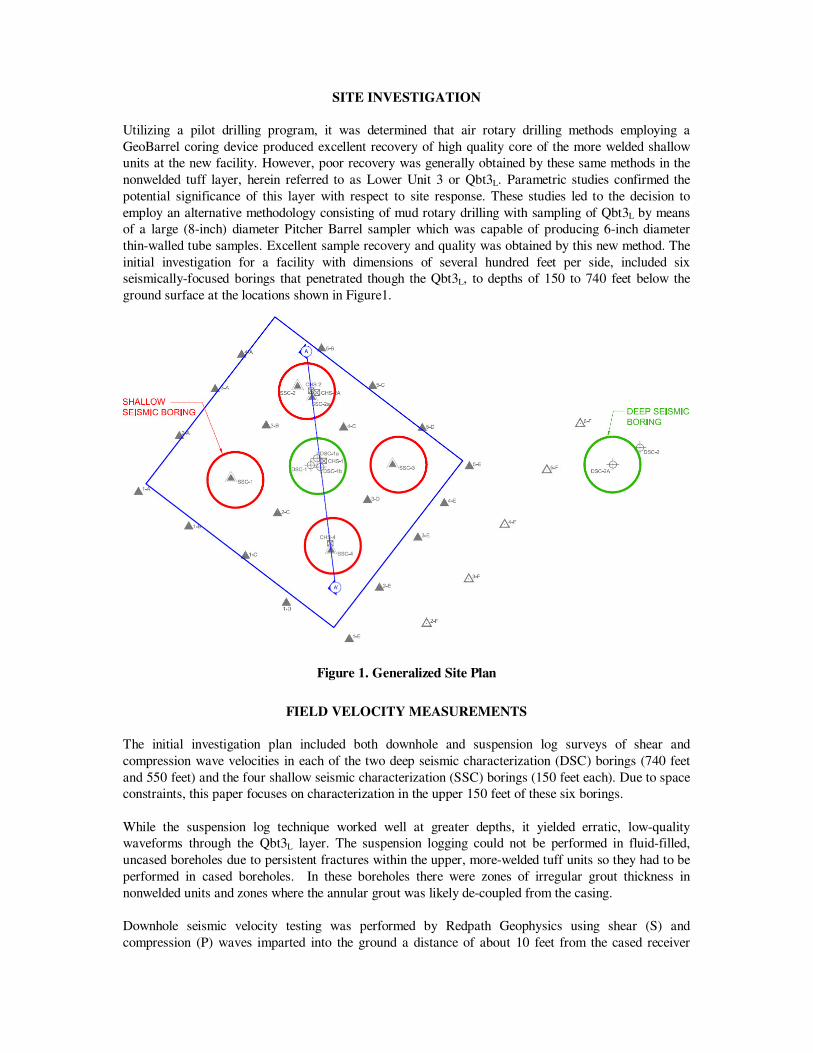
SITE INVESTIGATION Utilizing a pilot drilling program, it was determined that air rotary drilling methods employing a GeoBarrel coring device produced excellent recovery of high quality core of the more welded shallow units at the new facility. However, poor recovery was generally obtained by these same methods in the nonwelded tuff layer, herein referred to as Lower Unit 3 or Qbt3L. Parametric studies confirmed the potential significance of this layer with respect to site response. These studies led to the decision to employ an alternative methodology consisting of mud rotary drilling with sampling of Qbt3L by means of a large (8-inch) diameter Pitcher Barrel sampler which was capable of producing 6-inch diameter thin-walled tube samples. Excellent sample recovery and quality was obtained by this new method. The initial investigation for a facility with dimensions of several hundred feet per side, included six seismically-focused borings that penetrated though the Qbt3L, to depths of 150 to 740 feet below the ground surface at the locations shown in Figure1.
Figure 1. Generalized Site Plan
FIELD VELOCITY MEASUREMENTS The initial investigation plan included both downhole and suspension log surveys of shear and compression wave velocities in each of the two deep seismic characterization (DSC) borings (740 feet and 550 feet) and the four shallow seismic characterization (SSC) borings (150 feet each). Due to space constraints, this paper focuses on characterization in the upper 150 feet of these six borings. While the suspension log technique worked well at greater depths, it yielded erratic, low-quality waveforms through the Qbt3L layer. The suspension logging could not be performed in fluid-filled, uncased boreholes due to persistent fractures within the upper, more-welded tuff units so they had to be performed in cased boreholes. In these boreholes there were zones of irregular grout thickness in nonwelded units and zones where the annular grout was likely de-coupled from the casing. Downhole seismic velocity testing was performed by Redpath Geophysics using shear (S) and compression (P) waves imparted into the ground a distance of about 10 feet from the cased receiver
boring. Horizontal sledgehammer blows to a ground-supported, cleated-beam, secured under the weight of a truck, generated S waves, while vertical sledgehammer blow to a metal striker plate generated P-waves. Waveform travel times were measured from the impact sensor of the hammer to the magnetically-aligned three-dimensional (3-D) geophone set at a known depth in the cased borehole. Appropriate geometric correction factors were made to obtain the vertical travel times of the S- and P-waves to the receivers. The waveforms were generally of good quality and exhibited similar wave velocities within the six downhole survey locations. Within the Qbt3L layer, however, there were zones where the wave arrivals appeared to be offset with respect to upper and lower intervals. The effects of thicker sequences of grout or shorter paths of least resistance could be seen as abrupt offsets or stair-steps in the wave velocity versus travel time plots. Because it was still desired to use a second survey method to check and to confirm the downhole measurements, crosshole seismic velocity measurements were conducted by the University of Texas at Austin (UT) within the upper 150 feet of the profile The crosshole surveys were performed in three sets of two-borehole arrays using newly-drilled crosshole source (CHS) borings drilled about 10 feet from the adjacent cased boring as shown on Figure 1. After the completion of a Standard Penetration Test (SPT) prior to the crosshole measurements, the sampler would be left in place and a seismic receiver was lowered to the same depth in the adjacent cased borehole. The application of carpenter hammer blows to the top of the drill rod generated both S- and P-waves that travelled from the embedded SPT sampler to the adjacent receiver boring. While conducting crosshole testing concurrently with the advancement of the boring was slightly more labor intensive, this program allowed the team to collect SPT blow counts that would later be used to assist in the differentiation of subsurface geomechanical units. High clarity waveforms were obtained and, because of the close borehole spacing and survey measurement intervals, the impact of refracted waves was limited. Because a second uncased hole was available adjacent to the deep boring in the center of the site, two sets of crosshole measurements were in fact made at this location. Borehole deviation surveys were performed in both the cased and CHS borings.
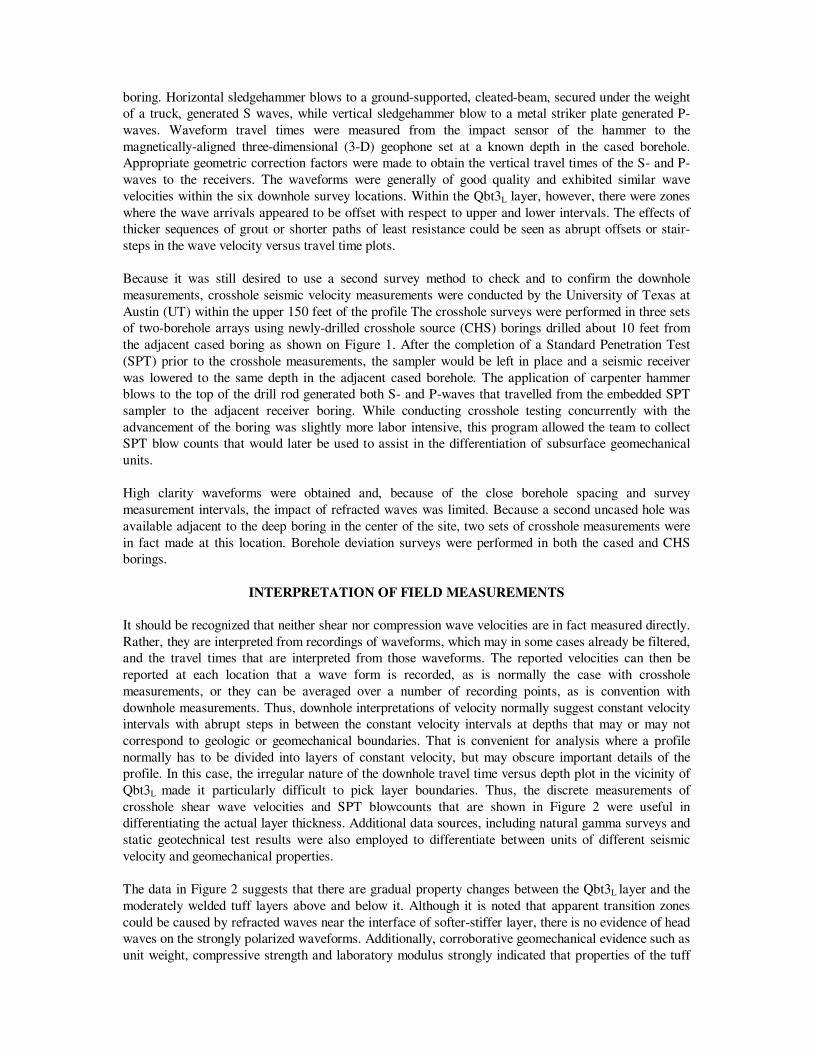
INTERPRETATION OF FIELD MEASUREMENTS It should be recognized that neither shear nor compression wave velocities are in fact measured directly. Rather, they are interpreted from recordings of waveforms, which may in some cases already be filtered, and the travel times that are interpreted from those waveforms. The reported velocities can then be reported at each location that a wave form is recorded, as is normally the case with crosshole measurements, or they can be averaged over a number of recording points, as is convention with downhole measurements. Thus, downhole interpretations of velocity normally suggest constant velocity intervals with abrupt steps in between the constant velocity intervals at depths that may or may not correspond to geologic or geomechanical boundaries. That is convenient for analysis where a profile normally has to be divided into layers of constant velocity, but may obscure important details of the profile. In this case, the irregular nature of the downhole travel time versus depth plot in the vicinity of Qbt3L made it particularly difficult to pick layer boundaries. Thus, the discrete measurements of crosshole shear wave velocities and SPT blowcounts that are shown in Figure 2 were useful in differentiating the actual layer thickness. Additional data sources, including natural gamma surveys and static geotechnical test results were also employed to differentiate between units of different seismic velocity and geomechanical properties. The data in Figure 2 suggests that there are gradual property changes between the Qbt3L layer and the moderately welded tuff layers above and below it. Although it is noted that apparent transition zones could be caused by refracted waves near the interface of softer-stiffer layer, there is no evidence of head waves on the strongly polarized waveforms. Additionally, corroborative geomechanical evidence such as unit weight, compressive strength and laboratory modulus strongly indicated that properties of the tuff
units vary gradually above and below the nonwelded unit. Therefore, transition layers Qbt3L-t and Qbt2-t were added to the geomechanical profile.
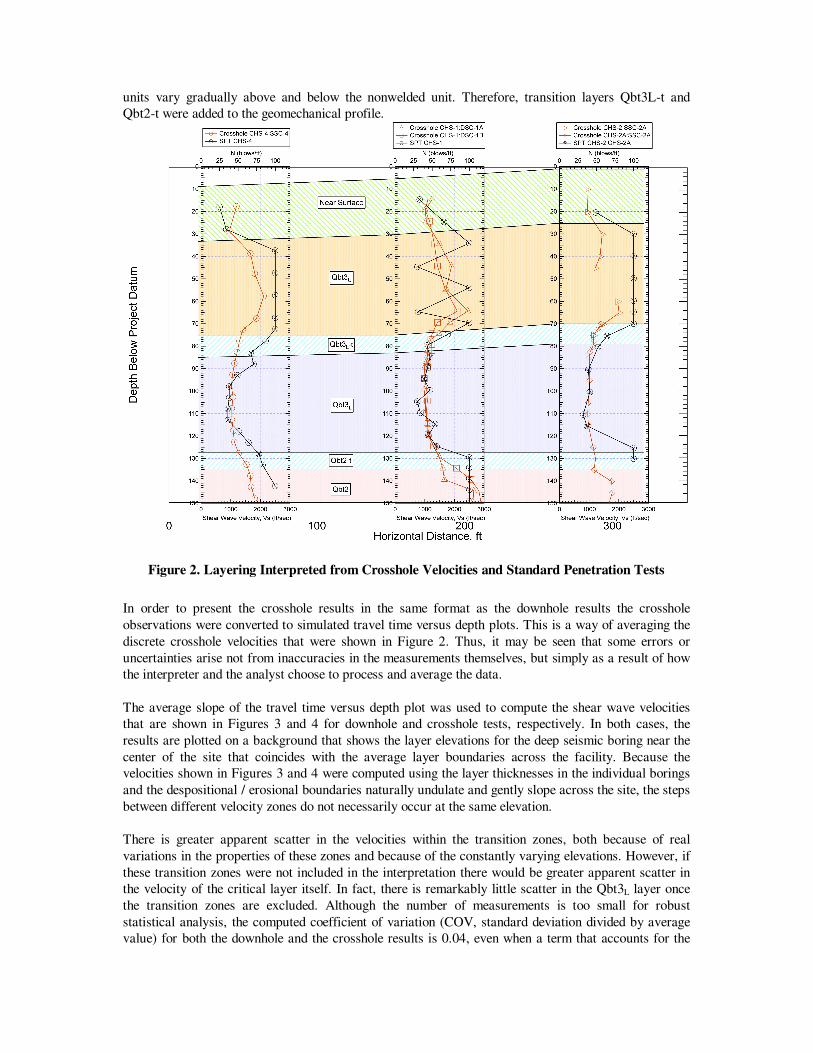
Figure 2. Layering Interpreted from Crosshole Velocities and Standard Penetration Tests In order to present the crosshole results in the same format as the downhole results the crosshole observations were converted to simulated travel time versus depth plots. This is a way of averaging the discrete crosshole velocities that were shown in Figure 2. Thus, it may be seen that some errors or uncertainties arise not from inaccuracies in the measurements themselves, but simply as a result of how the interpreter and the analyst choose to process and average the data. The average slope of the travel time versus depth plot was used to compute the shear wave velocities that are shown in Figures 3 and 4 for downhole and crosshole tests, respectively. In both cases, the results are plotted on a background that shows the layer elevations for the deep seismic boring near the center of the site that coincides with the average layer boundaries across the facility. Because the velocities shown in Figures 3 and 4 were computed using the layer thicknesses in the individual borings and the despositional / erosional boundaries naturally undulate and gently slope across the site, the steps between different velocity zones do not necessarily occur at the same elevation. There is greater apparent scatter in the velocities within the transition zones, both because of real variations in the properties of these zones and because of the constantly varying elevations. However, if these transition zones were not included in the interpretation there would be greater apparent scatter in the velocity of the critical layer itself. In fact, there is remarkably little scatter in the Qbt3L layer once the transition zones are excluded. Although the number of measurements is too small for robust statistical analysis, the computed coefficient of variation (COV, standard deviation divided by average value) for both the downhole and the crosshole results is 0.04, even when a term that accounts for the
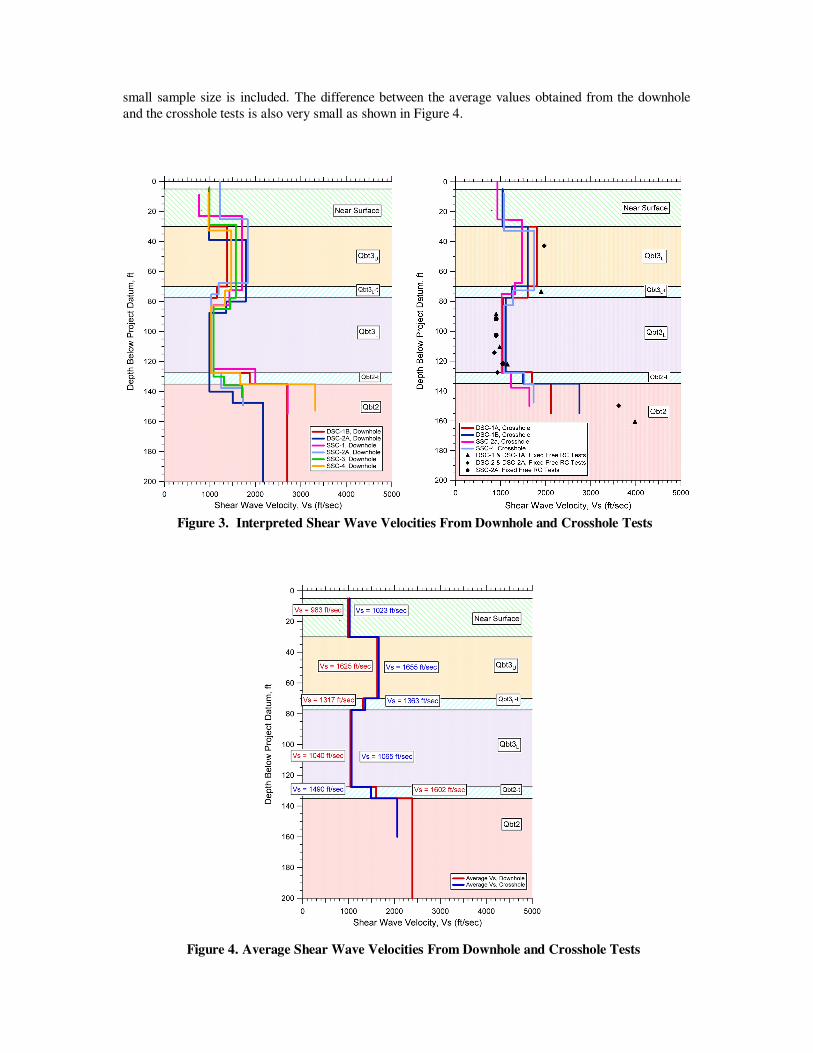
small sample size is included. The difference between the average values obtained from the downhole and the crosshole tests is also very small as shown in Figure 4.
Figure 3. Interpreted Shear Wave Velocities From Downhole and Crosshole Tests
Figure 4. Average Shear Wave Velocities From Downhole and Crosshole Tests
In the Qbt3L layer, the average of the individually averaged shear wave velocity values (Vs) is 1040 feet per second (ft/sec) using the downhole method and 1065 ft/sec using the crosshole method. The difference between these two values is equivalent to a COV of 0.02 for all ten measurements. In general, because there are different potential sources of error in each method, the two sets of results should not simply be averaged, but should be corrected for known biases and then weighted. In this case, however, both the uniformity of the material and quality of the measurements are such that a simple average may suffice. Even in this case, simple averaging of the results does not address the question of whether both measurement sets may be wrong or unrepresentative. Both the interpreters of the data and the analysts should be aware of all possible sources of error and uncertainty.
SOURCES OF ERROR AND UNCERTAINTY IN MEASURED FIELD VELOCITIES There are as many as six classes of error or uncertainty in field measurements and interpretation of velocities. Measurement Errors This class of error is typically minimized by means of a robust Quality Assurance (QA) program. These types of errors can be limited by proper calibration of measurement devices, but calibrations need to be conducted for field conditions. In the case of field velocity measurements, it is also necessary to conduct borehole deviation surveys and it may be important to either ensure consistent position of the source and receiver in the system and the orientation of the geophone themselves. Ideally, one would conduct an error propagation analysis to help isolate and minimize the greatest sources of error, but this may be difficult if errors do not follow a normal distribution and may be unnecessary given all of the other factors involved in the overall system. Wave Path Errors These types of errors can be minimized by using a short offset distance for downhole surveys and close borehole spacing for crosshole surveys, but problems may still remain in layered profiles which have softer layers sandwiched between stiffer layers. In this case, excellent results were obtained using the SPT sampler as a source for the crosshole measurements in the softer Qbt3L layer where good shear coupling produced clearly polarized, dominantly horizontal shear waves. The same source was less successful in zones of SPT refusal encountered in the more welded units overlying the Qbt3L. In this case, a more conventional method in which a downhole hammer is utilized within grouted casing likely would have produced better results. In Qbt3L, the greatest source of error was the unknown thickness of grout. The effect of the higher velocity in the grout may account for the average crosshole velocity being slightly higher than the average downhole velocity. While the thickness of the grout was not known precisely, the crosshole consultant performed a laboratory measurement on a representative grout cylinder and PVC casing, resulting in shear wave velocities of 3,790 ft/sec and 3,325 ft/sec, respectively. For an assumed maximum grout annulus of 6 inches over the as-constructed 11.5-foot source to receiver spacing, the higher shear wave velocity in the grout and the casing could result in a maximum 3.2% decrease in travel time for Qbt3L (Stokoe, 2006). Interpretation Errors The question of picking arrival times or matching waveforms from the raw observations should be noted. This should be addressed by normal QA procedures, including independent peer review of picks. The selection of average wave velocities from the travel time waterfall plots, as well as how broad or narrow to select the layers, and the development of the layer thicknesses requires judgment. They are not so much errors as obfuscations that may be introduced by the need to organize data for analysis purposes.
Representativeness This is typically more of a problem with sampling and laboratory testing and in fact provides a strong argument for always checking laboratory tests with field tests. However, it can also be a problem in the field if the geology is not well understood or there is limited access. In this case, with good access and layers that are relatively uniform over a wide area, this potential source of error was minimized. Things Not Considered One of the major shortcomings of typical QA procedures is that they ensure good calibration and documentation of measurements, but tend to neglect other important issues such as representativeness. Another example of an issue that is frequently overlooked is the effect of frequency and wave length on the measurements that are being made. In the example described in this paper, something that was initially overlooked was the reasonable expectation that, due to the method of deposition of the nonwelded tuff, this material might be expected to show cross-anisotropic properties. Although space limitations preclude detailed discussion of the results of compression wave measurements, the compression wave velocities measured in the horizontal direction using the crosshole technique were rather lower than those measured in the vertical direction using the downhole technique. When the receiver was offset vertically from the source in the crosshole setup, it was confirmed that the compression waves were anisotropic. The Averaging Problem While some of the potential obfuscations that result from averaging of data, whether properly weighted or not, are noted above, this problem may be minor relative to another issue that is generally not considered and deserves separate attention from the items listed immediately above. This issue has to do with whether soil and rock profiles, that may vary from one another over short distances because of depositional or weathering factors, can respond differently in an earthquake; generally speaking, they cannot for facility dimensions even somewhat larger than those of this project. Thus, the emerging practice of randomizing velocity profiles based on the maximum variation measured from one boring to another is ill-suited for a project where adequate site-specific data has been obtained. What should be used for analysis is a weighted average that takes into account the representativeness and the contribution of the individual profiles after correction for any systematic errors and the only uncertainty that should be included in the analyses is the uncertainty in the average, or mean, values.
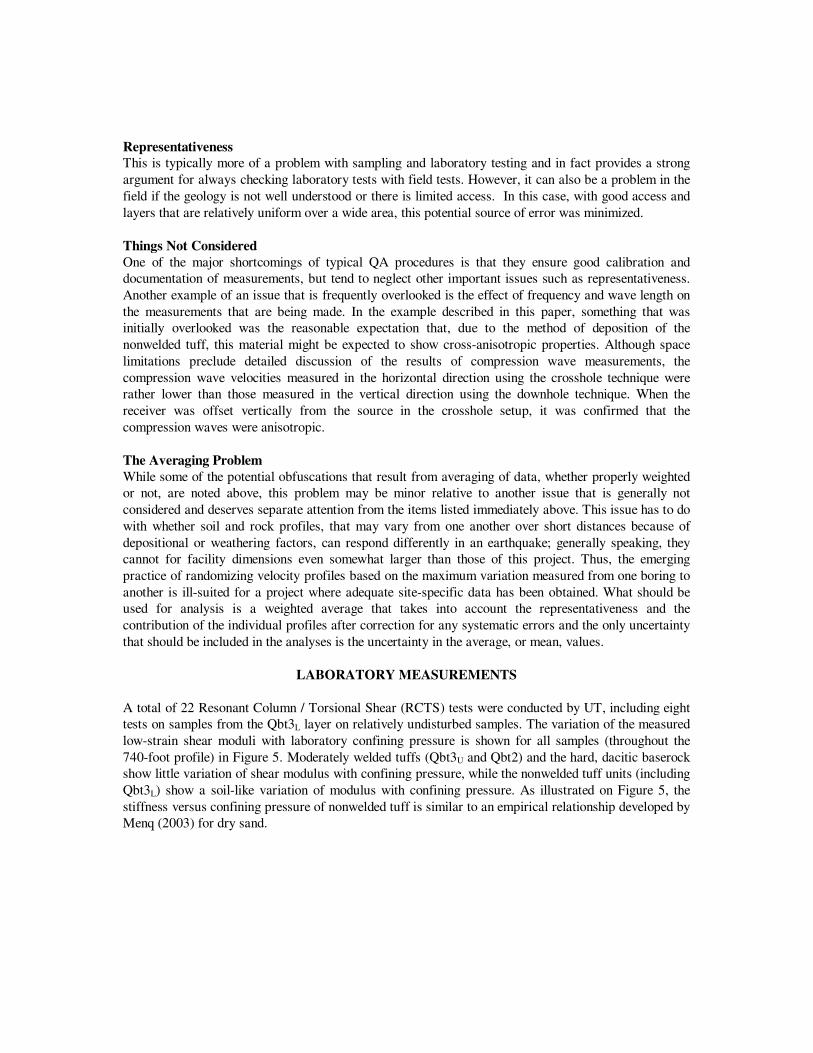
LABORATORY MEASUREMENTS A total of 22 Resonant Column / Torsional Shear (RCTS) tests were conducted by UT, including eight tests on samples from the Qbt3L layer on relatively undisturbed samples. The variation of the measured low-strain shear moduli with laboratory confining pressure is shown for all samples (throughout the 740-foot profile) in Figure 5. Moderately welded tuffs (Qbt3U and Qbt2) and the hard, dacitic baserock show little variation of shear modulus with confining pressure, while the nonwelded tuff units (including Qbt3L) show a soil-like variation of modulus with confining pressure. As illustrated on Figure 5, the stiffness versus confining pressure of nonwelded tuff is similar to an empirical relationship developed by Menq (2003) for dry sand.
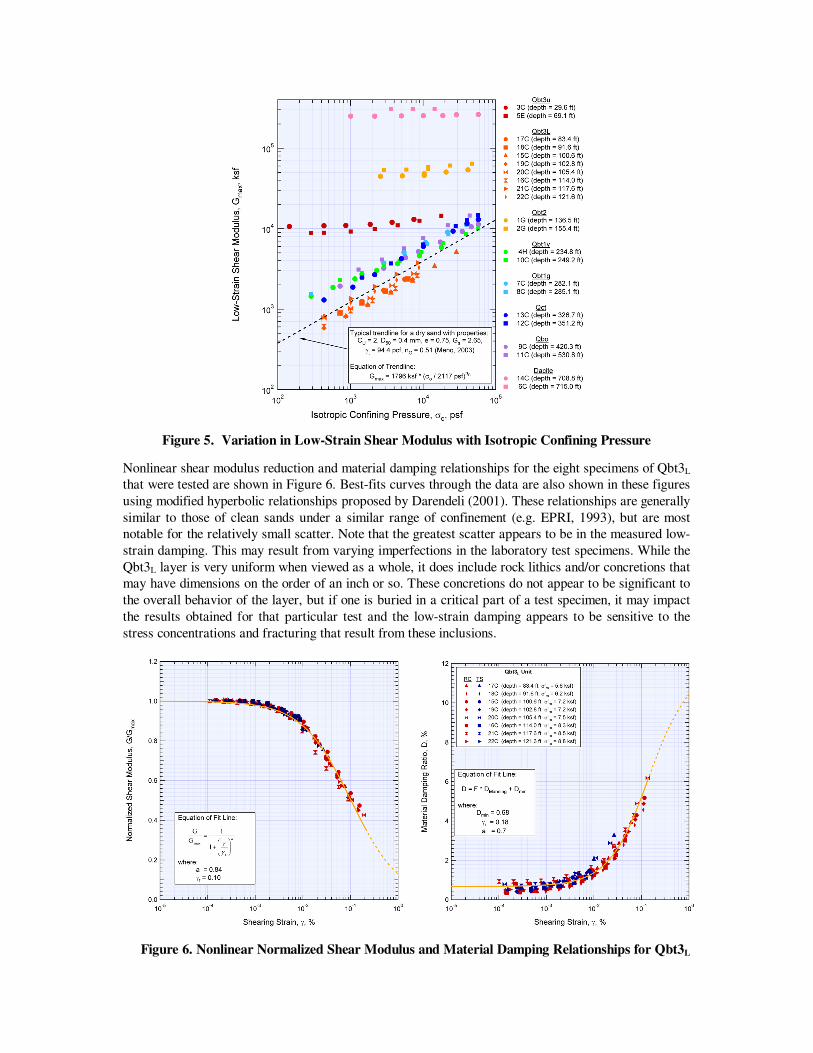
Figure 5. Variation in Low-Strain Shear Modulus with Isotropic Confining Pressure
Nonlinear shear modulus reduction and material damping relationships for the eight specimens of Qbt3L that were tested are shown in Figure 6. Best-fits curves through the data are also shown in these figures using modified hyperbolic relationships proposed by Darendeli (2001). These relationships are generally similar to those of clean sands under a similar range of confinement (e.g. EPRI, 1993), but are most notable for the relatively small scatter. Note that the greatest scatter appears to be in the measured low-strain damping. This may result from varying imperfections in the laboratory test specimens. While the Qbt3L layer is very uniform when viewed as a whole, it does include rock lithics and/or concretions that may have dimensions on the order of an inch or so. These concretions do not appear to be significant to the overall behavior of the layer, but if one is buried in a critical part of a test specimen, it may impact the results obtained for that particular test and the low-strain damping appears to be sensitive to the stress concentrations and fracturing that result from these inclusions.
Figure 6. Nonlinear Normalized Shear Modulus and Material Damping Relationships for Qbt3L
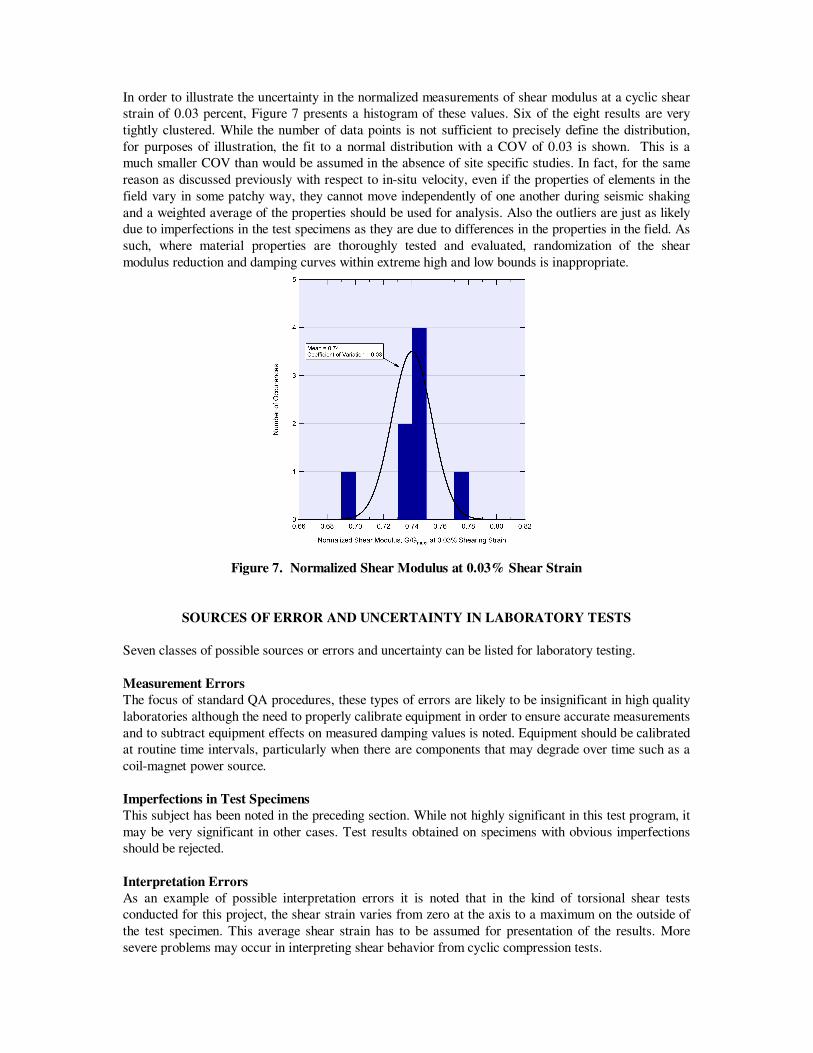
In order to illustrate the uncertainty in the normalized measurements of shear modulus at a cyclic shear strain of 0.03 percent, Figure 7 presents a histogram of these values. Six of the eight results are very tightly clustered. While the number of data points is not sufficient to precisely define the distribution, for purposes of illustration, the fit to a normal distribution with a COV of 0.03 is shown. This is a much smaller COV than would be assumed in the absence of site specific studies. In fact, for the same reason as discussed previously with respect to in-situ velocity, even if the properties of elements in the field vary in some patchy way, they cannot move independently of one another during seismic shaking and a weighted average of the properties should be used for analysis. Also the outliers are just as likely due to imperfections in the test specimens as they are due to differences in the properties in the field. As such, where material properties are thoroughly tested and evaluated, randomization of the shear modulus reduction and damping curves within extreme high and low bounds is inappropriate.
Figure 7. Normalized Shear Modulus at 0.03% Shear Strain
SOURCES OF ERROR AND UNCERTAINTY IN LABORATORY TESTS Seven classes of possible sources or errors and uncertainty can be listed for laboratory testing. Measurement Errors The focus of standard QA procedures, these types of errors are likely to be insignificant in high quality laboratories although the need to properly calibrate equipment in order to ensure accurate measurements and to subtract equipment effects on measured damping values is noted. Equipment should be calibrated at routine time intervals, particularly when there are components that may degrade over time such as a coil-magnet power source. Imperfections in Test Specimens This subject has been noted in the preceding section. While not highly significant in this test program, it may be very significant in other cases. Test results obtained on specimens with obvious imperfections should be rejected. Interpretation Errors As an example of possible interpretation errors it is noted that in the kind of torsional shear tests conducted for this project, the shear strain varies from zero at the axis to a maximum on the outside of the test specimen. This average shear strain has to be assumed for presentation of the results. More severe problems may occur in interpreting shear behavior from cyclic compression tests.
Representativeness This is often a severe problem, but one that is overlooked in interpretation. Samples will commonly be biased towards finer-grained and more cohesive materials because more coarse-grained soils are more difficult to sample and subsequently trim in a laboratory. In this case, a large number of high-quality samples were eventually obtained in the Qbt3L layer and it was possible to check both that the samples as a whole were relatively uniform in unit weight and gradation and that the samples tested were representative of the entire sample population. The Averaging Problem As noted above, the authors believe that in a relatively uniform layer such as the Qbt3L layer, the laboratory results should simply be averaged after rejecting any tests that are clearly affected by imperfections in the test specimens. This is also true with materials that are patchy or have lenses and should, more appropriately, be modeled as a single material with the nonuniformities considered by means of a weighted average. To randomize properties so that in any realization a layer of such a material has the properties of only soft inclusions for instance would be wrong. The case of thin layers with differing properties or layers with constantly varying properties, like the transition zones above and below the Qbt3L layer, can be more difficult. If a layer with constantly varying properties can be sampled and studied in detail and modeled as a separate layer, then a weighted average should be used. If thin layers can be sampled and studied in detail, but the analyst chooses to model them as a single layer, again a weighted average can be used. However, in many cases the field and laboratory studies will be insufficient to define the properties for thin layers and so assumed properties with greater uncertainties must be used. In this case, it may be appropriate to randomize the properties for purposes of analysis. Sample Disturbance The problem of sample disturbance is familiar to most geotechnical engineers and has been widely discussed in the literature. It can only be minimized by careful sampling and handling techniques, but it is essentially impossible to eliminate since there is inevitable stress release and re-application involved in taking a sample out of the ground and setting it up in the laboratory. Differences Between Field and Laboratory Stress States and Deformation Boundary Conditions These are commonly overlooked because of the uncertainty in their determination and the difficulty of reproducing them accurately in the laboratory. Much laboratory testing is conducted using isotropic re-consolidation assuming an appropriate value for the coefficient of lateral earth pressure, k0. This will only reapply the correct stress state if it is assumed that k0 is unity and the value in the field actually is unity.
RECONCILIATION OF FIELD AND LABORATORY MEASUREMENTS A useful but imperfect measure of sample disturbance, representativeness, and differences between field and laboratory stress states and deformation boundary conditions can be obtained by comparing the shear wave velocity, or low-strain shear modulus, measured in the field with that measured in the laboratory. This comparison was shown in Figure 3, which shows the shear wave velocities interpreted from RCTS tests in the laboratory and the interpreted average shear wave velocities for each layer from the crosshole tests. The ratio of RCTS shear wave velocity and the nearest discrete crosshole measurement (vs-Lab/vs-Field) is presented in Figure 8 for the upper units. For the major units above and below the Qbt3L transition zones, which are moderately welded tuffs, the field velocities are lower than the laboratory values as indicated by average vs-Lab/vs-Field values of 1.19 and 1.55, respectively. The authors believe that this is because the samples tested in the laboratory, which are intact and monolithic, do not reflect weathered zones and fractures which occur in the overall rock mass. For more soil-like materials it would be expected that the laboratory-measured velocities would be less than the field values because of disturbance and the inability to replicate the actual field state of stress in the
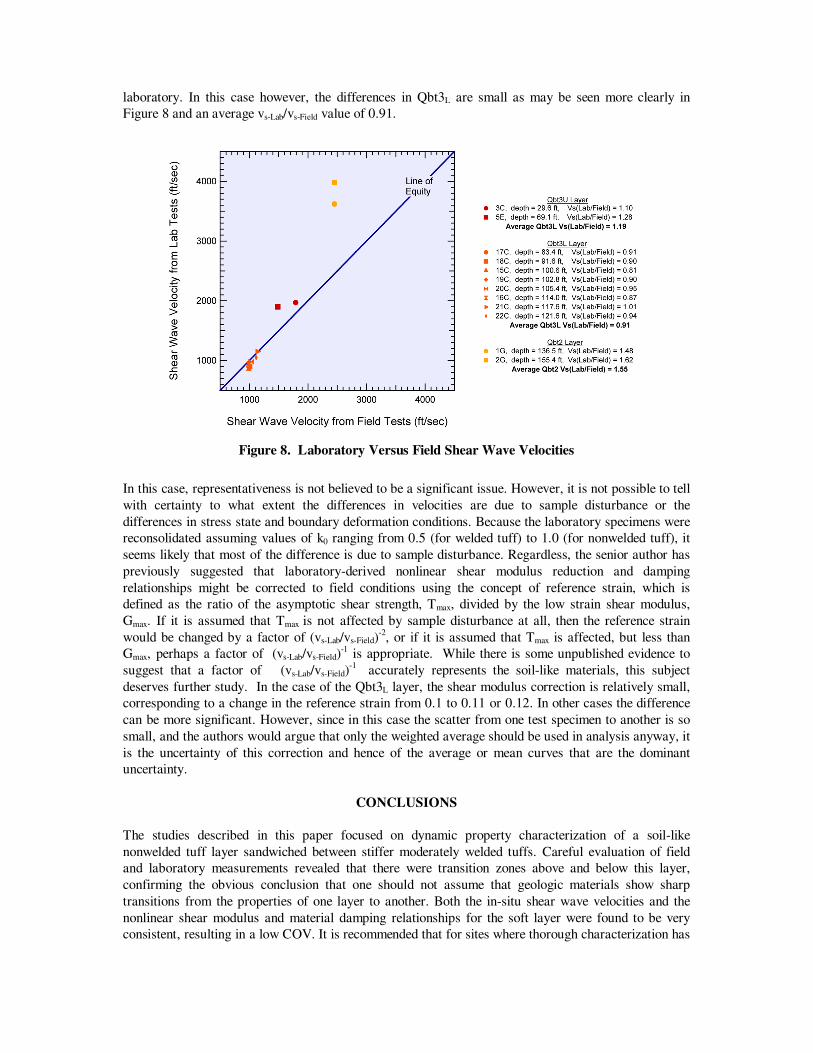
laboratory. In this case however, the differences in Qbt3L are small as may be seen more clearly in Figure 8 and an average vs-Lab/vs-Field value of 0.91.
Figure 8. Laboratory Versus Field Shear Wave Velocities In this case, representativeness is not believed to be a significant issue. However, it is not possible to tell with certainty to what extent the differences in velocities are due to sample disturbance or the differences in stress state and boundary deformation conditions. Because the laboratory specimens were reconsolidated assuming values of k0 ranging from 0.5 (for welded tuff) to 1.0 (for nonwelded tuff), it seems likely that most of the difference is due to sample disturbance. Regardless, the senior author has previously suggested that laboratory-derived nonlinear shear modulus reduction and damping relationships might be corrected to field conditions using the concept of reference strain, which is defined as the ratio of the asymptotic shear strength, Tmax, divided by the low strain shear modulus, Gmax. If it is assumed that Tmax is not affected by sample disturbance at all, then the reference strain would be changed by a factor of (vs-Lab/vs-Field)-2, or if it is assumed that Tmax is affected, but less than Gmax, perhaps a factor of (vs-Lab/vs-Field)-1 is appropriate. While there is some unpublished evidence to suggest that a factor of (vs-Lab/vs-Field)-1 accurately represents the soil-like materials, this subject deserves further study. In the case of the Qbt3L layer, the shear modulus correction is relatively small, corresponding to a change in the reference strain from 0.1 to 0.11 or 0.12. In other cases the difference can be more significant. However, since in this case the scatter from one test specimen to another is so small, and the authors would argue that only the weighted average should be used in analysis anyway, it is the uncertainty of this correction and hence of the average or mean curves that are the dominant uncertainty.
CONCLUSIONS The studies described in this paper focused on dynamic property characterization of a soil-like nonwelded tuff layer sandwiched between stiffer moderately welded tuffs. Careful evaluation of field and laboratory measurements revealed that there were transition zones above and below this layer, confirming the obvious conclusion that one should not assume that geologic materials show sharp transitions from the properties of one layer to another. Both the in-situ shear wave velocities and the nonlinear shear modulus and material damping relationships for the soft layer were found to be very consistent, resulting in a low COV. It is recommended that for sites where thorough characterization has
been performed that, after correction for any systematic errors, the weighted mean properties be used for such a layer in site response and soil-structure interaction analyses. The major uncertainly typically lies in the size of the correction required for systematic errors, and hence in the average or mean values, rather than in the distribution around the mean. In this case for the Qbt3L layer, use of a mean value for shear wave velocity of 1050 ft/sec was recommended. The calculated COV of 0.04 for both downhole and crosshole testing reflects both the uniform nature of this layer, as well as the high quality of measurements. The results of the eight RCTS tests on the Qbt3L layer were also remarkably close. Using the normalized shear modulus at a shearing strain of 0.03% as a benchmark, a COV of 0.03 was calculated for the median strain value of 0.74 percent. As measured in RCTS results, the laboratory-measured shear wave velocity of the Qbt3L layer was on average only 9% lower than the nearest field measured value. Based on the small difference between field and laboratory-measured values, a modest reference shearing strain adjustment of from 0.10 to 0.11 percent was recommended for the shear modulus reduction and damping curves. These are relative small values for the coefficients of variation and they will not necessarily apply on other projects. On each individual project the personnel making measurements, interpreting results and conducting analyses should be aware of all of the possible sources of error and uncertainty so that they can both minimize the errors and uncertainty and assign appropriate values for purposes of analysis. The value of carefully conducting site specific studies to not only evaluate, but to reduce uncertainties that might otherwise have to be assumed, is also obvious.
AKNOWLEDGEMENTS Alan Kuhn of Kleinfelder was instrumental in the development and oversight of the investigation program. The downhole velocity measurements were made by Bruce Redpath of Redpath Geophysics and the crosshole velocity measurements and RCTS tests were conducted by Kenneth H. Stokoe II of the University of Texas at Austin, assisted by Brady Cox and Won Kyoung Choi. Jed Stoken of Kleinfelder assisted in the analysis of dynamic property data and generation of graphics for the project. The support of Dennis Basile and Nathan Yost of Los Alamos National Laboratory and their contributions to this study are gratefully acknowledged.
REFERENCES Darendeli, M. B., (2001), “Development of a New Family of Normalized Modulus Reduction and Material Damping Curves,” Ph.D. Dissertation, University of Texas at Austin. Electrical Power Research Institute, (1993), “Guidelines for Determining Design Basis Ground Motions, Vol. 2: Appendices for Ground Motion Estimation,” EPRI TR 102293, Project 3302. Menq, F. Y., (2003), “Dynamic Properties of Sandy and Gravelly Soils,” Ph.D. Dissertation, University of Texas at Austin. Stokoe, K.H. (2006), Personal Communication, “Potential Uncertainties and Biases in the Crosshole Shear and Compression Wave Velocity Measurements”.