Embed Size (px)
Citation preview

Evaluation of Turbine Oil PerformanceCristian Soto PhD, VP of Science and Technology/COO, [email protected]
Jatin Mehta, Chemical Engineer (Research Engineer), [email protected]
23rd May 2019, Power Generation Committee

© 2019 Fluitec International
Summary
• Comparison of Turbine Oil Oxidation Tests • TOPP Test Parameters & Experimental Setup• Commercial Turbine Oil Performance• Antioxidant Performance • Base Oil Performance • TOPP Tests Observations • Next Generation Turbine Oil • TOPP Findings
© 2019 Fluitec International
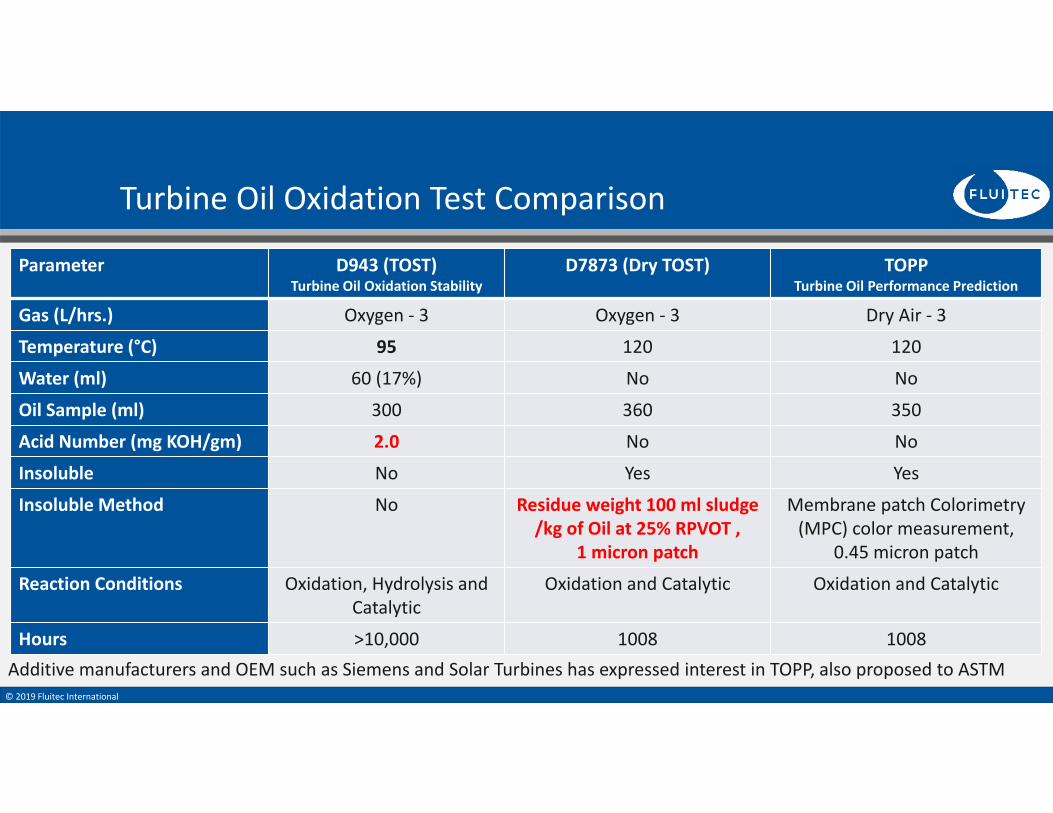
Turbine Oil Oxidation Test Comparison
Parameter D943 (TOST) Turbine Oil Oxidation Stability
D7873 (Dry TOST) TOPPTurbine Oil Performance Prediction
Gas (L/hrs.) Oxygen ‐ 3 Oxygen ‐ 3 Dry Air ‐ 3
Temperature (°C) 95 120 120
Water (ml) 60 (17%) No No
Oil Sample (ml) 300 360 350
Acid Number (mg KOH/gm) 2.0 No No
Insoluble No Yes Yes
Insoluble Method No Residue weight 100 ml sludge /kg of Oil at 25% RPVOT ,
1 micron patch
Membrane patch Colorimetry (MPC) color measurement,
0.45 micron patch
Reaction Conditions Oxidation, Hydrolysis and Catalytic
Oxidation and Catalytic Oxidation and Catalytic
Hours >10,000 1008 1008Additive manufacturers and OEM such as Siemens and Solar Turbines has expressed interest in TOPP, also proposed to ASTM

© 2019 Fluitec International
TOPP Experimental Setup
TOPP: Turbine Oil Performance Prediction

© 2019 Fluitec International
Sample Tubes
D943 TOPP TOPP Reference: ASTM D943
Air Delivery Tube
• Simple and easy setup• Agitation provided by air

© 2019 Fluitec International
TOPP Test Procedure & Sampling
Week 6
•Ruler•MPC•Demulsibility•Foam•Viscosity•TAN•RPVOT•FTIR•Air release•Particle Count•Clarity•Elemental Analysis
Week 5Week 4Week 3Week 2Week 1Initial
•Ruler•MPC•Demulsibility•Foam•Viscosity•TAN•RPVOT•FTIR•Air release•Particle Count•Clarity•Elemental Analysis
• Temperature: 120 0C, Dry Air: 3L/Hrs, Steel/Copper Catalyst: ASTM D5846, Six Tubes, 6 Weeks • Samples collected every week for 6 weeks and full oil analysis is performed.• Additional test may be added based on application and operational conditions
© 2019 Fluitec International
Observation
• Oxidation stability and resistance
• Acid generation
• Deposit resistance
• Sample clarity
• Performance properties
• Deposit on the tubes
• Deposit on the catalyst
• Other physical properties

© 2019 Fluitec International
TOPP of Turbine Oil 1
Test BaselineTurbine Oil(1 week)
Turbine Oil(2 weeks)
Turbine Oil (3 weeks)
Turbine Oil (4 weeks)
Turbine Oil (5 weeks)
Turbine Oil (6 weeks)
TAN, ASTM D664, mg/KOH 0.16 0.16 0.16 0.26 0.29 0.33 0.34Ruler, ASTM D6971, RUL% 100 89 88 55 48 6 12Ruler, ASTM D6971, % Aminic: 100% 91 79 66 36 12 16Ruler, ASTM D6971, % Phenolic: 100% 119.6 144.4 63.2 0 0 0RPVOT, ASTM D2272, minutes 1332 1056 1275 777 851 281 299
Membrane Patch Colorimetry ΔE 2 11 25 47 66 62 70Weight of Residue, mg/L 137 202 264 152 530 368 445
© 2019 Fluitec International
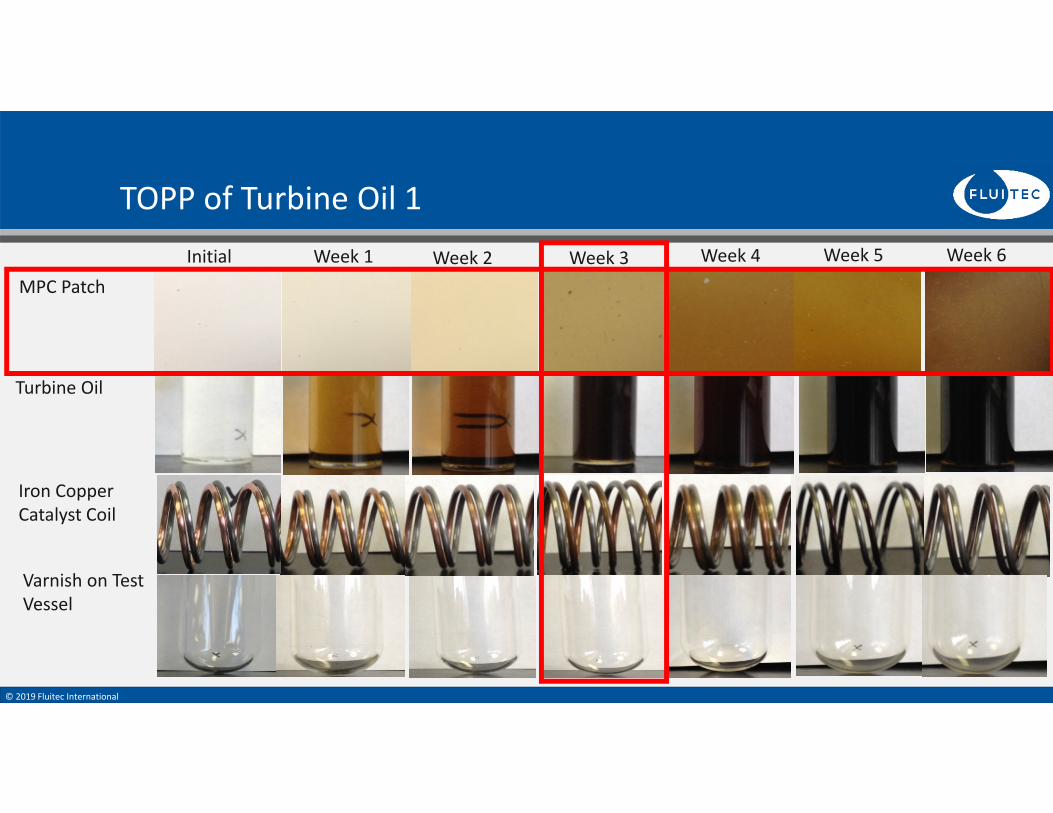
TOPP of Turbine Oil 1
MPC Patch
Turbine Oil
Iron Copper Catalyst Coil
Varnish on Test Vessel
Initial Week 1 Week 2 Week 3 Week 4 Week 5 Week 6

© 2019 Fluitec International
Summary of TOPP Results
Which oil should I use?

© 2019 Fluitec International
Summary of TOPP Results
Oil A
Oil B
Oil C

© 2019 Fluitec International
TOPP Formulated Oil Antioxidants Deposits
Oil A
Oil B
Oil C
Week 3Week 2Week 1 Week 6
Would you like this in your system?

© 2019 Fluitec International
TOPP Formulated Oil Antioxidants Depletion
6.15 11.511.5 14.650
50
100
150
200
250
300
350
400
450
500
550
0 2 4 6 8 10 12 14 16
Sample: B T0 Sample: B T1 Sample: B T2 Sample: B T3 Sample: B T4 Sample: B T6
6.15 11.511.5 14.650
50
100
150
200
250
300
350
400
450
500
550
0 2 4 6 8 10 12 14 16
Sample: B T0 Sample: B T1 Sample: B T2 Sample: B T3 Sample: B T4 Sample: B T6
5.2 12.812.8 15.60
100
200
300
400
500
600
700
800
900
1000
1100
1200
1300
0 2 4 6 8 10 12 14 16
Sample: A T0 Sample: A T1 Sample: A T2 Sample: A T3 Sample: A T4 Sample: A T6
5.2 12.812.8 15.60
100
200
300
400
500
600
700
800
900
1000
1100
1200
1300
0 2 4 6 8 10 12 14 16
Sample: A T0 Sample: A T1 Sample: A T2 Sample: A T3 Sample: A T4 Sample: A T6
Oil A Oil B
Amine AntioxidantsSingle TypeLow Initial AO
Amine AntioxidantsTwo Types High Initial AO
High AO package does not indicate high performance

© 2019 Fluitec International
TOPP Formulated Oxidation FTIR Region
Monitoring depletion of oxidation and thermal degradation species during the TOPP test

© 2019 Fluitec International
TOPP Formulated Oxidation FTIR Region
Measure thermal, hydrolysis and oxidative reaction products using FTIR spectroscopy
TOPP BaselineTOPP Two WeeksTOPP Five Weeks TOPP Six Weeks
Name Description1850 16521800 1750 1700
115
20
30
40
50
60
70
80
90
100
110
cm-1
%T
1739.4cm-122.395%T1767.6cm-137.118%T 1699.5cm-138.487%T
1790.8cm-166.226%T
Broadening of the peak indicates multiple different chemistries
© 2019 Fluitec International
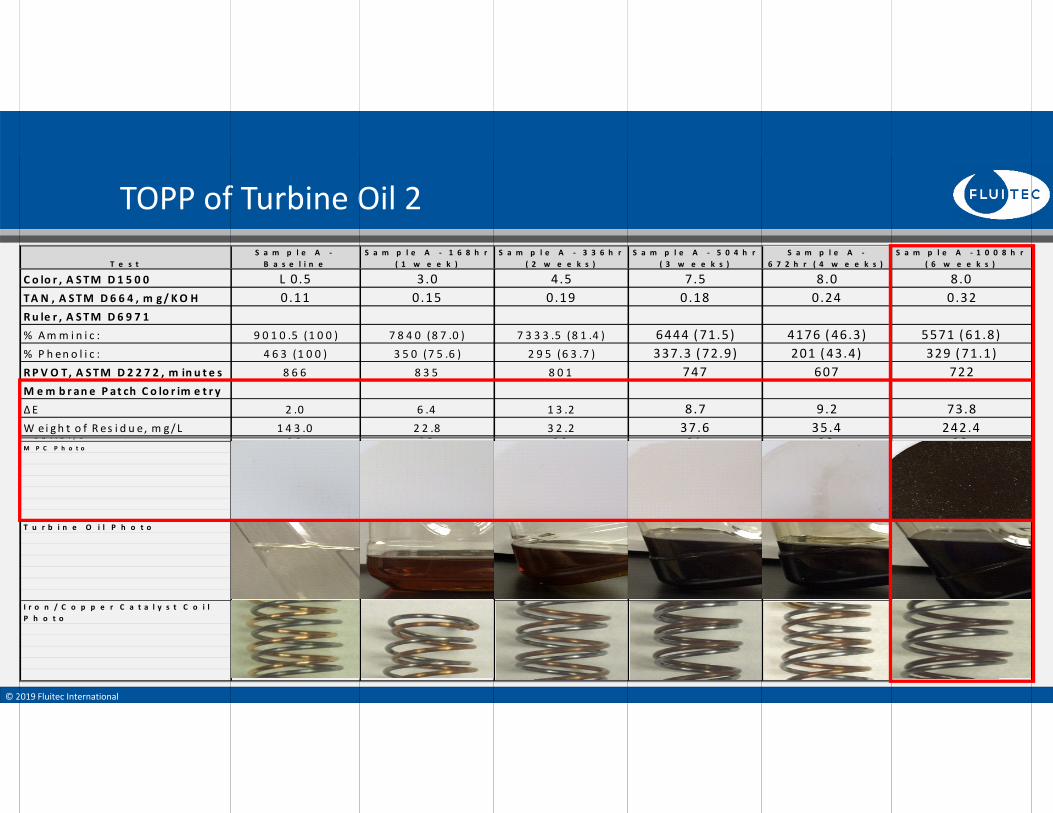
TOPP of Turbine Oil 2S a m p l e A ‐ 1 0 0 8 h r
( 6 w e e k s )T e s tS a m p l e A ‐
B a s e l i n eS a m p l e A ‐ 1 6 8 h r
( 1 w e e k )S a m p l e A ‐ 3 3 6 h r
( 2 w e e k s )S a m p l e A ‐ 5 0 4 h r
( 3 w e e k s )S a m p l e A ‐
6 7 2 h r ( 4 w e e k s )
S u l f u r / S 9 9 4 8 5 1 5 7 5 2 3 2M P C P h o t o
T u r b i n e O i l P h o t o
I r o n / C o p p e r C a t a l y s t C o i l P h o t o
C o lo r , A STM D 1 5 0 0 L 0.5 3.0 4.5 7.5 8.0 8.0TA N , A STM D 6 6 4 , m g/ KO H 0.11 0.15 0.19 0.18 0.24 0.32Ru le r , A STM D 6 9 7 1% Amm i n i c : 9 0 1 0 .5 (1 0 0 ) 7 8 4 0 (8 7 .0 ) 7 3 3 3 .5 (8 1 .4 ) 6444 ( 71.5) 4176 ( 46.3) 5571 ( 61.8)% P h en o l i c : 4 6 3 (1 0 0 ) 3 5 0 (7 5 .6 ) 2 9 5 (6 3 .7 ) 337.3 ( 72.9) 201 ( 43.4) 329 ( 71.1)RP V O T, A STM D 2 2 7 2 , m in u t e s 8 6 6 8 3 5 8 0 1 747 607 722M em b r an e P at ch C o lo r im e t r yΔE 2 .0 6 .4 1 3 .2 8 .7 9.2 73.8W ei gh t o f R es i d u e, m g/L 1 4 3 .0 2 2 .8 3 2 .2 37.6 35.4 242.4

© 2019 Fluitec International
Initial Week 1 Week 2 Week 3 Week 4 Week 5
TOPP Of Turbine Oil 2
Week 6MPC Patch
Turbine Oil
Varnish on Test Vessel

© 2019 Fluitec International
TOPP of Turbine Oil 3

© 2019 Fluitec International
TOPP of Commercial Turbine Oils
TestCompetitor Oil 1 ‐1008 hr (6 weeks)
Competitor Oil 2 ‐ 1008 hr (6 weeks)
Competitor Oil 3 ‐ 1008 hr (6 weeks)
Competitor Oil 4 ‐1008 hr (6 weeks)
Competitor Oil 4 ‐1008 hr (6 weeks)
Color, ASTM D1500 3.5 3.0 6.5 4.5 8.5
Ruler, ASTM D6971 % Aminic: 6550.5 114.5 75.6 42.4 21.9
Ruler, ASTM D6971 % Phenolic: 447 52.2 24.7 43.1 0RPVOT, ASTM D2272, minutes 421 820 831 969 1392
Membrane Patch Colorimetry, ΔE 70.248 67.563 63.36 35.369 101.57
Weight of residue, mg/L 714 90 134 52 156
MPC Patch Photo
Test Vessel Photo N/A
Next Generation 1008 hr (6 weeks)
7.588.577.27853.420
Most of the Turbine Oils fails due to high varnish potential by week 3 to 4

© 2019 Fluitec International
TOPP Data of Multiple Turbine Oils

© 2019 Fluitec International
TOPP Data Of Multiple Turbine Oils

© 2019 Fluitec International
Turbine Oil D(Baseline)
Turbine Oil D6 Weeks
12463 (218%) 10070 (176.4%)1410 (131%) 635 (59%)
1.4 6.2
1586 1341
TOPP with Same AO in Different Base‐stocks
Tests Turbine Oil C(Baseline)
Turbine Oil C6 Weeks
RULER, Area Aminic: 12109 (212%) 9600 (168.2%)RULER, Area Phenolic 1499 (139%) 158 (14.7%)Membrane Patch Colorimetry, ΔE 1.5 64.3
RPVOT, ASTM D2272, minutes 1710 1134
Photo of Turbine Oil
Photo of MPC
Turbine Oil E(Baseline)
Turbine Oil E6 Weeks
12669 (222%) 9539.5 (167.1%)1350 (125.5%) 527 (49%)
2 66.5
1735 1364

© 2019 Fluitec International
TOPP Observations
1.96.7
17.113.5
1.6
6.5
47.951.5
1.5
11.7
35.1
64.3
1.4
2.76.22
31
66.5
0
10
20
30
40
50
60
70
0 1 2 3 4 5 6
MPC
dE
TOPP weeks
MPC dE Trends
Oil A Oil B Oil C Oil D Oil E
1323
491
923
607
1710
1134
1586
1341
1735
1364
400
600
800
1000
1200
1400
1600
1800
2000
0 1 2 3 4 5 6
RPVO
T, m
inutes
TOPP weeks
RPVOT TrendsOil A (62%) Oil B (34%)Oil C (33%) Oil D (15%)Oil E (21%) Linear (Oil C (33%))
OIL D OIL D

© 2019 Fluitec International
Turbine Oil Performance Prediction
• Steam turbine: 12 Years • Gas turbine: 8 Years• Hydro turbine: 20 years• Compressor: 7 Years• Evaluating different additive systems• Evaluating various base‐stocks • Assessing fully formulated oil• Estimate the long‐term performance of the oil Performance of the formulated oil may vary based on the severity of the operating conditions

© 2019 Fluitec International
TOPP Findings
• Representative of real field scenario as compared to D943 and D7873
• Assess the physical as well as chemical properties of the turbine oil
• High RPVOT does not correspond to long term oxidation retention, monitor the depletion rate of antioxidants and RVOT
• Selection of appropriate antioxidants package is vital for long term RPVOT retention, lower deposit formation, and depletion rate
• Choice of proper base‐stock/co‐solubilizing agent is critical for long‐term deposit control and formulation stability
• Some turbine oil formulations may not show high deposit forming tendencies initially but may form high deposits after being in‐service for a couple of years
• Fill for life turbine oil provides long‐lasting performance
• Turbine oil formulation developed on this foundation shown in the next slide

© 2019 Fluitec International
Next Generation Turbine Oil
TestTurbine Oil Baseline
Turbine Oil 336 hr
(2 weeks)
Turbine Oil672 hr
(4 weeks)
Turbine Oil 1008 hr (6 weeks)
Turbine Oil 1680 hr
(10 weeks)
Turbine Oil 2016 hr
(12 weeks)
Turbine Oil 3024 hr
(18 weeks)
Color, ASTM D1500 0.5 1 1.5 2.0 3.0 3.0 4.0Ruler, ASTM D6971 % Amminic: 100 98.5 93.5 86 69.1 54.5 20.1Ruler, ASTM D6971 % Phenolic: 100 91.7 86.8 63.1 46.1 32.4 13.3RPVOT, ASTM D2272, minutes 1282 1189 1060 941 637 448 321Membrane Patch Colorimetry ΔE 0.7 1.2 2.1 5.2 7.5 8.1 8.5Weight of Residue, mg/L 8.2 10.0 21.0 35.4 43.0 41.0 39.3

© 2019 Fluitec International
Next Generation Turbine Oil
MPC Patch
Turbine Oil
Catalyst Coil
Test Tube
Week 2 Week 4 Week 6 Week 18Week 12Week 10Baseline

© 2019 Fluitec International
OEM Approval
• Siemens TLV 901304 and TLV 901305
• Man Turbo (LTAT thermal stability test)
Meets or exceeds OEM specs for Solar and GE
Initial 1200C 1500C 1800C1800C
Good thermal resistance and low deposit forming tendencies
No tendency for building deposits films
Tendency for deposit formation

Thank You!!!Acknowledgement:
Greg Livingstone, Fluitec International
Jo Ameye, Fluitec International
Nathan Walker, Lubrication Engineer
Wade Fleming, Lubrication Engineer