Embed Size (px)
Citation preview
Evaluation of Three Vision Based Object
Perception Methods for a Mobile Robot
Arnau Ramisa†, David Aldavert‡, Shrihari Vasudevan§,
Ricardo Toledo‡, Ramon Lopez de Mantaras†
†Artificial Intelligence Research Institute (IIIA-CSIC), Campus UAB, E-08193Bellaterra, Spain, [email protected], [email protected]
‡Computer Vision Center, Campus UAB, E-08193 Bellaterra, Spain,[email protected], [email protected]
§Australian Centre for Field Robotics, The University of Sydney, NSW 2006,
Australia, [email protected]
Abstract
This paper addresses object perception applied to mobile robotics.Being able to perceive semantically meaningful objects in unstructuredenvironments is a key capability in order to make robots suitable to per-form high-level tasks in home environments. However, finding a solutionfor this task is daunting: it requires the ability to handle the variabilityin image formation in a moving camera with tight time constraints. Thepaper brings to attention some of the issues with applying three stateof the art object recognition and detection methods in a mobile roboticsscenario, and proposes methods to deal with windowing/segmentation.Thus, this work aims at evaluating the state-of-the-art in object percep-tion in an attempt to develop a lightweight solution for mobile roboticsuse/research in typical indoor settings.
keywords: object detection, computer vision, mobile robotics
1

1 Introduction
Currently there is a big push towards semantics and higher level cognitive capa-bilities in robotics research. One central requirement towards these capabilitiesis to be able to identify higher level features like objects, doors, etc.
Although impressive results are obtained by modern object recognition andclassification methods, still a lightweight object perception method is lacking.Furthermore, the system should be able to learn new objects in an easy, andpreferably automatic, way.
investigate underlying representations of spatial cognition for autonomousrobots. Although not specifically addressed in that work, object perception isan essential component that the authors reported to be the most limiting factor.
Although different modalities of perception (e.g. laser range-finder, colorcamera, haptics) can be used, in this work we focus on passive vision, as it isinteresting for several reasons, like an affordable cost, compatibility with humanenvironments or richness of perceived information.
achieved in the detection test of the Pascal 2007 chall. Recently severalmethods have been quite successful in particular instances of the problem, suchas detecting frontal faces or cars, or in datasets that concentrate on a particularissue (e.g. classification in the Caltech-101 [2] dataset). However in more chal-lenging datasets like the detection competition of the Pascal VOC 2007 [3] themethods presented achieved a lower average precision. This low performance isnot surprising, since object recognition in real scenes is one of the most chal-lenging problems in computer vision [4]. The visual appearance of objects canchange enormously due to different viewpoints, occlusions, illumination varia-tions or sensor noise. Furthermore, objects are not presented alone to the visionsystem, but they are immersed in an environment with other elements, whichclutter the scene and make recognition more complicated.
In a mobile robotics scenario a new challenge is added to the list: compu-tational complexity. In a dynamic world, information about the objects in thescene can become obsolete even before it is ready to be used if the recognitionalgorithm is not fast enough.
For clarity, in the following we will refer to classification as the task ofassigning previously unseen object instances to given general class label (is thisa mug?), recognition as the task of identifying a particular object instance (isthis my mug?) and detection as (roughly) deciding which area of the image isoccupied by our object of interest (where is the mug?).
In the present work our intent is to survey some well established object recog-nition systems, comment on its applicability to robotics and evaluate them on amobile robotics scenario. The selected methods are the SIFT object recognitionalgorithm[11], the Bag of Features[14], and the Viola and Jones boosted cascadeof classifiers[17], and they were chosen taking into consideration issues relevantto our objective, for example its ability to detect at the same time they recog-nize, its speed or scalability and the difficulty of training the system. From theobtained results we extract our conclusions and propose several modificationsto improve the performance of the methods. Namely, we propose improvements
2

to increase the precision of the SIFT object recognition method, and a segmen-tation approach to make the Bag of Features method suitable for detection ininteractive time. We also benchmark the proposed methods agains the typicallyused Viola and Jones classifier. Finally, we perform extensive tests with theselected methods in our publicly available dataset1 to assess their performancein a mobile robotics setting.
The three methods are fundamentally different in that they address recogni-tion, classification and detection (three core problems of visual perception), butstill can be tailored to the other objectives too. We compare and benchmarkthese three successful vision approaches towards use in real mobile robotics ex-periments, providing an useful guide for roboticists who need to enable theirrobots with object recognition capabilities. The selected algorithms are evalu-ated under different issues, namely:
• Detection: Having the ability to detect where in the image is locatedthe object. In most situations, large portions of the image are occupiedby background objects that introduce unwanted information which mayconfuse the object recognition method.
• Classification: A highly desirable capability for an object detectionmethod is to be able to generalize and recognize previously unseen in-stances of a particular class.
• Occlusions: Usually a clear shot of the object to recognize will not beavailable to the robot. An object recognition method must be able to dealwith only partial information of the object.
• Texture: Objects with a rich texture are typically easier to recognizethan those only defined by its shape and color. We want to evaluate thebehavior of each method with both types of objects.
• Repetitive patterns: Some objects, such as a chessboard, present repet-itive patterns that cause problems in methods that have a data associationstage.
• Training set resolution: Large images generate more features at dif-ferent scales (specially for smaller ones) that are undoubtedly useful forobject recognition. However, if training images have a resolution muchhigher than test images descriptors may become too different.
• Training set size: Most methods can benefit from a larger and betterannotated training set. However, building such a dataset is time consum-ing. We want to assess which is the least amount of training informationthat each method requires to obtain its best results.
• Run-Time: One of the most important limitations of the scenario we areconsidering is the computation time. We want to measure the frame-rateat which comparable implementations of each method can work.
1Available for download at http://www.iiia.csic.es/~aramisa/iiia30.html
3

• Detection accuracy: Computing accurately the location of the objectcan significantly benefit other tasks such as grasping or navigation. Weare interested in how precise is the detection of the object recognitionalgorithm according to the ground truth.
Although different parts of object recognition methods (e.g. feature detectorsand descriptors, machine learning methods) have been extensively compared inthe literature, to our knowledge there is no work that compares the performanceof complete object recognition methods in a practically hard application likemobile robotics.
Probably the work most related with ours is the one of [5], where four meth-ods (SIFT and KPCA+SVM with texture and color features) were combinedin an object recognition/classification task for human-robot interaction. Theappropriate method for each class of object was chosen automatically from thenine combinations of task/method/features available, and models of the learnedobjects were improved during interaction with the user (pictured as a handi-capped person in the paper). This work was, however, more focused on buildinga working object classification method suitable for the particular task of human-robot interaction with feedback from the human user, and not in evaluating eachparticular method in a standardized way. Furthermore, no quantitative resultswere reported for the experiments with the robot.
Mikolajczyk et al. [6, 7] do a comprehensive comparison of interest regiondetectors and descriptors in the context of keypoint matching. Although thisworks are undoubtedly related with the one presented here, the objectives ofthe comparison are notably different: while Mikolajczyk et al. measured therepeatability of the region detectors and the matching precision of the regiondescriptors, here we focus on the performance of three well-known object recog-nition methods in the very specific setting of mobile robotics.
The rest of the paper is divided as follows: First, 1 shows the conclusionsreached in this work regarding the applicability of the evaluated methods inthe mobile robot vision domain. Next, in Section 2 comes an overview of thedatasets used in our experimentation. In Sections 3 to 5 the different objectrecognition algorithms are briefly described and the experiments done to arriveto the conclusions for each presented. Finally, in Section 6, the conclusions ofthe work are presented and continuation lines proposed.
4

SIFT Vocabulary Tree Cascade of Simple ClassifiersDetection Can detect objects under in-
plane rotation, scale changesand small out-of-plane rota-tions
Must be complemented witha sliding windows approach,a segmentation algorithm oran interest operator
Is able to determine the mostprobable bounding box ofthe object
Pose Estimation Up to an affine transforma-tion
presence/absence only presence/absence only
Classification(intra-classvariation andgeneralization)
No Yes Yes
Occlusions Tolerates it as long as atleast 3 points can be reli-ably matched (depends onammount of texture)
Showed good tolerance to oc-clusions
Low tolerance to occlusions
Repetitive pat-terns
No Yes Yes
Training set size One image From tens of images on Hundreds or thousands ofimages
Training set res-olution
VGA resolution is sufficient Benefits from higher resolu-tion of training data
VGA resolution is sufficient
Run-Time Less than a second per image two seconds per image witha segmentation algorithm in-cluded
Less than a second per image
Table 1: Qualitative summary of results found in our experiments.
5
2 Datasets and Performance Metrics
In order to evaluate the methods in a realistic mobile robots setting, we havecreated the IIIA30 dataset2, that consists of three sequences of different lengthacquired by our mobile robot while navigating at approximately 50 cm/s in alaboratory type environment and approximately twenty good quality images fortraining taken with a standard digital camera. The camera mounted in therobot is a Sony DFW-VL500 and the image size is 640x480 pixels. In Figure 1the robotic platform used can be seen. The environment has not been modifiedin any way and the object instances in the test images are affected by lightningchanges, blur caused by the motion of the robot, occlusion and large viewpointand scale changes.
Figure 1: Robotic platform used in the experiments.
We have considered a total of 30 categories (29 objects and background) thatappear in the sequences. The objects have been selected to cover a wide rangeof characteristics: some are textured and flat, like the posters, while others aretextureless and only defined by its shape. Figure 2.a shows the training imagesfor all the object categories, and 2.b shows some cropped object instances fromthe test images. Each occurrence of an object in the video sequences has beenmanually annotated in each frame to construct the ground truth, along with itsparticular image characteristics (e.g. blurred, occluded...).
In order to evaluate the performance of the different methods we used severalstandard metrics that are briefly explined in the following lines. Precision isdefined as the ratio of true positives among all the positively labeled examples,
2http://www.iiia.csic.es/~aramisa/iiia30.html
6

and reflects how accurate our classifier is.
Pre =TruePositives
FalsePositives+ TruePositives(1)
Recall measures the percentage of true positives that our classifier has been ableto label as such. Namely,
Rec =TruePositives
FalseNegatives+ TruePositives(2)
Since it is equally important to perform well in both metrics, we also consideredthe F-Measure metric:
f −measure =2 · Precision ·RecallPrecision+Recall
(3)
This measure assigns a single score to an operating point of our classifier weight-ing equally precision and recall, and is also known as f1−measure or balancedf − score. If the costs of a false positive and a false negative are asymetric, thegeneral f-measure can be used by adjusting the β parameter:
fg −measure =(1 + β2) · Precision ·Recallβ2 · Precision+Recall
(4)
In the object detection experiments, we have used the Pascal VOC objectdetection criterion [3] to determine if a given detection is a false or a truepositive. In brief, to consider an object as a true positive, the bounding boxesof the ground truth and the detected instance must have a ratio of overlap equalor greater than 50% according to the following equation:
BBgt ∩BBdetectedBBgt ∪BBdetected
≥ 0.5 (5)
where BBgt and BBdetected stand for the ground truth and detected objectbounding box respectively. For objects marked as occluded only the visible parthas been annotated in the ground truth, but the SIFT object recognition methodwill still try to adjust the detection bounding box for the whole object basedonly in the visible part. Since the type of annotation is not compatible with theoutput of the SIFT algorithm, for the case of objects marked as occluded, wehave modified the above formula in the following way:
BBgt ∩BBdetectedBBgt
≥ 0.5 (6)
As can be seen in the previous equation, it is only required that the detectedobject bounding box overlaps 50% of the ground truth bounding box.
Apart from the IIIA30 dataset, in order to test and adjust the parameters ofthe Vocabulary Tree object recognition method, we have used two pre-segmentedimage databases:
7

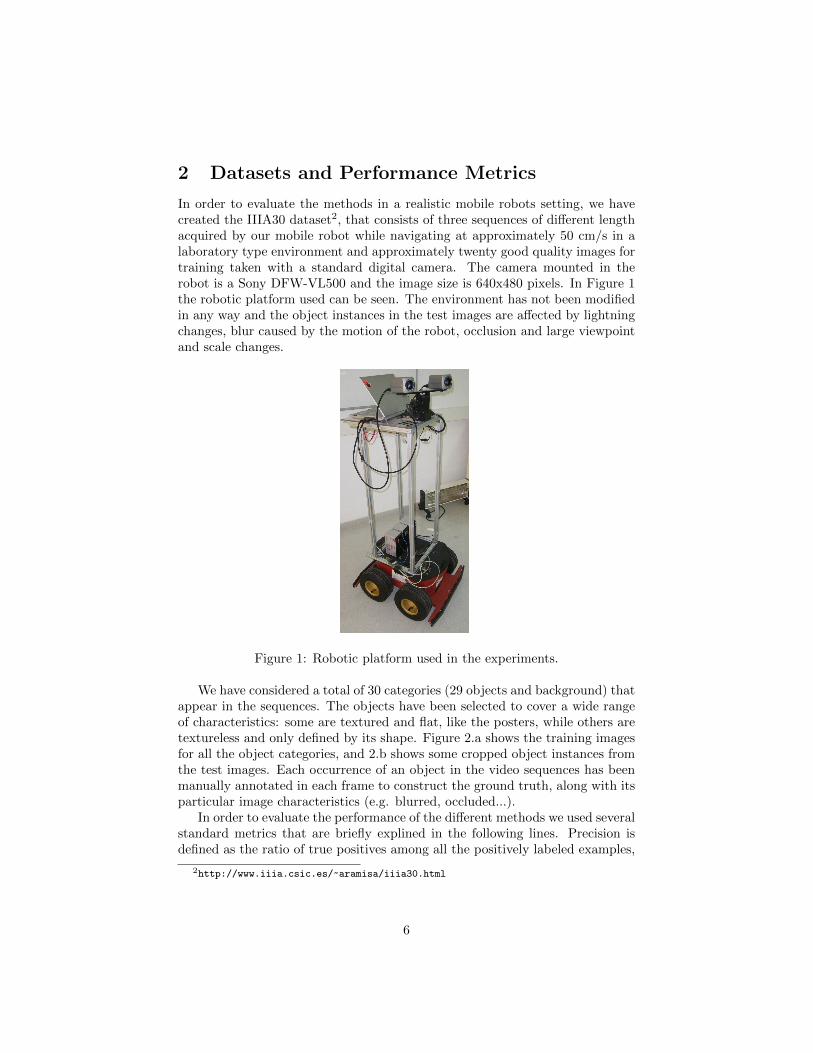
• ASL: The ASL recognition dataset3 consists of nine household objectsfrom the Autonomous Systems Lab of the ETHZ [8]. It consists of around20 training images per object from several viewpoints and 36 unsegmentedtest images with several instances of the objects, some of them with illumi-nation changes or partial occlusions. The training images have been takenwith a standard digital camera at a resolution of 2 megapixels, while thetest images have been acquired with a STHMDCS2VAR/C stereo headby Videre design at the maximum possible resolution (1.2 megapixels). Asegmented version of the training object instances has also been used insome experiments, and is referred as segmented ASL. Some images of thesegmented version can be seen in Figure 2.
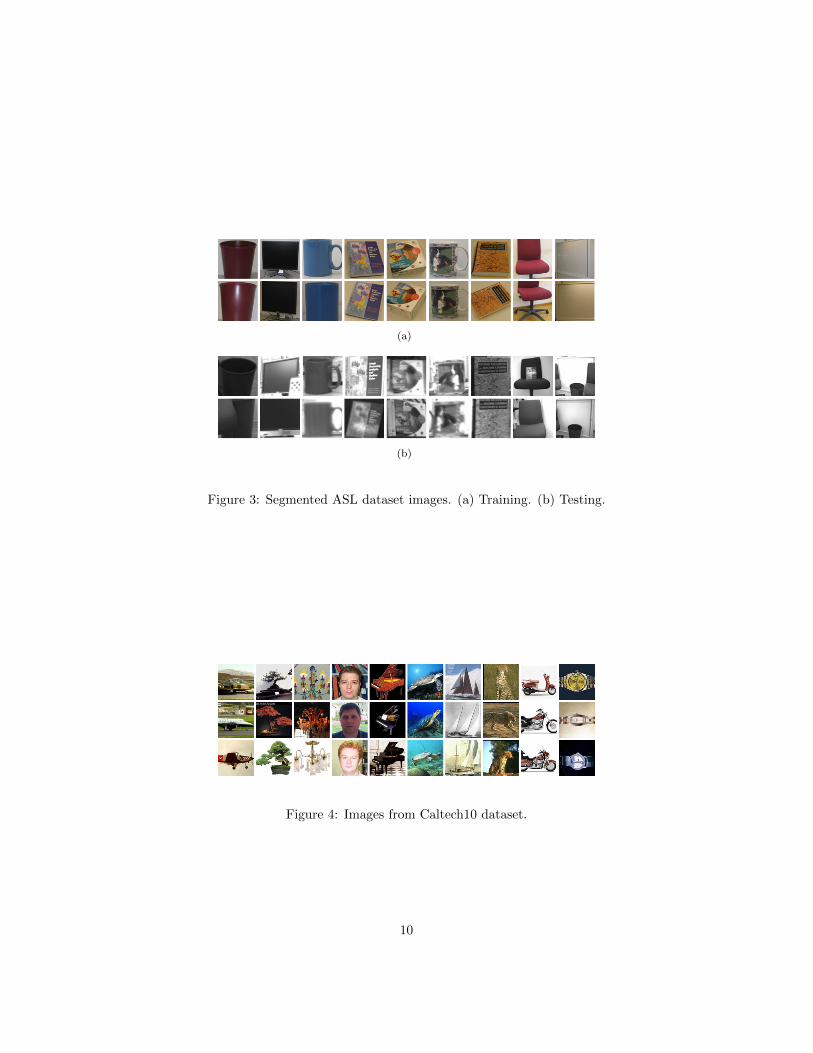
• Caltech10: This is a subset of the Caltech 101 dataset [9] , widely usedin computer vision literature. We have taken 100 random images of theten most populated object categories, namely: planes (lateral), bonsais,chandeliers, faces (frontal), pianos, tortoises, sails, leopards, motorbikesand clocks as seen in Figure 4. Training and testing subsets are determinedrandomly in each test. Experiments with dataset have been done followingthe setup of [10]: 30 random training images and the rest for testing.
3http://www.iiia.csic.es/~aramisa/iiia30.html
8

(a)
(b)
Figure 2: (a) Training images for the IIIA30 dataset. (b) Cropped instances ofobjects from the test images.
9
(a)
(b)
Figure 3: Segmented ASL dataset images. (a) Training. (b) Testing.
Figure 4: Images from Caltech10 dataset.
10

3 Lowe’s SIFT
Matching Method- Exact Nearest Neighbors-Approximate Nearest N.Min Distance Ratio
Training ImagesLocal Descriptor
Database
Local regiondetection and
description
For every valid hypothesis
GeneralHough
Transform
HypothesisFilteringStage
Final hypothesis
Detector Type:- Harris Laplace/Affine- Hessian Laplace/Affine- SURF- DoG•- MSERDesciptor type- SIFT•- Shape Context
- RANSAC- IRLS- Heuristic Rules
Test Image
DescriptorMatching
Non-Maxima SuppressionMin Number of Votes
Training set•Image Resolution
Figure 5: Diagram of the Lowe’s SIFT method with all the tests performedshown as purple boxes, Orange ones refer to steps of the method and green toinput/output of the algorithm.
Lowe’s SIFT object recognition approach is a view-centered object detectionand recognition system with some interesting characteristics for mobile robots,most significant of which is the ability to detect and recognize objects in anunsegmented image. Another interesting feature is the Best-Bin-First algorithmused for approximated fast matching, which reduces the search time by twoorders of magnitude for a database of 100,000 keypoints for a 5% loss in thenumber of correct matches [11]. Follows a brief outline of the algorithm.
The first stage of the approach consists on matching individually the SIFTdescriptors of the features detected in a test image to the ones stored in theobject database using the Euclidean distance. As a way to reject false corre-spondences, only those query descriptors for which the best match is isolatedfrom the second best and the rest of database descriptors are retained. In Figure6, the matching features between a test and model images can be seen. The
11

presence of some outliers (incorrect pairings of query and database features) canalso be observed.
Once a set of matches is found, the Generalized Hough Transform is used tocluster each match of every database image depending on its particular transfor-mation (translation, rotation and scale change). Although imprecise, this stepgenerates a number of initial coherent hypotheses and removes a notable portionof the outliers that could potentially confuse more precise but also more sensi-tive methods. All clusters with at least three matches for a particular trainingobject are accepted, and fed to the next stage: the Least Squares method, usedto improve the estimation of the affine transformation between the model andthe test images.
Figure 6: Matching stage in the SIFT object recognition method.
This approach has been modified in several ways in our experiments: Theleast squares method has a 0% breakdown point (i.e. any false correspondencewill make the model fitting method fail or give sub-optimal results), which is arather unfeasible restriction since we have found it is normal to still have somefalse matches in a given hypothesis after the Hough Transform.
To alleviate this limitation, instead of the least squares, we have used the It-eratively Reweighted Least Squares (IRLS), which we have found to perform wellin practice at a reasonable speed. Furthermore we have evaluated the RANdomSAmple Consensus (RANSAC), another well-known model fitting algorithm, tosubstitute or complement the IRLS. The RANSAC algorithm iteratively teststhe support of models estimated using minimal subsets of points randomly sam-pled from the input data. Finally, we have incorporated some domain knowl-edge by defining several heuristic rules on the parameters of the estimated affinetransformation to reject those clearly beyond plausibility. Namely:
• Hypotheses with object centers that are too close.
• Hypotheses that have a ratio between the x and y scales below a threshold.
Figure 5 shows an overview of our implementation of the SIFT object recognitionalgorithm steps.
12
For evaluating the method, one image per category from the training imageset is used. As there are several parameters to adjust in this method, we usedthe first sequence of the IIIA30 dataset (IIIA30-1) as test data to perform anextensive cross-validation over detector and descriptor type, training image size,matching method, distance ratio to the second nearest neighbor for rejectingmatches, non-maxima suppression and minimum number of votes in the HoughTransform and hypothesis verification and refinement methods.
Since this study is too extensive to be included here, details are providedonline for the interested reader4. Follows a brief summary of the most relevantresults obtained with the corss-validation.
In this section the results of cross-validation tests conducted using sequence1 of the IIIA30 dataset (IIIA30-1) with the different parameter combinationsconsidered are described. Taking into account all combinations, the best recallobtained has been 0.45 with the Hessian Laplace detector and the less restrictivesettings possible. However this configuration suffered from a really low precision,just 0.03.
The best precision score has been 0.94, and has been obtained also with theHessian Laplace detector, with a restrictive distance ratio to accept matches:0.5. The recall of this combination was 0.14. The same precision value but withlower recall has been obtained with the SURF and Hessian Affine detectors.
Looking at the combinations that had a best balance between recall andprecision (best f—measure), the top performing ones obtained 0.39 also with theHessian Laplace detector (0.29 recall and 0.63 precision). However, even thoughapproximate nearest neighbors is used, each image takes around 2 seconds tobe processed.
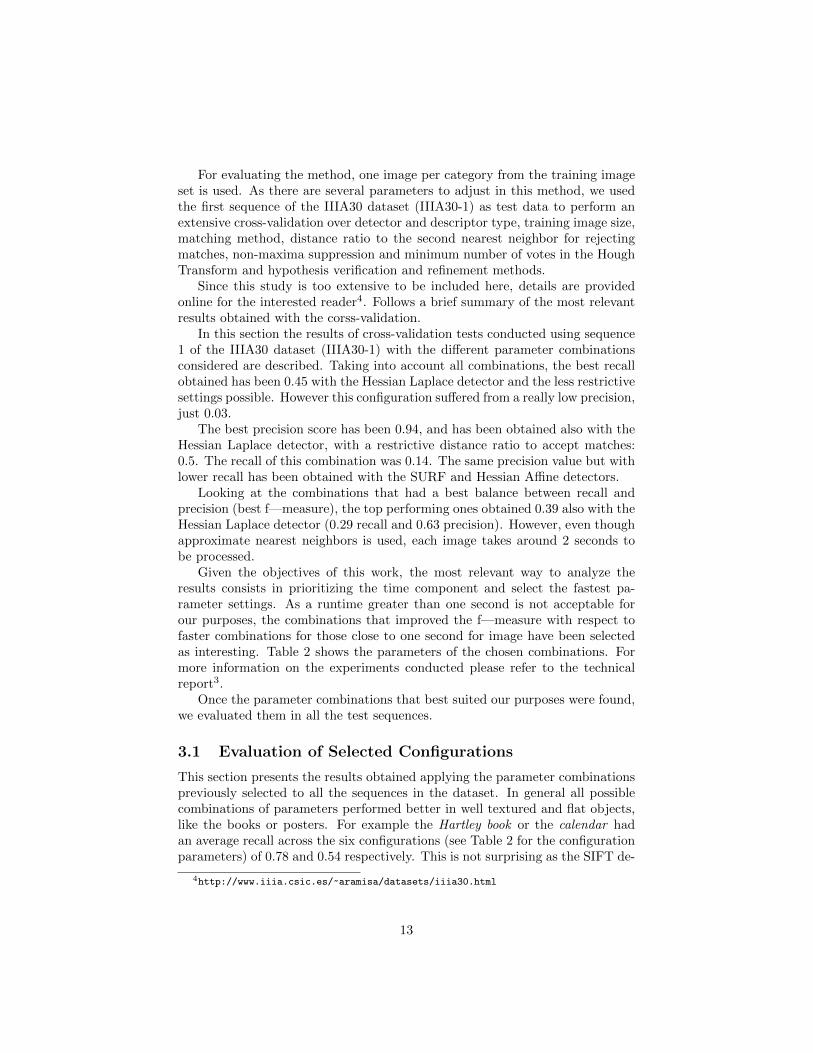
Given the objectives of this work, the most relevant way to analyze theresults consists in prioritizing the time component and select the fastest pa-rameter settings. As a runtime greater than one second is not acceptable forour purposes, the combinations that improved the f—measure with respect tofaster combinations for those close to one second for image have been selectedas interesting. Table 2 shows the parameters of the chosen combinations. Formore information on the experiments conducted please refer to the technicalreport3.
Once the parameter combinations that best suited our purposes were found,we evaluated them in all the test sequences.
3.1 Evaluation of Selected Configurations
This section presents the results obtained applying the parameter combinationspreviously selected to all the sequences in the dataset. In general all possiblecombinations of parameters performed better in well textured and flat objects,like the books or posters. For example the Hartley book or the calendar hadan average recall across the six configurations (see Table 2 for the configurationparameters) of 0.78 and 0.54 respectively. This is not surprising as the SIFT de-
4http://www.iiia.csic.es/~aramisa/datasets/iiia30.html
13
Meth
od
Dis
tance
Rati
o
Dete
cto
r
Min
.M
atc
hes
HT
Meth
od
RA
NSA
C
Appro
x-N
N
IRL
S
Heuri
stic
s
Tim
e(s
ec)
Recall
Pre
cis
ion
F-M
easu
re
Config 1 0.8 SURF 5 NMS No Yes Yes No 0.37 0.15 0.51 0.23Config 2 0.8 SURF 3 NMS Yes Yes Yes Yes 0.42 0.14 0.87 0.24Config 3 0.8 DoG 10 NMS No Yes Yes No 0.52 0.17 0.47 0.25Config 4 0.8 DoG 10 NMS Yes Yes Yes Yes 0.55 0.17 0.9 0.28Config 5 0.8 DoG 5 NMS Yes Yes Yes Yes 0.60 0.19 0.87 0.31Config 6 0.8 HesLap 10 NMS Yes Yes Yes Yes 2.03 0.28 0.64 0.39
Table 2: Detailed configuration parameters and results for the six representativeconfigurations in increasing time order. They have been chosen for providingthe best results in a sufficiently short time.
Object Config 1 Config 2 Config 3 Config 4 Config 5 Config 6Rec Pre Rec Pre Rec Pre Rec Pre Rec Pre Rec Pre
Grey bat-tery
0 0 0 0 0 0 0 0 0 0 0 0
Bicycle 0.54 0.52 0.52 1.00 0.33 0.52 0.36 0.89 0.38 0.90 0.33 0.62Hartleybook
0.58 0.93 0.58 0.93 0.86 0.77 0.88 0.88 0.95 0.85 0.81 0.73
Calendar 0.44 0.65 0.35 0.86 0.56 0.66 0.56 0.79 0.56 0.79 0.79 0.71Chair 1 0.03 0.08 0.02 0.33 0 0 0 0 0.01 1.00 0.54 1.00Charger 0.03 0.20 0.03 0.50 0 0 0 0 0 0 0.18 0.14Cube 2 0.62 0.28 0.67 0.67 0.71 0.11 0.76 0.59 0.76 0.55 0.52 0.38Monitor 3 0 0 0 0 0 0 0 0 0 0 0.02 0.33Posterspices
0.38 0.77 0.42 0.94 0.54 0.79 0.53 0.87 0.58 0.87 0.56 0.92
Rack 0.26 0.59 0.26 1.00 0.10 0.80 0.10 1.00 0.23 1.00 0.77 0.79
Table 3: Object-wise recall and precision for all combinations.
scriptor assumes local planarity, and depth discontinuities can severely degradedescriptor similarity. On average, textured objects achieved a recall of 0.53 anda precision 0.79 across all sequences. Objects only defined by shape and colorwere in general harder or even impossible to detect, as can be seen5 in Table 3.Recall for this type of objects was only 0.05 on average. Configuration 6, thatused the Hessian Laplace detector, exhibited a notably better performance forsome objects of this type thanks to its higher number of detected regions. Forexample the chair obtained a recall of 0.54, or the rack that obtained a 0.77recall using this feature detector. Finally, and somewhat surprisingly, objectswith a repetitive texture such as the landmark cubes (see Figure 2) had a quitegood recall of 0.46 on average. Furthermore, the result becomes even betterif we take into consideration that besides the self-similarity, all three landmarkcubes were also similar to one another.
Regarding the image quality parameters (see Table 4), all combinations be-haved in a similar manner: the best recall, as expected, was obtained by images
5For space reasons, only part of the Table was included. The full Table can be found inhttp://www.iiia.csic.es/~aramisa/datasets/iiia30_results/results.html
14

not affected by blur, occlusions or strong illumination changes. From the differ-ent disturbances, what was tolerated best was occlusion, followed by blur andthen by illumination. Combinations of problems also had a demolishing effectin the method performance as seen in the last three rows of Table 4, being theworst case the combination of blur and illumination that had 0 recall. Objectinstance size (for objects with a bounding box defining an area bigger than 5000pixels) did not seem to have such an impact in performance as image qualityhas. The performance with objects of smaller area has not yet been rigorouslyanalyzed and is left for future work. As can be seen in the results, RANSACand the heuristics significantly improved precision without affecting recall.
Object Config 1 Config 2 Config 3 Config 4 Config 5 Config 6Normal 0.26 0.25 0.26 0.28 0.3 0.33Blur 0.1 0.1 0.16 0.15 0.18 0.25Occluded 0.16 0.14 0.14 0.12 0.14 0.34Illumination 0 0 0.06 0.06 0.06 0.06Blur+Occl 0.06 0.04 0.08 0.06 0.09 0.14Occl+Illum 0.08 0.08 0.08 0.08 0.08 0.06Blur+Illum 0 0 0 0 0 0
Table 4: Recall depending on image characteristics. Normal stands for objectinstances with good image quality and blur for blurred images due to motion,illumination indicates that the object instance is in a highlight or shadow andtherefore has low contrast. Finally the last three rows indicate that the objectinstance suffers from two different problems at the same time.
Finally, we have validated the detection accuracy by the ratio of overlapbetween the ground truth bounding box and the detected object instance ascalculated in Equation 5. As can be seen in Figure 7, on average 70% of truepositives have a ratio of overlap greater than to 80%, regardless of the parametercombination. Furthermore, we found no appreciable advantage on detectionaccuracy for any object type or viewing conditions, although a more in-depthanalysis of this should be addressed in future work.
As a means to provide a context to the results obtained with the six selectedconfigurations (i.e. how good are they with respect to what can be obtainedwithout taking into account the execution time), we compare them to the bestoverall recall and precision values obtained with the SIFT object recognitionmethod. Table 5 displays the averaged precision and recall values of the fourconfigurations that obtained the overall best recall and the four that obtainedthe overall best precision, as well as the six selected configurations. As can beseen in the table, the attained recall in the selected configurations was 20% lowerthan the maximum possible, independently of the type of objects. Precision ismore affected by the amount of texture, and differences with respect to the topperforming configurations ranged from 17% to 38%.
3.2 Discussion
Experiments show that, using the SIFT object recognition approach with theproposed modifications, it is possible to precisely detect, considering all image
15

60% 70% 80% 90% 100%0
0,1
0,2
0,3
0,4
0,5
0,6
0,7
0,8
0,9
1
Config 1Config 2Config 3Config 4Config 5Config 6
Percentage of Overlap
Accum
ula
ted R
atio o
f T
rue P
osi
tive
s
Figure 7: Accumulated frequencies for ratio of overlap between the ground truthbounding box and the detected bounding box for correctly found objects (truepositives). An object is considered correctly detected if the ratio of overlapbetween the bounding boxes computed with equation 5 is 50% or more.
degradations, around 60% of well-textured object instances with a precisionclose to 0.9 in our challenging dataset at approximately one frame per secondin 640 × 480 pixel images with our not fully optimized implementation. Evendetectors known to sacrifice repeatability (probability of finding the same fea-ture region in slightly different viewing conditions) for speed such as the SURFobtain reasonable results. Performance degrades for objects with repetitive tex-tures or no texture at all. Regarding image disturbances, the approach resistedocclusions well, since the SIFT object recognition method is able to estimate areliable transformation as long as the visible part of the object contains enoughtexture (and a minimum number of correct matches, three by default) but notso well blur due to motion or deficient illumination.
The step of the algorithm that takes most of the processing time is the de-scriptor matching, as it has a complexity of O(N ·M ·D) comparisons, whereN is the number of features in the new test image, M is the number of fea-tures in the training dataset and D is the dimension of the descriptor vector.Approximate matching strategies, such as the one by [12] used in this work,make the SIFT object recognition method suitable for robotic application bylargely reducing its computational cost. In our experiments we experienced onlya 0.01 loss in the f—measure for an up to 35 times speed-up. Furthermore, animplementation tailored to performance should be able to achieve even fasterrates. A drawback of the SIFT object recognition method is that it is not ro-bust to viewpoint change. It would be interesting to evaluate how enhancingthe method with 3D view clustering as described in [13] affects the results, asit should introduce robustness to this type of transformation.
16

Best Recall Best Precision Selected Config.mean std mean std mean std
Repetitively textured objectsRecall 0.65 0.09 0.16 0.01 0.46 0.05Precision 0.02 0.01 0.75 0.15 0.43 0.24
Textured objectsRecall 0.70 0.03 0.28 0.03 0.53 0.10Precision 0.05 0.02 0.96 0.02 0.79 0.09
Not textured objectsRecall 0.21 0.01 0.01 0.01 0.05 0.04Precision 0.03 0.01 0.62 0.32 0.24 0.21
Table 5: Average recall and precision of the configurations that where selectedfor having the best values according to these two measures in the last section.Also average results among the six selected configurations are shown for compar-ison. Standard deviation is provided to illustrate scatter between the selectedconfigurations. Objects are grouped in the three “level of texture” categories inthe following way: the three cubes form the repetitively textured category, thetwo books, the calendar and the three posters form the textured category, andthe rest fall into the non textured category.
17

4 Vocabulary Tree Method
- Intensity Segmentation(floodcanny)- Depth Segmentation- Sliding Window
Local DescriptorDatabase
Local regiondetection and
descriptionHierarchical
K-Means
VocabularyTree
For
eac
h re
gion
Visual wordcounts
Weighting andnormalization K-NN classifier
Final hypothesis
Globaldescriptordatabase
- Branch Factor- Depth
Detector Type:- Harris Laplace/Affine- Hessian Laplace/Affine- SURF- DoG- MSER
- L1 and L2 norm- Single and doubleprecision
- Number of voting neighbors- Distance ratio between first and second class
Test Image
segmentation
Figure 8: Diagram of the Vocabulary Tree method. Modifications to the origi-nal algorithm have yellow background and tests performed are shown as purpleboxes. As before, orange boxes refer to steps of the method and green to in-put/output of the algorithm.
The Vocabulary Tree approach [14] to object classification is based on thebag of words document retrieval methods, that represent the subject of a docu-ment by the frequency in which certain words appear in the text. This techniquehas been adapted to visual object classification substituting the words with localdescriptors such as SIFT computed on image features [15, 16].
Although recently many approaches have been proposed following the bag ofwords model, we have selected this particular one because scalability to largenumbers of objects in a computationally efficient way is addressed, which isa key feature in mobile robotics. Figure 8 shows the main steps of the [14]algorithm. First the local feature descriptors are extracted from a test image,and a visual vocabulary is used to quantize those features into visual words.
A hierarchical vocabulary tree is used instead of a linear dictionary, as it
18

allows to code a larger number of visual features and simultaneously reduce thelook-up time to logarithmic in the number of leaves. The vocabulary tree isbuilt using hierarchical k-means clustering, where the parameter k defines thebranch factor of the tree instead of the final number of clusters like in the flat(standard) k-means. On the negative side, using such hierarchical dictionariescauses aliasing in cluster space that can reduce the performance of the approach.
Then, the visual words are weighted in accordance to its discriminative powerwith the Term Frequency-Inverse Document Frequency (TF-IDF) scheme to im-prove retrieval performance. Let ni be the number of descriptors correspondingto the codeword i found in the query image and mi the number of descrip-tors corresponding to the same codeword for a given training image, and let qand d be the histogram signatures of the query and database images, then thehistogram bins qi and di can be defined as:
qi = niωi
di = miωi(7)
where ωi is the weight assigned to node i. A measure based in entropy is usedto define the weights:
ωi = ln(N
Ni), (8)
where N is the number of images in the database, and Ni is the number ofimages in the database with at least one descriptor vector path through node i.Since signatures will be normalized before comparison, the resulting schema isthe term frequency-inverse document frequency.
To compare a new query image with a database image, the following scorefunction is used:
s(q, d) = ‖ q
‖q‖− d
‖d‖‖ (9)
The normalization can be in any desired norm, but the L1-norm (also knownas the “Manhattan” distance) was found to perform better both by [14] and inour experiments. The class of the object in the query image is determined asthe dominant one in the k nearest neighbors from the database images.
The second speed-up proposed by Nister and Stewenius consists on usinginverted files to organize the database of training images. In an inverted filesstructure each leaf node contains the ID number of the images whose signaturevalue for this particular leaf is not zero. To take advantage of this representation,and assuming that the signatures have been previously normalized, the previousequation can be simplified making the distance computation only dependent onthe nonzero elements both in the query and database vectors. With this distanceformulation one can use the inverted files and, for each node, accumulate to thesum only for the training signatures that have non-zero value. If signaturesare normalized using the L2 norm (i.e. the Euclidean distance), the distance
19

computation can be simplified further to:
||q − d||22 = 2− 2∑
i|qi 6=0,di 6=0
qidi (10)
and since we are primarily interested in the ranking of the distances, we cansimply accumulate the products and sort the results of the different images indescending order.
The main drawback of the Vocabulary Tree method is that it needs at leasta rough segmentation of the object to be recognized. The most straightforwardsolution to overcome this limitation is to divide the input image using a grid offixed overlapping regions and process each region independently. Alternatively,we propose a fast segmentation algorithm to generate a set of meaningful regionsthat can later be recognized with the vocabulary tree method.
The first option has the advantage of simplicity and universality: Resultsdo not depend on a particular method or set of segmentation parameters, butjust on the positions and shapes of the windows evaluated. However a squareor rectangular window usually does not fit correctly the shape of the objectwe want to detect and, in consequence, background information is introduced.Furthermore, if we want to exhaustively search the image, in the order of O(n4)overlapping windows will have to be defined, where n is the number of pix-els of the image. This will we extremely time-consuming, and also fusing theclassification output of the different windows into meaningful hypotheses is anon-trivial task. One way that could theoretically speed-up the sliding windowprocess is using integral images [17]. This strategy consists on first comput-ing an integral image (i.e. accumulated frequencies of visual word occurrencesstarting from an image corner, usually top-left) for every visual word in thevocabulary tree. Having the integral image pre-computed for all visual words,the histogram of visual word counts for an arbitrary sub-window can be com-puted with four operations instead of having to test if every detected featurefalls inside the boundaries of the sub-window. Let Ii be the integral image of aquery image for node i of the vocabulary tree, then the histogram H of visualwords counts for a given sub-window W can be computed in the following way:
Hi = Ii(Wbr) + Ii(Wtl)− Ii(Wtr)− Ii(Wbl) (11)
for all i, where Wbr, Wtl, Wtr and Wbl are respectively the bottom right, topleft, top right and bottom left coordinates of W .
The computational complexity of determining the visual word counts for anarbitrary sub-window is therefore O(4 · ϕ) operations, where ϕ is the size ofthe vocabulary. Doing the same without integral images has a complexity ofO(5 · η), where η is the number of visual words found in the test image. Fromthis, it is clear that integral images are a speed-up as long as ϕ is significantlysmaller than η (e.g. in case of dense feature extraction from the image with asmall vocabulary).
20
The second alternative is using a segmentation method to divide the imageinto a set of regions that must be recognized. Various options exist for this taskwhich can be broadly classified as intensity based and, if stereo pairs of imagesare available, depth based. In this work we have evaluated one method of eachtype. Namely, an intensity based method similar to the watershed algorithm,and a depth based one.
4.1 Intensity-based Segmentation
The intensity based method we propose, that we called floodcanny, consistson first applying the Canny edge detector to the image, and use the resultingedges as hard boundaries in a flood filling segmentation process. In contrastwith conventional watershed methods, in our method seed points are not localminima of the image, but are arbitrarily chosen from the set of unlabeled points;and a limit in brightness difference is imposed both for lower as well as for higherintensity values with respect to the seed point. For each candidate region of an
Figure 9: Results of the segmentation process using the floodcanny method.The first column shows the original images and the second column the seg-mented regions. Each color represents a different region, and Canny edges aresuperimposed for clarity.
21
acceptable size (in our experiments, having an area bigger than 900 pixels),a set of five sub-windows of different size centered in the segmented area aredefined and evaluated. In general, it is intuitive to think that, the more accuratethe segmentation of the image passed to the classifier is, the better will be theresults of the object recognition method. More specifically, methods that canovercome highlights, shadows or weak reflections as the one proposed by [18]have a potential to provide more meaningful regions for the classifier, and thecombination of such type of methods with appearance-based classifiers is an areaof great interest, that we would address in future work. For the present workhowever, we have used only our proposed floodcanny method, which, despite ofits simplicity, achieved good segmentation results as can be seen in Figure 9.Furthermore, it is fast to apply (less than 30 milliseconds for a 640×480 image),which is very convenient given our objectives.
4.2 Depth-based Segmentation
The second segmentation alternative proposed consisted of directly matchingfeatures between the left and right image to detect areas of constant depth.Since the geometry of the stereo cameras is known a priori, epipolar geometryconstraints can be used together with the scale and orientation of a given featureto reduce the set of possible matches. To determine the possible location ofthe objects in the environment, a grid of 3D cells of different sizes is used.Reprojected features cast a vote for a cell of a grid if it lies within the 3D cellcoordinates. Cells that have a minimum number of votes are reprojected tothe image and added as a candidate window. It seems tempting to directlyuse the matched features to construct the histogram of feature word counts,as it would reduce the amount of background introduced in the visual wordcounts histogram. However, there is no guarantee that all features of the objecthave been detected in both images and matched, and the effects of missingimportant object features are potentially worse than introducing a small amountof background. Therefore we considered it more adequate to accept all visualwords close to a set of valid matches.
4.3 Experimental Results
As in Section 3, an extensive cross-validation study has been conducted toevaluate the range of parameters of the method. For brevity here we onlyinclude the most relevant results and refer the interested reader to a technicalreport available online with all the experimental details6. This more detailedreport includes experiments that address:
1. Floating point precision (single/double)
2. Histogram normalization method
3. Effect in computational time of inverted files
6http://www.iiia.csic.es/~aramisa/datasets/iiia30.html
22
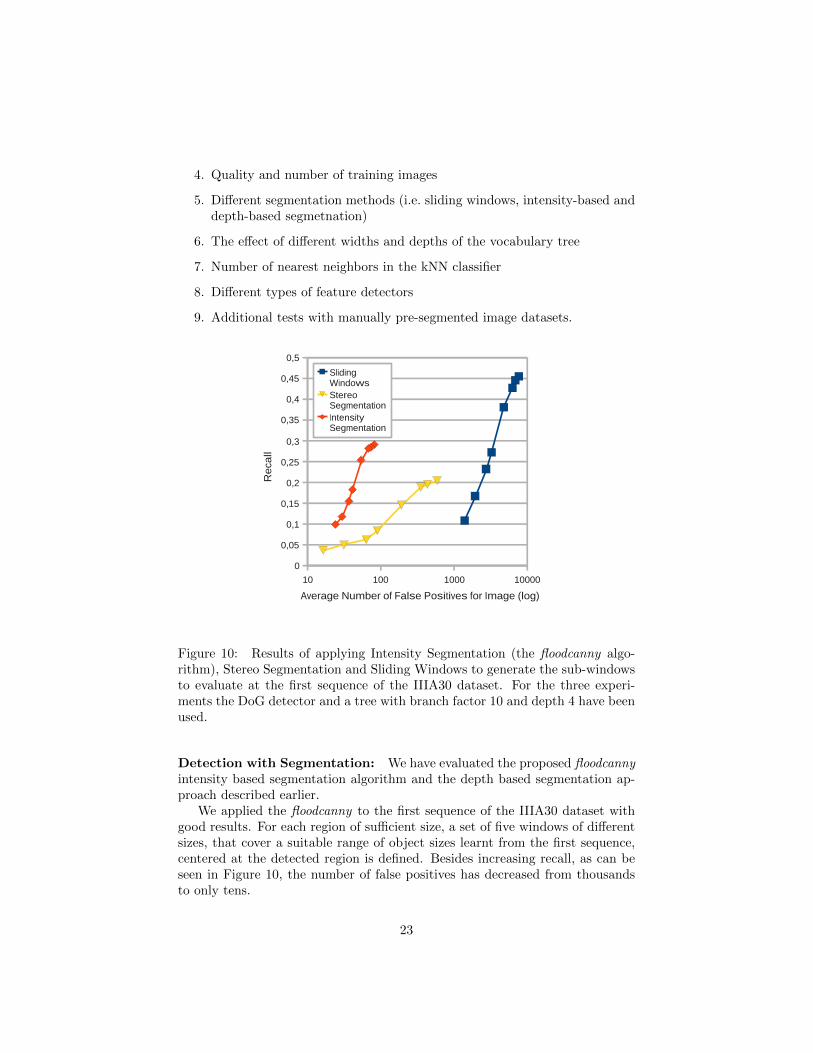
4. Quality and number of training images
5. Different segmentation methods (i.e. sliding windows, intensity-based anddepth-based segmetnation)
6. The effect of different widths and depths of the vocabulary tree
7. Number of nearest neighbors in the kNN classifier
8. Different types of feature detectors
9. Additional tests with manually pre-segmented image datasets.
10 100 1000 10000
0
0,05
0,1
0,15
0,2
0,25
0,3
0,35
0,4
0,45
0,5
Sliding WindowsStereo SegmentationIntensity Segmentation
Average Number of False Positives for Image (log)
Re
call
Figure 10: Results of applying Intensity Segmentation (the floodcanny algo-rithm), Stereo Segmentation and Sliding Windows to generate the sub-windowsto evaluate at the first sequence of the IIIA30 dataset. For the three experi-ments the DoG detector and a tree with branch factor 10 and depth 4 have beenused.
Detection with Segmentation: We have evaluated the proposed floodcannyintensity based segmentation algorithm and the depth based segmentation ap-proach described earlier.
We applied the floodcanny to the first sequence of the IIIA30 dataset withgood results. For each region of sufficient size, a set of five windows of differentsizes, that cover a suitable range of object sizes learnt from the first sequence,centered at the detected region is defined. Besides increasing recall, as can beseen in Figure 10, the number of false positives has decreased from thousandsto only tens.
23
Despite this result, the proposed segmentation scheme is not optimal, as itusually works better for large and textureless objects, that can be segmented asa big single region. Contrarily, small and textured objects pose a problem to thefloodcanny method, as no single large enough region can be found. Future workmust include evaluating the floodcanny approach with more window sizes andshapes for each putative region. Also we want to evaluate the use of windowstrained by the shape and scale of objects in the training set.
Regarding the depth segmentation, Figure 10 also shows the results for thisexperiment. Although the maximum attained recall is slightly lower than that ofsliding windows, it must be noted that, at a similar level of recall, false positivesare much lower.
4.4 Evaluation of Selected Configuration
In this Section we summarize the results obtained with the parameter configu-rations selected in the cross-validation study on all the test sequences.
Except for recall, which is better for the Vocabulary Tree method, the SIFTobject recognition has better results in all other aspects related to robotics.
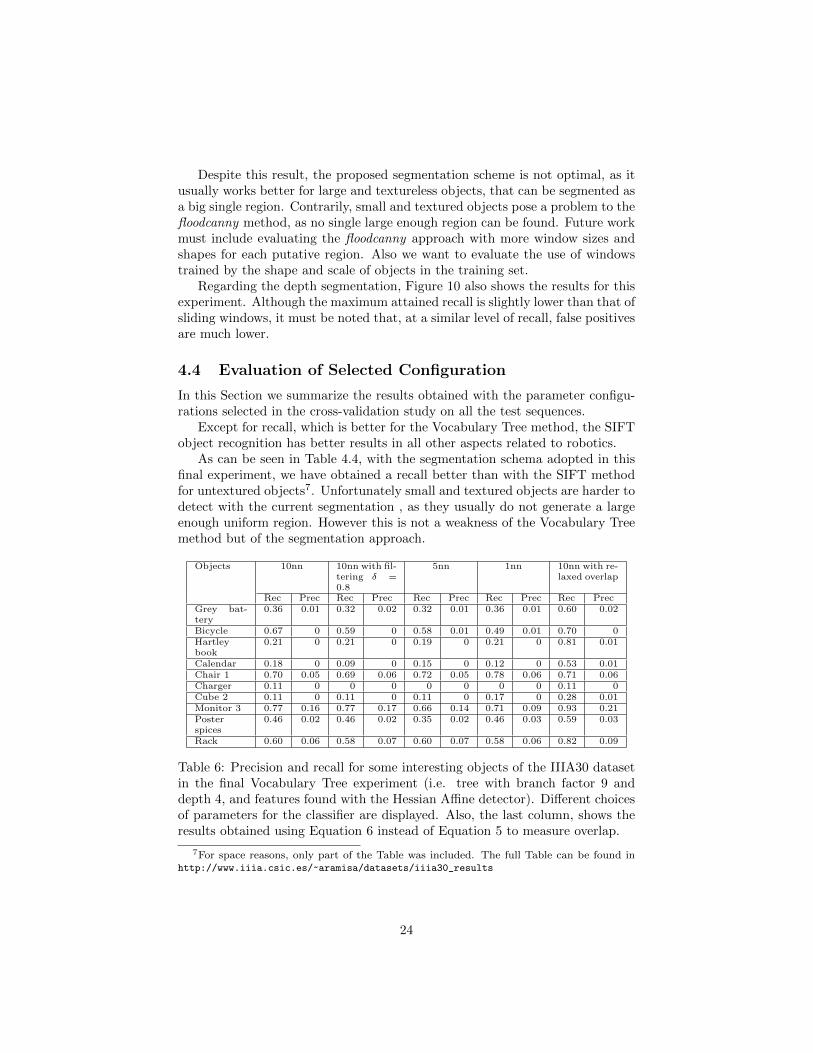
As can be seen in Table 4.4, with the segmentation schema adopted in thisfinal experiment, we have obtained a recall better than with the SIFT methodfor untextured objects7. Unfortunately small and textured objects are harder todetect with the current segmentation , as they usually do not generate a largeenough uniform region. However this is not a weakness of the Vocabulary Treemethod but of the segmentation approach.
Objects 10nn 10nn with fil-tering δ =0.8
5nn 1nn 10nn with re-laxed overlap
Rec Prec Rec Prec Rec Prec Rec Prec Rec PrecGrey bat-tery
0.36 0.01 0.32 0.02 0.32 0.01 0.36 0.01 0.60 0.02
Bicycle 0.67 0 0.59 0 0.58 0.01 0.49 0.01 0.70 0Hartleybook
0.21 0 0.21 0 0.19 0 0.21 0 0.81 0.01
Calendar 0.18 0 0.09 0 0.15 0 0.12 0 0.53 0.01Chair 1 0.70 0.05 0.69 0.06 0.72 0.05 0.78 0.06 0.71 0.06Charger 0.11 0 0 0 0 0 0 0 0.11 0Cube 2 0.11 0 0.11 0 0.11 0 0.17 0 0.28 0.01Monitor 3 0.77 0.16 0.77 0.17 0.66 0.14 0.71 0.09 0.93 0.21Posterspices
0.46 0.02 0.46 0.02 0.35 0.02 0.46 0.03 0.59 0.03
Rack 0.60 0.06 0.58 0.07 0.60 0.07 0.58 0.06 0.82 0.09
Table 6: Precision and recall for some interesting objects of the IIIA30 datasetin the final Vocabulary Tree experiment (i.e. tree with branch factor 9 anddepth 4, and features found with the Hessian Affine detector). Different choicesof parameters for the classifier are displayed. Also, the last column, shows theresults obtained using Equation 6 instead of Equation 5 to measure overlap.
7For space reasons, only part of the Table was included. The full Table can be found inhttp://www.iiia.csic.es/~aramisa/datasets/iiia30_results
24

Objects like the computer monitors, the chairs or the umbrella had a recallcomparable to that of textured objects. As can be seen in Table 7, a similarrecall was obtained for the objects of types textured and not textured. A slightlyworse recall was obtained for the repetitively textured objects, but we believeit is mostly because of the segmentation method.
10nn 10nn-0.8 5nn 1nn 10nn-relaxed
Repetitively textured objectsRecall 0.18 0.18 0.21 0.23 0.29Prec 0 0 0 0 0.01
Textured objectsRecall 0.29 0.27 0.26 0.28 0.53Prec 0.02 0.02 0.02 0.02 0.02
Not textured objectsRecall 0.29 0.26 0.27 0.29 0.39Prec 0.03 0.03 0.03 0.03 0.04
Table 7: Precision and recall depending on texture level of the objects in thefinal experiment with the [14] Vocabulary Tree. The objects are grouped in thesame way as in Table 5. The title 10nn-0.8 stands for 10 nearest neighborswith filtering δ = 0.8, and 10nn-relaxed for 10 nearest neighbors with relaxedoverlap.
Regarding the image quality parameters (see Table 8), the occluded objectsobtained a higher recall level, but this was because, as mentioned in the pre-vious discussion, the sliding windows approach taken in this experiment doesnot enforce a precise detection and, therefore, Equation 5 discards hypothesescorrectly detecting object instances. When Equation 6 was used for all objects,instead of restricting it only to the occluded ones, recall for objects with normaland blurred viewing conditions is increased. The percentage of detected objectswith a degree of overlap from 90% to 100% between the found and the groundtruth bounding box was increased by 14%, showing that, although not precisely,the considered windows did overlap almost the whole object region.
10nn 10nn-0.8 5nn 1nn 10nn-relaxed
Normal 0.24 0.23 0.24 0.25 0.45Blur 0.29 0.28 0.28 0.3 0.46Occluded 0.64 0.61 0.62 0.62 0.64Illumination 0.06 0.06 0.06 0.11 0.11Blur+Occl 0.43 0.41 0.43 0.46 0.43Occl+Illum 0.11 0.11 0.08 0.08 0.11Blur+Illum 0.14 0 0 0 0.14
Table 8: Recall depending on image characteristics. Normal stands for objectinstances with good image quality and blur for blurred images due to motion,illumination indicates that the object instance is in a highlight or shadow andtherefore has low contrast. Finally the last three rows indicate that the objectinstance suffers from two different problems at the same time.
25

4.5 Discussion
With the selected configurations we obtained an average recall of 30%. Moreimportantly, this approach has been able to detect objects that the SIFT couldnot find because of its restrictive matching stage. However, also 60 false posi-tives per image on average were detected with the selected configuration, whichrepresents a precision of 2% on average.
In the light of the performed experiments, it seems clear that the VocabularyTree method cannot be directly applied to a mobile robotics scenario, but somestrategy to reduce the number of false positives is necessary. In addition toreducing false positives to acceptable levels, it is necessary to accelerate thedetection step in order to process images coming from the robot cameras at anacceptable rate. Improving the segmentation strategy, or using a technique suchas the one presented in [19] will surely help improve the accuracy.
Nevertheless, we found that the Vocabulary Tree method was able to detectobjects that were inevitably missed by the SIFT Object Recognition method.Furthermore, new and promising bag of features type approaches are currentlybeing proposed, such as the aforementioned [20] approach, the one by [21] andspecially the one by [22]. Although we would have liked to evaluate all thesenew strategies here as well, time constraints make it impossible to address itnow and we must leave it for future work.
Regarding the depth segmentation, Figure 10.b also shows the results forthis experiment. Although the maximum attained recall is slightly lower thanthat of sliding windows, it must be noted that, at a similar level of recall, falsepositives are much lower.
26
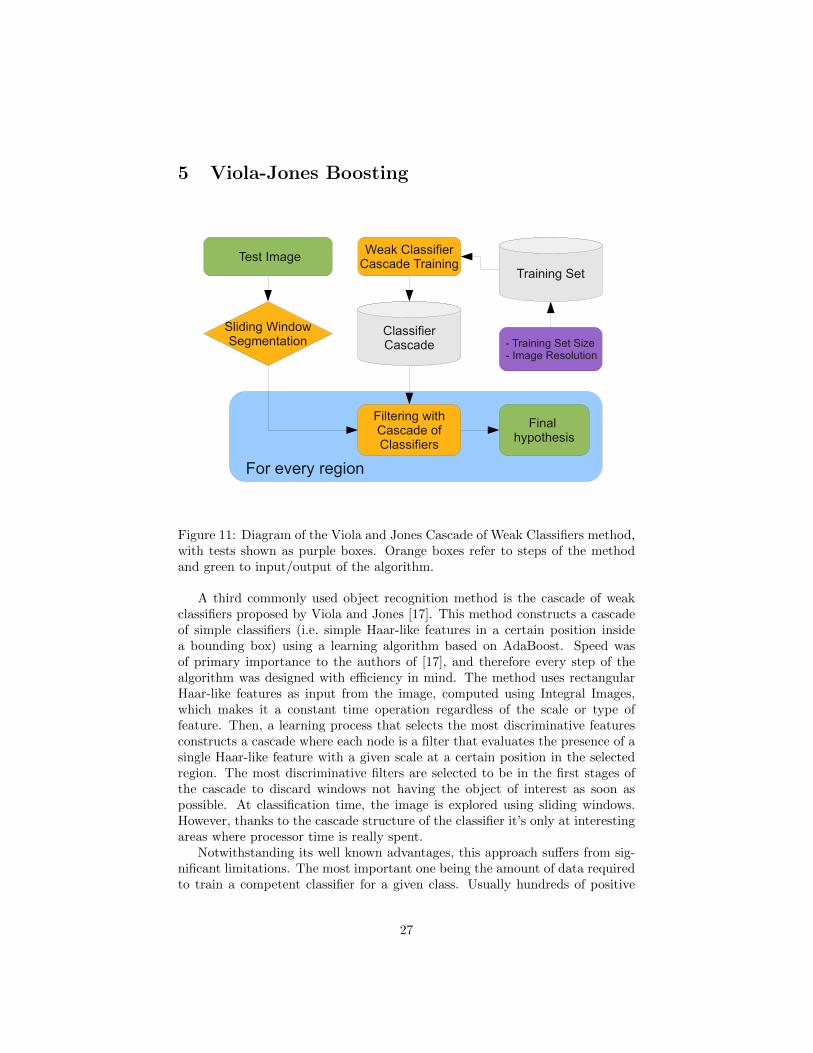
5 Viola-Jones Boosting
Training Set
Weak ClassifierCascade Training
For every region
Final hypothesis
Test Image
Filtering withCascade ofClassifiers
- Training Set Size- Image Resolution
Sliding WindowSegmentation
ClassifierCascade
Figure 11: Diagram of the Viola and Jones Cascade of Weak Classifiers method,with tests shown as purple boxes. Orange boxes refer to steps of the methodand green to input/output of the algorithm.
A third commonly used object recognition method is the cascade of weakclassifiers proposed by Viola and Jones [17]. This method constructs a cascadeof simple classifiers (i.e. simple Haar-like features in a certain position insidea bounding box) using a learning algorithm based on AdaBoost. Speed wasof primary importance to the authors of [17], and therefore every step of thealgorithm was designed with efficiency in mind. The method uses rectangularHaar-like features as input from the image, computed using Integral Images,which makes it a constant time operation regardless of the scale or type offeature. Then, a learning process that selects the most discriminative featuresconstructs a cascade where each node is a filter that evaluates the presence of asingle Haar-like feature with a given scale at a certain position in the selectedregion. The most discriminative filters are selected to be in the first stages ofthe cascade to discard windows not having the object of interest as soon aspossible. At classification time, the image is explored using sliding windows.However, thanks to the cascade structure of the classifier it’s only at interestingareas where processor time is really spent.
Notwithstanding its well known advantages, this approach suffers from sig-nificant limitations. The most important one being the amount of data requiredto train a competent classifier for a given class. Usually hundreds of positive
27

and negative examples are required (e.g. in [23] 5000 positive examples, derivedusing random transformations from 1000 original training images, and 3000negative examples where used for the task of frontal face recognition). Anotherknown drawback is that a fixed aspect ratio of the objects is assumed with thismethod, that may not be constant for certain classes of objects (e.g. cars). An-other drawback is the difficulty of generalizing the approach above 10 objects ata time[24]. Finally, the tolerance of the method to changes in the point of viewis limited to about 20◦. In spite of these limitations, the Viola and Jones objectdetector has had remarkable success and is widely used, especially for the tasksof car and frontal face detection.
Since the publication of the original work by Viola and Jones, many im-provements to the method have appeared, for example to address the case ofmulti-view object recognition [25, 26].
5.1 Experimental Results
In this work the original method has been evaluated using a publicly availableimplementation8
Training Set Size and Image Quality As previously mentioned, one of themost important limitations of the Viola and Jones object recognition methodis the size of the training set. In this work we have evaluated three differenttraining sets. The first one consists of images extracted from the ground truthbounding boxes from test sequences IIIA30-2 and IIIA30-3. The second oneconsists of the same training set used for the Vocabulary Tree experiments (20good quality training images per object type) and additional synthetic viewsgenerated from these images. Finally, the third training set is a mix betweengood quality images extracted from videos recorded with a digital camera (for21 objects, between 700 and 1200 manually segmented images per object), anda single training image plus 1000 new synthetic views (for 8 objects).
The dataset used for the first test only had a few images for each type ofobject: 50 to 70 images per class. In Table 9 the results obtained for sequencesIIIA30-1 and IIIA30-2 are shown. With so few training data, the Viola andJones classifier is able to find only some instances for objects of 11 out of the 29categories. This performance is expected due to the limited amount of trainingdata.
Table 10 shows the results obtained with the twenty training images used inthe Vocabulary Tree experiments, but further enhancing the set by syntheticallygenerating a hundred extra images for each training sample. As it can be seen,the usage of high quality images and the synthetic views significantly improvedthe results.
Finally, Table 11 shows the results obtained using the third training set,which consisted of hundreds of good quality images extracted from video record-
8We have used the implementation that comes with the OpenCV 1.0 library: http://
sourceforge.net/projects/opencvlibrary/
28

Object Recall Prec Object Recall PrecGrey battery 0.0 0.0 Monitor 2 0.14 0.14Red battery 0.28 0.02 Monitor 3 0.03 0.01
Bicycle 0.46 0.07 Orbit box 0.03 0.01Ponce book 0.0 0.0 Dentifrice 0.0 0.0
Hartley book 0.03 0.01 Poster CMPI 0.17 0.15Calendar 0.19 0.01 Phone 0.0 0.0
Chair 1 0.11 0.22 Poster Mystrands 0.36 0.27Chair 2 0.71 0.05 Poster spices 0.46 0.06Chair 3 0.0 0.0 Rack 0.0 0.0Charger 0.0 0.0 Red cup 0.0 0.0Cube 1 0.0 0.0 Stapler 0.03 0.01Cube 2 0.0 0.0 Umbrella 0.03 0.02Cube 3 0.0 0.0 Window 0.36 0.2
Extinguisher 0.0 0.0 Wine bottle 0.0 0.0Monitor 1 0.0 0.0
Table 9: Recall and precision values obtained training the Viola & Jones objectdetector using images extracted from the IIIA30-3 sequence and evaluating insequences IIIA30-1 and IIIA30-2.
Object Recall Prec Object Recall Prec Object Recall PrecGrey battery 0.0088 0.0189 Cube 1 0.0612 0.2143 Phone 0.0680 0.0778Red battery 0.0769 0.0393 Cube 2 0.0024 0.556 Poster Mystrands 0.714 0.120
Bicycle 0.0146 0.1014 Cube 3 0.0293 0.2424 Poster spices 0.0506 0.050Ponce book 0.0848 0.3117 Extinguisher 0.0889 0.1333 Rack 0.0619 0.5513
Hartley book 0.0403 0.0822 Monitor 1 0.0189 0.0130 Red cup 0.0059 0.0476Calendar 0.1064 0.2727 Monitor 2 0.4130 0.1959 Stapler 0.0224 0.200
Chair 1 0.0225 0.300 Monitor 3 0.400 0.1818 Umbrella 0.0466 0.5843Chair 2 0.0062 0.3441 Orbit box 0.0957 0.1594 Window 0.103 0.0825Chair 3 0.0222 0.0476 Dentifrice 0.0085 0.0253 Wine bottle 0.0322 0.3188Charger 0.0012 0.0833 Poster CMPI 0.100 0.0513 – – –
Table 10: Recall and precision values for each object category for the Viola& Jones object detector when using the same training set as with the bag offeatures with synthetically generated images.
ings done with a conventional camera. A conclusion that can be quickly inferredfrom the table is the decrease in performance caused by occlusions. Even objectsthat achieve a good recall and precision with good viewing conditions, fail inthe case of occlusions. In contrast, blurring and illumination variations did notaffect performance significantly. Regarding the object types, (textured, untex-tured and repetitively textured) textured objects obtained an overall recall of26% and precision of 33%, similar to that of repetitively textured objects (24%recall and 36% precision). Finally, untextured objects obtained 14% of recalland 19% precision. With this dataset, the average f-measure obtained is higherthan the one obtained with the bag of features object detection method.
The performance on the posters is surprisingly low in comparison to theother two methods. The explanation could be the large changes in point ofview that the posters suffer through the video sequences. The time necessaryto apply the classifiers for all the classes to one test image is 728 ms on average.
29
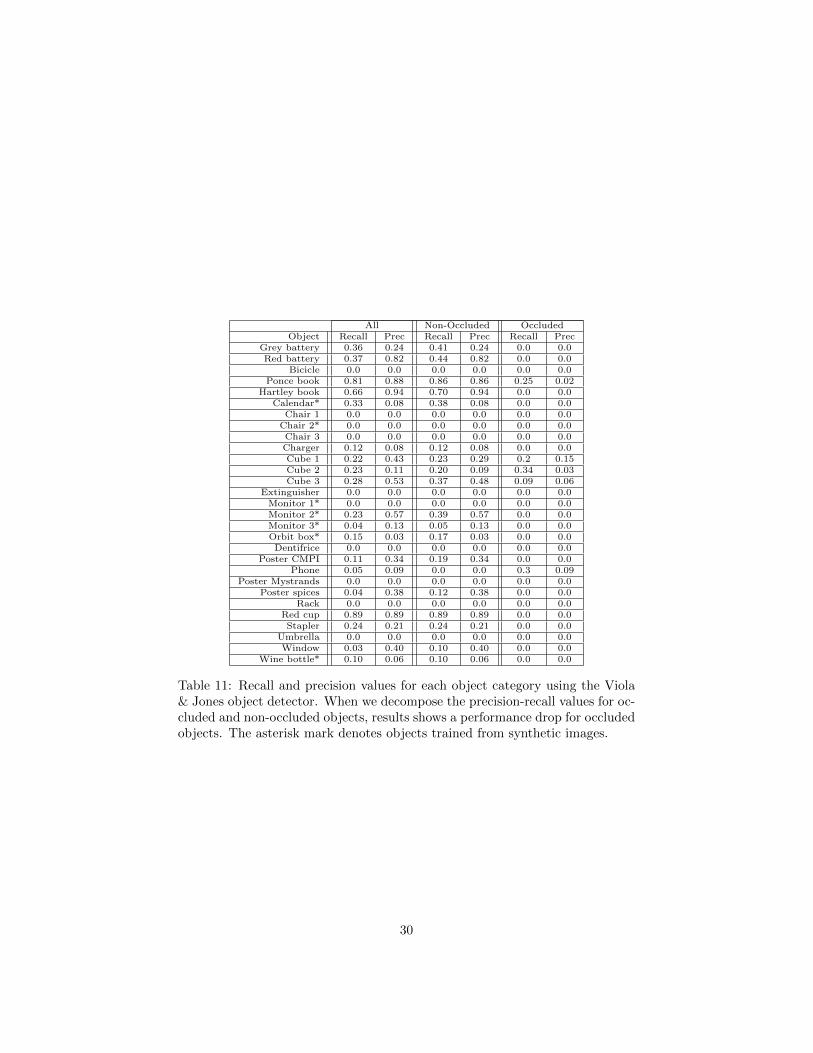
All Non-Occluded OccludedObject Recall Prec Recall Prec Recall Prec
Grey battery 0.36 0.24 0.41 0.24 0.0 0.0Red battery 0.37 0.82 0.44 0.82 0.0 0.0
Bicicle 0.0 0.0 0.0 0.0 0.0 0.0Ponce book 0.81 0.88 0.86 0.86 0.25 0.02
Hartley book 0.66 0.94 0.70 0.94 0.0 0.0Calendar* 0.33 0.08 0.38 0.08 0.0 0.0
Chair 1 0.0 0.0 0.0 0.0 0.0 0.0Chair 2* 0.0 0.0 0.0 0.0 0.0 0.0Chair 3 0.0 0.0 0.0 0.0 0.0 0.0Charger 0.12 0.08 0.12 0.08 0.0 0.0Cube 1 0.22 0.43 0.23 0.29 0.2 0.15Cube 2 0.23 0.11 0.20 0.09 0.34 0.03Cube 3 0.28 0.53 0.37 0.48 0.09 0.06
Extinguisher 0.0 0.0 0.0 0.0 0.0 0.0Monitor 1* 0.0 0.0 0.0 0.0 0.0 0.0Monitor 2* 0.23 0.57 0.39 0.57 0.0 0.0Monitor 3* 0.04 0.13 0.05 0.13 0.0 0.0Orbit box* 0.15 0.03 0.17 0.03 0.0 0.0Dentifrice 0.0 0.0 0.0 0.0 0.0 0.0
Poster CMPI 0.11 0.34 0.19 0.34 0.0 0.0Phone 0.05 0.09 0.0 0.0 0.3 0.09
Poster Mystrands 0.0 0.0 0.0 0.0 0.0 0.0Poster spices 0.04 0.38 0.12 0.38 0.0 0.0
Rack 0.0 0.0 0.0 0.0 0.0 0.0Red cup 0.89 0.89 0.89 0.89 0.0 0.0Stapler 0.24 0.21 0.24 0.21 0.0 0.0
Umbrella 0.0 0.0 0.0 0.0 0.0 0.0Window 0.03 0.40 0.10 0.40 0.0 0.0
Wine bottle* 0.10 0.06 0.10 0.06 0.0 0.0
Table 11: Recall and precision values for each object category using the Viola& Jones object detector. When we decompose the precision-recall values for oc-cluded and non-occluded objects, results shows a performance drop for occludedobjects. The asterisk mark denotes objects trained from synthetic images.
30

5.1.1 Discussion
Despite the use of very simple image features, the Viola and Jones Cascade ofclassifiers attains a good level of precision and recall for most of the objects ina very low runtime. Its main drawbacks are the large, in comparison with theother evaluated techniques, training dataset required to obtain a good level ofperformance, and the limited robustness to changes in the point of view andocclusions of the method. Furthermore, some theoretically “easy” objects, suchas the posters, proved to be troublesome to the Viola and Jones method. This isprobably due to overfitting to some particular view, or to too much variability ofthe very rich Haar feature distribution when changing the point of view, wherethe method was unable to find any recognizable regular pattern.
Nevertheless, the idea of a boosted cascade of weak classifiers is not limitedto the very fast but simple Haar features, but any kind of classifier can be usedfor that matter. A very interesting alternative is using linear SVMs as weakclassifiers, since it allows to add a non-linear layer to an already efficient linearclassifier. Such idea has been already successfully applied in a few cases [27, 28],and we believe it is a very interesting line to investigate.
31

6 Conclusions
Object perception capabilities are a key element in building robots able to de-velop useful tasks in generic, unprepared, human environments. Unfortunately,state of the art papers in computer vision do not evaluate the algorithms withthe problems faced in mobile robotics. In this work we have contributed anevaluation of three object recognition algorithms in the difficult problem of ob-ject recognition in a mobile robot: the SIFT object recognition method, theVocabulary Tree and a boosted cascade of weak classifiers. In contrast with thecase of high-quality static Flickr photos, images acquired by a moving robot arelikely to be low resolution, unfocused and affected by problems like bad fram-ing, motion blur or inadecuate illumination, due to the short dynamic range ofthe camera. The three methods have been thoroughly evaluated in a datasetobtained by our mobile robot while navigating in an unprepared indoor envi-ronment. Finally, in order to improve the performance of the methods, we havealso proposed several improvements to the methods.
This work aims to be a practical help for roboticists that want to enable theirmobile robots with object recognition capabilities, highlighting the advantagesand drawbacks of each method and commenting on its applicability in practicalscenarios. Furthermore, relevant enhancements for the methods existent in theliterature (i.e. support for 3D models in the SIFT object recognition method)are reported.
We have created a challenging dataset of video sequences with our mobilerobot while moving in an office type environment. These sequences have beenacquired at a resolution of 640× 480 pixels with the robot cameras, and are fullof blurred images due to motion, large viewpoint and scale changes and objectocclusions.
The first evaluated method is the SIFT object recognition method, proposedby [11]. Many issues including:
• training image quality
• approximate local descriptor matching
• false hypotheses filtering methods
are evaluated in a subset of the proposed dataset. Furthermore, we propose andevaluate several modifications to the original schema to increase the detectedobjects and reduce the computational time.
The parameter settings that attained best overall results are subsequentlytested in the rest of the dataset and carefully evaluated to have a clear picture ofthe response that can be expected from the method with respect to untexturedobjects or image degradations. Next, a similar evaluation is carried on for thesecond method, the Vocabulary Tree proposed by [14]. For the case of the Violaand Jones cascade of weak classifiers the used implementation directly offers athoroughly evaluated selection of parameters, and the main variable we haveevaluated is the training set size.
32

From the results obtained, it can be seen that with the present implemen-tation of the methods, the SIFT object recognition method adapts better tothe performance requirements of a robotics application. Furthermore, it is easyto train, since a single good quality image sufficed to attain good recall andprecision levels. However, although this method is resistant to occlusion andreasonable levels of motion blur, its usage is mostly restricted to flat well tex-tured objects. Also, classification (generalizing to unseen object instances of thesame class) is not possible with this approach.
On the other hand, the Vocabulary Tree method has obtained good recogni-tion rates both for textured and untextured objects, but too many false positivesper image were found. Finally, the Viola and Jones method offers both a goodrecall (specially for low-textured objects) and execution speed, but is very sen-sitive to occlusions and the simple features used seem to be unable to cope withthe most richly textured objects in case of strong changes in point of view.
For the object recognition experiments, only the SIFT and the Shape Con-text descriptors (see the technical report9) have been evaluated, future workshould include testing other image descriptors, especially color-based ones. Chro-matic information is usually disregarded in computer vision research, but includ-ing it in the object representation should help improve the recognition results.
Although we have evaluated the proposed object recognition methods in awide range of dimensions, one that is lacking is a more in-depth study of how thecomposition and size of the training set affects the overall results. For example,having similar objects, as the different monitors or chairs in the IIIA30 dataset,can cause confusion to the methods. Therefore future work will address theevaluation of different sub-sets of target objects.
The main limitation of the SIFT object recognition method is that only thefirst nearest neighbor of each test image feature is considered in the subsequentstages. This restriction makes the SIFT method very fast, but at the same timemakes it unable to detect objects with repetitive textures. Other approacheswith direct matching, like that of [29], overcome this by allowing every featureto vote for all feasible object hypotheses given the feature position and ori-entation. Evaluating this type of methods, or modifying the SIFT to acceptseveral hypotheses for each test image feature, would be an interesting line ofcontinuation of this work.
The heuristics proposed in this work to improve the SIFT object recognitionmethod have been manually designed. Nevertheless, it would be much better ifthe system itself was able to learn and generalize which bounding boxes param-eters constitute valid hypotheses, for instance using Reinforcement Learning.
The sliding windows approach could be improved by allowing windows with agood probability of a correct detection to inhibit neighboring and/or overlappingwindows, or simply keeping the best window for a given object would clearlyreduce the number of false positives.
Regarding the segmentation schema, we believe that results can be improvedby adopting more reliable techniques, able to resist highlights and shadows.
9http://www.iiia.csic.es/ aramisa/iiia30.html
33
Besides, textured areas pose a problem to the segmentation algorithm as, withthe current technique, no windows will be cast in scattered areas. It wouldbe interesting to test if a Monte Carlo approach to fuse neighboring regionscan help alleviate the problem without significantly affecting the computationaltime. Also a voting mechanism to detect areas with a high number of smallregions can be attempted.
In each candidate region detected by the segmentation method, a set ofwindows are evaluated. However, we used only square windows, and the resultsof the different windows of the set were not combined or used in a voting processto decide the most probable object hypothesis.
Furthermore, combining the intensity and disparity segmentations could helpimprove the accuracy of the detected regions. Also it would allow fusing themultiple small regions found in areas with high information content, where theintensity segmentation method fails to find a large enough region. Future worktowards evaluating these alternatives should therefore be undertaken.
Despite the drawbacks found with the Vocabulary Tree approach, bag offeatures techniques are a current topic of research, and improved approachesare constantly being presented. An example is the one proposed by [22], orthe work of [28], that seems able to overcome the problems encountered in thiswork. Therefore, evaluating this methods with the IIIA30 sequence is a naturalcontinuation line of this work.
The Viola and Jones approach was the fastest of the three in execution timeand, as mentioned earlier, it obtained a reasonable level of precision and recall–especially for the low-textured objects–, but at the cost of a significantly largertraining effort –both in computational cost and labeled data– than the othertwo methods. In addition, objects instances with occlusions had a performancenotably lower in comparison.
More powerful features, like the ones used for the other two methods, orthe popular HOGs [30], could also be used in the Viola and Jones cascade ofclassifiers. However that would increase the computational cost of the method.In order to handle the viewpoint changes extensions have been proposed tothe method [25, 31], specially using Error-Correcting Output Codes (ECOC)[32]. It would be interesting to evaluate the impact on the performance of theseextensions.
In summary: Three fundamentally different methods, each one a represen-tative of a very successful established paradigm for visual object perception,have been evaluated for feasibility for the particular task of object detection ina mobile robot platform. Furthermore, a number of variations or improvementsto the selected methods are being actively produced and evaluated.
34
References
[1] S. Vasudevan, S. Gachter, V. Nguyen, and R. Siegwart, “Cognitive maps formobile robots - an object based approach.” in Robotics and AutonomousSystems, Volume 55, Issue 5, From Sensors to Human Spatial Concepts, 31May 2007, Pages 359-371., 2007.
[2] L. Fei-Fei, R. Fergus, and P. Perona, “Learning generative visual mod-els from few training examples: An incremental bayesian approach testedon 101 object categories,” Computer Vision and Image Understanding,vol. 106, no. 1, pp. 59–70, 2007.
[3] M. Everingham, L. Van Gool, C. K. I. Williams, J. Winn,and A. Zisserman, “The PASCAL Visual Object ClassesChallenge 2007 (VOC2007) Results.” http://www.pascal-network.org/challenges/VOC/voc2007/workshop/index.html.
[4] N. Pinto, D. D. Cox, and J. J. Dicarlo, “Why is real-world visual objectrecognition hard?,” PLoS Computational Biology, vol. 4, pp. e27+, January2008.
[5] A. Mansur and Y. Kuno, “Specific and class object recognition for servicerobots through autonomous and interactive methods,” IEICE - Trans. Inf.Syst., vol. E91-D, no. 6, pp. 1793–1803, 2008.
[6] K. Mikolajczyk, T. Tuytelaars, C. Schmid, A. Zisserman, J. Matas,F. Schaffalitzky, T. Kadir, and L. V. Gool, “A comparison of affine regiondetectors,” International Journal of Computer Vision, vol. 65, no. 1/2,pp. 43–72, 2005.
[7] K. Mikolajczyk and C. Schmid, “A performance evaluation of local de-scriptors,” IEEE Transactions on Pattern Analysis & Machine Intelligence,vol. 27, no. 10, pp. 1615–1630, 2005.
[8] A. Ramisa, S. Vasudevan, D. Scaramuzza, R. L. de Mantaras, and R. Sieg-wart, “A tale of two object recognition methods for mobile robots.,” inICVS (A. Gasteratos, M. Vincze, and J. K. Tsotsos, eds.), vol. 5008 ofLecture Notes in Computer Science, pp. 353–362, Springer, 2008.
[9] L. Fei-Fei, R. Fergus, and P. Perona, “Learning Generative Visual Modelsfrom Few Training Examples: An Incremental Bayesian Approach Testedon 101 Object Categories,” in Workshop on Generative-Model Based Vi-sion, IEEE Computer Society, 2004.
[10] K. Grauman and T. Darrell, “The pyramid match kernel: Discriminativeclassification with sets of image features.,” in ICCV, pp. 1458–1465, IEEEComputer Society, 2005.
[11] D. G. Lowe, “Distinctive image features from scale-invariant keypoints,”Interantional Journal of Computer Vision, vol. 60, no. 2, pp. 91–110, 2004.
35

[12] M. Muja and D. Lowe, “Fast approximate nearest neighbors with automaticalgorithm configuration,” in International Conference on Computer VisionTheory and Applications (VISAPP’09), October 2009.
[13] D. G. Lowe, “Object recognition from local scale-invariant features,” inICCV ’99: Proceedings of the International Conference on ComputerVision-Volume 2, (Washington, DC, USA), p. 1150, IEEE Computer Soci-ety, 1999.
[14] D. Nister and H. Stewenius, “Scalable recognition with a vocabulary tree,”Conf. Computer Vision and Pattern Recognition, vol. 2, pp. 2161–2168,2006.
[15] G. Csurka, C. Bray, C. Dance, and L. Fan, “Visual categorization withbags of keypoints,” Workshop on Statistical Learning in Computer Vision,ECCV, pp. 1–22, 2004.
[16] J. Sivic and A. Zisserman, “Video google: A text retrieval approach toobject matching in videos,” Proc. ICCV, vol. 2, pp. 1470–1477, 2003.
[17] P. Viola and M. Jones, “Rapid object detection using a boosted cascadeof simple features,” in Proceedings of the Conference on Computer Visionand Pattern Recognition, vol. 1, p. 511, 2001.
[18] E. Vazquez, J. van de Weijer, and R. Baldrich, “Image Segmentation inthe Presence of Shadows and Highlights,” in ECCV 2008: 10th EuropeanConference on Computer Vision, Marseille, France, October 12-18, 2008,Proceedings, Part IV, pp. 1–14, Springer, 2008.
[19] R. Bianchi, A. Ramisa, and R. de Mantaras, “Automatic Selection of Ob-ject Recognition Methods using Reinforcement Learning,” 2010.
[20] B. Fulkerson, A. Vedaldi, and S. Soatto, “Localizing objects with smartdictionaries.,” in ECCV (1) (D. A. Forsyth, P. H. S. Torr, and A. Zisser-man, eds.), vol. 5302 of Lecture Notes in Computer Science, pp. 179–192,Springer, 2008.
[21] F. Moosmann, E. Nowak, and F. Jurie, “Randomized clustering forests forimage classification,” IEEE Transactions on Pattern Analysis and MachineIntelligence, vol. 30, no. 9, pp. 1632–1646, 2008.
[22] C. H. Lampert, M. B. Blaschko, and T. Hofmann, “Beyond sliding win-dows: Object localization by efficient subwindow search.,” in CVPR, IEEEComputer Society, 2008.
[23] R. Lienhart, E. Kuranov, and V. Pisarevsky, “Empirical analysis of detec-tion cascades of boosted classifiers for rapid object detection,” in In DAGM25th Pattern Recognition Symposium, pp. 297–304, 2003.
36
[24] A. Torralba, K. Murphy, and W. Freeman, “Sharing visual features formulticlass and multiview object detection,” IEEE Transactions on PatternAnalysis and Machine Intelligence, pp. 854–869, 2007.
[25] M. Jones and P. Viola, “Fast multi-view face detection,” in IEEE Confer-ence on Computer Vision and Pattern Recognition, Citeseer, 2003.
[26] C. Huang, H. Ai, B. Wu, and S. Lao, “Boosting nested cascade detec-tor for multi-view face detection,” in Proceedings of the 17th InternationalConference on Pattern Recognition, pp. 415–418, 2004.
[27] P. Viola, M. Jones, and D. Snow, “Detecting pedestrians using patternsof motion and appearance,” in International Journal of Computer Vision,vol. 63, p. 153161, Springer, 2005.
[28] D. Aldavert, A. Ramisa, R. Toledo, and R. L. D. Mantaras, “Fast andRobust Object Segmentation with the Integral Linear Classifier,” in IEEEConference on Computer Vision and Pattern Recognition, 2010.
[29] B. Leibe, A. Leonardis, and B. Schiele, “Robust object detection with inter-leaved categorization and segmentation.,” International Journal of Com-puter Vision, vol. 77, no. 1-3, pp. 259–289, 2008.
[30] N. Dalal, B. Triggs, I. Rhone-Alps, and F. Montbonnot, “Histograms oforiented gradients for human detection,” in IEEE Computer Society Con-ference on Computer Vision and Pattern Recognition, 2005. CVPR 2005,pp. 886–893, 2005.
[31] Z. Zhang, M. Li, S. Z. Li, and H. Zhang, “Multi-view face detection withfloatboost,” Applications of Computer Vision, IEEE Workshop on, vol. 0,p. 184, 2002.
[32] T. G. Dietterich and G. Bakiri, “Solving multiclass learning problems viaerror-correcting output codes,” Journal of Artificial Intelligence Research,vol. 2, pp. 263–286, 1995.
37