Embed Size (px)
Citation preview
S-1cAtes~
EVALUATION OF THE USE OF THE HAMBURG WHEEL-TRACKING DEVICE FOR MOISTURE
SUSCEPTIBILITY OF HOT MIX ASPHALT
DEPARTMENTAL RESEARCH
TEXAS DEPARTMENT
OF
TRANSPORTATION
DHT-45
RESEARCH AND TECHNOLOGY TRANSFER SECTION, PO. BOX 5080 AUSTIN, TX 78763-5080, 512-465-7403, FAX 512-465-7486
1. Report No. 2. Government Accession No.
DHT-4s
4. Title and Subtitle
EVALUATION OF THE USE OF THE HAMBURG WHEEL-TRACKING DEVICE FOR MOISTURE SUSCEPTIBILITY OF HOT MIX ASPHALT
7. Author(s)
Richard P. Izzo and Maghsoud Tahmoressi
9. Performing Organization Name and Address
Texas Department of lIansportation Bituminous Branch, Materials and Tests Section, Construction Division 2311 West Rundberg Lane, Suite 100
Technical Report Documentation Page 3. Recipient's Catalog No,
5. Report Date
6, Performing Organization Code
8. Performing Organization Report No.
Research Report DHT-4s
10. IAOrk Unit No. (TRAIS)
11. Contract or Grant No.
Austin, Texas 78758 /------------------------------1 13. Type of Report and Period Covered 12. Sponsoring Agency Name and Address October 1998
'Texas Department of Transportation Research and Technology Transfer Section, Construction Division P. O. Box 5080 Austin, Texas 78763-5080
15. Supplementary Notes
16. Abstract
14. Sponsoring Agency Code
Laboratory testing of hot mix asphalt (HMA) in order to evaluate moisture susceptibility has improved over the past several decades. Within the past eight years, the Hamburg wheel-tracking device (HWTD) has been used in evaluating HMA for moisture susceptibility. There are no standard test methods or specifications established for this testing device. This study evaluated the repeatability of the test, testing configuration, test temperature, and capability to evaluate effects of antistripping additives in HMA.
The HWTD has shown to be repeatable where six replicate tests provided consistent test results. The device yielded repeatable results for mixtures produced with different aggregates and with test specimens fabricated by different compacting devices.
The conventional testing configuration was altered such that cylindrical test specimens fabricated with a Superpave gyratory compactor (SGC) could be used in lieu of rectangular slabs. Results indicate that cylindrical specimens compacted with the SGC could be used for moisture evaluation in the HWTD for comparative evaluation of one material to another.
Typically, testing with the HWTD is performed at 50°C. Six mixtures were fabricated with and without antistripping additives and tested at 40°C and SO°C. Mixtures were modified with hydrated lime and a liquid antistripping additive and all mixed with AC-20. Test results have shown mixtures with hydrated lime to perform the best followed by those modified with liquid antistripping additive and worst were those without any additive at 40°C. Inconsistent trends were seen at 50°C. The HWTD properly predicted performance of the mixtures modified with antistripping additives at 40°C.
17. Key IAOrds
moisture susceptibility, HMAC, Superpave, Hamburg steel wheel-tracking device, testing, rutting, asphalt mixtures, materials, repeatability
18. Distribution Statement
No restrictions. This document is available to the public through the 'Texas Department of lIansportation Research Library; P.O. Box 5080, Austin, TX, 78763-5080.
19. Security Classif. (of this report)
Unclassified 20. Security Class;!. (of this page)
Unclassified 21. No. of Pages
24 22. Price
Form DOT F 1700.7 (8-72) Reproduction of completed page authorized
DHT-45 TxDOT 2/26/1999

DHT-45 ii TxDOT 2/26/7999
EVALUATION OF THE USE OF THE HAMBURG WHEEL-TRACKING DEVICE FOR MOISTURE
SUSCEPTIBILITY OF HOT MIX ASPHALT
DHT-45
by:
Richard P. Izzo
and
Maghsoud Tahmoressi
Texas Department of Transportation Construction Division/Bituminous Branch
2311 West Rundberg Lane, Suite 100 Austin, Texas 78758
October I, 1998
iii TxDOT 2/26/1999
NOTICE
The United States Government and the state of Texas do not endorse products ot manufacturers. Trade or manufacturers' names appear herein solely because they are considered essential to the
object of this report.
The contents of this report reflect the views of the authors, who are responsible for the facts and the accuracy of the data presented herein. The contents do not necessarily reflect the official view or policies of the Texas Department of Transportation. This report does not constitute a standard,
specification, or regulation.
ACKNOWLEDGMENTS
The research presented in this paper is part of a staff study sponsored by the Bituminous Branch of the Construction Division of the Texas Department of Transportation. The authors acknowledge the assistance of all laboratory personnel and staff.
DHT-45 iv TxDOT 2/26/1999
INTRODUCTION
Several transportation agencies throughout the United States evaluate hot mix asphalt (HMA) for moisture susceptibility. Moisture damage is responsible for millions of dollars in reconstruction and maintenance. This type of pavement distress has proven to be a serious problem plaguing asphalt pavements in the United States for several decades, where a large number of research projects have been performed to study moisture damage to hot mix.
Moisture damage or sensitivity is commonly referred to as stripping. This phenomenon is recognized as asphalt stripping from the aggregate surface. Stripping occurs when the adhesive bond between the aggregate surface and asphalt cement is broken (1). Moisture damage also weakens the asphalt matrix such that there is lower stability and load carrying capacity. The mechanistic result of moisture damage is a loss in adhesive and cohesive strength. Moisture damage from the loss of adhesive and cohesive properties in HMA will lead to . shoving, rutting, and fatigue cracking of asphalt pavement (2).
Several laboratory tests have been developed to assess the moisture susceptibility of HMA. Laboratory testing does not entirely simulate field conditions, however, they can provide useful information. These tests developed for the evaluation of moisture damage either assess the stripping of asphalt from the aggregate surface or the loss in strength of cylindrical, compacted HMA. Typically, boiling tests are used to evaluate the stripping of asphalt from aggregate surfaces. HMA is added to boiling water for a specified amount of time and visually inspected to estimate the degree of stripping. Strength testing generally includes the indirect tensile test in which cylindrical, compacted HMA specimens are tested following a conditioning sequence replicating freeze-thaw experienced in-situ (2, 3).
The Hamburg wheel-tracking device (HWTD) has been used for several years in Germany to evaluate the moisture susceptibility of HMA. Typically, a pair of rectangular slab samples are tested simultaneously with two steel wheels moving concurrently. Following the introduction of the HWTD in the United States, several other wheel-tracking devices have been developed and used assessing moisture damage.
OBJECTIVES
The objective of this study was to perform a comprehensive evaluation of the HWTD and its potential for use in assessing moisture susceptibility of HMA. This evaluation was performed with the following three phases:
(1) Repeatability of the testing device.
(2) Comparison of rectangular (slab) compacted test specimens versus cylindrical, gyratory cO:qlpacted test specimens.
(3) Interlaboratory study evaluating temperature and antistripping additive effects
Hamburg Wheel-Tracking Device (HWTD)
The HWTD has been developed and extenSively used in Hamburg, Germany, for the evaluation of moisture susceptibility of HMA. This device measures the combined effects of rutting and moisture damage by rolling a steel wheel across the surface of a rectangular slab that is submerged in sonc water. Figure 1 on page 12 is a picture of the testing device. It tests two rectangular slabs simultaneously with two reciprocating solid steel wheels that have a diameter of 204 mm and a width of 47 mm. The steel wheels move concurrently driven by a crank connected to a flywheel. This type of movement produces a constantly varying velocity where
DHT-45 7 TxDOT 2/26/7 999
the maximum velocity occurs in the center of the specimen. Rut depth measurements are taken at the center of the specimen. The load applied on each specimen is 703 N where each wheel rolls 230 mm before reversing in direction. A standard test applies a maximum number of 20,000 passes. The data produced by the device are customarily reported versus passes, rather than cycles, in which a cycle is two passes. A linear variable differential transducer measures the rut depth in each slab automatically and continuously with an accuracy of 0.01 mm. A maximum allowable rut depth of 4 mm at 20,000 passes is specified in Hamburg, Germany (4).
FHWA and Colorado Department of Transportation (CDOT) have performed extensive amounts of research with the HWTD since 1990. CDOT has developed Colorado Procedure CP-L 5112, "Hamburg Wheel Track Testing of Compacted Bituminous Mixtures," to assess the potential of moisture damage of HMA in Colorado. This specification adopted by CDOT utilizes the HWTD and is unique in that it specifies testing temperatures according to site location and asphalt binder type. A maximum rut depth of 10 rnrn at 20,000 passes is specified (5).
Figure 2 is an illustration of the typical output produced from the test including the test parameters. Data analysis includes the creep slope, stripping inflection point (SIP), and stripping slope. The creep slope relates to rutting primarily from plastic flow. It is the number of passes required to create a I-mm rut depth. The SIP is the number of passes at the intersection of the creep slope and stripping slope. This intersection is where ,stripping starts to dominate performance. The stripping slope is a measure of the accumulation of rutting primarily from moisture damage. It is the number of passes required to create a I-mm rut depth after the SIP (4).
REPEATABILITY OF HAMBURG WHEEL-TRACKING DEVICE (HWTD)
The repeatability of the HWTD was assessed through testing two different mixtures. The mixtures comprised of a limestone and gravel aggregate. Table 1 on page 7 lists the gradation and optimum asphalt content (OAC) of the mixtures. Slab and cylindrical test specimens were tested. The slab test specimens were compacted with a linear kneading compactor and the cylindrical test specimens were compacted with a Superpave gyratory compactor (SGC).
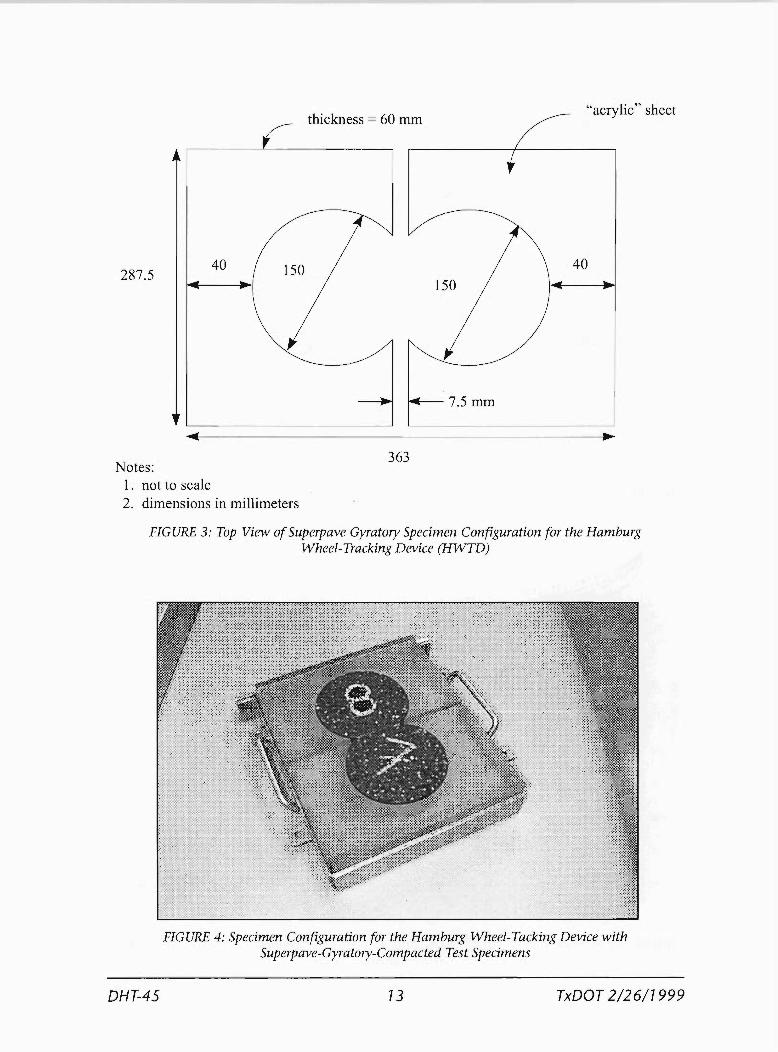
For cylindrical specimens, the test specimen configuration was modified such that one test specimen consisted of two SGC specimens. The specimens are secured in the mounting tray with two molds and two spacer plates fabricated with an acrylic material. Figure 3 illustrates a top view of the set up. This figure is not drawn to scale, and all dimensions are in rnrn. The spacer plates, which aid in securing the configuration, are placed behind each mold at opposite ends. The molds are shaped as rectangles with semicircles cut out approximately 25 mm from the back edge. However, with the spacer plates the semicircles are approximately 40 mm from the back edge of the mounting tray. The specimens are sawed such that they fit into the molds. The specimens are tightly fastened in the mounting tray by tightening the nuts that adjoin a front plate to the mounting tray. Overall, the whole specimen resembles a snowman figure with a contact area among the SGC specimens approximately S 1 crn2 (8.3 x 6.2 cm) and is adequately secured such that movement during testing does not occur other than any degradation resulting from the test. The sawed portion is approximately S% of the total volume of a single SGC specimen. This configuration with the SGC specimens can be seen in figure 4.
Tables 2 and 3 list the test results for the slabs and cylindrical test specimens. Table 2 provides data for the limestone mixture where test specimens were fabricated at 7±1 % air voids. Table 3 shows data for the gravel mixture where test specimens were compacted at 4±1 % air voids. Fluctuation of the test specimens' air void content was not initially intended. The slabs were compacted first and their air void contents were duplicated with the cylindrical test specimens. There was a limited amount of material obtained for each mixture; therefore,
OHT-45 2 TxOOT 2/26/7999
it was not possible to fabricate new test specimens. Failure criteria was established at a rut depth of 20 mm or maximum application of 20,000 passes. Six tests were performed for each mix type and test specimen configuration. These tables also provide the statistical mean and standard deviation.
The HWTD tests two specimens simultaneously. The test is stopped when a failure criterion has been reached, which was either 20 mm rut depth or 20,000 passes in this study. Two specimens almost never fail at the same number of passes with a 20 mm rut depth. However, it is possible for the test to continue until 20,000 passes for both test specimens. The number of passes to failure, Nf shown in the tables mentioned above, was estimated with the regression data from the stripping slope.
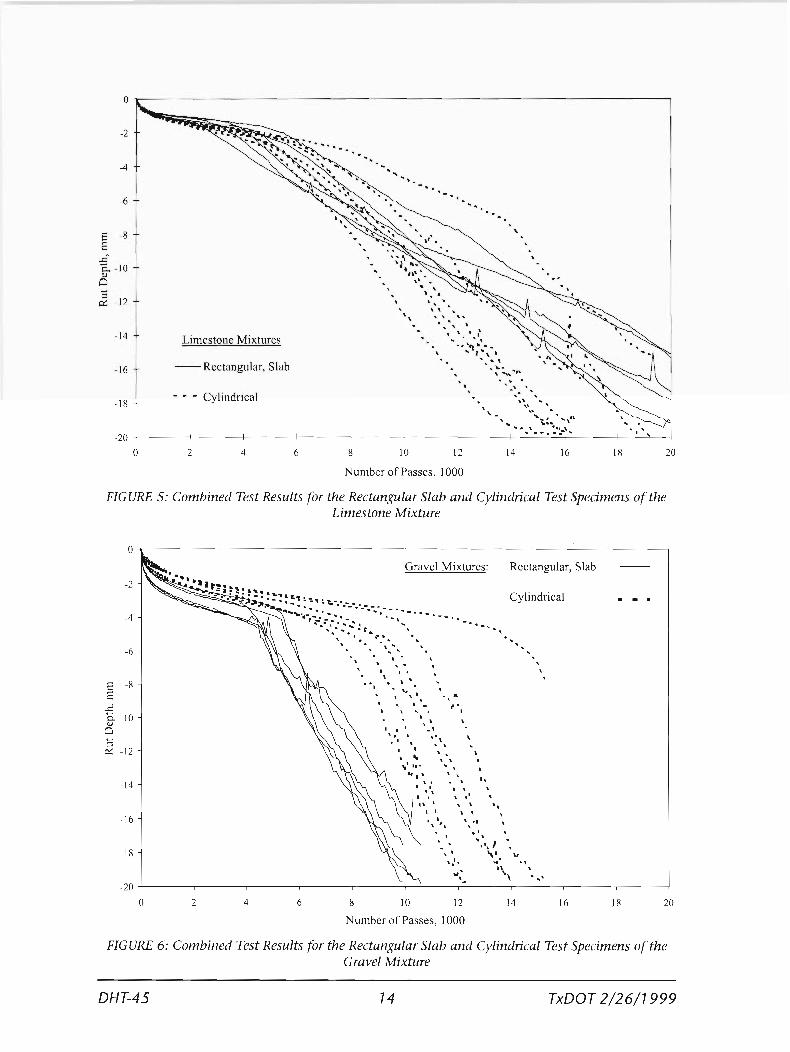
Figures 5 and 6 illustrate the test results produced by the HWTD. Figure 5 displays the test results for the limestone mixture and Figure 6 shows the test results for the gravel mixture. These plots illustrate the rut depth versus the number of passes of the steel wheels. The HWTD test results for the slab and gyratory compacted, cylindrical specimens have shown to be very repeatable. As shown in tables 2 and 3, the standard deviation calculated for each parameter has been found to be reasonably small with moderate variation. The different method of compaction did not have any effects on the repeatability of testing with the HWTD. The HWTD has shown to provide good repeatability with replicate testing.
Slab Compacted Versus Cylindrical, Gyratory Compacted
This section of the report compares the performance of rectangular slabs with cylindrical test specimens. The use of cylindrical specimens has been found to be simple and more convenient than the use of rectangular slabs. Typically, the rectangular, slab test specimens are compacted with a linear kneading compactor. These test specimens reqUire the use of plaster to be secured in the mounting tray prior to testing. A test performed with rectangular, slab test specimens will take approximately 3 days. A day is required for specimen fabrication, another for curing of the plaster, and finally a third for testing. Compaction of test specimens generally takes between 15 and 20 minutes with a kneading linear compactor.
The cylindrical test specimens are fabricated with a SGC. The SGC is used to compact specimens for the Superpave asphalt mixture design and available nationwide. The use of these specimens do not reqUire plaster in the testing configuration. In the modified configuration, specimens are secured in acrylic molds as shown in figure 4 and also seen in the testing device in figure 1. A test performed with cylindrical test specimens will take approximately 2 days. A day for specimen fabrication and the next for testing. Compaction of test specimens typically takes between 5 and 10 minutes with the SGc.
The comparison of compaction methods was evaluated with the data used in the previous section for the repeatability analYSis. Tables 2 and 3 list the data and figures 5 and 6 illustrate the test results for both compaction methodologies. A summary of the standard deviation calculated for each test parameter is listed in table 4. In most cases, the standard deviation for the limestone, slab mixtures were greater than that of the limestone, cylindrical specimens. The results for the gravel mixture varied where one type of compaction did not predOminately show greater variability. Table 4 also lists the standard deviation calculated for the combined data. The combined data grouped the test results from both compaction methodolOgies for each mixture. In most cases, the standard deviation for the combined data increased. It is apparent that there are differences in variability for the slab and cylindrical compacted tests specimens. However, based on the illustrations in figures 5 and 6 the performance of the mixtures were the same. The only significant difference can be seen with the SIP for the gravel mixtures in figure 6. The SIP is significantly greater for the cylindrical compacted test specimens. The SGC molded test specimens can be used for moisture damage evaluation in the HWTD for comparative evaluation of one material to another. The test results from the cylindrical molded specimens cannot be directly compared to the slab molded specimens.
DHT-45 3 TxDOT 2/26/1999
Interlaboratory Study
An interlaboratory study was conducted following an extensive evaluation of the HWTD. The HWTD was evaluated for its repeatability and for the use of cylindrical test specimens with a modified testing configuration in lieu of rectangular, slab test specimens. The purpose of this interlaboratory study included the evaluation of test temperature and the capability of the HWTD to detect the use of antistripping additives in HMA. Moisture damage or stripping is a reoccurring problem throughout Texas and antistripping additives are routinely used to improve the performance of HMA. Therefore, it is critical to know whether the HWTD can differentiate mixtures treated with antistripping additives.
The HWTD is commonly used in Hamburg, Germany, to approve and accept HMA, where typically an asphalt binder similarto a soft AC-20 is used (6). However, it is important to note that typical HMA used and developed in Germany is stone matrix asphalt, otherwise referred to as SMA. A characteristic of SMA is a high amount of fine material or the use of mineral filler (8 to 12% passing the 0.075 mm sieve). This type of mixture also includes the use of stabiliz· ers to prevent draindown. The use of mineral fillers and stabilizers will stiffen the asphalt binder such that performance of HMA with unmodified asphalt binders is similar to that of polymer-modified binders (7, 8). An AC-20 is generally used throughout Texas. Typically, tests with the HWTD are performed at 50°C. However, it is believed that this test temperature may be too extreme for HMA produced using AC-20. The softening point of AC-20 is typically less than 50°e. Asphalt binders or HMA with asphalt binders tested at temperatures beyond their softening point will exhibit poor qualities as asphalt binders undergo property changes upon reaching their softening pOint. The softening point is the point where the asphalt binder cannot support the weight of a steel ball and starts flowing from the ring-and-ball test. A test temperature of 40°C has been used and test results compared to that found at 50°C.
Materials Selection
Six mixtures were evaluated in this part of the study. The mixtures composed of six different aggregate types and one asphalt binder. The asphalt binder used in this study was an AC-20. Table 1 lists the different aggregate types used with source location throughout Texas. The asphalt binder type was the same for all the mixtures such as to reduce the variability between mixtures.
The OAC and aggregate gradation for each mixture are listed in table 1. The limestone and gravel mixtures were designed according to Texas Department of Transportation (TxDOT) specifications for a Type-D mixture. The other mixtures were designed according to TxDOT specifications for a Type-C mixture. The Type-C design yields a coarser mixture which can be seen from the gradations in table 1.
Test Temperature and Antistripping Additive Evaluation
The HWTD evaluates the susceptibility of HMA to moisture damage. It is believed that the stripping potential of HMA is significantly reduced through the use of antistripping additives. Research studies have proclaimed the benefits of antistripping additives for many years. Testing devices and methodologies measuring the moisture susceptibility of HMA must be capable of detecting the effects of antistripping additives on mixture performance. In this part of the study, mixtures were modified with antistripping additives and tested with the HWTD. The additives used were hydrated lime and a liquid antistripping agent. The antistripping additives were evaluated along with the testing temperature. Mixtures were modified and tested at 40 and 50°C. All test specimens were fabricated with a SGC and with an air void content of 7±1 %. Two replicate tests were performed for each mixture.
Table 5 lists the test results from the tests performed at 40 and 50°e. The data is grouped according to test temperature and type of antistripping additive used. Test results have shown
OHT-45 4 rxOOT 2/26/1999
L
L
r
better performance from the mixtures tested at 40°C. More importantly, improved effects from the antistripping additives in the mixtures were not always seen at SO°C. Properties measured by the HWTD of the mixtures modified with the antistripping additives did not always show improvement in comparison to the mixtures with no antistripping additives. This fact is important and questions the effectiveness of the HWTD to accurately assess moisture damage for mixtures with AC-ZO at the testing temperature of SO°c.
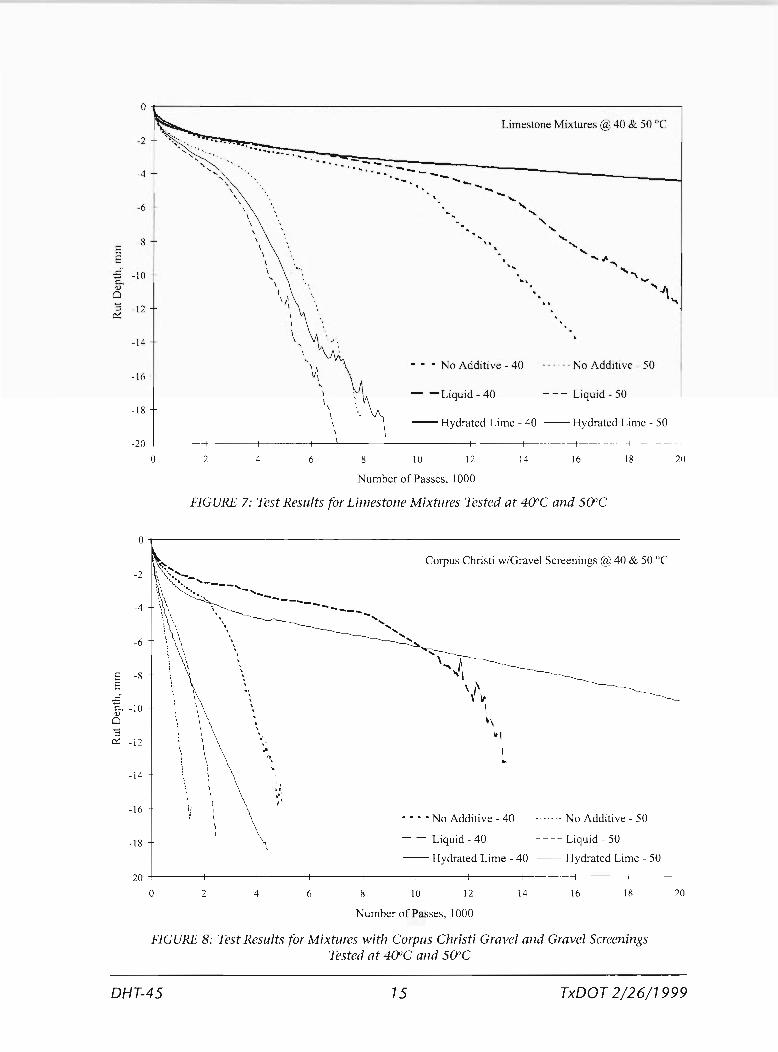
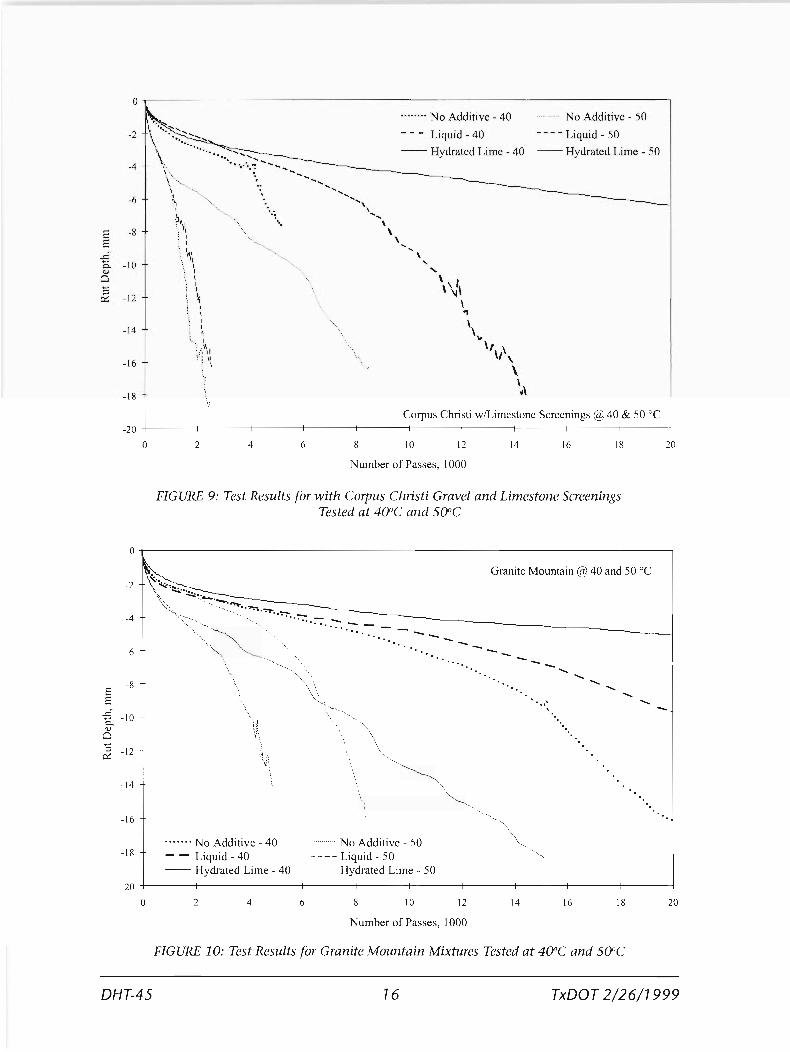
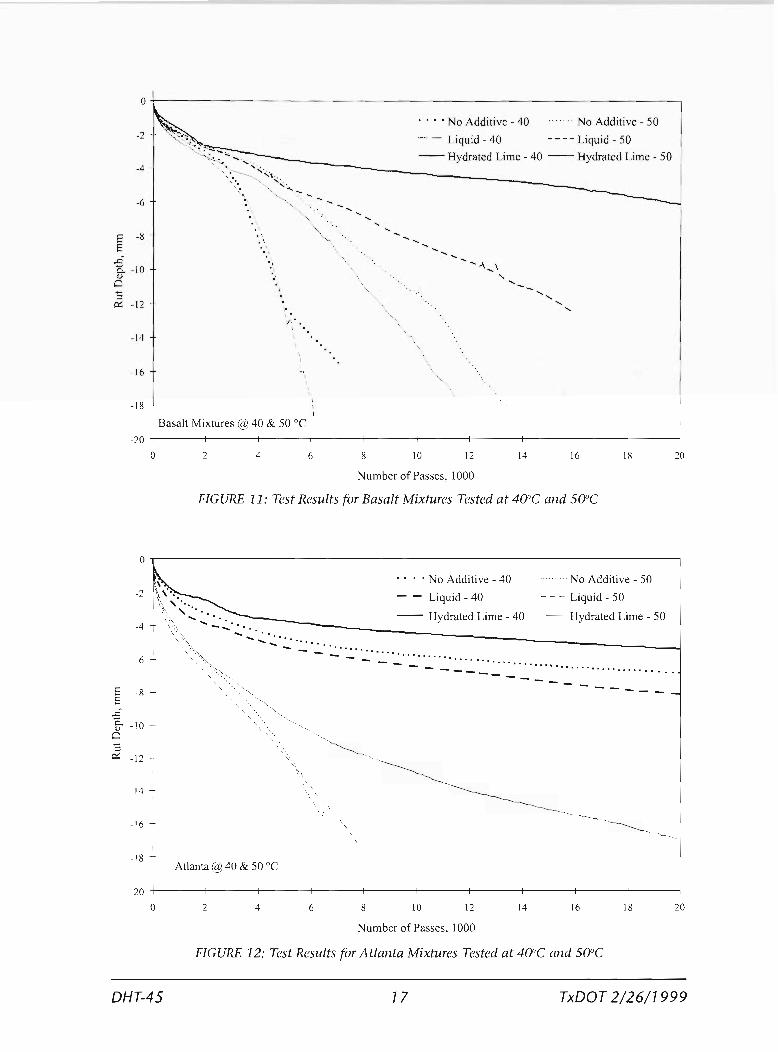
In most cases, significant improvements can be seen for the mixtures tested at 40°C as a result of treatment with antistripping additives. Figures 7 through 1Z illustrate the test results for all the mixtures tested at 40 and SO°C. Typically, the trend of the data for all the mixtures tested at 40°C were grouped above that tested at SO°c. More importantly, the results for the 40°C tests always ranked from mixtures with hydrated lime, liquid additive, and thirdly no antistripping additive as shown in figure 7. The data from the SO°C did not always rank in the same order. In most cases, the test parameters from 40°C in table 5. show that the mixtures modified with hydrated lime performed the best and was followed by the mixtures modified with liquid additive. The mixtures performing the worst were the mixtures with no modification. The Nf was determined through regression analysis of the stripping slope data. However, the mixtures modified with hydrated lime did not reach the SIP (as shown in figure 7) and thus the Nf could not be calculated. Therefore, '>ZO,OOO' was used in the table for this parameter and signifies that the mixtures did not fail up to ZO,OOO passes.
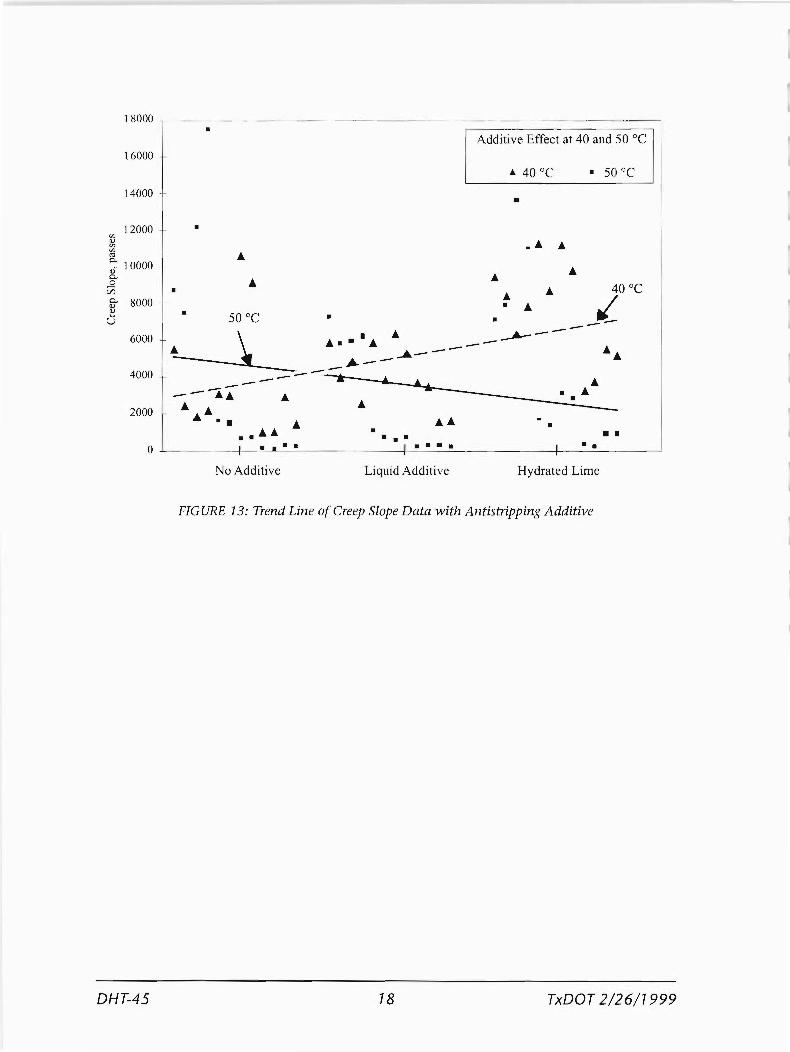
Figure 13 illustrates the trend of the creep slope data from the mixtures with no antistripping additive to the mixtures modified with hydrated lime. It can be seen that the trend of the creep slope increases with modification at 40°C. The trend of the data from the SO°C tests shows a decline in performance with modification. The 40°C trend line is typically expected since it is believed that antistripping additives improve the performance of HMA. However, this may also be showing the filler effects of the hydrated lime since creep slope relates to rutting as mentioned earlier. The mixtures with hydrated lime always shown the least amount of rutting and never reached the SIP. The same trend seen in figure 13 occurs with the stripping slope data with the mixtures with liquid antis tripping additive and those without any additive.
It is apparent that SO°C may be too extreme and performance measured by the HWTD may not be accurate at this test temperature for mixtures with AC-ZO. However, it is important to remember that these mixtures were composed of an AC-ZO asphalt binder in which the typical softening point is below SO°C. Mixtures with asphalt binders consisting of greater viscosity, hence higher softening points, may be tested at greater temperatures. HMA is composed of mineral aggregate and asphalt binder. The asphalt binder is a key component of HMA; thus, a mixture tested beyond its softening point where it is not stable will lead to misleading test results with the HWTD. A test temperature of 40°C appears to be appropriate for mixtures composed of AC-ZO, which is what a majority of the HMA throughout Texas is produced with.
CONCLUSIONS
The use of wheel-tracking devices evaluating hot mix asphalt (HMA) throughout the United States has increased since 1990. A few transportation agencies have developed test methods and specifications incorporating the use of these devices. The Texas Department of Transportation has begun performing research investigating the possible use of wheel-tracking devices in predicting performance of HMA. Specifically, the Hamburg wheel-tracking device (HWTD) has been targeted for the evaluation of moisture susceptibility.
The use of a new testing device initially requires research investigating repeatability and the capability to properly predict performance. Based on laboratory testing the following has been concluded:
DHT-45 5 TxDOT2/26/7999
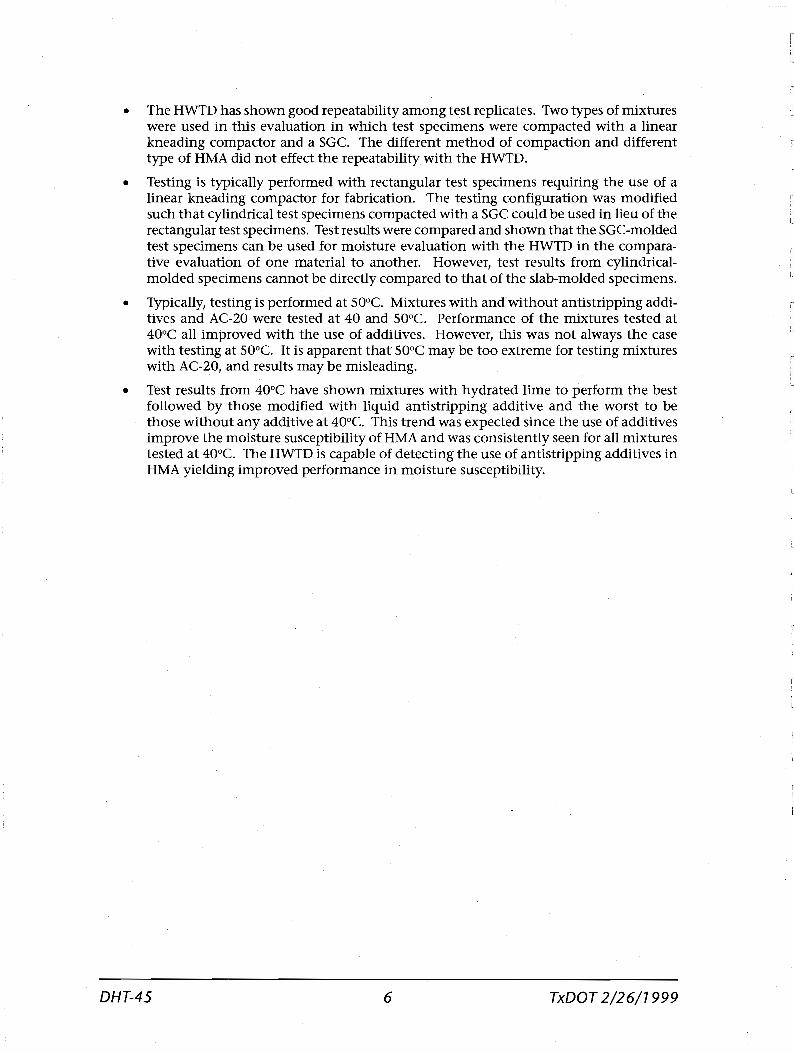
• The HWTD has shown good repeatability among test replicates. Two types of mixtures were used in this evaluation in which test specimens were compacted with a linear kneading compactor and a SGc. The different method of compaction and different type of HMA did not effect the repeatability with the HWTD.
• Testing is typically performed with rectangular test specimens requiring the use of a linear kneading compactor for fabrication. The testing configuration was modified such that cylindrical test specimens compacted with a SGC could be used in lieu of the rectangular test specimens. Test results were compared and shown that the SGC-molded test specimens can be used for moisture evaluation with the HWTD in the comparative evaluation of one material to another. However, test results from cylindricalmolded specimens cannot be directly compared to that of the slab-molded specimens.
• Typically, testing is performed at 50°C. Mixtures with and without antistripping additives and AC-20 were tested at 40 and 50°C. Performance of the mixtures tested at 40°C all improved with the use of additives. However, this was not always the case with testing at 50°C. It is apparent that 50°C may be too extreme for testing mixtures with AC-20, and results may be misleading.
• Test results from 40°C have shown mixtures with hydrated lime to perform the best followed by those modified with liqUid antistripping additive and the worst to be those without any additive at 40°C. This trend was expected since the use of additives improve the moisture susceptibility of HMA and was consistently seen for all mixtures tested at 40°C. The HWTD is capable of detecting the use of antistripping additives in HMA yielding improved performance in moisture susceptibility.
DHT-45 6 TxDOT 2/26/7999
L
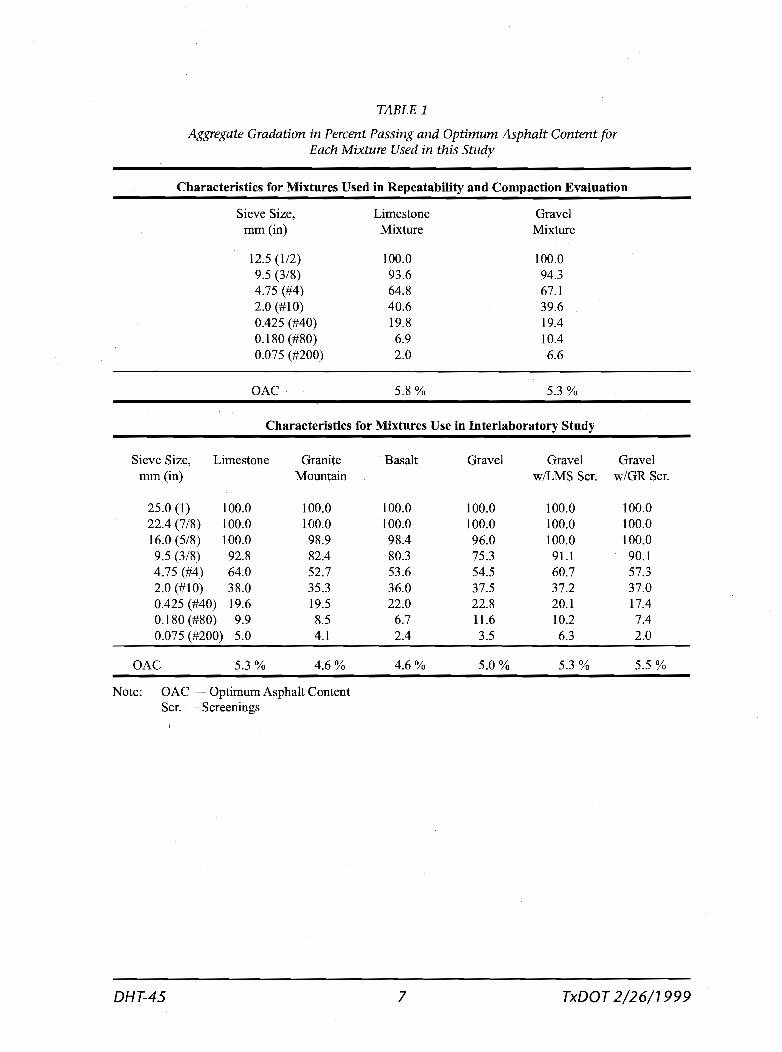
TABLE 1
Aggregate Gradation in Percent Passing and Optimum Asphalt Content for Each Mixture Used in this Study
Characteristics for Mixtures Used in Repeatability and Compaction Evaluation
Sieve Size, Limestone Gravel mm (in) Mixture Mixture
12.5 (1/2) 100.0 100.0 9.5 (3/8) 93.6 94.3 4.75 (#4) 64.8 67.1 2.0 (#10) 40.6 39.6 0.425 (#40) 19.8 19.4 0.180 (#80) 6.9 lOA 0.075 (#200) 2.0 6.6
OAC 5.8% 5.3 %
Characteristics for Mixtures Use in Interlaboratory Study
Sieve Size, Limestone Granite Basalt Gravel Gravel Gravel mm (in) Mountain wILMS Scr. w/GR Scr.
25.0 (1) 100.0 100.0 100.0 100.0 100.0 100.0 2204 (7/8) 100.0 100.0 100.0 100.0 100.0 100.0 16.0 (5/8) 100.0 98.9 98.4 96.0 100.0 100.0 9.5 (3/8) 92.8 82.4 80.3 75.3 91.1 90.1 4.75 (#4) 64.0 52.7 53.6 54.5 60.7 57.3 2.0 (#10) 38.0 35.3 36.0 37.5 37.2 37.0 0.425 (#40) 19.6 19.5 22.0 22.8 20.1 1704 0.180 (#80) 9.9 8.5 6.7 11.6 10.2 704 0.075 (#200) 5.0 4.1 2.4 3.5 6.3 2.0
OAC 5.3 % 4.6% 4.6% 5.0% 5.3 % 5.5 %
Note: OAC Optimum Asphalt Content Ser. Screenings
DHT-45 7 TxDOT 2/26/1999
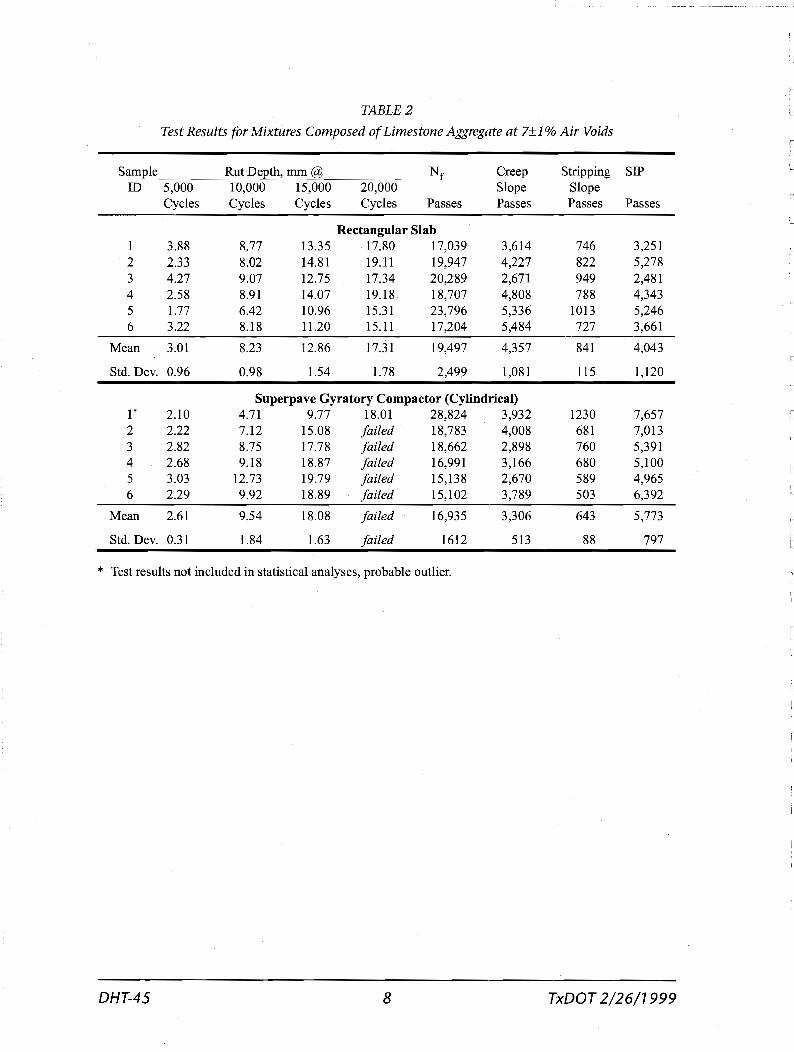
TABLE 2 L
Test Results for Mixtures Composed of Limes tone Aggregate at 7±1% Air Voids c
Sample Rut Depth, mm @ Nf Creep Stripping SIP -_ .... . ... --~
ID 5,000 10,000 15,000 20,000 Slope Slope Cycles Cycles Cycles Cycles Passes Passes Passes Passes
Rectangular Slab 3.88 8.77 13.35 17.80 17,039 3,614 746 3,251
2 2.33 8.02 14.81 19.11 19,947 4,227 822 5,278 3 4.27 9.07 12.75 17.34 20,289 2,671 949 2,481 4 2.58 8.91 14.07 19.18 18,707 4,808 788 4,343 5 1.77 6.42 10.96 15.31 23,796 5,336 1013 5,246 6 3.22 8.18 11.20 15.11 17,204 5,484 727 3,661
Mean 3.01 8.23 12.86 17.31 19,497 4,357 841 4,043
Std. Dev. 0.96 0.98 1.54 1.78 2,499 1,081 115 1,120
Superpave Gyratory Compactor (Cylindrical) l' 2.10 4.71 9.77 18.01 28,824 3,932 1230 7,657 2 2.22 7.12 15.08 failed 18,783 4,008 681 7,013 3 2.82 8.75 17.78 failed 18,662 2,898 760 5,391 4 2.68 9.18 18.87 failed 16,991 3,166 680 5,100 5 3.03 12.73 19.79 failed 15,138 2,670 589 4,965 6 2.29 9.92 18.89 failed 15,102 3,789 503 6,392
, -',
Mean 2.61 9.54 18.08 failed 16,935 3,306 643 5,773
Std. Dev. 0.31 1.84 1.63 failed 1612 513 88 797
* Test results not included in statistical analyses, probable outlier.
DHT-45 8 TxDOT 2/26/1999
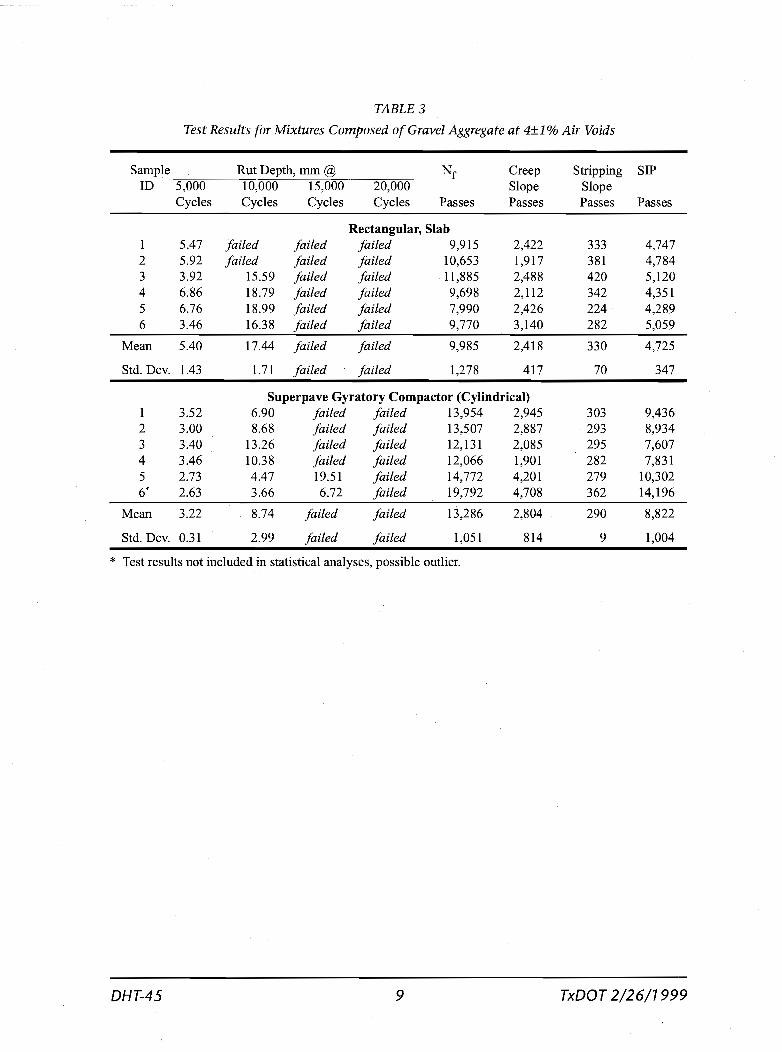
TABLE 3
Test Results for Mixtures Composed of Gravel Aggregate at 4±1 % Air Voids
Sample Rut Depth, mm @ Nf Creep Stripping SIP ID 5,000 ·······10,000 - 15,000 20,000 Slope Slope
Cycles Cycles Cycles Cycles Passes Passes Passes Passes
Rectangular, Slab 1 5.47 failed failed failed 9,915 2,422 333 4,747 2 5.92 failed failed failed 10,653 1,917 381 4,784 3 3.92 15.59 failed failed 11,885 2,488 420 5,120 4 6.86 18.79 failed failed 9,698 2,112 342 4,351 5 6.76 18.99 failed failed 7,990 2,426 224 4,289 6 3.46 16.38 failed failed 9,770 3,140 282 5,059
Mean 5.40 17.44 failed failed 9,985 2,418 330 4,725
Std. Dev. 1.43 1.71 failed failed 1,278 417 70 347
Superpave Gyratory Compactor (Cylindrical) 3.52 6.90 failed failed 13,954 2,945 303 9,436
2 3.00 8.68 failed failed 13,507 2,887 293 8,934 3 3.40 13.26 failed failed 12,131 2,085 295 7,607 4 3.46 10.38 failed failed 12,066 1,901 282 7,831 5 2.73 4.47 19.51 failed 14,772 4,201 279 10,302 6' 2.63 3.66 6.72 failed 19,792 4,708 362 14,196
Mean 3.22 8.74 failed failed 13,286 2,804 290 8,822
Std. Dev. 0.31 2.99 failed failed 1,051 814 9 1,004
* Test results not included in statistical analyses, possible outlier.
OHT-45 9 rxOOT 2/26/1999
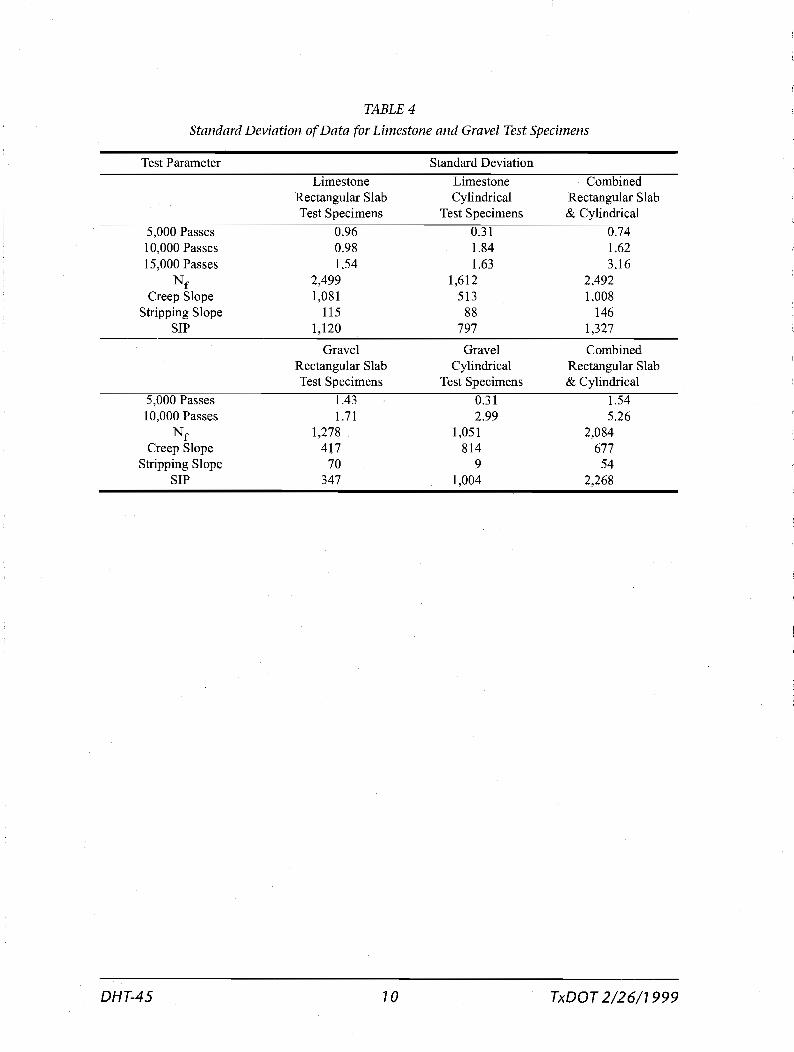
TABLE 4
Standard Deviation of Data for Limestone and Gravel Test Specimens
Test Parameter
5,000 Passes 10,000 Passes 15,000 Passes
N f Creep Slope
Stripping Slope SIP
10,000 Passes N f
Creep Slope Stripping Slope
SIP
DHT-45
Limestone Rectangular Slab Test Specimens
0.96 0.98 1.54
2,499 1,081
115 1,120
Gravel Rectangular Slab Test Specimens
1.71 1,278
417 70
347
10
Standard Deviation
Limestone Combined Cylindrical Rectangular Slab
Test Specimens & Cylindrical
0.31 0.74 1.84 1.62 l.63 3.16
1,612 2,492 513 1,008
88 146 797 1,327
Gravel Combined Cylindrical Rectangular Slab
Test Specimens & Cylindrical
2.99 5.26 1,051 2,084
814 677 9 54
1,004 2,268
TxDOT 2/26/1999
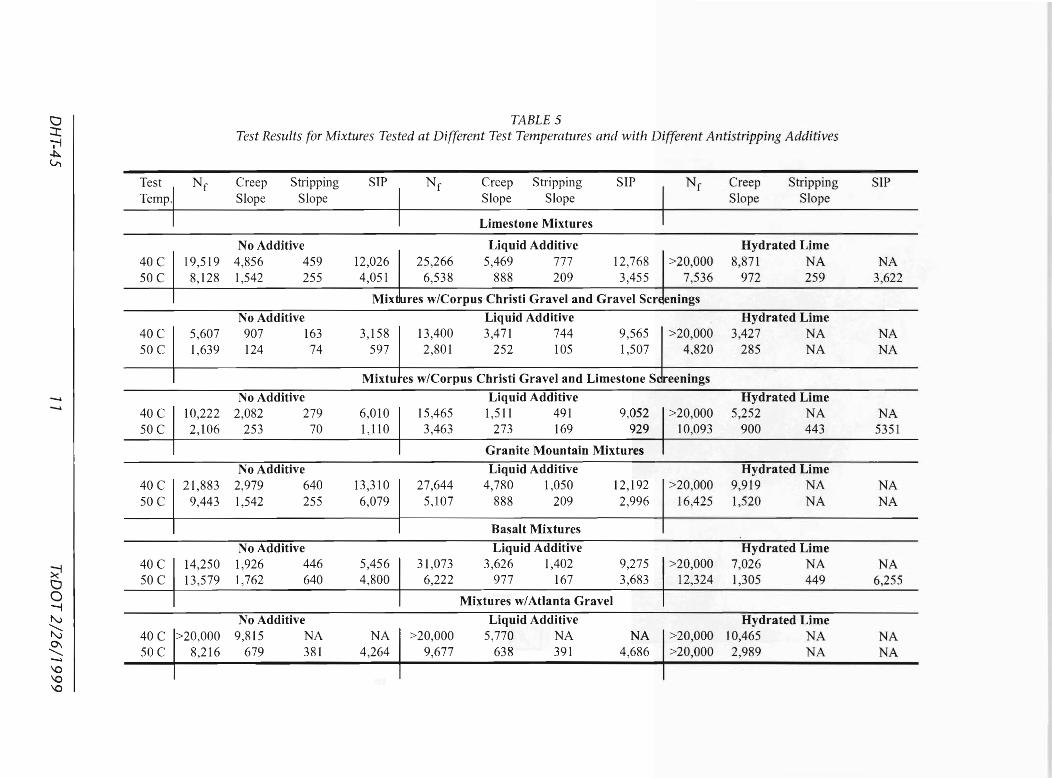
CJ TABLE 5 ::t Test Results for Mixtures Tested at Different Test Temperatures and with Different A ntis tripp ing Additives ~ ~ ~
Test Nf Creep Stripping SIP N f Creep Stripping SIP N f Creep Stripping SIP Temp.1 Slope Slope Slope Slope Slope Slope
Limestone Mixtures
No Additive Liquid Additive Hydrated Lime 40 C 19,519 4,856 459 12,026 25,266 5,469 777 12,768 >20,000 8,871 NA NA 50 C 8,128 1,542 255 4,051 6,538 888 209 3,455 7,536 972 259 3,622
Mix res w/Corpus Christi Gravel and Gravel Scr enings
No Additive Liquid Additive Hydrated Lime 40 C 5,607 907 163 3,158 13,400 3,471 744 9,565 >20,000 3,427 NA NA 50 C 1,639 124 74 597 2,801 252 105 1,507 4,820 285 NA NA
Mixtu es w/Corpus Christi Gravel and Limestone S eenings -..}, No Additive Liquid Additive Hydrated Lime -..},
40 C 10,222 2,082 279 6,010 15,465 1,511 491 9,052 1>20,000 5,252 NA NA 50 C 2,106 253 70 1,110 3,463 273 169 929 10,093 900 443 5351
Granite Mountain Mixtures
No Additive Liquid Additive Hydrated Lime 40 C 21,883 2,979 640 13,310 27,644 4,780 1,050 12,192 1>20,000 9,919 NA NA 50 C 9,443 1,542 255 6,079 5,107 888 209 2,996 16,425 1,520 NA NA
Basalt Mixtures
No Additive Liquid Additive Hydrated Lime
~ 40 C 14,250 1,926 446 5,456 31,073 3,626 1,402 9,275 1 >20,000 7,026 NA NA
CJ 50 C 13,579 1,762 640 4,800 6,222 977 167 3,683 12,324 1,305 449 6,255 0 Mixtures wi Atlanta Gravel -I N No Additive Liquid Additive Hydrated Lime ~ 40 C 1>20,000 9,815 NA NA >20,000 5,770 NA NA 1>20,000 10,465 NA NA 0\
50 C 8,216 679 381 4,264 9,677 638 391 4,686 >20,000 2,989 NA NA ""'--..},
\0 \0 \0
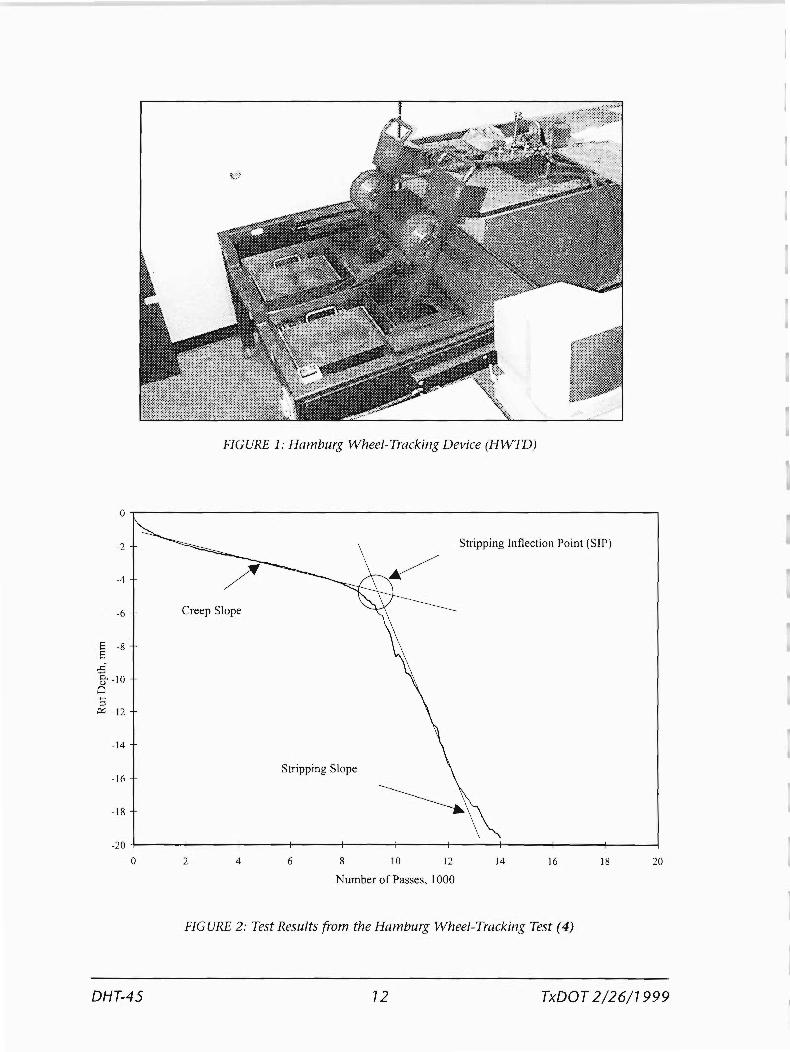
FIGURE 1: Hamburg Wheel-Tracking Device (HWTD)
o -
-2 Stripping Inflection Point (SIP)
-4
-6 Creep Slope
E -8 E
...c fr -10 Cl ::; t:Y. -12
-14
-16
-18
Stripping Slope
-20+-----~----~----~r_----~--~_+------r_----+_----_r----~----~
o 2 4 6 8 10 12 14 16 18 20
Number of Passes, 1000
FIG URE 2: Test Results from the Hamburg Wheel-Tracking Test (4)
DHT-45 72 TxDOT 2/26/7999
thickness = 60 mm "acrylic" sheet
287.5 40 40
150
7.5mm
Notes: 363
1. not to scale 2. dimensions in millimeters
FIGURE 3: Top View of Superpave Gyratory Specimen Configuration for the Hamburg Wheel-Tracking Device (HWTD)
DHT-45
FIGURE 4: Specimen Configuration for the Hamburg Wheel-Tacking Device with Superpave-Gyratory-Compacted Test Specimens
13 TxDOT 2/26/1999
0
-2
-4
-6
E -8 E .c 0, -10 u 0 "5
-12 ~
-14 Limestone Mixtures
-16 --Rectangular, Slab
-18 - - - Cylindrical
-20
0 2 4 6 8
" -,
, " "
10
..
, . , , \, ~ ,,'\. ,-,
-.
,. .. ~, ' , " ,
12
Number of Passes, 1000
'-
"
"" " ,. .. '~:, " .... \ft ... " .... '\. _ .... -.- ....
14 16 18 20
FIGURE 5: Combined Test Results for the Rectangular Slab and Cylindrical Test Specimens of the Limestone Mixture
0
-2
-4
-6
E -8 E .c 0, -10 Q)
0 "5 p::: -12
-14
-16
-18
-20
0 2 4 6
. , I
",
8
Gravel Mixtures: Rectangular, Slab
, " . , . ~ \', II
, '\ ,
\ I I 1 _.
-.. '.', ':', , . , ...
Cylindrical
"',
i",
,,' 11.- .. , ",'
" ",
10
- , , \
, .' '\
", "
12
, -, , . ' .:, I "
\, .. . ' "\
14
" .... '
16
Number of Passes, 1000
18 20
FIGURE 6: Combined Test Results for the Rectangular Slab and Cylindrical Test Specimens of the Gravel Mixture
DHT-45 74 TxDOT 2/26/7999
0
-2
-4
-6
-8 E E
.r::.~ -10 0..
Il,)
0 ::; -12 0:::
-14
-16
-18
-20
0
-2
-4
-6
E -8 E ~ fr -10 0 ::; 0::: -12
-14
-16
-18
-20
0
0
.....
" ,
2
, \
\ \ \
\
\ \
4
\ \ \ ...
\ \ \ I~
6
Limestone Mixtures @ 40 & 50 °C
~.. ---- .... ~ ......... -~~----- ..... --.
..~ .............
8
.. , .
- - • No Additive - 40 . - - No Additive - 50
- -Liquid - 40 - -- Liquid - 50
-- Hydrated Lime - 40 --Hydrated Lime - 50
10 12 14 16 18
Number of Passes, 1000
FIGURE 7: Test Results for Limestone Mixtures Tested at 4(yC and SOOC
\ \ \
\ \ I \
I \
\
2
1 \ \ \ \ I
. · · · ·
4
.. \.' t'
6
Corpus Christi w/Gravel Screenings @ 40 & 50°C
... '", " "I
\ ,\ \ ~
\ ~\
~1
I
••.• No Additive - 40
- - Liquid - 40
---.- No Additive - 50
---- Liquid - 50
-- Hydrated Lime - 40 -- Hydrated Lime - 50
10 12 14 16 18
Number of Passes, 1000
FIGURE 8: Test Results for Mixtures with Corpus Christi Gravel and Gravel Screenings Tested at 400C and salc
20
20
DHT-45 15 TxDOT 2/26/1999
0
-2
-4
-6
E -8 E
.r:,-
0. -10 OJ
Cl ::; 0:: -12
-14
-16
-18
-20
0
0
-2
-4
-6
E -8
E .£ -10 0.
OJ
Cl :3 -12 0::
- 14
-16
-18
-20
0
DHT-45
I~i 'I
I I I I I
~
2 4 6 8
........ No Additive - 40
- - - Liquid - 40
........... No Additive - 50
---- Liquid - 50
-- Hydrated Lime - 40 -- Hydrated Lime - 50
, " \
\\b \ .,
\ \.
\, \ \, ,
\ \ ~\
Corpus Christi wlLimestone Screenings @ 40 & 50 DC
10 12 14 16 18
Number of Passes, 1000
FIGURE 9: Test Results for with Corpus Christi Gravel and Limestone Screenings Tested at 400C and SOOC
Granite Mountain @ 40 and 50 DC
"-"-
"-"-
"-, "-..
20
, -:·1· \ \
....... No Additive - 40 - - Liquid - 40 -- Hydrated Lime - 40
2 4 6
... ... ...... .. No Additive - 50
---- Liquid - 50 - - Hydrated Lime - 50
8 10 12
Number of Passes, J 000
14 16 18 20
FIGURE 10: Test Results for Granite Mountain Mixtures Tested at 400C and SOVC
76 TxDOT 2/26/7 999
0
-2
-4
-6
E -8 E
..c:
. ' .,
.... No Additive - 40
- - Liquid - 40
.. , .... No Additive - 50
---- Liquid - 50
-- Hydrated Lime - 40 -- Hydrated Lime - 50
0, -)0 '.' !l)
0 =: 0:::
E E .c 0, !l)
0 =: 0:::
-12
-14
-16
-18
~
I' I '
v'' •
Basalt Mixtures @ 40 & 50 DC -20 +-------~----~------_r------~------+_----~------_+------~------+_----~
o
0
-2
-4
-6
-8
-10
-12
-14
-16
-18
2 4 6 8 10 12 14 16 18 20
Number of Passes, 1000
FIGURE 11: Test Results for Basalt Mixtures Tested at 400e and sooe
, .... No Additive - 40 .. . No Additive - 50
\ ,.... - - Liquid - 40 - - - Liquid - 50
\s' ~~ ~. . . . -- Hydrated Lime - 40 - - Hydrated Lime - 50
,.\ -,:" ~~-----------~. \ .. ,.. ,,' " .... ,. "" .... \>..,~ .....
'<'"~ . ........ . .... -.... . ..................... . - -- ............... . --- ---, .,-" - - ..... -" "':~
" <~> ,,~ ,', " ". "---,
Atlanta@40 & 50 °C
\ ', I
\ '\
\
-20 +-------~-----+-------+------~------+-----~-------+------~------+-----~
o 2 4 6 8 ]0 12 14 16 18 20
N umber of Passes, 1000
FIGURE 12: Test Results for Atlanta Mixtures Tested at 400e and S()le
DHT-45 17 TxDOT 2/26/1999
18000
16000
14000 -
12000 '" ~ ro
~ 10000 0... 0
(;j 0.. 8000 <ll <ll
U 6000
4000
2000
• Additive Effect at 40 and 50 DC
... 40 DC • 50 DC
•
•
•
• •
• 40 DC
~ • .I . --•
• ... . --.....-.--...-A-- --- -- ------. . ----.;--. --_..&
• • • • •• • •• • • ••• • • • •
o ~1 ---------+--~.~-· -·-------------4I~._·--·~.~-----------4----·~.------~
No Additive Liquid Additive Hydrated Lime
FIGURE 13: Trend Line of Creep Slope Data with Antistripping Additive
DHT-45 78 TxDOT 2/26/7999

REFERENCES
1. Fromm, H. J. liThe Mechanisms of Asphalt Stripping from Aggregate Surfaces." Proceeding, Association of Asphalt Paving Technologists, Vol. 43, 1974.
2. Ping, W. V. and Kennedy, T. W. Evaluation of Stripping and Moisture Damage in Asphalt Pavements Treated with Lime and A ntis tripping Agent. CTR 3-9-86-441-1, Center for Transportation Research, The University of Texas at Austin, April 1991.
3. Graf, P. E. "Factors Affecting Moisture Susceptibility of Asphalt Concrete Mixes." Proceedings, Association of Asphalt Paving Technologists, Vol. 55, 1986.
4. Izzo, R. P. and Tahmoressi, M. Comparative Analysis of Superpave Gyratory Compacted Specimens with Linear Kneading Compacted Slabs Using the Hamburg Wheel-Tracking Device. DHT-40. Texas Department of Transportation, Bituminous Section, Materials and Tests Division, Austin, 1997.
5. Aschenbrener, T., Terrel, R. L., and Zamora, R. A. Comparison of the Hamburg Wheel Tracking Device and the Environmental Conditioning System to Pavements of Known Stripping Performance. Report No. CDOT-DTD-R-94-1, Colorado Department of Transportation, Denver, Colorado, January 1994.
6. Aschenbrener, T. and Currier, G. Influence of Testing Variables on the Results from the Hamburg Wheel-Tracking Device. Report No. CDOT-DTD-R-93-22, Colorado Department of Transportation, Denver, Colorado, December 1993.
7. Stuart, K. D.and Malmquist, P. "Evaluation of Using Different Stabilizers in the U.S. Route 15 (Maryland) Stone Matrix Asphalt." Transportation Research Record 1454, TRB, National Research Council, Washington, D.C., 1994.
8. Mogawer, W. S. and Stuart, K. D. "Evaluation of Stone Matrix Asphalt Versus Dense-Graded Mixtures." Transportation Research Record 1454, TRB, National Research Council, Washington, D.C., 1994.
DHT-45 19 TxDOT 2/26/1999
DHT-45 20 TxDOT 2/26/1999