Embed Size (px)
Citation preview
EVALUATION OF THE STRATEGIC PROJECT GRANTS (SPG) PROGRAM Summary Report Prepared for:
Natural Sciences and Engineering Research Council (NSERC) February 29, 2012 Prepared by:
R.A Malatest & Associates Ltd. 500-294 Albert Street Ottawa ON K1P 6E6 Phone: (613) 688-1847 Fax: (613) 288-1278
1206-415 Yonge St Toronto ON M5B 2E7 Phone: (416) 644-0161 Fax: (416) 644-0164
858 Pandora Ave. Victoria BC V8W 1P4 Phone: (250) 384-2770 Fax: (250) 384-2774
300-10621 100th Ave. Edmonton AB T5J 0B3 Phone: (780) 448-9042 Fax: (780) 448-9047
Web: www.malatest.com
ii
Evaluation of the Strategic Project Grants Program
EXECUTIVE SUMMARY The evaluation of the Strategic Project Grants (SPG) program covered the period of fiscal year 1999/00 to fiscal year 2008/09. The SPG program was last evaluated in 1999. The evaluation was conducted by R. A. Malatest & Associates Ltd., while the Partial Benefit-Cost Analysis, which was one component of it, was carried out by KPMG. The purpose of the evaluation was to provide NSERC senior management with an assessment of the relevance and performance of the program. The evaluation was also designed to ensure that NSERC meets the requirements of subsection 42.1(1) of the Financial Administration Act and the Treasury Board Secretariat’s Policy on Evaluation.1 The evaluation questions were developed in consultation with RPP senior management, and address the core evaluation issues laid out in the Directive on the Evaluation Function. A quasi-experimental design (with non-equivalent groups) was used for estimating the impacts of the SPG program. Researchers and partners who had applied for, but not received, a Strategic grant were used as a comparison group. Multiple lines of evidence were employed to answer all evaluation questions, including: a document review; a file review; an administrative data review; key informant interviews; Web-based surveys of Strategic researchers, partners and Highly Qualified Personnel (HQP), as well as non-funded researchers and partners; case examples and a partial benefit-cost analysis. The overall evaluation design had two key limitations. First, the HQP survey responses can only be considered representative of the HQP who were most involved in Strategic projects, rather than all HQP involved. Second, while it was deemed worthwhile to use non-funded projects as a comparison group to identify program impacts, differences between Strategic and non-funded projects may have been partly due to quality differences between projects rather than the fact that some received funding from the SPG program. Relevance The evaluation concluded that the SPG program continues to be relevant, and meets an important need for both researchers and partners. It fills a specific niche in Canada’s range of research funding programs in that no other research funding program has the same unique combination of features. The SPG program is one of few funding programs to provide substantial funding for collaborative research that, because of its high-risk nature, might not otherwise be undertaken. The SPG program also fills a unique niche in NSERC’s continuum of Research Partnerships Programs, where it functions as a two-way bridge between discovery research and collaborative research with partner organizations. While there is a strong perceived need for the program in the research community, it has been suggested that it could better meet Canada’s research needs if the target areas were less restrictive. Effectiveness The program increases the participation of Canadian-based companies and/or government organizations in academic research by successfully creating interconnections and long-term relationships between individual researchers and partner organizations. Fewer long-term relationships would have been created if the SPG program did not exist, as only half of the projects that did not receive funding went ahead. However, the program does not provide partners with a first introduction to collaborative research; almost all partners surveyed (85%) had previously worked with university researchers for an average of 20 years. Almost all Strategic partners considered their collaborations with academic researchers to have been successful (95%). Partners identified various ways that NSERC could encourage potential partners to participate in the program. These included: program outreach and matchmaking between researchers and partners; further communicating the advantages of participating and achievements of strategic projects; helping address intellectual property issues; accepting applications from industry or government and distributing grant 1 Treasury Board Secretariat (2009). Policy on Evaluation, http://www.tbs-sct.gc.ca/pol/doc-eng.aspx?id=15024.
iii
Evaluation of the Strategic Project Grants Program
funds directly to partner organizations; increasing the participation of partners; and increasing the success rate of applications to the program. The SPG program has made a significant contribution to research in the target areas and the priorities of the science and technology strategy. Without the program, approximately half of the Strategic projects (45%) would likely not have proceeded, and many (39%) would have been reduced in scope, often with less involvement from partners (35%) or HQP (40%). The SPG program appears to have facilitated collaborations, where relevant, with researchers in non-NSE disciplines and researchers from other countries to enhance funded projects. Research results from Strategic projects are almost always transferred to partners. Strategic projects generated nearly twice the number of publications and conference presentations and produced a greater number of patent applications than non-funded projects. More than half of partners (63%) had already used the research results at the time of the evaluation, and one in ten planned to use the research results within the next year or two. More than half (52%) had also applied the results for economic gain, to strengthen public policy, or to achieve other social or environmental benefits. One in twenty (5%) Strategic projects (13 projects) led to the creation of a spin-off company, according to researchers. In addition, Strategic partners experience a range of benefits beyond the direct application of the research results. The incremental impact of the SPG program on creating training opportunities for HQP and enhancing their training is substantial, taking into account the high proportion of non-funded projects that did not proceed and the fact that those that did proceed often did so with reduced HQP involvement. On average, Strategic projects trained 15 HQP (12 of whom were students), which is twice as many as non-funded projects. Strategic projects also produced twice as many theses as non-funded projects that proceeded. The SPG program contributed to an increase in the number of HQP employed in target areas by giving some of the HQP most involved in Strategic projects a unique opportunity to conduct research in national research priority areas, by increasing their interest in the subject area, and by helping them gain relevant skills and the experience necessary for employment in those areas. Six in ten HQP (61%) reported that they were offered jobs or contracts as a result of the Strategic project, and almost all partners (90%) who had employed former HQP considered them to be more job-ready than other hires as a result of their participation. Strategic projects also had a sustainable impact on researchers’ teaching activities in most cases. Efficiency and Economy The SPG program is efficient in that the administrative costs required to deliver it are low (5.2%) and comparable to those of RPP overall. In addition, Strategic projects leverage substantial in-kind contributions from partners. Researchers were generally satisfied with the operation of the program, including staff responsiveness, the amount and duration of funds, and the reporting requirements. Some wanted to see changes in the timing of funding award decisions, the funding success rate and the duration of the grant. Non-funded researchers raised concerns with regard to the transparency and quality of the selection process. The socio-economic benefits of the SPG program almost certainly cover the costs. The Partial Benefit-Cost Analysis demonstrated that in the most conservative analysis, the socio-economic benefits from only five (out of 262) projects will cover almost 60% of total program costs. In a less conservative analysis, it is likely that benefits from five Strategic projects will cover about 1.4 times total program costs. Recommendations Given the overall success of the SPG program in achieving its expected results, only a few recommendations are presented for NSERC's consideration.
iv
Evaluation of the Strategic Project Grants Program
Recommendation #1: Continue the SPG program, while giving consideration to some minor adjustments to ensure continued relevance, and supporting new and ongoing research partnerships within the program's niche. Based on the findings, the following suggestions might be considered by NSERC:
• Create strategic flexibility in accepting promising projects that fall outside the current target areas.
• Attract or support the participation of new partner organizations in the program by connecting potential partners with university researchers, and vice versa.
Recommendation #2: Modify existing performance measurement systems to collect additional performance data in support of ongoing monitoring and program evaluation.
v
Evaluation of the Strategic Project Grants Program
TABLE OF CONTENTS
INTRODUCTION ........................................................................................................................................... 1
FINDINGS ..................................................................................................................................................... 9
CONCLUSIONS AND RECOMMENDATIONS .......................................................................................... 31
REFERENCES ............................................................................................................................................ 34

vi
Evaluation of the Strategic Project Grants Program
LIST OF TABLES Table 1: Evaluation Questions ......................................................................................................... 4 Table 2: Survey Response Rates .................................................................................................... 6 Table 3: Type of Impact by Area for Strategic Partners ................................................................. 17 Table 5: Estimated Costs for the SPG Program (2001/02-2009/10) ............................................. 25 Table 5: Leverage Ratio for Projects Ending in FY 2003/04-2008/09 ........................................... 25 Table 6: NPV and Benefit/Cost Ratio ............................................................................................. 29 Table A-1: Grouping of Target Areas ............................................................................................. 35
vii
Evaluation of the Strategic Project Grants Program
LIST OF FIGURES Figure 1: SPG Logic Model .............................................................................................................. 2 Figure 2: Distribution of Funding by Target Area (1999/00 - 2009/10) .......................................... 12 Figure 3: Distribution of Funding by Target Area (2007/08-2009/10) ............................................ 13 Figure 4: Projects that Proceeded without SPG Funding .............................................................. 13 Figure 5: Projects Requiring IP Management and Protection Activities ........................................ 16 Figure 6: Areas of Impact on Partner Organizations ..................................................................... 17 Figure 7: Impacts on Strategic Partners’ R&D ............................................................................... 20 Figure 8: Impact on HQP Expertise and Skills .............................................................................. 22 Figure 9: HQP Employment Status ................................................................................................ 23 Figure 10: Level of Satisfaction with Program Design Features .................................................... 26 Figure 11: Level of Satisfaction with Program Delivery ................................................................. 27
viii
Evaluation of the Strategic Project Grants Program
LIST OF ABBREVIATIONS
CRD Collaborative R&D Grants
DG Discovery Grants
HQP Highly qualified personnel
NSE Natural sciences and engineering
NSERC Natural Sciences and Engineering Research Council
R&D Research & development
RPP Research Partnerships Programs
S&T Science and technology
S&T strategy Canada's Mobilizing Science and Technology to Canada’s Advantage, the science and technology strategy
SPG Strategic Project Grants
SPI Strategy for Partnerships and Innovation
1
Evaluation of the Strategic Project Grants Program
INTRODUCTION This summary report presents the key findings, conclusions and recommendations of the evaluation of the Strategic Project Grants (SPG) program. The evaluation covered the period from fiscal year 1999/00 to fiscal year 2008/09. The SPG program was last evaluated in 1999. The evaluation was conducted by R. A. Malatest & Associates Ltd., while the Partial Benefit-Cost Analysis, which was one component of the evaluation, was carried out by KPMG. The purpose of the evaluation was to provide NSERC senior management with an assessment of the relevance and performance of the program. The evaluation was also designed to ensure that NSERC meets the requirements of section 42.1(1) of the Financial Administration Act and the Treasury Board Secretariat’s Policy on Evaluation.2 The SPG Program The SPG program was launched in 1977 by the National Research Council (NRC) and subsequently transferred to the Natural Sciences and Engineering Research Council (NSERC) when it was established in 1978. The goal of the SPG program is to increase research and training in targeted areas that could strongly enhance Canada’s economy, society and/or environment within the next 10 years. It funds early-stage research projects in targeted areas. These targeted areas are revisited every five years. The program is expected to:
• foster the increased participation of Canadian-based companies and/or government organizations in academic research;
• generate new knowledge/technology with the strong potential to strengthen Canada’s industrial base, generate wealth, create employment, and/or influence Canadian public policy;
• increase the number of highly qualified personnel (HQP) in the areas targeted by this program; and
• enable the transfer of knowledge/technology and expertise to Canadian-based companies that are well positioned to apply the results for economic gain, or to government organizations to strengthen public policy.
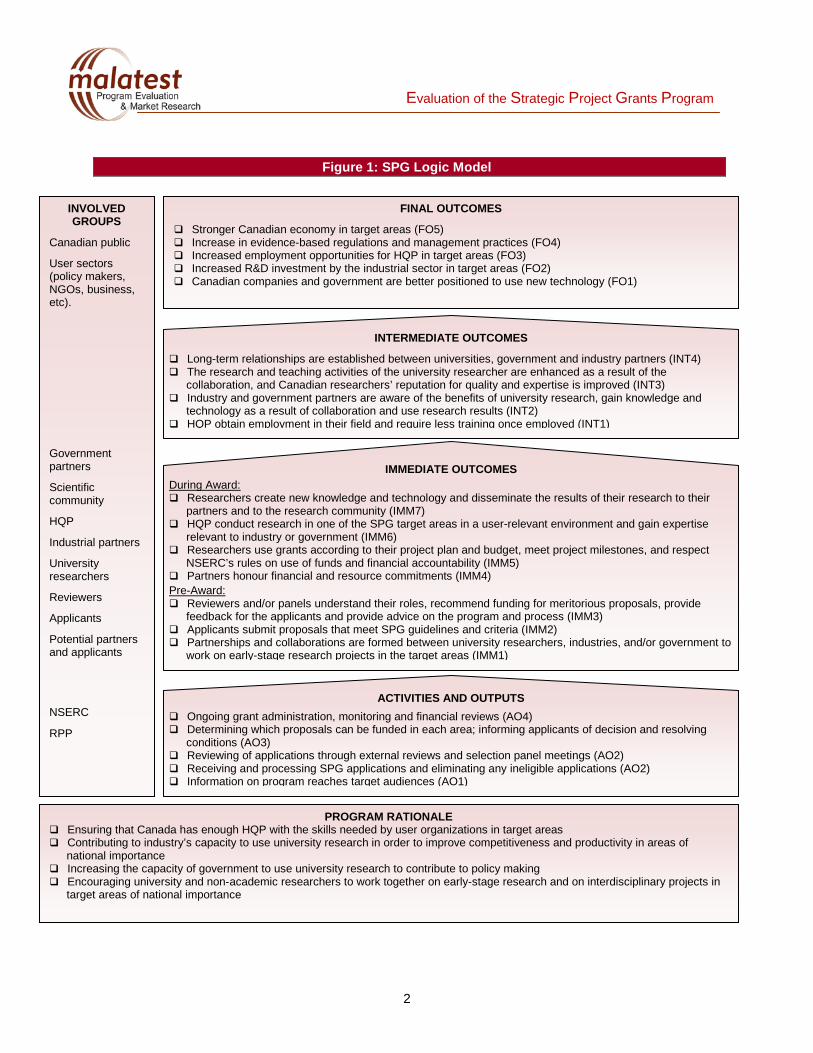
Grants are awarded through annual competitions for a duration of one to three years, and typically range from $30,000 to $200,000 per year. The average success rate was 34% for the period under review. To be eligible for funding, at least one academic researcher and one partner organization must collaborate on the project. The partner organization must be a Canadian-based company or government department/agency that can apply the research results. Companies are expected to use the results to generate wealth or employment within Canada, while government departments/agencies are expected to apply the results in a way that strengthens public policy. The supporting organization must be actively involved in all stages of the project; therefore, in-kind contributions are required, but cash is not. Figure 1 presents the logic model for the SPG program. The logic model illustrates the program rationale (at the bottom) and identifies the linkages between the program activities and outputs and the immediate, intermediate and final outcomes (at the top). The logic model also identifies the relevant groups involved in or affected by the program throughout its lifecycle (left side) and illustrates the “reach” of the program.
2 Government of Canada (2009, July 9). Treasury Board Secretariat: Policy on Evaluation. Retrieved September 30, 2011 from Government of Canada Web site: http://www.tbs-sct.gc.ca/pol/doc-eng.aspx?id=15024
2
Evaluation of the Strategic Project Grants Program
Figure 1: SPG Logic Model
PROGRAM RATIONALE Ensuring that Canada has enough HQP with the skills needed by user organizations in target areas Contributing to industry’s capacity to use university research in order to improve competitiveness and productivity in areas of
national importance Increasing the capacity of government to use university research to contribute to policy making Encouraging university and non-academic researchers to work together on early-stage research and on interdisciplinary projects in
target areas of national importance
ACTIVITIES AND OUTPUTS Ongoing grant administration, monitoring and financial reviews (AO4) Determining which proposals can be funded in each area; informing applicants of decision and resolving
conditions (AO3) Reviewing of applications through external reviews and selection panel meetings (AO2) Receiving and processing SPG applications and eliminating any ineligible applications (AO2) Information on program reaches target audiences (AO1)
IMMEDIATE OUTCOMES During Award: Researchers create new knowledge and technology and disseminate the results of their research to their
partners and to the research community (IMM7) HQP conduct research in one of the SPG target areas in a user-relevant environment and gain expertise
relevant to industry or government (IMM6) Researchers use grants according to their project plan and budget, meet project milestones, and respect
NSERC’s rules on use of funds and financial accountability (IMM5) Partners honour financial and resource commitments (IMM4)
Pre-Award: Reviewers and/or panels understand their roles, recommend funding for meritorious proposals, provide
feedback for the applicants and provide advice on the program and process (IMM3) Applicants submit proposals that meet SPG guidelines and criteria (IMM2) Partnerships and collaborations are formed between university researchers, industries, and/or government to
work on early-stage research projects in the target areas (IMM1)
INTERMEDIATE OUTCOMES
Long-term relationships are established between universities, government and industry partners (INT4) The research and teaching activities of the university researcher are enhanced as a result of the
collaboration, and Canadian researchers’ reputation for quality and expertise is improved (INT3) Industry and government partners are aware of the benefits of university research, gain knowledge and
technology as a result of collaboration and use research results (INT2) HQP obtain employment in their field and require less training once employed (INT1)
FINAL OUTCOMES
Stronger Canadian economy in target areas (FO5) Increase in evidence-based regulations and management practices (FO4) Increased employment opportunities for HQP in target areas (FO3) Increased R&D investment by the industrial sector in target areas (FO2) Canadian companies and government are better positioned to use new technology (FO1)
INVOLVED GROUPS
Canadian public
User sectors (policy makers, NGOs, business, etc).
Government partners
Scientific community
HQP
Industrial partners
University researchers
Reviewers
Applicants
Potential partners and applicants
NSERC
RPP
3
Evaluation of the Strategic Project Grants Program
Program Rationale (PR): As illustrated in Figure 1, the rationale that drives the SPG program is to: a) encourage university and non-academic researchers to work together on early-stage and interdisciplinary research in target areas; b) increase government capacity to use university research in policy making; c) contribute to industry’s capacity to use university research to improve competitiveness and productivity in national priority areas; and d) ensure a supply of HQP with the skills needed by user organizations in target areas. Activities and Outputs (AO): This component of the logic model presents the key activities undertaken by NSERC. NSERC ensures that information on the program reaches the intended target audiences (AO1), receives and processes applications, and evaluates the applications through selection panel meetings and external reviews (AO2). NSERC determines which proposals can be funded in each area and notifies applicants of the funding decision and resolves conditions if applicable (AO3). After the award, NSERC is involved in ongoing grant administration and monitoring, as well as financial reviews (AO4). Immediate Outcomes (IMM): The immediate outcomes are defined as occurring either before or during the grant and are therefore classified as “Pre-Award” or “During Award” in the logic model. Prior to applying for a strategic grant, university researchers and industry and/or government partners must form partnerships and collaborations with the intention of working on early-stage research projects in target areas (IMM1). The applicants then develop and submit proposals that meet SPG program guidelines and criteria (IMM2). The selection committees and/or external reviewers evaluate proposals against the selection criteria and recommend the most meritorious proposals for funding. They also provide feedback to applicants on their proposals, as well as offering feedback on the SPG program and review process, as appropriate (IMM3). During the Strategic Project grant, successful applicants (researchers) are expected to use grants according to program requirements (adhere to project plan and budget, meet milestones, respect financial accountability and use of funds) (IMM5), while industrial and government partners are expected to honour any cash and in-kind commitments that were stipulated in the application (IMM4). Participating HQP are expected to conduct research in one of the target areas and gain expertise relevant to industry or government (IMM6). Overall, it is expected that the grant will result in the creation of new knowledge and technology, which will be disseminated to partners and the research community (IMM7). Intermediate Outcomes (INT): The intermediate outcomes are expected to occur after the funding period of the strategic grant, but may not be observed for every funded project. Through their participation in strategic projects, industrial and government partners become more aware of the benefits of university research, gain knowledge and technology, and use the research results (INT2). While the strategic projects are likely to enhance the research and teaching activities of researchers during the funding period, those impacts are primarily expected to occur after completion of the projects. The enhanced research and teaching activities are expected to improve researchers’ reputation for quality and expertise (INT3). In light of the benefits accrued by researchers and partners, it is reasonable to expect the SPG program to contribute to the establishment of long-term relationships between researchers, government and industry (INT4). Based on the skills and expertise acquired through participation in Strategic projects, it is anticipated that HQP will obtain employment in their field and require less training once employed (INT1). Final Outcomes (FO): The final outcomes represent the broad societal impacts to which the SPG program contributes, along with other RPP programs and initiatives. Although it is difficult to assess and attribute the specific contributions of the SPG program to societal-level outcomes, the program’s contribution to these outcomes can be estimated by measuring the impacts of the program on the direct beneficiaries (funded researchers, partners and HQP).

4
Evaluation of the Strategic Project Grants Program
By virtue of the partnerships, collaborations, and research results gained, Canadian-based companies and government organizations participating in SPG grants are expected to be better positioned to use new technology (FO1). In turn, this is expected to increase investment in research and development (R&D) by the industrial sector in the target areas of the program (FO2) and increase evidence-based regulations and management practices in government (FO4). Both these results would contribute to increased employment opportunities for HQP (FO3). The improved utilization of new knowledge and technology, as well as HQP employed in target areas, will contribute to a stronger Canadian economy in those areas (FO5). Evaluation Issues The evaluation questions were developed in consultation with RPP senior management to address the core evaluation issues laid out in the Directive on the Evaluation Function3 (Table 1). The five questions related to program effectiveness align with the program’s four expected results and cover the outcomes in the logic model. The final expected outcomes pertaining to the impact of the program on Canada’s R&D environment and Canadian society in general were inferred from the project-level outcomes. A detailed evaluation matrix (including indicators and sources of information) was also developed to help guide the evaluation.
Table 1: Evaluation Questions
Relevance: The extent to which the SPG program is addressing a demonstrated need, is appropriate to the federal government, and is responsive to the needs of Canadians 1. Is there a necessary role for the federal government in delivering the SPG program? 2. What is the role of the SPG program in relation to NSERC’s priorities (e.g., Strategy for Partnerships
and Innovation [SPI]) and government-wide priorities in the area of science and technology)? 3. Is there a continued need for targeted funding aimed at increasing research and training in priority
areas? 4. What niche does the SPG program occupy in the suite of research partnership programs?
4.1. To what extent is the SPG program a bridge between NSERC’s Discovery Grants program and other research partnership programs?
Effectiveness: The extent to which the program is achieving or demonstrating progress towards achieving expected outcomes 5. How and to what extent has the SPG program contributed to research in the target areas and
priorities of the science and technology strategy? 5.1. To what extent has the SPG program facilitated the inclusion of research expertise from non-
NSE disciplines (as needed) to address complex research issues? 5.2. To what extent has the SPG program facilitated international collaborations (as needed) to
enhance the funded projects? 6. To what extent has the SPG program fostered increased participation of Canadian-based companies
and/or government organizations in academic research? 6.1. Based on participation in the SPG program, are partners more aware of the benefits of
collaborating with academic researchers? 6.2. To what extent has the program established long-term relationships between universities and
government or industry partners? 6.3. What could be done to make the SPG program more attractive to potential partners?
3 Government of Canada (2009, July 9). Treasury Board Secretariat: Policy on Evaluation. Retrieved September 30, 2011 from Government of Canada Web site: http://www.tbs-sct.gc.ca/pol/doc-eng.aspx?id=15024
5
Evaluation of the Strategic Project Grants Program
7. To what extent has the SPG program enabled the transfer of new knowledge/technology and expertise to Canadian-based companies or government?
8. How have partners used, and benefited from, university research results? 8.1 To what extent have industry partners applied the research results for economic gain? 8.2 How and to what extent have government partners applied the research results to strengthen
public policy or to achieve other social or environmental benefits? 9. What has been the impact of the SPG on the training and employment of HQP in the target areas and
the S&T priority areas? 9.1. What impacts has participation in the SPG program had on researchers’ teaching activities? 9.2. How and to what extent have participating HQP gained relevant skills and experience? 9.3. To what extent has the SPG program contributed to HQP obtaining employment in their field? 9.4. To what extent has the SPG program contributed to an increase in the number of HQP
employed in target areas? 10. What unintended outcomes have occurred as a result of the SPG program? Efficiency and Economy: SPG resource utilization in relation to the production of outputs and progress toward expected outcomes 11. To what extent are effective and efficient means being used to deliver the SPG program?
11.1. Can the efficiency of the SPG program be improved (i.e., can the same level of program outputs be achieved in a more affordable manner)?
Design and Methods A quasi-experimental design (with non-equivalent groups) was used for estimating the impacts of the SPG program. Researchers and partners who had applied for, but not received, a Strategic grant were used as a comparison group. Multiple lines of evidence were employed to answer all evaluation questions. The data collection methods and sources of information are described below. Document Review The document review provided background and context for the interpretation of results and informed evaluation questions related to relevance, and efficiency and economy. A range of documents was reviewed by the Consultant, including but not limited to, program descriptions, the program logic model, financial information, reporting templates, application forms, previous evaluations, documents related to the peer-review process and documents from Statistics Canada. File Review The file review was conducted by NSERC’s evaluation unit to help assess the effectiveness of the program. It involved examining 525 grant files associated with projects that ended between fiscal year 2003/04 and 2008/09, and 32 that were awarded as part of the supplementary competition in 2007 and completed in fiscal year 2009/10. Files associated with earlier projects were not reviewed as the open-ended reporting format used at the time did not allow for quantitative analysis of project results. Administrative Data Review The administrative data review included looking at data from NSERC’s Award Management Information System (NAMIS) and other administrative data kept by the program. Key Informant Interviews

6
Evaluation of the Strategic Project Grants Program
Semi-structured interviews were conducted with representatives of NSERC’s Research Partnerships Programs (8), Industry Canada (1), and selection panel members concerning the context and relevance of the SPG program, possible areas of improvement and challenges. Web-Based Surveys Web-based surveys were administered to university researchers, partners and HQP associated with projects ending between fiscal year 2003/2004 and 2008/2009. To reduce the response burden on the research community, only principal investigators (PIs) were surveyed; co-applicants were excluded. As e-mail addresses were not readily available for HQP, a respondent-driven sampling approach was used. Researchers were asked to forward an e-mail invitation to complete the HQP survey to those HQP who had participated in Strategic projects. The response survey rates were relatively high considering the survey mode and the populations surveyed (Table 2). The researcher and partner samples were representative of the population.
Table 2: Survey Response Rates
Strategic researchers
Non-funded researchers
Strategic partners
Non-funded partners HQP
Initial Sample 510 578 1,113 1,515 Unknown
Functional Sample (excluding cases without contact information)
474 558 835 907 Unknown
Completed Surveys 249 265 244 270 427
Gross Response Rate 49% 46% 22% 18% 34%-48%*
Valid Response 53% 47% 29% 30% Unknown
Sample Error (95% CI) ±4.5% ±4.5% ±5.6% ±5.4% ±4.7% Case Examples Case examples were conducted to illustrate how Strategic projects have produced tangible benefits for partners and to explore the factors that have contributed to project success. The primary selection criterion for cases was evidence of tangible impact on partners, but other criteria, such as representation by target area and type of partner organizations, were also considered in the selection process. A total of ten case examples were completed. Each case example was based on multiple sources of information. Partial Benefit-Cost Analysis The objective of PBCA was to determine whether the benefits of relatively few, highly successful projects cover (or are likely to cover) most or all the costs of the entire program. The PBCA methodology is a technique recognized as a best practice in the assessment of socio-economic returns from S&T programs. In PBCA, the gross and net benefits of a small sub-set of “high-impact” projects are calculated. These high-impact projects are those with the highest benefits that can be identified, quantified, and assigned a dollar value. Each high-impact project is treated as a separate case for detailed economic analysis. The net benefits of these high-impact projects are compared with the total cost of the program by calculating
7
Evaluation of the Strategic Project Grants Program
the Net Present Value (NPV4) and/or benefit-cost (B-C) ratio, after both benefit and cost streams have been deflated and discounted. PBCA is therefore a partial approach, since not all projects, and not all impacts, are investigated. The NPV is a conservative (sometimes very conservative) lower bound of socio-economic impacts, given that only the benefits of the highest-impact projects are estimated. They are, however, compared to the total program costs. Note that because high-impact projects are deliberately chosen for analysis, there is no extrapolation to the program as a whole. PBCA is also conservative in that due to limited data availability, it only captures a portion of the socio-economic benefits generated by the high-impact projects, and does not capture impacts that cannot be quantified in dollar terms. Through a rigorous screening process, the study team was able to identify five high-impact cases for which it was possible to quantify the socio-economic impacts in dollar terms. These projects were funded by the program between fiscal years 2000/01 and 2005/06, and represented less than 1% of the 626 Strategic projects awarded during this time. Once the projects were selected, models were constructed of the estimated gross benefits and costs of each high-impact case and sub-case. The type of benefits investigated included:
• Net profits for new products (i.e., marginal profits);
• Sale of firms (only profits for Canadian investors were included);
• Net profits on Canadian-based consulting services; and
• Net cost savings for new processes, such as licensing, training and implementation of the new technologies in an industrial setting (e.g., value of production time savings, value of increased throughput, reduced costs of maintenance and repair, value of reduced production losses).
In addition to costs related to production (determined mainly by modeling marginal profit rates; note that they take future costs of production and/or services into account), other case study costs that were modeled include:
• Early investments by partners and other investors (e.g., in start-up firms); and
• Early development costs by partners (pre-production). Both costs and benefits were modeled for each case on an annual basis. Costs for the case studies were modeled in the years they were incurred. Benefits were modeled from the known start date (in four out of five cases this was while the Strategic project was still in progress) to the anticipated end date (this varied for each individual case, from five to 20 years into the future). All but one of the five projects had already created economic benefits, making it easier and more reliable to estimate future benefits. The fifth case was undergoing testing in an industrial setting and was very close to being applied. Strengths and Limitations The evaluation design was strong overall in that it included multiple lines of inquiry for each evaluation question, benefited from relatively high survey response rates and low sample error, and used comparison groups to assess the net impact of the program. The overall design had two key limitations, which were carefully taken into account when conducting the analyses, and are acknowledged in the interpretation of findings. First, the HQP survey responses were likely not representative of the larger HQP population due to the respondent-driven sample approach. Researchers were more likely to have forwarded the survey
4 NPV is the sum of net benefits over the anticipated timeline of each individual project or case study, minus project and (in the case of PBCA) program costs, after applying discounting and/ or deflation adjustments as required.
8
Evaluation of the Strategic Project Grants Program
invitations to HQP that had been heavily involved in the project than HQP with more limited involvement. The former group may also have been more inclined to complete the survey. Considering this, it is reasonable to assume that the HQP sample was representative of those HQP who were most involved in Strategic projects. There is, however, no way to be certain how representative the respondents were since NSERC does not have a record of all HQP who have participated in Strategic projects. Due to the issues associated with extrapolation, it was not worthwhile identifying a comparison group for HQP. Another limitation of the evaluation design was that it used a non-equivalent comparison group. Non-funded projects comprised a non-equivalent comparison group because they were ranked lower than funded-projects by NSERC’s peer review panels. A difference in results between funded and non-funded projects, therefore, could be the result of inherent quality differences between projects rather than the fact that some received funding from the SPG program. On the other hand, many projects that did not receive Strategic funding were still deemed worthy of funding by the Strategic peer review panels and might have been funded had the competition budget been larger. Many of the projects that constituted the comparison group were also meritorious enough to be granted funding from other sources in the absence of Strategic funding. Considering this, it appeared worthwhile to use non-funded projects as a comparison group.

9
Evaluation of the Strategic Project Grants Program
FINDINGS This section presents the key findings and conclusions of the evaluation. Relevance The Government of Canada identifies a clear need for targeted funding aimed at increasing research and training in national priority areas in its science and technology (S&T) strategy, Mobilizing Science and Technology to Canada’s Advantage.5 The findings from the surveys of researchers and partner organizations also suggest that there is a strong perceived need for a program that funds research and training in target areas, focuses on early-stage research and supports collaborative R&D projects between university researchers and partner organizations. A majority of researchers and about half of partners also expressed a need for a funding program that does not require cash contributions from partners. A number of researchers (21% of Strategic researchers and 12% of non-funded researchers) did, however, feel that the current target areas are too restrictive.6 Some proposed that the program incorporate an “open” category for non-conforming projects or provide a pre-screening step prior to full application in order to assess whether a proposed project is aligned with the target areas. Selection panel members confirmed that some promising projects were not funded because they did not fall within one of the prescribed target areas. The SPG program’s target areas and focus on supporting projects that involve non-NSE co-applicants and international collaboration align with the priorities identified in the S&T strategy. The program also contributes to NSERC’s strategic outcome 3.0 (Innovation: Productive use of new knowledge in the natural sciences and engineering.) The SPG program’s expected outcomes are also consistent with the aims of NSERC’s Strategy for Partnerships and Innovation (SPI), in that the Strategy aims to increase the number of companies participating in NSERC’s innovation-focused programs, sustain relationships between university researchers and industry, develop industry-relevant skills among HQP and facilitate their employment in industry, and focus research investments on national priorities. The federal government and NSERC have a necessary role in delivering the SPG program because the program supports the Council’s mandate and meets a demonstrated need. The program also fills a unique niche in Canada’s range of research funding programs, as well as in NSERC’s continuum of Research Partnerships Programs. No other research funding program has the same unique combination of features (funds research in target areas addressing national priorities, is competition-based, focuses on early-stage collaborative research, engages public and private sector partners, and does not require cash contributions from partners). The SPG program appears to function as a bridge between discovery research and collaborative research with partner organizations. A majority of researchers (99% of Strategic researchers and 80% of non-funded researchers) perceived the program to be a bridge because it provides substantial grants for in-depth, early-stage research that focuses on industry needs, without requiring cash contributions from partners. The survey results also helped shed light on how the program works as a bridge in practice. A total of 146 out of 235 researchers (62%) had maintained a link with the Strategic partner through subsequent research collaborations. Researchers who engaged in research collaborations following the Strategic project were asked what their sources of funding for the research collaboration had been.7 One in five follow-up collaborations (21%) was funded by a Collaborative Research Development (CRD) grant.
5 Government of Canada (2007). Mobilizing Science and Technology to Canada's Advantage, http://www.ic.gc.ca/eic/site/ic1.nsf/eng/h_00231.html. 6 The proportion that raised this issue can be considered high because respondents raised this issue of their own initiative–the survey did not include explicit questions on this topic. 7 Respondents could select more than one answer.
10
Evaluation of the Strategic Project Grants Program
It was more common that collaborations were funded by another Strategic grant (39% by a Strategic project grant and 12% by a Strategic Network grant) or a Discovery Grant (39%). This means that slightly more than one in ten (13%) Strategic projects led to a CRD project, almost one-quarter to a Discovery Grant (23%), another quarter to another Strategic project (23%) and less than one in fifteen (7%) to an SNG. Strategic projects also appeared to have a multi-directional impact on researchers’ general research focus. A majority of researchers reported that the projects had led to new areas of basic research (79%); increased their focus on industrially relevant applied research (73%); or increased their focus on applied research relevant to science-based government organizations (64%) to a high extent. Non-funded researchers were significantly less likely to experience these impacts.
Effectiveness Expected result #1: Foster the increased participation of Canadian-based companies and/or government organizations in academic research The SPG program engaged more than 1,400 unique partners during the evaluation reference period, according to NSERC’s administrative data. Four fifths (80%) were industry partners, with the remainder split between government organizations (9%) and other types of organization (11%) (e.g., universities, societies, associations, hospitals). Results from the researcher survey suggest that each Strategic project engaged an average of 2.2 partners, of which 2.0 partners had not previously collaborated with the researcher. Partners that had previously collaborated with the researcher seemed to be slightly over-represented in the respondent group, given that just under half of the partners surveyed (46%) had not previously collaborated with the principal investigator. While the program enabled partners to connect with new university researchers, it did not provide them with a first-time introduction to collaborative, academic research. In fact, almost all partners surveyed (85%) had previously worked with university researchers for an average of 20 years. Strategic partners had actively participated in the Strategic projects, according to partners’ and researchers’ survey responses. While partners said they most often participated through ongoing consultations (92%), as many as three quarters (74%) reported that their involvement had gone beyond consultations and reoccurring discussions. These partners had provided facilities, been involved in conducting the research and/or contributed to training of HQP. Strategic partners considered their collaborations with academic researchers to have been successful (95%), a worthwhile investment (91%) and an experience that made them more aware of the benefits of collaborating with academic researchers (89%). Strategic researchers (83%) and partners (81%) generally sustained their relationships beyond the project. Most relationships were sustained through research collaborations (62% of Strategic researchers and 54% of partners) or through participation in formal or informal networks (40% of Strategic researchers and 60% of partners). Overall, fewer long-term relationships would have been created without the SPG program, as only half of the projects that did not receive funding went ahead (see Figure 4).
Conclusions: The SPG program continues to address a need, is appropriate to the federal government and aligns with Government of Canada and NSERC priorities. Segments of the research community do, however, suggest that the program would be better able to meet Canada’s research needs if the target areas were less restrictive. The evaluation found that the program occupies a unique niche in the suite of NSERC’s Research Partnerships Programs in that it functions as a two-way bridge between discovery research and collaborative research with partner organizations.

11
Evaluation of the Strategic Project Grants Program
Selection panel members and Strategic partners were asked to provide suggestions as to what improvements NSERC could make with respect to attracting organizations to partner with university researchers on a Strategic application. The most common themes that emerged from these suggestions are summarized below. The percentages in brackets refer to the proportion of all Strategic partners who responded to the survey.
• Reduce red tape and increase the flexibility of the program parameters (7%). A number of partners called for streamlining bureaucratic requirements (e.g., simplifying the application, reducing paperwork, speeding up approval time) and allowing more flexibility in project parameters (e.g., shorter/longer project terms, application deadlines, funding start dates).
• Communicating the advantages of participating in Strategic projects to potential partners (7%). Surveyed partners suggested that NSERC arrange open houses or presentations, continue to publish success stories, and highlight the business/competitiveness benefits. Selection panel members proposed that NSERC highlight the benefits of having access to HQP, as well as the fact that the program does not require cash contributions from partners.
• Increasing awareness of Strategic Project Grants through outreach and matchmaking (5%). Selection panel members suggested that many organizations may not be aware of the SPG program. Some selection panel members and partners felt that NSERC could do more outreach to potential partner organizations and take on an active matchmaking role. For example. NSERC could identify organizations that would be well placed to take advantage of research results in specific areas. The importance of opportunities for partners and researchers to connect was also highlighted through Strategic partners’ responses to questions on the survey. When partners were asked to rate a number of factors as either inhibiting or facilitating their ability to partner with a researcher on a Strategic application, they rated pre-established relationships with university researchers and the ability to find a university partner the highest.
• Provide assistance with intellectual property (IP) issues (5%). Selection panel members observed that intellectual property negotiations can be difficult for industrial partners in terms of the length of time it takes to reach agreements with universities. University policies and/or IP agreements brokered through university technology transfer offices often restrict the company’s rights to use jointly produced research results or make it possible for competitors to access the IP generated from the collaboration. IP issues were also rated by about one third of partners (30%) as an inhibiting factor for their participation. Some partners wanted NSERC to help ensure that the IP created does not lead to onerous obligations for their organizations at the time of commercialization. NSERC could encourage universities to improve the terms for IP arising from research that might have commercial value to the company. For projects that are expected to produce IP, NSERC could also help ensure that IP ownership is clearly defined from the outset of the project by providing general guidelines to university technology transfer offices.
• Accepting applications and distributing grant funds directly to partner organizations (4%). Some partners thought that if they were able to initiate the application and receive the grant instead of the researcher, they would not have to wait to be invited to participate in the project and subsequently co-develop the application.
• Increased participation of partners (4%). Some partners suggested that more interaction with researchers and increased involvement of the supporting organizations in the projects would make the partnership more attractive to them. Some indicated that NSERC should help ensure that partners are more than a name on the application.
• Increasing the success rate (2%). A few surveyed partners thought that funding a higher proportion of Strategic applications would attract more organizations.
Conclusions: The program does increase the participation of Canadian-based companies and/or
12
Evaluation of the Strategic Project Grants Program
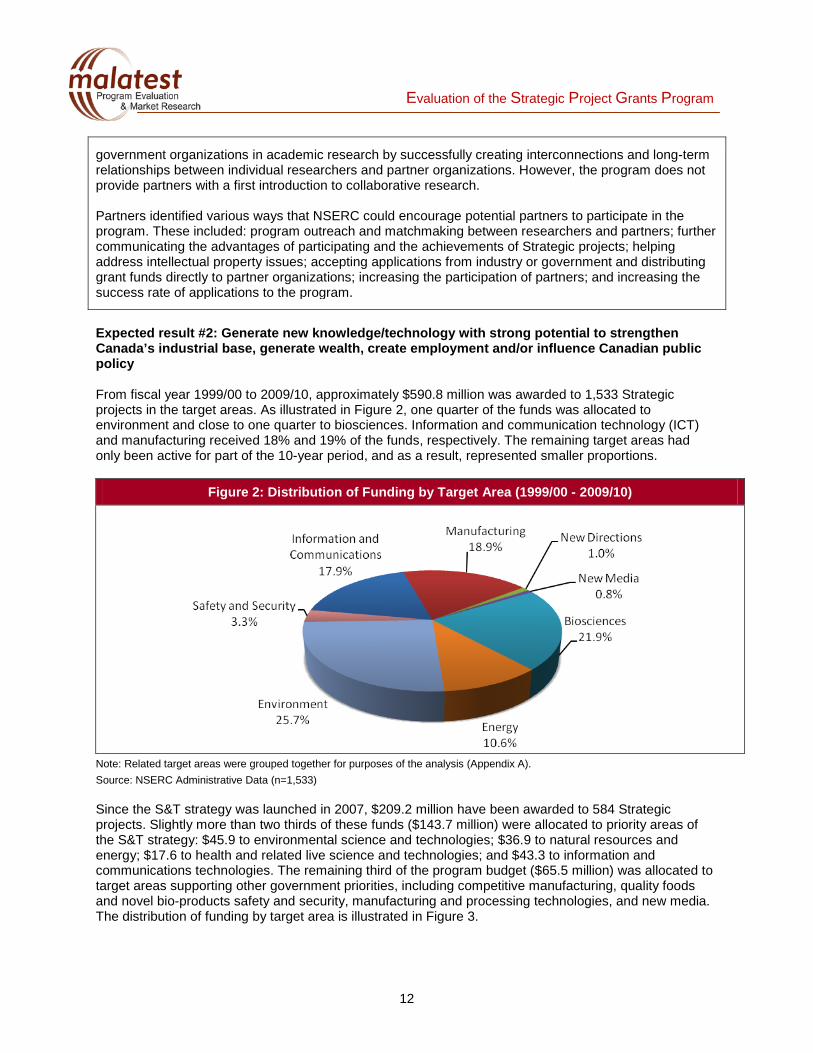
Expected result #2: Generate new knowledge/technology with strong potential to strengthen Canada’s industrial base, generate wealth, create employment and/or influence Canadian public policy From fiscal year 1999/00 to 2009/10, approximately $590.8 million was awarded to 1,533 Strategic projects in the target areas. As illustrated in Figure 2, one quarter of the funds was allocated to environment and close to one quarter to biosciences. Information and communication technology (ICT) and manufacturing received 18% and 19% of the funds, respectively. The remaining target areas had only been active for part of the 10-year period, and as a result, represented smaller proportions.
Figure 2: Distribution of Funding by Target Area (1999/00 - 2009/10)
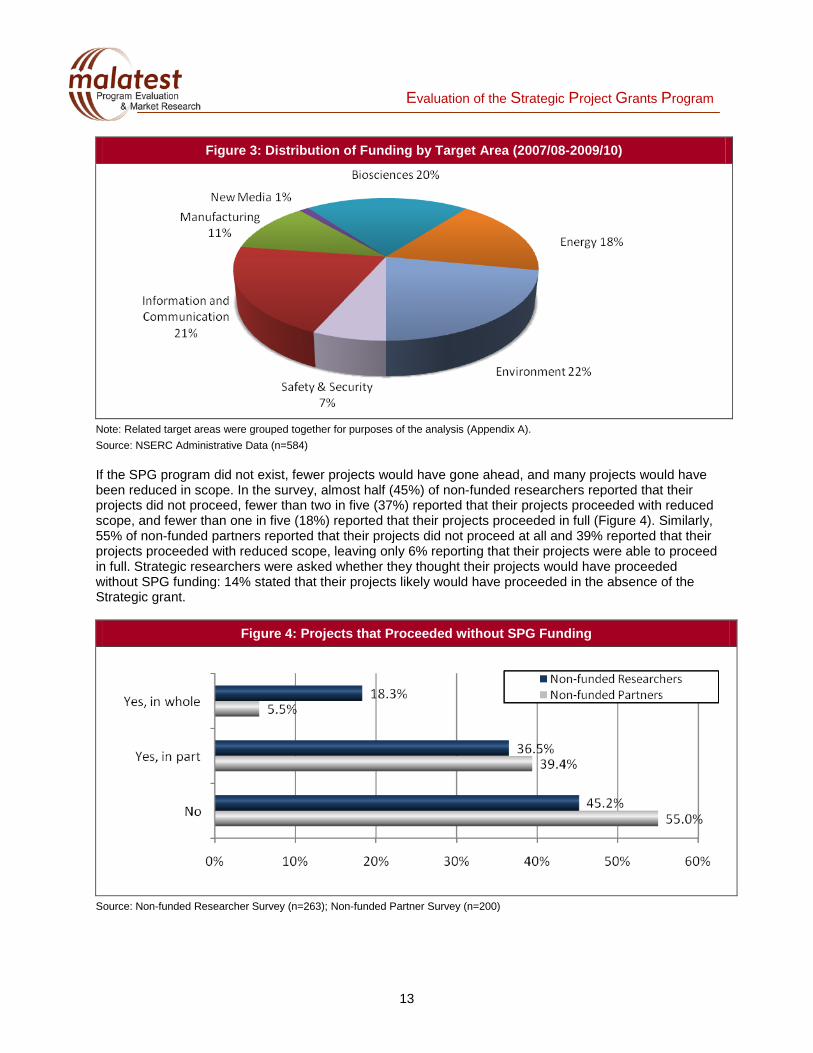
Note: Related target areas were grouped together for purposes of the analysis (Appendix A). Source: NSERC Administrative Data (n=1,533) Since the S&T strategy was launched in 2007, $209.2 million have been awarded to 584 Strategic projects. Slightly more than two thirds of these funds ($143.7 million) were allocated to priority areas of the S&T strategy: $45.9 to environmental science and technologies; $36.9 to natural resources and energy; $17.6 to health and related live science and technologies; and $43.3 to information and communications technologies. The remaining third of the program budget ($65.5 million) was allocated to target areas supporting other government priorities, including competitive manufacturing, quality foods and novel bio-products safety and security, manufacturing and processing technologies, and new media. The distribution of funding by target area is illustrated in Figure 3.
government organizations in academic research by successfully creating interconnections and long-term relationships between individual researchers and partner organizations. However, the program does not provide partners with a first introduction to collaborative research. Partners identified various ways that NSERC could encourage potential partners to participate in the program. These included: program outreach and matchmaking between researchers and partners; further communicating the advantages of participating and the achievements of Strategic projects; helping address intellectual property issues; accepting applications from industry or government and distributing grant funds directly to partner organizations; increasing the participation of partners; and increasing the success rate of applications to the program.
13
Evaluation of the Strategic Project Grants Program
Figure 3: Distribution of Funding by Target Area (2007/08-2009/10)
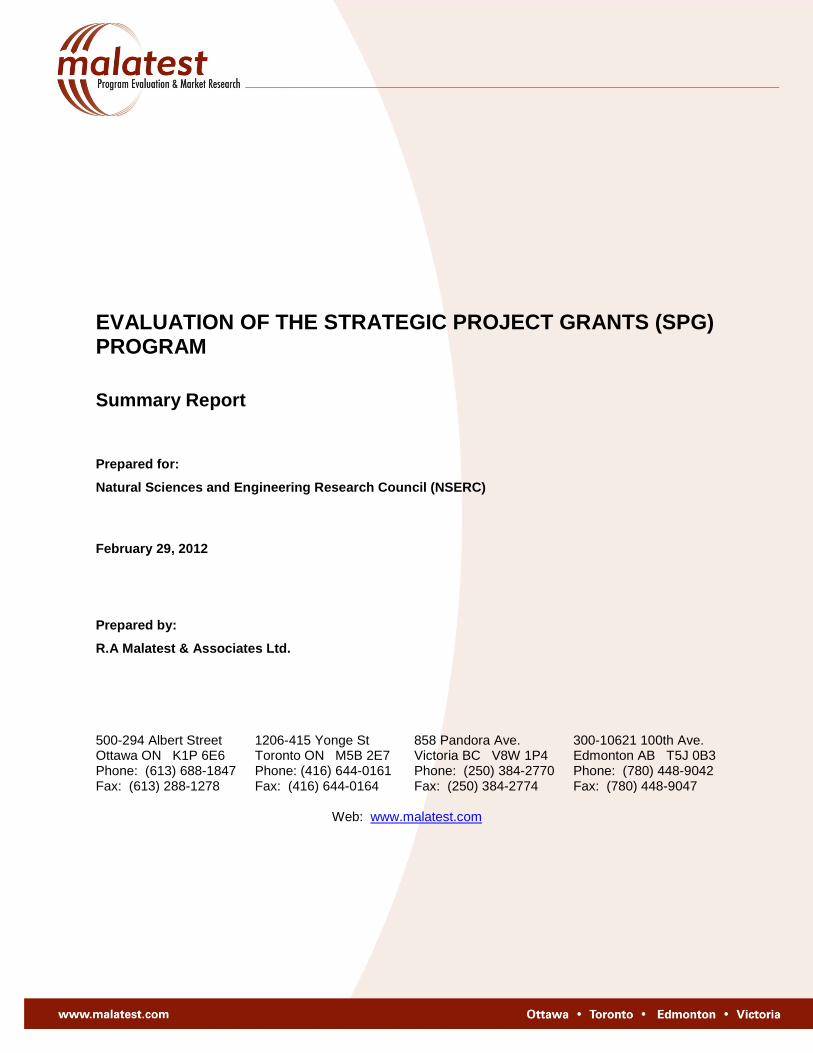
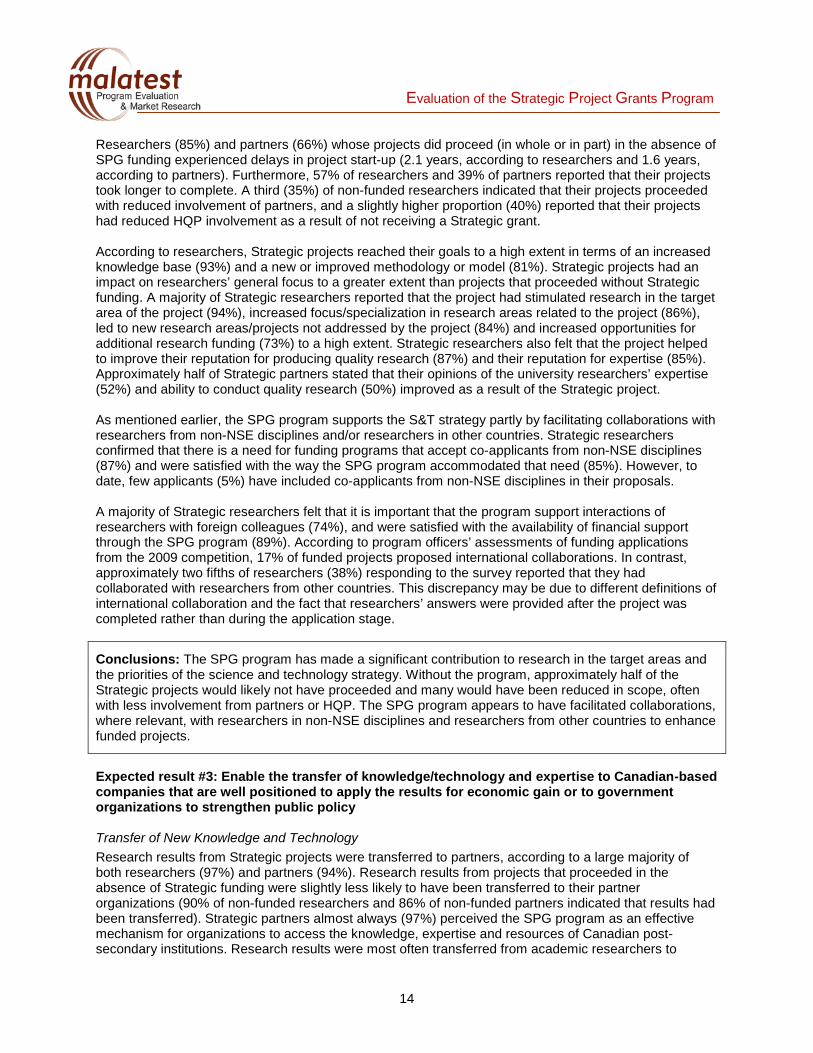
Note: Related target areas were grouped together for purposes of the analysis (Appendix A). Source: NSERC Administrative Data (n=584) If the SPG program did not exist, fewer projects would have gone ahead, and many projects would have been reduced in scope. In the survey, almost half (45%) of non-funded researchers reported that their projects did not proceed, fewer than two in five (37%) reported that their projects proceeded with reduced scope, and fewer than one in five (18%) reported that their projects proceeded in full (Figure 4). Similarly, 55% of non-funded partners reported that their projects did not proceed at all and 39% reported that their projects proceeded with reduced scope, leaving only 6% reporting that their projects were able to proceed in full. Strategic researchers were asked whether they thought their projects would have proceeded without SPG funding: 14% stated that their projects likely would have proceeded in the absence of the Strategic grant.
Figure 4: Projects that Proceeded without SPG Funding
Source: Non-funded Researcher Survey (n=263); Non-funded Partner Survey (n=200)
14
Evaluation of the Strategic Project Grants Program
Researchers (85%) and partners (66%) whose projects did proceed (in whole or in part) in the absence of SPG funding experienced delays in project start-up (2.1 years, according to researchers and 1.6 years, according to partners). Furthermore, 57% of researchers and 39% of partners reported that their projects took longer to complete. A third (35%) of non-funded researchers indicated that their projects proceeded with reduced involvement of partners, and a slightly higher proportion (40%) reported that their projects had reduced HQP involvement as a result of not receiving a Strategic grant. According to researchers, Strategic projects reached their goals to a high extent in terms of an increased knowledge base (93%) and a new or improved methodology or model (81%). Strategic projects had an impact on researchers’ general focus to a greater extent than projects that proceeded without Strategic funding. A majority of Strategic researchers reported that the project had stimulated research in the target area of the project (94%), increased focus/specialization in research areas related to the project (86%), led to new research areas/projects not addressed by the project (84%) and increased opportunities for additional research funding (73%) to a high extent. Strategic researchers also felt that the project helped to improve their reputation for producing quality research (87%) and their reputation for expertise (85%). Approximately half of Strategic partners stated that their opinions of the university researchers’ expertise (52%) and ability to conduct quality research (50%) improved as a result of the Strategic project. As mentioned earlier, the SPG program supports the S&T strategy partly by facilitating collaborations with researchers from non-NSE disciplines and/or researchers in other countries. Strategic researchers confirmed that there is a need for funding programs that accept co-applicants from non-NSE disciplines (87%) and were satisfied with the way the SPG program accommodated that need (85%). However, to date, few applicants (5%) have included co-applicants from non-NSE disciplines in their proposals. A majority of Strategic researchers felt that it is important that the program support interactions of researchers with foreign colleagues (74%), and were satisfied with the availability of financial support through the SPG program (89%). According to program officers’ assessments of funding applications from the 2009 competition, 17% of funded projects proposed international collaborations. In contrast, approximately two fifths of researchers (38%) responding to the survey reported that they had collaborated with researchers from other countries. This discrepancy may be due to different definitions of international collaboration and the fact that researchers’ answers were provided after the project was completed rather than during the application stage.
Conclusions: The SPG program has made a significant contribution to research in the target areas and the priorities of the science and technology strategy. Without the program, approximately half of the Strategic projects would likely not have proceeded and many would have been reduced in scope, often with less involvement from partners or HQP. The SPG program appears to have facilitated collaborations, where relevant, with researchers in non-NSE disciplines and researchers from other countries to enhance funded projects.
Expected result #3: Enable the transfer of knowledge/technology and expertise to Canadian-based companies that are well positioned to apply the results for economic gain or to government organizations to strengthen public policy Transfer of New Knowledge and Technology Research results from Strategic projects were transferred to partners, according to a large majority of both researchers (97%) and partners (94%). Research results from projects that proceeded in the absence of Strategic funding were slightly less likely to have been transferred to their partner organizations (90% of non-funded researchers and 86% of non-funded partners indicated that results had been transferred). Strategic partners almost always (97%) perceived the SPG program as an effective mechanism for organizations to access the knowledge, expertise and resources of Canadian post-secondary institutions. Research results were most often transferred from academic researchers to

15
Evaluation of the Strategic Project Grants Program
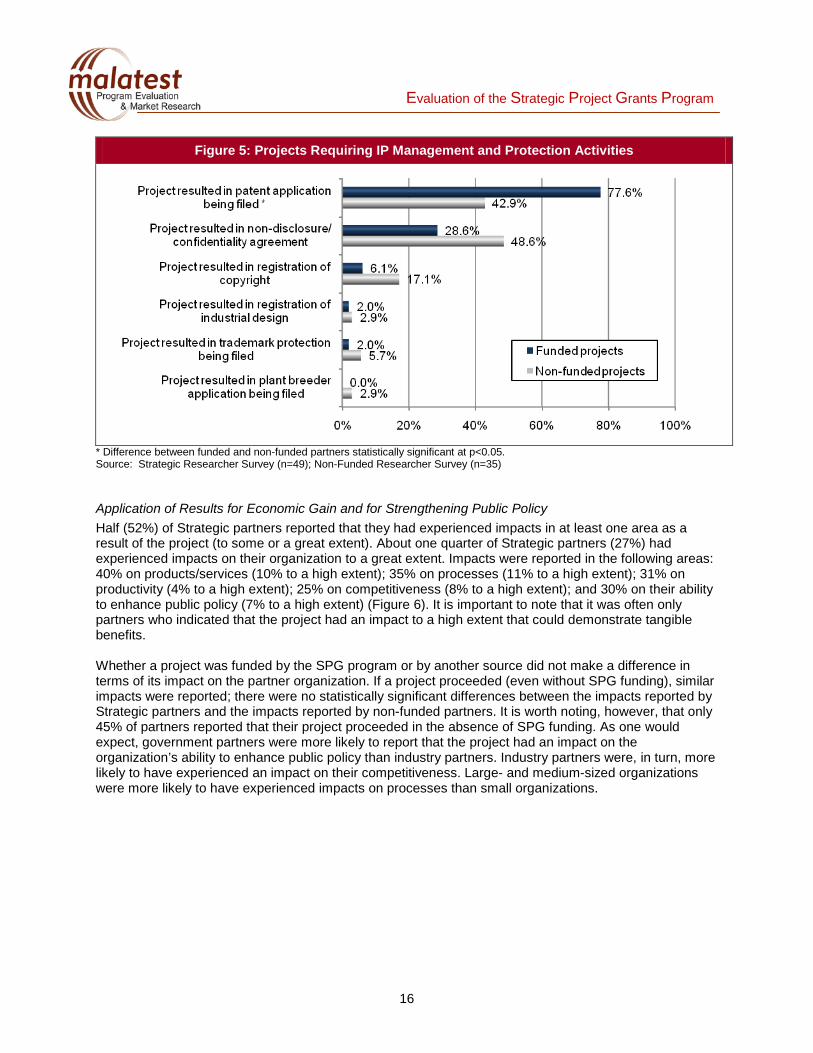
partners via informal discussions and correspondence. Formal methods of knowledge transfer, such as publications, reports and meetings, were also cited by a majority of researchers and partners. Other modes of transfer, such as through direct partner involvement in the project, hiring of HQP who had participated in the project, joint seminars or workshops, or co-authoring papers and presentations, were relatively common (reported by between a third and half of researchers and partners). Strategic projects were also more likely than non-funded projects to result in publications. Funded projects yielded an average of 8.7 refereed journal articles, 12.5 conference presentations/posters and 2.3 non-refereed journal articles. Non-funded projects that proceeded yielded a significantly lower number of publications: an average of 2.5 refereed journal articles, 3.9 conference presentations/posters and 0.9 non-refereed journal articles. Use of Research Results At the time the survey was administered, more than half (58%) of partners had already used research results from the Strategic projects, and one in ten (10%) planned to use results within the next year or two. Government partners (68%) were more likely than industry partners (51%) to report having used the results. Larger companies of 500 or more employees were more likely to have used results (63%) than mid-sized (58%) or small companies with fewer than 100 employees (46%). There was no difference between non-funded partners and Strategic partners in using the research results. More than a third (38%) of all Strategic partners had used the results before the project ended. In this context, it is important to keep in mind that non-use of research results may sometimes be considered an application, as the results could be used for informed decision-making about processes or products as well. The research findings may contribute to a partner deciding to pursue a different path. The case examples provided some insight into why research results were sometimes not used despite successful completion of the project. Some research results were too early-stage, some companies lacked funds to apply and commercialize results and others decided to change their market focus. Protection of Intellectual Property Intellectual property (IP) management or protection activities undertaken by researchers are an indication that research results were considered to have commercial potential. Approximately one in four researchers (22% of funded and 27% of non-funded) indicated that their project had produced IP that was protected. IP protection was not required in the remaining projects. This finding is consistent with the nature of early-stage and public policy oriented research, which is generally less likely to produce IP that needs to be protected. The completion year of the project did not influence whether or not projects had produced IP. Figure 5 compares the type of IP management activities undertaken by funded and non-funded researchers whose projects produced IP requiring protection. Strategic projects requiring IP management or protection were much more likely to result in patent applications being filed (78%) than non-funded projects (43%). Non-funded projects, on the other hand, were more likely to result in the execution of non-disclosure or confidentiality agreements and in the registration of copyright for software and databases. For all other IP protection/management activities, there are no significant differences between funded and non-funded projects. It should be noted that the number of researchers whose responses are summarized in the chart is quite small (n=49 Strategic researchers and n=35 non-funded researchers), which made the statistical comparisons between funded and non-funded researchers less reliable than if there had been a higher number of respondents.
16
Evaluation of the Strategic Project Grants Program
Figure 5: Projects Requiring IP Management and Protection Activities
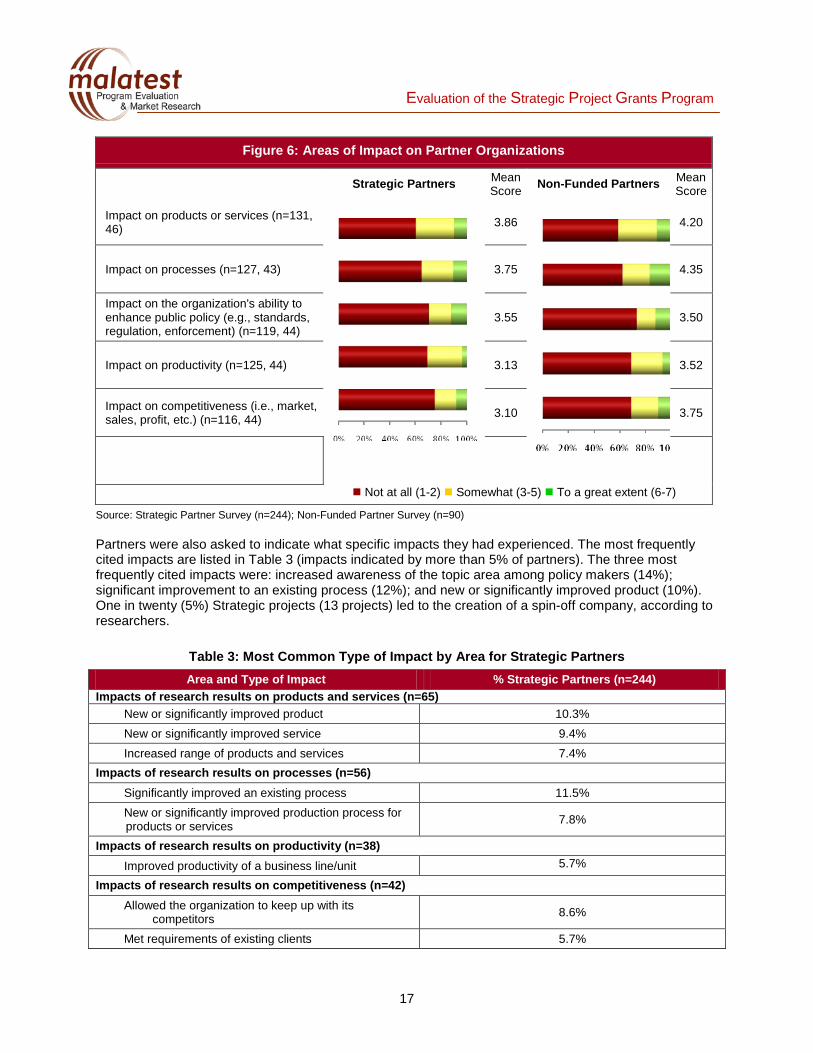
* Difference between funded and non-funded partners statistically significant at p<0.05. Source: Strategic Researcher Survey (n=49); Non-Funded Researcher Survey (n=35) Application of Results for Economic Gain and for Strengthening Public Policy Half (52%) of Strategic partners reported that they had experienced impacts in at least one area as a result of the project (to some or a great extent). About one quarter of Strategic partners (27%) had experienced impacts on their organization to a great extent. Impacts were reported in the following areas: 40% on products/services (10% to a high extent); 35% on processes (11% to a high extent); 31% on productivity (4% to a high extent); 25% on competitiveness (8% to a high extent); and 30% on their ability to enhance public policy (7% to a high extent) (Figure 6). It is important to note that it was often only partners who indicated that the project had an impact to a high extent that could demonstrate tangible benefits. Whether a project was funded by the SPG program or by another source did not make a difference in terms of its impact on the partner organization. If a project proceeded (even without SPG funding), similar impacts were reported; there were no statistically significant differences between the impacts reported by Strategic partners and the impacts reported by non-funded partners. It is worth noting, however, that only 45% of partners reported that their project proceeded in the absence of SPG funding. As one would expect, government partners were more likely to report that the project had an impact on the organization’s ability to enhance public policy than industry partners. Industry partners were, in turn, more likely to have experienced an impact on their competitiveness. Large- and medium-sized organizations were more likely to have experienced impacts on processes than small organizations.
17
Evaluation of the Strategic Project Grants Program
Figure 6: Areas of Impact on Partner Organizations
Strategic Partners Mean Score Non-Funded Partners Mean
Score
Impact on products or services (n=131, 46)
3.86
4.20
Impact on processes (n=127, 43) 3.75 4.35
Impact on the organization's ability to enhance public policy (e.g., standards, regulation, enforcement) (n=119, 44)
3.55 3.50
Impact on productivity (n=125, 44) 3.13 3.52
Impact on competitiveness (i.e., market, sales, profit, etc.) (n=116, 44) 3.10 3.75
Not at all (1-2) Somewhat (3-5) To a great extent (6-7)
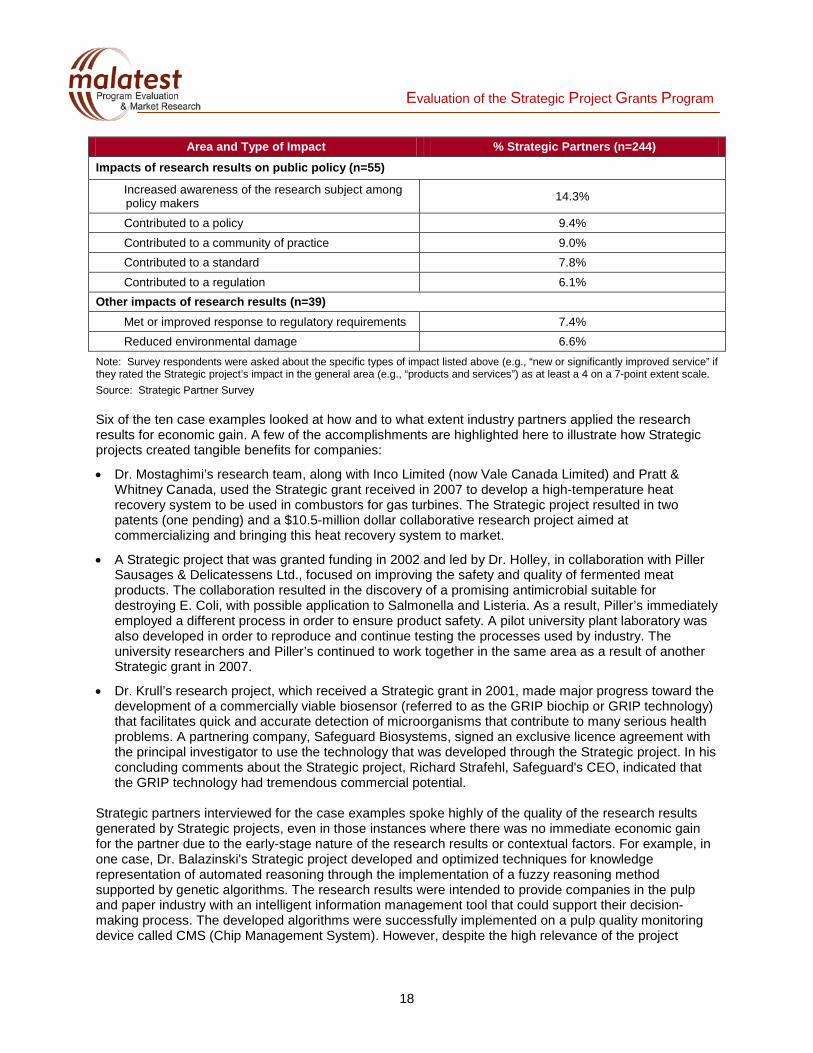
Source: Strategic Partner Survey (n=244); Non-Funded Partner Survey (n=90) Partners were also asked to indicate what specific impacts they had experienced. The most frequently cited impacts are listed in Table 3 (impacts indicated by more than 5% of partners). The three most frequently cited impacts were: increased awareness of the topic area among policy makers (14%); significant improvement to an existing process (12%); and new or significantly improved product (10%). One in twenty (5%) Strategic projects (13 projects) led to the creation of a spin-off company, according to researchers.
Table 3: Most Common Type of Impact by Area for Strategic Partners Area and Type of Impact % Strategic Partners (n=244)
Impacts of research results on products and services (n=65) New or significantly improved product 10.3% New or significantly improved service 9.4% Increased range of products and services 7.4%
Impacts of research results on processes (n=56) Significantly improved an existing process 11.5% New or significantly improved production process for products or services 7.8%
Impacts of research results on productivity (n=38) Improved productivity of a business line/unit 5.7%
Impacts of research results on competitiveness (n=42) Allowed the organization to keep up with its
competitors 8.6%
Met requirements of existing clients 5.7%
18
Evaluation of the Strategic Project Grants Program
Area and Type of Impact % Strategic Partners (n=244)
Impacts of research results on public policy (n=55)
Increased awareness of the research subject among policy makers 14.3%
Contributed to a policy 9.4% Contributed to a community of practice 9.0% Contributed to a standard 7.8% Contributed to a regulation 6.1%
Other impacts of research results (n=39) Met or improved response to regulatory requirements 7.4% Reduced environmental damage 6.6%
Note: Survey respondents were asked about the specific types of impact listed above (e.g., “new or significantly improved service” if they rated the Strategic project’s impact in the general area (e.g., “products and services”) as at least a 4 on a 7-point extent scale. Source: Strategic Partner Survey Six of the ten case examples looked at how and to what extent industry partners applied the research results for economic gain. A few of the accomplishments are highlighted here to illustrate how Strategic projects created tangible benefits for companies:
• Dr. Mostaghimi’s research team, along with Inco Limited (now Vale Canada Limited) and Pratt & Whitney Canada, used the Strategic grant received in 2007 to develop a high-temperature heat recovery system to be used in combustors for gas turbines. The Strategic project resulted in two patents (one pending) and a $10.5-million dollar collaborative research project aimed at commercializing and bringing this heat recovery system to market.
• A Strategic project that was granted funding in 2002 and led by Dr. Holley, in collaboration with Piller Sausages & Delicatessens Ltd., focused on improving the safety and quality of fermented meat products. The collaboration resulted in the discovery of a promising antimicrobial suitable for destroying E. Coli, with possible application to Salmonella and Listeria. As a result, Piller’s immediately employed a different process in order to ensure product safety. A pilot university plant laboratory was also developed in order to reproduce and continue testing the processes used by industry. The university researchers and Piller’s continued to work together in the same area as a result of another Strategic grant in 2007.
• Dr. Krull’s research project, which received a Strategic grant in 2001, made major progress toward the development of a commercially viable biosensor (referred to as the GRIP biochip or GRIP technology) that facilitates quick and accurate detection of microorganisms that contribute to many serious health problems. A partnering company, Safeguard Biosystems, signed an exclusive licence agreement with the principal investigator to use the technology that was developed through the Strategic project. In his concluding comments about the Strategic project, Richard Strafehl, Safeguard's CEO, indicated that the GRIP technology had tremendous commercial potential.
Strategic partners interviewed for the case examples spoke highly of the quality of the research results generated by Strategic projects, even in those instances where there was no immediate economic gain for the partner due to the early-stage nature of the research results or contextual factors. For example, in one case, Dr. Balazinski's Strategic project developed and optimized techniques for knowledge representation of automated reasoning through the implementation of a fuzzy reasoning method supported by genetic algorithms. The research results were intended to provide companies in the pulp and paper industry with an intelligent information management tool that could support their decision-making process. The developed algorithms were successfully implemented on a pulp quality monitoring device called CMS (Chip Management System). However, despite the high relevance of the project

19
Evaluation of the Strategic Project Grants Program
findings, the research results were not applied by partners due to a significant downturn in Canada’s pulp and paper industry. This economic context reduced the marketability of the technology within this sector. According to the Centre for Industrial Research of Quebec, should the pulp and paper industry experience an economic recovery, there would be significant interest in commercialization of the system. Four of the case examples looked at how Strategic government partners have applied the research results to strengthen public policy or achieve other social or environmental benefits. Two of these Strategic projects provided decision makers with previously unavailable knowledge, data, and tools that were (or will be) used in policy formation and decision making at a high and practical level. The knowledge generated by Dr. Smol's investigation into acidification and eutrophication in Maritime lakes was utilized by Environment Canada and Parks Canada to address gaps in their periodic acid rain assessments. The assessments are designed to inform environmental policies in relation to the aquatic effects of acid rain. Research scientist Dean Jeffries explained the Strategic project's contribution to environmental assessments as follows:
A major component of my work over the last 20 years has been to produce (as senior editor) national assessments of acid rain aquatics effects. There is a new [assessment] produced every seven years. All of the past assessments have called for research to quantify and/or simulate both the historical water quality of eastern Canadian lakes and the pathway they took to arrive at their present, acidified state [...] In many ways, this Strategic Project is a direct response to knowledge gaps identified in the acid rain assessments. The latest assessment is just now being finalized and both Dr. Smol and Dr. Dillon have provided data, data analyses, and written contributions for it. I expect that completion of this Strategic project will make them even larger contributors to the next assessment.
The data that was produced was also used by Kejimkujik National Park and the Cape Breton Highland National Park (part of Canadian Heritage), as well as Nova Scotia Agriculture and Fisheries, to assist with monitoring and managing their ecosystems. The findings in relation to long-term trends in trout habitat had a direct influence on Nova Scotia Agriculture and Fisheries’ management of recreational fisheries. Similarly, Dr. Blais' Strategic project, which assessed and predicted the impact of contaminants transported by migratory seabirds, also informed environmental assessments and contaminant monitoring and management programs within Arctic ecosystems. Nova Scotia Agriculture and Fisheries is planning to utilize Dr. Smol's project results in future initiatives aimed at protecting and enhancing fish habitat across the province. Environment Canada, also a project partner, is planning to use the research results to develop an official national policy on contaminant delivery in the Arctic. Sometimes the nature of research findings precludes their being applied as initially planned. For example, Dr. Kibenge’s Strategic 2002-funded project was aimed at developing a vaccine for an infectious salmon anaemia virus, but determined that the virus had a number of variations depending on geographical location. Without global application, the vaccine had limited commercial potential and was therefore not brought to market by the partnering company. There were also instances where research results from Strategic projects were applied unexpectedly. Dr. Bénié’s project, which received Strategic funding in 1999, developed an intelligent natural resources and environmental monitoring mapping system using high resolution images. With encouragement from the university’s business liaison office, the university team decided to create a spin-off company to further develop the system and commercialize the results. The company, GéoImage, now specializes in geomatic research and development, as well as the development of tools to assist in the governance of natural resources and the physical and human environment. Many different factors contributed to project success in generating benefits to partners. Successful application of research results was, in all cases, preceded by a strong focus on a research problem of great importance to the partner organization. An open and productive relationship between the university researchers and the partners appears to have been another key facilitator. Partners and researchers
20
Evaluation of the Strategic Project Grants Program
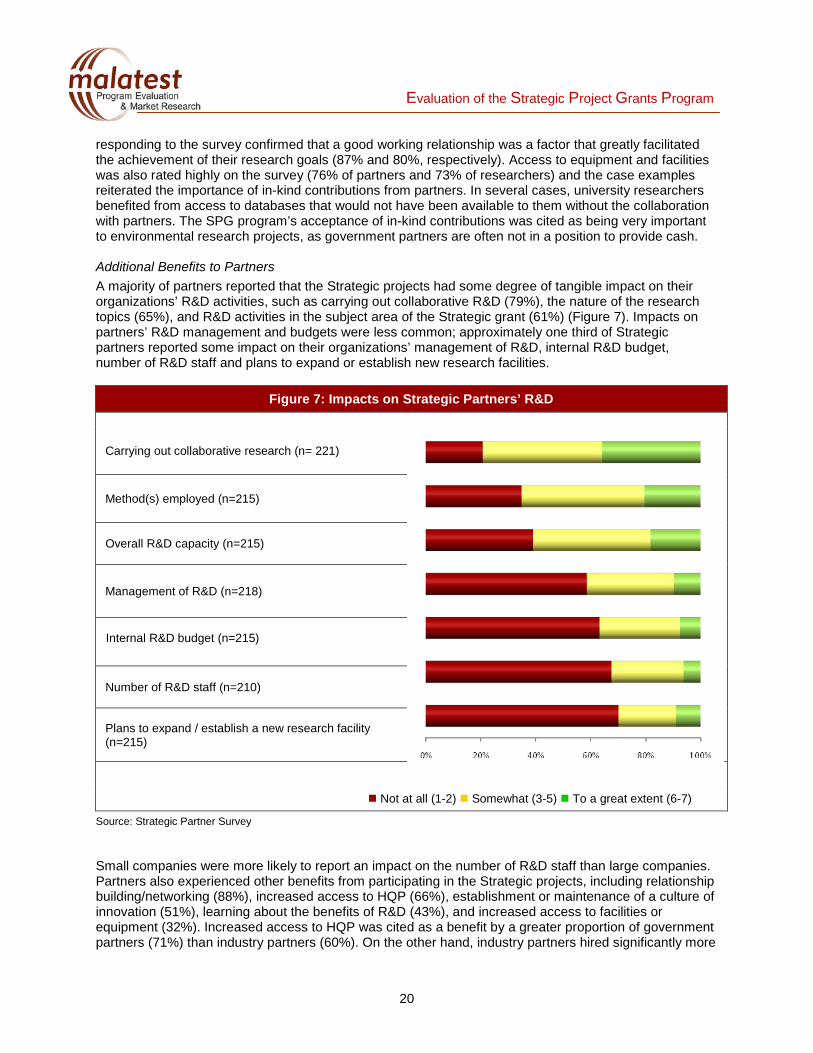
responding to the survey confirmed that a good working relationship was a factor that greatly facilitated the achievement of their research goals (87% and 80%, respectively). Access to equipment and facilities was also rated highly on the survey (76% of partners and 73% of researchers) and the case examples reiterated the importance of in-kind contributions from partners. In several cases, university researchers benefited from access to databases that would not have been available to them without the collaboration with partners. The SPG program’s acceptance of in-kind contributions was cited as being very important to environmental research projects, as government partners are often not in a position to provide cash. Additional Benefits to Partners A majority of partners reported that the Strategic projects had some degree of tangible impact on their organizations’ R&D activities, such as carrying out collaborative R&D (79%), the nature of the research topics (65%), and R&D activities in the subject area of the Strategic grant (61%) (Figure 7). Impacts on partners’ R&D management and budgets were less common; approximately one third of Strategic partners reported some impact on their organizations’ management of R&D, internal R&D budget, number of R&D staff and plans to expand or establish new research facilities.
Figure 7: Impacts on Strategic Partners’ R&D
Carrying out collaborative research (n= 221)
Method(s) employed (n=215)
Overall R&D capacity (n=215)
Management of R&D (n=218)
Internal R&D budget (n=215)
Number of R&D staff (n=210)
Plans to expand / establish a new research facility (n=215)
Not at all (1-2) Somewhat (3-5) To a great extent (6-7)
Source: Strategic Partner Survey Small companies were more likely to report an impact on the number of R&D staff than large companies. Partners also experienced other benefits from participating in the Strategic projects, including relationship building/networking (88%), increased access to HQP (66%), establishment or maintenance of a culture of innovation (51%), learning about the benefits of R&D (43%), and increased access to facilities or equipment (32%). Increased access to HQP was cited as a benefit by a greater proportion of government partners (71%) than industry partners (60%). On the other hand, industry partners hired significantly more
21
Evaluation of the Strategic Project Grants Program
HQP (2.0) than did government partners (1.2). The organization’s size did not seem to influence the number of HQP hired. One of the industry partners interviewed explained the value of networking with HQP this way:
[T]hese young students are very interesting, and you have to think long term. You never know where they might go in their career; some may go to [a federal agency] later on or play some other important role. It’s important to have these contacts.
Conclusions: Research results from Strategic projects are almost always transferred to partners, and Strategic projects are more successful in transferring research results than non-funded projects. Strategic projects generated almost twice the number of publications and conference presentations and produced a greater number of patent applications than non-funded projects. More than half of partners (63%) had already used the research results at the time of the evaluation, and one in ten partners planned to use the research results within the next year or two. More than half had applied the results for economic gain, to strengthen public policy or to achieve other social or environmental benefits. In addition, Strategic partners experienced a range of benefits beyond the direct application of the research results.
Expected result #4: Increase the number of highly qualified personnel in the areas targeted by this program Researchers reported that about twice as many HQP were trained through Strategic projects than through projects that proceeded without SPG funding. On average, 15 HQP received at least some training on each Strategic project. Of these, 3.5 were undergraduate students, 3.5 were master’s students, 3.1 were PhD students, 2.0 were postdoctoral fellows and 2.3 were research staff. Strategic projects also resulted in a higher number of master’s (2.9) and PhD theses (2.2) than non-funded projects (2.0 master’s and 1.2 PhD theses). On average, each HQP spent 1.39 years participating in a Strategic project. PhD. students spent the most time (2.14 years) and undergraduate students spent the least (0.53 years). The Learning Environment and Skills Gained Strategic projects had a sustainable impact on researchers’ teaching activities in most cases. It was most common that Strategic projects improved researchers’ teaching practices through use of real world examples (72%) and development of new content for existing courses (67%). Researchers also reported that the Strategic project had provided new equipment/material (35%), brought guest lecturers from partners (26%), and contributed to the development of new courses (14%). Only 11% of researchers indicated that the Strategic projects did not have an impact on teaching. The interactions between HQP and others involved in the Strategic project added value to the HQP training environment and helped most HQP to gain professional skills (84%), as well as skills and experience relevant to industry (79%) and science-based government organizations (80%) (Figure 8).

22
Evaluation of the Strategic Project Grants Program
Figure 8: Impact on HQP Expertise and Skills
I gained additional skills (e.g., professional or management skills) (n=418)
I gained expertise and technical skills relevant to science-based government organizations (n=400)
I gained expertise and technical skills relevant to industry (n=408)
Disagree (1-3) Neither agree nor disagree (4) Agree (5-7)
Source: HQP Survey (n=400-418) Interaction between HQP and individuals from partner organizations appeared to have been an important component of the training environment. The majority of HQP (85%) had an opportunity to interact with one or more partners. Similarly, 91% of Strategic partners reported facilitating training and/or professional experiences for HQP within their organization. In most cases, HQP interacted with partner organizations by presenting results (69%) and discussing the project to obtain input (67%). Many HQP also attended regular project meetings with a partner (47%) and submitted written material/results to individuals from the partner organization for review (44%). It was less common for HQP to work in the partner’s facilities (22%) or receive thesis supervision from a partner (15%). The survey results and case examples also revealed that collaborations with researchers and HQP from other non-NSE disciplines and other countries added value to the training environment. These collaborations offered opportunities to engage in problem-solving across multidisciplinary boundaries and brought new perspectives on the research from across the world. One HQP expressed the value added in the following way:
During the course of your own research you often come up against problems that are out of your field of expertise. While you try to broaden your knowledge in these cases, it is extremely beneficial to be able to talk with people who are more experienced in these areas.
Employment following the Strategic Project The SPG program contributed to the career paths and employment of HQP in their fields of study. Six in ten HQP (61%) reported that they were offered jobs or contracts as a result of the Strategic project, and almost all partners (90%) who had employed former HQP considered them to be more job-ready than other hires as a result of their participation. Almost all HQP who had been involved in Strategic projects (97%) were either working or continuing their studies. The employment rate was high, with 79% of those surveyed indicating that they were employed either full time (75%) or part time (4%) at the time of the survey (Figure 9). The unemployment rate among HQP who had been involved in Strategic projects (2.6%) is consistent with the unemployment rate among those trained in the NSE in the general population (3.6%) in 2010.8
8 Statistics Canada (2010). Labour Force Survey.
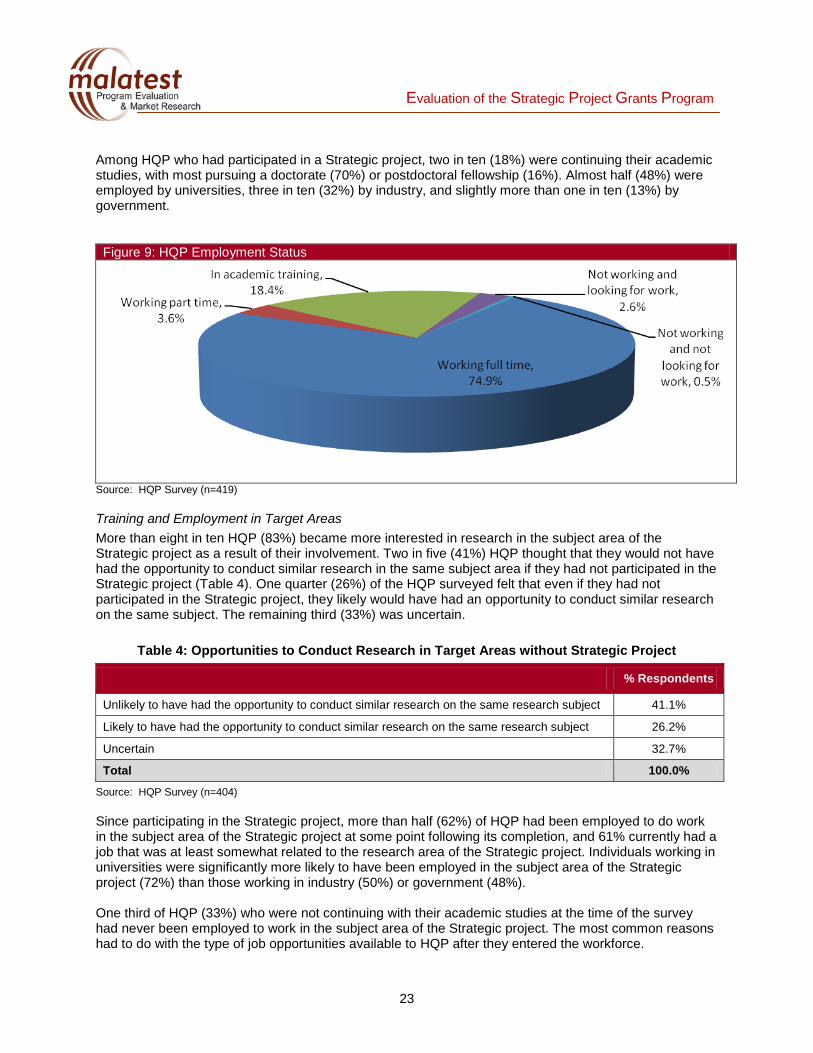
23
Evaluation of the Strategic Project Grants Program
Among HQP who had participated in a Strategic project, two in ten (18%) were continuing their academic studies, with most pursuing a doctorate (70%) or postdoctoral fellowship (16%). Almost half (48%) were employed by universities, three in ten (32%) by industry, and slightly more than one in ten (13%) by government. Figure 9: HQP Employment Status
Source: HQP Survey (n=419) Training and Employment in Target Areas More than eight in ten HQP (83%) became more interested in research in the subject area of the Strategic project as a result of their involvement. Two in five (41%) HQP thought that they would not have had the opportunity to conduct similar research in the same subject area if they had not participated in the Strategic project (Table 4). One quarter (26%) of the HQP surveyed felt that even if they had not participated in the Strategic project, they likely would have had an opportunity to conduct similar research on the same subject. The remaining third (33%) was uncertain.
Table 4: Opportunities to Conduct Research in Target Areas without Strategic Project
% Respondents
Unlikely to have had the opportunity to conduct similar research on the same research subject 41.1%
Likely to have had the opportunity to conduct similar research on the same research subject 26.2%
Uncertain 32.7%
Total 100.0%
Source: HQP Survey (n=404) Since participating in the Strategic project, more than half (62%) of HQP had been employed to do work in the subject area of the Strategic project at some point following its completion, and 61% currently had a job that was at least somewhat related to the research area of the Strategic project. Individuals working in universities were significantly more likely to have been employed in the subject area of the Strategic project (72%) than those working in industry (50%) or government (48%). One third of HQP (33%) who were not continuing with their academic studies at the time of the survey had never been employed to work in the subject area of the Strategic project. The most common reasons had to do with the type of job opportunities available to HQP after they entered the workforce.
24
Evaluation of the Strategic Project Grants Program
The majority (71%) of those who had not been employed to work in the subject area of the Strategic project indicated that they had received a work opportunity in another area, and one quarter (24%) said that they could not find work in the subject area. Many HQP also referred to the fact that they had continued their academic training instead, either in the subject area of the Strategic project (7%) or in another subject area (21%).
Conclusions: The incremental impact of the SPG program on creating training opportunities for HQP and enhancing their training is substantial, taking into account the high proportion of non-funded projects that did not proceed and that the fact that those that did proceed often did so with reduced involvement of HQP. Strategic projects trained twice as many HQP as non-funded projects and produced twice as many theses as non-funded projects that proceeded. The SPG program contributed to an increase in the number of HQP employed in target areas by giving some of the HQP most involved in Strategic projects a unique opportunity to conduct research in national research priority areas, by increasing their interest in the subject area, and by helping them gain relevant skills and the experience necessary for employment in those areas. Strategic projects also had a sustainable impact on researchers’ teaching activities in most cases.
Unexpected Outcomes There did not appear to be any unintended outcomes, positive or negative, resulting from the SPG program. Efficiency and Economy A program is efficient when it produces outputs at a relatively low cost. This means that the SPG program is efficient if the cost of awarding and administering the grants is low, and these activities are carried out in an effective manner. A research funding program demonstrates economy if the program is efficiently delivered and the total resources used are reasonable in relation to the outcomes generated. Efficiency One way to assess the efficiency of the SPG program is the ratio of its administrative costs to total grant funds awarded (the operating ratio). An estimate of administrative costs for the SPG program was only available for nine (2001/02 to 2009/10) of the eleven fiscal years under review. Overall for this period, the operating ratio was 5.2% (Table 5). The ratio was slightly lower than the ratio for the RPP division (5.7%) and slightly higher than the ratio for NSERC as a whole (4.4%) for the same time period. Administrative costs for the program include both the direct and indirect costs of administering it. Direct costs comprise salary9 and non-salary costs, which are related primarily to the adjudication of the award. Non-salary costs also include a share of the costs related to corporate representation and general administration for the RPP directorate. Other direct costs associated with administering the program, such as post-award management (which is a centralized function carried out by the Finance division) and indirect costs, such as common administrative services for NSERC (e.g., finance, human resources and IT) cannot be provided at the program level. These other direct and indirect costs have also been included in the total calculation of costs and were estimated using the ratio of total SPG grant funds to total NSERC grant funds. It should be noted that the estimation of administrative costs only takes NSERC’s costs into account. For example, the time spent by selection panel members on the competition process is not considered.
9 Salary estimates exclude employee benefits (EBP).

25
Evaluation of the Strategic Project Grants Program
Table 5: Estimated Costs for the SPG Program (2001/02-2009/10)
2001-02 2002-03 2003-04 2004-05 2005-06 2006-07 2007-08 2008-2009 2009-2010 Direct salary $638,016 $866,200 $922,480 $941,686 $976,285 $984,586 $1,304,407 $1,635,201 $1,397,843 Direct non-salary $120,172 $159,593 $157,574 $128,242 $186,275 $159,089 $331,652 $221,605 $201,370 Total direct costs $758,188 $1,026,563 $1,081,844 $1,070,871 $1,174,462 $1,144,506 $1,635,277 $1,858,308 $1,511,637 Indirect costs $1,295,626 $1,476,309 $1,395,677 $1,323,317 $1,255,394 $1,188,932 $1,608,438 $1,985,022 $1,421,104 Grant funds awarded $36,058,704 $42,820,210 $45,951,346 $48,337,252 $46,714,338 $44,722,824 $66,985,801 $73,580,052 $61,047,988 Operating ratio Direct 2.1% 2.4% 2.4% 2.2% 2.5% 2.6% 2.4% 2.5% 2.5% Indirect 3.6% 3.4% 3.0% 2.7% 2.7% 2.7% 2.4% 2.7% 2.3% Operating ratio 5.7% 5.8% 5.4% 5.0% 5.2% 5.2% 4.8% 5.2% 4.8% Note: Total direct spending includes non-salary and salary spending. Salary spending (indirect cost) was estimated using the program's grant funds as a percentage of the directorate's (council’s) grant funds, multiplied by the directorate's total salary expenditures (all non-program directorates’ total expenditures. (The results from a recent exercise undertaken by RPP to estimate staff time per program for one of the fiscal years under review, 2009/10, validates the appropriateness of this approach to estimating salary. Both approaches generated similar results and an identical operating ratio for the program (4.8% for fiscal year 2009/2010). Salary estimates exclude employee benefits (EBP). Source: NSERC administrative data It is not a goal of the SPG program to leverage substantial funds from partners; the program primarily requires in-kind contributions in order to ensure that partners are involved in the project. Administrative data show that projects awarded between 1998 and 2009 received an average contribution of $17,000 in cash and $149,000 in in-kind. The SPG program’s leverage ratio10 for the same time period was $0.54 for every $1 invested by NSERC. (Cash contributions represented $0.05 and in-kind contributions $0.49.) A majority of partner contributions were honoured, according to the final project reports (86% of cash contributions and 78% of in-kind contributions). Panel members and researchers were asked to reflect on the efficiency and effectiveness of the design features and delivery of the SPG program, as well as what changes, if any, could be made to improve it. Strategic researchers surveyed were generally satisfied with the design features of the program, particularly the grant amount (64% to a great extent) and the duration of the grant (58% to a great extent) (Figure 10). However, some researchers (4%) suggested that the duration of the grant should be extended. About half of Strategic researchers also reported being very satisfied with NSERC’s reporting requirements and the timing of the release of funds, while the rest were generally somewhat satisfied. The funding success rate was more of a concern, as only a third reported being very satisfied with that aspect of the program.
10 The ratio between partner contributions and SPG funds awarded.
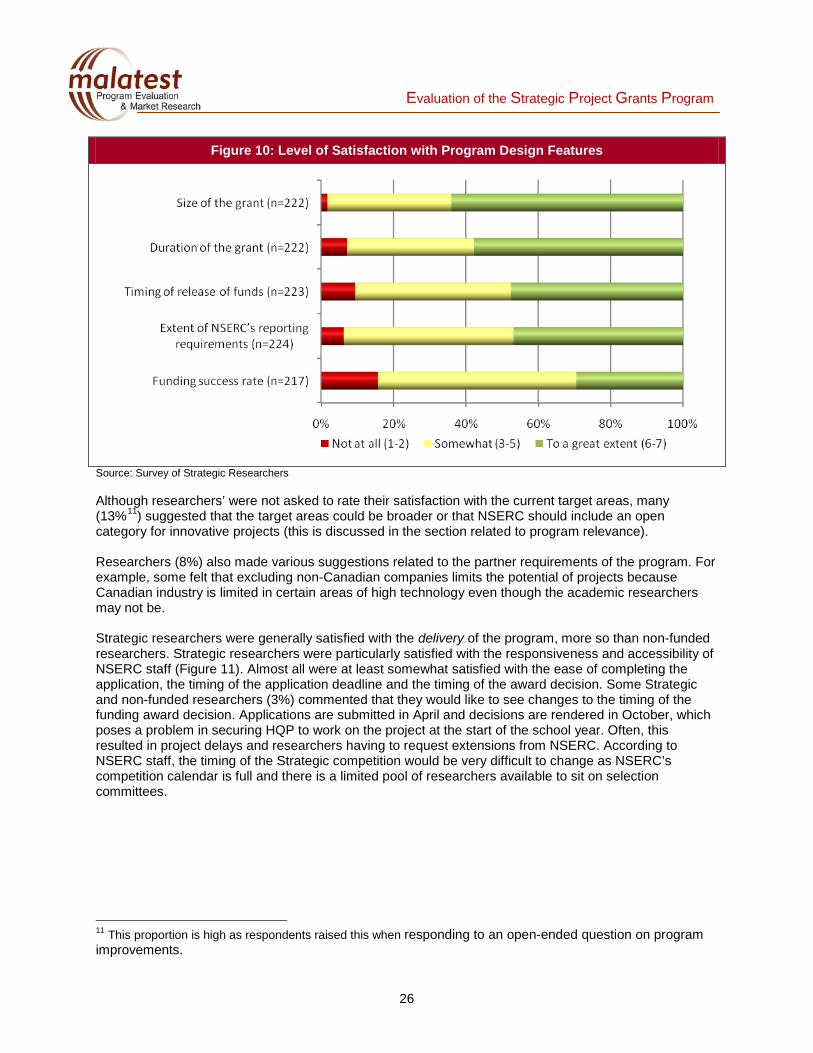
26
Evaluation of the Strategic Project Grants Program
Figure 10: Level of Satisfaction with Program Design Features
Source: Survey of Strategic Researchers Although researchers’ were not asked to rate their satisfaction with the current target areas, many (13%11) suggested that the target areas could be broader or that NSERC should include an open category for innovative projects (this is discussed in the section related to program relevance). Researchers (8%) also made various suggestions related to the partner requirements of the program. For example, some felt that excluding non-Canadian companies limits the potential of projects because Canadian industry is limited in certain areas of high technology even though the academic researchers may not be. Strategic researchers were generally satisfied with the delivery of the program, more so than non-funded researchers. Strategic researchers were particularly satisfied with the responsiveness and accessibility of NSERC staff (Figure 11). Almost all were at least somewhat satisfied with the ease of completing the application, the timing of the application deadline and the timing of the award decision. Some Strategic and non-funded researchers (3%) commented that they would like to see changes to the timing of the funding award decision. Applications are submitted in April and decisions are rendered in October, which poses a problem in securing HQP to work on the project at the start of the school year. Often, this resulted in project delays and researchers having to request extensions from NSERC. According to NSERC staff, the timing of the Strategic competition would be very difficult to change as NSERC’s competition calendar is full and there is a limited pool of researchers available to sit on selection committees.
11 This proportion is high as respondents raised this when responding to an open-ended question on program improvements.

27
Evaluation of the Strategic Project Grants Program
Figure 11: Level of Satisfaction with Program Delivery
Strategic Researcher Mean Score
Non-Funded Researcher
Mean Score
Responsiveness of NSERC program staff (n=213, 204)
5.94
4.59
Accessibility of NSERC program staff (n=210, 205) 5.84 4.53
Ease of completing application (n=223, 247) 5.03 4.33
Timing of application deadline (n=220, 244) 4.70 4.34
Timing of funding award/notice of decision (n=223, 235) 4.61 4.10
Not at all (1-2) Somewhat (3-5) To a great extent (6-7) Note: Significant differences between funded and non-funded researchers were found for all features (p<0.05). Source: Survey of Strategic Researchers; Survey of Non-Funded Researchers Non-funded researchers (21%) raised concerns with regard to the program’s selection process. They requested peer-reviewers with more expertise in areas relevant to the funding proposals, a more transparent and consistent selection process and an improved appeal process (e.g., having the opportunity to respond to critiques from the selection committees). In contrast to non-funded researchers, panel members and Strategic researchers spoke highly of the peer review process and thought that the panels’ meetings were run in an efficient manner. One past panel member said:
I think what is quite impressive is the peer review process. It is unmatched, the rigor that the programs are assessed, the transparency is unparalleled.
Both researchers and panel members welcomed the improvements recently made to the application process (applications are now online). Economy The economy of the SPG program was assessed through a Partial Benefit-Cost Analysis (PBCA), which determined whether the benefits of relatively few, highly successful projects cover (or are likely to cover) most or all the cost of the entire program. It is important to remember that it is not a specific goal of the SPG program to obtain a positive return on investment, since a great deal of the funded research is relatively high risk, both scientifically and commercially. However, the SPG program does focus on research that can at least potentially be used over the mid- or long-term for commercial or public good applications. The partial net benefits that the program has generated from fiscal year 2000/01 through 2005/06 were calculated based on the benefits of five high-impact cases. These benefits were compared to the total costs of the program over the five-year period and are expressed in the following manner:
28
Evaluation of the Strategic Project Grants Program
Net Present Value (NPV)–The NPV equals the total net benefits stream of the five high-impact projects, minus the total cost stream of the SPG program summed from fiscal year 2000/01 through 2005/06 (both streams discounted and deflated).
Benefit/Cost Ratio (B/C)–The B/C ratio equals the total net benefits of the five high-impact projects, divided by total SPG program costs (including all known partner costs) summed from fiscal year 2000/01 through 2005/06.12
A sensitivity analysis was conducted to help understand the effect of different analytic assumptions on the final study results, thus helping the reader understand how reliable and believable the findings are likely to be. The sensitivity analysis consisted of looking at the effects of lower- and upper-bound modeling for benefits, the effects of different discount rates, and the effect of removing the very largest cases from the analysis. The components of the sensitivity analysis are further described below.
Lower- and upper-bound modeling–The major portion of the sensitivity analysis consisted of developing lower and upper bounds for the benefits of most cases and sub-cases. In a few instances, the lower and upper bounds were identical. The upper and lower bounds were based on different assumptions about:
• the impact of the Strategic project innovation on industrial processes (e.g., to what degree costs will be lowered);
• the extent of current and likely future industrial take-up of the innovation (e.g., what proportion of the industry will use the new technology);
• the timing of that take-up (e.g., how often the new technology will be used);
• the way in which the partner firms will use it (e.g., how many products and product lines will be affected); and
• the estimated time until the SPG innovation would be replaced by newer technologies (the timeframe varied for each individual case, from five to 20 years).
Even within the upper bound, conservative assumptions were used. For example, one type of process improvement has only been modeled as being used for another five years into the future, whereas in reality, this technology (or an improved one based on it) is likely to be used for considerably longer. Only benefits were included for which incrementality and attribution to the Strategic grant were determined to be high, based on perceptions of respondents (both researchers and industry), the experience of the study team, and the results of the earlier project screening processes.
Discount rates–Both the benefit and cost streams were deflated and discounted, from the year of the initial Strategic grant under review (2000) through the last year in which benefits are assumed to occur (2030 for one of the cases). A variety of discount rates were used (the latter two being discussed in the Treasury Board’s Canadian Cost-Benefit Analysis Guide, Regulatory Proposals13):
• 2%, reflecting recent Bank of Canada rates for real return bonds (i.e., exclusive of inflation);
• 7%, reflecting recent US practice; and
• 8%, reflecting recent Treasury Board recommendations. This study did not use the higher discount rates sometimes employed in the private sector (e.g., 10-15%), since those rates attempt to model other effects, such as market and commercialization risks and the
12 Note that other benefit-cost or PBCA studies may define the B/C ratio in other ways (e.g., as the ratio of gross benefits divided by program costs alone, or benefits divided by program + partner costs). 13 Treasury Board Secretariat (2007). Treasury Board’s Canadian Cost-Benefit Analysis Guide, Regulatory Proposals, http://www.tbs-sct.gc.ca/ri-qr/documents/gl-ld/analys/analys00-eng.asp.
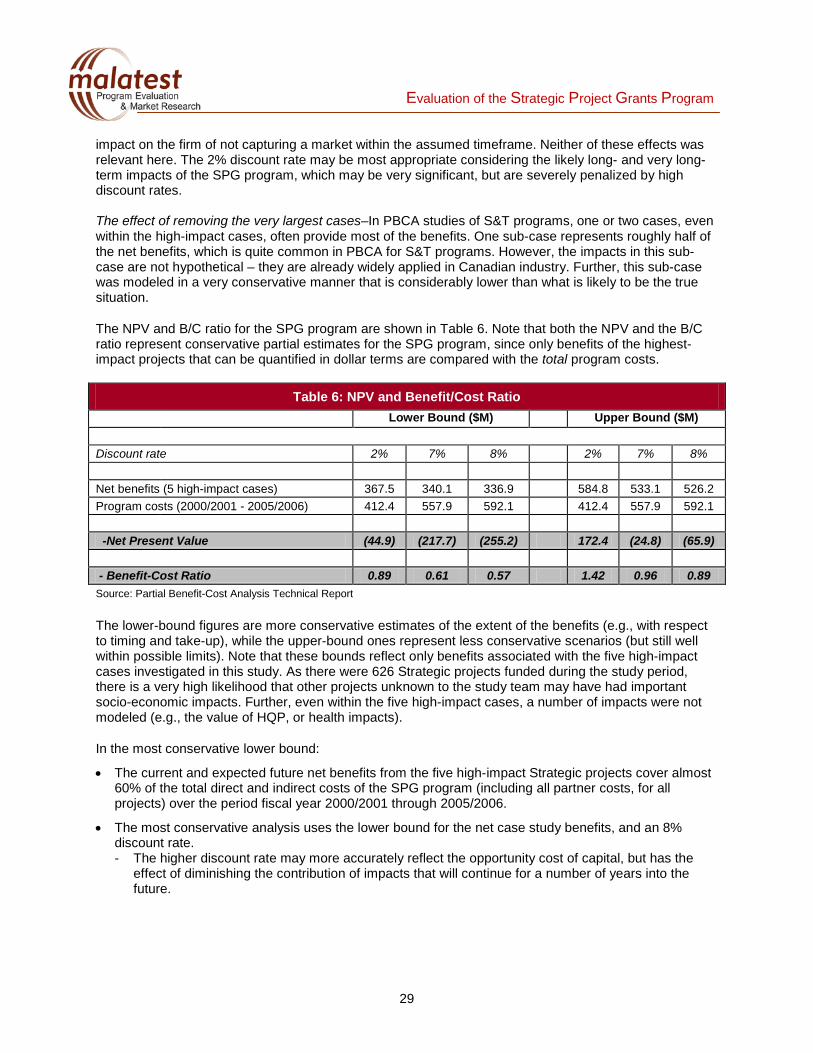
29
Evaluation of the Strategic Project Grants Program
impact on the firm of not capturing a market within the assumed timeframe. Neither of these effects was relevant here. The 2% discount rate may be most appropriate considering the likely long- and very long-term impacts of the SPG program, which may be very significant, but are severely penalized by high discount rates. The effect of removing the very largest cases–In PBCA studies of S&T programs, one or two cases, even within the high-impact cases, often provide most of the benefits. One sub-case represents roughly half of the net benefits, which is quite common in PBCA for S&T programs. However, the impacts in this sub-case are not hypothetical – they are already widely applied in Canadian industry. Further, this sub-case was modeled in a very conservative manner that is considerably lower than what is likely to be the true situation.
The NPV and B/C ratio for the SPG program are shown in Table 6. Note that both the NPV and the B/C ratio represent conservative partial estimates for the SPG program, since only benefits of the highest-impact projects that can be quantified in dollar terms are compared with the total program costs.
Table 6: NPV and Benefit/Cost Ratio Lower Bound ($M) Upper Bound ($M)
Discount rate 2% 7% 8% 2% 7% 8%
Net benefits (5 high-impact cases) 367.5 340.1 336.9 584.8 533.1 526.2 Program costs (2000/2001 - 2005/2006) 412.4 557.9 592.1 412.4 557.9 592.1
-Net Present Value (44.9) (217.7) (255.2) 172.4 (24.8) (65.9)
- Benefit-Cost Ratio 0.89 0.61 0.57 1.42 0.96 0.89 Source: Partial Benefit-Cost Analysis Technical Report The lower-bound figures are more conservative estimates of the extent of the benefits (e.g., with respect to timing and take-up), while the upper-bound ones represent less conservative scenarios (but still well within possible limits). Note that these bounds reflect only benefits associated with the five high-impact cases investigated in this study. As there were 626 Strategic projects funded during the study period, there is a very high likelihood that other projects unknown to the study team may have had important socio-economic impacts. Further, even within the five high-impact cases, a number of impacts were not modeled (e.g., the value of HQP, or health impacts).
In the most conservative lower bound:
• The current and expected future net benefits from the five high-impact Strategic projects cover almost 60% of the total direct and indirect costs of the SPG program (including all partner costs, for all projects) over the period fiscal year 2000/2001 through 2005/2006.
• The most conservative analysis uses the lower bound for the net case study benefits, and an 8% discount rate. - The higher discount rate may more accurately reflect the opportunity cost of capital, but has the
effect of diminishing the contribution of impacts that will continue for a number of years into the future.

30
Evaluation of the Strategic Project Grants Program
In the least conservative upper bound:
• The net benefits from these five Strategic projects amount to roughly 1.4 times the entire cost of the SPG program from fiscal year 2000/2001 through 2005/2006.
• The least conservative analysis uses the upper bound net case study benefits, and a 2% discount rate. - The lower discount rate may more accurately reflect the social preference for timing of costs vs.
benefits, but may not fully capture the partners’ opportunity costs.
The “most likely” estimate cannot be made in a simple fashion, for example, by averaging the lower and upper bounds, since there are too many uncertainties. However, given the highly conservative nature of this PBCA study (in which only five out of 626 projects were investigated), the consultants from KPMG conducting the study believe that the upper bound is the most reasonable estimate, irrespective of which discount rate is chosen.
Conclusions: The SPG program is efficient in that the administrative costs required to deliver it are low and comparable to those of RPP overall. In addition, Strategic projects leverage substantial in-kind contributions from partners. Researchers were generally satisfied with the operation of the program, including staff responsiveness, the amount and duration of funds, and reporting requirements. Some wanted to see changes in the timing of the funding award decisions, the funding success rate and the duration of the grant. Non-funded researchers raised concerns with regard to the transparency and quality of the selection process. The socio-economic benefits of the SPG program almost certainly cover the costs. The Partial Benefit-Cost Analysis demonstrated that in the most conservative analysis, the socio-economic benefits from only five (out of 262) projects will cover almost 60% of total program costs. In a less conservative analysis, it is likely that benefits from five Strategic projects will cover about 1.4 times total program costs.
31
Evaluation of the Strategic Project Grants Program
CONCLUSIONS AND RECOMMENDATIONS The conclusions and recommendations are presented below. Conclusions Overall, the evaluation found that the SPG program is relevant and that it demonstrates effectiveness, efficiency and economy by benefiting HQP, researchers, partners and Canadian society in general. Relevance The SPG program continues to be relevant, and meets an important need for both researchers and partners. It fills a niche in Canada’s range of research funding programs in that no other research funding program has the same unique combination of features. The SPG program is one of few funding programs to provide substantial funding for collaborative research that, as high-risk research, might not otherwise be undertaken. The SPG program also fills a unique niche in NSERC’s continuum of Research Partnerships Programs, where it functions as a two-way bridge between discovery research and collaborative research with partner organizations. While there is a strong perceived need for the program in the research community, it has been suggested that it could better meet Canada’s research needs if the target areas were less restrictive. Effectiveness The program increases the participation of Canadian-based companies and science-based government organizations in academic research by successfully creating interconnections and long-term relationships between individual researchers and partner organizations. Fewer long-term relationships would have been created without the SPG program, as only half of the projects that did not receive funding went ahead. However, the program does not provide partners with a first introduction to collaborative research; almost all partners surveyed (85%) had previously worked with university researchers for an average of 20 years. Almost all Strategic partners considered their collaborations with academic researchers to have been successful (95%). Partners identified various ways that NSERC could encourage potential partners to participate in the program. These included: program outreach and matchmaking between researchers and partners; further communicating the advantages of participating and achievements of strategic projects; helping address intellectual property issues; accepting applications from industry or government and distributing grant funds directly to partner organizations; increasing the participation of partners; and increasing the success rate of applications to the program. The SPG program has made a significant contribution to research in the target areas and the priorities of the science and technology strategy. Without the program, approximately half of the Strategic projects (45%) would likely not have proceeded, and many (39%) would have been reduced in scope, often with less involvement from partners (35%) or HQP (40%). The SPG program appears to have facilitated collaborations, where relevant, with researchers in non-NSE disciplines and researchers from other countries to enhance funded projects. This issue was not explored in depth, however, and it would likely be beneficial to revisit it as part of the next evaluation. Research results from Strategic projects are almost always transferred to partners. Strategic projects generated nearly twice the number of publications and conference presentations and produced a greater number of patent applications than non-funded projects. More than half of partners (63%) have already used the research results, and one in ten plans to use them. More than half (52%) have also applied the results for economic gain, to strengthen public policy or to achieve other social or environmental benefits. In addition, Strategic partners experience a range of benefits beyond the direct application of the research results.
32
Evaluation of the Strategic Project Grants Program
The incremental impact of the SPG program on creating training opportunities for HQP and enhancing their training is substantial, taking into account the high proportion of non-funded projects that did not proceed and that those that did proceed often did so with reduced involvement of HQP. On average, Strategic projects trained 15 HQP (12 of whom were students), which is twice as many as non-funded projects. Strategic projects also produced twice as many theses as non-funded projects that proceeded. The SPG program contributed to an increase in the number of HQP employed in target areas by giving some of the HQP most involved in Strategic projects a unique opportunity to conduct research in national research priority areas, by increasing their interest in the subject area, and by helping them gain relevant skills and the experience necessary for employment in those areas. Six in ten HQP (61%) reported that they were offered jobs or contracts as a result of the Strategic project, and almost all partners (90%) who had employed former HQP considered them to be more job-ready than other hires as a result of their participation. Strategic projects also had a sustainable impact on researchers’ teaching activities in most cases. Efficiency and Economy The SPG program is efficient in that the administrative costs required to deliver it are low (5.2%) and comparable to those of RPP overall. In addition, Strategic projects leverage substantial in-kind contributions from partners. Researchers were generally satisfied with the operation of the program, including staff responsiveness, the amount and duration of funds, and the reporting requirements. Some wanted to see changes in the timing of the funding award decisions, the funding success rate and the duration of the grant. Non-funded researchers raised concerns with regard to the transparency and quality of the selection process. The socio-economic benefits of the SPG program almost certainly cover the costs. The Partial Benefit-Cost Analysis demonstrated that in the most conservative analysis, the socio-economic benefits from only five (out of 262) projects will cover almost 60% of total program costs. In a less conservative analysis, it is likely that benefits from five Strategic projects will cover about 1.4 times total program costs. Recommendations Given the overall success of the SPG program in achieving its expected results, only a few recommendations are presented for NSERC's consideration. Recommendation #1: Continue the SPG program, while giving consideration to some minor adjustments to ensure continued relevance, and supporting new and ongoing research partnerships within the program's niche. Given that no other research funding program has the same unique combination of features (i.e., funds research in target areas addressing national priorities, is competition-based, focuses on early-stage collaborative research, engages public sector partners in addition to private, and does not require cash contributions from partners), the SPG program is in a unique position to advance new areas of research or innovative projects, and should continue to do so. The SPG program is also an important vehicle for providing training to HQP, allowing them to develop essential R&D skills and experience that is important to industry and government. Based on the findings, a few suggestions for NSERC to consider can be made:
• Create strategic flexibility in accepting promising projects that fall outside the current target areas. Many of those consulted as part of the evaluation were concerned that the target areas were too narrow and inflexible to fully support research of strategic importance to Canada. This concern could be addressed by building strategic flexibility into the funding criteria, allowing the program to support
33
Evaluation of the Strategic Project Grants Program
promising projects that fall outside the target areas but are nonetheless worthy of funding. However, if the program were to take this route, its alignment with the current, pre-defined priority areas in the S&T Strategy would decrease.
• Attract or support the participation of new partner organizations in the program by connecting potential partners with university researchers, and vice versa. Survey results reveal that, while the SPG program enables partners to connect with university researchers they have never worked with before, most partner organizations have a long history of collaborating with university researchers. If NSERC continues to view the SPG program as a tool for engaging new partner organizations in collaborative research with university researchers, it might consider developing or adopting an existing mechanism14 that seeks to connect new partners with university researchers. Insights collected from partners who took part in this evaluation could help clarify the specific types of support or information required by organizations new to the program. For example, some partners requested assistance with IP negotiations. If engaging new partner organizations in collaborative research is not a goal for the program, its literature and logic model should be revised to reflect that. The program’s role in relation to SPI would also need to be clarified.
Recommendation #2: Modify existing performance measurement systems to collect additional performance data in support of ongoing monitoring and program evaluation. The data collected through the program’s current Performance Measurement Strategy were used to support the evaluation of the SPG program. However, a few areas of improvement were identified over the course of the evaluation. Additional information that, if collected and recorded electronically, would support both ongoing program monitoring and future evaluations includes:
• contact information for HQP participating in Strategic projects;
• information about which proposals and projects include international collaborations or non-NSE co-applicants;
• information on whether an organization is a key partner or is less involved in the project (to assist in analyzing administrative data and developing sample frames); and
• more detailed, consistent and structured information on how partners have applied research results for economic gain or to strengthen public policy–this could be collected through the partners’ end-of-project reports, with follow-ups from program officers in cases where relevant information is missing.
Future evaluations would also benefit from efforts on the part of NSERC to improve the completeness and accuracy of the following information that is currently being collected and entered into the Council’s administrative database:
• size of partner organizations (small, medium or large), as this information was missing in a third of the cases; and
• actual cash and in-kind contribution amounts, drawn directly from the final statement of accounts in the project files.
14 For example, Mitacs utilizes an Industry Development Officer to facilitate university researcher and industrial interactions.
34
Evaluation of the Strategic Project Grants Program
REFERENCES
Government of Canada (2007). Mobilizing Science and Technology to Canada's Advantage, http://www.ic.gc.ca/eic/site/ic1.nsf/eng/h_00231.html.
Statistics Canada (2010). Labour Force Survey.
Treasury Board Secretariat (2009). Policy on Evaluation, http://www.tbs-sct.gc.ca/pol/doc-eng.aspx?id=15024.
Treasury Board Secretariat (2007). Treasury Board’s Canadian Cost-Benefit Analysis Guide, Regulatory Proposals, http://www.tbs-sct.gc.ca/ri-qr/documents/gl-ld/analys/analys00-eng.asp.
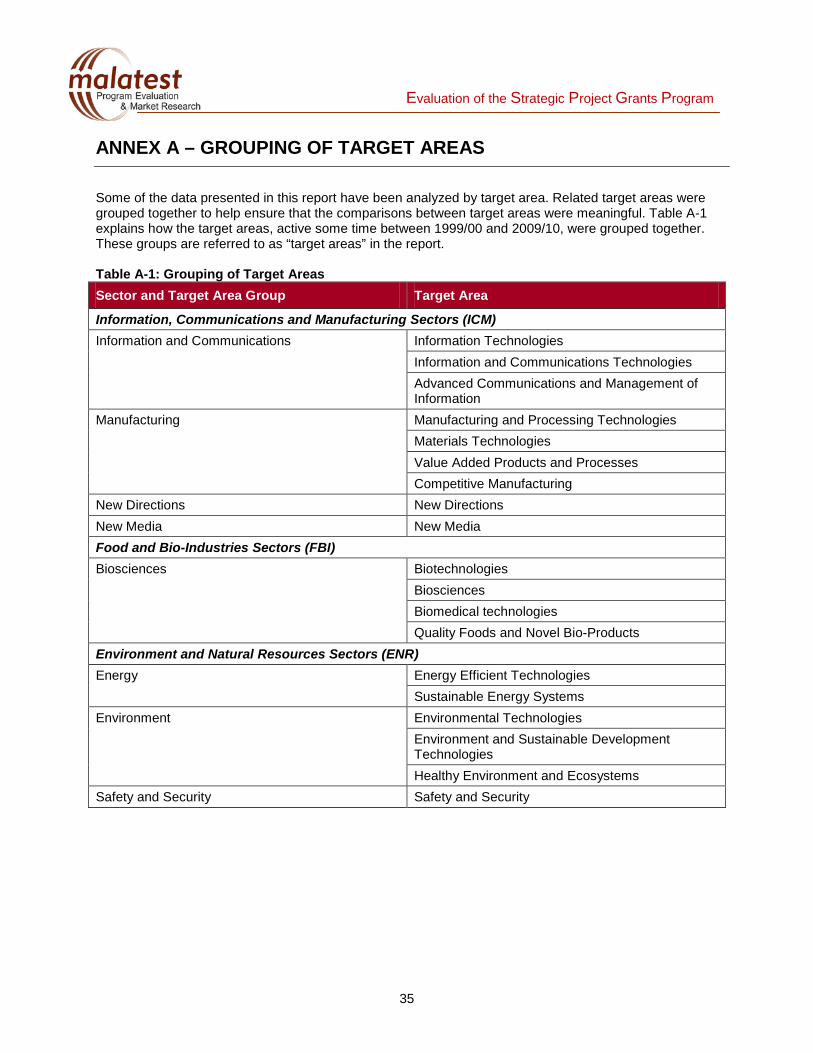
35
Evaluation of the Strategic Project Grants Program
ANNEX A – GROUPING OF TARGET AREAS
Some of the data presented in this report have been analyzed by target area. Related target areas were grouped together to help ensure that the comparisons between target areas were meaningful. Table A-1 explains how the target areas, active some time between 1999/00 and 2009/10, were grouped together. These groups are referred to as “target areas” in the report. Table A-1: Grouping of Target Areas Sector and Target Area Group Target Area
Information, Communications and Manufacturing Sectors (ICM) Information and Communications Information Technologies
Information and Communications Technologies Advanced Communications and Management of Information
Manufacturing Manufacturing and Processing Technologies Materials Technologies Value Added Products and Processes Competitive Manufacturing
New Directions New Directions New Media New Media Food and Bio-Industries Sectors (FBI) Biosciences Biotechnologies
Biosciences Biomedical technologies Quality Foods and Novel Bio-Products
Environment and Natural Resources Sectors (ENR) Energy Energy Efficient Technologies
Sustainable Energy Systems Environment Environmental Technologies
Environment and Sustainable Development Technologies Healthy Environment and Ecosystems
Safety and Security Safety and Security