Embed Size (px)
Citation preview
EVALUATION OF THE PERFORMANCE OF POLYURETHANE FOAMS IN RIGID
PAVEMENT PRESERVATION
By
Mawazo Chiyanda Fortunatus
Mbakisya Onyango Joseph Owino
Associate Professor of Civil Engineering Professor of Civil Engineering
(Chair) (Committee Member)
Ignatius Fomunung Weidong Wu
Professor of Civil Engineering Assistant Professor of Civil Engineering
(Committee Member) (Committee Member)
ii
EVALUATION OF THE PERFORMANCE OF POLYURETHANE FOAMS IN RIGID
PAVEMENT PRESERVATION
By
Mawazo Chiyanda Fortunatus
A Thesis Submitted to the Faculty of the University of
Tennessee at Chattanooga in Partial
Fulfillment of the Requirements of the Degree
of Master of Engineering
The University of Tennessee at Chattanooga
Chattanooga, Tennessee
August 2018

iii
Copyright © 2018
Mawazo Chiyanda Fortunatus
All Right Reserved

iv
ABSTRACT
After several years of service, concrete pavement slabs tend to settle due to weak subgrade
or erosion of the subgrade soil. Different treatment techniques have been used to rectify the
problem. In recent years, high-density polyurethane (HDP) foams were introduced on concrete
pavements after their success in leveling settled sidewalks and building bases/foundations.
Compared to other traditional slabs jacking/stabilization material, HDP foams are cost-effective,
their installation requires shorter lane closure times and protects the subgrade from subsurface
water infiltration by filling the voids.
In 2015 and 2016, the Tennessee DOT applied HDP material on sections of Interstates I-
24 and I-75 in Chattanooga, Tennessee to lift and level settled concrete pavement slabs.
Longitudinal profiles data were collected using a standard high-speed inertial profiler before and
after application of the material to assess the performance of the treated sections over time. These
data were evaluated by using the profile viewing and analyzing (ProVAL) software to compute
the international roughness index (IRI) and the transverse joint faulting.
Results show that application of HDP foams did neither improve nor retrogress the
pavement condition but maintained it in its state before application of the material. This study
recommends an in-depth ground investigation to be carried out before injection of the material,
establishment of a standardized protocol for selecting pavement sections suitable for HDP foam
injection, and contractors to use sophisticated leveling equipment, instead of the adjacent slab as
a reference, to avoid accumulation of errors due to overcorrection.

v
DEDICATION
This thesis is dedicated to my late lovely mother Kariba Mashauri Lukiko.
May Her Soul Rest in Eternal Peace
(1963 - 2005)

vi
ACKNOWLEDGEMENTS
First and foremost, I thank the Almighty God for giving me an opportunity to pursue a
master degree at the University of Tennessee at Chattanooga (UTC), I am greatly humbled and to
him, I owe my life. Thanks to my father, my step mother and the entire family back in Tanzania
for their emotional, spiritual, moral and material support not only in my education but also in all
life aspects; indeed, I am blessed to have them in my life.
I am grateful to my supervisor, Dr. Mbakisya Onyango, for her supervision, guidance,
encouragement, support and constructive criticism. Her patience and dedication to assist me is
highly appreciated. I extend my gratitude to the member of the committee; Dr. Owino, Dr.
Fomunung and Dr. Wu for their valuable advice and reviewing the manuscript of this thesis. Also,
I am immensely thankful to the Tennessee DOT for funding my studies at UTC, their financial
support is greatly appreciated. Also, I would like to thank staffs of the Department of Civil
Engineering and the College of Engineering, Mathematics and Computer Science in general for
their support and encouragements during my studies at UTC.
My sincere gratitude goes to my colleagues and friends; Murad Al Qurishee, Abubakr
Ziedan, Babatunde Atolagbe, and Maxwell Omwenga for their support, encouragement, and
friendship; they made my studies and life enjoyable on campus and off campus.

vii
Finally, I would like to thank individuals who had made my stay in the U.S. enjoyable and
memorable; the Birkby family in Huddersfield, U.K; Dr. Richard Wilson; Clarence Francis;
Simeon Otieno and his wife Grace; Gwamaka; and any other individual who I did not get a chance
to mention his/her name. Their advice and support have impacted my life greatly.

viii
TABLE OF CONTENTS
ABSTRACT ................................................................................................................................... iv
DEDICATION ................................................................................................................................ v
ACKNOWLEDGEMENTS ........................................................................................................... vi
TABLE OF CONTENTS ............................................................................................................. viii
LIST OF TABLES .......................................................................................................................... x
LIST OF FIGURES ....................................................................................................................... xi
LIST OF ABBREVIATIONS AND ACRONYMS ..................................................................... xii
CHAPTER
I. INTRODUCTION .............................................................................................................. 1
1.1. Problem Statement ..................................................................................................... 5
1.2. Objectives of the Study .............................................................................................. 6
1.3. Scope of the Study ..................................................................................................... 6
1.4. Thesis Overview ........................................................................................................ 6
II. LITERATURE REVIEW ................................................................................................... 8
2.1. Rigid Pavement Distresses ......................................................................................... 9
2.2. Concrete Pavement Preservation Strategies............................................................. 17
2.3. Slab Jacking and Slab Stabilization ......................................................................... 24
2.4. Case Studies on Applications of HDP Foams.......................................................... 27
2.5. Summary .................................................................................................................. 31

ix
III. METHODOLOGY ........................................................................................................... 33
3.1. Data Collection ........................................................................................................ 33
3.2. Data Analysis ........................................................................................................... 35
3.3. Joint/Cracks Detections and Faults Computation .................................................... 35
IV. RESULTS AND ANALYSIS ........................................................................................... 39
4.1. Results ...................................................................................................................... 40
4.2. Statistical Analysis ................................................................................................... 43
4.3. Discussion ................................................................................................................ 47
V. CONCLUSION AND RECOMMENDATIONS ............................................................. 55
REFERENCES ............................................................................................................................. 57
APPENDIX ................................................................................................................................... 61
A. TRANSVERSE JOINT FAULTING VARION OVER TIME ........................................ 61
B. PAIRED T-TESTS ANALYSIS OF TRANSVERSE JOINT FAULTING FOR THE
BEFORE AGAINST AFTER APPLICATION OF POLYURETHANE MATERIA ..... 65
C. QUANTILE-QUANTILE PLOTS.................................................................................... 67
VITA ............................................................................................................................................. 86

x
LIST OF TABLES
2.1 Distress in Concrete Pavements ............................................................................................. 16
2.2 Common Treatment Types in Rigid Pavement and Their Applicability ............................... 19
2.3 Concrete Pavement Repair Treatments Life Span ................................................................. 21
3.1 Sections Treated With Polyurethane Material ....................................................................... 34
4.1 Pavement Condition Metric Thresholds ................................................................................ 39
4.2 Treated Sections Transverse Joint Faulting Prior and Post Injection of Polyurethane .......... 41
4.3 Treated Sections IRI Readings Prior and Post Injection of Polyurethane ............................. 42
4.4 Paired t-tests for Before Application Against One Week After Application for I-75 South
and North .......................................................................................................................... 43
4.5 Paired t-tests for Before Application Against Thirteen Months After Application for I-75
South and North ................................................................................................................ 44
4.6 Paired t-tests Analysis of I-24 East_Moore ........................................................................... 45
4.7 Paired t-tests for Before Application Against One Week After Application for I-24
East_182 and I-24 West .................................................................................................... 45
4.8 Paired t-tests for Before Application Against Eight Months After Application for I-24
East_182 and I-24 West ................................................................................................... 46
4.9 Paired t-tests for Before Application Against Nineteen Months After Application for I-24
East_182 and I-24 West .................................................................................................... 46

xi
LIST OF FIGURES
2.1 Types of cracking in rigid pavement .................................................................................... 11
2.2 Slab spalling in rigid pavement............................................................................................. 12
2.3 Faulting of transverse crack .................................................................................................. 13
2.4 Pumping and water bleeding in JPCP ................................................................................... 15
3.1 Cropped profile slices curve fitting and faulting computation ............................................. 38
4.1 IRI against maximum transverse joint faulting for left wheel truck ..................................... 49
4.2 Residual IRI against maximum transverse joint faulting for left wheel truck ...................... 50
4.3 IRI against maximum transverse joint faulting for right wheel truck ................................... 50
4.4 Residual IRI against maximum transverse joint faulting for right wheel truck .................... 51
4.5 Mean IRI against mean transverse joint faulting .................................................................. 52
4.6 Residual mean IRI against mean transverse joint faulting.................................................... 52
4.7 Overall IRI trend over time ................................................................................................... 53
xii
LIST OF ABBREVIATIONS AND ACRONYMS
AADT Average Annual Daily Traffic
AASHTO American Association of State Highway and Transportation Officials
ACPA American Concrete Pavement Association
AFM Automated Faulting Measurement
ARRB Australian Road Research Board
ASCE American Society of Civil Engineers
CRCP Continuous Reinforced Concrete Pavement
DOT Department of Transportation
DIM-LTTP Distress Identification Manual for the Long-Term Pavement Performance
FHWA Federal Highway Administration
FWD Falling Weight Deflectometer
GPR Ground Penetrating Radar
HDP High Density Polyurethane
HMA Hot Mix Asphalt
IRI International Roughness Index
JPCP Jointed Plain Concrete Pavement
JRCP Jointed Reinforced Concrete Pavement
LTE Load Transfer Efficiency
NDT Non-Destructive Testing

xiii
NHS National Highway Systems
PCC Portland Cement Concrete
ProVAL Profile Viewing and Analyzing Software
SHA State Highway Agency
TDOT Tennessee Department of Transportation
U.S.A. United States of America

1
CHAPTER I
INTRODUCTION
Roads are the backbone of any society’s socio-economic development. In the U.S. there
are over four million miles of road network ranging from interstates to residential streets. In 2016
only, these roads enabled people and goods to move over 3.2 trillion miles (American Society of
Civil Engineers, 2017).
The American Society of Civil Engineers report card of 2017 on U.S. infrastructure reports
that $813 billion is required to renovate highways and bridges to an excellent condition; more than
50% ($430 billion) of the investment is for highways repairs whereas the remaining is for bridge
repair, system expansion, safety improvements, operations and environment concerns (American
Society of Civil Engineers, 2017). The reasons for huge funding required for highway repairs are
due to low capital invested in repair/rehabilitation and their delay since roadways can still be used
even if they are in poor conditions (American Society of Civil Engineers, 2017; Garber and Hoel,
2014).
The most common roadways pavements in practice in the U.S. are flexible pavement, rigid
pavement, and composite pavement. Flexible pavements are constructed from hot mix asphalt
(HMA) under laid by an asphalt binder on the base course/sub-base and subgrade. The layers are
arranged depending on the material strength to resist the effect of loading with high-quality
materials on the top (Huang, 2004).

2
Rigid pavement, also known as concrete pavement consists of a concrete slab constructed
from Portland Cement Concrete (PCC), in which the slab can be reinforced or unreinforced with
defined thickness and width. The PCC slab rests on the subgrade or granular base/sub-base course.
The sub-base is introduced mainly for controlling pumping, frost action, subgrade shrinkage and
swell, and improvement of drainage in the pavement (Huang, 2004). Composite pavement consists
of an asphalt concrete surface which provides a smooth ride quality, a PCC slab which acts as a
major load carrying component. Composite pavements are expensive, hence they are mostly
constructed when concrete pavements are being rehabilitated (Huang, 2004).
There are different types of concrete pavement, but the following three are more common
in roadway construction as compared to other types such as precast concrete, roller compacted
concrete and porous concrete;
i. Jointed Plain Concrete Pavement (JPCP)
JPCP is a mass concrete slab 3.6-6.0 m (12-29 ft) in length, built with closely spaced
contraction joints and load transfer mechanism is provided by dowels or aggregate interlocks, they
have a risk of developing cracks as the joint spacing increases (Delatte, 2014; Huang, 2004). Joint
spacing ranges from 4.5 to 9.0 m (15 to 30 ft) depending on climate, aggregate, and prior
experience (Huang, 2004).

3
ii. Jointed Reinforced Concrete Pavement (JRCP)
JRCP is reinforced with a wire mesh or deformed bars to increase the joint spacing (which
is larger than in JPCP) and hold the slab together after cracking, only dowels are used to transfer
the vertical loads at the joints. According to Huang (2004), its joint spacing varies between 9.1 to
30 m (30 - 100 ft). Delatte (2014) states that slabs of length up to 30 m (100 ft) have been used,
but their common slab length range from 7.5 to 9.0 m (25 – 30 ft).
iii. Continuous Reinforced Concrete Pavement (CRCP)
CRCP is reinforced continuously throughout the length of the pavement, with no joints
unless when the pavement meets a bridge or another type of pavement; for instance, flexible
pavement (construction joints). The pavement is left to crack within acceptable limit which is about
1 mm (0.04 in). Stresses induced in the pavement due to traffic and temperature gradient are
released through these cracks. CRCP has higher initial construction cost but lower maintenance
cost, as compared to JRCP which requires lesser initial construction cost but higher maintenance
cost during its service life (Delatte, 2014; Huang, 2004).
After several years of service, concrete pavement may not function as they were intended
due to distresses influenced by factors such as frequent heavy loadings, material properties of the
supporting foundation, environments and climatic changes, and aging of the pavement over time.
Slab settlement/ drop off is a common distress in jointed concrete pavements (JPCPs and JRCPs).

4
Slab drop off is mostly caused by weak foundation supporting the pavement which may be
due to poor compaction of the layers, erosion of the subgrade soil by pumping, and inferior quality
of the material. Apart from discomfort experienced by road users while traveling on differential
settled concrete slabs, slab drop off also poses safety hazards to them. State DOTs are therefore
compelled to maintain the smoothness and safety expected by road users by rectifying pavement
defects by applying appropriate preservation/repair techniques.
The FHWA requires DOTs to include pavement preservations strategies in their pavement
management program; because appropriate pavement preservation strategy applied at the right
section, and at the right time is proven to be cost-effective and sustainable while providing
smoother, safer and quieter riding (Van Dam et al., 2015).
Pavement preservation does not include structural and operational/capacity improvement
of the roadway. All corrective or preventive maintenance, as well as minor rehabilitation activities,
are regarded as pavement preservation (Davies and Sorenson, 2000; Huang, 2004).
This study evaluates the performance of JPCP treated with HDP foams to preserve its
surface smoothness. To assess the effectiveness of the material in surface leveling settled concrete
slabs, raw pavement surface roughness data collected by a standard inertial profiler before and
after application of the material is analyzed using ProVAL to obtain the transverse joint faulting
of the sections.
5
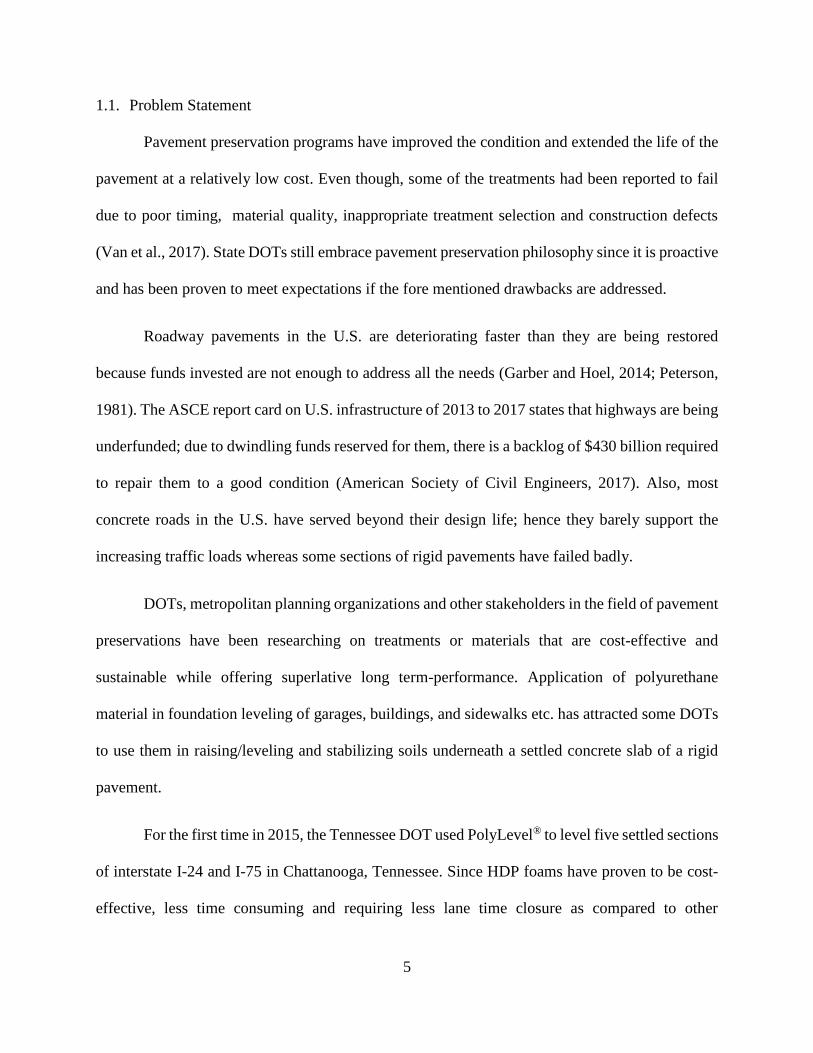
1.1. Problem Statement
Pavement preservation programs have improved the condition and extended the life of the
pavement at a relatively low cost. Even though, some of the treatments had been reported to fail
due to poor timing, material quality, inappropriate treatment selection and construction defects
(Van et al., 2017). State DOTs still embrace pavement preservation philosophy since it is proactive
and has been proven to meet expectations if the fore mentioned drawbacks are addressed.
Roadway pavements in the U.S. are deteriorating faster than they are being restored
because funds invested are not enough to address all the needs (Garber and Hoel, 2014; Peterson,
1981). The ASCE report card on U.S. infrastructure of 2013 to 2017 states that highways are being
underfunded; due to dwindling funds reserved for them, there is a backlog of $430 billion required
to repair them to a good condition (American Society of Civil Engineers, 2017). Also, most
concrete roads in the U.S. have served beyond their design life; hence they barely support the
increasing traffic loads whereas some sections of rigid pavements have failed badly.
DOTs, metropolitan planning organizations and other stakeholders in the field of pavement
preservations have been researching on treatments or materials that are cost-effective and
sustainable while offering superlative long term-performance. Application of polyurethane
material in foundation leveling of garages, buildings, and sidewalks etc. has attracted some DOTs
to use them in raising/leveling and stabilizing soils underneath a settled concrete slab of a rigid
pavement.
For the first time in 2015, the Tennessee DOT used PolyLevel® to level five settled sections
of interstate I-24 and I-75 in Chattanooga, Tennessee. Since HDP foams have proven to be cost-
effective, less time consuming and requiring less lane time closure as compared to other
6
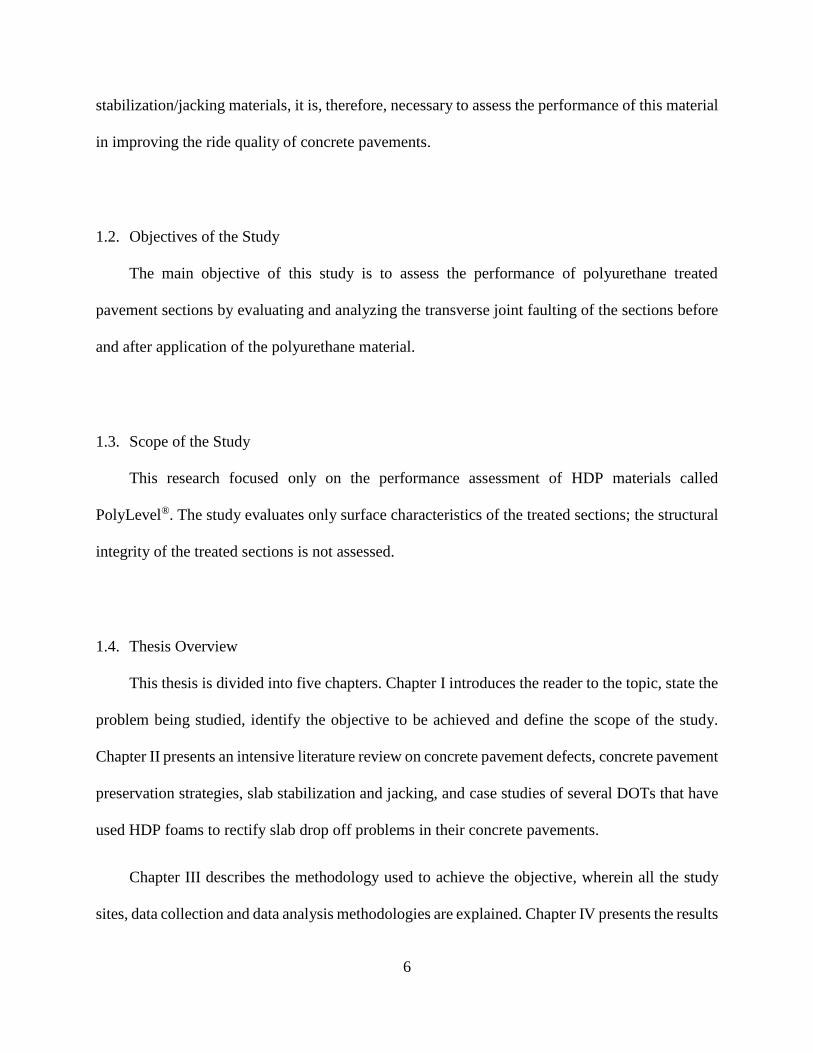
stabilization/jacking materials, it is, therefore, necessary to assess the performance of this material
in improving the ride quality of concrete pavements.
1.2. Objectives of the Study
The main objective of this study is to assess the performance of polyurethane treated
pavement sections by evaluating and analyzing the transverse joint faulting of the sections before
and after application of the polyurethane material.
1.3. Scope of the Study
This research focused only on the performance assessment of HDP materials called
PolyLevel®. The study evaluates only surface characteristics of the treated sections; the structural
integrity of the treated sections is not assessed.
1.4. Thesis Overview
This thesis is divided into five chapters. Chapter I introduces the reader to the topic, state the
problem being studied, identify the objective to be achieved and define the scope of the study.
Chapter II presents an intensive literature review on concrete pavement defects, concrete pavement
preservation strategies, slab stabilization and jacking, and case studies of several DOTs that have
used HDP foams to rectify slab drop off problems in their concrete pavements.
Chapter III describes the methodology used to achieve the objective, wherein all the study
sites, data collection and data analysis methodologies are explained. Chapter IV presents the results

7
and analysis. In this chapter, analysis and results of raw profile data using ProVAL software are
presented. Statistical analysis on the changes in transverse joint faulting before and after
application of HDP foams are discussed too. Conclusion and recommendations made from this
study are provided in Chapter V.
8
CHAPTER II
LITERATURE REVIEW
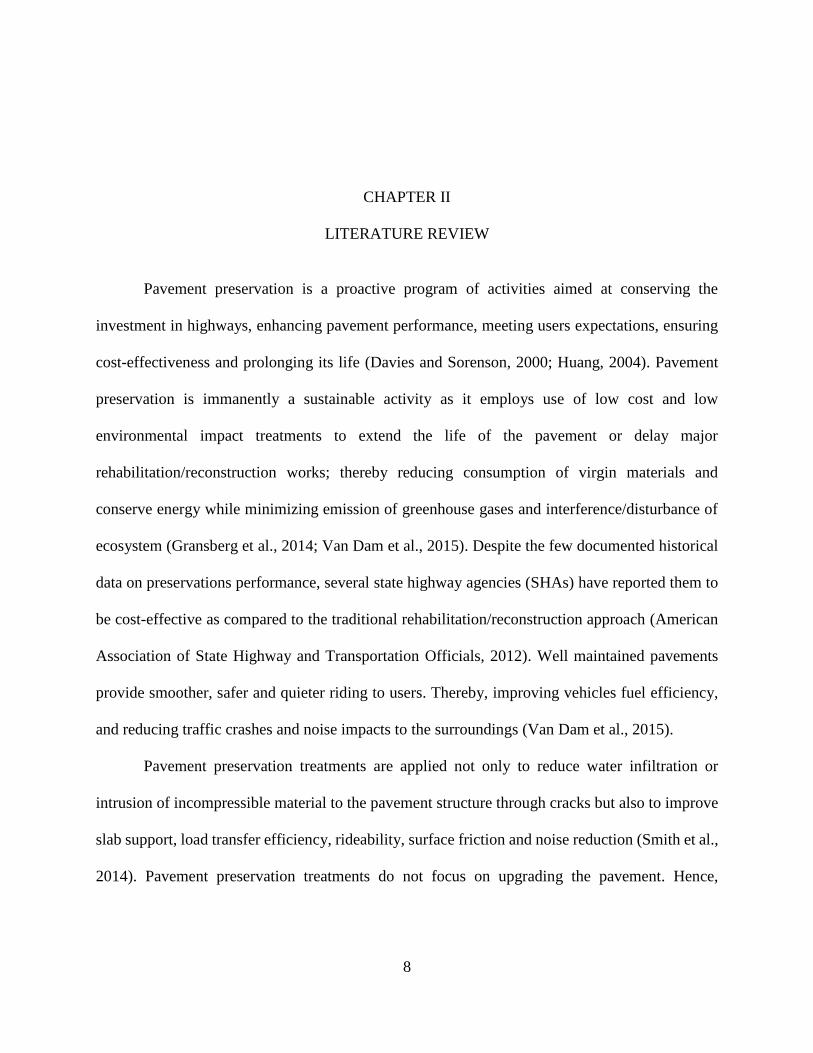
Pavement preservation is a proactive program of activities aimed at conserving the
investment in highways, enhancing pavement performance, meeting users expectations, ensuring
cost-effectiveness and prolonging its life (Davies and Sorenson, 2000; Huang, 2004). Pavement
preservation is immanently a sustainable activity as it employs use of low cost and low
environmental impact treatments to extend the life of the pavement or delay major
rehabilitation/reconstruction works; thereby reducing consumption of virgin materials and
conserve energy while minimizing emission of greenhouse gases and interference/disturbance of
ecosystem (Gransberg et al., 2014; Van Dam et al., 2015). Despite the few documented historical
data on preservations performance, several state highway agencies (SHAs) have reported them to
be cost-effective as compared to the traditional rehabilitation/reconstruction approach (American
Association of State Highway and Transportation Officials, 2012). Well maintained pavements
provide smoother, safer and quieter riding to users. Thereby, improving vehicles fuel efficiency,
and reducing traffic crashes and noise impacts to the surroundings (Van Dam et al., 2015).
Pavement preservation treatments are applied not only to reduce water infiltration or
intrusion of incompressible material to the pavement structure through cracks but also to improve
slab support, load transfer efficiency, rideability, surface friction and noise reduction (Smith et al.,
2014). Pavement preservation treatments do not focus on upgrading the pavement. Hence,
9
structural capacity improvements and reconstruction activities are not considered as preservation
(Burningham and Stankevich, 2005; Huang, 2004).
2.1. Rigid Pavement Distresses
Distresses in rigid pavements are associated with induced stresses, age of the pavement,
and deficiencies in materials, construction and maintenance (Garber and Hoel, 2014; Huang,
2004). Distress in pavements leads to either functional or/and structural failure of the pavement.
Functional distress affects the ability of the pavement to provide a safe and smooth ride to its users
whereas structural distress causes structural incapability of the pavements (Peshkin et al., 2011).
Before embarking into the repair of the damaged pavement section, engineers identify
types of the distress, their causes, and severity; then select an appropriate preservation technique
after conducting a life-cycle cost analysis of possible techniques based on the desired
improvements. While pavement preservations are a suitable option for functional failure, they are
not for structural enhancement of the pavement.
Apart from distresses, there are three other characteristics used to evaluate pavement
rehabilitation or maintenance needs: (1) pavement ride quality for surface condition of the
pavement, (2) pavement deflection for structural integrity, and (3) skid resistance for safety
(Garber and Hoel, 2014; Huang, 2004; Shahin, 2005). Data from these four pavement conditions
characteristics are not only useful in selecting a feasible treatments technique, but also in
identifying its impacts, work prioritization and funds optimization (Huang, 2004).
The distress identification manual for the long-term pavement performance (DIM-LTPP)
groups distress on jointed concrete pavement in the following manner: (1) cracking, (2) surface
10
defects, (3) joint deficiencies and (4) miscellaneous and others (Miller and Bellinger, 2014). Each
group is further divided into several sub categories. The most common distress joint failure in
jointed plain concrete pavement (JPCP) are briefly described below:
i. Crackings in concrete pavements is a result of stresses caused by repeated traffic loading.
These stresses may not even exceed the flexural strength of the concrete slab but still may
lead to formation of structural cracks due to lack of uniform base support, among other
things. Cracking is also influenced by weak subgrades, expansive soils, differential
settlements and curling of concrete slabs due to temperature gradient (Bautista and
Basheer, 2008). If not properly sealed cracks are likely to develop into concrete spalling in
situation where there is erosion of subgrade/base support and crack formation as a result of
moisture infiltration through cracks or joints (Bautista and Basheer, 2008). Figure 2.1
shows cracking distresses as categorized in the DIM-LTPP based on their location and
formation on the pavement.

11
Figure 2.1 Types of cracking in rigid pavement (Source: Miller and Bellinger, 2014)
ii. Spalling of concrete pavement is identified by cracking, breaking, chipping or fraying
of slab edge within 0.3 m from the face of longitudinal, transverse or corner of the
pavement as shown in Figure 2.2 (Lee and Shields, 2010; Miller and Bellinger, 2014;
North Carolina Department of Transportation, 2015).
Apart from being influenced by cracking near the transverse/longitudinal joints;
according to Huang (2004) spalling (transverse or longitudinal) is also caused by
poorly designed or constructed load transfer devices; corner spalling is caused by

12
freeze-thaw condition, durability cracking or other factors. Usually spalling extends to
intersect the joint at an angle and not throughout the whole slab thickness (Huang,
2004). Spalling is a joint deficiency related distress, others include longitudinal and
transverse joint seal damage.
Figure 2.2 Slab spalling in rigid pavement (Source: Miller and Bellinger, 2014; North Carolina
Department of Transportation, 2015)
iii. Faulting is commonly found in jointed concrete pavements without dowel bar
reinforcement. It manifests as a slight settlement of the leading edge of each slab in
the direction of traffic (Papagiannakis and Masad, 2017). Due to lack of dowel bars

13
or aggregate interlock in JPCP for load transfer, sudden increases in pore pressure
in wet subgrades occur, which in turn produces migration of fines and settlement
under the leading edge of each slab. Where the sudden pore pressure buildup is
accompanied by squirting of water and fines through the joint, the distress is
referred as pumping (Huang, 2004; Papagiannakis and Masad, 2017). Faulting can
be either in the longitudinal or transverse direction of the joint or crack (Figure 2.3).
However, the most common ones are near the joint in the transverse direction.
Figure 2.3 Faulting of transverse crack (Source: Miller and Bellinger (2014))
According to Smith et al. (1998) faulting is considered as a drainage related
distress. Improvement in pavement drainage system, shorter joint spacing, use of

14
widened lanes and stabilized base/ subgrade reduces faulting effects significantly
(Selezneva et al., 2000).
In most cases of faulting mechanism, the approach slab is higher than the leave
(departure) slab and is considered as positive faulting; negative faulting is recorded
when the leave slab is higher than the approach slab (Miller and Bellinger, 2014).
Joint faulting is measured in the nearest mm (in.) at 0.3 m (1 ft) from the outside
pavement edge and 0.75 m (2.50 ft) from the outside wheel path (Miller and
Bellinger, 2014). Faulting leads to unevenness of the pavement affecting the
roughness and ride quality on the pavement.
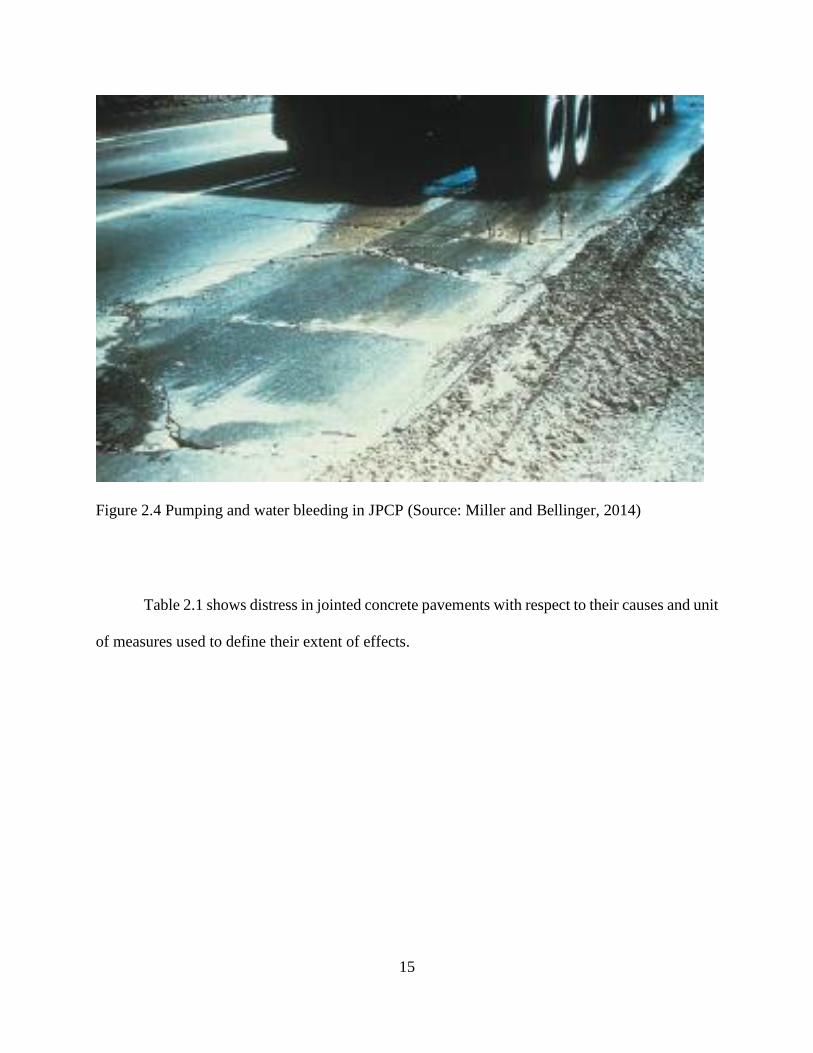
iv. Pumping is the ejection of soft subgrade/subbase soil (muddy water) underneath
the slab through cracks or joints, faults or along the edge of the pavement (Figure
2.4) due to slab deflection under dynamic traffic loading (Huang, 2004; Miller and
Bellinger, 2014). Curling of slabs or plastic deformation of the subgrade creates
void space, due to capillary forces (if the subgrade is on/under the water table) or
ingress of water from the top into the subgrade through cracks or joints). The void
space will be filled with fine-soft soil, when frequent passage of heavy wheel loads
occur the fine-soft soil under the leading slab are pumped due its deflection to the
trailing slab which had rebounded and created a vacuum; the fine material is sucked
outside from underneath the leading slab through joints or cracks (Huang, 2004).
Pumping and faulting are indicators of loss of slab support and likely to cause
corner cracking.
15
Figure 2.4 Pumping and water bleeding in JPCP (Source: Miller and Bellinger, 2014)
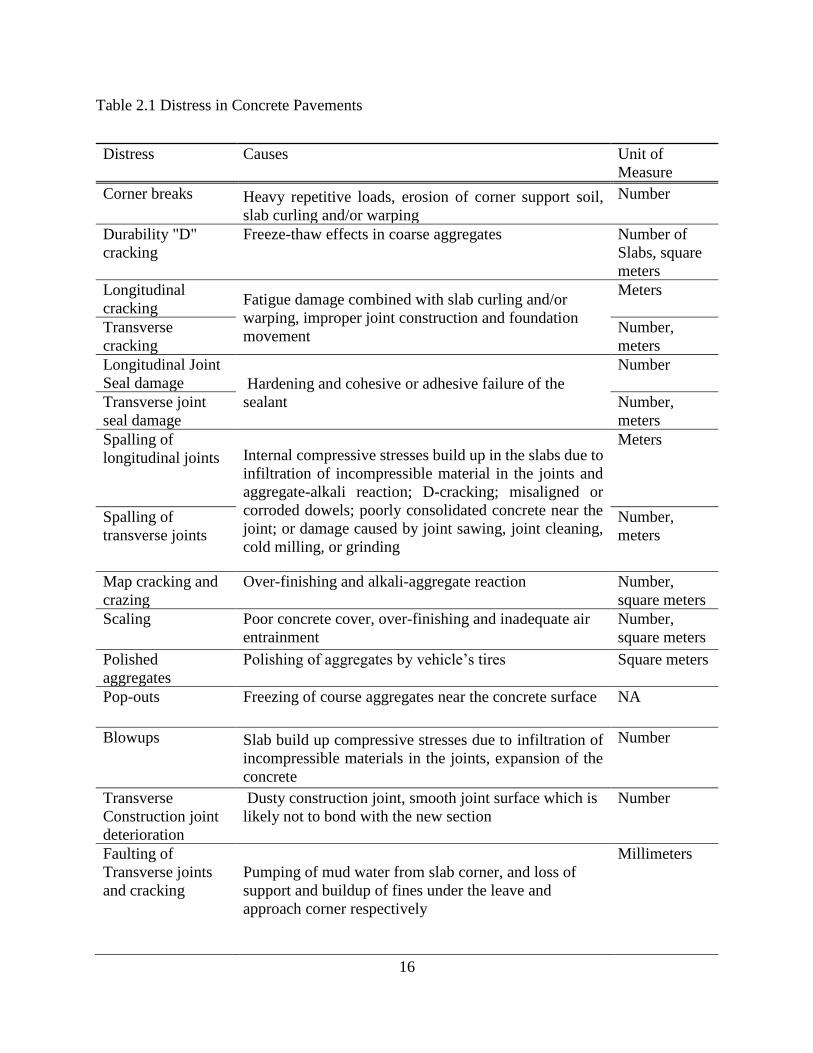
Table 2.1 shows distress in jointed concrete pavements with respect to their causes and unit
of measures used to define their extent of effects.
16
Table 2.1 Distress in Concrete Pavements
Distress Causes Unit of
Measure
Corner breaks Heavy repetitive loads, erosion of corner support soil,
slab curling and/or warping
Number
Durability "D"
cracking
Freeze-thaw effects in coarse aggregates Number of
Slabs, square
meters
Longitudinal
cracking Fatigue damage combined with slab curling and/or
warping, improper joint construction and foundation
movement
Meters
Transverse
cracking
Number,
meters
Longitudinal Joint
Seal damage Hardening and cohesive or adhesive failure of the
sealant
Number
Transverse joint
seal damage
Number,
meters
Spalling of
longitudinal joints Internal compressive stresses build up in the slabs due to
infiltration of incompressible material in the joints and
aggregate-alkali reaction; D-cracking; misaligned or
corroded dowels; poorly consolidated concrete near the
joint; or damage caused by joint sawing, joint cleaning,
cold milling, or grinding
Meters
Spalling of
transverse joints
Number,
meters
Map cracking and
crazing
Over-finishing and alkali-aggregate reaction Number,
square meters
Scaling Poor concrete cover, over-finishing and inadequate air
entrainment
Number,
square meters
Polished
aggregates
Polishing of aggregates by vehicle’s tires Square meters
Pop-outs Freezing of course aggregates near the concrete surface NA
Blowups Slab build up compressive stresses due to infiltration of
incompressible materials in the joints, expansion of the
concrete
Number
Transverse
Construction joint
deterioration
Dusty construction joint, smooth joint surface which is
likely not to bond with the new section
Number
Faulting of
Transverse joints
and cracking
Pumping of mud water from slab corner, and loss of
support and buildup of fines under the leave and
approach corner respectively
Millimeters

17
Lane to shoulder
drop off Improper joint construction and inadequate sealant
material
Millimeters
Lane to shoulder
separation
Millimeters
Punchouts
Heavy repeated loads, inadequate slab thickness, loss of
foundation support, or a localized concrete construction
deficiency
Number
Pumping and water
bleeding Heavy repetitive traffic loads, erosion subgrade/base
course soil
Meters,
number
Source: Miller and Bellinger (2014), Smith et al. (2014).
2.2. Concrete Pavement Preservation Strategies
Strategy selection for pavement preservation is substantially influenced by the pavement
management system of the transportation agency. Pavement management data are essential in the
screening process during treatment selection, as they are used to establish priorities among the
competing pavement needs, determine candidates suitable for preservation treatments, evaluate
the feasibility of the treatment and its cost-effectiveness, set performance targets, and forecast
consequences of the treatment in the future condition of the network (AASHTO, 2012; Smith et
al., 2014).
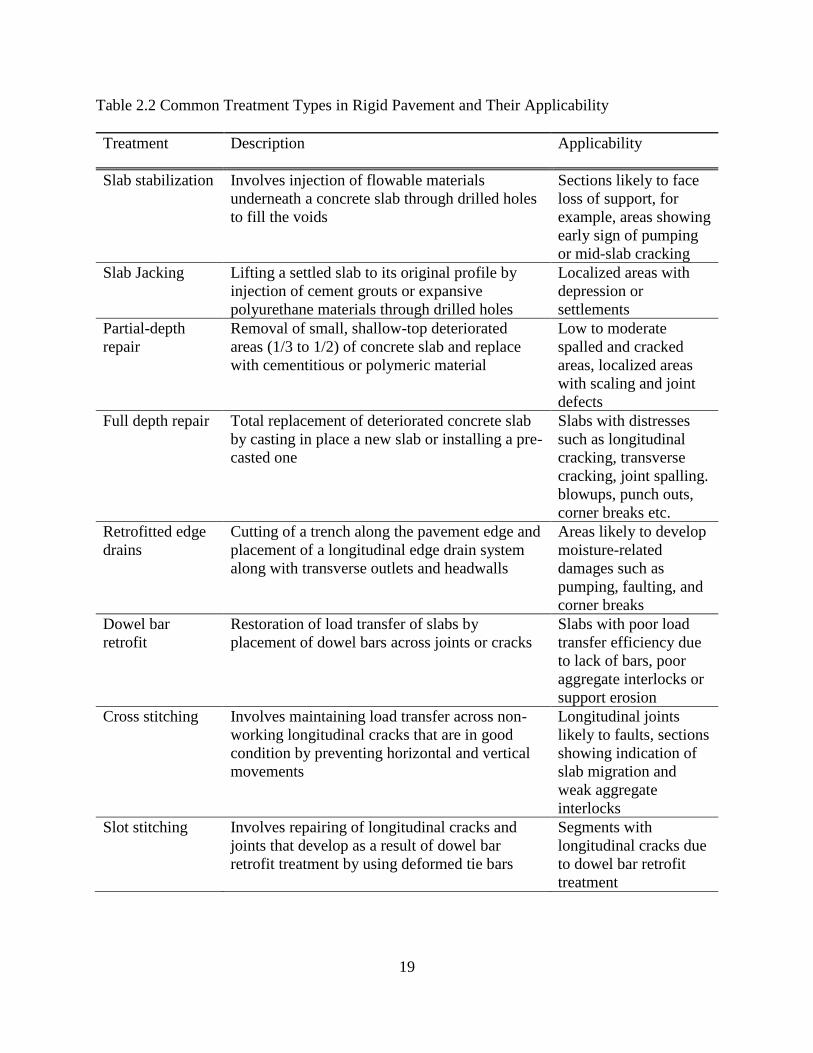
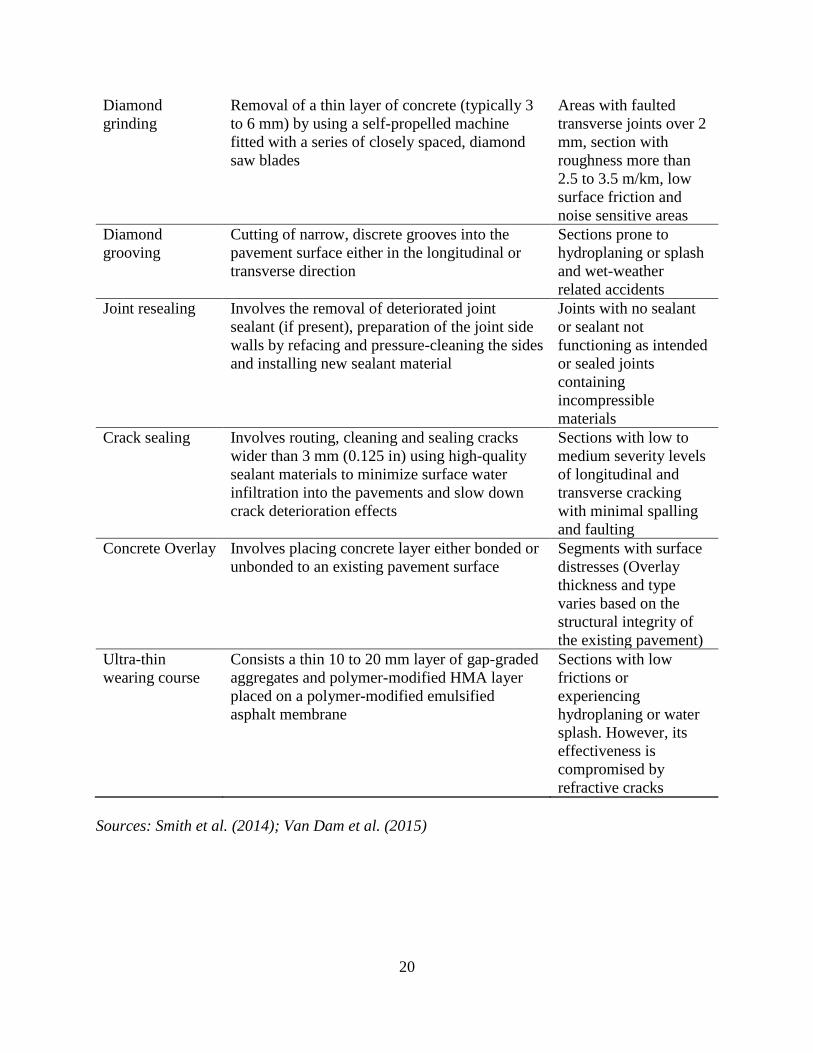
Table 2.2 shows different treatments description and their application in concrete
pavements (Smith et al., 2014; Van Dam et al., 2015). Smith et al. (2014) suggest the following
procedures be followed when the agency is selecting treatments to be applied to a damaged
pavement section:
i. Conducting a thorough pavement evaluation
ii. Determining causes of distresses and deficiencies
iii. Identifying effective and sustainable treatments that address deficiencies

18
iv. Identifying constraints and key selection factors
v. Developing a feasible treatment strategy
vi. Assessing the cost-effectiveness of the alternative treatment strategy
Moreover, selection of appropriate treatment strategy for a particular segment of the
pavement system depends on the following factors: (1) type of existing pavement, (2) type,
severity and extent of distress (3) volume and type of current and projected traffic, (4) local
climatic condition, (5) expected performance of the pavement, (6) work zone time restrictions, (7)
agency and user costs associated with each treatment, (8) availability of qualified contractors and
quality material, and (9) environmental sustainability (Gransberg et al., 2014; Moulthrop and
Smith, 2000; Peshkin et al., 2011; Smith et al., 2014).
19
Table 2.2 Common Treatment Types in Rigid Pavement and Their Applicability
Treatment Description Applicability
Slab stabilization Involves injection of flowable materials
underneath a concrete slab through drilled holes
to fill the voids
Sections likely to face
loss of support, for
example, areas showing
early sign of pumping
or mid-slab cracking
Slab Jacking Lifting a settled slab to its original profile by
injection of cement grouts or expansive
polyurethane materials through drilled holes
Localized areas with
depression or
settlements
Partial-depth
repair
Removal of small, shallow-top deteriorated
areas (1/3 to 1/2) of concrete slab and replace
with cementitious or polymeric material
Low to moderate
spalled and cracked
areas, localized areas
with scaling and joint
defects
Full depth repair Total replacement of deteriorated concrete slab
by casting in place a new slab or installing a pre-
casted one
Slabs with distresses
such as longitudinal
cracking, transverse
cracking, joint spalling.
blowups, punch outs,
corner breaks etc.
Retrofitted edge
drains
Cutting of a trench along the pavement edge and
placement of a longitudinal edge drain system
along with transverse outlets and headwalls
Areas likely to develop
moisture-related
damages such as
pumping, faulting, and
corner breaks
Dowel bar
retrofit
Restoration of load transfer of slabs by
placement of dowel bars across joints or cracks
Slabs with poor load
transfer efficiency due
to lack of bars, poor
aggregate interlocks or
support erosion
Cross stitching Involves maintaining load transfer across non-
working longitudinal cracks that are in good
condition by preventing horizontal and vertical
movements
Longitudinal joints
likely to faults, sections
showing indication of
slab migration and
weak aggregate
interlocks
Slot stitching Involves repairing of longitudinal cracks and
joints that develop as a result of dowel bar
retrofit treatment by using deformed tie bars
Segments with
longitudinal cracks due
to dowel bar retrofit
treatment
20
Diamond
grinding
Removal of a thin layer of concrete (typically 3
to 6 mm) by using a self-propelled machine
fitted with a series of closely spaced, diamond
saw blades
Areas with faulted
transverse joints over 2
mm, section with
roughness more than
2.5 to 3.5 m/km, low
surface friction and
noise sensitive areas
Diamond
grooving
Cutting of narrow, discrete grooves into the
pavement surface either in the longitudinal or
transverse direction
Sections prone to
hydroplaning or splash
and wet-weather
related accidents
Joint resealing Involves the removal of deteriorated joint
sealant (if present), preparation of the joint side
walls by refacing and pressure-cleaning the sides
and installing new sealant material
Joints with no sealant
or sealant not
functioning as intended
or sealed joints
containing
incompressible
materials
Crack sealing Involves routing, cleaning and sealing cracks
wider than 3 mm (0.125 in) using high-quality
sealant materials to minimize surface water
infiltration into the pavements and slow down
crack deterioration effects
Sections with low to
medium severity levels
of longitudinal and
transverse cracking
with minimal spalling
and faulting
Concrete Overlay Involves placing concrete layer either bonded or
unbonded to an existing pavement surface
Segments with surface
distresses (Overlay
thickness and type
varies based on the
structural integrity of
the existing pavement)
Ultra-thin
wearing course
Consists a thin 10 to 20 mm layer of gap-graded
aggregates and polymer-modified HMA layer
placed on a polymer-modified emulsified
asphalt membrane
Sections with low
frictions or
experiencing
hydroplaning or water
splash. However, its
effectiveness is
compromised by
refractive cracks
Sources: Smith et al. (2014); Van Dam et al. (2015)
21
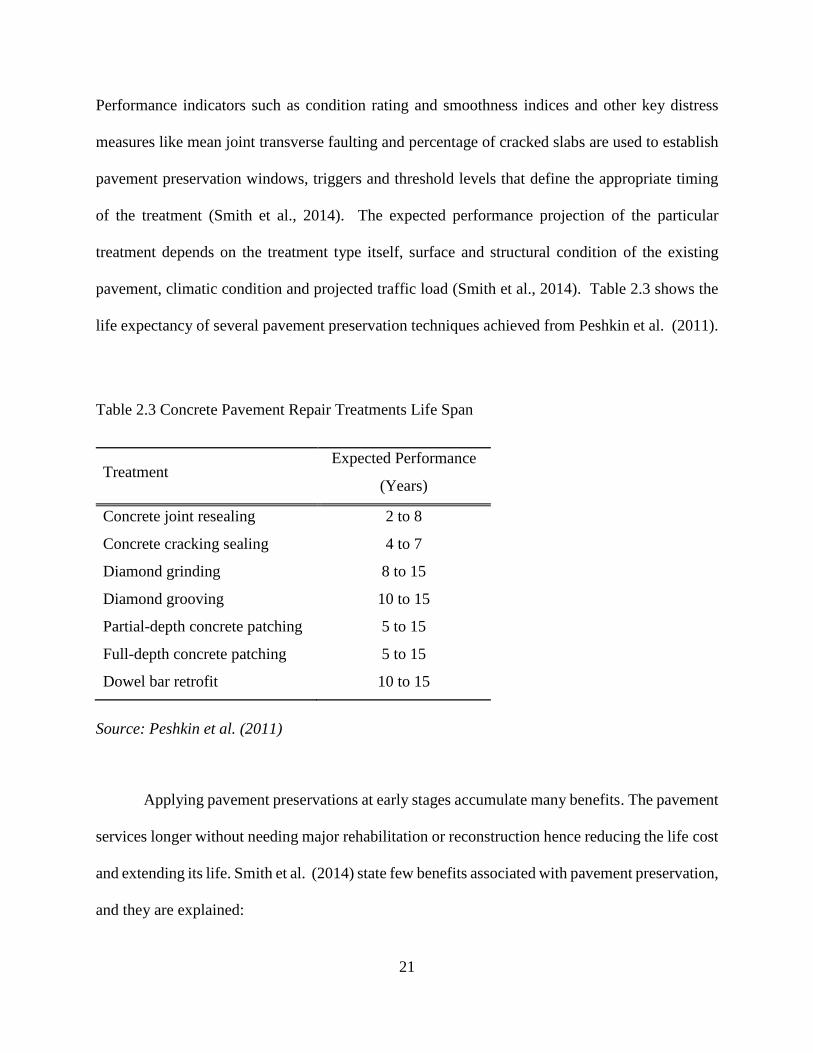
Performance indicators such as condition rating and smoothness indices and other key distress
measures like mean joint transverse faulting and percentage of cracked slabs are used to establish
pavement preservation windows, triggers and threshold levels that define the appropriate timing
of the treatment (Smith et al., 2014). The expected performance projection of the particular
treatment depends on the treatment type itself, surface and structural condition of the existing
pavement, climatic condition and projected traffic load (Smith et al., 2014). Table 2.3 shows the
life expectancy of several pavement preservation techniques achieved from Peshkin et al. (2011).
Table 2.3 Concrete Pavement Repair Treatments Life Span
Treatment Expected Performance
(Years)
Concrete joint resealing 2 to 8
Concrete cracking sealing 4 to 7
Diamond grinding 8 to 15
Diamond grooving 10 to 15
Partial-depth concrete patching 5 to 15
Full-depth concrete patching 5 to 15
Dowel bar retrofit 10 to 15
Source: Peshkin et al. (2011)
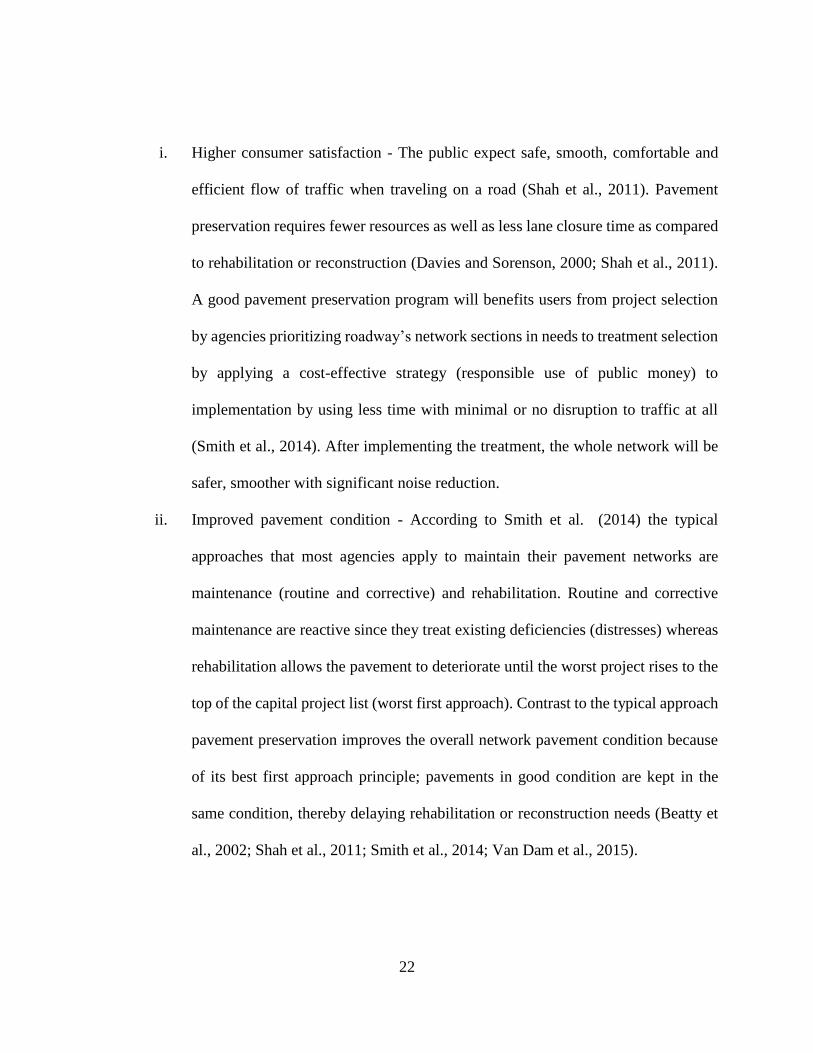
Applying pavement preservations at early stages accumulate many benefits. The pavement
services longer without needing major rehabilitation or reconstruction hence reducing the life cost
and extending its life. Smith et al. (2014) state few benefits associated with pavement preservation,
and they are explained:
22
i. Higher consumer satisfaction - The public expect safe, smooth, comfortable and
efficient flow of traffic when traveling on a road (Shah et al., 2011). Pavement
preservation requires fewer resources as well as less lane closure time as compared
to rehabilitation or reconstruction (Davies and Sorenson, 2000; Shah et al., 2011).
A good pavement preservation program will benefits users from project selection
by agencies prioritizing roadway’s network sections in needs to treatment selection
by applying a cost-effective strategy (responsible use of public money) to
implementation by using less time with minimal or no disruption to traffic at all
(Smith et al., 2014). After implementing the treatment, the whole network will be
safer, smoother with significant noise reduction.
ii. Improved pavement condition - According to Smith et al. (2014) the typical
approaches that most agencies apply to maintain their pavement networks are
maintenance (routine and corrective) and rehabilitation. Routine and corrective
maintenance are reactive since they treat existing deficiencies (distresses) whereas
rehabilitation allows the pavement to deteriorate until the worst project rises to the
top of the capital project list (worst first approach). Contrast to the typical approach
pavement preservation improves the overall network pavement condition because
of its best first approach principle; pavements in good condition are kept in the
same condition, thereby delaying rehabilitation or reconstruction needs (Beatty et
al., 2002; Shah et al., 2011; Smith et al., 2014; Van Dam et al., 2015).
23
iii. Increased safety - Safety of the roadways is a fundamental principle perceived by
the public. Pavement safety is improved by applying treatments that involve polish
resistant aggregates with macrotexture to increase wet-weather surface friction and
avoid sliding and hydroplaning related traffic crashes (Smith et al., 2014).
Pavement systems maintained in a good condition rides smoother with fewer
defects that can jeopardize its safety; also work zone related crashes are reduced
since it requires minimal or no disruptive repairs at all (Smith et al., 2014).
iv. Cost savings - Cost savings of pavement preservation are in terms of using less
expensive treatments which extend the life of the pavement, delaying of more
expensive options like major rehabilitation and reconstruction, and decreased user
cost, vehicle operating costs and work zone crashes due to less time of lane closure
time, smoother roads and few work zones (Smith et al., 2014) Pavement
preservation strategies has saved the Michigan DOT about $700 million in their
five years program (Smith et al., 2008).
For the agency to obtain the optimum benefits of the pavement preservations, Kercher
(2011) suggest the following to be addressed/observed:
i. Selecting the right treatment to be applied to the right section and at the right time
ii. Up to date pavement management system for confident and informed decision
making on the section to be treated, timing, cost associated, expected performance
and future needs of the network
iii. Developing a long-term budget plan that will initially consider both the “worst first
approach” and “best first approach” before shifting completely to the “best first
approach”

24
iv. Involvement of trained personnel in all stages of the project; scope of work and
contract agreement documents are well understood by contractors if
developed/designed by personnel with engineering background and experience
v. Well defined quality control criteria, and threshold levels for payment and
acceptance of work
2.3. Slab Jacking and Slab Stabilization
Slab jacking involves lifting/rising the slab in localized areas where slab
settlement/depression has occurred due to poor foundation support to re-establish a smooth profile
by using flowable material (Smith et al., 2014). Slab jacking is also known as mud jacking but due
to the discovery of other materials apart from cement grouts such as polyurethane, the term mud
jacking is becoming less common. Smith et al. (2014) recommend not to raise a slab more than 6
mm (0.25 in) past the neighboring slab level during material injection to avoid building up of
excessive stresses which are likely to cause cracking.
Slab stabilization is a non-destructive concrete pavement restoration strategy which
involves the injection of flowable material underneath the concrete slab through a 32 to 50 mm
(1.25 to 2.00 in) drilled holes on the slab (American Concrete Pavement Association, 1994; Smith
et al., 2014; Smith, 2005). According to Smith (2005) and American Concrete Pavement
Association (1994), to avoid conical spalling at the bottom of the slab, the downward pressure on
the pneumatic or hydraulic rotary percussion drill should be not more than 890 N (200 lbf.).
In granular subbases or subgrades, injection holes are drilled up to just below the concrete
slabs while in stabilized base the injection holes go to the bottom of the stabilized base since voids
25
are likely to form there (Lee and Shields, 2010; Smith et al., 2014). Sufficient holes should be
drilled not near joints or cracks, but within voids region to ensure that the materials reach the voids.
The drilling pattern of the holes may either be in the wheel path or in the centerline of the lane
depending on the condition to be corrected (Lee and Shields, 2010; Su Jung et al., 2008).
Polyurethane is one among the material used in slab stabilization/jacking, others being
cement-fly ash grouts and asphalt grouts. (Smith et al., 2014; Van Dam et al., 2015).
Polyurethanes used in slab stabilization/slab jacking is a high density expanding foam
formed by blending two components referred as the “A side” which consist of methylene diphenyl
diisocyanate and isocyanates with two or more functional groups (toluene diisocyanate and
diphenylmethane diisocyanate), and the “B side” (or “Resin (R) side”) which is a combination of
polyol compound (polymers with multiple hydroxyl group with repeating structure), catalysts and
water (Chun and Ryu, 2000).
Polyurethane foams are either hydrophilic or hydrophobic depending on their ability to
dissolve in water. Hydrophilic polyurethanes have a high affinity to water and cures to form
flexible foams or gel. They react with water, to create a bond, making them useful for sealing leaks
in cracks and joints. The expansion rate of hydrophilic is 5 to 7 times its original volume, making
them not ideal for slab lifting or stabilization (Yu et al., 2013).
Hydrophobic polyurethanes are made to not react with either gaseous or liquid matter. With
expansion rate of up to 20 times, low viscosity, high tensile and compressive strength, resistant to
freeze/thaw cycles and low thermal conductivity; hydrophobic foams are suitable for PCC slab
settlement mitigations (Yu et al., 2013). They are considered rigid foams due to their low water
26
content, and once cured they tend to not shrink over time (Gaspard and Zhang, 2010; Yu et al.,
2013).
Slab stabilization by polyurethane injection follows in permeation grouting or compaction
grouting ground improvement type depending on whether the hydrophobic foam is a single
component or two components respectively (Yu et al., 2013). Permeation grouting is mostly
applied in asphalt roadways and for sealing water leaks through cracks on concrete structures,
whereas compaction grouting is practical in filling voids and/or lifting concrete roadways,
sidewalks, approach slabs, and sunken tanks (Yu et al., 2013).
Slab stabilization is intended to fill the voids in the layer supporting the concrete, not to
raise the slab; by filling the voids deflection is reduced, and distress related deflections, such as
pumping and faulting are also minimized (American Concrete Pavement Association, 1994; Lee
and Shields, 2010; Smith, 2005; Smith et al., 2014). If the main purpose of the project is to raise
or level settled concrete slabs, slab jacking should be opted. In cases where slab stabilization and
slab jacking are performed simultaneously flowability of the material should be observed.
A successful slab stabilization strategy is a function of (1) accurate detection of voids, (2)
suitable materials and quantity required (3) optimal time for stabilization, and (4) appropriate
construction practices (American Concrete Pavement Association, 1994). In some situation, slab
stabilization is accompanied by other pavement restoration treatments such as diamond grinding
and slab jacking (Smith et al., 2014).
For optimum performance of slab stabilization, the technique should be used before the
occurrence of distresses caused by loss of supports such as faulting, pumping and corner breaks
(American Concrete Pavement Association, 1994; Smith et al., 2014).

27
Polyurethane injection is preferred over other slab stabilization/jacking treatment
technique such as grout injection and mud jacking because of their lack of standard procedures,
stresses induced in the slabs due to large access holes, grout spread limitation into voids, and curing
time of the material before the lane is open to traffic (Brewer et al., 1994; Soltesz, 2002). The
efficiency of the slab stabilization technique is influenced by the voids underneath the slab; excess
injection of the material introduces stresses in the slab and accelerates the development of cracks.
2.4. Case Studies on Applications of HDP Foams
The Pennsylvania DOT used high-density polyurethane (HDP) to rehabilitate a section on
U.S. Highway 402 of 9 km (5.60 mi)-four lane, divided highway, supported on an open-graded
stone subbase; the intended task was to stabilize the open-graded stone subbase layer, mitigate
faulting, and improve joint load transfer efficiency. The HDP foams were injected into the holes
at a maximum flow rate and pressure of 272 kg/min (560 lb/min) and 378 kPa (54.82 psi)
respectively (Vennapusa and White, 2015; Vennapusa et al., 2016).
The performance of the Pennsylvania DOT treated section assessed by Vennapusa and
White (2015) identified the following; (1) average IRI increased from 1.70 m/km (107.71 in/mi)
to 1.90 m/km (120.38 in/mi), indicating poor pavement surface levelling control, (2) spatial extent
of foam propagation in the subbase layer ranged between 0.3 m (1.00 ft) and 1.0 m (3.28 ft) from
the injection points, concentrated zones of foam mixed with subbase had low permeability, low
stiffness, and high shear strength when compared to untreated areas, (3) falling weight
deflectometer (FWD) tests indicated statistically significant improvement near cracks, load
transfer efficiency (LTE) increased from about 15% before treatment to about 45% shortly after
treatment and 86% after dowel bar retrofitting, no improvements were observed near slab joints or

28
at mid-panel, (4) HDP injection minimized faulting of the cracks despite measurements from the
robotic total station showing that pavement panels were raised by 6 mm (0.24 in) on average with
a standard deviation of 3 mm (0.12 in), exceeding 1.3 mm (0.05 in) as in the project specification.
Soltesz (2002) evaluated the performance of URETEK® injected by the Oregon DOT to
raise, stabilize and realign sections of Glenn Jackson Bridge and its adjacent concrete slabs. The
test site was monitored for elevation changes, hole infiltration and water permeability, and
compressive strength. In this project the following were found; (1) injected polyurethane raised
the slab to the target profile, but slabs sunk up to 10.5 mm (0.41 in) after two years of injection,
the cause of the settling was not investigated, and it was not known if it will continue, (2) HDP
can penetrate through small openings such as 3.20 mm (0.13 in) due to its ability to flow, and
protect the subgrade from water infiltration, and (3) compressive strength of HDP did not decrease
after 23 days of exposure to air and ground condition.
The Wisconsin DOT used URETEK® material to rectify settled slabs near the bridge
approach, the task took longer and more materials than expected, pavement ride quality was
improved but fine cracks developed in the treated slabs. These cracks were likely caused by
stresses induced during the injection process, and they were likely to reduce the service life of the
slabs if left unattended (Al-Eis and LaBarca, 2007). The following were recommended for the use
of URETEK® material for slab stabilization; (1) application of URETEK® is practical for high
volume roads where lane closure time is very important, (2) due to likelihood of inducing cracks
into slabs sagging in the middle, polyurethane injection may be substituted with slab replacement
or concrete grouting for good performance of the slab, and (3) to reasonably estimate the cost
associated with the procedure, ground penetrating radar (GPR) should be used to estimate the
amount of material required to fill the voids (Al-Eis and LaBarca, 2007).
29
Gaspard and Zhang (2015) assessed the performance of polyurethane foam in the reduction
of faulting by approximately 6.35 mm (0.25 in) on the jointed concrete pavement, the LA 1 by
pass in Natchitoches, Louisiana an urban principal arterial roadway with the average daily traffic
of 15,800, of which 20% were trucks. Its typical section consisted of a 230 mm (9 in) thick PCC
pavement with a 150 mm (6 in) thick soil cement base course and asphaltic concrete shoulders,
supported by group A-2-4 and A-4 soils. PCC slabs had faulted to about 25 mm (1 in) with IRI
ranging from 2.37 to 7.10 m/km (150 to 450 in/mi). Pre-and post-measurements of faulting were
measured using a high-speed profiler and manual faults measurements, IRI was measured using a
high-speed profiler too, and the Australian Road Research Board (ARRB) walking profiler.
Moreover, in Gaspard and Zhang's (2015) study, FWD was used to measure LTE at the
joints, void potential beneath the slab and slab deflection. In addition, to compare the free rise and
confined polyurethane foams density and strength, polyurethane was injected in cylindrical 76.20
mm (3 in) diameter by 76.20 mm (3 in) height molds; and core samples were taken from the
concrete slab and cement treated base course. Based on their findings, the polyurethane foam fault
correction process was not recommended for pavement preservation as it neither improve the ride
quality nor eliminates faulting as expected. Also, LTE was significantly reduced which was
accompanied by deflection increases in the slab as well as in the joints.
To evaluate the effectiveness of the URETEK® method applied by the Michigan DOT,
Opland and Barnhart (1995) conducted a study on three selected tests section of interstate I-75 in
Monroe County, on trucks lane with 254 - 280 mm (10 –11 in) thick reinforced concrete slabs,
resting on an open-graded base course. Improvements in the base support were significantly
observed at areas where slabs were severely damaged or cracked as compared to where the cracks
were hairline or open by 3.18 mm (0.13 in). However, in areas were the slabs were severely faulted

30
the material raised the slab and provided a temporary base stability. Also, one year after injection
of the material, ride quality and LTE at cracks and joints were approximately the same as before
application of the material. This study recommended the use of URETEK® as an alternate (not a
substitute) of mud jacking on concrete pavements supported on open-graded base course until
adequate experience and knowledge on the limitations and capabilities of the material is gained by
the DOT.
In 2011, the Missouri DOT applied URETEK® on a subbase and its underlaying layer to
rapidly improve its load-bearing capacity before placing an asphaltic base layer. FWD tests
conducted after several hours of complete deep injection showed an improvement in stiffness of
about 40%, and after the application of Geogrid and a 95.25 mm (3.75 in) layer of HMA wearing
course. FWD test results showed a stiffness increase of about 70% as compared to the benchmark
tests. After five years of in service, FWD test resulted in an average back calculated subgrade
modulus of 160 MPa (23,000 psi), an improvement of about 160% compared to the benchmark
tests. In general, no individual location had stiffness below 140 MPa (20,000 psi) whereas several
benchmarks had low stiffness moduli of up to 30 MPa (4,000 psi) (Boudreau et al., 2017).
On behalf of the Louisiana DOT, Gaspard and Morvant (2004) assessed the performance
of URETEK® material for leveling and void filling on CRCP and bridge approaches; whereas on
JPCP it was used to reduce faulting, filling voids and under seal. IRI was reduced from 33 to 68%
on CRCP and bridge approach slabs depressions decreased by 50 mm (2 in). Cores obtained from
CRCP and bridge approach slabs had dense polyurethane while those from JPCP had layers
ranging from soft to dense. The study recommended the polyurethane injection process to be
included as an alternative to other rehabilitation methods such as asphaltic concrete overlay and
patching. It also recommended that polyurethane suppliers and contractor should develop a

31
detailed laboratory testing protocol that will address the mechanical properties of the material
under different curing and injection condition, long-term durability of the material under repeated
traffic loading and environmental conditions, and field-testing method and quality assurance
values.
To stabilize a section of I 86 in Hartford, Vermont showing indication of subsurface
instability, the Vermont Transportation Agency opted to inject URETEK® 486. Based on the 2007
non-invasive and non-destructive testing (NDT) report of Applied Research Associates’
Consultants, 50,350 kg (111,000 lbs.) of foams were planned to be used, the project was delayed
to 2013 and 113232 kg (249,634 lbs.) were injected instead. Also, the FWD tests indicated
improvements, although some locations which previously weresubsidence had high stiffness
modulus compared to after injecting the foam. The site is still being studied for the agency to reach
a conclusion on the use of URETEK® 486 for slab stabilization. However, the section had not
required any maintenance, two years after injection of the material (Ellis, 2015).
2.5. Summary
Literature were reviewed on most common rigid pavement distresses, rigid pavement
preservation strategies, slab stabilization/jacking and several case studies of previous projects
which used HDP foams to stabilize and lift settled concrete slabs. These projects have shown that
slab drop-off (faulting) is caused by loss of foundation support due to either weak base/subgrade,
poor compaction and/or erosion of subgrade materials due to pumping. To rectify defects
associated with distresses, DOTs have established preservation strategies which specify when and
where a specific treatment(s) should be applied. Unattended distress not only they deteriorate the

32
condition of the pavement but also poses safety hazards to road users. Slab stabilization and slab
liftings are among the pavement treatments, they are applied to fill voids underneath the pavement
and level the sunken slab respectively. HDP foams are showing to be the most effective materials
for slab stabilization/jacking.
DOTs have conflicting experience on the effectiveness of HDP foams in rectifying faulting
defects in JPCPs. While others have reported an increase of IRI, joint faulting, and LTE, some
experienced a decrease of these indicators after application of polyurethane materials. Early
hairline cracks were observed due to stresses induced because of excessive injection of the
materials. Due to lack of detailed ground investigation, some DOTs used more materials than
specified in the project documents.
This study seeks to evaluate the performance of PolyLevel®, HDP foams injected by the
Tennessee DOT underneath settled concrete slabs with a thickness of 250 mm (10 in), resting on
granular base by assessing their transverse joint faulting before and after application of the
material. To obtain transverse joint faulting measurements of the treated sections, raw longitudinal
profile data were collected by a standard inertial profiler and analyzed using ProVAL software. In
general, the performance of polyurethane treated section is significantly affected by the soundness
of the slabs, type of foundation soils, and traffic loading and volume.
33
CHAPTER III
METHODOLOGY
This study evaluates the performance of five concrete pavement sections treated with high-
density polyurethane (HDP) material. Transverse joint faulting among the concrete slabs is
analyzed to assess the performance of the polyurethane material over time. Apart from other
distresses such as cracking or spalling, transverse joint faulting is among the factors influencing
smoothness of rigid pavement surface.
The study was performed on raw longitudinal profile data collected for a Tennessee DOT
project from March 2015 to March 2018. The data was collected by a Tennessee DOT contractor
using a standard inertial profiler at a sampling interval of 26.28 mm (1.03 in) before and after
injection of HDP foams. Profile viewing and analyzing (ProVAL) software was used to analyze
the raw profile data to obtain transverse joint faulting measurements before and after application
of the polyurethane material.
3.1. Data Collection
As alluded earlier, this research was conducted on five sections of U.S. Interstate I-75 and
I-24 as shown in Table 3.1 with distances ranging from 482.8 m (0.3 mi) to 3220 m (2.0 mi).
The sections were constructed of plain jointed concrete with a slab thickness 250 mm (10
in), resting on granular base. As per 2017 TDOT traffic data log the average annual daily traffic

34
(AADT) of treated sections on I-24 East and I-24 West was 134740 vehicles per day and 119930
vehicles per day respectively, with trucks representing 18.50% of the AADT. The AADT of treated
sections on I-75 was 77150 vehicles per day; of which 14.5% were trucks. In Table 3.1, the treated
lanes are counted from the left of the direction of travel; for instance, on section I-24 West, lane
No. 2 was the one treated with HDP foams.
Table 3.1 Sections Treated With Polyurethane Material
Section ID Start Mile End Mile Distance(mi) Treated
Lane ID
I-24 West 179.50 178.20 1.30 2
I-24 East 182.35 183.00 0.65 3
I-24 East Moore Bridge McBrien Bridge 0.30 2
I-75 North 7.00 9.00 2.00 3
I-75 South 9.00 7.00 2.00 3
Raw longitudinal profiler data were collected before and after application of the HDP
foams using a standard inertial profiler. These data are analyzed using the automated faulting
measurement (AFM) and ride quality module to transverse joint faulting and roughness indices
(IRI and MRI) respectively.
Apart from the raw longitudinal profile data, ProVAL AFM module requires joint spacing,
segment length, and joint window (i.e., uncertainty for joint location) as inputs for calculating the
transverse joint faulting. The joint spacing and joint width were retrieved from TDOT standard
and it specifies a joint spacing of 4.57 m (15 ft) and joint width of 25 mm (1 in). The default value
for joint window in ProVAL is 50 mm (2 in), and it is adopted in this study.
35
3.2. Data Analysis
Raw longitudinal profile data collected using a standard inertial profiler was imported into
ProVAL software for analysis. In ProVAL, sections were divided into segments of 100 m length,
if the analysis is conducted in U.S. customary units, the segment length shall be 0.1 mi (American
Association for State and Highway Transportation Officials, 2017).
The number of segments (samples) ranged from five to thirty-three depending on the length
of the section. I-24 East_Moore is the shortest section; hence it has the fewest number of segments
(i.e., five) whereas I-75 sections are the longest, with thirty-three segments.
The ride quality and AFM module in ProVAL was used to analyze the raw longitudinal
profile data for IRI and transverse joint faulting respectively. After the ProVAL analysis, the
outputs were exported into Excel® spreadsheets for statistical analysis, which was achieved by
using R programming software.
3.3. Joint/Cracks Detections and Faults Computation
The ProVAL AFM module has three techniques for detecting joints/cracks in the
longitudinal profile, which are down spike, step, and curled edge (Chang et al., 2012; The Transtec
Group, 2016). These three techniques are now briefly described.
The down spike method is partly based on the FHWA curl-wrap method. Developed by
Steve Karamihas for the FHWA, the FHWA curl-wrap method follows these four steps; profile
filtering, identification of deepest dips, dip count assembling across the data count, and
identification of joint location. It is effective for multiple profile runs collected at small sampling
interval with clear down ward spikes at joints. The down spike method is suited for slabs with

36
down spike with less or no sealant at all between the joints, and longitudinal profile collected at
small sampling interval.
The step method is based on the Mississippi DOT joint/crack identification method. It was
developed using longitudinal profile data collected at a sampling interval of 12.70 mm (0.50 in).
Joint faulting is detected if the elevation differences among the adjacent sampling is greater than
2.03 mm (0.08 in). The Mississippi DOT approach is effective for network level joint faulting
survey. However, there is no study which has confirmed that it is efficient beyond the required
12.70 mm (0.50 in) sampling interval.
The curled edge method was developed by the ProVAL team for differential elevation due
to slab curling. Curling is a deformation that occurs due to the difference in temperature across the
depth of a concrete slab. Apart from stresses induced in the slab due to temperature variation, slab
curling also affects the surface smoothness of the pavement. On a half car roughness index, impacts
of slab curling are as high as about 0.63 m/km (39.92 in/mi), with an average of 0.16 m/km (10.14
in/mi) (Chang et al., 2010).
In this study, the down spike method was used because prior to sections’ treatment with
polyurethane, sections showed indication of spikes, there was no sign of slab curling. The step
method was not used since the longitudinal profiles were collected at a sampling interval of 26.28
mm (1.03 in), and no studies have shown the efficiency of the step method beyond its required
sampling interval of 12.7 mm (0.50 in). The following are the steps in analyzing of longitudinal
profiles as described in AASHTO R 36-17 and Chang et al. (2012) for joints or cracks
identification:
37
i. After collection of longitudinal profiles along the section of interest using a high-
speed inertial profiler; anti-smoothing filtering is performed using a moving
average filter at a cutoff of 250 mm (9.84 in)
ii. The filtered profile is normalized by its root mean square to obtain unitless spike
profile
iii. Identification of locations in which the spike profile values exceed the threshold
values (the starting threshold value is -4)
iv. Values from (iii) above are screened to differentiate between joints and cracks
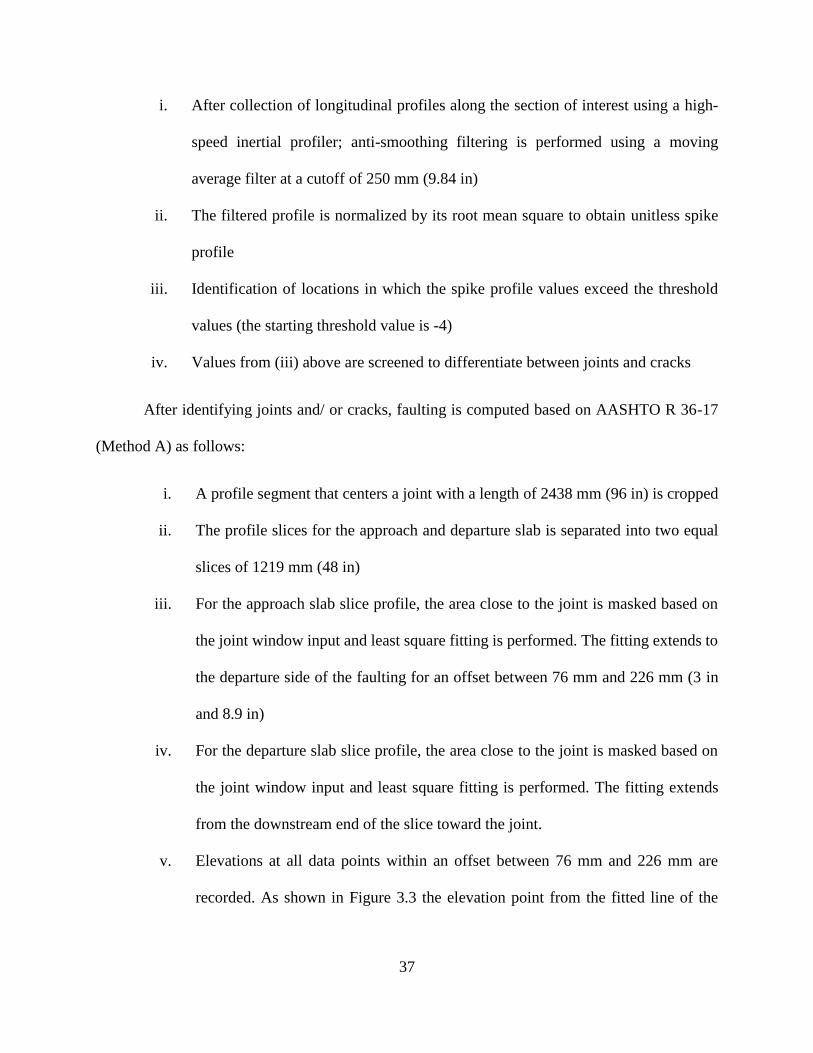
After identifying joints and/ or cracks, faulting is computed based on AASHTO R 36-17
(Method A) as follows:
i. A profile segment that centers a joint with a length of 2438 mm (96 in) is cropped
ii. The profile slices for the approach and departure slab is separated into two equal
slices of 1219 mm (48 in)
iii. For the approach slab slice profile, the area close to the joint is masked based on
the joint window input and least square fitting is performed. The fitting extends to
the departure side of the faulting for an offset between 76 mm and 226 mm (3 in
and 8.9 in)
iv. For the departure slab slice profile, the area close to the joint is masked based on
the joint window input and least square fitting is performed. The fitting extends
from the downstream end of the slice toward the joint.
v. Elevations at all data points within an offset between 76 mm and 226 mm are
recorded. As shown in Figure 3.3 the elevation point from the fitted line of the

38
approach slab slice is recorded as 𝑃1𝑖, and its corresponding elevation points from
the departure slab slice as 𝑃2𝑖.
vi. The faulting value is computed by averaging the difference between the elevations
data points (𝑃1𝑖 and 𝑃2
𝑖) obtained in iv above.
Figure 3.1 Cropped profile slices curve fitting and faulting computation (Source: Chang et al.
[2012])
The ProVAL AFM module gives three outputs when exported into Excel® spreadsheets;
joint locations which indicate where joints/cracks are located, faulting summary that summarizes
maximum and accumulated faulting in every segment for the entire test section, and faulting details
which show faulting value at every joint and/or crack detected.
39
CHAPTER IV
RESULTS AND ANALYSIS
Trigger levels for highway rehabilitation/maintenance are established by state DOTs or the
FHWA depending on the jurisdiction under which the roadway falls. Threshold levels for concrete
pavement condition rating indicators such as roughness, mean joint faulting and slab cracking are
defined and established; road section maintenance/repair needs should be addressed when the
threshold values exceed the trigger level set for the particular road functional class. All the three
indicators mentioned above contribute to pavement ride quality.
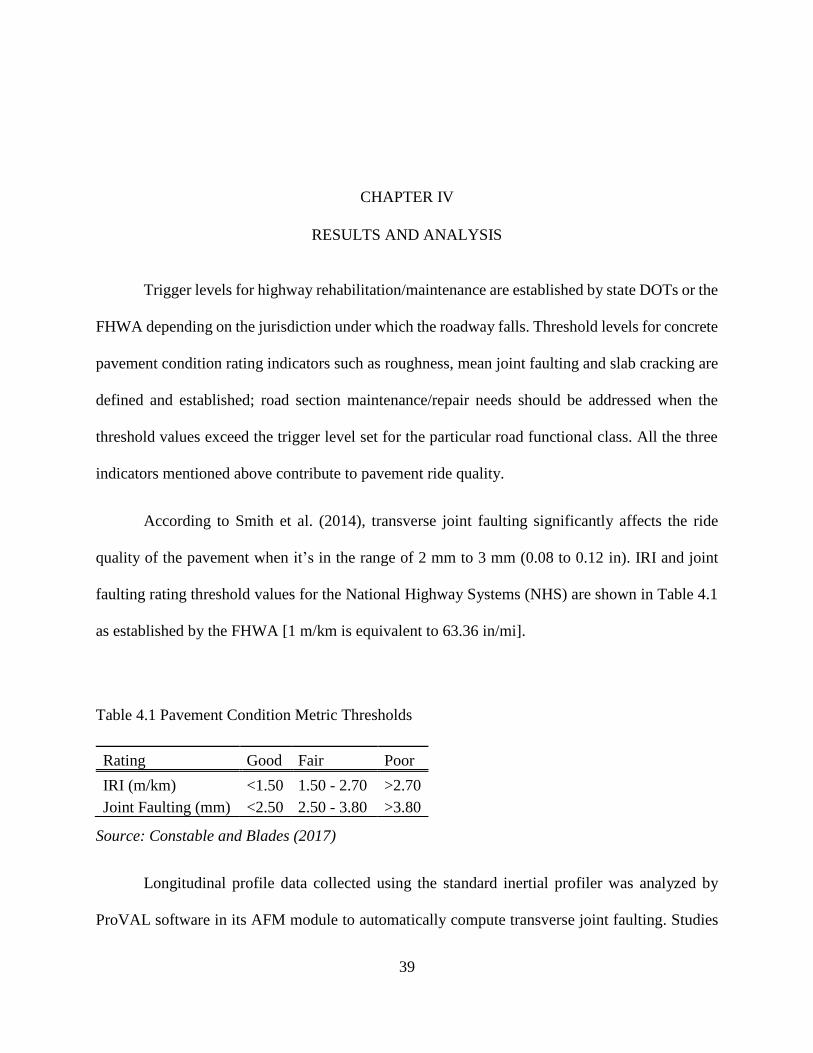
According to Smith et al. (2014), transverse joint faulting significantly affects the ride
quality of the pavement when it’s in the range of 2 mm to 3 mm (0.08 to 0.12 in). IRI and joint
faulting rating threshold values for the National Highway Systems (NHS) are shown in Table 4.1
as established by the FHWA [1 m/km is equivalent to 63.36 in/mi].
Table 4.1 Pavement Condition Metric Thresholds
Source: Constable and Blades (2017)
Longitudinal profile data collected using the standard inertial profiler was analyzed by
ProVAL software in its AFM module to automatically compute transverse joint faulting. Studies
Rating Good Fair Poor
IRI (m/km) <1.50 1.50 - 2.70 >2.70
Joint Faulting (mm) <2.50 2.50 - 3.80 >3.80

40
have shown that AFM results/values are not statistically different from those obtained by using an
absolute manual faultmeter such as the Georgia faultmeter (Chang et al., 2012). Also, AFM has
the advantage of being safe as it does not expose the crew conducting the survey to traffic and no
lane closure or traffic control is required since the high-speed inertial profiler can travel at the
prevailing traffic speed.
The AFM module can be applied at all levels; AASHTO R 36-17 specifies a minimum
sampling interval of 19 mm (0.75 in) for a site-specific project and 38 mm (1.50 in) for a network
level project, profiles must be recorded on both the left and right wheel path/track.
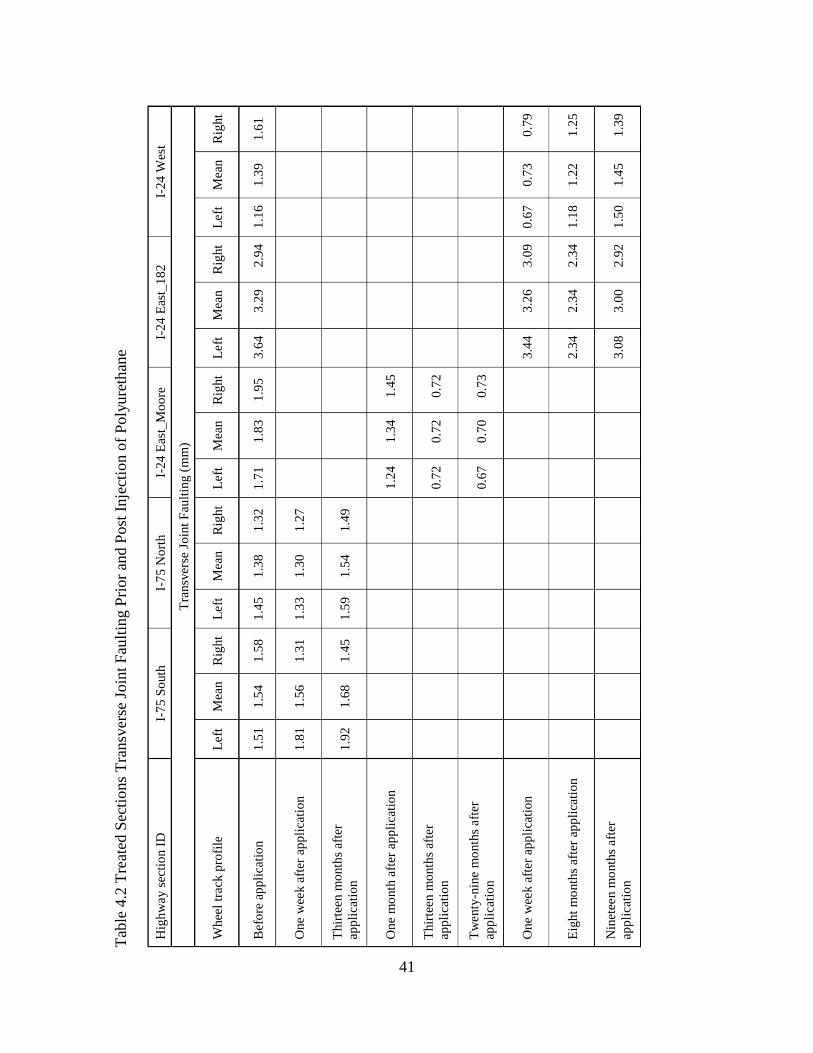
4.1. Results
Transverse joint faulting is considered positive when the approach slab is higher than the
departure slab, and vice versa is true for negative faulting. The overall transverse joint faulting
values of the sections were calculated by averaging the absolute individual faulting values at every
joint/crack detected in the specific section. The raw longitudinal profile data collected before and
after application of HDP foams were analyzed in ProVAL to obtain transverse joint faulting and
IRI. Table 4.2 and 4.3 summarize transverse joint faulting values and IRI measurements of the five
treated sections. Values were computed for both wheel track (left and right), and then averaged.
In this study, the mean values were used for judging whether the transverse joint faulting
or IRI increased/decreased after application of HDP foams. The decrease in either transverse joint
faulting or IRI indicates improvement in ride quality, while vice versa is true for the decrease.
Statistical analysis was conducted to evaluate if the changes were significant, and its results are
presented in the progressing section.
41
T
able
4.2
Tre
ated
Sec
tio
ns
Tra
nsv
erse
Join
t F
ault
ing P
rior
and P
ost
Inje
ctio
n o
f P
oly
ure
than
e
Hig
hw
ay s
ecti
on I
D
I-7
5 S
outh
I-
75
No
rth
I-
24
Eas
t_M
oo
re
I-2
4 E
ast_
18
2
I-2
4 W
est
Tra
nsv
erse
Jo
int
Fau
ltin
g (
mm
)
Whee
l tr
ack p
rofi
le
Left
M
ean
R
ight
Left
M
ean
R
ight
Left
M
ean
R
ight
Left
M
ean
R
ight
Left
M
ean
R
ight
Bef
ore
ap
pli
cati
on
1.5
1
1.5
4
1.5
8
1.4
5
1.3
8
1.3
2
1.7
1
1.8
3
1.9
5
3.6
4
3.2
9
2.9
4
1.1
6
1.3
9
1.6
1
One
wee
k a
fter
ap
pli
cati
on
1
.81
1.5
6
1.3
1
1.3
3
1.3
0
1.2
7
Thir
teen
mo
nth
s af
ter
app
lica
tio
n
1.9
2
1.6
8
1.4
5
1.5
9
1.5
4
1.4
9
One
mo
nth
aft
er a
pp
lica
tio
n
1.2
4
1.3
4
1.4
5
Thir
teen
mo
nth
s af
ter
app
lica
tio
n
0.7
2
0.7
2
0.7
2
Tw
enty
-nin
e m
onth
s aft
er
app
lica
tio
n
0.6
7
0.7
0
0.7
3
One
wee
k a
fter
ap
pli
cati
on
3.4
4
3.2
6
3.0
9
0.6
7
0.7
3
0.7
9
Eig
ht
mo
nth
s af
ter
app
lica
tio
n
2
.34
2.3
4
2.3
4
1.1
8
1.2
2
1.2
5
Nin
etee
n m
onth
s aft
er
app
lica
tio
n
3
.08
3.0
0
2.9
2
1.5
0
1.4
5
1.3
9
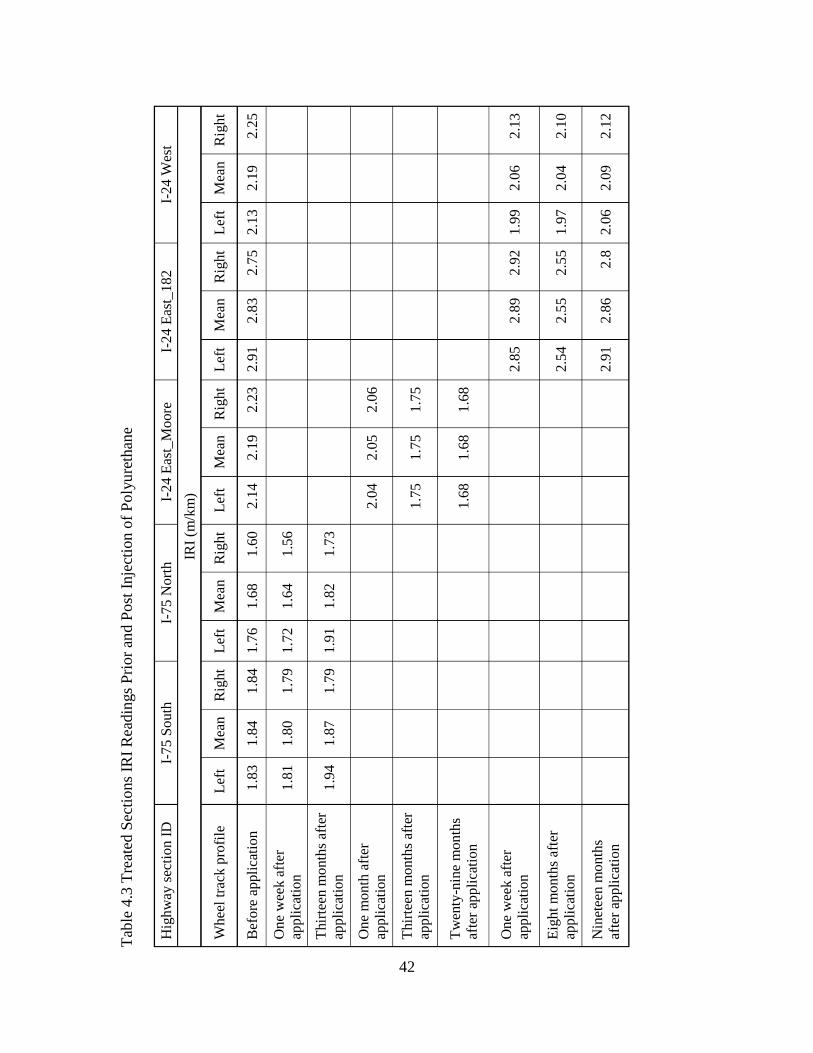
42
Tab
le 4
.3 T
reat
ed S
ecti
ons
IRI
Rea
din
gs
Pri
or
and P
ost
Inje
ctio
n o
f P
oly
ure
than
e
Hig
hw
ay s
ecti
on
ID
I-
75
So
uth
I-
75 N
ort
h
I-24 E
ast_
Moore
I-
24
Eas
t_1
82
I-2
4 W
est
IRI
(m/k
m)
Whee
l tr
ack p
rofi
le
Lef
t M
ean
Rig
ht
Lef
t M
ean
Rig
ht
Lef
t M
ean
Rig
ht
Lef
t M
ean
Rig
ht
Lef
t M
ean
Rig
ht
Bef
ore
ap
pli
cati
on
1.8
3
1.8
4
1.8
4
1.7
6
1.6
8
1.6
0
2.1
4
2.1
9
2.2
3
2.9
1
2.8
3
2.7
5
2.1
3
2.1
9
2.2
5
One
wee
k a
fter
appli
cati
on
1.8
1
1.8
0
1.7
9
1.7
2
1.6
4
1.5
6
Thir
teen
mo
nth
s af
ter
appli
cati
on
1.9
4
1.8
7
1.7
9
1.9
1
1.8
2
1.7
3
One
month
aft
er
appli
cati
on
2.0
4
2.0
5
2.0
6
Thir
teen
mo
nth
s af
ter
appli
cati
on
1.7
5
1.7
5
1.7
5
Tw
enty
-nin
e m
on
ths
afte
r ap
pli
cati
on
1.6
8
1.6
8
1.6
8
One
wee
k a
fter
appli
cati
on
2
.85
2.8
9
2.9
2
1.9
9
2.0
6
2.1
3
Eig
ht
month
s af
ter
appli
cati
on
2
.54
2.5
5
2.5
5
1.9
7
2.0
4
2.1
0
Nin
etee
n m
on
ths
afte
r ap
pli
cati
on
2
.91
2.8
6
2.8
2
.06
2.0
9
2.1
2

43
4.2. Statistical Analysis
The maximum transverse joint faulting values at every 100 m segment data was used for a
paired t-test using the R programming software. These data are assumed to be normally distributed,
as they were tested and their quantile-quantile (qq) plots are presented in Appendix C. The paired
t-tests were carried out to assess statistical significant changes at a confidence interval of 95% in
the means of the maximum faulting values before and after application of the polyurethane
material. The null hypothesis assumes that there is no significant difference between the means
and vice versa is true for the alternative hypothesis. The null hypothesis is rejected if the p-value
is below 0.05 and it indicates that the difference is statistically significant.
Table 4.4 shows a paired t-test of the maximum faulting values of before versus those
collected one week after application of HDP foams on section I-75 South and I-75 North. For both
sections, the p values are greater than 0.05 indicating that there were no statistical significant
changes between before and one week after application of the material.
Table 4.4 Paired t-tests for Before Application Against One Week After Application for I-75
South and North
Highway section ID Wheel track P-value Remarks
One
wee
k a
fter
appli
cati
on
I-75 South Left 0.5433 Accept the null hypothesis
Right 0.1399 Accept the null hypothesis
I-75 North Left 0.7124 Accept the null hypothesis
Right 0.1886 Accept the null hypothesis

44
Results of the paired t-test done on section I-75 South and I-75 North thirteen months after
application of polyurethane material are shown in Table 4.5. As it was one week after application
of the material (Table 4.4), still there were no statistical significant changes of transverse joint
faulting thirteen months after application of HDP foams as the p values are greater than 0.05.
Table 4.5 Paired t-tests for Before Application Against Thirteen Months After Application for I-
75 South and North
Highway section ID Wheel track P-value Remarks
Thir
teen
month
s
afte
r ap
pli
cati
on
I-75 South Left 0.3839 Accept the null hypothesis
Right 0.1451 Accept the null hypothesis
I-75 North Left 0.1344 Accept the null hypothesis
Right 0.3456 Accept the null hypothesis
Section I-24 East_Moore is the shortest sections of all the five test sections, therefore it has
the fewest segments number in it (i.e., five segments). The paired t-test conducted on the data
obtained one month after application of the material on this section showed that there were no
significant changes since the p-values are greater than 0.05 (Table 4.6). However, the paired t-test
indicated that the changes in transverse joint faulting are statically significant thirteen and twenty-
nine months after application of the material (p values are smaller than 0.05).

45
Table 4.6 Paired t-tests Analysis of I-24 East_Moore
Wheel track P-value Remarks
One month after
application
Left 0.1025 Accept the null hypothesis
Right 0.0699 Accept the null hypothesis
Thirteen months
after application
Left 0.0363 Reject the null hypothesis
Right 0.0239 Reject the null hypothesis
Twenty-nine
months after
application
Left 0.0031 Reject the null hypothesis
Right 0.0054 Reject the null hypothesis
Table 4.7 shows a paired t-test of the maximum transverse joint faulting values of before
versus those collected one week after application of HDP foams on section I-24 East_182 and I-
24 West. For both sections, the p values are greater than 0.05 indicating that there were no
statistical significant changes between before and one week after application of the material.
Table 4.7 Paired t-tests for Before Application Against One Week After Application for I-24
East_182 and I-24 West
Highway section ID Wheel track P-value Remarks
One
wee
k a
fter
appli
cati
on
I-24 East_182 Left 0.9928 Accept the null hypothesis
Right 0.3985 Accept the null hypothesis
I-24 West Left 0.1715 Accept the null hypothesis
Right 0.1871 Accept the null hypothesis
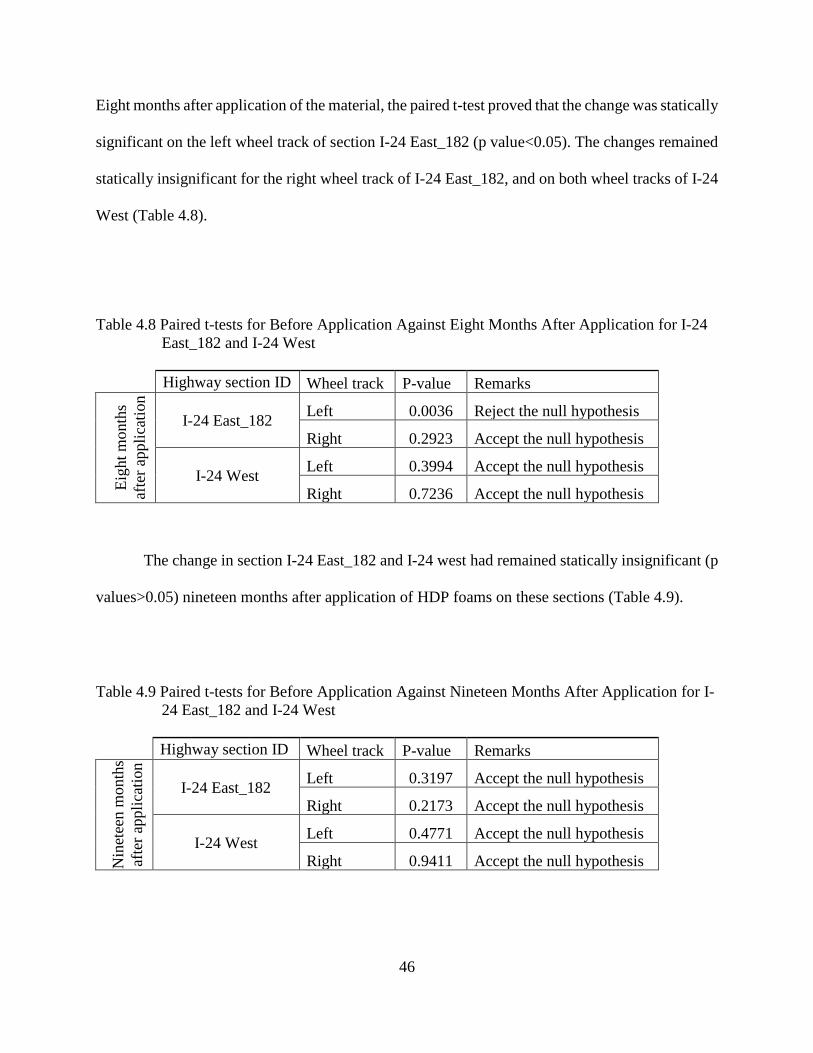
46
Eight months after application of the material, the paired t-test proved that the change was statically
significant on the left wheel track of section I-24 East_182 (p value<0.05). The changes remained
statically insignificant for the right wheel track of I-24 East_182, and on both wheel tracks of I-24
West (Table 4.8).
Table 4.8 Paired t-tests for Before Application Against Eight Months After Application for I-24
East_182 and I-24 West
Highway section ID Wheel track P-value Remarks
Eig
ht
month
s
afte
r ap
pli
cati
on
I-24 East_182 Left 0.0036 Reject the null hypothesis
Right 0.2923 Accept the null hypothesis
I-24 West Left 0.3994 Accept the null hypothesis
Right 0.7236 Accept the null hypothesis
The change in section I-24 East_182 and I-24 west had remained statically insignificant (p
values>0.05) nineteen months after application of HDP foams on these sections (Table 4.9).
Table 4.9 Paired t-tests for Before Application Against Nineteen Months After Application for I-
24 East_182 and I-24 West
Highway section ID Wheel track P-value Remarks
Nin
etee
n m
onth
s
afte
r ap
pli
cati
on
I-24 East_182 Left 0.3197 Accept the null hypothesis
Right 0.2173 Accept the null hypothesis
I-24 West Left 0.4771 Accept the null hypothesis
Right 0.9411 Accept the null hypothesis
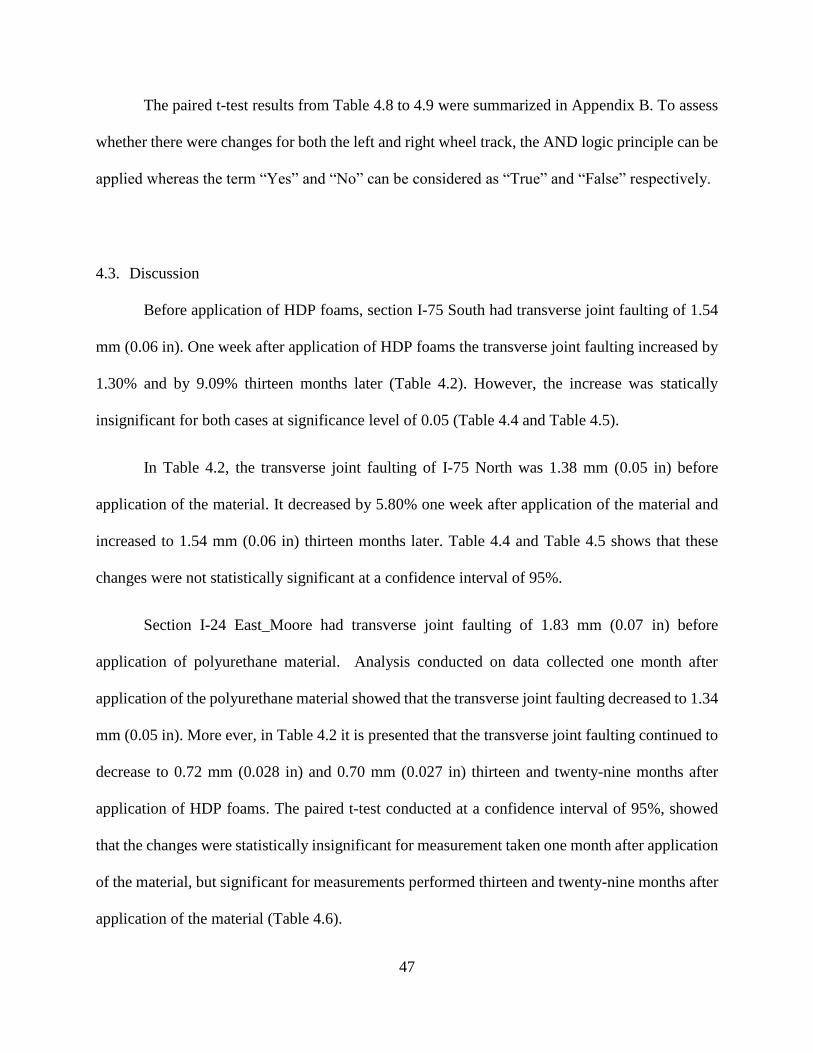
47
The paired t-test results from Table 4.8 to 4.9 were summarized in Appendix B. To assess
whether there were changes for both the left and right wheel track, the AND logic principle can be
applied whereas the term “Yes” and “No” can be considered as “True” and “False” respectively.
4.3. Discussion
Before application of HDP foams, section I-75 South had transverse joint faulting of 1.54
mm (0.06 in). One week after application of HDP foams the transverse joint faulting increased by
1.30% and by 9.09% thirteen months later (Table 4.2). However, the increase was statically
insignificant for both cases at significance level of 0.05 (Table 4.4 and Table 4.5).
In Table 4.2, the transverse joint faulting of I-75 North was 1.38 mm (0.05 in) before
application of the material. It decreased by 5.80% one week after application of the material and
increased to 1.54 mm (0.06 in) thirteen months later. Table 4.4 and Table 4.5 shows that these
changes were not statistically significant at a confidence interval of 95%.
Section I-24 East_Moore had transverse joint faulting of 1.83 mm (0.07 in) before
application of polyurethane material. Analysis conducted on data collected one month after
application of the polyurethane material showed that the transverse joint faulting decreased to 1.34
mm (0.05 in). More ever, in Table 4.2 it is presented that the transverse joint faulting continued to
decrease to 0.72 mm (0.028 in) and 0.70 mm (0.027 in) thirteen and twenty-nine months after
application of HDP foams. The paired t-test conducted at a confidence interval of 95%, showed
that the changes were statistically insignificant for measurement taken one month after application
of the material, but significant for measurements performed thirteen and twenty-nine months after
application of the material (Table 4.6).

48
Section I-24 East_182 and I-24 West had transverse joint faulting of 3.29 mm (0.13 in) and
1.39 mm (0.055 in) respectively before injection of HDP foams (Table 4.2). The transverse joint
faulting decreased in both sections one month after application (3.26 mm on I-24 East_182 and
0.73 mm on I-24 West). It continued to decrease on I-24 East_182, eight and nineteen months after
application while on I-24 West it increased nineteen months after application. In general, the
decrease or increase in transverse joint faulting after application of the material in these sections
was statistically insignificant at a significance level of 0.05 (Table 4.7, Table 4.8 and Table 4.9).
Application of polyurethane materials caused both increase and decrease in transverse joint
faulting. Variation of transverse joint faulting over time was plotted using data in Table 4.2, and
appended in appendix A. In summary, the increase in transverse joint faulting is statistically
insignificant on I-75 South, I-75 North (thirteen months after application), and I-24 West (eight
and nineteen months after application). The decrease on transverse joint faulting is insignificant
on I-75 North (one week after application) and on I-24 East_182, but its significant on I-24
East_Moore thirteen and twenty-nine months after application of HDP foams. Therefore, section
I-24 East_Moore is the only section that its transverse joint faulting decreased significantly
(Thirteen and twenty-nine months after application of HDP foams) but, it has very few sample
space (segments) making its results not statistically viable.
Although, the transverse joint faulting values increased for some sections such as I-75
South, I-75 North and I-24 West, their values are still in the acceptable range as per the FHWA
threshold levels in Table 4.1.
Furthermore, maximum transverse joint faulting and mean IRI values in each 100 m
segments from all the five sections were combined and correlated to obtain the relationship
between the two indicators, for the left and right wheel track/path. Figure 4.1 and 4.3 show that
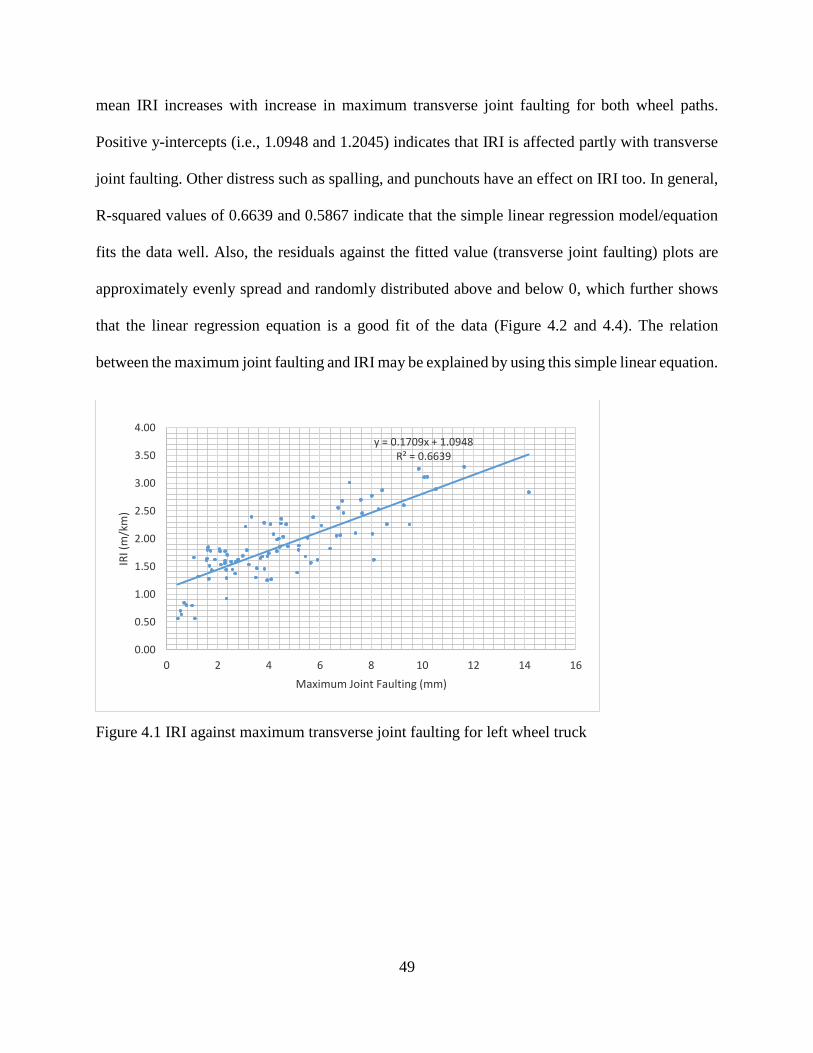
49
mean IRI increases with increase in maximum transverse joint faulting for both wheel paths.
Positive y-intercepts (i.e., 1.0948 and 1.2045) indicates that IRI is affected partly with transverse
joint faulting. Other distress such as spalling, and punchouts have an effect on IRI too. In general,
R-squared values of 0.6639 and 0.5867 indicate that the simple linear regression model/equation
fits the data well. Also, the residuals against the fitted value (transverse joint faulting) plots are
approximately evenly spread and randomly distributed above and below 0, which further shows
that the linear regression equation is a good fit of the data (Figure 4.2 and 4.4). The relation
between the maximum joint faulting and IRI may be explained by using this simple linear equation.
Figure 4.1 IRI against maximum transverse joint faulting for left wheel truck
y = 0.1709x + 1.0948R² = 0.6639
0.00
0.50
1.00
1.50
2.00
2.50
3.00
3.50
4.00
0 2 4 6 8 10 12 14 16
IRI (
m/k
m)
Maximum Joint Faulting (mm)
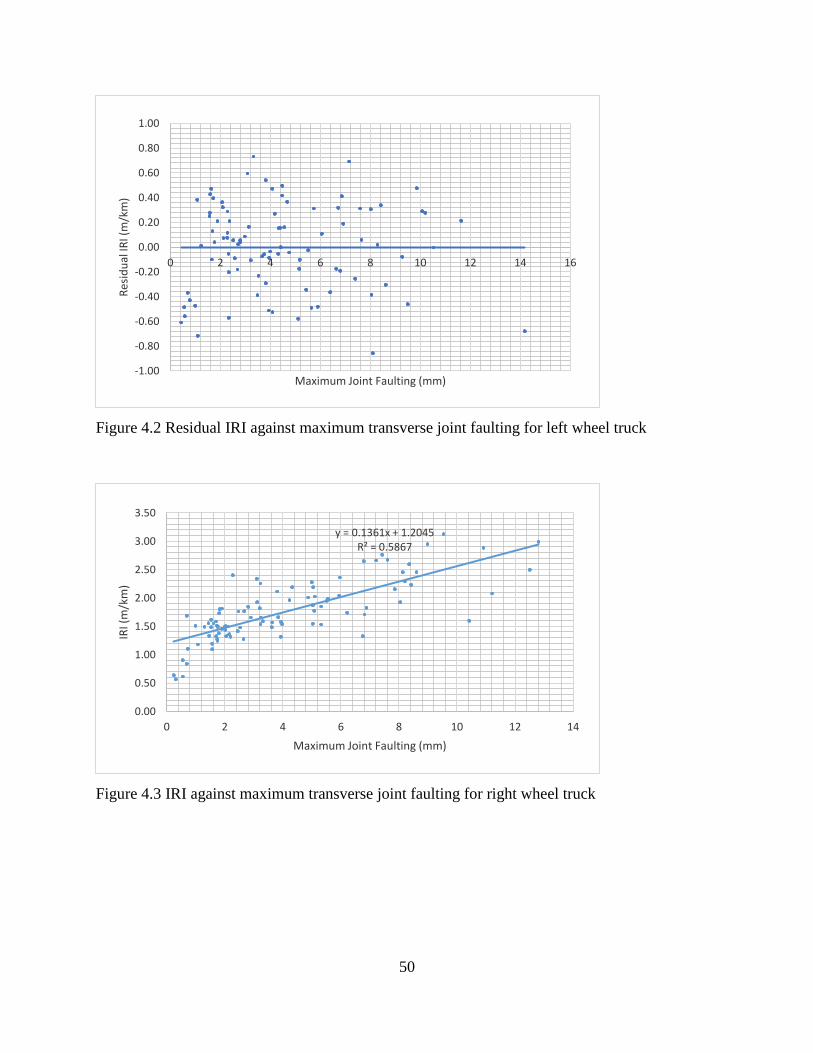
50
Figure 4.2 Residual IRI against maximum transverse joint faulting for left wheel truck
Figure 4.3 IRI against maximum transverse joint faulting for right wheel truck
-1.00
-0.80
-0.60
-0.40
-0.20
0.00
0.20
0.40
0.60
0.80
1.00
0 2 4 6 8 10 12 14 16
Res
idu
al IR
I (m
/km
)
Maximum Joint Faulting (mm)
y = 0.1361x + 1.2045R² = 0.5867
0.00
0.50
1.00
1.50
2.00
2.50
3.00
3.50
0 2 4 6 8 10 12 14
IRI (
m/k
m)
Maximum Joint Faulting (mm)

51
Figure 4.4 Residual IRI against maximum transverse joint faulting for right wheel truck
The overall absolute transverse joint faulting and mean IRI of the five sections in Tables
4.2 and 4.3 respectively were combined to obtain more samples for statistical correlation. The
aggregated data is plotted as shown in Figure 4.5 to obtain the relationship between IRI and
transverse joint faulting. It is observed that IRI increases with the increase of the mean transverse
joint faulting, and they are polynomially related with a coefficient of determination of 0.83. The
evenly distributed residuals above and below the zero line in Figure 4.6 further indicates that the
model fits the data properly.
-1.50
-1.00
-0.50
0.00
0.50
1.00
0 2 4 6 8 10 12 14
Res
idu
al IR
I (m
/km
)
Maximum Joint Faulting (mm)
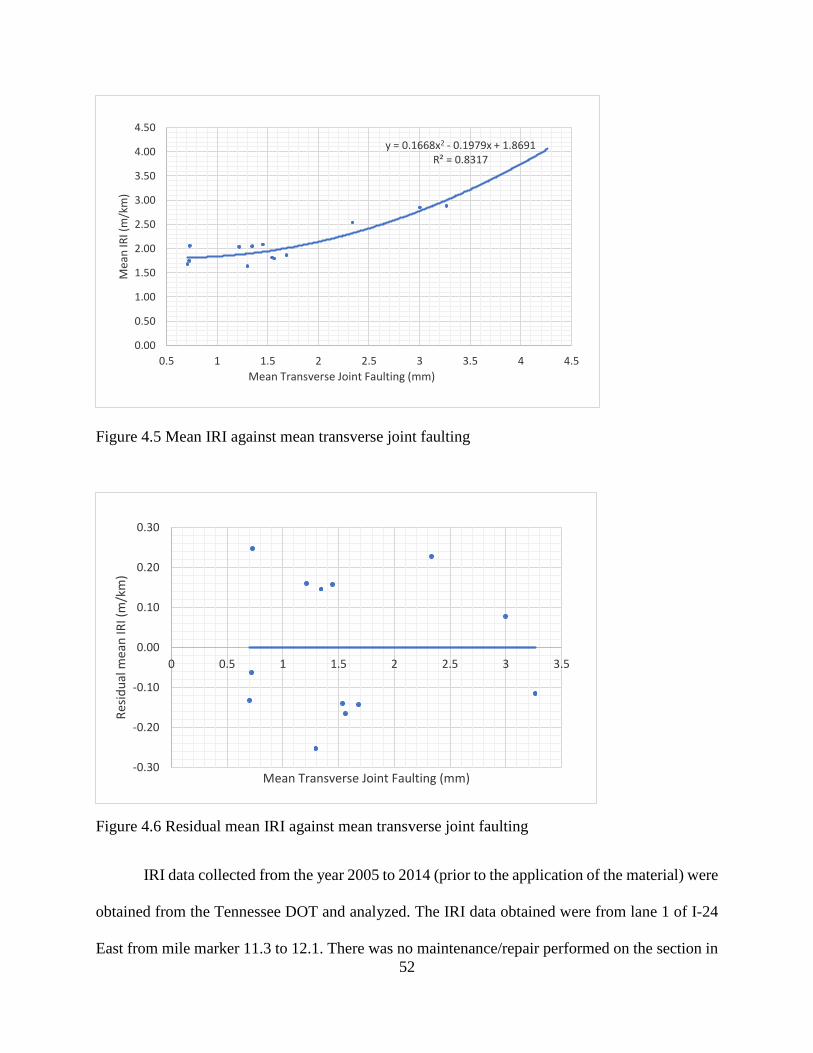
52
Figure 4.5 Mean IRI against mean transverse joint faulting
Figure 4.6 Residual mean IRI against mean transverse joint faulting
IRI data collected from the year 2005 to 2014 (prior to the application of the material) were
obtained from the Tennessee DOT and analyzed. The IRI data obtained were from lane 1 of I-24
East from mile marker 11.3 to 12.1. There was no maintenance/repair performed on the section in
y = 0.1668x2 - 0.1979x + 1.8691R² = 0.8317
0.00
0.50
1.00
1.50
2.00
2.50
3.00
3.50
4.00
4.50
0.5 1 1.5 2 2.5 3 3.5 4 4.5
Mea
n IR
I (m
/km
)
Mean Transverse Joint Faulting (mm)
-0.30
-0.20
-0.10
0.00
0.10
0.20
0.30
0 0.5 1 1.5 2 2.5 3 3.5
Res
idu
al m
ean
IRI (
m/k
m)
Mean Transverse Joint Faulting (mm)
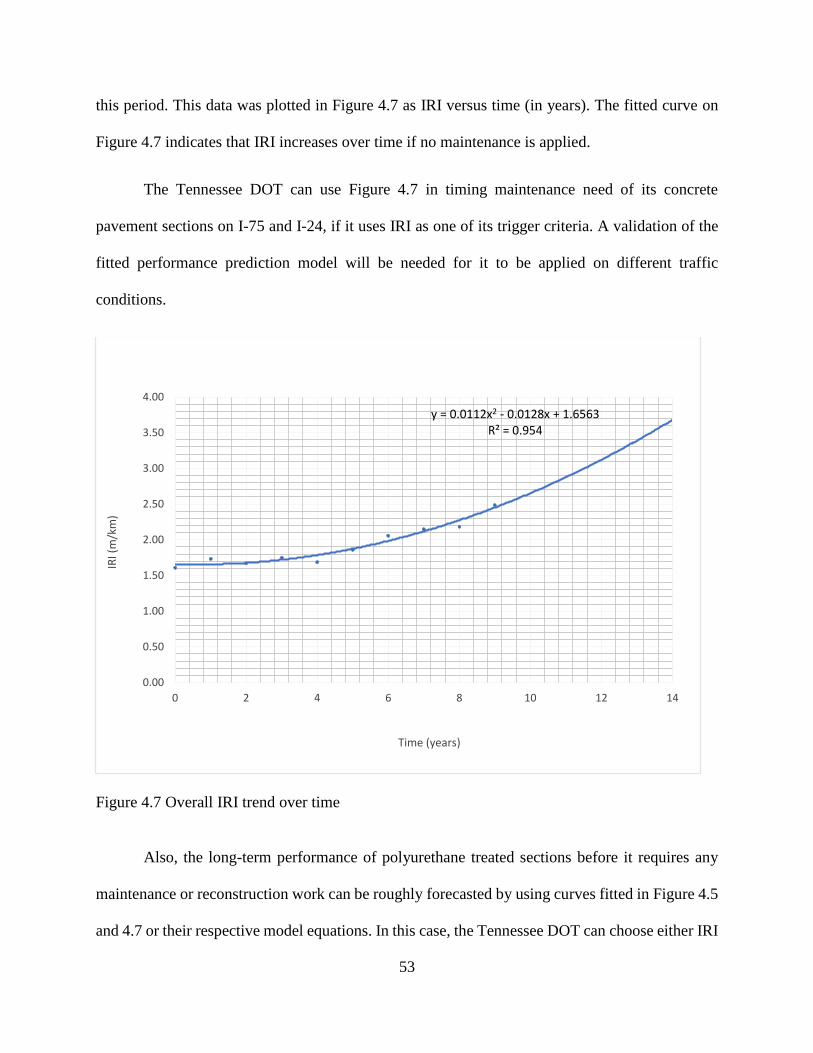
53
this period. This data was plotted in Figure 4.7 as IRI versus time (in years). The fitted curve on
Figure 4.7 indicates that IRI increases over time if no maintenance is applied.
The Tennessee DOT can use Figure 4.7 in timing maintenance need of its concrete
pavement sections on I-75 and I-24, if it uses IRI as one of its trigger criteria. A validation of the
fitted performance prediction model will be needed for it to be applied on different traffic
conditions.
Figure 4.7 Overall IRI trend over time
Also, the long-term performance of polyurethane treated sections before it requires any
maintenance or reconstruction work can be roughly forecasted by using curves fitted in Figure 4.5
and 4.7 or their respective model equations. In this case, the Tennessee DOT can choose either IRI
y = 0.0112x2 - 0.0128x + 1.6563R² = 0.954
0.00
0.50
1.00
1.50
2.00
2.50
3.00
3.50
4.00
0 2 4 6 8 10 12 14
IRI (
m/k
m)
Time (years)

54
or mean transverse joint faulting as its trigger criteria. However, the prediction will be affected by
factors such as the soundness of the slab, traffic type and volume, and subsurface conditions.

55
CHAPTER V
CONCLUSION AND RECOMMENDATIONS
The aim of this study was to assess the performance of HDP foams injected in jointed
concrete pavements by evaluating the transverse joint faulting of the treated sections. Transverse
joint faulting and IRI readings were computed from the raw longitudinal profiles collected using
a high-speed inertial profiler. The raw profile data were analyzed by the AFM and ride quality
modules in ProVAL software.
Before application of HDP foams four sections (I-75 South, I-75 North, I-24 East_Moore
and I-24 West) had mean IRI ranging between 1.68 m/km (106.44 in/mi) and 2.19 m/km (138.76
in/mi) and rated to be in a “fair” condition. I-24 East_182 had mean IRI of 2.83 m/km (179.31
in/mi) and rated to be in “poor” condition. The overall transverse joint faulting of all the five
sections was in a “fair” condition as it ranges from 1.50 mm to 3.80 mm (0.06 in to 0.15 in). After
application of the material both the mean IRI and transverse joint faulting have remained in the
same group range as they were before application (fair condition).
All the sections have remained in an acceptable condition range except for I-24 East_182,
which is in a poor condition. The overall transverse joint faulting of the treated sections decreased
with time (one week and/ or eight months after application) and increased a year later on I-75
South (by 9.09%), I-75 North (by 10.39%) and I-24 West (by 4.32%); except for the I-24
East_Moore and I-24 East_182 which decreased by 60.66% and 8.81% respectively after
application of HDP foams.
56
When transverse joint faulting values before application were statistically compared with
after application; the changes were statistically significant on I-24 East_Moore and insignificant
on the remaining sections. However, the sample spaces of I-24 East_Moore was very small making
them unrealistic for statistical analysis.
In general injection of HDP foams underneath the pavement slabs neither did improve nor
retrogress the condition of the sections but maintained it in their state before application of the
material. Therefore, for a pavement section in a poor condition (transverse joint faulting >3.80 mm
or IRI >2.70 m/km) HDP foams injection is not the best option, as the section will remain in the
same state even after application of the material. However, state DOTs can apply HDP foams on
section with good or those transiting to a fair condition to extend the life of the pavement.
This study recommends the following:
i. Prior injection of the material, a detailed ground investigation of the damaged
pavement section must be carried out to establish the causes. Filling of voids
requires different proportioning of diisocyanates and polyols from rising/ leveling
a settled slab.
ii. Development of a standardized protocol for selecting pavement sections suitable
for treatment with HDP foams.
iii. Contractors should use sophisticated leveling equipment, instead of the adjacent
slab as the benchmark, to avoid accumulation of errors due to overcorrection
iv. Progressive monitoring of the sections to capture a full long-term performance of
the material, and possible appropriate treatments after their service life time.

57
REFERENCES
Al-Eis, K. A., & LaBarca, I. K. (2007). Evaluation of the URETEK Method® of pavement lifting.
Retrieved from https://wisconsindot.gov/documents2/research/wi-02-
07uretekmethod1.pdf
American Association for State and Highway Transportation Officials. (2017). Standard practice
for evaluating faulting of concrete pavements (R 36-17). Retrieved from
https://www.techstreet.com/standards/aashto-r-36-17?product_id=1949597
American Association of State Highway and Transportation Officials. (2012). Pavement
management guide. Retrieved from https://trid.trb.org/view/1225945
American Concrete Pavement Association. (1994). Slab stabilization guidelines for concrete
pavements. Technical Bulletin TB018P. ACPA, Skokie, IL. Retrieved from
https://www.pavementpreservation.org/wp-
content/uploads/2010/12/Slab_Stabilization_Guidelines.pdf
American Society of Civil Engineers. (2017). 2017 U.S. Infrastructure Report Card. Retrieved
from https://www.infrastructurereportcard.org/
Bautista, F. E., & Basheer, I. (2008). Jointed Plain Concrete Pavement (JPCP) preservation and
rehabilitation design guide. California Department of Transportation. Retrieved from
http://www.dot.ca.gov/hq/maint/Pavement/Offices/Pavement_Engineering/PDF/JPCP-
Preservation-and-Rehab-Design-Guide.pdf
Beatty, T. L., Jackson, D. C., Dawood, D., Ford, R., Moulthrop, J., Taylor, G., . . . Keough, D.
(2002). Pavement preservation technology in France, South Africa, and Australia.
Retrieved from https://trid.trb.org/view/730131
Boudreau, R. L., Donahue, J. D., & Brown, R. W. (2017). US Highway 65 emergency pavement
subgrade improvement. https://doi.org/10.1201/9781315100333-157
Brewer, W. B., Jr., Hayes, C. J., & Sawyer, S. (1994). URETEK construction report. Retrieved
from https://trid.trb.org/view/422667
Burningham, S., & Stankevich, N. (2005). Why road maintenance is important and how to get it
done. Transport Notes Series, 4. Retrieved from
http://documents.worldbank.org/curated/en/971161468314094302/Why-road-
maintenance-is-important-and-how-to-get-it-done

58
Chang, G., Rasmussen, R., Merritt, D., Garber, S., & Karamihas, S. (2010). Impact of
temperature curling and moisture warping on jointed concrete pavement performance.
Retrieved from
https://www.fhwa.dot.gov/pavement/concrete/pubs/hif10010/hif10010.pdf
Chang, G., Watkins, J., & Orthmeyer, R. (2012). Practical implementation of automated fault
measurement based on pavement profiles. Pavement Performance: Current Trends,
Advances, and Challenges. ASTM International. Retrieved from
https://www.astm.org/DIGITAL_LIBRARY/STP/PAGES/STP104438.htm
Chun, B.-S., & Ryu, D.-S. (2000). A study on applications of polyurethane injection material for
ground improvement. KSCE Journal of Civil Engineering, 4(2), 113-118.
Constable, D., & Blades, D. (2017). National Performance Management Measure: Pavement and
bridge condition to assess the National Highway Performance Program. Retrieved from
https://www.fhwa.dot.gov/tpm/rule/170531pm2.pdf
Davies, R. M., & Sorenson, J. (2000). Pavement preservation: Preserving our investment in
highways. Public Roads, 63(4). Retrieved from
https://www.fhwa.dot.gov/publications/publicroads/00jan/pavement.cfm
Delatte, N. J. (2014). Concrete pavement design, construction, and performance. Boca Raton,
FL: CRC Press.
Ellis, W. (2015). Assessment of Uretek deep injection process. Retrieved from
http://vtrans.vermont.gov/sites/aot/files/planning/documents/planning/2015%20-
%2009%20Assessment%20of%20Uretek%20Deep%20Injection%20Process_0.pdf
Garber, N. J., & Hoel, L. A. (2014). Traffic and highway engineering. Stamford, CT: Cengage
Learning.
Gaspard, K., & Morvant, M. (2004). Assessment of the Uretek process on continuously
reinforced concrete pavement, jointed concrete pavement, and bridge approach slabs
Gaspard, K., & Zhang, Z. (2010). Mitigating transverse joint faulting in jointed concrete
pavement with polyurethane foam. Transportation Research Record: Journal of the
Transportation Research Board(2154), 3-11.
Gaspard, K., & Zhang, Z. (2015). Assessment of Mitigating Transverse Joint Faulting on
Portland Cement Concrete Pavement with Polyurethane Foam on LA 1 Bypass, State
Project Number 034-30-0023. Retrieved from
https://www.ltrc.lsu.edu/pdf/2005/03_2TA.pdf
Gransberg, D. D., Tighe, S. L., Pittenger, D., & Miller, M. C. (2014). Sustainable pavement
preservation and maintenance practices. In K. Gopalakrishnan, W. J. Steyn, & J. Harvey
(Eds.), Climate Change, Energy, Sustainability and Pavements (pp. 393-418).
Heidelberg, Germany: Springer.
59
Huang, Y. H. (2004). Pavement analysis and design. Upper Saddle River, NJ: Pearson.
Kercher, A. S. (2011). Pavement Preservation: A Successful Implementation. World
Highways/Routes du Monde, 20(8), pp. 21-22.
Lee, J., & Shields, T. (2010). Treatment guidelines for pavement preservation. JTRP Technical
Reports, 1128, 3114. https://doi.org/10.5703/1288284314270
Miller, J. S., & Bellinger, W. Y. (2014). Distress identification manual for the long-term
pavement performance program. Retrieved from
https://www.fhwa.dot.gov/publications/research/infrastructure/pavements/ltpp/reports/03
031/
Moulthrop, J., & Smith, R. (2000). State of the art and state of the practice in pavement
maintenance. Transportation in the New Millennium. Retrieved from
http://onlinepubs.trb.org/onlinepubs/millennium/00106.pdf
North Carolina Department of Transportation. (2015). Partial and full depth repair manual.
Retrieved from https://connect.ncdot.gov/letting/Division%204%20Letting/03-14-
2017/Methods%20Procedures%20for%20Maintainance%20and%20Repair%20of%20PC
C%20Pavements_6_2015.pdf
Opland, W. H., & Barnhart, V. T. (1995). Evaluation of the URETEK method for pavement
undersealing (Research Report Number R-1340). Research and Technology Section,
Materials and Technology Division, Michigan Department of Transportation.
Papagiannakis, A. T., & Masad, E. A. (2017). Pavement design and materials. Hoboken, NJ:
John Wiley & Sons.
Peshkin, D. G., Smith, K. L., Wolters, A., Krstulovich, J., Moulthrop, J., & Alvarado, C. (2011).
Guidelines for the preservation of high-traffic-volume roadways: Transportation
Research Board.
Peterson, D. E. (1981). Evaluation of pavement maintenance strategies. NCHRP Synthesis of
Highway Practice, 77. Retrieved from https://trid.trb.org/view/174042
Selezneva, O., Jiang, J., & Tayabji, S. D. (2000). Preliminary evaluation and analysis of LTPP
faulting data. Retrieved from
https://www.fhwa.dot.gov/publications/research/infrastructure/pavements/ltpp/00076/000
76a.pdf
Shah, H. K., Yoon, Y., Hastak, M., & Lee, J. (2011). Benefits and assessment of annual budget
requirements for pavement preservation. JTRP Technical Reports, 1477. Retrieved from
https://docs.lib.purdue.edu/jtrp/1477/
Shahin, M. Y. (2005). Pavement management for airport, roads and parking lots (2nd ed.).
London, U.K.: Kluwer Academic Publishers.
60
Smith, K., Harrington, D., Pierce, L., Ram, P., & Smith, K. (2014). Concrete Pavement
Preservation Guide. Retrieved from
https://www.fhwa.dot.gov/pavement/concrete/pubs/hif14004.pdf
Smith, K., Wade, M., Peshkin, D., Khazanovich, L., Yu, H., & Darter, M. (1998). Performance
of concrete pavements. Volume II: Evaluation of inservice concrete pavements. Retrieved
from https://trid.trb.org/view/484779
Smith, K. D. (2005). Concrete Pavement Rehabilitation and Preservation Treatments. Retrieved
from https://www.fhwa.dot.gov/pavement/pccp/pubs/06005/06005.pdf
Smith, K. D., Hoerner, T. E., & Peshkin, D. G. (2008). Concrete pavement preservation
workshop. Retrieved from http://www.cptechcenter.org/technical-
library/documents/preservation_reference_manual.pdf
Soltesz, S. (2002). Injected polyurethane slab jacking. Retrieved from
https://www.oregon.gov/ODOT/Programs/ResearchDocuments/InjectSlabJack.pdf
Su Jung, Y., Freeman, T. J., & Zollinger, D. G. (2008). Evaluation and Selection Guide of
Method of Repair for Routine Maintenance: Texas Transportation Institute, Texas A & M
University System.
The Transtec Group. (2016). ProVAL User's Guide. (Version 3.6). Texas, USA.
Van Dam, T. J., Harvey, J. T., Muench, S. T., Smith, K. D., Snyder, M. B., Al-Qadi, I. L., . . .
Roesler, J. R. (2015). Towards sustainable pavement systems: a reference document: US
Department of Transportation, Federal Highway Administration.
Van, T., Gaj, S., Gray, J., & Yew, C. (2017). Pavement Preservation (When, Where and How).
Every Day Count (EDC-4). Retrieved from
https://www.fhwa.dot.gov/innovation/everydaycounts/edc_4/pavement.cfm on January
23rd, 2018
Vennapusa, P. K., & White, D. J. (2015). Field assessment of a jointed concrete pavement
foundation treated with injected polyurethane expandable foam. International Journal of
Pavement Engineering, 16(10), 906-918.
Vennapusa, P. K., Zhang, Y., & White, D. J. (2016). Comparison of Pavement Slab Stabilization
Using Cementitious Grout and Injected Polyurethane Foam. Journal of Performance of
Constructed Facilities, 30(6), 04016056.
Yu, L., Wang, R., & Skirrow, R. (2013). The application of polyurethane grout in roadway
settlement issues. Geo Montreal 2013. Retrieved from
http://www.transportation.alberta.ca/content/doctype253/production/geomon2013paper40
0.pdf

61
APPENDIX A
TRANSVERSE JOINT FAULTING VARION OVER TIME

62
Figure A1 Variation of mean transverse joint faulting over time for section I-75 South
Figure A2 Variation of mean transverse joint faulting over time for section I-75 North
0.00
0.50
1.00
1.50
2.00
2.50
Before application One week after
application
Thirteen months
after application
Mea
n T
ran
sver
se J
oin
t F
ault
ing
(mm
)
0.00
0.50
1.00
1.50
2.00
2.50
Before application One week after
application
Thirteen months
after application
Mea
n T
ran
sver
se J
oin
t F
ault
ing
(mm
)

63
Figure A3 Variation of mean transverse joint faulting over time for section I-24 East_Moore
Figure A4 Variation of mean transverse joint faulting over time for section I-24 East_182
0.00
0.50
1.00
1.50
2.00
2.50
Before
application
One month
after
application
Thirteen
months after
application
Twenty nine
months after
application
Mea
n T
ran
sver
se J
oin
t F
ault
ing
(mm
)
0.00
0.50
1.00
1.50
2.00
2.50
3.00
3.50
Before
application
One week
after
application
Eight months
after
application
Nineteen
months after
application
Mea
n T
ran
sver
se J
oin
t F
ault
ing
(mm
)

64
Figure A5 Variation of mean transverse joint faulting over time for section I-24 West
0.00
0.50
1.00
1.50
2.00
2.50
Before
application
One week
after
application
Eight months
after
application
Nineteen
months after
application
Mea
n T
ran
sver
se J
oin
t F
ault
ing
(mm
)

65
APPENDIX B
PAIRED T-TESTS ANALYSIS OF TRANSVERSE JOINT FAULTING FOR THE BEFORE
AGAINST AFTER APPLICATION OF POLYURETHANE MATERIA

66
Highway
section ID I-75 South I-75 North
I-24
East_Moore I-24 East_182 I-24 West
Statistically Significant Changes?
Wheel track Left Right Left Right Left Right Left Right Left Right
One week after
application No No No No
Thirteen
months after
application
No No No No
One month after
application No No
Thirteen
months after
application
Yes Yes
Twenty-nine
months after
application
Yes Yes
One week after
application No No No No
Eight months
after application Yes No No No
Nineteen
months after
application
No No No No

67
APPENDIX C
QUANTILE-QUANTILE PLOTS

68
SECTION I-75 SOUTH
Figure C1 Left wheel track_Before application of HDP foams
Figure C2 Right wheel track_Before application of HDP foams

69
Figure C3 Left wheel track_One week after application of HDP foams
Figure C4 Right wheel track_One week after application of HDP foams

70
Figure C5 Left wheel track_Thirteen months after application of HDP foams
Figure C6 Right wheel track_Thirteen months after application of HDP foams
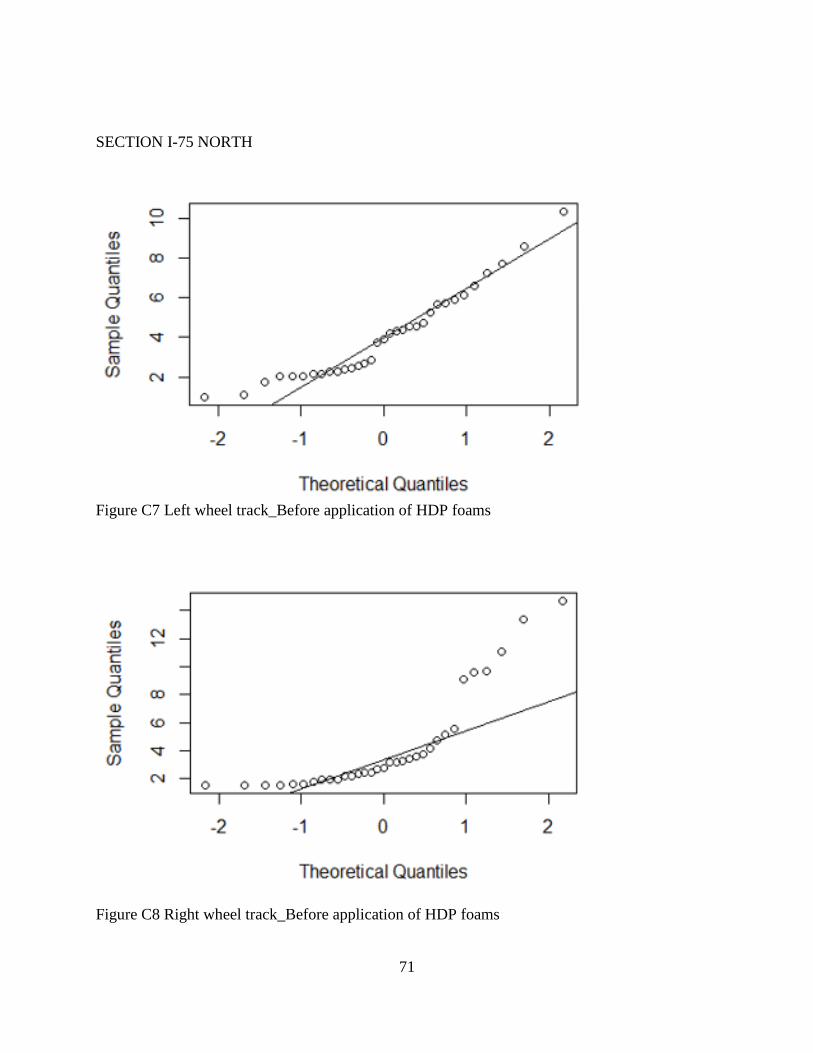
71
SECTION I-75 NORTH
Figure C7 Left wheel track_Before application of HDP foams
Figure C8 Right wheel track_Before application of HDP foams

72
Figure C9 Left wheel track_One week after application of HDP foams
Figure C10 Right wheel track_One week after application of HDP foams

73
Figure C11 Left wheel track_Thirteen months after application of HDP foams
Figure C12 Right wheel track_Thirteen months after application of HDP foams

74
SECTION I-24 EAST_MOORE
Figure C13 Left wheel track_Before application of HDP foams
Figure C14 Right wheel track_Before application of HDP foams
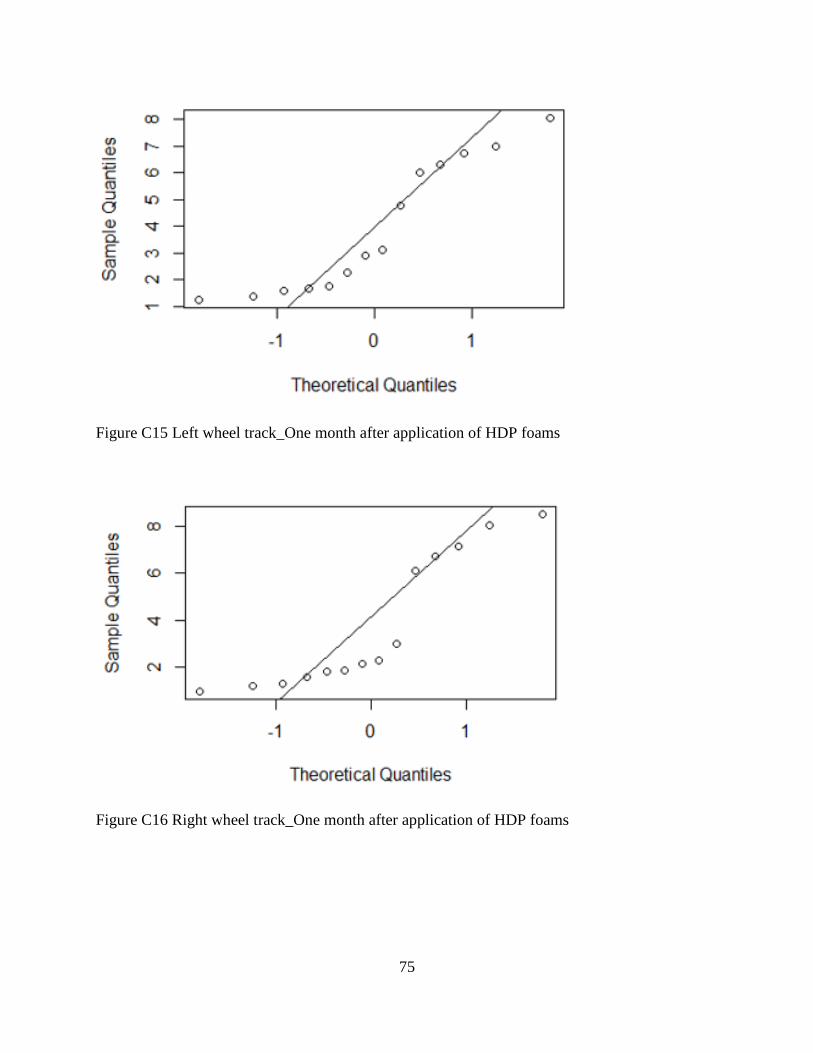
75
Figure C15 Left wheel track_One month after application of HDP foams
Figure C16 Right wheel track_One month after application of HDP foams

76
Figure C17 Left wheel track_Thirteen months after application of HDP foams
Figure C18 Right wheel track_Thirteen months after application of HDP foams
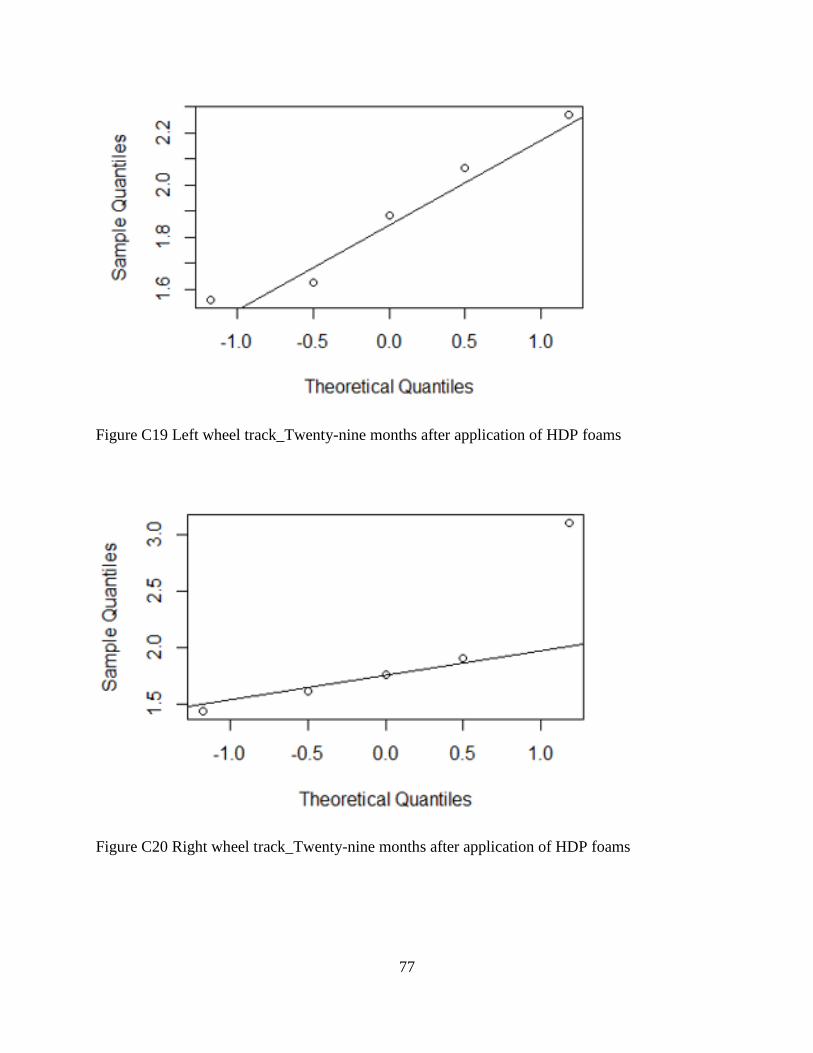
77
Figure C19 Left wheel track_Twenty-nine months after application of HDP foams
Figure C20 Right wheel track_Twenty-nine months after application of HDP foams
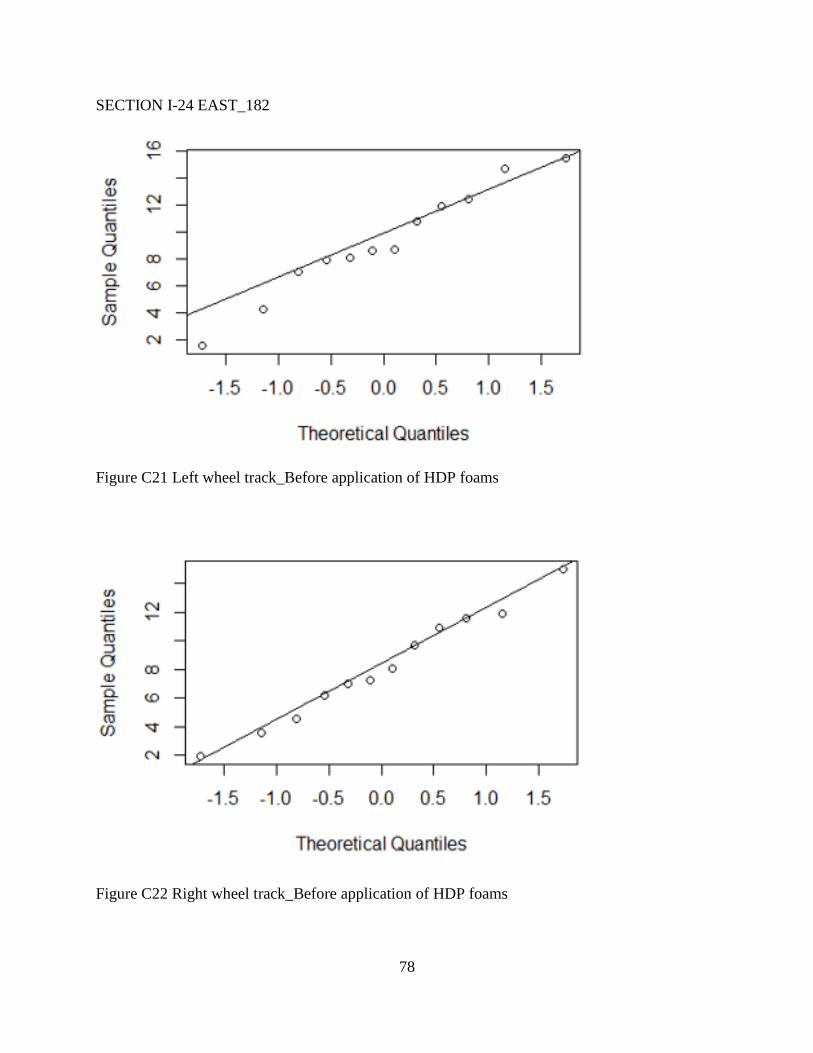
78
SECTION I-24 EAST_182
Figure C21 Left wheel track_Before application of HDP foams
Figure C22 Right wheel track_Before application of HDP foams

79
Figure C23 Left wheel track_One week after application of HDP foams
Figure C24 Right wheel track_One week after application of HDP foams

80
Figure C25 Left wheel track_Eight months after application of HDP foams
Figure C26 Right wheel track_Eight months after application of HDP foams

81
Figure C27 Left wheel track_Nineteen months after application of HDP foams
Figure C28 Right wheel track_Nineteen months after application of HDP foams

82
SECTION I-24 WEST
Figure C29 Left wheel track_Before application of HDP foams
Figure C30 Right wheel track_Before application of HDP foams

83
Figure C31 Left wheel track_One week after application of HDP foams
Figure C32 Right wheel track_One week after application of HDP foams

84
Figure C33 Left wheel track_Eight months after application of HDP foams
Figure C34 Right wheel track_Eight months after application of HDP foams

85
Figure C35 Left wheel track_Nineteen months after application of HDP foams
Figure C36 Right wheel track_Nineteen months after application of HDP foams

86
VITA
Mawazo Fortunatus is a Tanzanian born to Nyamususa Chiyanda and the late Kariba
Mashauri. He has three sisters and one brother. He attended Moshi Technical Secondary School
for his ordinary secondary school education and continued to Kibaha Secondary School for the
advanced level in 2008. He joined the University of Dar es Salaam, Tanzania in 2011 and
graduated in 2015 with a B.S. degree in Civil and Transportation Engineering.
After graduating, Mawazo joined the Dar es Salaam Rapid Transit (DART) agency as an
Intern Engineer for three months. (DART is the agency responsible for overseeing the operation
of the bus rapid transit system in the city of Dar es Salaam.) In December 2015, Mawazo returned
to the University of Dar es Salaam, where he worked as a Tutorial Assistant to the Department of
Transportation and Geotechnical Engineering.
He joined the University of Tennessee at Chattanooga (UTC) in August 2016 after
acquiring a research assistantship position. Mawazo will graduate from UTC in August 2018 with
a M.S. degree in Civil Engineering. In Fall 2018, Mawazo will join Auburn University, where he
will pursue a Ph.D. degree in Civil Engineering.