Embed Size (px)
Citation preview

Evaluation of the Performance and Testing Techniques of
Vehicle Frontal Protection Systems
By
Paul Bignell
BE (Mech)
A THESIS SUBMITTED TO THE SCHOOL OF CIVIL ENGINEERING
QUEENSLAND UNIVERSITY OF TECHNOLOGY IN PARTIAL
FULFILMENT OF REQUIREMENTS FOR THE DEGREE OF
DOCTOR OF PHILOSOPHY
JUNE 2004


i
KEYWORDS
Frontal Protection Systems, Bull bars, Impacts, Energy absorbed, Air bags, Quasi-
static testing, Dynamic testing, Finite Element Analysis

ii
ABSTRACT
Frontal Protection Systems (FPS) have become a popular accessory for passenger
vehicles. They are used to protect the front of a vehicle during minor impacts, and to
attenuate the impact energy during major impacts. With the increased safety of
modern passenger vehicles, the fitment of a FPS to a vehicle requires careful
consideration to the design and installation of the FPS as they may modify vehicle
crush characteristics. This is particularly important in vehicles fitted with air bags.
These community and industry concerns triggered the research discussed in this
thesis, which is the first comprehensive project undertaken in this particular area.
This project generated comprehensive research knowledge on the impact response
and energy absorption of FPS in order to evaluate performance. This involved a
range of experimental testing supplemented by finite element analysis. Experimental
testing was conducted using quasi-static and dynamic techniques to assess the overall
performance of current FPS available. Finite element models were then generated
and analysed using both implicit and explicit techniques, and calibrated against the
experimental testing results. These models were used throughout the project to
assess the FPS response, in particular the energy absorbed, to changes in impact
characteristics.
FPS assessment guidelines were developed from the knowledge generated from the
numerous FPS tests and analyses carried out in this research project. These
guidelines have been used in the design and evaluation of a number of FPS for air
bag compatibility. The real life performance of vehicles fitted with these FPS, have
given confidence to the assessment criteria developed in this research project.
This project has demonstrated that FPS can be designed to complement the safety
systems of modern passenger vehicles, and thus passenger safety. This would not
have been possible without the comprehensive research carried out in this project.

iii
TABLE OF CONTENTS
Chapter 1 Introduction ................................................................................................. 1
1.1 Aims and Objectives .......................................................................................... 1
1.2 Research and Methodology................................................................................ 1
1.2.1 Experimental Testing .................................................................................. 2
1.2.1.1 Quasi-Static Evaluation of FPS............................................................ 2
1.2.1.2 Dynamic Evaluation of FPS................................................................. 2
1.2.2 Finite Element Analysis .............................................................................. 3
1.2.3 FPS Evaluation............................................................................................ 3
1.3 Thesis Layout ..................................................................................................... 3
Chapter 2 Literature Review ........................................................................................ 5
2.1 Frontal Protection Systems ................................................................................ 5
2.1.1 FPS Types ................................................................................................... 6
2.1.2 FPS Components......................................................................................... 7
2.1.3 FPS Material ............................................................................................... 9
2.1.4 Fitment Numbers....................................................................................... 10
2.1.5 FPS Accessories........................................................................................ 10
2.1.6 FPS standards............................................................................................ 11
2.1.7 Pedestrian Safety....................................................................................... 12
2.2 Mechanics of Impacts ...................................................................................... 14
2.3 Air Bags ........................................................................................................... 22
2.3.1 The Air Bag System.................................................................................. 23
2.3.2 Air Bags .................................................................................................... 24
2.3.3 Air Bag Sensors ........................................................................................ 24
2.3.3.1 Mechanical Sensors............................................................................25
2.3.3.2 Electronic Sensors.............................................................................. 25
2.3.4 Air Bag Triggering Characteristics ........................................................... 28
2.4 Testing.............................................................................................................. 29
2.4.1 Quasi-Static Testing.................................................................................. 29
2.4.2 Dynamic Testing ....................................................................................... 30
2.4.2.1 Barrier Testing ................................................................................... 30
2.4.2.2 Pendulum Testing ..............................................................................30
2.4.3 Comparison of Testing Techniques .......................................................... 32

iv
2.4.4 Finite Element Analysis ............................................................................ 34
2.5 Summary .......................................................................................................... 35
Chapter 3 Experimental Testing................................................................................. 37
3.1 FPS Behaviour during an Impact ..................................................................... 37
3.2 Test Setup......................................................................................................... 40
3.2.1 Data Analysis ............................................................................................ 42
3.2.2 Failure Modes............................................................................................ 43
3.2.3 Summary of FPS Tested............................................................................ 46
3.3 Dynamic Testing .............................................................................................. 53
3.3.1 Pendulum Test Rig .................................................................................... 54
3.3.2 Data Acquisition........................................................................................ 54
3.3.3 FPS Mounting ........................................................................................... 55
3.3.4 Pendulum Velocity.................................................................................... 55
3.3.5 Testing Results .......................................................................................... 56
3.3.5.1 Data Analysis ..................................................................................... 56
3.3.5.2 Results Summary................................................................................ 58
3.4 Summary .......................................................................................................... 63
Chapter 4 Additional Experimental Testing............................................................... 65
4.1 Further Testing with Strain Gauges ................................................................. 65
4.1.1 Additional FPS .......................................................................................... 65
4.1.1.1 Assembly............................................................................................ 66
4.1.1.2 Strain Gauges and LVDTs ................................................................. 67
4.1.1.3 Results ................................................................................................ 68
4.1.2 Replacement Bar ....................................................................................... 72
4.1.2.1 Assembly............................................................................................ 72
4.1.2.2 Strain Gauges and LVDTs ................................................................. 75
4.1.2.3 Results ................................................................................................ 78
4.2 Vehicle Frontal Structures................................................................................ 83
4.2.1 Monocoque Structure ................................................................................ 84
4.2.2 Chassis Structure ....................................................................................... 85
4.2.3 Summary ................................................................................................... 86
Chapter 5 Finite Element Analysis............................................................................. 89
5.1 Finite Element Software................................................................................... 89
5.2 FPS Model........................................................................................................ 91

v
5.2.1 Elements.................................................................................................... 92
5.2.2 Material ..................................................................................................... 93
5.2.3 Boundary Conditions ................................................................................ 94
5.2.4 Output Requests ........................................................................................ 95
5.3 Quasi-Static Analysis ....................................................................................... 95
5.3.1 Loading ..................................................................................................... 95
5.3.2 Model Calibration ..................................................................................... 96
5.4 Pendulum Impact Simulation........................................................................... 98
5.4.1 The Pendulum ........................................................................................... 99
5.4.2 Contact ...................................................................................................... 99
5.4.3 Results ....................................................................................................... 99
5.4.4 Result Summary...................................................................................... 104
5.4.4.1 Deceleration ..................................................................................... 104
5.4.4.2 Velocity............................................................................................ 108
5.4.4.3 Load-Deflection ...............................................................................111
5.4.4.4 Energy Absorbed.............................................................................. 114
5.5 Summary ........................................................................................................ 116
Chapter 6 Transient Impact (Pulse) Loading ........................................................... 117
6.1 Transient Pulses ............................................................................................. 117
6.1.1 Pulse Variables........................................................................................ 119
6.1.2 FPS Model............................................................................................... 120
6.2 The Effect of Impact Surface Properties........................................................ 121
6.2.1.1 Results.............................................................................................. 123
6.2.1.2 Result Summary............................................................................... 124
6.3 The Effect of Mass......................................................................................... 128
6.3.1.1 Result Summary............................................................................... 130
6.4 Summary ........................................................................................................ 133
Chapter 7 FPS Testing Guidelines ........................................................................... 135
7.1 Possible effects a FPS can have on air bag triggering ................................... 135
7.1.1 FPS with increased stiffness ................................................................... 135
7.1.2 FPS with decreased stiffness................................................................... 137
7.1.3 FPS Strength ........................................................................................... 137
7.1.4 Time ........................................................................................................ 139
7.2 Testing for Air Bag Compatibility .................................................................141

vi
7.2.1 Additional FPS ........................................................................................ 142
7.2.2 Replacement FPS .................................................................................... 142
7.2.2.1 FPS Not Replacing Structural Components ..................................... 142
7.2.2.2 Electronic Sensors ............................................................................143
7.2.2.3 Mechanical Sensors.......................................................................... 143
7.2.2.4 FPS Replacing Structural Components ............................................ 144
7.2.3 Incompatible FPS and On Vehicle Testing............................................. 145
7.3 Considerations................................................................................................ 145
7.3.1 Vehicle Structure..................................................................................... 145
7.3.2 Mounting Bolt Locations ........................................................................ 146
7.3.3 Rate of Energy Absorption...................................................................... 146
7.3.4 FPS and Vehicle Auxiliaries ................................................................... 146
7.3.5 Sensor Location....................................................................................... 147
7.3.6 Bumperettes............................................................................................. 147
7.4 Summary ........................................................................................................ 147
Chapter 8 Summary and Conclusions ...................................................................... 149
8.1 Suggestions for Further Work ........................................................................ 151
8.2 Conclusions .................................................................................................... 152
References ................................................................................................................ 155

vii
LIST OF FIGURES
Figure 2.1 Replacement and Additional FPS............................................................... 6
Figure 2.2 Two typical additional FPS. ....................................................................... 6
Figure 2.3 Typical replacement FPS............................................................................ 7
Figure 2.4 Frontal Protection System mounting system. ............................................ 7
Figure 2.5 Additional FPS mount. ............................................................................... 8
Figure 2.6 Replacement FPS mount. ........................................................................... 8
Figure 2.7 Replacement FPS mount using folded section. .......................................... 9
Figure 2.8 Replacement FPS mount with composite insert after impact..................... 9
Figure 2.9 FPS fitted with winch, driving lights and antenna.................................... 10
Figure 2.10 Details of a FPS with winch assembly. .................................................. 11
Figure 2.11 Vehicle pedestrian contact...................................................................... 12
Figure 2.12 Comparison of new and old FPS designs. .............................................. 14
Figure 2.13 Two vehicles about to collide. ................................................................ 14
Figure 2.14 Crush characteristics with constant force. .............................................. 17
Figure 2.15 Crash pulse for lower velocity impact with constant crush zone. .......... 17
Figure 2.16 Crash pulse for higher velocity impact with constant crush zone. ......... 18
Figure 2.17 Theoretical ideal crash pulse. ................................................................. 18
Figure 2.18 Crash characteristics of a vehicle showing hard and soft components... 19
Figure 2.19 Frontal vehicle to barrier impact at 48 km/h measured in passenger
compartment. ..................................................................................................... 19
Figure 2.20 Frontal vehicle to barrier impact at 48 km/h measured in engine
compartment. ..................................................................................................... 20
Figure 2.21 Frontal vehicle to barrier impact at 15 km/h measured in passenger
compartment. ..................................................................................................... 20
Figure 2.22 Frontal vehicle to barrier impact, with 30 degree angle, at 48 km/h
measured in passenger compartment. ............................................................... 21
Figure 2.23 Frontal vehicle to pole impact at 48 km/h measured in passenger
compartment. ..................................................................................................... 22
Figure 2.24 Air bag system. ....................................................................................... 23
Figure 2.25 Example air bag triggering threshold. .................................................... 26
Figure 2.26 Example air bag deployment velocity thresholds................................... 28
Figure 2.27 Quasi-static testing using a UTM. .......................................................... 29

viii
Figure 2.28 FPS before and after dynamic pendulum testing. ................................... 31
Figure 3.1 Example of FPS rotation........................................................................... 38
Figure 3.2 Vehicle clearance...................................................................................... 39
Figure 3.3 Quasi-static testing setup. ......................................................................... 40
Figure 3.4 Rigid chassis. ............................................................................................ 41
Figure 3.5 FPS ready for quasi-static testing. ............................................................ 41
Figure 3.6 FPS after quasi-static testing.................................................................... 42
Figure 3.7 Load deflection plot for quasi-static testing. ............................................ 43
Figure 3.8 Replacement FPS for Holden Frontera..................................................... 44
Figure 3.9 Replacement FPS with winch for Toyota Hilux....................................... 45
Figure 3.10 Replacement FPS for Holden Commodore ............................................ 45
Figure 3.11 Quasi-static results for additional FPS.................................................... 48
Figure 3.12 Quasi-static testing results for replacement FPS. ................................... 51
Figure 3.13 Quasi-static testing for replacement FPS with winch............................. 53
Figure 3.14 Pendulum test rig. ................................................................................... 54
Figure 3.15 Front view of pendulum.......................................................................... 55
Figure 3.16 Rear view of pendulum........................................................................... 55
Figure 3.17 Deceleration of pendulum during impact............................................... 57
Figure 3.18 Velocity of pendulum during impact. ..................................................... 57
Figure 3.19 Load-deflection plots for quasi-static and dynamic tests........................ 58
Figure 3.20 Comparison of quasi-static and dynamic energy absorbed by FPS........61
Figure 3.21 Change in velocity and static energy absorbed....................................... 62
Figure 3.22 Change in velocity and pendulum energy absorbed. .............................. 62
Figure 4.1 Additional FPS parts................................................................................. 66
Figure 4.2 Additional FPS mounted to rigid chassis.................................................. 66
Figure 4.3 Strain gauge placement for additional FPS............................................... 67
Figure 4.4 Load-deflection results for additional FPS. .............................................. 68
Figure 4.5 Additional FPS after testing..................................................................... 69
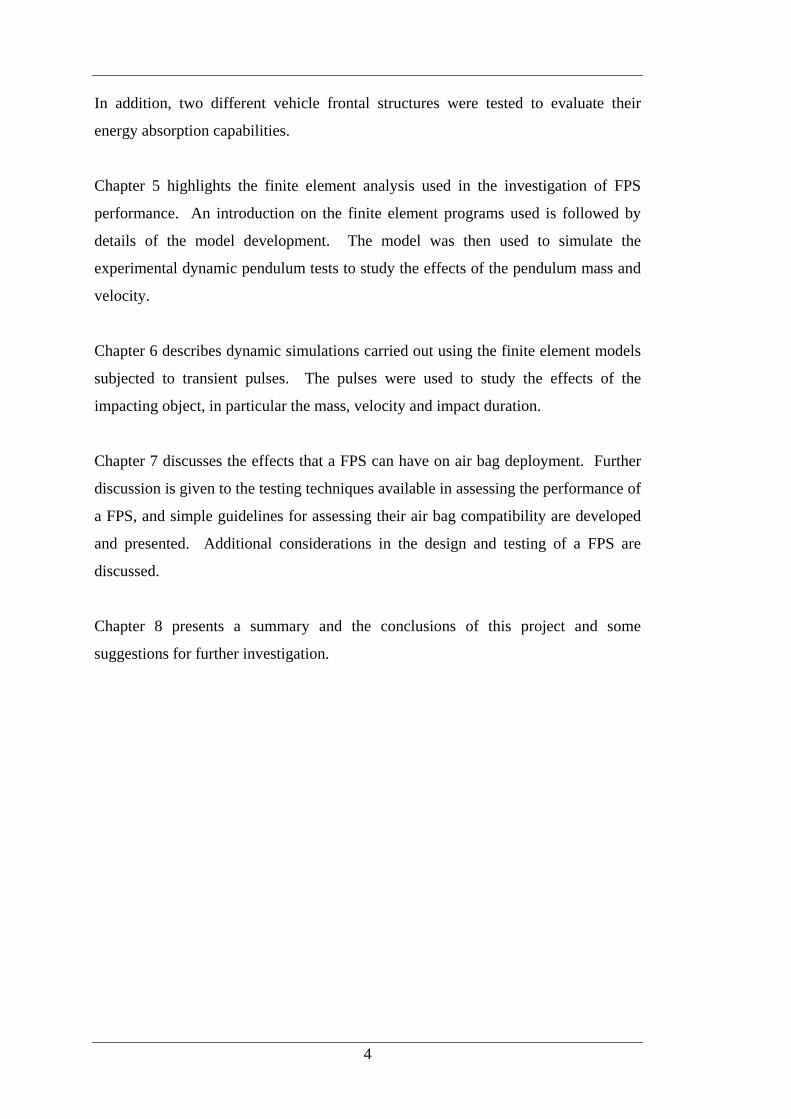
Figure 4.6 Principal strain results for bottom of tube. ...............................................70
Figure 4.7 Principal strain results for top of tube....................................................... 70
Figure 4.8 Major bends in tubing of additional FPS after testing. ............................ 71
Figure 4.9 Principal strain results for mounting plate................................................71
Figure 4.10 Mounting plates of additional FPS after testing. ................................... 72
Figure 4.11 Replacement FPS mounting kit. .............................................................73

ix
Figure 4.12 Vehicle mounts for replacement FPS. .................................................... 73
Figure 4.13 Replacement FPS mounting plate fixed to rigid chassis. ....................... 73
Figure 4.14 Assembly of channel section. ................................................................. 74
Figure 4.15 Completed replacement FPS mounted to rigid chassis. ......................... 74
Figure 4.16 Mounting plate slots shown in both positions. ....................................... 75
Figure 4.17 Bumperettes affixed to replacement FPS............................................... 75
Figure 4.18 Strain gauge placement for replacement FPS......................................... 76
Figure 4.19 LVDT placement for replacement FPS. ................................................. 77
Figure 4.20 Load deflection results for replacement FPS.......................................... 78
Figure 4.21 Replacement FPS after quasi-static testing............................................. 79
Figure 4.22 Mounting plates for replacement FPS after testing. ............................... 80
Figure 4.23 Principal strains for strain gauges A and G. ........................................... 81
Figure 4.24 Principal strains for strain gauges C, E and F......................................... 81
Figure 4.25 Channel section of replacement FPS after testing. ................................. 82
Figure 4.26 Principal strains for strain gauge D. ....................................................... 82
Figure 4.27 Bumperettes for replacement FPS after testing. ..................................... 83
Figure 4.28 Frontal structure of Mitsubishi Pajero before testing. ............................ 84
Figure 4.29 Frontal structure of Mitsubishi Pajero after testing. ............................... 84
Figure 4.30 Load-deflection results for Mitsubishi Pajero frontal structure.............. 85
Figure 4.31 Crush can from Landrover Discovery. ................................................... 85
Figure 4.32 Crush can from Landrover Discovery before and after testing. ............ 86
Figure 4.33 Load-deflection results for Landrover Discovery crush can. ................. 86
Figure 5.1 Replacement FPS surfaces........................................................................ 91
Figure 5.2 Half of FPS used in modelling. ................................................................ 92
Figure 5.3 Replacement FPS elements. ..................................................................... 93
Figure 5.4 Material property used for FPS finite element model. ............................. 94
Figure 5.5 Load curve for FPS finite element model................................................. 96
Figure 5.6 Load-deflection comparison of experimental and FEA results. ............... 97
Figure 5.7 von Mises stress comparison of experimental and FEA results at gauge E.
............................................................................................................................ 97
Figure 5.8 von Mises stress comparison of experimental and FEA results at gauge F.
............................................................................................................................ 98
Figure 5.9 FPS model before pendulum impact....................................................... 100
Figure 5.10 FPS model after pendulum impact. ...................................................... 100

x
Figure 5.11 Deceleration of pendulum during impact............................................. 101
Figure 5.12 Velocity of pendulum during impact. ................................................... 102
Figure 5.13 Load-deflection of the FPS during impact............................................ 102
Figure 5.14 Deceleration of pendulum during a 5 km/h impact. ............................. 104
Figure 5.15 Deceleration of pendulum during a 10 km/h impact. ........................... 105
Figure 5.16 Deceleration of pendulum during a 15 km/h impact. ........................... 105
Figure 5.17 Deceleration of pendulum during a 20 km/h impact. ........................... 106
Figure 5.18 Deceleration of pendulum during a 25 km/h impact. ........................... 106
Figure 5.19 Peak decelerations during pendulum impact. ....................................... 107
Figure 5.20 Velocity of pendulum during 5 km/h impact........................................ 108
Figure 5.21 Velocity of pendulum during 10 km/h impact...................................... 108
Figure 5.22 Velocity of pendulum during 15 km/h impact...................................... 109
Figure 5.23 Velocity of pendulum during 20 km/h impact...................................... 109
Figure 5.24 Velocity of pendulum during 25 km/h impact...................................... 110
Figure 5.25 Change in pendulum velocity after impact. .......................................... 110
Figure 5.26 Load-deflection results for 5 km/h pendulum impact........................... 111
Figure 5.27 Load-deflection results for 10 km/h pendulum impact......................... 112
Figure 5.28 Load-deflection results for 15 km/h pendulum impact......................... 112
Figure 5.29 Load- deflection results for 20 km/h pendulum impact........................ 113
Figure 5.30 Load- deflection results for 25 km/h pendulum impact........................ 113
Figure 5.31 Dynamic amplification of energy absorbed by FPS. ............................ 114
Figure 5.32 Percentage of energy absorbed by the FPS during impact. .................. 115
Figure 6.1 Half-sine and haversine pulses. .............................................................. 117
Figure 6.2 Square and triangular pulses. .................................................................. 118
Figure 6.3 Mass-Spring-Damper system..................................................................119
Figure 6.4 Pulse loads for 100 ms impact duration with varying velocity............... 121
Figure 6.5 Pulse loads for 110 ms impact duration with varying velocity............... 122
Figure 6.6 Pulse loads for 120 ms impact duration with varying velocity............... 122
Figure 6.7 Stress in FPS due to impulse load........................................................... 123
Figure 6.8 Load-deflection results for FPS during pulse load. ................................ 124
Figure 6.9 FPS response to pulse load with a velocity of 5 km/h. ........................... 124
Figure 6.10 FPS response to pulse load with a velocity of 10 km/h. ....................... 125
Figure 6.11 FPS response to pulse load with a velocity of 15 km/h. ....................... 125
Figure 6.12 Energy absorbed by FPS during pulse loads. ....................................... 126

xi
Figure 6.13 Percentage of energy absorbed during pulse loads............................... 127
Figure 6.14 Pulse loads for a 5 km/h impact with varying mass. ............................ 128
Figure 6.15 Pulse loads for a 10 km/h impact with varying mass. .......................... 129
Figure 6.16 Pulse loads for a 15 km/h impact with varying mass. .......................... 129
Figure 6.17 FPS response to pulse loads with varying mass at a velocity of 5 km/h.
.......................................................................................................................... 130
Figure 6.18 FPS response to pulse loads with varying mass at a velocity of 10 km/h.
.......................................................................................................................... 130
Figure 6.19 FPS response to pulse loads with varying mass at a velocity of 15 km/h.
.......................................................................................................................... 131
Figure 6.20 Energy absorbed by FPS during pulse loads. ....................................... 131
Figure 6.21 Percentage of energy absorbed by FPS during pulse loads. ................. 132
Figure 7.1 Premature air bag deployment due to stiffer FPS................................... 136
Figure 7.2 Premature air bag deployment due to less stiff FPS. .............................. 137
Figure 7.3 Premature air bag deployment due to less stiff FPS and stiffer vehicle
structure............................................................................................................ 138
Figure 7.4 Late air bag deployment due to less stiff FPS and vehicle structure. ..... 139
Figure 7.5 Testing guidelines for FPS and air bag compatibility. ........................... 140

xii
LIST OF TABLES
Table 2.1 Various electronic sensor algorithms. ........................................................ 27
Table 3.1 Quasi-static testing results for additional FPS. .......................................... 47
Table 3.2 Quasi-static results for replacement FPS................................................... 49
Table 3.3 Quasi-static testing results for replacement FPS with winch..................... 52
Table 3.4 Summary of FPS results for dynamic testing............................................. 59
Table 3.5 Comparison of dynamic and quasi-static energy absorbed by FPS. .......... 60
Table 5.1 Summary of results for pendulum impact. ............................................... 103
Table 5.2 Peak decelerations during pendulum impact............................................ 107
Table 5.3 Change in pendulum velocity after impact.............................................. 111
Table 5.4 Energy absorbed by the FPS during the impact. ...................................... 114
Table 5.5 Percentage of energy absorbed by the FPS during impact....................... 115
Table 6.1 Energy absorbed during pulse loads. ....................................................... 127
Table 6.2 Percentage of energy absorbed during pulse loads. ................................. 127
Table 6.3 Energy absorbed during pulse loads. ....................................................... 132
Table 6.4 Percentage of energy absorbed during pulse loads. ................................. 132

xiii
The work contained in this thesis has not been previously submitted for a degree or
diploma at any other higher education institution. To the best of my knowledge and
belief, the thesis contains no material previously published or written by another
person except where due reference is made.
Signed:
Date:

xiv
ACKNOWLEDGMENTS
As with most projects, the work involved, and contributions made, are more than the
single named author on the front. During this project the contribution and support by
others has been invaluable in the completion of this thesis. Thus I would like to
thank the following for there help during the project.
Firstly I would like to greatly thank Professor David Thambiratnam for his guidance
as the principal supervisor. Without the support, and experience, that David has
provided the project would not have been a success. I would also like to thank
Professor Frank Bullen for his help throughout the project. Without Frank’s effort in
starting this project there would not be a thesis.
I would also like to thank TJM Products, the industry partner during this project.
TJM Products supplied monetary aid, all Frontal Protection Systems tested during
the project and the dynamic testing facilities. I would like to thank the staff of TJM
who have were involved throughout the project, but in particular Mark McGuiness
and Lloyd Taylor.
I also greatly appreciate the contributions of the School of Civil Engineering for the
amenities which enabled me to complete this project. I also greatly appreciate the
staff of the centre that has helped me during this project, in particular the testing staff
who helped during the experimental stages of this project.
I also wish to thank my friends for their help during the project. Lastly I would like
to thank my family for their support during the project, without them no of this
would have been possible.

1
Chapter 1 Introduction
Frontal Protection Systems (FPS), or bull bars as they are commonly known, are
fitted to passenger vehicles for protection during minor impacts, such as animal
impacts, and to provide impact attenuation during major collisions. They have
become a popular accessory for passenger vehicles, and in particular four wheel
drive (4WD) recreation vehicles. But in recent years, with the advent of public
awareness for vehicle safety, concern has arisen on the possible detrimental effects
that a FPS may have when fitted to passenger vehicles, especially those fitted with
air bag systems.
1.1 Aims and Objectives
The main aim of this project is to generate fundamental research information on the
behaviour of FPS under load and their energy absorption capacity, and to develop
procedures for their performance evaluation. Extensive experimental and limited
analytical techniques will be used to generate this research information which will
then be used to predict the impact response of FPS and thereby achieve the project
aims. The outcome will be improved passenger safety under both minor and major
impacts.
Additional objectives which will be achieved are:
• Provide a better understanding of the impact response of FPS.
• Develop a simple, and economical, method for FPS assessment in order to
design them for predictable impact response and compatibility with vehicle
safety systems, such as air bags.
• Develop finite element models and dynamic simulation techniques to study
the effects of all important parameters such as velocity, mass and impact
duration on the impact response of the FPS.
1.2 Research and Methodology
The research program is based on the use of a range of testing facilities and the use
of sophisticated computer programs. The research components and methodology
may be summarised as follows.

2
1.2.1 Experimental Testing
Experimental testing during this project involves both quasi-static and dynamic
techniques. Testing the FPS mounted to the vehicle is not feasible during this project
as there are numerous combinations of vehicle-FPS systems that would require
testing and analysis, making the project unduly prohibitive with respect to cost and
resources. The simplified models used in this project are thus ideally suited for
achieving the aims and objectives of this research project.
1.2.1.1 Quasi-Static Evaluation of FPS
Typical FPS will be subjected to testing under lateral loads using a rigid chassis to
approximate the vehicle structure. This simple approach is valid due to the relative
superior stiffness of the vehicle structure in comparison to the FPS, established
during previous investigations by the FPS manufacturer.
The load-deflection characteristics, as well as the calculated energy absorbed, of each
FPS will be recorded to provide a data base of FPS performance. Further in depth
quasi-static analysis will be undertaken, where strains will be measured in addition to
deflections, to gain an enhanced understanding on the response of FPS components.
These results will be used later for finite element model calibration.
1.2.1.2 Dynamic Evaluation of FPS
It is widely accepted, that while static testing provides excellent data for evaluation
of relative performance, transfer functions are necessary for comparing quasi-static
and dynamic responses. Dynamic testing will be carried out by using a FPS mounted
on rigid chassis and impacting the FPS with a pendulum, which equates to the energy
imparted by an impacting vehicle. This is a simple and effective procedure for
dynamic testing as it allows good repeatability of results and has been shown to be a
valid method.
The retardation values determined by the impact testing will be recorded by
accelerometers, charge amplifiers and data acquisition systems. The maximum
retardation, “g” value is recorded and the change in velocity and load-deformation
resulting from the impact will be calculated. These will be used for the evaluation of
FPS performance and the effect of a FPS on the intended vehicle.

3
1.2.2 Finite Element Analysis
Finite element analysis will be carried out to simulate the pendulum impact and to
study the effects of varying impact characteristics. These models will be developed
from the FPS which are experimentally tested.
A simulated pendulum will be used to study the effects that changes in pendulum
mass and velocity have on the impact response of the FPS. Transient pulse loads
will be developed to simulate a variety of different impacts. These pulses will be
used to study the effects of mass, velocity and impact duration on FPS response.
1.2.3 FPS Evaluation
The experimental and analytical results generated during the project will be used to
evaluate the effects that a FPS has on a passenger vehicle, in particular the air bag
system. Guidelines for evaluating FPS compatibility with vehicle safety systems,
such as air bags, will be developed.
1.3 Thesis Layout
Chapter 2 includes a detailed literature review of FPS. This involves an investigation
into the background of FPS, and further details on the development of FPS. A
summary of relevant impact mechanics is introduced, and vehicle crash dynamics is
discussed. This is followed by details of a vehicle’s air bag system, particularly the
deployment of a vehicle’s air bags. Finally a summary of the various testing
techniques available for the FPS are discussed.
Chapter 3 details the experimental testing that was undertaken during the project. A
large selection of commonly available FPS were tested quasi-statically, and then
dynamically using a pendulum test rig. A comparison of the energy absorbed by
different FPS types, as well as a comparison between quasi-static and dynamic
results is presented.
Chapter 4 details further quasi-static testing that was undertaken to enhance the
understanding of the deformation and strain characteristics of the FPS under load.
Testing was conducted on two FPS using strain gauges and other measuring devices.
4
In addition, two different vehicle frontal structures were tested to evaluate their
energy absorption capabilities.
Chapter 5 highlights the finite element analysis used in the investigation of FPS
performance. An introduction on the finite element programs used is followed by
details of the model development. The model was then used to simulate the
experimental dynamic pendulum tests to study the effects of the pendulum mass and
velocity.
Chapter 6 describes dynamic simulations carried out using the finite element models
subjected to transient pulses. The pulses were used to study the effects of the
impacting object, in particular the mass, velocity and impact duration.
Chapter 7 discusses the effects that a FPS can have on air bag deployment. Further
discussion is given to the testing techniques available in assessing the performance of
a FPS, and simple guidelines for assessing their air bag compatibility are developed
and presented. Additional considerations in the design and testing of a FPS are
discussed.
Chapter 8 presents a summary and the conclusions of this project and some
suggestions for further investigation.

5
Chapter 2 Literature Review
Although Frontal Protection Systems (FPS) have been fitted to passenger vehicles for
many years, very little research has been conducted on the effect that they can have
on passenger vehicles, in particular the safety systems of the vehicle. This literature
review introduces the FPS and the research and testing done to date. An introduction
into impact mechanics and vehicle air bags systems is also presented.
2.1 Frontal Protection Systems
Frontal Protection Systems (FPS), or bull bars as they are more commonly called,
have been fitted to passenger vehicles for many years, specifically four wheel drive
(4WD) recreational vehicles. They are used to protect a vehicle from animal and
light impacts in remote rural areas. Fitted to the front of the vehicle, the FPS would
protect the vehicle, in particular the radiator and lights, against animal impacts,
reducing the possibility of the vehicle being immobilised and the driver being
stranded. With the increase in popularity of recreation vehicles, the fitment of FPS
has become more prevalent.
The first FPS were often manufactured from anything lying around the farm. They
were made to be stiff and indestructible. But over the years the design of the FPS
has evolved, from the forward protruding, square cornered aggressive design, to the
more round edged, body hugging profile that can be seen today. This has been
brought about due to pedestrian safety concerns and the greater expectation for the
FPS to be more aesthetically pleasing.
These changes in FPS design have also been brought about by the changes in vehicle
safety systems. The modern passenger vehicle includes many safety systems to
improve the protection offered to the passengers; these include vehicle crumple
zones and air bags. Crumple zones are used in vehicles so that the occupants are
subjected to reduced loading during impacts. As the severity of the impact increases
the stiffness of the vehicle also increases. Air bags are used to cushion the passenger
from the hard surfaces of the vehicle’s interior during an impact.

6
With the installation of air bags in modern vehicles, there is some concern on the
adverse effect of FPS on air bag deployment (Sparke 1994, Sullivan 1996). This is a
result of the FPS changing the crash characteristics of the vehicle. These crash
characteristics for a vehicle are used in the air bag triggering mechanism to assess the
severity of an accident and whether air bags should be deployed.
2.1.1 FPS Types
There are two different types of FPS for passenger vehicles; they are the additional
FPS and the replacement FPS. These two types are shown in Figure 2.1.
Figure 2.1 Replacement and Additional FPS.
The additional FPS is fitted to the vehicle without the removal of any frontal
components of the vehicle. The additional FPS offers minor impact protection for
the vehicle. The visible section of the additional FPS consists of a major loop, to
which additional side loops can be added. Two typical additional FPS designs are
shown in Figure 2.2.
Figure 2.2 Two typical additional FPS.
The replacement FPS, replaces the existing front bumper and mounting assembly of
the vehicle. The visible sections of a replacement FPS consist of the channel section,

7
to which tubular loop sections are added. An example of a typical replacement FPS
is shown in Figure 2.3. In some cases the replacement FPS not only replaces the
bumper of the vehicle, but also the crush cans of the vehicle, as shown in Figure 2.4.
Figure 2.3 Typical replacement FPS.
Figure 2.4 Frontal Protection System mounting system.
2.1.2 FPS Components
A FPS consists of two main components, the external channel or tubing, and the
mounting system. Both components have significant effects on the performance of
the FPS, and thus must be considered as an integrated system (Bullen et al., 1996).
The mounting system is the link between the vehicle and the visible exterior of the
FPS. It is this link that has the greatest effect on the overall performance of the FPS,
and therefore is the greatest concern in the design and installation of the FPS (Taylor,
1998). It is for this reason that the mounting system is often the first component of
the FPS to fail. This can be done by yielding or buckling, or by shearing of the
mounting bolts.

8
Although the visible channel and/or tubing of the FPS can look similar for different
vehicles, the design of the FPS mounts varies for every vehicle. For additional FPS
the mounting plates are simply welded to the ends of the tubular section, as shown in
Figure 2.5.
Figure 2.5 Additional FPS mount.
Mounts for a replacement FPS are generally more complex than mounts for
additional FPS. They can be manufactured from simple welded and folded plate
material, as shown in Figure 2.6. More complex mounts have been developed using
simple energy absorbing principles. One such FPS mount was developed by
Grzebieta et al (1996) using a folded section for air bag compatibility, as shown in
Figure 2.7. Other more complex mounts use crushable composite sections and push
pin assemblies, as shown in Figure 2.8.
Figure 2.6 Replacement FPS mount.

9
Figure 2.7 Replacement FPS mount using folded section.
Figure 2.8 Replacement FPS mount with composite insert after impact.
2.1.3 FPS Material
FPS are traditionally manufactured from steel or aluminium, but in recent years
plastic FPS have also been developed. The material that the FPS is manufactured
from has a great effect on the performance of the FPS. The most common material
sections used are tube, plate and channel, all in varying thicknesses.
Steel FPS are usually the strongest, but also the heaviest and hence they are generally
only produced for larger 4WD vehicles. Aluminium FPS are the most common form
of FPS available today, they offer a compromise in strength, to a steel FPS, but have

10
greatly reduced weight. Plastic FPS offer good low speed impact absorption and are
safer for pedestrians.
Some designs of FPS use bumperettes placed on the front of the FPS for both
aesthetic and practical purposes. Depending on the impacting object, the
bumperettes can become the initial contact and act as a buffer between the FPS and
impacting object. The bumperettes will help protect the FPS during the initial stages
of the impact by absorbing minor impact loads.
2.1.4 Fitment Numbers
An accurate number of the vehicles fitted with FPS within Australia is not known.
Although many surveys have been conducted both in Australia (Chiam & Tomas,
1980) (Gardner, 1994) and overseas (Zellmer & Otte, 1995) (Hardy, 1996) it is
estimated that 50% of 4WD vehicles are fitted with FPS. It is also concluded that the
majority of vehicles fitted with FPS are in rural areas. But the market for FPS, both
local and export, is increasing (Taylor, 1994).
2.1.5 FPS Accessories
Many different accessories can be mounted to a FPS, as shown in Figure 2.9. These
can include winches, driving lights and radio antennas. It is important to consider
the effects that these accessories can have on the performance of the FPS.
Accessories like radio antennas and driving lights will have little effect on the FPS,
besides an additional weight penalty, while the inclusion of a winch on the FPS can
greatly change the structural rigidity of the FPS.
Figure 2.9 FPS fitted with winch, driving lights and antenna.
The addition of a winch requires an additional winch frame and rollers to be bolted to
the FPS. The placement of the rollers on the front of the bar can sometimes become

11
the initial point of contact during an impact, changing the performance of the FPS.
The addition of a winch also increases the mass on the front of vehicle. Generally
FPS, fitted with winches, are stiffer due to the extra components, shown in Figure
2.10.
Figure 2.10 Details of a FPS with winch assembly.
2.1.6 FPS standards
At the start of this project no standard existed for vehicle FPS in the world. But at
the time of writing a new standard was introduced into Australia (AS 4876.1-2002).
This standard includes vehicles less than 3500 kg fitted with either an additional or
replacement FPS. The standard specifies the markings and packaging required by
FPS and that the design of the FPS must conform to the shape of the vehicle to which
it is to be fitted. The standard also specifies performance requirements for pedestrian
safety. This requires any part of the FPS above 1000 mm to have a head impact
criterion (HIC) less than 1500 when hit by a 2.5 kg head form at 30 km/h. It is
expected that future sections will be added to the standard to include protection
levels for the vehicle.
Vehicles sold within Australia are required to comply with Australian Design Rule
No. 69/00, Full Frontal Impact Occupant Protection (1996). This standard provides
specifications on the level of protection required to be offered to vehicle occupants.

12
It states the maximum levels of injury that can be sustained by a passenger when a
vehicle is impacted into a solid immovable barrier at 48km/h. FPS fitted to a vehicle
at time of sale must also comply with this standard.
Within Australia there is no standard for the testing of vehicle bumpers, but
standards do exist overseas, particularly in Europe and USA (Glance, 1999). Both
European and USA standards require the bumper of a vehicle to provide impact
protection to the vehicle at a velocity of 2.5 km/h. The standard uses pendulum
impacts to the front and back of the vehicle as well as the corner.
2.1.7 Pedestrian Safety
Vehicle safety systems are designed primarily to protect the passengers of the vehicle.
But in recent times the effects that a vehicle can have on external parties, in
particular pedestrians, has had an increased awareness. This recent awareness is
evident in the introduction of the above mentioned FPS standard and the introduction
of pedestrian testing in the European New Car Assessment Programme (EuroNCAP,
2001).
Pedestrians when struck by a vehicle will initially make contact with the bumper
system of the vehicle. The movement of the vehicle will push, and then propel the
pedestrian onto the bonnet of the vehicle. The key contact between the pedestrian
and the vehicle takes place in three specific areas, which can be seen in Figure 2.11.
Figure 2.11 Vehicle pedestrian contact. (www.euroncap.com)

13
With the introduction of a FPS to the front of the vehicle an increase in possible
injury to the pedestrian is evident. For this reason there are many organisations
calling for the ban of FPS. This has been partly fulfilled in Europe by the banning of
vehicle manufacturers to fit FPS to new vehicles from 2002. It is however still
possible to fit FPS after the vehicle has been bought.
The main issues concerning pedestrian safety are the heights of various sections of
the FPS. In particular the height of the upper bar is about the same height of some
children and the pelvis/upper leg height for adult pedestrians. Tests conducted at the
German Federal Highway Research Institute (BASt) investigated the effect of an
impact between FPS and child head forms (Zellmer and Otte, 1995). The tests were
conducted at a velocity of 20 km/h and nine of the fourteen tests resulted in a Head
Impact Criterion (HIC) value of more than 1000, which indicates an unacceptable
risk of serious head injury.
BASt also conducted tests using alternate materials for some components of the FPS
(Zellmer and Friendel, 1994). A plastic tube replaced the main tubing of the FPS,
while the front face of the vertical supporting members was covered with 40 mm of
expanded polystyrene. Testing was conducted at 40 km/h. The results of the tests
were HIC values of 370 for an impact with the plastic tube and 1114 for an impact
with the supporting member. Further tests were conducted where FPS members that
could strike the head of a child pedestrian were encased in self-skinned plastic foam.
Although the tests show a decrease in potential pedestrian injuries, when compared
with the original FPS, they do not indicate the possible effects that these changes will
make to the overall protection offered by the FPS. The potential of the FPS to keep
the vehicle mobilised during an impact with an animal could decrease.
A report published by the Australian Transport Safety Bureau tried to quantify the
contribution that FPS has on road trauma within Australia (Atewell et al., 2000). But
due to the lack of baseline data the report was unable to give exact details. The
report did conclude that the older style FPS offers a greater risk to pedestrians and
that this risk has been reduced with the newer style FPS. These changes in FPS

14
design can be seen in Figure 2.12, which have resulted in FPS which are body
hugging, with the elimination of sharp protrusions.
Figure 2.12 Comparison of new and old FPS designs.
A study conducted by the Transport Research Laboratory of the United Kingdom
compared the head injuries that would occur due to the impact with a vehicle fitted
with and without a FPS. The study showed that the difference in the HIC values for
vehicles with FPS were slightly higher than those recorded for the vehicle alone. But
the results for the vehicles alone were still high enough to inflict serious injury to the
pedestrian. Thus whether or not the vehicle was fitted with a FPS, the pedestrian
would more than likely have suffered severe injuries (Lawrence, 2000).
2.2 Mechanics of Impacts
It is important in the study of impacts to distinguish between the two different types
of impacts that occur, elastic and plastic impacts. In an elastic impact a negligible
amount of energy is lost between the two impacting bodies, for example the collision
of two billiard balls. A plastic impact involves a significant amount of energy
dissipated in the collision. An impact between two vehicles, where the vehicles
crumple on impact, is an example of an elasto-plastic impact.
To analyse different impacts the following simple equations are used. These
equations are generated by studying the impact of two vehicles shown in Figure 2.13.
Figure 2.13 Two vehicles about to collide. (Murray, 1994)

15
The first quantity to consider is kinetic energy, which is the energy of a moving mass.
2
2
1MVEK =
Where;
=KE Kinetic energy, Joules (J)
=M Mass of object, kilograms (kg)
=V Velocity of object, metres/second (m/s)
The second quantity to consider is work. Work represents the force applied through
a distance.
FsW =
Where;
=W Work, Joules (J)
=F Force, Newtons (N)
=s Distance moved, metres (m)
The next quantity to be considered is potential energy due to height or position. It
represents the stored energy in a mass that is stationary.
MghEP =
Where;
=pE Potential energy, Joules (J)
=g Surface gravity, 9.81 (m/s2)
=h Height, metres (m)
Another quantity to consider is momentum. A mass travelling at a certain velocity is
said to have a momentum.
MVM m =
Where;
=mM Momentum, Newton seconds (Ns)
An important consideration of momentum is that it can be neither created nor
destroyed. Thus the momentum before an impact is equal to the momentum after the
impact. Thus for two impacting objects the following equation is used.

16
2211321 )( VMVMVMM +=+
Where;
V1 = Velocity of object 1, (m/s)
V2 = Velocity of object 2, (m/s)
V3 = Resulting velocity of objects 1 and 2, (m/s)
M1 = Mass of object 1, (kg)
M2 = Mass of object 2, (kg)
This can be rearranged to find the resulting velocity of the two objects after impact.
21
22113 MM
VMVMV
++
=
The above equations can be used to find the energy dissipated, ED, during an impact.
This is found by subtracting the kinetic energy of the combined masses, from the
kinetic energies of the two masses before impact.
2321
222
211 )(
2
1
2
1
2
1VMMVMVMED +−+=
or;
221
21
21 )()(2
VVMM
MMED −
+=
When a vehicle is impacting a stationary object, in this case object 1, with a large
mass the equation can be simplified to the following.
2222
1VMED =
Using the equation
MaF =
Where;
=a Acceleration, (m/s2)
t
VVa 12 −
=
Where;
=t Time, seconds (s)

17
It can be deduced that;
)( 12 VVMFt −=
Using this equation for vehicle impacts would assume that the crush characteristics
of a vehicle are constant, as shown in Figure 2.14. This assumption can soon be
shown to be ineffective when the velocity of the impact is lower, or higher, than the
velocity used to calculate the vehicle crush zone. For a low velocity impact, the high
force needed to crush the vehicle will result in higher deceleration and unnecessary
injury risk to the vehicle passengers, shown in Figure 2.15.
Figure 2.14 Crush characteristics with constant force.
(Sparke, 1996)
Figure 2.15 Crash pulse for lower velocity impact with constant crush zone.
(Sparke, 1996)

18
For higher velocities, the kinetic energy of the impact will exceed the energy
absorbed during the crush of the vehicle. This will result in the crush of the
passenger compartment and high injury risk to the vehicle occupants, Figure 2.16.
Figure 2.16 Crash pulse for higher velocity impact with constant crush zone. (Sparke, 1996)
To reduce these risks the crash characteristics, or crash pulse, of the vehicle must
take into consideration three requirements (Sparke, 1996);
• Minimum vehicle damage for low speed impacts.
• Minimum deceleration for more frequent impacts.
• High energy capacity for high speed impacts.
A theoretical crash pulse for these considerations is shown in Figure 2.17.
Figure 2.17 Theoretical ideal crash pulse. (Sparke, 1996)
The actual crash pulse for a vehicle, shown in Figure 2.18, will differ from Figure
2.17 due to the varying stiffness of the different components that make up the front

19
section of a vehicle. Where the front bumper and bonnet are soft, the vehicle’s
engine is hard. These results will change depending on the impact velocity, angle
and measuring point.
Figure 2.18 Crash characteristics of a vehicle showing hard and soft components. (Murray, 1994)
The location of the measuring point for an impact greatly affects the results that are
recorded. For example Figure 2.19 and Figure 2.20 show the acceleration measured
during a frontal impact between a vehicle and a barrier, where the results were
measured in the passenger and engine compartments. The results show that as the
recording point gets closer to the impact, in this case the engine compartment, the
acceleration recorded increases. This is a result of the differences in stiffness of the
various parts of the vehicle, and how they affect the deceleration of the impact.
Figure 2.19 Frontal vehicle to barrier impact at 48 km/h measured in passenger compartment. (Chan, 2000)

20
Figure 2.20 Frontal vehicle to barrier impact at 48 km/h measured in engine
compartment. (Chan, 2000)
The impact velocity also has a major influence on the impact results. Figure 2.21
shows the frontal impact between a vehicle and a barrier at 15 km/h. Comparing this
with Figure 2.19 it can be seen that the acceleration values are less for the lower
velocity impact. For a 48 km/h impact the peak acceleration is 65g at approximately
40 ms, while for a 15 km/h impact peak acceleration is approximately 12g at 30 ms.
It is also important to note that the impact duration for both impacts is approximately
100 ms.
Figure 2.21 Frontal vehicle to barrier impact at 15 km/h measured in passenger
compartment. (Chan, 2000)

21
Another variable to consider in an impact is the type of impact. Figure 2.22 shows
the impact of a vehicle with a barrier having a 30 degree angle at 48 km/h. The
graph shows a peak acceleration after approximately 35 ms of about 45g, and that the
acceleration is still high after about 75 ms, and does not diminish till about 120 ms.
The higher impact duration, when compared with the full barrier impacts, is due to
the initial impact at the front corner of the vehicle, which then progresses across the
front of the vehicle.
Figure 2.22 Frontal vehicle to barrier impact, with 30 degree angle, at 48 km/h measured in passenger compartment. (Chan, 2000)
Another type of impact shown in Figure 2.23 shows the impact between a vehicle
and a pole at 48 km/h. A peak acceleration of approximately 60g occurs at about 45
ms. It is also noted that the acceleration remains high for a long period, compared to
a vehicle to rigid barrier impact, and that it does not diminish till about 125 ms. This
is mainly due to the greater penetration into the vehicle that occurs during this type
of impact.
Comparing the results of the three different impacts, in Figure 2.19, Figure 2.22 and
Figure 2.23, it can be seen that the duration of the impact is increased from 100 ms in
the frontal barrier impact, to approximately 120 ms for the other two impacts. Also it
is evident that the magnitude of acceleration differs between the impacts as a result
of the different components in the vehicle reacting to the various impacts. This was
also highlighted in a study conducted by Jones (1993) to predict the stiffness
coefficient of different vehicle impacts. The study showed that the vehicle stiffness

22
was higher for angled barrier impacts than for full barrier impacts, and higher again
for pole impacts.
Figure 2.23 Frontal vehicle to pole impact at 48 km/h measured in passenger compartment. (Chan, 2000)
This study of vehicle impacts demonstrates the changes in the results that occur
during different types of impacts and variations in the impacting velocities, as well as
measuring locations. This behaviour is important in the design of vehicle safety
systems, in particular the air bags.
2.3 Air Bags
While seatbelts are the primary devices providing restraint and protection to vehicle
passengers, air bags offer supplementary protection. Air bags were first introduced
in the United States between 1974 and 1976, mainly in large sized vehicles produced
by General Motors and Ford. Initially installed for drivers who do not wear seat
belts, they are used in the prevention of head injuries, the major cause of deaths
during vehicle accidents. Advances in air bag technology, and the need for increased
vehicle occupant safety, has led to air bags being a standard item in virtually all new
vehicles. It is compulsory for all new vehicles sold in the United States to have both
driver and passenger air bags.
The most common air bag today is the driver’s side air bag. This air bag is placed in
the steering wheel of the vehicle, and will deploy in frontal impacts only. Passenger
side air bags are installed in the dashboard in front of the passenger and set to trigger

23
when the vehicle is involved in a major frontal collision, along with the driver’s side
air bag. According to vehicle manufacturers, front air bags do not deploy with
animal strikes, roll overs, rear impacts and side impacts (Taylor, 1998).
It is becoming more common for vehicle manufacturers to incorporate side air bags.
These air bags are placed in the vehicle’s B pillar, or the side of the front passenger
seats. The side air bag curtain is another type of air bag for side impacts. The
curtain bag is stored in the roof of the vehicle and covers the side windows when
inflated. These air bags will not deploy in the event of a frontal impact.
Air bag technology, at present, is changing very rapidly. The latest air bags can
identify differences in vehicle occupants, including weight, height or how far they
are from the air bag. Once these details are known the air bag system will customise
the deployment characteristics to suit the vehicle occupants.
2.3.1 The Air Bag System
The air bag system consists of two essential components. They are the air bag and
the air bag sensor. Each component is crucial in how the air bag system performs.
The sensing-inflation-cushion-deflation process of the air bag deployment takes only
a fraction of a second. A diagram of the components can be seen in Figure 2.24.
Figure 2.24 Air bag system. (Chan, 2000)

24
2.3.2 Air Bags
The air bag is the visible component of the system. The air bag, when inflated offers
cushioned protection to the vehicle’s passengers from the interior of the vehicle. The
air bag is manufactured from nylon sections stitched together to form the bag. The
air bag is folded and placed in the vehicle ready for deployment.
The time taken for deployment is typically 30 milliseconds for a driver side air bag.
The bag, once inflated, provides a cushion to absorb the kinetic energy of the
occupant, and will take between 75 to 150 milliseconds to deflate. Deflation is done
through vents placed in the back of the air bag. Timing of these processes is critical
to the effectiveness of the system.
During an impact the kinetic energy of the passenger propels the passenger forward
towards the air bag. If the air bag has deployed too early, it would have started to
deflate before the passenger has contacted the air bag, and thus there may not be
enough restraint to prevent the occupant from contacting the vehicle interior. Also if
the air bag is deployed late, the air bag may not have fully inflated before the
passenger has made contact, resulting in the passenger impacting an unfolded air bag
which can impart considerable forces to the head and chest of the occupant. Thus
for an air bag to be effective it must be fully deployed before contact with the
occupant.
2.3.3 Air Bag Sensors
The air bag inflation process is initiated by the air bag sensors which signal the air
bag to deploy. The sensor is used to judge when an impact has occurred and the
severity of the impact. Thus the design of the air bag sensor has the critical role of
determining when the air bag should deploy. Once the decision to deploy has been
reached a signal is sent to the inflators to generate the gas to fill the bag.
The essential design of the sensor is to differentiate between minor, mild and major
impacts, and to distinguish which of these impacts require the deployment of an air
bag. In a low velocity impact, such as a 10 km/h vehicle impact into a rigid barrier,
the sensor should not trigger the air bag. In a mild impact, such as 30 km/h impact
into a rigid barrier or pole, the sensor will usually trigger the air bag within 40 to 60

25
ms after the initial impact. In a major impact, such as 50 km/h impact, the sensor
will send a signal to trigger the air bag within 10 to 20 ms.
The number of sensors, and the placement, of sensors varies for each vehicle. Some
vehicles can have multiple sensor locations, while others may only have one.
Common locations for sensors are inside the passenger compartment underneath the
dashboard, and behind the front bumper.
There are two different types of air bag sensors used for the deployment of front air
bags. They are velocity dependent or mechanical sensors, and electronic sensors.
Mechanical sensors were the first sensors used in air bag systems, but in recent years
the electronic sensor has become more prevalent.
2.3.3.1 Mechanical Sensors
There are many different forms of mechanical sensors. Some use electrical or
magnetic phenomena to operate, while others are based on mechanical mechanisms.
These different types of mechanical sensors all use the monitoring of a sensing mass
to judge when an impact has occurred. The decision to deploy is made when the
sensing mass’s movement causes the releasing of a mechanism, or the closing of an
electric circuit. Mechanical sensors are always used in multiple configurations.
Mechanical sensors are velocity dependent since they respond to the accumulation
effect of an acceleration sequence. But the characteristics used to determine the
triggering of an air bag vary with the different mechanisms used in the sensor.
2.3.3.2 Electronic Sensors
An electronic sensor contains an accelerometer and accompanying circuitry to
process an impact signal. Stored within the circuit are sophisticated algorithms that
are used to differentiate impacts. An electronic sensor can differentiate impacts more
intelligently than mechanical sensors. Electronic sensors can also be used in single
or multiple configurations.
During an impact the electronic sensor uses the accelerometer to record data of the
impact. The recorded data is then processed to identify the crash signal to be

26
compared with stored crash conditions. The decision to deploy the air bag is made
by the sensing algorithm. Sensing algorithms calculate many different variables of
the impact, and compare the results with stored crash data. An example of different
sensing algorithms is shown in Table 2.1.
The stored crashes within the airbag sensor are a collection of information from a
large number of crash tests for the vehicle. This data is stored in the sensor in the
form of limiting curves. These curves are the time histories of the changes in vehicle
velocity, or other calculated data, form the boundaries between non-deploy and
deploy regions. An example of this is shown in Figure 2.25 for the change in
velocity of the vehicle during an impact.
For the example shown in Figure 2.25, the change in velocity of the impact is
recorded, and compared with the triggering algorithm. If the change in velocity at a
given time crosses the triggering threshold, the line between the light and dark
regions, a signal will be sent for the air bag to deploy.
Figure 2.25 Example air bag triggering threshold.

27
Table 2.1 Various electronic sensor algorithms.
(Chan, 2000)

28
2.3.4 Air Bag Triggering Characteristics
As detailed above, the decision to deploy an air bag is determined by the air bag’s
sensors. These sensors are calibrated for each specific vehicle, dependant upon the
unique vehicle characteristics. This complex process is also governed by the type of
sensors and algorithms used. This is further complicated by the secrecy of vehicle
manufactures on their air bag triggering characteristics. Thus it is not widely known
what characteristics will determine when an air bag will trigger for a specific vehicle.
Vehicle manufactures, however, always set velocity thresholds for the deployment
and non deployment of air bags. The actual value of these velocities varies for each
vehicle. A possible example of this air bag velocity threshold is shown in Figure
2.26 (Taylor, 1998) (Chan, 2000). For this particular example, any impact below 12
km/h would not deploy the air bag, while any impact above 25 km/h would. In
between these two thresholds is the may deploy range where the deployment of the
air bags is determined by the severity of the impact.
Figure 2.26 Example air bag deployment velocity thresholds.
Work has been conducted to measure the deceleration required by various air bag
sensors to determine when an air bag module will trigger. Sredojevic et al (1998)
found that the lowest deceleration was 16g, but recommend that conservative
estimates for FPS compatibility should be judged on 12g for 4WD vehicles and 3.5g
for passenger vehicles. Grzebieta et al (1996) also found, in the development of an
air bag compatible FPS that for a specific vehicle the air bag would trigger at 25g.
These tests are very subjective since they give little detail on the sensors tested. For
example a sensor placed in the engine bay of a vehicle is more likely to have a higher
deceleration threshold than a sensor placed in the passenger compartment. Also,
simply estimating triggering on deceleration alone is only correct for mechanical
sensors or some electronic algorithms.
DEPLOY NO DEPLOY MAY DEPLOY
12 km/h 25 km/h

29
2.4 Testing
There are three main forms of testing available to evaluate the performance of FPS.
These can be divided into quasi-static and dynamic testing, as well as finite element
analysis. Quasi-static testing and dynamic testing are both forms of experimental
testing, where an actual FPS is placed under load, or impacted. Finite element
analysis is a computer simulation technique where a computer model of the FPS is
subjected to loading conditions. All these forms of testing vary in complexity and
cost, and will give varying characteristics of the FPS.
2.4.1 Quasi-Static Testing
Quasi-Static testing is used to test a wide variety of engineering structures, from
tensile tests of material specimens to roll over protection systems. The test requires
the use of a universal testing machine (UTM), as shown in Figure 2.27.
Figure 2.27 Quasi-static testing using a UTM.
The structure is placed in the machine and the cross head of the testing machine is
lowered, applying a gradually increasing load to the structure. The rate of
displacement can be adjusted to suit the testing circumstances. Through the use of
data acquisition software the load and deflection of the structure can be recorded.

30
2.4.2 Dynamic Testing
Dynamic testing differs from static testing in that loading of the structure is done
dynamically. The structure can be either impacted by a moving object, or can be
impacted into an object. Common results recorded during dynamic testing are
acceleration, velocity, load and deflection. Dynamic testing of FPS can be conducted
by two different testing techniques; they are barrier and pendulum testing.
2.4.2.1 Barrier Testing
Full Scale Crash testing, or barrier testing, is a well known testing technique
conducted by vehicle manufacturers to assess the safety characteristics of a vehicle.
Testing involves driving the vehicle into a fixed object at the required velocity. The
impacted object can either be a rigid wall or deformable barrier. All vehicles
manufactured are required to pass barrier testing standards in their respected
countries, within Australia this is conducted to Australian Design Rule 69/00.
Further full scale crash testing is conducted by the New Car Assessment Program
(NCAP) in various countries.
It is known that vehicle manufacturers test FPS for vehicle air bag compatibility by
using rigid barrier testing. Three different velocities are commonly used, one at the
air bag non-deploy threshold velocity and one above the deploy velocity and an
additional test conducted at 48 km/h for Australian Design Rule 69/00. No published
results of these tests are available in the public domain.
2.4.2.2 Pendulum Testing
Pendulum testing is used in many testing areas. Within the automotive sector
pendulum testing is extensively used in the testing of passenger vehicle bumper
systems under US and European standards, with no such standard in Australia.
Pendulum testing is also used by insurance companies, National Roads and Motorists
Association (NRMA) within Australia, to access the cost of low speed impacts on
vehicles for insurance purposes.
Pendulum testing of an FPS is conducted using a pendulum test rig, as shown in
Figure 2.28. The pendulum test consists of a moving pendulum, of adjustable weight,
that is given an initial velocity. The velocity is adjusted by varying the height of the

31
pendulum. Acceleration, velocity, loads and deflection can be recorded during the
impact.
Figure 2.28 FPS before and after dynamic pendulum testing.
The pendulum height necessary for a given impact velocity, V, can be calculated by
equating its potential (EP) and kinetic (EK) energies, when assuming that there are no
losses due to friction and wind.
PK EE =
=2
2
1MV Mgh
Where;
h = height the pendulum is raised from rest.
Rearranging this equation, the velocity V can be found as;
ghV 2=
The velocity of the pendulum can also be represented as a function of its length and
the angle of rotation as;
)cos1(2 θ−= glV
Where
l = the length of the pendulum arm
θ = angle of the pendulum arm from rest

32
It is important to note the velocity of the pendulum is determined by the height of the
pendulum, or the angle of rotation θ, and that the weight of the pendulum has no
effect on the velocity.
The FPS is placed in front of the pendulum, either fixed to a supporting structure, or
fitted to a trolley or vehicle. It is important to consider the differences that exist
between these various mounting conditions.
When a FPS is rigidly fixed, the impacting energy of the pendulum can only be
absorbed by the FPS. Thus the impacting energy of the pendulum is partly absorbed
by the FPS, and partly dissipated by the rebound of the pendulum; some additional
energy could also be absorbed elastically by the mounting structure.
Attaching the FPS to a trolley introduces another form of energy dissipation through
the movement of the trolley after the impact with the pendulum. Thus the impacting
energy of the pendulum is partly absorbed by the FPS and partly transferred to the
movement of the trolley and the rebound of the pendulum. It is also possible that the
trolley may absorb some energy elastically during the impact.
When testing a vehicle fitted with a FPS the vehicle will absorb further energy, when
compared to a trolley. This will be done through deformation of the vehicle and the
energy absorbing properties of the vehicle’s suspension and other components.
2.4.3 Comparison of Testing Techniques
Testing conducted by Zivkozic et al (1996) used four different FPS to compare
results from quasi-static and pendulum testing. The tests were conducted using
velocities between 2.5 and 15.2 km/h and pendulum masses of 134 and 594 kg.
Testing was conducted with and with out a plywood panel. The tests compared the
peak quasi-static and dynamic loads during the test and showed little comparison
existed. This test was inconclusive since it only considered the peak loads of the
tests and not a comparison of the load-deflection response or the energy absorbed
during the tests.

33
A study by Jones (1995) who compared results between quasi-static and impact
testing of various beams and tubes showed a good correlation up to the tested impact
velocity of 12 km/h.
To compare the different forms of dynamic testing, a study of the energy absorbed
during the impact needs to be undertaken. For a rigid barrier impact, or a pendulum
impact with a fixed FPS, the kinetic energy of the vehicle, or pendulum, is partly
absorbed by the FPS. The mass during the impact does not change for a rigid barrier
impact, and is assumed to be constant for a rigid pendulum impact since the mass of
the FPS is much less than the mass of the pendulum. The remaining energy not
absorbed by the FPS is transferred to the rebound of the vehicle, or pendulum, in the
opposite direction of the impact.
For a pendulum impact into a movable vehicle there is the same initial kinetic energy
as with the two other tests. But when the pendulum impacts the movable vehicle, the
mass involved during the impact is increased by the addition of the mass of the
vehicle. After the impact, once the two objects separate, the energy remaining after
the FPS impact is dissipated by the subsequent movement of the pendulum and the
movement of the vehicle.
In summary the energy equation for the impact would be.
)( 21 mmKDK EEE ++=
Where for a fixed object;
DK EE =
Where;
2
21MV
ED =
Another consideration in determining the velocity of the pendulum is how the
impacting object is mounted.

34
For an impact into a movable object;
221
21
21 )()(2
VVMM
MMED −
+=
Considering the mass of the pendulum and impacted body to be equal ( 21 MM = ),
and the impacted body to be stationary, V2=0.
4
21MV
ED =
Thus from the above equations it can be seen that the velocity of a pendulum
impacting a movable stationary object needs to be increased by 2 to obtain the
same energy dissipation as that of a pendulum impact into a fixed stationary object.
Tests conducted by Zivkovic (1996) tried to prove the 41 % difference between the
two different testing techniques. Testing was conducted between 9 and 18 km/h
using a number of different materials. The tests could not show a correlation
between the different tests using the 41 % velocity difference. It is unsure from these
tests what was compared in the comparison of results and what impact duration was
used. But it is important to remember that this comparison will only hold true when
the two impacting objects are in contact.
2.4.4 Finite Element Analysis
Finite Element Analysis (FEA) is a powerful analytical tool for analysing complex
engineering problems. The popularity of finite element analysis has greatly
increased in recent years due to the increase in possible applications and computing
power. FEA uses a computer generated model of the FPS to analyse under different
loading conditions, such as quasi-static and various dynamic conditions. The
advantage of FEA is that there is no need for a FPS to be damaged in testing,
although it is advisable to test a FPS for calibration. This is offset by the time taken
to develop the model and the cost of the software and computer hardware. Some
studies using FEA to study the behaviour of FPS were found in the literature.
A number of finite element models were used by Tomas (1994) to model various
types of FPS. A model was generated to model the impact of a frontal structure for a

35
typical vehicle at 48 km/h into a rigid barrier, as to Australian Design Rule 69/00.
Three different additional FPS models were then attached to the vehicle structure and
modelled. The additional FPS chosen represented two commonly available FPS and
a third stiffer FPS. The velocity changes for the vehicle were used to compare the
results for the vehicle with and without a FPS attached. The results showed that the
softer additional FPS had little effect on the crash pulse of the vehicle, while the
stiffer FPS had some effect.
Additional work was also carried out by Tomas (1994) in the modelling of a
replacement FPS attached to the same vehicle. This analysis was conducted at 20
and 25 km/h since the effect of the FPS at these velocities was deemed more
appropriate for air bag deployment. A further analysis was undertaken at a speed of
20 km/h with an additional FPS to simulate the effects of an impact into a pole.
All finite element models used in Tomas’s investigations modelled the FPS and the
frontal structure of the vehicle. This was done to compare the results of the vehicle
fitted with and without a FPS. However, if the analyse required was only of the FPS,
the addition of the vehicle structure would become computationally very expensive
and would not be required in a study such as that presented herein.
Bullen et al (1994) studied the impact response of an additional FPS. The analysis
used a simplistic approach assuming that the FPS would be elastic, neglecting
plasticity, and used beam elements. Triangular and sinusoidal pulses were generated
using velocities of 25 and 48 km/h and time durations between 30 and 50 ms. These
pulses were applied a FPS fixed at its mounts. It was concluded that the mounting
system of the FPS was an important component in the assessment of an FPS.
2.5 Summary
This chapter contained a literature review on FPS, which was divided into four broad
areas; Frontal Protection Systems, Mechanics of Impacts, Air bags and Testing.
Each of these areas is vital in the understanding of FPS design, performance and
testing. The literature review also showed that there are two key areas of research;
pedestrian safety, and compatibility with vehicle safety systems, especially air bags.

36
The research into FPS pedestrian safety has shown that pedestrians are at risk when a
vehicle is fitted with a FPS. This has partly been answered by the evolution of FPS
design to become more body hugging, with no sharp edges. But it is envisaged that
with the advent of the new Australian Design Standard, FPS manufacturers will
decrease the potential risk to pedestrians. This could be done by a change in FPS
design or materials.
The area of FPS and vehicle safety system compatibility is a less researched area, but
an area of great importance. FPS need to be designed to integrate into the safety
systems of vehicles and not to adversely affect the safety of the vehicle’s passengers.
This is of particular importance with a vehicle’s air bags. Thus testing of FPS needs
to be conducted to access their suitability for the fitment to vehicles.
The testing of FPS and air bag compatibility is a complex problem, made even harder
by the ‘secrecy’ of air bag triggering data. Experimental testing using both quasi-
static and dynamic techniques is currently being used by FPS and vehicle
manufacturers, but with no consistency in the testing methods and no published
results. This is an area that will be further discussed within this thesis and forms the
basis of this research project.

37
Chapter 3 Experimental Testing
As discussed in the previous chapter testing of FPS can be undertaken using quasi-
static or dynamic techniques. For this project both techniques were used. Quasi-
static testing was undertaken using a universal testing machine. While dynamic
testing was conducted by use of a swinging pendulum testing rig. This chapter
illustrates and discusses the experimental testing that was undertaken and the results
of those tests.
3.1 FPS Behaviour during an Impact
Before testing can be conducted, a brief description of the behaviour of a FPS during
an impact is required. This is required so that the appropriate data can be recorded
during the testing conducted.
Due to the nature of the intended vehicles, the testing of FPS needs to take into
account the effect that the FPS will have on the vehicle. This detail is of particular
concern with the mounting system of the FPS. To better examine the type of
vehicles that FPS are designed for, they need to be divided into two broad groups;
4WD recreational vehicle and general passenger vehicle.
4WD recreation vehicles are designed for off road use, and thus are designed slightly
different from passenger vehicles, although this has been slightly blurred with the
introduction of the newer ‘soft’ off road vehicles. 4WD vehicles are generally
constructed with a chassis to which the body, engine and other components are
mounted. This makes the 4WD vehicle more rigid and an ideal vehicle for heavy
towing.
Additionally 4WD vehicles are designed with a greater height from the ground, and
reduced vehicle overhangs, so that the vehicle can negotiate rough terrain. Due to
this increase in height, and reduction in approach angle, the bumper of the vehicle is
generally higher than the chassis of the vehicle. This difference in height means that
the bumper system of the vehicle requires a mounting system to fit the bumper to the
chassis, which in turn applies to any FPS fitted to the vehicle.

38
This makes the point of contact of any object that is hit higher than the mounting
points on the chassis. Thus the bumper, or FPS, will generally rotate about the
mounting points, and thus for a FPS, the top of the FPS will contact the front of the
vehicle. An example of FPS rotation is shown in Figure 3.1, with before and after
photos.
A
B
C
D
E
θ
Figure 3.1 Example of FPS rotation.
It can be seen in Figure 3.1 that the initial point of contact would be at height A. The
difference in height between A and B, the height of the FPS impact point above its
mounting points, is shown by the distance C. Due to this difference in height, the
FPS will rotate about B, an angle of θ, until the top of the FPS, D, comes in contact
with the front of the vehicle. It is also worth noting that as the FPS rotates the
contact point with the impacting object changes. Initially at A, the contact point
translates to E. Thus the rotation of the FPS is greater in the initial phases of the
impact.
The rotation of the FPS is a key issue in the integration of the FPS to the vehicle.
Generally by the time the FPS comes into contact with the vehicle it has become
plastic, and thus it can be assumed that the vehicle would offer more resistance than

39
the deflected FPS. Thus any energy absorbed by the FPS during testing, after which
it would have contacted the vehicle, can be ignored. The distance between the top of
the FPS and the vehicle, or vehicle clearance illustrated in Figure 3.2, was measured
before each test was conducted.
Vehicle Clearance
Figure 3.2 Vehicle clearance.
For general passenger vehicles, and some 4WD vehicles, rotation of the FPS does not
occur. This occurs when the initial contact point and the mounts of the FPS are
inline. In this case other clearance distances, between the FPS and vehicle, are
required for considering the effect that the FPS has on the vehicle. For most of the
FPS that were tested during this project, this was not an issue, and thus the vehicle
clearance between the top of the FPS and the vehicle was used.
With this in mind, during quasi-static testing the displacement of the FPS was
measured at two different places; one at the cross head, thus measuring displacement
where the load is applied, and the second at the top of the FPS to measure the
rotation of the FPS, which was compared with the vehicle clearance. With the
displacement data and the recorded load, the energy absorbed by the FPS before
coming into contact with the vehicle was calculated. Similarly, during dynamic
testing only data up to the FPS contacting the vehicle was considered.

40
3.2 Test Setup
Quasi-static testing was conducted using a Tinius Olsen universal testing machine
located at the Queensland University of Technology. To distribute the load across
the FPS a rectangular section, made from steel, was bolted to the cross head, shown
in Figure 3.3.
Figure 3.3 Quasi-static testing setup.
The FPS was mounted to a rigid chassis. The rigid chassis was used to replicate the
mounting structure of each specific vehicle to which the FPS was intended to be
fitted, as shown in Figure 3.4. All rigid chassis were constructed from steel and all
mounting holes on the chassis were the same holes that the FPS would use for
mounting to its intended vehicle.
A drawback in using a rigid chassis is that there is no deflection of the chassis, and
thus the FPS absorbs virtually all of the energy. In some cases this would be
acceptable due to the vehicle’s chassis acting in a similar way, but this would not
always be the case. For example, when crush cans are left on the vehicle and form
part of the FPS mounting system, the rigid chassis would be stiffer than that of the

41
crush cans. In this case, testing the FPS with a rigid chassis would give an over
exaggeration of the energy absorbed.
Figure 3.4 Rigid chassis.
Once the FPS had been mounted to the rigid chassis it was placed in the universal
testing machine, as shown in Figure 3.5. Load and displacement were recorded
using a computer running the data acquisition program Labtec Notebook. As
discussed earlier the deflection of the FPS was measured in two different places. A
string potentiometer was used to measure the displacement of the cross head, while a
LVDT was used to measure displacement at the top of the FPS, also shown in Figure
3.5. Load-deflection curves were generated for all tests using the two recorded
deflections and the recorded load.
SyncMaster 170Mp.
Cross head
Top of FPS
Figure 3.5 FPS ready for quasi-static testing.

42
A uniform displacement of 10 mm/min was then applied to the FPS until the FPS had
deflected a sufficient distance such that the deflection of the top of the FPS had
exceeded the vehicle clearance, shown in Figure 3.6. Once this displacement had
been reached the test was stopped and all data recorded was analysed.
Figure 3.6 FPS after quasi-static testing.
3.2.1 Data Analysis
All testing results were plotted as load-deflection variations for consistency, and ease
of calculating the energy absorbed. Moment rotation plots were not used as they
would not be applicable to all FPS tested, for example those with bumperrettes.
Further the point of rotation of the FPS is not known before the test, and the loading
point also varied during the tests.
Figure 3.7 shows a typical load-deflection plot for a FPS subjected to quasi-static
testing. As shown in the plot the top of the FPS, defined as BBar, has deflected a
greater distance than the cross head of the universal testing machine, defined as
XHead. This shows that the FPS has rotated about its fixed mounting points as the
load was applied. Taking the vehicle clearance into account, the energy absorbed by
the FPS, up to contact with the vehicle, can be calculated.
For this particular FPS, designed for the Mitsubishi Pajero iO, the clearance was
measured at 80 mm as indicated by the cross in Figure 3.7. This point is transferred
to the deflection curve for the cross head, referred to as [a]. The energy absorbed, or
area under the graph, up to this point was calculated, represented by the shaded area.

43
The cross head deflection is used to calculate the energy since the cross head applied
the load to the FPS, and thus represents a true load-deflection plot.
Figure 3.7 Load deflection plot for quasi-static testing.
The energy absorbed by this FPS was calculated to be 388 Joules. To gain a better
representation of this energy value a comparison with the kinetic energy of the
vehicle travelling at a speed of 25 km/h was calculated. The velocity of 25 km/h was
chosen as this is a known velocity where vehicle air bags will deploy. The mass of
the vehicle, plus two 75 kg occupants, was 1462 kg, and thus the kinetic energy was
calculated to be 35,253 J. Comparing this to the energy absorbed by the FPS during
testing it can be conclude that the FPS would absorb 1.1% of the energy of a vehicle
travelling at a speed of 25 km/h when impacting a immovable object.
3.2.2 Failure Modes
During the numerous tests of FPS conducted a number of different failure modes
were observed. The most common form of failure was yielding of the FPS. For an
additional FPS this would occur in the major bend of the tubing, or at the welded
mounting plate on the tubing. For replacement FPS the yielding would occur in the
mounting plates, and in some cases the yielding would lead to buckling of the plates.
The location of the yielding would depend on the geometry of the mounting plates.
A typical example of this failure mode is shown in Figure 3.7, where the yielding of
the FPS has resulted in significant rotation.

44
Another form of failure observed was shearing of the mounting bolts. This mode
was mainly seen on FPS that were fitted with winches. An example of this is shown
in Figure 3.8 which shows the results for a Holden Frontera replacement FPS. The
results show the load sharply droped at approximately 55 and 70 mm cross-head
deflection, once the bolts had sheared. Due to the shearing of the bolts the XHead
displacement is often greater than the BBar displacement. This type of characteristic
was also observed when welds were broken during testing.
0
5
10
15
20
25
30
35
40
45
50
0 10 20 30 40 50 60 70 80 90
Deflection (mm)
Lo
ad (
kN)
XHead BBar
Figure 3.8 Replacement FPS for Holden Frontera
Failure of FPS fitted with winches would often occur in the winching frame. This is
shown in Figure 3.9, showing the results for a Toyota Hilux replacement FPS with
winch. The results show a relatively constant stiffness up to approximately 54 mm
cross-head deflection. After this point the stiffness of the FPS is increased due to the
load being transferred to the winch frame of the FPS, preventing the FPS from
rotating.
As previously discussed the type of failure of the FPS is dependent on the design of
the FPS, which in turn is dependent upon the intended vehicle. For 4WD vehicles,
where the mounting point of the FPS is lower, rotation of the FPS was observed in
most instances, while for passenger vehicles, where mounting points of the FPS
would align with the impact point, rotation of the FPS was not always observed. An

45
example of this is shown in Figure 3.10 showing the results for a Holden
Commodore replacement FPS. As shown in the figure the XHead and BBar have the
same deflected profile. This has resulted in no rotation of the FPS.
0
20
40
60
80
100
120
0 10 20 30 40 50 60 70 80 90 100
Deflection (mm)
Lo
ad
(kN
)
XHe ad BBar
Figure 3.9 Replacement FPS with winch for Toyota Hilux.
0
10
20
30
40
50
60
0 20 40 60 80 100
Deflection (mm)
Lo
ad (
kN)
XHead BBar
Figure 3.10 Replacement FPS for Holden Commodore

46
The load-deflection results in Figure 3.7 and Figure 3.10, show that these responses
reach a peak load during testing and then become plastic. Figure 3.8 has reached a
peak load before the bolts had sheared, but had lost most of its stiffness. Figure 3.9
shows very little stiffness up to the point where the load is transferred to the winch
frame, then it seems to be still increasing in stiffness when the test was stopped.
A means of comparing the efficiency of the FPS to absorbed energy and the effect of
the various failure modes is to observe the shape of the load-deflection curve, or the
form factor. A perfect form factor would be that of a square wave, while a triangular
shape has a form factor of 50 %. Comparing the load-deflection curves in Figure 3.7,
Figure 3.8, Figure 3.9 and Figure 3.10, it is evident that each of the FPS has a
different form factor. Figure 3.7 has the best form factor of the four FPS of
approximately 75 %, while Figure 3.9 has the worst form factor of less than 50%.
3.2.3 Summary of FPS Tested
The following tables, Table 3.1, Table 3.2 and Table 3.3, present a summary of the
FPS that were tested during this project. The tables are divided into those
representing additional FPS, replacement FPS and replacement FPS with winches.
The different design types, as designated by the manufacturer are shown in bold. All
FPS were either manufactured from aluminium (A) or steel (S). The vehicle mass in
the table is the mass of vehicle with two 75 kg passengers
When comparing the data for each FPS it can be seen that the average clearance for
each FPS is approximately 80 mm. Also it can be seen that the amount of energy
absorbed by the FPS has little relation to the mass of the vehicle. This would be due
to the limitation of different materials available to the FPS manufacturers. For
example most aluminium FPS mounts are made from either 4 or 5 mm plate.
Table 3.1 shows a summary of the replacement FPS tested. The FPS are divided into
a number of different designs, T16 and T5 as well as being constructed from either
aluminium or steel.

47
Table 3.1 Quasi-static testing results for additional FPS.
Vehicle Clearance
(mm)
Mass of Vehicle
(kg)
Energy Absorbed
(J)
% Energy Absorbed
T16(A)
1 Mazda B Series 65 1632 549.5 1.4
2 Holden Jackaroo 85 2042 710 1.4
3 Kia Sportage 75 1646 463.5 1.2
4 Mitsubishi Challenger 90 1911 505 1.1
5 Toyota Prado 110 1873 776 1.7
6 Nissan Navara 85 1797 1473 3.4
7 Toyota Rav4 30 1402 80 0.2
8 Ford Explorer 90 2074 619.5 1.2
9 Jeep Grand Cherokee 80 1956 299.5 0.6
10 Holden Rodeo 60 1487 271 0.8
11 Mitsubishi Pajero 80 2132 195 0.4
12 Holden Frontera 99+ 80 1810 361.5 0.8
13 Nissan Pathfinder 99+ 85 1922 88.5 0.2
14 Mitsubishi Pajero iO 80 1462 387.5 1.1
15 Subaru Forester 95 1472 349 1.0
16 Suzuki Grand Vitara 65 1679 303 0.7
17 Daewoo Musso 98+ 120 2214 418 0.8
18 Landrover Freelander 35 1704 40.75 0.1
19 Ford Falcon AU 80 1645 368 0.9
20 Nissan Patrol GU 120 1990 1749 3.6
21 Toyota L/C100 75 2382 808.5 1.4
22 Honda CRV 15 1562 103 0.3
23 Ford Falcon EF 30 1688 276 0.7
24 Jeep Cherokee 85 1900 1472 3.2
25 Diahatsu Terios 65 1187 509 1.8
26 Suzuki Vitara 100 1257 500 1.6
27 Nissan Terrano II 85 1912 983 2.1
28 Holden Commodore VT 60 1703 593 1.4

48
29 Mitsubishi Pajero NL 85 2022 610 1.3
T5(A)
30 Mazda B Series 100 1632 816 2.1
31 Ford Falcon AU 100 1645 286.4 0.7
32 Holden Commodore 80 1703 1166 2.8
T5(S)
33 Mitsubishi Triton 90 1749 341 0.8
34 Nissan Navara 90 1797 326 0.8
35 Toyota Hilux 60 1790 448 1.0
Figure 3.11 shows a summary of the percentage of energy absorbed for additional
FPS tested, from Table 3.1. As shown in the results most of the FPS absorb energy
in the range 0.1 to 2.0 % in deflecting through a distance equal to the vehicle
clearance. Only a handful of the tested FPS absorbed energy above this range, with a
maximum of 3.6 %.
0.0
0.5
1.0
1.5
2.0
2.5
3.0
3.5
4.0
0 5 10 15 20 25 30 35
Test Number
En
erg
y A
bso
rbed
(%
)
T16 T5A T5S
Figure 3.11 Quasi-static results for additional FPS.

49
Table 3.2 shows a summary of the replacement FPS tested. The FPS are divided into
a number of different designs, T1, T3, T11, T13 and T15 as well as being constructed
from either aluminium or steel.
Table 3.2 Quasi-static results for replacement FPS.
Vehicle Clearance
(mm)
Mass of Vehicle
(kg)
Energy Absorbed
(J)
% Energy Absorbed
T1(A)
36 Subaru Forester 85 1472 2812.5 7.9
37 Landrover Discovery 80 2217 3576 6.7
38 Grand Vitara 75 1679 2984 7.4
39 Mazda B Series 90 1632 3085 7.8
40 Mercedes Benz ML320 170 2162 5826 11.2
41 Kia Sportage 70 1646 2204.5 5.6
42 Toyota Prado 80 1873 1502 3.3
43 VW Transporter 50 1732 2044 4.9
44 Holden Rodeo 65 1487 1419 4.0
45 Toyota Hilux 85 1461 961 2.7
46 Holden Jackaroo 75 2042 1339.5 2.7
47 Mitsubishi Pajero iO 95 1462 2346 6.7
48 Holden Frontera 99+ 80 1810 1811.5 4.2
49 Toyota L/C100 IFS 75 2557 1940 3.1
50 Toyota L/C100 Coil 75 2382 1910 3.3
51 Suzuki Grand Vitara 65 1679 3368.5 8.3
52 Nissan Pathfinder 4mm mnt
50 1922 3145 6.8
53 Nissan Pathfinder 5mm mnt
50 1922 4354.5 9.4
54 Toyota Prado 96 1873 3309 7.3
55 Nissan Patrol GU 100 1990 2420.5 5.0
56 Daewoo Musso 120 2202 7780 14.7
57 Lexus LX470 110 2557 5947 9.6
58 Mitsubishi Challenger 90 1911 2843 6.2
59 Toyota Rav4 97+ 180 1367 3879.5 11.8

50
60 Toyota Hilux 75 1790 1075 2.5
61 Suzuki Vitara 80 1257 2822 9.3
T3(A)
62 Mitsubishi Pajero 90 2132 7362.5 14.3
63 Kia Sportage 80 1646 3817 9.6
64 Mitsubishi Pajero NL 92 2022 4419 9.1
T11(A)
65 Holden Commodore 70 1703 2718.5 6.6
66 Ford Falcon AU 60 1645 2068 5.2
67 Holden Commodore VT 70 1703 175 0.4
T13(S)
68 Holden Rodeo 90 1487 747.5 2.1
69 Toyota Hilux 90 1790 2103 4.9
T15(A)
70 Toyota L/C100 IFS 80 2557 3621 5.9
71 Toyota LC/100 coil 80 2382 2727 4.7
72 Holden Jackaroo 75 2042 1598 3.2
T15(S)
73 Holden Rodeo 75 1487 1538 4.3
74 Mazda B Series 80 1632 2785 7.1
75 Toyota LC/100 coil 80 2382 2793 4.9
76 Toyota LC/100 IFS 80 2557 2178 3.5
77 Toyota Prado 96 1873 3648.5 8.1
78 Holden Jackaroo 85 2042 1179 2.4
79 Nissan Patrol GU 90 1990 2466 5.1

51
Figure 3.12 shows a summary of the percentage of energy absorbed for replacement
FPS tested, from Table 3.2. As shown in the results most of the FPS absorb energy
in the range 2.0 to 8.0 % in deflecting through a distance equal to the vehicle
clearance. A number of the tested FPS were above this range, with a maximum of
14.7 %.
0.0
2.0
4.0
6.0
8.0
10.0
12.0
14.0
16.0
35 40 45 50 55 60 65 70 75
Test Number
En
erg
y A
bso
rbed
(%
)
T1 T3A T11A T13S T15A T15S
Figure 3.12 Quasi-static testing results for replacement FPS.
Table 3.3 shows a summary of the replacement FPS tested with winches. The FPS
are divided into a number of different designs, T3 and T15, as well as being
constructed from either aluminium or steel.
Figure 3.13 shows a summary of the percentage of energy absorbed for replacement
FPS with winches, from Table 3.3. As shown in the results most of the FPS absorb
energy in the range 4.0 to 10.0 % in deflecting through a distance equal to the vehicle
clearance. Only a handful of the tested FPS absorb energy above this range, with a
maximum of 21.6 %.

52
Table 3.3 Quasi-static testing results for replacement FPS with winch.
Vehicle Clearance
(mm)
Mass of Vehicle
(kg)
Energy Absorbed
(J)
% Energy Absorbed
T3(A) + Winch
80 Toyota LC/100 coil 80 2382 2410.5 4.2
81 Toyota LC/100 IFS 80 2557 11715 19.0
82 Toyota Prado 9 1873 1543.5 3.4
T13(S) + Winch
83 Holden Rodeo 90 1487 1048.5 2.9
84 Toyota Hilux 90 1790 1069 2.5
T15(A) + Winch
85 Landrover Discovery 80 2217 3889 7.3
86 Mitsubishi Triton 90 1749 1809 4.3
87 Toyota LC/100 coil 80 2382 3680 6.4
88 Nissan Patrol GU 90 1990 4103 8.6
89 Ford Explorer 80 1790 3847 8.9
T15(S) + Winch
90 Landrover Discovery 100 2217 5095 9.5
91 Toyota Prado 90 1873 3717 8.2
92 Mazda B Series 80 1632 4122 10.5
93 Holden Rodeo 75 1487 1884 5.3
94 Mitsubishi Triton 90 1749 2488.5 5.9
95 Toyota Hilux 100 1790 3115 7.2
96 Toyota LC/100 IFS 70 2557 3745.5 6.1
97 Ford F350 55 2281 11902.5 21.6
98 Toyota LC/100 coil 80 2382 3455 6.0
99 Holden Jackaroo 85 2042 1692 3.4
100 Nissan Patrol GU 90 1990 4050 8.4
101 Ford Explorer 80 1790 5350 12.4

53
0.0
5.0
10.0
15.0
20.0
25.0
80 85 90 95 100
Test Number
En
erg
y A
bso
bed
(%
)
T3A T13S T15A T15S
Figure 3.13 Quasi-static testing for replacement FPS with winch.
Comparing all the results, the effect of the fitment of a winch can be seen, where the
average energy absorbed by the FPS has increased. It can also be seen from these
results that there is some discernable difference in the energy absorbed between FPS
manufactured from aluminium and steel.
3.3 Dynamic Testing
The previous section discussed quasi-static testing conducted. This was used to
study the load-deflection response and energy absorbed by the FPS. But during
vehicle impacts the load is dynamic. Thus to study the dynamic properties of a FPS
dynamic testing was undertaken. For vehicle testing this is often undertaken by
driving a vehicle into a rigid barrier, which is a very expensive procedure. For low
speed impacts, like bumper testing, the impact is done with a pendulum.
In this project dynamic testing was studied by use of a pendulum test rig. These tests
were able to evaluate the accelerations and velocities of the impact, as well as loads
and energy absorbed.

54
3.3.1 Pendulum Test Rig
The pendulum test rig consisted of the rigid frame, a pendulum and a winching
device for raising the pendulum, shown in Figure 3.14. For testing, a pendulum
weight of 2008 kg was used since it is a good representative weight for most vehicles.
Fitted to the front of the pendulum was a piece of plywood to spread the load, shown
in Figure 3.15. Testing was undertaken at TJM Products.
Figure 3.14 Pendulum test rig.
3.3.2 Data Acquisition
The deceleration of the pendulum was recorded during the test. This was done by
use of accelerometers, charge amplifiers and memory recorders. The accelerometer
was placed centrally on the back of the pendulum, at the centre of mass of the
pendulum. The rear of the pendulum, with charge amplifier is shown in Figure 3.16.

55
Figure 3.15 Front view of pendulum.
Figure 3.16 Rear view of pendulum.
3.3.3 FPS Mounting
The FPS were mounted to the same rigid chassis as used during quasi-static testing to
ensure correlation of results. The FPS was then fixed to two rigid supports in front
of the pendulum, which can be seen in Figure 3.1 and Figure 3.16. The supports
were adjusted so that the pendulum impact would occur when the pendulum had
reached its lowest point, or point of maximum velocity.
3.3.4 Pendulum Velocity
The velocity of the pendulum was adjusted by changing the start height, or angle, of
the pendulum. The height was calculated by using the energy equations discussed in
Chapter 2. For the testing conducted a velocity of 5.5 km/h was chosen for use with
additional FPS, while a velocity of 10 km/h was used for replacement FPS. These
velocities were chosen since they represent non-deployment velocities for vehicle air
bags, and were also used in previous tests conducted by the FPS manufacturer.

56
3.3.5 Testing Results
All data analysed was recorded from the accelerometer placed on the back of the
pendulum. It was assumed that all the momentum of the pendulum acted on the FPS
that it was impacting. Thus the effects of friction and environmental effects, such as
wind, were ignored in the analysis.
Unlike in quasi-static testing it was not possible to record the deflection of the FPS at
its top. Thus testing continued till the pendulum had rebounded from the impact with
the FPS. Since the pendulum was the only recorded point from which displacement
can be extrapolated it was assumed that the tested FPS behaved similar to that during
quasi-static testing. By assuming this the deflection of the pendulum was assumed to
be the same as the deflection of the cross head during quasi-static testing. Thus,
when calculating when the FPS would have rotated a sufficient distance to come in
contact with the vehicle, the same procedure as in section 3.2.1 and Figure 3.7 was
used. The displacement of point [a] for each FPS tested quasi-statically was
recorded and used for the pendulum displacement during dynamic testing.
The clearance distance was very important in the analysis of the dynamic results.
This was due to the recording of the data lasting longer than that required for the
clearance distance to be reached. In most tests, the peak acceleration of the impact
would often occur after this distance had been reached. This resulting peak was
often due to the top of FPS impacting the supporting frame or rigid chassis. For this
reason any data recorded after the FPS would have contacted the vehicle was not
analysed.
3.3.5.1 Data Analysis
A number of FPS were tested dynamically. A typical result and analysis is shown
for the Mitsubishi Pajero iO additional FPS, that was quasi-statically tested in section
3.2.1.
Figure 3.17 shows the deceleration recorded during the pendulum impact up to the
time when the FPS would have rotated and contacted the vehicle. The graph shows a
gradual increase in the deceleration up to the peak deceleration of 7.5 m/s2 (0.76 g)
occurring after approximately 27 ms.

57
-8
-7
-6
-5
-4
-3
-2
-1
00 5 10 15 20 25 30
Time (m/s)
Acc
eler
atio
n (
m/s
2 )
Figure 3.17 Deceleration of pendulum during impact.
By integrating the acceleration-time results the velocity of the pendulum during the
impact was calculated, as shown in Figure 3.18. The velocity of the pendulum
decreases from the initial impact speed of 5.5 km/h to approximately 4.95 km/h
during this time period.
4.8
4.9
5
5.1
5.2
5.3
5.4
5.5
5.6
0 5 10 15 20 25 30
Time (ms)
Vel
oci
ty (
km/h
)
Figure 3.18 Velocity of pendulum during impact.

58
By multiplying the mass of the pendulum with the accelerations recorded, the force
of the pendulum acting on the FPS was calculated. The displacement of the
pendulum was calculated by integrating the velocity with time. Figure 3.19 was
generated using the calculated force and displacement. The graph also shows the
load and deflection recorded during quasi-static testing. As can be seen the graphs
are very similar, with the quasi-static results having a slightly higher load. This
higher load results in the FPS absorbing more energy during quasi-static testing.
0
2
4
6
8
10
12
14
16
0 5 10 15 20 25 30 35 40
Deflection (mm)
Lo
ad (
kN)
Static Dynamic
Figure 3.19 Load-deflection plots for quasi-static and dynamic tests.
From the graph the energy absorbed by the FPS, or lost by the pendulum, was
calculated to be 333 J, or 16.5 % of the pendulum’s kinetic energy. The remaining
kinetic energy of the pendulum has dissipated by further deformation of the FPS and
by rebound, which are not shown in these graphs.
3.3.5.2 Results Summary
The peak acceleration, velocity change of the pendulum during the impact, and the
energy absorbed by the FPS were calculated for each FPS tested dynamically. The
energy absorbed by the FPS was compared to the kinetic energy of the pendulum
during the impact, and represented as a percentage.

59
Table 3.4 shows a summary of the testing results for the FPS that were subjected to
dynamic testing. The table also shows the change in velocity of the pendulum up to
the vehicle clearance for the FPS had been reached.
Table 3.4 Summary of FPS results for dynamic testing.
Vehicle
Vehicle Mass (kg)
Pendulum Velocity (km/h)
Peak Acceleration
(m/s2)
Velocity Change (km/h)
T16
Subaru Forester 1472 5.5 9.1 0.38
Nissan Pathfinder 1922 5.5 17 1.05
Nissan Navara 1797 5.5 10.1 0.88
Kia Sportage 1646 5.5 7.9 0.25
Holden Frontera 1810 5.5 12.1 0.58
Mitsubishi Pajero iO 1462 5.5 7.39 0.64
Ford Falcon Au 1645 5.5 3.3 0.228
Toyota Prado 1873 5.5 12.1 0.875
Mitsubishi Pajero Nm 2132 5.5 6.32 0.44
Toyota Rav4 1462 5.5 4.75 0.13
Holden Rodeo 1487 5.5 9.39 0.52
Jeep Cherokee 1956 5.5 11.25 0.49
Ford Explorer 2074 5.5 10.87 0.69
T5
Mazda B Series 1632 5.5 12.12 0.78
Nissan Navara 1797 5.5 8.57 0.4
T1
Mitsubishi Pajero iO 1462 10 38.41 1.98
Holden Frontera 1810 10 23 1.55
Kia Sportage 1646 10 38.2 2.23
Toyota Prado 1873 10 19.5 1.39
Toyota Hilux 1461 10 14.99 1.12

60
Table 3.5 shows a comparison of the dynamic and quasi-static energy absorbed
during experimental testing. The percentage of energy absorbed by the FPS of the
swinging pendulum’s kinetic energy is also shown.
Table 3.5 Comparison of dynamic and quasi-static energy absorbed by FPS.
Vehicle
Dynamic Energy
(J)
Static Energy
(J)
Percentage Difference
(%)
Percentage of Pendulum
Energy (%)
T16
Subaru Forester 290 349 +20.3 12.4
Nissan Pathfinder 788 876 +11.2 33.6
Nissan Navara 628 738 +17.5 26.8
Kia Sportage 185 131 -29.2 7.9
Holden Frontera 441 362 -17.9 18.8
Mitsubishi Pajero iO 333 388 +16.5 14.2
Ford Falcon Au 114 368 +222.8 4.9
Toyota Prado 646 776 +20.1 27.6
Mitsubishi Pajero Nm 257 195 -24.1 11.0
Toyota Rav4 83 80 -3.6 3.5
Holden Rodeo 377 271 -28.1 16.1
Jeep Cherokee 349 300 -14.0 14.9
Ford Explorer 521 620 +19.0 22.2
T5
Mazda B Series 570 816 +43.2 24.3
Nissan Navara 357 326 -8.7 15.2
T1
Mitsubishi Pajero iO 2646 2346 -11.3 34.2
Holden Frontera 1484 1811 +22.0 19.2
Kia Sportage 2957 2882 -2.5 38.2
Toyota Prado 1853 1502 -18.9 23.9
Toyota Hilux 1060 961 -9.3 13.7

61
Studying these results it is evident that the energy absorbed during quasi-static and
dynamic pendulum testing is similar in magnitude, which is evident in Figure 3.20
where the data points for each FPS are plotted. Up to approximately 1000 J the
results match very well, after this point due to the reduced number of results, the
difference between the energies is observed to be greater. This is shown in the
closeness of the data points to the trendline, and the calculated r-squared value of
0.958. This similarity in energy absorbed could be due to the slow velocity of the
pendulum impact, and thus the pendulum velocity could be within the range of quasi-
static.
R2 = 0.958
0
500
1000
1500
2000
2500
3000
0 500 1000 1500 2000 2500 3000
Static Energy (J)
Dyn
amic
En
erg
y (J
)
Figure 3.20 Comparison of quasi-static and dynamic energy absorbed by FPS.
Figure 3.21 shows a comparison of the change in velocity of the pendulum, during
the impact, and the percentage of static energy absorbed for a vehicle travelling at 25
km/h. The trendline in the figure shows that for lower energy absorption FPS there
is a good relationship between the results, while as the percentage of energy
absorbed increases the relationship decreases. This is highlighted by the r-squared
value of 0.8239. This is partly due to the lack of data for higher energy absorbing
FPS. But it is also expected that higher energy absorbing FPS use the interaction
between their components, and not just the material of the FPS for the absorption of
energy. Due to this composite action between the components of higher energy

62
absorbing FPS, the use of quasi-static testing to predict their dynamic response is less
accurate.
R2 = 0.8239
0
0.5
1
1.5
2
2.5
3
0.00 1.00 2.00 3.00 4.00 5.00 6.00 7.00 8.00
Static Energy (%)
Ch
ang
e in
Vel
oci
ty (
km/h
)
Figure 3.21 Change in velocity and static energy absorbed.
R2 = 0.9413
R2 = 0.688
0
0.5
1
1.5
2
2.5
0.0 5.0 10.0 15.0 20.0 25.0 30.0 35.0 40.0 45.0
Dynamic Energy (%)
Ch
ang
e in
Vel
oci
ty (
km/h
)
Additional FPS Replacement FPS
Figure 3.22 Change in velocity and pendulum energy absorbed.

63
Figure 3.22 shows the comparison between the change in velocity of the pendulum
and the percentages of energy absorbed by the FPS during dynamic testing. The data
is separated into two groups for additional and replacement FPS which were tested at
the two different pendulum velocities. For the additional FPS the curve shows a very
good fit, shown by the high r-squared value of 0.9413, while the curve for the
replacement FPS is inconclusive due to the lack of data, shown by the low r-squared
value of 0.688. It is evident in these results that there is a direct relationship between
the energy absorbed by the FPS and the change in velocity of the pendulum. This
would be expected due to conservation of momentum and the transfer of energy from
the pendulum to the FPS.
3.4 Summary
This chapter presents and discuses, the results of more than one hundred FPS that
were experimentally tested. Initial testing was done using quasi-static techniques,
followed by dynamic pendulum testing. During testing the FPS were mounted to a
rigid chassis to replicate the vehicle structure. Testing was conducted until the
deflection of the top of the FPS reached a value equal to the clearance between the
vehicle and the FPS.
From quasi-static testing the energy absorbed by the different types of FPS were
calculated. This energy can be used to gain an understanding of the effect that the
FPS will have on a vehicle during an impact. This was done by comparing the
calculated energy with the kinetic energy of the vehicle travelling at a velocity of 25
km/h, with the value represented as a percentage. It was observed that most
additional FPS absorb up to approximately 4 % of the energy of a vehicle. This
energy absorbed increased to approximately 8 % for a vehicle with a replacement
FPS, or approximately 10 % for a replacement FPS with a winch.
The dynamic testing in this chapter was conducted using a pendulum test rig. The
acceleration of the pendulum was recorded, from which the velocity change of the
pendulum and the energy absorbed by the FPS were calculated. It was shown that
there was a good relationship between the percentage of the kinetic energy absorbed
by the FPS and the change in velocity of the pendulum. But the relationship between
the percentage of quasi-static energy and change in pendulum velocity was less

64
conclusive. It was also shown, that the energies absorbed by the FPS during both
quasi-static and dynamic testing were similar in magnitude. It would also be
expected that better correlation of results could have occurred if a greater number of
FPS were tested dynamically.
From these results it was shown that the results for quasi-static and dynamic testing
are comparable for lower energy absorbing FPS, typically additional FPS. While as
the FPS absorbs more energy, typical of replacement FPS, the correlation in the
results decreases. This is expected to be due to the lower energy absorbing FPS
relying predominately on material properties to absorb energy, while higher energy
absorbing FPS also rely on the composite action between the different components in
the FPS.
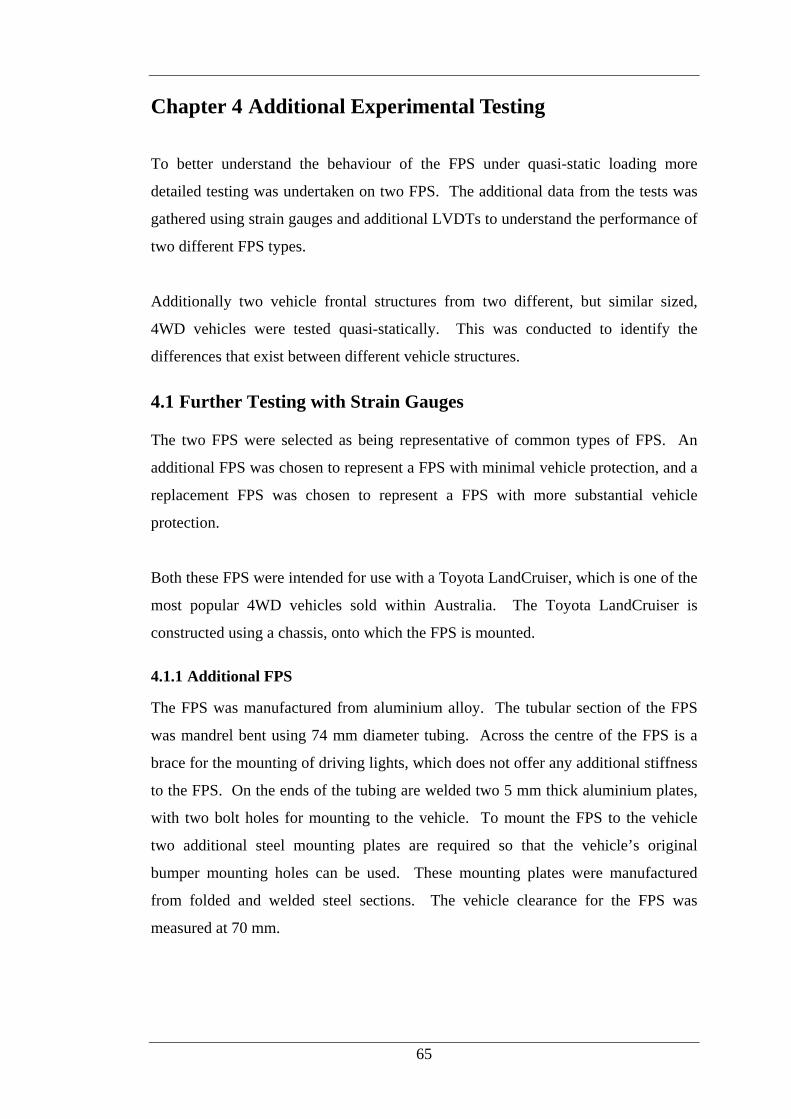
65
Chapter 4 Additional Experimental Testing
To better understand the behaviour of the FPS under quasi-static loading more
detailed testing was undertaken on two FPS. The additional data from the tests was
gathered using strain gauges and additional LVDTs to understand the performance of
two different FPS types.
Additionally two vehicle frontal structures from two different, but similar sized,
4WD vehicles were tested quasi-statically. This was conducted to identify the
differences that exist between different vehicle structures.
4.1 Further Testing with Strain Gauges
The two FPS were selected as being representative of common types of FPS. An
additional FPS was chosen to represent a FPS with minimal vehicle protection, and a
replacement FPS was chosen to represent a FPS with more substantial vehicle
protection.
Both these FPS were intended for use with a Toyota LandCruiser, which is one of the
most popular 4WD vehicles sold within Australia. The Toyota LandCruiser is
constructed using a chassis, onto which the FPS is mounted.
4.1.1 Additional FPS
The FPS was manufactured from aluminium alloy. The tubular section of the FPS
was mandrel bent using 74 mm diameter tubing. Across the centre of the FPS is a
brace for the mounting of driving lights, which does not offer any additional stiffness
to the FPS. On the ends of the tubing are welded two 5 mm thick aluminium plates,
with two bolt holes for mounting to the vehicle. To mount the FPS to the vehicle
two additional steel mounting plates are required so that the vehicle’s original
bumper mounting holes can be used. These mounting plates were manufactured
from folded and welded steel sections. The vehicle clearance for the FPS was
measured at 70 mm.

66
4.1.1.1 Assembly
Figure 4.1 shows the pieces of the T16 FPS before the FPS had been mounted to the
rigid chassis. As shown in the figure the FPS consists of the external tubing
constructed from aluminium alloy, the mounting plates constructed from steel and
various nuts and bolts used to assemble and mount the FPS.
Figure 4.1 Additional FPS parts.
Figure 4.2 shows the FPS once it had been mounted to the rigid chassis. For the FPS
the steel mounting plates were bolted to the tubing using two M10 bolts, on each end,
tensioned to manufacture’s recommendation. The mounting plates were mounted to
the rigid chassis using M12 bolts tensioned to manufacturer’s recommendation.
Figure 4.2 Additional FPS mounted to rigid chassis.

67
4.1.1.2 Strain Gauges and LVDTs
To better understand the mechanics of the FPS under load, six rosette strain gauges
were placed on the FPS to measure the strain of the FPS during the test. The strain
gauges were placed at various locations on the FPS where it was determined that the
critical strains of the FPS would occur during testing. The strain values were
recorded using a computer with data acquisition software.
Gauge B
Gauge C
Gauge D
Gauge F
Gauge G
Gauge H
Figure 4.3 Strain gauge placement for additional FPS.

68
Five gauges were placed around the major bend of the FPS, deemed to be the critical
section. Two gauges, C and F, were placed on the underside of the tube, while three
gauges, B, D and E, were placed on the top of the tube. One gauge, G, was placed on
the aluminium plate welded to the FPS. The remaining gauge, H, was placed on one
of the steel mounting plates. Figure 4.3 shows pictures of the strain gauge
placements, where each gauge is highlighted by the circle.
Two LVDTs were used during the test. One was used to measure the displacement
of the cross head, while the other was used to measure the displacement of the top of
the FPS tubing.
4.1.1.3 Results
As detailed above, the load-deflection and strains were recorded during the test.
Figure 4.4 shows the load-deflection results for the test.
0
2
4
6
8
10
12
14
16
18
20
0 10 20 30 40 50 60 70 80
Deflection (mm)
Load
(kN
)
XHead BBar
Figure 4.4 Load-deflection results for additional FPS.
The results shows that the stiffness of the FPS, during the first 10mm of cross-head
deflection, remained relatively constant. After 10 mm deflection the stiffness of the
FPS decreases till the peak load of approximately 18 kN was reached, at which point
yielding of the FPS had occured. Comparing the curves for the top tubing of the FPS,

69
designated as BBar, and the cross head, designated as XHead, the amount of rotation
of the FPS that occurred during the testing is evident. When the top of the FPS
deflected 70 mm, the vehicle clearance for the FPS, the cross head deflection of the
FPS had reached approximately 34 mm. Using this results the energy absorbed by
the FPS, up to the 70 mm vehicle clearance, was calculated at approximately 585 J.
Figure 4.5 shows a couple of views of the FPS after the quasi-static loading. When
comparing these pictures with the before testing pictures the amount of rotation
exhibited by the FPS can be seen.
Figure 4.5 Additional FPS after testing.
Peak principal strains during the test were exhibited in the major bend of the tubing.
Figure 4.6 shows the strains on the outer bend surface of the tubing, while Figure 4.7
shows the strains on the inner bend surface of the tubing. The directions of principal
strains were not calculated as they were not required. When comparing these results
it can be seen that the inner surface had approximately twice the strains of the outer
surface. It was also observed that the strains were similar along the bend of the
tubing, which could be attributed to the manufacturing process of the FPS. Figure
4.8 shows close ups of the tubing after testing, where the flattening of the tubing in
the bend can clearly be seen.
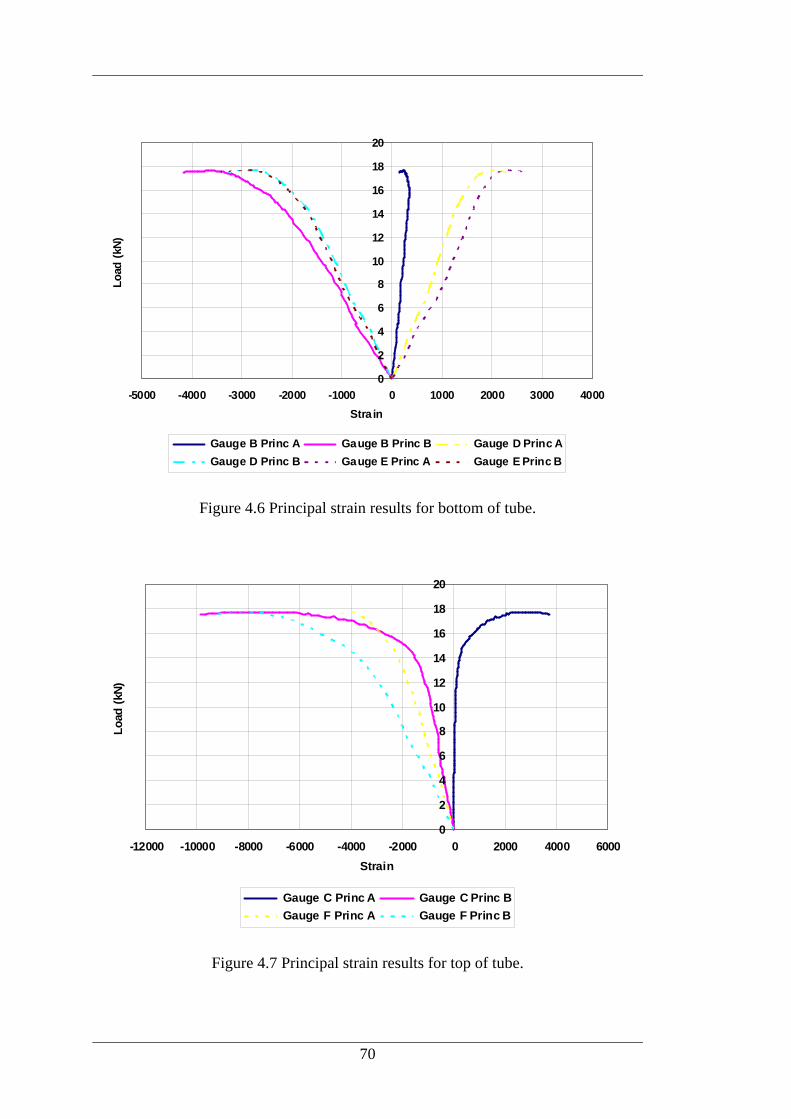
70
0
2
4
6
8
10
12
14
16
18
20
-5000 -4000 -3000 -2000 -1000 0 1000 2000 3000 4000
Stra in
Load
(kN
)
Gauge B Princ A Gauge B Princ B Gauge D Princ A
Gauge D Princ B Gauge E Princ A Gauge E Princ B
Figure 4.6 Principal strain results for bottom of tube.
0
2
4
6
8
10
12
14
16
18
20
-12000 -10000 -8000 -6000 -4000 -2000 0 2000 4000 6000
Strain
Load
(kN
)
Gauge C Princ A Gauge C Princ B
Gauge F Princ A Gauge F Princ B
Figure 4.7 Principal strain results for top of tube.

71
Figure 4.8 Major bends in tubing of additional FPS after testing.
Figure 4.9 shows the strain results for the mounting plates, which are very low when
compared with the strains discussed above. This is due to the lower tube section
being aligned axially with the loading of the FPS. Thus the tube section is under a
compressive load, which results in the plastic hinge forming in the major bend of the
tubing. Figure 4.10 shows the mounting plates after the testing, where it can be seen
that little deformation had occurred.
0
2
4
6
8
10
12
14
16
18
20
-600 -400 -200 0 200 400 600 800 1000
Strain
Load
(kN
)
Gauge G Princ A Gauge G Princ B
Gauge H Princ A Gauge H Princ B
Figure 4.9 Principal strain results for mounting plate.

72
Figure 4.10 Mounting plates of additional FPS after testing.
4.1.2 Replacement Bar
The replacement FPS was manufactured from steel, with an aluminium tube section.
Unlike the additional FPS tested, this FPS consists of two main pieces; these were
the channel section and the mounts. The channel section was manufactured from
4mm steel plate, while the mounts were manufactured from 5mm steel plate. The
vehicle clearance for the FPS was measured at 80 mm.
4.1.2.1 Assembly
Figure 4.11 shows the mounting kit for the FPS which consisted of the two mounting
plates, spacers and bolts. The main section of the mounting plate had three slots, for
the fixing of the channel section, and two holes for bolting to the vehicle’s chassis.
To this section are welded two further sections, also manufactured from 5mm steel.
Each of these sections had two further holes for mounting to the vehicle. Thus in
total there were six holes for bolting to the chassis and three bolt holes for the
mounting of the channel section on each mount. These details can be seen in Figure
4.12.
Figure 4.13 shows the mounts attached to the test rig, with all six mounting bolts in
place. All bolts used in the assembly of the FPS were tensioned to the
manufacturer’s recommendations.

73
Figure 4.11 Replacement FPS mounting kit.
Figure 4.12 Vehicle mounts for replacement FPS.
Figure 4.13 Replacement FPS mounting plate fixed to rigid chassis.

74
The FPS channel section was manufactured from 4mm steel plate, welded together to
form the channel section. To the channel section were welded two perpendicular
plate sections for fixing to the mounting plates with three bolts. The top tube section
is also bolted to the channel section, shown in Figure 4.14, this section is
manufactured from aluminium tubing.
Figure 4.14 Assembly of channel section.
Figure 4.15 shows the completed assembly of the FPS once the channel section had
been bolted to the mounts.
Figure 4.15 Completed replacement FPS mounted to rigid chassis.
As detailed in the description of the FPS, the mounting plates have slots to which the
bolts fixing the channel section and the mounting plates can slide. The length of
these slots is approximately 20 mm. Included with the bolts and nuts fixing these
two parts were locking and flat washers. Figure 4.16(a) shows the channel section
positioned at the bottom of the slots, while Figure 4.16(b) shows the channel section
at the top of the slots, as they would be when the FPS is mounted to a vehicle.
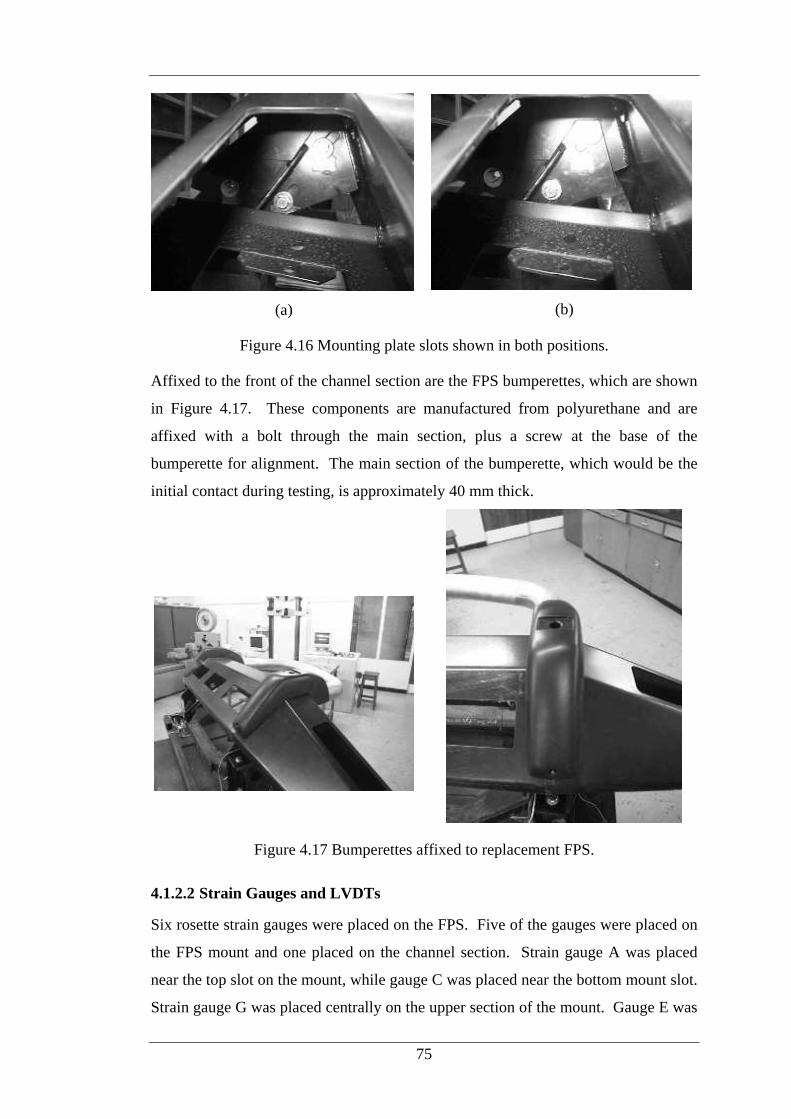
75
(a)
(b)
Figure 4.16 Mounting plate slots shown in both positions.
Affixed to the front of the channel section are the FPS bumperettes, which are shown
in Figure 4.17. These components are manufactured from polyurethane and are
affixed with a bolt through the main section, plus a screw at the base of the
bumperette for alignment. The main section of the bumperette, which would be the
initial contact during testing, is approximately 40 mm thick.
Figure 4.17 Bumperettes affixed to replacement FPS.
4.1.2.2 Strain Gauges and LVDTs
Six rosette strain gauges were placed on the FPS. Five of the gauges were placed on
the FPS mount and one placed on the channel section. Strain gauge A was placed
near the top slot on the mount, while gauge C was placed near the bottom mount slot.
Strain gauge G was placed centrally on the upper section of the mount. Gauge E was

76
placed on the lower section of the mount. Gauge F was placed centrally on the upper
welded flange section of the mount. The remaining gauge, D, was placed centrally
on the mounting plate of the channel section. These gauge locations, highlighted by
the circles, can be seen in various pictures of Figure 4.18.
Gauge A
Gauge C
Gauge D
Gauge E
Gauge F
Gauge G
Figure 4.18 Strain gauge placement for replacement FPS.
To better understand the deflection of the FPS four LVDTs were used to measure the
deflection of the FPS, shown in Figure 4.19. As with all previous testing a LVDT
was placed on the cross head of the UTM, and another was placed on the top of the

77
tubing. An additional LVDT was placed under the channel of the FPS. This was
used to measure the displacement of the channel during the test. This measurement
could be compared with the deflection of the cross head displacement to better
understand the effect of the bumperettes. A further LVDT was used to measure the
displacement of the FPS mount. This measurement would enable a better
understanding of the effect of the slots when compared with the LVDT displacement
for the channel.
Figure 4.19 LVDT placement for replacement FPS.

78
4.1.2.3 Results
The results of the load-deflection for the test are shown in Figure 4.20. The results
show the deflection of the four LVDT locations measured during the test. It is
important to note that the results for the cross head, designated as XHead, is the true
load-deflection of the FPS, while the other results are the relative deflections of the
other measured points during the test. From the cross head results it is shown that
the FPS exhibited a constant stiffness up to approximately 40 mm deflection, where
the stiffness increased up to a deflection of approximately 70 mm. The stiffness then
decreased up to when the testing was stopped.
0
20
40
60
80
100
120
140
0 20 40 60 80 100 120
Deflection (mm)
Load
(kN
)
XHead BBar Channel Mount
Figure 4.20 Load deflection results for replacement FPS.
On first observation, there is very little difference between the results of the cross
head and that of the top of the FPS, designated at BBar. This may lead one to
assume that the FPS has rotated little during the test. But when comparing the
deflection of the top of the FPS, to that of the mount, it can be seen that a significant
amount of rotation has occurred during the test as shown in Figure 4.21. The reason
for the similarity between cross head and the top of the FPS is due to the bumperettes
fitted to the front of the FPS, and the channel movement within the slots.

79
Figure 4.21 Replacement FPS after quasi-static testing.
The bumperettes account for approximately the first 20 mm of deflection, before any
load is absorbed by the mounting system of the FPS. This is evident in the constant
stiffness at the start. When comparing the cross head and channel deflections it can
be seen that the bumperettes had deformed approximately 20 mm when the load
reached 20 kN. The bumperettes were fully deformed when a load of approximately
85 kN was reached.
Comparing the channel and mount deflection shows that the sliding of the channel
section started to occur when the load had reached approximately 18 kN. By the
time the load had reached 50 kN the channel section had moved the maximum 20mm
in the slots.
Figure 4.22 shows pictures of the deflected mounts after testing. Deflection of the
mount was observed along its longitudinal axis, as well as twisting of the mount.
The twisting of the mount occurred in an outwards direction due to the bolting of the

80
channel section to the inner surface. Further deformation was evident in the mount
slots which were caused by the fixing bolts for the channel section.
Figure 4.22 Mounting plates for replacement FPS after testing.
Figure 4.23 shows the principal strains recorded by the strain gauges located on the
upper section of the FPS mounts, while those of the lower section are shown in
Figure 4.24. Comparing these two figures shows that the lower section of the mount
had much higher strains. For the upper section, the strain increase remained
relatively constant up to a load of 40 kN, and then increased at a greater rate. This
also occurred in the lower section of the mount, but at a load of approximately 100
kN, where yielding had occurred. The directions of principal strains were not
calculated as they were not required.

81
0
20
40
60
80
100
120
140
-2500 -2000 -1500 -1000 -500 0 500 1000 1500 2000
Strain
Lo
ad (
kN)
Gauge A Princ A Gauge A Princ B
Gauge G Princ A Gauge G Princ B
Figure 4.23 Principal strains for strain gauges A and G.
0
20
40
60
80
100
120
140
-10000 -5000 0 5000 10000 15000
Strain
Load
(kN
)
Gauge C Princ A Gauge C Princ B Gauge E Princ A
Gauge E Princ B Gauge F Princ A Gauge F Princ B
Figure 4.24 Principal strains for strain gauges C, E and F.
Very little deformation was evident in the channel mounting plate, as shown in
Figure 4.25. The principal strains observed in the channel section were relatively
low compared to those in the mount, as shown in Figure 4.26.
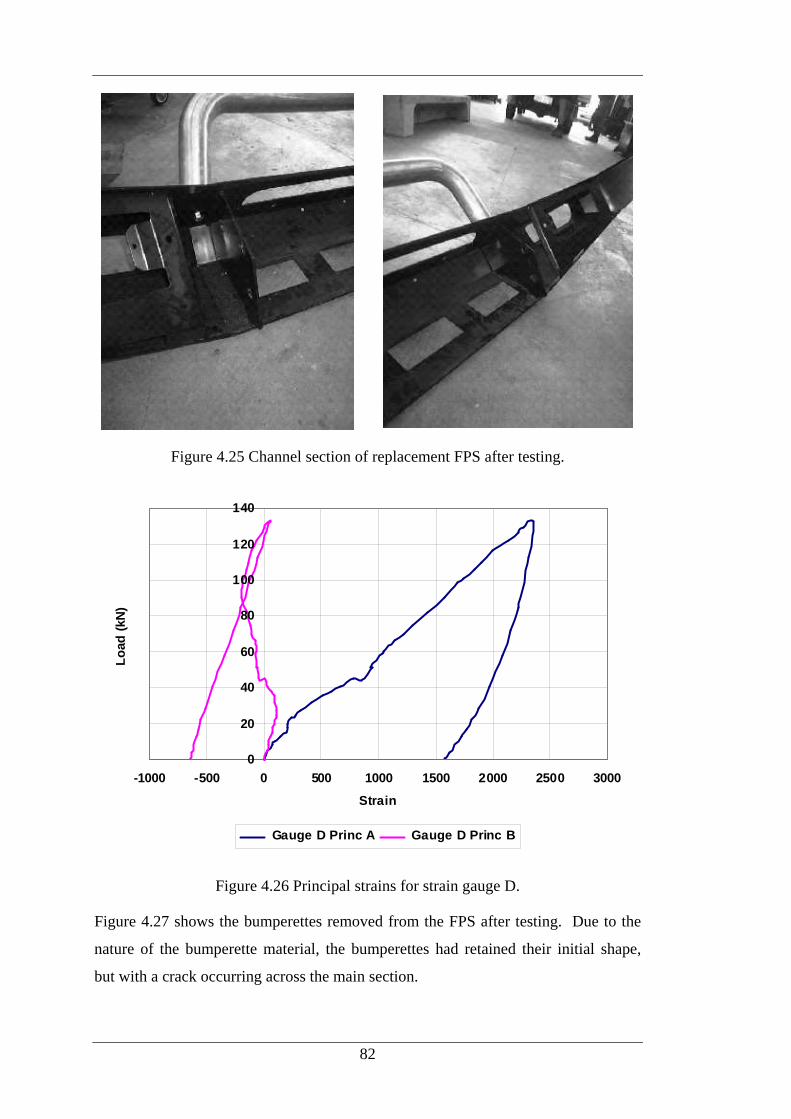
82
Figure 4.25 Channel section of replacement FPS after testing.
0
20
40
60
80
100
120
140
-1000 -500 0 500 1000 1500 2000 2500 3000
Strain
Lo
ad (
kN)
Gauge D Princ A Gauge D Princ B
Figure 4.26 Principal strains for strain gauge D.
Figure 4.27 shows the bumperettes removed from the FPS after testing. Due to the
nature of the bumperette material, the bumperettes had retained their initial shape,
but with a crack occurring across the main section.

83
Figure 4.27 Bumperettes for replacement FPS after testing.
4.2 Vehicle Frontal Structures
The vehicle’s frontal structure has a major effect on the design, and thus impact
performance of a FPS. These energy absorbing structures greatly dictate the impact
characteristics of the vehicle during the initial stages of an impact. The fitment of a
FPS to these structures, or the replacement of these structures by a FPS needs careful
consideration.
A passenger vehicle’s structure can generally be classified as either being
constructed of a monocoque or chassis structure. Each of these structures behaves
slightly different during an impact. A vehicle with a chassis structure uses a stiff
chassis to which the body of the vehicle is mounted. During an impact the energy is
absorbed by the body of the vehicle and transferred through the chassis. Energy can
also be absorbed by energy dissipaters integrated into the chassis, such as crush cans.
Most 4WD recreational vehicles are generally manufactured this way.
The monocoque type structure combines the chassis and body of the vehicle into one
structure. The monocoque provides both the stiffness of the vehicle and its energy
absorbing capability. Most modern passenger vehicles use a monocoque structure.
Two examples of vehicle frontal structures were tested quasi-statically, from two
different, but similar sized vehicles. Testing was conducted using the same setup as
previous quasi-static FPS tests. The load and deflection of the cross head was
recorded during each test.

84
4.2.1 Monocoque Structure
The first structure tested was off a Mitsubishi Pajero, shown in Figure 4.28 before
and Figure 4.29 after testing. The Mitsubishi Pajero is a 4WD recreational vehicle
manufactured with a monocoque structure. The frontal structure tested is located
behind a plastic bumper, welded to the vehicle. As shown in the figures the frontal
structure is made from a stamped thin steel section. The two dimples on the front of
the structure absorb the energy of any impact applied to the structure. The quasi-
static load-deflection results of the structure are shown in Figure 4.30. The structure
gradually absorbed energy up to about 40 mm deflection where the dimples had been
crushed, beyond which the load was applied to the mounting structure, shown by the
resulting increase in stiffness.
Figure 4.28 Frontal structure of Mitsubishi Pajero before testing.
Figure 4.29 Frontal structure of Mitsubishi Pajero after testing.

85
0
20
40
60
80
100
120
140
160
0 10 20 30 40 50 60
Deflection (mm)
Lo
ad (
kN)
Figure 4.30 Load-deflection results for Mitsubishi Pajero frontal structure.
4.2.2 Chassis Structure
The second structure tested is a crush can from a Landrover Discovery, as shown in
Figure 4.31. The Landrover Discovery is a 4WD recreational vehicle manufactured
with a chassis. Two of these crush cans are located behind a plastic bumper, and
bolted to the vehicle’s chassis. The crush can was manufactured from a thin
aluminium tubular section. Energy is absorbed by the folding of the structure as a
load is applied, shown in Figure 4.32. The results from testing a single crush can
using quasi-static loading can be seen in Figure 4.33. The results show that the crush
can has a high initial stiffness as the first fold forms. After this initial peak the load
and hence the rate of energy absorbed remains relatively constant.
Figure 4.31 Crush can from Landrover Discovery.

86
Figure 4.32 Crush can from Landrover Discovery before and after testing.
0
10
20
30
40
50
60
70
80
90
100
0 10 20 30 40 50 60 70 80 90 100
Deflection (mm)
Lo
ad (
kN)
Figure 4.33 Load-deflection results for Landrover Discovery crush can.
4.2.3 Summary
Testing conducted in this chapter was used to gain a better understanding of two
different types of FPS, and to gauge the performance of two different types of
vehicle frontal structures.
The testing of the two types of FPS showed the varying complexity of the FPS, and
the different ways for FPS to absorb energy. The energy absorbed by the additional
FPS was mostly by the material properties of the manufactured FPS, while for the
replacement FPS, the energy was absorbed by the FPS material, the bumperettes and
the friction between the mounts and channel section.

87
The testing also showed the critical points to consider in the design and manufacture
of a FPS. For the additional FPS tested, the critical location was at the major bend of
the tubular section, which was shown in the deformation of the tubing in this area
and the strain results. For the replacement FPS the critical location was observed to
be the lower section of the mounts where the largest principal strains were recorded.
The two frontal structures tested showed the variation that exists between different
vehicle types. When comparing the load-deflection results of these two structures it
is important to remember that two crush cans are mounted to the front of a vehicle,
such as the Landrover Discovery. Thus for full frontal impacts the frontal structure
of the Landrover Discovery absorbs more energy, than that of the Mitsubishi Pajero.
This is due to the higher average load and also the greater deflected distance.
Consideration should also be given to the rate at which the energy is absorbed. The
loading of the Mitsubishi Pajero increased with the deflection, while that of the
Landrover Discovery remains relatively constant, after the initial peak.


89
Chapter 5 Finite Element Analysis
Finite Element Analysis (FEA) use computers to accurately generate analytical
models of a structure to be analysed. These models can be used to study the effects
of different loading types and to study the influence of important parameters on the
response of a structure.
In this project FEA was used to further investigate the additional FPS that was tested
in Chapter 4. The finite element models were used to simulate the experimental
pendulum testing and to study the effects of vehicle mass, impact velocity and
impact duration, as well as the properties of the impacting surface.
This chapter describes the development of a FPS finite element model, as well as
presenting the results obtained from a simulated pendulum impact. Chapter 6
discusses transient pulse loading applied to the finite element model.
5.1 Finite Element Software
During this project two different finite element packages were used; ABAQUS (HKS,
2001) and LS-Dyna (LSTC, 2001). The capabilities of both these packages are very
versatile, and they are capable of carrying out highly specialised investigations in
their respected areas. ABAQUS is a general purpose FEA package, with the ability
to model structural and thermal problems. ABAQUS Standard uses the implicit
method to solve problems, which is best suited to static problems. LS-Dyna,
although with limited implicit abilities, uses an explicit code to solve problems. This
is best suited to dynamic problems, which are often more complex and time
consuming to solve.
Implicit and explicit both refer to time integration algorithms that are used in the
respective computer programs. Both methods can be used to solve transient dynamic
problems. But when static equilibrium is required, where inertia effects are omitted,
the implicit method can be used to solve the governing equations much quicker than
an explicit solver.

90
In solving a problem, an implicit solution computes a stiffness matrix to represent the
interaction of nodal displacements within the structure. The stiffness matrix is then
inversed and multiplied with the nodal forces to compute the nodal displacements, as
in a typical stiffness method of analysis. The nodal displacements are then used to
test and verify the governing equation, where a balance between external and internal
energies must be reached. Once equilibrium has been reached the solver increases
the time step, and thus any external forces, so that equilibrium can be reached again.
The advantage of this is that the user can choose the required time step, while the
disadvantages are the requirements to form, store and factorise the stiffness matrix.
Thus implicit methods generally involve a small number of expensive time steps.
The explicit method sums the internal and external forces at each node and divides
by the nodal mass to find the nodal acceleration. The solution advances by
integrating the acceleration in time, where the time step size is limited by the Courant
condition. This condition implies that the distance travelled by an infinitesimal wave
in one time step must never exceed the distance between computational nodes. This
often restricts the size of the time step to small intervals. Thus explicit methods
generally involve many inexpensive time steps. The disadvantage of this is that for
any long duration, or static problems, it can become prohibitively expensive.
One of the main differences between implicit and explicit solvers is the restriction
placed on the user of the time step size that can be used. As stated above implicit
time steps can be chosen by the user and can be quite large, while explicit time steps
are generated by the solver and are generally small. These differences lead to the
different problems that are commonly solved with each solver. Implicit solvers are
used to solve quasi-static and static problems, such as material spring back. An
explicit solver is used to solve dynamic problems, like drop tests and vehicle
collisions.
Throughout this project both finite element packages were used. The pre-processor
MSC/Patran was used for model development, which is able to output ABAQUS
code. ABAQUS was therefore used during model development. Once the model
had been developed the code was converted to a LS-Dyna input file. ABAQUS
modelling was conducted using the Queensland University of Technology’s super
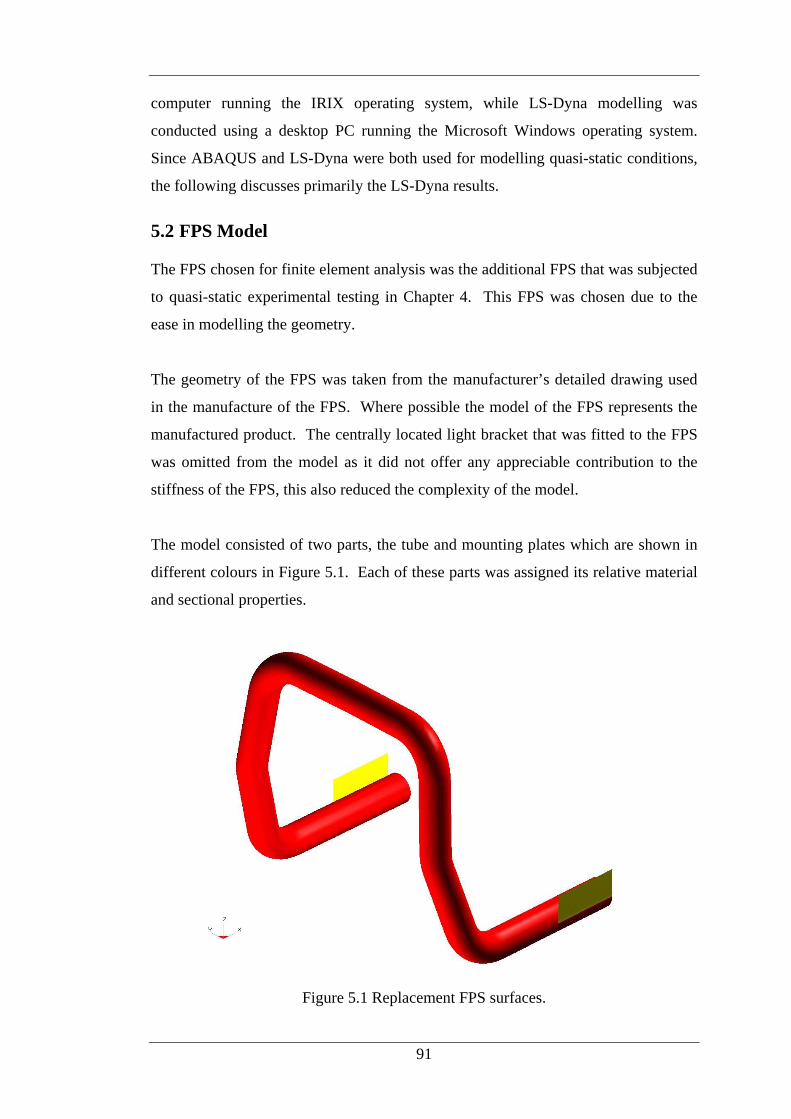
91
computer running the IRIX operating system, while LS-Dyna modelling was
conducted using a desktop PC running the Microsoft Windows operating system.
Since ABAQUS and LS-Dyna were both used for modelling quasi-static conditions,
the following discusses primarily the LS-Dyna results.
5.2 FPS Model
The FPS chosen for finite element analysis was the additional FPS that was subjected
to quasi-static experimental testing in Chapter 4. This FPS was chosen due to the
ease in modelling the geometry.
The geometry of the FPS was taken from the manufacturer’s detailed drawing used
in the manufacture of the FPS. Where possible the model of the FPS represents the
manufactured product. The centrally located light bracket that was fitted to the FPS
was omitted from the model as it did not offer any appreciable contribution to the
stiffness of the FPS, this also reduced the complexity of the model.
The model consisted of two parts, the tube and mounting plates which are shown in
different colours in Figure 5.1. Each of these parts was assigned its relative material
and sectional properties.
Figure 5.1 Replacement FPS surfaces.

92
The FPS was modelled using shell elements. The centre line of the tubular section
was used to extrude the surface around. This surface was then meshed. To cut down
on processing time only half of the FPS was modelled by use of symmetry conditions,
as shown in Figure 5.2.
Figure 5.2 Half of FPS used in modelling.
One important consideration in the development of the model is that the bends in the
tubular section generated in the model were of perfect tubular shape. In the
manufactured FPS, due to the manufacturing process, the bends in the FPS exhibit a
flattening in the bends. This would result in an expected reduction in the stiffness of
this section, and residual stresses.
5.2.1 Elements
The Hughes-Liu element type was chosen for all shell elements in the model. This
element is a four node element that is very computationally efficient. The tubular
section and the mounting plate were given a shell thickness of 5 mm. Figure 5.3
shows the FPS after it had been meshed.

93
Figure 5.3 Replacement FPS elements.
Since the FPS consisted of two separate parts, the tubular section and the flat
mounting plate, the mesh density for each part was made the same. This allowed for
the nodes along the edge of the mounting plate to be merged with the nodes along the
tube, thus creating a join between the mounting plate and the tubular section to
represent the weld of the manufactured FPS.
5.2.2 Material
Since a non-linear solver was used to analyse the models, an elasto-plastic material
property was assigned to both parts of the FPS. The LS-Dyna material type
MAT_PIECEWISE_LINEAR_PLASTICITY was used, which is an elasto-plastic
material with an arbitrary stress versus strain curve.
Both parts of the FPS were manufactured from aluminium. The material properties
used for the parts were as follows;
ρ = 2700 kg/m3
E = 69 GPa
ν = 0.33
The stress versus strain data input into the model can be seen in Figure 5.4. These
material properties were gathered from tensile material testing, and the data provided

94
by the material manufacturer. It can be seen that the stress strain diagram is a typical
elasto-plastic curve depicting the strain beyond first yield.
0
20
40
60
80
100
120
140
160
180
200
0 0.005 0.01 0.015 0.02 0.025 0.03 0.035 0.04 0.045
Strain
Str
ess
(Mp
a)
Figure 5.4 Material property used for FPS finite element model.
5.2.3 Boundary Conditions
Boundary conditions were placed at the two bolt locations on the mount of the FPS.
While symmetry conditions were applied at the top of the FPS where the model had
been divided.
During the analysis of this model both pinned, allowing for rotation about the bolt,
and fixed boundary conditions were used. Both the pinned, and fixed, boundary
conditions produced the same deflected result, although the stress exhibited in the
mount differed between the conditions. The similar deflected result was due to the
pinned conditions simulating a fixed condition, due to the small distance between the
two bolt locations in relation to the moment distance of the applied load. By
comparing the stress in the mounting plate to the experimental testing results, the
pinned boundary condition was chosen due to the similarity of the resulting stress.

95
5.2.4 Output Requests
Four different forms of output were requested from the finite element models. All
results were read and graphed using the program eta PostGL and eta Graph.
DATABASE_BINARY_D3PLOT was requested so that the results of the model
could be viewed using the post-processor eta PostGL.
DATABASE_GLSTAT was requested to obtain the global data during the analyses.
In particular the kinetic energy of the pendulum, and the total energy of the model
during the analysis.
DATABASE_NODOUT was requested to track the displacement of particular nodes
during the analyses. For static and pulse loading, the displacement of the node where
the load had been applied was recorded. For the pendulum impact models, a node
selected on the pendulum was used to record the displacement, velocity and
acceleration of the pendulum. For all models a node on the top of the FPS was
selected to measure the deflection of the FPS to judge when the vehicle clearance
had been reached.
DATABASE_SPCFORC was requested to record the reaction forces on the supports
of the FPS during the analysis.
5.3 Quasi-Static Analysis
A Quasi-Static analysis was undertaken using ABAQUS and the limited implicit
abilities of LS-Dyna. The quasi-static model was compared with experimental
testing results to calibrate the model.
5.3.1 Loading
Loading was applied to the model as a point load. Since the FPS rotates during
loading, the point for loading was chosen just below the initial contact point. The
loading was defined in LS-Dyna using LOAD_NODE_POINT command. The load
was defined as a curve using the DEFINE _CURVE command, shown in Figure 5.5.
The magnitude of the applied load was similar to the loading applied during
experimental testing.

96
0
5
10
15
20
25
0 5 10 15 20 25 30 35
Time (sec)
Lo
ad (k
N)
Figure 5.5 Load curve for FPS finite element model.
5.3.2 Model Calibration
An implicit analysis of the finite element model was run using LS-Dyna. The results
from this model were compared with those of the experimental test reported in
Chapter 4.
Figure 5.6 shows a comparison of the load deflection results for both the
experimental and finite element results. As shown the load-deflection of the FEA is
very similar to that which was recorded during experimental testing.
Stress values were also compared with those obtained in Chapter 4. Figure 5.7 and
Figure 5.8 show the von Mises stress during the elastic range, for both the
experimental and FEA results at two different locations on the FPS. The figures
show a good correlation between the results, while the small differences can be
attributed to the residual stress that occurs during the manufacturing process of the
FPS. The good correlation between results for both load–deflection and von Mises
stress ensured the satisfactory calibration of the finite element model. Comparisons
between other stresses, such as principal stresses, were not considered as the
calibration was adequate.

97
The weight of the FPS was also correlated between that of the FEA model and the
FPS experimentally tested. The weight of the FEA model was approximately 8 kg,
the same as that measured during the experimental testing.
0
2
4
6
8
10
12
14
16
18
20
0 10 20 30 40 50 60
Deflection (mm)
Lo
ad (
kN)
Experimental FEM
Figure 5.6 Load-deflection comparison of experimental and FEA results.
0
20
40
60
80
100
120
140
160
180
0 10 20 30 40 50 60
Deflection (mm)
Vo
n M
ises
Str
ess
(MP
a)
Experimental FEM
Figure 5.7 von Mises stress comparison of experimental and FEA results at gauge E.

98
0
20
40
60
80
100
120
140
160
180
0 5 10 15 20 25 30 35
Deflection (mm)
Vo
n M
ises
Str
ess
(MP
a)
Experimental FEM
Figure 5.8 von Mises stress comparison of experimental and FEA results at gauge F.
Once the finite element model was developed and calibrated, the next step was to
analyse the model under varying dynamic conditions. Two different testing schemes
were conducted. The first scheme was to simulate the dynamic pendulum
experimental testing, as described in Chapter 3. The second scheme was to study the
transient response of FPS by applying impact loads in the form of pulses. This was
done to study the effects of impact duration and parameters of the impacting surface.
All dynamic models were run using LS-Dyna explicit solver.
5.4 Pendulum Impact Simulation
This loading scheme was used to simulate the conditions that were present during
experimental dynamic pendulum testing. In these analyses, the weight and velocity,
of the pendulum were varied to gain an understanding of the differences that these
two variables have on the dynamic performance of the FPS.
Using the calibrated finite element model, a pendulum impact was added to the FPS
model. The results that were analysed were the deceleration, change in velocity,
load-deflection and energy absorbed by the FPS.

99
5.4.1 The Pendulum
The pendulum was modelled using Hughes-Liu shell elements and given steel
material properties using the LS-Dyna material type 20 MAT_RIGID. A rigid
material property was chosen to represent the pendulum to reduce computation time,
since stress values in the pendulum were not sought. The pendulum was restricted
from moving in all directions, except the direction of the initial velocity.
The mass of the pendulum was varied between 1000, 1500 and 2000 kg. These
weights were chosen to represent possible pendulum, or vehicle weights. This was
done by changing the thickness of the pendulum between 200 and 400mm. The
density of the pendulum remained constant throughout the analyses.
The pendulum was given varying initial velocities during the analyses. The velocity
of the pendulum was varied between 5, 10, 15, 20 and 25 km/h. These velocities
were chosen as this range represents velocities at which vehicle air bags should not
deploy, may deploy and should deploy.
5.4.2 Contact
The contact between the pendulum and the FPS during the impact was modelled
using the LS-Dyna contact type AUTOMATIC_NODES_TO_SURFACE. For the
analysis, the pendulum was set as the master surface, while the FPS was assigned as
slave nodes. The static and dynamic coefficient of friction was set to 0.1; all other
variables were left to the default values. Self contact for the FPS was not required
since no part of the FPS would come in contact with itself before deflecting a
sufficient distance to have hit the front of the vehicle.
5.4.3 Results
The following is a discussion of the results from the load case of a 2000 kg
pendulum at a velocity of 15 km/h. A summary comparing the results for all load
cases will follow. All results are interpreted for the full FPS.
Figure 5.9 shows the model before the pendulum had made contact with the FPS.
The different colours of the model show the three different parts that make up the
model; the pendulum, FPS tubular section and mounting plate.

100
Figure 5.9 FPS model before pendulum impact.
Figure 5.10 shows the deflected shape of the FPS after the pendulum has impacted
the FPS. The deflected shape shown is the deflected FPS when it would have
contacted the front of the vehicle at the measured clearance distance of 70 mm. Thus
only the results during the first 70 mm of the travel will be discussed.
Figure 5.10 FPS model after pendulum impact.
The figure also shows the maximum von Mises stress of the FPS. The maximum
stress occurs at the two mounting points on the mounting plates, due to the stress
concentrations imparted by the boundary conditions, and also at the knee section of
the tube, similar to that which occurred during the quasi-static analysis and
experimental testing.

101
The first result for discussion is the deceleration that was experienced by the
pendulum during the impact. Figure 5.11 shows the results of the global deceleration
that the pendulum is subjected to during the impact. Since the pendulum was
modelled as a rigid surface the deceleration experienced by the pendulum is the same
for each individual node.
0
0.5
1
1.5
2
2.5
3
0 2 4 6 8 10 12
Time (ms)
Dec
eler
atio
n (g
)
Figure 5.11 Deceleration of pendulum during impact.
The plot shows that there are two peaks during the impact, which represent the two
higher stressed areas of the FPS. The first peak is representative of the initial peak
stress which occurs at the knee of the FPS, having a peak of 2.6g after 1.5 ms. Once
the knee section of the FPS had yielded, the peak stress then occurred at the
mounting plates of the FPS, the cause of the second peak of 2g after 7.5 ms. The
FPS had come into contact with the vehicle after approximately 9.5 ms.
Figure 5.12 shows the velocity of the pendulum during the impact. The velocity of
the pendulum before the impact was 15 km/h. The pendulum velocity had been
reduced to 14.62 km/h, a change of 0.38 km/h, by the time the FPS clearance
deflection had been reached.
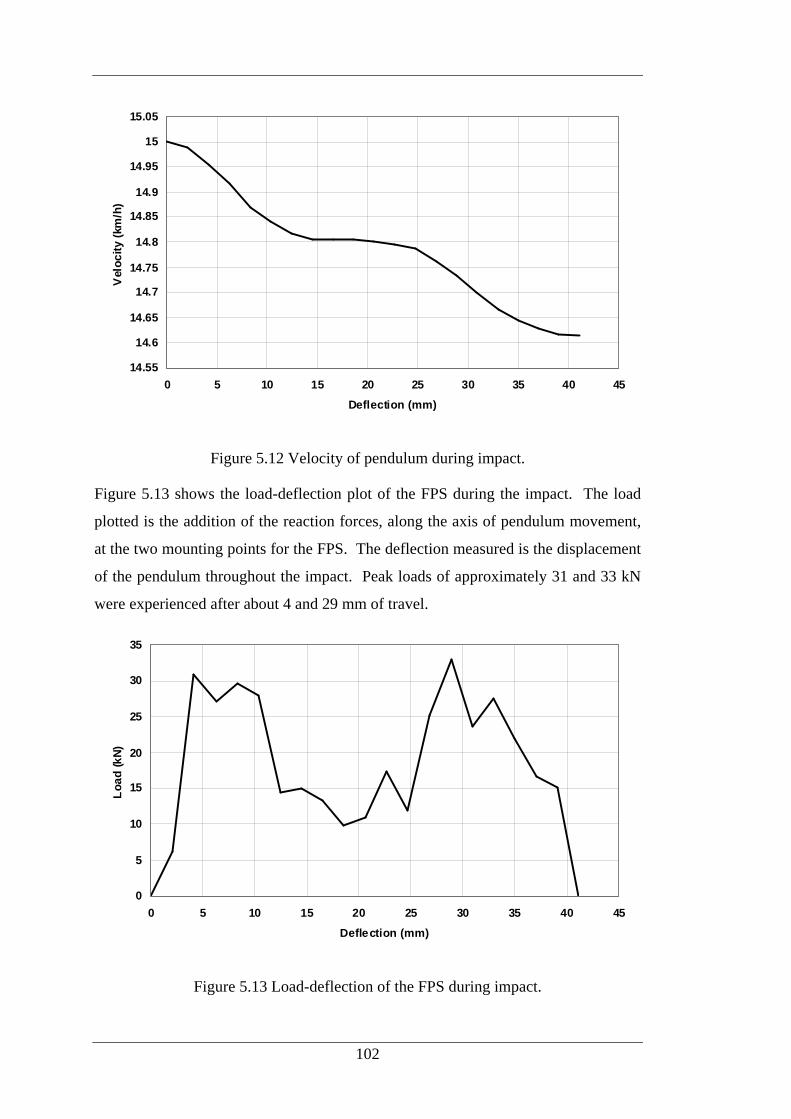
102
14.55
14.6
14.65
14.7
14.75
14.8
14.85
14.9
14.95
15
15.05
0 5 10 15 20 25 30 35 40 45
Deflection (mm)
Vel
ocity
(km
/h)
Figure 5.12 Velocity of pendulum during impact.
Figure 5.13 shows the load-deflection plot of the FPS during the impact. The load
plotted is the addition of the reaction forces, along the axis of pendulum movement,
at the two mounting points for the FPS. The deflection measured is the displacement
of the pendulum throughout the impact. Peak loads of approximately 31 and 33 kN
were experienced after about 4 and 29 mm of travel.
0
5
10
15
20
25
30
35
0 5 10 15 20 25 30 35 40 45
Deflection (mm)
Loa
d (k
N)
Figure 5.13 Load-deflection of the FPS during impact.
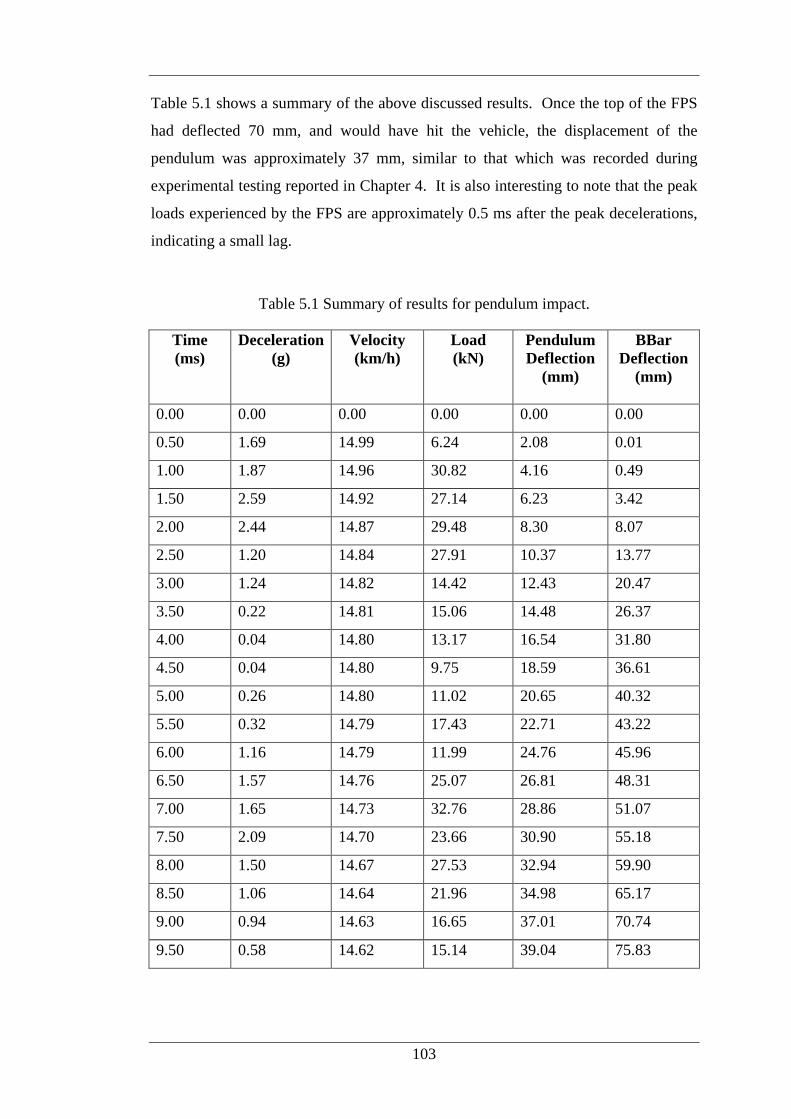
103
Table 5.1 shows a summary of the above discussed results. Once the top of the FPS
had deflected 70 mm, and would have hit the vehicle, the displacement of the
pendulum was approximately 37 mm, similar to that which was recorded during
experimental testing reported in Chapter 4. It is also interesting to note that the peak
loads experienced by the FPS are approximately 0.5 ms after the peak decelerations,
indicating a small lag.
Table 5.1 Summary of results for pendulum impact.
Time (ms)
Deceleration (g)
Velocity (km/h)
Load (kN)
Pendulum Deflection
(mm)
BBar Deflection
(mm)
0.00 0.00 0.00 0.00 0.00 0.00
0.50 1.69 14.99 6.24 2.08 0.01
1.00 1.87 14.96 30.82 4.16 0.49
1.50 2.59 14.92 27.14 6.23 3.42
2.00 2.44 14.87 29.48 8.30 8.07
2.50 1.20 14.84 27.91 10.37 13.77
3.00 1.24 14.82 14.42 12.43 20.47
3.50 0.22 14.81 15.06 14.48 26.37
4.00 0.04 14.80 13.17 16.54 31.80
4.50 0.04 14.80 9.75 18.59 36.61
5.00 0.26 14.80 11.02 20.65 40.32
5.50 0.32 14.79 17.43 22.71 43.22
6.00 1.16 14.79 11.99 24.76 45.96
6.50 1.57 14.76 25.07 26.81 48.31
7.00 1.65 14.73 32.76 28.86 51.07
7.50 2.09 14.70 23.66 30.90 55.18
8.00 1.50 14.67 27.53 32.94 59.90
8.50 1.06 14.64 21.96 34.98 65.17
9.00 0.94 14.63 16.65 37.01 70.74
9.50 0.58 14.62 15.14 39.04 75.83

104
The energy absorbed by the FPS was calculated by the area under the load-deflection
plot in Figure 5.13. In this particular case the energy absorbed was 756 J up to the
FPS contacting the vehicle. Energy lost during the analysis due to friction was
approximately 72 J, while the total energy in the system was reduced by 16 J.
5.4.4 Result Summary
The following is a summary of the results of the FEA undertaken using the various
pendulum velocities and masses discussed.
5.4.4.1 Deceleration
The decelerations generated by the impact of the pendulum with the FPS are
presented in the following figures. This deceleration is the global deceleration of the
rigid body. Although this will not be the same as the deceleration experienced by the
vehicle, is does relate to the change in velocity that the pendulum experiences during
the impact.
0
0.5
1
1.5
2
2.5
3
0 5 10 15 20 25 30 35 40
Time (ms)
Dec
eler
atio
n (g
)
1000 kg 1500 kg 2000 kg
Figure 5.14 Deceleration of pendulum during a 5 km/h impact.

105
0
0.5
1
1.5
2
2.5
3
3.5
4
0 2 4 6 8 10 12 14 16
Time (ms)
Dec
eler
atio
n (g
)
1000 kg 1500 kg 2000 kg
Figure 5.15 Deceleration of pendulum during a 10 km/h impact.
0
1
2
3
4
5
6
0 2 4 6 8 10 12
Time (ms)
Dec
eler
atio
n (g
)
1000 kg 1500 kg 2000 kg
Figure 5.16 Deceleration of pendulum during a 15 km/h impact.

106
0
1
2
3
4
5
6
7
0 1 2 3 4 5 6 7 8 9
Time (ms)
Dec
eler
atio
n (g
)
1000 kg 1500 kg 2000 kg
Figure 5.17 Deceleration of pendulum during a 20 km/h impact.
0
1
2
3
4
5
6
7
8
0 1 2 3 4 5 6 7
Time (ms)
Dec
eler
atio
n (g
)
1000 kg 1500 kg 2000 kg
Figure 5.18 Deceleration of pendulum during a 25 km/h impact.
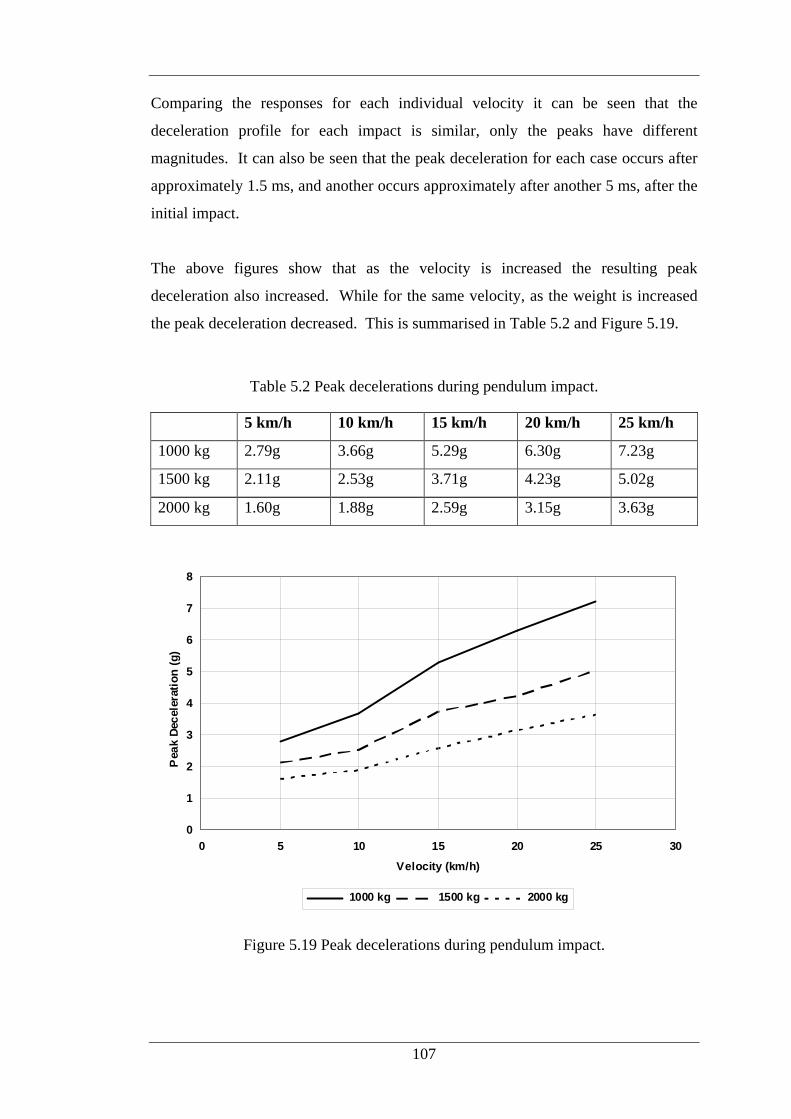
107
Comparing the responses for each individual velocity it can be seen that the
deceleration profile for each impact is similar, only the peaks have different
magnitudes. It can also be seen that the peak deceleration for each case occurs after
approximately 1.5 ms, and another occurs approximately after another 5 ms, after the
initial impact.
The above figures show that as the velocity is increased the resulting peak
deceleration also increased. While for the same velocity, as the weight is increased
the peak deceleration decreased. This is summarised in Table 5.2 and Figure 5.19.
Table 5.2 Peak decelerations during pendulum impact.
5 km/h 10 km/h 15 km/h 20 km/h 25 km/h
1000 kg 2.79g 3.66g 5.29g 6.30g 7.23g
1500 kg 2.11g 2.53g 3.71g 4.23g 5.02g
2000 kg 1.60g 1.88g 2.59g 3.15g 3.63g
0
1
2
3
4
5
6
7
8
0 5 10 15 20 25 30
Velocity (km/h)
Pea
k D
ecel
erat
ion
(g)
1000 kg 1500 kg 2000 kg
Figure 5.19 Peak decelerations during pendulum impact.

108
5.4.4.2 Velocity
The velocity of the pendulum during the impact is presented in the following figures.
This velocity is the global velocity of the rigid body.
0
1
2
3
4
5
6
0 5 10 15 20 25 30 35 40 45
Deflection (mm)
Vel
ocity
(km
/h)
1000 kg 1500 kg 2000 kg
Figure 5.20 Velocity of pendulum during 5 km/h impact.
9
9.2
9.4
9.6
9.8
10
10.2
0 5 10 15 20 25 30 35 40 45
Deflection (mm)
Vel
ocity
(km
/h)
1000 kg 1500 kg 2000 kg
Figure 5.21 Velocity of pendulum during 10 km/h impact.

109
14.1
14.2
14.3
14.4
14.5
14.6
14.7
14.8
14.9
15
15.1
0 5 10 15 20 25 30 35 40 45 50
Deflection (mm)
Vel
ocity
(km
/h)
1000 kg 1500 kg 2000 kg
Figure 5.22 Velocity of pendulum during 15 km/h impact.
19.1
19.2
19.3
19.4
19.5
19.6
19.7
19.8
19.9
20
20.1
0 5 10 15 20 25 30 35 40 45 50
Deflection (mm)
Vel
ocity
(km
/h)
1000 kg 1500 kg 2000 kg
Figure 5.23 Velocity of pendulum during 20 km/h impact.

110
24.2
24.3
24.4
24.5
24.6
24.7
24.8
24.9
25
25.1
0 5 10 15 20 25 30 35 40 45 50
Deflection (mm)
Vel
ocity
(km
/h)
1000 kg 1500 kg 2000 kg
Figure 5.24 Velocity of pendulum during 25 km/h impact.
As with the deceleration results, the profiles of the velocity for each load case are
similar. As would be expected the velocity change of the pendulum is greater for the
lightest mass and the lowest velocity.
0
0.5
1
1.5
2
2.5
0 5 10 15 20 25 30
Velocity (km/h)
Cha
nge
in V
elo
city
(km
/h)
1000 kg 1500 kg 2000 kg
Figure 5.25 Change in pendulum velocity after impact.

111
When the velocity, or mass, of the pendulum was increased, the effect that the FPS
has on the velocity of the pendulum diminished. This is shown in Table 5.3 and
Figure 5.25, which show the resultant change in velocity of the pendulum after the
FPS had deflected sufficiently to have hit the vehicle.
Table 5.3 Change in pendulum velocity after impact.
5 km/h 10 km/h 15 km/h 20 km/h 25 km/h
1000 kg 1.92 km/h 0.90 km/h 0.76 km/h 0.72 km/h 0.63 km/h
1500 kg 1.20 km/h 0.60 km/h 0.51 km/h 0.49 km/h 0.41 km/h
2000 kg 0.88 km/h 0.45 km/h 0.38 km/h 0.36 km/h 0.31 km/h
5.4.4.3 Load-Deflection
The following figures show the load-deflection results for each load case. As
previously stated the deflection recorded was that of the pendulum displacement,
while the load is the sum of the reaction forces at the FPS boundary conditions
applied to the FPS mount.
It is evident in the figures that for each individual velocity, the load-deflection for
each pendulum mass is similar. This shows that the mass of the pendulum does not
have an effect on the energy absorption capability of the FPS.
0
5
10
15
20
25
30
0 5 10 15 20 25 30 35 40 45
Deflection (mm)
Loa
d (k
N)
1000 kg 1500 kg 2000 kg
Figure 5.26 Load-deflection results for 5 km/h pendulum impact.

112
0
5
10
15
20
25
30
0 5 10 15 20 25 30 35 40 45
Deflection (mm)
Loa
d (k
N)
1000 kg 1500 kg 2000 kg
Figure 5.27 Load-deflection results for 10 km/h pendulum impact.
0
5
10
15
20
25
30
35
0 5 10 15 20 25 30 35 40 45
Deflection (mm)
Loa
d (k
N)
1000 kg 1500 kg 2000 kg
Figure 5.28 Load-deflection results for 15 km/h pendulum impact.

113
0
5
10
15
20
25
30
35
40
45
0 5 10 15 20 25 30 35 40 45 50
Deflection (mm)
Loa
d (k
N)
1000 kg 1500 kg 2000 kg
Figure 5.29 Load- deflection results for 20 km/h pendulum impact.
0
10
20
30
40
50
60
0 5 10 15 20 25 30 35 40 45 50
Deflection (mm)
Loa
d (k
N)
1000 kg 1500 kg 2000 kg
Figure 5.30 Load- deflection results for 25 km/h pendulum impact.

114
5.4.4.4 Energy Absorbed
Since the load-deflection results for different pendulum masses are similar for each
impacting velocity, the calculated energy absorbed by the FPS is the same. Table 5.4
summarises the energy absorbed by the FPS during the various impacts.
Table 5.4 Energy absorbed by the FPS during the impact.
5 km/h 10 km/h 15 km/h 20 km/h 25 km/h
1000 kg 590 J 625 J 742 J 889 J 921 J
1500 kg 598 J 623 J 740 J 900 J 905 J
2000 kg 597 J 629 J 756 J 889 J 920 J
Comparing the energy absorbed by the FPS during the impacts, and that which was
absorbed by the FPS during quasi-static testing (469 J), it is evident that the dynamic
energy absorption by the FPS is higher than the static energy absorbed. Using the
static energy absorbed as the equivalent of a 0 km/h impact, the dynamic
amplification of energy absorption of the FPS was calculated for each velocity.
These results are shown in Figure 5.31.
y = 0.0395x + 1.0138R2 = 0.9693
0
0.5
1
1.5
2
2.5
0 5 10 15 20 25 30
Velocity (km/h)
Dyn
amic
Am
plifi
catio
n
Figure 5.31 Dynamic amplification of energy absorbed by FPS.
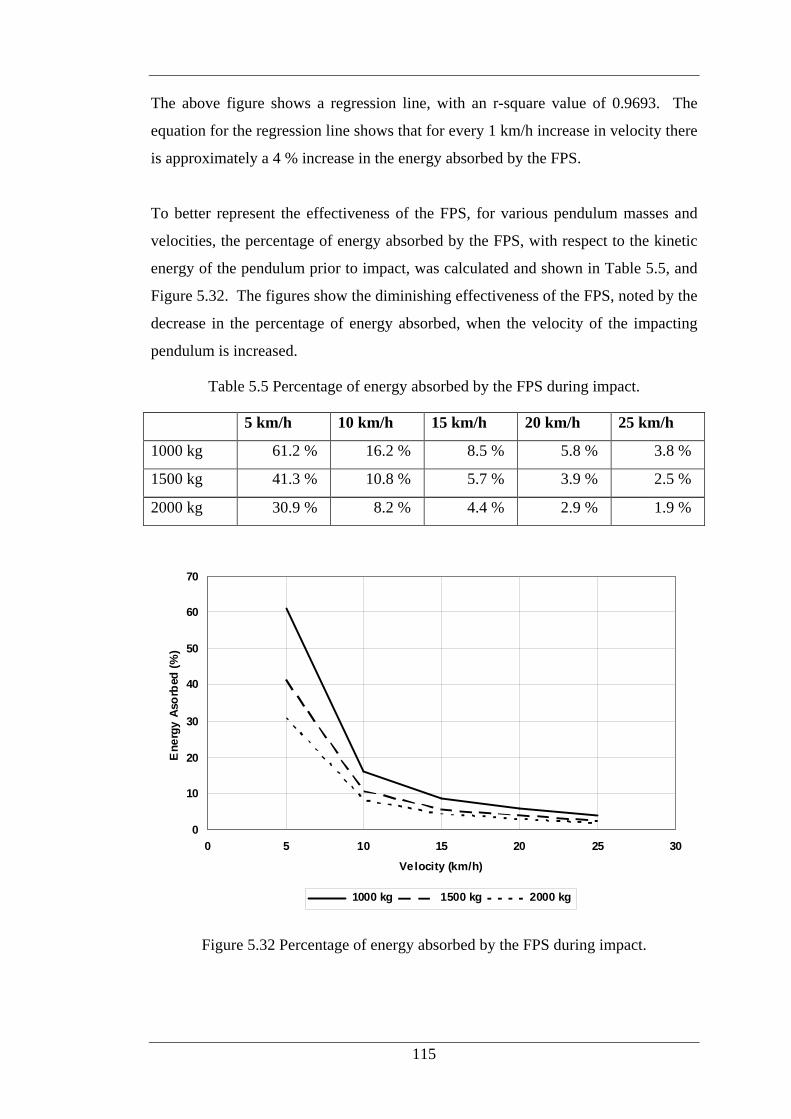
115
The above figure shows a regression line, with an r-square value of 0.9693. The
equation for the regression line shows that for every 1 km/h increase in velocity there
is approximately a 4 % increase in the energy absorbed by the FPS.
To better represent the effectiveness of the FPS, for various pendulum masses and
velocities, the percentage of energy absorbed by the FPS, with respect to the kinetic
energy of the pendulum prior to impact, was calculated and shown in Table 5.5, and
Figure 5.32. The figures show the diminishing effectiveness of the FPS, noted by the
decrease in the percentage of energy absorbed, when the velocity of the impacting
pendulum is increased.
Table 5.5 Percentage of energy absorbed by the FPS during impact.
5 km/h 10 km/h 15 km/h 20 km/h 25 km/h
1000 kg 61.2 % 16.2 % 8.5 % 5.8 % 3.8 %
1500 kg 41.3 % 10.8 % 5.7 % 3.9 % 2.5 %
2000 kg 30.9 % 8.2 % 4.4 % 2.9 % 1.9 %
0
10
20
30
40
50
60
70
0 5 10 15 20 25 30
Velocity (km/h)
Ene
rgy
Aso
rbed
(%
)
1000 kg 1500 kg 2000 kg
Figure 5.32 Percentage of energy absorbed by the FPS during impact.

116
5.5 Summary
This chapter details the development, and analysis, of a finite element model for the
additional FPS tested in Chapter 4. The finite element model was calibrated using the
experimental quasi-static results, and then used to simulate the dynamic impact
conditions of the experimental pendulum tests conducted in Chapter 3. These
dynamic impact conditions were applied to the model to gauge the effects of
pendulum mass and velocity on the response of the FPS.
The results from the pendulum impact analyses showed that as the velocity of the
pendulum was increased, so was the deceleration experienced by the pendulum and
the energy absorbed by the FPS, while the change in velocity of the pendulum
decreased. The pendulum impact simulation also showed that the mass of the
pendulum has no effect on the energy absorbed by the FPS for a similar velocity, but
the deceleration and velocity change of the pendulum increase with the increase in
mass.
The above results can be used to assess the significance of the pendulum parameters
during experimental testing. From the results it was shown that the mass of the
pendulum has an effect on velocity change of the pendulum, while having no effect
on the energy absorbed by the FPS. Thus if the energy absorbed by the FPS, or the
deceleration of the pendulum is required, the mass of the pendulum is not important
since the energy absorbed remains the same and deceleration can simply be scaled
with the mass of the pendulum and vehicle. While if the results required are the
velocity change of the pendulum, the chosen mass and velocity of the pendulum will
be important.
This chapter has also demonstrated that the finite element technique is an economical
and efficient means of studying the behaviour of FPS. The economy is evident when
comparing the potential cost of the numerous pendulum parameters modelled in this
chapter, to that of the cost of obtaining the same results from experimental testing.

117
Chapter 6 Transient Impact (Pulse) Loading
Chapter 5 used a simulated finite element pendulum model to study the effects that
pendulum mass and velocity have on the dynamic response of a FPS. The results
showed that as the velocity of the pendulum was increased, so was the energy
absorbed by the FPS. While for a pendulum with a similar velocity, the mass of the
pendulum made no difference to the energy absorbed.
To further enhance the understanding of the impact response of FPS, a more detailed
impact analysis was carried out to study the effects of mass, velocity and impact time
duration on the energy absorbed by the FPS. This was done by using the calibrated
FPS model, developed in Chapter 5, and applying transient pulse loads to the FPS.
6.1 Transient Pulses
In the testing of air bag sensors selected types of pulses are used to simulate varying
types of impacts. Moreover, impact tests carried out have indicated that the loading
is “pulse” type. The shapes of these loading curves can be haversine, half-sine,
triangular or square. The haversine and half-sine pulses of the same duration are
shown in Figure 6.1. While the square and triangular pulses are shown in Figure 6.2.
Half-sine Haversine
Figure 6.1 Half-sine and haversine pulses.

118
Square Triangular
Figure 6.2 Square and triangular pulses.
The testing is an iterative procedure that uses artificially generated pulses with
various durations and magnitudes. From the results of this testing a suitable response
curve can be developed.
The two most commonly used pulse shapes are the haversine and the half-sine. The
half-sine curve can be represented in the following equation in terms of acceleration
(A) and time (t);
∆=T
t
T
VtA
.sin
2)(
ππ
where T is the pulse duration and 0 ≤ t ≤ T, and the change in velocity (∆V) can be
calculated by the area under the curve.
Multiplying this equation by mass (m) will change the equation into a function of
force;
∆=T
t
T
VmtF
.sin
2)(
ππ
where the area under the curve is the change in momentum (m∆V).
This equation can be used to study the effects of mass, as well as velocity and pulse
duration on the impact response. This equation was used to represent a force versus
time pulse to be applied to the finite element model of the FPS.

119
6.1.1 Pulse Variables
The length of the pulse’s time duration varies depending on the mass and the
properties of the impacting object. This can be illustrated by considering a simple
mass-spring-damper system shown in Figure 6.3, where the mass (m) can represent
that of a vehicle, an impacting object or a FPS with crush characteristic functions
represented by the damping coefficient (c) and spring constant (k).
Figure 6.3 Mass-Spring-Damper system.
The equation of motion for this system is represented by the following second-order
differential equation;
0)()()( =++ tkxtxctxm &&&
with the initial conditions at t = 0, of the mass moving with a velocity of 0v and the
spring and damper about to be compressed during the impact;
0)0( vx = , 0)0( =x
Since the impact of the vehicle would represent an underdamped system, the solution
to the above equation would be;
tBetAetx tt ββ αα sincos)( −− +=
where;
m
c
2=α ,
m
kmc
2
42 −=β
Damper
Spring
Mass

120
and α and β are constants to be determined from the initial conditions. Using the
initial conditions, the above equation takes the form:
tev
tx t ββ
α sin)( 0 −=
When the mass reaches a maximum displacement at t = t1;
βα=1tant
or t1 is a function of m, c and k.
),,(1 kcmft =
Thus the impact duration is a function of the vehicle’s mass, damping coefficient and
spring constant. It can also be noted that the time duration is not a function of the
impact velocity, although the dynamic properties of c and k will depend on the rate
of deformation. Thus since the mass of a vehicle will not change during an impact,
the impact duration will remain constant if the ratio between c and k is also constant.
By using the above equations the effects of different impacting surfaces can be
studied. For a rigid barrier, with a stiff spring constant, the impact duration would be
short. While for a deformable barrier, with a soft spring constant, the impact
duration would be longer.
Using the above relationship, the effect of mass and the impact surface properties can
be studied by applying pulse loads to a FPS. As discussed in Chapter 2, frontal
vehicle collisions normally have a time duration between 100 and 120 ms (Chan
2000), independent of the velocity at which the vehicle is travelling.
6.1.2 FPS Model
Modelling was conducted using the same FPS model used in the previous chapter.
The pulse loads were distributed between three nodes on the FPS. The first node was
the same node at which the quasi-static load was applied, while the other two nodes
were on either side of this node. This was done to reduce the effects of localized
yielding in the model. All modelling was conducted using LS-Dyna.

121
6.2 The Effect of Impact Surface Properties
As detailed above, the mass and impact properties determine the time duration of the
pulse. While the mass, time duration and velocity determine the magnitude of the
pulse. By using a constant mass it is possible to study the effects of the impacting
surface for various velocities, by varying the pulse duration.
The mass chosen for the analyses was 2557 kg, the mass of a Toyota Landcruiser.
The velocities used were 5, 10 and 15 km/h. Velocities higher than these were not
used since the FPS offers little protection above these velocities, as shown in Chapter
5. Impact durations of 100, 110 and 120 ms were chosen.
Using the above variables, nine different pulses were generated, three for each
impact duration. Figure 6.4 shows the pulses for a duration of 100 ms, while Figure
6.5 and Figure 6.6 show the pulses for 110 and 120 ms durations respectively. As
expected as the pulse duration is increased the peak value of the pulse also increased,
which can be seen in the figures. These pulse loads were applied to the FPS model
as discussed above.
0 10 20 30 40 50 60 70 80 90 100
5
150
20
40
60
80
100
120
140
160
180
Load (kN)
Time (ms)
Velocity (km/h)
5 10 15
Figure 6.4 Pulse loads for 100 ms impact duration with varying velocity.

122
0 11 22 33 44 55 66 77 88 99 110
5
150
20
40
60
80
100
120
140
160
Load (kN)
Time (ms)
Velocity (km/h)
5 10 15
Figure 6.5 Pulse loads for 110 ms impact duration with varying velocity.
0 12 24 36 48 60 72 84 96 108 120
5
150
20
40
60
80
100
120
140
Load (kN)
Time (ms)
Velocity (km/h)
5 10 15
Figure 6.6 Pulse loads for 120 ms impact duration with varying velocity.

123
6.2.1.1 Results
The following is a discussion of the results from one of the load cases that was
analysed. It is for a pulse with a 110 ms time duration and an impacting velocity of
10 km/h. A summary comparing the results of all the load cases follows.
Figure 6.7 shows the deflected shape, and von Mises stress distribution, experienced
by the FPS during the pulse loading. In this particular case the FPS has deflected a
sufficient distance to have contacted the vehicle. Similar to the other forms of testing,
the peak stress of the FPS occurs in the bend of the tubular section and at the two
supports. High stress can also be seen at the nodes where the load is applied.
Figure 6.7 Stress in FPS due to impulse load.
Figure 6.8 shows the load-deflection results for the FPS during the pulse load. The
load plotted is the addition of the reaction loads at the two boundary conditions of the
FPS, while the deflection is measured at the middle node where the load was applied.
It shows that the FPS reached a peak load of approximately 25 kN, which occured
when the FPS was perfectly plastic. For this particular load case the energy absorbed
by the FPS was approximately 713 J up to when the FPS would have contacted the
vehicle.

124
0
5
10
15
20
25
30
0 5 10 15 20 25 30 35 40 45
Deflection (mm)
Loa
d (k
N)
Figure 6.8 Load-deflection results for FPS during pulse load.
6.2.1.2 Result Summary
A summary of the nine pulse load case results are shown in the following figures.
0
5
10
15
20
25
0 5 10 15 20 25 30 35 40 45
Deflection (mm)
Loa
d (k
N)
100 ms 110 ms 120 ms
Figure 6.9 FPS response to pulse load with a velocity of 5 km/h.

125
0
5
10
15
20
25
30
0 5 10 15 20 25 30 35 40 45 50
Deflection (mm)
Loa
d (k
N)
100 ms 110 ms 120 ms
Figure 6.10 FPS response to pulse load with a velocity of 10 km/h.
0
5
10
15
20
25
30
35
0 5 10 15 20 25 30 35 40 45 50
Deflection (mm)
Loa
d (k
N)
100 ms 110 ms 120 ms
Figure 6.11 FPS response to pulse load with a velocity of 15 km/h.

126
The figures show that as the velocity increased the peak load applied to the FPS
increased, similar to the FEA results in Chapter 5. It also shows that the load is
increased as the time duration of the pulse is decreased.
Comparing these figures with the load-deflection results of the pendulum impact in
Chapter 5 for a similar velocity shows that the magnitudes of the loads are similar.
Although the loading profile for the pulse results are much smoother than that of the
pendulum impact.
Table 6.1 and Figure 6.12 show the energy absorbed by the FPS during the various
pulse loadings. It is evident that the difference between the energy absorbed for the
same velocity, but different time duration, is greater as the velocity is increased.
This could be due to the inertial response of the FPS increasing as the velocity is
increased. It also highlights that the properties of the impacting surface have more
effect as the velocity is increased.
0
200
400
600
800
1000
0 5 10 15 20
Velocity (km/h)
En
erg
y A
bso
rbed
(J)
100 ms 110 ms 120 ms
Figure 6.12 Energy absorbed by FPS during pulse loads.

127
Table 6.1 Energy absorbed during pulse loads.
5 km/h 10 km/h 15 km/h
100 ms 615 J 756 J 892 J
110 ms 596 J 713 J 824 J
120 ms 583 J 676 J 769 J
Table 6.2 and Figure 6.13 show the percentage of energy absorbed by the FPS during
each load case. Here it can be seen that the effectiveness of the FPS decreases as the
velocity of the impact is increased, while for the same impact velocity the
effectiveness of the FPS remains relatively constant, independent of the impact
duration.
Table 6.2 Percentage of energy absorbed during pulse loads.
5 km/h 10 km/h 15 km/h
100 ms 24.94 % 7.66 % 4.02 %
110 ms 24.17 % 7.23 % 3.71 %
120 ms 23.64 % 6.85 % 3.46 %
0
4
8
12
16
20
24
28
0 5 10 15 20
Velocity (km/h)
En
erg
y A
bso
rbed
(%
)
100 ms 110 ms 120 ms
Figure 6.13 Percentage of energy absorbed during pulse loads.

128
6.3 The Effect of Mass
By assuming a constant impacting surface, using a constant time duration, the effects
of the impacting mass can be studied. To study this the time duration for the pulses
were restricted to 110 ms, while the mass and the velocity of the impacting object
were changed. Velocities of 5, 10 and 15 km/h were used, while masses of 1000,
1500 and 2000 kg were selected.
Using the above variables, nine different pulses were generated, three for each
impacting velocity. The different pulses are shown in Figure 6.14 for a 5km/h
impact, and Figure 6.15 and Figure 6.16 for 10 and 15 km/h impacts. The figures
show that as the velocity and mass of the impacting surface is increased the
magnitude of the load also increased. These pulse loads were applied to the FPS
model as discussed previously.
0 11 22 33 44 55 66 77 88 99 110
1000
20000
5
10
15
20
25
30
35
40
Load (kN)
Time (ms)
Mass (kg)
1000 1500 2000
Figure 6.14 Pulse loads for a 5 km/h impact with varying mass.

129
0 11 22 33 44 55 66 77 88 99 110
1000
20000
10
20
30
40
50
60
70
80
Load (kN)
Time (ms)
Mass (kg)
1000 1500 2000
Figure 6.15 Pulse loads for a 10 km/h impact with varying mass.
0 11 22 33 44 55 66 77 88 99 110
1000
20000
20
40
60
80
100
120
Load (kN)
Time (ms)
Mass (kg)
1000 1500 2000
Figure 6.16 Pulse loads for a 15 km/h impact with varying mass.

130
6.3.1.1 Result Summary
A summary of the nine pulse load case results are shown in the following figures,
Figure 6.17, Figure 6.18 and Figure 6.19. As with the previous results of the FPS
response to pulse loads, it is evident that as the velocity, or mass, was increased, the
peak load applied to the FPS also increased.
0
5
10
15
20
25
0 5 10 15 20 25 30 35 40 45
Deflection (mm)
Loa
d (k
N)
1000 kg 1500 kg 2000 kg
Figure 6.17 FPS response to pulse loads with varying mass at a velocity of 5 km/h.
0
5
10
15
20
25
0 5 10 15 20 25 30 35 40 45
Deflection (mm)
Loa
d (k
N)
1000 kg 1500 kg 2000 kg
Figure 6.18 FPS response to pulse loads with varying mass at a velocity of 10 km/h.

131
0
5
10
15
20
25
30
0 5 10 15 20 25 30 35 40 45
Deflection (mm)
Loa
d (k
N)
1000 kg 1500 kg 2000 kg
Figure 6.19 FPS response to pulse loads with varying mass at a velocity of 15 km/h.
Calculations for the energy absorbed by the varying pulse loads are shown in Table
6.3, and graphed in Figure 6.20. For an impact velocity of 5 km/h, the energy
absorbed by the FPS does not greatly differ between the different masses. While as
the velocity is increased, the greater masses show a wider variance.
0
100
200
300
400
500
600
700
800
0 5 10 15 20
Velocity (km/h)
En
erg
y A
bso
rbed
(J)
1000 kg 1500 kg 2000 kg
Figure 6.20 Energy absorbed by FPS during pulse loads.

132
Table 6.3 Energy absorbed during pulse loads.
5 km/h 10 km/h 15 km/h
1000 kg 535 J 577 J 614 J
1500 kg 577 J 614 J 683 J
2000 kg 577 J 661 J 751 J
By calculating the percentage of energy absorbed by the FPS during the different
load pulses, the effectiveness of the FPS can be evaluated. These results are shown
in Table 6.4 and Figure 6.21. Here it is shown that the effectiveness of the FPS
decreased as the velocity and mass of the impact was increased, similar to the
previous results.
Table 6.4 Percentage of energy absorbed during pulse loads.
5 km/h 10 km/h 15 km/h
1000 kg 55.47 % 14.96 % 7.07 %
1500 kg 39.88 % 10.61 % 5.25 %
2000 kg 29.91 % 8.57 % 4.33 %
0
10
20
30
40
50
60
0 5 10 15 20
Velocity (km/h)
En
erg
y A
bso
rbed
(%
)
1000 kg 1500 kg 2000 kg
Figure 6.21 Percentage of energy absorbed by FPS during pulse loads.

133
6.4 Summary
This chapter presented further dynamic analysis of FPS using finite element
techniques. Using the previous calibrated model, transient pulse loads were applied
to the FPS. The pulse loads were used to study the effects of mass, velocity and
impact time duration.
By using a constant mass, it was possible to study the effect of the impacting surface,
by varying the pulse time duration, and velocity. The analyses showed, that for the
same velocity, increasing the pulse time duration would decrease the amount of
energy absorbed by the FPS. Increasing the velocity for the same pulse duration
however, increased the energy absorbed by the FPS, as observed in the pendulum
analysis
By using a constant pulse time duration, it was possible to further study the effects of
mass and velocity. As observed earlier, by increasing the velocity the amount of
energy absorbed by the FPS also increased. The analysis also showed that for the
same velocity, the energy absorbed by the FPS increased as the mass was increased.
By studying the percentage of energy absorbed by the FPS, for the two transient
pulse load cases, it is evident that velocity has a greater effect than mass on the
energy absorbed by the FPS. This is expected since in the calculation of kinetic
energy the velocity is squared, unlike mass. Also, the duration of the impact has
little effect on the performance of the FPS.
As with the previous chapter, this chapter has further shown that the use of finite
element modelling is both an economical and efficient means of testing and
evaluating FPS, especially when studying the effects of various impact parameters.


135
Chapter 7 FPS Testing Guidelines
In the previous chapters the experimental testing and finite element analysis of FPS
were presented and the findings discussed. This chapter discusses the possible
effects that a FPS can have on a vehicle and vice-versa. The experimental and finite
element results are used in the development of guidelines for assessing the
compatibility of a FPS for a vehicle fitted with air bags. Factors influencing the
design and testing of the FPS are also discussed.
7.1 Possible effects a FPS can have on air bag triggering
The effect that the FPS has on the vehicle’s air bag triggering is determined by the
characteristics of the FPS, in particular the stiffness and strength, and how these
attributes compare with the vehicle’s components that are replaced by the FPS.
These two influencing characteristics determine how a FPS absorbs energy during an
impact, and also the time taken for a FPS to fail. The strength of a FPS ultimately
defines the amount of energy absorbed, while the stiffness affects the rate at which
the energy is absorbed.
Additionally the type of FPS fitted is a determining factor, such that an additional
FPS will always increase the stiffness and strength of a vehicle during the initial
stages of an impact, while a replacement FPS can decrease or increase the stiffness
and strength of the vehicle.
Following are examples on how these attributes of stiffness and strength can affect a
vehicle’s air bag system. The following situations are mainly concerned with frontal
impacts, but can equally be applied to different impact types. They also assume that
the air bag sensor(s) use velocity change as the determining parameter, which as
shown in Table 2.1 is common to many algorithms.
7.1.1 FPS with increased stiffness
The installation of a replacement FPS which provides greater stiffness than the
original bumper assembly, or an additional FPS, would be the most likely cause of
premature air bag deployment. Figure 7.1 shows an example of this with a triggering
threshold, shown by the straight line. The original vehicle structure, shown by the

136
full line, would deploy at A, while the vehicle with a FPS, shown by the dashed line,
would deploy at point B.
Figure 7.1 Premature air bag deployment due to stiffer FPS.
The premature triggering of the FPS can have a number of effects on the vehicle and
passengers. One such occurrence would be that the FPS could deploy below the
minimum velocity of air bag deployment. This occurrence can have two effects
depending on the severity of the impact.
The first would be that the air big could deploy for an impact that does not warrant
air bag deployment. If this were to occur it could result in an accident due to the
shock imparted on the vehicle’s driver. The vehicle’s owner would also have the
additional cost of replacing the air bag.
The second effect could be for a more severe impact where the air bag would have
been deployed anyway. In this occurrence a prematurely deployed air bag may have
fully inflated, and started to deflate, by the time the passenger would have come into
contact with the air bag. Thus the passenger would impact a deflating air bag, which
wouldn’t offer the same protection, if any, as a fully deployed air bag.
Air Bag Deployment
A B
Time (t)
∆V (m/s)
o o

137
7.1.2 FPS with decreased stiffness
The fitment of a FPS that has less stiffness than the components that are replaced can
result in late air bag deployment, or possibly non deployment of the air bags. An
example when this may occur would be when the components replaced by the FPS
include vehicle crush cans. Figure 7.2 shows an example of this with a triggering
threshold, shown by the straight line. The original vehicle structure, shown by the
full line, would deploy at A, while the vehicle with a FPS, shown by the dashed line,
would deploy at point B.
Figure 7.2 Premature air bag deployment due to less stiff FPS.
Late deployment of the air bag can affect the vehicle’s passengers in a number of
ways. During an impact the passengers will be propelled forward towards the air bag.
But due to the late deployment of the air bag the passengers could arrive at the wheel
before the air bag has deployed, or more likely, are hit by the air bag as it is
unfolding. Also as a result of this late deployment, the air bag deployment velocity
could be raised, such that non deployment may occur for a velocity for which
deployment should occur.
7.1.3 FPS Strength
The strength of the FPS is also of significant importance as to whether the FPS has
failed before or after the air bag triggering threshold has been reached, and also on
how much energy has been absorbed by the FPS. A FPS that does not fail prior to
Air Bag Deployment
A B
Time (t)
∆V (m/s)
o o

138
the triggering threshold would absorb all the energy of the impact up to air bag
deployment. The above two scenarios are examples of this. For a vehicle fitted with
a FPS, where the FPS has failed and contacted the vehicle, the remaining vehicle’s
structure would absorb the additional energy of the impact. The effect on air bag
deployment in this case will depend on the remaining stiffness of the vehicle, when
compared to the original structure. Two examples of this are discussed below for
FPS that are less stiff than the components they replace, and fail before air bag
triggering. This could equally be applied to FPS that are stiffer.
For a vehicle in which the fitment of a FPS has replaced crush cans, or other
structural components, and the remaining vehicle stiffness is greater than before,
premature air bag deployment may occur. An example of this can be seen in Figure
7.3. The original vehicle structure, shown by the full line, would deploy at A. While
the vehicle with a FPS, shown by the dashed line, would deploy at point B. The
vehicle, with FPS, shows decreased stiffness up to point C. By this point the FPS has
failed and contacted the vehicle, and thus all additional energy is absorbed by the
vehicle. In this case the vehicle has effectively a stiffer structure, shown by the
increase in stiffness up to point B, where the air bag would trigger.
Figure 7.3 Premature air bag deployment due to less stiff FPS and stiffer vehicle
structure.
Air Bag Deployment
A B
Time (t)
∆V (m/s)
C o
o o

139
On the other hand if the remaining vehicle structure was less stiff than before, late air
bag deployment could occur. An example of this is shown in Figure 7.4. In this case
the vehicle, with FPS, has a reduced stiffness up to point C, where the FPS has failed
and has hit the vehicle. Due to the reduced stiffness, when compared to the original
vehicle the curve is extended to point B where the air bag is deployed. This occurs
after point A resulting in a late deployment of the air bag.
Figure 7.4 Late air bag deployment due to less stiff FPS and vehicle structure.
7.1.4 Time
Another influencing factor in determining the effect of a FPS is the time taken for the
FPS to fail and contact the vehicle. As detailed in Section 2.3, the time taken to
trigger an air bag is dependent on the severity of the impact, and in particular the
velocity of the vehicle. At low velocity triggering, where the effect of the FPS will
be greatest, the triggering of the air bag can take between 40 and 60 ms.
As shown in Chapter 5 for the additional FPS analysed, the time taken for the FPS to
contact the vehicle varied between 30 ms for an impact at 5 km/h, to 6 ms at a
velocity of 25 km/h. For this FPS the effect on the triggering process is minimal due
to the small time to failure. But for FPS that absorb higher amounts of energy, and
thus a longer failure time, the effect on the triggering process will be greater.
Air Bag Deployment
A B
Time (t)
∆V (m/s)
C o
o o

140
Figure 7.5 Testing guidelines for FPS and air bag compatibility.

141
7.2 Testing for Air Bag Compatibility
As discussed above, a FPS fitted to an air bag equipped vehicle can have a number of
effects on passenger safety, and thus to overcome these detrimental effects testing for
air bag compatibility is required. But to truly test the compatibility of a vehicle fitted
with a FPS and air bags, one would require tests to be conducted for every impact
used in the development of the air bag triggering thresholds. This would include
different impacting objects and different types of impacts, such as front on, angled
and pole. Naturally this would be a very arduous, and expensive, task requiring
many vehicles and FPS. Thus a more economical, and simple, form of testing is
required.
As detailed earlier vehicle manufacturers generally use rigid barrier tests, at three
different velocities for FPS compliance. This is done at velocities below and above
the air bag deployment velocity thresholds. If the air bag does not deploy below the
threshold, and deploys above the threshold the FPS it is deemed to be compatible.
But even this testing would be too costly for FPS manufacturers. While a vehicle
manufacturer may only sell a few vehicle models, with a single FPS option for each,
FPS manufacturers produce a number of different FPS for a wide range of vehicles
available on the market. Thus the cost of barrier testing would be substantial.
The testing conducted in this thesis, both quasi-static and dynamic pendulum impact,
are two effective forms of simple testing techniques. But judging the compatibility
of a FPS with a vehicle’s air bag system is a very difficult task, due to the complexity
and secrecy of air bag deployment characteristics. Thus conservative estimates,
using these testing techniques were used in the development of testing guidelines,
shown in Figure 7.5.
The following guidelines use the energy absorbed by the FPS to assess the
compatibility of the FPS. This is based on more than one hundred FPS that have
been tested during this project and real world performance of vehicles fitted with
these FPS. The first distinction that should be made in testing is whether the FPS is
an additional or replacement FPS.

142
7.2.1 Additional FPS
Quasi-static, or pendulum testing, should be used to access the energy absorbed by
an additional FPS during an impact. A conservative estimate of 4 % is used as a
determining factor to assess the compatibility of the FPS. Using this conservative
estimate all additional FPS tested during the thesis would be deemed to be air bag
compatible for their intended vehicles.
7.2.2 Replacement FPS
The testing of replacement FPS is a more complex task than that of an additional FPS.
This is due to the components the FPS replaces on the vehicle, and replacement FPS
are designed to offer more protection, and thus absorb more energy than additional
FPS. Thus a distinction needs to be made between a FPS that replaces structural
components of the vehicle, such as crush cans, and a FPS that simply replace the
original bumper assembly.
7.2.2.1 FPS Not Replacing Structural Components
The first stage in assessing the compatibility of replacement FPS, that do not replace
structural components, is to conduct quasi-static testing. Historically the
conservative estimate of 6 % of quasi-static energy absorbed by the FPS has been
shown to be safe for air bag equipped vehicles. Although 6 % is a conservative
estimate, FPS higher than this value may also be compatible for air bag equipped
vehicles.
From observations during experimental testing, FPS that absorb more than
approximately 6 % quasi-static energy often rely on more than the material
properties of the FPS for energy absorption. As shown during testing of the
replacement FPS in Chapter 4, part of the energy absorbed by the FPS was provided
by the friction between the bolted sections, due to the movement in the bolts. Other
FPS mounts observed use the crushing of composite sections and push pin
assemblies for the absorption of energy.
It is also likely that the composite action between the FPS mounts and the vehicle’s
structure will also have an effect on the FPS performance. Additionally the
installation of a winch to the FPS, adds to the complexity and energy absorption of

143
the FPS. Thus for replacement FPS that absorb more then 6 % of the energy during
quasi-static testing, the use of dynamic testing should be used to complement the
quasi-static tests.
Due to the properties of the different types of air bag sensors, as described in Chapter
2, the suitability of a higher energy absorbing replacement FPS need to be judged
along with the type of sensor(s) used for the intended vehicle, these will be either
electronic or mechanical sensors. This is due to the different parameters that are
used for the different sensor types.
7.2.2.2 Electronic Sensors
The preference for electronic sensors, over mechanical sensors, for air bag systems is
increasing. But due to the varied and complex algorithms used in these sensors,
shown in Table 2.1, conservative estimates on the suitability of FPS are used.
The assessment of the suitability of a FPS tested dynamically should be made on the
combination of the energy absorbed by the FPS and the resulting change in velocity
response of the pendulum. A conservative estimate of 8 % energy absorbed by the
FPS can be used. But a comparison of these results should be made to known impact
characteristics of the vehicle and air bag triggering data for the vehicle when
available. It is also imperative that the data used for the assessment of the FPS
includes only the impact duration up to the FPS contacting the vehicle.
The finite element pendulum analysis showed that the pendulum velocity should be
close to the non-deploy/deploy threshold for the vehicle’s air bag system. It also
showed that when the change in velocity of the pendulum is required the mass of the
pendulum has an effect. Thus the mass of the pendulum should be close to the mass
of the intended vehicle.
7.2.2.3 Mechanical Sensors
In the testing of vehicles with mechanical sensors the same criteria as for electronic
sensors can be used where energy absorbed in the determining factor, or a more
simple approach of analysing the peak deceleration could also be used.

144
Previous research has shown that for vehicles with mechanical sensors the
performance of the FPS can be assessed by the deceleration of the FPS during an
impact. Thus for vehicles with this type of sensor the peak deceleration during the
impact can be compared with the air bag triggering criteria, if known. Estimates of
these values have been suggested to be 12 g for 4WD vehicles and less than 3.5 g for
passenger vehicles (Sredojevic, 1998), although these values will vary for each
vehicle.
As the finite element pendulum results showed, the velocity of the pendulum has an
effect on the deceleration recorded, while the mass of pendulum does not. Thus this
testing should be conducted at the non-deploy/deploy vehicle velocity for the
vehicle’s air bag deployment.
7.2.2.4 FPS Replacing Structural Components
When a FPS replaces any substantial components of the vehicle’s structure, such as
crush cans, the impact response of these components should be studied so that the
characteristics of the FPS are comparable. These structural components of the
vehicle are designed to absorb greater impacts than a simple bumper assembly, and
thus replacing these components significantly changes the impact response of the
original vehicle. For this reason a FPS should be designed so that the impact
characteristics neither very greatly above nor below those of the replaced structure
components. Thus unlike FPS that simply replace a bumper assembly, when
replacing structure components, a FPS has to be made strong enough so that similar
characteristics to those components replaced are exhibited, or air bag triggering
problems as discussed in Section 7.1.3 may occur.
Pendulum testing, at the air bag deployment velocity, should be conducted on the
replaced structure components, and on the intended FPS, and a comparison between
the two tests results should be made. A difference of 1 km/h between the responses
of the two structures was suggested in the draft Australian FPS Standards for
comparative dynamic pendulum testing (Australian Standard, 2001).
Quasi-static testing could also be used in the development of the FPS, but as shown
in Chapter 3, the correlation between quasi-static and dynamic testing techniques

145
was decreased for higher energy absorbing systems, thus dynamic testing should be
used in testing the final product.
7.2.3 Incompatible FPS and On Vehicle Testing
Most additional and replacement FPS that are deemed to be incompatible using the
above conservative guidelines will be unsuitable for fitment to vehicles with air bags.
But in some cases, due to the design of the vehicle, or FPS, or the conservative
nature of these guidelines, the FPS could be deemed compatible with further testing.
These types of tests are beyond the scope of this thesis but a number of different
testing techniques could be used.
Pendulum testing with the FPS mounted to the vehicle could be conducted. The
vehicle should be placed in front of the pendulum, with the engine left running, and
the throttle linkage removed. The vehicle would then be impacted with a pendulum
equal to its own weight at the non-deploy/deploy air bag velocity threshold. When
the vehicle is impacted by the pendulum the suitability of the FPS can be assessed by
the deployment or non deployment of the air bag.
Rigid barrier testing can also be used to assess the suitability of the FPS. The vehicle,
with FPS, should be driven into the barrier at the non-deploy/deploy air bag velocity
threshold. The suitability of the FPS can be assessed by the deployment or non
deployment of the air bag.
7.3 Considerations
The testing and assessment of FPS for air bag compatibility is very complex. In the
above guidelines the FPS is tested off the vehicle and mounted to a rigid chassis, and
thus the interaction of the FPS and the vehicle will not be observed during testing.
Many variables in the design and fitment of the FPS can have a great effect on the
impact characteristics of the FPS and the vehicle. The following are some points that
need to be considered in the design and testing of a FPS.
7.3.1 Vehicle Structure
As shown in the testing conducted in Chapter 4, the frontal structures of vehicles
need to be carefully considered in the design and fitment of a FPS. Generally

146
passenger vehicles are made of a softer structure than 4WD recreational vehicles.
The difference in vehicle stiffness affects the duration of the impact, such that the
stiffer the structure the shorter the impact duration will be. Consideration must also
be given to the vehicle’s size. A smaller vehicle, although it may be softer, can have
a shorter impact duration due to the reduced deformation available before the chassis
or engine is impacted.
7.3.2 Mounting Bolt Locations
Consideration must also be given to the mounting points on the vehicle used for the
FPS. If the FPS mounts are bolted to the vehicle using the same bolt holes as the
original bumper, then the FPS should interact similarly with the vehicle. If new, or
different bolt locations are used for the mounting of the FPS, consideration should be
given to the effect that this will have on the impact performance of the vehicle. For
example, a vehicle which has crush cans located on the end of the chassis
consideration should be given to the interaction between the FPS and the crush cans.
Some FPS designs tested bypassed crush cans on the vehicle, and thus directly
transferred load to the vehicle’s chassis.
7.3.3 Rate of Energy Absorption
The rate at which the energy is absorbed also needs to be considered. For example
the replacement FPS tested in Chapter 4 absorbed its energy over a deflected distance
of 80 mm. The peak load was approximately 130 kN and the average load was
approximately 65 kN. If the deflected distance of the FPS had been reduced to 40
mm, the peak and average load on the FPS would double for the FPS to absorb the
same amount of energy, and thus the FPS would absorb energy at an increased rate.
This increased rate would more likely cause premature air bag deployment. But as
previously mentioned in Chapter 3, most FPS tested in this thesis had a clearance of
approximately 80 mm, and thus the rate of energy absorbed proved not to be as great
a concern, but should be considered in any FPS testing.
7.3.4 FPS and Vehicle Auxiliaries
Care should also be given to the vehicle’s structure and any auxiliaries that may be
located within the FPS clearance. The location of any objects behind the FPS, that
the FPS may contact during an impact, can greatly affect the characteristics of the

147
impact. For example water bottles are sometimes placed behind the vehicle bumper.
Since water is an incompressible fluid, if a FPS was to contact this during an impact
an increase in stiffness may occur that could result in premature air bag deployment.
7.3.5 Sensor Location
The location of air bag crash sensors can also have an effect on the FPS design.
Some vehicles may only have one sensor placed inside the vehicle’s cabin, while
other vehicles can have multiple sensors throughout the vehicle. The mounting of
the FPS to the vehicle should carefully avoid any direct, or indirect, contact with a
sensor.
7.3.6 Bumperettes
Bumperettes are placed on the front of a FPS to absorb low velocity impacts, and to
improve the appearance of the FPS. The effectiveness of bumperettes would greatly
depend on the type of impact and the properties of the impacting surface. For
example when impacted by a rigid body, such as a pendulum during testing, the
bumperettes are at their full effect, which was shown in Chapter 4 for the
replacement FPS.
For deformable impact surfaces it would be expected that the effectiveness of the
bumperettes could be reduced since the deformable impacting object could make
contact with the rest of the FPS. If the impacting object was to hit the vehicle at an
angle, or the impacting object doesn’t make contact with bumperettes, such as an
impact with a pole, the bumperettes would not offer any energy absorption ability
during the impact. In this situation the impact response of the FPS would change to a
stiffer initial response. Consideration of this should be taken into account in the
calculation of the energy absorbed by the FPS.
7.4 Summary
This chapter has highlighted the possible effects on a vehicle’s air bag system that
may result when a FPS has been fitted to a vehicle. Early, late or non deployment of
air bags may occur when a FPS has greatly changed the impact characteristics of the
vehicle. The properties of the FPS that can greatly affect these impact characteristics
are its stiffness and strength. Both these properties are important factors in
148
determining the energy absorbed by the FPS. It is this energy absorption ability of
the FPS that was used in the developed guidelines to access the compatibility of the
FPS and air bags.
The guidelines developed in this chapter use conservative estimates which can be
used in the evaluation of FPS for air bag compatibility. These guidelines take into
consideration the type of FPS, the type of air bag sensor(s) used by the vehicle and
whether or not the FPS has replaced structural components of the vehicle. Testing in
the guidelines uses both quasi-static and dynamic techniques, and are conducted off
vehicle.
All testing in the guidelines use lateral testing, which although do not represent all
possible real world impacts, offers a possible worst case scenario for the effect that
the FPS can have on a vehicle. This is particularly true for additional FPS that offer
little protection to the vehicle during angled impacts.
Nearly all of the hundred plus FPS that were tested during this project failed by
yielding and had rotated a sufficient distance to have come into contact with the
vehicle. This type of controlled failure is easy to assess with the use of these
guidelines, since the load deflection behaviour of the FPS is predictable and energy
is continuously absorbed throughout the FPS displacement. FPS failure
characteristics that greatly differ from the norm can also be assessed by these
guidelines, but care must be given to the manner in which the FPS absorbs energy.
This is particularly so for FPS that do not rotate, where it is difficult to access when
the FPS would have come into contact with the vehicle.
Due to the complex nature of vehicle air bag systems, and the variable characteristics
of vehicles, these guidelines were developed as a guide for the testing and evaluation
of FPS for air bag compatibility. They are not intended to replace full scale crash
testing, which though very costly, is the most effective assessment of FPS
compatibility. But with an understanding of the development of these guidelines,
and the considerations given, these guidelines can be used as a cost effective means
of testing a FPS for air bag compatibility.

149
Chapter 8 Summary and Conclusions
The use of FPS, or bull bars as they are popularly known, has been an accepted
practice for fitment to passenger vehicles in Australia, in city areas and more so in
the outback, for many years. They have beneficial effects by providing protection
during minor collisions and impact attenuation during major collisions.
With the advent of air bags in modern passenger vehicles, the performance of FPS
and their effects on air bag deployment have become questionable. The community
was concerned whether or not the installation of FPS would have adverse effects on
air bag deployment, and thus compromise passenger safety. This concern was also
felt by the industry which needed to demonstrate that FPS can be designed and fitted
so as to have beneficial effects, and not detrimental effects, towards passenger safety.
It was this concern which started this joint university-industry research project which
is the very first comprehensive research into FPS behaviour.
To study the behaviour of the FPS experimental and analytical techniques were used.
Experimental testing used both quasi-static and dynamic techniques, while finite
element analysis was undertaken to better understand various dynamic properties.
Using these experimental and analytical results a set of testing guidelines were
developed for the assessment of FPS and their compatibility with air bag equipped
vehicles. These guidelines use a combination of quasi-static and dynamic testing
techniques.
From quasi-static testing, of over one hundred FPS, the energy absorbed by the
different types of FPS were calculated, up to the FPS impacting the vehicle. This
energy was used to gain an understanding of the behaviour a FPS can have when
fitted to a vehicle during an impact. This was done by comparing the calculated
energy with the kinetic energy of the vehicle travelling at a velocity of 25 km/h, with
the value represented as a percentage. It was observed that most additional FPS
tested absorb up to approximately 4 % of the energy of the vehicle, while for
replacement FPS, the energy absorbed increased up to approximately 8 %, or
approximately 10 % for a replacement FPS with a winch.

150
Comparing the quasi-static and dynamic experimental testing results, it was shown
that there was a good relationship between the energies absorbed, and thus the
percentages of the energy absorbed, by the FPS. But the relationship between the
percentage of quasi-static energy and change in pendulum velocity was less
conclusive.
From these results it was shown that quasi-static and dynamic testing were
comparable for lower energy absorbing FPS, typically additional FPS, while as the
FPS absorbs more energy, typical of replacement FPS, the correlation in the results
decreased. This was partly due to the lack of results for higher energy absorbing FPS,
but it is also expected that lower energy absorbing FPS rely predominately on
material properties to absorb energy, while higher energy absorbing FPS also rely on
the composite action between the different components. Thus the use of quasi-static,
or dynamic pendulum, testing was suggested for assessing additional FPS up to a
value of 4% energy absorption, and 6 % for replacement FPS.
For FPS that replace structural components of the vehicle, such as crush cans,
comparative testing of the FPS and the structural components replaced by the
installation of the FPS should be conducted. Two of these frontal structures were
tested in Chapter 4. The results of these tests, from two similar sized vehicles with
different structures, showed the variance that can exist between vehicles. This
highlighted the importance of designing the FPS as a complete system that integrates
with the vehicle, such that the initial behaviour of the FPS is similar to that of the
original vehicle.
The experimental pendulum results were complemented by simulated pendulum
analyses undertaken using finite element analysis. The results from the FEA showed
that as the velocity of the pendulum was increased, so was the deceleration
experienced by the pendulum and the energy absorbed by the FPS. The velocity
change experienced by the pendulum during the impact also decreased as the
velocity of the pendulum increased. The pendulum impact simulation also showed
that the mass of the pendulum has no effect on the energy absorbed by the FPS. But
the deceleration and velocity change of the pendulum increased with the increase in
mass.

151
From the FEA pendulum results, the significance of the pendulum velocity and mass
during experimental testing was highlighted. These parameters were used in the
guidelines for assessment of replacement FPS, above the 6 % energy absorption
range. The results showed that the mass of the pendulum had an effect on velocity
change of the pendulum, while having no effect on the energy absorbed by the FPS.
Thus if the energy absorbed by the FPS, or the deceleration of the pendulum is
required, as with mechanical air bag sensors, the mass of the pendulum is not
important since the energy absorbed remains the same, and deceleration can simply
be scaled with the mass of the pendulum and vehicle. If the results required are the
velocity change of the pendulum and the energy absorbed, as with electronic air bag
sensors, then the chosen mass and velocity of the pendulum will be important.
To further examine the dynamic behaviour of a FPS, transient pulse loads were
applied to the finite element model of a FPS to study the influence of mass, velocity
and impact time duration. By using a constant mass, it was possible to study the
effects of the impacting surface, by varying the pulse time duration for varying
velocities. The analysis showed, that for the same velocity, increasing the pulse time
duration would decrease the amount of energy absorbed by the FPS. While as with
the pendulum analysis, increasing the velocity, for the same pulse time duration, the
energy absorbed by the FPS would increase. By using a constant pulse time duration,
it was also possible to further study the effect of mass and velocity. Similar to
previous analyses, by increasing the velocity the amount of energy absorbed by the
FPS increased. These analyses also showed that for a similar velocity, the energy
absorbed by the FPS increased as the mass in increased. Also, for the FPS analysed,
the duration of the impact had little effect on the performance of the FPS. These
FEA results showed the importance of testing a FPS at the non-deploy/deployment
air bag triggering velocity. The mass of the pendulum during testing, although not as
significant as the velocity, should be closely matched to that of the vehicle.
8.1 Suggestions for Further Work
Since this project was the first comprehensive research into the testing of FPS and
their compatibility with vehicle air bags, there are many areas where further study is
warranted. Some of these are discussed below.
152
This project has considered the FPS as a complete system, a combination of the
external structure and the mounting system. During the testing conducted it was
evident that the mounting system of a FPS provides the biggest influence on the FPS
performance. Thus further study and development of the FPS mounting structure
should be conducted, with the possible development of more efficient energy
absorbing structures. This could be done using common energy absorption structures,
dampers, new materials or frusta.
This thesis has assumed that once the FPS had become plastic, and deflected
sufficient distant to come in contact with the vehicle, the FPS would not offer any
additional resistance during an impact. Although this assumption is sound, further
investigation into the interaction between the FPS and vehicle would be beneficial.
All testing in this project has used a rigid chassis to simulate the structure of the
vehicle. But for some vehicles, in particular monocoque structures, it would be
expected that the use of a rigid structure would not properly simulate the stiffness of
the vehicle’s structure. Thus further analysis needs to be done on the suitability of
the FPS mounting structure, with an eye to the development of a pseudo chassis to
better represent the differences in a vehicle’s structure’s stiffness.
Research should also be carried out on different types of impacts. This thesis has
mainly discussed frontal impacts, but real world impacts can occur at any angle. No
testing found to date has considered the effect of the FPS on these types of impacts.
Further consideration should also be given to pole impacts.
Additionally further quasi-static and dynamic experimental testing should be
undertaken to build a larger database of results. These additional results can be
added to the results in Chapter 3 to strengthen the presented conclusions.
8.2 Conclusions
This project used all possible processes, such as quasi-static and dynamic
experimental testing and computer simulations, to generate the research information.
The use of quasi-static and dynamic experimental testing has shown that the energy
absorbed by a FPS provides valid guidelines for assessing the performance of a FPS.

153
The finite element technique was shown to be an efficient, and economical, tool for
studying the impact response of FPS, and to evaluate the effects of important
parameters, without expensive experimental testing.
The research findings from numerous FPS tests carried out in this research project
and observations of real life performance of vehicles fitted with these FPS, have
given confidence to the assessment criteria developed in this research project. This
is the main outcome of this research project. It has been shown that FPS can be
designed to complement the safety systems of modern passenger vehicles, and thus
passenger safety. This would not have been possible without the comprehensive
research carried out in this project.
The other outcomes of this project are:
• Greater understanding of impact response of FPS.
• Generation of research information which provide design guidance for FPS.
• Establishment of the power and capability of finite element techniques as
economical and efficient means of studying FPS behaviour and carrying out
parametric studies to evaluate design variations.
This project has shown that the behaviour of a FPS is dependent upon the composite
action of the FPS, the FPS material and the incorporated mounting devices.
Deflection, yielding and failure of the FPS must be such that airbags are neither
deployed too early, too late, or not at all, while at the same time providing protection
against animal and light impacts. Hence the design of FPS must satisfy a dual design
criteria; ie it must both be strong enough to offer protection during minor impacts,
and remain flexible enough to avoid influencing the airbag deployment
characteristics of the vehicle. This design criteria can be satisfied by not only
limiting the energy absorbed by the FPS, but also by ensuring that the FPS is strong
enough to offer protection, and yet sufficiently flexible to yield and deflect to set
limits prior to the absorption of a designated amount of energy.
Finally, it can be concluded that the project findings have generated fundamental
research information on FPS behaviour and have achieved the project aims and
objectives, which will be of great benefit to the industry and the community.


155
References
Australian Standard, “Motor Vehicle Frontal Protection Systems, Part 1: Road user
protection”, Australia, Australian Standard AS 4876.1, 2002
Australian Standard, “Motor Vehicle Frontal Protection Systems, Part 1: Road user
protection - Draft”, Australia, Australian Standard, 2001
Attewell R. and Glase K, “Bull Bars and Road Trauma”, Road Safety Research
Report CR200, Australia, 2000
Chaim H. K. and Thomas J. A., “Investigation of the Effect of Bull Bars as Impact
Attenuation Devices with Air Bags”, Australia, Department of Transport Australia,
Office of Road Safety CR13, 1980
Chan, C, “Fundamentals of Crash Sensing in Automotive Air Bag Systems”, U.S.A.,
Society of Automotive Engineers, 2000
Bullen F., Thambiratnam T. and Bugeja M., “Integration of Bull-Bars as Impact
Attenuation Devices with Air Bags”, Australia, 15th International Technical
Conference on the Enhanced Safety of Vehicles, Paper Number 96-S4-O-11, Pages
655-659, 1996
EuroNCAP, “European New Car Assessment Programme; Testing Protocol”
EuroNCAP, 2001
Federal Office of Road Safety, “Australian Design Rule No. 69/00, Full Frontal
Impact Occupant Protection”, Australia, Federal Office of Road Safety, 1996
Gardener B., “VicRoads Perspective On Bull Bars”, Bull Bar Safety – Proceedings
of a workshop held in Sydney, Australia 4 May 1994, Road Safety Bureau, Pages 27-
28, 1994

156
Glance P. M., “Measuring the Phenomenon of Bumper Impact”, Paper Number
1999-01-3187, U.S.A., Society of Automotive Engineers, 1999
Grzebieta R., Zou R. and Powell C., “Development of an Air Bag Compatible Bull
Bar”, Australia, 1996
Hardy B. J., “A Study of Accidents Involving Bull Bar Equipped Vehicles”, TRL
Report 243, United Kingdom, Transport Research Laboratory, 1996
Hibbitt, Karlsson and Sorensen, Inc. (HKS), “ABAQUS/Standard User’s Manual,
Volume I, II and III”, U.S.A., Hibbitt, Karlsson and Sorensen, Inc., 1998
International Organisation for Standardisation, “Exterior Protection for Passenger
Cars”, Switzerland, International Standard ISO 2958-1973 (E), 1973
Jones I. S., “The Effect of Impact Type and Vehicle Velocity on Vehicle Crush
Characteristics”, 27th Annual Proceedings for American Association for Automotive
Medicine, Pages 211-230, 1983
Jones N, “Quasi-Static Analysis of Structural Impact Damage”, Journal of
Construction Steel Research, Issue 23, Pages 151-177, 1995
Lawrence G., Rodmell C. and Osborne A., “Assessment and Test Procedures for Bull
Bars”, TRL Report 460, United Kingdom, Transport Research Laboratory, 2000
Livermore Software Technology Corporation (LTSC), “LS-DYNA Keyword Users
Manual, Volume I and II”, U.S.A., Livermore Software Technology Corporation,
2001
Murray N. W., “When it Comes to the Crunch, The Mechanics of the Car Collisions”,
Singapore, World Scientific Publishing, 1994

157
Sparke L. J., “Bull bars, Kangaroos and Holden Cars – A Challenge Unique To
Australia”, Bull Bar Safety – Proceedings of a workshop held in Sydney, Australia 4
May 1994, Road Safety Bureau, Pages 21-24, 1994
Sparke L. J., “Optimisation of Crash Pulse Through Frontal Structure Design”,
Australia, General Motors - Holden Pty Ltd, Paper Number 96-S4-W-21, 1996
Sredojevic B. and Zivkovic G., “Vehicle Frontal Protection System (Bull Bars) :
Airbag Compatibility Tests”, Australia, Automotive Safety Engineering Pty Ltd,
1998
Sullivan J. L., “Bullbar Design for Airbag Equipped Vehicles”, Australia, 15th
International Technical Conference on the Enhanced Safety of Vehicles, Paper
Number 96-S4-O-12, Pages 665-665, 1996
Taylor L. R., “Development in Vehicle Frontal Protection Bars”, Australia, TJM
Products Pty. Ltd., 1998
Tomas J. A., “Effects of Bull Bars on the Crash Pulse of Sedan Cars and Car
Occupant’s Injury; Progress Report No. 1”, Australia, RMIT and Monash University,
1994
Tomas J. A., “Effects of Bull Bars on the Crash Pulse of Sedan Cars and Car
Occupant’s Injury; Progress Report No. 2”, Australia, RMIT and Monash University,
1994
Tomas J. A., “Effects of Bull Bars on the Crash Pulse of Sedan Cars: Evaluation of
the Outback Bar; Progress Report No. 3”, Australia, RMIT and Monash University,
1994
Tomas J. A., “Effects of Bull Bars on the Crash Pulse of Sedan Cars (Country Bar at
20 kph into a pole); Progress Report No. 4”, Australia, RMIT and Monash University,
1994

158
Zellmer h. and Friendel D., “Potential Risk for Vulnerable Road Users from Crash
Bar Equipped Off-Road Vehicles”, 38th Strapp Car Crash Conference, Pages 403-412,
1994
Zellmer H. and Otte D., “Injury Risk of Vulnerable Road Users in Case of Accident”,
1995 International IRCOBI Conference on Biomechanics, Pages 119-132, 1995
Zivkovic G., “Vehicle Frontal Protection System (VFPS) – Bullbars: Pendulum
Testing”, Australia, Automotive Safety Engineering Pty Ltd, 1999
Zivkovic G., “Impact Performance of Current Produced Bull Bars”, Australia,
Automotive Safety Engineering Pty Ltd, 1996
Zivkovic G., “Impact Performance of Current Produced Bull Bars”, Australia,
Automotive Safety Engineering Pty Ltd, 1996