Embed Size (px)
Citation preview
Evaluation of the museum environmental riskby means of tempera-painted dosimeters
M. Bacci*, M. Picollo, S. Porcinai, B. RadicatiIstituto di Ricerca sulle Onde Elettromagnetiche `̀ Nello Carrara'', CNR, Via Panciatichi 64, 50127 Firenze, Italy
Abstract
The monitoring and control of environmental parameters provide useful information in order to reduce the decay of works
of art. Dosimeters that reproduce the pictorial structure of paintings as closely as possible were prepared and tested to evaluate
the effects induced on works of art by the `̀ global'' indoor environment. These dosimeters were aged under different
conditions in ageing chambers, and successively were placed in the Uf®zi Gallery for several months. The data obtained from
the naturally aged dosimeters were compared with those found for the arti®cially aged, thus providing information on the
alteration process induced by the environmental factors. # 2000 Elsevier Science B.V. All rights reserved.
Keywords: Environmental monitoring; Visible re¯ectance spectroscopy; Non-invasive investigation
1. Introduction
Paintings on exhibit in galleries and museums are
inevitably subject to deterioration with the passage of
time. Exposure to various environmental parameters
such as, ultraviolet (UV) and visible light, tempera-
ture, relative humidity (RH), particulate, atmospheric
gases and pollutants are responsible for ageing painted
works of art [1±7]. Colour changes are the most
apparent effects of these environmental conditions.
The studies of these parameters have primarily
focused on the monitoring of various pre-selected
factors. However, the monitoring of environmental
parameters by measuring the individual factors at a
particular point in times does not yield an accurate
assessment of the potential damage to art since the
internal environment is always subject to ¯uctuations.
In order to obtain data on the global impact of the
environment affecting the exposed artworks, the
synergistic effects of the various environmental fac-
tors must be analysed. Thus, a different approach for
evaluating the conditions or the change in conditions,
which may alter the stability of the objects and affect
their longevity, must be considered. With this
approach, the paintings themselves can be studied
as dosimeters integrating all the effects of the envir-
onment.
However, because of a paintings' uniqueness, the
actual artworks cannot be considered `̀ test panels'',
which can be subjected to harsh conditions and
sampled without restriction. Therefore, mock paint-
ings were constructed with similar materials to act as
dosimeters and to serve for monitoring the quality of
the museum environment.
The fading of painted artworks is one of the most
immediately visible effects of the environment.
Recording spectra in the visible region at different
times (as before and after ageing processes) makes it
possible not only to get information about the induced
Thermochimica Acta 365 (2000) 25±34
* Corresponding author.
0040-6031/00/$ ± see front matter # 2000 Elsevier Science B.V. All rights reserved.
PII: S 0 0 4 0 - 6 0 3 1 ( 0 0 ) 0 0 6 1 0 - 9
chemical changes, but also to have a direct measure-
ment of the potential damage to the work of art. In
addition, the obtained data could be better related to
the actual damage occurring on paintings, since colour
changes are a macroscopic and global index of
alteration.
In this paper, the results obtained by non-invasive
re¯ectance spectroscopic analysis in the visible region
on mock paintings are presented. The mock-ups were
arti®cially aged under different exposure conditions
(light, thermal, and pollutant exposure). By comparing
the re¯ectance spectra, acquired before and after
arti®cial ageing procedures, it was possible to evaluate
the mock paintings' alteration induced by the different
exposures. Finally, the data obtained in the laboratory
were compared with the results obtained from a mock
painting (made with 12 dosimeters) that was exposed
to natural ageing at the Uf®zi Gallery, Florence.
2. Experimental
Several dosimeters were prepared by using different
pigments/dyes (Table 1) mixed with egg tempera
medium (yolk and egg white). The selected pig-
ments/dyes were required to have a different stability
to light and pollutants, to cover a wide range of colours
of both natural and synthetic origin, and to be com-
patible with egg tempera medium. In order to obtain a
constant thick painted layer (200 mm wet layer thick-
ness), the pigments/dyes were deposited on melinex1
(125 mm-thick polyethylene terephthalate sheets)
using a ®lm applicator.
The painted sheets of melinex1, one for each
pigment or dye, were cut into small strips as two
different sets of the same pigment/dye were essential.
The ®rst set was arti®cially aged and the second was
used for preparing the mock paintings (dosimeters),
which were exposed in natural environments (i.e.
galleries and museums). Both sets had its own refer-
ence strip stored in controlled environment without
oxygen and light.
The arti®cial ageing tests consisted of three separate
exposure cycles of different environmental para-
meters: light (visible component only), temperature,
and pollutants (SO2, NOx). The samples aged under
light were exposed in a light box for 4, 8, 16, 32 and 64
days using Philips TLD94 58 W daylight rendering
¯uorescent tubes. These tubes were ®ltered with Per-
spex VE UV ®lters which had a cut-on wavelength at
about 400 nm and maintained a constant sample illu-
minance of 18 klux. During this ageing process, the
temperature and RH in the light-box were around
308C and 30%, respectively. For the thermal ageing
exposure the samples were placed in an oven without
any lights at 608C and at 55% RH for 7, 14, and 21
days. Exposure to air pollutants was carried out for 4
days under a continuous ¯ow of SO2, NOx, and air, so
that the overall concentrations of SO2 and NOx in the
gas chamber were approximately 10 and 20 ppm,
respectively (T � 23�C, RH � 55%).
One of the mock paintings, prepared for natural
ageing in museums and galleries, was placed for 9
months (from 16 December 1996 to 29 September
1997) in the Leonardo room at the Uf®zi Gallery,
Florence.
Table 1
Pigments chosen for the preparation of the mock dosimeters
Pigment Source Chemical formula
Extra fine azurite Kremer, Germany 2CuCO3�Cu(OH)2
Extra fine smalt Kremer, Germany SiO2±K2O±CoO
Synthetic indigo Janssen, Belgium C16H10N2O2
Mountain cinnabar Kremer, Germany HgS
Lead white Aldrich, USA 2PbCO3Pb(OH)2
Lead antimoniate yellow Zecchi, Italy Pb2Sb2O6(O, OH)
Raw Sienna Earth Zecchi, Italy aFeOOH Ð aFe2O3
Lead(II) chromate Aldrich, USA PbCrO4
Curcumin Acros, USA C21H20O6
Alizarin Acros, USA C14H8O4
26 M. Bacci et al. / Thermochimica Acta 365 (2000) 25±34
A spectrophotometer (Perkin-Elmer Mod. l19)
equipped with a 60 mm integrating sphere was used
to analyse all the samples. The re¯ectance spectra
were acquired from 360 to 2500 nm. The resolution of
the spectrophotometer was �0.2 and �0.8 nm for the
visible and near-IR ranges, respectively. Each sample
was measured three times (three different cycles of
measurements) in order to reduce possible errors
which might be induced by external sources. Calibra-
tion was performed with plates of pressed BaSO4
powder (purity >99.99%). The colorimetric data were
evaluated from the re¯ectance spectra of the samples
following the CIELAB1976 recommendation [8]. The
mean error of the measurement, due to incorrect re-
positioning operations, non-homogeneous layers, etc.,
was evaluated as about �0.7DE (colour variation)
units.
These spectrophotometric measurements allowed
the evaluation of the changes in the dosimeters that
were induced by the arti®cial or the natural ageing
processes as follows:
1. Display of the difference between the re¯ectance
spectra of the aged sample and the control (DR%).
DR% made it possible to monitor the spectral
variations related to the chromophore and/or to the
scattering properties of the surface. An almost
constant value of DR% over the visible spectral
range indicated that no change of chromophore
had occurred, and the re¯ectance variation was
mainly due to a different scattering of the
investigated surface.
2. Calculation of the colour change (DE) together
with its three components Da�, Db� and DL�,according to the CIELAB 1976 recommendation.
These data were directly correlated with the visual
perception.
3. Principal component analysis (PCA). PCA
was performed in order to stress the variability
within the spectra of the arti®cially aged samples.
To explain the spectral variation that occurred
as a consequence of the natural ageing processes,
the re¯ectance spectra collected from the exposed
strips at the ®eld site were projected onto
the PCA model, which was built using the
arti®cially aged data. The PCA algorithm was
implemented in the MATLAB1 environment and
run on a PC.
3. Results and discussion
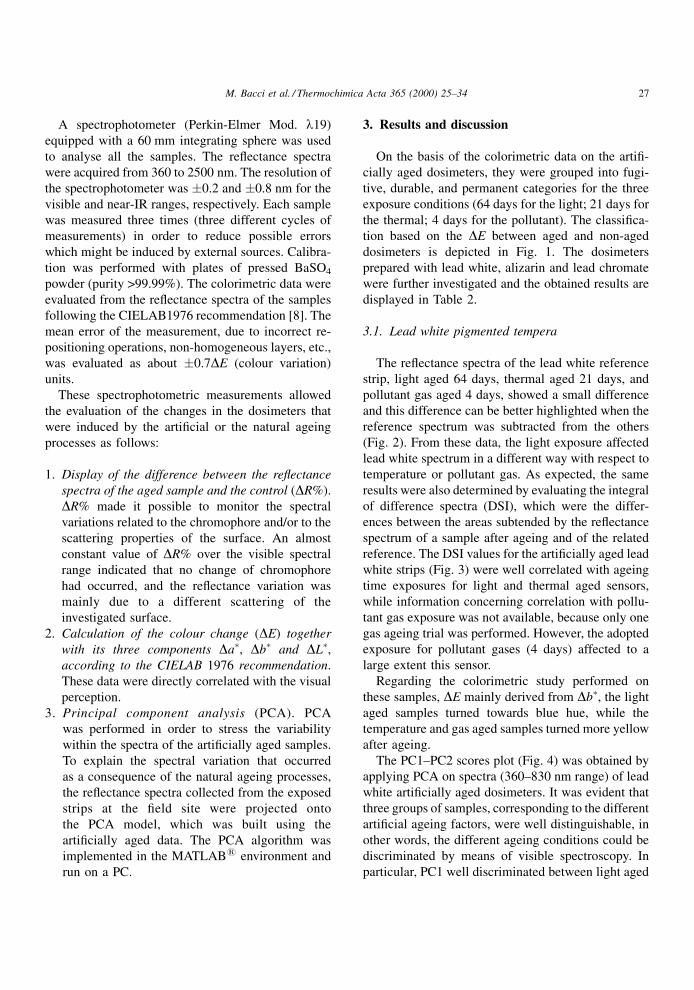
On the basis of the colorimetric data on the arti®-
cially aged dosimeters, they were grouped into fugi-
tive, durable, and permanent categories for the three
exposure conditions (64 days for the light; 21 days for
the thermal; 4 days for the pollutant). The classi®ca-
tion based on the DE between aged and non-aged
dosimeters is depicted in Fig. 1. The dosimeters
prepared with lead white, alizarin and lead chromate
were further investigated and the obtained results are
displayed in Table 2.
3.1. Lead white pigmented tempera
The re¯ectance spectra of the lead white reference
strip, light aged 64 days, thermal aged 21 days, and
pollutant gas aged 4 days, showed a small difference
and this difference can be better highlighted when the
reference spectrum was subtracted from the others
(Fig. 2). From these data, the light exposure affected
lead white spectrum in a different way with respect to
temperature or pollutant gas. As expected, the same
results were also determined by evaluating the integral
of difference spectra (DSI), which were the differ-
ences between the areas subtended by the re¯ectance
spectrum of a sample after ageing and of the related
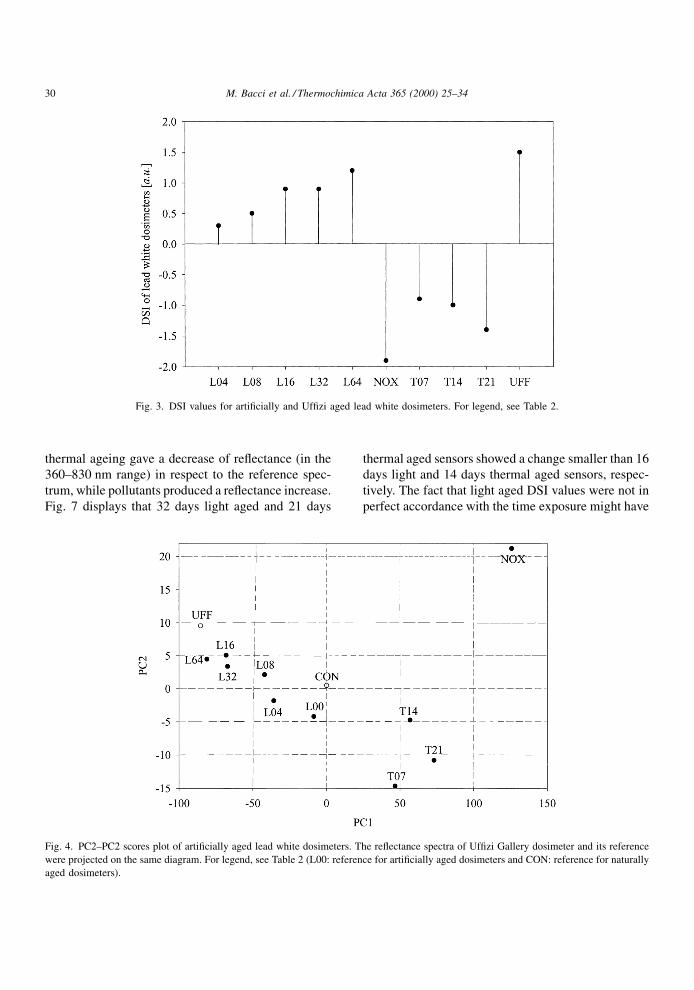
reference. The DSI values for the arti®cially aged lead
white strips (Fig. 3) were well correlated with ageing
time exposures for light and thermal aged sensors,
while information concerning correlation with pollu-
tant gas exposure was not available, because only one
gas ageing trial was performed. However, the adopted
exposure for pollutant gases (4 days) affected to a
large extent this sensor.
Regarding the colorimetric study performed on
these samples, DE mainly derived from Db�, the light
aged samples turned towards blue hue, while the
temperature and gas aged samples turned more yellow
after ageing.
The PC1±PC2 scores plot (Fig. 4) was obtained by
applying PCA on spectra (360±830 nm range) of lead
white arti®cially aged dosimeters. It was evident that
three groups of samples, corresponding to the different
arti®cial ageing factors, were well distinguishable, in
other words, the different ageing conditions could be
discriminated by means of visible spectroscopy. In
particular, PC1 well discriminated between light aged
M. Bacci et al. / Thermochimica Acta 365 (2000) 25±34 27
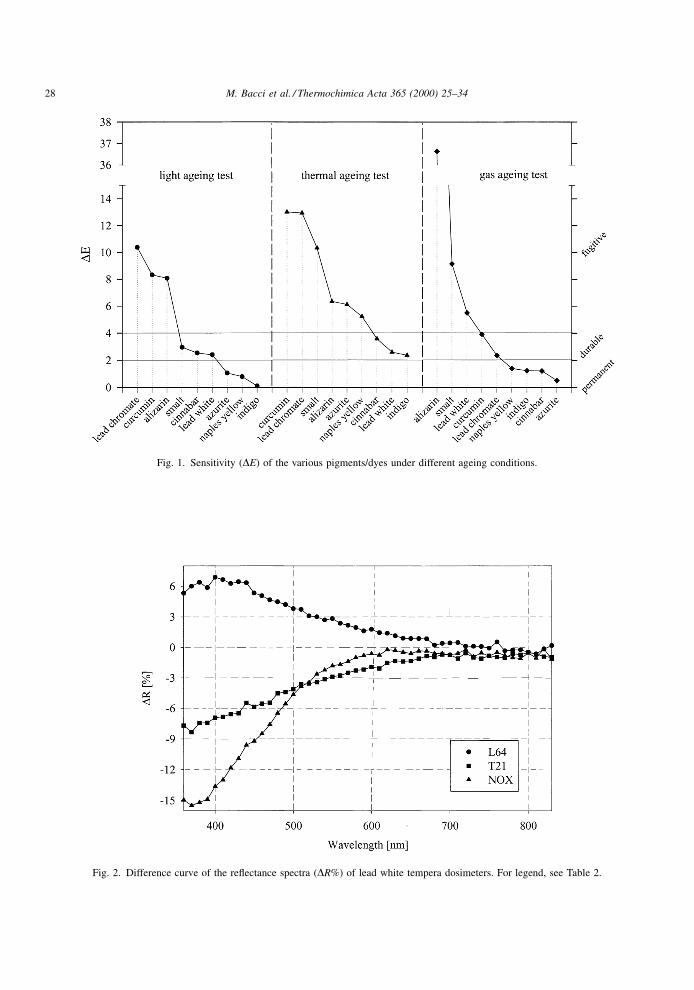
Fig. 1. Sensitivity (DE) of the various pigments/dyes under different ageing conditions.
Fig. 2. Difference curve of the re¯ectance spectra (DR%) of lead white tempera dosimeters. For legend, see Table 2.
28 M. Bacci et al. / Thermochimica Acta 365 (2000) 25±34
and thermally or pollutants aged dosimeters, while
PC2 was able to differentiate the pollutants aged
dosimeter from all the other sensors. A good correla-
tion between ageing time and PC1 scores was found
for light aged dosimeters.
3.2. Alizarin pigmented tempera
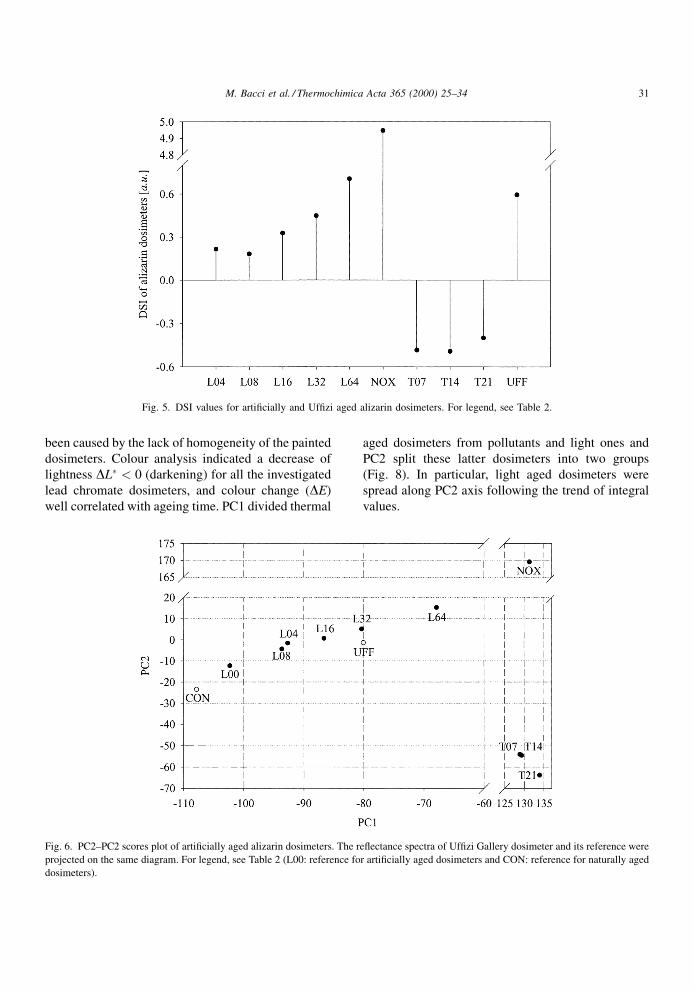
DSI (Fig. 5) showed that alizarin dosimeter was
extremely sensitive to pollutants. The effect of light
and pollutants ageing factors produced an increase of
re¯ectance. On the other hand, the spectra of thermal
aged alizarin sensors had a re¯ectance lower than
reference spectrum and the changes due to this ageing
factor seemed to be saturated after 7 days exposure
time. The same conclusions were derived from the
colorimetric analysis: the alizarin dosimeters were
very sensitive to the pollutant ageing (DE � 36:6)
and sensitive to the light ageing (DE � 8:9). The main
contribution to DE was given by Db�, which was
linked to a relevant increase in re¯ectance in the
500±700 nm range. This increase produced a shift
in the colour evaluation, compared with the reference
strip, towards reddish-yellow hue.
From the PC1±PC2 scores plot (99.9% of total vari-
ance), three groups corresponding to the three diffe-
rent ageing conditions were clearly separated (Fig. 6).
3.3. Lead chromate pigmented tempera
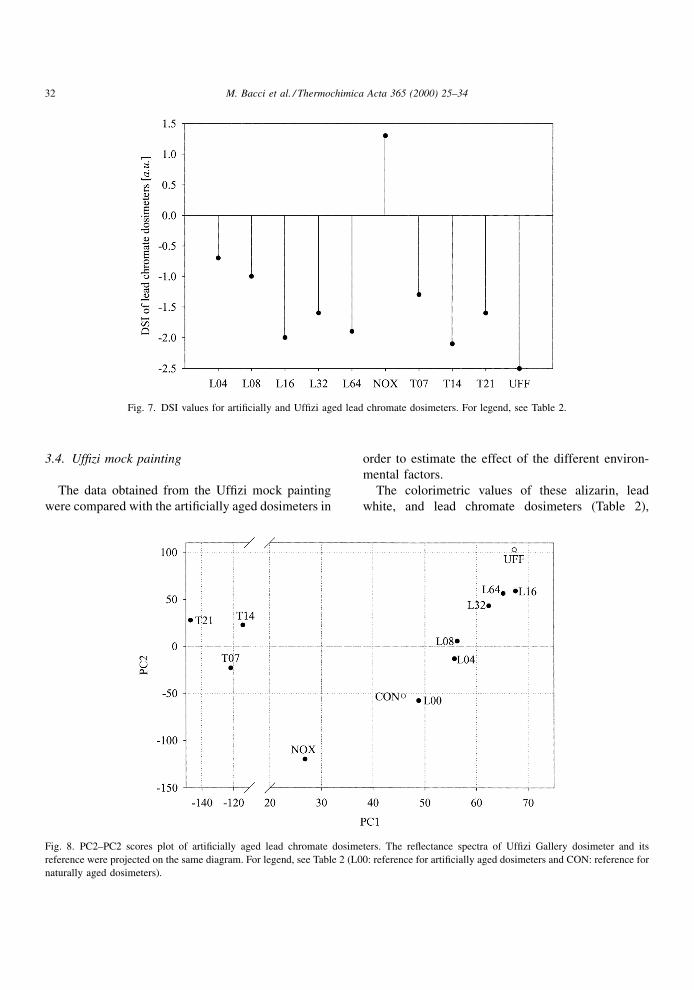
The DSI values (Fig. 7) indicated that light and
thermal ageing played a different role from pollutants
in the alteration process of lead chromate dosimeters.
In fact, the spectral modi®cation induced by light and
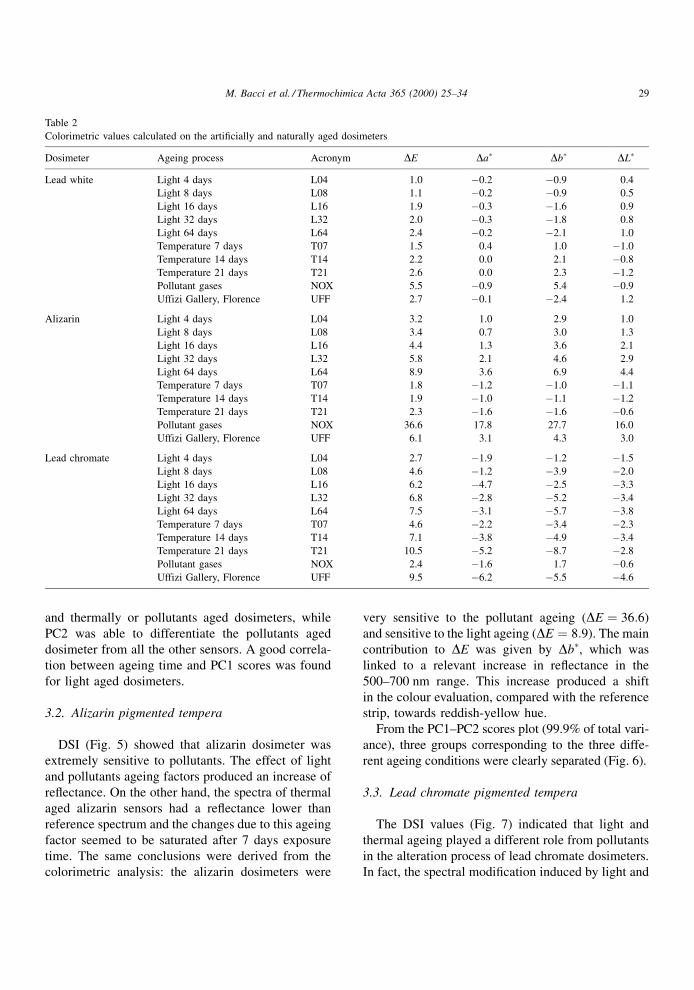
Table 2
Colorimetric values calculated on the arti®cially and naturally aged dosimeters
Dosimeter Ageing process Acronym DE Da� Db� DL�
Lead white Light 4 days L04 1.0 ÿ0.2 ÿ0.9 0.4
Light 8 days L08 1.1 ÿ0.2 ÿ0.9 0.5
Light 16 days L16 1.9 ÿ0.3 ÿ1.6 0.9
Light 32 days L32 2.0 ÿ0.3 ÿ1.8 0.8
Light 64 days L64 2.4 ÿ0.2 ÿ2.1 1.0
Temperature 7 days T07 1.5 0.4 1.0 ÿ1.0
Temperature 14 days T14 2.2 0.0 2.1 ÿ0.8
Temperature 21 days T21 2.6 0.0 2.3 ÿ1.2
Pollutant gases NOX 5.5 ÿ0.9 5.4 ÿ0.9
Uffizi Gallery, Florence UFF 2.7 ÿ0.1 ÿ2.4 1.2
Alizarin Light 4 days L04 3.2 1.0 2.9 1.0
Light 8 days L08 3.4 0.7 3.0 1.3
Light 16 days L16 4.4 1.3 3.6 2.1
Light 32 days L32 5.8 2.1 4.6 2.9
Light 64 days L64 8.9 3.6 6.9 4.4
Temperature 7 days T07 1.8 ÿ1.2 ÿ1.0 ÿ1.1
Temperature 14 days T14 1.9 ÿ1.0 ÿ1.1 ÿ1.2
Temperature 21 days T21 2.3 ÿ1.6 ÿ1.6 ÿ0.6
Pollutant gases NOX 36.6 17.8 27.7 16.0
Uffizi Gallery, Florence UFF 6.1 3.1 4.3 3.0
Lead chromate Light 4 days L04 2.7 ÿ1.9 ÿ1.2 ÿ1.5
Light 8 days L08 4.6 ÿ1.2 ÿ3.9 ÿ2.0
Light 16 days L16 6.2 ÿ4.7 ÿ2.5 ÿ3.3
Light 32 days L32 6.8 ÿ2.8 ÿ5.2 ÿ3.4
Light 64 days L64 7.5 ÿ3.1 ÿ5.7 ÿ3.8
Temperature 7 days T07 4.6 ÿ2.2 ÿ3.4 ÿ2.3
Temperature 14 days T14 7.1 ÿ3.8 ÿ4.9 ÿ3.4
Temperature 21 days T21 10.5 ÿ5.2 ÿ8.7 ÿ2.8
Pollutant gases NOX 2.4 ÿ1.6 1.7 ÿ0.6
Uffizi Gallery, Florence UFF 9.5 ÿ6.2 ÿ5.5 ÿ4.6
M. Bacci et al. / Thermochimica Acta 365 (2000) 25±34 29
thermal ageing gave a decrease of re¯ectance (in the
360±830 nm range) in respect to the reference spec-
trum, while pollutants produced a re¯ectance increase.
Fig. 7 displays that 32 days light aged and 21 days
thermal aged sensors showed a change smaller than 16
days light and 14 days thermal aged sensors, respec-
tively. The fact that light aged DSI values were not in
perfect accordance with the time exposure might have
Fig. 3. DSI values for arti®cially and Uf®zi aged lead white dosimeters. For legend, see Table 2.
Fig. 4. PC2±PC2 scores plot of arti®cially aged lead white dosimeters. The re¯ectance spectra of Uf®zi Gallery dosimeter and its reference
were projected on the same diagram. For legend, see Table 2 (L00: reference for arti®cially aged dosimeters and CON: reference for naturally
aged dosimeters).
30 M. Bacci et al. / Thermochimica Acta 365 (2000) 25±34
been caused by the lack of homogeneity of the painted
dosimeters. Colour analysis indicated a decrease of
lightness DL� < 0 (darkening) for all the investigated
lead chromate dosimeters, and colour change (DE)
well correlated with ageing time. PC1 divided thermal
aged dosimeters from pollutants and light ones and
PC2 split these latter dosimeters into two groups
(Fig. 8). In particular, light aged dosimeters were
spread along PC2 axis following the trend of integral
values.
Fig. 5. DSI values for arti®cially and Uf®zi aged alizarin dosimeters. For legend, see Table 2.
Fig. 6. PC2±PC2 scores plot of arti®cially aged alizarin dosimeters. The re¯ectance spectra of Uf®zi Gallery dosimeter and its reference were
projected on the same diagram. For legend, see Table 2 (L00: reference for arti®cially aged dosimeters and CON: reference for naturally aged
dosimeters).
M. Bacci et al. / Thermochimica Acta 365 (2000) 25±34 31
3.4. Uf®zi mock painting
The data obtained from the Uf®zi mock painting
were compared with the arti®cially aged dosimeters in
order to estimate the effect of the different environ-
mental factors.
The colorimetric values of these alizarin, lead
white, and lead chromate dosimeters (Table 2),
Fig. 7. DSI values for arti®cially and Uf®zi aged lead chromate dosimeters. For legend, see Table 2.
Fig. 8. PC2±PC2 scores plot of arti®cially aged lead chromate dosimeters. The re¯ectance spectra of Uf®zi Gallery dosimeter and its
reference were projected on the same diagram. For legend, see Table 2 (L00: reference for arti®cially aged dosimeters and CON: reference for
naturally aged dosimeters).
32 M. Bacci et al. / Thermochimica Acta 365 (2000) 25±34
denoted that the environment within the Gallery did
affect the dosimeter during the 9-month exposure. For
the ®rst two dosimeters (alizarin and lead white) Da�,Db�, and DL� showed a trend which excluded an
effective role in the ®nal colour variation played by
the thermal-ageing process. Thus, light alone or
together with pollutants seemed to be the main factor
that induced colour alteration of the mock painting in
the Uf®zi Gallery.
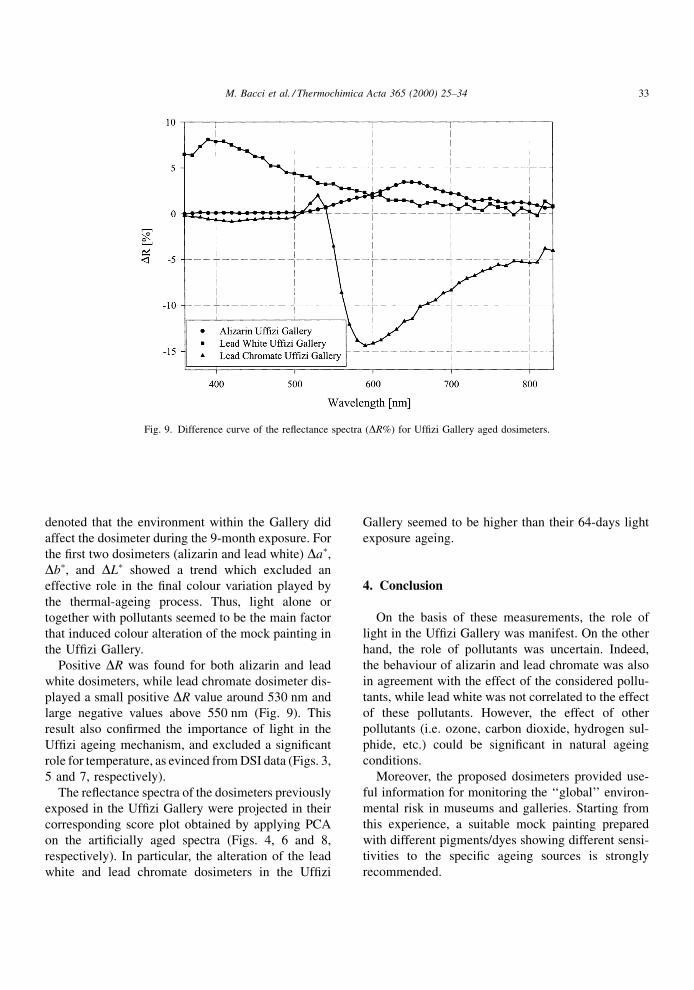
Positive DR was found for both alizarin and lead
white dosimeters, while lead chromate dosimeter dis-
played a small positive DR value around 530 nm and
large negative values above 550 nm (Fig. 9). This
result also con®rmed the importance of light in the
Uf®zi ageing mechanism, and excluded a signi®cant
role for temperature, as evinced from DSI data (Figs. 3,
5 and 7, respectively).
The re¯ectance spectra of the dosimeters previously
exposed in the Uf®zi Gallery were projected in their
corresponding score plot obtained by applying PCA
on the arti®cially aged spectra (Figs. 4, 6 and 8,
respectively). In particular, the alteration of the lead
white and lead chromate dosimeters in the Uf®zi
Gallery seemed to be higher than their 64-days light
exposure ageing.
4. Conclusion
On the basis of these measurements, the role of
light in the Uf®zi Gallery was manifest. On the other
hand, the role of pollutants was uncertain. Indeed,
the behaviour of alizarin and lead chromate was also
in agreement with the effect of the considered pollu-
tants, while lead white was not correlated to the effect
of these pollutants. However, the effect of other
pollutants (i.e. ozone, carbon dioxide, hydrogen sul-
phide, etc.) could be signi®cant in natural ageing
conditions.
Moreover, the proposed dosimeters provided use-
ful information for monitoring the `̀ global'' environ-
mental risk in museums and galleries. Starting from
this experience, a suitable mock painting prepared
with different pigments/dyes showing different sensi-
tivities to the speci®c ageing sources is strongly
recommended.
Fig. 9. Difference curve of the re¯ectance spectra (DR%) for Uf®zi Gallery aged dosimeters.
M. Bacci et al. / Thermochimica Acta 365 (2000) 25±34 33
Lastly, it must be stressed that, owing to the actual
nature of the dosimeters, the observed damage, though
ampli®ed, is very close to that suffered by the paint-
ings on exhibit.
Acknowledgements
This research was supported by the EC Project
Environmental Research for Art Conservation
(ERA, Contract No. EV5V CT 94 0548) and, partially,
by the Progetto Finalizzato `̀ Beni Culturali'' of the
National Research Council of Italy. The authors wish
to thank Dr. Marianne Odlyha (Birkbeck College,
London), Prof. Jaap Boon and Dr. Oscar van den
Brink (FOM Institute, Amsterdam) for providing them
with the arti®cially aged samples. They are also grate-
ful to the staff of the Tate Gallery (London) and of the
TNO (Delf) for having performed the ageing test, and
to Mr. Bellucci of the Opi®cio delle Pietre Dure
(Florence) for having prepared the tempera-samples.
Lastly, the authors are particularly grateful to
Drs. O. Casazza and A.M. Petrioli, who made possible
the investigation inside the Uf®zi Gallery.
References
[1] G. Thomson, The Museum Environment, 2nd Edition,
Butterworths/Heinemann, Oxford, 1986.
[2] C.L. Shaver, G.R. Cass, Environ. Sci. Technol. 17 (1983)
748.
[3] D. Grosjean, P.M. Whitmore, C.P. De Moor, G.R. Cass,
Environ. Sci. Technol. 21 (1987) 635.
[4] D. Grosjean, L.G. Salmon, G.R. Cass, Environ. Sci. Technol.
26 (1992) 952.
[5] F. De Santis, V. Di Palo, I. Allegrini, Sci. Total Environ. 127
(1992) 211.
[6] D. Saunders, J. Kirby, Preprints of the Contributions to the
Ottawa Congress of the International Institute for Conserva-
tion of Historic and Artistic Works (IIC), Vol. 190, 1994.
[7] D. Saunders, J. Kirby, Preprints of the 11th Triennial Meeting
in Edinburgh of ICOM-CC Committee for Conservation, Vol.
87, 1996.
[8] G. Wyszecki, W.S. Stiles, Color Science: Concepts and
Methods, Quantitative Data and Formulae, Wiley, New York,
1982.
34 M. Bacci et al. / Thermochimica Acta 365 (2000) 25±34