Embed Size (px)
Citation preview
Available free online at www.medjchem.com
Mediterranean Journal of Chemistry 2018, 7(4), 272-285
*Corresponding author: Abdallah Hadfi Received August 18, 2018
Email address: [email protected] Accepted October 10, 2018
DOI: http://dx.doi.org/10.13171/mjc74181121-hadfi Published November 21, 2018
Evaluation of the irrigation water quality in Biougra circle along
with highlighting the effectiveness of a scaling inhibitor
Abdallah Hadfi *, Said Ben Aazza, M’barek Belattar, Said Mohareb and Ali Driouiche
Team “Materials and Physical Chemistry of Water”, Laboratory of Process Engineering, Faculty of Sciences,
Ibn Zohr University, Agadir, Morocco
Abstract: Localized irrigation is characterized by localized frequent and continuous water supply. It ensures the
efficient use of water. However, this fertigation system suffers from the problem of clogging of the distributors.
The present study aims to study the physico-chemical quality of the water of irrigation within the Biougra circle;
analyze of the type of scale deposited in the water pipes and the highlight of the effectiveness of an inhibitor of
calcium carbonate precipitation. This study was carried out at a temperature of 25°C, using the technical
"LCGE". Indeed, the classification of irrigation water, according to Piper, revealed that the analyzed waters are
characterized by calcium and magnesium bicarbonate facies with a slight tendency to migrate to the calcium and
magnesium chloride and sulfate facies. The characterization of the scale collected in the irrigation water pipes of
Biougra circle by X-ray fluorescence, X-ray diffraction and thermal analysis (ATD-ATG) made it possible to
prove that the scale is mainly formed of calcium carbonate with calcite variety. The inhibition of calcium
carbonate precipitation by a food inhibitor was obtained with a concentration of 0.6 mg/L.
Keywords: Scale; localized irrigation; water; physico-chemical quality; calcium carbonate.
Introduction
Chtouka Plain is characterized by a particularly
well-developed agricultural activity and even
constitutes the first primeurist region of Morocco.
The high level and quality of modern agriculture in
this region ensure its growing importance
worldwide. It is export-oriented agriculture.
The intense agricultural activities in this area
require considerable water resources given the semi-
arid to a sub-desert climate that characterizes the
area. It is a climate that promotes agricultural
development in the region, but that requires
substantial water resources. Today, this area suffers
from a recurrent lack of water and from over-
exploited groundwater which reaches its limits. The
available data shows that the pressure on aquifers to
meet the agricultural needs of water in this region
has involved a shortage of water resources of about
270 million cubic meters per year. This increased
shortage of groundwater resources year after year. It
has also led to a serious deterioration of the aquifer.
In some areas, there is a total depletion of the
aquifer 1.
Aware of this situation, Morocco launched the
National Program of Water Economy in Irrigation
(NPWE-II). It focuses on two components:
economizing and valuing the water of irrigation and
aims at the conversion of the existing (traditional)
irrigation systems in localized irrigation systems 2.
Micro-irrigation or localized irrigation is done
drop-by-drop. It is a very economical technique since
it consumes only what the plant needs. Indeed, the
water is channelled to the root of the plant. It is
appropriate for most of the agricultural cultures.
However, this irrigation system faces the
drippers clogging problem. Indeed, clogging leads to
poor water distribution in the soil, which directly
affects the growth and development of plants 3.
According to studies conducted in Morocco, more
than 80 % of micro-irrigated farms suffer from this
problem 4.
Considering the major problems caused by scale
formation in irrigation water pipes and the absence
of relevant studies on fertigation systems, the
importance of this study is obvious. This research
has three objectives: studying of the physico-
chemical quality of the irrigation water of this
region; analyzing the type of scale formed in water
pipes and highlighting the efficiency of an inhibitor
of calcium carbonate precipitation using the
controlled degassing technique known as
"LCGE" 5-8.
The studied inhibitor is a food product phosphate
based. Indeed, phosphate-containing additives have
Mediterr.J.Chem., 2018, 7(4) A. Hadfi et al. 273
been used in water treatment practice for several
decades. The main purposes of using these chemicals
are to control pipe corrosion and inhibit calcium
carbonate scale formation 9.
Recent surveys indicate that more than half of
the water treatment utilities in the United States have
adopted the use of phosphate-containing additives 10,11. These additives include orthophosphate, zinc
orthophosphate, polyphosphate and various
phosphate blends 11. The use of phosphate-containing
additives also prevents the deposition of calcium
carbonate scale on pipe walls in the distribution
system, in boilers, and hot water lines by
sequestering calcium and inhibiting calcium
carbonate (calcite) precipitation, even under
conditions of calcite oversaturation.
Presentation of the study area
The geographical situation
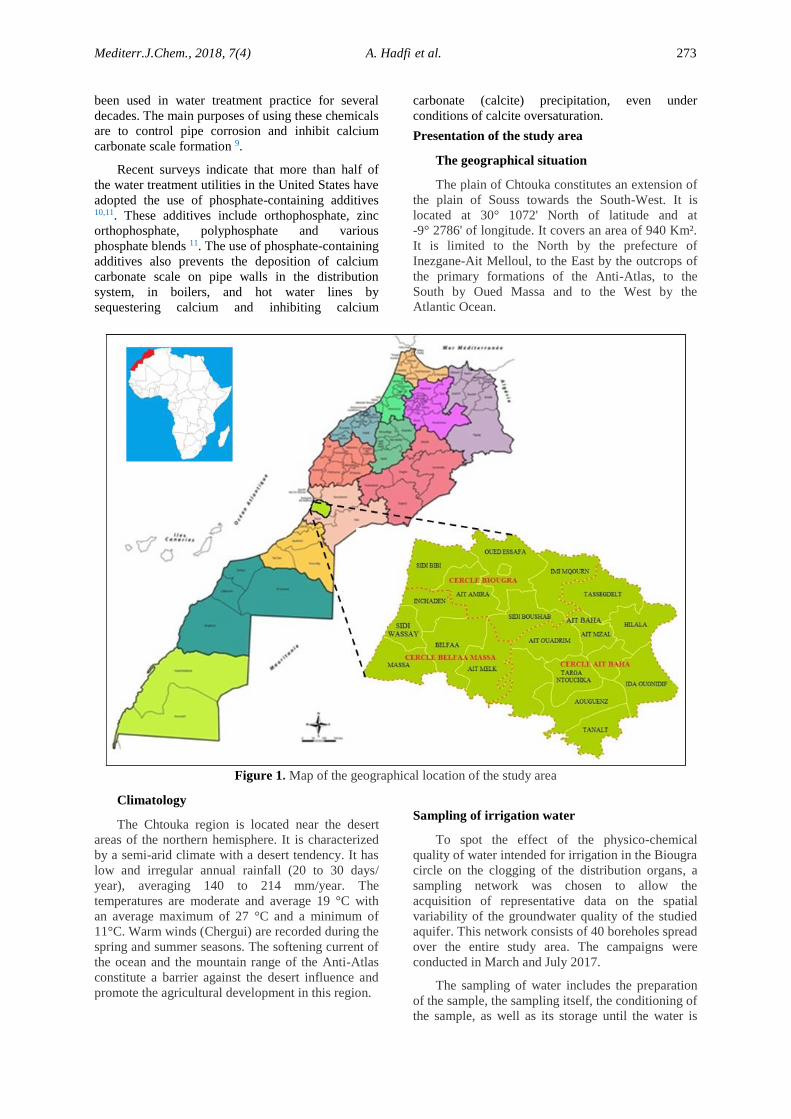
The plain of Chtouka constitutes an extension of
the plain of Souss towards the South-West. It is
located at 30° 1072' North of latitude and at
-9° 2786' of longitude. It covers an area of 940 Km².
It is limited to the North by the prefecture of
Inezgane-Ait Melloul, to the East by the outcrops of
the primary formations of the Anti-Atlas, to the
South by Oued Massa and to the West by the
Atlantic Ocean.
Figure 1. Map of the geographical location of the study area
Climatology
The Chtouka region is located near the desert
areas of the northern hemisphere. It is characterized
by a semi-arid climate with a desert tendency. It has
low and irregular annual rainfall (20 to 30 days/
year), averaging 140 to 214 mm/year. The
temperatures are moderate and average 19 °C with
an average maximum of 27 °C and a minimum of
11°C. Warm winds (Chergui) are recorded during the
spring and summer seasons. The softening current of
the ocean and the mountain range of the Anti-Atlas
constitute a barrier against the desert influence and
promote the agricultural development in this region.
Sampling of irrigation water
To spot the effect of the physico-chemical
quality of water intended for irrigation in the Biougra
circle on the clogging of the distribution organs, a
sampling network was chosen to allow the
acquisition of representative data on the spatial
variability of the groundwater quality of the studied
aquifer. This network consists of 40 boreholes spread
over the entire study area. The campaigns were
conducted in March and July 2017.
The sampling of water includes the preparation
of the sample, the sampling itself, the conditioning of
the sample, as well as its storage until the water is
Mediterr.J.Chem., 2018, 7(4) A. Hadfi et al. 274
analyzed. Each of these steps is important to
guarantee the reliability of the analysis results.
Sampling area
Given a large number of boreholes in the study
area, and faced with the impossibility of analyzing
the water from all these boreholes, we proceeded to
the selection of 40 boreholes uniformly distributed
throughout the circle of Biougra.
Selection of sampling points
For good representativeness of samples, we
chose the sampling boreholes according to the
following criteria:
- Good spatial distribution of boreholes
- Water use for irrigation
- Accessibility of the water points to be sampled.
Execution of samples
After the choice of sampling points, it is
necessary to open the valve sufficiently to renew the
water contained in the piping until it becomes
representative of the aquifer portion to be sampled.
To disinfect the valve, it must be passed under a
flame.
The water samples must be taken in clean
bottles, rinsed with distilled water and then with the
water to be analyzed. After the samples have been
bottled, the bottles must be hermetically sealed
without leaving air bubbles in the bottle.
The bottles must be identified with labels
indicating the sample number.
Storage of samples
All waters are likely to change more or less
rapidly as a result of physical, chemical or biological
reactions that may occur in the bottle in the lapse of
time between sampling and analysis.
For that, samples must be brought to the
laboratory as soon as possible (less than 24 hours).
The temperature of the sample must never exceed
that of the groundwater sampled. The bottles should
be stored in a cool and away from light (cooler or
refrigerator). In the laboratory, samples should be
stored in a refrigerator between 3 and 5 °C 12.
Physico-chemical analyses
The field-measurements include electrical
conductivity (EC), pH and temperature. The
chemical analyses carried out in our laboratory
concern: Cations: Ca2+, Mg2+, Na+ and K+, Anions:
Cl-, SO42-, HCO3
-, CO32- and NO3
- and the dry
residue (DR).
The results of chemical analyses of water must
imperatively be subjected to a validity test which
consists of the calculation of the ionic balance. This
parameter is used to verify the accuracy of the
analytical methods used and the validity of chemical
determinations. If it is less than 5 % the analyses are
considered as correct when its value is between 5 %
and 10 %; the analyses can be rigorously retained.
However, above 10 % the analyses must be
repeated 13.
Results and Discussion
The analysis results of irrigation water
The aim of this hydrochemical study is to
determine the physico-chemical characteristics of
water and dissolved elements in order to determine
their origins, to define the chemical facies of
groundwater, to compare them and to follow their
evolution in space.
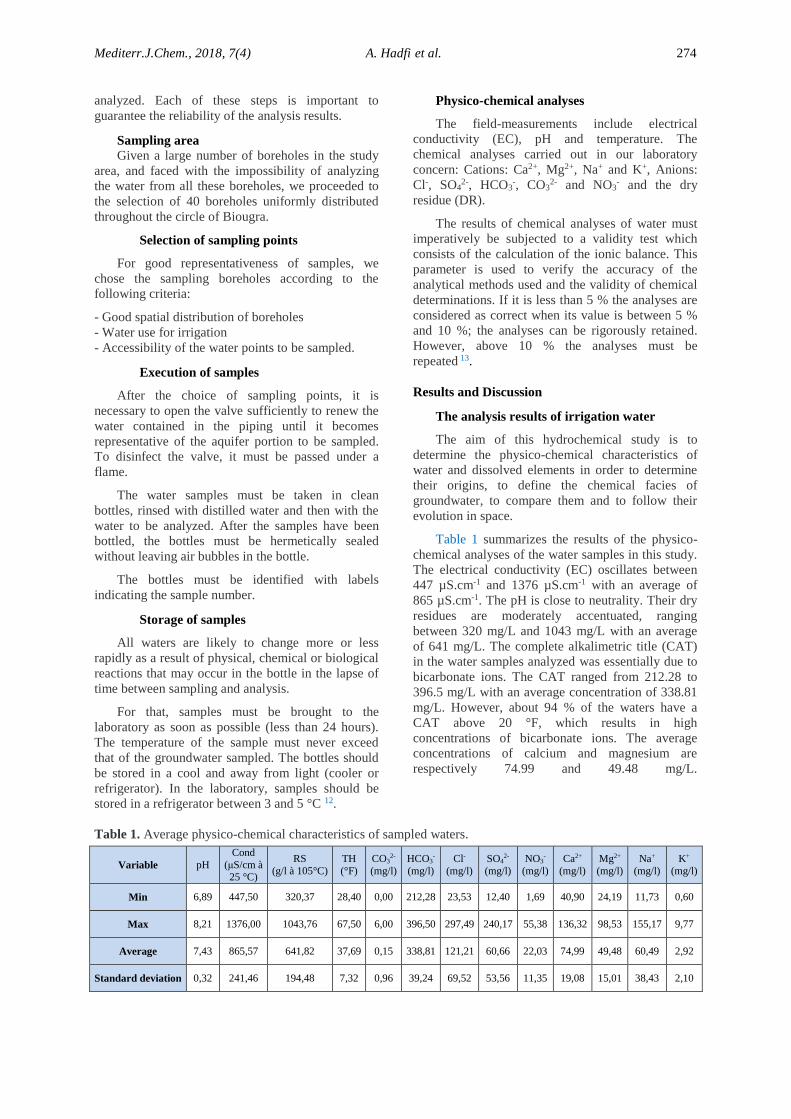
Table 1 summarizes the results of the physico-
chemical analyses of the water samples in this study.
The electrical conductivity (EC) oscillates between
447 µS.cm-1 and 1376 µS.cm-1 with an average of
865 µS.cm-1. The pH is close to neutrality. Their dry
residues are moderately accentuated, ranging
between 320 mg/L and 1043 mg/L with an average
of 641 mg/L. The complete alkalimetric title (CAT)
in the water samples analyzed was essentially due to
bicarbonate ions. The CAT ranged from 212.28 to
396.5 mg/L with an average concentration of 338.81
mg/L. However, about 94 % of the waters have a
CAT above 20 °F, which results in high
concentrations of bicarbonate ions. The average
concentrations of calcium and magnesium are
respectively 74.99 and 49.48 mg/L.
Table 1. Average physico-chemical characteristics of sampled waters.
Variable pH
Cond
(μS/cm à 25 °C)
RS
(g/l à 105°C)
TH
(°F)
CO32-
(mg/l)
HCO3-
(mg/l)
Cl-
(mg/l)
SO42-
(mg/l)
NO3-
(mg/l)
Ca2+
(mg/l)
Mg2+
(mg/l)
Na+
(mg/l)
K+
(mg/l)
Min 6,89 447,50 320,37 28,40 0,00 212,28 23,53 12,40 1,69 40,90 24,19 11,73 0,60
Max 8,21 1376,00 1043,76 67,50 6,00 396,50 297,49 240,17 55,38 136,32 98,53 155,17 9,77
Average 7,43 865,57 641,82 37,69 0,15 338,81 121,21 60,66 22,03 74,99 49,48 60,49 2,92
Standard deviation 0,32 241,46 194,48 7,32 0,96 39,24 69,52 53,56 11,35 19,08 15,01 38,43 2,10
Mediterr.J.Chem., 2018, 7(4) A. Hadfi et al. 275
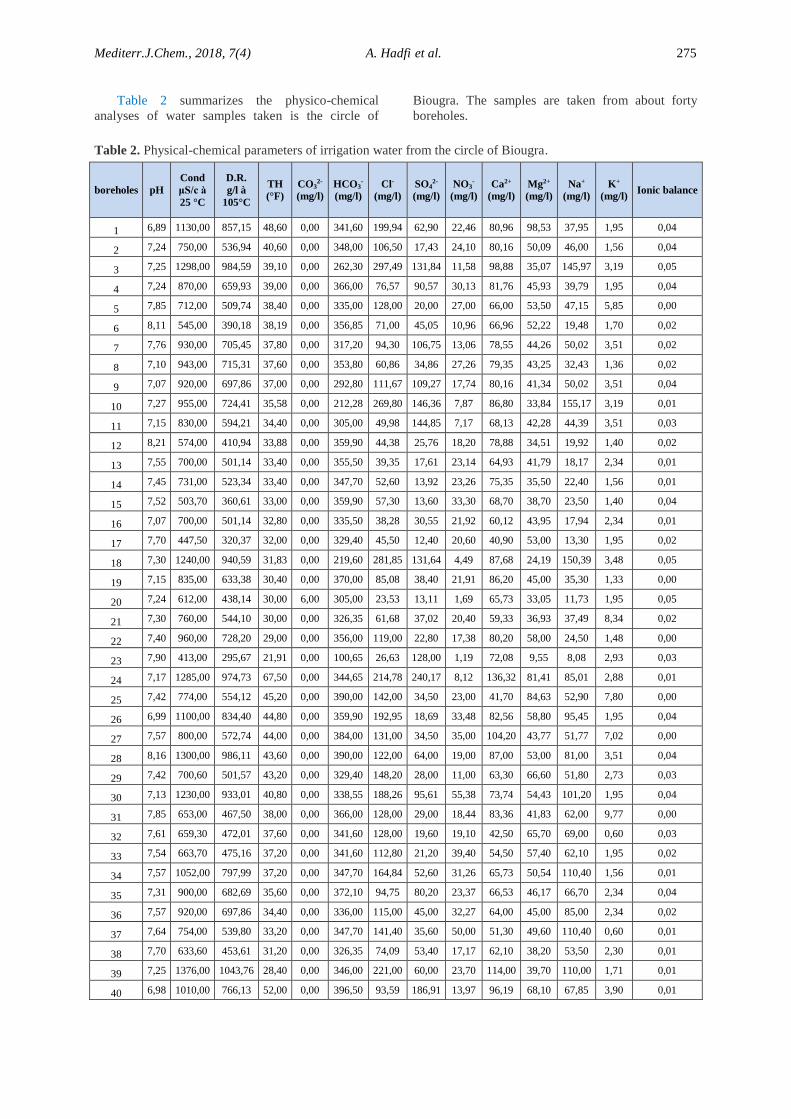
Table 2 summarizes the physico-chemical
analyses of water samples taken is the circle of
Biougra. The samples are taken from about forty
boreholes.
Table 2. Physical-chemical parameters of irrigation water from the circle of Biougra.
boreholes pH
Cond
μS/c à
25 °C
D.R.
g/l à
105°C
TH
(°F)
CO32-
(mg/l)
HCO3-
(mg/l)
Cl-
(mg/l)
SO42-
(mg/l)
NO3-
(mg/l)
Ca2+
(mg/l)
Mg2+
(mg/l)
Na+
(mg/l)
K+
(mg/l) Ionic balance
1 6,89 1130,00 857,15 48,60 0,00 341,60 199,94 62,90 22,46 80,96 98,53 37,95 1,95 0,04
2 7,24 750,00 536,94 40,60 0,00 348,00 106,50 17,43 24,10 80,16 50,09 46,00 1,56 0,04
3 7,25 1298,00 984,59 39,10 0,00 262,30 297,49 131,84 11,58 98,88 35,07 145,97 3,19 0,05
4 7,24 870,00 659,93 39,00 0,00 366,00 76,57 90,57 30,13 81,76 45,93 39,79 1,95 0,04
5 7,85 712,00 509,74 38,40 0,00 335,00 128,00 20,00 27,00 66,00 53,50 47,15 5,85 0,00
6 8,11 545,00 390,18 38,19 0,00 356,85 71,00 45,05 10,96 66,96 52,22 19,48 1,70 0,02
7 7,76 930,00 705,45 37,80 0,00 317,20 94,30 106,75 13,06 78,55 44,26 50,02 3,51 0,02
8 7,10 943,00 715,31 37,60 0,00 353,80 60,86 34,86 27,26 79,35 43,25 32,43 1,36 0,02
9 7,07 920,00 697,86 37,00 0,00 292,80 111,67 109,27 17,74 80,16 41,34 50,02 3,51 0,04
10 7,27 955,00 724,41 35,58 0,00 212,28 269,80 146,36 7,87 86,80 33,84 155,17 3,19 0,01
11 7,15 830,00 594,21 34,40 0,00 305,00 49,98 144,85 7,17 68,13 42,28 44,39 3,51 0,03
12 8,21 574,00 410,94 33,88 0,00 359,90 44,38 25,76 18,20 78,88 34,51 19,92 1,40 0,02
13 7,55 700,00 501,14 33,40 0,00 355,50 39,35 17,61 23,14 64,93 41,79 18,17 2,34 0,01
14 7,45 731,00 523,34 33,40 0,00 347,70 52,60 13,92 23,26 75,35 35,50 22,40 1,56 0,01
15 7,52 503,70 360,61 33,00 0,00 359,90 57,30 13,60 33,30 68,70 38,70 23,50 1,40 0,04
16 7,07 700,00 501,14 32,80 0,00 335,50 38,28 30,55 21,92 60,12 43,95 17,94 2,34 0,01
17 7,70 447,50 320,37 32,00 0,00 329,40 45,50 12,40 20,60 40,90 53,00 13,30 1,95 0,02
18 7,30 1240,00 940,59 31,83 0,00 219,60 281,85 131,64 4,49 87,68 24,19 150,39 3,48 0,05
19 7,15 835,00 633,38 30,40 0,00 370,00 85,08 38,40 21,91 86,20 45,00 35,30 1,33 0,00
20 7,24 612,00 438,14 30,00 6,00 305,00 23,53 13,11 1,69 65,73 33,05 11,73 1,95 0,05
21 7,30 760,00 544,10 30,00 0,00 326,35 61,68 37,02 20,40 59,33 36,93 37,49 8,34 0,02
22 7,40 960,00 728,20 29,00 0,00 356,00 119,00 22,80 17,38 80,20 58,00 24,50 1,48 0,00
23 7,90 413,00 295,67 21,91 0,00 100,65 26,63 128,00 1,19 72,08 9,55 8,08 2,93 0,03
24 7,17 1285,00 974,73 67,50 0,00 344,65 214,78 240,17 8,12 136,32 81,41 85,01 2,88 0,01
25 7,42 774,00 554,12 45,20 0,00 390,00 142,00 34,50 23,00 41,70 84,63 52,90 7,80 0,00
26 6,99 1100,00 834,40 44,80 0,00 359,90 192,95 18,69 33,48 82,56 58,80 95,45 1,95 0,04
27 7,57 800,00 572,74 44,00 0,00 384,00 131,00 34,50 35,00 104,20 43,77 51,77 7,02 0,00
28 8,16 1300,00 986,11 43,60 0,00 390,00 122,00 64,00 19,00 87,00 53,00 81,00 3,51 0,04
29 7,42 700,60 501,57 43,20 0,00 329,40 148,20 28,00 11,00 63,30 66,60 51,80 2,73 0,03
30 7,13 1230,00 933,01 40,80 0,00 338,55 188,26 95,61 55,38 73,74 54,43 101,20 1,95 0,04
31 7,85 653,00 467,50 38,00 0,00 366,00 128,00 29,00 18,44 83,36 41,83 62,00 9,77 0,00
32 7,61 659,30 472,01 37,60 0,00 341,60 128,00 19,60 19,10 42,50 65,70 69,00 0,60 0,03
33 7,54 663,70 475,16 37,20 0,00 341,60 112,80 21,20 39,40 54,50 57,40 62,10 1,95 0,02
34 7,57 1052,00 797,99 37,20 0,00 347,70 164,84 52,60 31,26 65,73 50,54 110,40 1,56 0,01
35 7,31 900,00 682,69 35,60 0,00 372,10 94,75 80,20 23,37 66,53 46,17 66,70 2,34 0,04
36 7,57 920,00 697,86 34,40 0,00 336,00 115,00 45,00 32,27 64,00 45,00 85,00 2,34 0,02
37 7,64 754,00 539,80 33,20 0,00 347,70 141,40 35,60 50,00 51,30 49,60 110,40 0,60 0,01
38 7,70 633,60 453,61 31,20 0,00 326,35 74,09 53,40 17,17 62,10 38,20 53,50 2,30 0,01
39 7,25 1376,00 1043,76 28,40 0,00 346,00 221,00 60,00 23,70 114,00 39,70 110,00 1,71 0,01
40 6,98 1010,00 766,13 52,00 0,00 396,50 93,59 186,91 13,97 96,19 68,10 67,85 3,90 0,01
Mediterr.J.Chem., 2018, 7(4) A. Hadfi et al. 276
Groundwater classification according to
PIPER
We used Avignon's hydrochemistry software
(version 6.51), which allowed us to determine the
chemical facies of the irrigation water, and in
particular to construct the Piper diagram. This
diagram has been used by several authors for data
processing and has given satisfactory results 14-16.
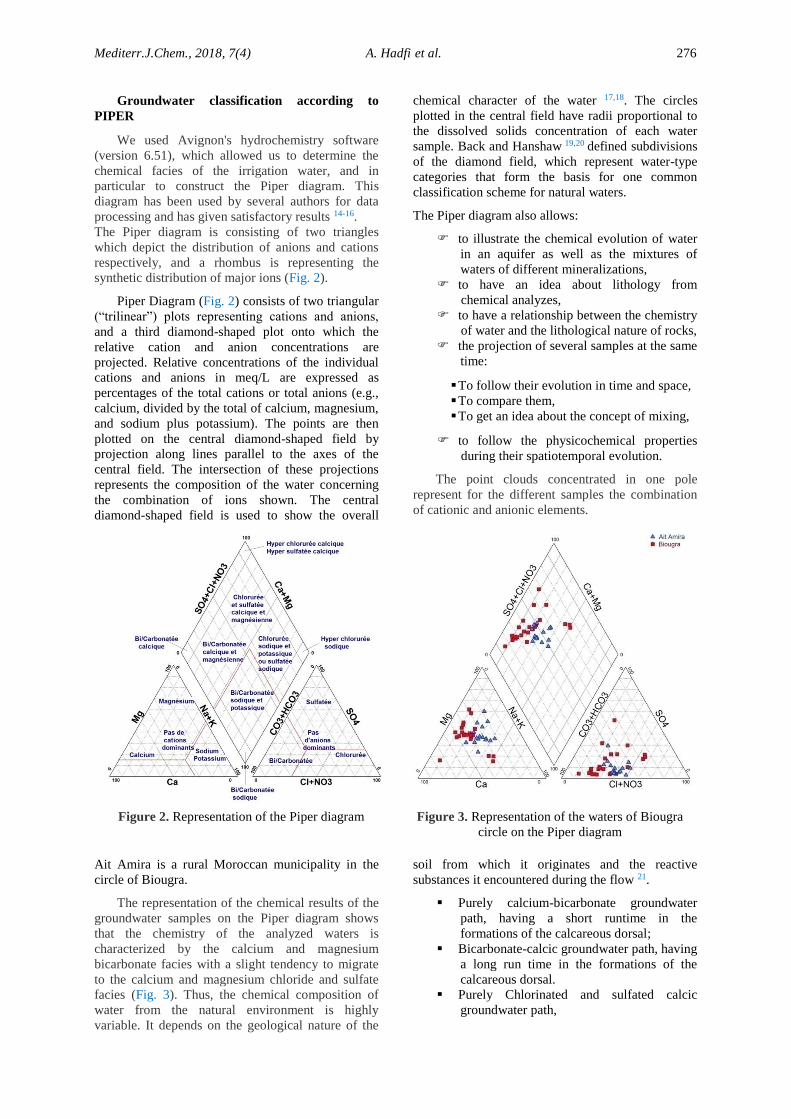
The Piper diagram is consisting of two triangles
which depict the distribution of anions and cations
respectively, and a rhombus is representing the
synthetic distribution of major ions (Fig. 2).
Piper Diagram (Fig. 2) consists of two triangular
(“trilinear”) plots representing cations and anions,
and a third diamond-shaped plot onto which the
relative cation and anion concentrations are
projected. Relative concentrations of the individual
cations and anions in meq/L are expressed as
percentages of the total cations or total anions (e.g.,
calcium, divided by the total of calcium, magnesium,
and sodium plus potassium). The points are then
plotted on the central diamond-shaped field by
projection along lines parallel to the axes of the
central field. The intersection of these projections
represents the composition of the water concerning
the combination of ions shown. The central
diamond-shaped field is used to show the overall
chemical character of the water 17,18. The circles
plotted in the central field have radii proportional to
the dissolved solids concentration of each water
sample. Back and Hanshaw 19,20 defined subdivisions
of the diamond field, which represent water-type
categories that form the basis for one common
classification scheme for natural waters.
The Piper diagram also allows:
to illustrate the chemical evolution of water
in an aquifer as well as the mixtures of
waters of different mineralizations,
to have an idea about lithology from
chemical analyzes,
to have a relationship between the chemistry
of water and the lithological nature of rocks,
the projection of several samples at the same
time:
To follow their evolution in time and space,
To compare them,
To get an idea about the concept of mixing,
to follow the physicochemical properties
during their spatiotemporal evolution.
The point clouds concentrated in one pole
represent for the different samples the combination
of cationic and anionic elements.
Figure 2. Representation of the Piper diagram Figure 3. Representation of the waters of Biougra
circle on the Piper diagram
Ait Amira is a rural Moroccan municipality in the
circle of Biougra.
The representation of the chemical results of the
groundwater samples on the Piper diagram shows
that the chemistry of the analyzed waters is
characterized by the calcium and magnesium
bicarbonate facies with a slight tendency to migrate
to the calcium and magnesium chloride and sulfate
facies (Fig. 3). Thus, the chemical composition of
water from the natural environment is highly
variable. It depends on the geological nature of the
soil from which it originates and the reactive
substances it encountered during the flow 21.
Purely calcium-bicarbonate groundwater
path, having a short runtime in the
formations of the calcareous dorsal;
Bicarbonate-calcic groundwater path, having
a long run time in the formations of the
calcareous dorsal.
Purely Chlorinated and sulfated calcic
groundwater path,
Mediterr.J.Chem., 2018, 7(4) A. Hadfi et al. 277
Chlorinate-calcic groundwater path
influenced by the contact with water with
bicarbonate calcic and magnesian
predominance, revealing a high bicarbonate
rate.
Characterization of scale deposits
X-ray fluorescence, X-ray diffraction and
thermal analysis (DTA/TGA) are used to identify
scale deposits collected on irrigation water pipes in
Biougra Circle.
X-ray fluorescence analysis
Qualitative chemical analysis
For more detailed characterization of the various
scales collected and to highlight elements present in
the trace state, we are led to use the X-ray
fluorescence analysis (Axiosm AX Spectrometer)
which proves to be the best method to use since it is
at the same time sensitive, fast and more or less non-
destructive. Using this technique, the scale
constituents collected in the irrigation water pipes
can be identified.
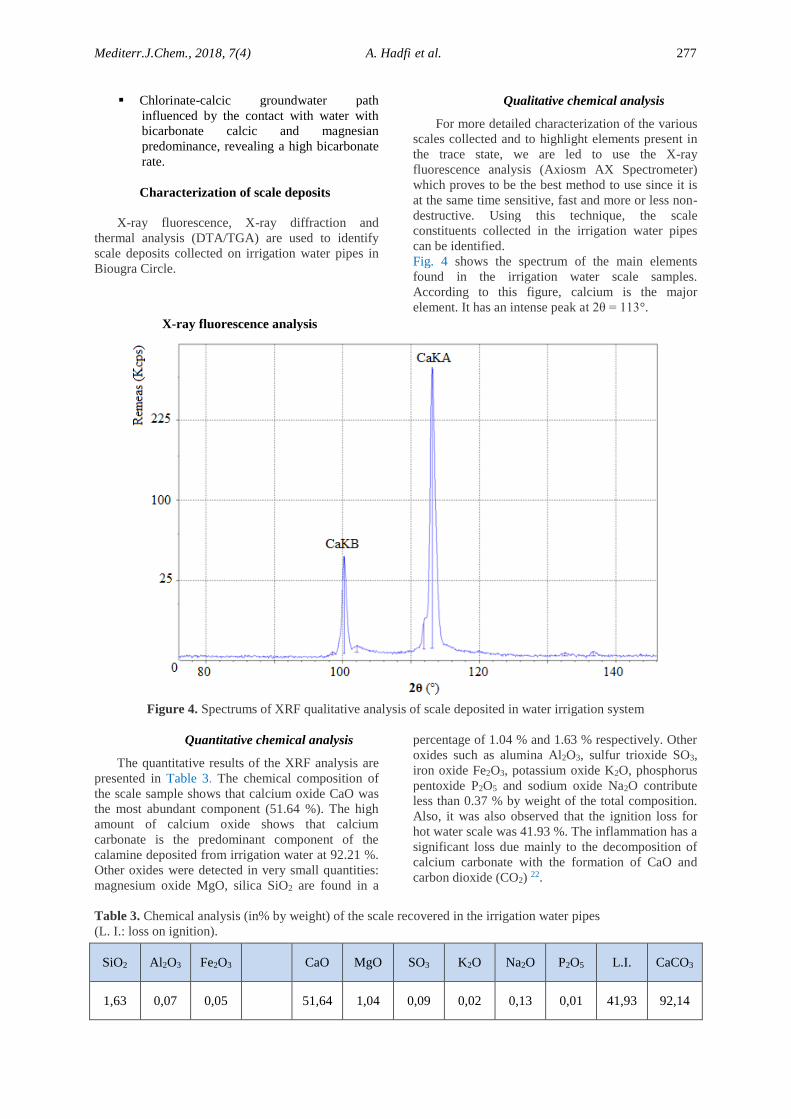
Fig. 4 shows the spectrum of the main elements
found in the irrigation water scale samples.
According to this figure, calcium is the major
element. It has an intense peak at 2θ = 113°.
Figure 4. Spectrums of XRF qualitative analysis of scale deposited in water irrigation system
Quantitative chemical analysis
The quantitative results of the XRF analysis are
presented in Table 3. The chemical composition of
the scale sample shows that calcium oxide CaO was
the most abundant component (51.64 %). The high
amount of calcium oxide shows that calcium
carbonate is the predominant component of the
calamine deposited from irrigation water at 92.21 %.
Other oxides were detected in very small quantities:
magnesium oxide MgO, silica SiO2 are found in a
percentage of 1.04 % and 1.63 % respectively. Other
oxides such as alumina Al2O3, sulfur trioxide SO3,
iron oxide Fe2O3, potassium oxide K2O, phosphorus
pentoxide P2O5 and sodium oxide Na2O contribute
less than 0.37 % by weight of the total composition.
Also, it was also observed that the ignition loss for
hot water scale was 41.93 %. The inflammation has a
significant loss due mainly to the decomposition of
calcium carbonate with the formation of CaO and
carbon dioxide (CO2) 22.
Table 3. Chemical analysis (in% by weight) of the scale recovered in the irrigation water pipes
(L. I.: loss on ignition).
SiO2 Al2O3 Fe2O3
CaO MgO SO3 K2O Na2O P2O5 L.I. CaCO3
1,63 0,07 0,05
51,64 1,04 0,09 0,02 0,13 0,01 41,93 92,14
Mediterr.J.Chem., 2018, 7(4) A. Hadfi et al. 278
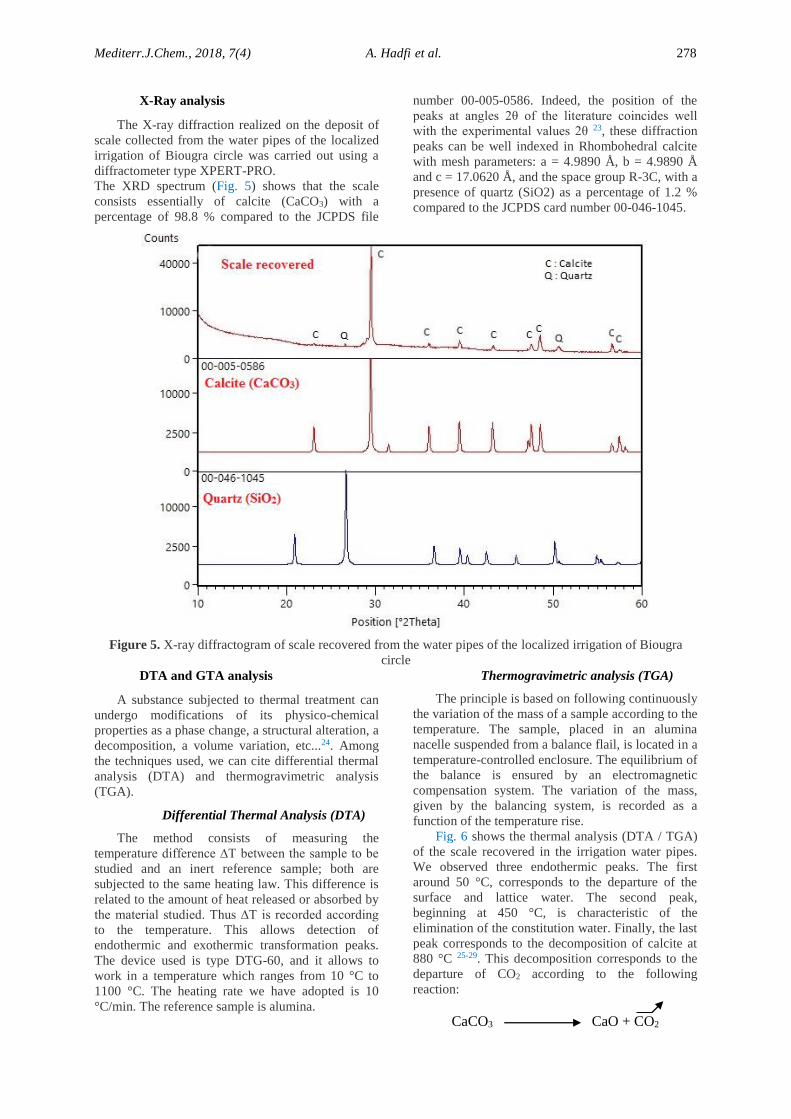
X-Ray analysis
The X-ray diffraction realized on the deposit of
scale collected from the water pipes of the localized
irrigation of Biougra circle was carried out using a
diffractometer type XPERT-PRO.
The XRD spectrum (Fig. 5) shows that the scale
consists essentially of calcite (CaCO3) with a
percentage of 98.8 % compared to the JCPDS file
number 00-005-0586. Indeed, the position of the
peaks at angles 2θ of the literature coincides well
with the experimental values 2θ 23, these diffraction
peaks can be well indexed in Rhombohedral calcite
with mesh parameters: a = 4.9890 Å, b = 4.9890 Å
and c = 17.0620 Å, and the space group R-3C, with a
presence of quartz (SiO2) as a percentage of 1.2 %
compared to the JCPDS card number 00-046-1045.
Figure 5. X-ray diffractogram of scale recovered from the water pipes of the localized irrigation of Biougra
circle
DTA and GTA analysis
A substance subjected to thermal treatment can
undergo modifications of its physico-chemical
properties as a phase change, a structural alteration, a
decomposition, a volume variation, etc...24. Among
the techniques used, we can cite differential thermal
analysis (DTA) and thermogravimetric analysis
(TGA).
Differential Thermal Analysis (DTA)
The method consists of measuring the
temperature difference ∆T between the sample to be
studied and an inert reference sample; both are
subjected to the same heating law. This difference is
related to the amount of heat released or absorbed by
the material studied. Thus ∆T is recorded according
to the temperature. This allows detection of
endothermic and exothermic transformation peaks.
The device used is type DTG-60, and it allows to
work in a temperature which ranges from 10 °C to
1100 °C. The heating rate we have adopted is 10
°C/min. The reference sample is alumina.
Thermogravimetric analysis (TGA)
The principle is based on following continuously
the variation of the mass of a sample according to the
temperature. The sample, placed in an alumina
nacelle suspended from a balance flail, is located in a
temperature-controlled enclosure. The equilibrium of
the balance is ensured by an electromagnetic
compensation system. The variation of the mass,
given by the balancing system, is recorded as a
function of the temperature rise.
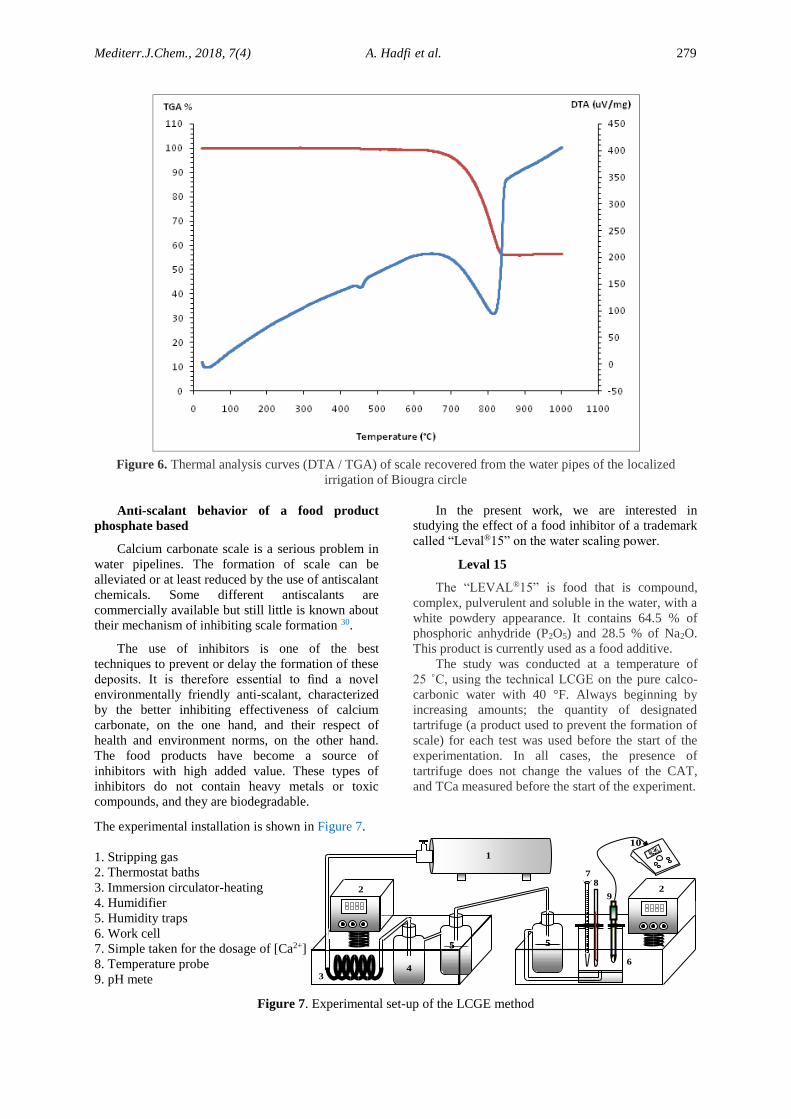
Fig. 6 shows the thermal analysis (DTA / TGA)
of the scale recovered in the irrigation water pipes.
We observed three endothermic peaks. The first
around 50 °C, corresponds to the departure of the
surface and lattice water. The second peak,
beginning at 450 °C, is characteristic of the
elimination of the constitution water. Finally, the last
peak corresponds to the decomposition of calcite at
880 °C 25-29. This decomposition corresponds to the
departure of CO2 according to the following
reaction:
CaCO3 CaO + CO2
Mediterr.J.Chem., 2018, 7(4) A. Hadfi et al. 279
Figure 6. Thermal analysis curves (DTA / TGA) of scale recovered from the water pipes of the localized
irrigation of Biougra circle
Anti-scalant behavior of a food product
phosphate based
Calcium carbonate scale is a serious problem in
water pipelines. The formation of scale can be
alleviated or at least reduced by the use of antiscalant
chemicals. Some different antiscalants are
commercially available but still little is known about
their mechanism of inhibiting scale formation 30.
The use of inhibitors is one of the best
techniques to prevent or delay the formation of these
deposits. It is therefore essential to find a novel
environmentally friendly anti-scalant, characterized
by the better inhibiting effectiveness of calcium
carbonate, on the one hand, and their respect of
health and environment norms, on the other hand.
The food products have become a source of
inhibitors with high added value. These types of
inhibitors do not contain heavy metals or toxic
compounds, and they are biodegradable.
In the present work, we are interested in
studying the effect of a food inhibitor of a trademark
called “Leval®15” on the water scaling power.
Leval 15
The “LEVAL®15” is food that is compound,
complex, pulverulent and soluble in the water, with a
white powdery appearance. It contains 64.5 % of
phosphoric anhydride (P2O5) and 28.5 % of Na2O.
This product is currently used as a food additive.
The study was conducted at a temperature of
25 ˚C, using the technical LCGE on the pure calco-
carbonic water with 40 °F. Always beginning by
increasing amounts; the quantity of designated
tartrifuge (a product used to prevent the formation of
scale) for each test was used before the start of the
experimentation. In all cases, the presence of
tartrifuge does not change the values of the CAT,
and TCa measured before the start of the experiment.
The experimental installation is shown in Figure 7.
1. Stripping gas
2. Thermostat baths
3. Immersion circulator-heating
4. Humidifier
5. Humidity traps
6. Work cell
7. Simple taken for the dosage of [Ca2+]
8. Temperature probe
9. pH mete
Figure 7. Experimental set-up of the LCGE method
2
1
34
55
6
78
9
10
2
5 5
Mediterr.J.Chem., 2018, 7(4) A. Hadfi et al. 280
The principle of technical LCGE is based on the
accelerated formation of deposits of calcium
carbonate under the effect of degasification of the
studied water, usually atmospheric air, according to
the following reaction:
Ca2+ + 2 HCO3- CaCO3(s) + CO2 + H2O
The statement of the pH values and the
concentration of a Ca2+ ion over time allow making a
description of the precipitation kinetics of calcium
carbonate 8.
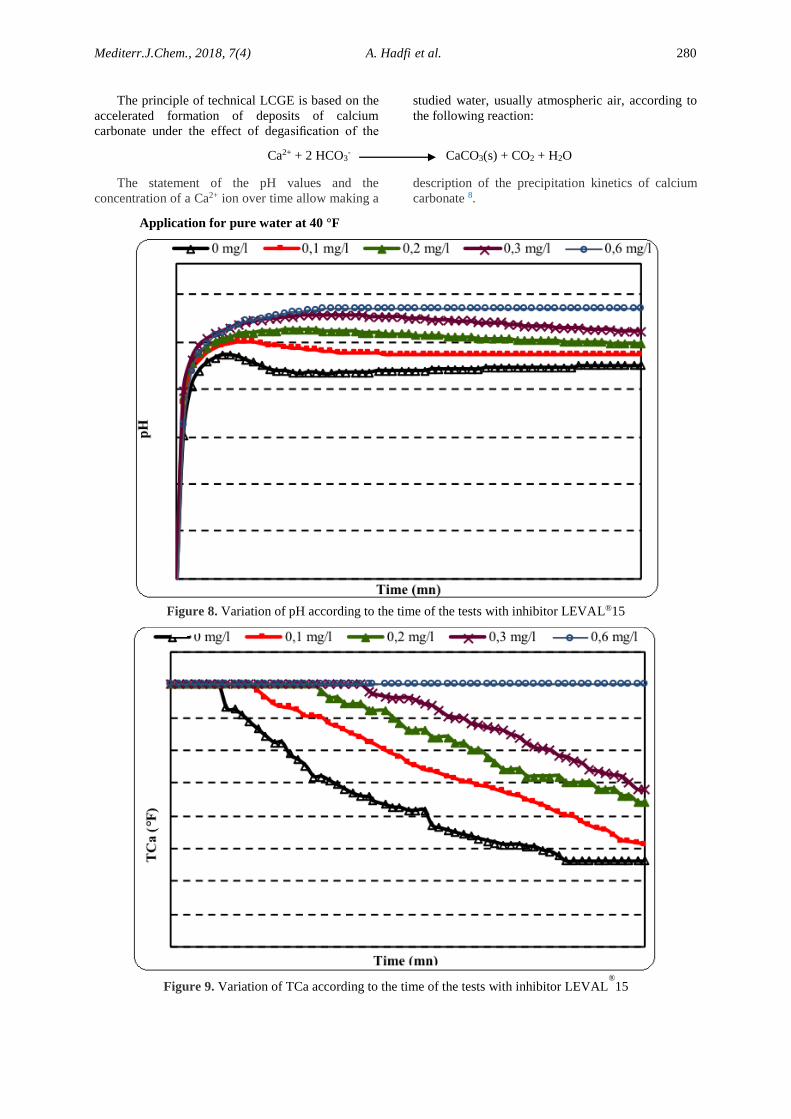
Application for pure water at 40 °F
Figure 8. Variation of pH according to the time of the tests with inhibitor LEVAL®15
Figure 9. Variation of TCa according to the time of the tests with inhibitor LEVAL®
15

Mediterr.J.Chem., 2018, 7(4) A. Hadfi et al. 281
Figure 10. Variation of the rate of supersaturation βcal according to the time of the tests with inhibitor
LEVAL®15.
The analysis of these curves and the kinetic modelling lead to the values presented in Table 4.
Table 4. Germination time (Tg), pH of germination (pHg) supersaturation coefficient overlooked to the calcite
(βcalcite) and precipitation speed of calco-carbonic solution at 40˚F added increasing quantities of a food product
phosphate based.
Concentration
(mg/L)
Time of
germination (mn) pHg βcalcite
Diffusional calcite Reddy calcite
KD (mn−1) R² KR (˚F−1∙mn−1) R²
0 16 8,42 77,65 1,53E-02 0,994 6,58E-04 0,983
0,1 22 8,5 107,23 9,64E-03 0,978 3,45E-04 0,990
0,2 36 8,58 120,32 8,31E-03 0,959 2,88E-04 0,976
0,3 50 8,67 158,6 1,49E-02 0,957 2,30E-04 0,989
0,6 - - - - - - -
The analysis of these results proved the following
observations:
- The germination time increases with the
concentration of the scaling inhibitor. From
concentrations that are more than or equal to 0.6
mg/L (effective concentration), the inhibition
becomes total, and precipitation is not observed
during the test.
- The pH at the germination point increases with
inhibitor concentration from 8.42 for 0 mg/L to
8.67 for 0.3 mg/L. The fall in pH is evident for
the test without inhibitor, whereas for increasing
concentrations this fall becomes less remarkable.
A stage is obtained before precipitation, which
proves that the duration of the germination phase
exceeds that of degassing.
- The precipitation follows a diffusion model for
the test without inhibitor. It is modelled by the
Reddy model for tests with the inhibitor.
The experimental results (Fig. 8 to 10) obtained
make it possible to conclude that the germination
time in the case of the calco-carbonic solution at 40
°F is 16 minutes without inhibitor. The addition of
0.6 mg/L of "LEVAL®15" to the solution prevents
the precipitation of calcium carbonate under the
conditions of the experiment, i.e. total inhibition of
scaling.
The mechanism suggested for this inhibition is
the adsorption of pyrophosphate (P2O7)4- on the
calcite surface, which blocks the active crystal
growth sites.
The inhibition of calcite crystal growth by
pyrophosphate can be explained by blockage of
Mediterr.J.Chem., 2018, 7(4) A. Hadfi et al. 282
surface crystal growth sites by adsorbed
pyrophosphate ions. The adsorption of
pyrophosphate can be described by a simple
Langmuir adsorption model 31, giving rise to
preventing any precipitation of calcium carbonate
under the conditions of the experiment.
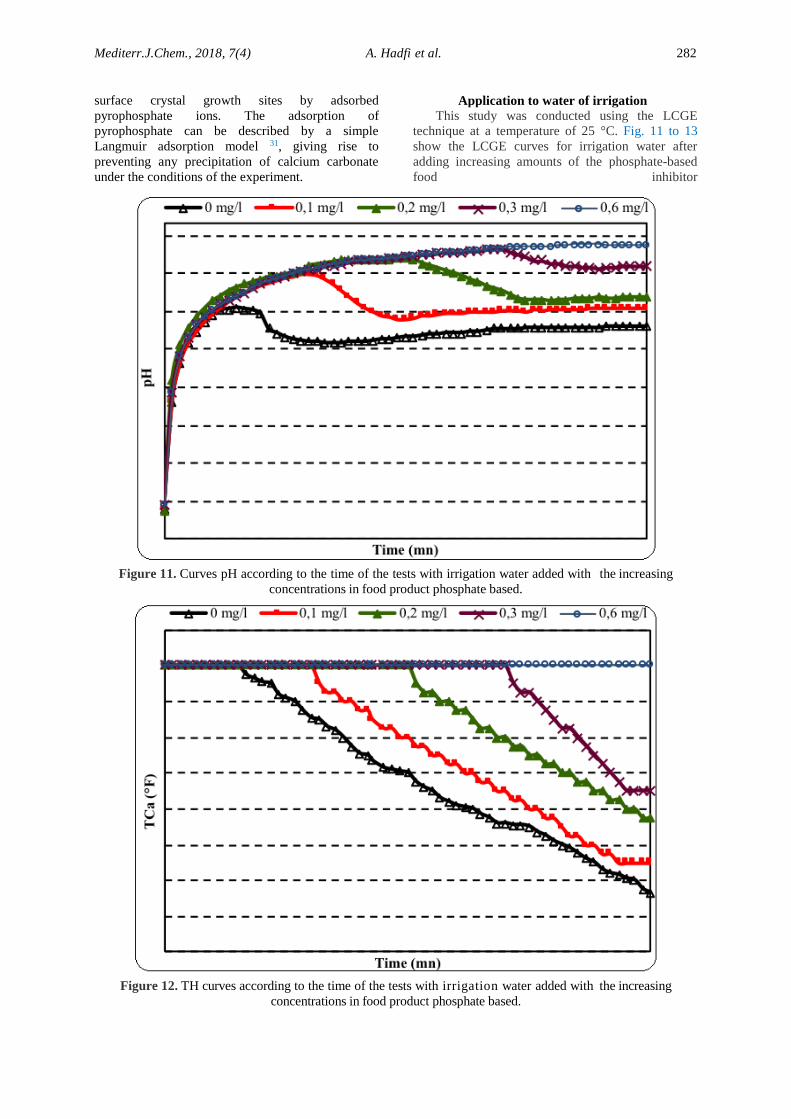
Application to water of irrigation
This study was conducted using the LCGE
technique at a temperature of 25 °C. Fig. 11 to 13
show the LCGE curves for irrigation water after
adding increasing amounts of the phosphate-based
food inhibitor
Figure 11. Curves pH according to the time of the tests with irrigation water added with the increasing
concentrations in food product phosphate based.
Figure 12. TH curves according to the time of the tests with irrigation water added with the increasing
concentrations in food product phosphate based.
Mediterr.J.Chem., 2018, 7(4) A. Hadfi et al. 283
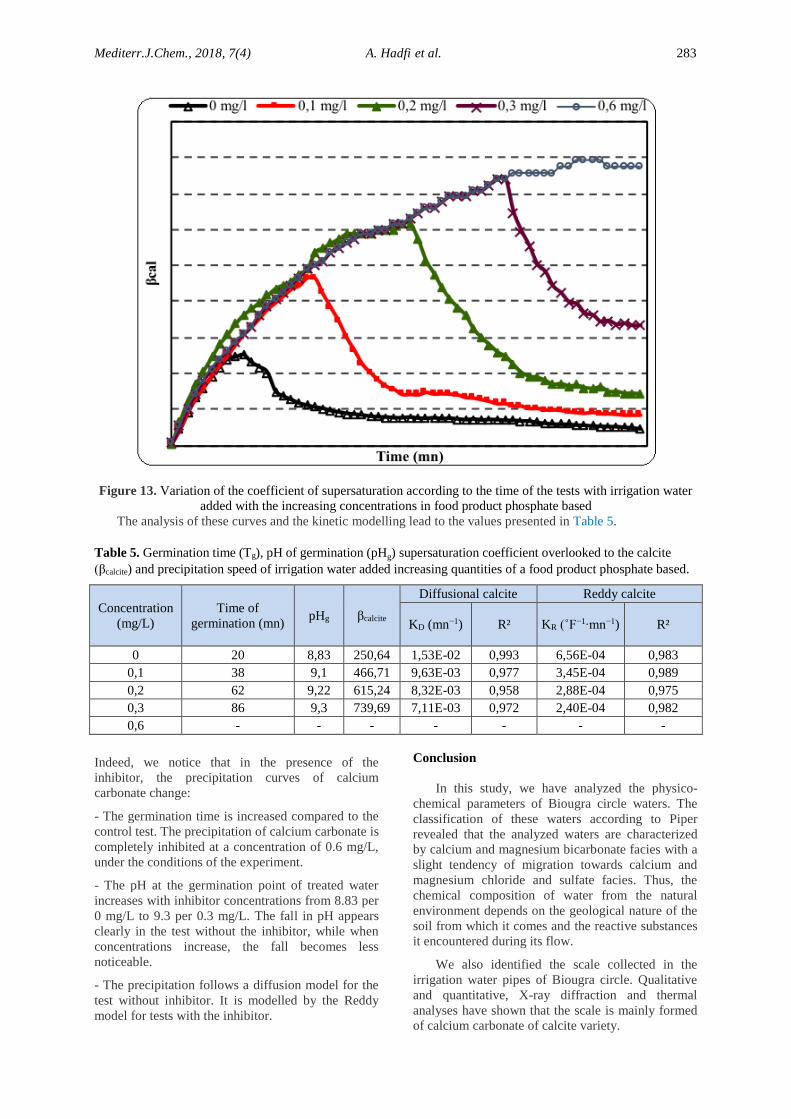
Figure 13. Variation of the coefficient of supersaturation according to the time of the tests with irrigation water
added with the increasing concentrations in food product phosphate based
The analysis of these curves and the kinetic modelling lead to the values presented in Table 5.
Table 5. Germination time (Tg), pH of germination (pHg) supersaturation coefficient overlooked to the calcite
(βcalcite) and precipitation speed of irrigation water added increasing quantities of a food product phosphate based.
Concentration
(mg/L)
Time of
germination (mn) pHg βcalcite
Diffusional calcite Reddy calcite
KD (mn−1) R² KR (˚F−1∙mn−1) R²
0 20 8,83 250,64 1,53E-02 0,993 6,56E-04 0,983
0,1 38 9,1 466,71 9,63E-03 0,977 3,45E-04 0,989
0,2 62 9,22 615,24 8,32E-03 0,958 2,88E-04 0,975
0,3 86 9,3 739,69 7,11E-03 0,972 2,40E-04 0,982
0,6 - - - - - - -
Indeed, we notice that in the presence of the
inhibitor, the precipitation curves of calcium
carbonate change:
- The germination time is increased compared to the
control test. The precipitation of calcium carbonate is
completely inhibited at a concentration of 0.6 mg/L,
under the conditions of the experiment.
- The pH at the germination point of treated water
increases with inhibitor concentrations from 8.83 per
0 mg/L to 9.3 per 0.3 mg/L. The fall in pH appears
clearly in the test without the inhibitor, while when
concentrations increase, the fall becomes less
noticeable.
- The precipitation follows a diffusion model for the
test without inhibitor. It is modelled by the Reddy
model for tests with the inhibitor.
Conclusion
In this study, we have analyzed the physico-
chemical parameters of Biougra circle waters. The
classification of these waters according to Piper
revealed that the analyzed waters are characterized
by calcium and magnesium bicarbonate facies with a
slight tendency of migration towards calcium and
magnesium chloride and sulfate facies. Thus, the
chemical composition of water from the natural
environment depends on the geological nature of the
soil from which it comes and the reactive substances
it encountered during its flow.
We also identified the scale collected in the
irrigation water pipes of Biougra circle. Qualitative
and quantitative, X-ray diffraction and thermal
analyses have shown that the scale is mainly formed
of calcium carbonate of calcite variety.
Mediterr.J.Chem., 2018, 7(4) A. Hadfi et al. 284
The chemical inhibition of calcium carbonate
precipitation can be considered as the most evident
method to prevent scaling observed in the
agricultural sector in Biougra region. Pure calco-
carbonic water at 40 °F and irrigation water whose
hardness is around 40 °F were used to test the
inhibitory efficacy of a food inhibitor: LEVALL®15,
using the LCGE technique.
The experimental results gained show that in the
case of the 40 °F calco-carbonic solution, a
concentration of 0.6 mg/L in "LEVALL®15" totally
prevents the precipitation of calcium carbonate.
The application of this inhibitor to irrigation
water has also shown that a concentration of 0.6
mg/L totally prevents precipitation of calcium
carbonate under the conditions of the experiment.
References
1- ABHSMD. Plan directeur d’aménagement
intégré des ressources en eau (PDAIRE)
(Chapitre 3), p 120. Maroc 2008.
2- Projet d'appui au programme national
d'économie d'eau d'irrigation (PAPNEEI-II
Ministère de l’Agriculture et de la Pêche
Maritime, Maroc 2017.
3- D. J. Pitts, D. Z. Haman, A. G. Smajstria,
Causes and prevention of Emitter plugging in
Mico irrigation Systems. Bulletin 258. Florida
Cooperative Extension Service. Institute of
Food and Agricultural Sciences. University of
Florida, 1990
4- H. Elattir, La conduite et le pilotage de
l’irrigation goutte à goutte en Maraîchage,
bulletin mensuel d’information et de liaison ou
PNTTA, Transfert de technologie en
agriculture, 2005, N°124,
5- H. Roques; Study of the kinetics of
precipitation of calcium carbonate. Thesis,
Toulouse; (1964).
6- L. Dedieu, C. Hort, A. Martin Domingues,
M. Rola and H. Roques; Contribution to the
study of the scaling phenomenon. General
points and the L.C.G.E. method of study.
Tribune de l’eau. 1994; 47:3-19.
7- C. Hort, A. Martin Domingues, C. Rabut,
H. Roques; Contribution to the study of scaling
phenomena. 2nd Part: The kinetics of crystal
growth. Tribune de l’eau. 1995; 48:31-46.
8- A. Hadfi, S. Ben-Aazza, M. Belaatar, N. Hafid
and A. Driouiche, Study of the Inhibitor
Scaling Effect of the Agricultural Water by a
Phosphate Fertilizer. Journal of Water Resource
and Protection, 2015,7, 1234-1241.
doi: 10.4236/jwarp.2015.715100
9- V. L. Snoeyink and D. Jenkins, “Water
Chemistry,” Wiley, New York, 1980.
10- R.J. Casale; Improving chemical handling
procedures can help reduce associated
treatment problems. J. Am. Water Works
Assoc; 2001. 93 (9), 95-106
11- L.S. McNeill and M. Edwards; Phosphate
inhibitor use at US utilities. J. Am. Water
Works Assoc; 2002. 94 (7), 57-63.
12- M. Barcelona, J. Gibb, J.A. Helfrich, E.E.
Garske, Practical guide for groundwater
sampling. Illinois State Water survey report,
1985, p. 374)
13- J. Rodier; Analyse de l’eau : Eaux naturelles,
eaux résiduaires, eaux de mer. Paris, Dunod,
2009, p 1579
14- H. Alayat and C. Lamouroux, Coastal Zone
Processes and Management. Environmental
Legislation, 2007, 75 - 84
15- A. M. Kouassi, A. Mamadou, K. E. Ahoussi
and J. Biemi, Rev. Ivoir. Sci. Technol., 2013,
22, 138 - 166
16- N. AKA, S. B. BAMBA, G. SORO and
N. SORO, Larhyss Journal, 2013, 16, 3 - 52
17- Hill RA. Geochemical patterns in the Coachella
Valley, California. Trans Am Geophys Union
1940; 21: 46-49
18- A. M. Piper; A graphic procedure in the
geochemical interpretation of water analyses.
American Geophysical Union Transactions,
1944, 25, 914-928.]
19- W. Back; Techniques for mapping of
hydrochemical facies, U.S. Geological Survey
Professional, 1961, Paper 424-D, p. 380-382
20- W. Back and B. B. Hanshaw, Chemical
geohydrology. Adv Hydro sci, 1965, 2:49-109
21- T. K. Yao, M. Oga, O. Fouché, D. Baka and
C. P. J. Biemi, Int. J. Biol. Chem. Sci., 2012, 6,
7069 - 7086.
22- M. Belattar, A. Hadfi, S. Ben Aazza, S.
Mohareb, N. Hafid and A. Driouiche.
Characterization of scale deposits formed in
sanitary hot water pipelines in the northern
tourist zone of Agadir city. Mediterranean
Journal of Chemistry 2018, 7(2), 86-92.
23- A. M. Belchar, et al., Control of Crystal Phase
Switching and Orientation by Soluble Mollusc-
Shell Proteins, Nature, 1996, 381, pp. 56-58.
24- C. A Jouenne; Traité de céramiques et
matériaux minéraux ; Ed. Septima, 1990
25- N. Hafid, M. Belaatar, S. Ben-Aazza, A. Hadfi,
M. Ezahri and A. Driouiche, Characterization
of Scale Formed in Drinking Water and Hot
Water Pipes in the Taliouine Downtown-
Morocco. American Journal of Analytical
Chemistry, 2015, 6, 677-686.
doi: 10.4236/ajac.2015.68065.
26- C. Rodriguez-Navarro, E. Ruiz-Agudo,
A. Luque, A.B. Rodriguez-Navarro and
M. Ortega-Huerta. Thermal decomposition of
calcite: Mechanisms of formation and textural
evolution of CaO nanocrystals. American
Mineralogist, 2009, 94, 578-593,
0003-004X/09/0004-578$05.00/
DOI: 10.2138/am.2009.3021.
27-
Mediterr.J.Chem., 2018, 7(4) A. Hadfi et al. 285
27- I. Halikia, L. Zoumpoulakis, E. Christodoulou,
D. PrattisKinetic. Study of the thermal
decomposition of calcium carbonate by
isothermal methods of analysis. The European
Journal of Mineral Processing and
Environmental Protection. 2001, 1, 89-102
28- A. Singh, S. Dash, M. Kamruddin,P.K.
Ajikumar, A.K. Tyagi, V.S. Raghunathan and
B.Raj, Formation of nanocrystalline calcia by
the decomposition of calcite. Journal of the
America Ceramic Society, 2002, 85, 927-932.
29- Y. Junjun, K. Xin, Q. Changlei, F. Bo, V.
Ananthanarayanan, S. Dmitry, Modeling of
CaCO3 decomposition under CO2/H2O
atmosphere in calcium looping processes, Fuel
Processing Technology, 2014, 125, 125-138.
30- J. C. Cowan and D. J. Weintritt; In Water-
Formed Scale Deposits; Gulf Publishing
Company: Houston, Texas, 1976, pp 8, 93,
255-257, 261-262, 596.
31- Yi-Pin Lin, Philip C. Singer; ‘’Inhibition of
calcite crystal growth by polyphosphates’’,
Water Research 39, 2005, 4835-4843.