Embed Size (px)
Citation preview
Ifakara Health Institute & Muhimbili University of Health and Allied Sciences Page i
Evaluation of the integration of eye care for children into primary health care
system in Tanzania
Prepared by Dr Mwifadhi Mrisho, c Dr Milka Mafwiri, Muhimbili University of Allied and Health Sciences, Dar es Salaam Mr Abdalla Mkopi, Ifakara Health Institute, Dar es Salaam Mr Fakih Bakar, Ifakara Health Institute, Dar es Salaam
Final report October 2014
Ifakara Health Institute & Muhimbili University of Health and Allied Sciences Page ii
List of Contributors
1. Prof. Gilbert Clare, London School of Hygiene and Tropical Medicine, London 2. Elena Schmidt, Sightsavers UK
3. Emma Jolley, Sightsavers UK
4. Christina Mbise, Sightsavers, Tanzania
5. Fulgence Ngeze, Ifakara Health Institute, Dar es Salaam
6. Dr Nkundwe Mwakyusa, 5Ministry of Health and Social Welfare
1
Ifakara Health Institute & Muhimbili University of Health and Allied Sciences Page iii
Table of Contents List of Tables ............................................................................................................................ v
List of figures ........................................................................................................................... vi
List of Abbreviations .............................................................................................................. vii
1 Background ........................................................................................................................ 1
1.1 Primary health care and eye care for children ............................................................................ 2
1.2 The Ten Key Activities for Healthy Eyes (10 KAHE) in Children ................................................ 2
1.3 Adding an eye module to the existing IMCI materials in Tanzania (“eyeIMCI”)........................... 3
1.4 Health Systems Approach ......................................................................................................... 4
1.5 Evaluation research ................................................................................................................... 5
1.6 Theory of change framework ..................................................................................................... 6
1.7 Statement of the problem and rationale of the study .................................................................. 6
2 Objectives .......................................................................................................................... 7
2.1 General Objective: ..................................................................................................................... 7
2.2 Specific Objectives: ................................................................................................................... 7
3. Methods .............................................................................................................................. 8
3.1 Study design .............................................................................................................................. 8
3.2 Sample size ............................................................................................................................... 8
3.3 Sampling procedure................................................................................................................. 11
3.4 Data collection ......................................................................................................................... 11
3.5 Data management and analysis .............................................................................................. 13
3.6 Quality control.......................................................................................................................... 13
3.7 Ethical consideration................................................................................................................ 13
4. Findings ........................................................................................................................... 14
4.1 Household participants and response rates ............................................................................. 14
4.2 Demographic and Socio-economic Characteristics .................................................................. 14
4.3 The current delivery of Reproductive and Child Health services and service outputs ............... 16
4.3.1 Vitamin A supplementation at 9, 15 and 21 months .......................................................... 16
4.3.2 Vitamin A supplementation by age groups ........................................................................ 16
4.3.3 Measles Immunization ...................................................................................................... 19
4.3.4 Last measles seen in the catchment population and at the facilities ................................. 20
4.3.5 Deworming tablets to under five children .......................................................................... 20
4.3.6 Vitamin A supplementation to women delivering at health facilities ................................... 21
Ifakara Health Institute & Muhimbili University of Health and Allied Sciences Page iv
4.3.7 Nutrition to under-fives children ........................................................................................ 22
4.3.8 Knowledge, attitudes and current health seeking behaviour ............................................. 24
4.3.9 Common illnesses in children ........................................................................................... 25
4.3.10 Perceived reasons for eye illness ..................................................................................... 26
4.3.11 Community perceptions on preventive methods for eye illness ......................................... 27
4.3.12 Health care providers’ knowledge assessment ................................................................. 28
4.3.13 Health care providers’ knowledge on eye conditions ........................................................ 28
4.3.14 Eye care knowledge assessment (images and case studies) ........................................... 29
5. The provision of eye care services, referral pathways and record keeping ................ 31
5.1 The provision of eye care services ........................................................................................... 31
5.2 Ocular prophylaxis ................................................................................................................... 32
5.3 Referral mechanism................................................................................................................. 32
5.4 Health facility record keeping ................................................................................................... 32
6. Elements of the health system that need to be strengthened ...................................... 32
6.1 Supervision .............................................................................................................................. 32
6.2 Health facility equipments and supplies ................................................................................... 33
7. Barriers to implementation ............................................................................................. 33
7.1 The proximity to health facilities ............................................................................................... 33
7.2 Community challenges and copying mechanisms .................................................................... 34
7.3 Health education in the visited health facilities ......................................................................... 34
7.4 Frequency of health talks ......................................................................................................... 34
7.5 Health talks on eye conditions: Clients’ perspectives ............................................................... 35
7.6 Health talks on eye conditions: Providers’ perspectives ........................................................... 35
7.7 Mothers/guardians knowledge on exclusive breastfeeding ...................................................... 35
7.8 Management of sick children (illnesses in the past 2-3 weeks) ................................................ 36
7.9 Management of eye problem in children .................................................................................. 37
7.10 Health care providers’ pre-service and in-service trainings ...................................................... 39
7.11 Health facility service delivery .................................................................................................. 41
7.11.1 Reported place of birth ..................................................................................................... 41
7.11.2 Availability of clinic cards to under five children ................................................................ 42
7.12 Post Natal Care Services, health care provider’s views ........................................................... 42
7.13 Community healthcare seeking behaviour ............................................................................... 42
7.14 ........................................................................................... Clients’ perceptions on service delivery
........................................................................................................................................................... 43
Ifakara Health Institute & Muhimbili University of Health and Allied Sciences Page v
8. Discussion ....................................................................................................................... 44
9. Study limitations .............................................................................................................. 46
10. Conclusions & Recommendations ................................................................................. 47
11. References ....................................................................................................................... 48
List of Tables
Table 1: Household survey sample size estimates for Singida and Manyoni districts ............................... 9
Table 2: Summary of sample sizes for quantitative and qualitative data ................................................ 10
Table 3: Overview of the study participants in the household survey ..................................................... 14
Table 4: Number of households, interviews and response rates according to the districts ..................... 14
Table 5: Characteristics of enrolled women aged 15 - 49 according to the districts ................................ 15
Table 6: Recorded vitamin A supplementation by age groups in both districts ....................................... 17
Table 7: Recorded vitamin A supplementation by district ....................................................................... 17
Table 8: Reported vitamin A supplementation by age groups in both districts ........................................ 18
Table 9: Reported vitamin A supplementation by district ........................................................................ 18
Table 10: Overall measles Immunization ............................................................................................... 19
Table 11: Measles Immunization by district............................................................................................ 19
Table 12: Overall deworming tablets to under five children .................................................................... 20
Table 13: Deworming tablets to under five children by district ................................................................ 21
Table 14: Vitamin A supplementation: women delivering at health facilities vs social economic status 21
Table 15: Vitamin A supplementation: women delivering at health facilities vs education ...................... 22
Table 16: Foods usually given to children in addition to breast feeding .................................................. 22
Table 17: Foods usually given to children above 18 months while being weaned breast milk ................ 23
Table 18: Foods usually given to children above 18 months while being weaned breast milk Vs social
economic status of the respondents....................................................................................................... 24
Table 19: Foods usually given to children above 18 months while being weaned breast milk Vs
education of the respondents ................................................................................................................. 24
Table 20: Mothers’ perceptions on the commonest eye conditions in children in the community ............ 26
Table 21: Perceived main reasons of contacted eye diseases in children .............................................. 27
Table 22: Perceived prevention methods of eye diseases in children .................................................... 27
Table 23: Frequency of encountering children with eye problem ............................................................ 28
Table 24: Reported common eye conditions seen in children ................................................................ 29
Table 25: Health care providers who feel confident in examining children’s eyes................................... 29
Table 26: Reported preventive methods of measles condition (responses to image 5) .......................... 31
Table 27: The proximity to health facilities ............................................................................................. 34
Table 28: Topics heard by mothers during health education sessions ................................................... 35
Table 29: Illness for under – 5 children in the last 2-3 weeks ................................................................. 36
Table 30: Respondents who thought care for health problem ................................................................ 36
Table 31: Types of eye problem for children .......................................................................................... 37
Table 32: Perceived reasons for the care not sought at a health facility ................................................. 38
Table 33: Under 5 mothers reporting frequency they usually wash their children’s faces ....................... 39
Table 34: RCH staff who completed pre-service training on IMCI .......................................................... 41
Table 35: RCH staff who completed in-service training on IMCI ............................................................. 41
Table 36: Place of delivery ..................................................................................................................... 41
Ifakara Health Institute & Muhimbili University of Health and Allied Sciences Page vi
Table 37: Clients satisfaction on the day of service ................................................................................ 43
List of figures Figure 1: Poster showing diagnosis and treatment of common eye conditions ......................................... 4
Figure 2: Map of Tanzania and the Study Site (Singida Region) .............................................................. 8
Figure 3: Images which were used in eye care knowledge assessment to the Health Care Providers ... 12
Figure 4: Where was the care sought for health problem in the last 2 - 3 weeks- not eyes problem. ...... 37
Figure 5: Place where the care was sought for the eye problem ............................................................ 38
Ifakara Health Institute & Muhimbili University of Health and Allied Sciences Page vii
List of Abbreviations
CHMT Council Health Management Team
CPD Continuous Professional Development
EAs Enumeration Areas
FGD Focus Group Discussion
HIMS Health Information Management System
IHI Ifakara Health Institute
IMCI Integrated Management of Childhood Illnesses
KAHE Key Activities for Healthy Eyes
LSHTM London School of Hygiene and Tropical Medicine
MoHSW Ministry of Health and Social Welfare
MUHAS Muhimbili University of Health and Allied Sciences
NBS National Bureau of Statistics
NIMRI National Institute for Medical Research
PHC Primary Health Care
PMTCT Prevention of Mother to Child Transmission
PNC Post Natal Care
PPS Probability Proportion to Size
RCH Reproductive Child Health
RHMT Regional Health Management Team
TDHS Tanzania Demographic and Health Survey
WHO World health Organization
UNICEF United Nations Children's Fund
Ifakara Health Institute & Muhimbili University of Health and Allied Sciences Page viii
Acknowledgements
This report has been produced with financial support from the Sightsavers. Technical and logistical
support has been provided by Muhimbili University of Health and Allied Sciences (MUHAS), London
School of Hygiene and Tropical Medicine (LSHTM) and the Ministry of Health and Social Welfare
(MoHSW). The report is a joint output of MUHAS, LSHTM and Ifakara Health Institute (IHI). The IHI
Evaluation Team wishes to acknowledge the immense technical support and advice provided by our
collaborators mentioned above. In particular we most sincerely acknowledge the excellent technical
guidance, support and encouragement provided by Professor Clare Gilbert from LSHTM, Gospert
Katunzi, Elena Schmidt, and Emma Jolley from Sightsavers. We are also indebted to Ms. Christina
Mbise and Mr. Fulgence Ngeze for their administrative support during the whole period of the study. It
would have been impossible to realise this work without the profound support from Dr. Salim Abdulla, IHI
Chief Executive Director and Dr. Godfrey Mbaruku, Deputy IHI Director for their guidance and support.
We are very grateful to the districts authorities in Singida District Council, Ikungi and Manyoni districts for
the logistical support, guidance and stewardship during fieldwork. Without their support, this evaluation
would not have been complete and successful. Finally, we thank all interviewees who generously offered
to respond and all other people who participated in this study in one way or another for agreeing to set
aside their valuable time to share their views on various aspects of this assessment.
Ifakara Health Institute & Muhimbili University of Health and Allied Sciences Page ix
Executive summary
Background
The prevalence of blindness in children is closely related to economic development and the social
determinants of health. In low income countries, the prevalence of blindness in children ranges from 3 to
15/10,000 children. In Tanzania, the under 5 mortality in 2006 was 122/1000 live births, while the
prevalence of blindness in children aged 0-15 years is around 8/10,000 children. Evidence from large
scale studies indicate that in developing countries the majority of children who are blind are either born
blind, or become blind before the age of five years. The pre-school age group should, therefore, be the
target for interventions. The available evidence also suggests that in developing countries the major
causes of blindness have changed over time: measles related blindness has declined as a result of
better immunization programmes, and vitamin A supplementation means that corneal scarring is also
becoming a rarity.
As corneal scarring from measles and vitamin A deficiency have declined over time, cataract, which is
likely to have a constant incidence, has become a relatively more important cause. Countries in Africa
with good immunization and vitamin A supplementation, cataract has overtaken corneal scarring as the
predominant avoidable cause. Primary health care has the potential to play a major role in preventing
blindness in children, through specific preventive measures.
The Integrated Management of Childhood Illness (IMCI) arose as an approach to reduce morbidity and
mortality, with a focus on children aged 0-5 years. The approach was developed by United Nations
Children's Fund (UNICEF) and the World Health Organization (WHO). IMCI has been adopted and
implemented with varying degrees of success in developing countries, including Tanzania. The MoHSW
in Tanzania is fully supportive of including eye care as part of IMCI. It has recommended a module to be
developed specifically for eyes. This includes the diagnosis and treatment of common eye conditions.
Methodology
This was a cross-sectional study which used both quantitative and qualitative research methods. The
quantitative data were obtained from the household level and health facilities in Singida rural and
Manyoni districts. As for the quantitative survey, 860 participants from the households were recruited for
interviews. Twenty four health facilities were surveyed in both districts. Furthermore, qualitative methods
were also applied in triangulation, incorporating the advantages of each research approach. Thirty one
in-depth interviews were conducted with health care providers and six FGDs with parents and
grandparents of under-five children. In addition, key informants interviews were done at districts, regional
and national levels.
Key findings
This study recorded vitamin A supplementation from the children growth monitoring cards. Overall, the
study found that 70% of the children above 9 months received the supplementation at ninth month.
Eighty seven percent of the children in Singida rural received vitamin A supplementation as compared to
50.8% in Manyoni district. Proportions of vitamin A supplementation in different age groups above 12
months were higher in Singida rural district as compared to Manyoni district. With regards to vitamin A
supplementation given to children at 15 and 21 months, results show that it was 20.1% and 8.4% for the
Ifakara Health Institute & Muhimbili University of Health and Allied Sciences Page x
two age categories respectively. On the other hand, ninety six percent the women reported that their
children were given vitamin A supplementation. With regards to the reported number of doses, women in
Manyoni district reported a relatively higher number of doses of vitamin A supplementation as compared
to Singida rural.
There was a relatively low coverage of 53.8% for vitamin A supplementation to the children below 12
months. With regards to the number of doses of the vitamin A supplementation, the results show that
only children below 12 months received appropriate number of doses (which are two doses). A number
vitamin A supplementation doses received in Manyoni was higher as compared to Singida rural.
Mothers of the children aged above 9 months were asked if their children were given vitamin A
supplementation. The results show that 96.3% of the children were reported to have been given vitamin
A supplementation. Ninety seven of the children in Singida rural and 96% in Manyoni were reported to
have been given vitamin A supplementation. The results also show that, children of the same age group
were reported to have received an average of two doses of vitamin A supplementation.
Seventy percent of women delivered at health facilities. Of all the women who delivered at the health
facilities, more than a half of the respondents reported to have been given vitamin A supplementation
shortly after giving birth. The reporting was significantly higher in Singida rural 67% as compared to
Manyoni district which was at 45.9%. However, 4.4% of the women in both districts couldn’t remember if
they were given vitamin A after delivery.
The study recorded measles immunization from the children growth monitoring cards. The results show
that only six out of eleven children aged below 9 months were vaccinated. Likewise, 84.5% of children
aged 9 months or older were vaccinated against measles immunization. Ninety three percent of the
children aged 9 months or older in Singida rural were vaccinated against measles as compared to 76.1%
of the children in the same age group in Manyoni district. Fifty seven present of the respondents in both
districts reported that measles immunization prevents measles, keep the child healthy 22%, preventing
diseases 1.2% and making the child strong 0.6%. More than half of the health care providers reported to
have never seen a child with measles in the catchment areas.
With regards to the deworming tablets, 63.4% of the under five children were reported to have been
given deworming tablets. Most of the children aged (12 – 23 months) 67.2% in Singida rural were given
deworming tablets as compared to 48% of the children of the same age group in Manyoni district.
Malaria, pneumonia, measles and eye illnesses were the most reported health problems. Other chronic
illnesses mentioned include coughing, diarrhoea, and fever. The most reported causes of illnesses
included malnutrition, weather changes and lack of preventive measures like ITN. This was consistent
with data from the health facility survey whereas fever, diarrhea and pneumonia were common
mentioned.
Majority of the respondents in FGD sessions conducted with grandmothers, fathers and mothers of
under-five in the surveyed districts reported to have sought care from health facilities. However, some
respondents reported to have sought care from drug shops as well as self-medication. Health facilities
were the first source of treatment followed by self-medication and traditional healers.
The common reported eye conditions by the mothers of children under-five included: red, watering or
sticky eyes reported at 73% in Singida rural and 74.4% in Manyoni district. Trachoma illness was more
Ifakara Health Institute & Muhimbili University of Health and Allied Sciences Page xi
commonly reported at 20% in Manyoni district as compared to 8% in Singida rural. From the qualitative
findings, the most reported eye problems were red eyes, discharging eyes and trachoma. Other reported
eye problems mentioned included blindness and itching eyes.
All health facility in-charges of the visited health facilities were asked about the management of
ophthalmia neonatorum as a service to manage eye conditions in neonates. All health facilities manage
ophthalmia neonatorum through “start treatment and see the patient again”. With regard to management
of red eye/conjunctivitis in older children, 92% reported the practice “start treatment and see the patient
again”. The most treatment administered includes eye ointment 75%; Eye drop 13%; and antibiotic
injectable 4%.
With regard to provision of ocular prophylaxis to the babies in the health facilities visited, the in-charges
were asked if the service is performed. Ocular prophylaxis is performed at 58.3% for all babies and 4.2%
being performed only if STD is detected. There was no statistically significant difference on performing
ocular prophylaxis.
In terms of availability of equipment and supplies, health facilities in-charges were asked if the facility
had functional torches, antibiotic eye drops/ointment, injectable antibiotics and sterile eye pads.
Antibiotic eye drops/ointment and injectable antibiotics were available at 88%. Twenty one percent of the
visited health facilities had functional touches and sterile eye pads.
With regard to the referral mechanisms, eighty three percent of the health facility in-charge in visited
health facilities reported to have referred children to another facility. Among the referred cases, 90%
were provided with details while standard referral forms were used only by 25%. About 30% of the health
facilities which referred the cases received feedback from the referral made. The commonest reported
reasons for referrals were malaria/fever 58%, followed by diarrhea 29% and failure to thrive 17%.
Supervision was also a point of interest in this study. We wanted to know if the facility had been visited in
the last six months by RCH supervisors. Almost all 96% of health facility in-charge interviewed reported
to have been visited in the period of six months prior to the survey. Although health care providers
acknowledged that they felt supported during supervision, most of them said that the supervision did not
involve case management observation.
Discussion
The study has documented Vitamin A supplementation and measles immunization of children to be high.
However, our data suggest that vitamin A supplementation was high but routinely immunization
coverage reported on children clinic card was not as high as from mass campaigns. The present study
has also identified the utilization of health facilities to under-five children as in the previous studies.
Since December 2004, deworming for children aged 12-59 months has been integrated with the vitamin
A supplementation events. It has been reported elsewhere that through these initiatives deworming
coverage has been high. The results from this survey show that, despite the fact that deworming is
biannual provided (every after six months) to children under-five years, deworming coverage has not
been high as the coverage of vitamin A supplementation.
The study has also shown that eye infections were very common in the surveyed districts. Though, the
challenge is whether community members are able to distinguish between trachoma and other causes of
Ifakara Health Institute & Muhimbili University of Health and Allied Sciences Page xii
red, discharging eyes. Besides, there were some gaps noted as most of women or care givers need
health education about importance of different vaccines. There is also a need for health workers to
continue providing health education to the mothers as only less than sixty percent get the vitamin A
supplementation shortly after delivery.
Availability of drugs and supplies on eye health care was good in the visited health facilities. The high
availability of antibiotics in the visited health facilities needs to be addressed with clear strategies. The
training of health workers on how to effectively utilize available resources is an ideal preference.
Health policies and planning in any country depend heavily on having correct and timely information on
health parameters. The new Health Information Management System (HIMS) for district level and above
is being rolled out. Referrals and onward referrals can now be tracked through the register in Singida
Regional Referral Hospital. However, referral mechanisms from RCH need to be improved i.e. standard
referral slips in the lower health facilities and provision of eye health care training to the health care
providers. The HIMS currently in use has one category of “eye infections” in which all eye conditions are
included. Yet, the challenge will be to have appropriate HIMS for tracking referrals at facilities where
there are no dedicated eye units.
Health facility supervision in the last six months prior to the survey was high. However, less than fifty
percent of the supervision was not related to case management or clinical mentoring. This is consistent
with what has been reported elsewhere.
Conclusions & Recommendations
1 Efforts should be made to sustain the high coverage of Vitamin A supplementation and measles
immunisation. Increase mothers’ knowledge of eye diseases and how they can be prevented.
Increase vitamin A supplementation to mothers through health education. Improve capabilities of
RCH workers in the prevention, detection and management of eye conditions. There is also a
need to include routine examination of the eyes of newborn at the primary health facilities.
2 Areas that need special consideration include; Improvement of HIMS in RCH clinics so referrals
can be tracked. Improve supervision in terms of capacity building of staff in RCH clinics for eye
care. Improve supervisor’s skills in teaching through case management: There is a need to
develop training materials for eye conditions.
3 IMCI has the potential to contribute significantly to both the case management of illness and its
prevention. The actual impact that will result from training health workers to use the IMCI
guidelines and supporting them after training remains to be determined. Hence integrating
eyeIMCI into the existing training structures is a recommended option for better training
outcomes.
4 The study has identified the following gaps to be addressed: include leadership training of
supervisors as good supervision can change attitudes and motivation; develop health education
materials for eye care, including posters displayed where mothers can see them and availability
of health education materials.
Ifakara Health Institute & Muhimbili University of Health and Allied Sciences Page 1
1 Background The prevalence of blindness in children is closely related to economic development and the social
determinants of health. In low income countries, the prevalence of blindness in children ranges from 3 to
15/10,000 children [1], [2], [3]. Some evidence suggests that the prevalence of blindness is associated
with under-5 mortality rates. In Tanzania, the under 5 mortality in 2006 was 122/1000 live births, while
the prevalence of blindness in children aged 0-15 years is around 8/10,000 children. Rates are likely to
be higher in poor rural communities compared to more developed urban areas. Evidence from large
scale studies indicate that in developing countries the majority of children who are blind are either born
blind, or become blind before the age of five years [3], [4]. The pre-school age group should, therefore,
be the target for interventions. The available evidence also suggests that in developing countries the
major causes of blindness have changed over time: measles related blindness has declined as a result
of better immunization programmes and vitamin A supplementation means that corneal scarring is also
becoming a rarity [1]. Other avoidable causes of corneal blindness include conjunctivitis of the newborn,
particularly that due to gonorrhea, and the use of traditional eye remedies. The latter are more likely in
situations where primary eye care services are either not available or affordable, so parents use local
remedies, or go to traditional healers. These practices can lead to visual loss from a delay in seeking
appropriate treatment or through direct damage to the eye.
As corneal scarring from measles and vitamin A deficiency have declined over time, cataract, which is
likely to have a constant incidence, has become a relatively more important cause, and in countries in
Africa with good immunization and vitamin A supplementation programmes, cataract has overtaken
corneal scarring as the predominant avoidable cause [1]. Cataract in children can be present at birth
(congenital) or develop during the first few years of life (developmental cataract). Cataracts can also be
unilateral or bilateral. Early detection and referral to centres able to manage childhood cataract can give
good improvement in visual function, even if the visual acuity does not improve to normal levels[5], [6].
As with adult cataract, there is little that can be done to prevent cataract in children as the majority are of
unknown cause, or are familiar. Control of cataract blindness, therefore, depends on early detection,
counseling parents on the urgency of surgery, referral to the eye care centre which can manage
children, and good follow up to detect and manage complications and provide high quality optical and
low vision services [6]. Counseling is critical so that parents realize that cataract surgery is needed and
urgent, butthis is only the first step in restoring sight to their child. However, in developing counties,
including Tanzania [7], [8], there is evidence that children frequently present for surgery many years after
the parents first noticed the problem, which may have been a white pupil, or “spot in the eye”, or the
parents noticed that their child could not see properly. Barriers to presentation include misconceptions
that congenital blindness cannot be treated; being given the wrong advice by health workers; not
knowing where to go; believing that the condition would resolve on its own; preference for local
remedies; cost; fear of the operation and of hospitals in general, and distance. Lack of education among
mothers is another risk factor for late presentation [8]. Children can also develop other conditions which
if not detected early and treated appropriately can also lead to loss of vision, such as corneal ulcers,
trauma and strabismus, or loss of the child’s life e.g. retinoblastoma. There is another group of eye
conditions which are common among children and where prompt and appropriate treatment eases the
symptoms and prevents parents from using traditional remedies or purchasing and using medication
from unregulated village drug sellers. These include conjunctivitis and allergic eye disease, and in some
Ifakara Health Institute & Muhimbili University of Health and Allied Sciences Page 2
settings trachoma and the eye signs of vitamin A deficiency (e.g. night blindness). In all countries
significant refractive errors are uncommon in pre-school age children.
Children can also have unavoidable causes of visual loss, due to congenital abnormalities, retinal
dystrophies or optic nerve conditions [2]. Many of these conditions only affect the retina or optic nerve,
and the external appearance of the eyes is entirely normal. Parents will only notice that their child cannot
see properly, as they do not behave “visually” e.g. they are afraid to walk around; they fall over things;
they press on their eyes [9].These children also need to be detected and referred for investigation and
diagnosis, and referred for rehabilitation and pre-school interventions. The latter are essential to prevent
the developmental delay that accompanies profound visual loss of early onset.
Primary health care has the potential to play a major role in preventing blindness in children, through
specific preventive measures i.e. maintaining high coverage with measles immunization and vitamin A
supplementation; Credes prophylaxis to prevent ophthalmia neonatorum [10], and health education
regarding a good diet, breast feeding and avoidance of traditional eye remedies. Many of these
interventions have been shown to be highly effective in clinical trials [11] or as a result of large scale
programmes. Primary health care workers can also play a key role identifying children who need urgent
referral for investigation and/or treatment i.e. those with ocular abnormalities such as a white pupil; those
whose parents report that they think their child cannot see normally. Primary Health Care (PHC) workers
can also be trained to diagnose and manage the less serious but common eye conditions of childhood,
such as conjunctivitis. Sensitive and informed counseling of parents is another important activity.
1.1 Primary health care and eye care for children
The Integrated Management of Childhood Illness (IMCI) arose as an approach to reducing morbidity and
mortality, with a focus on children aged 0-5 years. There are three elements to IMCI: (1) improving
partnerships between health facilities or services and the communities they serve; (2) increasing
appropriate and accessible care and information from community-based providers; and (3) integrating
promotion of key family practices critical for child health and nutrition [12]. The approach was developed
by United Nations Children's Fund (UNICEF) and the World Health Organization (WHO). IMCI has been
adopted and implemented with varying degrees of success in developing countries, including Tanzania
[13], [14]. Despite being developed as a comprehensive approach, the focus in reality has tended to be
on facility based interventions. IMCI materials have a section on “ear health” but there is no section on
eye health, although certain eye conditions and their management (e.g. corneal ulceration as a
complication of measles) are included. Tanzania has embraced IMCI, and the programme is being
implemented through the Reproductive and Child Health (RCH) services.
1.2 The Ten Key Activities for Healthy Eyes (10 KAHE) in Children
Realization of the important role that PHC can play in promoting child eye health led to the development
of the “ten key activities” for child eye health. These were delineated at a WHO/Lions meeting in Geneva
in 2002 [15]. Recommended activities are as follows:
Activities relating to primary prevention
1. Clean the eyes at birth. Apply antibiotic eye ointment.
2. Give mothers vitamin A 200,000 I.U. immediately after delivery.
3. Promote breast feeding and good nutrition.
Ifakara Health Institute & Muhimbili University of Health and Allied Sciences Page 3
4. Immunize children against measles at 9 months and give vitamin A 100,000 I.U. Encourage second
measles immunization.
5. Keep children’s faces clean.
6. Do not put traditional eye medicines in the eyes.
Activities relating to early detection, treatment and referral:
7. Give high dose vitamin A to all children with measles infection
8. Any child who cannot see well - refer to an eye care worker as soon as possible.
9. Any child with a white pupil or other abnormality - refer to an eye care worker urgently
10. Any child with serious eye injury or red eye - refer to an eye care worker
A pilot study, undertaken in 15 Reproductive and Child Health (RCH) clinics in Dar-es-Salaam have
shown that after training in these activities, RCH staff were more likely to implement activities specific to
eye complaints, such as cleaning babies of newborn babies at delivery and instilling and antibiotic or
antiseptic, referring to the eye doctor any child with trauma, white pupil, or red eyes [16]. They were also
more likely to give vitamin A supplementation to mothers after delivery than their untrained counterparts
[17].
Staff in RCH clinics are ideally placed to deliver eye care for children as they have very close contact
with mothers from pregnancy onwards, and with young children. The success of this initial study has
provided the impetus for this larger study.
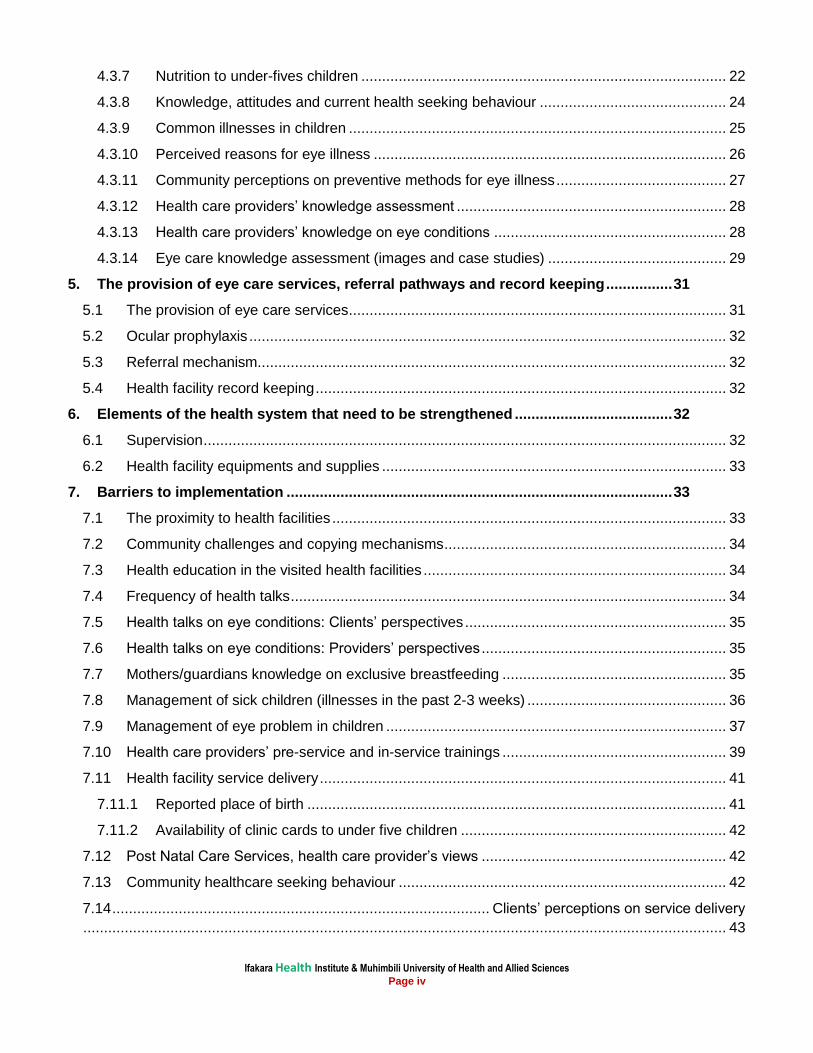
1.3 Adding an eye module to the existing IMCI materials in Tanzania
(“eyeIMCI”)
The Ministry of Health in Tanzania is fully supportive of including eye care as part of IMCI. It has
recommended a module to be developed specifically for eyes. The 10 KAHEs are fully supportive.
Though, MoHSW has not readily accommodated the module. The module will be included and be used
in training as a pilot pending further decision. These will be modified to be in line with IMCI format and
content, and are likely to encompass the following:
Normal eyes and vision - prevent eye conditions and preserve sight:
1. Clean the eyes at birth. Apply antibiotic eye ointment.
2. Give mothers vitamin A 200,000 I.U. immediately after delivery.
3. Promote breast feeding and good nutrition.
4. Immunize children against measles at 9 months and give vitamin A 100,000 I.U. Encourage second
measles immunization.
5. Keep children’s faces clean.
6. Do not put traditional eye medicines in the eyes.
Detect and treat:
7. Prevent blindness in children with measles. Treat with high dose vitamin A on day 1, day 2 and day
10
8. Treat red, sticky eyes after checking that the corneas are normal. Treat with topical antibiotic. See in
2 days. Refer if not improving
Ifakara Health Institute & Muhimbili University of Health and Allied Sciences Page 4
Detect and refer immediately:
9. Refer all children with red eyes and whitish patch on the cornea. Ulcers can lead to loss of vision
10. Refer all children who cannot see normally – even if their eyes appear normal. Early treatment gives
better results
11. Refer all children a white reflex or spot in the pupils even if you cannot see it. The child may have
cataracts which need urgent management
12. Refer all children a history of injury with a blunt or sharp object. They may need specialist treatment
This includes the diagnosis and treatment of common eye conditions such as conjunctivitis or allergies
which were not included in the 10 KAHEs. A poster, such as below, will be developed.
Figure 1: Poster showing diagnosis and treatment of common eye conditions
Normal eyes and vision: prevent eye conditions and preserve sight
Give mothers high dose vitamin A after delivery. This increase their breast milk vitamin A
Promote breast feeding to reduce the risk of measles & vitamin A deficiency
Clean the eyelids at birth, and instil antibiotic, to prevent conjunctivitisof the newborn
Keep childrens’ faces clean, to prevent infection, including trachoma
Immunization children against measles and give high does vitamin A: both prevent blindness
Do not use traditional eye medicines as they can damage the eyes
Detect and treat Detect and refer immediately
Treat red, sticky eyes after checking that the corneas are normal Treat with topical antibiotic. See in 2 days
Prevent blindness in children with measles. Treat with high dose vitamin A. Treat with tetracycline ointment if the eyes are red.
Refer all children with red eyes and whitish patch on the cornea. Ulcers can lead to loss of vision
Refer all children who cannot see normally – even if their eyes appear normal. Early treatment gives better results
Refer all children a white reflex in the pupils even if you cannot see it. The child may have cataracts which need urgent management
Refer all children a history of injury with a blunt or sharp object. They may need specialist treatment
1.4 Health Systems Approach
The project focuses on integration, which is closely linked to the “systems” approach. Here, integration
refers to identifying and targeting existing health providers (RCH services) and determining how eye
health interventions for children can be incorporated to ensure the preventive measures, as well as early
detection, diagnosis and treatment of eye related conditions are implemented in the most efficient way.
Ifakara Health Institute & Muhimbili University of Health and Allied Sciences Page 5
Academic literature refers to three basic models of integration: (a) provider level integration, where the
same provider offers a range of services during the same consultation; (b) facility-level integration,
where a range of services is available at one facility but not necessarily from the same provider; and (c)
systems-level integration, which in addition to facility-level integration, incorporates a coherent referral
system between facilities in order to ensure the patient is able to access all necessary services within
the healthcare system and in their community [18]. This project explores integration at all three levels
and aims to identify the most effective and efficient points for system entry and service provision.
Based on existing evidence of integration and empirically generated data, this project aims to support
the development and implementation of policies, protocols and other tools and procedures that are
important to help institutionalize and harmonize eye health services as part of child health care
delivery. The project addresses issues of staff training and the mechanisms essential to sustain the
delivery of eye health services over the long term. Integration will entail capacity building of staff and
their supervisors, development of materials, ensuring adequate supplies of medicines as well as
documentation systems. Decisions on integrating eye care into IMCI will entail a participatory approach
to ensure participation, acceptability and ownership of the systemic change.
A recent systematic review of the literature on integrating primary health services at the point of delivery
in low and middle income countries identified five randomized trials and four controlled before and after
(CBA) studies [19]. This paper makes a useful distinction between integration and “linkages”, the latter
being defined as sharing of information and referral between service providers or levels of service
provision. The authors conclude that “There is some evidence that ’adding on’ services (or linkages) may
improve the utilization and outputs of healthcare delivery. However, there is no evidence to date that full
integration improves health care delivery or health status” [20]. The review highlights that evaluation of
integration is challenging and that the anticipated results are not always achieved. Rigorous methods are
required to enable the correct conclusions to be drawn in terms of benefits as well as possible
downsides, and so that any change is attributed to the addition of the new service or component of the
service.
1.5 Evaluation research
There has recently been increased interest in research which evaluates the delivery of one or more
interventions, as opposed to clinical trials which focus more narrowly on assessing the efficacy of a
specific intervention, such as a new drug [20], [21]. The study design of choice to assess efficacy is a
randomized clinical trial, where individuals are randomly allocated. Trials are designed in such a way so
that in an ideal situation the only difference between the two groups is the treatment they are allocated
to, and great effort is made to ensure high levels of adherence to the intervention. Having shown that an
intervention has high levels of efficacy (e.g. vitamin A supplementation reduces child mortality) the next
step is to assess how the intervention can be implemented within health services. Often the interventions
are complex, requiring more than just a new medication, and may entail a change in behaviour by
patients and/or additional investigations, prescribing or reporting by health staff. Sometimes it is not
possible to use randomized trials to assess these more complex interventions (i.e. those made up of a
range of interconnecting or interrelated components), and “quasi-experimental study designs” can be
used instead. These include interrupted time series, and uncontrolled or controlled before and after
Ifakara Health Institute & Muhimbili University of Health and Allied Sciences Page 6
studies [21]. Each has advantages and disadvantages, and the context as well as the nature of the
intervention being evaluated has an important bearing on the study design.
The main factors which have to be in place for interventions to be effective in the real world are:
Availability:
o services have the new intervention;
o facilities are available for diagnosis
o staff are trained to deliver it
Use:
o patients access the service
demand side barriers: distance; cost; awareness; competing demands on
resources; family decision making; waiting times; lack of drugs; staff attitudes;
traditional beliefs and practices.
supply side barriers: lack of drugs/supplies; competing demands on time;
Quality:
o correct dose / regime prescribed; appropriate referrals;
o patients adhere to intervention prescribed; attend for follow up; attend if referred;
All need to be taken into account when evaluating the effectiveness of a complex intervention and have
been assessed in Phase 1 of this study.
1.6 Theory of change framework
In evaluating a complex intervention it is usual to build a theory of change framework. This starts with the
desired positive change envisaged, using evidence of efficacy from trials, if available. Theories or
frameworks are chosen to assess the steps which bring about change in behaviour or performance, and
decisions are needed on the intervention(s) required, or package of interventions, where they will be
delivered and by whom, and the inputs required to develop and deliver the intervention. Barriers to
implementation at every step need to be delineated as well as assumptions.
1.7 Statement of the problem and rationale of the study
The control of blindness in children requires activities at the primary level. Some eyeIMCI activities relate
specifically to eye health (e.g. refer children with visual loss) whereas others will also impact on general
health (e.g. measles immunization). In Tanzania, a pilot study which evaluated the 10 KAHEs has shown
that activities that relate to general health are already being implemented as part of RCH programs but
staff did not realize that these are also control measures for visual loss. However, the activities that
relate specifically to eye health (i.e. prevention of on/ treatment of common eye diseases, identification
and referral for further management of children with ocular morbidity and blindness) are not routinely
implemented by staff in RCH clinics. Failure to implement these activities leads to late presentation of
children with ocular morbidity and blindness to tertiary eye centres in Tanzania leading to irreversible
blindness. Lack of knowledge, skills and supervision were cited by RCH staff as reasons for failure to
implement the eye specific activities. However, after training, RCH staff were more knowledgeable and
were more likely to implement the 10 KAHE than their untrained counterparts.
Ifakara Health Institute & Muhimbili University of Health and Allied Sciences Page 7
Staff in RCH clinics have very close contact with young children and their mothers, providing
opportunities for them to implement the activities which promote eye health and prevent blindness in
children.
The results of this study will inform policy makers on the integration of eye care for children into primary
health care system; and will be used to support the development and implementation of policies,
protocols and other tools and procedures that are important to help institutionalize and harmonize eye
health services as part of child care delivery.
2 Objectives
2.1 General Objective: To evaluate eye health interventions which are to be integrated into the Integrated Management of
Childhood Illness for children in facilities providing Reproductive and Child Health services in Singida
region, Tanzania.
2.2 Specific Objectives:
1. To examine the current delivery of Reproductive and Child Health services and service outputs (e.g.,
immunisation and vitamin A uptake) using mixed methods
2. To assess knowledge, attitudes and current health seeking behaviour among mothers and the
community regarding eye health/conditions in children and to assess their attitudes towards the
service they receive
3. To assess the provision of eye care in Singida region, and to review referral pathways and record
keeping
4. To assess elements of the health system that need to be strengthened to effectively deliver the
intervention (e.g. supervision; equipment; supplies of consumables) and the current situation in
these areas
5. To assess barriers to implementation (availability, use and quality) e.g. staff motivation and staff
turnover.
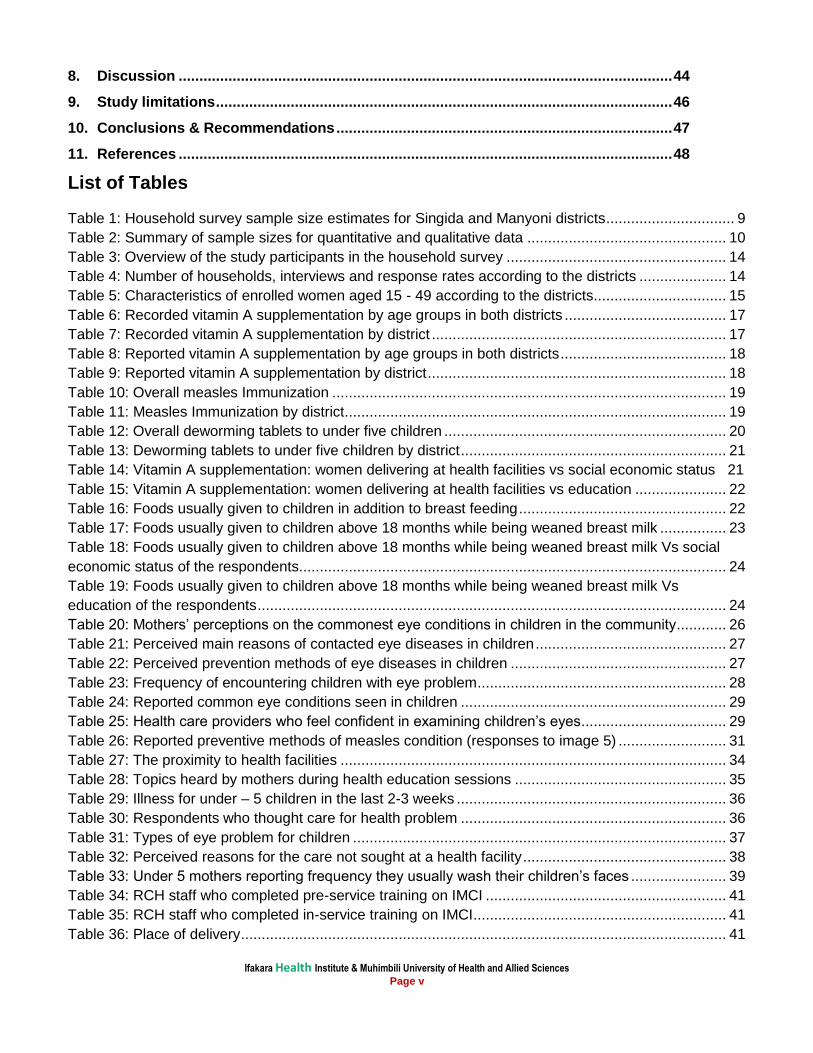
Ifakara Health Institute & Muhimbili University of Health and Allied Sciences Page 8
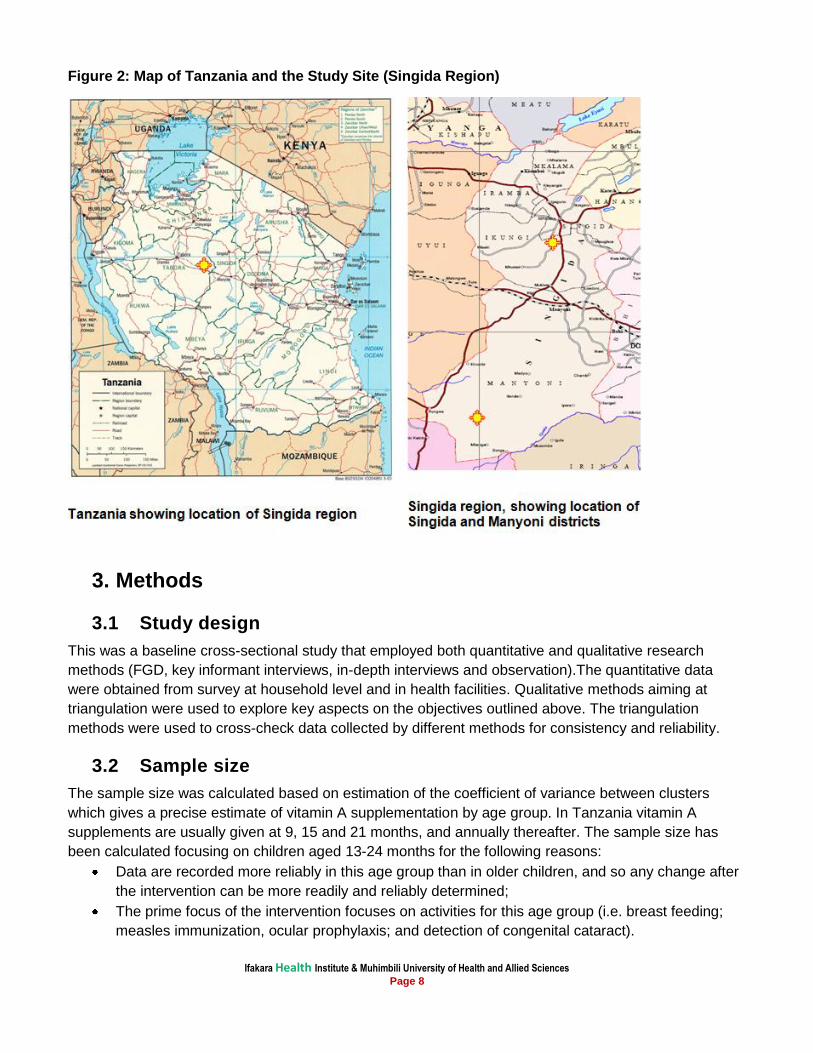
Figure 2: Map of Tanzania and the Study Site (Singida Region)
3. Methods
3.1 Study design
This was a baseline cross-sectional study that employed both quantitative and qualitative research
methods (FGD, key informant interviews, in-depth interviews and observation).The quantitative data
were obtained from survey at household level and in health facilities. Qualitative methods aiming at
triangulation were used to explore key aspects on the objectives outlined above. The triangulation
methods were used to cross-check data collected by different methods for consistency and reliability.
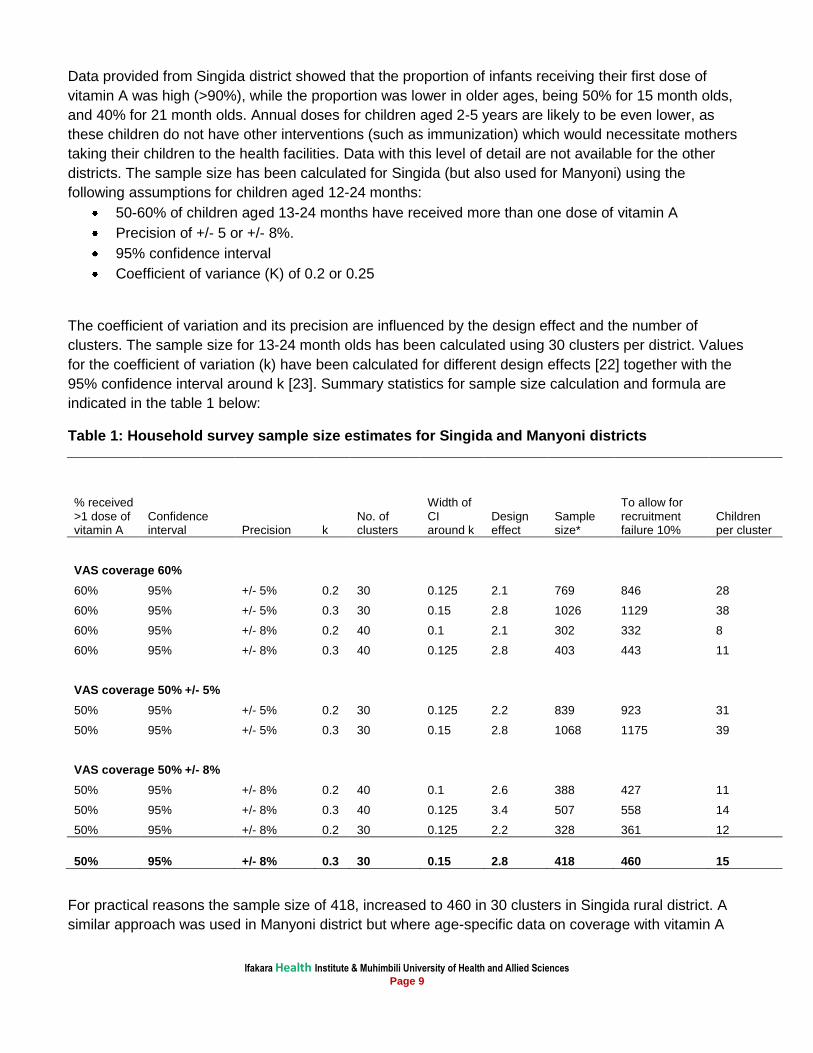
3.2 Sample size
The sample size was calculated based on estimation of the coefficient of variance between clusters
which gives a precise estimate of vitamin A supplementation by age group. In Tanzania vitamin A
supplements are usually given at 9, 15 and 21 months, and annually thereafter. The sample size has
been calculated focusing on children aged 13-24 months for the following reasons:
Data are recorded more reliably in this age group than in older children, and so any change after
the intervention can be more readily and reliably determined;
The prime focus of the intervention focuses on activities for this age group (i.e. breast feeding;
measles immunization, ocular prophylaxis; and detection of congenital cataract).
Ifakara Health Institute & Muhimbili University of Health and Allied Sciences Page 9
Data provided from Singida district showed that the proportion of infants receiving their first dose of
vitamin A was high (>90%), while the proportion was lower in older ages, being 50% for 15 month olds,
and 40% for 21 month olds. Annual doses for children aged 2-5 years are likely to be even lower, as
these children do not have other interventions (such as immunization) which would necessitate mothers
taking their children to the health facilities. Data with this level of detail are not available for the other
districts. The sample size has been calculated for Singida (but also used for Manyoni) using the
following assumptions for children aged 12-24 months:
50-60% of children aged 13-24 months have received more than one dose of vitamin A
Precision of +/- 5 or +/- 8%.
95% confidence interval
Coefficient of variance (K) of 0.2 or 0.25
The coefficient of variation and its precision are influenced by the design effect and the number of
clusters. The sample size for 13-24 month olds has been calculated using 30 clusters per district. Values
for the coefficient of variation (k) have been calculated for different design effects [22] together with the
95% confidence interval around k [23]. Summary statistics for sample size calculation and formula are
indicated in the table 1 below:
Table 1: Household survey sample size estimates for Singida and Manyoni districts
% received >1 dose of vitamin A
Confidence interval Precision k
No. of clusters
Width of CI around k
Design effect
Sample size*
To allow for recruitment failure 10%
Children per cluster
VAS coverage 60%
60% 95% +/- 5% 0.2 30 0.125 2.1 769 846 28
60% 95% +/- 5% 0.3 30 0.15 2.8 1026 1129 38
60% 95% +/- 8% 0.2 40 0.1 2.1 302 332 8
60% 95% +/- 8% 0.3 40 0.125 2.8 403 443 11
VAS coverage 50% +/- 5%
50% 95% +/- 5% 0.2 30 0.125 2.2 839 923 31
50% 95% +/- 5% 0.3 30 0.15 2.8 1068 1175 39
VAS coverage 50% +/- 8%
50% 95% +/- 8% 0.2 40 0.1 2.6 388 427 11
50% 95% +/- 8% 0.3 40 0.125 3.4 507 558 14
50% 95% +/- 8% 0.2 30 0.125 2.2 328 361 12
50% 95% +/- 8% 0.3 30 0.15 2.8 418 460 15
For practical reasons the sample size of 418, increased to 460 in 30 clusters in Singida rural district. A
similar approach was used in Manyoni district but where age-specific data on coverage with vitamin A
Ifakara Health Institute & Muhimbili University of Health and Allied Sciences Page 10
supplements were not available. Therefore, a total of 920 were required from 60 clusters in both
Manyoni and Singida rural districts.
Table 2: Summary of sample sizes for quantitative and qualitative data
Activities Whom Expected number Actual number
Place
A Key Informant interviews
1 RMO 1 1 Region HQ
Regional RCH Co-coordinator 1 1 Region HQ
Ophthalmic Medical Assistant in Singida
1 1 Region HQ
Regional Eye Care Co-ordinator, Singida
1 - Region HQ
District RCH Co-coordinator 1 per district 1 District Hospital
Cataract surgeon 1 1 Manyoni District
B Community based studies
2 Household survey
Care-seeking behaviour (interview care givers of under 5 children)
920 women in 60 clusters with under-five children
870
Manyoni & Singida rural districts
3 Focus group discussions
With fathers, mothers and grandmothers of young children to find out their health seeking behaviour
One of each (i.e., 3) per district
One of each (i.e., 3) per district
C Facility based studies
C1 RCH service providers
4 Interviews, with staff, observation
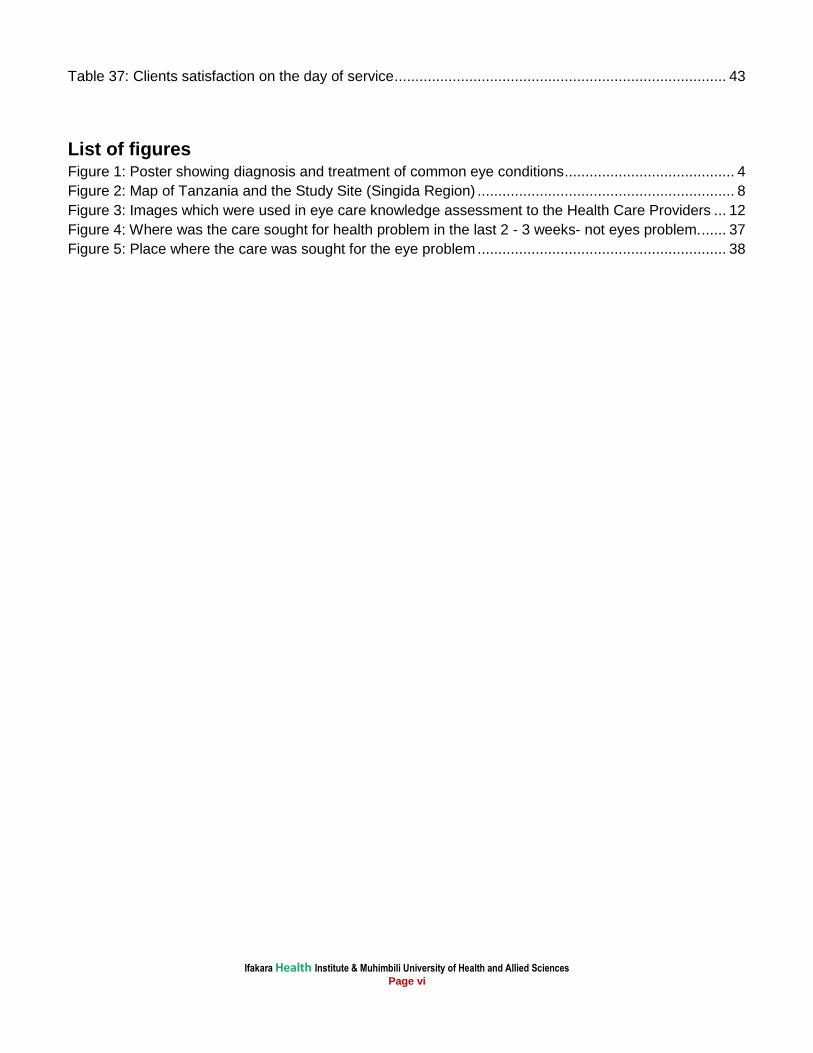
To assess services provided; their knowledge of eye conditions (shown in Figure 3); to assess current level of provision; assess process and outcome indicators which could be used in Phase 2
13 clinics / district. In each facility: in-Charge, and two other members of staff
Interview with staff on knowledge assessment 31; Observation 27; In-charge RCH staff 26
Health facilities selected so as to be representative of facilities in the two districts
5 Exit interviews
Mothers of children, to find out what they experienced and what they thought of the care they received
5 women with under-five children Approx. 60
195
C2 Eye care service providers
6 Interviews, with staff, observation
To assess services provided; their knowledge of eye conditions; to assess current level of provision; assess process and outcome indicators
All health facilities to be visited
24 All eye care providers in Manyoni & Singida rural districts
Ifakara Health Institute & Muhimbili University of Health and Allied Sciences Page 11
3.3 Sampling procedure
The procedure involved multi-stage sampling method starting with selection of health facilities. CSurvey
software was used to sample required health facilities. In the second stage of sampling, eligible study
participants were selected within each community around selected health facility. The selection of health
facilities was based on probability proportional to size (PPS). After arriving at the selected health facility,
all nearby villages surrounding health facilities were listed and one village was selected randomly. All
eligible households were identified for recruitment (with assistance of community leader). This process
was continued until all 15 eligible study participants were found. If the 15 eligible study participants were
not found, a nearby village was selected to complete the required number.
3.4 Data collection
We visited 920 households and collected information about health care seeking behavior from mothers
or caregivers of children aged <5 years. Thirty in-depth interviews were conducted with health care
providers, 16 in Manyoni and 14 in Singida rural districts. Three FGDs based on the methodology
described by Dawson et al. (1993) were conducted in each of the study district with six to eight women,
fathers and grandmothers of under-five children. FGDs were done separately with each of the group-
fathers, mother and grandmothers. The FGDs generally took place at a convenient place at the
informant’s village office. During FGD sessions, participants were provided with refreshments. Before
the FGD, the moderator introduced all participants, explained the general topic of discussions, and let
participants know that everyone should contribute his/her ideas. An experienced moderator, along with a
note-taker, led the discussions, each taking notes. The FGDs were recorded using an MP3 voice
recorder. After the FGD, a note-taker transcribed all the information by writing the text into a word format.
In facility based information, a list of facilities providing RCH services in each district were prepared,
together with their catchment population. In each district 13 RCH clinics were selected to represent rural
and urban communities.
Ifakara Health Institute & Muhimbili University of Health and Allied Sciences Page 12
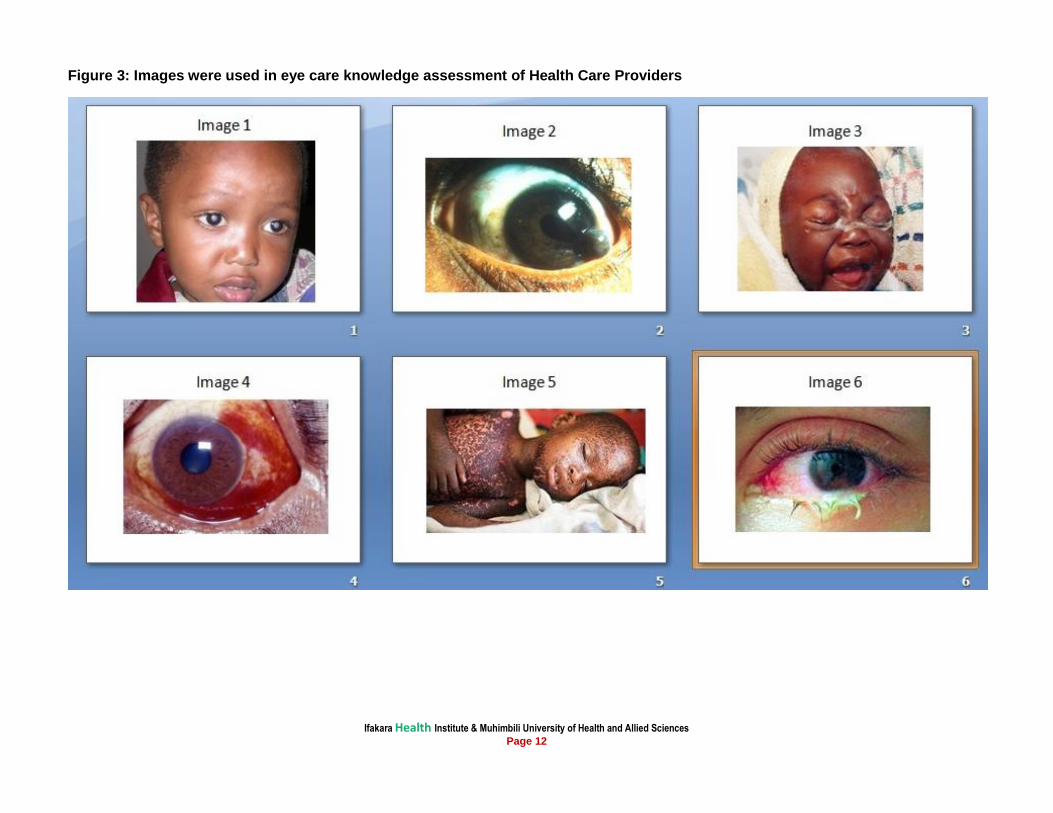
Figure 3: Images were used in eye care knowledge assessment of Health Care Providers
Ifakara Health Institute & Muhimbili University of Health and Allied Sciences Page 13
3.5 Data management and analysis
Quantitative data were entered into password protected EPI DATA software. Data were reviewed after
the initial data entry for out-of-range responses, missing values, or inconsistent skip patterns. The
original data collection forms were reviewed to resolve any discrepancies or problems. Quantitative data
were then transferred into STATA software (version 12, College Station, Texas, USA) for analysis.
Qualitative data (FGDs and In-depth interviews) were recorded using an MP3 voice recorder, upon
getting permission from the participants. After the FGD, the note-takers and the moderator reviewed
their hand written notes. The transcripts were typed and exported to NVivo 8 software for analysis.
Qualitative data were analyzed based on major key themes emerging during interviews and all
interviews were coded and analyzed using a thematic framework based on the study objectives.
3.6 Quality control
The survey was carried out by an experienced research team. Detailed field tools were prepared and
piloted in Mkuranga district during the training sessions. Each completed questionnaire was checked
both by the interviewers and supervisors on a daily basis. Similarly, close supervision were carried out
by the research team throughout the training, data collection, data entry, cleaning and analysis.
3.7 Ethical consideration
Ethical approval was obtained from the Ethics Review Boards of Ifakara Health Institute (IHI), Muhimbili
University of Health and Allied Science (MUHAS), London School of Hygiene and Tropical Medicine
(LSHTM) and The National Institute of Medical Research in Tanzania (NIMR). Written informed consents
were obtained in local language from all participants taking part in the study. No names were used in any
analysis or reporting, as codes were assigned. Permission was sought to record interviews and to use
anonymous quotes. In the community surveys, any participant or child identified with an eye complaint
was advised to visit the nearby health facility for treatment.
Ifakara Health Institute & Muhimbili University of Health and Allied Sciences Page 14
4. Findings
4.1 Household participants and response rates
We expected to interview a total of 920 eligible women in both Singida rural and Manyoni districts. A
total of 860 households agreed to participate in the survey. From these households, a total of 870
women aged 15 – 49 years agreed to be interviewed. Table 3 summarizes the study participants that
were involved in the survey.
Table 3: Overview of the study participants in the household survey
Variable Number
Households agreed to participate 860
Total women interviewed 870
Number of under-two year children 823
Number of under-five year children 1,097
The table 4 below shows the number of households and the women response rate for the baseline
study. The response rate is important because a high rate of non-response may affect the results. A total
of 920 households were estimated as the required sample for this study, of which 860 households
successfully participated in the survey, yielding a household response rate of 93.5% (860/920). In the
visited households, 870 women were identified for interview, resulting to a response rate of 94.6%
(870/920).
Table 4: Number of households, interviews and response rates according to the districts
Overall Singida Manyoni
Households
Households sampled 920 460 460
Households interviewed 860 436 424
Households response rate (%) 93.5 94.8 92.2
Interviews with women aged 15 – 49 years
Number of eligible women sampled 920 460 460
Number of women interviewed 870 441 429
Women response rate (%) 94.6 95.9 93.3
4.2 Demographic and Socio-economic Characteristics
This section provides the summary statistics on demographic and socio-economic characteristics of the
households visited. Most of the results are summarized in table 5 below.
To begin with, respondents or care takers were asked questions related to the households
characteristics. We provide the summary of both, Singida rural and Manyoni district. The proportion of
households’ heads with primary education was 79.8% (352/441) in Singida rural and 68.5% (294/429) in
Manyoni. However, 18% (76/429) of the household heads in Manyoni district had no formal education
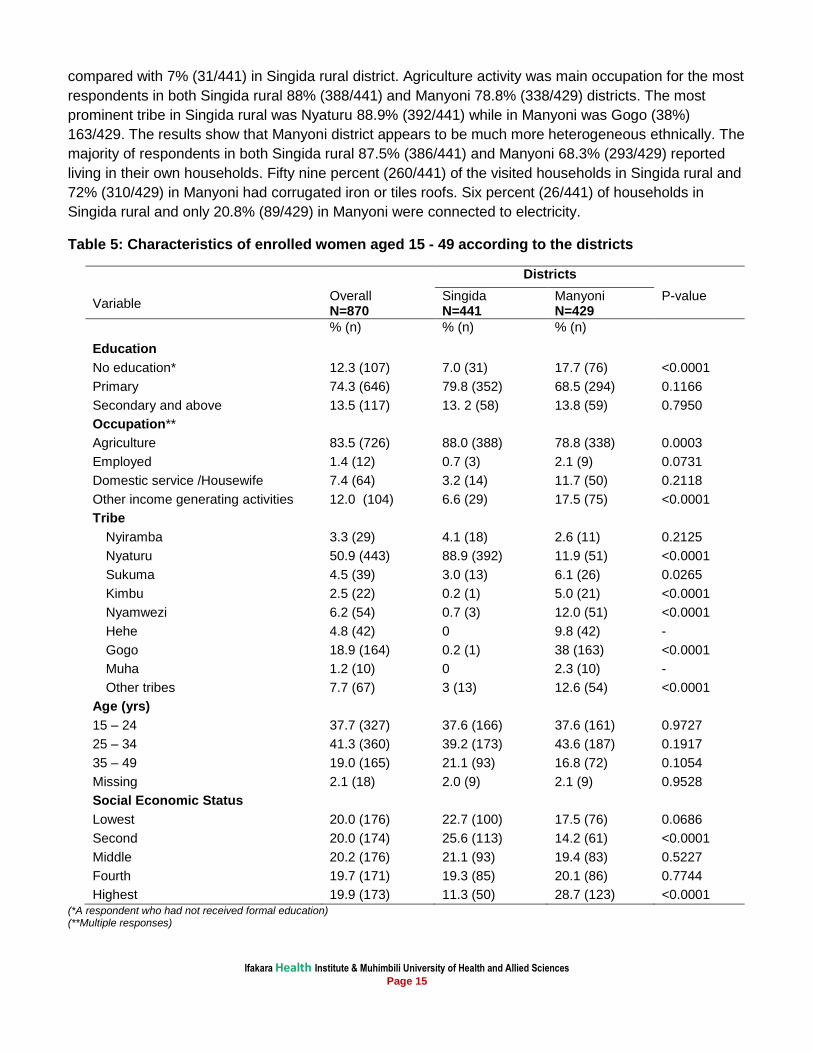
Ifakara Health Institute & Muhimbili University of Health and Allied Sciences Page 15
compared with 7% (31/441) in Singida rural district. Agriculture activity was main occupation for the most
respondents in both Singida rural 88% (388/441) and Manyoni 78.8% (338/429) districts. The most
prominent tribe in Singida rural was Nyaturu 88.9% (392/441) while in Manyoni was Gogo (38%)
163/429. The results show that Manyoni district appears to be much more heterogeneous ethnically. The
majority of respondents in both Singida rural 87.5% (386/441) and Manyoni 68.3% (293/429) reported
living in their own households. Fifty nine percent (260/441) of the visited households in Singida rural and
72% (310/429) in Manyoni had corrugated iron or tiles roofs. Six percent (26/441) of households in
Singida rural and only 20.8% (89/429) in Manyoni were connected to electricity.
Table 5: Characteristics of enrolled women aged 15 - 49 according to the districts
Districts
Variable
Overall N=870
Singida N=441
Manyoni N=429
P-value
% (n) % (n) % (n)
Education
No education* 12.3 (107) 7.0 (31) 17.7 (76) <0.0001
Primary 74.3 (646) 79.8 (352) 68.5 (294) 0.1166
Secondary and above 13.5 (117) 13. 2 (58) 13.8 (59) 0.7950
Occupation**
Agriculture 83.5 (726) 88.0 (388) 78.8 (338) 0.0003
Employed 1.4 (12) 0.7 (3) 2.1 (9) 0.0731
Domestic service /Housewife 7.4 (64) 3.2 (14) 11.7 (50) 0.2118
Other income generating activities 12.0 (104) 6.6 (29) 17.5 (75) <0.0001
Tribe
Nyiramba 3.3 (29) 4.1 (18) 2.6 (11) 0.2125
Nyaturu 50.9 (443) 88.9 (392) 11.9 (51) <0.0001
Sukuma 4.5 (39) 3.0 (13) 6.1 (26) 0.0265
Kimbu 2.5 (22) 0.2 (1) 5.0 (21) <0.0001
Nyamwezi 6.2 (54) 0.7 (3) 12.0 (51) <0.0001
Hehe 4.8 (42) 0 9.8 (42) -
Gogo 18.9 (164) 0.2 (1) 38 (163) <0.0001
Muha 1.2 (10) 0 2.3 (10) -
Other tribes 7.7 (67) 3 (13) 12.6 (54) <0.0001
Age (yrs)
15 – 24 37.7 (327) 37.6 (166) 37.6 (161) 0.9727
25 – 34 41.3 (360) 39.2 (173) 43.6 (187) 0.1917
35 – 49 19.0 (165) 21.1 (93) 16.8 (72) 0.1054
Missing 2.1 (18) 2.0 (9) 2.1 (9) 0.9528
Social Economic Status
Lowest 20.0 (176) 22.7 (100) 17.5 (76) 0.0686
Second 20.0 (174) 25.6 (113) 14.2 (61) <0.0001
Middle 20.2 (176) 21.1 (93) 19.4 (83) 0.5227
Fourth 19.7 (171) 19.3 (85) 20.1 (86) 0.7744
Highest 19.9 (173) 11.3 (50) 28.7 (123) <0.0001
(*A respondent who had not received formal education) (**Multiple responses)
Ifakara Health Institute & Muhimbili University of Health and Allied Sciences Page 16
The majority 41.4% (360/870) of women of reproductive age in the households visited were in the age
group 25-34 (table 5). With regard to socioeconomic status, respondents were asked about the
possession of specific items such as bicycle, radio, mobile phone, mosquito net and animals. These
items were weighted and categorised into five ranks: lowest, second, middle, fourth and highest social
economic status. In general, Manyoni district had a higher proportion of households with higher SES
than Singida rural district 28% (122/424) vs 11% (50/436). The following sections will present the results
according to the specific objectives of the study.
4.3 Current delivery of Reproductive and Child Health services and
service outputs
4.3.1 Vitamin A supplementation at 9, 15 and 21 months
This survey recorded vitamin A supplementation from the children growth monitoring cards. Overall, the
study found that 70% (756/1081) of the children above 9 months received the supplementation at ninth
months. Eighty seven percent (501/579) of the children in Singida rural received vitamin A
supplementation at 9 months as compared to 50.8% (255/502) in Manyoni district with p-value <0.0001.
With regards to vitamin A supplementation given to children at 15 and 21 months, results show that it
was 20.1% (102/808) and 8.4% (36/430) respectively.
Mothers of the children aged above 9 months were asked if their children were given vitamin A
supplementation. The results show that 96.3% (1041/1081) of the children were reported to have been
given vitamin A supplementation. Ninety seven (559/579) of the children in Singida rural and 96%
(482/502) in Manyoni were reported to have been given vitamin A supplementation. The results also
show that, children of the same age group were reported to have received an average of two doses of
vitamin A supplementation.
Respondents were asked about the perceived reasons of giving vitamin A supplementation to their
children. Forty five percent (200/441) of the women interviewed in Singida rural and 41% (174/429) in
Manyoni district reported that vitamin A prevents illness or keeps the baby healthy. Only 6.8% (59/870)
of the respondents reported that vitamin A supplementation prevents eye diseases while 44% (385/870)
of the women did not know any reason for giving vitamin A to their children. Another reason mentioned
for giving vitamin A was to make the child strong 8% (67/870).
4.3.2 Vitamin A supplementation by age groups
This study looked at vitamin A supplementation in different age groups from children growth monitoring
cards. There was a relatively low coverage of 53.8% (7/13) for children below 12 months. Proportions of
vitamin A supplementation in different age groups above 12 months were higher in Singida rural district
as compared to Manyoni district. With regards to the number of doses of vitamin A, the results show that
only children below 12 months received appropriate number of doses (which are two doses). In Manyoni
district, children received higher number of doses of vitamin A supplementation as compared to Singida
rural. Tables 6 and 7 summarize the results. On the other hand, ninety six percent (1052/1097) of the
women reported that their children were given vitamin A supplementation. With regards to the reported
number of doses, women in Manyoni district reported a relatively higher number of doses of vitamin A
supplementation as compared to Singida rural as shown in tables 8 and 9.
Ifakara Health Institute & Muhimbili University of Health and Allied Sciences Page 17
Table 6: Recorded vitamin A supplementation by age groups in both districts
Both Districts
Age group Received VAS Number of doses
N n % Expected (cumulative)
Number of doses given (mean)
children given expected number of doses % (n)
<12 13 7 53.8 1 2 38.5 (5)
12 – 23 861 652 75.7 3 2 1.5 (13)
24 – 35 34 29 85.3 5 2 0*
36 – 47 110 96 87.3 7 2 0*
48 – 59 74 62 83.8 9 2 0*
Missing 5 3 N/A N/A 5
Total 1097 849 77.4% 1.6 (18)
* No child was given expected number of doses
Table 7: Recorded vitamin A supplementation by district
Singida Manyoni
Age group Received VAS Number of doses Received VAS Number of doses
N (sample)
n (VAs)
% Expected (cumulative)
Number of doses given (mean)
N (sample)
n (VAs)
% Expected (cumulative)
Number of doses given (mean)
<12 9 5 55.6 1 1 4 2 50 1 5
12 – 23 433 375 86.6 3 1 428 277 64.7 3 2
24 – 35 21 18 85.7 5 1 13 11 84.6 5 3
36 – 47 71 66 93 7 2 39 30 76.9 7 4
48 – 59 53 47 88.7 9 2 21 15 71.4 9 3
Missing 5 3 - N/A N/A - - - N/A N/A
592 514 86.8 505 335 66.3
Ifakara Health Institute & Muhimbili University of Health and Allied Sciences Page 18
Table 8: Reported vitamin A supplementation by age groups in both districts
Both Districts
Age group Received VAS Number of doses
N n % Expected (cumulative)
Number of doses given (mean)
children given expected number of doses % (n)
<12 13 8 61.5 1 2 37.5 (3)
12 – 23 861 826 95.9 3 2 24.3 (209)
24 – 35 34 33 97.1 5 2 11.8 (4)
36 – 47 110 110 100 7 2 0*
48 – 59 74 70 94.6 9 3 1.4 (1)
Missing 5 5 - N/A N/A 5
Total 1097 1052 95.9% 19.8 (217)
* No child was given expected number of doses
Table 9: Reported vitamin A supplementation by district
Singida
Manyoni
Age group Received VAS Number of doses
Received VAS Number of doses
N (sample)
n (VAs)
% Expected (cumulative)
Number of doses given (mean)
N (sample)
N (VAs)
% Expected (cumulative)
Number of doses given (mean)
<12 9 6 66.6 1 1
4 2 50 1 1
12 – 23 433 417 96.3 3 2
428 409 95.6 3 2
24 – 35 21 20 95.2 5 2
13 13 100 5 3
36 – 47 71 71 100 7 2
39 39 100 7 3
48 – 59 53 50 94.3 9 2
21 20 95.2 9 3
Missing 5 5 - N/A N/A
- - - N/A N/A
592 569 96.1
505 483 95.6
Ifakara Health Institute & Muhimbili University of Health and Allied Sciences Page 19
4.3.3 Measles Immunization
The survey recorded measles immunization from the children growth monitoring cards. The results show
that six out of eleven children aged below 9 months were vaccinated against measles. Likewise, 84.5%
(918/1081) of the children aged 9 months or older were vaccinated against measles. Ninety three
percent (536/579) of the children aged 9 months or older in Singida rural were vaccinated against
measles as compared to 76.1% (382/502) of the children in the same age group in Manyoni district.
There was statistically significant difference between the two districts p-value <0.0001. Summary of the
results are shown in tables 10 and 11 below.
However, mothers were asked if their children were vaccinated against measles at 9 months and the
result shows that 95.5% (533/579) of the mothers in Manyoni and 94% (472/502) in Singida rural
reported to have vaccinated their children against measles.
With regards to the reasons for providing measles immunization to children, 57% (496/870) of the
respondents in both districts reported that measles immunization prevents measles. Other reasons given
were ‘to prevent illness or keep the child healthy’ 22% (191/870); ‘preventing diseases’ 1.2% (10/870)
and ‘making the child strong’ 0.6% (5/870). Twenty one percent (184/870) of the women did not know
the reasons for giving measles immunization to their children.
Table 10: Overall measles Immunization
Both Districts
Measles Immunized
Age group N n %
<9 months 11 6 54.5%
9 months or older 1081 918 84.9%
Missing 5 5 N/A
1097 929 84.7%
Table 11: Measles Immunization by district
Singida
Manyoni
P-value Age group
(sample)
N
(received)
n %
(sample)
N
(received)
n %
<9 months 8 5 62.5
3 1 33.3 0.3869
9 months or older 579 536 92.6
502 382 76.1 <0.0001
Missing 5 5 -
- - - N/A
592 546 92.2
505 383 75.8
Ifakara Health Institute & Muhimbili University of Health and Allied Sciences Page 20
4.3.4 Last measles seen in the catchment population and at the facilities
Health facility staff in RCH were asked when was the last time they saw a child with measles in their
catchment area and at the facility. Overall, more than half of the respondents 58.3% (14/24) had never
seen a child with measles in the catchment area. Sixty three percent (15/24) of the health facility staff in
RCH reported that they had never seen a child with measles at their facilities. Only one percent of the
health facilities RCH staff had seen a child with measles within the last month at both facility and in the
catchment area. Twenty one percent (5/24) of the in-charges had seen a child with measles in the
catchment population.
4.3.5 Deworming tablets to under five children
With regards to the deworming tablets, 63.4% (696/1097) of the under five children were reported to
have been given deworming tablets. Most of the children aged (12 – 23 months) 67.2% (291/433) in
Singida rural were given deworming tablets as compared to 48% (209/428) of the children in the same
age group in Manyoni district. Tables 12 and 13 below summarize the results.
Table 12: Overall deworming tablets to under five children
Age group
Both Districts
Received deworming tablets
N N %
<12 13 3 23.1%
12 – 23 861 500 58.1%
24 – 35 34 25 74.5%
36 – 47 110 97 88.2%
48 – 59 74 68 92.9%
Missing 5 3 N/A
1097 696 63.4%
Ifakara Health Institute & Muhimbili University of Health and Allied Sciences Page 21
Table 13: Deworming tablets to under five children by district
Singida
Manyoni
P-value Age group
(sample)
N
(received)
N %
(sample)
N
(received)
n %
<12 9 3 33
4 0 0 -
12 – 23 433 291 67.2
428 209 48.8 <0.0001
24 – 35 21 14 66.7
13 11 84.6 <0.0001
36 – 47 71 65 91.5
39 32 82.1 0.1399
48 – 59 53 50 94.3
21 18 85.7 0.2204
Missing - 3 N/A
- 0 N/A -
592 426 72
505 270 53.5
4.3.6 Vitamin A supplementation to women delivering at health facilities
Of all the women who delivered at the health facilities 69.5% (762/1097), more than a half (55.5%
(423/762)) of the respondents reported to have been given vitamin A supplementation shortly after giving
birth. The reporting was significantly higher in Singida rural 67% (233/348) as compared to Manyoni
district 45.9% (190/414)(p-value <0.0001). However 4.4% (34/765) of women couldn’t remember if they
were given vitamin A.
The study wanted to see if there was an association between social economic status of the respondents
and education against vitamin A supplementation for women delivering at health facilities. Overall, there
was no association between social economic status and vitamin A supplementation for women delivering
at health facilities. However, there was an association between vitamin A supplementation for women
delivering at health facilities and education. Many women with primary and secondary education were
more likely to receive vitamin A supplementation shortly after delivery as compared to those with no
education. Tables 14 and 15 below summarize the results.
Table 14: Vitamin A supplementation to women delivering at health facilities vs social economic status of the respondents
Variable Social Economic Status
X2
P-Value
Lowest Second Middle Fourth Highest
Overall % (n/N) 56.9 (62/109)
56.5 (78/138)
60.1 (92/153)
58.1 (101/174)
47.9 (90/188)
18.5784 0.099
Singida % (n/N) 72.2 (39/109)
65.9 (56/138)
73.9 (51/153)
68.7 (57/174)
52.6 (30/188)
15.1926 0.231
Manyoni % (n/N) 41.8 (23/55)
41.5 (22/53)
48.8 (41/84)
48.4 (44/91)
45.8 (60/131)
15.7047 0.205
(Independent variables)
Ifakara Health Institute & Muhimbili University of Health and Allied Sciences Page 22
Table 15: Vitamin A supplementation to women delivering at health facilities vs education of the respondents
Variable
Overall
Education
X2 P-Value
No education Primary Secondary+
Overall % (n/N) 55.5
(423/762)
41.7
(35/84)
58.6
(332/567)
50.5
(56/111) 13.0096 0.043
Singida % (n/N) 67.0
(233/348)
72.2
(13/18)
70.0
(198/284)
46.8
(22/34) 12.1218 0.059
Manyoni % (n/N) 45.9
(190/414)
33.3
(22/66)
47.2
(134/284)
53.1
(34/64) 6.2679 0.394
(Independent variables)
4.3.7 Nutrition to under-fives children
With regard to the nutrition, we asked mothers or caregivers the usual type of food given to the child in
addition to breastfeeding. We wanted to capture if the food was given daily or sometimes. Grains were
the most prominent foodstuff given daily to the children in both districts 81% (893/1097). In addition, 84%
(683/1097) of mothers/caregivers reported to have sometimes given their children grains in both districts.
Table 16 below summarizes the type of foodstuff usually given to children.
Table 16: Foods usually given to children in addition to breast feeding
Districts
Variable Overall N=1097
Singida N=592
Manyoni N=505
P-Value
% (n) % (n) % (n)
Daily given grains 81.4 (893) 78.0 (462) 85.4 (431) 0.0019
Daily given protein 11.3 (124) 6.8 (40) 16.6 (84) <0.0001
Daily given vegetables 5.4 (59) 2.4 (14) 8.9 (45) <0.0001
Daily given fruits 2.2 (24) 2.7 (16) 1.6 (8) 0.2068
Given nothing 0.1 (1) 0.2 (1) 0 0.3555
Sometimes given grains 84.2 (683) 88.9 (345) 79.9 (338) 0.0032
Sometimes given protein 13.7 (111) 5.9 (23) 20.8 (88) <0.0001
Sometimes given vegetables 5.7 (46) 3.4 (13) 7.8 (33) 0.0004
Sometimes given fruits 11.6 (94) 8.3 (32) 14.7 (62) 0.0001
(Multiple responses were allowed)
The study shows that 67.3% (716/1097) of the children under-five years were being breastfed and given
complementary foods. Thirty seven percent (262/716) of those children were greater than 18 months.
Most of the children 96.2% (252/261) above 18 months were daily given grains. These children were
less given protein 24.1% (61/261), vegetables 3.8 (10/261) and fruits 14.5% (38/261).There was a
Ifakara Health Institute & Muhimbili University of Health and Allied Sciences Page 23
significant difference between the two districts for the children 18 months who were daily given grains
while weaned breast milk with p-value 0.0019. Table 18 summarizes the results.
Table 17: Foods usually given to children above 18 months while being weaned breast milk
Districts
Variable Overall Singida Manyoni
X2 P-Value
N=261 N=135 N=127
% (n) % (n) % (n)
Daily given grains 96.2 (252) 93.3 (126) 99.2 (126) 6.1615 0.0019
Daily given protein 24.1 (62) 26.7 (36) 21.3 (27) 1.0474 0.306
Daily given vegetables 3.8 (10) 5.9 (8) 1.6 (2) 3.3747 0.066
Daily given fruits 14.5 (38) 17.8 (24) 11.0 (14) 2.4074 0.121
Sometimes given grains 12.6 (34) 13.3 (18) 12.6 (16) 0.0876 0.957
Sometimes given protein 8.8 (23) 8.9 (12) 8.7 (11) 0.0996 0.951
Sometimes given vegetables 3.8 (10) 3.7 (5) 3.9 (5) 0.133 0.936
Sometimes given fruits 3.8 (10) 1.5 (2) 6.3 (8) 5.2933 0.071
(Multiple responses were allowed)
With regards to foods given to the children above 18 months in relation to social economic status, the
results show that there were associations of social economic status in relation to children who were daily
given fruits. Likewise, there was also an association between children sometimes given protein, given
vegetables and given fruits with social economic status of the parents/guardians. Mothers with highest
social economic status were likely to sometimes give their children protein and fruits while those with
lowest social economic status were more likely to sometimes give their children vegetables.
In addition, there was no association between the children who were daily and sometimes given fruits
against mothers/guardians education. The only noted association was between mothers/guardians
education against children who were daily given fruits. Mothers with secondary school education were
more likely to give fruits daily to their children than those with no education or with primary education.
Tables 18 and 19 summarize the results.
Ifakara Health Institute & Muhimbili University of Health and Allied Sciences Page 24
Table 18: Foods usually given to children above 18 months while being weaned breast milk Vs social economic status of the respondents
Variable
Overall Social Economic Status
X2
P-Value N=261
Lowest N=54
Second N=62
Middle N=46
Fourth N=54
Highest N=46
% (n) % (n) % (n) % (n) % (n) % (n)
Daily given grains 96.2 (252) 96.3 (52) 96.8 (60) 95.7 (44) 98.2 (53) 93.5 (43) 1.5809 0.812
Daily given protein 24.1 (62) 22.2 (12) 22.6 (14) 17.4 (8) 35.2 (19) 21.7 (10) 5.0893 0.278
Daily given vegetables 3.8 (10) 7.4 (4) 3.2 (2) 0 5.6 (3) 2.2 (1) 4.5637 0.335
Daily given fruits 14.5 (38) 5.6 (3) 22.6 (14) 4.4 (2) 20.4 (11) 17.4 (8) 12.3829 0.015
Sometimes given grains 12.6 (34) 9.3 (5) 11.3 (7) 17.4 (8) 20.4 (11) 6.5 (3) 15.2549 0.054
Sometimes given protein 8.8 (23) 5.6 (3) 4.8 (3) 4.4 (2) 13.0 (7) 17.4 (8) 16.8091 0.032
Sometimes given vegetables
3.8 (10) 7.4 (4) 4.8 (3) 4.4 (2) 0 2.2 (1) 19.5666 0.012
Sometimes given fruits 3.8 (10) 0 8.1 (5) 0 3.7 (2) 6.5 (3) 17.0755 0.029
(Multiple responses were allowed)
Table 19: Foods usually given to children above 18 months while being weaned breast milk Vs education of the respondents
Variable Overall N=261
Education
X2
P-Value
No education N =32
Primary N=193
Secondary+ N=37
% (n) % (n) % (n) % (n)
Daily given grains 96.2 (252) 100 (32) 95.9 (185) 94.6 (35) 1.5809 0.454
Daily given protein 24.1 (63) 21.9 (7) 23.3 (45) 29.7 (11) 0.7933 0.673
Daily given vegetables 3.8 (10) 6.3 (2) 4.2 (8) 0 20,410 0.36
Daily given fruits 14.5 (38) 3.1 (1) 14.5 (28) 24.3 (9) 6.219 0.045
Sometimes given grains 12.6 (34) 18.8 (6) 12.4 (24) 10.8 (4) 2.2614 0.688
Sometimes given protein 8.8 (23) 3.1 (1) 8.8 (17) 13.5 (5) 6.0385 0.196
Sometimes given vegetables 3.8 (10) 12.5 (4) 2.6 (5) 2.7 (1) 7.8165 0.099
Sometimes given fruits 3.8 (10) 3.1 (1) 3.6 (7) 5.4 (2) 1.6901 0.793
(Multiple responses were allowed)
4.3.8 Knowledge, attitudes and current health seeking behaviour
The study assessed knowledge, attitudes and current health seeking behaviour among the
women/guardians and the community at large. With regard to the general illnesses facing under five
children in the community, responses from FGD sessions with community members when asked about
the most common problem showed that Malaria, pneumonia, measles and eye illnesses were the most
Ifakara Health Institute & Muhimbili University of Health and Allied Sciences Page 25
reported health problems. However, other chronic illnesses mentioned include: coughing, diarrhea, and
fever. The most reported causes of illnesses included malnutrition, weather changes and lack of
preventive measures like Insect treated Nets (ITN). This was consistent with data from the health facility
survey whereas fever, diarrhea and pneumonia were common mentioned by health care providers as
most diseases seen to under five children. For example, in some of the FGD sessions in both district,
participants had this to say:
“Children are suffering from fever, diarrhea and worms especially during rainy season” Participant, FGD
session, Manyoni district.
“In fact, children suffer from diseases like eye illness. You may see children playing while one of them is
sick” Participant, FGD session, Singida district
“During rainy season until the time when people starts to harvest crops, people get sick frequently.
Children suffer mainly from worms and sometimes from eye illness during hot season. All my children
suffered from eye illnesses recently. Other diseases that affect our children include rashes. I have also
seen children with rashes” Participant, FGD session Singida rural
Community members were also asked about the steps taken when a child become sick. The majority of
respondents (mothers, grandmothers and fathers) in FGD sessions in both Manyoni and Singida rural
districts reported to have sought care from health facilities. However, some respondents reported to
have sought care from drug shops as well as self-medication. Health facilities were the first source of
treatment followed by self-medication and traditional healers. If a child does not get better after first
source, the child was reported to be taken to the second source of treatment. These include: traditional
healers, district hospital and regional hospital. With regards to the place of eye care seeking, majority of
respondents reported to have sought care from dispensaries and followed by hospitals. Home remedies
were reported by a few respondents. The following typical statements were recorded:
“Like others have earlier said, when you get illness you have to go to an expert at a health facility to seek
further medical assistance. As we have said, you cannot just buy drugs for a child at the local shops
because the baby cannot speak like an adult; you need to take the child to dispensary” Participant, FGD
session Singida Rural
“To me for example, If I take a child to a dispensary and doesn’t get better, I usually go to the health
centre, and if still the child doesn’t get better I go to the district hospital or regional hospital ” Participant,
FGD session Singida Rural
“The last resort depends on the discussion with a clinician. I may ask a doctor to let me take the child for
more investigation at higher facility like St. Gasper. If that option fails, we have our local remedies which
we also use.” Participants, FGD session, Manyoni district.
4.3.9 Common illnesses in children
From the household survey, the study also wanted to quantify if eye problems were common in children
in the study districts. Sixty eight percent (592/870) of the mothers of under-five children in both districts
Ifakara Health Institute & Muhimbili University of Health and Allied Sciences Page 26
reported that eye problems were common in children, while 9.2% (80/870) of the mothers did not know
whether eye problems were common in children.
Women in the visited communities who reported eye problem as common in children were also asked to
mention the common eye conditions in children. The common reported eye conditions by the mothers of
children under-five included: red, watering or sticky eyes reported at 73% (214/295) in Singida rural and
74.4% (221/297) in Manyoni district. Trachoma illness was more commonly reported 20% (58/297) in
Manyoni district as compared to 8% (23/295) in Singida rural. Other eye illnesses that were also
prominent in the surveyed districts are shown in the table 20 below.
Table 20: Mothers’ perceptions on the commonest eye conditions in children in the community
Districts
Variable Overall N= 592
Singida N=295
Manyoni N=297
P-Value
% (n) % (n) % (n)
Sore, irritable, itchy eyes 14.0 (83) 11.5 (34) 16.5 (49) 0.0814
Trachoma 13.7 (81) 7.8 (23) 19.5 (58) <0.0001
Red, watering or sticky eyes 73.5 (435) 72.5 (214) 74.4 (221) 0.6066
Injuries / something in the eyes 1.7 (10) 1.0 (3)
2.4 (7) 0.2059
Other 14.4 (85) 13.2 (39) 15.5 (46) 0.4314
Don’t know 6.4 (38) 5.4 (16) 7.4 (22) 0.3248
(Multiple responses were allowed)
From the qualitative findings, the most reportedly eye problems were red eyes, discharging eyes and
trachoma. Other reported eye problems mentioned were blindness and itching eyes. With regards to the
causes of eye illnesses, participants in FGD session reported that weather changes, dust and flies were
commonly main causes of the eye illnesses. However, in some FGD sessions, respondents did not know
the causes of eye illness. The following quotes explain about the association of weather changes and
eye illness:
“There is a time when we say it is due to weather changes. If you visit our village you will hear everyone
talking about eyes illness. That is why we conclude by saying that it is weather changes” FGD session
Singida Rural.
“We may also associate eye illness with dust and rain. Most eye cases decreases during rain seasons
but increases during hot seasons when there is much dust”. FGD session Singida Rural
4.3.10 Perceived reasons for eye illness
The study also wanted to understand the perceived reasons for eye illness in the community. Majority
48.5% (422/870) of the women or caregivers reported that dirty and dusty environment were the main
reason for eye illness in children. There was a significant difference between the study districts, Manyoni
having higher proportion 61.5% (264/429) of respondents who mentioned that dirty and dusty
environments were the main reason for eye illness in children as compared to Singida rural district which
Ifakara Health Institute & Muhimbili University of Health and Allied Sciences Page 27
reported at 35.8% (158/441)(p-value <0.0001). Flies were also mentioned as the next perceived reason
for eye illness after dirty and dust environment as shown in the table 21 below.
Table 21: Perceived main reasons of contacted eye diseases in children
Districts
Variable Overall N=870
Singida N=441
Manyoni N=429
P-Value
% (n) % (n) % (n)
Seasonal disease 9.1 (79) 4.5 (20) 13.8 (59) <0.0001
Dirty, dusty environment 48.5 (422) 35.8 (158) 61.5 (264) <0.0001
Problem that runs in the family 1.8 (16) 0.5 (2) 3.3 (14) 0.0020
Flies 24.7 (215) 11.3 (50) 38.5 (165) <0.0001
Be bewitched, angering spirits 0.6 (5) 0 1.2 (5) 0.0230
Lack of vitamin and nutrition 0.8 (7) 0.7 (3) 0.9 (4) 0.6773
Fever 0.6 (5) 0.7 (3) 0.5 (2) 0.6762
(Multiple responses were allowed)
4.3.11 Community perceptions on preventive methods for eye illness
We also asked the respondents in the visited households on the preventive methods for eye illness in
the community. Although there was no significant difference between the two districts, the majority 38%
(330/870) of the respondents reported that they keep their children’s faces clean. Washing baby’s face
frequently was reported as another method used to prevent eye illness in the community. This
prevention method was significantly reported in Manyoni district 39% (166/429) as compared to 17%
(76/441) in Singida rural district. However, 26.2% (228/870) of the respondents did not know the
preventive methods of eye diseases in children. There were no reported association between social
economic status and education of the respondents against the reported prevention methods. The table
22 below shows the prevention methods applied for eye illness.
Table 22: Perceived prevention methods of eye diseases in children
Districts
Variable
Overall N=870
Singida N=441
Manyoni N=429
P-Value
% (n) % (n) % (n)
Give him/her vaccine 8.3 (72) 5.2 (23) 11.4 (49) 0.0009
Wash his/her face frequently 27.8 (242) 17.2 (76) 38.7 (166) <0.0001
Keep him/her clean 37.9 (330) 34.9 (154) 41.0 (176) 0.0635
Take him/her away from witches 0.2 (2) 0.2 (1) 0.2 (1) 0.9844
Give vitamin A 1.3 (11) 0.7 (3) 1.9 (8) 0.1180
Don’t Know 26.2 (228) 34 (150) 18.2 (78) <0.0001
(Multiple responses were allowed)
Ifakara Health Institute & Muhimbili University of Health and Allied Sciences Page 28
4.3.12 Health care providers’ knowledge assessment
Heath care providers were asked about the duration they had worked in the visited health facilities.
Majority reported to have been working in the health facilities for more than five years and had never
been transferred. Likewise, they also reported to have not been satisfied with the health facility
infrastructure. Health provider’s knowledge was assessed by asking questions related to the
interventions.
With regard to the knowledge on vitamin A supplementation, we asked health care providers through in-
depth interviews about the reasons and the intervals for giving vitamin A supplementation and measles
immunization to children. Majority of the health care providers were aware that Vitamin A
supplementation prevents eye illness. With regard to the time intervals, most of the respondents
reported that vitamin A supplementation is given every six months during mass campaigns while
measles immunization is provided at nine months. For example, the following typical statements were
documented:
“We provide vitamin A supplementation to the children in order to improve their health, eye in particular.
They are supplemented every after six months”. In-depth interview with HCP, Singida rural
“The child gets measles vaccination once and this is at nine month” In-depth interview with HCP,
Manyoni district
“Measles vaccination is provided once at nine month. But we have heard that there is another one
(second dose) coming” In-depth interview with HCP, Singida rural
4.3.13 Health care providers’ knowledge on eye conditions
Reproductive and child health care providers were asked about how often they see children with eye
problems. Thirty nine percent (12/27) reported to have seen children with eye problems once or more
times in a week while 19.4% (6/27) of the respondents reported once a month and 38.7% (12/27) less
than once a month. Respondents from Manyoni district reported to have seen a few children with eye
problem as compared to Singida Rural district. Table 23 below summarizes the results.
Table 23: Frequency of encountering children with eye problem
Districts
Variable Overall N=27
Singida N=14
Manyoni N=13
P-Value
% (n) % (n) % (n)
Once a week or more 35.5 (11) 43.8 (7) 26.7 (4) 0.3096
About once a month 19.4 (6) 37.5 (6) 0 -
Less than a month 38.7(12) 6.3 (1) 73.3(11) 0.0001
Missing 6.5 (2) 12.5 (2) 0 -
With regard to the eye problem we asked health care providers to mention the common eye problems
seen in children in the surveyed districts. Ninety two percent (22/24) of the health care providers
Ifakara Health Institute & Muhimbili University of Health and Allied Sciences Page 29
reported to have seen red, discharging eyes within the first month of birth. This was commonly reported
in Manyoni district at 100% (11/11) as compared to Singida rural which was 85% (11/13). Likewise, red
eye with discharge in older children was reported to be 8.3% (2/24) while itches were around 4.2%
(1/24) and 17% (4/24) reported other eye conditions. The summary of the findings are presented in the
table 24 below.
Table 24: Reported common eye conditions seen in children
Districts
Variable Overall N=24
Singida N=13
Manyoni N=11
P-Value
% (n) % (n) % (n)
Red eye with discharging in first month 91.7 (22) 84.6 (11) 100 (11) 0.1742
Red eye with discharge in older children 8.3 (2) 7.7 (1) 9.1 (1) 0.9017
Itches 4.2 (1) 7.7 (1) 0 -
Others 16.7 (4) 7.7 (1) 27.3 (3) 0.1997
(Multiple responses were allowed)
Health care providers in RCH were also asked whether they feel confident in examining children’s eyes.
About 43% (13/30) of the respondents reported to have felt somewhat confident while 40% (12/30)
reported to be very confident and 17% (5/30) were not confident in examining children’s eyes.
Table 25: Health care providers who feel confident in examining children’s eyes
Districts
Variable Overall N=30
Singida N=15
Manyoni N=15
P-Value
% (n) % (n) % (n)
Yes, very confident 40.0 (12) 46.7 (7) 33.3 (5) 0.4561
Somewhat confident 43.3 (13) 33.3 (3) 53.3 (8) 0.0582
Not Confident 16.7 (5) 20.0 (3) 13.3 (2) 0.6242
We also asked if HCP feels confident in treating children’s eye. Only 39% (11/30) of the respondents
reported to be very confident while 36% (10/30) reported to have felt somewhat confident and 25%
(7/30) were not confident in treating children’s eyes.
4.3.14 Eye care knowledge assessment (images and case studies)
The study assessed knowledge of health care providers on different children eye conditions. Health care
providers were provided with different images which included: cataract; trauma; ophthalmia neonatorum;
mild trauma; measles and conjunctivitis as shown in figure 3 in page 12.
Ifakara Health Institute & Muhimbili University of Health and Allied Sciences Page 30
Image 1: Cataract
With regard to the first image, the following questions were posed: what did health care providers notice
wrong with the child eyes and if they had ever seen this condition before; what eye condition was that
and what could they do? These questions had pre-corded answers.
Ninety percent (28/31) of the health care providers reported that the pupils were white. Only 6.7% (2/31)
of the respondents reported anything other than a white pupil and 3.2% (1/31) didn’t know what was
wrong with the eyes. Likewise, 71% (22/31) had seen this condition before and 71% (22/31) mentioned
that this was cataract. With regard to the action to be taken, 84% (26/31) reported that they could refer
the child urgently.
Image 2: Trauma
With regard to the second image (on figure 3 in page 13), two questions were posed: what did health
care providers notice wrong with the child eyes and what could they do? Twenty three percent (7/31) of
the health care providers reported that the pupil was not round. Only 10% (3/31) of the respondents repo
rted something coming out of the eye while 48% (15/31) reported anything other than the above and
19% (6/31) couldn’t know what was wrong with the eyes. With regard to the action to be taken, 90%
(28/31) of the respondent reported that they could urgently refer the child.
Image 3: Ophthalmia neonatorum
With regard to the image three, the following questions were posed: what did health care providers
notice wrong with the child eyes and if they had ever seen this condition before; what eye condition was
it and what could they do? Ninety seven percent (30/31) of the HCP noticed swollen eye lids with
discharge. Likewise, 90% (28/31) had seen this condition before and 90% (28/31) mentioned that this
was infection with sexually transmitted diseases or ophthalmia neonatorum and 6% (2/31) could not
understand this condition. Lastly, 39% (12/31) reported that they could clean the eyes; 29% (9/31)
reported that they could give injection of antibiotics and 13% (4/31) of the respondents mentioned that
they could refer the child urgently and 19.3% (6/31) mentioned other things different from the above.
Image 4: Mild trauma
An image with a mild trauma (image 4) was shown to the health care providers and asked what was
wrong with the child’s eye. Most respondents reported that the eye was very red 64.5% (20/31), and
13% (4/31) reported that there was a bleed in the eye and 23% (7/31) of the respondents mentioned
other causes different from the above. Only 16% (5/31) of the respondents said that they had seen this
condition before. Thirteen percent (4/31) of the respondents reassured the mother that it would get better
while 80.7% (25/31) mentioned other measures other than the above; 6.4% (2/31) reported to have no
treatment for such a case and 9.7% (3/31) didn’t know any measure they could take.
Image 5: Measles
With regard to the fifth image, we asked a set of three questions with pre-corded answers. The first
question was what was wrong with the child and if the condition can affect the child’s eyes and lastly
what can be done to prevent eyes problems from this condition. Eighty four percent (26/31) of the health
Ifakara Health Institute & Muhimbili University of Health and Allied Sciences Page 31
care providers said that it was measles. Only 16% (5/31) mentioned other conditions. Health care
providers were asked to mention if measles can affect eyes. Almost all the health care providers 97%
(30/31) said that the condition can affect eyes. With regard to prevention of the problem, 42% (8/31) of
the respondents reported that giving vitamin A supplementation could help to prevent eye problem while
6.5% (2/31) said antibiotic drops/ointment; 42% (13/31) reported anything other than the above and 10%
(3/31) of the respondents did not know how to prevent the condition. Table 26 summarizes the results.
Table 26: Reported preventive methods of measles condition (responses to image 5)
Districts
Variable
Overall N=31
Singida N=15
Manyoni N=16
P-Value
% (n) % (n) % (n) Give vitamin A supplementation 41.9 (8) 33.3 (5) 50.0 (8) 0.3473
Antibiotic drops/ointment 6.5 (2) 6.7 (1) 6.3 (1) 0.9624
Anything other than above 41.9 (13) 46.7 (7) 37.5 (6) 0.6052
Don’t know 9.7 (3) 13.3 (2) 6.3 (1) 0.5050
Image 6: Conjunctivitis
With regard to the image six, the following questions were posed: what did health care providers notice
wrong with the child’s eyes and if they had ever seen this condition before; what eye condition was that?
what could the HCP do? and lastly, what could HCP tell the mother? These questions had pre-corded
answers. Eighty seven percent (27/31) of the respondents reported that the eye was red with discharge.
Forty eight percent (15/31) of the respondents reported to have seen this condition before. Likewise,
61.3% (19/31) of the respondents reported that the condition was conjunctivitis/infection. On the other
hand, 26% (8/31) didn’t know this eye condition and 13% (4/31) of the respondents mentioned other
things different from the conjunctivitis. With regard to the action to be taken by health care providers,
39% (12/31) could provide antibiotics; 52% (16/31) mentioned other things different from providing
antibiotics while 6.4% (2/31) didn’t know what to do.
With regard to the action they would take to inform mother about the illness, 42% (13/31) of the
respondents reported to advice mother to put the drops as prescribed while 52% (16/31) mentioned
other things different from the above and 6.4% didn’t know what to tell the mother.
5. The provision of eye care services, referral pathways and
record keeping
5.1 The provision of eye care services All health facility in-charges of the visited health facilities were asked about the management of
ophthalmia neonatorum as a service to manage eye conditions in neonates. The result shows that all
health facilities manage ophthalmia neonatorum through “start treatment and see the patient again”.
With regard to management of red eye/conjunctivitis in older children, 92% (22/24) reported that they
Ifakara Health Institute & Muhimbili University of Health and Allied Sciences Page 32
practice “start treatment and see the patient again”. The most treatment administered includes eye
ointment 75% (18/24); Eye drop 13% (3/24); antibiotic injectable 4% (1/24).
5.2 Ocular prophylaxis
With regard to provision of ocular prophylaxis to new born babies to prevent conjunctivitis of the new
born in health facilities visited, the in-charges were asked if the service is performed. Results show that
ocular prophylaxis is performed by 58.3% (14/24) to all new born babies while 4.2 (2/24) HCP performed
the procedure only if STD has been detected in the mother. There was no statistically significant
difference on performing ocular prophylaxis between the two districts with 0.7925 p - value.
5.3 Referral mechanism
With regard to the referral mechanisms we asked health facilities’ in-charges if they had ever referred
children to another facility. Eighty three percent (20/24) of the respondents in visited health facilities
reported to have referred children to another facility. Among of the referred cases, 90% (19/20) were
provided with details while standard referral forms were used by only 25% (5/20). About 30% (6/20) of
the health facilities which referred the cases received feedback from the referral made. The commonest
reported reasons for referrals were malaria/fever 58% (14/24), followed by diarrhea 29% (7/24) and
failure to thrive 17% (4/24).
5.4 Health facility record keeping
Record keeping was also a point of interest for this study. In-charges of the visited health facilities were
asked if ocular prophylaxis performed is recorded in the register at delivery. Thirty three percent (8/24)
reported that ocular prophylaxis is recorded in the register. With regard to recoding of vitamin A
supplementation to children, the results show that 95.8% (23/24) of the health facilities provided and
recorded vitamin A supplementation in the registers in the previous month before the survey. Likewise,
the record shows that 79.2% (19/24) of the visited health facilities provided vitamin A supplementation to
the women on routine basis. Record reviews revealed that 87% (20/24) of the health facilities referred
children to another facility and 90% (18/24) provided details of place of the referral point.
At regional level, the findings from OPD register showed that the age of the patient, place of residence
and diagnosis were always recorded. There were no routine recording for patients referred in or out of
the facility.
6. Elements of the health system that need to be strengthened
6.1 Supervision
Supervision was also a point of interest in this study. We wanted to know if the facility had been visited in
the last six months by RCH supervisor. Almost all 96% (23/24) of health facilities in-charges interviewed
reported to have been visited in the period of six months prior to the survey. Of those who were visited,
the in-charges were asked about activities that the supervisor did. More than half (13/23) of the health
care providers who were visited reported that the supervisor collected data; 87% (20/23) reviewed
records; 47.8% (11/23) of the supervisors provided supplies; 39% (9/23) observed health talks; 43.5%
Ifakara Health Institute & Muhimbili University of Health and Allied Sciences Page 33
(10/23) conducted clinical training; 60.9% (14/23) listened to problems; 30.4% (7/23) offered to solve
problems; 47.8% (11/23) supervisor courtesy call only and 43.5% (10/23) of the supervisor made
observation (clinical mentoring).
The study also wanted to know how long did the supervisor stay at a facility. Majority, 57% (13/23) of the
supervisors stayed at a facility for 1-2 hours. Likewise, 26% (6/23) of the supervisors spent more than
two hours while 13% (3/23) stayed for less than one hour.
With regard to qualitative information (in-depth interviewers with health facilities’ in-charges) on
supervision, majority of the respondents reported to have been supervised within six months before the
interview. Although health care providers acknowledged that they felt supported during supervision, most
of them said that the supervision did not involve case management observation by the supervisors. A
checklist is sometimes used to assess the facility. The most common method of giving feedback was
through meetings. The following typical statements were made:
“When the supervisor came he checked the environment, clinical records and the drugs. He called a
meeting thereafter and insisted on the better use of drugs and the Community Health Fund (CHF). The
supervisor didn’t observe when I was with the client”. HCP, Manyoni district
“It was a normal supervision that the supervisor asked some questions only and gave some instructions
because it was late in evening” HCP, Singida rural district.
6.2 Health facility equipments and supplies
In terms of availability of equipments and supplies, health facilities in-charges were asked if the facility
had functional torches, antibiotic eye drops/ointment, injectable antibiotics and sterile eye pads.
Antibiotic eye drops/ointment and injectable antibiotics were available at 88% (21/24). Twenty one
percent (5/24) of the visited health facilities had functional touches and sterile eye pads. Sterile eye pads
were available at Mtinko and Kintinku health centres.
7. Barriers to implementation
7.1 The proximity to health facilities
With regards to the proximity to health facilities, we asked women or care takers how far they live from
the health facilities; within 5 kilometres; between 6-10 kilometres and beyond 15 kilometres from the
health facilities. Seventy percent (299/429) of women/care takers in Manyoni reported to be living within
five kilometres from health facilities as compared to 25.2% (111/441) in Singida rural. However, 74%
(328/441) of the respondents in Singida rural could not estimate the distance from their home to the
health facilities as compared to 26% (111/429) of the respondents in Manyoni district. Majority of the
respondents 96.4% (839/870) in both districts went to the health facilities on foot. There was statistically
significant difference between travelling by foot in Singida rural as compared to Manyoni with a (p-value
<0.0001). Singida rural had many respondents travelling on foot as compared to Manyoni district. The
table 27 below shows more details about the distance to the nearest health facility.
Ifakara Health Institute & Muhimbili University of Health and Allied Sciences Page 34
Table 27: The proximity to health facilities
District
Distance Overall N=870
Singida N=441
Manyoni N=429
P-Value
% (n) % (n) % (n)
Within 5 km 47.1 (410) 25.2 (111) 69.7 (299) <0.0001
6 – 10 2.1 (18) 0.2 (1) 4.0 (17) 0.0001
> 15 0.3 (3) 0.2 (1) 0.5 (3) 0.3030
I don’t know 50.5 (439) 74.4 (328) 25.9 (111) <0.0001
7.2 Community challenges and copying mechanisms
Participants were also asked to mention the challenges which are encountered when a baby gets sick in
the family. The most commonly reported challenges in FGD sessions were financial constraints, with
difficulties in mobilizing cash. Another problem reported during FGD sessions was lack of transport to
the health facility. The following are some of the quotes from the FGD sessions related to the challenges
in cash mobilization when the child gets sick:
“The first main challenge is when the child is sick and parents are not prepared. Illness comes
unplanned and sometimes there might be no cash to send the child to the dispensary or health centre”
Participant, FGD session, Singida rural.
“First of all economically I have to think about what to do in order to get some money for child treatment.
I have also to struggle to get cash even through borrowing” Participant, FGD session, Manyoni district
“In this village for example, most of the women do not have business, they mainly depend on agriculture.
Sometimes a child might get an accident by falling from a tree and you might sell a reserved sack of
sunflower or sorghum, chicken, sheep or cow to support for health facility services” Participant, FGD
session, Singida rural.
7.3 Health education in the visited health facilities
Women or care takers were asked if the health facilities they visit provide health education. About
seventy six percent (830/1097) of the respondents reported to have been given health education when
attending clinics. Eighty two percent (485/592) in Singida rural compared with to 68.3% (345/505) in
Manyoni district.
7.4 Frequency of health talks
The study captured the frequency of health education talks at the visited health facilities. The pre-corded
answers were: ‘yes every time I attend there were health education’; ‘yes sometimes there was heath
education’ and ‘no there is rarely health education’. Overall, 43.7% (380/870) of respondents reported
that there was health education every time they attend. Singida rural reported higher proportion 62%
(277/441) of women who heard health education every time they attend at health facilities compared to
24% (103/429) in Manyoni. Respondents were asked about the topics covered during health education.
The most prominent topics covered were nutrition or growth monitoring 67.6% (561/830) followed by
breastfeeding 31.2% (259/830) and reproductive and child health 30.1% (195/830). With the exception
Ifakara Health Institute & Muhimbili University of Health and Allied Sciences Page 35
of measles and reproductive and child health topics, there were no statistically significant differences to
the rest of the topics heard in Manyoni and Singida rural districts. Table 28 below shows the details of
the topics covered.
Table 28: Topics heard by mothers during health education sessions
Districts
Variable Overall N=830
Singida N=485
Manyoni N=345
P-Value
% (n) % (n) % (n)
Fever 4.1 (34) 3.5 (17) 4.9 (17) 0.2976
Measles 5.4 (43) 1.2 (6) 10.7 (37) <0.0001
Diarrhea 1.6 (13) 1.7 (8) 1.5 (5) 0.8742
Nutrition/growth 67.6 (561) 64.3 (312) 72.2 (249) 0.1082
Breast feeding 31.2 (259) 33 (160) 28.7 (88) 0.1364
Chest infections 2.7 (22) 2.5 (12) 2.9 (10) 0.8279
Vaccination 1.5 (10) 2.2 (8) 0.7 (2) 0.1246
Reproductive and child health 30.1 (195) 19.2 (70) 43.9 (125) <0.0001
HIV/AIDS 3.4 (22) 2.2 (8) 4.9 (14) 0.0579
(Multiple responses were allowed)
7.5 Health talks on eye conditions: Clients’ perspectives
Women were also asked if they had ever heard about a health talks on eye conditions at their clinics.
Only 23.6% (196/873) of the respondents reported to have heard about health talks on eye conditions in
both Singida rural and Manyoni districts.
7.6 Health talks on eye conditions: Providers’ perspectives
In connection to the above, the study asked the RCH staff in the visited health facilities if they provide
health education related to eye conditions. Forty four percent (12/27) of the health care providers
reported to have provided health talks related to eye conditions in children. There was a significant
difference between Singida rural 50% (7/14) and Manyoni district 39% (5/13) in relation to the health
education on eye illness.
7.7 Mothers/guardians knowledge on exclusive breastfeeding
With regard to exclusive breastfeeding, the respondents were asked for how long should a child be
exclusively breastfed. This question aimed at testing the level of knowledge on exclusive breastfeeding.
Majority of the respondents in both Singida rural 85% (374/441) and Manyoni 74% (318/429) districts
respectively reported that children are exclusively breastfed for six months. With regards to the best
foods to give young children while weaning, majority of the respondents 97% (840/870) in both districts
reported to give them grain foodstuff.
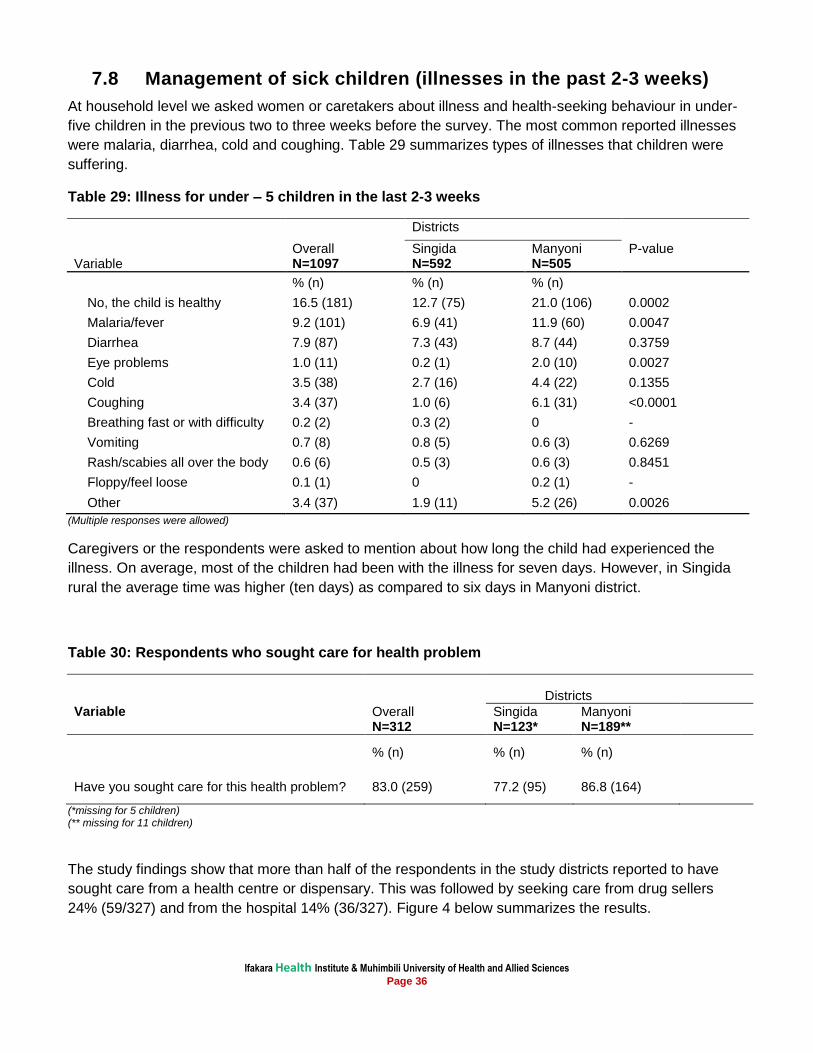
Ifakara Health Institute & Muhimbili University of Health and Allied Sciences Page 36
7.8 Management of sick children (illnesses in the past 2-3 weeks)
At household level we asked women or caretakers about illness and health-seeking behaviour in under-
five children in the previous two to three weeks before the survey. The most common reported illnesses
were malaria, diarrhea, cold and coughing. Table 29 summarizes types of illnesses that children were
suffering.
Table 29: Illness for under – 5 children in the last 2-3 weeks
Districts
Variable Overall N=1097
Singida N=592
Manyoni N=505
P-value
% (n) % (n) % (n)
No, the child is healthy 16.5 (181) 12.7 (75) 21.0 (106) 0.0002
Malaria/fever 9.2 (101) 6.9 (41) 11.9 (60) 0.0047
Diarrhea 7.9 (87) 7.3 (43) 8.7 (44) 0.3759
Eye problems 1.0 (11) 0.2 (1) 2.0 (10) 0.0027
Cold 3.5 (38) 2.7 (16) 4.4 (22) 0.1355
Coughing 3.4 (37) 1.0 (6) 6.1 (31) <0.0001
Breathing fast or with difficulty 0.2 (2) 0.3 (2) 0 -
Vomiting 0.7 (8) 0.8 (5) 0.6 (3) 0.6269
Rash/scabies all over the body 0.6 (6) 0.5 (3) 0.6 (3) 0.8451
Floppy/feel loose 0.1 (1) 0 0.2 (1) -
Other 3.4 (37) 1.9 (11) 5.2 (26) 0.0026
(Multiple responses were allowed)
Caregivers or the respondents were asked to mention about how long the child had experienced the
illness. On average, most of the children had been with the illness for seven days. However, in Singida
rural the average time was higher (ten days) as compared to six days in Manyoni district.
Table 30: Respondents who sought care for health problem
Districts
Variable Overall N=312
Singida N=123*
Manyoni N=189**
% (n) % (n) % (n)
Have you sought care for this health problem? 83.0 (259) 77.2 (95) 86.8 (164)
(*missing for 5 children) (** missing for 11 children)
The study findings show that more than half of the respondents in the study districts reported to have
sought care from a health centre or dispensary. This was followed by seeking care from drug sellers
24% (59/327) and from the hospital 14% (36/327). Figure 4 below summarizes the results.
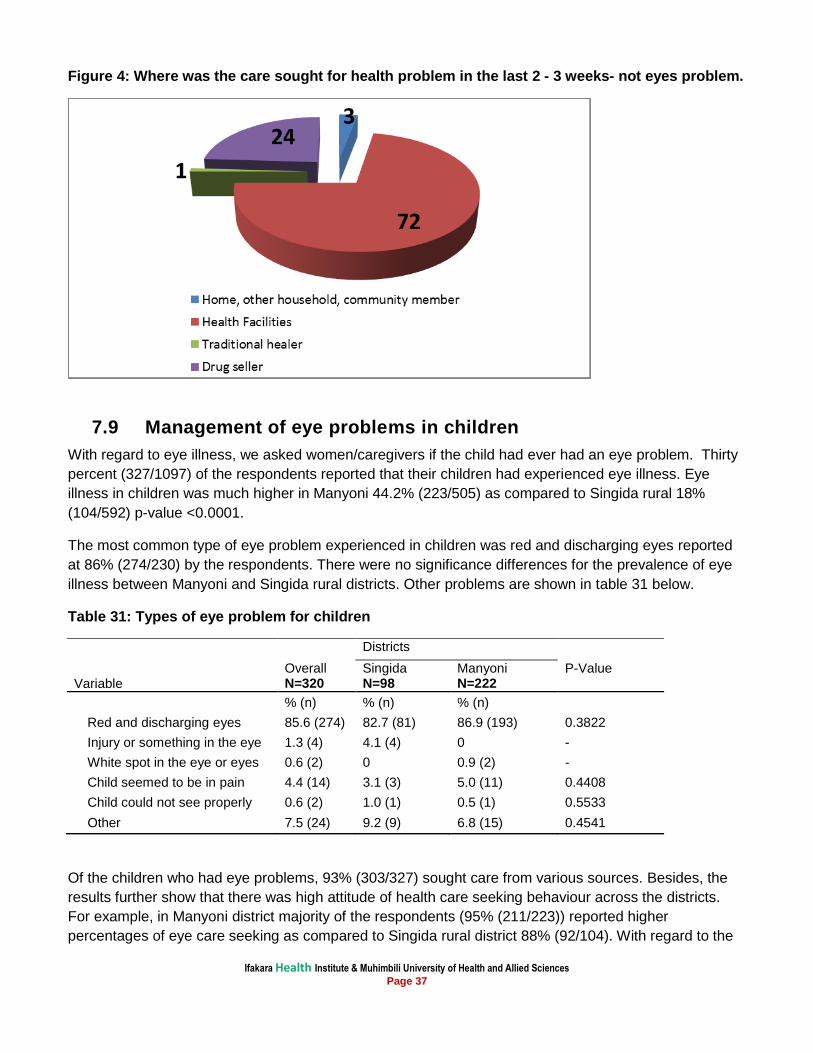
Ifakara Health Institute & Muhimbili University of Health and Allied Sciences Page 37
Figure 4: Where was the care sought for health problem in the last 2 - 3 weeks- not eyes problem.
7.9 Management of eye problems in children
With regard to eye illness, we asked women/caregivers if the child had ever had an eye problem. Thirty
percent (327/1097) of the respondents reported that their children had experienced eye illness. Eye
illness in children was much higher in Manyoni 44.2% (223/505) as compared to Singida rural 18%
(104/592) p-value <0.0001.
The most common type of eye problem experienced in children was red and discharging eyes reported
at 86% (274/230) by the respondents. There were no significance differences for the prevalence of eye
illness between Manyoni and Singida rural districts. Other problems are shown in table 31 below.
Table 31: Types of eye problem for children
Districts
P-Value Overall Singida Manyoni Variable N=320 N=98 N=222
% (n) % (n) % (n)
Red and discharging eyes 85.6 (274) 82.7 (81) 86.9 (193) 0.3822
Injury or something in the eye 1.3 (4) 4.1 (4) 0 -
White spot in the eye or eyes 0.6 (2) 0 0.9 (2) -
Child seemed to be in pain 4.4 (14) 3.1 (3) 5.0 (11) 0.4408
Child could not see properly 0.6 (2) 1.0 (1) 0.5 (1) 0.5533
Other 7.5 (24) 9.2 (9) 6.8 (15) 0.4541
Of the children who had eye problems, 93% (303/327) sought care from various sources. Besides, the
results further show that there was high attitude of health care seeking behaviour across the districts.
For example, in Manyoni district majority of the respondents (95% (211/223)) reported higher
percentages of eye care seeking as compared to Singida rural district 88% (92/104). With regard to the
Ifakara Health Institute & Muhimbili University of Health and Allied Sciences Page 38
place of care, 71% (233/327) sought care from the health facilities followed by drug seller 17% (57/327).
Figure 5 below gives a summary of the place of care.
Figure 5: Place where the care was sought for the eye problem
For those who did not seek care for eye illness 1.9% (21/1097), we asked the women or care givers the
reasons for not seeking eye care. The most prominent reason was that the condition being not serious at
42.9% (9/21) in both districts and lack of money 33.3% (7/21). Table 32 below summarizes the results.
Table 32: Perceived reasons for the care not sought at a health facility
Districts
Overall Singida Manyoni Variable P-Value
N=52 N=13 N=39
% (n) % (n) % (n) The condition was not serious 26.9 (14) 15.4 (2) 30.8 (12) 0.2788
Local / traditional treatment is better 1.9 (1) 7.7 (1) 0 -
Unfriendly staff 1.9 (1) 7.7 (1) 0 -
Too far / transport difficulties 19.2 (10) 30.8 (4) 15.4 (6) 0.2229
No time/other commitments 11.5 (6) 38.5 (5) 2.6 (1) 0.0005
Facilities have no medication 3.9 (2) 0 5.1 (2) -
Other 34.6 (18) 0 46.2 (18) -
Furthermore, we asked mothers and caregivers how often they wash their children’s face. Forty two
percent (462/1097) of the respondents in both districts wash their children’s faces more than twice a day.
Likewise, 41% (448/1097) of the respondents in both Singida rural and Manyoni district wash their
children’s faces twice a day. There was significant differences for the mothers who reported to wash
their children’s faces twice a day and more than twice a day in Singida and Manyoni districts, with p-
value <0.0001. However, there were no association of the respondents’ social economic status and
Ifakara Health Institute & Muhimbili University of Health and Allied Sciences Page 39
education against the reported frequencies the parents/guardians washing their children’s faces. The
summary of the findings are shown in table 33 below.
We also wanted to know the association between the respondents who have ever heard health talks
against children face washing. Overall 38.7% (242/1097) of the under-five mothers reported to have ever
heard health talks in the facilities said to have washed their children faces. Majority of those who
reported to have ever heard health talks said that they washed their children faces more than twice a
day 51.7 (125/242).
Table 33: Under 5 mothers reporting frequency they usually wash their children’s faces
Districts
Variable Overall N=1097
Singida N=592
Manyoni N=505
P-Value
% (n) % (n) % (n)
Less than once a day 0.2 (2) 0.2 (1) 0.2 (1) 0.9103
Once a day 13.0 (143) 13.9 (82) 12.1 (61) 0.3849
Twice a day 40.8 (448) 47.5 (281) 33.1 (167) <0.0001
More than twice a day 42.1 (462) 35.1 (208) 50.3 (254) <0.0001
Only when their face is dirty 3.6 (39) 2.9 (17) 4.4 (22) 0.1856
Missing 0.3 (3) 0.5 (3) 0 -
7.10 Health care providers’ pre-service and in-service trainings
The study also looked at the pre-service and in-service training received by RCH providers. Most of the
health care providers (through in-depth interviews) reported to have received pre-service training on
nutrition, immunization, family planning and Antenatal Care. On the other hand, most of the health care
providers reported to have received in service training on IMCI, family planning, Prevention of Mother to
Child Transmission (PMTCT), breastfeeding, Focused Antenatal Care, immunization and Basic
Emergency Management of Obstetric and Neonatal Care (BeMONC). Most of the in-service trainings
were reported to have been conducted within a year. The most important challenges related to in-service
training includes: long modules, limited time, limited supply of electricity in some of the health facilities
(specific for IMCI trainings) and lack of materials in local language.
“Yes, I have received training on IMCI. However I have not completed all modules as my colleague was
on leave as I was alone at the facility. I have completed two module against nine required” HCP, Singida
rural
“I have received in-service training on IMCI about nine month ago. The training was useful; I learnt many
things in practical and through pictures. The challenge is that the modules were long and the time was
short” HCP, Manyoni district
“I received in-service trainings on PMTCT, family planning, vaccination, IMCI and breastfeeding.
Trainings were good as they help in data collection from the patients. The participants get to hear and
see through pictures. We were organized in groups during trainings, this helped the participants to ask
questions and have great understanding but the training time was too short” HCP, Manyoni district
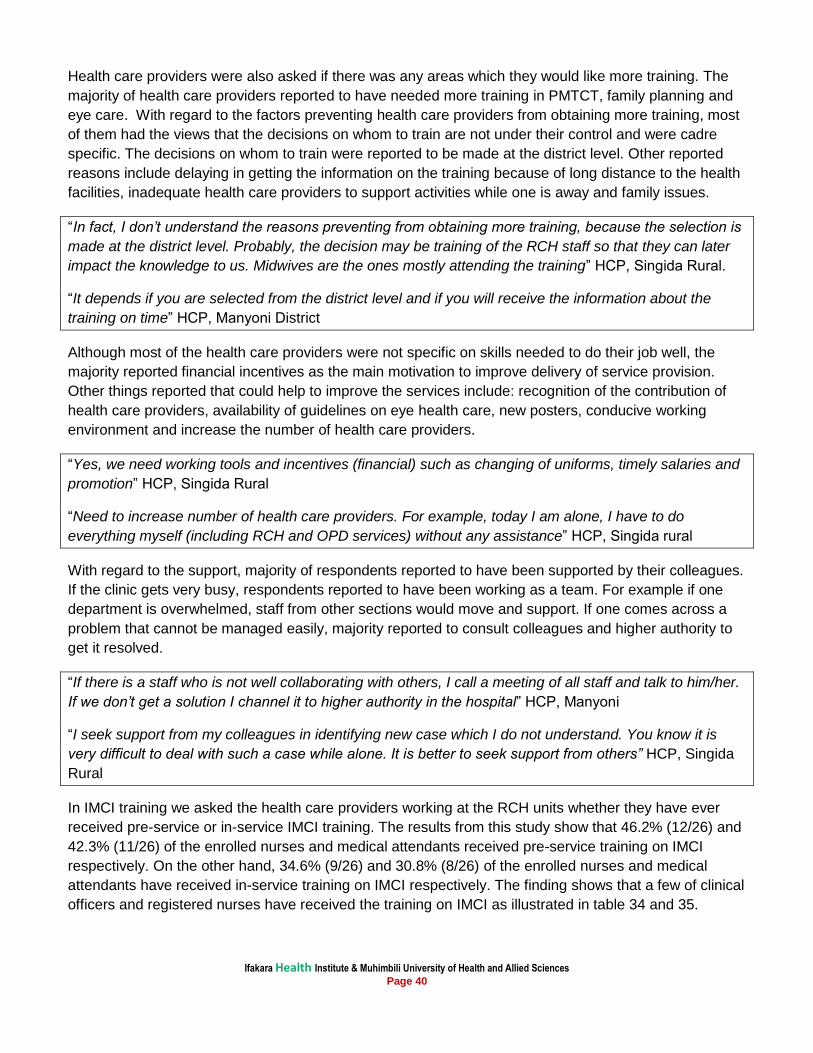
Ifakara Health Institute & Muhimbili University of Health and Allied Sciences Page 40
Health care providers were also asked if there was any areas which they would like more training. The
majority of health care providers reported to have needed more training in PMTCT, family planning and
eye care. With regard to the factors preventing health care providers from obtaining more training, most
of them had the views that the decisions on whom to train are not under their control and were cadre
specific. The decisions on whom to train were reported to be made at the district level. Other reported
reasons include delaying in getting the information on the training because of long distance to the health
facilities, inadequate health care providers to support activities while one is away and family issues.
“In fact, I don’t understand the reasons preventing from obtaining more training, because the selection is
made at the district level. Probably, the decision may be training of the RCH staff so that they can later
impact the knowledge to us. Midwives are the ones mostly attending the training” HCP, Singida Rural.
“It depends if you are selected from the district level and if you will receive the information about the
training on time” HCP, Manyoni District
Although most of the health care providers were not specific on skills needed to do their job well, the
majority reported financial incentives as the main motivation to improve delivery of service provision.
Other things reported that could help to improve the services include: recognition of the contribution of
health care providers, availability of guidelines on eye health care, new posters, conducive working
environment and increase the number of health care providers.
“Yes, we need working tools and incentives (financial) such as changing of uniforms, timely salaries and
promotion” HCP, Singida Rural
“Need to increase number of health care providers. For example, today I am alone, I have to do
everything myself (including RCH and OPD services) without any assistance” HCP, Singida rural
With regard to the support, majority of respondents reported to have been supported by their colleagues.
If the clinic gets very busy, respondents reported to have been working as a team. For example if one
department is overwhelmed, staff from other sections would move and support. If one comes across a
problem that cannot be managed easily, majority reported to consult colleagues and higher authority to
get it resolved.
“If there is a staff who is not well collaborating with others, I call a meeting of all staff and talk to him/her.
If we don’t get a solution I channel it to higher authority in the hospital” HCP, Manyoni
“I seek support from my colleagues in identifying new case which I do not understand. You know it is
very difficult to deal with such a case while alone. It is better to seek support from others” HCP, Singida
Rural
In IMCI training we asked the health care providers working at the RCH units whether they have ever
received pre-service or in-service IMCI training. The results from this study show that 46.2% (12/26) and
42.3% (11/26) of the enrolled nurses and medical attendants received pre-service training on IMCI
respectively. On the other hand, 34.6% (9/26) and 30.8% (8/26) of the enrolled nurses and medical
attendants have received in-service training on IMCI respectively. The finding shows that a few of clinical
officers and registered nurses have received the training on IMCI as illustrated in table 34 and 35.
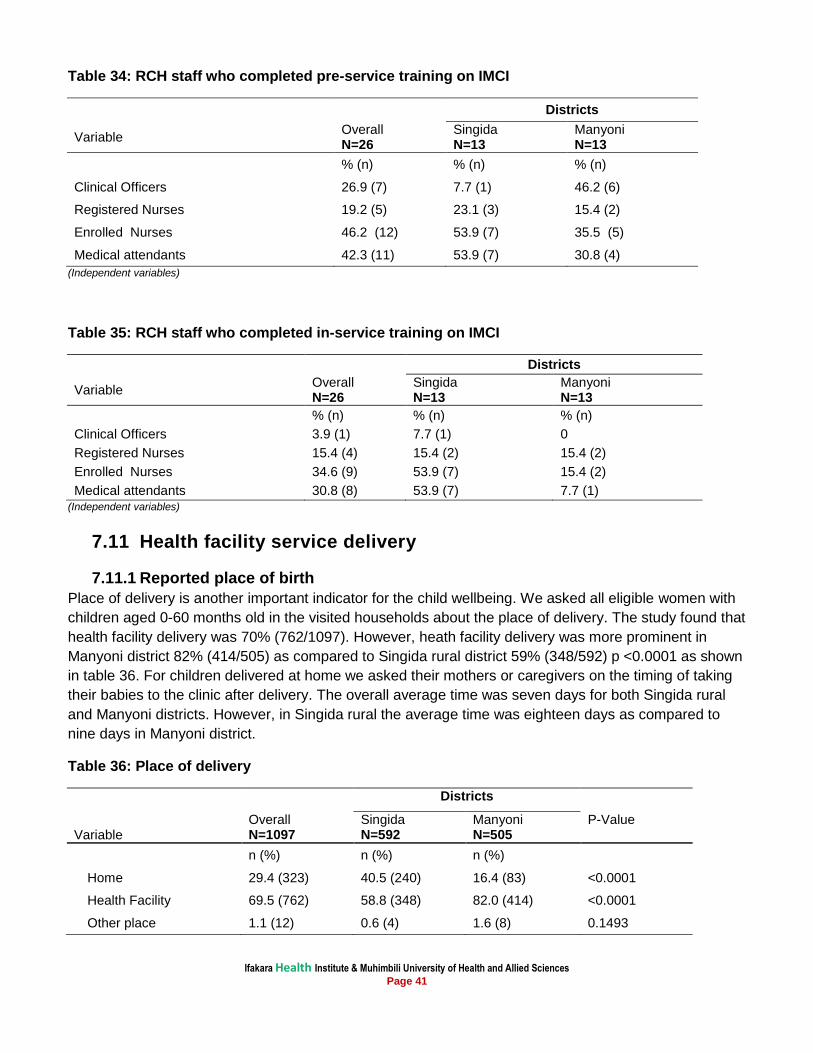
Ifakara Health Institute & Muhimbili University of Health and Allied Sciences Page 41
Table 34: RCH staff who completed pre-service training on IMCI
Districts
Variable Overall N=26
Singida N=13
Manyoni N=13
% (n) % (n) % (n)
Clinical Officers 26.9 (7) 7.7 (1) 46.2 (6)
Registered Nurses 19.2 (5) 23.1 (3) 15.4 (2)
Enrolled Nurses 46.2 (12) 53.9 (7) 35.5 (5)
Medical attendants 42.3 (11) 53.9 (7) 30.8 (4)
(Independent variables)
Table 35: RCH staff who completed in-service training on IMCI
Districts
Variable Overall N=26
Singida N=13
Manyoni N=13
% (n) % (n) % (n)
Clinical Officers 3.9 (1) 7.7 (1) 0
Registered Nurses 15.4 (4) 15.4 (2) 15.4 (2)
Enrolled Nurses 34.6 (9) 53.9 (7) 15.4 (2)
Medical attendants 30.8 (8) 53.9 (7) 7.7 (1) (Independent variables)
7.11 Health facility service delivery
7.11.1 Reported place of birth
Place of delivery is another important indicator for the child wellbeing. We asked all eligible women with
children aged 0-60 months old in the visited households about the place of delivery. The study found that
health facility delivery was 70% (762/1097). However, heath facility delivery was more prominent in
Manyoni district 82% (414/505) as compared to Singida rural district 59% (348/592) p <0.0001 as shown
in table 36. For children delivered at home we asked their mothers or caregivers on the timing of taking
their babies to the clinic after delivery. The overall average time was seven days for both Singida rural
and Manyoni districts. However, in Singida rural the average time was eighteen days as compared to
nine days in Manyoni district.
Table 36: Place of delivery
Districts
Variable Overall N=1097
Singida N=592
Manyoni N=505
P-Value
n (%) n (%) n (%)
Home 29.4 (323) 40.5 (240) 16.4 (83) <0.0001
Health Facility 69.5 (762) 58.8 (348) 82.0 (414) <0.0001
Other place 1.1 (12) 0.6 (4) 1.6 (8) 0.1493
Ifakara Health Institute & Muhimbili University of Health and Allied Sciences Page 42
7.11.2 Availability of clinic cards to under five children
With regard to the availability of clinic cards, all mothers were asked if their children 0-60 months had
clinic cards. Availability of cards was at high level in both districts at 91% (1003/1097).
7.12 Post Natal Care Services, health care provider’s views
Respondents were also asked on their perceptions of women using Post Natal Care (PNC). Majority of
health care providers reported that there was limited awareness on using PNC to most of the mothers.
Distance to the health facility was mentioned by the health care providers as the main reason hindering
mothers from sending their children for postnatal care. Other reasons mentioned were negative attitude
towards vaccine and other conflicting home obligations. Likewise, new pregnancies can force women to
stop attending PNC while attending ANC.
“I think most of the women don’t have enough health education on maternal and child health issues.
Also, most of them walk long distances attending to the health facilities. I think they get tired” HCP
Singida rural
“It is due to lack of health education. Some live far away from the facility as well as negative attitude to
the new vaccine (PCV 13) and rotavirus. Most women may find themselves pregnant while having
children who are supposed to attend PNC. This can force them to leave the older children at home while
mothers attend new ANC alone. Health education about the importance of vaccination should be
provided” HCP, Manyoni district.
7.13 Community healthcare seeking behaviour
In most of the FGD sessions, both men and women reported to have sent their children to the health
facilities for health care services. However, the majority of participants reported that children are mostly
sent to the clinic by women. With regard to the seeking permission from husband, majority of women
reported to have sent their children to clinic without father’s consent.
“It is probably true, children are mostly sent to clinic by women, personally I have to take the baby
myself, and this depends on child’s age. If my child has stopped breast feeding, I usually carry the child
myself to clinic” Fathers FGD session Manyoni
“It is us (women) because we know that this is our responsibility, you may wake up the husband and tell
him that the child is sick. I noticed some changes, but for now I see the situation is not good, I tell him to
accompany me to the facility. He only becomes an accompanying person but the woman goes to explain
herself.” FGD Singida Rural
With regard to community perceptions on the use of PNC for under-five children, majority of the study
participants reported that children are sent to the PNC for growth monitoring within the first year. The
findings from qualitative study, FGDs in particular, have shown that most of the women do utilize heath
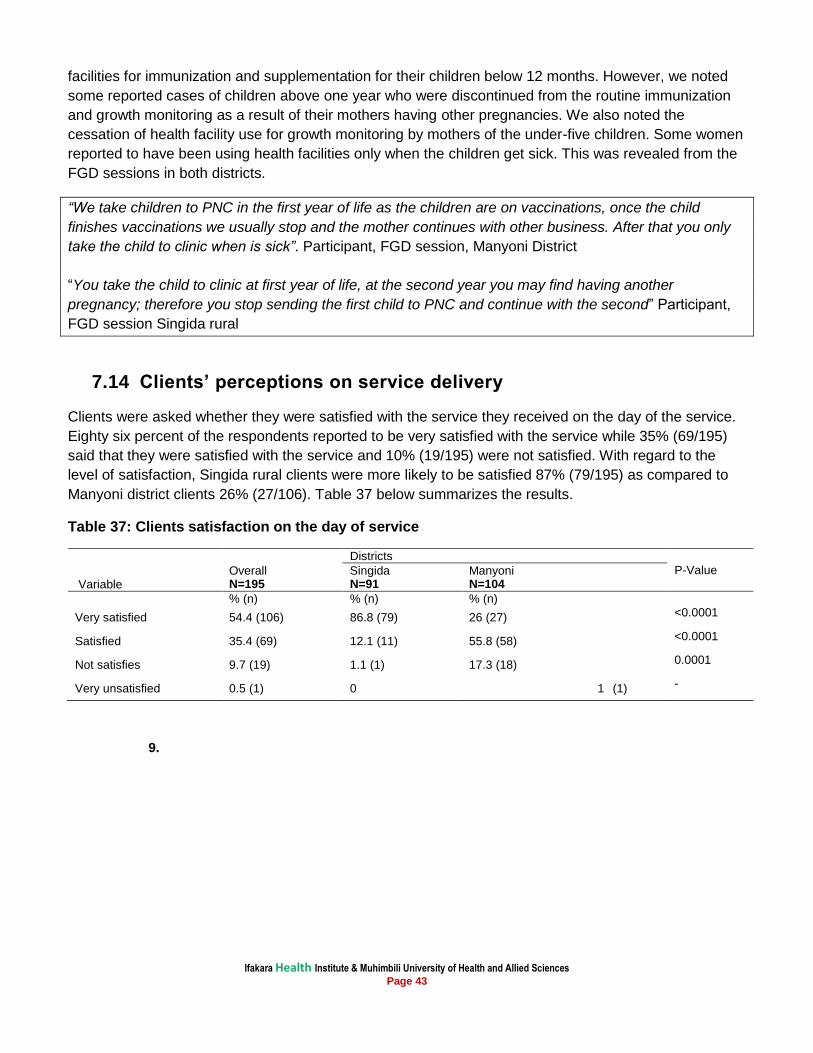
Ifakara Health Institute & Muhimbili University of Health and Allied Sciences Page 43
facilities for immunization and supplementation for their children below 12 months. However, we noted
some reported cases of children above one year who were discontinued from the routine immunization
and growth monitoring as a result of their mothers having other pregnancies. We also noted the
cessation of health facility use for growth monitoring by mothers of the under-five children. Some women
reported to have been using health facilities only when the children get sick. This was revealed from the
FGD sessions in both districts.
“We take children to PNC in the first year of life as the children are on vaccinations, once the child
finishes vaccinations we usually stop and the mother continues with other business. After that you only
take the child to clinic when is sick”. Participant, FGD session, Manyoni District
“You take the child to clinic at first year of life, at the second year you may find having another
pregnancy; therefore you stop sending the first child to PNC and continue with the second” Participant,
FGD session Singida rural
7.14 Clients’ perceptions on service delivery
Clients were asked whether they were satisfied with the service they received on the day of the service.
Eighty six percent of the respondents reported to be very satisfied with the service while 35% (69/195)
said that they were satisfied with the service and 10% (19/195) were not satisfied. With regard to the
level of satisfaction, Singida rural clients were more likely to be satisfied 87% (79/195) as compared to
Manyoni district clients 26% (27/106). Table 37 below summarizes the results.
Table 37: Clients satisfaction on the day of service
Districts
P-Value
Variable Overall N=195
Singida N=91
Manyoni N=104
% (n) % (n) % (n)
Very satisfied 54.4 (106) 86.8 (79) 26 (27) <0.0001
Satisfied 35.4 (69) 12.1 (11) 55.8 (58) <0.0001
Not satisfies 9.7 (19) 1.1 (1) 17.3 (18) 0.0001
Very unsatisfied 0.5 (1) 0 1 (1) -
9.
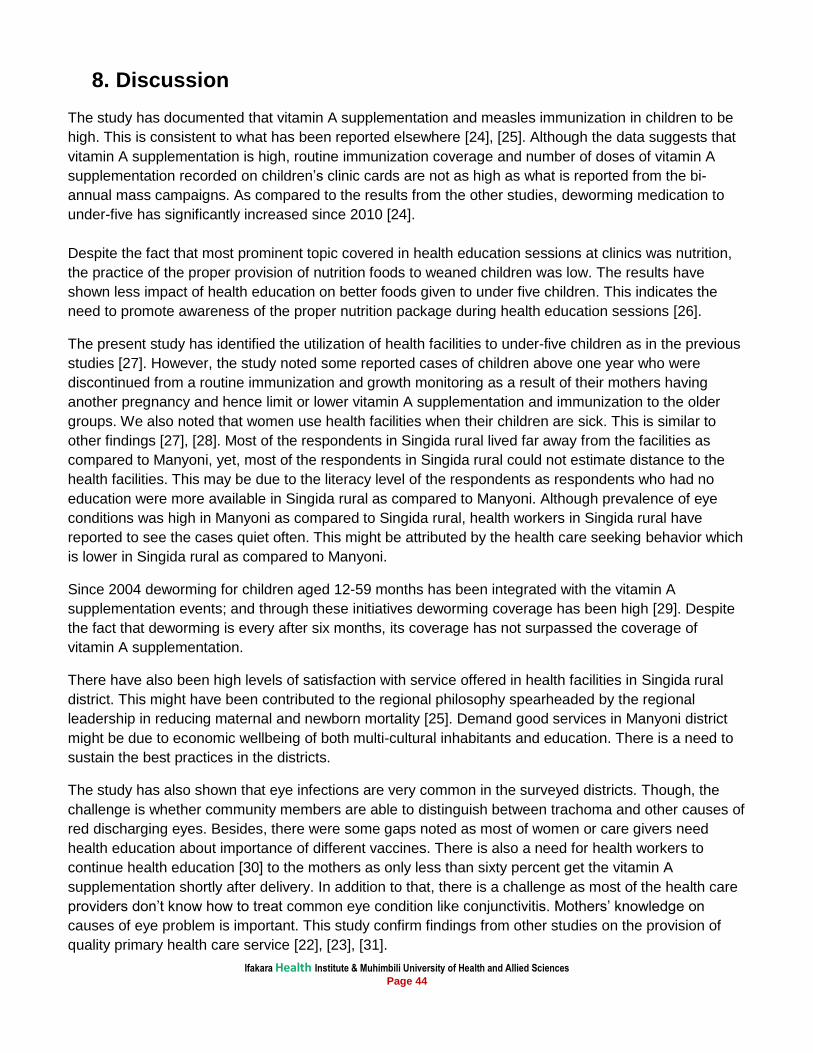
Ifakara Health Institute & Muhimbili University of Health and Allied Sciences Page 44
8. Discussion
The study has documented that vitamin A supplementation and measles immunization in children to be
high. This is consistent to what has been reported elsewhere [24], [25]. Although the data suggests that
vitamin A supplementation is high, routine immunization coverage and number of doses of vitamin A
supplementation recorded on children’s clinic cards are not as high as what is reported from the bi-
annual mass campaigns. As compared to the results from the other studies, deworming medication to
under-five has significantly increased since 2010 [24].
Despite the fact that most prominent topic covered in health education sessions at clinics was nutrition,
the practice of the proper provision of nutrition foods to weaned children was low. The results have
shown less impact of health education on better foods given to under five children. This indicates the
need to promote awareness of the proper nutrition package during health education sessions [26].
The present study has identified the utilization of health facilities to under-five children as in the previous
studies [27]. However, the study noted some reported cases of children above one year who were
discontinued from a routine immunization and growth monitoring as a result of their mothers having
another pregnancy and hence limit or lower vitamin A supplementation and immunization to the older
groups. We also noted that women use health facilities when their children are sick. This is similar to
other findings [27], [28]. Most of the respondents in Singida rural lived far away from the facilities as
compared to Manyoni, yet, most of the respondents in Singida rural could not estimate distance to the
health facilities. This may be due to the literacy level of the respondents as respondents who had no
education were more available in Singida rural as compared to Manyoni. Although prevalence of eye
conditions was high in Manyoni as compared to Singida rural, health workers in Singida rural have
reported to see the cases quiet often. This might be attributed by the health care seeking behavior which
is lower in Singida rural as compared to Manyoni.
Since 2004 deworming for children aged 12-59 months has been integrated with the vitamin A
supplementation events; and through these initiatives deworming coverage has been high [29]. Despite
the fact that deworming is every after six months, its coverage has not surpassed the coverage of
vitamin A supplementation.
There have also been high levels of satisfaction with service offered in health facilities in Singida rural
district. This might have been contributed to the regional philosophy spearheaded by the regional
leadership in reducing maternal and newborn mortality [25]. Demand good services in Manyoni district
might be due to economic wellbeing of both multi-cultural inhabitants and education. There is a need to
sustain the best practices in the districts.
The study has also shown that eye infections are very common in the surveyed districts. Though, the
challenge is whether community members are able to distinguish between trachoma and other causes of
red discharging eyes. Besides, there were some gaps noted as most of women or care givers need
health education about importance of different vaccines. There is also a need for health workers to
continue health education [30] to the mothers as only less than sixty percent get the vitamin A
supplementation shortly after delivery. In addition to that, there is a challenge as most of the health care
providers don’t know how to treat common eye condition like conjunctivitis. Mothers’ knowledge on
causes of eye problem is important. This study confirm findings from other studies on the provision of
quality primary health care service [22], [23], [31].
Ifakara Health Institute & Muhimbili University of Health and Allied Sciences Page 45
Health policies and planning in any country depend heavily on having correct and timely information on
health parameters [32]. New HIMS for district level and above is being rolled out, using a separate
register. There is an active eye department in Singida Regional Referral Hospital with a newly qualified
ophthalmologist who has been oriented in eye care for children. Referrals and onward referrals can now
be tracked through the register in Singida Regional Referral Hospital. However, referral mechanisms
from RCH need to be improved i.e. standard referral slips in the lower health facilities and provision of
eye health care training to the health care providers. Currently MoHSW has developed registers which
will capture eye conditions as they were previously not in HIMS recording register. Yet, the challenge
may still be referrals to the facilities where there is no eye unit.
Health facilities supervision in the last six month prior to the survey was high. However, less than fifty
percent of the supervision was not related to case management observation or clinical mentoring. This is
consistent to what has been reported elsewhere [33]. The study documented that there was relatively
low staff turnover in the visited districts which implies that training of health care providers on eyeIMCI
will not affect the intervention as trained staff will be available to offer services in their facilities with
newly acquired skills.
Availability of drugs and supplies on eye health care was good in the visited health facilities. The high
availability of antibiotics in the visited health facilities needs to be addressed with clear strategies of
training health workers on how to effectively utilize available resources. Eye care has been incorporated
into the Standard Treatment Guidelines and National Essential List of Medicines [18]. There has been
successful efforts of including essential medication for eye care in the Medical Store Department (MSD)
price catalogue [28].
This study identified the financial incentives to health care providers as the main motivation to improve
service delivery. Financial incentives are mostly claimed when staff work overtime or when they are very
tight with extra duties. When these health care providers are not motivated, faced with little or no
recognition of their contributions, limited availability of working tools, the sector should not expect
wonders of better results. This is similar as reported in other settings [34], [35].
Important to note is that efforts to reduce child mortality need to improve both care seeking for childhood
illnesses and quality of case management [36]. IMCI has the potential to contribute significantly to both
the case management of illness and its prevention [37], [17]. The actual impact that will result from
training health workers to use the IMCI guidelines and supporting them after training remains to be
determined [37]. In this study, most of the health care providers reported to have received in service
training on IMCI. There is documentation from many countries that a number of vertical programmes are
bundled to address several diseases through IMCI strategy for prevention and hence delivered together
as a cluster in primary care [30], [31]. It is therefore worth mentioning that integrating eye care for
children into the existing training structure will have better impact to improve knowledge of health care
providers.
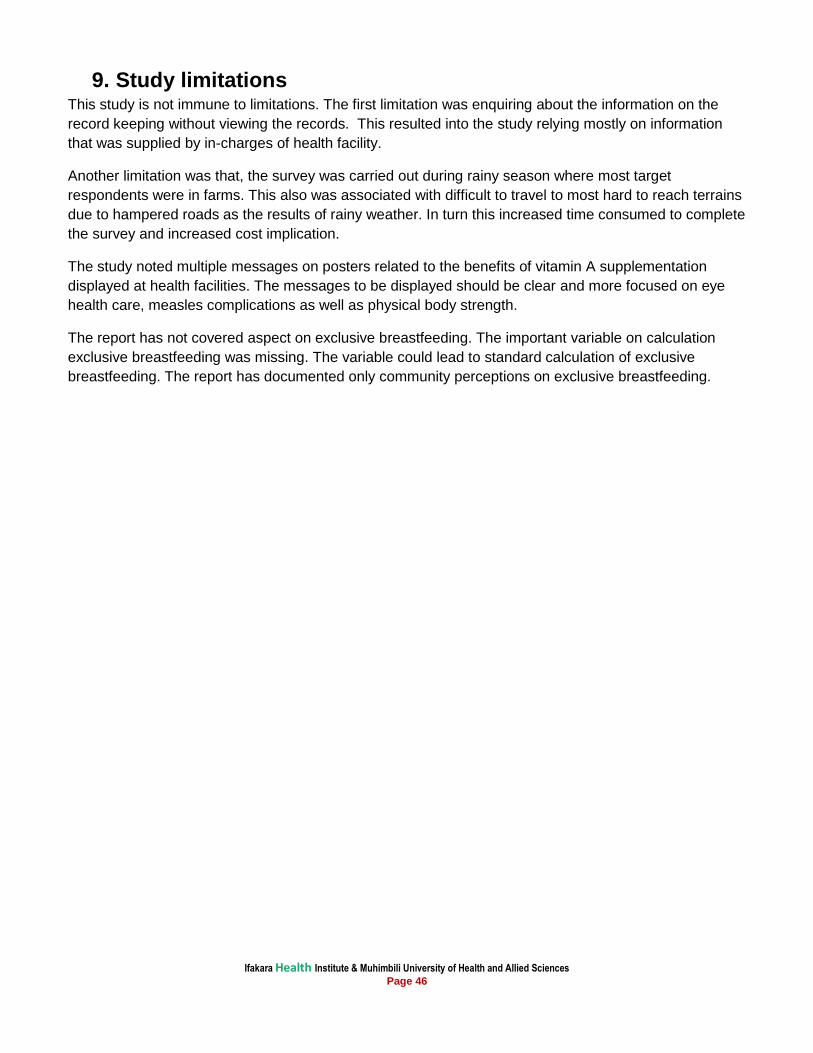
Ifakara Health Institute & Muhimbili University of Health and Allied Sciences Page 46
9. Study limitations This study is not immune to limitations. The first limitation was enquiring about the information on the
record keeping without viewing the records. This resulted into the study relying mostly on information
that was supplied by in-charges of health facility.
Another limitation was that, the survey was carried out during rainy season where most target
respondents were in farms. This also was associated with difficult to travel to most hard to reach terrains
due to hampered roads as the results of rainy weather. In turn this increased time consumed to complete
the survey and increased cost implication.
The study noted multiple messages on posters related to the benefits of vitamin A supplementation
displayed at health facilities. The messages to be displayed should be clear and more focused on eye
health care, measles complications as well as physical body strength.
The report has not covered aspect on exclusive breastfeeding. The important variable on calculation
exclusive breastfeeding was missing. The variable could lead to standard calculation of exclusive
breastfeeding. The report has documented only community perceptions on exclusive breastfeeding.
Ifakara Health Institute & Muhimbili University of Health and Allied Sciences Page 47
10. Conclusions & Recommendations
1. It was established that staff in health facilities visited know how to refer children with serious eye
conditions and that health education is frequently being given on a range of topics but almost none on
eye care. However, there were areas which need attention. These include: effort should be made to
sustain the high coverage of vitamin A supplementation and measles immunization. Improve ocular
prophylaxis coverage. Increase mothers’ knowledge of eye diseases and how they can be prevented;
increase vitamin A supplementation of mothers through health education. Improve capabilities of RCH
in the prevention, detection and management of eye conditions and a need to include routine
examination of the eyes of newborn at the primary health facilities.
2. The following areas need special consideration: Improve HIMS in RCH clinics so referrals can be
tracked; improve supervision in terms of capacity building of staff in RCH clinics for eye care; Improve
supervisor’s skills in teaching through case management as there are different checklists through
different donor funded projects. There is a need to include eye care in supervisors’ check lists to be
implemented by eye care personnel; improve the provision of equipment for eye examination; develop
training materials for eye conditions; involve end users in designing the eye health module as current
modules are considered long; all cadres need to be trained, including Medical Attendants; engage
Regional and District Medical Officers in the roll out to improve ownership: through leadership it is
advocated that Regional and District Eye Care Coordinators be included in the relevant management
teams which include Regional Health Management Team (RHMT) and Council Health Management
Team (CHMT); there is a need to include eye health talks in health education sessions in clinics for
better behavioural change outcomes. Lastly, the eye health care trainings need to include a range of
health care cadres such as nurses, medical attendants and clinical officers across the districts as
similar to the current IMCI distance learning training practice.
3. As IMCI has the potential to contribute significantly to both the case management of illness and its
prevention, the actual impact that will result from training health workers to use the IMCI guidelines
and supporting them after training remains to be determined. Hence integrating eyeIMCI into the
existing training structure is a recommended option for better training outcomes.
4. The results do not only give an insight on how the intervention should focus with regards to health
education topics , but also indicates the need to promote awareness of the proper nutrition feeding
practices during the ANC/PNC visits.
5. In conclusion, the study has found out that measles immunization, vitamin A supplementation,
utilization of health facilities by under-fives are high in Singida rural and Manyoni districts and need be
sustained as best practices. Primary health Care providers refer children for secondary care but are
have inadequate knowledge to treat even common conditions like conjunctivitis. The study has
identified the following gaps that need to be addressed: improve attitudes to work: recognition of the
contribution of health care providers; supply of guidelines and educational materials (like posters and
brochures) on eye health; conducive working environment; include leadership training of supervisors
as good supervision can change attitudes and motivation; train health workers on child eye health to
equip them with knowledge and skills for management of eye conditions and health education for
mothers, develop health education materials for eye care, including posters displayed where mothers
can see them and availability of health education materials.
Ifakara Health Institute & Muhimbili University of Health and Allied Sciences Page 48
References 1. Gilbert, C. Changing challenges in the control of blindness in children. . Eye (Lond), , 2007.
21(10): p. 1338-43. 2. Rahi J. and Gilbert C., Epidemiology and the world-wide impact of visual impairment in children.,
in Epidemiology of Eye Disease, G Johnson., et al., Editors. Imperial College Press/World Scientific: London and Singapore. 2012.
3. Muhit, M.A. et al. The key informant method: a novel means of ascertaining blind children in Bangladesh. . Br J Ophthalmol,, 2007 91(8): p. 995-9.
4. Muhit, M.A.et al. Causes of severe visual impairment and blindness in Bangladesh: a study of 1935 children. Br J Ophthalmol 2007 91(8): p. 1000-4.
5. Zhang, H. et al. Long-term results of pediatric cataract surgery after delayed diagnosis. . J AAPOS. 2012. 16(1): p. 65-9.
6. You, C. et al. Visual impairment and delay in presentation for surgery in chinese pediatric patients with cataract. Ophthalmology, , 2011 118(1): p. 17-23.
7. Bowman, R.J. et al. Outcomes of bilateral cataract surgery in Tanzanian children. Ophthalmology 2007. 114(12): p. 2287-92.
8. Kishiki, E. et al. Improving postoperative follow-up of children receiving surgery for congenital or developmental cataracts in Africa. J AAPOS, 2009. 13(3): p. 280-2.
9. Bronsard, A., et al. Why are children brought late for cataract surgery? Qualitative findings from Tanzania. Ophthalmic Epidemiol 2008. 15(6): p. 383-8.
10. Mwende, J. et al. Delay in presentation to hospital for surgery for congenital and developmental cataract in Tanzania. Br J Ophthalmol, , 2005. 89(11): p. 1478-82.
11. Baiyeroju, A., et al. Managing eye health in young children. Community Eye Health 2010.23(72 ): p. 4-11.
12. DI Thurnham. Vitamin A suplementation: Beneficial effects on mortality and morbidity in children aged six months to five years. Sight and Life 2011. 25(3 ): p. 38-49.
13. World Health Organization. A five-year project for the prevcention of childhood blindness. . Report of a WHO Consultaiotn Geneva, June 2002. WHO/PBL/02.88., 2002.
14. Masanja, H. et al. Impact of Integrated Management of Childhood Illness on inequalities in child health in rural Tanzania. Health Policy Plan 2005. 20 (Suppl 1): p. i77-i84.
15. Ali, Z. et al. Prophylaxis of ophthalmia neonatorum comparison of betadine, erythromycin and no prophylaxis. J Trop Pediatr 2007. 53(6): p. 388-92.
16. Mafwiri MM; Kisenge R; Gilbert CE, A pilot study to evaluate incorporating eye care for children into reproductive and child health services in Dar-es-Salaam, Tanzania: a historical comparison study. BMC Nurs.,2014. 13: p. 15. doi: 10.1186/1472-6955-13-15. eCollection 2014.
17. Armstrong Schellenberg, J. et al. The effect of Integrated Management of Childhood Illness on observed quality of care of under-fives in rural Tanzania. Health Policy Plan, , 2004. . 19(1): 1-10.
18. Colombini M et al. Health-sector responses to initiate partner violence in low and middle-income settings: a review of current models, challenges and opportunities Bulletin of the World Health Organization 2008. 86 (8).
19. Armstrong Schellenberg, J.R., et al. Effectiveness and cost of facility-based Integrated Management of Childhood Illness (IMCI) in Tanzania. Lancet, 2004. 364(9445 ): p. 1583-94.
20. Dudley L; P Garner. Strategies for integrating primary health services in low- and middle-income countries at the point of delivery. Cochrane Database Syst Rev 2011((7): p.): p. CD003318.
21. Mafwiri Milka. and Gilbert Clare. Evaluation of Implementation of the WHO’s “10 Key Eye Health Activities for Primary level Staff” by Reproductive and Child Health Workers in Dar-es-Salaam, Tanzania. Unpublished document, International Centre for Eye health. London School of Hygiene and Tropical Medicine. 2010.
22. Rasheed N et al. Client satisfaction and perceptions about quality of health care at primary health centre of Delhi, India. Indian Jornal of Community Health 2012. 24 (3).
23. Aldana JM et al. Client satisfaction and quality of health care in rural Bangladesh Bulletin of the World Health Organization. 2001. 79 (6).
Ifakara Health Institute & Muhimbili University of Health and Allied Sciences Page 49
24. NBS [Tanzania] and ORC Macro, Tanzania Demographic and Health Survey 2010 - Key Findings. National Bureau of Statistics, Dar es Salaam and ORC Macro, Calverton, MD. 2010.
25. Ndaki, Region Administrative Secretaries Commitment in Singida RHMT, Regional Health Management Newsletter, Issue No.2 September 2012.
26. Deshpande Jayant D, Purushottam Giri, Phalke Deepak, Phalke Vaishali, Kalakoti Piyush and Syed M M Aarif. Socio-cultural practices in relation to breastfeeding, weaning and child rearing among Indian mothers and assessment of nutritional status of children under five in rural India Australasian Medical Journal 09/2010;, 2010. 3(9): p. 618-624. DOI: 10.4066/AMJ.2010.417.
27. Schellenberg JA, V.C., Mushi A, de Savigny D, Schellenberg D, Mshinda H, Bryce J. Tanzania Integrated Management of Childhood Illness MCE Baseline Household Survey Study Group. Inequities among the very poor: health care for children in rural southern Tanzania. Lancet, 2003 361(9357): p. 561-6.
28. Medical Store Department (MSD) Price Catalogue, Dar es Salaam Tanzania, 2014/2015. 29. Knopp S, M.K., Stothard JR, Khamis IS, Rollinson D, et al. Patterns and Risk Factors of
Helminthiasis and Anemia in a Rural and a Periurban Community in Zanzibar, in the Context of Helminth Control Programs. PLoS Negl Trop Dis 2010 4 (5): pe681. doi:10.1371/journal.pntd.0000681.
30. Atun RA et al. Policy Brief, When do vertical (stand-alone)programmes have a place in health systems? Health Systems and Policy Analysis World Health Organization, on behalf of the European Observatory on Health Systems and Policies 2008.
31. Walsh JA & Warren KS, Selective primary health-care – Interim strategy for disease control in developing-countries. . New England Journal of Medicine, 1979. 301: p. 967–974.
32. Ali M; Kuroiwa C. Accurate record keeping in referral hospitals in Pakistan's north west frontier province and Punjab: a crucial step needed to improve maternal health. J Pak Med Assoc. , 2007. 57(9): p. 443-6.
33. Joanna Armstrong Schellenberg; Mwifadhi Mrisho; et al.Health and survival of young children in southern Tanzania. BMC Public Health, 2008. 8: p. 194.
34. Prytherch H. Motivation and incentives of rural maternal and neonatal health care providers: a comparison of qualitative findings from Burkina Faso, Ghana and Tanzania. BMC Health Serv Res., 2013. 10.1186/1472-(13:149.): p. 6963-13-149.
35. Bärnighausen & Bloom D, Financial incentives for return of service in underserved areas: a systematic review. BMC Health Serv Res. 2009. 29;9:86. (10.1186/1472-): p. 6963-9-86. .
36. Bojalil R; Kirkwood BR; Bobak M and Guiscafre H. The relative contribution of case management and inadequate care-seeking behaviour to childhood deaths from diarrhea and acute respiratory infections in Hidalgo, Mexico. Tropl Med Int Health 2007 12 (12): p1545–1552.
37. World Health Organization. Integrated management of childhood illness by outpatient health workers: technical basis and overview. Bull World Health Org 1997. 75 (Suppl 1): p. 119–128.