Embed Size (px)
Citation preview

Framework Contract SANCO/2008/01/055 Lot 1: Public Health – Contract N°
SANCO/2008/01/055 Lot 1- Provision of Evaluation, Impact Assessment and
Related Services to the Commission in the Area of Public Health
Evaluation of the implementation of the Strategy
for Europe on Nutrition, Overweight and Obesity
related health issues
FINAL REPORT
submitted by
“Public Health Evaluation and Impact Assessment Consortium” (PHEIAC)
Including:
Economisti Associati srl (Consortium Lead Firm)
The Evaluation Partnership (Lead Partner for the Assignment)
29 April 2013
1
TABLE OF CONTENTS
0. EXECUTIVE SUMMARY......................................................................................................... 6
1. INTRODUCTION ................................................................................................................... 14
2. APPROACH TO THE EVALUATION .................................................................................... 15
2.1. Evaluation background and purpose ................................................................................. 15
2.2. The Strategy’s intervention logic ........................................................................................ 18
2.3. Evaluation approach and methodology .............................................................................. 20
2.4. Caveats and limitations ..................................................................................................... 23
3. OVERVIEW OF NOPA STATISTICS AND TRENDS ............................................................ 24
3.1. Overweight and obesity ..................................................................................................... 24
3.2. Physical activity ................................................................................................................. 26
3.3. Nutritional status and dietary habits ................................................................................... 28
3.4. Non-communicable diseases and risk factors .................................................................... 29
4. EVALUATION RESULTS PER THEMATIC AREA ............................................................... 31
4.1. Member State activities and the HLG ................................................................................ 31
4.1.1. HLG impact on dialogue, understanding and strategy implementation across Member States .................................................................................................................................... 32
4.1.2. EC role of facilitator in the HLG ................................................................................... 36
4.1.3. Progress of national approaches in key areas ............................................................. 38
4.1.4. Impact of HLG on progress of national approaches ..................................................... 49
4.2. The EU Platform for Action on Diet, Physical Activity and Health ....................................... 52
4.2.1. Relevance of the commitments to the needs of stakeholders and citizens ................... 54
4.2.2. Proportionality between level of action and Platform objectives ................................... 64
4.3. EU legislation related to the implementation of the Strategy .............................................. 69
4.3.1. Development of new European laws ........................................................................... 70
4.3.2. Impact of AVMSD on self-regulation in marketing to children ...................................... 83
4.4. EU policy integration .......................................................................................................... 92
4.4.1. Integration of the NOPA dimension in EU policies ....................................................... 92
4.5. EU funding and programmes ........................................................................................... 101
4.5.1. Health Programme contribution to development of good practices ............................ 101
4.5.2. Utility and results of School Fruit Scheme ................................................................. 109
4.5.3. Impact of the most deprived programme on nutritional behaviour .............................. 116
4.5.4. Impact of 2009 Preparatory Actions in the field of sport (HEPA projects) .................. 123
4.5.5. FP7 contribution to increasing understanding and evidence for policy-making .......... 129
4.6. Monitoring system / evidence base .................................................................................. 136
4.6.1. Existence of monitoring structures in the EU Member States .................................... 138

2
4.6.2. Effectiveness of WHO NOPA database communication ............................................ 144
4.6.3. Usefulness of WHO monitoring material for policy development ................................ 147
5. CONCLUSIONS AND RECOMMENDATIONS ................................................................... 152
5.1. Key conclusions per thematic area .................................................................................. 152
5.1.1. Member State activities and High Level Group .......................................................... 152
5.1.2. EU Platform for Action on Diet, Physical Activity and Health ...................................... 152
5.1.3. EU Legislation ........................................................................................................... 153
5.1.4. Integration of NOPA dimension in other EU policies .................................................. 154
5.1.5. EU funding and programmes ..................................................................................... 155
5.1.6. Monitoring system / evidence base ............................................................................ 156
5.2. Key conclusions from the case studies ............................................................................ 157
5.2.1. Making the healthy option available ........................................................................... 157
5.2.2. Encouraging physical activity ..................................................................................... 158
5.2.3. Targeting priority groups (inequalities) ....................................................................... 159
5.3. Overall conclusions and recommendations ..................................................................... 160
5.3.1. Level of action ........................................................................................................... 160
5.3.2. Effectiveness / impact................................................................................................ 161
5.3.3. Recommendations .................................................................................................... 162

3
LIST OF TABLES
Table 1: Evaluation themes and questions ...................................................................................................... 16 Table 2: Summary of main primary data collection methods ........................................................................... 22 Table 3: Strategy implementation indicators at national level .......................................................................... 39 Table 4: ‘Fat’ taxes in EU countries ................................................................................................................. 44 Table 5: Perceived usefulness of the individual renewed objectives and working methods ........................... 60 Table 6: EU Member States’ actions on food marketing to children ................................................................ 84 Table 7: Private actions on food marketing to children .................................................................................... 86 Table 8: Self-regulatory codes of conduct on the advertising of food and beverages to children ................... 88 Table 9: Treatment of NOPA related impacts in IAs where the NOPA dimension was judged by the evaluation team to be clearly relevant ............................................................................................................................... 97 Table 10: Treatment of NOPA related impacts in IAs where the NOPA dimension was considered to be potentially relevant ........................................................................................................................................... 98 Table 11: NOPA-related actions funded by the Health Programme selected for in-depth assessment ........ 104 Table 12: Contribution of the selected actions to the priority areas of the EU Nutrition Strategy .................. 105 Table 13: Children and schools reached (2009/2010 vs. 2010/2011) ........................................................... 110 Table 14: Participating children and schools per country / region (2010/2011) ............................................. 111 Table 15: HEPA Preparatory Actions selected for in-depth assessment ...................................................... 124 Table 16: Contribution of the selected actions to the priority areas of the EU Nutrition Strategy .................. 127 Table 17: FP7 funding for research projects in areas supporting the objectives of the Strategy .................. 130 Table 18: NOPA-related actions funded by FP7 selected for in-depth assessment...................................... 131 Table 19: Contribution of the selected actions to the priority areas of the EU Nutrition Strategy .................. 132 Table 20: Physical activity surveillance in selected Member States .............................................................. 140 Table 21: Last year for which NOPA surveillance data is available per MS .................................................. 141
LIST OF FIGURES
Figure 1: Implementation of the EU Strategy – intervention logic.................................................................... 19 Figure 2: Schematic overview of the evaluation approach .............................................................................. 20 Figure 3: Obesity rates among adults (% of population) 2010 or nearest year ............................................... 25 Figure 4: Obesity rates among adults in selected European countries (% of population) ............................... 26 Figure 5: Self-reported inactivity levels across the EU and Norway (% of population).................................... 27 Figure 6: Trends in daily moderate-to-vigorous physical activity in children (% of population), 21 EU countries, 2005-06 to 2009-10 ......................................................................................................................... 28 Figure 7: EU average dietary energy supply (kcal/ person/ day), EU average dietary protein supply (g/ person/ day) and EU average dietary fat supply (g/ person/ day) 2000 to 2009 ............................................. 28 Figure 8: Death rates from CHD, men aged under 65, selected Member States ............................................ 30 Figure 9: Diabetes prevalence as % of population (selected Member States) ................................................ 30 Figure 10: Excerpt from the intervention logic - HLG and Member State action ............................................. 31 Figure 11: Better informed consumers, 2010 implementation status .............................................................. 40 Figure 12: Making the healthy option available, 2010 implementation status ................................................. 42 Figure 13: Encouraging physical activity .......................................................................................................... 44 Figure 14: Priority groups and settings ............................................................................................................ 46 Figure 15: Developing monitoring systems ...................................................................................................... 47 Figure 16: Engaging private sector .................................................................................................................. 48 Figure 17: Policy coherence at local level ........................................................................................................ 48 Figure 18: Excerpt from the intervention logic – Platform for Action on Diet, Physical Activity and Health and Private actor actions ......................................................................................................................................... 52 Figure 19: Active for-profit commitments by activity area in 2009 and 2011 ................................................... 55 Figure 20: Active not-for-profit commitments by activity area in 2009 and 2011 ............................................. 56 Figure 21: Active commitments targeting children and adolescents in 2009 and 2011................................... 57 Figure 22: Number of active commitments in renewed priority areas in 2009 and 2011 ................................ 58 Figure 23: Proportion of active commitments of a sample of for-profit members 2009 – 2011 ....................... 59 Figure 24: Excerpt from the intervention logic – EU legislation ....................................................................... 69 Figure 25: Transposition Article 9.2 AVMSD (2011) ........................................................................................ 81

4
Figure 26: Excerpt from the intervention logic – EU policy integration ............................................................ 92 Figure 27: Distribution of clearly relevant and potentially relevant IAs per DG ............................................... 96 Figure 28: Excerpt from the intervention logic – EU funding and programmes ............................................. 101 Figure 29: Expected impacts of the actions assessed ................................................................................... 107 Figure 30: Total number of aid recipients of the MDP and participating MS (2007 – 2011) .......................... 118 Figure 31: Breakdown of allocation under the MDP, 1995-2011 (in EUR) .................................................... 120 Figure 32: Expected impacts of the actions assessed ................................................................................... 128 Figure 33: Expected impacts of the actions assessed ................................................................................... 135 Figure 34: Excerpt from the intervention logic – monitoring system / evidence base.................................... 136 Figure 35: WHO European database on nutrition, obesity and physical activity (NOPA) ............................. 137 Figure 36: Number of types of surveillance data recorded (out of a possible 9) ........................................... 139 Figure 37: Use of the NOPA database website ............................................................................................. 150 Figure 38: Implementation of the EU Nutrition Strategy – desired outcomes ................................................ 157
ABBREVIATIONS
ARD
Arbeitsgemeinschaft der öffentlich-rechtlichen Rundfunkanstalten der Bundesrepublik
Deutschland (German television broadcaster)
AVMSD Audiovisual Media Services Directive
BMELV Bundesministerium für Ernährung, Landwirtschaft und Verbraucherschutz (German
Federal Ministry of Food, Agriculture and Consumer Protection)
BMG Bundesministerium für Gesundheit (German Federal Ministry for Health)
BMI Body mass index
CAP Common Agricultural Policy
CHD Coronary heart disease
CIVITAS City-Vitality-Sustainability Initiative
CMO Common Market Organisation
CVD Cardio-vascular disease
DG AGRI Directorate-General for Agriculture and Rural Development
DG CLIMA Directorate-General for Climate Action
DG CONNECT Directorate-General Communications Networks, Content and Technology
DG EAC Directorate-General Education and Culture
DG EMPL Directorate General for Employment, Social Affairs and Inclusion
DG ENTR Directorate-General for Enterprise and Industry
DG ENV Directorate-General for Environment
DG MARE Directorate-General for Maritime Affairs and Fisheries
DG MOVE Directorate-General for Mobility and Transport
DG REGIO Directorate-General for Regional Policy
DG RTD Directorate-General for Research and Innovation
DG SANCO Directorate-General for Health and Consumer Affairs
EA Economisti Associati s.r.l.
EAHC Executive Agency for Health and Consumers
EC European Commission
ECHI European Community Health Indicators
ECHIM European Community Health Indicators Monitoring
EFSA European Food Safety Authority
EHES European Health Examination Survey
EHIS European Health Interview Survey
EPHA European Public Health Alliance
ERDF European Regional Development Fund
ESF European Social Fund
EU European Union
EU PA GL European Union Physical Activity Guidelines
EURADIA Alliance for European Diabetes Research
EUROSTAT Statistical Office of the European Union

5
F&V Fruit and vegetables
FAO Food and Agricultural Organisation of the United Nations
FBS Food balance sheet
FEND Foundation of European Nurses in Diabetes
FP7 Seventh Framework Programme for Research
FTE Full time employee
g Gram
GPAQ Global Physical Activity Questionnaire
HBSC Health behaviour in school-aged children
HEPA Health-enhancing physical activity
HFSS High in fat, sugar and salt
HIAP Health in all policies
HLG High Level Group
HP Health programme
IA Impact assessment
ICC International Chamber of Commerce
IDF International Diabetes Federation
IO International organisation
IPAQ International Physical Activity Questionnaire
ISSG Inter service steering group
JRC Joint Research Centre
kcal Kilocalorie(s)
kg Kilogram
MDP Most Deprived Programme
MET Metabolic equivalent
mmol/L Millimoles per litre
MS Member State(s)
NCD Non-communicable disease
NCP National Contact Point
NGO Non-governmental organisation
NOPA Nutrition, obesity and physical activity
OECD Organisation for Economic Cooperation and Development
PA Physical activity
PCDE Primary Care Diabetes Europe
PHEIAC Public Health Evaluation and Impact Assessment Consortium
Phil. Trans. R.
Soc. B
Philosophical Transactions of the Royal Society B: Biological Sciences (Journal)
PNAA Plan national d’aide alimentaire (French national food aid programme)
R&D Research and development
RStV Rundfunkstaatsvertrag (German interstate broadcasting agreement)
SFS School Fruit Scheme
SG Steering group
SKU Stock-Keeping Unit
SMS School Milk Scheme
SPSI Social protection and social inclusion
TEP The Evaluation Partnership
TVWFD Television Without Frontiers Directive
UN United Nations
VAT Value Added Tax
WHO World Health Organisation
ZAW Zentralverband der deutschen Werbewirtschaft (Association of the German Advertising
Industry)
ZDF Zweites Deutsches Fernsehen (German television broadcaster)

6
0. EXECUTIVE SUMMARY
A) EVALUATION CONTEXT
The Strategy for Europe on Nutrition, Overweight and Obesity related health issues
In view of the dramatic rise in the levels of overweight and obesity and the worsening trend of poor diets and low physical activity levels across large parts of Europe, the EU began to significantly ramp up its action in this area approximately ten years ago. In 2007, the publication of the Strategy for Europe on Nutrition, Overweight and Obesity related health issues (“the Strategy”) provided an integrated framework for action intended to contribute to reducing ill health due to poor nutrition, overweight and obesity in the EU. Emphasising the Commission’s conviction that “an optimal response in this field will be achieved by promoting both the complementarity and integration of different relevant policy areas (horizontal approach), and of the different levels of action [i.e. local, regional, national, European and international] (vertical approach)”, the Strategy advocates a partnership approach, and encourages action by four main groups of actors: the EU itself, Member States, private actors, and international cooperation with the WHO.
The Evaluation
In 2012, the European Commission commissioned an independent external evaluation of the implementation of the Strategy. The aim of the evaluation was to assess both the implementation process (i.e. if, how and how far relevant initiatives have been developed by the European Commission and other relevant actors) and its impact (i.e. to what extent the relevant initiatives and the Strategy as a whole have produced results in line with their respective objectives). The scope of the evaluation included initiatives / actions developed and implemented between 2007 and 2011 by all four main groups of actors.
The evaluation approach was built on three distinct pillars (or task packages):
1. Evaluation according to (groups of) instruments: The main focus of the evaluation was on assessing the implementation and, to the extent possible, the results of the individual key initiatives and instruments that were developed and put into action to implement the Strategy. The scope of this exercise was defined by the 17 evaluation questions, which were divided into six thematic areas.
2. Case studies according to desired outcomes: In order to develop a better understanding of the totality of actions and impacts against a given objective, three case studies were conducted. These incorporated and built on the relevant results of the previous task package, but rather than focusing on individual instruments or outputs, each case study focused on a specific desired outcome.
3. Analysis of statistics and trends on the evolution of NOPA issues: An in-depth review and assessment of available statistical sources concerning obesity and overweight and other Nutrition, Obesity, and Physical Activity (NOPA) related issues was undertaken, in order to provide an indication of whether progress is being made in line with the global objectives of the Strategy.
The data collection and analysis methods and tools were tailored to each specific thematic area and task package. Primary data for the evaluation was generated by engaging a total of nearly 200 relevant stakeholders and key informants through interviews and focus groups. The evaluation also compiled and used secondary data from a large number of documents and databases.

7
B) CONCLUSIONS AND RECOMMENDATIONS
Level of action
The Strategy and the various instruments to implement it have contributed to galvanising and inspiring efforts to address nutrition, overweight and obesity-related health issues. At European level, the EU has developed and implemented legislation in some of the key areas identified as priorities in the Strategy. These mostly concern the labelling and marketing of food and related projects, and are in part aimed at improving the provision of nutrition information to consumers. In addition, to support goals as diverse as strengthening the evidence base for policy-making and making healthy foods more available to specific target groups, the Commission has funded a variety of programmes and transnational projects.
The Commission has also set up numerous fora to facilitate engagement among other stakeholders. Through the Platform, it brings the private and voluntary sectors together, where it is then their responsibility to agree and adhere to commitments intended to address specific aspects of overweight and obesity-related health issues. In order to encourage action among the Member States, the Commission established the High Level Group, which fosters peer learning, the sharing of best practices and the negotiation and agreement of common initiatives. The Member States also address the Strategy’s key areas with their own policies and initiatives, though the level of action varies considerably according to the issue and country in question.
It is worth noting that the majority of initiatives at the EU as well as national levels have addressed nutrition and related issues to a greater extent than promoting physical activity. Several factors have contributed to this disparity, including the nature of the problems to be addressed, the types of interventions at the relevant actors’ disposal, and the membership structure of the existing fora.
Overall effectiveness / impact
Both by taking action itself and by engaging with other relevant actors, the EU has contributed to addressing several key determinants of overweight, obesity and related health issues. Thus, progress has been made (albeit to a varying extent) towards all of the objectives defined in the Strategy. The measures taken were clearly steps in the right direction, although (partly due to the ‘soft’ competence and the limited resources available to the EU) their contribution has in most cases not led to major changes (at least not when seen in relation to the scale of the problem, as the levels of overweight and obesity continue to be high across the EU).
In this context, it is worth highlighting that most of the action taken in Europe to date (both at the EU and at the national levels) has been of a relatively soft nature, and has relied primarily (although the extent varies by country) on information provision and education, limited interventions in specific environments (such as schools), and voluntary actions by the food industry and other private actors, so as to generate an impact via a series of relatively subtle changes.
There are many who argue that more intrusive measures, in particular stricter regulation and/or fiscal measures, would be more effective to combat overweight and obesity, and there is some evidence to suggest this may indeed be the case. However, since there is a lack of consensus among Member States (who have primary responsibility for this area) on the desirability of such measures, it would have been unrealistic to expect the EU to work actively to encourage them.
Therefore, considering the various constraints the EU faces, the Strategy and its implementation have been reasonably effective. It has contributed to the issue’s firm establishment on the political agenda, and helped to facilitate cooperation between and action by a range of actors.

8
However, with a view to the future, the evaluation results also show there is a real risk that, without a new impetus, interest in continuing to deal with the issue may fade, at least at the European level. The gains made since the adoption of the Strategy were at least partly due to the Commission’s willingness to innovate, develop ideas and test new initiatives. As these initiatives become more established, enthusiasm for them is beginning to wear off, as evidenced by a certain tendency towards inertia in both the High Level Group and the Platform.
More generally, the economic crisis has profoundly altered the policy landscape since the Strategy was adopted in 2007. This speaks firstly to the need to take adequate consideration of the budgetary and other constraints faced by public and private actors in all initiatives aimed at addressing nutrition and physical activity. It also highlights the implications of rising inequality for health: socio-economically disadvantaged groups are more likely to have unhealthy diets and be physically inactive.
Recommendations
The EU should build on the progress made since the adoption of the Strategy in 2007. It should continue to play an active role and facilitate an integrated and holistic approach to policy in this area. Within the areas of its competence, it should continue to both pursue actions itself and seek to engage and build partnerships with other stakeholders, including Member States and the private sector. However, substantial efforts are needed to re-focus efforts and re-energise collaboration. Areas that deserve particular attention going forward include:
A greater focus on physical activity promotion; and
A careful consideration of effects on lower socio-economic groups, to ensure that initiatives do not further exacerbate health inequalities.
Member State activities and the High Level Group
The High Level Group has brought together senior officials from the Member States on a regular basis, encouraging them to learn from each other, cultivate working relationships, pursue joint initiatives and keep abreast of important EU policy developments.
The Salt Reduction Framework, a voluntary initiative jointly agreed by all HLG members, is the best example of the HLG’s potential to make a real impact. The progress made with the Framework demonstrates the HLG provides an ideal forum for promulgating effective policy ideas among EU countries, galvanising political will and reaching workable compromises. The continued attention to the issue and regular reporting have ensured that, at least in some countries, the initiative has led to real change (though impact evidence is scarce) and even opened the door to types of intervention, such as voluntary agreements with industry, that were not previously considered.
The HLG’s other achievements have been softer, harder to assess and, indeed, indicative of the risks now facing it. Although some value is clearly added by bringing key officials together and encouraging an open exchange of ideas on MS and EU policy developments, lacking a major initiative to re-focus minds post-Salt Reduction Framework (extending the Framework to other nutrients has so far proven difficult), the HLG appears to be witnessing an unintended, gradual de-prioritisation on both sides and diminishing relevance. For example, members have noticed that less senior Commission officials chair the meetings than was previously the case, and often respond in kind, as director-level participants are increasingly replaced by more junior substitutes.

9
Recommendations
The Commission should strive to re-establish the HLG as a unique forum where key discussions and debates are held and where important information is exchanged. Ways to do this include:
Re-launch the objectives and strategic direction of the HLG, potentially in the context of the successor to the Strategy, so that it is clear to members why they should attend and what they can expect to get out of the meetings.
Define new topics for future joint agreements, striking a balance between a high level of ambition and reasonable chances of success. If consensus does not appear possible in a given area, consider encouraging members to pursue smaller initiatives among the like-minded.
Demonstrate to members that the HLG is high on the Commission’s list of priorities by enlisting senior officials to chair meetings and, where possible, invite guest speakers that members are unlikely to encounter in other fora.
EU Platform for Action on Diet, Physical Activity and Health
Since its launch in 2005, the EU Platform for Action on Diet, Physical Activity and Health has provided a common forum for exchange between private and civil society actors from different sectors and the Commission, and has contributed to enhancing dialogue and mutual understanding between them. The Platform has also contributed to generating a significant level of action, embodied in the more than 300 voluntary commitments made by its members.
The main problem facing the Platform is the difficulty of assessing the relevance, proportionality and impact of these actions. The reasons for this include the lack of comparability between individual commitments, and the fact that the Platform has no common (quantitative) targets, and no effective mechanism for assessing commitments, their objectives and outcomes, let alone their ultimate health impacts. As a result, many members feel they have little insight into the real value and appropriateness of commitments, and tend to distrust each other’s intentions (in particular regarding voluntary commitments by the food industry). The review of a sample of commitments suggests that there are vast differences between commitments as regards their scope, level of ambition and the extent to which they deliver and report – or can be expected to deliver and report – concrete and relevant results.
A number of recent developments within the Platform (inter alia the renewed objectives agreed in 2011) have been positive, but not sufficient to significantly alter this situation. Thus, the fundamental problem remains that, although the Platform has successfully engaged key stakeholders, improved the dialogue between them and generated a significant amount of action, it has largely failed to achieve the other key objective set in its founding charter, namely that “over time better evidence is assembled of what works, and Best Practice more clearly defined.” This lack of evidence, and of an objective and widely accepted mechanism to judge the merit of commitments, had led to some disenchantment. Many Platform members feel that the dialogue has become increasingly stale, as similar arguments (based more on pre-formed opinion than on objectively verifiable facts) are repeated time and again.

10
Recommendations
The Platform should focus on making progress towards generating better evidence. To achieve this, thought needs to be given to how the relevance, proportionality and/or impact of commitments can be assessed more comprehensively and systematically. Ways in which this could potentially be done include:
Pre-screening of commitments by an independent panel;
Periodic analytical (rather than purely descriptive) reviews of commitments by activity area; and
The commissioning of targeted scientific research and/or evaluative studies.
All of these would have resource implications. Any such measures also need to be considered carefully to ensure they are acceptable to members and do not deter further voluntary action.
EU legislation
Three pieces of EU legislation are clearly relevant to the Strategy’s specific objective of ‘better informed consumers’. The Nutrition and Health Claims Regulation (adopted in 2006) and the Food Information Regulation (adopted in 2011) have the potential of enabling consumers to make healthier food choices by making more information relevant to health and diet available. For example, the Nutrition and Health Claims Regulation harmonises the criteria products have to fulfil in order to be allowed to carry nutrition claims such as “energy-reduced”, “saturated fat free” or “(very) low sodium/salt”. The Food Information Regulation makes labelling for energy and six key nutrients mandatory, sets rules for legibility, and allows for additional forms of representation (such as colour coded systems) on a voluntary basis as long as certain criteria are met.
While these are clearly steps in the right direction in terms of enabling consumers to be better informed and avoiding misleading information, it would be wrong to classify them as ground-breaking developments in the fight against overweight, obesity and related health problems. There are a number of concerns and/or shortcomings that are likely to limit the ultimate health impact of both Regulations. The fact that the Food Information Regulation does not mandate any form of front-of-pack nutrition declaration is disappointing considering the large body of evidence demonstrating the much higher effectiveness of front-of-pack labelling for most consumers. Also, the lack of common nutrient profiles (which are supposed to be one of the central elements of the Nutrition and Health Claims Regulation) continues to be a considerable source of frustration, both among industry actors and health and consumer organisations.
The Audiovisual Media Services Directive (adopted in 2007) includes an article that calls on Member States and the Commission to encourage self-regulation by media service providers to limit advertising of ‘unhealthy’ foods and beverages to children. This has contributed to limiting such advertising, in so far as it was one of several factors that led to the development of self-regulatory approaches in many Member States. Due to the variety of codes (in terms of restrictions, media coverage, and definitions of key concepts), the Article’s contributions to the objectives of the Strategy vary across the different Member States. The review of the situation in five Member States suggests that in some cases, the codes that were adopted (or revised) are not strict or clear enough to have a significant impact on actual advertising practices.

11
Recommendations
The Commission (in collaboration with other actors) should consider further steps to address the shortcomings of the EU legislation adopted in recent years (when compared with the optimal outcomes from a health perspective). This should include:
Working towards the widespread and consistent implementation (on a voluntary basis) of front-of-pack energy and nutrient labelling;
Making a concerted effort to agree and implement the nutrient profiles foreseen in the Nutrition and Health Claims Regulation; and
Continuing to monitor self-regulation (as well as regulation) on food marketing to children in the EU Member States, with a view to highlighting differences in approaches and implementation and their effects on advertising practices and exposure.
Integration of NOPA dimension in other EU policies
In accordance with the ‘Health in all Policies’ principle, DG SANCO aims to ensure an adequate contribution of relevant EU policies to the objectives in the field of nutrition, obesity and physical activity (NOPA). The integration of NOPA concerns in other EU policies has been quite successful in some policy areas, including (parts of) the EU’s agricultural, research, media, sport, consumer protection, and health statistics. On the other hand, there has been little or no inter-service cooperation in a number of other policy spheres, including transport, employment and regional policy.
A systematic screening and subsequent analysis of (potentially) relevant Commission Impact Assessments (which are one of the key vehicles to achieve policy integration) suggests that, for policies that are clearly relevant from the NOPA perspective, the majority of IAs did consider these impacts (though there were a few exceptions). However, for policies where the relevance of the NOPA dimension is less clear (i.e. policies that touch on issues that can potentially affect NOPA, but where this isn’t one of the central objectives), the mention or even analysis of NOPA impacts is the exception rather than the norm.
Thus, by and large, DG SANCO has successfully integrated NOPA concerns into EU policies where the implications were relatively clear. However, partly due to capacity constraints, it has found it more difficult to mainstream the NOPA dimension into other, potentially much broader policies, where its relevance is typically less obvious.
Recommendations
To implement the Health in All Policies approach more fully, DG SANCO should attempt to engage more with the Commission services responsible for a range of EU policies for which the NOPA implications tend to be less obvious, but can potentially be very significant. Relevant policy areas that should be prioritised include:
Regional policy, in particular the structural funds;
Environmental policy, in particular in the context of the work towards a possible EU ‘Sustainable Food Strategy’;
Health and safety at work; and
Urban transport / mobility.

12
EU funding and programmes
Between 2007 and 2011, the Commission invested EUR 304.2 million to co-fund 98 projects that are relevant to the Strategy through the Seventh Framework Programme for Research (which provided the lion’s share of the funding), the Health Programme and the Preparatory Actions in the field of sport. Such projects can make a significant contribution to strengthening the evidence base for policy-making, and in some cases have also had a tangible positive impact on other relevant objectives. Generally speaking, the most successful projects were those that were integrated by partners with a long-standing history of collaboration; included partners with complementary expertise; featured a strong dissemination component; derived policy implications; and provided high sustainability prospects after EU funding.
The EU School Fruit Scheme was essential to the extension of existing or creation of new programmes in 24 Member States. In the school year 2010/11, the EU Scheme contributed to the distribution of an average of 35 portions of fruit and vegetables to over 8 million school children. The scheme had a positive impact on children’s fruit and vegetables consumption in the short term. Although it was too early to measure any longer-term impacts, there is a body of scientific evidence suggesting that fruit and vegetable schemes can have long term impacts on consumption, provided that their design (including frequency and type of produce distributed, accompanying educational measures etc.) is in line with the respective education systems and food cultures.
The Most Deprived Programme has contributed to feeding millions of needy people across Europe. But given that nearly all of the food distributed consisted of basic foodstuffs like cereal-based products (pasta, rice, flour) and dairy products (milk, skim milk powder, butter and cheese), while the amount of fresh fruit and vegetables was negligible, it is very unlikely that the Programme had a significant effect on the nutritional behaviour (in terms of healthier eating habits) of beneficiaries during the period under evaluation (2007-2011). However, nutritional considerations have begun to play a more important role from 2012 onwards (with the new regulation), and there are indications that this will continue to be the case in a future revised programme.
Recommendations
EU co-funding for schemes and programmes to pursue NOPA-related objectives has been effective and should be continued. In particular:
So as to maximise their relevance and policy impact, funding decisions for transnational projects should emphasise the dissemination strategy, policy implications, and sustainability of projects.
With three funding options for NOPA-related projects available in the programming period 2014-2020, the Commission services concerned (DG RTD, DG SANCO and DG EAC) should co-ordinate in order to minimise overlaps and maximise clarity.
The Commission should carefully consider the recommendations made by the external evaluations of the EU School Fruit Scheme and the School Milk Scheme (once it becomes available), in particular to provide more guidance for effective accompanying measures and more consistent and comparable evaluations of national / regional schemes.
Monitoring system / evidence base
The NOPA database, a project jointly funded by the Commission and WHO Europe, collects and catalogues surveillance data and information on national policies and actions from across the EU and publicises the findings. Some of the obstacles to the success of the project, mostly related to surveillance data, are beyond WHO Europe and the Commission’s control, as the database

13
depends on the timeliness and comparability of data collected by a range of actors. Examination of this data reveals persistent methodological inconsistencies that render comparison between countries difficult. This is especially true for trend data which would be extremely useful in determining the relative success of different policy approaches.
Concerning issues over which the project exercises more control, it has made considerable achievements. WHO Europe has collected an enormous amount of information on each country’s policies and actions, and made some of this, particularly actual policy documents, publicly available through the NOPA database and a series of publications. This has enabled relevant stakeholders to learn about what other countries are doing and encouraged them to find out more. Although there are concerns about parts of the database going out of date, this represents a major achievement and can make a significant contribution to policy development in the EU.
However, there have been inter-related shortcomings in organising and disseminating the massive amount of information at WHO Europe’s disposal. The current version of the NOPA database accessible to the public does not make available any surveillance data. The policy information displayed is mostly limited to the existence of policies and basic facts about them (rather than the detailed information on implementation and evaluation that has also been collected). Moreover, the project has generally not been widely publicised, meaning that awareness of it is limited to a small group of insiders.
Recommendations
With a view towards the next phase of the project, the Commission and WHO Europe should increase the focus on the NOPA database’s user-friendliness and dissemination of information. In particular, this could entail:
Publish the surveillance data collected so as to facilitate comparison between countries and help stakeholders figure out how their countries are performing in relation to others.
Increase the functionality of the NOPA database website so that stakeholders can find information on the implementation and evaluation of policies.
Communicate about the NOPA database to a wider audience, inter alia through exploring opportunities for cross-promotion on the Commission website and other fora.
Taking a broader view, this evaluation has highlighted many times that the current provision of surveillance and evaluation data in the EU as a whole is far from adequate. Without such data it is difficult to make statements about current trends with confidence, or to assess the effectiveness of policies meant to address overweight and obesity. The Commission, along with WHO Europe, should work to encourage relevant actors in the Member States to collect better data at regular intervals, promote the awareness and adoption of common standards and methodologies, such as those already developed for the EHIS and Global Physical Activity Questionnaire, and ensure that results are published and disseminated widely.

14
1. INTRODUCTION
This report is the fourth and final deliverable submitted to the European Commission – Directorate General for Health and Consumers (DG SANCO) by The Evaluation Partnership (TEP) on behalf of the “Public Health Evaluation and Impact Assessment Consortium” (PHEIAC) in the context of the Evaluation of the implementation of the Strategy for Europe on Nutrition, Overweight and Obesity related health issues.
It contains the complete results of all evaluation tasks, as well as conclusions and recommendations. The report is structured as follows:
Section 2 briefly introduces the evaluation subject, purpose and issues, as well as the approach and methodology and key limitations.
Section 3 summarises the most relevant statistical data concerning trends in overweight and obesity and other related issues.
Section 4 presents the main findings of the evaluation, structured by thematic areas and evaluation questions.
Section 5 contains key conclusions on the main groups of instruments (based on the responses to the evaluation questions) and certain key objectives (based on the case studies), as well as overarching conclusions and recommendations.
Additional materials have been submitted in separate documents, namely:
The full reports on the three case studies.
The Annexes, which contain more detailed reports on a number of areas addressed by the evaluation, as well as technical materials related to the evaluation methodology.
The evaluation team would like to express its gratitude to all those who contributed to the evaluation, including officials in DG SANCO and other Commission services, national government representatives and other stakeholders from the private sector and civil society. We are especially grateful for the valuable input and advice provided by Annette Stafleu (diet and nutrition expert, TNO), Willem van Mechelen and Hidde van der Ploeg (experts on physical activity, VU University Medical Center Amsterdam).
Any queries related to this report should be directed to the team leader, Mr Martin Kuehnemund.
Martin Kuehnemund Principal, EU evaluation The Evaluation Partnership Coffey 109 Baker Street London W1U 6RP United Kingdom Tel. +44 20 7487 0400 [email protected]

15
2. APPROACH TO THE EVALUATION
2.1. Evaluation background and purpose
The Strategy for Europe on Nutrition, Overweight and Obesity related health issues
In view of the dramatic rise in the levels of overweight and obesity and the worsening trend of poor diets and low physical activity levels across large parts of Europe, the EU began to significantly ramp up its action in this area approximately ten years ago. Following repeated calls for action from the Council,1 the European Commission launched a Green Paper consultation in 2005,2 which led to the adoption of the White Paper on “A Strategy for Europe on Nutrition, Overweight and Obesity related health issues” (“the Strategy”) in 2007.3 This Strategy provides an integrated framework for action intended to contribute to reducing ill health due to poor nutrition, overweight and obesity in the EU. Emphasising the Commission’s conviction that “an optimal response in this field will be achieved by promoting both the complementarity and integration of different relevant policy areas (horizontal approach), and of the different levels of action [i.e. local, regional, national, European and international] (vertical approach)”, the Strategy advocates a partnership approach, and goes on to outline the roles of and encourage action by four main groups of actors: the EU itself, Member States, private actors, and international cooperation with the WHO.
Purpose and scope of the evaluation
Almost exactly five years after the adoption of the Strategy for Europe on Nutrition, Overweight and Obesity related health issues, the European Commission decided to commission an independent external evaluation of the implementation of the Strategy. According to the Task Specifications:
“The general aim of the evaluation is to give a substantiated knowledge of the degree of achievement of actions by the Commission and Member States since 2007 and an assessment of how far they contributed to promote health, prevent ill health caused by poor nutrition, overweight and obesity and in particular of their capacity to help achieving the WHO Europe objective of a decline of overweight and obesity by 2015.”
The objective of the evaluation is essentially two-fold. In widely used evaluation terminology, the project can be described as a combined process and impact evaluation, since it is to assess both:
The implementation process – i.e. if, how and how far relevant initiatives have been developed between 2007 and 2011 by the European Commission and other relevant actors; and
1 Council Conclusions of 2 December 2002 on Obesity (OJ C 11, 17.1.2003, p. 3), of 2 December 2003 on
Healthy Lifestyles (OJ C 22, 27.1.2004, p. 1); of 2 June 2004 on Promoting Heart Health (Press release: 9507/04 (Presse 163); of 6 June 2005 on Obesity, Nutrition and Physical Activity (Press release: 8980/05 (Presse 117); of 5 June 2006 on Promotion of Healthy Lifestyles and Prevention of Type II diabetes (OJ C 147, 23.6.2006, p. 1). 2 European Commission: Green Paper "Promoting healthy diets and physical activity: a European dimension
for the prevention of overweight, obesity and chronic diseases". COM(2005) 637 final 3 European Commission: White Paper on “A Strategy for Europe on Nutrition, Overweight and Obesity
related health issues”. COM(2007) 279 final

16
Its impact – i.e. to what extent the relevant initiatives and the Strategy as a whole have produced results in line with their respective objectives, against the baseline of 2007.
The scope of the evaluation includes initiatives / actions by all four groups of actors identified previously, namely:
The European Commission, in its roles as: o Policy co-ordinator between different Commission services, with Member States –
via the High Level Group for Nutrition and Physical Activity (HLG) – and with private actors (via the EU Platform for Action on Diet, Physical Activity and Health);
o Regulator; and o Developer and implementer of programmes and funding schemes.
Member States, as members of the HLG and as developers / implementers of national approaches, policies and legislation.
Industry and civil society, as members of the EU Platform and as ‘owners’ of the various commitments made as part of the Platform process.
WHO Europe, as the Commission’s partner in monitoring progress, especially at the Member State level.
Evaluation issues and questions
The Task Specifications for the assignment define a set of evaluation questions to be answered. Broadly speaking, these concern two kinds of key evaluation issues that correspond with the two-fold objective set out above (process / impact evaluation):
Process / implementation: The extent to which envisaged initiatives have been implemented in line with expectations.
Effectiveness / Utility: The extent to which objectives set are achieved, and the extent to which the effects corresponded with the needs problems and issues to be addressed.
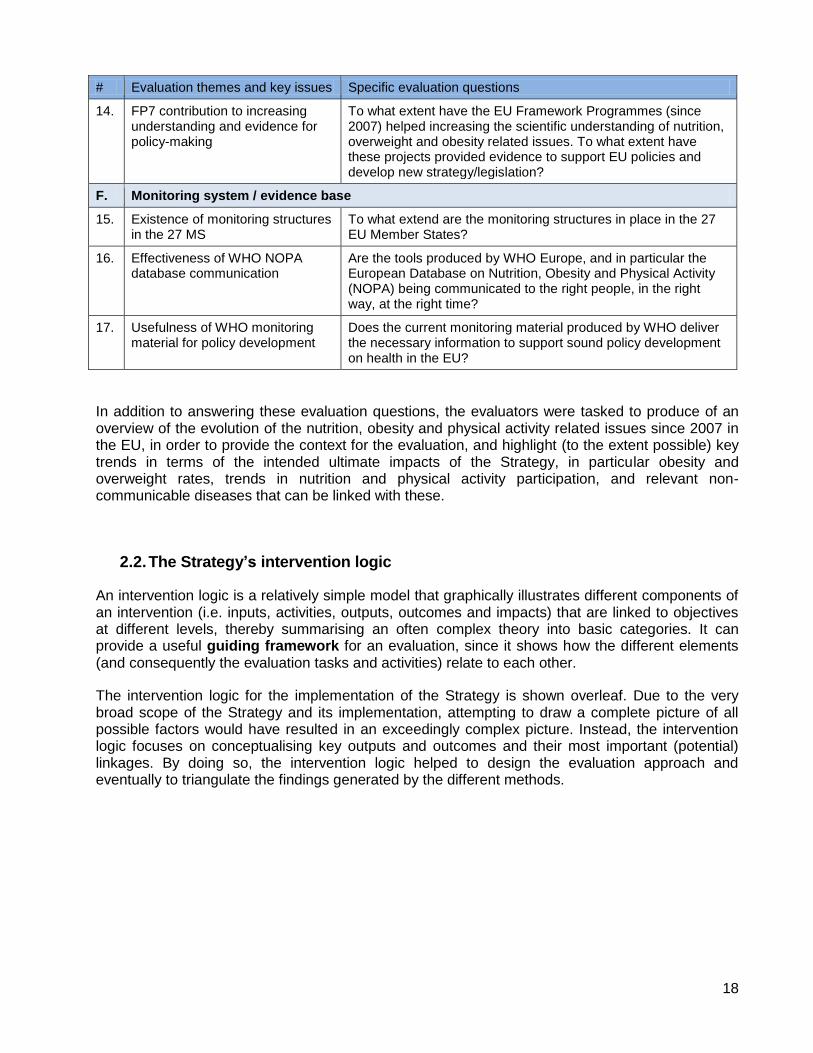
The 17 evaluation questions relate to six main themes or types of initiatives / actions. They are reproduced in full in the table below. In addition, for ease of reference, the table contains an abridged version of the key issues under each question.
Table 1: Evaluation themes and questions
# Evaluation themes and key issues Specific evaluation questions
A. Member State activities and the HLG
1. HLG impact on dialogue, understanding and harmonisation of approaches across MS
To what extent has the HLG contributed to a better dialogue between the Member States and better understanding of each other’s approaches? To what extent has the HLG been instrumental in promoting similar strategy implementation across Member States?
2. EC role of facilitator in the HLG To what extent has the Commission played its role of facilitator in the HLG?

17
# Evaluation themes and key issues Specific evaluation questions
3. Progress of national approaches in key areas
To what extent have national approaches progressed in the following key areas?
a. Better informed consumers. b. Making the healthy option available c. Encouraging Physical activity. d. Priority groups and settings e. Developing a monitoring system f. Engaging private sector. g. Policy coherence at local level.
4. Impact of HLG on progress of national approaches
To what extent have the progresses mentioned in question 3 been influenced by the work of the HLG?
B. EU Platform for Action on Diet, Physical Activity and Health
5. Relevance of commitments to the needs of stakeholders and citizens
To what extent do actions initiated by Platform members address the needs of stakeholders and EU citizens? This should address in particular actions launched since 2010.
6. Proportionality between level of action and Platform objectives
Is the level of action(s) initiated by Platform members in a sound relationship to the operational objectives targeted in the founding Charter? Contractors should investigate, to the extent possible, the quantitative aspects between the input given by the members and the desirable potential outcomes.
C. Existing EU legislation related to the implementation of the Strategy
7. Development of new European laws
To what degree has the EU developed the new European laws foreseen in the White Paper? Aspects to be studied should cover work of the Commission, the Council and the European Parliament.
8. Impact of AVMSD on self-regulation in marketing to children
What has been the impact of the AVMSD on the development of self regulatory approaches to marketing of HFSS food and beverages to children? Aspects to be studied should address both facilitating policies by MS and actions developed by the industry.
D. EU integration of policies
9. Integration of NOPA dimension in EU policies
To what extent has the DG SANCO been successful in integrating Nutrition and Physical Activity dimensions in different EU policies?
E. EU funding and programmes
10. Health Programme contribution to development of good practices
To what extent has the EU Health Programme contributed to the development of good practices in the Member States? To what extent has the Health Programme addressed the needs in this regard?
11. Utility and results of the School Fruit Scheme
What is the utility of the European School Fruit Scheme to the Strategy according to the results achieved?
12. Impact of the most deprived programme on nutritional behaviour
What is the impact of the most deprived programme on the nutritional behaviour of programmes beneficiaries?
13. Impact of 2009 Preparatory Actions in the field of sport (HEPA projects)
What was the impact of the 2009 Preparatory Action in the field of sport (Health Enhancing Physical Activity projects)?
18
# Evaluation themes and key issues Specific evaluation questions
14. FP7 contribution to increasing understanding and evidence for policy-making
To what extent have the EU Framework Programmes (since 2007) helped increasing the scientific understanding of nutrition, overweight and obesity related issues. To what extent have these projects provided evidence to support EU policies and develop new strategy/legislation?
F. Monitoring system / evidence base
15. Existence of monitoring structures in the 27 MS
To what extend are the monitoring structures in place in the 27 EU Member States?
16. Effectiveness of WHO NOPA database communication
Are the tools produced by WHO Europe, and in particular the European Database on Nutrition, Obesity and Physical Activity (NOPA) being communicated to the right people, in the right way, at the right time?
17. Usefulness of WHO monitoring material for policy development
Does the current monitoring material produced by WHO deliver the necessary information to support sound policy development on health in the EU?
In addition to answering these evaluation questions, the evaluators were tasked to produce of an overview of the evolution of the nutrition, obesity and physical activity related issues since 2007 in the EU, in order to provide the context for the evaluation, and highlight (to the extent possible) key trends in terms of the intended ultimate impacts of the Strategy, in particular obesity and overweight rates, trends in nutrition and physical activity participation, and relevant non-communicable diseases that can be linked with these.
2.2. The Strategy’s intervention logic
An intervention logic is a relatively simple model that graphically illustrates different components of an intervention (i.e. inputs, activities, outputs, outcomes and impacts) that are linked to objectives at different levels, thereby summarising an often complex theory into basic categories. It can provide a useful guiding framework for an evaluation, since it shows how the different elements (and consequently the evaluation tasks and activities) relate to each other.
The intervention logic for the implementation of the Strategy is shown overleaf. Due to the very broad scope of the Strategy and its implementation, attempting to draw a complete picture of all possible factors would have resulted in an exceedingly complex picture. Instead, the intervention logic focuses on conceptualising key outputs and outcomes and their most important (potential) linkages. By doing so, the intervention logic helped to design the evaluation approach and eventually to triangulate the findings generated by the different methods.

19
Figure 1: Implementation of the EU Strategy – intervention logic
European Commission Private actors
EC & WHO
Europe
Priority areas
Member States
Better informed consumers
Healthy options available
Physical activity encouraged
Evidence base for policy-making
Priority groups targeted
Effective monitoring systems
Tra
nsnation
al
pro
jects
on
NO
PA
-
rela
ted
issu
es
Dis
trib
utio
n o
f h
ealthy
foo
d. to
child
ren a
nd
acco
mp.
measure
s
Code
s o
f co
nd
uct
for
advert
isin
g to
child
ren
Audio
vis
ual M
edia
Serv
ices D
irective
Health P
rogra
mm
e
School F
ruit S
che
me
School M
ilk S
che
me
EU
polic
ies:
Educa
tion
, tr
an
spo
rt,
regio
nal p
olic
y,
etc
.
NO
PA
inte
gra
ted into
oth
er
polic
ies
Hig
h-L
evel G
roup f
or
NP
A
Pla
tfo
rm f
or
Actio
n
on D
iet, P
hysic
al
Activity a
nd
He
alth
Co-o
rdin
ation /
colla
bora
tio
n
Self-r
eg
ula
tion
Oth
er
actio
ns
Natio
nal polic
ies,
law
s,
actio
ns
Co-o
rdin
ation /
colla
bora
tio
n
Mis
cella
neou
s
app
roach
es/a
ctio
ns
Com
mitm
en
ts
Better health and quality of life
Smart, sustainable, inclusive growth
Reduced obesity and overweight Reduced incidence of related NCDs
More health-enhancing physical activity
Healthier diets
Outputs
Instruments
Outcomes
Impacts
Nutr
itio
n a
nd H
ealth
Cla
ims R
eg
ula
tion
Fo
od I
nfo
rmation
Regula
tio
n
Most
De
prived
Pro
gra
mm
e
Pre
para
tory
Actions
in th
e fie
ld o
f S
port
7th
Fra
mew
ork
Pro
gra
mm
e f
or
Rese
arc
h (
FP
7)
Monito
ring
of
national polic
ies
NO
PA
da
tabase
Fals
e,
mis
leadin
g o
r
unfo
un
de
d c
laim
s
pro
hib
ited
Key n
utr
itio
n
info
rmatio
n p
rovid
ed
on p
acks
Dis
trib
utio
n o
f
agricultura
l pro
ducts
to t
he m
ost n
ee
dy
Tra
nsnation
al
pro
jects
on
HE
PA
-
rela
ted
issu
es
Colla
bora
tive
rese
arc
h p
roje
cts
on
NO
PA
-rela
ted issu
es
Potentially all outcomes
Potentially all outcomes

20
2.3. Evaluation approach and methodology
The evaluation had to deal with several significant sources of complexity, most importantly the very broad scope (encompassing over a dozen policy instruments grouped under six thematic areas, and including actions by both the Commission and other actors) and the problem of measuring and attributing impact. In response to the challenges posed by this complexity, the evaluation approach is built on three distinct pillars (or task packages), as illustrated in the diagram below, and explained in more detail in the subsequent text.
Figure 2: Schematic overview of the evaluation approach
1. Evaluation according to (groups of) instruments: The main focus of the evaluation was on assessing the implementation and, to the extent possible, the results of the individual key initiatives and instruments that were developed and put into action to implement the Strategy. The scope of this exercise is defined by the 17 evaluation questions, which are divided into six thematic areas. The bulk of the data collection and analysis effort was structured along the lines of these areas and instruments. In each area, we used a tailored set of methods to collect a mix of primary and secondary, qualitative and quantitative data. In order to ensure the relevance and usefulness of the data, a series of judgment criteria and indicators were developed to guide the data collection and analysis process and ensure the evaluation questions can be answered in a robust and transparent way (see Annex 5). The findings and conclusions from this task are presented in section 4 of this report.
2. Case studies according to desired outcomes: The first task package produced a wealth of data for each of the thematic areas / instruments being evaluated. However, these results are necessarily fragmented, in that they only relate to specific instruments,
3. Analysis of statistics
and trends 2. Case studies according
to desired outcomes
1. Evaluation according to instruments
Member State
activities and the HLG
EU Platform for Action on Diet, PA and
Health
EU legislation related to the
Strategy
EU integration of
policies
EU funding and
programmes
Monitoring system / evidence
base
Overall
evaluation results
Making the healthy option available
Encouraging physical activity
Priority groups / inequalities
Evolution of obesity and overweight
Evolution of diet / nutrition
Evolution of physical activity rates

21
rather than the Strategy as a whole. In order to develop a better understanding of the totality of actions and impacts against a given objective, we conducted three case studies. These incorporated and built on the relevant results described previously, but the analytical perspective was different. Rather than focusing on individual instruments or outputs, each case study focused on a specific desired outcome and took into account the most important actions and instruments that were expected to contribute to these (including, where relevant, initiatives that were not covered within the six thematic areas). The purpose of the case studies was to assess progress against these specific objectives in a comprehensive manner, bringing together relevant information and data on separate but conceptually related instruments, and thus help overcome the fragmentation referred to above. The case study reports are contained in a separate document.
3. Analysis of statistics and trends on the evolution of NOPA issues: The two task packages described previously provided a large amount of relevant information about (a) the implementation of the Strategy (i.e. the extent to which the envisaged initiatives have been implemented in line with expectations and produced the expected outputs) and (b) the effectiveness (i.e. the extent to which outcomes in line with the envisaged specific objectives have been generated). However, this still did not allow us to make any definitive judgments as to the final impacts of the Strategy and its various implementing instruments, in terms of their effect on healthier diets, more physical activity, and ultimately reduced obesity and overweight. These issues are too complex, and there are too many intervening factors, for any impacts to be directly measurable, or for any measurable changes to be directly attributed to a specific instrument or action. Nonetheless, it is important to understand whether, in general terms, progress is being made in the fight against obesity and related problems. For this reason, we undertook an in-depth review and assessment of available statistical sources concerning obesity and overweight and other Nutrition, Obesity, and Physical Activity (NOPA) related issues. This analysis, which is summarised in section 3 of this report, was intended to provide an indication of whether progress is being made in line with the global objectives of the Strategy.
Data collection strategy
As outlined previously, the data collection and analysis methods and tools are tailored to each specific thematic area and task package. Primary data for the evaluation was generated by engaging a total of nearly 200 relevant stakeholders and key informants through interviews and focus groups. We also compiled and used secondary data by reviewing a very large number of documents and databases.
In practical terms, the different task packages mentioned above were kept separate for the purpose of data collection and initial analysis, which took place between September 2012 and February 2013. The case studies were undertaken after the conclusion of the data collection on the thematic areas, so that the results of the latter could be taken into account and incorporated where appropriate. A summary of the stakeholders and key informants that were consulted, and the respective methods used, is shown in the table below.

22
Table 2: Summary of main primary data collection methods
Evaluation themes
Instruments Stakeholders / informants consulted
Consultation method(s)
Number of respondents
A. Member State activities and the HLG
Member State activities and the HLG
HLG members Interviews 26 interviews conducted
B. EU Platform for Action
Platform meetings and commitments in general
Platform members Focus groups
Questionnaire (for members unable to attend the groups)
18 participants across 4 focus groups
11 questionnaire responses
Sample of 10 commitments Platform members (owners of specific commitments)
Interviews 10 interviews conducted
C. EU legislation
Development of legislation (health claims, food labelling, AVMSD)
Representatives of EU institutions, industry and civil society
Interviews 16 interviews conducted
AVMSD codes of conduct in 5 MS (DE, DK, HU, IT, PT)
Representatives of national authorities, industry, civil society
Interviews 20 interviews conducted
D. Integration of EU policies
Integration of EU policies EC officials (DG SANCO and other DGs)
Interviews 8 interviews conducted (DGs SANCO, AGRI, RTD, JRC, CONNECT)
E. EU funding and programmes
Health Programme
Prep. Actions Sport
FP7
Coordinators and partners for 10 selected projects
Interviews 30 interviews conducted (3 per project)
School Fruit Scheme (Recent evaluation available, no additional primary data collection foreseen)
N/A N/A
Most Deprived Programme EC officials, Member State representative, NGOs
Interviews 10 interviews conducted
F. Monitoring system / evidence base
NOPA database and related tools / mechanisms
Data managers / contributors (WHO, DG SANCO, national focal points)
(Potential) data users
Workshop / interviews
1 visit to the WHO in Copenhagen
25 interviews
Case studies Availability of healthy options
Physical activity promotion
Priority groups (inequalities)
Key informants (as appropriate to complement data from other sources)
Interviews 12 experts, policy-makers and evaluators
Statistics and trends
Overweight and obesity, nutrition, physical activity, NCDs
OECD, Eurostat, WHO Europe, IDF
Ad hoc contacts 4 organisations
Total 191
A summary of the evaluation methods employed, including a more detailed breakdown of the consulted organisations and groups, can be found in Annex 6.

23
2.4. Caveats and limitations
The nature of this exercise and of its subject posed a number of challenges to the evaluation, which mean that the results are subject to certain caveats and limitations. These mainly concern two key issues.
Firstly, the scope of the evaluation is extremely broad. It had to cover a very wide range of issues, instruments and initiatives, many of which could easily have been (and in some cases were) the subject of a dedicated evaluation of their own. As a result, the present evaluation had to be strategic and pragmatic about the effort that could be dedicated to data collection and analysis. It had to rely heavily on secondary data, including existing evaluation studies, implementation reports, databases and relevant scientific research, which did not always provide a complete picture of the level of action and effectiveness. We undertook primary research to complement and build on the available secondary data to the greatest extent possible, but due to the vast scope of the exercise, this could not always address all potentially relevant elements and aspects in the same amount of detail. Thus, the evaluation results are comprehensive in the sense that they cover all of the areas and instruments the evaluation was tasked to assess, but the depth and breadth of the analysis is sometimes limited by the available secondary data, as well as the time and resources at our disposal to collect additional primary data. This affects in particular the policies and measures taken at the level of the Member States, for which we had to rely mainly on what information was available from existing sources (in particular the NOPA database).
Secondly, the ultimate impact of the Strategy is very difficult to measure and/or attribute to specific interventions. This is due to several reasons. The Strategy itself is a policy document that is intended to spur action by various groups of actors, but determining its precise effect on their behaviour is very challenging, since there are numerous other factors (including activities of other actors such as the WHO and Member States) that also exert an influence. In turn, many of the instruments to implement the Strategy (such as the coordination fora) are of a ‘soft’ nature, which again makes it difficult to determine (or even quantify) their exact effects. Even the more tangible interventions usually address specific sub-issues (such as reformulation of a given product category) and/or target groups (such as school children). Although their outcomes can often be determined with a reasonable amount of certainty, it is usually not possible to ascertain or extrapolate their ultimate health impact at the EU level. Due to the multitude of (1) factors that influence overweight, obesity and related health issues, and (2) interventions at the various levels to attempt to address these factors, it is methodologically extremely difficult to attribute any changes in these issues to any one specific action (or group of actions). There is also a dearth of comparable and recent statistical surveillance data on NOPA issues in the EU, which means that even at an aggregated level, it is impossible to identify any clear trends for the period from the Strategy’s publication in 2007 until today.
In view of these conceptually separate but mutually reinforcing factors and challenges, the evaluation is able to provide a comprehensive assessment of key actions taken at the EU level, their implementation and their effectiveness, as well as a review of a wide range of actions by Member States and private actors (albeit not a complete inventory). It also assesses the added value of the Strategy and its implementing instruments, and draws conclusions concerning the overall level of action and the achievement of key objectives. It does not and cannot, however, provide the same level of depth and detail for all relevant aspects, or quantify the Strategy’s overall impact on public health in Europe.

24
3. OVERVIEW OF NOPA STATISTICS AND TRENDS
This section provides a summary of relevant statistics related to nutrition, obesity and physical activity (NOPA) issues in the EU and a short overview of non-communicable diseases and their risk factors. It draws on data compiled by the WHO, OECD, Eurostat and FAO, as well as selected other national or international sources. It should be noted that, across all themes, the aggregation of national data, or comparisons across Member States, are often not possible due to differences in how data is collected and reported in different countries. Also, relevant health, food consumption etc. surveys are usually only conducted once every few years, and the results take time to be processed and published. This means that in many cases, the latest available data stems from around 2009. Obviously, this makes the presentation of meaningful trends for the period since the adoption of the EU Strategy very difficult. Furthermore, the statistics presented below should be seen as providing context to the evaluation, but one should be careful not to attribute any of the trends or changes that can be observed to the EU Strategy or any specific actions to implement it. Further information on relevant statistics related to NOPA issues in the EU is given in Annex 1.
3.1. Overweight and obesity
Body Mass Index (BMI) data allow Members States’ populations to be compared against agreed criteria. Obesity is indicated by a BMI greater than or equal to 30, while a BMI greater
than or equal to 25 but lower than 30 defines ’overweight’4,5. Some Member States rely on self-
reported data, while in others professional interviewers take measurements. The inherent bias in self-reported data can result in underestimates in the level of overweight and obesity6, making comparisons between Member States difficult.
According to the latest available data7, approximately 35% of all adults in the EU are overweight, and approximately 17% are classified as obese. There are significant differences between Member States. Problems with comparability of data notwithstanding, the data suggest that the problem is most pronounced in Ireland, the UK (United Kingdom) and Hungary (Figure 3).
4 WHO, 2012. Obesity and overweight, Fact sheet N°311. Available from:
http://www.who.int/mediacentre/factsheets/fs311/en/ 5 These cut-offs are not appropriate for children, whose bodies undergo a number of physiological
changes as they grow. Methods used to measure a child's healthy weight vary depending on age. 6 See e.g. Elgar, S., 2008. Validity of self-report screening for overweight and obesity. Evidence from the
Canadian Community Health Survey. Available from: http://www.ncbi.nlm.nih.gov/pubmed/19009930 7 OECD, 2012. Health at a Glance: Europe 2012, OECD Publishing. Available from:
10.1787/9789264183896-en

25
Figure 3: Obesity rates among adults (% of population) 2010 or nearest year
Source: OECD Health at a Glance (2012)
Most available trend data (including that from the OECD’s Health at a Glance Europe (2012) report) suggest obesity rates in most EU Member States are continuing to rise. However, a 2012 OECD paper suggests that the rise of obesity among adults has effectively ‘come to a halt’ for the past ten years in a few countries: Switzerland (7-8%), Italy (8-9%), Hungary (17-18%)8 and England (22-23%)9,10. The data show increases in obesity in the last decade for which figures are available in countries such as Spain (12% to 14%) and France (8 to 11%), and a larger increase in Ireland (from 10% to 14%) (Figure 4).
It should be noted that the OECD paper only contains data from a subset of countries (as outlined in Annex 1 to the report) and that in some cases, such as Hungary and Ireland, the limited number of data points available make it difficult to point with confidence to trends over time. As such, it may be premature to draw conclusions on its applicability across the EU, particularly as there are few other sources which currently support the view that obesity may be flatlining in some countries.
8 In the case of Hungary, the Obesity Update presents measured data, whereas the Health at a Glance
Europe report uses self-reported data for height and weight. As explained above, the reporting bias for self-reported data is high, which risks masking the rise in obesity. 9 The discrepancy between the figures presented in the Obesity Update and those in the Health at a
Glance Europe (2012) report is explained in that while the 2012 Obesity Update is based on detailed analyses of individual-level health survey data, the Health at a Glance Europe report is based upon crude prevalence rates. For further detail please see Annex 1. 10
OECD, 2012. Obesity Update 2012, OECD Publishing. Available from: http://www.oecd.org/health/49716427.pdf
measured self-reported
0.0
5.0
10.0
15.0
20.0
25.0
30.0
%

26
Figure 4: Obesity rates among adults in selected European countries (% of population)
Source: OECD Obesity Update (2012)
The OECD’s Health at a Glance Europe (2012) report, based on crude prevalence rates suggests overweight and obesity among 15-year-olds across the EU increased between 2001-02 and 2009-10 from average reported rates of 11% to 13%11. Newer Member States (Czech Republic, Estonia, Poland, Romania and Slovenia) reported the largest increases (e.g. Poland increased from 7 to 13%), while only Denmark and the UK reported any significant reduction. In contrast, the OECD’s 2012 Obesity Update, based on detailed analyses of individual-level health survey data, suggests child obesity has stabilised in two Member States12: Rates in France have remained stable (at 6-8%) over the past 20 years with the same true for England since 2002, albeit at a higher level.
3.2. Physical activity
Rates of physical inactivity in the EU remain high. The available data show that the majority of Europeans do not engage in sufficient health-enhancing physical activity (HEPA), a trend that has not shown much improvement in general terms. The recent special issue on physical activity in the Lancet collated self-reported physical activity data13 with the results for Europe presented in Figure 5. Differences in methodology across countries combined with culturally different interpretations of physical activity constructs make comparisons difficult.
11
OECD, 2012. Health at a Glance: Europe 2012, OECD Publishing. Available from: 10.1787/9789264183896-en 12
OECD, 2012. Obesity Update 2012, OECD Publishing. Available from: http://www.oecd.org/health/49716427.pdf 13
Hallal, P.C. et al, Lancet Physical Activity Series Working Group. Global physical activity levels: surveillance progress, pitfalls, and prospects. Lancet. 2012 Jul 21; 380(9838): 247-57.
0%
5%
10%
15%
20%
25%
1990 1992 1994 1996 1998 2000 2002 2004 2006 2008 2010
Rate
of
obesity %
England
Spain
France
Italy Switzerland
Ireland
Hungary

27
Figure 5: Self-reported inactivity levels across the EU and Norway (% of population)
Source: The Lancet (2012)
Data from individual countries reveal that physical activity rates increased in some Member States, while in others rates remained stable or dropped. For example, a joint health monitor project in the Baltic States and Finland showed that, between 1998 and 2008, “Leisure-time physical activity and commuting physical activity” have remained nearly static for 10 years in Estonia, Latvia and Lithuania. Only in Finland was there some increase in the level of leisure-time physical activity from 1998 to 200814. Regular surveys in England reveal a significant increase in the proportion of those who meet government recommendations for the minimum level of physical activity to achieve health benefits, from 27% in 1998 to 36% in 200815. However, in Italy the proportion of the population meeting the minimum recommended physical activity levels remained stable between 2007 and 2009 (at 33%), and the percentage of those classified as completely inactive (undertaking no physical activity at all) increased slightly, from 28% to 30%16.
Rates of physical activity in children also appear to be decreasing, with OECD data showing a decline in average physical activity in both boys and girls across 21 EU Countries17 (Figure 6).
14
THL, 2011. Social Determinants of Health Behaviours Finbalt Health Monitor 1998–2008, p 82. Available from: http://www.thl.fi/thl-client/pdfs/f316c417-cc1d-48e6-a2e2-7389fde28630.
15 Department of Health: Health Survey for England. Available from: www.dh.gov.uk/en/publicationsandstatistics/publishedsurvey/healthsurveyforengland/healthsurveyresults/index.htm
16 Ministry of Health: Behaviour Risk Factor surveillance system (PASSI). Annual reports 2007, 2008 and 2009. Available from: http://www.epicentro.iss.it/passi/sorvRisultatiNazionale.asp
17 Currie, C. et al. (2008), Inequalities in Young People's Health; Currie, C. et al. (2012), Social
Determinants of Health and Well-being Among Young People.
0
10
20
30
40
50
60
70%
Inactive

28
Figure 6: Trends in daily moderate-to-vigorous physical activity in children (% of population), 21 EU countries, 2005-06 to 2009-10
Source: C. Currie et al. (2008 and 2012)
3.3. Nutritional status and dietary habits
Understanding patterns and trends in nutrition and dietary status is important given the impact diet can have on health. The Food Balance Sheets (FBS) of the UN’s Food and Agriculture Organisation (FAO) provide the most comprehensive measure of food availability at country level, revealing the extent to which the food supply of a country is adequate in relation to nutritional requirements18. Recommendations for daily energy intake vary between countries, averaging around 2,500 and 2,000 kcal for men and women (respectively) engaged in moderate amounts of daily physical activity19. FAO estimates indicate average dietary energy supply remained stable at close to 3,500 kcal/ person/ day to 200920, although actual food intake will be lower due to factors such as wastage. Estimates for EU average dietary protein and fat availability (measured in grams per person per day) also remained stable between 2000 to 2009 (Figure 7), in line with energy supply.
Figure 7: EU average dietary energy supply (kcal/ person/ day), EU average dietary protein supply (g/ person/ day) and EU average dietary fat supply (g/ person/ day) 2000 to 2009
Source: FAO (2012)
18
FBS are calculated from the food produced in and imported into countries minus the food exported net of imports, fed to animals or otherwise not available for human consumption, divided by the population size. J.Kearney, 2010. Food consumption trends and drivers, Phil. Trans. R. Soc. B (2010) 365, 2793–2807. Available at: 10.1098/rstb.2010.0149 19
Annex XIII of Regulation (EU) No 1169/2011 on the provision of food information to consumers contains GDAs, which will form the basis of GDA labelling in the EU. 20
FAO, 2012. FAO Statistical Yearbook 2012. Available at: http://www.fao.org/docrep/015/i2490e/i2490e00.htm
21
14 11
29 24
19 19
13 9
27
23
19
0
10
20
30
40
Age 11 Age 13 Age 15 Age 11 Age 13 Age 15
Girls Boys
%
2005-06 2009-10
0
20
40
60
80
100
120
140
160
180
200
0.00
500.00
1,000.00
1,500.00
2,000.00
2,500.00
3,000.00
3,500.00
4,000.00
g/ pers
on/ day
Kcal/ p
ers
on/ day)
Energy supply (kcal/person/day)
Protein supply quantity (g/person/day)
Fat supply quantity (g/person/day)

29
FAO estimates on EU average fruit and vegetable supply21, remained stable in the decade to 2009 although the average masked wide variation across Member States in 2010, the most recent year for which data are available. In the absence of trend data for salt intake across Member States, the only country for which data was available for 2008 and 2011, the UK, showed a decline in mean estimated salt intake of 14% from 2001 to 201122. Average intake in 2011 (8.1g per day) was nevertheless still higher than the recommended maximum of 5g per day. Data on saturated fat intake is also sparse, with FAO estimates suggesting that most Member States exceeded the recommended average per person limit of less than 10% of total daily energy intake from saturated fatty acids23.
3.4. Non-communicable diseases and risk factors
Cardiovascular diseases (CVD) represent 40% of all deaths in the EU (43% among women and 36% among men), over a third of which are from coronary heart disease (CHD) and just over a quarter are from stroke. Most CVDs can be prevented by addressing risk factors including obesity, unhealthy diet, physical inactivity, raised blood pressure and diabetes24.
Death rates from CHD fell consistently between 2000 and 2010 in most Member States (see Figure 8). Almost all countries recorded substantial decreases in death rates from stroke in the decade to 2009. It is estimated that over 60% of CHD and around 40% of ischaemic stroke in developed countries is due to total blood cholesterol levels in excess of the theoretical minimum (3.8 mmol/L)25, which can be reduced by physical activity and a reduction in the consumption of saturated fat. Estimated mean population total cholesterol levels reduced between 1980 and 2008 in all EU countries for both men and women, except in Poland, where levels remained stable26.
A direct link exists between the risk of CVD and both systolic and diastolic blood pressure levels27, which can be lowered through weight loss, increased physical activity, and a reduction in salt and alcohol intake. WHO estimates for 2009 indicate hypertension prevalence28 for men and women affected at least one third of the population in all EU countries although trends in mean systolic blood pressure among men and women have decreased in most Member States since 198029. Higher-income western and northern European countries have experienced the largest decreases, while levels have remained relatively stable in many eastern European countries.
21
Ibid 22
K. Sadler et al, 2011. National Diet and Nutrition Survey - Assessment of dietary sodium in adults (aged 19 to 64 years) in England. Available from http://transparency.dh.gov.uk/2012/06/21/sodium-levels-among-adults 23
WHO Regional Office for Europe, 2012. Country snapshots on Nutrition, Physical Activity and Obesity in European Union Member States, WHO. 24
WHO, 2012. Factsheet 317, Cardiovascular diseases (CVDs). Available from: http://www.who.int/mediacentre/factsheets/fs317/en/index.html 25
WHO, 2002. The World Health Report 2002. Reducing Risks, Promoting Healthy Life. WHO. 26
WHO Global Health Observatory - http://www.who.int/gho/database/en/ 27
Lewington, S. et al, 2002. Age-specific relevance of usual blood pressure to vascular mortality: a meta-analysis of individual data for one million adults in 61 prospective studies. Lancet 2002; 360 (9349): 1903-13. 28
defined as ‘a systolic blood pressure greater than 140 or a diastolic blood pressure greater than 90, or blood pressure lowering medication use’. 29
Nichols, M. et al, 2012. European Cardiovascular Disease Statistics 2012. European Heart Network, European Society of Cardiology, Sophia Antipolis. Available at: http://www.ehnheart.org/cvd-statistics.html

30
Figure 8: Death rates from CHD, men aged under 65, selected Member States
Source: WHO Mortality Database (2012)
Diabetes ranks among the leading causes of CVDs and intensifies the effect of other CVD risk factors such as raised cholesterol levels, raised blood pressure and obesity. Type 2 diabetes, a largely preventable disease, represents over 90% of all cases and is associated with being overweight and physical inactivity30. The most recent estimate of diabetes prevalence suggests a rate of 4.1% in the EU31. Most Member States showed an increase in diabetes prevalence after 2000 with rates almost doubling in Romania and Latvia. Estimates of raised fasting blood glucose levels (an indicator of diabetes risk) have increased steadily across Member States since 198032. High prevalence of raised fasting glucose in some Member States such as Lithuania belies lower rates of diagnosed diabetes.
Figure 9: Diabetes prevalence as % of population (selected Member States)
Source: WHO (2012)
30
EURADIA, FEND, IDF Europe, PCDE Diabetes, 2011 (Third edition). The Policy Puzzle: Is Europe Making Progress? 31
WHO Global Health Observatory http://www.who.int/gho/database/en/ 32
WHO Global Health Observatory http://www.who.int/gho/database/en/
0
20
40
60
80
100
120
Age s
tandard
ized d
eath
rate
s fro
m C
HD
, adults a
ged u
nder
65 (
death
s p
er
100,0
00)
Austria
Germany
Malta
Netherlands
Romania
Sweden
0
0.5
1
1.5
2
2.5
3
3.5
4
4.5
5
2000 2001 2002 2003 2004 2005 2006 2007 2008 2009 2010 2011
Dia
bete
s p
revale
nce, in
%
EU members since 2004 or 2007 Finland Italy United Kingdom

31
4. EVALUATION RESULTS PER THEMATIC AREA
The statistics described in the previous section provide an indication of the scale and the scope of the problem of overweight, obesity and related health issues. In order to try to address these problems, governments and other actors around the globe have developed and implemented a wide range of strategies, policies and actions.
This section of the report assesses key actions and instruments included in the EU’s Strategy for Europe on Nutrition, Overweight and Obesity related health issues, and implemented in the period between 2007 and 2011. They focus on initiatives taken by the EU itself, but include activities by other actors (in particular the EU Member States and the private sector) where appropriate. The instruments covered include policy co-ordination fora, legislative measures, as well as funding schemes and programmes; for a graphical overview, please refer to the intervention logic diagram in section 2.2 of this report. The ensuing sections are structured along the lines of the six thematic areas and the 17 evaluation questions (see section 2.1).
4.1. Member State activities and the HLG
Contributing to dialogue, mutual understanding and co-ordination among the Member States is a crucial way for the European Commission to contribute to all six of the priority areas outlined in the Strategy. It is especially reliant on such contributions in the fields of health, nutrition and physical activity, where article 168 TFEU assigns a ‘soft’ competence to the EU. To this end, the Strategy stipulates that the Commission set up a High Level Group (HLG), with the aim of ensuring ‘that the exchange of policy ideas and practices between Member States takes place, with an overview of all government policies’.33 The HLG’s place in the Strategy’s intervention logic is illustrated below:
Figure 10: Excerpt from the intervention logic - HLG and Member State action
33
A Strategy for Europe on Nutrition, Overweight and Obesity related health issues, COM(2007) 279, p. 5
Priority areas
Member States
Better informed consumers
Healthy options available
Physical activity encouraged
Evidence base for policy-making
Priority groups targeted
Effective monitoring systems
High-Level Group for NPA
National policies,
laws, actions
Co-ordination / collaboration
Miscellaneous approaches/actions
Outputs Instruments Outcomes
EC / Member States

32
4.1.1. HLG impact on dialogue, understanding and strategy implementation across Member States
Evaluation question 1
To what extent has the HLG contributed to a better dialogue between the Member States and better understanding of each other’s approaches? To what extent has the HLG been instrumental in promoting similar strategy implementation across Member States?
Through in-depth interviews with members of the HLG, in addition to an analysis of relevant documents including HLG meeting agendas and minutes, the evaluation team sought to gauge the HLG’s contribution to a number of objectives. More specifically, through answering this evaluation question the team set out to ascertain the extent to which the HLG meetings and dialogue have achieved the main desired outputs of the HLG, namely 1) enhancing members’ awareness and understanding of other Member States’ approaches and 2) leading to policy co-ordination / collaboration between the Member States on NOPA issues.
Broken into their constituent parts, the answers to these questions can be expressed from several different angles as per the three subheadings below.
1. Level of satisfaction of HLG members with the relevance, breadth and quality of topics discussed in the HLG
Salt reduction and food reformulation
Topics discussed in the HLG are strongly linked to DG SANCO’s policy agenda and the priority areas it has identified for joint action. Therefore food reformulation, in particular salt reduction, has played a pre-eminent role in HLG discussions, appearing on the agenda of nearly every HLG meeting since its inception in 2008. This includes the negotiations that led to the Salt Reduction Framework and subsequent annexes on sugars and saturated fat and extends to the presentations delivered by Member State representatives on their policies and experiences.
A large majority of HLG members expressed high levels of satisfaction with this approach. Having agreed that salt reduction was an area of mutual concern where collaborative efforts were possible, most interviewees considered it logical, coherent and informative to devote a significant proportion of the HLG’s time to it. While a small number of Member State representatives felt that tackling salt reduction was not sufficiently wide-reaching or ambitious in relation to the amount of time spent discussing it in the HLG, this was a minority view, mostly restricted to officials whose Member States had begun to address the issue relatively long ago; these interviewees welcomed the recent shift to other aspects of food reformulation such as sugars and saturated fat.
Thus, with regard to salt reduction and other types of food reformulation, in addition to other areas attracting widespread, international attention, such as the taxation of unhealthy foods,34
34
It is important to note that there has been a considerable amount of debate about the correct use of the terms “healthy” or “unhealthy” food or nutrients in recent years. It is clear that fat, sugars and salt are important parts of any diet; however, when consumed in excess, they can lead to serious health issues including overweight or obesity. Although there is no widely accepted scientific definition, foods that are energy-dense (i.e. contain a high amount of calories) and/or high in certain nutrients, in particular (saturated) fat, (added) sugars and/or salt are sometimes referred to as “unhealthy”. Throughout this

33
nearly all members considered the HLG the principal forum for learning about the policies and approaches of other Member States. The presentations were described as informative and focused, in particular their emphasis on the rationale for a given approach, the practicalities of putting it in place, the results achieved and challenges encountered.
However, it must also be noted that members interpreted these presentations (and the ensuing discussions) differently depending on the extent of their own country’s progress on the issues at hand. Broadly, interviewees fit into three groups, the first two of which were larger than the third:
Those Member States which had already worked extensively on salt reduction felt that the HLG discussions reinforced their work. One member summed up this view, stating ‘I think the main thing I’ve learned in the HLG is that there are so many different approaches and ways of doing things, and we gain perspective on the strengths and weakness of the approaches we have at home’.
Another group of Member States, often belonging to the EU-12, found that hearing about other Member States’ experiences was essential for learning about the issues and informing national policy.
The third, quite diverse group of Member States was made up of countries which either favoured a different approach to addressing salt reduction than the HLG or did not currently prioritise salt reduction or food reformulation. Members of this minority group found participation in the HLG informative but were less satisfied than others with regard to the topics discussed.
Other aspects of national policy
Views were less favourable of the HLG as a forum for exchange about other aspects of national policy. During the interviews two main reasons for this emerged. Firstly, while most interviewees welcomed the chance for Member States to present on topics of their choosing, several of them remarked that discussions outside the core subject of reformulation were often less focused and less widely applicable to the national situations of other Member States. One HLG member described some of these discussions as ‘interesting but of little take-home value’. Secondly, a considerable proportion of members felt that issues that are important to them were not discussed in enough depth, perhaps inevitably due to the large number of potential topics and the limited amount of time available in HLG meetings. According to interviewees, the topics that could be addressed more thoroughly ranged from education and public awareness programmes to nutrition in hospitals.
In addition, nearly all HLG members agreed that physical activity played only a small role in the discussions, to the extent that one interviewee described the full title of the HLG (High Level Group on Nutrition and Physical Activity) as ‘misleading’. However, they differed as to whether the emphasis of the group on nutrition was desirable. About half of interviewees pointed out that many of the officials involved in the HLG meetings had no expertise in or responsibility for physical activity. Thus, while they found presentations on the subject interesting, they were seldom able to apply best practices from other Member States and would be unlikely to benefit from a greater focus on physical activity. A smaller but not insignificant sample of interviewees took an opposing view, highlighting that any solution to the overweight and obesity epidemic would necessarily entail a cross-sectoral approach. These interviewees would like the HLG to devote more time and political resources to physical activity in the future.
report, we use the term “unhealthy food” to refer to food that is usually of little nutritional value (i.e. contains few proteins, vitamins or minerals) and is high in fat, sugars, salt and/or calories.

34
EU policy developments
Although not related to Member State policies and approaches per se, the vast majority of HLG members greatly appreciated the time allocated to presentations on policy developments by DG SANCO and other Commission officials. Interviewees explained that while this information was important, it was difficult to obtain from other sources in a digestible form. This led some members to describe such presentations ‘invaluable’ and a key motivation for their participation in the HLG. Interviewees expressed particularly positive views of the presentations and information provided by officials from services other than DG SANCO whose policies had ramifications for their work in nutrition and / or physical activity. Indeed, about a third of interviewees regretted that more time was not made available for discussion of these issues, rather than just presentations followed by short question and answer sessions.
The Platform for Action on Diet, Physical Activity and Health
Asked to comment on the interaction between the HLG and Platform, interviewees expressed views that were highly diverse and polarised. Often, these reflected the varying regulatory environments and traditions of the Member States with regard to issues such as self-regulation, voluntary initiatives and relationships between national administrations and industry. A pattern among interviewees emerged (with some exceptions) whereby representatives of Member States that already pursued similar initiatives at home found the joint sessions with the Platform very informative and useful; some interviewees in this group considered the EU Platform part and parcel of their actions at national level. In a similar logic, many representatives of Member States that followed a strictly regulatory course at national level perceived the joint meetings to be of little use.
However, some Member States fell into neither group, and most of them were favourable towards the Platform and considered the joint meetings a key forum to gather information that would impact on them at national level. For example, a couple interviewees from small countries that imported a significant share of their food explained that they had little leverage over the industry and thus relied on forums such as the Platform to encourage activities such as food reformulation. Other countries, mostly in Central and Eastern Europe, had little previous experience of interaction with the private sector but were profoundly affected by their participation in the joint meetings with the Platform. This led them to consider changing their approaches at national level.
2. Networking effects of HLG participation (including indicators on frequency of contact between HLG members outside of meetings and existence of a system for disseminating best practices and other relevant information among HLG members)
Nearly all interviewees lauded the informal nature of the HLG and explained that, in many cases, this helped them develop a personal rapport with some of their counterparts and continue to share information between meetings. However, it was also clear that this contact was mostly on an ad hoc basis, with the onus on individual HLG members to initiate and maintain contact. No interviewees could point to a system for sharing information on a systematic basis, and thus the extent and quality of inter-member exchange was very uneven and often dependent on personal relationships, historical ties between certain Member States (e.g. the Nordic countries) or atypically high levels of engagement with the HLG. Around a third of interviewees were in very frequent and open dialogue with other HLG members; for these interviewees such contact was a key benefit of participating in the HLG. Others (about half) described a situation whereby they were rarely or never in contact with other members.
Several members speculated that the mailing list and the posting of meeting agendas, minutes and presentations on Circa and the HLG website were intended to act as a regular platform for

35
exchange. However, these interviewees also pointed out that they seldom have time to navigate the Circa site in order to find documents that might be of interest to them or examine emails sent through the list server in detail (aside from the agenda and other documentation in the run-up to HLG meetings).
3. Contribution of HLG to discussions and development of joint initiatives (including indicators on existence of mechanisms for discussing and developing joint initiatives in each of the key areas and scope of those initiatives)
The mechanism for discussing and developing joint initiatives in key areas clearly exists, and the Salt Reduction Framework provides a model of how it should work in practice: leveraging political impetus and momentum from the Commission, the HLG provides a forum for the Member States to discuss, negotiate and ultimately agree a common initiative for implementation (albeit on a voluntary basis) in all Member States. However, the key areas identified in the Strategy cover a wide variety of policy areas,35 and the Salt Reduction Framework (including the subsequently added Annexes) directly addresses only one of them: making the healthy option available.
Partly, this reflects pragmatic and realistic decision-making by the Commission and the Member State representatives participating in the HLG. The majority of interviewees considered the Salt Reduction Framework sufficiently ambitious, especially in light of the EU’s relatively new competence in nutrition and the (at the time) fledgling status of the HLG. Moreover, given that the EU can only pursue voluntary initiatives in this area, a substantial proportion of interviewees felt that a stricter framework, or one addressing a more hotly-debated policy area, would not be implemented36.
Other interviewees, however, pointed to the experience of the Salt Reduction Framework as reason for pessimism about the potential achievements of the HLG. As expressed by one member, ‘we’ve been working together for five years, mostly on salt and a little on saturated fat. Is that the most efficient way to improve nutrition in Europe? The discussions have been useful, but we’ve limited ourselves to relatively small issues.’ Some of these interviewees were quick to describe salt as ‘low-hanging fruit’, given its clear health impact and the ease with which it can be isolated in many foods. They surmised that agreeing the parameters of a joint initiative for other nutrients, such as sugars or saturated fat, would be far more difficult for a number of reasons, not least their naturally high levels in some foods, less conclusive health evidence and the existence of well organised groups with an interest in preventing big reductions.
At this stage it is by no means clear that the mechanisms provided by the HLG in its current form will be able to address such challenges effectively. Similarly, there is little evidence to demonstrate the extent to which the HLG can or should pursue joint initiatives in the other key areas. The meetings with the Platform, for example, have provided a forum for exchange but would require a substantially expanded mandate (and a commensurate increase in resource and time commitments) in order to agree joint initiatives between the Member States and the private sector. The HLG’s engagement with the other key areas has up to this point been tangential, limited to the presentation and discussion of related subjects by HLG members, the Commission and other stakeholders.
35
As per the Terms of Reference for this evaluation, the key areas are defined as 1) better informed consumers; 2) making the healthy option available; 3) encouraging physical activity; 4) priority groups and settings; 5) developing a monitoring system; 6) engaging the private sector; and 7) policy coherence at local level. 36
Indeed, as described in the answer to evaluation question 4, the available evidence shows that implementation of the existing Salt Reduction Framework has been far from straightforward or universal.

36
Conclusion
The HLG has contributed to better dialogue between the Member States and an increased understanding of each others’ approaches, especially for the main areas of focus of the HLG, i.e. food reformulation and policy developments at the EU level. The Salt Reduction Strategy in particular has led to the implementation of a similar strategy by many Member States. In other areas, albeit only in individual cases, participants have clearly benefited from learning about the approaches of their counterparts from other countries.
On the subject of salt reduction and food reformulation, the HLG has clearly carved out a niche for itself as the principal forum for the sharing of experiences between Member States and the development of joint initiatives. The choice to focus the HLG discussions on salt reduction and food reformulation appears broadly appropriate given the importance of these issues for health, the benefits for some Member States of learning from others and the difficulties and time required in forming consensus for agreement on EU-wide initiatives.
Similarly, the HLG is the primary setting for senior officials to learn about relevant policy developments at the European level and it provides a unique platform for networking and regular but informal contact between members. These aspects of the discussions were thus perceived as the main added value of the HLG and indeed the principal motivators for the participation of a considerable number of members.
However, the time devoted to other aspects of national policy was seen as less focused and, on the whole, less widely applicable. Despite the interest members expressed in hearing about the experiences and initiatives of their counterparts, at times these discussions provided little of practical value. Physical activity was perceived as playing only a small role in HLG discussions despite its importance for reducing overweight and obesity; a considerable proportion of HLG members saw this as a pragmatic choice that reflected the expertise and competences of participants, many of whom do not have responsibility for physical activity promotion.
4.1.2. EC role of facilitator in the HLG
Evaluation question 2
To what extent has the Commission played its role of facilitator in the HLG?
The European Commission plays a crucial role in the HLG, arranging and facilitating the meetings, developing the agenda and mediating between members to agree joint initiatives. Although the intentions and actions of the Member State representatives themselves are the principal drivers of HLG achievement, the Commission provides the framework within which the group operates. In order to ascertain the extent to which the Commission has been successful in this role, HLG members were asked to comment on their perceptions of the format and functioning of the meetings and related issues such as email communication, the dedicated Circa site and the HLG website.
With few exceptions, interviewees were satisfied with the basic format of three to four full-day meetings per year, facilitated by a Commission official and consisting mostly of presentations but with some time built in for questions and discussion. In the small number of cases in which HLG members did express misgivings about any of these issues, interviewees felt that the

37
Commission had made pragmatic choices to reconcile competing demands for brevity and thoroughness.
Interviewees also described the fashion in which the Commission set the agenda and chaired the HLG meetings as suitable and competent. While few members claimed to have directly contributed to the agenda of any HLG meetings, they felt this reflected their broad agreement with the items put forward; when they had specific issues that they wanted to discuss, the general sentiment was that the Commission would take their views into account. However, a few HLG members took the opposing view, remarking that the HLG agenda, for individual meetings but also more generally, reflected the policy priorities of the Commission rather than the Member States.
The (albeit mild) frustration that was expressed related more to communication between the Commission and the HLG membership in the run-up to and in between meetings. For example, a small number of interviewees remarked that documents were often not circulated far enough in advance of the meetings to allow HLG members to agree a policy position within their administrations; this reduced their ability to participate fruitfully in discussions and negotiations. Moreover, while not all interviewees expressed specific opinions about the Circa site and mailings, those that did mention them often held negative points of view, describing the site as difficult to navigate and the mailings as too voluminous and unfocused. In the words of one interviewee, ‘being bombarded with all the presentations from a given meeting is not especially helpful, even if the topics discussed were relevant’. In this respect, the ‘Flash reports – Conclusions of the Chair’ are much appreciated, especially for the speed with which they are circulated after meetings, and for providing an accessible synopsis of each meeting.
More substantive discussion about the Commission’s role in the HLG stemmed from questions about political direction, negotiating joint initiatives and maintaining dialogue during the meetings. About half of participants were extremely positive about the direction and drive provided by the Commission, explaining that the Commission listened to participants’ views and attempted to propose mutually agreeable compromises. As put by one HLG member, ‘the leadership from the Commission is very interesting because they give the Member States enough time to consider the issues and when they run into trouble the Commission proposes a solution. The Commission takes a pro-active and solution-oriented approach which I find really helpful’.
While nearly all interviewees felt that the Commission should play a strong leadership role in the HLG, some expressed some concern that its political commitment had declined, both in terms of driving the agenda for collaboration and encouraging the implementation of joint initiatives. In some ways, these interviewees felt that this was inevitable: at its inception, due to the newness of the EU competence in health, the HLG was ground-breaking, seeking to identify for the first time the issues where there might be scope for Europe-wide collaboration in the field of nutrition, introducing counterparts from different Member States to each other and experimenting with different potential methods for negotiating joint initiatives. In order to kick-start the group, interviewees explained that the Commission allocated it a high degree of political capital: meetings were all chaired by the Director-General, with frequent visits from the Commissioner for Consumers, and participants brought with them the requisite authority from their national ministries.
As the group became more established, however, a significant number of HLG members have perceived an apparent deprioritising in political terms. The Director-General intervenes less frequently, and the Member States more often than previously reported sending substitute (more junior) colleagues, rather than the officially named director-level members, to participate in the HLG. (In addition to indicating a decline in priority, the shifting membership stiffens relations between participants, making it harder to build a rapport and collaborate between meetings.) As explained under question 1, there is some concern among members that it will be difficult to maintain the momentum required to negotiate and agree any new initiatives that are as ambitious and wide-reaching as the Salt Reduction Framework. These interviewees

38
considered it incumbent on the Commission to clarify its commitment to the HLG and set an example to recapture the imaginations of the Member States.
In addition, a few interviewees remarked that participation in the dialogue taking place in the HLG meetings was often limited to a smaller ‘core’ of Member States. Indeed, around half of interviewees described attending the meetings ‘primarily to listen’, and for the most part this appears to reflect their national priorities: these members find it more useful to learn from their counterparts and the Commission and (potentially) take lessons to emulate at national level. However, part of this also appears to stem from language issues, as some participants, especially those whose languages are not included in the interpretation, find it difficult to listen and contribute to the group in English.
Conclusion
The Commission has in large part fulfilled its role as a facilitator for the HLG. It has set up the meetings in a form that is satisfactory to the vast majority of members and conducive to fruitful discussions. The successful chairing of the meetings has contributed to the achievements of the HLG up to this stage, in particular with regard to the strong political direction and steering provided at the group’s inception. Most criticisms related to minor practicalities, such as late circulation of meeting materials and having only limited time for discussion.
However, interviewees also made clear that maintaining political momentum is of utmost importance for the future sustainability of the HLG and voiced concerns that it was falling in priority among the Commission and Member States alike. While concerns about diminishing commitment and motivation were by no means ubiquitous, a considerable proportion of interviewees highlighted this, and pointed out that making substantial achievements in the future on more controversial subjects than salt reduction would require a commensurately strong push from the Commission in addition to deft negotiation and competent meeting organisation.
4.1.3. Progress of national approaches in key areas
Evaluation question 3
To what extent have national approaches progressed in the following key areas?
a. Better informed consumers. b. Making the healthy option available c. Encouraging Physical activity. d. Priority groups and settings e. Developing a monitoring system f. Engaging private sector. g. Policy coherence at local level.
Dialogue and policy co-ordination are primarily useful as a vehicle for eventual progress by the competent authorities in the Member States. Thus at the outcome level a true assessment of the Strategy hinges on the responses to two key questions: have the Member States made
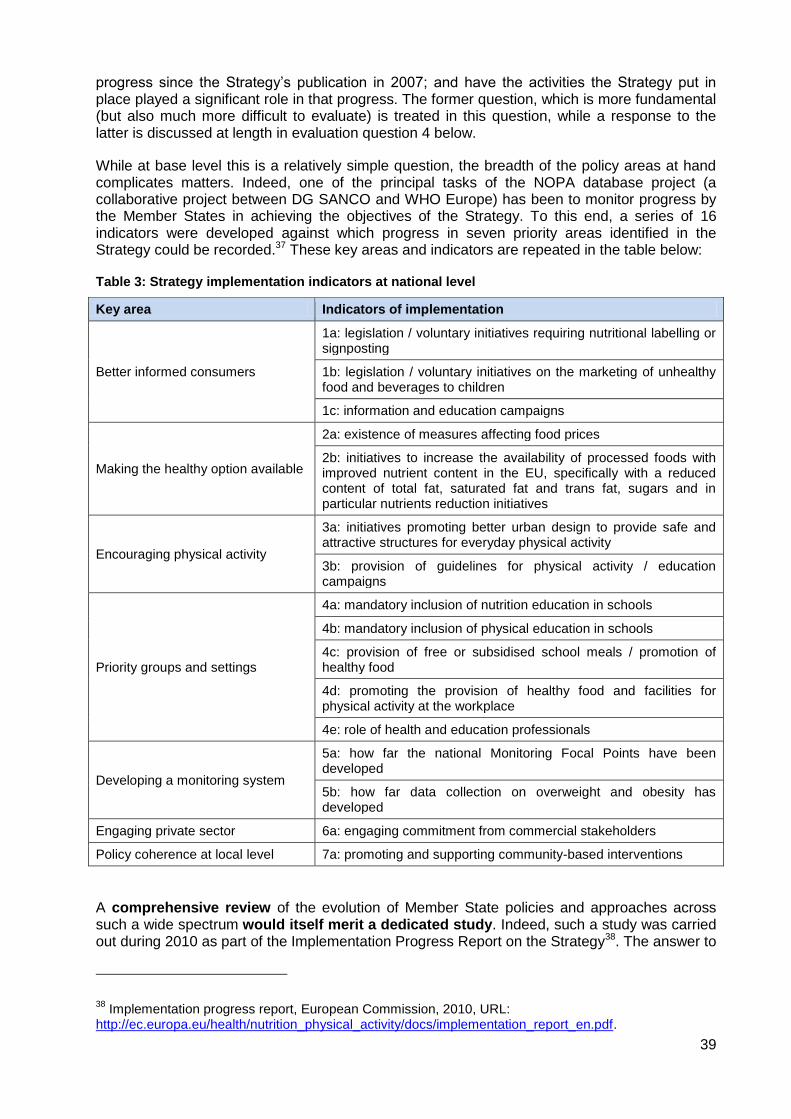
39
progress since the Strategy’s publication in 2007; and have the activities the Strategy put in place played a significant role in that progress. The former question, which is more fundamental (but also much more difficult to evaluate) is treated in this question, while a response to the latter is discussed at length in evaluation question 4 below.
While at base level this is a relatively simple question, the breadth of the policy areas at hand complicates matters. Indeed, one of the principal tasks of the NOPA database project (a collaborative project between DG SANCO and WHO Europe) has been to monitor progress by the Member States in achieving the objectives of the Strategy. To this end, a series of 16 indicators were developed against which progress in seven priority areas identified in the Strategy could be recorded.37 These key areas and indicators are repeated in the table below:
Table 3: Strategy implementation indicators at national level
Key area Indicators of implementation
Better informed consumers
1a: legislation / voluntary initiatives requiring nutritional labelling or signposting
1b: legislation / voluntary initiatives on the marketing of unhealthy food and beverages to children
1c: information and education campaigns
Making the healthy option available
2a: existence of measures affecting food prices
2b: initiatives to increase the availability of processed foods with improved nutrient content in the EU, specifically with a reduced content of total fat, saturated fat and trans fat, sugars and in particular nutrients reduction initiatives
Encouraging physical activity
3a: initiatives promoting better urban design to provide safe and attractive structures for everyday physical activity
3b: provision of guidelines for physical activity / education campaigns
Priority groups and settings
4a: mandatory inclusion of nutrition education in schools
4b: mandatory inclusion of physical education in schools
4c: provision of free or subsidised school meals / promotion of healthy food
4d: promoting the provision of healthy food and facilities for physical activity at the workplace
4e: role of health and education professionals
Developing a monitoring system
5a: how far the national Monitoring Focal Points have been developed
5b: how far data collection on overweight and obesity has developed
Engaging private sector 6a: engaging commitment from commercial stakeholders
Policy coherence at local level 7a: promoting and supporting community-based interventions
A comprehensive review of the evolution of Member State policies and approaches across such a wide spectrum would itself merit a dedicated study. Indeed, such a study was carried out during 2010 as part of the Implementation Progress Report on the Strategy38. The answer to
38
Implementation progress report, European Commission, 2010, URL: http://ec.europa.eu/health/nutrition_physical_activity/docs/implementation_report_en.pdf.

40
this question re-addresses the same topics, while acknowledging that a repeat of the 2010 exercise (which itself has several shortcomings making an accurate assessment of progress at that time problematic) update the parts of the report referring to Member State progress on the indicators mentioned above.
It is worth briefly summarising the methodology that was used to inform the abovementioned Implementation progress report. National focal points in each Member State (officials in each country’s relevant ministry and often participants in the HLG as well) were asked by WHO Europe to complete two reporting templates, one on national policy documents and another on existing health programmes, projects and other initiatives. The national contact points were also asked to score the level of implementation against the 1-5 indicators identified for each of the key areas as 1) Not existing or clearly not stated in any policy document, and not planned within two years; 2) Clearly stated and partly implemented or enforced; or 3) clearly stated and entirely implemented and enforced. Together, the national focal points and WHO Europe officials validated the data. Therefore, the 2010 implementation report does not necessarily show progress, with the Strategy’s publication in 2007 as a baseline as much as it shows implementation tout court. In addition, it should be noted that the wording of the indicators and scoring system left national contact points with considerable room for interpretation, and the narrative section of the implementation report does not facilitate comparison between countries or provide a high level of certainty about the true level of implementation. In other words, it is not clear that a ‘2’ assigned to a specific indicator in one country would necessarily be assigned the same ‘2’ in another country. Taking this into account helps reconcile the results of the implementation report, which are generally quite positive, with more specific findings in this evaluation and elsewhere that indicate more room for improvement.
The following subsections briefly review the implementation status of each of the key areas as per the 2010 report and provide commentary on the progress that has been made since. This is informed mostly by the research carried out for the rest of the evaluation. In order to avoid repetition, where relevant progress is explained through short summaries of progress coupled with cross references to other parts of this report.
1. Better informed consumers
Figure 11: Better informed consumers, 2010 implementation status
2
2
7
9
17
18
16
8
2
0 5 10 15 20 25
1c: Existence of information andeducation campaigns promoting
healthy eating and raisingawareness
1b: Existence of legislation orvoluntary initiatives on the marketingof unhealthy food and non-alcoholic
beverages to children
1a: Existence of legislation orvoluntary initiatives requiringnutritional labelling of foods
Low Medium HighLevel of implementation:

41
The 2010 report demonstrates substantial, but uneven implementation in the area of better informed consumers39. Indeed, the majority of NCPs reported at least a ‘medium’ level of implementation across all three indicators. Implementation was most advanced for indicator 1c, which in part reflects the fact that information and education campaigns are easier to develop and roll out than legislation, which necessarily produces winners and losers. The other two indicators, however, refer to regulation and self-regulation, where progress requires considerable political will and behavioural change. In 2010, it was clear that, while most Member States had made some progress in these areas, few (or, in the case of indicator 1a on nutritional labelling, hardly any) Member States had fully implemented the requisite measures for either indicator.
Since that time, in relation to indicators 1a and 1b progress would have been expected in line with the implementation of several pieces European legislation assessed in evaluation questions 7 and 8. Without repeating those findings, the most relevant points can be summarised as follows:
Regulation on Nutrition and Health Claims (1924/2006EC) (section 4.3.1 A.3): the Regulation aims to regulate the way nutrition and health claims are made about food and entered into force in January 2007. Since then the key development has been, after substantial delay, the adoption in May 2012 of the list of permitted health claims. This entered into force in December of that year and, despite the delay, will harmonise the way health claims about food are made in the EU, reducing confusion among consumers, especially in the countries where prior regulation was weak. Stakeholders interviewed for the evaluation felt that this would remove the majority of unsubstantiated food claims from the market, thereby enabling consumers to make better informed choices. However, progress has been even further delayed on the part of the legislation concerning nutrient profiles, meaning that Member States have not yet made any progress in this aspect of implementation.
Audiovisual Media Services Directive (2010/13/EU) (sections 4.3.1, C.3 and 4.3.2): Article 9.2 of the Directive aims to encourage Member States to develop codes of conduct regarding advertisements of unhealthy food and beverages to children. This aspect of the Directive is voluntary and therefore Member State action is difficult to attribute directly to the legislation. Nonetheless, research for the evaluation in five countries showed considerable progress in this area, some of it since 2010, most notably in Portugal, where a regulation was passed in 2011 which explicitly prohibits any kind of commercial communication of unhealthy foods and beverages during children’s programmes.
39
Partly, this unevenness reflects the nature of the indicators against which NCPs were asked to report progress. For example, NCPs from over half of Member States (16) rated their status on the indicator existence of information and education campaigns promoting health eating and raising awareness as high, or ‘clearly stated and entirely implemented and enforced’, while only two NCPs considered that their country had not made any progress at all. While this is laudable, it is also worth mentioning that the scoring system does not ask NCPs to consider the scale or comprehensiveness of an initiative. In other words, the existence of an information and education campaign could satisfy the requirements for a high score depending on the subjective interpretation of a given NCP.
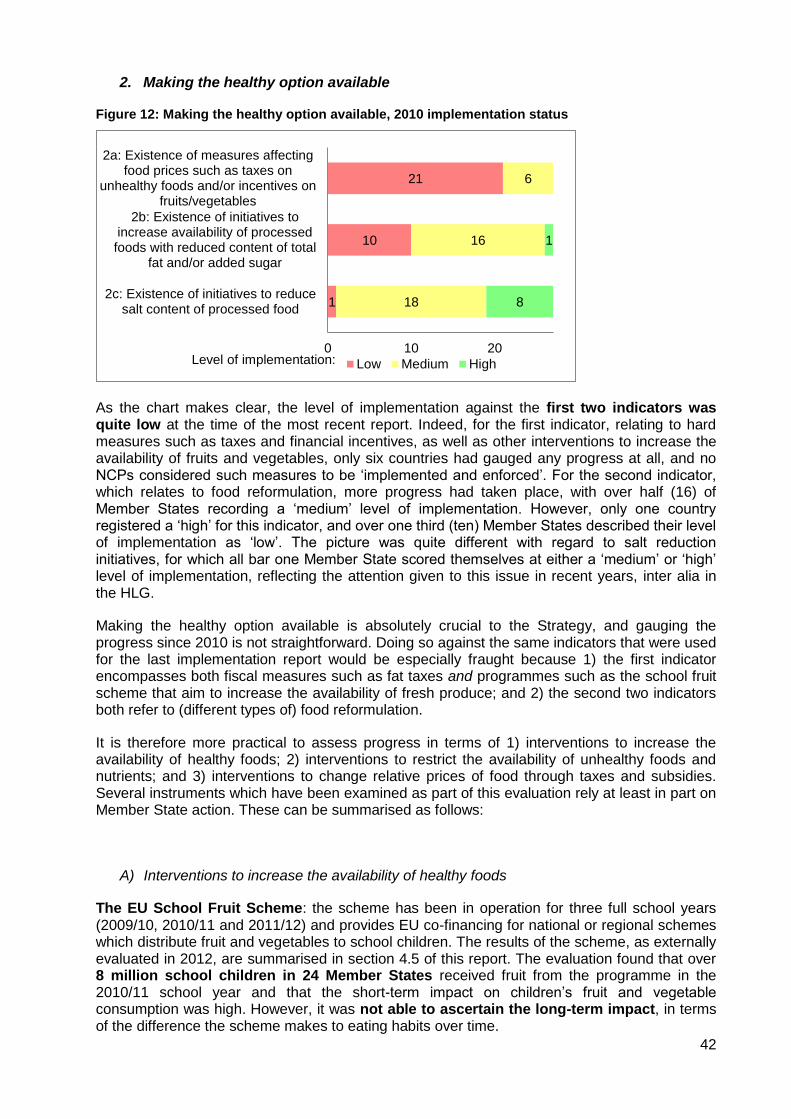
42
2. Making the healthy option available
Figure 12: Making the healthy option available, 2010 implementation status
As the chart makes clear, the level of implementation against the first two indicators was quite low at the time of the most recent report. Indeed, for the first indicator, relating to hard measures such as taxes and financial incentives, as well as other interventions to increase the availability of fruits and vegetables, only six countries had gauged any progress at all, and no NCPs considered such measures to be ‘implemented and enforced’. For the second indicator, which relates to food reformulation, more progress had taken place, with over half (16) of Member States recording a ‘medium’ level of implementation. However, only one country registered a ‘high’ for this indicator, and over one third (ten) Member States described their level of implementation as ‘low’. The picture was quite different with regard to salt reduction initiatives, for which all bar one Member State scored themselves at either a ‘medium’ or ‘high’ level of implementation, reflecting the attention given to this issue in recent years, inter alia in the HLG.
Making the healthy option available is absolutely crucial to the Strategy, and gauging the progress since 2010 is not straightforward. Doing so against the same indicators that were used for the last implementation report would be especially fraught because 1) the first indicator encompasses both fiscal measures such as fat taxes and programmes such as the school fruit scheme that aim to increase the availability of fresh produce; and 2) the second two indicators both refer to (different types of) food reformulation.
It is therefore more practical to assess progress in terms of 1) interventions to increase the availability of healthy foods; 2) interventions to restrict the availability of unhealthy foods and nutrients; and 3) interventions to change relative prices of food through taxes and subsidies. Several instruments which have been examined as part of this evaluation rely at least in part on Member State action. These can be summarised as follows:
A) Interventions to increase the availability of healthy foods
The EU School Fruit Scheme: the scheme has been in operation for three full school years (2009/10, 2010/11 and 2011/12) and provides EU co-financing for national or regional schemes which distribute fruit and vegetables to school children. The results of the scheme, as externally evaluated in 2012, are summarised in section 4.5 of this report. The evaluation found that over 8 million school children in 24 Member States received fruit from the programme in the 2010/11 school year and that the short-term impact on children’s fruit and vegetable consumption was high. However, it was not able to ascertain the long-term impact, in terms of the difference the scheme makes to eating habits over time.
1
10
21
18
16
6
8
1
0 10 20
2c: Existence of initiatives to reducesalt content of processed food
2b: Existence of initiatives toincrease availability of processedfoods with reduced content of total
fat and/or added sugar
2a: Existence of measures affectingfood prices such as taxes on
unhealthy foods and/or incentives onfruits/vegetables
Low Medium HighLevel of implementation:

43
Other EU initiatives, such as the School Milk Scheme and the Most Deprived Programme also involve distributing food and drinks and rely on Member State action. However, both schemes have been in existence for 20-30 years, meaning that they do not represent progress taking place since 2010 unless substantial improvements have recently been made to them (an evaluation of the School Milk Scheme is due at the end of 2013 while the Most Deprived Programme will be terminated at the end of the same year). Moreover, as is discussed in depth in section 4.5, it has not been possible to determine the health benefits of both of these programmes with a high degree of certainty.
While an examination of further Member State action is outside the scope of this evaluation, it is worth noting that, according to a recent report,40 the majority of OECD countries (including EU Member States) have adopted measures to improve the diets and eating habits of school-age children. However, the extent to which these measures have been enacted or improved since 2010 remains unclear merits further examination.
B) Interventions to restrict the availability of unhealthy foods and nutrients
The EU Salt Reduction Framework: although the Framework was developed within the HLG, it is voluntary and relies completely on Member State action to reach the EU-wide salt reduction target of 16% in the four years between 2008 and 2012. According to a survey of Member States carried out by the Commission in 2012,41 most countries have adopted a voluntary approach in their national initiatives (i.e. relying at least partly on self-regulation by economic operators to reduce the salt content of their products); 18 countries reported to have negotiated concrete agreements (often quantifiable commitments) with (certain types of) food companies. Five countries combine a voluntary approach to salt reduction with a voluntary labelling measure (by introducing healthy eating logos), while thirteen countries combine a voluntary approach with legislative measures (including laws limiting the maximum salt content for some food categories, mostly for bread).
As regards the impact of the measures in different countries, reliable and comparable data is hard to come by, partly due to the different reference periods and the lack of recent data. According to the Commission’s report, only the UK had data that showed a reduction of salt intake since the EU Framework was agreed (from 8.6 grams per person in 2008 to 8.1 grams in 2011, although this still means that 70% of participants had a daily intake of salt higher than the recommendation of no more than 5 grams per day). Three others (Finland, France and Lithuania) measured a decrease in salt intake for periods preceding the Framework, while three EU Member States (Netherlands, Slovak Republic and Sweden) could not detect a change in salt consumption for a period that was partly covered by the Framework. Several countries indicated they were planning to evaluate national salt intake levels in the next two to three years.
It is also worth mentioning that Member State action in other areas, such as labelling and advertising, can reinforce reformulation efforts and provide an incentive for companies to reformulate. Some of these, as they relate to EU legislation, are described in the section on better informed consumers and sections 4.3.1 and 4.3.2 and numerous initiatives are undoubtedly taking place within individual Member States, many of which, given the emphasis on reformulation in recent years, will have been developed subsequent to 2010.
40
Sassi, F.: Obesity and the Economics of Prevention: Fit not Fat. OECD, 2010. 41
DG SANCO: Survey on Member States’ Implementation of the EU Salt Reduction Framework, 2012.
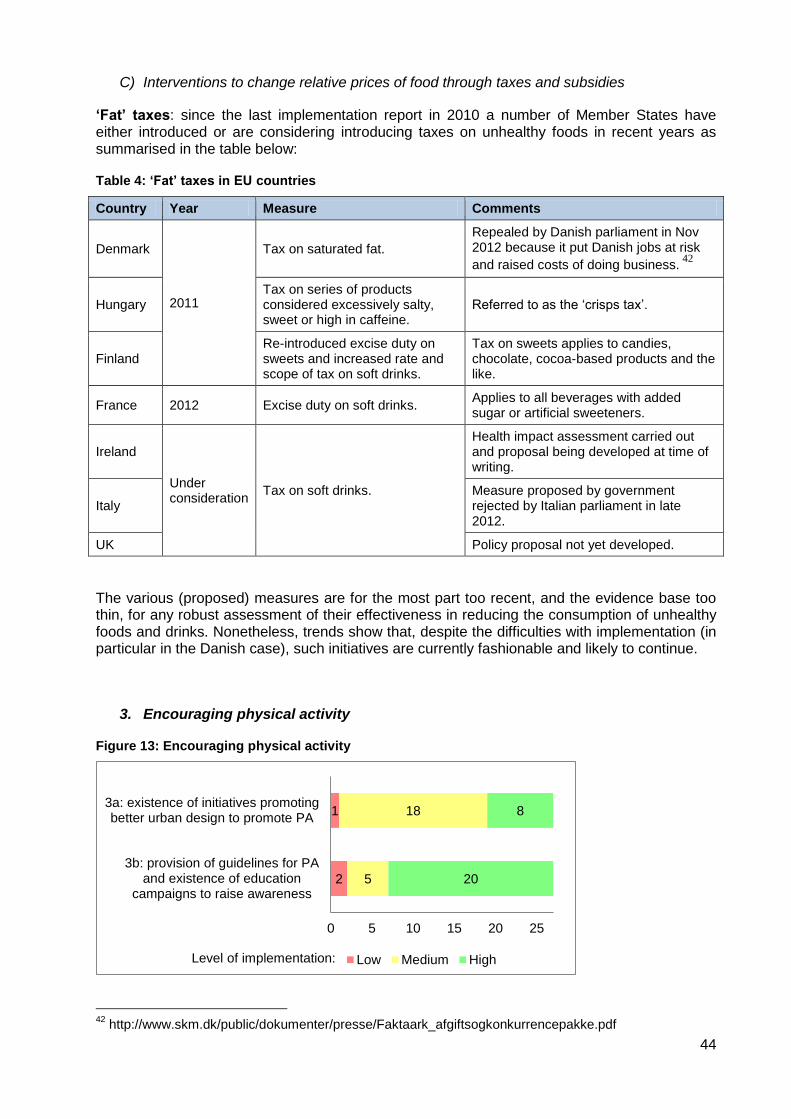
44
C) Interventions to change relative prices of food through taxes and subsidies
‘Fat’ taxes: since the last implementation report in 2010 a number of Member States have either introduced or are considering introducing taxes on unhealthy foods in recent years as summarised in the table below:
Table 4: ‘Fat’ taxes in EU countries
Country Year Measure Comments
Denmark
2011
Tax on saturated fat.
Repealed by Danish parliament in Nov 2012 because it put Danish jobs at risk
and raised costs of doing business. 42
Hungary Tax on series of products considered excessively salty, sweet or high in caffeine.
Referred to as the ‘crisps tax’.
Finland Re-introduced excise duty on sweets and increased rate and scope of tax on soft drinks.
Tax on sweets applies to candies, chocolate, cocoa-based products and the like.
France 2012 Excise duty on soft drinks. Applies to all beverages with added sugar or artificial sweeteners.
Ireland
Under consideration
Tax on soft drinks.
Health impact assessment carried out and proposal being developed at time of writing.
Italy Measure proposed by government rejected by Italian parliament in late 2012.
UK Policy proposal not yet developed.
The various (proposed) measures are for the most part too recent, and the evidence base too thin, for any robust assessment of their effectiveness in reducing the consumption of unhealthy foods and drinks. Nonetheless, trends show that, despite the difficulties with implementation (in particular in the Danish case), such initiatives are currently fashionable and likely to continue.
3. Encouraging physical activity
Figure 13: Encouraging physical activity
42
http://www.skm.dk/public/dokumenter/presse/Faktaark_afgiftsogkonkurrencepakke.pdf
2
1
5
18
20
8
0 5 10 15 20 25
3b: provision of guidelines for PAand existence of education
campaigns to raise awareness
3a: existence of initiatives promotingbetter urban design to promote PA
Low Medium HighLevel of implementation:

45
The 2010 report noted high levels of implementation against both indicators. Only one Member State achieving only a ‘low’ level of implementation on the first indicator, which referred to the existence of urban design initiatives aimed at promoting everyday physical activity such as walking and cycling, while just two Member States did not report having guidelines for physical activity and education campaigns to raise awareness.
However, as is the case for several of the indicators in the 2010 implementation report, it is difficult to assign concrete meaning to the findings. Both indicators are open to interpretation and could result in inconsistent reporting by NCPs in different Member States. The second indicator in particular refers clearly to two types of initiative: physical activity guidelines, and education campaigns to raise awareness. One could imagine two NCPs reporting an identical situation in more than one way. Moreover, the two indicators are very narrow in scope. A true assessment of Member State action on physical activity initiatives would need to consider myriad interventions aimed at many target groups and taking place in many settings. In addition, the EU Physical Activity Guidelines, published in November 200843, emphasise the need for a cross-sectoral approach to physical activity promotion, which the two indicators above do not capture.
Leading from this, there are no comprehensive studies that examine progress against the two indicators subsequent to 2010. However, research carried out in the context of a European Commission Impact Assessment on a future initiative on health-enhancing physical activity, carried out in 2012,44 identified numerous shortcomings in Member State implementation of the EU Physical Activity Guidelines. The Impact Assessment found that, despite the existence of physical activity guidelines in most Member States, national approaches to physical activity were not sufficiently cross-sectoral, meaning that often only a small number of actors considered physical activity when planning and implementing initiatives. The study also found that the Member States often lacked concrete objectives and goals, did not provide for sufficient monitoring and evaluation and failed to communicate effectively. As recent as 2012, the Impact Assessment noted a continued lack of progress in putting more effective policy in place. While it is clear that many individual initiatives exist in the Member States to promote physical activity, some of which are making positive impacts, it is also clear that in most countries a sufficiently holistic and comprehensive approach is not being followed.
43
http://ec.europa.eu/sport/library/documents/c1/eu-physical-activity-guidelines-2008_en.pdf. 44
DG EAC, 2013.

46
4. Priority groups and settings
Figure 14: Priority groups and settings
The chart above shows fairly positive results based on the 2010 implementation report. Over half of Member States recorded ‘high’ levels of implementation for the indicators relating to nutrition and physical activity education at schools. The vast majority rated themselves either ‘high’ or ‘medium’ in the implementation of the other three indicators on the subjects of healthy school meals, physical activity initiatives at work and the role of health and education professionals45. Despite the positive scores, the indicators, as with the other key areas, are vague and subjective. The WHO, EU and most Member States have guidelines recommending a certain amount of physical activity education per week, for example, but this is not referred to in the indicator. Such criticisms at least partly explain discrepancies between the nearly overwhelmingly positive results shown in the chart and continued calls for action in the subjects treated in each of the indicators.
Providing an update of the information provided in the chart would therefore be problematic, but the ensuing paragraphs give an overview of the ways and extent to which priority groups are taken into account in the Member States:
Several EU initiatives entail action by Member State authorities, particularly in the period since 2010, and have a special focus on target groups. These consist of the national implementation of the Nutrition and Health Claims Regulation, the Food Information Regulation and Article 9.2 of the Audiovisual Media Services Directive (described in section 4.3), national implementation of and the School Fruit Scheme (socioeconomic disparities were given particular focus in certain countries, namely Hungary, Bulgaria, Slovakia and the German region of North Rhine Westphalia, as described in detail in section 4.5);
A review of the information available in the NOPA database46 showed that, while most Member States had policies on NOPA issues and on poverty and social exclusion, most Member States did not demonstrate a sufficiently integrated approach. For example, only 11 Member States specifically mentioned the issue of overweight and / or
45
This last indicator refers to the availability of nutrition and physical activity counselling in primary health care and the existence of training in the promotion of healthy eating and physical activity for teachers and health care workers 46
Analysis conducted using templates completed by national focal points and returned to WHO Europe.
1
6
3
1
20
21
12
3
11
6
12
24
15
0 5 10 15 20 25
4e: Role of health and educationprofessionals
4d: Existence of initiatives to providehealthy food and facilities for PA at
work
4c: Provision of free or subsidisedschool meals and availability of
healthy food
4b: Mandatory inclusion of physicaleducation in the curriculum of
primary and secondary school pupils
4a: Mandatory inclusion of nutritioneducation in the curriculum of
primary and secondary school pupils
Low Medium HighLevel of implementation:

47
obesity in relation to social protection and inclusion. However, the templates also showed other ways that some Member States target priority groups with relation to the following issues:
o Physical activity in schools: ten Member States claimed to promote physical activity in schools with a special focus on disadvantaged groups and five Member States provided special training for teachers to promote physical activity among disadvantaged groups.
o Welfare and social benefits: 15 Member States indicated that they had schemes in place to distribute healthy food to disadvantaged groups.
o Fiscal policies: two Member States reported having measures in place to affect food prices in order to assist disadvantaged groups.
o Information provision: five Member States reported having regulations on marketing unhealthy foods and drinks to children and five countries reported having nutrition guidelines with a special focus on disadvantaged groups.
In 2010 WHO Europe set up a forum for policy collaboration called the Obesity and Inequalities Member States Action Network.47 To date, the level of action resulting from the Network seems to have been relatively low, and a meeting planned for 2012 was cancelled. However, the Network did meet again in 2013, with the intention of discussing concrete actions, objectives and goals moving forward.
Some Member States have set up programmes to address so-called food deserts where there is little access to healthy food. Examples of such programmes include the Healthy Living Neighbourhood Shops programme in Scotland48 and the Change4Life programme in England. 49
5. Developing monitoring systems
Figure 15: Developing monitoring systems
The implementation report demonstrates that in 2010 there were vast discrepancies between the monitoring systems for nutrition and physical activity in the EU Member States. While six NCPs considered their countries to have systems that were ‘entirely implemented and enforced’, their counterparts from twelve Member States felt that their own systems were only
47
Source: Presentation P. Graça at the WHO meeting on Nutrition National Focus Points (10-12 March 2013). 48
Source: EATWELL consortium: Effectiveness of Policy Interventions to Promote Healthy Eating and Recommendations for Future Action: Evidence from the EATWELL Project. Project Deliverable 5.1, 2012, p. 38. 49
Source: EATWELL consortium: Effectiveness of Policy Interventions to Promote Healthy Eating and Recommendations for Future Action: Evidence from the EATWELL Project. Project Deliverable 5.1, 2012, p. 38. The degree to which sales were raised depended on the extent to which stores complied with the guidelines
9 12 6
0 5 10 15 20 25
Existence of measures to strengthenmonitoring and evaluation in the
areas of nutrition and PA
Low Medium HighLevel of implementation:

48
‘partly implemented or enforced’. A significant minority (nine) NCPs reported that their monitoring systems were either non-existent or close to it.
This issue is examined in depth in section 4.6, but it is worth noting here that, according to the information provided in the NOPA database the situation with regard to the surveillance of nutrition, obesity and physical activity does not appear to have changed much during the period between the last implementation report and the time of writing, with large disparities persistent in the monitoring and evaluation systems the various Member States have in place.
6. Engaging private sector
Figure 16: Engaging private sector
Judging by the 2010 implementation report, nearly all national contact points felt that the their country had at least some initiatives engaging commitment from commercial stakeholders, but that the extent of these initiatives was not very large. The fiches completed for the NOPA database date from the same time, but interviews with members of the High Level Group carried out for this evaluation (detailed findings in sections 4.1.1, 4.1.2 and 4.1.4) show that, especially in the EU-12, there are general perceptions that engagement with the private sector has increased in recent years. Examples include implementation of the Salt Reduction Framework, which has mostly entailed voluntary initiatives, some of which led Member State administrations to open dialogue with industry for the first time, and engagement with the private sector on the basis of the perceived benefits of the Platform.
7. Policy coherence at local level
Figure 17: Policy coherence at local level
The latest implementation report was compiled after data on the extent of community-based interventions was collected for the NOPA database, and this issue has not been investigated for this evaluation in detail, rendering it difficult to ascertain with any certainty whether there has been any progress on the level of implementation, already assessed positively in 2010 as shown in the chart above. In addition, while the implementation report provides data against the indicator, it does not include any narrative commentary giving an explanation of precisely how the indicator was meant to be interpreted. Comparison aside, while many initiatives to address overweight and obesity-related health issues exist at local level (and some EU programmes,
4 21 2
0 5 10 15 20 25
Existence of initiatives engagingcommitment from commercial
stakeholders
Low Medium HighLevel of implementation:
2 17 8
0 5 10 15 20 25
Promoting and supportingcommunity based interventions
Low Medium HighLevel of implementation:
49
such as the School Fruit Scheme, are implemented at local level), the extent to which this has changed since 2010 is not possible to ascertain.
Conclusion
Although a systematic analysis of Member State action in all of the key areas was not within the scope of the evaluation, the available evidence points to considerable but uneven progress since the 2010 implementation report was published. While in some areas, often linked to EU initiatives, progress has been clear and substantial, in others progress appears to have been less significant, with some Member States taking steps forward and others stagnating.
In terms of progress linked to the EU, one can point to the implementation of legislation like the Regulation on Nutrition and Health Claims and Article 9.2 of the AVMSD, Member State activity as part of EU programmes such as the School Fruit Scheme, initiatives agreed at EU level such as the Salt Reduction Framework, and engagement with the private sector encouraged through such fora as the High Level Group and the Platform.
Other initiatives cannot be directly linked to EU-level initiatives but represent progress nonetheless. Several countries are developing or have already implemented fiscal measures to decrease the relative prices of healthier foods and beverages in comparison with less healthy alternatives, and many Member States have specific interventions in place to target priority groups.
While these gains are welcome, in other key areas progress has been less evident. Despite the public attention given to physical activity, for example, little progress has been documented in the national implementation of the EU Physical Activity Guidelines, and physical inactivity rates remain high. The systems of monitoring and evaluation of also do not appear to have improved much in recent years, and many gaps and inconsistencies persist in the ways that various Member States collect surveillance data on NOPA issues.
4.1.4. Impact of HLG on progress of national approaches
Evaluation question 4
To what extent have the progresses mentioned in question 3 been influenced by the work of the HLG?
The activities and products of the HLG – dialogue, peer learning, voluntary initiatives – do not lend themselves to straightforward attribution analysis. Indeed, most of the HLG’s influence is indirect: learning from each other or from the Commission, HLG members can draw inspiration for new approaches at home; based on a voluntary initiative agreed in the HLG, each Member State follows its own traditions and policy-making pathways to work towards an overarching, European level goal. Thus, in order to ascertain the contribution of the HLG to national approaches, the evaluation team principally on interviews with members, who were asked to explain how and to what extent their involvement in the HLG resulted in changes at the national level. Where possible (e.g. to assess the impact of the Salt Reduction Framework) documentary
50
evidence, either from the Commission, WHO or other sources, was also considered and fed into the analysis.
1. Impact of the HLG on salt reduction
Given the importance in the HLG of agreeing and implementing the Salt Reduction Framework, it is worth considering its influence on Member State policy separately from other policy areas. As explained under evaluation question 1, only a very small number of interviewees doubted the appropriateness of salt reduction as the first major initiative of the HLG. By this logic, a significant proportion of Member States would have implemented new policies to reduce salt in line with the targets identified in the Framework. In fact, from the interviews a somewhat more nuanced picture emerges, with the Member States again falling into three categories (as explained under evaluation question 1, sub-heading 1):
A considerable number of Member States, often from the EU-12, had not been actively pursuing salt reduction until the agreement of the Salt Reduction Framework and described it as ‘instrumental’ in developing and implementing their national policies, both in terms of providing goals and, based on the experiences of other Member States, learning from their peers. The impact in these Member States can be described as high.
Those Member States which had already worked extensively on salt reduction were not able to point to any big changes in their national approach due to the Salt Reduction Framework. Instead, they felt that it reinforced their efforts, helping officials sustain the political commitment of the issue vis-à-vis ministers, the media and other stakeholders. The impact in these Member States can be described as medium.
The remaining Member States either did not currently prioritise salt reduction or favoured an approach that was difficult to adapt to the Salt Reduction Framework. In these Member States the impact can be described as low.
Available data on the implementation of the Salt Reduction Framework are broadly consistent with this view. The most recent survey of the Member States for which data is available, carried out in 2010, produced results broadly in line with the interview findings. At that time, six countries reported that the Salt Reduction Framework provided a model for their national programmes and eight countries claimed that it had strengthened or led to improvements in their national approaches.
2. Impact on other aspects of national approaches
The influence of the HLG on other aspects of national approaches is very hard to ascertain systematically. When asked to comment on the benefits of participating in the HLG, no interviewees pointed immediately to policy changes at national level. Rather, they emphasised softer gains, such as keeping abreast of European policy developments, gaining a perspective of how one’s own country measures up against others and learning from and building working relationships with counterparts from other Member States. This was especially the case for representatives from smaller countries, who explained that they often feel ‘insulated and peripheral’. Participating in the HLG allows them to gain perspective and inspiration not only from other Member States, but from the hundreds of EU-funded projects and initiatives as well.
While desirable, such benefits impact national policy in indirect, longer-term and subtle ways. However, in several instances interviewees were able to describe tangible effects of their participation in the HLG. These effects often related to Member State approaches to the food and drinks industry: some countries that had previously not engaged in dialogue and collaboration with the private sector revised their approach after learning about the positive experiences of their counterparts from other Member States in the HLG or in the joint meetings

51
with the Platform. In another example, one interviewee described hearing about the approach of another Member State to dealing with energy drinks and later adapting a similar strategy at home.
Most interviewees did not expect the HLG to have more direct or tangible impacts but considered their participation worthwhile for the benefits mentioned above and in the section on evaluation question 1. However, a small number of interviewees lamented that no Commission funding was available to implement any of the best practices shared by other Member State representatives. Given the current climate of government austerity, especially in certain countries, these interviewees explained that, despite taking into account the financial constraints in which the Commission operates, it was frustrating to learn about potentially successful initiatives without any possibility of implementing them.
Conclusion
Although difficult to quantify, the HLG has had a clear impact on Member State approaches to NOPA issues. This has been most evident in the implementation of the Salt Reduction Framework, which, in some countries, has led to direct improvements in policy. In most other Member States it has at least contributed to, strengthened or reinforced existing efforts to reduce salt.
The impacts of the HLG are less obvious in those policy areas that did not form the main focus of the HLG. While interviewees were overwhelmingly positive about their participation, many of the benefits they identified, such as keeping abreast of EU and national policy developments, peer learning and networking, led to few tangible. In some cases members of the HLG were able to explain how they applied lessons from the HLG meetings to their national settings, or pursued joint initiatives with their counterparts from other Member States, but these were in the minority.

52
4.2. The EU Platform for Action on Diet, Physical Activity and Health
The main instrument to engage private stakeholders in the implementation of the Strategy is the EU Platform on Diet, Physical Activity and Health. The Platform was set up in 2005 as a representative forum and relies on dialogue and voluntary actions in different priority areas. The Platform normally meets three to four times a year, and additionally meets once a year with the High Level Group on Nutrition and Physical Activity.
The diagram below is an excerpt from the intervention logic for the implementation of the EU Strategy that was developed for this evaluation (for the full version see the inception report) and shows the respective key expected outputs and outcomes of the Platform and self-regulatory actions that are relevant in the context of the present evaluation. As can be seen, because of the broad scope of its activities, the Platform can potentially contribute to all six priority areas.
Figure 18: Excerpt from the intervention logic – Platform for Action on Diet, Physical Activity and Health and Private actor actions
A comprehensive evaluation of the EU Platform for action on Diet, Physical Activity and Health was conducted in 2009-2010, which assessed the Platform’s contribution to enhancing the dialogue between its members and the sectors they represent, the relevance, proportionality and implementation of Platform members’ commitments, and the Platform’s impact. The evaluation found that enhancing dialogue was one of the main achievements of the Platform. It stated that the Platform “is an innovative approach that has brought together actors with very different interests who were previously often antagonistic towards each other”. In addition, the evaluation suggested that “there is a good representation of a broad range of sectors on the Platform […] providing a good basis for facilitating a cross-sectoral approach to the issue of obesity”.
However, the evaluation also highlighted some areas where there was room for improvement. The evaluation noted that for-profit and not-for-profit Platform members often had very different opinions with regard to the effectiveness of the Platform itself and the commitments made by its members. While the Platform had led to an enhanced understanding between for-profit and not-for-profit members, this had not necessarily translated into greater
European Commission / private actors
Priority areas
Physical activity encouraged
Priority groups targeted
Platform for Action on Diet, Physical
Activity and Health
Self-regulation Other actions
Co-ordination / Collaboration
Commitments
Outputs Instruments Outcomes
Better informed consumers
Healthy options available
Evidence base for policy-making
Effective monitoring systems
Private Actors

53
trust and industry and NGOs still had very different perceptions on a number of issues. More specifically, many not-for-profit members had doubts as to the extent to which the dialogue actually led to a significant change in attitudes of for-profit members. For-profit members, in turn, were dissatisfied with the (in their opinion) overly critical attitude of many not-for-profit members and the “watch-dog” role they assigned to themselves. The antagonism between for-profit and not-for-profit members was (among others) illustrated by the lack of joint initiatives.
With regard to the effectiveness of commitments, the evaluation found that relevant and proportionate commitments co-existed with commitments that were less so. It found that while some commitments were significantly wider in scope and potential impact, thereby reaching a larger target group, other commitments were far more inward-facing and only focused on very small target groups. It was still too early to judge on the actual health impact of Platform commitments.
The evaluation recommended for the European Commission to look to defining a renewed mandate that recognised what had been achieved, set priorities for future work, and established joint goals and operational objectives to ensure buy-in (especially from the not-for-profit sector) and continued momentum.50 Partly in response to these recommendations, two thematic working groups were set up to review the objectives of the Platform and its monitoring approach. This resulted in two working papers with recommendations. While the Platform Charter remained the main framework for reference, the working paper on renewed objectives introduced and re-emphasised a number of issues:
Activity areas: “advocacy and information exchange” was added as a sixth field of action for commitments.
Working methods: the working paper introduced “improved working methods” by adding a new slot called “New stakeholders’ initiatives in all areas” in plenary meetings with a view to providing stakeholders with the opportunity to discuss plans for commitments and by sharing stakeholders’ presentations two weeks before plenary meetings so as to facilitate more informed discussions.
Requirements for commitments: the working paper defined minimum requirements for commitments, namely the delivery of results by 2013, wider coverage (in terms of geography and target groups), commitments should be proportional to the size and capacity of the member and mainly targeted at the owner’s core business, and when possible members were encouraged to consider possibilities for joint approaches.
Priority areas and target groups: the working group (re-) emphasised priority areas and target groups for the period of 2011 – 2013. The target groups were (1) vulnerable groups including children and (2) low socio-economic groups. The priority areas were improvements of already existing commitments in (1) advertising and marketing to children and (2) reformulation, (3) physical activity and sports; and (4) reaching out to schools to increase physical activity and to make the healthy option available.51
In addition to these renewed objectives, the monitoring system was adapted by shifting the focus from a quantitative to a qualitative assessment of commitments. The working paper on monitoring presented a suggested way forward, elaborating on changes in the quality, content and use of monitoring. Based on this working paper, the following key changes were made to the monitoring system52:
50
Source: Evaluation of the European Platform for Action on Diet, Physical Activity and Health, The Evaluation Partnership, Final Report July 2010. 51
Source: Working Paper on Renewed Objectives, DG SANCO, 15 February 2011. 52
These changes were implemented from 2011 onwards. Source: Annual report EU Platform 2011.

54
Scoring system: the previous scoring system with 5 scores was replaced by a qualitative system based on 3 levels of performance;
Outcome indicators: the measuring of outcome became compulsory, meaning that it would be taken into account when assessing the overall quality of the commitment;
Written feedback: the contractor committed to provide written qualitative feedback in a systematic and tailored way to improve the quality of the monitoring;
Coaching: the contractor committed to provide monitoring guidance and ex post discussions of monitoring efforts to individual Platform members. It also introduced a 3 hours coaching / training session with up to 25 participants every year;
Support to plenary discussions: the contractor committed to carry out overall analyses of commitments in the relevant field of action for the afternoon sessions of the Platform meetings, identifying possible gaps in commitments, and preparing questions related to the commitments' substance, impact, relevance and effectiveness, as well as suggestions for possible improvements of the commitments.
Since the previous evaluation already provided a lot of relevant information on the work of the Platform, the aim of the present evaluation is to build on data gathered in 2009-2010 and complement this with new data on recent developments, in order to ascertain the extent to which the findings and conclusions reached in 2010 continue to be valid. One key characteristic of the Platform is the focus on action (in the form of commitments) rather than only dialogue. The sections below focus primarily on the relevance of the commitments to the needs of stakeholders and EU citizens and the proportionality between the level of action and the Platform objectives (in particular the renewed objectives).
4.2.1. Relevance of the commitments to the needs of stakeholders and citizens
Evaluation question 5
To what extent do actions initiated by Platform members address the needs of stakeholders and EU citizens? This should address in particular actions launched since 2010.
The previous evaluation concluded that the Platform generated a considerable number of commitments, but that at the same time there was a clear variance in the relevance of these actions. It noted that “both for-profit and not-for-profit members questioned the extent to which all the commitments are equally relevant to the objective of fighting obesity and both sectors tend to be critical of each other”. In addition, it concluded that “it is unclear to what extent commitments are actually addressing the needs of stakeholders and potential multipliers, and especially vulnerable or affected groups”.
In order to assess whether these findings still hold true, the evaluation team assessed the number and types of commitments, the proportion of commitments addressing the priority areas and target groups, the compliance of commitments with some of the minimum requirements defined in 2011, the (perceived) effect of the renewed objectives and working methods, and the (perceived) relevance of commitments in 2009 and 2011. The key findings are presented in the sections below.

55
1. Number and types of commitments in 2009 and 2011
This section provides an overview of the number and types of commitments in 2009 and 2011 based on the information available in the Platform database. Naturally, this purely quantitative data only provides part of the picture, and one should be careful not to read too much into the numbers. In order to assess the level of action, one also needs to take into account the specific content of commitments, including their level of ambition and scope of action. These aspects are discussed in more detail in paragraph five of this section and section 4.2.2, based on the feedback gathered from Platform members and the in-depth review of a sample of ten commitments.
The Platform currently consists of 14 for-profit members and 19 not-for-profit members, indicating that there is a reasonably balanced distribution between for-profit and not-for-profit members. Based on a review of the commitment database, the total number of active Platform commitments dropped from 141 in 2009 to 127 in 201153. While the number of commitments owned by for-profit members dropped considerably (from 102 to 87), the number of commitments held by not-for-profit members almost remained the same (39 in 2009 and 40 in 2011).
The figure below reflects the number of active commitments held by for-profit members by activity area in 2009 and 2011. It shows that the number of active for-profit commitments has mainly fallen in the areas of labelling and marketing and advertising, but increased in the area of reformulation. Please note that these figures do not take into account the number of individual companies that implement these commitments. For example, while a relatively high number of commitments fall under the category of education, it is likely that commitments under the area of reformulation are implemented on a much larger scale and by many more actors (such as the local member companies of multinationals).
Figure 19: Active for-profit commitments by activity area in 2009 and 2011
The next figure presents the active commitments owned by not-for-profit Platform members by activity area in 2009 and 2011. This figure also shows some small changes in the spread of commitments across the activity areas. While the number of commitments in the area of
53
The information in this section is based on a quantitative analysis of data from the Platform online database. It is further based on the assumption that when there was monitoring data available in a given year, the commitment was active at that time. The numbers are somewhat different from the data provided in the annual reports.
18
35
8
22
11 8
11
32
9 13
15
7
0
10
20
30
40
Consumerinformation,
includinglabelling
Education,includinglifestyle
modification
Physical activitypromotion
Marketing andadvertising
Composition offood
(reformulation)
Advocacy andinformationexchange
2009 2011

56
advocacy and information exchange increased, there were fewer commitments promoting physical activity in 2011.
Figure 20: Active not-for-profit commitments by activity area in 2009 and 2011
Both the for-profit and not-for-profit figures show that after the introduction of the sixth field of action (“advocacy and information exchange”) the total number of commitments in this area (18 in 2009 and 21 in 2011) as well as the proportion of commitments in this area (13% in 2009 and 17% in 2011) only increased to a small extent.
2. Proportion of commitments addressing priority target groups
The number of commitments directly or indirectly targeting children changed to a very minor extent, namely from 41 to 39 between 2009 and 2011. Several commitments targeting this group were longer-term commitments and thus were active in 2009 as well as in 2011. The figure below presents the total number of active commitments targeting children and adolescents for for-profit and not-for-profit members in 2009 and 2011. It should be noted that, in light of the lower total number of commitments in 2011 (see above), the percentage of commitments targeting children has actually risen from 29% to 31%.54
54
It should be noted that some commitments did not directly target children and adolescents, but other (related) groups such as parents, educators, health professionals, or policy makers. Therefore, the data was based on the number of commitments that were categorised as targeting “children and adolescents”, “educators”, and “parents” in the EU Platform commitments database. The annual report of the Platform found that a higher number of commitments targeting children and adolescents (namely 55 in total in 2011). This discrepancy might be due to using somewhat different selection criteria.
1
13 11
4
0
10
2
13
7
3 1
14
0
10
20
30
Consumerinformation,
includinglabelling
Education,includinglifestyle
modification
Physicalactivity
promotion
Marketing andadvertising
Compositionof food
(reformulation)
Advocacy andinformationexchange
2009 2011

57
Figure 21: Active commitments targeting children and adolescents in 2009 and 2011
Also with regard to the spread of commitments targeting this group across the activity areas, there were only minor changes. The vast majority of the commitments by for-profit members were in the area of education. A significantly smaller number of commitments fell under the areas of physical activity promotion and marketing and advertising. Only a few commitments fell in other areas. The commitments targeting children and adolescents held by not-for-profit members were more evenly spread across the different activity areas.
The annual monitoring report 2012 concluded that only a few commitments explicitly reported lower socio-economic groups as a target audience (6 in total in 2011). This included 3 commitments in the area of education / lifestyles and 3 in the area of physical activity promotion. 5 of the 6 commitments targeting vulnerable groups were owned by for-profit members. It should be noted that many of the Platform commitments addressed more general target audiences (such as the “general public” or “children and adolescents”), which could also include lower socio-economic groups. In addition, the annual monitoring report indicated that in 2011 there were some commitments that addressed these groups at policy level or that showed awareness of these groups and had the intention to develop clearer objectives in relation to this group. There was no information available on the number of commitments addressing this target group in the year 2009.
3. Commitments addressing the priority areas
The commitment database was also screened to analyse any changes in the number of commitments addressing the priority areas identified in February 2011. The figure below compares the number of active commitments in each of the renewed priority areas in 2009 and 2011.55 It shows that only the number of commitments in the area of reformulation increased. In the remaining priority areas, the number of active commitments decreased slightly between 2009 and 2011 (broadly in line with the overall reduction in the number of commitments).56
55
Please note that in order to assess the number of active commitments in the areas of reaching out to schools with the aim of increasing physical activity and making the healthy option available, the evaluation team screened the database by reviewing all the results for the target groups “educators” and “children and adolescents”. In relation to “reaching out to schools with the aim of making the health option available”, it should be noted that while many commitments reached out to schools to provide educational material, only those commitments that actually contributed to improving the food offer at schools were counted. 56
With regard to the areas of ‘marketing and advertising to children’ and ‘reformulation’, the renewed objectives highlighted the need for improvements of existing commitments. While the figure only provides information on the number of commitments in these areas, the level of action will be discussed under evaluation question 6.
35 34
6 5
0
10
20
30
40
50
2009 2011
For-profit members Not-for-profit members

58
Figure 22: Number of active commitments in renewed priority areas in 2009 and 2011
4. Number and types of commitments in relation to the minimum requirements
This section elaborates on the extent to which commitments adhered to some of the minimum requirements for which data was available from the database or the monitoring reports, namely the geographical coverage and the extent to which commitments were likely to target the core business of the commitment owners.57
The monitoring reports suggested that there had not been any substantial change in the geographical coverage of commitments between 2009 and 2011.58 However, the annual report of 2012 did find a substantial increase in geographical coverage of new commitments (i.e. those commitments that were introduced in 2011) compared to previous years. The European coverage of new commitments increased from 59% to 73% between 2011 and 2012).
In relation to the extent to which commitments were likely to target the core businesses of the Platform members, the evaluation team looked specifically at those for-profit Platform members that are directly involved in the areas of food production, retailing and / or marketing and advertising,59 and assessed the spread of their commitments across the six activity areas. These 5 Platform members together had 84 active commitments in 2009 and 72 in 2011, meaning that their total number of commitments dropped by approximately 14 per cent between those years. The figure below illustrates how their commitments were spread across the activity areas in 2009 and 2011. It shows that while there was a small increase in the proportion of commitments in some areas (including reformulation and education), the proportion of commitments decreased in the other “core” areas (namely marketing and advertising and consumer information). The total proportion of commitments in these three areas (which are directly related to these members’ core business) decreased from 56% to 49% between 2009 and 2011.
57
As there was no available (comparable) data on the other minimum requirements in the database or the monitoring report, the compliance with the remaining minimum requirements was assessed through the focus groups and the in-depth reviews of the sample of commitments, which are discussed in the next sections. 58
With regard to the geographical coverage of commitments, the annual monitoring report of the EU Platform distinguished between national coverage (commitments in only one country of a region within a country), regional coverage (commitments in 2 to 5 Member States), and European coverage (commitments in more than 5 Member States). 2009: 56% European coverage, 6% regional coverage, and 38% national coverage. 2011: 59% European coverage, 5% regional coverages, and 36% national coverage. 59
Namely FoodDrinkEurope, the European Modern Restaurants Association, the European Federation of Contracting Catering Organisations, EuroCommerce; and the World Federation of Advertisers.
6
11
19
7 7 5
16 16
5 5
0
5
10
15
20
Advertising andmarketing to
children
Reformulation Physical activityand sports
Reaching out toschools with theaim of increasing
PA
Reaching out toschools with the
aim of making thehealthy option
available
2009
2011
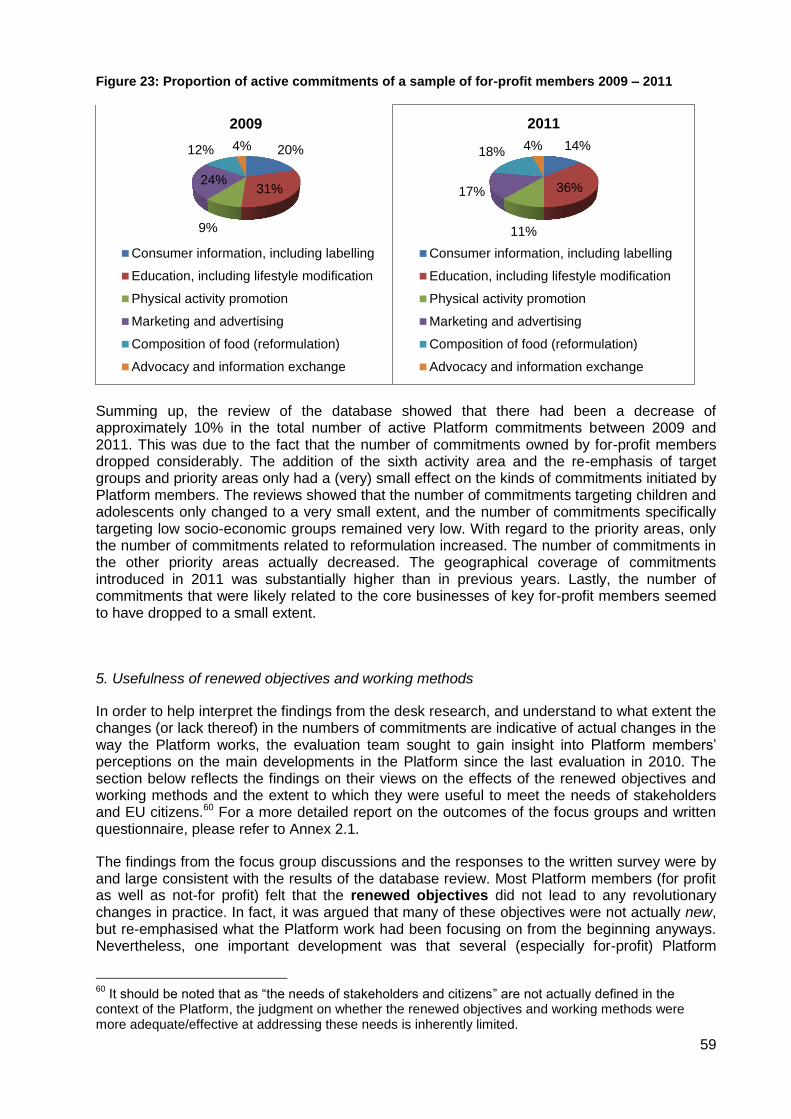
59
Figure 23: Proportion of active commitments of a sample of for-profit members 2009 – 2011
Summing up, the review of the database showed that there had been a decrease of approximately 10% in the total number of active Platform commitments between 2009 and 2011. This was due to the fact that the number of commitments owned by for-profit members dropped considerably. The addition of the sixth activity area and the re-emphasis of target groups and priority areas only had a (very) small effect on the kinds of commitments initiated by Platform members. The reviews showed that the number of commitments targeting children and adolescents only changed to a very small extent, and the number of commitments specifically targeting low socio-economic groups remained very low. With regard to the priority areas, only the number of commitments related to reformulation increased. The number of commitments in the other priority areas actually decreased. The geographical coverage of commitments introduced in 2011 was substantially higher than in previous years. Lastly, the number of commitments that were likely related to the core businesses of key for-profit members seemed to have dropped to a small extent.
5. Usefulness of renewed objectives and working methods
In order to help interpret the findings from the desk research, and understand to what extent the changes (or lack thereof) in the numbers of commitments are indicative of actual changes in the way the Platform works, the evaluation team sought to gain insight into Platform members’ perceptions on the main developments in the Platform since the last evaluation in 2010. The section below reflects the findings on their views on the effects of the renewed objectives and working methods and the extent to which they were useful to meet the needs of stakeholders and EU citizens.60 For a more detailed report on the outcomes of the focus groups and written questionnaire, please refer to Annex 2.1.
The findings from the focus group discussions and the responses to the written survey were by and large consistent with the results of the database review. Most Platform members (for profit as well as not-for profit) felt that the renewed objectives did not lead to any revolutionary changes in practice. In fact, it was argued that many of these objectives were not actually new, but re-emphasised what the Platform work had been focusing on from the beginning anyways. Nevertheless, one important development was that several (especially for-profit) Platform
60
It should be noted that as “the needs of stakeholders and citizens” are not actually defined in the context of the Platform, the judgment on whether the renewed objectives and working methods were more adequate/effective at addressing these needs is inherently limited.
20%
31%
9%
24%
12% 4%
2009
Consumer information, including labelling
Education, including lifestyle modification
Physical activity promotion
Marketing and advertising
Composition of food (reformulation)
Advocacy and information exchange
14%
36%
11%
17%
18% 4%
2011
Consumer information, including labelling
Education, including lifestyle modification
Physical activity promotion
Marketing and advertising
Composition of food (reformulation)
Advocacy and information exchange

60
members had consolidated their commitments in order to have fewer and more focused commitments, but also to reduce the administrative burden of having to monitor all the commitments. Some other (smaller) changes were the enhanced attention to the area of promoting physical activity and an increased geographical coverage of new commitments. However, it was argued that these developments were not a result of the renewed objectives but would have taken place anyways.61 Nevertheless, the findings from the focus groups indicated that the introduction of the renewed objectives did add some value to the Platform process. As was indicated by a significant number of Platform members, they re-emphasised and clarified what commitments needed to focus on, and what was (at a minimum) expected from Platform commitments.
The renewed working methods (which were in fact new) were reflected upon quite positively by the majority of for-profit as well as not-for-profit Platform members. Although relatively small, there were several adjustments that were made since the last evaluation in 2010 and that could clearly be attributed to the renewed working methods that were established in February 2011. There had been positive developments related to the plenary discussions (through the new time slot at the end of plenary meetings) as well as the communication about the discussions (through the Flash reports). Also the timely provision of presentations was appreciated by most Platform members. However, with regard to this latter development, there was little evidence that this actually led to more informed discussions during the meetings. A number of (especially not-for-profit) participants mentioned that many discussions were still formulaic and static in nature.
The table below presents the key evaluation findings on the adequacy of each of the individual renewed objectives and working methods.
Table 5: Perceived usefulness of the individual renewed objectives and working methods
Renewed objective
Key evaluation findings
1. Addition of sixth field of action
There was a consensus among both for-profit and not-for-profit Platform members that the activity areas were still relevant. According to the vast majority of members, the addition of the sixth activity area “advocacy and information exchange” mainly served to recognise the commitments that were made by many not-for-profit members and to fit these into the monitoring process. Platform members did not think that the additional activity area led to any changes in practice.
2. Improvements working methods
Several for-profit and not-for-profit Platform members indicated that there had been improvements in the working methods of the Platform:
The addition of the time slot called “New stakeholders’ initiatives in all fields of action” at the end of plenary meetings was valued by many Platform members, albeit for different reasons than was foreseen when this slot was introduced. While it was hardly used to discuss any plans or
ideas for action62
, it did provide Platform members with more flexibility to
present and discuss new important developments in existing commitments and to introduce new Platform members and their activities at an early stage, even if these were in areas that were not the focus of the particular plenary meeting in question.
The fact that presentations were shared two weeks before the plenary
61
This was mainly due to the fact that most actions were initiated in wider contexts rather than solely in response to the Platform or the renewed objectives. 62
It was mentioned that the idea of discussing any plans or ideas for action was unrealistic, as many of the commitments and actions were developed in a wider context than only the Platform and that many of the topics would be too sensitive to be discussed in the Platform before being agreed upon by member organisations.

61
meetings (at least most of the time) was valued by most Platform members. However, the focus group discussions revealed that the extent to which this actually led to better informed discussions was questionable. Both for-profit and not-for-profit members explained that this was often due to constraints in time and resources to prepare meetings.
Several Platform members mentioned the ‘Flash reports’ produced by the Commission as a positive development. It was appreciated that these reports were sent around shortly after the plenary meetings, and that they provided useful summaries of the Platform discussions.
3. Definition of minimum requirements for commitments
A significant number of for-profit and not-for-profit Platform members indicated that the minimum requirements did not change much in practice, as many commitments were already compliant with these requirements before. At the same time, some members indicated that there was a large variation in the degree of compliance with these minimum requirements. The focus group discussions revealed some relevant developments in relation to the minimum requirements:
Some for-profit members stressed that their commitments had become fewer in number and more focused on their core business. The database review indeed showed a decrease in the overall number of commitments, although there is not enough evidence to draw any definitive conclusions on changes in the extent to which commitments are focused on their owners’ core businesses.
A few Platform members mentioned that they broadened the geographical scope of their commitments. The database review also found an enhanced geographical coverage, especially of new commitments.
However, these developments were not perceived to be a result of the renewed objectives. Most Platform members agreed that, in line with the findings from the previous evaluation and the monitoring reports, the number of joint initiatives remained very small throughout the years.
4. Re-emphasis of priority areas and target groups
According to most Platform members, the re-emphasis of priority areas and target groups did not lead to any major changes in practice, as these areas and groups were already covered by many commitments before. However, the focus group discussions revealed that it did bring renewed attention to the priority issues and target groups in some respects:
Priority areas: in line with the database review, both for-profit and not-for-profit Platform members observed that there had been an increased attention to the promotion of physical activity since the last evaluation, leading to a better balance of topics discussed in the plenary meetings. Some participants also felt that there had been a high level of action in the areas of advertising and marketing to children, and reformulation. Again, members felt that this development, while consistent with the renewed objectives, could not necessarily be attributed to their adoption.
Target groups: several members noted that there had been an increased focus on children and adolescents in certain commitments. However, prioritising lower socio-economic groups was perceived to be much more difficult, especially for for-profit actors who generally did not tend to differentiate between socio-economic groups when carrying out their activities. This was also in line with the findings from the database.
6. Relevance of recent commitments (2010 and 2011)
In addition to the developments related to the renewed objectives, Platform members were asked to comment on the relevance of recent commitments. Almost all Platform members found it difficult to comment on this, as they were not familiar with the vast majority of the commitments. It was indicated that the commitments presented during plenary meetings only constituted a “tip of the iceberg”. Therefore, during the focus groups members mostly reflected on their own commitments or those that they did happen to know about.

62
The views on the perceived relevance of recent commitments were somewhat mixed. While some Platform members did not perceive any significant changes, others were of the opinion that there was a general trend towards commitments being fewer in number and (according to several for-profit members) more focused on the core business of the commitment owners. There were some disagreements related to the kinds of commitments (held by for-profit members) that were relevant or not. While for-profit members argued that it should be acceptable to continue actions in fields such as education in addition to their core businesses, some not-for-profit members felt that it was inappropriate for industry members to initiate any commitments in areas not related to their core businesses.63
The relevance of commitments was perceived to be an important but controversial issue of debate between the different sectors. The previous evaluation found that:
“The platform has led to a better understanding among members from different sectors, notably through a dialogue that has become more constructive and less confrontational over the years. However, there is still an element of confrontation between for-profit and not-for-profit members, and the enhanced understanding has not necessarily translated into greater trust”.
The focus group discussions revealed that there was still a degree of antagonism between (certain) for-profit and not-for-profit Platform members, who tended to assess the relevance of the Platform work somewhat differently. While recognising attempts to address certain issues (through the renewed objectives), a significant number of members (both for-profit and not-for-profit) were dissatisfied with the plenary discussions of the Platform. It was argued that Platform members often just “[stated] their own opinions without really engaging in a structured dialogue”. This was perceived as being an obstacle to the further development of commitments. Not-for-profit members also seemed sceptical about the extent to which the dialogue between the different sectors had led to significant changes in the attitudes of for-profit members. In addition, some not-for-profit members argued that the Commission did not contribute enough to enhance the quality of the dialogue. For example, it was mentioned that the Chair of the Platform saw the Commission’s role only as that of a moderator and facilitator, and therefore tended to avoid discussions that were too critical and was unwilling to take a stance on controversial issues (such as the relevance of certain commitments). Some members felt that the Commission should play a stronger leadership role.
For-profit members tended to be much more positive on the quality of the plenary meetings. The polarisation between the Platform members was seen as inherent to the nature and composition of the Platform and it was argued that this actually helped to create a constructive dialogue. Some Platform members provided examples of concrete changes in commitments that resulted from this dialogue. For example, it was explained that the adoption of the common nutrient profiles for the EU Pledge was a result of the discussions that had taken place during several plenary meetings. For-profit Platform members were also much less critical of the role of the Commission in the Platform process.
Regardless of the disagreements on the definition of ‘relevance’ and the divergent views on the quality of the cross-sectoral dialogue, most Platform members (for-profit as well as not-for-profit) agreed that the relevance of recent commitments still varied significantly. This was in line with the findings from the previous evaluation and the in-depth review of the sample of commitments. The previous evaluation stated that there were “clear indications that commitments which are relevant and proportionate (and therefore have the potential for significant impact), co-exist with commitments that are less so”. The in-depth review of the 10 commitments (more information on this is presented in the next section) showed that, as all commitments need to relate to one of the activity areas which are all deemed relevant to the
63
Within this context, it is important to note that the previous evaluation found that the Commission had encouraged members to make commitments not only related to their core business, but to also explore ways of becoming active in other areas.

63
Platform objectives, and these have been agreed by all Platform members as at least potentially relevant, it would be hard to argue that any of these commitments were not relevant. However, the link between the commitments and the overall aim of reversing the trend of obesity was in some cases (much) clearer than in others.
Conclusion
The renewed objectives (adopted in 2011) introduced a new activity area, improved working methods, and highlighted priority areas, target groups, and minimum requirements for Platform commitments. One of the more striking developments since the last evaluation in 2010 and the adoption of the renewed objectives is that there seems to be a trend towards fewer and more focused commitments held by for-profit members. Platform members were able to provide examples of how they consolidated commitments in line with (but not necessarily inspired by) the renewed objectives and enhanced their levels of action. Despite the overall reduction of commitments, the number of commitments in the areas of reformulation and physical activity promotion increased. It is noteworthy that both these activity areas were highlighted as priority areas under the renewed objectives. Also the geographical coverage of recent commitments improved. Changes in working methods have led to some improvements. While these improvements were very much appreciated by many of the Platform members and were perceived to be beneficial to the Platform process, there was no evidence that they actually led to substantial changes in the quality of the plenary debates.
While these small changes may have led to a slightly better focus of discussions and commitments, it should be noted that overall the renewed objectives did not change the objectives or work of the Platform in a revolutionary way. The findings suggest that many of the renewed objectives were not really new but only re-emphasised the areas and groups that much of the Platform work was focusing on anyways. Also, the renewed focus on priority groups (children and disadvantaged groups) and the encouragement to explore opportunities for joint commitments did not have a real impact in practice, as Platform members continued to struggle to find ways of working together and/or of specifically targeting lower socio-economic groups.
Therefore, it can be concluded that the main findings of the Platform evaluation in 2010 are still valid. Core commitments that were very clearly relevant to the Platform objectives still co-exist with commitments that were somewhat less so. The activity areas are still considered relevant to the Platform objectives. As all commitments were linked (at least loosely) to one or more of these areas, they were naturally all relevant to the Platform objectives to some extent and thus also the needs of stakeholders and citizens. However, a true assessment of their relevance cannot be made without an in-depth assessment of commitments, as the relevance also very much depends on their concrete nature, scope and (expected and actual) outcomes. In terms of the perceived relevance, there were still differences of opinion between for-profit and not-for-profit members. While not-for-profit members were sceptical about the extent to which for-profit members were making genuine efforts to contribute to the Platform objectives, for-profit members were much more positive about the relevance of commitments.
The actual level of action and proportionality of commitments is further elaborated on in the next section.

64
4.2.2. Proportionality between level of action and Platform objectives
Evaluation question 6
Is the level of action(s) initiated by Platform members in a sound relationship to the operational objectives targeted in the founding Charter?
Contractors should investigate, to the extent possible, the quantitative aspects between the input given by the members and the desirable potential outcomes.
The previous evaluation concluded that “the level of action initiated by Platform members is not always proportionate to the objective set out in the founding charter”. With regard to the impact of the Platform work, it stated that “while commitments may well be playing a part in efforts to combat obesity and overweight in Europe, it is too early to make a judgment on the health impact of Platform commitments”. In order to assess whether these conclusions still hold true, the evaluation team collected Platform members’ perceptions of the extent to which recent developments had led to a higher level of action. In addition, it reviewed the inputs, outputs, and where possible outcomes of a sample of 10 commitments in-depth (for brief reports on each of these commitments, please see Annex 2.2).
1. The level of action of commitments
The previous evaluation revealed that there were significant differences in members’ levels of action of their commitments. It stated that “some organisations have commitments that are much wider in scope and potential impact, thereby reaching a larger target group, while other commitments are very inward-facing, focusing on a small target group […]”. It also found that there were also clear disagreements between for-profit and not-for-profit Platform members. While the former were accused of not putting enough efforts and resources into their commitments and choosing the “easy-to-implement” commitments, the latter were perceived as being overly critical and not contributing enough actual actions of their own.
When asked about the levels of action of recent commitments, views were still mixed. Not-for-profit members were generally sceptical about the level of action of (for-profit) commitments. While they acknowledged that there were some examples of ambitious commitments that achieved good results, many felt that in many other commitments there was considerable scope for improvement, and that in most cases, the industry had not been able to convincingly demonstrate the health impacts of its commitments. For-profit members agreed with the fact that some commitments had a higher level of action than others. At the same time, they explained that commitments were being improved continuously, but that developing actions and coming to an agreement with member organisations often was a lengthy process.
The in-depth review of the sample of commitments indicated that the levels of ambition of different commitments still varied to a great extent. One illustrative example related to commitments in the area of reformulation. While some commitments had concrete targets to reduce nutrients such as fat, sugars and/or salt, a few others did not commit to targets at all, but only to collecting and analysing food composition information of the company’s portfolio, which in turn could potentially (but not necessarily) lead to reformulation of certain products. Another example related to the way in which umbrella organisations monitored the implementation of commitments by member organisations. While some organisations went a long way to collect the required data and to follow up any non-compliant behaviour, a few other organisations (especially those European umbrella organisations with little direct control over their members) indicated that little could be done to ensure the effective implementation of the commitment by its members.

65
While all commitments were relevant to the Platform objectives, it is clear that the levels of ambition of these commitments, but also the degree to which commitment owners could be held accountable, differed substantially. Comparing the levels of action between commitments held by not-for-profit members (and the extent to which they constituted additional efforts) was less straightforward, as the kinds of activities, capacity and available funding of these members varied considerably, and some organisations actually received funding from the European Commission.
While many commitments were not initiated in response to the Platform but rather in wider contexts, the Platform sometimes added value to commitments by acting as a catalyst. The previous evaluation found that many commitments were not entirely new but that existing activities were often scaled up or revised to be turned into Platform commitments. Also the present evaluation (which only came across one commitment that was initiated entirely in response to the Platform) found that in several cases the Platform inspired or stimulated actions, for example by enhancing the level of ambition, coverage, or level of accountability and transparency. For example, the EU Pledge clearly progressed in response to debates and criticism from not-for-profit members as was illustrated by the introduction of the nutrient profiles late 2012. Other ways in which the Platform added value to commitments was by helping umbrella organisations to convey the importance of addressing certain issues to their member organisations and by providing a podium to showcase and enhance the visibility of certain actions. The latter was especially relevant to EU funded (research) projects.64
2. The implementation of commitments
The in-depth review of commitments indicated that the majority of commitments were implemented as envisaged. As many of the Platform members were European level or international organisations, the commitments were usually implemented through a top-down structure. There was a huge variance in inputs spent on for-profit as well as not-for-profit commitments, ranging from 30 persons days and EUR 5,000 spent on relatively small projects by NGOs with very limited resources, to over 300 working days and over EUR 4 million spent on much larger projects by multinational companies. While some commitment owners were able to provide detailed information on the inputs invested in the commitments, others found it more difficult to do so. In several cases the investments of their member organisations implementing the commitment were not available or it was not possible to differentiate the costs related to the commitment from the costs of the organisation’s (other) core activities.
In terms of outputs, some Platform members defined specific target outputs (such as reformulation targets, compliance rates, number of website visitors, etc.) and were able to report on those outputs and on their outcomes. Others only committed to less tangible activities and as a consequence, it was much harder to get a sense of the actual outcomes of those commitments. While most of the outputs were largely produced as envisaged, Platform members ran into a variety of obstacles when implementing the commitments. Some examples of such difficulties were: the coordination of actors implementing the commitments in different countries, obtaining monitoring data of the commitments, reformulating products without affecting the taste of products and dealing with European (labelling) legislation. With regard to the latter, one consumer information commitment ran into difficulties due to legislative uncertainty related to the lack of common nutrient profiles. Another commitment owner argued that the Nutrition and Health Claims Regulation limited the opportunity for companies to inform consumers about the reformulation, thus creating a negative incentive to reformulation.
64
Ways in which the Platform benefitted organisations rather than individual commitments were: being able to participate in cross-sectoral dialogues, mutual learning, and being in (closer) contact with the Commission.

66
3. The relationship between inputs and outcomes of commitments
While many of the commitments were generally found to be relevant (at least in principle) and commitments were implemented as envisaged, assessing the proportionality of commitments (i.e. the relationship between inputs and outcomes) was much harder. The focus group discussions and the in-depth review of commitments revealed that there was a lack of evidence on the overall impact of commitments, which was primarily due to the difficulty of isolating the impact of individual actions on the complex and multifaceted problem of nutrition and overweight related health issues.
In the area of information, education and research (an area addressed by many commitments by not-for-profit members), while the results of some research projects indeed contributed to a broader evidence base for policy making, it was not always possible to extrapolate the findings to other contexts and it was also not clear to what extent it actually had an impact on public health interventions in practice. Another example related to the commitment “Increasing Outreach of EUFIC’s Information on Diet, Physical Activity and Health”. While the language coverage of the organisation’s website expanded substantially, and as a result the number of users increased, it was not possible to specify the actual impact of the commitment on consumer information or the extent to which there was an increase in the actual use of this information (translated into healthier eating behaviour) by consumers.
Similar challenges exist even for commitments that relate to the core business of for-profit members. For example, in the area of advertising to children, based on extensive annual monitoring exercises, the EU Pledge was able to demonstrate very high compliance rates with the commitment as such, as well as a clear reduction in the overall exposure of children to (certain) advertisements. In the area of reformulation, several commitments were able to report data on the reduction of certain nutrients (such as salt and saturated fat) or the reduction of product sizes of certain products. However, determining the impact of these reductions on the total intake of nutrients and/or calories (let alone the impact on public health) was not possible. Even if the required information on people’s consumption behaviour (which would need to be very detailed and measured over a longer term) were available, there are numerous other factors influencing consumption that cannot be controlled for.
It should be noted that, while none of the commitment owners were able to measure the precise impact of the commitments, the available data on outcomes varied substantially across different commitments. For example, Mars did indicate that, in the context of its commitment “Product Reformulations & Portion Size Reductions” it had removed 3,000 tonnes of saturated fat from the European diet per year and replaced this with unsaturated fat (sunflower oil). Comparing this to the estimated daily intake of 30 grams of saturated fat per day65 this would amount to an average reduction of 0.05% of saturated fat per European. While it was still not possible to isolate the precise impact of this reduction on public health, it provided significantly more information relevant to the issue of proportionality than some other commitments.
In relation to the lack of evidence on impact, the monitoring system was discussed extensively among Platform members during the focus groups. The 2010 evaluation of the Platform found that:
“The monitoring system’s aim is to produce evidence and know-how (notably with a view to ensuring the relevance, proportionality and effective implementation of Platform commitments), but the system has not been exploited to its full potential with a view to doing this. In fact, while it has succeeded in placing the issue of monitoring high on the agenda of Platform members and has forced members to be accountable in some way, it could be argued that it has developed more into an end in itself, rather than a means of supporting the implementation of commitments.”
65
The recommended daily intake of saturated fatty acids is 30 grams for men and 20 grams for women; it is estimated that the actual intake it about 20% higher than this. Source: http://www.nhs.uk/Livewell/Goodfood/Pages/Eat-less-saturated-fat.aspx.
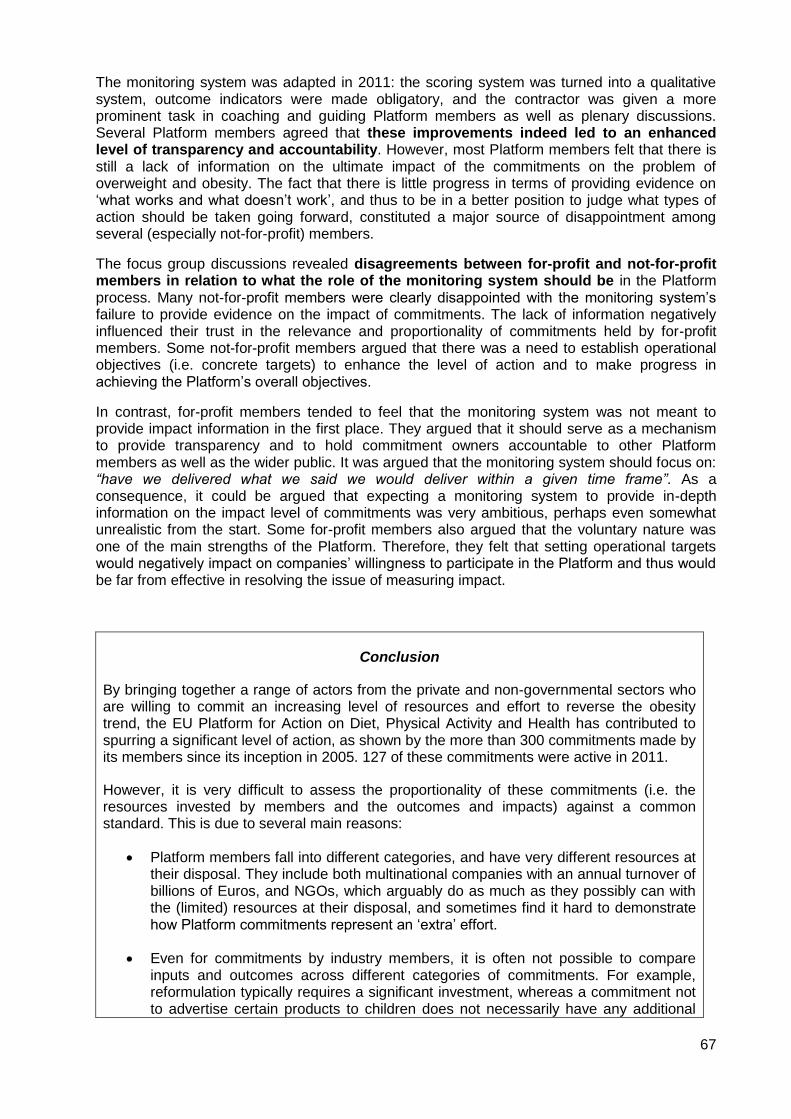
67
The monitoring system was adapted in 2011: the scoring system was turned into a qualitative system, outcome indicators were made obligatory, and the contractor was given a more prominent task in coaching and guiding Platform members as well as plenary discussions. Several Platform members agreed that these improvements indeed led to an enhanced level of transparency and accountability. However, most Platform members felt that there is still a lack of information on the ultimate impact of the commitments on the problem of overweight and obesity. The fact that there is little progress in terms of providing evidence on ‘what works and what doesn’t work’, and thus to be in a better position to judge what types of action should be taken going forward, constituted a major source of disappointment among several (especially not-for-profit) members.
The focus group discussions revealed disagreements between for-profit and not-for-profit members in relation to what the role of the monitoring system should be in the Platform process. Many not-for-profit members were clearly disappointed with the monitoring system’s failure to provide evidence on the impact of commitments. The lack of information negatively influenced their trust in the relevance and proportionality of commitments held by for-profit members. Some not-for-profit members argued that there was a need to establish operational objectives (i.e. concrete targets) to enhance the level of action and to make progress in achieving the Platform’s overall objectives.
In contrast, for-profit members tended to feel that the monitoring system was not meant to provide impact information in the first place. They argued that it should serve as a mechanism to provide transparency and to hold commitment owners accountable to other Platform members as well as the wider public. It was argued that the monitoring system should focus on: “have we delivered what we said we would deliver within a given time frame”. As a consequence, it could be argued that expecting a monitoring system to provide in-depth information on the impact level of commitments was very ambitious, perhaps even somewhat unrealistic from the start. Some for-profit members also argued that the voluntary nature was one of the main strengths of the Platform. Therefore, they felt that setting operational targets would negatively impact on companies’ willingness to participate in the Platform and thus would be far from effective in resolving the issue of measuring impact.
Conclusion
By bringing together a range of actors from the private and non-governmental sectors who are willing to commit an increasing level of resources and effort to reverse the obesity trend, the EU Platform for Action on Diet, Physical Activity and Health has contributed to spurring a significant level of action, as shown by the more than 300 commitments made by its members since its inception in 2005. 127 of these commitments were active in 2011.
However, it is very difficult to assess the proportionality of these commitments (i.e. the resources invested by members and the outcomes and impacts) against a common standard. This is due to several main reasons:
Platform members fall into different categories, and have very different resources at their disposal. They include both multinational companies with an annual turnover of billions of Euros, and NGOs, which arguably do as much as they possibly can with the (limited) resources at their disposal, and sometimes find it hard to demonstrate how Platform commitments represent an ‘extra’ effort.
Even for commitments by industry members, it is often not possible to compare inputs and outcomes across different categories of commitments. For example, reformulation typically requires a significant investment, whereas a commitment not to advertise certain products to children does not necessarily have any additional

68
costs attached to it per se.
It is clear that many actions in the areas covered by the commitments would have taken place as part of members’ regular (business / CSR) activities, albeit not necessarily with the same scope, level of ambition, continuity and/or accountability. Isolating the ‘added value’ of the commitments over and above what would have happened without the Platform is difficult.
The Platform never defined any quantifiable operational objectives, meaning there is no clear benchmark against which to measure the outputs and outcomes of commitments.
In view of these difficulties, the level of action can only be assessed by individual commitments or activity areas. The results of the focus groups and in-depth review of the sample of ten commitments undertaken as part of this evaluation suggest that many commitments represent a genuine effort to contribute to the Strategy’s objectives. Moreover, it was found that some commitments continue to evolve and to increase the level of action, partly as a result of the Platform process. However, there are still substantial differences in the levels of action across commitments. While several commitments were quite concrete and ambitious (in for example the number of people they intended to reach or the targets they aimed to achieve), in a few other cases the actual objectives committed to were much vaguer and the level of ambition was much lower.
These vast differences between commitments, combined with the lack of an agreed mechanism to assess their proportionality, remains one of the key problems of the Platform. While the monitoring system has ensured a high level of accountability, it has not been able to facilitate comparisons between commitments, or provide evidence on the impacts of commitments on nutrition, overweight and obesity related health issues. In light of the complexity of the obesity problem and the myriad factors that contribute to it, assessing and attributing the ultimate health impact of the commitments is an extremely difficult task; this would require research studies and data collection methods that go well beyond the capacity of the current monitoring process. The resulting lack of knowledge on ‘what works and what doesn’t work’ causes significant doubts and distrust, in particular by not-for-profit members in relation to the relevance and proportionality of commitments held by for-profit members.

69
4.3. EU legislation related to the implementation of the Strategy
In the White Paper on a Strategy for Europe on Nutrition, Overweight and Obesity related health issues66, the European Commission identified better informed consumers as one of the crucial areas related to the improvement of nutrition and health related issues. Moreover, it is seen as an issue that can be typically addressed at the Union level.
In line with what was foreseen by the European Commission in the White Paper, the EU has adopted three pieces of legislation to improve the provision of information to consumers:
Regulation (EC) No 1924/2006 on Nutrition and Health Claims: this Regulation aims to protect consumers from misleading or unfounded nutrition and health claims while at the same time ensuring the proper functioning of the EU internal market, by introducing harmonised rules and prohibiting claims that are not scientifically substantiated.
Regulation (EU) No 1169/2011 on Food Information: the objective of this Regulation is to attain a high level of consumer protection and enabling them to make informed food choices, while at the same time ensuring the proper functioning of the EU internal market, by simplifying and adapting the legislative framework regulating the area of food information, and nutrition labelling in particular.
Article 9.2 of Directive 2010/13/EU on Advertisements of Unhealthy Foods and Beverages to Children: Article 9.2 of this Directive obliges the European Commission and Member States to encourage media service providers to develop codes of conduct regarding commercial communications of foods high in fat, salt and/or sugars that accompany or are included in children’s programmes.
The diagram below shows these three pieces of legislation and their respective key expected outputs and outcomes that are relevant in the context of the present evaluation. The diagram is an excerpt from the intervention logic for the implementation of the EU Strategy that was developed for this evaluation (for the full version see the inception report).
Figure 24: Excerpt from the intervention logic – EU legislation
66
COM (2007) 279 final, Brussels, 30.05.2007
European Commission
Priority areas
Better informed consumers
Priority groups targeted
Nutrition and Health
Claims Regulation
Food Information
Regulation
False, misleading or unfounded claims
prohibited
Key nutrition information provided
on packs
Outputs Instruments Outcomes
Audiovisual Media Services Directive
(Art. 9.2)
Codes of conduct for advertising to
children

70
4.3.1. Development of new European laws
Evaluation question 7
To what degree has the EU developed the new European laws foreseen in the White Paper? Aspects to be studied should cover work of the Commission, the Council and the European Parliament.
A. Regulation (EC) No 1924/2006 on Nutrition and Health Claims made on foods
Regulation (EC) No 1924/2006 (which entered into force in January 2007) regulates nutrition and health claims made on foods. The Regulation defines the word ‘claim’ as “any message or representation which is not mandatory under Community or national legislation […], which states, suggests or implies that a food has particular characteristics”.67 The provisions apply to claims made on all commercial communications (whether in the labelling, presentation or advertising) of foods.68
A.1. Development of the Regulation
Main motives for the Regulation
The Nutrition and Health Claims Regulation harmonised the previously wide-ranging legislation on claims made on foods at EU level. The Regulation has a dual objective. On the one hand, it aims to attain a high level of consumer protection by ensuring that claims are based on sound scientific evidence and do not provide misleading information. The rationale is that enabling consumers to make better informed food choices can contribute to the prevention of a variety of common diseases, which also include overweight and obesity. On the other hand, the Regulation aims to ensure the proper functioning of the internal market. The choice of legislative instrument (i.e. regulation) reflects this aim for harmonisation.
The interviewees indicated that there was a general shared agreement among for-profit and not-for-profit stakeholders on the need to regulate this area at the European level. According to the interviewees, there were perceived benefits for consumers who were prevented from making informed food choices by false or misleading claims, as well as for economic operators who faced different regulations across the EU.
Consultation process
In response to the perceived need to harmonise legislation, DG SANCO launched a Discussion Paper in 200169 asking stakeholders to provide inputs on the question of how to harmonise legislation in this area. 90 stakeholders responded to this consultation, including Member States, consumer and public health organisations, and industry actors. Subsequently, the Commission held a follow-up meeting with stakeholders and with Member States for further consultation on a preliminary draft proposal.70 Based on the consultation of the stakeholders,
67
Source: Article 2.1. Paragraph 4 and 5 of the same Article specify that a ‘nutrition claim’ states, suggests or implies that a food has particular beneficial nutritional properties, and a ‘health claim’ states, suggests or implies a relationship between (constituents of) food and health. 68
Source: Article 1.2 of Regulation (EC) No 1924/2006. 69
DG SANCO Discussion Paper on Nutrition Claims and Functional Claims, SANCO 1341/2001. 70
Source: explanatory memorandum Commission Proposal COM (2003) 424.

71
the Commission tabled a proposal in July 2003.71 The inclusion of health claims in this proposal (which were initially left out of the Discussion Paper) reflected the wish of stakeholders to regulate all claims at the European level.
Whereas a few interviewees indicated to be satisfied with the way in which they were consulted by the Commission, calling it a “proper consultation with a wide outreach”, most of the interviewees were not able to comment of the consultation process due to the fact that it took place ten years ago.
A.2. Adoption of the Regulation
The adoption process took place from the time the Commission tabled its proposal in July 2003 until the final adoption of the Regulation in December 2006 (3.5 years later).72 The findings from the interviews suggest that there were some discussion points that triggered heated debates and substantially delayed the adoption process.
Especially the issue of nutrient profiles (determining whether foods are eligible or not to bear claims, on the basis of their nutrient composition) was mentioned as a much debated provision.73 The main aim of setting nutrient profiles was to prevent the encouragement of consumers to make choices “which directly influence their total intake of individual nutrients or other substances in a way which would run counter to scientific advice”.74 Whereas food operators argued that nutrient profiles would incorrectly suggest that there are ‘good’ and ‘bad’ foods as opposed to ‘good’ and ‘bad’ diets, the Commission and consumer groups argued that there was still a need to limit the advertisements of such products. Support by the Council, the final Regulation does include the establishment of nutrient profiles, which according to Article 4 were to be established by the Commission by 19 January 2009.
Other examples of discussion points according to a few individual interviewees included the Annex on Nutrition Claims (i.e. what should be included in this list, what should the conditions of use be, etc.), how to deal with health claims based on new scientific data75 and whether or not trademarks and brand names which constitute nutrition or health claims in themselves should be included in the scope of the Regulation76.
71
COM (2003) 424 Proposal for a Regulation of the European Parliament and of the Council on nutrition and health claims made on foods, 16.07.2003. 72
The Regulation was adopted by the European Parliament and subsequently by the Council. Source: http://ec.europa.eu/food/food/labellingnutrition/claims/index_en.htm. 73
Consumer and public health groups, as well as industry actors were consulted on the issue of nutrient profiles. In addition, there were two meetings called the “Working Groups of the Advisory Group on the Food Chain and Animal Plant on Nutrient Profiles”, held on 8 July and 28 November 2008. Also Member State experts and EFSA were consulted. http://ec.europa.eu/food/food/labellingnutrition/claims/nut_profiles_en.htm. 74
COM (2003) 424 Proposal for a Regulation of the European Parliament and of the Council on nutrition and health claims made on foods, 16.07.2003, Preamble (6). 75
This is dealt with in the final Regulation Article 18, in the so-called ‘fast track procedure’. 76
Whereas the European Parliament was in favour of excluding these from the Regulation, the final Regulation provides that trade-marks and brand names are included in the Regulation. However, Article 27.2 introduced an extended transition period for those products existing before 1 January 2005 (which do not have to comply with the Regulation until 19 January 2022.

72
A.3. Implementation of the Regulation
Progress on implementation
As said, the Regulation entered into force in January 2007. Almost all interviewees representing the industry as well as the civil society indicated to be rather disappointed with the progress made so far on the implementation of certain key elements of the Regulation. Below are the key issues that the interviewees discussed in relation to the implementation of the Regulation:
Health claims: Article 13 of the Regulation stipulates that economic operators have to submit their claims to the competent authorities of their Member States. These national authorities then check the validity of the application77 and send the request to EFSA, who then checks whether all the necessary information has been provided to perform the scientific assessment.78 After the scientific assessment, a draft opinion is prepared and discussed by the working group and by the Panel on Dietetic Products Nutrition and Allergies who adopts a final opinion. The final authorisation of the claim is performed by the Commission and Member States. A list of permitted health claims, containing 222 authorised health claims, was adopted on in May 2012.79 With regard to the implementation of Article 13, interviewees discussed the following two issues:
o Delay list of permitted health claims: almost all interviewees mentioned that there was a substantial delay in the publication of the list of permitted health claims, which was published in May 2012 instead of 31 January 2010 as mandated by the Regulation. The main reason for this delay was the enormous amount of submitted claims which was not foreseen. A couple of interviewees pointed to the negative consequences of this delay, relating to legal uncertainty for economic operators as well as a delay in enhanced consumer protection. Nevertheless, most of the interviewees recognised the enormous workload that the applications for health claims caused, and perceived the final publication of the list of permitted health claims as a positive step towards the full implementation of the Regulation.
o Assessment of botanicals: one element of the list of permitted health claims that has not been resolved yet is the assessment of health claims made on botanicals. Until now, this is put on hold by the Commission until specific procedures on how to assess these claims are agreed upon by the European institutions. Again, a couple of interviewees were concerned with this delay, for similar reasons as described above.
Nutrient profiles: a majority of interviewees indicated that the implementation of nutrient profiles is a key element of the Regulation. The fact that the nutrient profiles have not been established yet is seen by many interviewees as a severe obstruction to the implementation of the Regulation. When asked about the reasons for the delay of the establishment of the nutrient profiles, interviewees pointed to technical as well as political complexities, relating to:
o Whether nutrient profiles should be set for food in general or for categories of food;
77
Checking the validity, among others, includes checking whether forms are filled in correctly, whether the application is compliant with the criteria set in the Regulation, etc. 78
If this is not the case, further information is requested from the applicant. 79
The Commission consolidated the original 44000 claims into a list of 4600 entries. The list of permitted health claims represents some 500 entries. 1600 entries of claims could not be authorised. The remainder of the claims are still awaiting a final decision. These claims mainly consist of botanical claims (currently on hold) claims that need further assessment, and claims that are still under consideration of the Commission and Member States. Source: http://ec.europa.eu/nuhclaims/.
73
o Which and how many nutrients should be included in the system; and
o What the thresholds for each of the nutrients should be.80
Several interviewees mentioned the effects of the extensive lobbying, which according to them has led the issue to become politically very sensitive. The industry representatives indicated that the delay in establishing nutrient profiles caused legal uncertainty for companies (sometimes even leading them to postpone product reformulation while awaiting the final decision on the profiles and particularly the thresholds). Civil society representatives, in turn, were concerned about the effectiveness of the Regulation in ensuring the foreseen protection of consumers. It was argued that nutrient profiles are of crucial importance to achieve this. A few individual interviewees mentioned that due to a lack of transparency, the current situation around the nutrient profiles was unclear to them.81 The Commission indicated that it received considerable inputs from different stakeholders, and is currently working on the development of a new proposal on this issue.82
With regard to the role of EFSA, several interviewees indicated that it was given a very challenging task, in particular by Article 13 of the Regulation. In addition to the enormous volume of the work, assessing the health claims was also an unprecedented task.83 With the publication of the list of permitted health claims, EFSA has overcome most of the difficulties in assessing the health claims. It has established assessment criteria and developed guidelines for future applications and the expected number of future applications seems manageable. The vast majority of interviewees were pleased with the work carried out by EFSA. They argued that not only the way in which EFSA managed the work load, but also the high scientific standards were very much appreciated.
Views on effectiveness
As mentioned before, the Nutrition and Health Claims Regulation aims to protect consumers from false, inaccurate or misleading claims, while at the same time ensuring the proper functioning of the internal market. The overall extent to which the Regulation has achieved its main objectives was reflected upon by the interviewees as follows:
Enhancing consumer protection: both industry and civil society representatives agreed on the fact that “consumers were really put at the heart of this Regulation”. One of the main achievements in relation to consumer protection was the list of permitted health claims. According to a significant number of interviewees, this has removed the majority of unsubstantiated claims from the market, and is likely to continue to do so in the future, thereby enabling consumers to make better informed food choices. However, the interviewees also highlighted the fact that consumer protection could be further enhanced by establishing nutrient profiles, and regretted that until today this opportunity has not been used.
A few individual interviewees (representing the industry) elaborated on the consequences of the Regulation for the food industry. Whereas it was recognised that those companies that had invested in scientific substantiation of claims benefitted from the Regulation (as they received a return on their investment), the representatives
80
EFSA provided a Scientific Opinion on these issues in January 2008, which can be found here: http://www.efsa.europa.eu/en/efsajournal/pub/644.htm. 81
One specific example of this is the Impact Assessment on this topic that the Commission wanted to carry out. It was mentioned that it was unclear what exactly the aim of this study was. 82
A indication of when this proposal was to be expected could not be given. 83
One specific difficulty brought along by this was that it had to establish criteria to assess the claims against, which turned out to be complicated exercise.

74
expressed concerns about the strict assessment of claims and the potential to limit incentives to innovate.
Proper functioning of internal market: despite the delay in publication, most interviewees felt that the final list of permitted health claims was also likely to contribute to more harmonisation across the EU market. Especially once the existing stocks (of products containing non-harmonised claims) are exhausted, this is likely to considerably contribute to the free movement of foods. Nevertheless, a few individual interviewees (representing the industry) suggested that there were still some national differences, for example related to the level of flexibility in wording of claims that was maintained by Member States. Despite the positive comments related to the list of permitted health claims, a few interviewees mentioned that the lack of assessment of claims made on botanicals as well as the lack of nutrient profiles had a negative effect on achieving this second objective and therefore argued that in order to further enhance the functioning of the internal market, these issues needed to be taken forward.
B. Regulation (EU) No 1169/2011 on the provision of Food Information to consumers
Acknowledging the importance of nutrition labelling and its potential to channel information to consumers, the White Paper (2007) announced the Commission’s intention to put forward a proposal for legislation in the field of nutrition labelling. In 2011, the Regulation on the Provision of Food Information to Consumers was adopted, which established general principles, requirements and responsibilities governing food information. Especially Article 9.1, l (the mandatory nutrition declaration) is of key relevance in relation to nutrition, overweight and obesity related health issues.
This section will elaborate on the progress made in the development and adoption of the Food Information Regulation. In addition, it will reflect interviewees’ views on the future implementation of this Regulation.
B.1. Development of the Regulation
Main motives for the Regulation
The legal framework preceding the Regulation consists for the main part of two Directives; one on the labelling, presentation and advertising of foodstuffs (2000/13/EC) and one more specifically on nutrition labelling (90/496/EEC). The Impact Assessment accompanying the Commission Proposal84 found that the previous legislation was not sufficient, stating that: “consumers’ use of labels is inconsistent and the effectiveness of labelling as a communication tool can be questioned”. Therefore, the main motive for developing the Regulation was to update, simplify and clarify existing legislation in the field of food and nutrition labelling.
The new Regulation, consolidating the two Directives into one Regulation, has a dual objective. On the one hand it aims to attain a high level of consumer protection and to ensure consumers’ right to information, by enabling them to make informed food choices (which in turn may have a positive effect on their health). On the other hand, the Regulation aims to improve the free movement of foods in the internal market.
84
COM (2008) 40 final.

75
Consultation process
In line with the EU’s Better Regulation Strategy85, the Commission Proposal for the Food Information Regulation was preceded by an extensive consultation process. From 2003 onwards, there have been several stakeholder consultations and research studies on the issue of food and nutrition labelling. For the development of the draft Regulation, the Commission sought the views of Member States, governmental organisations, food industry organisations (including small and medium sizes enterprises), non-governmental organisations (including consumer protection and public health groups) and individuals.86
The consultation findings indicated that most stakeholders agreed on the need to adapt the existing legislation in the area of food and nutrition labelling and the objectives of enhancing consumer protection and ensuring free movement of foods were rarely disputed. Also, stakeholders were generally satisfied with the efforts made by the Commission to consult the interested parties. However, there were strong disagreements as to how certain issues related to the provision of food and nutrition information to consumers needed to be addressed. Consequently, the views on the quality of the Commission proposal (tabled on 30 January 2008) were mixed. A few interviewees indicated they were dissatisfied with the extent to which their feedback was taken into account in the Commission proposal. In addition, a few of the interviewees considered the available pan-European evidence on consumer needs (as the basis for the proposal) insufficient.
B.2. Adoption of the Regulation
The topic of nutrition labelling was seen by many as highly controversial. A significant number of interviewees mentioned that due to the controversy around the topic as well as the technical complexities, the adoption process took longer than is usually the case. It was on 29 September 2011, 3.5 years after the Commission tabled its proposal, that the final Regulation was finally adopted by the European Council. Not only were there many discussions between the European institutions, there were also substantive debates within the institutions. In particular, the number of amendments proposed by MEPs and Council members was enormous, which triggered extensive negotiations within and between institutions. In addition, several interviewees pointed to the unusual amount of lobbying that took place.
Some of the main recurring points of discussion relevant to the Strategy that were mentioned by the interviewees included:
Presentation of nutrition declaration: whereas the Commission initially proposed mandatory front of pack labelling, the majority of Member States favoured mandatory back of pack labelling only. When the European Parliament eventually followed the Council position, the final result was a mandatory back of pack nutrition declaration.87
85
The Better Regulation Strategy promotes the better design and application of EU legislation, emphasises the importance of constructive dialogues with all stakeholders, and strives to work with all member States to ensure a consistent application of regulatory tools. Source: press release European Commission, 27 June 2012, http://ec.europa.eu/governance/better_regulation/index_en.htm. 86
An overview of all the consultations can be found in the Impact Assessment accompanying the Commission proposal on the provision of food information to consumers (COM (2008) 40 final). 87
The mandatory nutrition declaration must include the energy value, amounts of fat, saturates, carbohydrate, sugars, protein and salt, which must be indicated per 100g/100ml and may additionally presented per portion.

76
The final Regulation also allows for additional forms of presentation (such as traffic light systems) on a voluntary basis, but on the condition that it follows certain criteria.88
Nutrition labelling of alcoholic beverages: although the Commission and the Council were in favour of mandatory nutrition labelling for alcoholic beverages, the majority of the European Parliament was against this. For the time being, alcoholic beverages are exempted from the provisions on the mandatory nutrition declaration and the list of ingredients. The Commission is to produce a report within three years after the entry into force of the Regulation on the question whether or not the mandatory nutrition declaration should also apply to alcoholic beverages.
Trans-fatty acids: there were inter-institutional discussions on whether or not trans-fatty acids should be included in the mandatory nutrition declaration. Finally it was decided that the Commission shall submit a report assessing the presence of fat in foods and the (potential) impact of information provision and other measures on diet choices, and if appropriate, shall accompany this report with a legislative proposal.
Country of origin labelling: there were substantial disagreements on the need and feasibility of origin labelling between the main institutions but also between Member States and between parliamentarians. The final result of the negotiations – which goes beyond what the Commission had originally foreseen in its proposal – is that origin labelling is extended to several other products.89
Other points of discussion relevant to the Strategy that were mentioned less frequently by the interviewees included rules on allergen labelling, vegetable oils and imitation foods.
B.3. Implementation of the Regulation
Progress on implementation
Most of the provisions of the Regulation enter into force from 13 December 2014, but the provisions on the mandatory nutrition declaration will only enter into force from 13 December 2016 onwards. Despite the fact that the Regulation formally does not apply yet, the interviewees were asked to elaborate on potential achievements of the Regulation and potential future obstacles to its successful implementation.
It was frequently mentioned that the mere adoption of the Regulation was an achievement in itself. There seemed to be a general atmosphere of relief that the actors reached a final agreement, despite the lengthy debates and the contrasting views on the respective compromises. Also, the fact that the Regulation makes the nutrition declaration mandatory was seen as an important improvement which is likely to contribute to better informed consumers in the future.
A significant number of interviewees pointed out that due to the high level of controversy, several issues remained unresolved and/or are to be reported on later by the Commission.90 There were also some complaints regarding ambiguity in the way some provisions were to
88
These criteria include, among others, that they are based on sound consumer research, aim to facilitate consumer understanding, are supported by scientifically valid evidence and are objective and non-discriminatory. Source: Article 35 of Regulation (EU) No 1169/2011. 89
These products include fresh meat from swine, sheep and goats, and poultry, in addition to beef (for which separate legislation already existed) and fruits and vegetables, honey, olive oils, and cases where the lack of origin information would mislead consumers. 90
Examples are labelling of trans-fatty acids, country of origin labelling, and nutrition labelling of alcoholic beverages.

77
be interpreted.91 This was said to cause uncertainty for economic operators, who as a consequence fear having to change their labels multiple times, thus facing extra costs. It was argued by a few industry representatives that this could undermine the aim of the extended transition period, which was introduced to reduce additional costs for operators.
Views on effectiveness
As described above, the main motive for the Food Information Regulation was to update, simplify and clarify existing legislation with a view to attaining a higher level of consumer protection on the one hand, and to ensure the free movement of foods on the other hand. Some interviewees argued that the high number of concessions compromised the aim of simplifying and clarifying legislation. While it was recognised that the Regulation indeed consolidates all rules into one piece of legislation, some argued that a certain lack of simplicity and clarity persists mainly due to the high number of provisions and the complexity of the final text.92
The final outcome of the Regulation in relation to its main objectives was reflected upon by the interviewees as follows:
Consumer protection: most of the interviewees (representatives from industry as well as civil society) agreed that consumer protection has received significantly more attention in this Regulation than in previous legislation. Especially the mandatory nutrition declaration, legibility criteria93, allergen information and the provisions against misleading information are generally seen as important steps to attain a higher level of consumer protection. However, what is striking is that both for-profit and not-for-profit interviewees indicated to be in favour of front of pack labelling at the development and adoption stage of the Regulation. Several interviewees made reference to research studies that showed that consumers are significantly more likely to read front-of-pack labels than on back-of-pack labels.94 Therefore, several interviewees were disappointed with the final decision on this issue, some even describing it as a “missed opportunity”. In terms of impact, the civil society representatives were of the opinion that while the Regulation is a step in the right direction towards attaining a higher level of consumer protection, more needs to be done in the future to achieve ‘better informed consumers’. For example, a few interviewees argued for further regulation and accompanying educational measures.
Despite contrasting views between for-profit and not-for-profit actors on some particular issues, several interviewees mentioned that the overall Regulation strikes a fair balance between the interests of consumers and economic operators. However, as mentioned before, some expressed criticism in relation to the legal uncertainties that economic operators are faced with.
Free movement of foods: it was recognised by several interviewees that the Regulation (replacing multiple directives) is likely to substantially diminish the variety in national legislative measures. However, this effect could be undermined to some extent by the fact that several issues remained unresolved. Currently, there are activities on-going to tackle this issue; for example, the Commission and Member States have met
91
The evaluation team has been provided with a list of interpretation issues. Example are whether the voluntary front of pack information needs to be provided in the language of territory where the product is sold and what the difference between ‘consumer ‘ and ‘final consumer’ is. 92
In relation to the complexity of the final text, it was highlighted that not only lawyers but also small and medium sized enterprises needed to be able to read and understand the Regulation. 93
Some of the legibility criteria are still to be defined by the Commission. 94
One well-known example is the FLABEL study. URL: http://www.flabel.org/en/

78
several times in working groups to discuss interpretation issues and the Commission is currently working on a Q&A document and implementing rules.
C. Article 9.2 of the Audiovisual Media Services Directive (2010/13/EU)
In response to technological developments and innovations in the audiovisual media industry, the Audiovisual Media Services Directive (hereafter AVMSD)95 replaced and updated the Television Without Frontiers Directive (hereafter TVWFD)96 in 2007. Article 9.2 of this Directive encourages the Commission and Member States to develop codes of conduct regarding advertisements of foods and beverages that are high in certain nutrients to children, thereby for the first time addressing advertisements that specifically relate to unhealthy foods and children.97
The aim of this section is to provide an overview of the progress made on the development, adoption and implementation of Article 9.2 of the Audiovisual Media Services Directive. The question of how the Article was implemented in different Member States is addressed under the next evaluation question (section 3.3.2).
C.1. Development of Article 9.2 AVMSD
The White Paper (2007) stated that “Advertising and marketing are powerful sectors that aim to influence consumer behaviour. There is evidence that advertising and marketing of foods influence diet, and in particular those of children”. The Commission indicated that it preferred to respond to this issue by maintaining the voluntary approach at the European level as “it can potentially act quickly and effectively to tackle rising overweight and obesity rates”.
In line with the White Paper, the main motive for introducing Article 9.2 in the AVMSD was to limit the number of advertisements of so-called ‘unhealthy’ foods and beverages to children and thereby, to protect children from the influence of excessive advertising. The rationale is that reducing the number of advertisements on unhealthy products (in particular those high in fat, sugars, and/or salt) has the potential of affecting the intake of such products by children and thus of contributing to the prevention and reduction of childhood overweight and obesity.
C.2. Adoption of Article 9.2 AVMSD
Following an extensive consultation process from 2002 to 200598, the Commission first tabled a proposal for revision of the TVWFD in December 2005.99 Neither this first proposal nor the
95
2010/13/EU, which is a codified version of the initial Audiovisual Media Services Directive 2007/65/EU. 96
This Directive was first adopted in 1989 (Directive 89/552) and later amended in 1997 (Directive97/36). 97
Previously, the TVWF Directive contained Article 16 which stated that “advertising shall not cause moral or physical detriment to minors”. It laid down that advertisement, among others, (a) shall not directly exhort minors to buy a product or a service by exploiting their inexperience and (b) shall not directly encourage minors to persuade their parents or others to purchase the goods or services being advertised. 98
This consultation process included Discussion Paper by the Commission, public hearings, focus groups, written observations, etc. A detailed overview can be found here: http://ec.europa.eu/avpolicy/reg/history/consult/index_en.htm. 99
COM(2005) 646 final
79
Impact Assessment100 that was carried out to develop the proposal mentioned advertising of unhealthy foods and beverages to children. It was the European Parliament which in its first reading in December 2006 introduced this issue, namely in an amendment of, at that time, Article 3g. This was reflected in the second Commission proposal which was published in March 2007.101
The AVMSD was finally adopted on 29 November 2007.102 Subsequently, a codified version of the Directive was adopted on 15 February 2010. This codified version of the Directive mainly changed the numbering of the Directive and provides a consolidated set of Recitals.103 The final Article on this topic reads as follows:
“Member States and the Commission shall encourage media service providers to develop codes of conduct regarding inappropriate audiovisual commercial communications, accompanying or included in children’s programmes, of foods and beverages containing nutrients and substances with a nutritional or physiological effect, in particular those such as fat, trans-fatty acids, salt/sodium and sugars, excessive intakes of which in the overall diet are not recommended.”
The final Directive was to be transposed into national legislation by 19 December 2009.
Desk research and comments from a few interviewees reveal some criticism with regard to the ‘softness’ of the Article. This criticism mainly regarded the lack of definitions on the terms “encouragement”, “inappropriate” and “children’s programmes”. A few individuals argued that this kind of wording complicates the monitoring in practice. However, this was counteracted by those who claimed that the Article triggers a fear of regulation among economic operators, which is likely to encourage industry-led action. In addition, it was argued that stronger provisions on this topic would undermine the principle of subsidiarity.
C.3. Implementation of Article 9.2 AVMSD
Actions taken by the Commission
Article 9.2 states that both the Commission and Member States shall encourage media service providers to develop codes of conduct regarding inappropriate commercial communications of sugary, fatty or salty foods and beverages, accompanying or included in children’s programmes. To comply with this obligation, the Commission has organised several meetings and events.
The Commission organised two workshops104 in December 2009 and October 2010. The aim of these workshops was to bring together and encourage a dialogue between a range of stakeholders who otherwise would not have contact with each other. During each of the workshops, various actors provided presentations on a number of relevant topics. Also a number of national authorities presented the ways in which they implemented Article 9.2 of the AVMSD. Afterwards, stakeholders exchanged views and discussed the different topics.
100
SEC(2005) 1625/2 101
COM(2007) 170 final. 102
When the European Parliament approved the final amendments made by the Council. Source: http://europa.eu/rapid/press-release_IP-07-1809_en.htm?locale=en. 103
http://ec.europa.eu/avpolicy/reg/history/codecision/index_en.htm. 104
The Workshops were organised by DG CONNECT.

80
For the first workshop in 2009, a range of actors were invited, including audiovisual media service providers, advertising and food industry, regulators, Member States and NGOs.105 The workshop consisted of four panels, each discussing one of the following areas:
Existing self-regulatory mechanisms;
Initiatives undertaken by audiovisual media service providers;
The role of the regulatory authorities; and
Policy developments in the area of food advertising to children.
Some of the conclusions from this workshop were that there was a need for more similar events, and that there was a need to encourage better cooperation between audiovisual and health ministries.
The second workshop in 2010 was also attended by a wide range of actors (more than 70 in total), namely Commission representatives106, Member States’ representatives, representatives from the media advertising industry and food and consumer groups. This workshop consisted of four parts, focused on:
Policy framework - Health and consumer protection perspective;
Implementation of the AVMSD - Initiatives by the Member States;
Initiatives undertaken by audiovisual media service providers; and
Initiatives by the advertising industry.
This workshop concluded that the encouragement of codes of conduct in the area of food advertising to children is work in progress. It was also stated that the first application report was to show whether self-regulation in this area works well, or whether regulatory measures are necessary.
In addition to the workshops, the Commission had some bilateral meetings with representatives of media service providers and the advertising sector. According to the Commission official, there were attempts to organise similar organisations with consumer groups, but this has not yet been successful.
Lastly, Article 29 of the AVMSD lays down that a contact committee monitors the implementation of the Directive and the developments in the sector and serves as a forum for exchanges of views. There have been several contact committee meetings with responsible ministries from the Member States in 2009 and 2010, during some of which the implementation of Article 9.2 was discussed. The meeting minutes indeed reveal that the topic has been discussed several times, for example in relation to the application report of December 2011 (and the adoption of the table of transposition) and the second workshop organised by the Commission.
Actions taken by Member States
Based on information provided by the Member States (via questionnaires), the Commission reported for the first time on the application of a number of elements of the Directive in May 2012.107 Among others, it produced a table demonstrating the transposition of Article 9.2 into national legislation. The figure below provides a summary of the information available.
105
http://ec.europa.eu/avpolicy/reg/tvwf/advertising/codes/workshop/index_en.htm. 106
There were representatives from different Commission services: DG CONNECT, DG SANCO and DG RESEARCH. 107
http://ec.europa.eu/avpolicy/docs/reg/tvwf/contact_comm/35_minutes_en.pdf.

81
Figure 25: Transposition Article 9.2 AVMSD (2011)
Source: European Commission, Table of transposition of Art. 9.2 of Directive 2010/13/EU.
The report was based largely on information provided by Member States in response to a Commission questionnaire in 2011. The trends shown by the transposition table indicate that the majority of Member States (17) had some form of self-regulation in place. 9 Member States even had statutory regulation in place (in 5 of these Member States this was complemented with self-regulation). 7 Member States indicated they had neither statutory nor self-regulation; 4 of these had general provisions in the law that encouraged the development of codes of conduct regarding appropriate marketing techniques, but 3 had no provisions at all.108
With regard to the effectiveness of Member State actions, the implementation report concluded that, in order to strengthen the effectiveness of rules in particular with regard to the protection of minors:
“More effort needs to be made to create scale, support and best practice for codes of conduct on inappropriate commercial communications for food high in fat, salt or sugar targeting children. The effectiveness of such codes of conduct must be further assessed.”109
When the EU-level interviewees were asked about the effectiveness of Article 9.2 of the AVMSD, the majority of them felt they were not able to make a judgment. They felt that it was too early to draw conclusions, mainly due to the fact that there is still only limited pan-European data available. Interviewees also felt that the effective application of self-regulation is likely to depend to a significant extent on whether or not a tradition of self-regulation exists in a given Member State.
The next section of this report will shed more light on the impact of Article 9.2 of the AVMSD, by reviewing the available evidence on the adoption of codes of conduct in this area in the EU, as well as by looking specifically at the experience of a few selected Member States.
108
It must be noted that the regulatory provisions and self-regulatory codes of conduct are not necessarily a direct result of Article 9.2 of the AVMSD. Also other developments such as the EU Platform are likely to have contributed as well. 109
http://eur-lex.europa.eu/LexUriServ/LexUriServ.do?uri=COM:2012:0203:FIN:EN:PDF.

82
Conclusion
The EU institutions have developed and adopted all three pieces of legislation foreseen in the White Paper. In fact, the Nutrition and Health Claims Regulation was already adopted in 2006, before the adoption of the Strategy for Europe on Nutrition, Overweight and Obesity related health issues. The Food Information Regulation was adopted in 2011, more than three years after the initial Commission proposal was tabled in 2008. The Audiovisual Media Services Directive was adopted in 2007, shortly just after the Strategy was published.
All three laws have the potential to contribute to the objectives of the Strategy, in particular in terms of enhancing consumer information in order to enable them to make healthier food choices. However, the information collected for the evaluation also reveals a number of concerns and/or shortcomings that are likely to limit the ultimate impact. Thus, while the new legislation is certainly a step in the right direction in terms of enabling consumers to be better informed and avoiding misleading information, it is difficult to classify it as a ground-breaking development in the fight against nutrition, overweight and obesity related health issues.
The findings suggest that the Nutrition and Health Claims Regulation, and in particular the adoption of the list of permitted health claims, was perceived as an important step towards higher consumer protection. However, the implementation of certain key elements, such as the establishment of nutrient profiles and the assessment of claims made on botanicals, was severely delayed. Until today, this limits the effectiveness of the Regulation with regard to the improved provision of information to consumers and causes legal uncertainties for economic operators.
With regard to the Food Information Regulation, the evaluation found that especially the mandatory nutrition declaration, but also other consumer focused provisions are likely to significantly contribute to the aim of better information to consumers. Nevertheless, there were some concerns with regard to certain outcomes of the Regulation, which were the results of tough negotiations. According to the majority of stakeholders, the fact that the final Regulation does not mandate front of pack labelling reduced its (potential) effectiveness, since relevant research has shown that the majority of consumers are significantly less likely to read labels at the back of packs. Lastly, the provisions related to nutrition labelling to not enter into force until December 2016, which means that the main effects related to enhanced consumer protection will only become noticeable four years from now.
The inclusion of article 9.2 in the AVMSD has led many Member States to address this issue. However some doubts remain as to the effectiveness of self-regulatory approaches to food marketing for children. These are discussed in more detail under the next evaluation question.

83
4.3.2. Impact of AVMSD on self-regulation in marketing to children
Evaluation question 8
What has been the impact of the AVMSD on the development of self-regulatory approaches to marketing of HFSS food and beverages to children? Aspects to be studied should address both facilitating policies by MS and actions developed by the industry.
Actions and initiatives in EU-27
Information on self-regulatory codes of conduct in the field of food marketing to children is available from two main sources, namely the Commission implementation table (as discussed in the previous section) and the PolMark project.110 The latter was carried out by the International Association for the Study on Obesity and investigated policies in the area of food marketing to children. However, both of the sources use slightly different categories to classify the different countries in relation to the (kinds of) regulation and/or self-regulation in place. In addition, neither of them is completely up to date; the Commission implementation table is based on information provided by the Member States at the end of 2011 and the PolMark project is based on data acquired in 2009. As a result, the findings of these two sources are not directly comparable and also do not provide completely up to date information on the current situation in the EU Member States. In order to address this issue, the evaluation investigated the experience of a reduced sample of five Member States in more depth. The findings are described in the next section of this report.
The main findings of the PolMark project are summarised below. Please note that these findings do not specifically relate to the impact of Article 9.2 of the AVMSD alone, but constitute a more general assessment of the relevant initiatives undertaken by national authorities and industry organisations since 2006.
Government actions
The data from this PolMark study showed a clear change in the policy environment since 2006. The demand for action in the field of food advertising to children is increasing, and many governments explicitly expressed to favour (at least for the time being) self-regulation over statutory regulation (although the latter is also becoming more popular).111 The study stated that:
“There has been significant movement towards greater restriction on promotional marketing to children, achieved through a variety of means. Government-approved forms of self-regulation have been the dominant response, but statutory measures are increasingly being adopted.”
According to the findings of the study, all of the EU Member States had general government regulation that affects advertising to children or some form of marketing control, which affects food marketing to children to some extent. In addition, a number of Member States addressed the issue of food marketing to children via more specific self-regulatory measures, statutory regulation and/or other complementary instruments. The figure below provides an overview of the findings of the PolMark project with regard to the occurrence of different approaches across the EU.
110
The study covered both the EU and the wide WHO European region. Source: The PolMark project, Policies on marketing food and beverages to children, final report July 2010. URL: http://www.iaso.org/site_media/uploads/The_PolMark_Project_Final_Report_Annex_1_FINAL.pdf. 111
However, the study also underlined the increase in statutory approaches, which are considered as a feasible policy option by an increasing number of countries.

84
Table 6: EU Member States’ actions on food marketing to children
General government
regulation *
Explicit statement in national health
policy $
Explicit statutory regulation
Explicit guidelines
Approved self-regulation
Potential / planned future
action ***
Austria Y Y
Belgium Y Y Y IND Y
Bulgaria Y Y UC
Cyprus Y UC
Czech Republic
Y
Denmark Y Y Y IND
Estonia Y
Finland Y Y Y
France Y Y Y WG UC
Germany Y Y Y IND'' UC
Greece Y Y draft
Hungary Y
Ireland Y Y Y Y
Italy Y Y
Latvia Y
Lithuania Y UC
Luxembourg Y
Malta Y UC
Netherlands Y Y Y IND Y
Poland Y
Portugal Y Y Y IND UC
Romania Y
Slovakia Y
Slovenia Y UC
Spain Y Y Y WG Y
Sweden Y
UK Y Y Y Y WG Y
Total 27 12 3 1 8 14
* Regulation that affects all advertising to children, or some form of marketing control, and therefore affects
food marketing to children $ Action is recommended in a policy or action plan (including those commissioned by government and
prepared by independent experts), which may or may not have been implemented; “health” policy could also mean nutrition and/or obesity policy
" The government has not yet stated that they “approve” the code, which was released in June 2009. WG The development of the self-regulatory code and/or implementation of the code is with government
involvement IND Self-regulation is independent of government, but has been designated by government as the current
means to address advertising to children ** Industry self-regulatory code or commitment that is entirely independent of government policy, but may, if
designated with a #, form part of government policy # Self-regulatory code is part of government policy *** Some form of governmental body is discussing developing or changing a policy on food marketing to
children **** In the case of the EU 27, this refers to the EU Pledge UC Action is under consideration; Y implies that action is clearly planned or underway & Not official government policy, but of the government-appointed yet independent Children's Ombudsman
and Consumer Spokesman
Source: Final Report the PolMark project, 2010

85
The category “approved self-regulation” referred to self-regulation that had been developed in collaboration with (or at the request of) governments. The study reported that out of the 8 Member States that had approved self-regulation, 5 Member States had self-regulation that was independent of government, but had been “designated by government as the current means to address advertising to children”. 3 of them had self-regulatory codes that were developed with government involvement.
For those countries who reported to have planned future actions, 8 were still considering taking action, while 6 Member States had concrete plans underway.
Private actions
With regard to private actions, the PolMark project reported that all 27 EU Member States were part of the EU Pledge, and thus had a voluntary commitment in place. In addition, many of the Member States had a self-regulatory code on food, and/or self-regulatory bodies with a general code on children. The number of Member States in each of these categories is illustrated in the table overleaf.

86
Table 7: Private actions on food marketing to children
Voluntary industry
commitment ****
Self-regulatory food code
Self-regulatory body with general child code
Austria Y Y
Belgium Y Y # Y
Bulgaria Y Y
Cyprus Y
Czech Republic
Y Y Y
Denmark Y Y
Estonia Y
Finland Y Y
France Y Y Y
Germany Y Y Y
Greece Y Y Y
Hungary Y Y Y
Ireland Y Y Y
Italy Y Y Y
Latvia Y
Lithuania Y Y
Luxembourg Y Y
Malta Y
Netherlands Y Y # Y
Poland Y Y
Portugal Y Y # Y
Romania Y Y Y
Slovakia Y Y (TBA) Y
Slovenia Y Y
Spain Y Y # Y
Sweden Y Y
UK Y Y Y
Total 27 16 21
* Regulation that affects all advertising to children, or some form of marketing control, and therefore affects
food marketing to children $ Action is recommended in a policy or action plan (including those commissioned by government and
prepared by independent experts), which may or may not have been implemented; “health” policy could also mean nutrition and/or obesity policy
" The government has not yet stated that they “approve” the code, which was released in June 2009. WG The development of the self-regulatory code and/or implementation of the code is with government
involvement IND Self-regulation is independent of government, but has been designated by government as the current
means to address advertising to children ** Industry self-regulatory code or commitment that is entirely independent of government policy, but may, if
designated with a #, form part of government policy # Self-regulatory code is part of government policy *** Some form of governmental body is discussing developing or changing a policy on food marketing to
children **** In the case of the EU 27, this refers to the EU Pledge UC Action is under consideration; Y implies that action is clearly planned or underway & Not official government policy, but of the government-appointed yet independent Children's Ombudsman
and Consumer Spokesman
Source: Final Report the PolMark project, 2010.

87
The PolMark study found that while there is a general trend towards more self-regulation in the area of food advertising to children, there are significant variations in the way in which this topic is being address in the various Member States. Not only were there different forms of self-regulation observed (i.e. codes approved by governments, codes developed independent of governments, and national and international pledges), also the specific restrictions on food marketing to children varied significantly.
Sampled countries
In order to gain insight into the way in which Article 9.2 was implemented in practice, the evaluation team sampled five countries (based on geographical location and level of activity in the area of advertising of unhealthy foods and beverages to children) to investigate the development, application and effectiveness of the Article. The remainder of this section will elaborate on the key findings in relation to initiatives and actions by the public sector and by the private sector, and the perceived effectiveness of the self-regulatory approaches in these countries. For a more detailed report on each of the five countries, please refer to Annex 3.1.
Initiatives and actions by the public sector
The analysis of the sample of countries showed that while some Member States clearly attempt to stimulate the development of self-regulatory codes of conduct in the area of advertising of unhealthy foods and beverages to children112, others are less pro-active in doing so. For example, in Germany an action plan called “In Form” called upon the industry to develop a code of conduct for food advertising to children. The Portuguese Ministry of Health created the “National Platform against Obesity”, thereby approving and facilitating self-regulation. Also the Danish Ministry of Fisheries, Agriculture, and Foods agreed that it was willing to try out the self-regulatory approach at least for the time being. At the same time, the national authorities in all three countries warned the industry that it would monitor food marketing practices to children closely and consider legislation if self-regulation would not yield satisfactory results. In contrast, in Hungary for example, none of the interviewees were aware of any actions undertaken by their government to develop such a self-regulatory approach.
Aside from the self-regulatory approaches, all five countries have some form of statutory legislation in place. However, the statutory restrictions differ substantially across the Member States. For example, while the Hungarian Media Law (Act 82/210) and the Hungarian Advertising Act No. XLVIII) only prohibit advertisements capable of harming the development of children in general (without specifically mentioning food or beverages), the Portuguese Audiovisual Media Services Law (No 27/2007) is much more explicit and forbids any potentially harmful commercial messages to children, including those related to “foods and beverages containing nutrients and substances [...] excessive intakes of which in the diet are not recommended” during the exhibition of children’s programmes.
With regard to the impact of Article 9.2 of the AVMSD on the development of these self-regulatory approaches, the findings show that the Article had some influence, as it helped to raise awareness of the issue of advertisements of unhealthy foods and beverages to children and contributed to the (further) development of self-regulatory approaches in certain Member States. For example, the German code of conduct was developed partly in response to an action plan by the German government on healthy nutrition and physical activity, and partly in response to the adoption of Article 9.2 of the AVMSD. Also in Portugal, the Article was
112
Self-regulatory approaches in the field of food advertising to children fell in some countries under the responsibility of the Ministry of Health and in others the Ministry of Fisheries, Agriculture and Food or Food, Agriculture and Consumer Protection.

88
mentioned to be one among several factors that stimulated the development of self-regulatory initiatives. However, it should be noted that in none of the five sampled countries, Article 9.2 was the only factor triggering these developments and a few interviewees even noted that the Article 9.2 had not played a role at all.
Initiatives and actions by the private sector
Self-regulatory codes of conduct in relation to commercial communications of (unhealthy) foods and beverages to children exist in 4 out of the 5 countries (all of which were updated after the introduction of Article 9.2 of the AVMSD). In Italy, Article 11 of the “Code of Advertising Self-Regulation” (latest revision in 2004) states that special care should be taken in messages directed towards children so as not to cause any harm or exploit their inexperience. However, no explicit reference is made with regard to advertisements of foods or beverages.113
The table below provides a summary of the self-regulatory codes of conduct in each of the sampled countries. It shows that Denmark is the only country with common nutrient profiles in place. These nutrient profiles define criteria on the content of fat, sugars and salt for 10 categories of food. The codes in Germany, Portugal and Hungary do not specifically mention unhealthy foods and beverages but apply to foods and beverages in general. The definitions of “children” differed to a small extent between the countries.
Table 8: Self-regulatory codes of conduct on the advertising of food and beverages to children
Denmark Germany Hungary Italy Portugal
Self-regulatory code of conduct
“Code for Responsible Food Marketing Communica-tion to Children”
“Code of Conduct on Commercial Communica-tion for Foods and Beverages”
“Code of Advertising Ethics”
“Code of Advertising Self-Regulation”
“Portuguese Pledge against Childhood Obesity”
114
Effective since
January 2008 July 2009 September 2009
August 2012, Art. 11: 2004
November 2009
Definition of “unhealthy food and beverages”
Yes No No N/A No
Definition of “children”
Up to the age of 13
Up to the age of 12
Up to the age of 12
N/A Up to the age of 12
The content of the self-regulatory codes of conduct (some of which are based on the International Chamber of Commerce (ICC) Code) vary quite significantly across the different countries. There were substantial differences in relation to the restrictions in place. While the Danish code of conduct prohibits the marketing of unhealthy foods (i.e. those high in fat, sugars and/or salt) towards children, the German code of conduct only prohibit certain marketing techniques, such as the use of animated characters of personalities. The signatories of the Portuguese Pledge committed to refrain from advertising in programmes where 50% or more of
113
The Italian code only very generally stipulates that messages towards children should not suggest adopting poor eating habits or neglecting healthy lifestyles. 114
In addition to the Portuguese Pledge, there is a more general self-regulatory code called the “Self-Regulatory Code for Commercial Communication for Food and Beverages” which is effective since May 2010.
89
the audience are below the age of 12 (some signatories maintain a stricter audience threshold of 35%). The nutritional criteria are set by the individual companies. Lastly, the Hungarian code of conduct provides that one should ensure clear differentiation between edited content and commercial promotion, avoid using children’s imagination, and avoid the broadcasting of advertisements with characters from children’s programmes in the environment of the same programme. The codes of conduct apply to a variety of media channels, including (depending per code of conduct) TV, print, radio, internet, schools, social media and sponsorships.
Perceived effectiveness
Most national authorities in the sample of countries indicated to be satisfied with the approach taken in relation to the issue of food advertisements to children. A German official, for example, noted that a complete ban of food marketing to children would be inappropriate and violate the principle of freedom of expression. Therefore, the official was of the opinion that preventing inappropriate forms of marketing was a much more proportionate approach to the issue at hand. A Danish official noted that the fact that operators developed the code themselves led to a better understanding of the importance of the issue and enhanced ownership of the rules. With regard to peer pressure, the Danish official explained that because industry actors want to avoid competitive advantages, they would report each other in cases of non-compliance. Another advantage mentioned by a government official was that the financial burden of self-regulation on the state is much lower than that of a regulatory approach. The Portuguese official felt that due to peer pressure and the enhanced attention at the European level, the issue of food advertising to children is taken increasingly more serious by industry actors.
However, while being satisfied with the approach taken in general, government officials did have some concerns with regard to the coverage and strictness of codes. For example, there were some concerns with regard to the low coverage (in terms of media covered and companies that subscribed to the code) and/or the strictness of the codes. In relation to the strictness of codes, one interviewee noted that while the Portuguese national authorities had taken clear actions to stimulate the self-regulatory approach, it could also contribute to developing guidelines of what foods are to be considered as “unhealthy”. A Hungarian representative noted that the public awareness of the possibility to file complaints was too low and needed to be addressed. As said, in light of concerns regarding the effectiveness of codes, the Danish, German and Portuguese officials stated that they continue to monitor the situation and reserve the right to take additional measures when deemed necessary, which constitutes an incentive for the industry to continue to make serious efforts and improve codes of conduct where necessary.
While few interviewees felt able to comment on the actual impact of self-regulatory codes of conduct on children’s exposure to (unhealthy) food and beverages advertisements, the Danish official noted that, while it was not possible to make a quantified estimate, there was likely to be a slight rather than large improvement, as there were already a lower number of such advertisements on the Danish television to begin with.
Industry actors generally felt that the codes of conduct are indeed effective and referred to the consistently high compliance rates and the low number of complaints. The Hungarian industry representative felt that this low number of complaints is a result of the code being clear and effective, and the fact that there were few violations of the code. The Danish industry representative noted that in the few instances of non-compliance, economic operators are often unaware of their non-compliance rather than unwilling to comply. In this respect, the interviewee pointed to the on-going efforts of the responsible Forum to keep members updated and aware of the code and the spot-checking exercises that are conducted on a regular basis, but also to continuous efforts to improve the effectiveness of the code (for example to include cinemas in the scope of the code). According to several industry representatives, one of the main advantages of the self-regulatory approach is that it can react much faster to rapid technological

90
developments than a statutory approach. Another advantage mentioned by one of the interviewees was that because of the participatory approach, companies are less inclined to try to evade the rules.
Civil society representatives were generally less optimistic about the effectiveness of the codes of conduct. While a representatives of a consumer and a health organisation were positive about the developments in Portugal and noted that there has been a substantial reduction in the number of advertisements of unhealthy foods and beverages, representatives from similar organisations in other countries felt that there are a number of challenges that prevent the codes from being effective in reducing children’s exposure to such advertisements. Some representatives mentioned similar concerns as representatives of national authorities, and stated that the codes are too soft or too general. In addition, a Hungarian civil society representative considered the low number of complaints to be a consequence of people not being used to or aware that they can complain in cases of non-compliance. Also the economic crisis was mentioned by Hungarian organisations as being an important obstacle. It was argued that as the attention shifted to economic issues, the efforts from the industry weakened.115 In Germany, a study conducted by researchers from the University of Hamburg concluded that “the exposure to commercials for non-core foods and the use of techniques attractive to children are widespread and appear to have remained unaffected by [self-regulatory commitments]”. In addition, several interviewees felt that, while the codes of conduct were a step in the right direction in contributing to the objectives of the Strategy, there was a need for additional measures, for example related to the education of children or awareness raising among consumers in general.
Considering the limitations of the codes of conduct, Hungarian civil society representatives indicated to be strongly in favour of statutory legislation. Also consumer organisations in Germany indicated that they continue to push for more far-reaching rules that would mean that certain foods can no longer be advertised to children at all.
Conclusion
The available information on the situation in the EU-27 suggests that in the majority of Member States, self-regulation to address the issue of marketing to children has been developed. Some Member States (also) rely on statutory regulation, and only very few Member States had no provisions at all. The detailed assessment of the situation in five selected Member States suggests that article 9.2 of the AVMSD often inspired and contributed to the development or updating of self-regulatory approaches to this issue, but it was rarely the only factor. On-going debates at the national level, as well as the creation of the EU Platform and self-regulatory commitments within it, have also been important factors.
In four out of the five countries that were analysed, specific codes of conduct for food marketing to children were developed, or existing codes updated and expanded with new rules on this, following the adoption of the AVMSD. Nevertheless, the analysis shows a variety of self-regulatory approaches; namely codes of conduct developed with the involvement of governments, codes developed independently of governments, and Pledges both at national and European level. There were also large discrepancies in the exact coverage and level of strictness of the different self-regulatory instruments across the EU. Most importantly, these differences related to:
Restrictions in place: there were clear differences in the restrictions that were imposed by the different codes. While some Member States completely ban advertisements of
115
While the economic crisis was also mentioned by the Portuguese representative, it was not perceived to be as big as an obstacle as in Hungary.

91
unhealthy foods and beverages to children, others only place restrictions on the use of certain techniques, such as the use (animated) characters or personalities.
Definition of ‘unhealthy’: in only one Member State ‘unhealthy foods and beverages’ was defined by specific nutrient profiles. While some Member States mentioned ‘foods and beverages with high contents of sugars, fat or salt’, others only provided guidelines for marketing of foods and beverages in general.
Definition of ‘children’: there were some differences in the way in which Member States defined children (for example those younger than 12 or 13 years old). Some codes of conduct did not provide any definition at all.
Coverage of the codes: there were some variations in the different media services that were covered in the code, and the coverage of companies in the code.
With regard to the effectiveness of the codes, industry representatives described the high compliance rates and the low number of complaints as signs of effectiveness. However, while recognising the progress made, some government and civil society representatives had concerns about the low coverage and/or strictness of certain codes. The PolMark project concluded that in order to be able to assess the real effectiveness of codes of conducts, there is a need for clearer objectives and better monitoring and evaluation mechanisms. It stated that “a lack of agreed exposure or outcome indicators makes it difficult to compare and contrast the effects of different approaches”. However, the concerns regarding the low coverage and strictness of codes in combination with some anecdotal evidence provided by interviewees suggests that at least in some cases, the codes did not have a significant impact on actual advertising practices.

92
4.4. EU policy integration
The question to be addressed under this theme relates to the extent to which DG SANCO has been able to integrate (or ‘mainstream’) nutrition, obesity and physical activity (NOPA) concerns into EU policies in areas other than health policy. The respective key expected outputs and outcomes they are meant to contribute to are shown in the diagram below, which represents an excerpt from the intervention logic for the implementation of the EU Strategy that was developed for this evaluation (for the full version see the inception report).
Figure 26: Excerpt from the intervention logic – EU policy integration
4.4.1. Integration of the NOPA dimension in EU policies
valuation question 9:
To what extent has the DG SANCO been successful in integrating Nutrition and Physical Activity dimensions in different EU policies?
Concrete measures by DG SANCO to raise awareness of the Nutrition Strategy and influence other EC services In accordance with the ‘Health in all Policies’ (HIAP) principle, the Strategy aims to ensure an adequate contribution of relevant EU policies (among others youth, education, sport, transport, agriculture) to the objectives in the field of nutrition, obesity and physical activity (NOPA). In other words, Commission policies in areas other than health which do not have as a primary goal to reduce overweight and obesity may be marshalled towards the purpose of contributing to improving nutrition and preventing overweight and obesity.
European Commission
Outputs Instruments Outcomes
EU policies: Education, transport, regional policy,etc.
NOPA integrated into other policies
Priority areas
Better informed consumers
Healthy options available
Physical activity encouraged
Evidence base for policy-making
Priority groups targeted
Effective monitoring systems

93
The shared view of DG SANCO officials interviewed is that the main achievement in relation to the integration of relevant EU policies is having made other Commission services aware of the work carried out as part of the NOPA Strategy, and of the opportunities for collaboration. This argument is supported by the majority of Commission officials in other DGs, some of whom confirmed that when they started working in the respective relevant programmes they were not aware of the NOPA Strategy and that it was DG SANCO which introduced them to it and to the possibilities for collaboration.
Cooperation between DG SANCO and other DGs has mainly taken shape through mutual participation in Inter-Service Steering Groups for evaluation studies and impact assessments (IAs) and meetings and exchanges of a more informal nature. These have proved important to highlight the different perspectives and priorities that each DG brings to the table, and to provide and receive updates on progress made on different fronts.
The meetings of the High Level Group and of the EU Platform for Action on Diet, Physical Activity and Health have also offered opportunities for DG SANCO to invite other Commission services to present their initiatives, by for example discussing the results of relevant projects or programmes (e.g. RTD FP7 funded project EATWELL, or DG AGRI’s School Fruit Scheme).
Conferences and workshops have also been organised by DG SANCO where other DGs were invited (see example box above on the High Level Conference on Monitoring and Evaluation of EU and MS NOPA strategies), and likewise DG SANCO has taken part in events hosted by other Commission Services.
According to DG SANCO interviewees, collaboration on NOPA issues has been most fruitful with the following DGs:
DG AGRI (in particular with Commission officers implementing the School Fruit Scheme, but also those responsible for the School Milk Scheme and the Free Food for the Most Deprived Programme);
DG SANCO (Food Labelling and Health and Nutrition Claims initiatives);
DG CONNECT (the enforcement of Article 9(2) of the AVMSD on codes of conduct for advertising unhealthy food to children);
DG RTD (FP7-funded research projects in the areas of food, nutrition, obesity and health-related diseases);
JRC (Nutrition activity group in the Institute for Health and Consumer Protection);
EAC (funding for selected Preparatory actions in the field of HEPA);
EUROSTAT (provision of statistics on BMI and related health determinants in the framework of the European Health Interview System).
The majority of the initiatives listed above are covered in detail in other parts of the report. The boxes below provide an overview of recent changes to the School Milk Scheme, and the work carried out by the JRC.
High Level Conference on Monitoring and Evaluation of EU and MS NOPA strategies A successful example of inter-service collaboration was on occasion of the implementation progress report of the Strategy which was published in 2010. DG SANCO worked closely with other DGs in the planning of the conference to announce the main findings of the report, and included presenters from DG AGRI and DG RTD and from EU funded projects (FOOD, funded by the Health Programme). Working groups were organised which focused on different priorities of the Strategy –one of them being Health in all Policies and the challenges from a NOPA perspective. The conference was a useful opportunity to reflect on key achievements and future challenges and to emphasize the importance of engaging other DGs in potential health gains.
High Level Conference on Monitoring and Evaluation of EU and MS NOPA strategies A successful example of inter-service collaboration was on occasion of the implementation progress report of the Strategy which was published in 2010. DG SANCO worked closely with other DGs in the planning of the conference to announce the main findings of the report, and included presenters from DG AGRI and DG RTD and from EU funded projects (FOOD, funded by the Health Programme). Working groups were organised which focused on different priorities of the Strategy –one of them being Health in all Policies and the challenges from a NOPA perspective. The conference was a useful opportunity to reflect on key achievements and future challenges and to emphasize the importance of engaging other DGs in potential health gains.
94
The recent evolution of the School Milk Scheme
Since 1977, the EU School Milk Scheme (SMS) has made grants available for the sale of reduced-rate dairy products in schools, in order to encourage their consumption by children. The SMS was reviewed in 2008, and as part of this reform a greater emphasis was placed on aspects related to overweight and obesity prevention and related health issues. Thus, the selection criteria for the list of eligible products now includes health related elements, such as a limitation of added sugars to a maximum of 7% and the opening of the programme to a whole range of low fat milk products. It is also worth noting that the SMS also has an educational character, and that since the latest review of the programme, secondary schools have the same access to the scheme as nursery schools, other pre-school establishments and primary schools. According to DG AGRI, these changes constitute proof that NOPA concerns were indeed integrated into the SMS to a greater extent in recent years, due at least partly to the publication of the 2007 Strategy.
Nutrition activity in the Institute for Health and Consumer Protection (JRC)
The main objective of the nutrition activity at the JRC is to provide advice to the Commission, the European Parliament and the Member States and to be in the frontline when scientific advice is needed. During the first years after the nutrition activity group at the JRC was set up, the aim was to develop a support capacity. From 2011 onwards, the group consolidated its position and there were a series of NOPA-related milestones achieved. In terms of regular activities, the group attends and follows-up HLG and Platform meetings and publishes the bi-monthly Nutrition Research Highlights newsletter. Recent examples of research articles, workshops and projects include:
o the elaboration of an informative booklet and CD for a nationwide campaign in Romania against childhood obesity;
o the organisation of a workshop on the topic of science support to policy makers in addressing nutritional challenges in Europe;
o the development of a Foresight Study “Tomorrow’s healthy society –research priorities for foods and diets” commissioned by DG RTD;
o the participation in other research projects (i.e. FP7-funded project “PATHWAY.
On the other hand, little or no progress seems to have been made in the relationship and common topics with DG MOVE, DG REGIO and DG EMPL, in spite of the fact that they are responsible for potentially relevant policies, namely:
DG MOVE (Transport for health urban environments): Measures related to safe walking and cycling are documented by DG MOVE in the 2010 Strategy implementation report, including:
o approximately 130 measures related to safe walking and cycling within the framework of the CIVITAS Initiative;
o 10 cycling projects within the framework of the STEER component of the Intelligent Energy Europe Programme.
Despite the progress documented, DG SANCO officers confirmed that collaboration between the DGs in this policy area was largely non-existent. The reasons behind this lack of cooperation were not clear, but one argument was that actions in this area were not as clearly outlined as was the case in other areas, so it was difficult to follow up.
DG REGIO (European Regional Development Fund): With the aim of investing in health to foster competitiveness and productivity, and administrative capacity-building, EUR 5billion of ERDF funding were allocated for health infrastructure investment in 2007-13. It was not possible for the evaluation to identify if there were any NOPA relevant projects funded, and

95
DG SANCO officers confirmed that there was no collaboration with DG REGIO services in the framework of the Strategy.
DG EMPL (European Social Fund): The ESF funds health activities linked to ageing, e-health, health promotion and training. It was not possible for the evaluation to identify if any NOPA relevant projects were funded, and DG SANCO officials confirmed that there was little collaboration with DG EMPL services in the framework of the Strategy. Participation of DG SANCO in at least two IA Inter-Service Steering Groups commissioned by DG EMPL was confirmed by the evaluation team, and the development of a joint IA report between the two DGs on “Communication – Solidarity in health – Reducing health inequalities in the EU” carried out in 2009.
The reasons behind these differences in the intensity of inter-DG collaboration are not clear, but experience shows that split lines of communication between DGs (i.e. when there is more than one Unit responsible for the relation with another DG) tends to be counterproductive, as it can generate confusion. Also, collaboration tends to be better if framed in a concrete programme or initiative. As highlighted by one interviewee:
“EU funded programmes are very important factors contributing to meet the objectives of the Strategy. The financial dimension is key and translates into money available to beneficiaries (i.e. research consortia, Member States, etc.) that is not available at DG SANCO.”
In view of DG SANCO interviewees, future challenges lie in further consolidating successful collaboration ties, but also working more closely with those services with whom cooperation has been more irregular, and identifying new partners, such as DG ENV and CLIMA –regarding the production and consumption of healthy and sustainable diets. However, interviewees agreed that priority choices have to be made when it comes to potential collaboration opportunities. Resources are scarce and Commission officials involved have difficulties to find the time to be represented in meetings and understanding the programmes.
Proportion of relevant EC Impact Assessments (IAs) that consider impacts on nutrition, obesity and overweight, or physical activity levels
One of the key vehicles to achieve policy integration is the EC’s IA system, which is intended to allow policy-makers to consider a wide range of potential positive or negative impacts of regulatory as well as non-regulatory proposals in an integrated way. A systematic screening and analysis of Commission IAs produced between 2007 and 2011 was carried out by the evaluation team to review the extent to which they consider any impacts related to NOPA. The process that was followed is summarized below:
We screened the titles of all (more than 400) IAs produced between 2007 and 2011, and identified 52 for which, given their broad subject area, the NOPA dimension could potentially be relevant.
Summaries of these 52 IA reports were reviewed by a panel of five experts (three EU evaluation / IA experts, one expert on nutrition and diet and one on physical activity), who were asked to judge the relevance of the NOPA dimension in each case.
o Where there was near consensus among the panel (at least four of the five agreed), the IAs were classified as clearly relevant from a NOPA perspective. This was the case of 18 IAs.
o IAs were there was a difference of opinion (two or three experts felt the NOPA dimension was relevant) were classified as potentially relevant. This was the case of 17 IAs.

96
o The remainder, for which none or only one of the experts saw the NOPA dimension as relevant, were discarded as irrelevant from the further analysis.
We then analysed the 35 IAs for which the NOPA dimension was found to be clearly or potentially relevant in more detail, to assess the extent to which this dimension was taken into account in the reports, and, where relevant, possible reasons for its exclusion (see figure 27 below for the distribution of IAs per DG in the final sample).
Figure 27: Distribution of clearly relevant and potentially relevant IAs per DG
1. IA reports where the NOPA dimension was considered to be clearly relevant
DG SANCO formed part of the Inter-Service Steering Groups of at least 13 of the IA reports where the NOPA dimension was judged as clearly relevant, acting as the lead DG in 6 of them. There are only 2 IA reports in the list that did not have a representative of DG SANCO in the ISSG.
Of the 18 reports where the NOPA dimension was judged to be clearly relevant by the evaluation team, 13 of them did actually contain at least a mention and, in 8 cases, a qualitative analysis of possible NOPA impacts.
A closer analysis of the remaining 5 IAs that did not mention NOPA impacts led to the conclusion that it would have been relevant for the authors to consider NOPA related impacts in all 5 cases. Two examples are provided below:
o Proposal for a Regulation establishing a Health for Growth Programme, the third programme of EU action in the field of health for the period 2014-2020 (DG SANCO): any decision on the shape and reach of the future Health Programme is expected to impact on the NOPA dimension.
o Proposal for a Decision establishing a multiannual Community programme on protecting children using the Internet and other communication technologies (DG CONNECT): online advertising can include marketing of unhealthy food, tobacco and alcohol. Information and/or encouragement of eating disorders such as anorexia is another potential risk. Lower level of physical activity as a result of over-exposure to the Internet is yet another serious problem that impacts on the NOPA dimension.
The table below provides an overview of the IA reports in this category.
0
1
2
3
4
5
6
7
8
9NOPA clearly relevant NOPA potentially relevant
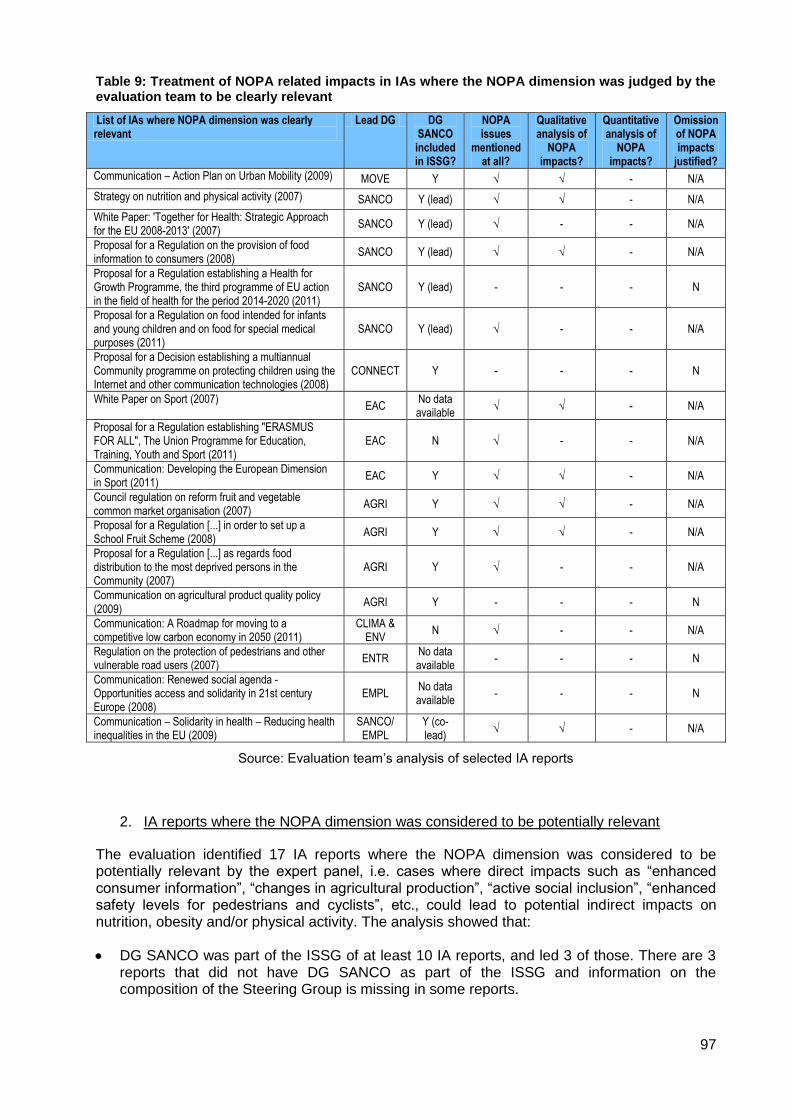
97
Table 9: Treatment of NOPA related impacts in IAs where the NOPA dimension was judged by the evaluation team to be clearly relevant
List of IAs where NOPA dimension was clearly relevant
Lead DG DG SANCO included in ISSG?
NOPA issues
mentioned at all?
Qualitative analysis of
NOPA impacts?
Quantitative analysis of
NOPA impacts?
Omission of NOPA impacts
justified?
Communication – Action Plan on Urban Mobility (2009) MOVE Y √ √ - N/A
Strategy on nutrition and physical activity (2007) SANCO Y (lead) √ √ - N/A
White Paper: 'Together for Health: Strategic Approach for the EU 2008-2013' (2007)
SANCO Y (lead) √ - - N/A
Proposal for a Regulation on the provision of food information to consumers (2008)
SANCO Y (lead) √ √ - N/A
Proposal for a Regulation establishing a Health for Growth Programme, the third programme of EU action in the field of health for the period 2014-2020 (2011)
SANCO Y (lead) - - - N
Proposal for a Regulation on food intended for infants and young children and on food for special medical purposes (2011)
SANCO Y (lead) √ - - N/A
Proposal for a Decision establishing a multiannual Community programme on protecting children using the Internet and other communication technologies (2008)
CONNECT Y - - - N
White Paper on Sport (2007) EAC
No data available
√ √ - N/A
Proposal for a Regulation establishing "ERASMUS FOR ALL", The Union Programme for Education, Training, Youth and Sport (2011)
EAC N √ - - N/A
Communication: Developing the European Dimension in Sport (2011)
EAC Y √ √ - N/A
Council regulation on reform fruit and vegetable common market organisation (2007)
AGRI Y √ √ - N/A
Proposal for a Regulation [...] in order to set up a School Fruit Scheme (2008)
AGRI Y √ √ - N/A
Proposal for a Regulation [...] as regards food distribution to the most deprived persons in the Community (2007)
AGRI Y √ - - N/A
Communication on agricultural product quality policy (2009)
AGRI Y - - - N
Communication: A Roadmap for moving to a competitive low carbon economy in 2050 (2011)
CLIMA & ENV
N √ - - N/A
Regulation on the protection of pedestrians and other vulnerable road users (2007)
ENTR No data available
- - - N
Communication: Renewed social agenda - Opportunities access and solidarity in 21st century Europe (2008)
EMPL No data available
- - - N
Communication – Solidarity in health – Reducing health inequalities in the EU (2009)
SANCO/ EMPL
Y (co-lead)
√ √ - N/A
Source: Evaluation team’s analysis of selected IA reports
2. IA reports where the NOPA dimension was considered to be potentially relevant
The evaluation identified 17 IA reports where the NOPA dimension was considered to be potentially relevant by the expert panel, i.e. cases where direct impacts such as “enhanced consumer information”, “changes in agricultural production”, “active social inclusion”, “enhanced safety levels for pedestrians and cyclists”, etc., could lead to potential indirect impacts on nutrition, obesity and/or physical activity. The analysis showed that:
DG SANCO was part of the ISSG of at least 10 IA reports, and led 3 of those. There are 3 reports that did not have DG SANCO as part of the ISSG and information on the composition of the Steering Group is missing in some reports.

98
Only 4 reports in this group mentioned NOPA impacts, none of which considered these impacts in more detail.
A closer look at the remaining 13 reports that did not mention NOPA impacts led the evaluation team to conclude that even though the omission of NOPA impacts was probably justified in 5 reports, it could have been useful to take these into account in 8 reports.
Examples of reports where the omission was justified include:
o EU Consumer Policy Strategy 2007-2013 (DG SANCO): Consumer education and information is among the social impacts assessed, but this is mainly related to citizens’ rights as consumers and the potentialities of cross-border transaction and does not touch on health-related issues.
o Proposal for a Regulation establishing rules for direct payments to farmers under support schemes within the framework of the common agricultural policy (DG AGRI): The policy options are aimed at building a more competitive and sustainable agriculture in the EU. Even though it could be argued that changes in production patterns could affect the price of agricultural products, which in turn can have health impacts, this is a very indirect link and NOPA impacts are potentially far away in the impact chain.
Examples of reports where NOPA related impacts should have been mentioned include: o Report from the Commission – Options for animal welfare labelling and the
establishment of a European Network of Reference Centres for the protection and welfare of animals (DG SANCO): Even though the report does not consider NOPA related impacts, it does argue that an overdose of information could lead consumers to confusion. It is the view of the evaluation team that another label could confuse consumers and detract them from nutrition labelling.
o Communication on the Community strategy 2007-2012 on health and safety at work (DG
EMPL): Working conditions that affect health include sedentary behaviour and lack of physical activity, both of which ultimately have an impact that is relevant from the NOPA point of view.
The table below offers an overview of the IA reports in this category.
Table 10: Treatment of NOPA related impacts in IAs where the NOPA dimension was considered to be potentially relevant
List of IAs where NOPA dimension was potentially relevant
DG DG SANCO included in ISSG?
NOPA issues
mentioned at all?
Qualitative analysis of NOPA impacts?
Quantitative analysis of
NOPA impacts?
Omission of NOPA impacts
justified?
EU Consumer Policy Strategy 2007-2013 (2007) SANCO Y (lead) - - - Y
Proposal for a Regulation on novel foods and amending Regulation (EC)No XXX/XXXX (common procedure) (2008)
SANCO Y (lead) √ - - N/A
Report from the Commission – Options for animal welfare labelling and the establishment of a European Network of Reference Centres for the protection and welfare of animals (2009)
SANCO Y (lead) - - - N
Communication: An EU Strategy for Youth - Investing and Empowering. A renewed open method of coordination to address youth challenges and opportunities (2009)
EAC Y √ - - N/A
Proposal for a Recommendation on policies to reduce early school leaving (2011)
EAC N - - - N
Communication: 'Towards joint programming in research: Working together to tackle common challenges more effectively' (2008)
RTD N - - - N

99
List of IAs where NOPA dimension was potentially relevant
DG DG SANCO included in ISSG?
NOPA issues
mentioned at all?
Qualitative analysis of NOPA impacts?
Quantitative analysis of
NOPA impacts?
Omission of NOPA impacts
justified?
Communication – Horizon 2020 – the Framework Programme for Research and Innovation (2011)
RTD N - - - Y
Legislative proposals following the Communication on the 'Health Check' in the Common Agricultural Policy (2008)
AGRI No data available
- - - N
Proposal for a Regulation on agricultural product quality schemes: 1) Traditional Specialities Guaranteed (2010)
AGRI Y - - - Y
Proposal for a Regulation establishing rules for direct payments to farmers under support schemes within the framework of the common agricultural policy (2011)
AGRI No data available
- - - Y
Communication - Innovation for a sustainable Future - The Eco-innovation Action Plan (2011)
CLIMA & ENV
No data available
- - - Y
Communication: Building a sustainable future for aquaculture - A new impetus for the Strategy for the Sustainable Development of European Aquaculture (2009)
MARE Y √ - - N/A
Proposal for a Regulation on the Common Fisheries Policy (2011)
MARE Y √ - - N/A
Proposal for a Regulation on the Common Organisation of the Markets (CMO) in Fishery and Aquaculture Products (2011)
MARE Y - - - N
Communication on the Community strategy 2007-2012 on health and safety at work (2007)
EMPL No data available
- - - N
Communication on a Commission Recommendation on the active inclusion of people excluded from the labour market (2008)
EMPL Y - - - N
Proposal for a Regulation on a European Union Programme for Social Change and Innovation (2011)
EMPL Y - - - N
Source: Evaluation team’s analysis of selected IA reports
We would like to emphasise that the judgment of the evaluation team as to whether NOPA impacts were (potentially) relevant and “should” have been taken into account is not meant as a judgment of whether such impacts would have been significant, or more significant than the impacts that were identified in the reports. In many cases, a cursory analysis would have likely determined that they were not. Also, the fact that NOPA-related impacts are not mentioned explicitly in the IA report does not necessarily mean that they were not discussed at some stage of the process by the authors of the IA and/or the ISSG, which may have considered them but found them not worthy of inclusion in the final IA report. These factors are impossible to determine in the context of this evaluation. Therefore, the analysis presented above should not be seen as an indictment of any real or potential “failure” of individual IAs and their authors. Instead, the aggregated results are intended as an indication of overall trends. In this sense, the lack of explicit consideration of NOPA impacts across a relatively large proportion of IAs led by various DGs where such impacts are potentially (but not clearly) relevant would seem to indicate that more could be done to ensure they are duly taken into account.
Conclusion
In accordance with the ‘Health in all Policies’ (HIAP) principle, DG SANCO aims to ensure an adequate contribution of relevant EU policies (among others youth, education, sport, transport, agriculture) to the objectives in the field of nutrition, obesity and physical activity (NOPA).
The integration of the NOPA dimension in other EU policies has been more successful in some policy areas, including those led by DGs AGRI, RTD, CONNECT, SANCO, EAC, JRC and EUROSTAT. Inter-Service Steering Groups, ad-hoc meetings, workshops and conferences are the main vehicle for collaboration to happen. The High Level Group and the

100
Platform have also been relevant fora to present the joint achievements. On the other hand, there has been little or no cooperation in the spheres of transport, regional policy and employment. Experience shows that cooperation has been more fluent when clear communication lines were established and where concrete objectives – generally in the framework of an EU-funded programme – were set.
Even though awareness has been raised of the advantages and opportunities of integration, future challenges lie in further institutionalising links between DGs, through for instance concrete measures for monitoring the progress of relevant initiatives.
One of the key vehicles to achieve policy integration is the EC’s IA system, which is intended to allow policy-makers to consider a wide range of potential positive or negative impacts of regulatory as well as non-regulatory proposals in an integrated way. A systematic screening and analysis of Commission IAs was carried out to assess the degree to which NOPA related impacts have been taken into account in the reports. The evidence showed that:
For policies that are clearly relevant from the NOPA perspective, the majority of IAs did consider these impacts (though there were a few exceptions);
For policies where the relevance of the NOPA dimension is less clear (i.e. policies that touch on issues that can potentially affect NOPA, but where this isn’t one of the central objectives), the mention or even analysis of NOPA impacts is the exception rather than the norm.
Thus, the evaluation results show that, by and large, DG SANCO has successfully integrated NOPA concerns into EU policies where the implications were relatively clear. However, partly due to capacity constraints, it has found it more difficult to mainstream the NOPA dimension into other, potentially much broader policies, where its relevance is typically less obvious. In some cases, these are significant policies with a large budget envelope attached to them (e.g. the ERDF and ESF). In order to fully implement the Health in All Policies approach, the EU Health Strategy116 notes that developing synergies with other sectors “is crucial for a strong Community health policy”. Among those sectors explicitly mentioned are regional and environment policy, and health and safety at work, in which there has been little progress to date as far as the NOPA dimension is concerned.
116
European Commission: White Paper “Together for Health: A Strategic Approach for the EU 2008-2013”. COM(2007) 630 final
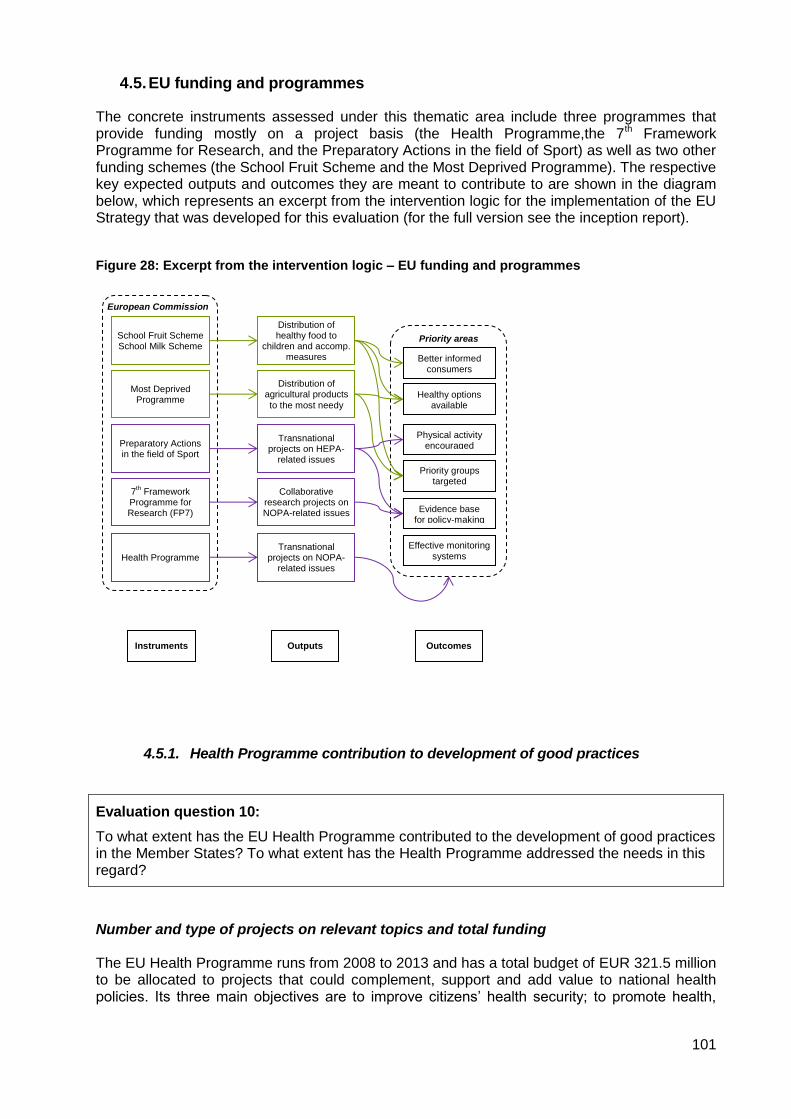
101
4.5. EU funding and programmes
The concrete instruments assessed under this thematic area include three programmes that provide funding mostly on a project basis (the Health Programme,the 7th Framework Programme for Research, and the Preparatory Actions in the field of Sport) as well as two other funding schemes (the School Fruit Scheme and the Most Deprived Programme). The respective key expected outputs and outcomes they are meant to contribute to are shown in the diagram below, which represents an excerpt from the intervention logic for the implementation of the EU Strategy that was developed for this evaluation (for the full version see the inception report).
Figure 28: Excerpt from the intervention logic – EU funding and programmes
4.5.1. Health Programme contribution to development of good practices
Evaluation question 10:
To what extent has the EU Health Programme contributed to the development of good practices in the Member States? To what extent has the Health Programme addressed the needs in this regard?
Number and type of projects on relevant topics and total funding The EU Health Programme runs from 2008 to 2013 and has a total budget of EUR 321.5 million to be allocated to projects that could complement, support and add value to national health policies. Its three main objectives are to improve citizens’ health security; to promote health,
European Commission
7th Framework
Programme for Research (FP7)
Health Programme
Outputs Instruments Outcomes
School Fruit Scheme School Milk Scheme
Most Deprived Programme
Preparatory Actions in the field of Sport
Collaborative research projects on NOPA-related issues
Transnational projects on NOPA-
related issues
Distribution of healthy food to
children and accomp. measures
Distribution of agricultural products
to the most needy
Transnational projects on HEPA-
related issues
Priority areas
Better informed consumers
Healthy options available
Physical activity encouraged
Evidence base for policy-making
Priority groups targeted
Effective monitoring systems

102
including the reduction of health inequalities; and to generate and disseminate health information and knowledge.
Specific innovative actions promoting health development, the second key objective of the programme, can receive EU funding as a means of implementing the Strategy on Nutrition, Overweight and Obesity related Health issues. Actions under the Health Promotion objective that contribute to the Strategy fall under the area of Health Determinants (2.2) and the specific sub-area on nutrition and physical activity (2.2.1).117
Between 2008 and 2011 there were 15 actions funded under the corresponding sub-area in the Health Promotion strand, with a total budget of EUR 6.8 million (see table in Annex 4.1 for an overview of the actions funded during this period). Preliminary information for 2012 confirms that there was one project selected for funding worth EUR 1 million118, and three further proposals in reserve for an additional total of just over EUR 1.4 million119. An initial calculation (including the 2012 budget) shows that actions funded under the Health Programme that support the objectives of the Strategy have so far amounted to approximately 2.7% of the total budget of the programme.
Overall assessment of effectiveness of HP regarding good practice identification and dissemination The Mid Term Evaluation of the Health Programme carried out by The Evaluation Partnership in 2011 undertook an assessment of the effectiveness of the Health Programme regarding good practice identification and dissemination. This section summarises the relevant findings presented in the final evaluation report. The identification and promotion of good practice focused on the sharing of health-related best practices and learning and support between Member States and with the EC. Findings showed that:
the intention to share health-related best practices across Member States appeared to be present in some shape or form in almost all the 14 actions reviewed;
there was consensus among stakeholders interviewed, in particular representatives of International Organisations, that the Health Programme had to some extent contributed to analysis and informed policy information and implementation across the EU. One interesting finding in light of the current evaluation is that important contributions were specified in the areas of obesity, physical activity and nutrition;
six out of every ten respondents in the e-survey felt that their activity had contributed to the sharing of experience and/or best practices between stakeholders within public health to a great extent;
the development of similar actions as a result of actions funded under the Health Programme was thought to be taking place at all levels, with a higher proportion of actions being developed at the national and European levels than internationally.
In terms of the effectiveness of the Health Programme regarding dissemination of the results of the actions, findings from the mid-term evaluation evidenced that:
117
See the legal text of the Health Programme: Decision No 1350/2007/EC of the European Parliament and of the Council of 23 October 2007 establishing a second programme of Community action in the field of health (2008-13). 118
Promoting healthy eating and physical activity in local communities (HEPCOM), awarded to the Netherlands Institute for Health Promotion. 119
The proposals in reserve were: Obesity Prevention through European Network (OPEN), European Youth Tackling Obesity (EYTO), and Health Olympics _ Take control over your Spirits! (HOTSPIRITS).

103
while the dissemination of the individual deliverables (Technical Interim Report, Final Report etc.) seemed to be working well, the communication of the actual results, once an action comes to an end, posed a challenge to action leaders. There was no clear dissemination strategy in place either from the side of DG SANCO or the EAHC in order to specifically target certain stakeholders, i.e. EU and MS policy makers, other officials working in MS public health departments, and even those within the Health Programme, some of whom did not seem to be sufficiently informed about the results of the individual actions, e.g. members of the Programme Committee;
dissemination was not just a problem of the Health Programme, but it relates to all financial programmes that involve a multitude of parties and stakeholders. EAHC officials interviewed stated that many actions funded had very good dissemination strategies, such as websites, newsletters, conferences at the end of an action etc. However, the dissemination of results at national level, for example to reach national policy makers, was perceived as a problem, as this is something that needs to be done additionally by actions;
target groups of individual actions were kept very generic and/or were not easily quantifiable. Following on from this, most actions assessed did not seem to have a clear dissemination plan for their outputs or a clear description of the channels they intended to use.
Contrary to the above views, the survey findings suggested that the results of actions funded under the Health Programme were widely disseminated and publicly available. Over half of respondents felt that the results of their actions were disseminated and publicly available to a great extent. However, the evaluation noted that most actions had not come to an end at the time of implementing the survey; therefore it was assumed that survey respondents referred to interim results of their actions or future dissemination. Suggestions for improving the dissemination of results included an increased dissemination through publications by the European Commission (rather than the organisation leading the action), ideally in a broad range of languages and specifically targeting relevant stakeholders. Several respondents recommended making better use of the Health Programme’s website to disseminate action results. A point was also made regarding the correlation between the dissemination of results and sustained action funding. Survey respondents felt that long-term funding of actions would enable them to disseminate their results more successfully, using long-term dissemination strategies (e.g. through building databases of interested individuals and institutions, setting up annual events etc.) and leaving a stronger legacy than short-term funded actions with less resources for disseminating results. Concrete contribution of relevant projects to the six desired outcomes of the Strategy The analysis of the concrete contribution of relevant projects to one or more of the six desired outcomes of the Strategy (i.e. the priority areas) is based on an in-depth assessment of a sample of three NOPA-related actions funded under the Health Programme (see Table 11 below for an overview of each selected action and Annex 4.1.2 for the detailed assessment reports). The analysis below should be read with the caveat that this evaluation is not intended to make a judgment of the projects as such, but it is really more an assessment of whether any direct / strong contribution to the objectives of the Strategy can be identified.

104
Table 11: NOPA-related actions funded by the Health Programme selected for in-depth assessment
Action and timeframe Objectives Lead organisation
EU Health Programme (DG SANCO)
Fighting Obesity through Offer and Demand (FOOD) [01/2009-04/2011]
The project aimed at addressing rising concerns of obesity in adults by promoting healthy eating habits during the working day. The two main goals of the project were to improve the nutritional habits of employees by raising their awareness of health issues and to improve the nutritional quality of the food on offer by working with restaurants.
Edenred France
Policy, Health and Family Learning (PoHeFa) [07/2009-06/2012]
This project aimed at increasing the awareness within municipal policy makers and professional practitioners on how the socio-cultural context within the local settings, where municipalities can intervene with health promoting activities has an effect on healthy lifestyle choices and the health status within families.
University College South Denmark
Partnership, Healthy Eating and Innovative Governance as Tools to Counteract Obesity and Overweight (Obesity Governance) [11/2009-10/2011]
The project focused on public-private partnerships around manufactured food as a means to counteract obesity and overweight in Europe. Its main objective was to study innovative approaches, such as industry involvement and public-private partnerships (PPPs), to counteract obesity and overweight in Europe.
Norway National Institute of Consumer Research
The FOOD project is a good example of an action effectively contributing to the Strategy, in particular to the areas of better informed consumers, making the healthy option available, and priority groups and settings. There was also a modest contribution to the third priority area focused on physical activity, though this was not an explicit objective of the project and there are no indicators of the success of this particular action. The keys to the success of this project were a strong emphasis on communication to employees of targeted companies (better informed consumers) and to restaurant owners and chefs (in order to make the healthy option available), coupled with a strong PR strategy (including presentations at the Platform and the HLG) which achieved good media coverage of the results of the project. The fact that the action has continued after EU funding came to an end has helped to reinforce the messages and actions. The contribution of the PoHeFa project to the objectives of the Strategy is more uncertain. The project aims at contributing indirectly in the longer term to the areas of making the healthy option available, encouraging physical activity and targeting priority groups and settings, but the contributions are not yet evident. The PoHeFa method aims at introducing a strategic and structured working process for municipalities to use in relation to planning, implementing and evaluating health promoting activities (with a focus on nutrition and/or physical activity) targeted at children, adolescents and their parents. The key output is a tested toolbox for local authorities, available in a more general European format and adapted to the six different countries that took part in the project. In the longer term the impact on target priority groups will be dependent on increased awareness and willingness of local authorities to apply the PoHeFa method and start working more strategically following the planning, implementation and evaluation guidelines and tools provided by the project. The Obesity Governance action aims at contributing in the longer term to the area of evidence base for policy making but the degree to which the contribution will be effective is uncertain. It can also be argued that if the action is effective in raising awareness of the role of public private partnerships (PPPs) in fighting overweight and obesity, and this leads to new partnerships being implemented, it will also contribute indirectly to the first four priority areas in the Strategy,

105
namely better informed consumers, making the healthy option available, physical activity encouraged and priority groups targeted. The research undertaken by the Obesity Governance consortium aimed at increasing awareness and understanding among target groups of the relevance and role of PPPs in fighting overweight and obesity in Europe, but it also aimed at pointing out to the particularities that PPPs can have in different countries/regulatory regimes. The main problem with the action was the lack of a clear and effective dissemination strategy to communicate the outputs of the research undertaken to the key target audiences identified. Table 12 below presents an overview of the extent to which each of the actions assessed contributed to the priority areas of the Strategy. As foreseen in the intervention logic of the Strategy, there is a potential and scope for the different NOPA-related projects funded by the Health Programme to contribute to all six priority areas.
Table 12: Contribution of the selected actions to the priority areas of the EU Nutrition Strategy
Priority Areas / EU Nutrition Strategy FOOD project’s contribution
PoHeFa project’s contribution
Obesity Governance project’s
contribution
1. Better informed consumers + + N/A +
2. Healthy option available + + + +
3. Physical activity encouraged + + +
4. Priority groups and settings ++ + +
5. Evidence base for policy making N/A N/A +
6. Effective monitoring systems N/A N/A N/A
++: Concrete contribution to a priority area / +: Indirect contribution (though not yet materialised) to a priority area / N/A: No contribution foreseen
Of the three actions assessed, only one of them (i.e. FOOD) can be said to have made concrete contributions to three of the six priority areas of the Strategy. In the case of the other two actions (i.e. PoHeFa and Obesity Governance), potential contributions to the Strategy are dependent on the degree to which other stakeholders use the results of the research undertaken by these projects. One of the main differences between the three projects is that FOOD worked directly with “end users” (employees and restaurants), whereas the other two actions targeted policy-makers and other relevant stakeholders, namely NGOs and businesses. Concrete lessons / activities identified in relevant projects that can be taken as good practices for combating obesity by other organisations In terms of good practice identified in the fight against obesity, one feature that was common to all three actions was the development of a baseline overview, inventory or literature review. This has proved useful to validate or contest initial assumptions and to frame the upcoming work. It also helps to consolidate the available evidence base in the fields of nutrition, overweight and obesity and to give visibility to research pieces or interventions in the field. The FOOD project stands out over the other two actions with the following good practices identified:
The identification of concrete target groups that were to be reached by the action (i.e. employees, restaurants welcoming these employees at lunch time, and the Human Resources Managers and CEOs of targeted companies). The general public, public health

106
professionals and stakeholders (including members of the Platform and the High Level Group) were also targeted by the project.
The budgeting and design of a wide range of tools for each of the target groups, and the adaptation of the tools to the six countries that participated in the project. The mix of communication tools and the active press and media strategy granted the action with a high visibility.
The decision to create a network of restaurants complying with FOOD recommendations. This “certification” given to restaurants was an extremely useful tool to attract new restaurants to receive a “quality label”. As the network of FOOD restaurants continues to grow, the number of employees who can have access to healthier food choices will also increase.
The implementation of two waves of surveys in 2009 and 2010 targeted at 52,000 employees and 5,000 restaurants in the six participating countries. The objective is to implement the questionnaire annually in the participating countries to analyse evolution of habits and knowledge and establish long term impacts.
The PoHeFa project proposed an interesting working method which participants defined as “action research oriented”. The overall objective of the action was to introduce a strategic and structured working process in relation to planning, implementation and evaluation of health promoting activities within children, young people and their families. The approach consisted in recruiting 12 pilot municipalities in six participating countries and to undertake a policy analysis for each municipality based on a mapping exercise. The results of the mapping exercise were assessed against the theoretical assumptions of the project, and a set of recommendations were presented to the local authorities. The participating local authorities piloted the recommendations in specific settings (with support from consortium partners), which gave them the opportunity to apply the tools and the results of the work. The results have been gathered into a conceptual framework –the “PoHeFa toolbox”– that is intended to assist local authorities to improve their practices within health promotion. The main question is the transferability of the PoHeFa toolbox to municipalities in other countries not covered by the action, and the degree to which the toolbox can be potentially used as a standalone tool without guidance from consortium partners or public health experts familiar with the project. In terms of good practices identified in the Obesity Governance project, an element that stands out is the breadth of the initial analysis which focused on identifying public-private partnerships fighting overweight and obesity in the EU 27 Member States and Norway. The broad scope of the baseline research allowed registering more than 200 initiatives and establishing similarities and differences between partnerships in different countries and regulatory regimes. The sample of partnerships identified and evaluated had more validity because it was representative of all EU Member States. The partnerships selected were also representative of different types of areas: initiatives at pre-schools, schools, and workplace settings, labeling and drinking partnerships, and campaigns directed to the general public. The final discussion on the transferability of partnerships was also enhanced by the breadth of the initial research undertaken, as it allowed to refer to transfers within and between geographical regions (i.e. EPODE initiative, Keyhole labeling and school fruit schemes) but also transfers between the same and different types of regulatory regimes.

107
Identified longer term impacts of relevant projects to addressing nutrition, and reducing overweight and obesity in the EU
It is still too early to reflect on the longer term impacts of the projects assessed, as all three have only been finalised recently and expected impacts require a longer period of time to materialise. It is also difficult to try to attribute wider impacts to individual actions with relatively modest budgets and timeframes (and limited sustainability prospects in the cases of PoHeFa and Obesity Governance) in light of the multiplicity of programmes, activities and interventions in place in the fields of nutrition, overweight and obesity. With this caveat, it should be remarked that, with very similar budgets, the FOOD project achieved concrete outcomes, compared to the more uncertain/indirect outcomes of PoHeFa and Obesity Governance. This leads us to conclude that results and impact are not exclusively dependent on budget but that there were other factors that played a role, namely:
Action oriented projects targeted directly at end users can result in concrete short term results, whereas research oriented projects targeted at intermediaries like local authorities are dependent on subsequent actions by stakeholders for the results to translate into concrete benefits for end users;
dissemination is a key factor for the take up of actions or results, irrespective of whether a project is action or research oriented;
sustainability of projects (after EU funding has ceased) is also important in terms of consolidating the results achieved and further widening their impact. The FOOD project is a clear example of how initial EU funding has kick-started an action that has continued even when that funding was gone.
Despite the differences, the three actions were designed to contribute to the objectives of the Health Programme, in particular to the sub-area on nutrition and physical activity. It should also be noted that Figure 29 below outlines the expected longer term impacts of each project as reconstructed in the individual intervention logics that are presented in Annex 4.1.2.
Figure 29: Expected impacts of the actions assessed
Expected Impacts
Enhance the
development of
healthy nutrition
habits and lifestyles at
the workplace
FOOD PoHeFaObesity
Governance
Ensure that health
promoting activities
focusing on
overweight, obesity
and healthy lifestyle
within young people
and their families have
a better and long
lasting effect.
Contribute to decrease the number of unhealthy citizens in Europe
Contribute to the
development of good
practices on the
reformulation of
manufactured foods to
combat overweight
and obesity in Europe

108
The Obesity Governance project ended with a final stakeholder conference that presented and discussed the results of the research undertaken with selected stakeholders, the majority representing selected PPPs that had been evaluated by the consortium. A critical factor for the sustainability and impact of the research conducted would have been a well-structured dissemination strategy that could have effectively helped to raise awareness and understanding of the important role (as well as the limitations) of PPPs in the fight against overweight and obesity in Europe. The homepage lacked elaboration, there was no budget or strategy for writing and presenting scientific papers, and the stakeholder conference (which was judged to be successful by the project coordinator) could have brought together a larger number of stakeholders.
Conclusion
Between 2008 and 2011 there were 15 actions funded by the Health Programme that support the objectives of the Strategy, with a total budget of EUR 6.8 million. An initial calculation (including the 2012 budget) shows that these actions have so far represented approximately 2.7% of the total budget of the programme. In view of these amounts (average of less than EUR 2 million per year), it seems clear that although Health Programme projects can potentially affect specific groups or settings in certain MS, their overall impacts at the EU level should not be overestimated.
The mid-term evaluation of the Health Programme showed that the majority of projects have been effective in the identification of good practices for combating obesity in the EU. However, dissemination and especially application of good practices are more uncertain and often a challenge for project leaders and for Commission and EAHC officials. The three projects assessed in depth help to illustrate this in the specific context of NOPA-related issues.
The FOOD project is a good example that illustrates the potential of individual actions to contribute to the objectives of the Strategy. The action-oriented project combined the direct targeting of relevant actors, strategic dissemination (well planned, implemented on a regular basis from the outset, without necessarily relying on a large budget), and sustainable activities that continue after EU funding ceased.
Other projects assessed raised more doubts because they were research-oriented actions targeted at intermediaries and lacked well planned dissemination strategies. Hence, the applicability of the results of these projects appears to be much more uncertain.
As a result, only one of the three projects assessed seems likely to make a concrete contribution to several priority areas of the Strategy. For the other projects, although there is potential to contribute to the objectives of the Strategy, it seems unlikely that this will be realised in the context of discontinued EU funding and lack of concrete follow-up dissemination activities among relevant target groups.

109
4.5.2. Utility and results of School Fruit Scheme
Evaluation question 11:
What is the utility of the European School Fruit Scheme to the Strategy according to the results achieved?
The School Fruit Scheme (SFS) emerged as a result of two parallel processes. Firstly, the 2007 reform of the first pillar of the Common Agricultural Policy (CAP), i.e. Common Market Organisation (CMO) introduced measures to promote consumption of fruits and vegetables (F&V), including encouragement for consumption of F&V in educational establishments. Secondly, EU developments in the field of public health resulted in the adoption of the Health Strategy and the Strategy for Europe on Nutrition, Overweight and Obesity related issues in 2007 that explicitly referred to the need of improving dietary habits, provision of F&V and promoting physical activity among school children. Invited by the Council, the EC set up an Inter-Service Group in 2007 and launched an Impact Assessment of a school fruit scheme. In 2008 the Council agreed on the EC proposal adopting Regulation No 13/2009 that set up the SFS. In 2009/2010 school year, the first children across the EU benefited from the scheme. The overall policy objective of the SFS is to increase the share of F&V in the diets of children, which is to be achieved through:
making F&V easily available to children in the school environment;
eliminating any price barriers by providing F&V free of charge;
educating children, parents and teachers about the benefits of eating F&V. MS are required to draw up a strategy for the implementation of the scheme at national or regional level that would outline: the budget, target group, eligible products, involvement of relevant stakeholders, and accompanying measures necessary to make the scheme effective. The annual budget of the SFS at EU level has been set at 90 million Euros per school year to support the schemes in the MS. The co-financing limits vary between 50% and 75% of the costs. The SFS implementation at national level is quite flexible, including varying definitions of the target group (from 2.5 to 18 year olds), different distribution models and diverse frequency and duration of the intervention. So far, 24 Member States have participated in the scheme, of which 21 apply a central organisational structure at the national level and 3 apply a decentralised structure at the regional level120. In 2011, the EC launched the first external evaluation of the SFS aimed at examining the implementation, as well as the effectiveness, efficiency, coherence and relevance of the implementation of the scheme between 2009 and 2011121. What follows is an assessment of the extent to which the SFS has contributed to a healthier diet of school children in the EU based on the results of this external evaluation, as well as on the review of additional documentation such as the Special Report issued by the European Court of Auditors in 2011122.
120
Synthetic Summary of the Evaluation of the European School Fruit Scheme, AFC Management Consulting AG, July 2012. 121
Final Report of the Evaluation of the European School Fruit Scheme, AFC Management Consulting AG, July 2012. 122
Are the school milk and school fruit schemes effective? Special Report No 10 2011, European Court of Auditors.

110
It is also worth noting that a similar scheme, the EU School Milk Scheme (SMS), which is intended to encourage consumption of dairy products among children, has been in existence since 1977. Although the SMS is not assessed in detail here, please refer to section 4.4.1 for a summary of how health and obesity-related aspects have been increasingly integrated into the scheme in recent years. Contribution of the scheme to the desired outcome of priority groups targeted: Number of children reached and portions of fruit and vegetables distributed (per MS and year) According to the results of the external evaluation, in the school year 2010/2011 the SFS reached 8.2 million children, accounting for 25% of the target group within the participating countries and regions. This represented a 73% increase compared to the initial school year 2009/2010 (Table 13). The number of schools reached increased from 32,273 in 2009/2010 to 54,267 in 2010/2011 (27% of all eligible schools in participating Member States). The evaluation also revealed that, on average, 12% more schools and 12% fewer children than planned have participated so far.
Table 13: Children and schools reached (2009/2010 vs. 2010/2011)
2009/2010 2010/2011 Var.
Children reached 4,700,000123
8,146,290 +73%
% of eligible children N/A 25% N/A
Schools reached 32,273 54,267 +68%
% of eligible schools N/A 27% N/A
Source: Final Report of the Evaluation of the European School Fruit Scheme (July 2012)
There is evidence that shows that the increase in the number of children and schools reached with the SFS can be linked to EU support, as 70% of the Control Authorities and Single Contact Points124 in the participating MS and regions reported that the EU contribution led to the implementation of new nation- (or region-) wide schemes in their countries. In addition, in the countries or regions where there was a well-functioning and widespread scheme prior to the launch of the EU scheme (i.e. approx. 30% of the Member States), EU funds were used to extend the scheme to more schools and children. Ireland, Flanders and France are examples of this. In terms of the portions of fruit and vegetables distributed, 290 million portions were distributed to 8.2 million children in the school year 2010/11 (an average of 35 portions per child), creating an additional demand for fruit and vegetables of 43,730 tons125. At national and regional level, the data also revealed that there is still room for improvement as over 50% of the participating countries and regions reached less than 50% of their eligible children (Table 14).
123
Estimation based on the information provided in the leaflet “Evaluation of the European School Fruit Scheme. Results and Recommendations”.AFC Management Consulting AG, July 2012. 124
National Control Authorities (i.e. staff of the responsible National Ministries) and Single Contact Points (e.g. staff of the national evaluation institutions) in 10 selected participating Member States or federal regions and the United Kingdom (as non-participating Member State) participated in face-to-face or telephone interviews with the external evaluators. 125
This makes 0.06% of the total gross net supply in the EU 27 fruit and vegetable market.

111
Table 14: Participating children and schools per country / region (2010/2011)126
Country / region
2010/2011
Participating children
% of all children
Participating schools
% of all schools
Cyprus 52,343 100.0% 360 100.0%
Rhineland-Palatinate (DE) 163,214 99.6% 1,169 99.2%
Malta 31,241 96.0% 138 99.0%
Czech Republic 370,241 79.5% 3,143 76.2%
Hungary 297,865 76.8% 1,726 75.8%
Slovakia 461,490 75.1% 1,999 37.2%
Poland 835,506 71.6% 9,104 65.2%
Estonia 36,346 70.8% 292 52.3%
Luxembourg 62,587 70.7% 125 70.7%
Latvia 73,221 63.4% 537 67.6%
Slovenia 101,553 63.0% 275 62.0%
Romania 1,035,477 60.9% 6,259 55.5%
Bavaria (DE) 215,350 56.0% 1,440 59.6%
Portugal 217,385 52.0% 2,911 56.0%
Italy 1,343,000 49.5% 8,800 48.9%
Greece 284,109 46.5% 1,545 26.6%
Wallonia (BE) 134,297 45.6% 857 30.7%
Lithuania 42,437 38.0% 352 32.0%
Thuringia (DE) 28,284 37.6% 217 38.6%
Flanders (BE) 244,019 36.4% 1,139 45.1%
Saarland (DE) 11,424 34.6% 91 44.2%
Bulgaria 96,439 30.1% 789 19.2%
Spain 1,049,361 26.2% 4,694 46.2%
Austria 133,202 17.6% 975 10.8%
The Netherlands 287,599 17.6% 1,499 20.8%
Saxony An halt (DE) 15,065 15.0% 245 10.3%
Ireland 59,635 11.9% 384 11.5%
North Rhine-Westphalia (DE) 85,000 11.5% 455 12.0%
Baden-Württemberg (DE) 130,871 10.6% 820 5.9%
Denmark 51,029 7.1% 477 21.0%
France 196,700 1.6% 1,450 2.2%
EU 8,146,290 54,267
Source: Annual Monitor Reports (Final Report of the Evaluation of the European School Fruit Scheme - July 2012)
126
The final report of the external evaluation provides data for 2010/2011 only. Some countries provide data on participating children and schools for the year 2009/2010 in annual reports. However, this data was not presented in the evaluation’s final report as it was deemed to be incomplete and/or not comparable. In some cases, the data was only available in the official language of the MS and could not be fully translated in English within the timeframe given for the evaluation.

112
Drawing from this evidence it can be concluded that the SFS has mainly contributed to creating new national / regional schemes in 31 countries / regions and to extending existing ones in order to reach a higher portion of the target group. The external evaluation suggests that an extension of both the EU funding share and absolute EU aid would lead to an extension of the SFS’s scale and reach. This would possibly also have an impact on the number of portions provided to children and the frequency of distribution, as often MS reduce the frequency or duration of the programme in order to expand the SFS to as many children as possible while meeting their budget restrictions. Contribution of the scheme to the desired outcome of making the healthy option available: degree of SFS contribution to a durable increase in the fruit and vegetable consumption of children (if any) According to the evaluation report, the three main parameters for assessing the contribution of the SFS to a durable increase in the F&V consumption of children are the quantity of F&V consumed, the frequency and duration of the distribution. A more regular and sustained offer of F&V has a higher probability of having an impact on children’s nutrition behaviour in the longer term. In terms of the quantity, the majority of the national evaluations reported a positive impact of the SFS on children’s F&V consumption in the short term127. This was also the view of the majority of the stakeholders consulted in a sample of participating countries and regions (e.g. National Control Authorities, Single Contact Points, school headmasters, parents, and experts). However, it is worth noting that the measurement and evaluation carried out by the MS varied significantly, and hardly any country stated an explicit quantity for the increase in children’s consumption. As regards the frequency of the distribution, the external evaluation established that a frequency of at least 3 times a week is recommendable128. At present, the frequency of distribution varies greatly among the participating countries and regions, with the majority supplying 1 to 2 times per week and only nine reporting 3 to 5 times per week on an average basis. This was considered insufficient to reach the goals of the SFS. The different scheme durations also vary strongly across the MS. The external evaluation showed that circa 90% distributed longer than 20 weeks in 2010/11 (i.e. longer than half a school year). However, if this parameter is combined with that of frequency, the most popular strategy for distributing F&V for the school year 2010/2011 was once or twice a week throughout at least half a school year. This is probably due to a restricted budget and the desire to involve as many children as possible. According to the above analysis, the SFS has succeeded in increasing the consumption of F&V among the target group in the short term. However, the frequency and duration of the distribution in most Member States may represent a challenge for the sustainability of this increase. In addition to this, approximately half of the stakeholders consulted said the long-term effects on consumption were not that clear and that there is not enough experience to make an assessment at this stage. Thus, the question of whether the SFS will lead to a durable increase in the fruit and vegetable consumption of children remained unanswered.
127
18 out of the 21 countries / regions that examined whether an increase in children’s F&V consumption had taken place due to the SFS reported a positive development. Four could not identify an impact on consumption. In addition to this, some countries / regions that carried out an indirect estimation of F&V consumption also reported positive effects (e.g. by considering teachers’ and parents’ impressions, comparing the frequencies of consumption or checking the contents of lunchboxes, etc.). None of the participating countries / regions reported on negative impacts. 128
Nevertheless, it should be noted that a daily frequency over a long intervention period is the most effective strategy for generating a sustainable positive impact on eating habits.

113
Despite these rather cautious results in terms of the SFS’s durable impact on children’s F&V consumption, it is worth noting that research carried out in 2007 shows that “school-based schemes are effective at increasing both intake of, and positive knowledge and attitudes to fruit and vegetable intake” and that both “large (national) and smaller (local) scale FV [fruit and vegetables] schemes can have long term impacts on consumption”129. This is in line with the results of the SFS in some specific countries / regions which succeeded in carrying out quite robust assessments of results, as presented in the final evaluation report (e.g. North Rhine-Westphalia)130. Contribution of the scheme to the desired outcome of better informed consumers, by teaching school children about healthy lifestyle and healthy eating According to the final evaluation report of the SFS, tackling availability and price of F&V is less likely to be effective in changing eating habits unless it goes hand in hand with awareness raising and education. In effect, the implementation of accompanying measures (such as information material; lectures; teacher training; farm visits; gardening; etc.) is mandatory for all countries and regions that participate in the SFS. These are planned and carried out by schools and are aimed at ensuring the successful implementation of the scheme and improving the target group’s knowledge on the benefits of F&V or healthy eating habits131. The importance of these measures in ensuring the effectiveness of the programme was also highlighted by the European Court of Auditors in its assessment of the school milk and school fruit schemes. As accompanying measures are currently not eligible for EU co-funding and have to be fully covered by Member States’ (and other stakeholders’) funds, the countries / regions are free in the way they design and implement these measures. Thus, accompanying measures differ a lot, and the external evaluation was unable to identify fully the way in which these contribute to the achievement of the scheme’s objectives.
Based on the evidence provided in the final report of the external evaluation, it is possible to say that most of the participating countries and regions have implemented actions aimed at teaching school children about healthy lifestyle and healthy eating132, regardless of the results obtained. The evidence shows the following:
two out of every three countries present the SFS via the internet. In some cases the internet is used as a tool to reach teachers and children. Parents are also frequently identified as a target group using the internet;
almost all reporting countries employed knowledge transfer measures designed to encourage cognitive learning. These were mainly in relation to the health benefits of consuming more F&V and information on recommended daily consumption and on the products themselves;
over half of the reporting countries implemented action orientated measures, in particular farm visits and school gardening.
129
De Sa, J. and Lock, K. (2007): “School based fruit and vegetable schemes: A review of the evidence”. London School of Hygiene and Tropical Medicine, pg 3. 130
Example on consumption increase in North Rhine-Westphalia presented in the Final Report of the Evaluation of the European School Fruit Scheme, p. 48. 131
As per Commissions Regulation (EC) No 288/2009 article 3. 132
As examples of accompanying measures, the European Court of Auditors highlights the following: travelling exhibition to educate pupils about fruit and vegetables, interactive information both in a school entrance hall, discussions organised for parents with doctors and nutritionists, vegetable garden on school premises, and educational support material for teachers.

114
The majority of stakeholders consulted in the framework of the external evaluation stated that educational measures contribute positively to the SFS. In particular, they:
increase children’s knowledge about fruit and vegetable and healthy eating;
impulse them to try new fruit and vegetable and getting to know these varieties;
sensitise them to eat five portions of fruit and vegetable per day;
motivate them to change eating habits; and
enrich school education. The external evaluation also revealed that accompanying measures are either regarded by the participating countries and regions as a central element in changing children's eating habits (e.g. Ireland) or, in most cases, as "additional extra" within the scheme (e.g. Netherlands and France). According to the in-depth study of the three examples stated, both principles are able to increase children’s consumption of F&V during the intervention period. A long-time assessment measurement after the intervention was carried out by Ireland only, and this showed that accompanying measures have a long lasting effect. The external evaluation and the European Court of Auditors suggested that, if the importance of these measures is confirmed, the Commission should consider the possibility of making them eligible for EU co-financing and providing guidance on the approach to be used for the design and evaluation of these measures. The Commission has in fact proposed for CAP 2020 to include these measures under the eligible costs to the EU aid. Factors that contribute to the success of the scheme in the Member States Based on the documentation reviewed, it is possible to say that the factors that have contributed most to the success of the SFS are:
EU funding: The external evaluation showed that EU financial support allowed for the development of new or extended large-scale and nation-wide schemes in nearly all participating MS. In addition to this, the evaluation concluded that large-scale free distribution of F&V is to a large extent only practicable through the EU aid.
Visibility of the EU support: This has made the programme more serious and relevant and has added credibility and relevance to the national / regional schemes.
Visibility of the scheme: According to the European Court of Auditors, the visibility of the scheme may help to convey a message about the value of the product in question. In all the cases observed, fruit distribution was highly visible, making the schemes more likely to have an educational impact.
Free distribution: This has been key to ensuring that all the targeted children have access to the F&V distributed by the scheme. As per the European Court of Auditors’ report, this also minimises the relative deadweight, as the scheme’s beneficiaries include children who would not have been prepared to purchase the product without a subsidy. In addition, the fact that distribution of F&V is free of charge to schools has helped to ensure the uptake of the scheme.
Distribution outside the canteens: By comparing the SFS and school milk scheme, the European Court of Auditors established that distribution outside the canteens has been key in the SFS for avoiding a deadweight effect in which the products are included in the canteen meals anyway or are bought by children themselves.
Wide range of products: This has been important in keeping children’s interests in the programme. At least 5 to 10 different products are offered to children at the participating schools.
Tools to facilitate the educational goals: Both the external evaluation and the European Court of Auditors’ report established that accompanying measures are a central aspect in promoting lasting healthy eating habits. Even though the extent to which these measures contribute to the effectiveness of the SFS has not been established yet, they make the scheme more likely to achieve its short-term and long-term objectives.

115
Extent to which the scheme contributes to reduce obesity in the EU through positively influencing the development of definitive consumption habits among children Following the general objectives of the Strategy, the SFS intends to increase the consumption of F&V among children, which has been established to be below the minimum recommended intake of 400g/day (on average in European Member States). The low intake of F&V contributes to poor diet which is considered to be one of the key elements of obesity and a series of other (often related) health problems. By positively influencing the consumption habits of children in the short and long term, the SFS aims to reduce obesity in the EU. As explained before, although it could not be quantified, the external evaluation found a positive short-term impact on children’s fruit and vegetable consumption during the intervention period in almost all participating countries and regions133. Whether the short-term increase in F&V consumption can be sustained and transformed into a definitive higher consumption is still not entirely certain (as a result of the scarcity of comprehensive and robust evidence). However, there is evidence coming from recent research that suggests that a positive impact can be expected in the longer term if the duration of the programme exceeds one year and F&V are continued to be provided for free. A high frequency distribution (at least 3 times a week) is also important to have an effect on children’s behaviour and create a habitual F&V consumption.
Conclusion
In the last year for which data is available (2010/11), the EU School Fruit Scheme contributed to the distribution of an average of 35 portions of fruit and vegetables to over 8 million school children in 24 Member States. An external evaluation carried out in 2011-2012 found that this has led to an increase in the consumption of F&V in the short term for which the EU financial support has been instrumental. As such, the SFS has clearly contributed to making the healthy option more available for one of the priority groups identified in the Strategy, namely children. Through the accompanying measures, it has also contributed to educating children of the components and benefits of a healthy diet.
However, due mainly to the scarcity of relevant data from the evaluations of national schemes, the external evaluation was unable to provide conclusive evidence of the extent to which these short-term benefits lead to longer term changes in the dietary habits of participants. While relevant studies have concluded that, in general, both “large (national) and smaller (local) scale FV [fruit and vegetables] schemes can have long term impacts on consumption”134,only a few of the national or regional schemes that form part of the EU SFS were able to demonstrate that this was indeed the case for their respective schemes. Thus, although it is not (yet) possible to measure the longer term dietary impacts of the SFS as a whole, it is increasingly clear that, if implemented effectively, the scheme has a large potential to affect sustainable changes in the eating habits of the children it reaches.
The evaluation does point to a number of key factors that enhance the scheme’s chances of having a significant longer term impact. They include the coverage, frequency of distribution and duration of the programme. In addition, the evaluation underlines the importance of appropriate accompanying measures. At present, all of these factors vary widely across national and regional schemes, which further complicates the measurement of the impact at the
133
In the cases where no increase was reported, the reasons provided were either methodological problems or the short intervention period. 134
De Sa, J. and Lock, K. (2007): “School based fruit and vegetable schemes: A review of the evidence”. London School of Hygiene and Tropical Medicine, p. 3.
116
EU level.
4.5.3. Impact of the most deprived programme on nutritional behaviour
Evaluation question 12:
What is the impact of the most deprived programme on the nutritional behaviour of programmes beneficiaries?
The Most Deprived Persons of the Community (MDP) scheme was launched in the winter of 1986/87, when the European Community's surplus stocks of food commodities based on beef, olive oil, butter, milk powder, rice, cereals and sugar were given to Member State charities for distribution to people in need. With the subsequent CAP reform process, intervention stocks were reduced, and the scheme came to rely increasingly on market purchases. The current programme's budget has increased steadily, from EUR97 million in 1988 to EUR 500 million in 2009 and onward. In parallel, the number of people benefiting from the scheme has grown from over 14 million people who received aid in 2008 to almost 19 million people in 2011.
The volume of products distributed by the programme has risen sharply over the years, with a particularly high amount of cereals available. Traditionally the programme has mainly distributed dry foods, including pasta, flour, sugar, rice and cereal. Even though there has been a greater variety of foodstuffs introduced over the past few years, including vegetables, dairy products, meat, biscuits, cooking oil and baby-foods, representatives of NGOs actively working in the scheme agree that there is scope for offering a wider variety of healthier products, in particular protein products, fresh fruit and vegetables. The Commission is currently undergoing a process of reflection on the successor programme for the period 2014-2020. A formal proposal for the successor programme for the period 2014-2020 was presented in autumn 2012.
A detailed overview of the evolution of the scheme and available statistics is presented in Annex 4.4.
Contribution of the programme to the desired outcome of priority groups targeted: number of persons benefiting from MDP per MS and year As highlighted in the Impact Assessment report on the Fund for European Aid to the Most Deprived issued recently135 (and as confirmed by interviewees in the context of this evaluation), the current MDP regulation does not define the most deprived persons but leaves it to the Member States to define eligibility criteria. This results in diverse criteria and methods, and ultimately in a diversity of populations (in terms of gender, age groups, professional status and income status, to name a few) served by food aid in the different countries that receive EU funds.
135
Impact Assessment accompanying the document Proposal for a Regulation of the European Parliament and of the Council on the Fund for European Aid to the Most Deprived [COM (2012) 617 final], 24/10/2012.

117
Differences in the criteria for selecting the final recipients in the Member States
According to the Impact Assessment report136
, three main groups of Member States can be distinguished in terms of the criteria for identifying the final recipients of food aid:
– Definition of the most deprived persons on the basis of low income, i.e. persons entitled to social security assistance according to national law: Belgium, Estonia, Lithuania, Latvia, Slovakia and Poland.
– Definition linked to housing status, i.e. homeless persons or at risk of becoming homeless: Czech Republic and Luxembourg.
– Definition based on two or more criteria, including low income, difficult living conditions, unemployment, health or disability, age-related dependency: this approach is followed by the majority of participating Member States (Hungary, Romania, Spain, Finland, France, Italy, Ireland, Slovenia, Slovakia, Bulgaria and Malta).
The "at risk of poverty rate" indicator is used in the present programme as a proxy to allocate resources between Member States. This indicator represents the share of people with an income below 60 % of the national "equalised median income". It does not measure wealth or poverty, but low income in comparison to other residents in that country.137Given the diverse criteria in the definition of programme beneficiaries in the Member States, not all people who fall within the “at risk of poverty rate” group are actually targeted by the MDP.
The majority of interviewees agreed that in the past, food poverty was a prerogative of irregular migrants, homeless and people with psychological distress. The economic crisis in Europe has brought about an increased number of “new poor” across EU countries. The profile of MDP beneficiaries has changed and recipients of food aid now include retired, recently unemployed, elderly people, young people, large families with young children, and people of whole districts that were once productive and due to the continuing recession have lost many workplaces.
The majority of Member States provide aggregate information on the total number of beneficiaries each year138, but in the absence of clear definitions and reporting and evaluation rules, there is considerable uncertainty as to how these global figures are calculated, which in turn raises questions on the reach and the impact of the programme:
“What the Member States report is a global figure. How they count beneficiaries – whether it is someone going once into a food kitchen, or someone receiving food packages every week – is hard to verify. It is very difficult to have a harmonised approach.”139
DG AGRI officials argue that from a management point of view, almost the entire budget is devoted to food. Under the current legal frame of the scheme no budget for technical assistance (i.e. for developing indicators or undertaking evaluations) is foreseen. In accordance with the legal requirements in force, the scheme has been implemented with few reporting requirements
136
IA report on the MDP, Annex 2, p. v 137
Eurostat glossary http://epp.eurostat.ec.europa.eu/statistics_explained/index.php/Glossary:At-risk-of-poverty_rate 138
Spain stands out as an exception. The government’s website provides information on the number of beneficiaries in each of the Spanish regions per year. The Spanish official interviewed confirmed that the government collects and aggregates information provided by the local voluntary organisations on the numbers of beneficiaries of food aid per profile group, but this information was not accessed by the evaluation team. 139
Interviews with MDP stakeholders carried out by TEP.

118
due to the inherent difficulties of defining and monitoring indicators140, but it works and gives concrete help to many people.
The graph below shows the evolution of the total number of aid recipients and the number of Member States participating in the scheme between 2007 and 2011 (figures on aid recipients are still not available for 2012). The big budget increase141 that took place in 2009 to take account of food price inflation impacted on the number of aid recipients, which jumped from 14.4 million in 2008 to 18 million in 2009.
Figure 30: Total number of aid recipients of the MDP and participating MS (2007 – 2011)
Source: DG AGRI presentation on the main results of the distribution plan, stakeholders’ meeting
(July 2012)
Available disaggregated statistics including number of aid recipients per Member State between 2007 and 2011 and calculation of annual amounts spent per beneficiary in each Member State are presented in Annex 4.4.
Contribution of the programme to the desired outcome of making the healthy option available: amount of ‘healthy and nutritious food’ (including fruit and vegetables) distributed per person As confirmed by the Impact Assessment report, originally the products to be distributed were limited to those for which intervention applies. The reform of the CAP reduced the number of these products, but still the food that was acquired in the market had to contain products from the same category as those in the intervention stocks.
The concept of nutritionally balanced food was initially introduced in the Commission’s proposal to reform the scheme back in 2008, and remained an element in the successive proposals
140
The charitable organisations distributing the food are based often only on volunteers with little training and they target people who are often outside all social security systems (homeless or illegal immigrants). Therefore, it is very difficult to define and monitor a detailed and homogenuous set of indicators as regards aid recipients of the programme. One good and reliable indicator of the performance of the programme is the tonnes of products distributed which has risen sharply over the years with a particular high amount of cereals-based and dairy-based products distributed. 141
The scheme’s budget increased from EUR 300 million distributed in 2008 to EUR 500 million in 2009.
18,986,18218,403,851
18,072,152
14,423,854
13,149,105
0
2000000
4000000
6000000
8000000
10000000
12000000
14000000
16000000
18000000
20000000
2007 2008 2009 2010 2011
0
5
10
15
20
25
Aid Recipients
Number of participating MS

119
presented by the Commission. However, it was not until early 2012, when the amended proposal came into effect, that a clause was introduced, suggesting Member States to take into account nutritional considerations when developing their annual plans:
“Member States should base their requests for food products on national food distribution programmes setting out their objectives and priorities for food distribution to the most deprived persons, which should include nutritional considerations.”142
As per the interviews carried out with authorities in four Member States (Italy, France, Spain and Poland), this new clause had a positive effect in terms of the food products offered in 2012, but interviewees agreed that:
it is still too early to assess impacts of a healthier food offer on beneficiaries;
there are many restrictions to the food that can be offered because the food is generally distributed between three and four times per year, and the charities that coordinate the distribution efforts lack adequate storage refrigeration facilities to store fresh products;
it is not just about distributing healthier food, but it is also important to accompany this with educational and training activities for volunteers and final beneficiaries143;
the central objective of the programme is to feed people in need. If the food distributed can incorporate nutritional considerations, this is a plus, but it should not divert from the main aim of the scheme which is to distribute food to the poor and marginalised;
the nutritional value of food products should be correlated to their unitary cost.144
Organisations like the European Public Health Alliance (EPHA) argue critically that although the revision of the MDP scheme approved in 2012 included some improvements of nutritional profile, the selected products are still of a low health-promoting value (like preserved fruit and canned tuna).
Despite the restrictions on the type of products imposed by MDP rules until 2011 and distribution constraints, one positive result of MDP funds is their leveraging effect on other sources of funding destined to food aid. In many participating countries, intervention products or products with a long conservation distributed with MDP funds are complemented by more perishable goods from other sources. France is a good example of a successful coexistence between the MDP and the National Food Aid Programme (PNAA). In 2011, the PNAA distributed 17 types of foodstuffs (including meat, fish, fresh fruit and vegetables) complementary to the 34 types of food products distributed by the MDP. In fact, the PNAA was implemented in 2004 as a counterbalance to MDP intervention food products to offer a more balanced diet to the people in need.
Figure 31 below shows the evolution of the breakdown of budget allocation per type of food products under the MDP between 1995 and 2012. Between 2007 and 2011, the main food
142
Regulation (EU) No 121/2012 of the European Parliament and of the Council of 15 February 2012amending Council Regulations (EC) No 1290/2005 and (EC) No 1234/2007 as regards distribution of food products to the most deprived persons in the Union 143
According to the Italian AGEA representative interviewed, accompanying measures are important and particularly useful for young people and parents of babies. In his opinion, MDP funding available is barely sufficient to provide food to the growing number of people in need; hence the knowledge of food is less important than the food itself in the context of the scheme. Nutritional knowledge of the MDP could be improved by drawing from other funds. Also, collaboration between governments and voluntary organisations is fundamental to guarantee that the accompanying measures achieve the target. Some organisations in Italy are currently implementing projects to raise public awareness (especially among students) to reduce the amount of food that is wasted or misused. 144
One of the criteria that is applied in Italy for choosing the food products that are distributed is the maximisation of the per capita quota, with optimisation in terms of quality and quantity. For this reason, the nutritional value of a certain food products in the framework of a balanced diet is related to its unitary cost.
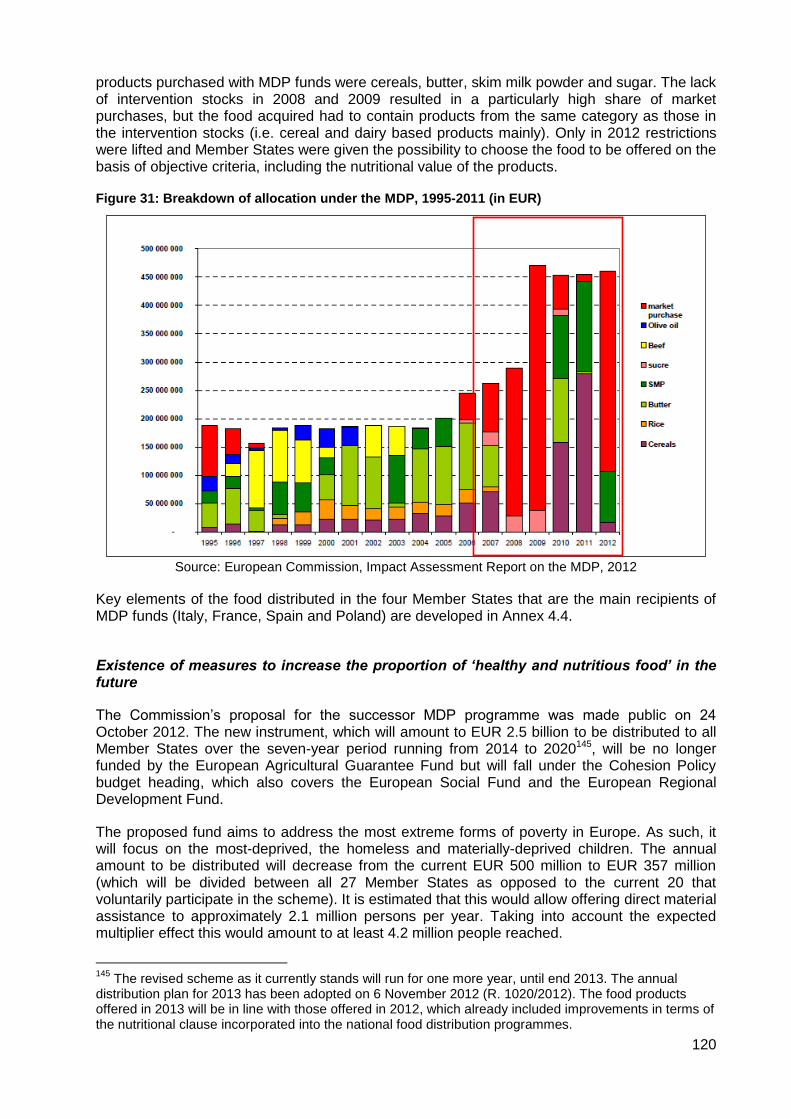
120
products purchased with MDP funds were cereals, butter, skim milk powder and sugar. The lack of intervention stocks in 2008 and 2009 resulted in a particularly high share of market purchases, but the food acquired had to contain products from the same category as those in the intervention stocks (i.e. cereal and dairy based products mainly). Only in 2012 restrictions were lifted and Member States were given the possibility to choose the food to be offered on the basis of objective criteria, including the nutritional value of the products.
Figure 31: Breakdown of allocation under the MDP, 1995-2011 (in EUR)
Source: European Commission, Impact Assessment Report on the MDP, 2012
Key elements of the food distributed in the four Member States that are the main recipients of MDP funds (Italy, France, Spain and Poland) are developed in Annex 4.4.
Existence of measures to increase the proportion of ‘healthy and nutritious food’ in the future
The Commission’s proposal for the successor MDP programme was made public on 24 October 2012. The new instrument, which will amount to EUR 2.5 billion to be distributed to all Member States over the seven-year period running from 2014 to 2020145, will be no longer funded by the European Agricultural Guarantee Fund but will fall under the Cohesion Policy budget heading, which also covers the European Social Fund and the European Regional Development Fund.
The proposed fund aims to address the most extreme forms of poverty in Europe. As such, it will focus on the most-deprived, the homeless and materially-deprived children. The annual amount to be distributed will decrease from the current EUR 500 million to EUR 357 million (which will be divided between all 27 Member States as opposed to the current 20 that voluntarily participate in the scheme). It is estimated that this would allow offering direct material assistance to approximately 2.1 million persons per year. Taking into account the expected multiplier effect this would amount to at least 4.2 million people reached.
145
The revised scheme as it currently stands will run for one more year, until end 2013. The annual distribution plan for 2013 has been adopted on 6 November 2012 (R. 1020/2012). The food products offered in 2013 will be in line with those offered in 2012, which already included improvements in terms of the nutritional clause incorporated into the national food distribution programmes.

121
Under the new programme, each Member State will be free to choose whether to use the funds allocated to provide food assistance, or, alternatively, to use all or part of the funds to organise other types of non-financial support to people experiencing severe material deprivation. Support may cover materials necessary for settling in permanent housing and children clothing.
In terms of the existence of measures to increase the proportion of ‘healthy and nutritious food’ in the future, the introduction of accompanying measures could help to enhance the nutritional knowledge of the most deprived people and to change eating habits. According to the Impact Assessment report, the accompanying measures should ensure a greater sustainability of the results obtained.
However, in view of the reduced budget, the degree to which Member States will opt for the possibility to go beyond food aid is still uncertain. The assumption in the Impact Assessment report, which is confirmed by the views and concerns of national authorities and voluntary organisations interviewed,146is that the Member States currently using the MDP will continue to distribute food aid, whereas the Member States not using it will concentrate on the new areas of activity.
It is also unclear if Member States will maintain the nutritional considerations in the food products to be distributed from 2014 onwards. In light of the foreseen budget cuts, it is expected that the priority of the countries that participate in the current scheme will be on maximising the amount of food to be purchased and the number of people to be reached. In other words, the key objective will be to feed people; hence, cheap food products with a high calorie intake (e.g. pasta, rice, milk, etc) are more likely to prevail than more expensive food products with a higher nutritional value (e.g. vitamins and proteins). If the food offered incorporates nutritional considerations, this will be of course a plus, but the cost of food products will remain the main priority.
Challenges to promoting healthy eating among poor people There is consensus among MDP stakeholders interviewed that the most vulnerable people eat less well mainly because of the existence of economic barriers that limit the kind of products that they can buy or receive from charitable organisations. Poor people eat what they can / when they can. The nutritional disorder opens the door to many problems, including overweight and obesity. Interviewees emphasised that across Europe, the prices of many foodstuffs that are high in fat, salts and/or sugars tend to be noticeably lower than healthier, more nutritious food, giving disadvantaged communities little choice but to opt for the less healthy options. According to national representatives and charities interviewed, the real challenge is economic poverty. People of low socio-economic status need better, more accessible and affordable food available to them in a sustainable way that can in turn help in the promotion of social inclusion – not just emergency food of high energy and fat value. Accompanying measures are judged to be important, in particular if they focus on specific target groups such as younger people or families with children in need. These measures help to create a food culture by raising awareness of the importance of specific food products in the daily diet, and suggesting food products otherwise not available for purchase. It is agreed that even the most vulnerable people can make adequate choices from a nutritional point of view, favouring some food products over others with the available budgets. However, the shared view is that accompanying measures should not be implemented at the expense of food aid, i.e. taking away resources that could be focused on distributing food. In the
146
Interviewees expressed their worry that this wider menu of choices would further reduce the volumes of food aid distributed.
122
context of the current MDP scheme (and all the more so under the successor programme), where available funding is barely sufficient to provide food to the growing number of people in need, the knowledge of food is less important than the food itself.
Conclusion
During the period covered by this evaluation (2007-2011), the number of people benefiting from the MDP scheme has grown from over 13 million to almost 19 million (although these figures are likely to include some double-counting). As indicated above, the tonnes of products distributed should also be taken into consideration. The profile of MDP beneficiaries has changed and expanded as a result of the economic crisis in Europe in recent years. Both governments and charities interviewed report that recipients of food aid now include retired, recently unemployed, elderly people, young people, large families with young children, and people of whole districts that were once productive and due to the continuing recession have lost many workplaces.
Up until early 2012, the choice of food products was limited by the obligatory link between the food to be distributed and the products in intervention stocks. The main food products purchased with MDP funds between 2007 and 2011 were basic foodstuffs like cereal-based products (pasta, rice, flour), products containing sugar, and dairy products (milk, skim milk powder, butter and cheese). The lack of intervention stocks in 2008 and 2009 resulted in a particularly high share of market purchases, but the food acquired had to contain products from the same category as those in the intervention stocks (i.e. cereal and dairy based products mainly). While these are not ‘unhealthy’ products as such (but form part of a balanced diet), and while the key objective of the programme is to provide basic food to the needy (and not to improve their nutritional behaviour) in the framework of the evaluation of the Strategy we conclude that only a very small share of the food distributed through the MDP has potentially contributed to ‘healthier’ nutritional behaviour among the most deprived.
Nonetheless, despite the restrictions on the type of products imposed by MDP rules, one positive result of MDP funds is their leveraging effect on other sources of funding destined to food aid. In many participating countries, intervention products or products with a long conservation distributed with MDP funds are complemented by more perishable goods from other sources.
Only in 2012 restrictions were lifted to the types of food products that could be bought in the market and Member States were given the possibility to choose the food to be offered on the basis of objective criteria, including the nutritional value of the products. The programme has thus improved from a nutritional point of view thanks to less rigid rules, which offer the possibility to purchase food products on the market, and to the incorporation of a nutritional clause in the revised regulation.
In spite of the clear benefits that the MDP has had in feeding millions of needy people across Europe, during the period being evaluated (until 2011), it seems very unlikely that it had a significant effect on the nutritional behaviour of beneficiaries or contributed to the fight against the issues listed in the Strategy (obesity, overweight and related diseases such as diabetes, heart disease, etc.). It is still too early to measure any impacts resulting from the recent changes to the programme, and there are still logistical restrictions to distributing fresh fruit and vegetables under the scheme. The definitive shape that the successor programme will take, and how this can impact on the nutritional behaviour of beneficiaries in the future, also remains to be seen.
123
4.5.4. Impact of 2009 Preparatory Actions in the field of sport (HEPA projects)
Evaluation question 13:
What was the impact of the 2009 Preparatory Action in the field of sport (Health Enhancing Physical Activity projects)?
Number and type of HEPA projects and total funding Following the White Paper on Sport (2007) and the accompanying Action Plan, the Preparatory Actions in the field of sport were adopted by the Commission in 2008 to test the establishment and functioning of suitable networks and good practices in nine different fields related to sport with a view to a possible future EU funding programme for sport. One of these fields was health-enhancing physical activity (HEPA) promotion. Nine transnational HEPA pilot projects were selected for funding in 2009, out of a total of 134 applications received in this field, which represented over half of the total applications received for Preparatory Actions in 2009.
The objective of the selected HEPA projects was to support networking and exchange of best practices between the sport sector, schools, authorities and the private sector in preparation for a possible future EU programme for sport. Objectives, activities and outputs of HEPA projects were therefore not formulated to directly feed into the Strategy.
The total budget provided by the Commission for HEPA projects was EUR 1.98 million, which represented an average of slightly less than EUR 220,000 per project. The average Commission co-financing rate for these projects was 77%, with grant recipients required to contribute with the matching funds. Annex 4.2.1 provides an overview of the HEPA-related Preparatory Actions that were expected to contribute to the objectives of the EU Strategy on Nutrition, Overweight and Obesity-related Health issues.
Overall assessment of effectiveness of Preparatory Actions regarding good practice identification and dissemination The Evaluation of the Preparatory Actions and special events in the field of sport carried out by The Evaluation Partnership in 2011 undertook an assessment of the degree to which the funded actions generated and shared knowledge between different actors in different Member States, and the extent to which good practice was effectively disseminated. This section summarises the relevant findings presented in the final evaluation report. With regard to good practice identification, findings showed that:
The Preparatory Actions facilitated the generation and sharing of knowledge between different types of sport organisations in different countries, which is likely to support the development of incentive measures in the field of sport.
Involvement in the projects served to strengthen individual partner organisation’s own knowledge of the topic area, because they understood that many of the problems or issues faced were similar in other countries and they were able to learn from other partners. Importantly, by working together many projects seemed to be able to achieve synergies that would not have been possible if they had worked alone;
The other important contribution of the Preparatory Actions was that they helped to consolidate and structure the EU dimension. A key outcome for the envisaged new Sport Chapter in the proposed EU programme for education, youth and sport is that networks

124
brought together partners from diverse organisations and sectors, which enriched the partnerships created.
The evaluation also found that in established fields such as in the area of health-enhancing physical activity, networks could lead to identifying and articulating policy recommendations.
In terms of the effectiveness of the Preparatory Actions regarding dissemination of their results, findings from the evaluation evidenced that:
It was not possible to define precisely the numbers of individuals who were reached through the activities supported under 2009. However, the survey asked coordinators to estimate the number of people who actively participated in the activities organised during the project (e.g. attended events, visited associated websites, got involved in training, etc.). The following, albeit limited and partial, information was provided, which shows a significantly broader reach of actions in the field of HEPA:
Projects Estimated number of participants
Projects Estimated number of participants
HEPA Circa 380,000 Disability Circa 2,500
Education & training Circa 1,000 – 2,000 Gender Circa 750
Projects were intended to reach a broad cross-section of different types of relevant publics. A number of survey respondents indicated that their projects were intended to target other groups not listed in the survey question, including: the elderly, the general public, disabled organisations, municipalities and ministries.
Concrete contribution of relevant projects to the Strategy’s desired outcomes of encouraging physical activity and to providing evidence for policy making The analysis of the concrete contribution of relevant projects to the Strategy’s desired outcomes of encouraging physical activity and to providing evidence for policy making (and other priority areas) is based on an in-depth assessment of a sample of three HEPA Preparatory Actions funded by DG EAC (see Annex 4.2.2 for the detailed assessment reports). The analysis below should be read with the caveat that this evaluation is not intended to make a judgment of the projects as such, but it is really more an assessment of whether any direct / strong contribution to the objectives of the Strategy can be identified.
Table 15: HEPA Preparatory Actions selected for in-depth assessment
Action and timeframe Objectives Lead organisation
Preparatory Actions (DG EAC)147
Senior Sport Moving Age (S2-PORT) [01/2010-03/2011]
The project aimed at designing a holistic methodology (useful for different types of organisations) to introduce physical activity as a new lifestyle to prevent disease among elderly people. The methodology was based on the identification of relevant practices in the use of sport for prevention and healthy ageing.
Regional Ministry for Youth and Sports of Extremadura
147
The recent Evaluation of Preparatory Actions and Special Events in the field of sport, carried out by The Evaluation Partnership for DG EAC in 2010/2011, included case studies of three HEPA Preparatory Actions (AthléSante, Euro Sport Health, and Becoming the Hub). These three actions were not considered for the current sample in order to cover a different set of actions.

125
Action and timeframe Objectives Lead organisation
Sport Action Network of Europe (SANTE) [12/2009-03/2011]
The project aimed at promoting health enhancing physical activity with a starting point in sport organisations by encouraging cooperation between national and local sport organisations, business, schools, local governments, health organisations and other stakeholders in the field and by documenting examples of innovative cross-sectoral cooperation.
International Sport and Culture Association (ISCA)
Introducing every day Culture of Sports for Children in European Cities (YOU NEED EXERCISE!) [01/2010-01/2011]
The project was designed to promote physical activity among children through the exchange of best practices and activities amongst participating local governments which resulted in a database of successful practices and a practical handbook for other local governments.
City of Stuttgart, Sport Department
The SANTE project is considered to have made concrete contributions to three of the six objectives of the Strategy, namely encouraging physical activity, focusing on priority groups and settings, and developing the evidence base for policy making. There was also some work carried out that could be related to the second priority area focused on making the healthy option available, but this was intended to be a complement to the principal focus on health-enhancing physical activity. The contribution to the objective of physical activity was achieved through:
improvement of existing initiatives or development of new initiatives as part of the process of developing the SANTE action plans;
enhanced tools and training to SANTE participants to better work with beneficiaries;
identification and assessment of partnerships that stood out as best practices;
development of multiple dissemination tools;
development of ten new cooperation projects as a direct result of SANTE.
Many of the initiatives developed or identified as part of the project had a focus on specific priority groups, in particular senior citizens and children. In terms of contributing with evidence base for policy making, the SANTE project implemented an outreach strategy that differentiated between the European level, the national level and the local level. The ‘You Need Exercise!’ project is judged to have contributed to three of the six objectives of the Strategy, namely encouraging physical activity, focusing on priority groups and settings, and developing the evidence base for policy making. The contribution to the objective of physical activity was achieved through the development (and in some cases implementation) of new measures as a result of inspiration and exchange from the project:
in Stuttgart, a new programme called ‘kitafit’, was developed for children aged three to six years old;
Rotterdam started a programme for younger children up to six years old, based on the examples they learned about.
Athens, Innsbruck and Copenhagen launched strategic planning networking processes in their cities for the implementation of new programmes and/or the extension of existing ones.
In terms of contributing to the objective of priority groups and settings, activities and programmes were launched or expanded in child care centres, kindergartens, schools and sport clubs with a focus on enhancing the physical activity of children but also reinforcing the knowledge about the importance of practising sports.

126
In terms of contributing with evidence base for policy making, the ‘You Need Exercise!’ project produced two concrete outcomes for municipalities to benefit from the exchange of experience and successful interventions:
during the project over 200 best practice examples were identified and around 60 were considered suitable for an online database that was developed on best practices. The online database, which is currently maintained by the City of Stuttgart, is the core platform for the new European network ‘Cities for Sports’148;
the partner cities developed 28 guidelines on the promotion of children’s physical activity, which compile existing guidelines and scientific findings and provide practical solutions for the implementation of physical activity programmes among children.
The S2-PORT project could make a contribution to three of the six objectives of the Strategy, namely encouraging physical activity, focusing on priority groups and settings, and developing the evidence base for policy making. However, the consortium was integrated by universities and research institutions in its majority, and the project met with difficulties when it came to validating and disseminating the methodology with policy makers and practitioners in the field. The result was that the theory and guidelines that had been developed in the first phases of the project were not taken up to the next level, where practical application was supposed to take place. A problem seemed to have been that the profile of the consortium was too academic-oriented, hence project partners found it difficult to interact with policy makers and to ‘sell’ them the methodology for application in local settings. The other factor that affected the dissemination and application of the results of the project was the change of government in Extremadura immediately after the project had come to an end. With the new government, of a different political extraction, the Extremadura team that had led the project was replaced and any further dissemination that could have taken place was discontinued. More information on the Preparatory Actions in the field of sport, including this project, can be found on the Sport Unit's website149. Table 16 presents an overview of the extent to which each of the actions assessed contributed to the priority areas of the Strategy. It is interesting to note that the three projects could contribute to more priority areas of the Strategy than the initial two areas foreseen in the intervention logic of the Strategy, namely those of physical activity encouraged and evidence base for policy making. As such, the focus of the Preparatory Actions on priority groups and settings was clear and there were also efforts in one of the projects to contribute to making the healthy option available.
148
At the end of the project, consortium partners decided to extend the ‘You Need Exercise!’ platform to other cities and target groups, including youth, adults and senior citizens. That is how the ‘Cities for Sports’ network was born. The ‘Cities for Sports’ network currently supports 25 member municipalities in their interchange on cross-sectoral approaches. More information on the network can be found at http://www.citiesforsports.eu/ 149
http://ec.europa.eu/sport/library/documents/b1/eusf2012-preparatory-actions-and-specialevents-2009-2011.pdf

127
Table 16: Contribution of the selected actions to the priority areas of the EU Nutrition Strategy
Priority Areas / EU Nutrition Strategy SANTE project’s contribution
‘You Need Exercise!’ project’s
contribution
S2-PORT project’s contribution
1. Better informed consumers N/A N/A N/A
2. Healthy option available + N/A N/A
3. Physical activity encouraged ++ ++ +
4. Priority groups and settings ++ + + +
5. Evidence base for policy making ++ ++ +
6. Effective monitoring systems N/A N/A N/A
++:Concrete contribution to a priority area / +:Indirect contribution (though not yet materialised) to a priority area / N/A: No contribution foreseen
Two of the three actions assessed (i.e. SANTE and ‘You Need Exercise!’) can be said to have made concrete contributions to three of the six priority areas of the Strategy. In the case of the third action, there were a number of factors mainly related to the composition of the consortium (too biased towards the academic) and to the political changes in the region of Extremadura that prevented the crystallisation of concrete contributions. There were two main reasons behind the success of SANTE and ‘You Need Exercise!’ in contributing to the Strategy, namely:
the two actions were led by strong stakeholders and key referents in their respective fields (i.e. ISCA and the City of Stuttgart), both of whom built consortia with evident pre existing links and a history of collaboration and with strong potential for continuity;
the two consortia were integrated in their majority by stakeholders (i.e. sport grassroots organisations and municipalities) with a clear capacity to implement and to do networking and reach other relevant players (i.e. other sectors, other cities, others within a city, etc.).
Concrete lessons / activities identified in relevant projects that can be taken as good practices for enhancing physical activity and combating obesity by other organisations In terms of concrete lessons and activities identified, all three actions had a strong networking component as their ‘raison d’être’, in line with the specific objective of the Preparatory Actions in the Commission’s 2009 Annual Work Programme, which was “to test/support the establishment and functioning of suitable networks and exchange of best practice in policy fields already identified in the White Paper on Sport.” The following lessons were identified by the evaluation in relation to the networking dimension of the projects under assessment:
networks established out of already existing forms of collaboration (i.e. SANTE and ‘You Need Exercise!’) were more likely to endure than networks that were specifically built for the project;
in a similar line, partners within networks who had a history of collaboration were more likely to exercise an active role in the project than partners who were new;
the capacity of project coordinators to transcend the boundaries of the network and to reach other relevant stakeholders in the field through outreach and dissemination was judged key to guarantee the sustainability of the partnership and to expand it further;
the capacity of project coordinators to exercise an adequate management role, stating clear objectives and tasks to partners from the outset, communicating regularly with them, and providing the necessary tools and support to partners to undertake their tasks was also seen to be very important to maintain partners’ commitment;

128
within larger networks, approaches encouraging bilateral or trilateral exchanges (e.g. consultations and twinning exchanges organised in the framework of SANTE) were judged to be positive for promoting more concrete results.
Identified longer term impacts of relevant projects to enhancing physical activity, and reducing overweight and obesity in the EU Even with the relatively modest budgets and timeframes, two out of the three Preparatory Actions assessed (i.e. SANTE and ‘You Need Exercise!)’ can be said to have achieved some impact and to be headed in the right direction towards the longer term impacts set. Factors that help explain the differences between projects with similar budgets include:
project coordinators and partners that are policy makers (i.e. ‘You Need Exercise!’) or grassroots organisations/practitioners (i.e. SANTE) have the capacity to move from theory to practice. In both cases, concrete activities and programmes with the potential to impact on many beneficiaries were implemented as a result of the project networking and exchanges;
dissemination is a key factor for the take up of actions or results;
particularly in the case of larger networks internal communication is important to achieve overall results and to better communicate to external stakeholders;
sustainability of projects (after EU funding has ceased) is also important in terms of consolidating the results achieved and further widening their impact. Continuity is more likely to happen between partners with a history of collaboration.
Figure 32 below outlines the expected longer term impacts of each project.
Figure 32: Expected impacts of the actions assessed
Expected Impacts
Contribute to the goal
of having 100 million
more EU citizens
active in sport and
physical activity by
2020
SANTE‘You Need
Exercise!’S2-PORT
Contribute to the
reduction of adiposity,
overweight and
chronic illnesses such
as juvenile-onset
diabetes through the
promotion of regular
activity for children
Contribute to decrease the number of unhealthy citizens in Europe
Support networking
and exchange of
relevant practices
between relevant
actors in the field of
active ageing through
physical activity

129
Conclusion
Nine transnational HEPA pilot projects were selected for funding in 2009, to test the feasibility of more significant funding for sport (including HEPA actions) in the future. The objective of the selected HEPA projects was to support networking and exchange of best practices between the sport sector, schools, authorities and the private sector in preparation for a possible future EU programme for sport. One of the areas to be tested was HEPA promotion. A total of 134 applications were received in this field, which represented over half of the total applications received for Preparatory Actions in 2009. The total budget provided by the Commission for HEPA projects was EUR 1.98 million, which represented an average of slightly less than EUR 220,000 per project. Despite the modest budgets, it was observed by the evaluation that the focus on networking (in particular when projects are built on pre-existing partnerships which guarantee continuity after EU funding) is important to get the most out of each project.
The evaluation of Preparatory Actions and special events in the field of sport showed that the majority of projects served to strengthen the knowledge of partners engaged and most importantly helped to consolidate and structure the EU dimension. Dissemination issues were not covered in detail in the evaluation, but there was evidence that HEPA Preparatory Actions were judged by project participants to be particularly strong in disseminating their results.
Two of the three projects assessed seem likely to make a concrete contribution to several priority areas of the Strategy (including those of physical activity encouraged and evidence base for policy making), which is a very positive result considering the budgetary and timing constraints. Factors that explain the success of these projects include lead organisations with the capacity to implement activities and programmes as a result of project discussions and inspiration, but also with the resources to reach others (i.e. municipalities, sport organisations, etc.). Projects that were built on pre-existing partnerships resulted in strengthened collaboration. Dissemination and sustainability prospects were also important.
4.5.5. FP7 contribution to increasing understanding and evidence for policy-making
Evaluation question 14:
To what extent have the EU Framework Programmes (since 2007) helped to increase the scientific understanding of nutrition, overweight and obesity related issues? To what extent have these projects provided evidence to support EU policies and develop new strategy/legislation?
Number and type of projects on relevant topics and total funding
With a total budget of some EUR 50 billion over its seven years, the Seventh Framework Programme for Research (FP7) represents a substantial component of the European research effort, with a significant growth from earlier FPs. The broad objectives of FP7 have been grouped into four main areas of EU research policy, namely Cooperation, Ideas, People and Capacities. In particular, the FP7’s Cooperation strand fosters (among many others) collaborative research projects supporting the objectives of the Strategy by contributing to the

130
elucidation of mechanisms of nutrition related diseases and disorders and providing tools for the development of food, obesity treatment and public health policies to prevent diet-related diseases. The table below reflects the number of projects and amount of EU funding available in areas supporting the objectives of the Strategy150. Only projects launched between 2007 and end 2011 which fall within the scope of this evaluation are included:
Table 17: FP7 funding for research projects in areas supporting the objectives of the Strategy
FP7 Thematic Fields Number of Projects Funded Total EU Funding
Food, Health and Well Being 49 projects EUR 194,183,196
Diabetes and Obesity 19 projects EUR 84,276,822
Health Promotion and Disease Prevention 4 projects EUR 11,253,849
Clinical Research into Practice 1 project EUR 2,999,550
International Public Health and Health Systems 1 project EUR 2,703,358
TOTAL NUMBERS 74 projects EUR 295,416,775
Projects funded under FP7 areas that support the objectives of the Strategy have so far amounted to approximately 0.6% of the total budget of the programme.
Annex 4.3.1 presents the full list of relevant projects that were considered for the analysis.
Overall assessment of contribution of FP7 research (in all areas) for policy making
To assess the overall contribution of FP7 research for policy making, the evaluation team reviewed the FP7 Interim Evaluation Report of the Expert Group, published in November 2010151. While this evaluation report (as well as the similar reports on the Health Programme and the Preparatory Actions) covered all areas of research and did not make explicit reference to impacts on obesity, it provided an indication of the indicative outcomes and impacts of FP7, including impacts related to outreach, dissemination and communication to citizens, which helps to put the findings from the analysis of the selected NOPA-related projects (see below) into perspective.
The evaluation report recognised the inherent difficulties of measuring outcomes and impact of FP7 mid-way through the programme because of the inevitable lags between research and publication of results or in the translation of findings into policy or societal impact. However, it acknowledged that most of the specific programmes seemed to have devoted increased attention to dissemination, communication and policy-related activities. According to the report, the little evidence available regarding dissemination of knowledge seemed to be positive. When analysed in perspective, communication of results was judged to have improved in comparison with previous FPs: research results were found to be increasingly presented in final project conferences, and stakeholders and potential users were involved in the final phases of projects, and in some cases, in the production of policy briefs. The report acknowledged the efforts made by the Commission to enhance communication, including the development of practical guides for researchers to help them with communication
150
Relevant FP7-funded projects include those focused on research into consumer behaviour; health impact of food and nutrition; drivers for preventing obesity in target groups such as infants, children and adolescents, and into effective diet interventions; and research into health determinants, disease prevention and health promotion. 151
Interim Evaluation of the Seventh Framework Programme, Report of the Expert Group, Final Report 12 November 2010,

131
and societal outreach. However, it argued that there was room for improvement in terms of thinking about a standard approach to the use of the internet as a channel for promotion and dissemination and in relation to centralising FP7 communication efforts on the Commission’s side, which could positively impact on the overall branding and promotion of the programme and its research projects. Another suggestion formulated in the expert group’s report was to dedicate sufficient attention to potential impacts when setting objectives of calls for proposals. It should be noted that the above observations and recommendations were made three years ago, when there was less evidence of concrete impacts of the FP7-funded projects for policy making and for society at large. However, some of the reflections that the report identified at the aggregate level (i.e. a focus of projects on dissemination and on establishing ties with policy) are also detected in the context of the current assessment for the four projects analysed. Concrete contribution of relevant projects to the Strategy’s desired outcome of providing evidence for policy making
The analysis of the concrete contribution of relevant projects to the Strategy’s desired outcome of providing evidence for policy making (and potentially to the other objectives of the Strategy) is based on an in-depth assessment of a sample of four NOPA-related actions funded under FP7 (see Table 18 below for an overview of each selected action and Annex 4.3.2 for the detailed assessment reports). The analysis below is not intended to make a judgment of the projects as such, but is mainly an attempt to assess whether any direct / strong contribution to the objectives of the Strategy can be identified.
Table 18: NOPA-related actions funded by FP7 selected for in-depth assessment
Action and timeframe Objectives Lead organisation
EU Health Programme (DG SANCO)
Interventions to Promote Healthy Eating Habits: Evaluation and Recommendations (EATWELL) [04/2009-03/2013]
The project aimed at making an overview of healthy eating interventions in Member States, review existing evaluations of the effectiveness of interventions, and identifying gaps, success and failure factors. Its final objective is to provide policy makers with best practice guidelines to develop interventions that will encourage healthy eating across Europe.
The University of Reading, UK
Food Labelling to Advance Better Education for Life (FLABEL) [08/2008-01/2012]
The project aimed at determining how food nutrition labelling can affect dietary choices, consumer habits and food-related health issues by developing and applying an interpretation framework incorporating both the label and other factors/influences.
European Food Information Council
Targeting Obesity-driven Inflammation (TOBI) [01/2008-06/2011]
The project aimed at analysing mechanisms provoking adipokine-mediated crosstalk and an inflammatory drift in obese patients. Its remit was to develop novel strategies to reduce or reverse major adipokine-mediated adverse interactions in peripheral tissues and by periorganic adipose tissue, namely insulin resistance and vascular dysfunction, respectively.
Medical University of Vienna
European Energy Balance Research to Prevent Excessive Weight Gain among Youth (ENERGY) [02/2009-07/2011]
The project was focused on the development and formative evaluation of a school-based and family-involved intervention scheme ready to be implemented across Europe, aimed at promoting health behaviours that contribute to a healthy energy balance among youth.
VU University Medical Center, The Netherlands

132
All four projects assessed aimed to contribute, mainly through research undertaken in different fields, to developing the evidence base for policy making152. In other words, even though the four projects were research-oriented, there were clear implications derived for public policy. In fact, the communication and dissemination of the results of the research undertaken and in particular the dialogue with policy makers and key relevant stakeholder groups of were already foreseen and planned in the design of these projects. The EATWELL project compiled information on more than 100 national-level policy interventions in Europe, classified them in two broad groups, and identified gaps, success and failure factors for these campaigns. The project’s main objective was to improve nutrition policy making in Europe by providing scientific evidence of the effectiveness of these interventions. The project’s main output was a number of recommendations addressed at policy makers to improve the different types of measures under analysis, namely advertising controls, social marketing, nutrition education and nutrition labelling, fiscal measures, availability measures for disadvantaged group, reformulation and regulation interventions. The aim of the FLABEL project was to determine how nutrition information on food labels can affect dietary choices, consumer habits and in the longer term impact on food-related health issues. The background to FLABEL’s financing was the on-going discussion in Europe about how to improve nutrition labelling and the debates around different labelling options. FLABEL kicked off in parallel to legislative discussions around the review of Directive 90/496/EEC on nutrition labelling of foodstuffs. According to project interviews carried out, there were attempts from the Commission to put the project on a “fast track” so that it could contribute more effectively to the legislative process. Even though the final results were not available on time, the project contributed strongly to the debate. The TOBI project, which was highly research-oriented, attempted to identify a potential drug target that could help in the fight against the obesity epidemic and consequently impact on obesity health care and on the perception of obesity by national and international policy makers. The main objective of the ENERGY project was to raise awareness of the importance of breaking up sedentary behaviour among school children. The evidence collected through the research and the pilot intervention that was implemented provided relevant information on the determinants of sedentary behaviour and presented tools to combat it. The results of the project are expected to feed into the design and implementation of future interventions. Interestingly, as reflected in Table 19 and further expanded below, NOPA-related projects funded by FP7 also contributed (directly or indirectly) to the other priority areas of the Strategy.
Table 19: Contribution of the selected actions to the priority areas of the EU Nutrition Strategy
Priority Areas / EU Nutrition Strategy EATWELL project’s
contribution
FLABEL project’s
contribution
TOBI project’s
contribution
ENERGY project’s
contribution
1. Better informed consumers + + + +
2. Healthy option available + + N/A N/A
3. Physical activity encouraged N/A N/A N/A +
4. Priority groups and settings + + N/A ++
5. Evidence base for policy making ++ ++ ++ ++
6. Effective monitoring systems N/A + N/A +
++:Concrete contribution to a priority area /+:Indirect contribution (though not yet materialised) to a priority area / N/A: No contribution foreseen
152
The results of EATWELL and FLABEL were used as part of the evidence base for the present evaluation (in particular the EATWELL results were an important input for the case studies).

133
Better informed consumers: EATWELL and FLABEL focused on the collection of evidence on the effectiveness of specific interventions (including nutrition labelling) on consumers, and formulated recommendations to policy makers based on the results. ENERGY was mainly about identifying and analysing specific energy-balance related behaviours and determinants and designing a pilot intervention that could then be implemented by policy makers, thus potentially contributing to the objective of better informed consumers. In an attempt to bring down the results of the project and to communicate to a wider audience, the TOBI project had a heavy focus on dissemination activities targeted at the general public and at key stakeholders with the aim of raising awareness of the importance of acquiring healthier nutrition habits.
Healthy option available: an important part of EATWELL’s research focused on the identification and analysis of measures that enhanced the availability of healthy foods, that restricted the availability of unhealthy foods or nutrients or that changed relative prices of food through taxes and subsidies. The research undertaken by FLABEL unveiled that labelling can be considered as a mechanism to set standards that can be used to influence product development. In other words, given that nutrition labelling makes some aspects of the products more visible, producers are led to change the composition of these products which leads to making the healthy option available.
Physical activity encouraged: the UP4FUN intervention developed in the framework of the ENERGY project aimed at reducing and breaking up sitting time at home (with special emphasis on TV and PC/electronic games) and to break up sitting time in school in children
aged 10‐12 years.
Priority groups and settings: ENERGY in particular was clearly focused on specific priority groups and settings, namely school-children aged 10 to 12. EATWELL and FLABEL also undertook some research on vulnerable groups with specific needs (e.g. diabetics).
Effective monitoring systems: Both FLABEL and ENERGY contributed to the objective of effective monitoring systems. The two projects established best practices and methodological benchmarks that can be used in future studies.
Concrete lessons / activities identified in relevant projects that can be taken as good practices for combating obesity in the EU
One common positive feature of all four projects that can be taken as good practice for combating obesity is the clear effort to move beyond the research results and the academic world and to make recommendations and provide tools for policy makers and implementers. This was evident in the consortia teams, all of which were mainly integrated by researchers but included partners representing non-academic sectors, such as not-for-profit organisations, communicators, industry representatives, etc. The project work plans also reflected this intention: all four projects featured distinct dissemination work packages (with communication activities and tools targeted at different stakeholders, including in many cases to the media). EATWELL, FLABEL and ENERGY went a step further and incorporated work packages specifically addressed at deriving implications for or making recommendation to policy makers.
The EATWELL project was particularly good at identifying, categorising and analysing the effectiveness of different types of interventions in the field of nutrition policy. The comprehensive overview undertaken is a key input to the strategic discussion on the most appropriate types of approaches and measures in the fight against overweight and obesity in Europe. The EATWELL results were presented to the High Level Group at its meeting on 15 November 2012, which is another indication of its policy relevance and dissemination efforts.

134
FLABEL’s added value consisted in going further down the line of the research undertaken on nutrition labelling to determine if consumers read / pay attention to labels; if consumers are attracted to particular types of labels; if and how consumer infer healthiness from nutrition labels; and if there are any effects of labels on dietary intake and dietary habits. The research constitutes a landmark that can be used in future research in this area, and its focus on public policy through the participation and feedback from policy makers was also important to bring the results of the research down to the ground.
TOBI’s experience provided two concrete lessons that can be taken as good practice examples. The first was the appointment of a dissemination and management partner, who was responsible inter alia for dissemination via events, press, web presence and social media. This delegation of management and communication tasks conferred to the project an important non-scientific dimension that allowed to divulge the results to a wider audience. The second important contribution of the TOBI project was a toolbox developed for further scientific work on obesity research. The toolbox includes standard operating procedures that guarantee uniform operating methods in clinical trials, animal and in vitro experiments and a bio bank to facilitate material exchange between TOBI members.
The ENERGY project proposed to test the results of the research undertaken in a pilot intervention, which was implemented in 5 countries. The intervention, which according to partners could have been developed in a longer timeframe and could have been adapted to different settings, was the result of a thorough data-collection process which included primary field work and secondary data analysis. The main objective of the project was to provide the example that interventions need to be based on evidence to yield meaningful results.
Identified longer term impacts of relevant projects to addressing nutrition, and reducing overweight and obesity in the EU
All four projects assessed have clearly contributed to building the evidence base for policy making in the field of nutrition and the fight against overweight and obesity in the EU. The secondary research undertaken has built upon existing interventions and studies and has brought about a more integrated overview of efforts undertaken. The primary research conducted has provided novel insights and could constitute a baseline for future research. The majority of projects have only been finalised recently or are currently closing, so it is still too early to reflect on the longer term impacts. However, timeframes have been particularly longer on average, and budgets have been substantially higher, than for the other projects funded under the Health Programme or the HEPA Preparatory Actions and assessed as part of this evaluation. This has contributed to enhance the individual visibility, reach and role of these projects in a scenario of multiple actions receiving support from DG RTD. Another common feature of all four projects is that the respective consortia were integrated in their majority by partners with a long-standing history of collaboration who knew each other and who were familiar with EU rules. This characteristic makes it more likely that collaboration will continue in the future. In fact, new follow up projects were already confirmed in some cases maintaining the core teams and focusing on related subjects. The ultimate impact of many of these projects is however dependent on the use that is made of their results by policy makers and practitioners. Dissemination strategies and links with policy makers and other key stakeholder groups have been key elements of the work plans, and non-academic partners with relevant expertise have been appointed to coordinate work with this objective in mind, which increases the likelihood that the results will be taken into account and used (where appropriate) by relevant actors in the future.

135
Figure 33 below outlines the expected longer term impacts of each project as reconstructed in the individual intervention logics that are presented in the Annex.
Figure 33: Expected impacts of the actions assessed
Detailed analyses of the expected impacts of each of the projects assessed are included in Annex 4.3.2.
Conclusion
Between 2007 and 2011 there were 74 actions funded by FP7 that support the objectives of the Strategy, with a total budget of EUR 295.4 million. Even though funding for NOPA-related projects represents approximately 0.6% of the total budget of FP7, the number of projects and the budget invested were substantially higher than those of the Health Programme and the HEPA Preparatory Actions funded by DG EAC.
Even though it is too early to consider long term impacts, all four projects assessed were designed and implemented with a view to enhancing the evidence base for policy making. In other words, even though the four projects were research-oriented, there were clear implications derived for public policy. The research conducted by the project teams was communicated to relevant stakeholders and disseminated widely in the media with a view to deriving policy implications and to making recommendations. Consortia teams were mainly integrated by researchers but included partners representing non-academic sectors with ties to and knowledge of relevant groups. The potential of these projects to impact on policy makers and society at large is significant, but dependent upon the concrete use that is made of their results.
The FP7 interim evaluation report written in 2010 argued that there was scope for the Commission to further enhance the overall branding and promotion of the programme and its research results, which could certainly help to sustain project results and findings so that the research does not lose its momentum after the projects come to an end.
Expected Impacts
Provide policy, data
collection and
monitoring advice in
relation to healthy
eating and generate
best-practice
guidelines for
implementation
EATWELL FLABEL ENERGY
Contribute to decrease the number of unhealthy citizens in Europe
TOBI
Provide evidence
base at pan-European
level on the role that
nutrition information
plays on food labels
Reduce the risk of
obesity-associated
disorders through the
identification of a
potential drug target
Contribute to the
prevention of
unnecessary weight
gain among school-
aged children through
the design and testing
of an evidence-based
intervention ready to
be implemented and
tested across Europe
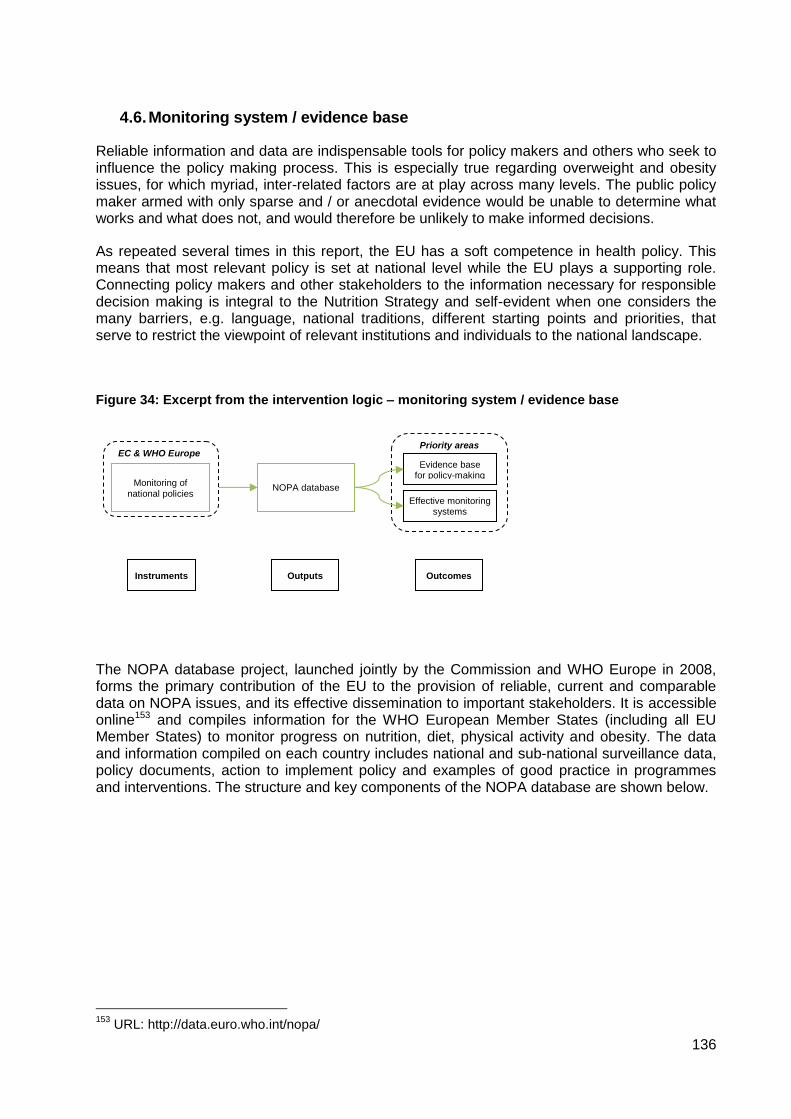
136
4.6. Monitoring system / evidence base
Reliable information and data are indispensable tools for policy makers and others who seek to influence the policy making process. This is especially true regarding overweight and obesity issues, for which myriad, inter-related factors are at play across many levels. The public policy maker armed with only sparse and / or anecdotal evidence would be unable to determine what works and what does not, and would therefore be unlikely to make informed decisions.
As repeated several times in this report, the EU has a soft competence in health policy. This means that most relevant policy is set at national level while the EU plays a supporting role. Connecting policy makers and other stakeholders to the information necessary for responsible decision making is integral to the Nutrition Strategy and self-evident when one considers the many barriers, e.g. language, national traditions, different starting points and priorities, that serve to restrict the viewpoint of relevant institutions and individuals to the national landscape.
Figure 34: Excerpt from the intervention logic – monitoring system / evidence base
The NOPA database project, launched jointly by the Commission and WHO Europe in 2008, forms the primary contribution of the EU to the provision of reliable, current and comparable data on NOPA issues, and its effective dissemination to important stakeholders. It is accessible online153 and compiles information for the WHO European Member States (including all EU Member States) to monitor progress on nutrition, diet, physical activity and obesity. The data and information compiled on each country includes national and sub-national surveillance data, policy documents, action to implement policy and examples of good practice in programmes and interventions. The structure and key components of the NOPA database are shown below.
153
URL: http://data.euro.who.int/nopa/
EC & WHO Europe Priority areas
Evidence base for policy-making
Effective monitoring systems
Monitoring of national policies
NOPA database
Outputs Instruments Outcomes

137
Figure 35: WHO European database on nutrition, obesity and physical activity (NOPA)
Source: Wijnhoven T, Bollars C, Racioppi R: WHO European Database on Nutrition, Obesity and Physical Activity (NOPA). Presentation at the 2nd Meeting of the HEPA Europe-EU Contact Group, Amsterdam, 12 October 2011
WHO Europe officials collect and collate surveillance data from a variety of international sources, which is then supplemented by other sources with the help of national focal points (NCPs) within each country’s ministry of health. The NCPs also compile information on policies and actions which is validated and evaluated by WHO Europe.
The intention is for the database to be periodically updated and expanded with data on nutritional status, food consumption, nutrient intake, physical-activity levels and policy implementation in each Member State. WHO Europe continuously collects new surveillance data as it is released, while the majority information on national actions and policies was collected via two templates completed by NCPs in 2009. Since then, updates have progressed on an ad hoc basis, with WHO Europe in periodic contact with NCPs. Ultimately, the NOPA database is intended to enable policy makers and other stakeholders to identify gaps and needs in data collection and policy development, show progress in their efforts to tackle obesity and learn from the experiences of others Member States.
This section therefore assesses the NOPA database project in terms of its contribution to surveillance, the collection and collation of information on national NOPA policies and actions and the dissemination of results among policy makers and other stakeholders. It also attempts to gauge the extent to which the NOPA database has been an aid to policy making. In addition, where appropriate other sources of data, most importantly the European Health Interview Survey (EHIS) and the sources used to inform section 2 of this report are also taken into account. In order to make this assessment, the evaluation team has considered the documentary evidence as well as interviews with the contributors to and users (and potential users) of the NOPA database.

138
4.6.1. Existence of monitoring structures in the EU Member States
Evaluation question 15
To what extent are the monitoring structures in place in the 27 EU Member States?
This question relates to the existence of data and information that should in theory be contained in the NOPA database and relies to a large extent on the information collected for it and made available to the evaluators. It is important to acknowledge that monitoring structures may exist that the NOPA database has not managed to capture. While a more detailed assessment would require a comprehensive review of national monitoring structures and policies, the NOPA database project itself, a multi-year endeavour involving several full-time staff, is meant to fulfil this function. As mentioned above, our examination of the NOPA database is supplemented where relevant with other available data sources and the views of NOPA database users.
1. Level of completeness, timeliness and comparability of national surveillance data on obesity, dietary habits and physical activity / inactivity
Completeness
There are three key areas – overweight and obesity, nutrition intake and physical activity – about which WHO Europe attempted to gather surveillance data. The exercise clearly showed that the vast majority of countries reported some data in each of these areas: no countries failed to produce any overweight or obesity data, just two countries reported no data at all about physical activity rates and only eight Member States did provide WHO Europe with some information about national food consumption.
However, the apparent ubiquity of relevant data masks important shortcomings (all of which are also highlighted in the section 2 of this report on the analysis of statistics and trends). With relation to the completeness of surveillance data, there are demonstrable and widespread differences between countries. Using WHO Europe’s breakdown of data into three categories relating to 1) adults; 2) adolescents; and 3) children reveals that countries were far more likely to collect information on adults than on either of the other two groups, and more likely to collect information on children than on adolescents. That being said, there are some inconsistencies in this finding. Denmark, for example, provided obesity data covering adolescents but not children, while doing the opposite for physical activity prevalence. Hungary collected food consumption data for adolescents but not for children. Such examples abound, and some Member States, such a Romania and Luxembourg, produced data for only two out of the possible nine datasets. It is also worth pointing out that for most Member States data on overweight and obesity was far more complete than for either physical activity or food consumption.
The map below summarises this and paints a picture that is broadly positive in terms of the types of data collected. It points out that for nearly half (13) of countries WHO Europe was able to find data on between four and six of the nine possible types of surveillance data, while for ten Member States it found data for between six and nine of the types and only in four Member States was data available in three or fewer.

139
Figure 36: Number of types of surveillance data recorded (out of a possible 9)
Source: NOPA database country fiches
However, even this level of detail conceals an important aspect of the data’s completeness, namely the extent to which it is obtained using reliable and robust methods. In this respect the quality of the data collected varies considerably depending on the Member State and specific issues in question. For example, a report recently produced as part of the NOPA database project reports on the various methods the Member States employ for physical activity surveillance. The report identifies large methodological variations, for example, whether surveys are self-recorded or professionally administered. These lead to differences in the quality (and comparability) of the data collected. For illustrative purposes, the table on the next page looks at the ways in which five countries, all appearing ‘green’ on the map above, collect information about physical activity (those for which WHO Europe was able to find data for all nine of the possible surveillance areas). It shows large discrepancies. Some of the surveys are recorded yearly while others were only recorded once; some use self-reported data while others use professional interviewers; some have short time frames, asking about respondents’ activity that week or month, while others focus on longer periods of time. Finally, some surveys use standard, internationally agreed questionnaires based on either the Global physical activity questionnaire (GPAQ) or International physical activity questionnaire (IPAQ), while other countries devise their own sets of questions. All of these methods vary in their level of robustness, in addition to affecting stakeholders’ ability to ascertain trends or compare datasets. Similar discrepancies likely exist for other types of surveillance data, but in-depth examination is not possible using the current version of the NOPA database website.
1-3
Types of surveillance
data available:
4-6
7-9
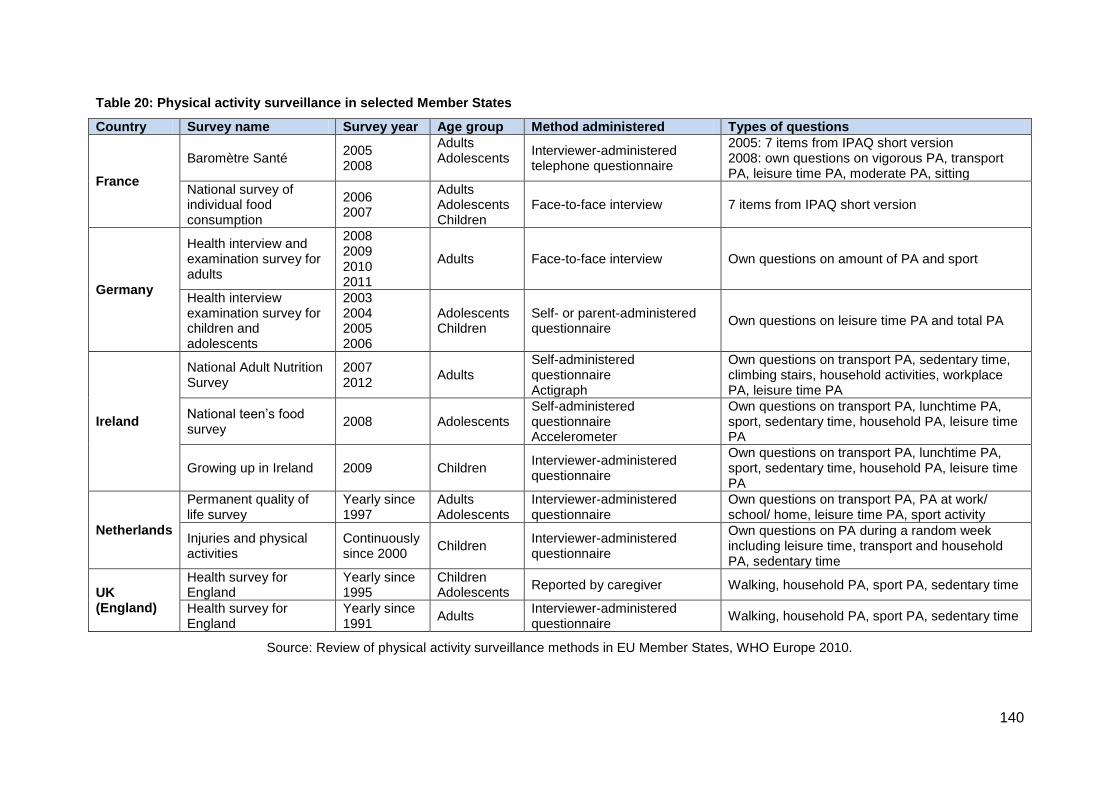
140
Table 20: Physical activity surveillance in selected Member States
Country Survey name Survey year Age group Method administered Types of questions
France
Baromètre Santé 2005 2008
Adults Adolescents
Interviewer-administered telephone questionnaire
2005: 7 items from IPAQ short version 2008: own questions on vigorous PA, transport PA, leisure time PA, moderate PA, sitting
National survey of individual food consumption
2006 2007
Adults Adolescents Children
Face-to-face interview 7 items from IPAQ short version
Germany
Health interview and examination survey for adults
2008 2009 2010 2011
Adults Face-to-face interview Own questions on amount of PA and sport
Health interview examination survey for children and adolescents
2003 2004 2005 2006
Adolescents Children
Self- or parent-administered questionnaire
Own questions on leisure time PA and total PA
Ireland
National Adult Nutrition Survey
2007 2012
Adults Self-administered questionnaire Actigraph
Own questions on transport PA, sedentary time, climbing stairs, household activities, workplace PA, leisure time PA
National teen’s food survey
2008 Adolescents Self-administered questionnaire Accelerometer
Own questions on transport PA, lunchtime PA, sport, sedentary time, household PA, leisure time PA
Growing up in Ireland 2009 Children Interviewer-administered questionnaire
Own questions on transport PA, lunchtime PA, sport, sedentary time, household PA, leisure time PA
Netherlands
Permanent quality of life survey
Yearly since 1997
Adults Adolescents
Interviewer-administered questionnaire
Own questions on transport PA, PA at work/ school/ home, leisure time PA, sport activity
Injuries and physical activities
Continuously since 2000
Children Interviewer-administered questionnaire
Own questions on PA during a random week including leisure time, transport and household PA, sedentary time
UK (England)
Health survey for England
Yearly since 1995
Children Adolescents
Reported by caregiver Walking, household PA, sport PA, sedentary time
Health survey for England
Yearly since 1991
Adults Interviewer-administered questionnaire
Walking, household PA, sport PA, sedentary time
Source: Review of physical activity surveillance methods in EU Member States, WHO Europe 2010.

141
Timeliness
Surveillance data’s timeliness is comprised of both the extent to which it is current and the frequency with which it is compiled. The NOPA database shows considerable differences between EU Member States on both of these fronts. With regard to the former (apart from data on adolescent overweight and obesity, recorded in nearly all Member States as part of a 2010 OECD survey), some Member States can draw on overweight and obesity or physical activity data from as recently as 2011/ 2012, while for some Member States the most recently recorded data, if there is any available at all, dates from prior to 2007, as shown in the table below.
Table 21: Last year for which NOPA surveillance data is available per MS
Number of MS with most recent data in:
2011/12 2010 2009 2008 2007 or earlier
No data
Overweight and obesity
Adults 3 4 6 8 5 1
Adolescents - 24 - 1 1 1
Children - 11 - 4 6 6
Physical activity
Adults 4 3 - 6 10 4
Adolescents - - 1 3 3 20
Children 1 1 2 - 6 17
Food consumption
Adults - 1 - 4 12 10
Adolescents - 1 - 2 6 19
Children - 1 - 2 11 13
Total 8 46 9 30 60 91
No trend data has yet been published as part of the NOPA database project, but the evaluation team’s review of the evolution of NOPA issues (contained in section 3 and annex 1 of this report) makes clear that the frequency of data collection depends on the Member State and type of data in question. Generally, overweight and obesity data is recorded with more regularity than either physical activity prevalence or nutritional intake (though this also varies according to the Member State under consideration).
Comparability
The differences between Member States described above conspire to render comparison between countries difficult. This is exacerbated by a number of other factors, most notably methodological discrepancies and culturally varying interpretations of seemingly concrete terms, such as what constitutes physical activity and the age at which a person is considered an adult. This is especially true with regard to measuring physical activity rates and food consumption, in addition to overweight and obesity in children.
However, there have been numerous efforts at standardisation, and these have met with some success. For example, BMI is used by all Member States to record overweight and obesity in adults and adolescents. With regard to physical activity, the International Physical Activity Questionnaire has been incorporated into the surveys of eight Member States.154 For nutrition, food consumption surveys are carried out using widely differing methodologies, but a degree of comparability is given by the Food Balance Sheets compiled yearly by the UN’s Food and Agricultural Organisation, which measure food availability in all EU Member States.
154
According to the review of physical activity surveillance methods in EU Member States, WHO Europe 2010.

142
Perhaps most importantly, the European Health Interview Survey incorporates all of three areas and is carried out across the EU using a standardised methodology specifically designed to facilitate comparison. So far it has been deployed once, in 2007-2009, meaning that trend data cannot yet be established, but a regulation was recently passed at European level155 stipulating that a second round of the survey will be carried out in 2013-2015.
2. Level of completeness, timeliness and comparability of data on national policies and actions (development and implementation)
A lack of information on the policies and actions taken in the Member States is the main problem the NOPA database project was envisaged to address, and it is now the principal store and source of such information. While there are discrepancies between the information that has been entered into the database and the information that has made available to the evaluators, the ensuing sub sections attempt to gauge the level of completeness, timeliness and comparability of the data. Much of the assessment relies on the evaluation team’s examination of the available information, but where relevant interviews it also includes the findings of interviews with users and potential users of the database.
Completeness
Based on the country fiches provided by WHO Europe to the evaluators, it is evident that the NOPA database contains an extremely comprehensive store of information on Member State actions and policies, including (where relevant) a description of each policy, implementation status, the issuing body and the policy areas covered. In addition, NCPs were asked to provide feedback on the existence of certain types of policies relating to the key areas defined in the Strategy and to remark on their implementation status, the extent to which each of these policies targets overweight and obesity and specific socioeconomic groups, and whether implementing actions are carried out at national or local level. Questions were also asked about education and awareness-raising campaigns, coordinating mechanisms, lists of relevant stakeholders, the existence of public-private partnerships and voluntary actions by economic actors.
Despite the herculean effort required to complete the fiches, an examination of the completed versions shows that the vast majority of them were completed fully and comprehensively. While it is conceivable that some NCPs would either not have or be unable to obtain information on all relevant policies, interviews with a small sample of contributors to the database suggest that large amounts of time were invested in compiling the relevant information. Where necessary, this was supplemented by follow-up contact with WHO Europe to ensure completeness. Moreover, all final versions of the fiches were validated by WHO Europe before being officially entered into the database.
Timeliness
The NOPA database has been informed by two approaches, one systematic and process-driven and another based on open, informal dialogue between the NCPs and WHO Europe. The first of these is responsible for the majority of information contained in the database and consists of a consultation exercise whereby WHO Europe asked NCPs to complete two templates, which WHO staff then validated. NCPs submitted the original template in spring
155
Commission Regulation 141/2013/EU, url: http://eur-lex.europa.eu/LexUriServ/LexUriServ.do?uri=OJ:L:2013:047:0020:0048:EN:PDF.

143
2009. Another template, which expands on and complements the original, was submitted at the end of the same year. Thus as of the end of 2009 the database can be considered at its most complete.
The second approach to data collection entails the on-going work WHO Europe staff and their interaction with the NCPs. The work carried out under this approach has served to update the database during the time since submission of the abovementioned templates. While this has resulted in important improvements to the database it has also, according to interviewees, gathered information unevenly. In other words, the information in the database is more current for those countries with especially active and committed NCPSs, and those which WHO staff are particularly knowledgeable about. This became evident in interviews among users from around Europe, and renders it impossible to point to a specific moment subsequent to late 2009 when the database was fully up to date. The lack of a date on the website stating when it was last updated exacerbated this fact, as users and potential users were unable to gauge the extent to which they could rely on the NOPA database to provide them with current information, or at least information linked to a specific time. In addition, the onerousness of the original data collection exercise begs the question of how often it can plausibly be repeated in a similarly comprehensive way.
Comparability
The fiches completed to inform the NOPA database were specifically drafted as to facilitate comparability: where possible closed answer choices are used to describe features of policies such as the extent of implementation and the policy areas covered. Similarly, as described above, for each of a long list of types of policy, NCPs answered multiple-choice questions regarding various aspects of them. Ostensibly this would make the data relatively comparable and, indeed, to an extent this is the case.
However, it is also worth noting that differences in interpretation regarding the questions could easily muddle distinctions and reduce the level of comparability. For some issues, such as whether a given policy is ‘adopted’, in ‘final version’ or in ‘draft version’, providing objective responses should have been relatively straightforward for the NCPs. However, for other issues, such as whether a policy is ‘not existing, or not clearly stated in any policy document, and not planned within two years’, ‘clearly stated, partly implemented or enforced’ or ‘clearly stated and entirely implemented and enforced’ leaves much more room for interpretation. Indeed, as shown in the results to evaluation question 3, at times the level of implementation recorded for given key areas, compiled using NOPA database results, seems to bear little resemblance to objectively verifiable information. Distinguishing between ‘partly implemented’ and ‘clearly implemented’ appears particularly fraught, especially for actions other than legislation. All of this detracts from the overall level of comparability provided by the database.
In addition, it should also be noted that the current version of the NOPA database website does not allow for any comparison on the implementation of policies, but rather facilitates comparison on more limited aspects such as policy area covered and year of publication.
Conclusion
The NOPA database clearly provides a much more comprehensive store of data, on both surveillance and national actions and policies, than was available previously. By collecting data on such a wide range of issues and policies, it creates an unprecedented opportunity to share and compare such data and information across countries.

144
However, with regard to surveillance data, the database serves to highlight persistent discrepancies in the availability of data, in terms of completeness, as some Member States collect more comprehensive data than others, in terms of timeliness, as Member States vary in the regularity with which they conduct surveys, and in terms of comparability, since the Member States continue to use widely varying survey techniques, methodologies and definitions.
Regarding information on national actions and policies the NOPA database project has amassed a comprehensive set of data, and this is to be lauded. At the same time, it should also be noted that the labour-intensive exercise for populating the database acts as a brake on the extent to which it can be updated with regularly; the current version dates from late 2009, with subsequent updates being conducted (only) on an ad hoc basis. Moreover, the ability to compare policies from different countries is somewhat diminished due to potential differences in the interpretation of answer choices on the fiches that national contact points were asked to fill out. Difficulties in addressing these issues may explain why, thus far, only information on the existence of policies and basic descriptions, rather than the more comprehensive information collected, is available on the current version of the NOPA database website.
4.6.2. Effectiveness of WHO NOPA database communication
Evaluation question 16
Are the tools produced by WHO Europe, and in particular the NOPA database, being communicated to the right people, in the right way, at the right time?
Even a perfect database would be useless if nobody knew it existed, or if interested parties did not know what it contained or how to access it. For this reason, communicating about the NOPA database is just as important as developing and maintaining it. Through interviews with users and potential users, the evaluation team has attempted to shed some light on the general level of awareness about the NOPA database and what it contains. Given that the database has not been publicised heavily and that few potential users knew about it, a significant part of the interviews also focused on how WHO Europe and the Commission could best promote it in the future.
1. Dissemination of results
As mentioned above, the NOPA database has not been much publicised up to this point and the website is rarely promoted among external stakeholders. While it is open to the public and can be found using search engines such as Google, currently a large proportion of contributors to and users of the database is made up of the same people: WHO Europe’s own staff, Commission officials and the NCPs. Given the deep involvement of these groups in policy making, they are clearly important users and should continue to be so if and when WHO Europe promotes the website and other project materials more widely. The NCPs in particular are responsible for crucial functions within national (usually health) ministries and need reliable and comparative data for a host of reasons referred to numerous times in this report.
Leading from this, the minority of external stakeholders among interviewees who knew about the database prior to be contacted for interview were made aware either through word of mouth, a presentation by WHO Europe at a conference or other event or through what was described

145
by one interviewee as ‘random and frantic Googling’ when in need of comparative information on NOPA policies.
Recognising that communication campaigns are both expensive and hard to value, the current approach still presents significant shortcomings and results in missed opportunities. It relies heavily on the personal engagement of key stakeholders to make use of the database and inform their colleagues and contacts about it. Interviews with contributors to the database demonstrated highly variable levels of engagement, implying that other potential users may be aware of the database in some countries and in some ministries but not others, despite its potential value. This problem is exacerbated by the current version of the website, which presents only a fraction of the information entered into the database by WHO Europe. A small number of users explained that they maintain regular contact with WHO Europe, which upon request is able to present specially tailored comparative reports. These reports have been described as extremely useful (see evaluation question 17 below) but their reach cannot extend beyond NCPs who are both already aware of the kind of information the database contains (usually from completing a country template) and in enough contact with WHO Europe to know that such data requests can be made. An interested person who, against the odds,156 stumbled onto the NOPA database website would be unlikely to ascertain that more information was available and would not know to contact WHO Europe to find out about it.
The information in the NOPA database is also disseminated through periodic reports which present analysis of specific aspects of the database. These reports are printed and handed out at events where key stakeholders, such as policy makers, researchers and representatives of interest groups are present. In addition to data and commentary on issues such as surveillance methods for physical activity promotion, each report offers a description of the NOPA database project and directs readers to the website for more information. Stakeholders obtaining one at events such as the annual EU Sport Forum or meetings of the EU Platform would conceivably have their interest piqued and go on to examine the website and, potentially, use it. However, it is also telling that despite their diversity, none of the stakeholders interviewed for this evaluation could recall seeing these reports.
While the reports are publicly available for download, they are not catalogued and listed on the NOPA database website in a place that is easy to find, and although they are stored on the WHO Europe server, they are hard to find without entering the exact title into a search engine; it is unlikely that a relevant stakeholder would unearth pertinent information in this way. Other organisations sometimes publish the links, but according to their own priorities rather than WHO Europe’s. Moreover, the reports themselves do not follow a consistent structure. They act as deliverables under the various work packages of the joint EC / WHO Europe project, and thus serve both reporting and dissemination of information purposes. Some, such as report number 2: Report on the 2nd meeting of national information focal points,157 are clearly aimed at stakeholders with a direct interest in the project, while others, such as report number 6: review of physical activity surveillance data sources in European Union Member States158 have a (likely unrealised) appeal to a wider audience. A researcher, for example, coming across the first of these reports would not know to follow the series for potentially interesting editions at a later date.
Users and potential users were generally critical of the communication system described above, and voiced frustration that the Commission and WHO Europe had not put forward a more coherent and comprehensive alternative. For example, given the joint nature of the project, some interviewers were surprised that the project was not promoted on the Commission’s otherwise very informative Public Health site. In the words of one researcher, echoed by other
156
It does not appear among the first hits in Google searches using keywords such as ‘data on nutrition trends in Europe’, ‘obesity in Europe’ ‘nutrition policy in the EU’ etc. 157
http://ec.europa.eu/health/nutrition_physical_activity/docs/implementation_report_a1b_en.pdf. 158
http://www.euro.who.int/__data/assets/pdf_file/0005/148784/e95584.pdf.

146
interviewees, ‘why isn’t there a link to the database on the Commission’s own website? If it was promoted on that site I would have found out about the database a long time ago because I consult it frequently’. Similarly, interviewees felt more mention could have been made of the project in meetings of the Platform and other EU-level fora.
While all this suggests that the NOPA database project has not been effectively promoted up to this point, it also needs to be acknowledged that dissemination of results has not been a high priority for WHO Europe and the Commission. Instead, interviews with those responsible for the database explained that the previous phase of the project was based on creating a worthwhile product that can then be rendered user friendly and publicised more widely. For example, publication of a report summarising the state of play in each country is imminent, and the website is in the process of being completely re-tooled. While it is not yet clear how successful these upcoming initiatives are likely to be, a greater focus on communication is likely to be a step in the right direction.
2. Alignment between communication channels and tools used and preferences and needs of target audiences
It is already clear from indicator 1 that the channels and tools used to promote the NOPA database up to this point have not met the preferences and needs of target audiences. Indeed, the database is not promoted in a systematic fashion, much of the promotion that does exist is ad hoc and most interested stakeholders would be hard pressed to find out about it without prior knowledge. Having established this fact allowed more time in the interviews to explore the ways in which the NOPA database could be effectively promoted in the future, with a view to the greater emphasis on disseminating the information than has thus far been the case.
As alluded to above, interviewees were quick to point out that WHO Europe and the Commission should exploit opportunities for cross promotion. Both institutions currently have websites that are visited by many relevant stakeholders, but information about the NOPA database is either (in the case of WHO Europe) difficult to find or non-existent (in the case of the Commission). Some interviewees found this particularly surprising given the Commission’s funding of and commitment to the project, and felt that an explanation of it and links to the website and the relevant periodic reports would add considerable value.
In a similar vein, a few interviewees suggested that WHO Europe and the Commission make greater use of extant fora to talk about the database. For example, one interviewee felt that periodic updates on the status of the database and summaries of key findings could be provided to members of the Platform, either through presentations during the meetings or, at the very least, entries in the Platform meeting minutes and Flash Report – Conclusions from the Chair that are circulated to Platform members subsequent to meetings. Spreading information about the database within the Platform was seen as particularly important due to low levels of awareness and the potential relevance for its members. Based on particular users’ needs and interests, targeted communication was also suggested. This could revolve around a system whereby users would register their preferences and, when suitable, receive news on updates to relevant parts of the database.
Most interviewees also felt that more external promotion would be useful, and that it should be more systematic and purposeful than has currently been the case. For example, nominally the database has been promoted to members of the HEPA Europe network through presentations at periodic events and the provision of some copies of the periodic reports. However, members do not receive regular newsletter updates on changes and improvements to the database and have not been alerted to the possibility of soliciting tailored reports from WHO Europe on particularly pertinent subjects. Among researchers and experts in specific sectors, it was

147
suggested that WHO Europe attempt to place articles on the database included in relevant newsletters and even advertise on the websites of scientific journals.
Conclusions
Communication of the NOPA database has not been extensive up to this point, reflecting the low level of priority assigned to it by WHO Europe thus far. In its current form, the database website is very difficult to find online without insider knowledge. Little advertising or even cross-promotion on the European Commission website or other fora is currently taking place, while its lack of functionality and confusing interface appears to discourage some potential users from engaging with the site or recommend it to colleagues.
The project has been promoted on a relatively small scale, via presentations by WHO Europe at conferences and through the publication of eight thematic reports on various aspects of the information collected and analysed. In addition, insiders such as the national contact points are, as policy makers, among the most important audience for the database, and they are all aware of it. Nonetheless, nearly all potential users interviewed about the database had never heard of it but thought it could be a valuable resource for their work. All of this strongly suggests that greater emphasis should be placed on promotion of the database in the future.
4.6.3. Usefulness of WHO monitoring material for policy development
Evaluation question 17
Does the current monitoring material produced by WHO deliver the necessary information to support sound policy development on health in the EU?
There are two key aspects to this question, one relating to the database’s potential and the other to its actual use. The latter is particularly fraught due to the communication issues highlighted in the response to question 16. However, an examination of the evaluators’ findings for each of the two indicators below provides some insight both into the results of the database so far and on the medium-term outcomes that can be expected in future if improvements to the communication strategy are developed and enacted.
1. Level of usefulness of the data as perceived by policy makers in relevant fields
Evaluation question 15 examined the extent to which the NOPA database was complete at the time of writing. This indicator turns to the usefulness of the database, referring, on the one hand, to the alignment between the information contained in it and the needs of policy makers (and other key stakeholders) and, on the other hand, to the ability of users to get from the database the data and information they need.
Nearly all users and potential users interviewed were extremely positive about the NOPA database as a concept and explained that it addressed a real need in terms of providing a ‘one-stop-shop’ for data and information about various NOPA issues. They reported difficulties in gleaning the information they needed from previously existing sources of data and felt that
148
the NOPA database either could help them or already was. In large part their difficulties related to language issues and a lack of knowledge about foreign sources of data, and the partial solutions they had been (or often, still were) practising were far less preferable to a well-functioning NOPA database: they confined their research to 1) international sources such as the OECD and Eurostat; 2) to countries they knew well (usually their own and, possibly, neighbouring countries whose languages and institutions they understood); and, 3) in some cases, asked for help from colleagues and acquaintances in other Member States. Even in the best of circumstances such data-gathering methods would only provide stakeholders with an incomplete picture, and in practice many interviewees were unable to find potentially valuable information about the experiences of other countries.
However, the potential worth of the NOPA database has been partially offset, at this stage, by two concerns. Firstly, much of the data collected for the database is not currently available on the NOPA database website. Of the four areas (surveillance, national policies and actions, good practices and status), the current version of the NOPA database website only allows users to access information on national policies and actions. Most interviewees felt this could be useful if they wanted to verify whether a country or group of countries had a policy in a certain subject. However, often this is relevant just as a first step. Interviewees from all stakeholder groups explained that they could only base decisions on such information if it was supplemented by data on implementation, outcome and impact which would help them to figure out which policies were successful (and therefore worth emulating). WHO Europe collects such data but it does not currently figure on the website, meaning that users would have to follow up their online search with further research or direct contact with WHO staff or ministries in other Member States. For most users this seriously undermined the utility of the database, particularly among those who did not have extensive networks among policy makers in other Member States to whom they could direct further queries.
Even with regard to the information on national policies and actions, many users expressed some misgivings. It was not clear to them how the information was compiled and whether it was current and complete. One interviewee, for example, remarked that ‘it didn’t seem that there were that many documents on the site right now’, adding that some of the electronic citations she attempted to follow were non-functioning. Another looked for data on his own country, but was not able to tell ‘how up to date [the data] was or what was behind any of the information’. In preparation for the interview, one researcher, who had not used the site before, tried to locate a specific policy document from his country and, finding that the version on the database was no longer current, explained that he would not be comfortable using the database without knowing when it was last updated. Similarly, one user, who had worked on a project he thought was linked to the NOPA database project, was disappointed to find that the data collected for that project was not available on the site.
Leading from this, concerns about the user-friendliness of the database website were widespread. Frequent comments were ‘I’m not sure the database works correctly on my browser’ and ‘navigating the database website is not very intuitive’. One user was frustrated that she was able to access ‘only a list rather than detailed information’. Language problems were also persistent, since only the titles of specific policy documents were translated, while the policies remained in original language. This limited the immediate usefulness of the database, as interviewees could often only read the documents from a small number of countries. Moreover, this small number of countries often included neighbouring and other countries where given stakeholders already possessed a network they could draw on for the type of information contained in the database.
The comparative aspect of the database website was described as somewhat practical for allowing users to quickly ascertain which countries had a policy in a given area. However, it was criticised for being vague and hard to understand, since having a policy which relates to this or that subject does not necessarily mean that the country in question deals with that subject in a particularly effective way; the language issues mentioned above imply that a user would need to

149
conduct substantial research in order to arrive at a finding that is useful rather than ‘merely’ interesting.
Overall, opinions of the usefulness of the NOPA database as it currently stands can be summarised in the words of one interviewee, who asserted that the database was ‘a good first step that would be very useful if it worked better’. Such comments were expressed with regularity and indeed summarise WHO Europe’s own plans to completely redevelop the site. At the same time, it must be concluded that, given the concerns, misgivings and difficulties cited above, the version of the database now available cannot be considered a key resource for stakeholders in the policy-making community.
2. Level of use of NOPA database and its products as evidence for policy making
Evaluation question 16 highlighted that communication has not been a priority for the NOPA database project up to this point, while under indicator 1 above it is explained that much of the information collected for the database is not readily available to wider audiences. As such, despite the website and several other products (e.g. periodically released thematic reports) having been made public, the database has seen little use outside a small group of key stakeholders, mostly made up of NCPs themselves. Thus, taken as a whole, the database website cannot be said to have made a large impact, in general terms, of enabling policy makers to make better informed decisions.
However, such a statement ignores the real impact that the NOPA database project has had, albeit in a limited number of cases, and fails to shed light on the ways in which the database can (and should) be used once WHO Europe improves the website and ramps up its promotional efforts. The text boxes below illustrate four main ways in which the NOPA database has been used, with an emphasis on how stakeholders found out about it, what information they needed, how they were able to obtain and what decisions their experience with the database helped them to make. This in turn should clarify the types of modifications and improvements that are needed in future if the database is to realise its full potential.
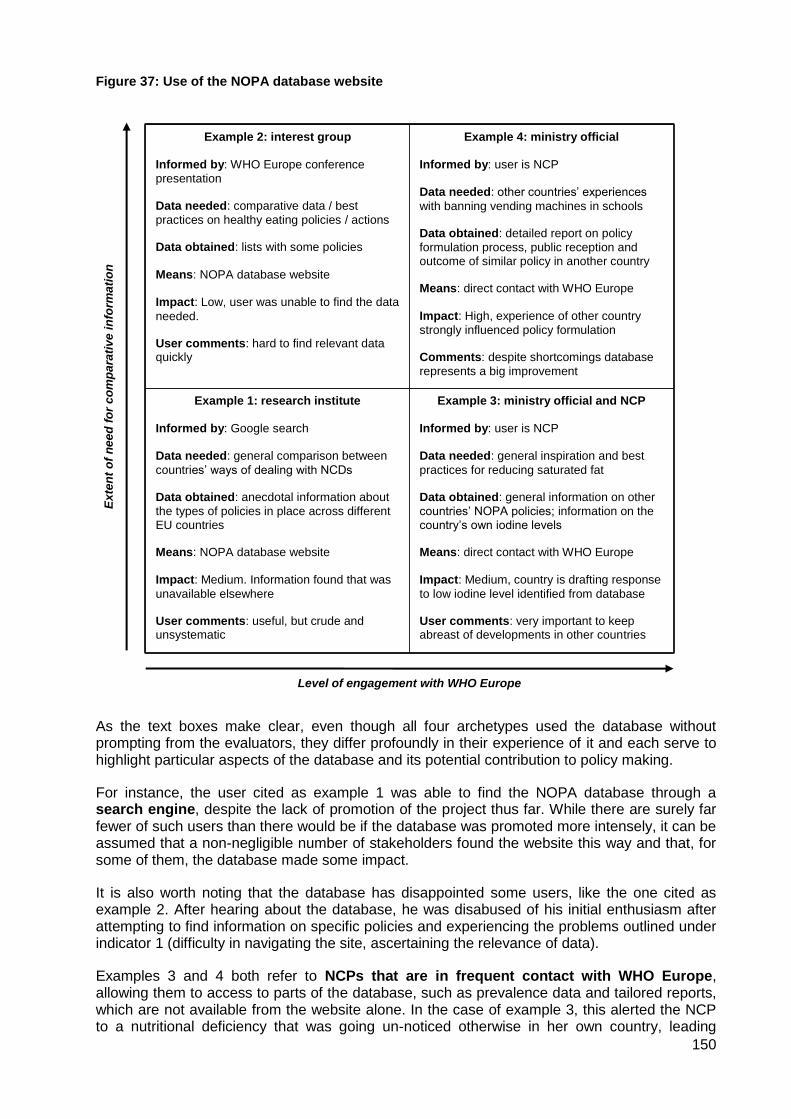
150
Figure 37: Use of the NOPA database website
As the text boxes make clear, even though all four archetypes used the database without prompting from the evaluators, they differ profoundly in their experience of it and each serve to highlight particular aspects of the database and its potential contribution to policy making.
For instance, the user cited as example 1 was able to find the NOPA database through a search engine, despite the lack of promotion of the project thus far. While there are surely far fewer of such users than there would be if the database was promoted more intensely, it can be assumed that a non-negligible number of stakeholders found the website this way and that, for some of them, the database made some impact.
It is also worth noting that the database has disappointed some users, like the one cited as example 2. After hearing about the database, he was disabused of his initial enthusiasm after attempting to find information on specific policies and experiencing the problems outlined under indicator 1 (difficulty in navigating the site, ascertaining the relevance of data).
Examples 3 and 4 both refer to NCPs that are in frequent contact with WHO Europe, allowing them to access to parts of the database, such as prevalence data and tailored reports, which are not available from the website alone. In the case of example 3, this alerted the NCP to a nutritional deficiency that was going un-noticed otherwise in her own country, leading
Example 2: interest group
Informed by: WHO Europe conference
presentation Data needed: comparative data / best
practices on healthy eating policies / actions Data obtained: lists with some policies
Means: NOPA database website
Impact: Low, user was unable to find the data
needed. User comments: hard to find relevant data quickly
Example 4: ministry official
Informed by: user is NCP Data needed: other countries’ experiences
with banning vending machines in schools Data obtained: detailed report on policy
formulation process, public reception and outcome of similar policy in another country Means: direct contact with WHO Europe Impact: High, experience of other country
strongly influenced policy formulation Comments: despite shortcomings database
represents a big improvement
Example 1: research institute
Informed by: Google search Data needed: general comparison between
countries’ ways of dealing with NCDs Data obtained: anecdotal information about
the types of policies in place across different EU countries Means: NOPA database website Impact: Medium. Information found that was
unavailable elsewhere User comments: useful, but crude and unsystematic
Example 3: ministry official and NCP
Informed by: user is NCP Data needed: general inspiration and best
practices for reducing saturated fat Data obtained: general information on other
countries’ NOPA policies; information on the country’s own iodine levels Means: direct contact with WHO Europe Impact: Medium, country is drafting response
to low iodine level identified from database User comments: very important to keep abreast of developments in other countries
Level of engagement with WHO Europe
Ex
ten
t o
f n
ee
d f
or
co
mp
ara
tiv
e i
nfo
rma
tio
n

151
directly to a policy response. The user cited in example 4 also benefited profoundly from the NOPA database due to a strong relationship with WHO Europe. While it is questionable that WHO Europe would have the capacity to handle a large number of such requests, the example is illustrative of how truly good practice examples and data on policy outcomes can catalyse effective policy making.
Looked at from another angle, examples 3 and 4 put the spotlight on some of the key shortcomings in the current version of the NOPA database, namely that not enough information has put online and that promotion has been too passive. Access to prevalence data, which the NOPA database project collates based on over ten sources, Member State experiences with policy implementation, evaluation results and best practice examples could benefit a much larger audience than has currently been the case. Similarly, if the website interface was improved it would allow more confident use of information on national policies and actions that is already accessible.
Conclusion
The NOPA database has clearly provided a small number of stakeholders with invaluable evidence for policy making. This has taken place mainly through the provision of specially tailored products provided to individuals by WHO Europe upon request. Other users have been able to find information on the website or publications that was not available elsewhere and apply it to their work.
However, the fact that much of the information contained on the database, including surveillance data and information on policy implementation and evaluation, in addition to best practices, is not available precludes those who are not already in direct contact with WHO Europe from benefiting significantly from the existence of the database. This situation is likely to persist until 1) more of the massive store of data held by WHO Europe is made publicly available and 2) information about the project is effectively disseminated.

152
5. CONCLUSIONS AND RECOMMENDATIONS
This section draws conclusions, based on the triangulation and interpretation of findings from all evaluation methods, sources and themes. The first sub-section is dedicated to the six groups of main instruments. The second sub-section introduces key conclusions from the three case studies (the full reports are contained in a separate document). The third and final sub-section draws general conclusions on the Strategy as a whole and its implementation, and also formulates recommendations for future action.
5.1. Key conclusions per thematic area
5.1.1. Member State activities and High Level Group
The Member States themselves retain primary responsibility for health policy (including obesity and overweight-related health issues), but the European Commission can add significant value by playing a catalytic or facilitating role. The High Level Group represents a major attempt to do this by using a relatively small amount of EU funding to bring together senior officials from the Member States on a regular basis, encouraging them to learn from each other, cultivate working relationships, pursue joint initiatives and keep abreast of important EU policy developments.
The HLG’s success and potential to make a real impact rely on several inter-related factors, most importantly the respective interest of its members, the Commission’s ability to chair it effectively and the political weight lent to the Group by all involved. The evaluation has found that the HLG is at its strongest when these factors are in ample supply. The Salt Reduction Framework, a voluntary initiative jointly agreed by all HLG members, is the best example of this. It demonstrates that the HLG provides a unique and ideal forum for promulgating effective policy ideas among EU countries, galvanising political will and reaching workable compromises. The continued attention to the issue and regular reporting have ensured that, at least in some countries, the initiative has led to real change (though impact evidence is scarce) and even opened the door to types of intervention, such as voluntary agreements with industry, that were not previously considered.
The HLG’s other achievements have been softer, harder to assess and, indeed, indicative of the risks now facing it. Clearly some value is added by bringing key officials together and encouraging an open exchange of ideas, and many HLG members were adamant about the importance of hearing from the Commission directly about EU policy developments. Nonetheless, lacking a major initiative to re-focus minds post-Salt Reduction Framework (extending the Framework to other nutrients has so far proven difficult), the HLG appears to be witnessing an unintended, gradual de-prioritisation on both sides and diminishing relevance. For example, members have noticed that less senior Commission officials chair the meetings than was previously the case, and often respond in kind, as director-level participants are increasingly replaced by more junior substitutes. This risks instigating a vicious cycle, with such staff less capable than their directors of driving the political agenda at home, and leads to a real danger that the group will languish unless the Commission recognises the need to back the group politically as well as financially.
5.1.2. EU Platform for Action on Diet, Physical Activity and Health
The EU Platform for Action on Diet, Physical Activity and Health was launched in 2005 as an innovative policy instrument to engage the private and non-governmental sectors in the fight against overweight and obesity. Since then, it has provided a common forum for exchange of information and opinions between stakeholders from different sectors and the Commission,

153
and has contributed to enhancing dialogue and mutual understanding between them. The Platform has also contributed to generating a significant level of action in areas ranging from consumer information and education to the composition of food, embodied in the more than 300 voluntary commitments made by its members (including the European food and related industries) over the years. A monitoring system ensures accountability by requiring members to report on the objectives, inputs, outputs and outcomes of their commitments on a yearly basis.
Thus, while there can be no doubt that Platform members have undertaken and continue to undertake a significant number of actions, the main problem facing the Platform is the difficulty of assessing the relevance, proportionality and impact of these actions. The reasons for this include the lack of comparability between individual commitments, not only due to the huge differences between activity areas (such as reformulation and education), but also to the wide variety of Platform members (in terms of their size, resources, core business etc.). The Platform has no common (quantitative) targets, and no effective mechanism for assessing commitments, their objectives and outcomes, let alone their ultimate health impacts – which in any case are very difficult to measure and attribute to specific actions due to the multitude of factors that affect the issue of overweight and obesity. As a result, many members feel they have little insight into the real value and appropriateness of commitments, and tend to distrust each other’s intentions (in particular regarding voluntary commitments by the food industry). The review of a small sample undertaken as part of this evaluation confirms there are vast differences between commitments as regards their scope, level of ambition and the extent to which they deliver and report – or can be expected to deliver and report – concrete and relevant results. Far-reaching and (potentially) impactful actions co-exist with others that appear far less impressive.
A number of recent developments within the Platform have been positive, but not sufficient to significantly alter this situation. The renewed objectives agreed in 2011 have helped to some extent to define – or in some cases re-emphasise – certain key priorities. Perhaps partly in response to this, there has been a trend towards slightly fewer yet more focused (and potentially more relevant) commitments, especially by for-profit members. At the same time, the number of commitments in the areas of reformulation and physical activity promotion has increased slightly. Minor changes in the working methods and the monitoring process have also led to some improvements. However, Platform members have continued to struggle to find ways of working together and/or of specifically targeting lower socio-economic groups.
The fundamental problem remains that, although the Platform has successfully engaged key stakeholders, improved the dialogue between them and generated a significant amount of action, it has largely failed to achieve the other key objective set in its founding charter, namely that “outcomes and experience from actors’ performance can be reported and reviewed, so that over time better evidence is assembled of what works, and Best Practice more clearly defined.” Although the monitoring system has been effective in terms of ensuring accountability (i.e. proving that members deliver what they committed to), it has not been able to provide enough evidence on what works, much less on the impacts of commitments on nutrition, overweight and obesity related health issues. In light of the complexity of the obesity problem and the myriad factors that contribute to it, the question seems justified whether it was ever realistic to expect a monitoring system based entirely on self-reported data to provide such answers. Be that as it may, the continued lack of evidence on ‘what works and what doesn’t work’, and of an objective and widely accepted mechanism to judge the merit of commitments, had led to some disenchantment. Many Platform members feel that the dialogue has become increasingly stale, as similar arguments (based more on pre-formed opinion than on objectively verifiable facts) are repeated time and again.
5.1.3. EU Legislation
Three pieces of EU legislation are clearly relevant to the Strategy’s specific objective of ‘better informed consumers’. The Nutrition and Health Claims Regulation was adopted in 2006

154
and entered into force in 2007; since then, all such claims related to food products have to be pre-authorised by the European Commission. The Food Information Regulation was adopted in 2011, and includes new mandatory nutrition labelling rules, which will enter into force in December 2016. The Audiovisual Media Services Directive (AVMSD) was adopted in 2007, and includes an article that calls on Member States and the Commission to encourage self-regulation by media service providers to limit advertising of ‘unhealthy’ foods and beverages to children.
Both Regulations certainly have the potential of enabling consumers to make healthier food choices by making more information relevant to health and diet available. For example, the Nutrition and Health Claims Regulation harmonises the criteria products have to fulfil in order to be allowed to carry nutrition claims such as “energy-reduced”, “saturated fat free” or “(very) low sodium/salt”. The Food Information Regulation makes labelling for energy and six key nutrients mandatory, sets rules for legibility, and allows for additional forms of representation (such as colour coded systems) on a voluntary basis as long as certain criteria are met.
While these are clearly steps in the right direction in terms of enabling consumers to be better informed and avoiding misleading information, it would be wrong to classify them as ground-breaking developments in the fight against overweight, obesity and related health problems. The reason is that there are a number of concerns and/or shortcomings that are likely to limit the ultimate health impact of both Regulations. The fact that the Food Information Regulation only makes the nutrition declaration mandatory from 2016, and does not mandate any form of front-of-pack declaration, is disappointing considering the large body of evidence demonstrating the much higher effectiveness of front-of-pack labelling for most consumers. Also, the lack of common nutrient profiles (which are supposed to be one of the central elements of the Nutrition and Health Claims Regulation) continues to be a considerable source of frustration, both among industry actors and health and consumer organisations.
Lastly, the inclusion of Article 9.2 in the AVMSD contributed to limiting commercial communications of unhealthy foods and beverages to children, in so far as it was one of several factors that led to the development of self-regulatory approaches in many Member States. Due to the variety of codes (in terms of restrictions, media coverage, and definitions of key concepts), the Article’s contributions to the objectives of the Strategy are hard to assess but likely to vary across the different Member States. The review of the situation in five Member States suggests that in some cases, the codes that were adopted (or revised) are not strict or clear enough to have a significant impact on actual advertising practices.
5.1.4. Integration of NOPA dimension in other EU policies
In accordance with the ‘Health in all Policies’ principle, DG SANCO aims to ensure an adequate contribution of relevant EU policies to the objectives in the field of nutrition, obesity and physical activity (NOPA) embodied in the EU Strategy. To this end, it seeks to influence and foster collaboration with other Commission services that are responsible for policies in a number of areas.
The integration of the NOPA dimension in other EU policies has been quite successful in some policy areas, including (parts of) the EU’s agricultural, research, media, sport, consumer protection, and health statistics. The collaboration with the relevant services has mainly taken the form of Inter-Service Steering Groups, ad-hoc meetings, workshops and conferences. The High Level Group and the Platform have also been used as fora to present the joint achievements. On the other hand, there has been little or no inter-service cooperation in a number of other policy spheres, including transport, employment and regional policy. Experience shows that cooperation has been most fluent where concrete objectives – often in the context of an EU-funded programme – were set. In the absence of concrete initiatives with clear and significant NOPA implications, lines of communication have tended to be much harder to establish.

155
One of the key vehicles to achieve policy integration is the Commission’s Impact Assessment (IA) system, which is intended to allow policy-makers to consider a wide range of potential positive or negative impacts of regulatory as well as non-regulatory proposals in an integrated way. A systematic screening and subsequent analysis of (potentially) relevant IAs suggests that, for policies that are clearly relevant from the NOPA perspective, the majority of IAs did consider these impacts (though there were a few exceptions). However, for policies where the relevance of the NOPA dimension is less clear (i.e. policies that touch on issues that can potentially affect NOPA, but where this isn’t one of the central objectives), the mention or even analysis of NOPA impacts is the exception rather than the norm.
Thus, the evaluation results show that, by and large, DG SANCO has successfully integrated NOPA concerns into EU policies where the implications were relatively clear. However, partly due to capacity constraints, it has found it more difficult to mainstream the NOPA dimension into other, potentially much broader policies, where its relevance is typically less obvious. In some cases, these are significant policies with a large budget envelope attached to them (e.g. the ERDF and ESF). In order to fully implement the Health in All Policies approach, the EU Health Strategy159 notes that developing synergies with other sectors “is crucial for a strong Community health policy”. Among those sectors explicitly mentioned are regional and environment policy, and health and safety at work, in which there has been little progress to date as far as the NOPA dimension is concerned.
5.1.5. EU funding and programmes
Between 2007 and 2011, the Commission invested EUR 304.2 million to co-fund 98 projects that are relevant to one or more of the six key priority areas of the Strategy. By far the most important source of funding was the Seventh Framework Programme for Research (which provided 97% of the funding), followed at a considerable distance by the Health Programme (2%) and the Preparatory Actions in the field of sport (1%). The majority of projects were primarily research-oriented (e.g. FLABEL, a project to investigate how food nutrition labelling can affect dietary choices, consumer habits and food-related health issues). A few others can be described as action-oriented (e.g. FOOD, a project that worked directly with employees and restaurants across several EU countries to promote healthy eating habits during the working day).
The review of a sample of such projects confirms that they can make a significant contribution to strengthening the evidence base for policy-making, and in some cases have also had a tangible positive impact on other relevant objectives. Generally speaking, the most successful projects in contributing to the objectives of the Strategy were those that were integrated by partners with a long-standing history of collaboration; included both academic and non-academic partners with complementary expertise; featured a strong dissemination component, generally reflected in a distinct work package with an appropriate and experienced work package leader; integrated the views of policy makers (through workshops, stakeholder advisory boards, etc.) to derive policy implications; and those that guaranteed high sustainability prospects after EU funding, through new actions funded, continuation of collaboration through the networks created, etc.
In addition to the three programmes mentioned above, the evaluation considered two EU funding schemes. The EU School Fruit Scheme has been essential to the extension of existing or creation of new programmes in 24 Member States. In the school year 2010/11, the EU Scheme contributed to the distribution of an average of 35 portions of fruit and vegetables to over 8 million school children. The external evaluation found that in the short term at least, the scheme has a positive impact on children’s fruit and vegetables consumption. Although it was too early to measure any longer-term impacts (i.e. whether the increase in consumption is
159
European Commission: White Paper “Together for Health: A Strategic Approach for the EU 2008-2013”. COM(2007) 630 final

156
sustained when children are no longer eligible to receive free produce), there is a body of scientific evidence (not directly related to this particular scheme) suggesting that fruit and vegetable schemes can have long term impacts on consumption, provided that their design (including frequency and type of produce distributed, accompanying educational measures etc.) are in line with the respective education systems and food cultures.
The Most Deprived Programme has contributed to feeding millions of needy people across Europe. But given that nearly all of the food distributed consisted of basic foodstuffs like cereal-based products (pasta, rice, flour), products containing sugar, and dairy products (milk, skim milk powder, butter and cheese), while the amount of fresh fruit and vegetables was negligible, it is very unlikely that the Programme had a significant effect on the nutritional behaviour (in terms of healthier eating habits) of beneficiaries during the period under evaluation (2007-2011). However, nutritional considerations have begun to play a more important role from 2012 onwards (with the new regulation), and there are indications that this will continue to be the case in a future revised programme.
5.1.6. Monitoring system / evidence base
The NOPA database, a project jointly funded by the Commission and WHO Europe, attempts to take down some of the barriers which prevent policy makers and other stakeholders from using relevant data and information about other Member States to address the challenges posed by overweight and obesity issues. Despite differences in language, culture, traditions and priorities, the cross-cutting nature of these issues and high degrees of variation and success across the EU mean comparable data is especially important. To make this available, the project collects and catalogues surveillance data and information on national policies and actions from across the EU and publicises the findings.
Some of the obstacles to the success of the project, mostly related to surveillance data, are beyond WHO Europe and the Commission’s control. Since other actors are responsible for collecting raw data (though separately the Commission does fund the collection of relevant data through periodic Eurobarometer surveys and the European Health Interview Survey), the project is in a sense a prisoner to the completeness, timeliness and comparability of data collected by international organisations such as the OECD, Eurostat and individual Member States. Examination of this data reveals persistent methodological inconsistencies that render comparison between countries difficult. This is especially true for trend data which would be extremely useful in determining the relative success of different policy approaches.
Concerning issues over which the project exercises more control, it has made considerable achievements. Using its network of national contact points within ministries in the Member States, WHO Europe has collected an enormous amount of information on each country’s policies and actions, and made some of this, particularly actual policy documents, publicly available through the NOPA database and a series of publications. This has enabled relevant stakeholders, most notably the national contact points themselves, to learn about what other countries are doing in a given area and encouraged them to find out more. Although there are concerns about parts of the database going out of date (the database has only been updated on an ad hoc basis since a major data collection exercise in 2009), this represents a major achievement and several examples demonstrate the significant contributions this can make to policy development in the EU.
However, the success of the project up to this point has been checked by inter-related shortcomings in organising and disseminating the massive amount of information at WHO Europe’s disposal. The current version of the public NOPA database does not make available any surveillance data, while the policy information displayed is limited to the existence of policies and basic facts about them. Despite collecting detailed information on the implementation and evaluation of policies (to the extent that it is available to national contact points), WHO Europe has so far been unable to make much of this information public. Users

157
can contact WHO Europe for more comprehensive, tailored products, but only a small group of users could be expected to know this, and given limited resources it would be implausible to mainstream such a method. Moreover, the project has generally not been widely publicised, meaning that news of existence has not reached beyond a small group of insiders, despite a self-evident wider interest and myriad opportunities for promotion. As an example, at the time of writing no news of the project appears on the Commission’s website. Until these shortcomings, comprised more of form than substance, are addressed, the project will be unable to realise its full potential and its success will remain limited.
5.2. Key conclusions from the case studies
Three case studies were conducted to complement and build on the other evaluation tasks, in particular the evaluation according to different (groups of) instruments, since these necessarily provide a somewhat fragmented perspective on the implementation of the Strategy (as summarised in the previous section). The case studies were intended to help develop a better understanding of the totality of actions and impacts against selected key objectives (i.e. desired outcomes). For this purpose, the case studies focused on three of the six priority areas identified in the Strategy, bringing together findings on relevant instruments that have already been assessed, and complementing this with additional data and analysis.
Figure 38: Implementation of the EU Nutrition Strategy – desired outcomes
Note: The desired outcomes listed correspond to the priority areas in section 4 of the Strategy. Those outcomes covered by case studies are marked in red.
5.2.1. Making the healthy option available
The years since the publication of the EU Strategy in 2007 have seen a considerable amount of action to make healthy options more widely available in the EU, mainly by enhancing the availability of healthy foods in specific environments (in particular schools) and by initiatives to reduce the content of energy and “unhealthy” nutrients of processed foods (mainly through reformulation).
In the area of making processed food less unhealthy, reformulation (and in particular salt reduction) has received a growing amount of attention. Although it is difficult to judge the level of action by the food industry as a whole, the level of engagement between public and private actors at EU level and in many Member States has clearly increased, not least due to the EU Platform (which defined reformulation as one of its priority areas for the period 2011-2013) and the development of a common EU framework for salt reduction under the auspices of the High Level Group. The approach chosen by the EU and by most Member States relied primarily on voluntary action; in the absence of conclusive evidence, how effective this is continues to be hotly debated. The review of reformulation commitments made by Platform members for this case study confirms that it is difficult to judge all such actions in the same way; their effectiveness is likely to depend to a significant extent on whether or not they include concrete actions and quantifiable targets, as opposed to just a general declaration of intent. Nonetheless, examples of individual commitments serve to illustrate the potential health impact of such
Priority areas
Effective monitoring systems
Evidence base for policy-making
Priority groups targeted
Physical activity encouraged
Healthy options available
Better informed consumers

158
efforts, if and when they are sufficiently ambitious, and made and monitored consistently and continuously.
When it comes to enhancing the availability of healthy foods (in particular fresh fruit and vegetables), the majority of interventions have targeted school children. School fruit schemes and/or school milk schemes now exist in nearly all Member States (or at least in specific regions thereof), often supported by the EU. The distribution of free produce tends to go hand in hand with education measures and/or efforts to improve school canteen menus more generally. The available evidence (including the results of the evaluation of the EU SFS) suggests that these do work in terms of increasing short-term consumption. In other words, children who participate eat more fruit and vegetables than those who do not. However, some questions remain regarding the longer-term effects, i.e. if and how this increase can be sustained when the children are no longer eligible to receive free produce. There are indications that the design of such programmes and their accompanying measures are key determinants of their effectiveness in the long term.
Fiscal measures are increasingly being discussed in recent years, but no action has been taken at the EU level, and only a few Member States have actually implemented ‘fat taxes’. Most of these target products that are high in salt or sugars (in particular soft drinks). The only attempt to date to tax saturated fat (in Denmark) was abandoned after only one year due to concerns about its adverse economic impact. None of these taxes have been in force long enough in Europe to be evaluated. While simulation studies show that price changes can have an impact on consumption, they also suggest that demand for food products may be relatively inelastic (i.e. for a significant reduction in consumption to occur the price of unhealthy foods would have to be increased substantially). The Danish example also serves to highlight the risks with the implementation of such measures, and the need to design them very carefully so as to avoid unintended side effects.
Overall, the gaps in the evidence and the limited nature of the case study notwithstanding, it seems clear that the Strategy and its co-ordination fora have contributed to progress towards the objective of “making the healthy option available”. On the one hand, specific EU actions (including the creation of the Platform and the funding available to national and regional school fruit schemes) have acted as a catalyst for action. On the other hand, the common approach to salt reduction, and more generally the exchange of information and ideas within the High-Level Group, have contributed to the adoption of novel approaches and an increased level of action in some Member States at least. This contribution is highly variable (depending on the topic and Member State in question) and cannot be quantified. It has fallen short of the expectations of those who expected the EU to instigate more forceful (possibly regulatory and/or fiscal) measures. However, in light of the limited competence of the EU and the lack of consensus among Member States on more intrusive measures, it can be argued that EU action has been a useful step in the right direction.
5.2.2. Encouraging physical activity
The Strategy recognises that an appropriate and sufficient response to persistently high levels of physical inactivity in Europe demands a holistic approach that brings together numerous stakeholders at EU, national and local levels from both the public and private sectors. To this end, many initiatives have taken place in recent years which could potentially contribute to the priority area of ‘encouraging physical activity’.
In line with the EU’s supporting competence in health and sport policies, its initiatives to encourage physical activity have mostly fallen into three categories, namely political commitments (such as the White Paper on Sport and EU Physical Activity Guidelines), co-ordination fora (such as the High Level Group on nutrition and physical activity) and financial support for projects (such as the NOPA database and preparatory actions in the field of sport). All of these aim more to spur action by stakeholders than to promote physical activity directly,

159
with the bulk of interventions aimed at the latter being developed and implemented at the national, regional or local levels across a wide variety of environments and settings.
EU-level initiatives have thus far only achieved limited effectiveness at promoting physical activity, not least because for some initiatives, such as the High Level Group and Platform, it is only a secondary focus that is not fully aligned with the expertise or responsibility of many of those involved. Other initiatives, such as the EU Physical Activity Guidelines, could potentially have a large impact on Member State policy but have so far not received a strong political commitment. Initiatives in the Member States serve to reinforce this point, with those seen to be most effective distinguishing themselves more for adhering to principles laid out in the Guidelines (e.g. taking a cross-sectoral approach; giving adequate weight to evaluation and the production of evidence) than for targeting any specific setting or target group.
Leading from this, while the impact of EU action in promoting physical activity is small (examples of influence in some Member States notwithstanding), new initiatives such as the expected Council Recommendation on health-enhancing physical activity may result in bigger impacts in the future. The Recommendation would focus on the EU Physical Activity Guidelines, giving them more political weight and establishing a monitoring mechanism to record progress, with the hope of encouraging implementation at national level. While instigating a re-orientation towards physical activity promotion against the backdrop of economic crisis and austerity would require significant political will, if the new initiative leads to a step change in the way the Member States design, implement and evaluate physical activity interventions, the impact could be huge.
Similarly, while the EU added value appears minor and limited to specific cases at this point, the desired impact from the Recommendation and monitoring system would represent a substantial departure from the status quo. In addition, future EU added value is also likely to stem from much more extensive funding for transnational projects and networks, through the sport component of the Erasmus for All programme, than was previously the case.
In summary, there are many actions currently taking place to promote physical activity at both EU and national levels. Thus far, the EU contribution has been limited by its soft competences in sport and health and the emphasis on nutrition in longstanding fora, such as the HLG for nutrition and physical activity. Nonetheless, new developments, in particular the expected Council Recommendation on HEPA, could lead to considerable impact by boosting the mandate of the newly established Expert Group on sport, health and participation and putting in place a monitoring mechanism for the implementation of the EU Physical Activity Guidelines. The latter in particular could clarify the case for EU action in physical activity promotion, bringing together the work of the Expert Group, the NOPA database and projects to be funded through the future Erasmus for All programme.
5.2.3. Targeting priority groups (inequalities)
Considering the concentration of high obesity levels in lower socio-economic groups, the Strategy identified these groups (alongside children) as a priority in the fight against nutrition, overweight and obesity related health issues. Indeed, evidence consistently shows severe inequalities in obesity, especially among women. These inequalities have serious implications for social life, education levels and labour market outcomes. Moreover, as women in these groups are more likely to give birth and raise children who will themselves be overweight or obese, they tend to reinforce the link between obesity levels and socio-economic disadvantage. Due to the variety of determinants that cause social inequalities in obesity, there is a very wide range of policy interventions with the potential of influencing the social gradient in obesity, intentionally or unintentionally, and positively or negatively.
To date, EU-level initiatives in the area of social inequalities in obesity have mainly focused on strengthening the evidence base. The EU has supported a number of research projects that
160
focused on the prevalence of the issue as well as the effectiveness of policy interventions in this area. However, apart from this, the EU added value in addressing the social dimension in overweight and obesity has been limited. The issue was not extensively addressed through the existing policy coordination fora including the High Level Group, the OMC for Social Protection and Social Inclusion, or in the EU Platform.
At Member State level, the issue is dealt with in a variety of ways, depending on the political priorities of local, regional and national governments. Generally speaking, a number of developments indicate that awareness of the issue has been growing since 2007. This was for example illustrated by the creation of a Member States Action Network on Obesity and Inequalities under the auspices of the WHO Europe, and the fact that Member States reported to have developed a number of policies or programmes relevant to the issue of obesity and with a special focus on disadvantaged groups.
Key policy interventions which are particularly effective in reducing social inequalities in obesity included school fruit and vegetable schemes (as they tend to have a larger impact on disadvantaged children), ‘fat taxes’ (which are regressive, as the poor spend a greater portion of their income on food, but this also means that the impact on their consumption and therefore health is greater) and policies relevant to the life-course approach (as they aim to ensure an integrated and continuous approach and focus on crucial stages of people’s lives). The use of ‘fat taxes’ was much more limited, due to concerns about their acceptability and potential adverse economic impacts. While several Member States had policies that were relevant to the life-course approach and had a special focus on lower socio-economic groups, it was not always clear to what extent these policies formed part of a comprehensive life-course strategy.
Interventions that tend to be less effective in reducing the social gradient in obesity related to the provision of information, such as information campaigns and food labelling interventions. Evidence shows that as the provision of information affects the purchasing and consumption behaviour of lower socio-economic groups to a smaller extent than other population groups (due to the fact that information is not always appropriate for the target group, advice not economically feasible, or the information too detailed or complex), so that such interventions, unless carefully designed and/or accompanied by flanking measures, may even aggravate social inequalities in obesity.
5.3. Overall conclusions and recommendations
5.3.1. Level of action
As shown in the preceding sections, the Strategy and the various instruments to implement it have clearly contributed to galvanising and inspiring efforts to address nutrition, overweight and obesity-related health issues. At European level, the EU has developed and implemented legislation in some of the key areas identified as priorities in the Strategy. These mostly concern the labelling and marketing of food and related projects, and are in part aimed at improving the provision of nutrition information to consumers. In addition, to support goals as diverse as strengthening the evidence base for policy making and making healthy foods more available to specific target groups, the Commission has funded a variety of programmes and transnational projects.
The Commission has also set up numerous fora to facilitate engagement among other stakeholders. Through the Platform, it brings the private and voluntary sectors together, where it is then their responsibility to agree and adhere to commitments intended to address specific aspects of overweight and obesity-related health issues. In order to encourage action among the Member States, where much of the crucial action for combatting obesity takes place, the Commission established the High Level Group, which brings together national officials and

161
fosters peer learning, the sharing of best practices and the negotiation and agreement of common initiatives. The Member States also address the Strategy’s key areas with their own policies and initiatives, though the level of action varies considerably according to the issue and country in question.
When assessing the level of action since the Strategy was published in 2007, it is worth noting that the majority of initiatives at the EU as well as national levels have addressed nutrition and related issues to a significantly greater extent than promoting physical activity. Several factors have contributed to this quite significant disparity. Improving nutrition and increasing physical activity have fundamental differences, and therefore often demand different types of public policy response. While there are examples to demonstrate that both issues can partly be addressed in similar ways (e.g. educational campaigns), the nutritional problems of obesity can in many cases be linked to excess (of consumption) while those of physical activity relate more to scarcity. Conceptually, the former are ‘simpler’ (though not necessarily ‘easy’) to deal with: there are numerous actors (e.g. food companies) whose rational behaviour encourages the over-consumption of unhealthy food, and public interventions can put in place incentives that lead to adjustments in that behaviour. Such interventions are where regulation, self-regulation and co-ordination fora can play a significant role. However, precisely because increased physical activity levels would not harm anyone’s interests, it is more difficult to incentivise it without spending on infrastructure and other interventions aimed at making positive changes. Such interventions are often costly and carried out most effectively at local level.
Leading from this, both the EU and stakeholders engaged through existing fora tend to be better placed to devise and implement interventions to influence Europeans’ nutrition than their levels of physical activity. For example, the vast majority of HLG members represent administrations that are responsible for nutrition but not physical activity, while the core business of most industry members of the Platform relates to the production and distribution of food. It would be unrealistic to expect such groupings to possess the expertise or interest to promote physical activity on the scale needed to address complex and widespread problems surrounding physical inactivity in Europe.
5.3.2. Effectiveness / impact
The present evaluation shows that, both by taking action itself and by engaging with other relevant actors, the EU has contributed to addressing several key determinants of overweight, obesity and related health issues. Through the various fora and instruments discussed at length in this report, progress has been made (albeit to a varying extent) towards all of the objectives defined in the Strategy, including better informed consumers, the availability of healthier food options, physical activity promotion, targeting certain priority groups, strengthening the evidence base for policy-making, and more effective monitoring systems. The measures taken were clearly steps in the right direction, although (partly due to the ‘soft’ competence and the limited resources available to the EU) their contribution has in most cases not led to major changes (at least not when seen in relation to the scale of the problem).
Across the EU, the levels of overweight and obesity continue to be high, although there are significant differences between Member States (both in terms of overweight and obesity prevalence rates, and in terms of the key determinants of nutrition and physical activity). The lack of up-to-date and comparable prevalence data (see section 3 of this report) means it is not possible to draw any definitive conclusions regarding trends in the years since the EU Strategy was published in 2007. Based on what data is available, it appears that in most Member States, overweight and obesity levels are still rising – although there are early indications that in a few countries, the trend may have been slowed or even halted in recent years. However, the data situation is such that, even in these few countries, it is still difficult to conclude with any degree of certainty whether, when taken together, the various policies and interventions being implemented are beginning to have the desired effect. And even if this were the case, the

162
problem of overweight and obesity is far too complex to attribute changes in obesity rates that can be observed to any single measure or group of measures by any one actor.
In this context, it is worth highlighting that most of the action taken in Europe to date (both at the EU and at the national levels) has been of a relatively soft nature, and has relied primarily (although the extent varies by country) on information provision and education, limited interventions in specific environments (such as schools), and voluntary actions by the food industry and other private actors, so as to generate an impact via a series of relatively subtle changes.
There are many who argue that more intrusive measures, in particular stricter regulation and/or fiscal measures, would be more effective to combat overweight and obesity, and there is some evidence to suggest that this may indeed be the case. However, since there is a lack of consensus among Member States (who have primary responsibility for this area) on the desirability of such measures, it would have been unrealistic to expect the EU to work actively to encourage them.
Therefore, considering the various constraints the EU faces, the Strategy and its implementation have been reasonably effective. It has contributed to the issue’s firm establishment on the political agenda, and helped to facilitate cooperation between and action by a range of actors.
However, with a view to the future, the evaluation results also show that there is a real risk that, without a new impetus, interest in continuing to deal with the issue may fade, at least at the European level. The gains made since the adoption of the Strategy were at least partly due to the Commission’s willingness to innovate, develop ideas and test new initiatives. As these initiatives become more established, enthusiasm for them is beginning to wear off, as evidenced by a certain tendency towards inertia in both the High Level Group and the Platform.
5.3.3. Recommendations
In view of the continued relevance of the problem of overweight, obesity and related health issues, the EU should build on the progress made since the adoption of the Strategy in 2007. It should continue to play an active role and facilitate an integrated and holistic approach to policy in this area. Within the areas of its competence, it should continue to both pursue actions itself and seek to engage and build partnerships with other stakeholders, including Member States and the private sector. However, in order to maintain (or even increase) momentum, substantial efforts are needed to re-focus efforts and re-energise collaboration between the many actors implicated in the Strategy.
The Commission obviously has a large role to play in setting the policy agenda and political priorities, and working to secure a groundswell of participation. At the same time, the Commission’s efforts must be mirrored by requisite efforts on the behalf of Member States. Given their responsibility for implementing (and paying for) many of the relevant policies and initiatives, the active support of Member State administrations is crucial.
Additionally, it is worth reiterating that existing instruments have addressed nutrition to a considerably greater extent than physical activity. In order to alleviate this disparity, the Commission could focus on raising the profile of nascent initiatives which do focus on physical activity, such as the Expert Group on Sport, Health and Participation, and fostering collaboration with the HLG and other existing fora.
More generally, the economic crisis has profoundly altered the policy landscape since the Strategy was adopted in 2007, not least for nutrition and physical activity. This speaks firstly to the need to take adequate consideration of the budgetary and other constraints faced by public and private actors in all initiatives aimed at addressing these issues. It also highlights the

163
implications of rising inequality for health: inter alia, socio-economically disadvantaged groups are more likely to have unhealthy diets and be physically inactive. Special care needs to be taken to ensure that nutrition and physical activity initiatives do not further exacerbate health inequalities, but are designed and implemented so as to benefit all socio-economic groups in at least equal measure. To this end, some inspiration could be taken from the equality impact assessments carried out in several Member States as a regular part of the policy formulation process.
With regard to the six main thematic areas evaluated, more concrete recommendations are presented below.
High Level Group on Nutrition and Physical Activity
After initial success, the evaluation has shown that enthusiasm for the HLG is beginning to fade. This decreases the possibilities for agreeing new joint initiatives to follow the Salt Reduction Framework and reduces the level of discussion among members. In order to reverse this gradual de-prioritisation, the Commission should strive to re-establish the HLG as a unique forum where key discussions and debates are held and where important information is exchanged. Ways to do this include:
Re-launch the objectives and strategic direction of the HLG, potentially in the context of the successor to the Nutrition Strategy, so that it is clear to members why they should attend and what they can expect to get out of the meetings. If identifying sufficiently enticing topic areas for discussion and debate proves difficult, ideas could be produced through externally commissioned research.
Define new topics for future joint agreements, striking a balance between a high level of ambition and reasonable chances of success. If consensus does not appear possible in a given area, consider encouraging members to pursue smaller initiatives among the like-minded, perhaps on a regional level. Such initiatives could bring together, for example, countries with comparable levels of overweight and obesity among adults and/or children, facing similar problems concerning the over-consumption of certain nutrients, or similar difficulties in raising physical activity levels.
Demonstrate to members that the HLG is high on the Commission’s list of priorities by enlisting senior official to chair meetings and, where possible, invite guest speakers that members are unlikely to encounter in other fora.
Platform for Action on Diet, Physical Activity and Health
In order to maintain its momentum and keep members engaged, the Platform should focus on making progress towards its original objective that has so far only been achieved to a very limited extent, namely that “outcomes and experience from actors’ performance can be reported and reviewed, so that over time better evidence is assembled of what works, and best practice more clearly defined.” To achieve this, thought needs to be given to how the relevance, proportionality and/or impact of commitments can be assessed more comprehensively and systematically. Ways in which this could potentially be done include:
a pre-screening of commitments by an independent panel before they are submitted to the Platform (in order to alleviate members’ concerns about negative publicity, the results and recommendations stemming from this should not be made public, at least not before the commitment is formally submitted);
periodic analytical (rather than purely descriptive) reviews of commitments by activity area, in order to compare experiences, highlight good practices and identify room for improvement;
the commissioning of targeted scientific research and/or evaluative studies to investigate the relationship between the outcomes of commitments and health impacts (which is

164
usually not possible within the confines of monitoring, which should continue to primarily serve to ensure accountability).
All of these would have (potentially significant) resource implications that cannot be covered from the current budget for monitoring and annual reporting. Any such measures also need to be considered carefully to ensure they are acceptable to members and do not deter further voluntary action. It is important to carefully balance ‘sticks’ (e.g. a mechanism that risks criticising aspects of certain commitments) with ‘carrots’ (e.g. explicit recognition of good practice commitments with some sort of seal of approval).
EU legislation
In order to maximise the health impacts of the EU legislation adopted in recent years, the Commission (in collaboration with other actors) should consider further steps to address the existing shortcomings (when compared with the optimal outcomes from a health perspective). This should include:
Working towards the widespread and consistent implementation (on a voluntary basis) of front-of-pack energy and nutrient labelling, since this has a far higher impact on consumers’ purchasing decisions than back-of-pack labelling.
Making a concerted effort to agree and implement the nutrient profiles foreseen in the Nutrition and Health Claims Regulation.
Continuing to monitor self-regulation (as well as regulation) on food marketing to children in the EU Member States, with a view to highlighting differences in approaches and implementation and their effects on advertising practices and exposure.
EU policy integration
To implement the Health in All Policies approach more fully, DG SANCO should attempt to engage more with the Commission services responsible for a range of EU policies for which the NOPA implications tend to be less obvious, but can potentially be very significant, so as to ensure that positive impacts on nutrition, obesity and overweight and/or physical activity are maximised, and possible negative impacts avoided to the extent possible. Relevant policy areas that should be prioritised include:
Regional policy, in particular the structural funds, which account for around one third of the EU budget and present very significant opportunities to support projects with positive impacts on NOPA issues.
Environmental policy, in particular in the context of the work towards a possible EU ‘Sustainable Food Strategy’ which has recently begun, and the fact that there is a growing interest in the relationship between healthy diets and their potential to also reduce environmental burdens.
Health and safety at work, where, apart from having developed a legal framework, the Commission works with the European Agency for Health and Safety at Work and the European Foundation for the Improvement of Living and Working Conditions to disseminate information, offer guidance and promote healthy working environments.
Urban transport, where the 2009 Action Plan on urban mobility has recently been reviewed, and the future course of action will need to be set soon.
EU funding and programmes
EU co-funding for schemes and programmes to pursue NOPA-related objectives has been effective and should be continued. In particular:
So as to maximise their relevance and policy impact, funding decisions for transnational projects should emphasise the dissemination strategy, policy implications, and sustainability of projects.

165
With three funding options for NOPA-related projects available in the programming period 2014-2020 (the Health for Growth Programme, Horizon 2020, and the sport component of the Erasmus for All Programme), the concerned Commission services should co-ordinate in order to minimise overlaps and maximise clarity as to what can be funded under which programme.
The Commission should carefully consider the recommendations made by the external evaluation of the EU School Fruit Scheme (as well as the ongoing evaluation of the School Milk Scheme, once it becomes available), in particular to provide more guidance for effective accompanying measures and more consistent and comparable evaluations of national / regional schemes.
Monitoring / evidence base
The NOPA database is a unique and potentially valuable tool for policy making, but so far the information collected has not been made available to a sufficient proportion of stakeholders, in a sufficiently digestible form, for it to have a large impact. With a view towards the next phase of the project, the Commission and WHO Europe should increase the focus on user-friendliness and dissemination of information. In particular, this could entail:
Publish the surveillance data collected so as to facilitate comparison between countries and help stakeholders figure out how their countries are performing in relation to others. Given the volume of data collected and the difficulty in finding such comprehensive data through other sources, the database could become an invaluable resource.
Increase the functionality of the NOPA database website so that stakeholders can find information on the implementation and evaluation of policies rather than just descriptions of those policies.
Communicate about the NOPA database to a wider audience, inter alia through exploring opportunities for cross-promotion on the Commission website and other fora where large numbers of stakeholders can be reached with little cost.
Taking a broader view, this evaluation has highlighted many times that the current provision of surveillance and evaluation data in the EU as a whole is far from adequate. Without such data it is difficult to make statements about current trends with confidence, or to assess the effectiveness of policies meant to address overweight and obesity. The Commission, along with WHO Europe, should work to encourage relevant actors in the Member States to collect better data at regular intervals, promote the awareness and adoption of common standards and methodologies, such as those already developed for the EHIS and Global Physical Activity Questionnaire, and ensure that results are published and disseminated widely.
A re-launched or re-energised EU Strategy on nutrition, overweight and obesity related health issues would also present an opportunity for the Commission to strive for even greater integration between the different areas and fora. In the past, the instances where there has been cooperation and exchanges have generally been useful and informative, such as the joint meetings of the High Level Group and the Platform, or the presentations in these fora on the results of relevant EU-funded programmes or projects. However, there is still room for further improvements in this respect, in order to facilitate learning, generate ideas and show how the different pieces fit together to form a coherent whole. For example, there could be events and/or written or online materials to disseminate the results of various EU-funded projects and other initiatives in a given priority area (such as better informed consumers or physical activity promotion) in a more holistic way. Such initiatives could also help communicate key messages better and to a wider audience, and generate greater buy-in from a range of potential multipliers.