Embed Size (px)
Citation preview

Evaluation of the impact of the HM Prison Service Enhanced Thinking Skills programme on reoffendingOutcomes of the Surveying Prisoner Crime Reduction (SPCR) sample
Greg Sadlier
Ministry of Justice Research Series 1910November 2010
Evaluation of the impact of the HM Prison Service Enhanced Thinking Skills programme on reoffendingOutcomes of the Surveying Prisoner Crime Reduction (SPCR) sample
Greg Sadlier
Analytical Services Justice Policy Group Ministry of Justice (On secondment from London Economics)
This information is also available on the Ministry of Justice website
wwwjusticegovukpublicationsresearchhtm
Disclaimer
The views expressed are those of the authors and are not necessarily shared by the Ministry
of Justice (nor do they represent Government policy)
copy Crown Copyright 2010
You may re-use this information (not including logos) free of charge in any format or medium
under the terms of the Open Government Licence
To view this licence visit httpwwwnationalarchivesgovukdocopen-government-licence
or write to the Information Policy Team The National Archives Kew London TW9 4DU
or e-mail psinationalarchivesgsigovuk
First Published 2010
ISBN 978-1-84099-418-6
Analytical Services exists to improve policy making decision taking and practice
by the Ministry of Justice It does this by providing robust timely and relevant data
and advice drawn from research and analysis undertaken by the departmentrsquos
analysts and by the wider research community
Acknowledgments
The Surveying Prisoner Crime Reduction (SPCR) prisoner survey was funded by the Ministry of Justice (MoJ) the Department of Work and Pensions the Department of Health and the Department for Innovation Universities and Skills Thanks are due to Ipsos MORI whose staff collected the data for this research Special thanks are due to the prisoners who participated in the survey and Governors and staff at participating prisons The research was greatly facilitated by the data cleaning analysis and advice provided by colleagues in Offender Management Analytical Services at MoJ (especially Dr Kathryn Hopkins Richard Boorman Jennifer Poyser Dr Julie Withey Dr Rik van de Kerckhove and Vea Papadopoulou)
The research would not have been possible without the additional data provided by the Rehabilitation Services Group at the National Offender Management Service (especially Rosie Travers) the OASys Data Evaluation and Analysis Team (especially Dr Robin Moore Philip Howard and Dionne Peart) and access to the Police National Computer (maintained by the National Policing Improvement Agency) via the Justice Statistics Analytical Services team at MoJ
Special thanks are due to Miguel Goncalves (Justice Statistics Analytical Services MoJ) for quality assurance of the technical analysis Additional comments on a draft version of the report were also gratefully received from MoJ colleagues (policy makers and practitioners) Finally thanks are extended to the two anonymous peer reviewers
Contents
Policy briefing i
Research summary ii
1 Context 1The Enhanced Thinking Skills programme 2Previous evaluation research 4
2 Approach 7Data sources and sample details 8Outcome measures 11Evaluation research design 11
3 Results 19Effectiveness of ETS in reducing reoffending 19Caveats and limitations of the research 26
4 Implications 28
5 Further research 30
6 Additional resources 32
7 References 33
Appendix Technical annex 37
List of tables and figures
Table 31 Impact of ETS on reconviction outcomes of the SPCR sample 20Table 32 Impact of ETS on reconviction outcomes of the SPCR sample
completers only 21Table 33 ETS suitability criteria fulfilment non-participant
and ETS participant groups 23Table 34 Impact of ETS on reconviction outcomes of the SPCR sample
lsquonot strictly suitablersquo and lsquostrictly suitablersquo participants only 26Table A1 Logistic regression model of prisoner characteristics influencing
probability of treatment (ETS) and reconviction outcomes 38Table A2 Average treatment effect on the treated (ATT) 39Table A3 Means standardised bias reduction and t-tests for equality of means
in the treatment and control groups before and after matching 40Table A4 Need Sum of OASys Section 11 Thinking and Behaviour scores
(OASys) by treatment and control groups 42Table A5 Motivation to change behaviour (OASys) by treatment
and control groups 43Table A6 Problems with readingwritingnumeracy (OASys) by treatment
and control groups 43Table A7 Problems with learning difficulties (OASys) by treatment
and control groups 43Table A8 Problems with current psychological problemsdepression (OASys)
by treatment and control groups 43Table A9 Problems with current psychiatric problems (OASys)
by treatment and control groups 44Table A10 Gender (SPCR) by treatment and control groups 44Table A11 Marital status (SPCR) by treatment and control groups 45Table A12 Ethnicity (SPCR) by treatment and control groups 45Table A13 Previous severe convictions (PNC) by treatment and control groups 46Table A14 Grouped index offence type (PNC) by treatment and control groups 46Table A15 Family member has been convicted of a non-motoring offence (SPCR)
by treatment and control groups 47Table A16 Family member has been in prison (SPCR) by treatment
and control groups 47Table A17 Agree Want to stop offending (SPCR) by treatment and control groups 47Table A18 Disagree Want to stop offending (SPCR) by treatment and control groups 47Table A19 Agree Want to get help to stop offending (SPCR) by treatment
and control groups 48Table A20 Disagree Want to get help to stop offending (SPCR) by treatment
and control groups 48Table A21 Anticipation of reoffending CRIME-PICS (SPCR) by treatment
and control groups 49Table A22 Victim hurt denial CRIME-PICS (SPCR) by treatment and control groups 50Table A23 Evaluation of crime as worthwhile CRIME-PICS (SPCR)
by treatment and control groups 50Table A24 Used class A drugs in the four weeks before custody (SPCR)
by treatment and control groups 51Table A25 Used class BC drugs in the four weeks before custody (SPCR)
by treatment and control groups 51
Table A26 Injected illegal drugs in the four weeks before custody (SPCR) by treatment and control groups 51
Table A27 Accommodation prior to custody (SPCR) by treatment and control groups 51
Table A28 Educational (qualifications) attainment (SPCR) by treatment and control groups 52
Table A29 Was in paid work in the four weeks before custody (SPCR) by treatment and control groups 52
Table A30 Reconviction indicator one-year (PNC) by treatment and control groups 52
Table A31 Frequency of reoffending one-year (PNC) by treatment and control groups 53
Table A32 Frequency of reoffences one-year (PNC) by treatment and control groups 54
Table A33 Severe offences reconviction indicator one-year (PNC) by treatment and control groups 54
Figure 31 Need and risk score distributions for non-participant and ETS participant groups with suitability thresholds 22
Figure 32 Readiness and responsivity score distributions for non-participant and ETS participant groups with suitability thresholds 25
Figure A1 Risk OASys total weighted score (OASys) by treatment and control groups 42
Figure A2 Age (SPCR) by treatment and control groups 44Figure A3 Copas rate on release (PNC) by treatment and control groups 45Figure A4 Total previous convictions (PNC) by treatment and control groups 46Figure A5 General attitude to offending CRIME-PICS (SPCR) by treatment
and control groups 48
i
Policy briefing
More than half of all crime is committed by offenders who have previously been through the criminal justice system1 Time spent in custody therefore presents an important opportunity for intervention to address prisonersrsquo criminogenic needs2 Enhanced Thinking Skills (ETS) is an accredited offending behaviour programme that addresses thinking and behaviour associated with offending with the objective of reducing general reconviction rates3
This research examined the impact of prison-based ETS on the one-year reconviction outcomes of 257 adult participants (all programme starters) between 2006 and 2008 with the following findings
a statistically significant reduction of six percentage points in the one-year reconviction rate compared with the reconviction rate of a matched comparison group
a statistically significant reduction in the frequency of reoffending of 60 recordable offences per 100 released prisoners
no statistically significant impact was found on the severe4 offence reconviction rate
Almost identical impacts were found for completers alone but the significance of the one-year reconviction rate was lost due to the reduction in sample size (by excluding drop-outs)
The research also examined participant suitability targeting relative to the suitability criteria
Only 58 of ETS participants were found to have met the ETS suitability criteria fully (met both need and risk requirements simultaneously) though caveats apply This suggests that the programme was not always administered to the most suitable prisoners which may have limited its effectiveness
A stronger reduction in the reconviction rate and frequency of reoffending was found for participants meeting the suitability criteria
Though the programme has been shown to be effective in practice these findings suggest that a stricter application of the targeting criteria may have further enhanced the effectiveness of the programme in reducing reoffending5
1 Home Office (2006)2 Criminogenic needs refer to a wide range of factors (associated with the pathways) which are generally
understood to be related to offending3 In 2009 ETS was replaced by the Thinking Skills Programme (TSP) representing a refresh and update of the
cognitive skills programme in line with advances in theory and practice Evaluation of reconviction outcomes of TSP participants is not yet possible as not enough time has passed since its introduction
4 Approximately 150 of the 3000 Home Office offence codes are defined as lsquoseverersquo including violence against the person (eg murder manslaughter) sexual offences aggravated vehicle taking and death by dangerous drink or drug driving A full list is available in Ministry of Justice (2010)
5 National Offender Management Service practitioners report that the accuracy of targeting has improved over time meaning that a similar evaluation of ETS in a later period (post-2008) or TSP might find an even more significant effect
ii
Research summary
This research examined the impact of the Enhanced Thinking Skills (ETS) accredited offending behaviour programme on the one-year reconviction outcomes of 257 prison-based participants between 2006 and 2008
ETS is a cognitive-behavioural offending behaviour programme that addresses thinking and behaviour associated with offending with the objective of reducing general reconviction rates It is targeted at medium-highhigh risk male and female offenders with a need for cognitive skills intervention The programme consists of 20 two-hour interactive sessions delivered three to five times per week for four to six weeks with two facilitators and no more than ten participants6
Evaluation of the effectiveness of interventions in reducing reoffending enables policy makers to prioritise and focus resources on the most productive programmes The objective of the research was to evaluate the HM Prison Service Enhanced Thinking Skills accredited offending behaviour programme in terms of reconviction outcomes whilst controlling for the different characteristics needs and risk factors of offenders
The research aims to provide some clarity to the discordant evidence base on the effectiveness of ETS in reducing reoffending Early findings of a statistically significant reduction in reconviction (Friendship et al 2002) following ETS participation were later tempered by research studies finding little or no statistical differences between ETS participants and non-participants (Falshaw et al 2003 Cann et al 2003 Cann 2006 McDougall et al 2009) However all evaluations of reconviction outcomes (Friendship et al 2002 Falshaw et al 2003 Cann et al 2003 Cann 2006) note a common methodological limitation as a possible explanation of their findings the inability to control for potential selection bias due to differences in unmeasured dynamic risk factors7 between the participants and their comparators The key added value of the current study is the ability to match on the basis of dynamic risk factors (for example drug use accommodation motivation to stop offending attitudes education marital status) and additional rich static risk factors (for instance family criminal history) in addition to the standard static risk factors
As the source of the novel dynamic risk factor data the base sample for the analysis is that of the Surveying Prisoner Crime Reduction (SPCR) prisoner survey8 The SPCR dataset was supplemented by data on offender treatment status from the offending behaviour programme interventions database (National Offender Management Service Rehabilitation Services Group) data on the assessed need and risk of prisoners from the Offender Assessment System (OASys) and criminal history and reconviction data from the Police National Computer (PNC)
6 In 2009 ETS was replaced by the Thinking Skills Programme (TSP) representing a refresh and update of the cognitive skills programme in line with advances in theory and practice Evaluation of reconviction outcomes of TSP participants is not yet possible as not enough time has passed since its introduction
7 Reoffending risk factors are split into lsquostaticrsquo factors that cannot be changed (eg age gender criminal history) and lsquodynamicrsquo factors that can be changed (eg drug misuse motivation to stop offending attitudes to crime)
8 A large-scale longitudinal cohort study of nearly 4000 newly sentenced adult prisoners in England and Wales
iii
The final sample size was 2771 prisoners sentenced to between one month and four years including 2405 (87) men and 366 (13) women The treatment sample comprised 257 (9) prisoners who participated on ETS between March 2006 and September 2008 including 20 (8 of participants) that did not complete the course The remaining 2514 prisoners did not participate on ETS and were used to select a matched comparison group
A retrospective quasi-experimental research design was used to compare the one-year reconviction outcomes of participants with a matched comparison group that had not participated in the programme Three outcome measures of proven reoffending9 were considered (all within one year of release) the proportion of prisoners that were reconvicted the frequency of reoffending and the proportion that were reconvicted of a severe offence
Propensity score matching10 was used to select a comparison group that was statistically lsquosimilarrsquo to participants across a set of pre-selected characteristics that are predictive of ETS participation and reconviction measured prior to treatment
ETS suitability criteria level of criminogenic need (factors associated with offending behaviour) risk of reconviction and responsivity and readiness criteria
Static risk factors age gender index offence type Copas rate (a measure of criminal career length and intensity) sanctioning history (previous convictions and previous severe convictions) ethnicity marital status and family criminal history
Dynamic risk factors motivation to stop offending attitudes to offending drug use accommodation educational attainment and employment status before custody
Equality of means testing confirmed no statistically significant difference between the treated and matched control group across all matching characteristics Any observed difference in the average reconviction rates between the two groups is therefore assumed to be the causal effect of the ETS intervention known as the average treatment effect on the treated (ATT)
Whilst every effort has been made to remove the selection bias it is possible that an unmeasured bias may still remain uncontrolled Further checks revealed some differences between the treatment and control groups It was found that the average sentence length of the treatment group (975 days) was longer than that for the control group (727 days) It was also found that 6 of the treatment group and 2 of the control group had been on another accredited OBP during the SPCR sentence though both proportions are small It is also possible that prisoners may have participated on non-accredited OBPs or a substance 9 An offender is said to have committed a proven reoffence if the offender receives a conviction (by a caution or
guilty verdict) at court for the reoffence The reoffence must have been committed within the one-year follow up period and the conviction must follow either within that one-year follow up or in a further 6 months which is to allow time for the offence to be proven at court
10 Technical note Controls were matched using a radius matching algorithm (calliper = 005) based on the odds ratio of the propensity score predicted using logistic regression
iv
misuse treatment during their SPCR sentence period which may have contributed to the observed treatment effect The potential for such multiple interventions has not been controlled for as the sample size did not permit such analysis The standard caveat covering generalisability of findings from limited sample sizes applies
The results of this evaluation show that ETS was successful in significantly reducing both the reconviction rate and frequency of general reoffending of participants
The proportion of ETS participants that were reconvicted within one year (272) was six percentage points lower (statistically significant) than the comparison group (335)
ETS participants were convicted of 60 fewer recordable offences within one year per 100 released prisoners than comparators (607 versus 1208 offences) a statistically significant reduction
No statistically significant impact was found on the severe offence reconviction rate (a reduction of 01 percentage points was not statistically significant)
Almost identical impacts were observed for completers only (drop-outs were removed from the sample) The same significant reduction in frequency of reoffending was found but the significance of the reduction in the rate of reconviction was lost due to the reduction in sample size (by excluding drop-outs) Nonetheless evaluation based on all participants better captures the true effect of the intervention in practice (Colledge et al 1999)
A secondary finding of the research was a low adherence to the suitability targeting criteria among those prisoners that actually received the programme over the period 2006 to 2008 though caveats apply Investigation revealed that only 58 of ETS participants were suitable for ETS (met both need and risk requirements simultaneously) This suggests that the programme was not always administered to the most suitable group of prisoners which may have limited its effectiveness The reconviction rate and frequency of reoffending was found to be lower for participants meeting the suitability criteria than those not meeting them The one year reconviction rate for strictly suitable treated offenders (172) was lower than that for not strictly suitable ones (329) Similarly the frequency of reoffending of strictly suitable offenders (398 reoffences) was also lower than that of the not strictly suitable offenders (726 reoffences)
The findings are encouraging for policy makers and practitioners alike The fact that ETS has been found to significantly reduce the one-year reconviction rate and frequency of reoffending provides support for the funding and use of ETS (and by extension its replacement TSP) in custody Though the programme has been shown to be effective in practice these research findings suggest that a stricter application of the targeting criteria
v
may have further enhanced the effectiveness of the programme in reducing reoffending11 National Offender Management Service practitioners report that the accuracy of targeting has improved over time meaning that a similar evaluation of ETS in a later period (post-2008) or TSP might find an even more significant effect
11 Research clearly demonstrates the importance of risk need and responsivity targeting for effective treatment (Hollin 1995 Taxman and Thanner 2006 Palmer et al 2009 Gendreau et al 2009 Andrews and Bonta 2010)
1
1 Context
Reoffending accounts for a substantial proportion of crime and reducing reoffending is an important policy objective of the criminal justice system
As more than half of all crime is committed by offenders who have previously been through the criminal justice system12 todayrsquos prison population includes the likely offenders of tomorrow Therefore time spent in custody presents an opportunity for intervention to rehabilitate prisoners by addressing their criminogenic needs13 so as to improve their chances of re-integrating successfully into society on their release Offending behaviour programmes (OBPs) ndash rehabilitation programmes designed to identify reduce and monitor factors associated with offending ndash play an important role in this effort to break the cycle of crime
This research examined the impact of the Enhanced Thinking Skills (ETS) accredited offending behaviour programme on the one-year reconviction outcomes of 257 prison-based participants between 2006 and 2008
Research question
Evaluation of the effectiveness of interventions in reducing reoffending enables policy makers to prioritise and focus resources on the most productive programmes Ineffective programmes can then be targeted for reform or termination just as effective programmes can be identified with improvements sought to further enhance effectiveness This evaluation seeks to contribute to this process by evaluating what has been the most frequently delivered accredited OBP in HM Prison Service
The objective of the research was to evaluate the HM Prison Service Enhanced Thinking Skills accredited offending behaviour programme by linking interventions in prison to reconviction outcomes whilst controlling for the different characteristics needs and risk factors14 of offenders Incorporating new data on dynamic risk factors the analysis is based on the Surveying Prisoner Crime Reduction (SPCR) prisoner survey sample
Whilst the ETS programme has been evaluated previously (Friendship et al 2002 Falshaw et al 2003 Cann et al 2003 Cann 2006 McDougall et al 2009) this is the first time that dynamic risk factors (including drug use accommodation motivation to stop offending attitudes marital status) and additional rich static risk factors (for instance family criminal history) provided by the SPCR survey have been available to improve comparison group matching
12 Home Office (2006)13 Criminogenic needs refer to a wide range of factors (associated with the pathways) which are generally
understood to be related to offending14 Reoffending risk factors are split into lsquostaticrsquo factors that cannot be changed (eg age gender criminal
history) and lsquodynamicrsquo factors that can be changed (eg drug misuse motivation to stop offending attitudes to crime)
2
The Enhanced Thinking Skills programmeEnhanced Thinking Skills (hereafter referred to as ETS) is a short group-based general offending behaviour programme delivered by HM Prison Service that addresses thinking and behaviour associated with offending with the objective of reducing general reconviction rates15 Following the cognitive-behavioural approach it is based on the premise that cognitive skills deficits (for example poor problem solving and critical reasoning) are important factors in explaining offending behaviour and that such skills can be taught (Clarke 2000)
Through a sequenced series of structured exercises ETS aims to boost prisonersrsquo cognitive skills to enhance offendersrsquo ability to achieve worthwhile goals and ultimately reduce recidivism The exercises are designed to target six key aspects of thinking skills linked with offending impulse control cognitive style (flexible thinking) social perspective taking valuesmoral reasoning critical reasoning and interpersonal problem solving
ETS was developed by the Prison Service in the early 1990s and was first accredited for use in custody in 199616 The programme consists of 20 two-hour sessions run between three and five times per week for a period of four to six weeks Sessions involve interactive exercises assignments role playing and discussions and are run by two facilitators with no more than ten participants per group
In 2009 ETS was replaced by the Thinking Skills Programme (TSP) representing a refresh and update of the cognitive skills programme in line with advances in theory and practice
Suitability criteria
ETS is targeted at male and female offenders who are medium-high risk or above with a need for cognitive skills intervention The specific risk and need requirement participant identification tools (jointly referred to as lsquosuitability criteriarsquo) applicable during the period of treatment are set out below17
15 Since 2000 an amended version of ETS has been delivered by HM Probation Service to offenders in the community
16 Ministry of Justice (2009)17 The suitability criteria for ETS have been revised over time Those employed in this analysis are based
on the Assessing Suitability for Offending Behaviour Programmes Risk Need amp Responsivity Guidance for Treatment Managers published in August 2007 (HM Prison Service 2007) The ETS start dates of treated individuals in the SPCR sample stretch from March 2006 to September 2008 so this guidance was introduced in the middle of this period Nonetheless as an indication and selector of suitability for the intervention the guidance is retrospectively relevant With the emergence of OGRS version 3 (Howard et al 2009) later guidance (National Offender Management Service 2009) has defined the risk requirement for ETS (and its replacement TSP) with reference to OGRS3 (2 year reconviction 50 and above)
3
Risk requirements18
The assessment of risk of proven reconviction ensures that the programme is appropriate for the individual The risk threshold specified for ETS is the point on either the Offender Assessment System (OASys) or Offender Group Reconviction Scale19 version 2 (OGRS2) scale (with the higher score band used if both are completed) that divides lsquolow-mediumrsquo from lsquohigh-mediumrsquo risk offenders
OASys score 56 or above or
OGRS2 score 41 or above
Need requirements20
The assessment of need ensures that the programme is relevant to the individualrsquos needs Potential need for cognitive skills intervention is considered present if the sum of the prisonerrsquos scores on a selected seven of the ten Section 11 (Thinking and Behaviour) items of the OASys assessment totals 7 or above or totals 4 or above with at least one individual score of 2 (indicating significant problems) The seven selected Section 11 items are impulsivity ability to recognise problems problem solving skills awareness of consequences achieves goals understands other peoplersquos views and concreteabstract thinking
Responsivity and readiness criteria
Though more advisory than prescriptive consideration is also given to the responsiveness and readiness of the individual to benefit from the programme This is assessed in relation to intellectual ability literacy dyslexialearning difficulty mental and physical health psychopathic traits motivation to change behaviour and disability This ensures that the programmersquos mode of delivery matches the learning styles and other diverse needs of participants
Prioritisation of suitable candidates
Once assessed as suitable for the programme candidates are then prioritised according to risk of serious harm likelihood of reconviction proximity to release timing of hearings likelihood of positive impact group composition and other opportunity for treatment21
18 Prior to August 2007 the Sentence Planning Risk Predictor was used as the risk tool when assessing suitability for any OBP There is some flexibility in the application of the risk requirement with prisoners within three points of the OASysOGRS2 cut-off permitted to progress for need requirement consideration There are also exemptions to the cut-offs for indeterminate sentenced prisoners and sex offenders who score at least medium on the Risk Matrix 2000
19 The Offender Group Reconviction Scale (OGRS) is a risk assessment measure used to predict the likelihood of reconviction for individual offenders based on static risks (age gender and criminal history) alone
20 The original indicator of criminogenic needs the ETS Semi-Structured Interview has gradually been replaced by OASys Section 11 scores as confirmed in later guidance (National Offender Management Service 2009)
21 HM Prison Service (2007)
4
Previous evaluation researchPrevious evaluations of ETS have produced mixed results on the effectiveness of the programme Early findings of a statistically significant and large reduction in reconviction were later tempered by research studies finding little or no statistical differences between ETS participants and non-participants Results have also differed depending on whether starters or completers are included and whether a one- or two-year reconviction outcome is used Several reasons for the disparity in findings have been speculated with all studies citing the potentially important role of unmeasured dynamic factors This is a shortcoming that this study sought to address
All reconviction studies to date have used a retrospective quasi-experimental research design that compares the reconviction outcomes of the ETS treatment group with those of a comparison group matched on a narrow range of static risk factors
The first evaluation of ETS by Friendship et al (2002) examined the pre-accreditation ETS programme delivered by HM Prison Service (from 1992 to 1996) The research found statistically significant reductions in the two-year reconviction rate of male ETS participants Specifically participation in either ETS or Reasoning and Rehabilitation (RampR)22 was found to significantly reduce the two-year reconviction rates for medium-to-low (by 14 percentage points) and medium-to-high (11 percentage points) risk offenders No significant effect was found for either low or high risk offenders
Subsequent studies of the post-accreditation programme could not reproduce these positive results In contrast Falshaw et al (2003 2004) failed to find a statistically significant difference in the two-year reconviction rates of adult ETS participants (1996 to 1998) in any of the OGRS risk bands whether programme non-completers were included or excluded A similar evaluation by Cann et al (2003) investigated the temporal effects of ETS by studying both the one- and two-year reconviction rates for male adult and young offenders (1998 to 2000) Whilst no difference was detected for all adult males who had started the programme a significant reduction in the one-year rate was found for males (26 percentage points on average and 70 for high risk offenders) and young offenders (36 percentage points on average) who had completed the programme However these differences were not maintained a further year on with no significant effect found for any group at the two-year post-release stage suggesting that the impact of ETS on reoffending behaviour may be short-lived
The possibility of a differential gender impact of ETS was considered by Cann (2006) who assessed the impact of ETS on a group of female (only) participants ndash the only evaluation to consider female prisoners The results were similar to the post-accreditation evaluations of ETS delivered to males with no significant differences in the one- and two-year reconviction rates of female ETS participants
22 The researchers note that ldquo[a]s Reasoning and Rehabilitation (RampR) and Enhanced Thinking Skills (ETS) share the same theoretical basis the programmes are analysed alongside one anotherrdquo (Friendship et al 2002 pp2-3)
5
More recently a randomised control trial (RCT) evaluation of ETS in HM Prison Service by McDougall et al (2009) focused on the short-term impact of the programme They found that ETS was effective in reducing impulsivity and changing the self-reported offending-related thinking of adult male prisoners No examination of reconviction outcomes was possible however as ethical considerations of treatment denial meant that the comparison group also participated in an ETS programme later in their sentence prior to release Nonetheless as impulsivity has been linked to reoffending (Blackburn 1972 Eysenck and McGurk 1980 Mak 1991) this finding suggests an expected reduction in recidivism for participants This result supports earlier findings (Clarke et al 2004) that ETS participation brought short-term non-reconviction benefits including increased self-confidence developed interpersonal skills and improved prisoner behaviour The nature of prisonersrsquo motivations for participating in a cognitive behaviour programme was also found to be a key factor in assessing the effectiveness of the programme (Clarke et al 2004)
Rationale for this evaluation
Existing evaluation evidence on ETS is therefore inconclusive (McDougall et al 2009) Reflecting on the disagreement of later findings with those of Friendship et al (2002) it has been suggested (Falshaw et al 2003 Cann et al 2003) that the early large significant impact may have reflected an initial enthusiasm of programme tutors motivation of participants andor the focused nature of delivery prior to its accreditation and later expansion23 Such an explanation would if true create doubts about the efficacy of OBP accreditation and roll-out of programmes across the Prison Service
Alternatively another factor may drive the variability of evaluation results Whilst disagreeing in terms of research findings all previous evaluations of ETS note one common methodological limitation as a possible explanation of their findings the inability to control for potential differences in dynamic risk factors (Friendship et al 2002 Falshaw et al 2003 Cann et al 2003 Cann 2006) As very little data have been available to date on dynamic factors previous studies have been constrained to matching based on a narrow range of static risk factors alone (for example age gender ethnicity criminal career variables) Consequently potential selection bias due to differences in unmeasured dynamic risk between the participants and their comparators has not been controlled Such bias could plausibly account for the variation of the evidence to date
The key advantage and added value of this research is the opportunity to match using dynamic risk factors in addition to static ones afforded by SPCR prisoner survey and OASys data Some of the dynamic risk factors on which data are available are motivation to stop offending attitudes to crime substance misuse physical and mental health educational
23 For a qualitative examination of the process of ETS implementation and delivery in a prison context please see Clarke et al (2004)
6
attainment and skills level employment status accommodation status marital status and needs The prisoner survey also allows matching on additional rich static risk factors (for example family contact with the criminal justice system)
A further limitation of previous evaluations has been the reliance on Offenders Index data to assess reconviction which may not be the most complete source of such information (Falshaw et al 2003) The current study improves on this aspect by drawing its reconviction data from the Police National Computer the official source of criminal conviction histories
7
2 Approach
The research methodology of the study covering data sources final sample details and analysis techniques employed is summarised and explained in this section More details on technical points are provided in the Technical Annex
This evaluation assessed the impact of the HM Prison Service ETS programme on reoffending using a retrospective quasi-experimental research design that compared the one-year reconviction outcomes of participants with those of a matched comparison group that had not participated in the programme The research set out to test the hypothesis that ETS has no significant impact on the reconviction rates of programme participants
Based on the SPCR prisoner sample and incorporating data from the Offending Behaviour Programme Interventions Database Offender Assessment System (OASys) and the Police National Computer (PNC) the assembled dataset provides a profile of prisonersrsquo characteristics needs experiences and outcomes of unprecedented detail The combined dataset comprises more than 1800 variables on a final sample of 3277 prisoners
The comparison (matched control)24 group was generated using a statistical matching technique such that it is sufficiently lsquosimilarrsquo25 to the ETS participant (treatment) group to permit valid comparison The effect of this technique is to balance the programme suitability offending-risk characteristics and criminogenic needs across the treatment and matched control groups A strong match has been achieved taking account of 42 variables meaning that the treatment and control groups are statistically lsquosimilarrsquo or unbiased such that we would expect to observe the same reoffending outcomes for each group on average Any observed difference in the average reconviction rates between the two groups may therefore be assumed to be the causal effect of the ETS intervention known as the average treatment effect on the treated (ATT)
The analysis was carried out on an lsquointention-to-treatrsquo basis (consistent with Colledge et al 1999) whether the participant completed the ETS programme or not though analysis of completers only has also been run for completeness
24 A note on terminology used for the remainder of the report following the evaluation literature the term lsquotreatment grouprsquo is used in this report to refer to those prisoners in the sample that received ETS in the relevant sentence period Conversely the term lsquountreatedrsquo is used to distinguish those prisoners in the sample that did not receive ETS in the relevant sentence period The term lsquocontrolrsquo (and lsquomatched controlrsquo) is reserved to refer to the untreated prisoners that form part of the matched control group following propensity score matching
25 lsquoSimilarrsquo is defined as having mean values that are not statistically different from those of the participant group across a set of variables pre-selected as being simultaneously predictive of the probability of treatment and the probability of reconviction
8
Data sources and sample detailsAs the source of the novel dynamic risk factor data the base sample for the analysis is that of the SPCR prisoner survey The SPCR dataset is supplemented by merging to three further data sources data on which prisoners received ETS in what time period from the Offending Behaviour Programme Interventions Database data on the assessed need and risk of prisoners from the Offender Assessment System (OASys) and criminal history and reconviction data from the Police National Computer Each data source is described in turn
SPCR prisoner survey (wave 1)
Surveying Prisoner Crime Reduction (SPCR) is a large-scale longitudinal cohort study of nearly 4000 newly-sentenced adult prisoners in England and Wales comprising four waves of interviews conducted between 2005 and 2009
This evaluation uses wave 1 data only Wave 1 conducted at the point of reception into prison describes the characteristics and needs26 of the cohort of prisoners demographics background and family offending history educational achievements employment status physical and mental health substance misuse accommodation and relationships attitudes27 needs to help prevent them from reoffending and plans and expectations for the future (upon release from prison) All data are self-reported and as the survey responses relate to the start of the particular custodial sentence all responses are measured before any treatment could have commenced
Prisoners were selected from the Ministry of Justicersquos (MoJ) Inmate Information System (IIS) database and their current location found using MoJrsquos Local Inmate Data System (LIDS) The minimum sentence length accepted was one month due to the time taken to locate the prisoner and interview them and the maximum sentence length was four years to allow for a reasonable data-collection period Prisoners were recruited into the study on the basis of fully informed consent and ethical guidelines for social research were followed Prisoners were interviewed by specially trained researchers using computer-assisted (CAPI) questionnaires
Interview targets were set for every reception prison (except those with very low throughput) based on the proportional sizes of receptions at each prison Prison reception characteristics were found to be highly variable and targets were compiled using the most recent information available Over-sampling targets were calculated to allow for any difficulties in accessing prisoners Thus the interviews were drawn from 40 prisons from a possible 53 eligible prisons
26 The term lsquoneedsrsquo is used throughout to refer to a wide range of factors (associated with the pathways) which are generally understood to be related to offending sometimes known as ldquocriminogenic needsrdquo A summary of the general problems and needs of these newly sentenced prisoners has already been published (Stewart 2008)
27 Attitudes are measured using CRIME-PICS II (Frude et al 1994) a widely used and validated questionnaire-based instrument for examining and detecting changes in offendersrsquo attitudes to offending Special thanks are due to Jennifer Poyser in Offender Management Analytical Services at MoJ for the conversion of SPCR attitude question responses to CRIME-PICS II scores
9
The full sample (after removal of ineligible participants)28 at wave 1 was 3849 adult prisoners sentenced to between one month and four years29 This represents the base sample for this evaluation though the final sample will be smaller due to failed matches in database merging and data completion filters
Offending Behaviour Programme Interventions Database
To determine the treatment status of the base sample (that is which prisoners had received ETS during their sentence period) the SPCR wave 1 dataset was linked to the OBP prison interventions database compiled by the National Offender Management Service (NOMS) Rehabilitation Services Group30
The database is based on administrative records of interventions delivered to prisoners (71521 unique prisoner numbers) from 1994 to 2009 It covers accredited OBPs only including Controlling Anger and Learning how to Manage it (CALM) Cognitive Skills Booster (CSB) Cognitive Self Change Programme (CSCP) Enhanced Thinking Skills (ETS) Focus on Resettlement (FOR) Healthy Relationships Programme (HRP) Reasoning and Rehabilitation (RampR) Chromis JETS and Sex Offender Treatment Programme (SOTP)
When matched to the SPCR sample (by prisoner number) it was found that 449 (12) of the 3849 SPCR prisoners had received an accredited intervention The magnitude of this intervention rate was validated by comparison of total ETS programme participants and total prison population figures More specifically 371 (10) prisoners were identified as having participated in ETS within the SPCR sentence period All started the programme between March 2006 and September 200831 ETS was by far the most common OBP intervention delivered and the only individual programme with a sufficient number of participants to permit a statistical analysis of effectiveness
Offender Assessment System (OASys)
For verification of suitability for the programme and to allow matching of control prisoners based on these characteristics data are required on the risk and need of the prisoners in the sample This data requirement is fulfilled by the Offender Assessment System (OASys)
28 Twenty-eight participants were removed due to ineligibility Please see the SPCR Technical Report for more information
29 There are two sub-samples within SPCR Sample 1 (Reception Prisoners) is representative of the entire prison reception population (the lsquoflowrsquo into prison) at the time of sampling (n=1435) Sample 2 (Longer-term Prisoners) is a booster sample to reflect the higher proportion of longer-term prisoners in the prison population (the lsquostockrsquo of prisoners) (n=2414) Please see the SPCR Technical Report for more information This evaluation study uses the combined sample and does not distinguish between the two sub-samples That said ETS tends to be reserved for longer-term prisoners
30 Previously known as the Interventions amp Substance Misuse Group (ISMG)31 If a prisoner was recorded as receiving more than one ETS course in the SPCR sentence period the latest
start date was used
10
OASys is NOMSrsquos principal riskneed assessment and management tool for adult offenders in England and Wales and is used to assess suitability for ETS Introduced in 2001 OASys produces standardised assessments of offendersrsquo risks and needs by combining actuarial methods of prediction with structured professional judgement In terms of outputs OASys provides data on the likelihood of reconviction criminogenic factors (need) and risk of harm
The SPCR sample was matched to the OASys database by PNC number All OASys assessments completed for the prisoners in the SPCR sample subject to data completion criteria32 were provided by the OASys Data Evaluation and Analysis Team (O-DEAT) numbering some 2956433 Nonetheless as OASys assessments are not mandatory and the coverage of OASys is not universal an OASys assessment is available for only 3512 prisoners (316 of which were treated)
With an average of eight assessments provided per prisoner the one OASys assessment relevant to the instance of ETS participation was selected for each prisoner The method of selection differed for treated and untreated prisoners As the start date of ETS is known for each participant the most recent assessment prior to the start date was selected As there is no start date for the untreated group the OASys assessment completed closest (before or after) to the SPCR sentence prison reception date was selected
Police National Computer
Criminal conviction history and reconviction data were obtained from the Police National Computer (PNC) The SPCR sample was matched to the PNC database (June 2010 snapshot) using personal identifiers (surname forenames gender date of birth) returning 3615 valid matches34 Respondents must have been released for a minimum of one and a half years (allowing one year to reoffend and six months to be convicted) to be included in the matched sample Respondents that were deceased deported or had absconded were excluded from the sample
Final achieved sample details
Following merging of the four datasets 2771 of the 3849 full SPCR sample (and 257 of the 371 ETS participants) had complete data a valid OASys assessment matched to the PNC and had no missing data on any variables employed in the statistical modelling The sample included 2405 (87) men and 366 (13) women
32 All assessments provided met the following minimum standards of data completion Each of the scored sections (1 to 12) within the core OASys assessment must have had at least four-fifths of their scored items completed ndash ensuring that each criminogenic need was assessed properly and In the risk of serious harm sections the screening must have been completed the decision whether to complete a full risk analysis should have been consistent with the information provided and the four ratings of risk of serious harm in the community must have been completed (OASys Data Evaluation and Analysis Team 2010)
33 All OASys assessments used in the analysis are pre-OASys release 431 (August 2009) assessments34 Special thanks are due to Richard Boorman in Offender Management Analytical Services at MoJ for matching
the SPCR sample to the PNC and completing the reconviction analysis
11
The participant sample comprised 257 (9 of the final sample) treated prisoners who started ETS between March 2006 and September 2008 This includes 20 (8 of all treated) participants that did not complete the course a similar proportion observed in previous studies (Friendship et al 2002 Falshaw et al 2003 Cann et al 2003 Cann 2006) The remaining 2514 prisoners did not undertake ETS which provides a reasonable pool from which to select a matched control group35
Outcome measuresTo assess programme effectiveness the impact of ETS is measured with reference to the one-year reconviction outcomes of participants and comparators To reflect the fact that a successful outcome for ETS could include no reconviction (general andor severe) or a reduction in the frequency of reoffending three separate measures of proven reoffending36 are examined defined as follows
reconviction rate (one-year) binary (yesno) indicator of whether the offender was convicted of a recordable offence that was committed within the 12-month period after release from the SPCR custodial sentence
reoffending frequency (one-year) continuous measure of how many recordable offences the offender was convicted of that were committed within the 12-month period after release from the SPCR custodial sentence (note that there may be more than one offence per conviction) and
severe offence reconviction rate (one-year) binary (yesno) indicator of whether the offender was convicted of a severe offence that was committed within the 12-month follow-up period after release from the SPCR custodial sentence The designation of an offence as lsquoseverersquo follows a standard definition under which approximately 150 of the 3000 Home Office offence codes are defined as severe37
Evaluation research designTo evaluate the impact of ETS it would be desirable to compare each treated prisonerrsquos reconviction outcome after treatment with what it would have been without treatment The latter is of course not observable ndash a treated individual cannot have an untreated outcome ndash and so a proxy must be created
35 It is possible that prisoners (participants and non-participants) may have participated in other intervention programmes accredited (for example another OBP or substance misuse treatment) andor non-accredited (of varying quality) during their SPCR sentence period Analysis of the level of participation on other accredited OBPs by the treatment group and matched control groups is presented later in this section
36 An offender is said to have committed a proven reoffence if the offender receives a conviction (by a caution or guilty verdict) at court for the reoffence The reoffence must have been committed within the one-year follow up period and the conviction must follow either within that one-year follow up or in a further 6 months which is to allow time for the offence to be proven at court
37 Severe offence types include violence against the person (murder attempted murder manslaughter wounding) sexual offences (sexual assault rape sexual activity with a minor or a person with a mental disorder abuse of children through prostitution and pornography trafficking for sexual exploitation) aggravated vehicle taking and death by dangerous drink or drug driving A full list of severe offence types is available in lsquoAppendix G List of most serious (severe) offencesrsquo of Ministry of Justice (2010)
12
Due to the active selection mechanism for ETS treatment (see suitability criteria in section 1) it is likely that prisoners selected for treatment differ on average from untreated prisoners even before treatment commences ETS participants should be characterised by a medium-to-high reconviction risk and a high level of criminogenic needs whereas non-participants should have a profile that is more reflective of the general prison population This is known as selection bias For this reason any difference observed in a simple comparison of the average outcome of the treatment group with that of the untreated group could be explained by factors other than the intervention treatment It is important therefore to remove as much of the selection bias as possible between the treatment group and comparison groups prior to comparison of the average outcomes The Propensity Score Matching (Rosenbaum and Rubin 1983) statistical technique has been developed for this very purpose
A primer on Propensity Score Matching
Whilst only a Randomised Control Trial (RCT)38 can ensure a random distribution of any unobserved sources of potential bias ethical and practical considerations can mean that RCT is not an easy-to-use methodology to evaluate the impact of interventions on reconviction rates
Instead Propensity Score Matching (PSM) has been selected to estimate the causal treatment effect of ETS39 On the Scientific Methods Scale adapted for reconviction studies (Harper and Chitty 2005 National Offender Management Service 2005) PSM rates as a level 4 research design ldquothat controls for bias by using the most robust method of matching individuals on all variables that affect participation in the intervention as well as all variables that affect outcomerdquo40 As differences in the variables influencing the treatment and the outcome are controlled for after the treatment intervention the approach is defined as a retrospective quasi-experimental design
The basic idea of PSM is to select a group of untreated individuals that are statistically lsquosimilarrsquo to the group of treated individuals across the set of relevant observed characteristics measured at the pre-treatment (and pre-allocation) stage41 Once the group is well matched (little or no statistical difference in the means of the matching variables) to the treatment group it is an adequate control group to generate the proxy untreated outcome Differences between the outcomes of the treated and untreated groups can then be attributed to the intervention
38 ldquoAn RCT compares outcomes when the intervention is used to outcomes without the intervention or with an alternative (seen in the control group) In an RCT participants are randomly allocated to an intervention or a control group which differs systematically in the type or amount of the intervention received The groups are otherwise equivalent because all other differences are randomly distributedrdquo (National Offender Management Service 2005 p2)
39 In the lsquoScientific Methods Scale adapted for reconviction studiesrsquo (National Offender Management Service 2005) a five-level lsquostandard of researchrsquo scale (5 representing the highest standard) of methodologies to evaluate the impacts of an intervention on reoffending and other offence-related outcomes propensity score matching rates as a level 4 research design (RCT is the only level 5 method) Level 4 is defined as ldquoComparison group matched to intervention group on theoretically relevant factors eg risk of reconviction (well-matched comparison group)rdquo (National Offender Management Service 2005 p3)
40 National Offender Management Service (2005) p 341 Specifically PSM matches individuals based on their probability (propensity score) of participating in the
intervention programme given their observed characteristics
13
Matching methodology
The matching methodology used to generate the matched control group comprises five components suitability filter pre-selected matching variables matching algorithm the parsimonious PSM model and assessment of the match quality Consultation on the methodology employed was undertaken with analyst and policy colleagues at MoJ and NOMS
Suitability filter of potential control matches
The codification of the suitability criteria defining the prisoner needs and characteristics that determine selection into the programme presents the opportunity to control directly for selection bias Assuming that untreated prisoners satisfying the suitability criteria did not receive treatment due to practical barriers (for example ETS was not provided at the establishment the prisoner was participating on another programme or was movedreleased whilst on waiting list) non-participants could be filtered by the suitability criteria to yield an ETS-suitable pool of untreated potential control matches
Such a filter was successfully implemented though with an unexpected result As the OASys data provided did not include OGRS2 scores the risk requirement was assessed with respect to the OASys score This is not invalid as the guidance notes ldquoIf an offender passes the cut-off on one but not both scales [ie OGRS2 and OASys total weighted score] you can consider them to be suitable to progress to the needs assessment stagerdquo42
To ensure the relevance of the filter a cross-check was carried out by applying the same filter to the treatment group with the expectation of finding a high rate of compliance However this analysis revealed that a substantial proportion (up to 42) of ETS participants failed to satisfy even the basic need and risk requirements for ETS suitability43 This is the first noteworthy finding of this research and has important implications for the evaluation Full results are presented and discussed in the following Results section
The direct implication of this finding is that an explicit suitability criteria filter of the potential control pool would be unnecessarily restrictive seeing as the treatment group itself does not satisfy the criteria It also has an important implication for the potential effectiveness of the programme If the suitability criteria are designed so as to identify the individuals that are most likely to benefit from the intervention then a weak adherence to these suitability criteria would constrain the potential effectiveness that the intervention programme could actually achieve in practice (Andrews and Bonta 2010) This is an important point as a programme
42 HM Prison Service (2007) p543 It is important to note some caveats to this analysis (explained fully in the Results section) The specification
of the risk tool to OGRS2 or OASys was only introduced in August 2007 half-way through the period under analysis (March 2006 to September 2008) A secondary indicator of criminogenic needs the ETS Semi-Structured Interview was also used historically though emphasis was placed on the OASys Section 11 scores in the assessment of need There is also some flexibility allowed in the application of the suitability criteria individuals with an OASys or OGRS2 score within three points below the cut-off may be progressed to ETS and special considerations are made for indeterminate sentence prisoners and sex offenders
14
evaluation result of no statistically significant reduction in reconviction may actually be reflecting poor targeting rather than a poor programme
Pre-selected matching variables
Prior to undertaking the matching and outcome analysis a wide range of factors were identified as being the most important drivers of participation in the intervention and the reconviction outcome These variables have two functions First they form the basis of the full specification of the matching model Second the quality of the control group match is assessed by comparing its mean values with those of the treatment group on each one of these variables In addition to ETS suitability criteria and the standard static risk factors the list includes several dynamic risk factors unlike previous evaluations
The first group of factors identified are those that (should) determine the probability of treatment ndash the ETS suitability criteria level of criminogenic need risk of reconviction and responsivity and readiness criteria (motivation to change behaviour and whether the prisoner has problems with reading writing numeracy learning difficulties psychological problemsdepression or psychiatric problems)
The second group are static reconviction risk factors selected as the variables underpinning the OGRS3 score found to be a more accurate predictor of reconviction than OGRS2 and the Sentence Planning Risk Predictor (Howard et al 2009) Namely the individual static factors include age gender index offence type (explained below) the Copas rate44 sanctioning history (total previous convictions and previous severe convictions and their quadratics) Additional static risk factors from SPCR survey responses have also been included ethnicity (White Black Mixed Asian and Other background) marital status family criminal history
Every offence type has a distinct Home Office code of which there are more than 3000 which are grouped into 20 categories in the standardised OGRS classification After checking the distribution of the ETS participants across these 20 categories most had too few observations to be statistically useful Accordingly the 20 offence categories have been further grouped into six categories that are both meaningful (similar offences) and contain 20 or more treated prisoners45 The final offence type groupings with grouped OGRS categories are Violent (violence and public orderriot offences) Robbery Sexual (sexual offences not against a child sexual offences against a child and solicitingprostitution) Acquisitive (burglary (domestic) burglary (other) theft (non-motor) handling stolen goods fraud and forgery taking and driving away and related offences and theft from vehicles) Drug (drugs import export production or supply and drugs possessionsmall-scale supply) Other (abscondingbail offences other motoring drink driving criminal damage and any other offences)
44 The Copas rate (Copas and Marshall 1998) is a measure that reflects both the intensity and length of the offenderrsquos criminal career calculated as log [ (number of sanction occasions) (10 + years between first and current sanction) ] The higher the Copas rate the more convictions an offender has amassed in a given amount of time and the more likely it is that the offender will reoffend within one year
45 An exception is the lsquoOtherrsquo category the reference category for modelling which has 15 treated participants
15
Box 21 Matching variables pre-selected as being predictive of ETS participation and reconviction risk
Programme suitability criteria Need Sum of OASys Section 11 Thinking and Behaviour scores (OASys) Risk OASys total weighted score (OASys) Motivation to change behaviour (OASys) Problems with readingwritingnumeracy (OASys) Problems with learning difficulties (OASys) Problems with current psychological problemsdepression (OASys) Problems with current psychiatric problems (OASys)
Static risk factors Gender (SPCR) Age (SPCR) Marital status Married (SPCR) Marital status Living with a partner (SPCR) Ethnicity Any Mixed background (SPCR) Ethnicity Any Asian background (SPCR) Ethnicity Any Black background (SPCR) Ethnicity Any Other background (SPCR) Copas rate on release (PNC) Previous convictions (PNC) Previous convictions squared (PNC) Previous severe convictions (PNC) Previous severe convictions squared (PNC) Index offence type Violent (PNC) Index offence type Sexual (PNC) Index offence type Acquisitive (PNC) Index offence type Drug (PNC) Index offence type Robbery (PNC) Family member has been convicted of a non-motoring offence (SPCR) Family member has been in prison (SPCR)
Dynamic risk factors Agree Want to stop offending (SPCR) Disagree Want to stop offending (SPCR) Agree Want to get help to stop offending (SPCR) Disagree Want to get help to stop offending (SPCR) General attitude to offending CRIME-PICS (SPCR) Anticipation of reoffending CRIME-PICS (SPCR) Victim hurt denial CRIME-PICS (SPCR) Evaluation of crime as worthwhile CRIME-PICS (SPCR) Used class A drugs in the four weeks before custody (SPCR) Used class BC drugs in the four weeks before custody (SPCR) Injected illegal drugs in the four weeks before custody (SPCR) Transient accommodation prior to custody (SPCR) Sleeping rough prior to custody (SPCR) Educational (qualifications) attainment (SPCR) Was in paid work in the four weeks before custody (SPCR)
Note Data source is listed in parentheses
16
A range of dynamic risk factors found to be incrementally predictive of general reconviction in addition to static risk factors (Howard 2009) have also been included These factors are motivation to stop offending attitudes to offending drug use accommodation educational attainment and employment status before custody
Many of the factors are categorical and so have been converted to indicator variables (also known as lsquodummy variablesrsquo) For instance ethnicity has been split into five separate yesno variables ndash one for each individual ethnic background The full set of variables is listed in Box 21
Matching algorithm
A variety of propensity score matching methods are available to adjust for pre-treatment observable differences between the treatment group and untreated groups each best suited to particular types of data The algorithm developed to match the control group for this evaluation and the motivation underlying its choice are briefly explained here The propensity score matching analysis was undertaken in the Stata statistical software programme using the psmatch2 module (Leuven and Sianesi 2003)
First a logistic regression was used to predict the probability of treatment (the propensity score) for all treated and untreated prisoners based on their observed characteristics The resultant propensity scores summarise each prisonerrsquos characteristics on all matching variables in one measure that is used as the basis for matching
Since the sample consists of comparatively few treated prisoners in relation to many untreated ones radius matching (Dehejia and Wahba 2002) was chosen as the matching algorithm This technique uses the maximum amount of data whilst the imposition of a tolerance threshold avoids the risk of bad matches All untreated prisoners whose propensity score falls within a defined range of tolerance (radius calliper) of a treated prisonerrsquos score are matched to that prisoner A radius calliper of 005 of a standard deviation of the logit of the propensity score has been used46 The benefit of radius matching is lower propensity score variances than would result from one-to-one nearest-neighbour matching As a further step to ensure comparability prisoners with propensity scores outside the range of values where both treated and untreated observations are found were dropped a requirement of the technique47
46 The appropriate calliper size is not clearly prescribed by the empirical literature (Smith and Todd 2005) The inventors of propensity score matching Rosenbaum and Rubin (1983) recommend a calliper of a quarter of a standard deviation of the logit of the propensity score as appropriate in general This would be equivalent to 0236 in this case which was tried and rejected due to returning a weak match quality The radius calliper size was iteratively reduced until the point (005) that a further reduction would drop treated observations Sensitivity analysis was carried out on radius calliper size (00001 to 025) which found that the results were not highly sensitive to calliper size
47 Technically this is referred to as imposing common support
17
With a choice-based sample such as this participants are likely to be over-sampled relative to their frequency in the eligible prisoner population (Caliendo and Kopeinig 2005) To control for this over-sampling matching was undertaken on the odds-ratio of the propensity scores (Heckman and Smith 1995)48
The outcome of this methodology was that each ETS participant was matched with a synthetic control observation composed of the average of all non-participants sufficiently similar (propensity score within the radius limit) to the participant
Parsimonious PSM model
Due to the limited size of the sample there was a focus on parsimony (simplification without any loss of power) in development of the model Dropping insignificant variables from the logistic regression gains degrees of freedom (fewer parameters to be estimated) and observations (due to missing values on some variables) without losing explanatory power The final model was reduced to a smaller set of 16 variables listed in Box 2249 To check that this process did not introduce a bias the correlation of the propensity scores of the reduced model and the full model was checked and found to be greater than 091
Box 22 Parsimonious Propensity Score Matching model matching variables
Programme suitability criteria Need Sum of OASys Section 11 Thinking and Behaviour scores (OASys) Risk OASys total weighted score (OASys) Motivation to change behaviour (OASys) Problems with readingwritingnumeracy (OASys) Problems with current psychiatric problems (OASys)
Static risk factors Gender (SPCR) Age (SPCR) Index offence type Violent (PNC) Index offence type Sexual (PNC) Index offence type Acquisitive (PNC) Index offence type Drug (PNC) Index offence type Robbery (PNC)
Dynamic risk factors Agree Want to get help to stop offending (SPCR) Victim hurt denial CRIME-PICS (SPCR) Used class BC drugs in the four weeks before custody (SPCR) Sleeping rough prior to custody (SPCR)
Note Data source is listed in parentheses
48 Caliendo and Kopeinig (2005) note that weights are required to consistently estimate the probability of treatment when sampling is choice based However as an odds-ratio estimated using incorrect weights will be a scalar multiple of the true odds-ratio (a monotonic transformation of the propensity score) matching may proceed on the odds-ratio even when sampling weights are unknown (Heckman and Smith 1995)
49 The full model (including all 42 pre-selected variables) was run successively with the least significant variable dropped each time using the stepwise function with a confidence limit for retention equal to 01
18
Assessment of control match quality
The robustness of the calculated treatment effect depends on the quality of the match achieved The degree of lsquosimilarityrsquo between the treatment and the control group was tested using a range of statistical techniques (namely standardised bias reduction and t-tests of equality of means) Please refer to the Technical Annex for the detailed results of these tests
In summary equality of means testing confirmed no statistically significant difference between the treatment and matched control group across all 42 characteristics pre-selected as being predictive of ETS participation and reconviction risk The control group is therefore well matched on the pre-selected matching characteristics with a similar expected reconviction rate as the treatment group allowing robust estimation of the treatment effect
Whilst every effort has been made to remove the selection bias it is possible that an unmeasured bias may still remain uncontrolled Further checks on average sentence length and participation on other accredited OBP interventions (using the Offending Behaviour Programme Interventions Database) were carried out which revealed some differences between the treatment and control groups It was found that the average sentence length of the treatment group (975 days) was longer than that for the control group (727 days) It was also found that 6 of the treatment group and 2 of the control group had been on another accredited OBP during the SPCR sentence though both proportions are small
19
3 Results
The results of this evaluation show that ETS was effective in bringing about a statistically significant reduction in both the reconviction rate and frequency of reoffending in the year following release from custody for 257 prison-based participants on ETS between 2006 and 2008 Almost identical results were found for completers (when drop-outs were excluded) though the significance of the reduction in the one-year reconviction rate was lost due the reduction in the size of the sample
A secondary finding of the research was a low adherence to the suitability targeting criteria among those prisoners that actually received the programme over the period This suggests that the programme was not always administered to the most suitable group of prisoners which may have limited the effectiveness of the programme in reducing reoffending
The research findings are presented and summarised in this section The conclusions and policy-relevant implications of the results are discussed in the Implications section More detail on the results is contained in the Technical Annex
Effectiveness of ETS in reducing reoffendingThe impact of the programme is identified as the average causal effect of participation on the ETS programme (the treatment) on reconviction outcomes As the control group was created using a methodologically robust propensity score matching model and established as valid by tests on the quality of the match it represents a good proxy for the counterfactual untreated outcome of the treatment group50 The observed difference in the average conviction rates between the treatment and control groups may therefore be considered the causal effect of the ETS intervention known as the average treatment effect on the treated (ATT)
All programme participants
The reconviction rate and the frequency of reoffending of all ETS participants (including non-completers) was found to be significantly lower than the matched control group in the year following release from custody No statistically significant impact was found on the severe offence reconviction rate
The average reconviction outcomes of the treated and untreated groups and the difference between them (ATT with t-stat) are presented in Table 31 The results show that the proportion of programme participants that were reconvicted within one year (272) was six percentage points below that observed in the control group (335) and that this difference was statistically significant A statistically significant difference was also found in terms of frequency of reoffending as participants (607 offences) were reconvicted of 60 fewer recordable offences within one year per 100 released prisoners than the control group (1208 offences)
50 Testing revealed no statistical difference in the mean values of the two groups across all 42 variables pre-selected as being predictive of ETS participation and reconviction risk
20
These are the noteworthy results of this analysis as they show that ETS was successful in significantly reducing both the reconviction rate and frequency of reoffending of participants After contradictory evidence and debate the results seem to support Friendship et alsrsquo (2002) positive results though the magnitude of the effect is smaller Whilst the severe offences reconviction rate was lower in the treatment group the difference was not significant This is not surprising given the programme is not designed to target severe offending and the rarity of severe offences
Table 31 Impact of ETS on reconviction outcomes of the SPCR sample
SampleReconviction rate
(one-year)
Reoffences per 100 released prisoners
(one-year)
Severe offences reconviction rate
(one-year)Average outcomes
Treatment group (n=257) 272 607 08Matched control group 335 1208 09
Treatment effect (ATT) -62a -601b -01(t-stat) -204 -547 -013Note Average treatment effect on the treated (ATT) is the difference between the mean outcome of the
treatment group and the matched control groupa Statistically significant at the 005 levelb Statistically significant at the lt0001 level
Completers only
The evaluation has followed the lsquointention-to-treatrsquo approach in general (consistent with Colledge et al 1999) However not all participants completed the programme ndash 8 of the treated final sample did not complete the course As in previous evaluations non-completers have been removed from the analysis to test any sensitivity of the treatment effect to programme completion
21
The results are summarised in Table 32 showing an almost identical though not statistically significant reduction in the rate of reconviction for completers when drop-outs were excluded The loss in significance was most likely due to the reduction in the size of the sample The statistically significant reduction in the frequency of reoffending was retained with an almost identical effect size No significant impact was again found for the severe offences reconviction rate
Table 32 Impact of ETS on reconviction outcomes of the SPCR sample completers only
SampleReconviction rate (one-
year)
Reoffences per 100 released prisoners
(one-year)
Severe offences reconviction rate
(one-year)Average outcomesTreatment group (n=237) 270 599 08Matched control group 335 1208 09Treatment effect (ATT) -65 -609a 00(t-stat) -156 -321 -001Note Average treatment effect on the treated (ATT) is the difference between the mean outcome of the
treatment group and the matched control groupa Statistically significant at the 001 level
Completers of intervention programmes are often found to have a stronger effect than non-completers This may be due to a self-selection effect whereby completers may be more motivated or have fewer needs or have a lower risk of reoffending Therefore effectiveness of the programme should not be evaluated against completers alone whose outcomes may have been better even without the intervention Rather the true effect of the intervention as it is used in practice should be evaluated by considering all participants both completers and non-completers (Colledge et al 1999 National Offender Management Service 2005) Accordingly more weight should be placed on the findings for all participants
Assessment of suitability targeting
The HM Prison Service guidance to assess suitability for ETS and other OBPs notes
ldquoOne of the principles of effective interventions is appropriate targeting An offender is more likely to benefit from participation in an offending behaviour programme if heshe demonstrates levels of risk and need that are appropriate for the particular interventionrdquo51
To facilitate appropriate targeting HM Prison Service designed a set of risk need and responsivity suitability criteria to identify those prisoners that were most suitable for the programme These criteria were set out in the Context section Strict adherence to these criteria should ensure that ETS is appropriate and relevant for all participants
51 HM Prison Service (2007) p3
Figure 31 Need and risk score distributions for non-participant and ETS participant groups with suitability thresholds
Need Sum of OASys Section 11 Thinking and Behaviour scores (OASys)
Risk OASys total weighted score (OASys)
0
5
10
15
4 7 140
5
10
15
4 7 140 0
Per
cen
t
Per
cen
t
0
5
10
15
50 100 1500
Per
cen
t
0
5
10
15
50 100 1500
Per
cen
t
Non-participant
Non-participant
ETS participant
ETS participant
22
Need and risk requirements
The need and risk52 profiles of the participant and non-participant groups53 were compared The comparison is presented graphically in Figure 31 with needrisk ETS programme suitability thresholds marked with vertical red lines (observations to the right of the line rate as lsquosuitablersquo for ETS) In the case of need the dual thresholds of 7 or 4 (with at least one individual score of 2 indicating significant problems) are marked A single vertical red line for 56 and above is marked as the risk threshold
With regard to both need and risk the participant and non-participant distributions follow a broadly similar pattern The majority of the non-participant group had a needrisk profile that would have made them suitable for ETS This is good news for matching purposes as it means that similar prisoners at the pre-treatment stage could have been treated or remained untreated More importantly a lot of prisoners in the participant group fall to the left of the red vertical line in both charts ndash and so rated as lsquonot strictly suitablersquo for ETS
52 As the OASys data do not include OGRS2 it has only been possible to define suitability with respect to the OASys total weighted score This is not necessarily invalid as the guidance notes ldquoIf an offender passes the cut-off on one but not both scales [ie OGRS2 and OASys total weighted score] you can consider them to be suitable to progress to the needs assessment stagerdquo HM Prison Service (2007) p5
53 This analysis is based on the full sample of 3512 (316 participants and 3196 non-participants) and not the treatment and matched control groups
23
Further investigation of the need and risk (OASys total weighted score) scores revealed that only 58 of the participant group were suitable for ETS (met both need and risk requirements simultaneously) while 49 of the non-participant group would have been suitable (Table 33)
Table 33 ETS suitability criteria fulfilment non-participant and ETS participant groups
SuitabilityNon-participants ETS participants
N N Not strictly suitable for ETS 1629 510 134 424Strictly suitable for ETS 1567 490 182 576Total 3196 1000 316 1000NoteSuitability is defined with reference to risk (an OASys score 56 or above) and need (a total score of 7
or above and a total score of 4 or above with at least one individual score of 2 (indicating significant problems))
It is important to note some caveats to this analysis The suitability criteria for ETS have been reviewed and changed over time The ETS start dates of participants in the SPCR sample stretch from March 2006 to September 2008 whilst the specification of the risk tool as OGRS2 or OASys was only introduced in August 2007 (the Sentencing Planning Risk Predictor was used previously) Similarly this period covers a time when both a local semi-structured interview and the OASys assessment were sources of need information for programme staff As the programme did not itself change substantially during this period later indicators of suitability for the intervention are retrospectively relevant from a targeting perspective54 though the retrospective application of the later indicators provides no reflection of the accuracy in the application of the targeting criteria during the earlier period
There is also some flexibility allowed in the application of the suitability criteria individuals with an OASys or OGRS2 score within three points below the cut-off may be progressed to ETS and special considerations are made for indeterminate sentence prisoners and sex offenders The original indicator of criminogenic needs the ETS Semi-Structured Interview has gradually been replaced by OASys Section 11 scores as confirmed in later guidance (National Offender Management Service 2009)55
54 Assuming that amendments to the suitability identification tools over time represent improvements in targeting later indicators applied retrospectively are likely to provide a better indicator of suitability than older indicators Accordingly this analysis provides no reflection on the selection process of treatment managers at the time but rather a pure view of suitability of treated participants
55 later guidance also specified definition of risk groups suitable for ETS with reference to OGRS3 (score 50 or above)
24
Readiness and responsivity criteria
A similar comparative analysis was also carried out for the readiness and responsivity criteria The HM Prison Service (2007) guidance lists assessment items in the lsquoResponsivity Assessmentrsquo and lsquoReadiness Assessmentrsquo sections including intellectual ability literacy dyslexia mental and physical health psychopathic traits motivation to change behaviour disability However the guidance does not specify the data variables or the thresholds to be used To investigate these readiness and responsivity criteria the lsquoexclusion criteriarsquo for general offending programmes from the OASys Manual56 were used
Again the profiles of the participant and non-participant groups57 were compared with a similar pattern emerging Figure 32 plots the distributions side-by-side with the readiness and responsivity thresholds marked by red vertical lines (this time profiles to the right of the line are not strictly suited to ETS) As with the need and risk profiles the two distributions are unexpectedly similar with a number of the participant group recorded as lsquonot at allrsquo motivated or having lsquosignificant problemsrsquo More specifically of the participant group
109 were scored as lsquonot at allrsquo motivated to change their behaviour
74 had lsquosignificant problemsrsquo with readingwritingnumeracy
61 had lsquosignificant problemsrsquo with learning difficulties
103 had lsquosignificant problemsrsquo with current psychological problemsdepression and
58 had lsquosignificant problemsrsquo with current psychiatric problems
56 OASys development team (2001) p16757 This analysis is based on the full sample of 3512 (316 participants and 3196 non-participants) and not the
treatment and matched control groups
Figure 32 Readiness and responsivity score distributions for non-participant and ETS participant groups with suitability thresholds
0
20
40
60
Verymotivated
Quitemotivated
Not at all0
20
40
60
Verymotivated
Quitemotivated
Not at all
Per c
ent
Per c
ent
Non-participant ETS participant
Motivation (OASys)
0
50
100
No problems Someproblems
Significantproblems
Per c
ent
Non-participant
Problems with readingwritingnumeracy (OASys)
0No problems Some
problemsSignificantproblems
Per c
ent
ETS participant
020
6080
No problems Someproblems
Significantproblems
Per c
ent
Non-participant
Problems with learning difficulties (OASys)
0No problems Some
problemsSignificantproblems
Per c
ent
ETS participant
0
20
40
60
No problems Someproblems
Significantproblems
Per c
ent
Non-participant
Problems with current psychological probelmsdepression (OASys)
0
20
40
60
No problems Someproblems
Significantproblems
Per c
ent
ETS participant
4020
6080
40
50
100
0
50
100
No problems Someproblems
Significantproblems
Per c
ent
Non-participant
Problems with current psychological probelms (OASys)
0
50
100
No problems Someproblems
Significantproblems
Per c
ent
ETS participant
25
26
Analysis of treatment effect by suitability
To investigate the importance of adherence to the need and risk principles in participant targeting the reconviction outcomes of the treatment group were also analysed according to participant suitability As before suitability is defined with reference to risk (an OASys score 56 or above) and need (a total score of 7 or above and a total score of 4 or above with at least one individual score of 2 (indicating significant problems)) As there is some flexibility in the application of the criteria this is termed lsquostrict suitabilityrsquo
Of the treatment group 164 (64) were strictly suitable for ETS whereas 1404 (56) of the control group were strictly suitable The remainder of each group were not strictly suitable
The results of the analysis (Table 34) show that the one-year reconviction rate for strictly suitable treated offenders (172) was lower than that for not strictly suitable ones (329) Similarly the frequency of reoffending of strictly suitable offenders (398 reoffences) was also lower than that of the not strictly suitable offenders (726 reoffences)
Table 34 Impact of ETS on reconviction outcomes of the SPCR sample lsquonot strictly suitablersquo and lsquostrictly suitablersquo participants only
SampleReconviction rate
(one-year)
Reoffences per 100 released prisoners
(one-year)
Severe offences reconviction rate
(one-year)Not strictly suitable (n=93) 329 726 12Strictly suitable (n=164) 172 398 -
Caveats and limitations of the researchIt is important to note that the number of ETS-treated prisoners provided by SPCR (257) is a limited sample falling in the lower range of previous evaluation samples (from 114 to 2195 participants) as a result of a low intervention rate and missing data filters Results based on limited samples may not be reliable indicators of the wider population and in some cases the sample sizes may be too small to detect differences which may actually exist58 Tests of statistical significance are carried out on the results of this evaluation for this reason The low intervention rate means that there is a large pool (2514) from which to form a well-balanced matched control group It should also be noted that all SPCR data are self-reported
Whilst every effort has been made to remove the selection bias it is possible that an unmeasured bias may still remain uncontrolled Further checks revealed some differences between the treatment and control groups It was found that the average sentence length of the treatment group (975 days) was longer than that for the control group (727 days)
58 This caveat is more relevant where no effect is detected ndash in which case the correct conclusion may be that the sample was insufficient to detect an effect rather than that the intervention had no effect For a discussion of sample size detection power and reliability of reconviction rates please see Harper and Chitty (2004) p8
27
The possibility of multiple intervention participation has not been controlled for as the sample size did not permit such analysis Examination revealed that 6 of the treatment group and 2 of the control group had been on another accredited OBP during the SPCR sentence though both proportions are small It is also possible that prisoners may have participated on non-accredited OBPs or a substance misuse treatment during their SPCR sentence period which may have contributed to the observed treatment effect If the rate of participation in other programmes was higher in the ETS treated group the estimated treatment effect of ETS would represent a pooled effect of all treatments received and so may be overstated If the rate of participation in other programmes was higher in the ETS control group the estimated treatment effect of ETS may be understated
This evaluation has been limited to using one-year conviction rates as two-year reconviction outcome data will only become available in 12 monthsrsquo time Thus it is not possible at this time to conclude on the duration of the impact of ETS ndash that is to say whether the observed one-year effect endures two years on from release or whether it dissipates (as found by Cann et al 2003) It is planned to conduct a follow-up study of reconviction at the two-year post-release stage (please see the Further research section)
28
4 Implications
This report has evaluated the effectiveness of the prison-based ETS programme by linking participation to reconviction outcomes The evaluation results show that ETS was successful in significantly reducing both the reconviction rate and frequency of general reoffending of participants The most important implications of these results are outlined below
This research has added some clarity to the discordant evidence base on the effectiveness of ETS by improving on key methodological limitations of previous evaluation studies This provides a more solid evidence base of support on which to build intervention-based policy
The most important message for policy makers is that ETS the most frequently delivered offending behaviour programme over the past decade did work to significantly reduce reoffending in the short term (one year) at least This result should assist policy makers to prioritise and focus operational resources towards the most productive intervention efforts Though ETS has since been replaced by the Thinking Skills Programme (TSP) the results of this evaluation demonstrate that cognitive-behavioural OBPs can work to significantly reduce reoffending for offenders released from prison The findings are likely to be particularly relevant for TSP which represents a refresh and update of ETS in line with advances in theory and practice However these specific findings cannot be generalised to other cognitive-behavioural intervention programmes Each programme has its own distinct objectives delivery methods and targeted characteristics and so would require a discrete evaluation
For practitioners although the findings on reduced reconviction rates are encouraging and reflect a job well done there are also lessons to be learned A low adherence to the risk need and responsivity suitability criteria was found among those prisoners that actually received the programme between 2006 and 2008 This suggests that the programme was not always administered to the most suitable prisoners Given that research supports the importance of risk need and responsivity targeting for effective treatment (Hollin 1995 Taxman and Thanner 2006 Palmer et al 2009 Gendreau et al 2009 Andrews and Bonta 2010) and the finding of lower reconviction rates for strictly suitable prisoners this may have limited the effectiveness of the programme in reducing reoffending The fact that a significant reduction in reconviction was found in spite of this finding suggests that a stricter application of the targeting criteria might further enhance the effectiveness of the programme National Offender Management Service practitioners report that the accuracy of targeting has improved over time meaning that a similar evaluation of ETS in a later period (post-2008) or TSP might find an even more significant effect
29
Future researchers may be able to draw on the methodology developed for this research as a methodological blueprint for further evaluations The findings of this research could be complemented and enhanced by addressing some of the outstanding evidence gaps framed by a set of research questions and proposed research designs set out in the Further research section
30
5 Further research
Whilst this evaluation has added some clarity to the evidence base on the effectiveness of general cognitive-behavioural programmes evidence gaps remain These gaps are defined by the research questions listed below with suggested research designs that could provide robust answers to complement and enhance the findings in this paper
Duration of the reduction in reoffending effect Does ETS have a lasting impact or will the observed one-year effect have dissipated after two years as found by Cann et al (2003) It is planned to conduct a follow up study of the treated and matched control individuals of this evaluation two years after their release applying the same methodology to investigate the duration of the ETS impact in one yearrsquos time
Cost-effectiveness of the programme Is the cost of ETS provision justified by the observed reduction in reoffending The reduction in reoffences estimated in this evaluation could be used as the basis for a cost-benefit analysis of the ETS programme Linking the estimated reduction in reoffending to estimates of the social cost of criminal offences the avoided social costs of crime (the benefit) could be compared to data on the cost of ETS provision (estimated to be in the region of pound2000 per prisoner)59
Generalisability of the findings Would the observed effect be verified or even more significant in a larger sample By repeating the evaluation methodology but replacing SPCR variables with OASys data variables where possible the full population of prisoners undertaking ETS could be evaluated The downside to this approach is the compromised choice of data for dynamic risk factors Other benefits would be the ability to employ more matching variables and being able to evaluate some of the smaller accredited programmes This research could also be used as a methodological blueprint to evaluate substance misuse intervention programmes
What works for whom What are the characteristics of the prisoners that benefit most from ETS and other OBPs The difference in reconviction outcome for each treated prisoner compared with the matched control could be regressed on a range of treated prisonersrsquo characteristics to identify which kinds of offenders under which circumstances most benefit from undertaking ETS
The effectiveness of TSP Does ETSrsquos replacement the Thinking Skills Programme (TSP) have a lesser similar or greater impact on reconviction A similar evaluation methodology could be used to evaluate the effectiveness of TSP in reducing reconviction outcomes though this would not be possible for a couple of years as TSP was only introduced in 2009
59 Social Exclusion Unit (2002) p 81
31
Database of research findings What does the evidence base tell us about the effectiveness of ETS Policy makers are often influenced by the latest study to be published rather than the synthesised message of the collective body of evaluation research The formation and maintenance of a database of outcome studies could be used for systematic reviews and meta-analytic analysis to produce a comprehensive review of ETS efficacy to inform and guide policy makers and practitioners (for example see Tong and Farrington 2006)
In the longer term samples of the other cohort studies being conducted by MoJ ndash the probation sample of the Offender Management Community Cohort Study (OMCCS) and the juvenile offenders sample of the Juvenile Cohort Study (JCS) ndash could be similarly linked to the same management information databases (for example OASys) as linked to SPCR in this evaluation When combined with OASys assessment data and viewed as a collective database this would be the richest known single evidence base in existence on the static and dynamic factors involved in offending behaviour
32
6 Additional resources
Readers interested in researching further the issues and topics probed in this paper further may want to consult the following publications websites and other useful sources of information
HM Prison Service Offender Behaviour Programmes (OBPs) httpwwwhmprisonservicegovukadviceandsupportbeforeafterreleaseoffenderbehaviourprogrammes
Ministry of Justice Research httpwwwjusticegovukpublications
National Offender Management Service httpwwwjusticegovukaboutnomshtm
Correctional Services Accreditation Panel httpwwwjusticegovukaboutcorrectional-services-accreditationhtm
National Reducing Reoffending Delivery plan (National Offender Management Service (NOMS) website) httpnomsjusticegovuk
Social Exclusion Unit (Cabinet Office) httpwwwcabinetofficegovuksocial_exclusion_task_forceaspx
Office for National Statistics (ONS) httpwwwstatisticsgovuk
33
7 References
Andrews D A and Bonta J (2010) The psychology of criminal conduct (5th ed) New Providence NJ LexisNexis Matthew Bender
Blackburn R (1972) lsquoDimensions of hostility and aggression in abnormal offendersrsquo Journal
of Consulting and Clinical Psychology 38 pp 20ndash26
Caliendo M and Kopeinig S (2005) lsquoSome Practical Guidance for the Implementation of Propensity Score Matchingrsquo IZA Discussion Papers Series Discussion Paper No 1588 Institute for the Study of Labor (IZA)
Cann J Falshaw L Nugent F and Friendship C (2003) Understanding What Works
cognitive accredited skills programmes for adult men and young offenders Research Findings 226 London Home Office
Cann J (2006) Cognitive skills programmes impact on reducing reconviction among a
sample of female prisoners Home Office Research Study 276 London Home Office
Clarke A Simmonds R and Wydall S (2004) Delivering cognitive skills programmes in
prison a qualitative study Home Office Research Study 242 London Home Office
Clarke D A (2000) Theory Manual for Enhanced Thinking Skills Prepared for the Joint Prison Accreditation Panel London Home Office
Colledge M Collier P and Brand S (1999) Crime reduction programme and constructive
regimes in prison Programmes for offenders Guidance for evaluators Crime reduction programme ndash guidance note 2 Research Development and Statistics Directorate London Home Office
Copas J and Marshall P (1998) lsquoThe offender group reoffending scale A statistical reoffending score for use by probation officersrsquo Applied Statistics 47(1) 159ndash171
Dehejia RH and Wahba S (2002) lsquoPropensity Score-Matching Methods for Nonexperimental Causal Studiesrsquo Review of Economics and Statistics February 2002 Vol 84 No 1 pp 151ndash161
Eysenck S B and McGurk B J (1980) lsquoImpulsiveness and venturesomeness in a detention centre populationrsquo Psychological Reports 47 pp 1299ndash1306
34
Falshaw L Friendship C Travers R and Nugent F (2003) Searching for what works An
evaluation of cognitive skills programmes Home Office Research Study 206 London Home Office
Falshaw L Friendship C Blud L Travers R and Nugent F (2004) lsquoSearching for what works HM Prison Service accredited cognitive skills coursesrsquo British Journal of Forensic
Practice 6 (2) pp 3ndash13
Friendship C Blud L Erikson M and Travers R (2002) An evaluation of cognitive
behavioural treatment for prisoners Home Office Research Study 161 London Home Office
Frude N Honess T and Maguire M (1994) CRIME-PICS II Manual Cardiff Michael and Associates
Gendreau P Smith P and Theacuteriault YL (2009) lsquoChaos theory and correctional treatment Common sense correctional quackery and the law of fartcatchersrsquo Journal of Contemporary
Criminal Justice 25 384ndash396
Harper G and Chitty C (eds) (2004) The impact of corrections on re-offending A review of
lsquoWhat Worksrsquo (3rd ed) Home Office Research Study No 291 London Home Office
Heckman J and Smith J (1995) rsquoAssessing the Case for Social Experimentsrsquo Journal of
Economic Perspectives 9 85ndash110
HM Prison Service (2007) Assessing Suitability for Offending Behaviour Programmes Risk
Need amp Responsivity Guidance for Treatment Managers Offending Behaviour Programmes Unit HM Prison Service
Home Office (2006) A Five Year Strategy for Protecting the Public and Reducing Re-
offending London The Stationary Office
Hollin C R (1995) lsquoThe meaning and implications of ldquoprogramme integrityrdquorsquo In J McGuire (Ed) What works Reducing reoffending Guidelines from Research and Practice (pp 195ndash208) Chichester England John Wiley and Sons
Howard P (2009) Improving prediction of re-offending using the Offender Assessment
System Research Summary 209 London Ministry of Justice Available at httpwwwjusticegovukpublicationsdocsoasys-research-summary-02-09pdf
Howard P Francis B Soothill K and Humphreys L (2009) OGRS 3 the revised Offender
Group Reconviction Scale Research Summary 709 London Ministry of Justice
35
Leuven E and Sianesi B (2003) psmatch2 Stata module to perform full Mahalanobis and
propensity score matching common support graphing and covariate imbalance testing httpideasrepecorgcbocbocodes432001html version 315 2 May 2009
Mak A S (1991) lsquoPsychosocial control characteristics of delinquents and nondelinquentsrsquo Criminal Justice and Behaviour 18 (3) pp 297ndash303
McDougall C Clarbour J Perry A and Bowles R (2009) Evaluation of HM Prison Service
Enhanced Thinking Skills Programme Report on the implementation of a randomised
controlled trial London Ministry of Justice
McDougall C Clarbour J Perry A and Bowles R (2009) Evaluation of HM Prison Service
Enhanced Thinking Skills Programme Report on the outcomes of a randomised controlled
trial London Ministry of Justice
Ministry of Justice (2009) The Correctional Services Accreditation Panel Report 2008-
2009 Available at httpwwwjusticegovukpublicationsdocscorrectional-services-report-20080-09pdf
Ministry of Justice (2010) Reoffending of adults results from the 2008 cohort ndash England and
Wales Ministry of Justice Statistics bulletin London Ministry of Justice Available at httpwwwjusticegovukpublicationsdocsreoffending-adults-2008-cohortpdf
National Offender Management Service (2005) Understanding research methods and
findings lsquoWhat Worksrsquo Briefing 305 Available at httprdshomeofficegovukrdspdfs05wwbn3pdf
National Offender Management Service (2009) Suitability for Accredited Interventions Risk
Need amp Responsivity Targeting Criteria for Offender Managers and Treatment Managers
Interventions and Substance Misuse Group Directorate of Commissioning and Operational Policy National Offender Management Service May 2009
OASys Data Evaluation and Analysis Team O-DEAT (2010) OASys caveats notes and
limitations ndash layered OASys (May 10)
OASys development team (2001) Offender Assessment System OASys User Manual OASys Manual V2 Crown Copyright 2002
Palmer EJ McGuire J Hatcher RM Hounsome JC Bilby CAL and Hollin CR (2009) lsquoAllocation to offending behavior programs in the English and Welsh probation servicersquo Criminal Justice and Behavior 36 909ndash922
36
Rosenbaum P R and Rubin D B (1983) lsquoThe Central Role of the Propensity Score in Observational Studies for Causal Effectsrsquo Biometrika 70 41ndash55
Smith J and Todd P (2005) rsquoDoes matching overcome LaLondersquos critique of nonexperimental estimatorsrsquo Journal of Econometrics Elsevier vol 125(1-2) pages 305ndash353
Social Exclusion Unit (2002) Reducing re-offending by ex-prisoners Available from httpwwwcabinetofficegovukmediacabinetofficesocial_exclusion_task_forceassetspublications_1997_to_2006reducing_reportpdf
Stewart D (2008) The problems and needs of newly sentenced prisoners results from a
national survey Ministry of Justice Research Series 1608 Published online at httpwwwjusticegovukpublicationsresearch2008htm
Taxman FS and Thanner M (2006) lsquoRisk need and responsivity (RNR) It all dependsrsquo Crime and Delinquency 52 28ndash51
Tong LSJ and Farrington DP (2006) lsquoHow effective is the ldquoReasoning and Rehabilitationrdquo programme in reducing reoffending A meta-analysis of evaluations in four countriesrsquo Psychology Crime and Law 12 3ndash24
37
Appendix 1 Technical annex
Full set of matching variables (covariates)Programme suitability criteriaoasys_need Need Sum of OASys Section 11 Thinking and Behaviour scores
(OASys)oasys_score Risk OASys total weighted score (OASys)oasys_motiv Motivation to change behaviour (OASys)oasys_litnum Problems with readingwritingnumeracy (OASys)oasys_lrndiff Problems with learning difficulties (OASys)oasys_psychgl Problems with current psychological problemsdepression (OASys)oasys_psychtr Problems with current psychiatric problems (OASys)
Static risk factorsspcr_genderf Gender Female (SPCR)spcr_age Age (SPCR)spcr_marst_mar Marital status Married (SPCR)spcr_marst_lvp Marital status Living with a partner (SPCR)spcr_ethnic_mix Ethnicity Any Mixed background (SPCR)spcr_ethnic_as Ethnicity Any Asian background (SPCR)spcr_ethnic_bl Ethnicity Any Black background (SPCR)spcr_ethnic_oth Ethnicity Any Other background (SPCR)pnc_copas Copas rate on release (PNC)pnc_ttlprevconv Previous convictions (PNC)pnc_ttlprevconv2 Previous convictions squared (PNC)pnc_ttlprevconvsev Previous severe convictions (PNC)pnc_ttlprevconvsev2 Previous severe convictions squared (PNC)pnc_index_vio Index offence type Violent (PNC)pnc_index_sxl Index offence type Sexual (PNC)pnc_index_acq Index offence type Acquisitive (PNC)pnc_index_drg Index offence type Drug (PNC)pnc_index_rob Index offence type Robbery (PNC)spcr_famconv Family member has been convicted of a non-motoring offence
(SPCR)spcr_fampris Family member has been in prison (SPCR)
Dynamic risk factorsspcr_motivstoffy Agree Want to stop offending (SPCR)spcr_motivstoffn Disagree Want to stop offending (SPCR)spcr_motivhlpstoffy Agree Want to get help to stop offending (SPCR)spcr_motivhlpstoffn Disagree Want to get help to stop offending (SPCR)spcr_attg General attitude to offending CRIME-PICS (SPCR)spcr_atta Anticipation of reoffending CRIME-PICS (SPCR)spcr_attv Victim hurt denial CRIME-PICS (SPCR)spcr_atte Evaluation of crime as worthwhile CRIME-PICS (SPCR)spcr_drug4wka Used class A drugs in the four weeks before custody (SPCR)spcr_drug4wkbc Used class BC drugs in the four weeks before custody (SPCR)spcr_drug4wkinj Injected illegal drugs in the four weeks before custody (SPCR)spcr_accomtrans Transient accommodation prior to custody (SPCR)spcr_accomrough Sleeping rough prior to custody (SPCR)spcr_edqual Educational (qualifications) attainment (SPCR)spcr_job4wk Was in paid work in the four weeks before custody (SPCR)
38
Logistic regression model
Table A1 Logistic regression model of prisoner characteristics influencing probability of treatment (ETS) and reconviction outcomes
Coefficient Standard error P-valueETS suitabilityNeed (thinking and behaviour) 0082 0027 0002Risk (OASys score) 0005 0003 0069Motivation to change behaviour (OASys) 0323 0122 0008Problems with readingwritingnumeracy -0303 0116 0009Problems with current psychiatric problems 0335 0131 0011
GenderMale Reference
categoryFemale 0736 0177 0000
Age -0030 0009 0000
Index offence typeOther Reference
categoryViolent 1223 0296 0000Sexual 2094 0389 0000Acquisitive 0243 0313 0438Drug 1192 0309 0000Robbery 1552 0329 0000
Motivation to stop offendingDisagreed with ldquoI want to get help to stop offendingrdquo all other responses
Reference category
Agreed with ldquoI want to get help to stop offendingrdquo
0315 0091 0001
Offending-related attitudesVictim hurt denial 0078 0026 0003
Drug useUsed Class BC drugs in the 4 weeks before custody
-0195 0150 0193
AccommodationStable accommodation prior to custody Reference
categoryTemporary accommodation prior to custody Reference
categorySleeping rough prior to custody -0709 0409 0083
Constant -4933 0554 0000Notes Number of observations = 2771 (257 treated 2514 untreated) Pseudo R2 = 00958 LR
chi2(16)=16397 probgtchi2 00000
39
Calculation of the average treatment effect on the treated (ATT)
Outcome measures
pnc_reconvind Indicator of reconviction within one yearpnc_reofffreq Frequency of proven reoffending within one yearpnc_reconvindsev Indicator of severe offence reconviction within one year
Table A2 Average treatment effect on the treated (ATT)
Variable Sample Treated Controls(Difference)
ATTa
Standard error t-stat
pnc_reconvind Unmatched 0272 0370 (-0098) 0031 -311Matched ATT 0272 0335 -0062 0031 -204
pnc_reofffreq Unmatched 0607 1422 (-0815) 0182 -447Matched ATT 0607 1208 -0601 0110 -547
pnc_reconvindsev Unmatched 0008 0007 (0001) 0006 011Matched ATT 0008 0009 -0001 0006 -013
a ATT is the difference between the mean outcome of the treatment group and the matched control group
40
Tests of covariate balancing
Table A3 Means standardised bias reduction and t-tests for equality of means in the treatment and control groups before and after matching
Variable SampleMean
bias bias
reductiont-test
Treatment Control t pgttoasys_need Unmatched 7381 6703 203 299 000
Matched 7381 7269 34 834 039 070oasys_score Unmatched 77335 75658 48 070 049
Matched 77335 77060 08 836 009 093oasys_motiv Unmatched 1210 1141 110 165 010
Matched 1210 1201 15 864 017 087oasys_litnum Unmatched 0350 0416 -102 -150 013
Matched 0350 0361 -17 830 -020 084oasys_lrndiff Unmatched 0187 0184 05 008 094
Matched 0187 0180 13 -1510 014 089oasys_psychgl Unmatched 0486 0426 89 139 017
Matched 0486 0499 -19 791 -020 084oasys_psychtr Unmatched 0237 0142 194 327 000
Matched 0237 0224 27 861 028 078spcr_genderf Unmatched 0214 0124 243 408 000
Matched 0214 0199 39 838 041 068spcr_age Unmatched 28008 30216 -238 -349 000
Matched 28008 28364 -38 839 -046 065spcr_marst_mar Unmatched 0070 0093 -84 -123 022
Matched 0070 0075 -19 776 -023 082spcr_marst_lvp Unmatched 0296 0256 90 140 016
Matched 0296 0250 103 -149 117 024spcr_ethnic_mix Unmatched 0062 0038 110 187 006
Matched 0062 0040 100 92 112 026spcr_ethnic_as Unmatched 0047 0041 28 044 066
Matched 0047 0035 57 -1056 067 050spcr_ethnic_bl Unmatched 0035 0065 -137 -189 006
Matched 0035 0063 -127 76 -145 015spcr_ethnic_oth Unmatched 0000 0004 -89 -101 031
Matched 0000 0002 -51 431 -076 045pnc_copas Unmatched -0902 -0880 -27 -040 069
Matched -0902 -0910 10 644 011 091pnc_ttlprevconv Unmatched 10946 12746 -163 -227 002
Matched 10946 11580 -57 648 -069 049pnc_ttlprevconv2 Unmatched 212140 314300 -133 -163 010
Matched 212140 257960 -60 552 -082 041pnc_ttlprevconvsev
Unmatched 0132 0146 -34 -050 062Matched 0132 0165 -79 -1300 -087 039
pnc_ttlprevconvsev2
Unmatched 0163 0209 -57 -074 046Matched 0163 0239 -95 -657 -102 031
41
Variable SampleMean
bias bias
reductiont-test
Treated Control t pgttpnc_index_vio Unmatched 0327 0245 182 288 000
Matched 0327 0311 36 804 039 070pnc_index_sxl Unmatched 0078 0040 162 286 000
Matched 0078 0078 -03 982 -003 098pnc_index_acq Unmatched 0175 0303 -302 -430 000
Matched 0175 0195 -46 847 -057 057pnc_index_drg Unmatched 0218 0195 57 088 038
Matched 0218 0211 16 718 018 086pnc_index_rob Unmatched 0144 0065 261 469 000
Matched 0144 0133 37 858 037 071spcr_famconv Unmatched 0463 0403 121 185 006
Matched 0463 0433 60 503 067 050spcr_fampris Unmatched 0396 0334 129 200 005
Matched 0396 0354 88 322 098 033spcr_motivstoffy Unmatched 1720 1670 93 139 017
Matched 1720 1719 01 985 002 099spcr_motivstoffn Unmatched 0016 0010 40 065 052
Matched 0016 0007 58 -453 069 049spcr_motivhlpstoffy
Unmatched 1346 1085 338 498 000Matched 1346 1304 55 836 065 052
spcr_motivhlpstoffn
Unmatched 0097 0164 -166 -234 002Matched 0097 0107 -25 850 -031 076
spcr_attg Unmatched 58131 57962 23 033 074Matched 58131 58212 -11 518 -012 091
spcr_atta Unmatched 18393 18516 -50 -073 047Matched 18393 18547 -63 -257 -068 050
spcr_attv Unmatched 11825 10907 321 454 000Matched 11825 11681 50 843 061 054
spcr_atte Unmatched 13996 13809 60 092 036Matched 13996 13871 40 331 045 066
spcr_drug4wka Unmatched 0381 0419 -77 -118 024Matched 0381 0408 -55 289 -062 053
spcr_drug4wkbc Unmatched 0494 0499 -10 -015 088Matched 0494 0486 16 -637 019 085
spcr_drug4wkinj Unmatched 0109 0155 -135 -194 005Matched 0109 0143 -99 265 -114 025
spcr_accomtrans Unmatched 0054 0052 12 019 085Matched 0054 0058 -17 -360 -018 085
spcr_accomrough Unmatched 0027 0054 -138 -188 006Matched 0027 0032 -23 835 -030 076
spcr_edqual Unmatched 1965 1893 36 054 059Matched 1965 1915 25 308 028 078
spcr_job4wk Unmatched 0346 0331 32 049 062Matched 0346 0331 32 17 036 072
Figure A1 Risk OASys total weighted score (OASys) by treatment and control groups
Risk OASys weighted score
8
6
4
2
Per c
ent
Control
0
8
6
4
2
Per c
ent
Treatment
050 100 150 50 100 150
42
Distributions of matching variables by treatment and control groups
Table A4 Need Sum of OASys Section 11 Thinking and Behaviour scores (OASys) by treatment and control groups
Summed scoreControl Treatment
n Valid n Valid 0 111 44 44 1 04 041 89 35 35 6 23 232 126 50 50 11 43 433 156 62 62 13 51 514 219 87 87 24 93 935 234 93 93 19 74 746 262 104 104 23 89 897 281 112 112 37 144 1448 253 101 101 30 117 1179 211 84 84 29 113 11310 184 73 73 15 58 5811 147 58 58 18 70 7012 117 47 47 17 66 6613 62 25 25 7 27 2714 62 25 25 7 27 27Missing 0 00 0 00Total 2514 1000 1000 257 1000 1000Note Control group frequencies are unweighted (a weighted average of controls within the radius calliper is
used in the matching algorithm)
43
Table A5 Motivation to change behaviour (OASys) by treatment and control groups
RatingControl Treatment
n Valid n Valid Not at all 367 146 146 28 109 109Quite motivated 1426 567 567 147 572 572Very motivated 721 287 287 82 319 319Missing 0 00 0 00Total 2514 1000 1000 257 1000 1000Note Control group frequencies are unweighted (a weighted average of controls within the radius calliper is
used in the matching algorithm)
Table A6 Problems with readingwritingnumeracy (OASys) by treatment and control groups
ExtentControl Treatment
n Valid n Valid No problems 1735 690 690 187 728 728Some problems 512 204 204 50 195 195Significant problems 267 106 106 20 78 78Missing 0 00 0 00Total 2514 1000 1000 257 1000 1000Note Control group frequencies are unweighted (a weighted average of controls within the radius calliper is
used in the matching algorithm)
Table A7 Problems with learning difficulties (OASys) by treatment and control groups
ExtentControl Treatment
n Valid n Valid No problems 2185 869 869 226 879 879Some problems 195 78 78 14 54 54Significant problems 134 53 53 17 66 66Missing 0 00 0 00Total 2514 1000 1000 257 1000 1000Note Control group frequencies are unweighted (a weighted average of controls within the radius calliper is
used in the matching algorithm)
Table A8 Problems with current psychological problemsdepression (OASys) by treatment and control groups
Extent Control Treatment
n Valid n Valid No problems 1693 673 673 162 630 630Some problems 572 228 228 65 253 253Significant problems 249 99 99 30 117 117Missing 0 00 0 00Total 2514 1000 1000 257 1000 1000Note Control group frequencies are unweighted (a weighted average of controls within the radius calliper is
used in the matching algorithm)
Figure A2 Age (SPCR) by treatment and control groups
8
6
4
2
0
Per
cen
t
20 40 60 80
8
6
4
2
0
Per
cen
t
20 40 60 80Age (SPCR)
Control Treatment
44
Table A9 Problems with current psychiatric problems (OASys) by treatment and control groups
ExtentControl Treatment
n Valid n Valid No problems 2244 893 893 211 821 821Some problems 184 73 73 31 121 121Significant problems 86 34 34 15 58 58Missing 0 00 0 00Total 2514 1000 1000 257 1000 1000Note Control group frequencies are unweighted (a weighted average of controls within the radius calliper is
used in the matching algorithm)
Table A10 Gender (SPCR) by treatment and control groups
GenderControl Treatment
n Valid n Valid Male 2203 876 876 202 786 786Female 311 124 124 55 214 214Missing 0 00 0 00Total 2514 1000 1000 257 1000 1000Note Control group frequencies are unweighted (a weighted average of controls within the radius calliper is
used in the matching algorithm)
Figure A3 Copas rate on release (PNC) by treatment and control groups
10
5
0-4 -2 0 2
Per c
ent
10
5
0-4 -2 0 2
Per c
ent
COPAS rate on release (PNC)
Control Treatment
45
Table A11 Marital status (SPCR) by treatment and control groups
StatusControl Treatment
n Valid n Valid Married 234 93 93 18 70 70Living with partner 642 255 256 76 296 296Other 1636 651 651 163 634 634Missing 2 01 0 00Total 2514 1000 1000 257 1000 1000Note Control group frequencies are unweighted (a weighted average of controls within the radius calliper is
used in the matching algorithm)
Table A12 Ethnicity (SPCR) by treatment and control groups
Ethnic groupControl Treatment
n Valid n Valid Any White background 2142 852 852 220 856 856Any Mixed background 96 38 38 16 62 62Any Asian background 103 41 41 12 47 47Any Black background 163 65 65 9 35 35Any Other background 10 04 04 0 00 00Missing 0 00 0 00Total 2514 1000 1000 257 1000 1000Note Control group frequencies are unweighted (a weighted average of controls within the radius calliper is
used in the matching algorithm)
Figure A4 Total previous convictions (PNC) by treatment and control groups
30
20
10
050 100 150 200
30
20
10
050 100 150 200
Per c
ent
Per c
ent
Previous convictions (PNC)
Control Treatment
46
Table A13 Previous severe convictions (PNC) by treatment and control groups
NumberControl Treatment
n Valid n Valid 0 2205 877 877 227 883 8831 265 105 105 26 101 1012 34 14 14 4 16 163 5 02 02 0 00 004 5 02 02 0 00 00Missing 0 00 0 00Total 2514 1000 1000 257 1000 1000Note Control group frequencies are unweighted (a weighted average of controls within the radius calliper is
used in the matching algorithm)
Table A14 Grouped index offence type (PNC) by treatment and control groups
Offence type grouping
Control Treatmentn Valid n Valid
Other 384 153 153 15 58 58Violent 616 245 245 84 327 327Robbery 163 65 65 37 144 144Sexual 100 40 40 20 78 78Acquisitive 761 303 303 45 175 175Drug 490 195 195 56 218 218Missing 0 00 0 00Total 2514 1000 1000 257 1000 1000Note Control group frequencies are unweighted (a weighted average of controls within the radius calliper is
used in the matching algorithm)
47
Table A15 Family member has been convicted of a non-motoring offence (SPCR) by treatment and control groups
ResponseControl Treatment
n Valid n Valid No 1486 591 597 137 533 537Yes 1003 399 403 118 459 463Missing 25 10 2 08Total 2514 1000 1000 257 1000 1000Note Control group frequencies are unweighted (a weighted average of controls within the radius calliper is
used in the matching algorithm)
Table A16 Family member has been in prison (SPCR) by treatment and control groups
ResponseControl Treatment
n Valid n Valid No 1658 660 666 154 599 604Yes 831 331 334 101 393 396Missing 25 10 2 08Total 2514 1000 1000 257 1000 1000Note Control group frequencies are unweighted (a weighted average of controls within the radius calliper is
used in the matching algorithm)
Table A17 Agree Want to stop offending (SPCR) by treatment and control groups
ResponseControl Treatment
n Valid n Valid Other 101 40 40 9 35 35Agree 627 249 249 54 210 210Strongly agree 1786 710 710 194 755 755Missing 0 00 0 00Total 2514 1000 1000 257 1000 1000Note Control group frequencies are unweighted (a weighted average of controls within the radius calliper is
used in the matching algorithm)
Table A18 Disagree Want to stop offending (SPCR) by treatment and control groups
ResponseControl Treatment
n Valid n Valid Other 2498 994 994 254 988 988Disagree 7 03 03 2 08 08Strongly disagree 9 04 04 1 04 04Missing 0 00 0 00Total 2514 1000 1000 257 1000 1000Note Control group frequencies are unweighted (a weighted average of controls within the radius calliper is used in the matching algorithm)
Figure A5 General attitude to offending CRIME-PICS (SPCR) by treatment and control groups
15
10
5
020 40 60 80
Per c
ent
Control15
10
5
020 40 60 80
Per c
ent
Treatment
General attitude to offending CRIME-PICS (SPCR)
48
Table A19 Agree Want to get help to stop offending (SPCR) by treatment and control groups
ResponseControl Treatment
n Valid n Valid Other 725 288 288 40 156 156Agree 851 339 339 88 342 342Strongly agree 938 373 373 129 502 502Missing 0 00 0 00Total 2514 1000 1000 257 1000 1000Note Control group frequencies are unweighted (a weighted average of controls within the radius calliper is
used in the matching algorithm)
Table A20 Disagree Want to get help to stop offending (SPCR) by treatment and control groups
ResponseControl Treatment
n Valid n Valid Other 2174 865 865 237 922 922Disagree 268 107 107 15 58 58Strongly disagree 72 29 29 5 19 19Missing 0 00 0 00Total 2514 1000 1000 257 1000 1000Note Control group frequencies are unweighted (a weighted average of controls within the radius calliper is
used in the matching algorithm)
49
Table A21 Anticipation of reoffending CRIME-PICS (SPCR) by treatment and control groups
ScoreControl Treatment
n Valid n Valid 8 2 01 01 0 00 009 1 00 00 0 00 0010 3 01 01 1 04 0411 6 02 03 0 00 0012 14 06 06 1 04 0413 27 11 11 4 16 1614 46 18 19 8 31 3315 113 45 48 9 35 3716 201 80 85 18 70 7417 276 110 116 30 117 12318 628 250 265 65 253 26619 371 148 156 44 171 18020 287 114 121 30 117 12321 145 58 61 13 51 5322 106 42 45 9 35 3723 71 28 30 5 19 2024 29 12 12 2 08 0825 17 07 07 2 08 0826 14 06 06 2 08 0827 7 03 03 1 04 0428 3 01 01 0 00 0029 1 00 00 0 00 0030 6 02 03 0 00 00Missing 140 56 13 51Total 2514 1000 1000 257 1000 1000Note Control group frequencies are unweighted (a weighted average of controls within the radius calliper is
used in the matching algorithm)
50
Table A22 Victim hurt denial CRIME-PICS (SPCR) by treatment and control groups
ScoreControl Treatment
n Valid n Valid 3 69 27 27 2 08 084 47 19 19 2 08 085 59 23 23 1 04 046 136 54 54 6 23 237 104 41 41 4 16 168 155 62 62 14 54 549 129 51 51 20 78 7810 241 96 96 19 74 7411 133 53 53 8 31 3112 664 264 264 77 300 30013 257 102 102 38 148 14814 196 78 78 22 86 8615 324 129 129 44 171 171Missing 0 00 0 00Total 2514 1000 1000 257 1000 1000Note Control group frequencies are unweighted (a weighted average of controls within the radius calliper is
used in the matching algorithm)
Table A23 Evaluation of crime as worthwhile CRIME-PICS (SPCR) by treatment and control groups
ScoreControl Treatment
n Valid n Valid 4 1 00 00 1 04 045 5 02 02 1 04 046 16 06 06 2 08 087 26 10 11 2 08 088 68 27 28 4 16 169 96 38 39 9 35 3510 177 70 72 21 82 8311 197 78 80 13 51 5112 270 107 109 31 121 12213 235 93 95 24 93 9414 328 130 133 33 128 13015 266 106 108 24 93 9416 276 110 112 27 105 10617 229 91 93 24 93 9418 115 46 47 20 78 7919 94 37 38 12 47 4720 70 28 28 6 23 24Missing 45 18 3 12Total 2514 1000 1000 257 1000 1000Note Control group frequencies are unweighted (a weighted average of controls within the radius calliper is
used in the matching algorithm)
51
Table A24 Used class A drugs in the four weeks before custody (SPCR) by treatment and control groups
ResponseControl Treatment
n Valid n Valid No 1460 581 581 159 619 619Yes 1054 419 419 98 381 381Missing 0 00 0 00Total 2514 1000 1000 257 1000 1000Note Control group frequencies are unweighted (a weighted average of controls within the radius calliper is
used in the matching algorithm)
Table A25 Used class BC drugs in the four weeks before custody (SPCR) by treatment and control groups
ResponseControl Treatment
n Valid n Valid No 1259 501 501 130 506 506Yes 1255 499 499 127 494 494Missing 0 00 0 00Total 2514 1000 1000 257 1000 1000Note Control group frequencies are unweighted (a weighted average of controls within the radius calliper is
used in the matching algorithm)
Table A26 Injected illegal drugs in the four weeks before custody (SPCR) by treatment and control groups
ResponseControl Treatment
n Valid n Valid No 2121 844 845 228 887 891Yes 389 155 155 28 109 109Missing 4 02 1 04Total 2514 1000 1000 257 1000 1000Note Control group frequencies are unweighted (a weighted average of controls within the radius calliper is
used in the matching algorithm)
Table A27 Accommodation prior to custody (SPCR) by treatment and control groups
TypeControl Treatment
n Valid n Valid Stable accommodation 2247 894 894 236 918 918Transient accommodation 130 52 52 14 54 54Sleeping rough 137 54 54 7 27 27Missing 0 00 0 00Total 2514 1000 1000 257 1000 1000Note Control group frequencies are unweighted (a weighted average of controls within the radius calliper is
used in the matching algorithm)
52
Table A28 Educational (qualifications) attainment (SPCR) by treatment and control groups
Highest qualification attained
Control Treatment
n Valid
n Valid
No qualifications 1099 437 441 99 385 388Other qualifications (incl overseas) 66 26 26 7 27 27O levelGCSE grade D-G (or similar qualification) 372 148 149 47 183 184O levelGCSE Grades A-C (or similar qualification) 507 202 204 61 237 239Trade apprenticeships 87 35 35 6 23 24AAS levels 220 88 88 21 82 82Higher education diploma 57 23 23 11 43 43First degreepostgraduate degree 70 28 28 2 08 08Higher degreepostgraduate degree 13 05 05 1 04 04Missing 23 09 2 08Total 2514 1000 1000 257 1000 1000Note Control group frequencies are unweighted (a weighted average of controls within the radius calliper is
used in the matching algorithm)
Table A29 Was in paid work in the four weeks before custody (SPCR) by treatment and control groups
ResponseControl Treatment
n Valid n Valid No 1681 669 669 168 654 654Yes 832 331 331 89 346 346Missing 1 00 0 00Total 2514 1000 1000 257 1000 1000Note Control group frequencies are unweighted (a weighted average of controls within the radius calliper is
used in the matching algorithm)
Table A30 Reconviction indicator one-year (PNC) by treatment and control groups
IndicatorControl Treatment
n Valid n Valid No 1584 630 630 187 728 728Yes 930 370 370 70 272 272Missing 0 00 0 00Total 2514 1000 1000 257 1000 1000Note Control group frequencies are unweighted (a weighted average of controls within the radius calliper is
used in the matching algorithm)
53
Table A31 Frequency of reoffending one-year (PNC) by treatment and control groups
IndicatorControl Treatment
n Valid n Valid 0 1584 630 630 187 728 7281 495 197 197 54 210 2102 203 81 81 11 43 433 117 47 47 3 12 124 53 21 21 1 04 045 33 13 13 1 04 046 8 03 03 0 00 007 7 03 03 0 00 008 6 02 02 0 00 009 1 00 00 0 00 0010 2 01 01 0 00 0011 2 01 01 0 00 0013 0 00 00 0 00 0015 1 00 00 0 00 0018 1 00 00 0 00 0032 1 00 00 0 00 00Missing 0 00 0 00Total 2514 1000 1000 257 1000 1000Note Control group frequencies are unweighted (a weighted average of controls within the radius calliper is
used in the matching algorithm)
54
Table A32 Frequency of reoffences one-year (PNC) by treatment and control groups
IndicatorControl Treatment
n Valid n Valid 0 1584 630 630 187 728 7281 272 108 108 31 121 1212 181 72 72 15 58 583 117 47 47 15 58 584 91 36 36 2 08 085 65 26 26 3 12 126 42 17 17 2 08 087 38 15 15 1 04 048 32 13 13 1 04 049 20 08 08 0 00 0010 19 08 08 0 00 0011 15 06 06 0 00 0012 11 04 04 0 00 0013 6 02 02 0 00 0014 6 02 02 0 00 0015 5 02 02 0 00 0016 1 00 00 0 00 0017 0 00 00 0 00 0018 1 00 00 0 00 0019 1 00 00 0 00 0020 1 00 00 0 00 0021 2 01 01 0 00 0022 2 01 01 0 00 0025 1 00 00 0 00 0039 1 00 00 0 00 00Missing 0 00 0 00Total 2514 1000 1000 257 1000 1000Note Control group frequencies are unweighted (a weighted average of controls within the radius calliper is
used in the matching algorithm)
Table A33 Severe offences reconviction indicator one-year (PNC) by treatment and control groups
IndicatorControl Treatment
n Valid n Valid No 2496 993 993 255 992 992Yes 18 07 07 2 08 08Missing 0 00 0 00Total 2514 1000 1000 257 1000 1000Note Control group frequencies are unweighted (a weighted average of controls within the radius calliper is
used in the matching algorithm)
Ministry of Justice Research Series 1910Evaluation of the impact of the HM Prison Service Enhanced Thinking Skills programme on reoffendingThis research examined the impact of the Enhanced Thinking Skills (ETS) programme on the one-year reconviction outcomes of 257 prison-based participants between 2006 and 2008 Radius propensity score matching was used to match a comparison group that had no statistically significant difference (at the means) to the treatment group on any matching characteristic ETS was found to significantly reduce both the reconviction rate (six percentage points) and frequency (60 reoffences per 100 released prisoners) of general reoffending of participants No statistically significant impact was found on the severe offences reconviction rate Almost identical impacts were found for completers A stronger reduction in reconviction was found for participants meeting the suitability criteria Though the programme has been shown to be effective in practice the findings suggest that a stricter application of the targeting criteria might have further enhanced the effectiveness of the programme
ISBN 978 1 84099 418 6copy Crown copyrightProduced by the Ministry of JusticeAlternative format versions of this report are available on requestE-mail researchjusticegsigovukhttpwwwjusticegovukpublicationsresearchhtm
2
The Enhanced Thinking Skills programmeEnhanced Thinking Skills (hereafter referred to as ETS) is a short group-based general offending behaviour programme delivered by HM Prison Service that addresses thinking and behaviour associated with offending with the objective of reducing general reconviction rates15 Following the cognitive-behavioural approach it is based on the premise that cognitive skills deficits (for example poor problem solving and critical reasoning) are important factors in explaining offending behaviour and that such skills can be taught (Clarke 2000)
Through a sequenced series of structured exercises ETS aims to boost prisonersrsquo cognitive skills to enhance offendersrsquo ability to achieve worthwhile goals and ultimately reduce recidivism The exercises are designed to target six key aspects of thinking skills linked with offending impulse control cognitive style (flexible thinking) social perspective taking valuesmoral reasoning critical reasoning and interpersonal problem solving
ETS was developed by the Prison Service in the early 1990s and was first accredited for use in custody in 199616 The programme consists of 20 two-hour sessions run between three and five times per week for a period of four to six weeks Sessions involve interactive exercises assignments role playing and discussions and are run by two facilitators with no more than ten participants per group
In 2009 ETS was replaced by the Thinking Skills Programme (TSP) representing a refresh and update of the cognitive skills programme in line with advances in theory and practice
Suitability criteria
ETS is targeted at male and female offenders who are medium-high risk or above with a need for cognitive skills intervention The specific risk and need requirement participant identification tools (jointly referred to as lsquosuitability criteriarsquo) applicable during the period of treatment are set out below17
15 Since 2000 an amended version of ETS has been delivered by HM Probation Service to offenders in the community
16 Ministry of Justice (2009)17 The suitability criteria for ETS have been revised over time Those employed in this analysis are based
on the Assessing Suitability for Offending Behaviour Programmes Risk Need amp Responsivity Guidance for Treatment Managers published in August 2007 (HM Prison Service 2007) The ETS start dates of treated individuals in the SPCR sample stretch from March 2006 to September 2008 so this guidance was introduced in the middle of this period Nonetheless as an indication and selector of suitability for the intervention the guidance is retrospectively relevant With the emergence of OGRS version 3 (Howard et al 2009) later guidance (National Offender Management Service 2009) has defined the risk requirement for ETS (and its replacement TSP) with reference to OGRS3 (2 year reconviction 50 and above)
3
Risk requirements18
The assessment of risk of proven reconviction ensures that the programme is appropriate for the individual The risk threshold specified for ETS is the point on either the Offender Assessment System (OASys) or Offender Group Reconviction Scale19 version 2 (OGRS2) scale (with the higher score band used if both are completed) that divides lsquolow-mediumrsquo from lsquohigh-mediumrsquo risk offenders
OASys score 56 or above or
OGRS2 score 41 or above
Need requirements20
The assessment of need ensures that the programme is relevant to the individualrsquos needs Potential need for cognitive skills intervention is considered present if the sum of the prisonerrsquos scores on a selected seven of the ten Section 11 (Thinking and Behaviour) items of the OASys assessment totals 7 or above or totals 4 or above with at least one individual score of 2 (indicating significant problems) The seven selected Section 11 items are impulsivity ability to recognise problems problem solving skills awareness of consequences achieves goals understands other peoplersquos views and concreteabstract thinking
Responsivity and readiness criteria
Though more advisory than prescriptive consideration is also given to the responsiveness and readiness of the individual to benefit from the programme This is assessed in relation to intellectual ability literacy dyslexialearning difficulty mental and physical health psychopathic traits motivation to change behaviour and disability This ensures that the programmersquos mode of delivery matches the learning styles and other diverse needs of participants
Prioritisation of suitable candidates
Once assessed as suitable for the programme candidates are then prioritised according to risk of serious harm likelihood of reconviction proximity to release timing of hearings likelihood of positive impact group composition and other opportunity for treatment21
18 Prior to August 2007 the Sentence Planning Risk Predictor was used as the risk tool when assessing suitability for any OBP There is some flexibility in the application of the risk requirement with prisoners within three points of the OASysOGRS2 cut-off permitted to progress for need requirement consideration There are also exemptions to the cut-offs for indeterminate sentenced prisoners and sex offenders who score at least medium on the Risk Matrix 2000
19 The Offender Group Reconviction Scale (OGRS) is a risk assessment measure used to predict the likelihood of reconviction for individual offenders based on static risks (age gender and criminal history) alone
20 The original indicator of criminogenic needs the ETS Semi-Structured Interview has gradually been replaced by OASys Section 11 scores as confirmed in later guidance (National Offender Management Service 2009)
21 HM Prison Service (2007)
4
Previous evaluation researchPrevious evaluations of ETS have produced mixed results on the effectiveness of the programme Early findings of a statistically significant and large reduction in reconviction were later tempered by research studies finding little or no statistical differences between ETS participants and non-participants Results have also differed depending on whether starters or completers are included and whether a one- or two-year reconviction outcome is used Several reasons for the disparity in findings have been speculated with all studies citing the potentially important role of unmeasured dynamic factors This is a shortcoming that this study sought to address
All reconviction studies to date have used a retrospective quasi-experimental research design that compares the reconviction outcomes of the ETS treatment group with those of a comparison group matched on a narrow range of static risk factors
The first evaluation of ETS by Friendship et al (2002) examined the pre-accreditation ETS programme delivered by HM Prison Service (from 1992 to 1996) The research found statistically significant reductions in the two-year reconviction rate of male ETS participants Specifically participation in either ETS or Reasoning and Rehabilitation (RampR)22 was found to significantly reduce the two-year reconviction rates for medium-to-low (by 14 percentage points) and medium-to-high (11 percentage points) risk offenders No significant effect was found for either low or high risk offenders
Subsequent studies of the post-accreditation programme could not reproduce these positive results In contrast Falshaw et al (2003 2004) failed to find a statistically significant difference in the two-year reconviction rates of adult ETS participants (1996 to 1998) in any of the OGRS risk bands whether programme non-completers were included or excluded A similar evaluation by Cann et al (2003) investigated the temporal effects of ETS by studying both the one- and two-year reconviction rates for male adult and young offenders (1998 to 2000) Whilst no difference was detected for all adult males who had started the programme a significant reduction in the one-year rate was found for males (26 percentage points on average and 70 for high risk offenders) and young offenders (36 percentage points on average) who had completed the programme However these differences were not maintained a further year on with no significant effect found for any group at the two-year post-release stage suggesting that the impact of ETS on reoffending behaviour may be short-lived
The possibility of a differential gender impact of ETS was considered by Cann (2006) who assessed the impact of ETS on a group of female (only) participants ndash the only evaluation to consider female prisoners The results were similar to the post-accreditation evaluations of ETS delivered to males with no significant differences in the one- and two-year reconviction rates of female ETS participants
22 The researchers note that ldquo[a]s Reasoning and Rehabilitation (RampR) and Enhanced Thinking Skills (ETS) share the same theoretical basis the programmes are analysed alongside one anotherrdquo (Friendship et al 2002 pp2-3)
5
More recently a randomised control trial (RCT) evaluation of ETS in HM Prison Service by McDougall et al (2009) focused on the short-term impact of the programme They found that ETS was effective in reducing impulsivity and changing the self-reported offending-related thinking of adult male prisoners No examination of reconviction outcomes was possible however as ethical considerations of treatment denial meant that the comparison group also participated in an ETS programme later in their sentence prior to release Nonetheless as impulsivity has been linked to reoffending (Blackburn 1972 Eysenck and McGurk 1980 Mak 1991) this finding suggests an expected reduction in recidivism for participants This result supports earlier findings (Clarke et al 2004) that ETS participation brought short-term non-reconviction benefits including increased self-confidence developed interpersonal skills and improved prisoner behaviour The nature of prisonersrsquo motivations for participating in a cognitive behaviour programme was also found to be a key factor in assessing the effectiveness of the programme (Clarke et al 2004)
Rationale for this evaluation
Existing evaluation evidence on ETS is therefore inconclusive (McDougall et al 2009) Reflecting on the disagreement of later findings with those of Friendship et al (2002) it has been suggested (Falshaw et al 2003 Cann et al 2003) that the early large significant impact may have reflected an initial enthusiasm of programme tutors motivation of participants andor the focused nature of delivery prior to its accreditation and later expansion23 Such an explanation would if true create doubts about the efficacy of OBP accreditation and roll-out of programmes across the Prison Service
Alternatively another factor may drive the variability of evaluation results Whilst disagreeing in terms of research findings all previous evaluations of ETS note one common methodological limitation as a possible explanation of their findings the inability to control for potential differences in dynamic risk factors (Friendship et al 2002 Falshaw et al 2003 Cann et al 2003 Cann 2006) As very little data have been available to date on dynamic factors previous studies have been constrained to matching based on a narrow range of static risk factors alone (for example age gender ethnicity criminal career variables) Consequently potential selection bias due to differences in unmeasured dynamic risk between the participants and their comparators has not been controlled Such bias could plausibly account for the variation of the evidence to date
The key advantage and added value of this research is the opportunity to match using dynamic risk factors in addition to static ones afforded by SPCR prisoner survey and OASys data Some of the dynamic risk factors on which data are available are motivation to stop offending attitudes to crime substance misuse physical and mental health educational
23 For a qualitative examination of the process of ETS implementation and delivery in a prison context please see Clarke et al (2004)
6
attainment and skills level employment status accommodation status marital status and needs The prisoner survey also allows matching on additional rich static risk factors (for example family contact with the criminal justice system)
A further limitation of previous evaluations has been the reliance on Offenders Index data to assess reconviction which may not be the most complete source of such information (Falshaw et al 2003) The current study improves on this aspect by drawing its reconviction data from the Police National Computer the official source of criminal conviction histories
7
2 Approach
The research methodology of the study covering data sources final sample details and analysis techniques employed is summarised and explained in this section More details on technical points are provided in the Technical Annex
This evaluation assessed the impact of the HM Prison Service ETS programme on reoffending using a retrospective quasi-experimental research design that compared the one-year reconviction outcomes of participants with those of a matched comparison group that had not participated in the programme The research set out to test the hypothesis that ETS has no significant impact on the reconviction rates of programme participants
Based on the SPCR prisoner sample and incorporating data from the Offending Behaviour Programme Interventions Database Offender Assessment System (OASys) and the Police National Computer (PNC) the assembled dataset provides a profile of prisonersrsquo characteristics needs experiences and outcomes of unprecedented detail The combined dataset comprises more than 1800 variables on a final sample of 3277 prisoners
The comparison (matched control)24 group was generated using a statistical matching technique such that it is sufficiently lsquosimilarrsquo25 to the ETS participant (treatment) group to permit valid comparison The effect of this technique is to balance the programme suitability offending-risk characteristics and criminogenic needs across the treatment and matched control groups A strong match has been achieved taking account of 42 variables meaning that the treatment and control groups are statistically lsquosimilarrsquo or unbiased such that we would expect to observe the same reoffending outcomes for each group on average Any observed difference in the average reconviction rates between the two groups may therefore be assumed to be the causal effect of the ETS intervention known as the average treatment effect on the treated (ATT)
The analysis was carried out on an lsquointention-to-treatrsquo basis (consistent with Colledge et al 1999) whether the participant completed the ETS programme or not though analysis of completers only has also been run for completeness
24 A note on terminology used for the remainder of the report following the evaluation literature the term lsquotreatment grouprsquo is used in this report to refer to those prisoners in the sample that received ETS in the relevant sentence period Conversely the term lsquountreatedrsquo is used to distinguish those prisoners in the sample that did not receive ETS in the relevant sentence period The term lsquocontrolrsquo (and lsquomatched controlrsquo) is reserved to refer to the untreated prisoners that form part of the matched control group following propensity score matching
25 lsquoSimilarrsquo is defined as having mean values that are not statistically different from those of the participant group across a set of variables pre-selected as being simultaneously predictive of the probability of treatment and the probability of reconviction
8
Data sources and sample detailsAs the source of the novel dynamic risk factor data the base sample for the analysis is that of the SPCR prisoner survey The SPCR dataset is supplemented by merging to three further data sources data on which prisoners received ETS in what time period from the Offending Behaviour Programme Interventions Database data on the assessed need and risk of prisoners from the Offender Assessment System (OASys) and criminal history and reconviction data from the Police National Computer Each data source is described in turn
SPCR prisoner survey (wave 1)
Surveying Prisoner Crime Reduction (SPCR) is a large-scale longitudinal cohort study of nearly 4000 newly-sentenced adult prisoners in England and Wales comprising four waves of interviews conducted between 2005 and 2009
This evaluation uses wave 1 data only Wave 1 conducted at the point of reception into prison describes the characteristics and needs26 of the cohort of prisoners demographics background and family offending history educational achievements employment status physical and mental health substance misuse accommodation and relationships attitudes27 needs to help prevent them from reoffending and plans and expectations for the future (upon release from prison) All data are self-reported and as the survey responses relate to the start of the particular custodial sentence all responses are measured before any treatment could have commenced
Prisoners were selected from the Ministry of Justicersquos (MoJ) Inmate Information System (IIS) database and their current location found using MoJrsquos Local Inmate Data System (LIDS) The minimum sentence length accepted was one month due to the time taken to locate the prisoner and interview them and the maximum sentence length was four years to allow for a reasonable data-collection period Prisoners were recruited into the study on the basis of fully informed consent and ethical guidelines for social research were followed Prisoners were interviewed by specially trained researchers using computer-assisted (CAPI) questionnaires
Interview targets were set for every reception prison (except those with very low throughput) based on the proportional sizes of receptions at each prison Prison reception characteristics were found to be highly variable and targets were compiled using the most recent information available Over-sampling targets were calculated to allow for any difficulties in accessing prisoners Thus the interviews were drawn from 40 prisons from a possible 53 eligible prisons
26 The term lsquoneedsrsquo is used throughout to refer to a wide range of factors (associated with the pathways) which are generally understood to be related to offending sometimes known as ldquocriminogenic needsrdquo A summary of the general problems and needs of these newly sentenced prisoners has already been published (Stewart 2008)
27 Attitudes are measured using CRIME-PICS II (Frude et al 1994) a widely used and validated questionnaire-based instrument for examining and detecting changes in offendersrsquo attitudes to offending Special thanks are due to Jennifer Poyser in Offender Management Analytical Services at MoJ for the conversion of SPCR attitude question responses to CRIME-PICS II scores
9
The full sample (after removal of ineligible participants)28 at wave 1 was 3849 adult prisoners sentenced to between one month and four years29 This represents the base sample for this evaluation though the final sample will be smaller due to failed matches in database merging and data completion filters
Offending Behaviour Programme Interventions Database
To determine the treatment status of the base sample (that is which prisoners had received ETS during their sentence period) the SPCR wave 1 dataset was linked to the OBP prison interventions database compiled by the National Offender Management Service (NOMS) Rehabilitation Services Group30
The database is based on administrative records of interventions delivered to prisoners (71521 unique prisoner numbers) from 1994 to 2009 It covers accredited OBPs only including Controlling Anger and Learning how to Manage it (CALM) Cognitive Skills Booster (CSB) Cognitive Self Change Programme (CSCP) Enhanced Thinking Skills (ETS) Focus on Resettlement (FOR) Healthy Relationships Programme (HRP) Reasoning and Rehabilitation (RampR) Chromis JETS and Sex Offender Treatment Programme (SOTP)
When matched to the SPCR sample (by prisoner number) it was found that 449 (12) of the 3849 SPCR prisoners had received an accredited intervention The magnitude of this intervention rate was validated by comparison of total ETS programme participants and total prison population figures More specifically 371 (10) prisoners were identified as having participated in ETS within the SPCR sentence period All started the programme between March 2006 and September 200831 ETS was by far the most common OBP intervention delivered and the only individual programme with a sufficient number of participants to permit a statistical analysis of effectiveness
Offender Assessment System (OASys)
For verification of suitability for the programme and to allow matching of control prisoners based on these characteristics data are required on the risk and need of the prisoners in the sample This data requirement is fulfilled by the Offender Assessment System (OASys)
28 Twenty-eight participants were removed due to ineligibility Please see the SPCR Technical Report for more information
29 There are two sub-samples within SPCR Sample 1 (Reception Prisoners) is representative of the entire prison reception population (the lsquoflowrsquo into prison) at the time of sampling (n=1435) Sample 2 (Longer-term Prisoners) is a booster sample to reflect the higher proportion of longer-term prisoners in the prison population (the lsquostockrsquo of prisoners) (n=2414) Please see the SPCR Technical Report for more information This evaluation study uses the combined sample and does not distinguish between the two sub-samples That said ETS tends to be reserved for longer-term prisoners
30 Previously known as the Interventions amp Substance Misuse Group (ISMG)31 If a prisoner was recorded as receiving more than one ETS course in the SPCR sentence period the latest
start date was used
10
OASys is NOMSrsquos principal riskneed assessment and management tool for adult offenders in England and Wales and is used to assess suitability for ETS Introduced in 2001 OASys produces standardised assessments of offendersrsquo risks and needs by combining actuarial methods of prediction with structured professional judgement In terms of outputs OASys provides data on the likelihood of reconviction criminogenic factors (need) and risk of harm
The SPCR sample was matched to the OASys database by PNC number All OASys assessments completed for the prisoners in the SPCR sample subject to data completion criteria32 were provided by the OASys Data Evaluation and Analysis Team (O-DEAT) numbering some 2956433 Nonetheless as OASys assessments are not mandatory and the coverage of OASys is not universal an OASys assessment is available for only 3512 prisoners (316 of which were treated)
With an average of eight assessments provided per prisoner the one OASys assessment relevant to the instance of ETS participation was selected for each prisoner The method of selection differed for treated and untreated prisoners As the start date of ETS is known for each participant the most recent assessment prior to the start date was selected As there is no start date for the untreated group the OASys assessment completed closest (before or after) to the SPCR sentence prison reception date was selected
Police National Computer
Criminal conviction history and reconviction data were obtained from the Police National Computer (PNC) The SPCR sample was matched to the PNC database (June 2010 snapshot) using personal identifiers (surname forenames gender date of birth) returning 3615 valid matches34 Respondents must have been released for a minimum of one and a half years (allowing one year to reoffend and six months to be convicted) to be included in the matched sample Respondents that were deceased deported or had absconded were excluded from the sample
Final achieved sample details
Following merging of the four datasets 2771 of the 3849 full SPCR sample (and 257 of the 371 ETS participants) had complete data a valid OASys assessment matched to the PNC and had no missing data on any variables employed in the statistical modelling The sample included 2405 (87) men and 366 (13) women
32 All assessments provided met the following minimum standards of data completion Each of the scored sections (1 to 12) within the core OASys assessment must have had at least four-fifths of their scored items completed ndash ensuring that each criminogenic need was assessed properly and In the risk of serious harm sections the screening must have been completed the decision whether to complete a full risk analysis should have been consistent with the information provided and the four ratings of risk of serious harm in the community must have been completed (OASys Data Evaluation and Analysis Team 2010)
33 All OASys assessments used in the analysis are pre-OASys release 431 (August 2009) assessments34 Special thanks are due to Richard Boorman in Offender Management Analytical Services at MoJ for matching
the SPCR sample to the PNC and completing the reconviction analysis
11
The participant sample comprised 257 (9 of the final sample) treated prisoners who started ETS between March 2006 and September 2008 This includes 20 (8 of all treated) participants that did not complete the course a similar proportion observed in previous studies (Friendship et al 2002 Falshaw et al 2003 Cann et al 2003 Cann 2006) The remaining 2514 prisoners did not undertake ETS which provides a reasonable pool from which to select a matched control group35
Outcome measuresTo assess programme effectiveness the impact of ETS is measured with reference to the one-year reconviction outcomes of participants and comparators To reflect the fact that a successful outcome for ETS could include no reconviction (general andor severe) or a reduction in the frequency of reoffending three separate measures of proven reoffending36 are examined defined as follows
reconviction rate (one-year) binary (yesno) indicator of whether the offender was convicted of a recordable offence that was committed within the 12-month period after release from the SPCR custodial sentence
reoffending frequency (one-year) continuous measure of how many recordable offences the offender was convicted of that were committed within the 12-month period after release from the SPCR custodial sentence (note that there may be more than one offence per conviction) and
severe offence reconviction rate (one-year) binary (yesno) indicator of whether the offender was convicted of a severe offence that was committed within the 12-month follow-up period after release from the SPCR custodial sentence The designation of an offence as lsquoseverersquo follows a standard definition under which approximately 150 of the 3000 Home Office offence codes are defined as severe37
Evaluation research designTo evaluate the impact of ETS it would be desirable to compare each treated prisonerrsquos reconviction outcome after treatment with what it would have been without treatment The latter is of course not observable ndash a treated individual cannot have an untreated outcome ndash and so a proxy must be created
35 It is possible that prisoners (participants and non-participants) may have participated in other intervention programmes accredited (for example another OBP or substance misuse treatment) andor non-accredited (of varying quality) during their SPCR sentence period Analysis of the level of participation on other accredited OBPs by the treatment group and matched control groups is presented later in this section
36 An offender is said to have committed a proven reoffence if the offender receives a conviction (by a caution or guilty verdict) at court for the reoffence The reoffence must have been committed within the one-year follow up period and the conviction must follow either within that one-year follow up or in a further 6 months which is to allow time for the offence to be proven at court
37 Severe offence types include violence against the person (murder attempted murder manslaughter wounding) sexual offences (sexual assault rape sexual activity with a minor or a person with a mental disorder abuse of children through prostitution and pornography trafficking for sexual exploitation) aggravated vehicle taking and death by dangerous drink or drug driving A full list of severe offence types is available in lsquoAppendix G List of most serious (severe) offencesrsquo of Ministry of Justice (2010)
12
Due to the active selection mechanism for ETS treatment (see suitability criteria in section 1) it is likely that prisoners selected for treatment differ on average from untreated prisoners even before treatment commences ETS participants should be characterised by a medium-to-high reconviction risk and a high level of criminogenic needs whereas non-participants should have a profile that is more reflective of the general prison population This is known as selection bias For this reason any difference observed in a simple comparison of the average outcome of the treatment group with that of the untreated group could be explained by factors other than the intervention treatment It is important therefore to remove as much of the selection bias as possible between the treatment group and comparison groups prior to comparison of the average outcomes The Propensity Score Matching (Rosenbaum and Rubin 1983) statistical technique has been developed for this very purpose
A primer on Propensity Score Matching
Whilst only a Randomised Control Trial (RCT)38 can ensure a random distribution of any unobserved sources of potential bias ethical and practical considerations can mean that RCT is not an easy-to-use methodology to evaluate the impact of interventions on reconviction rates
Instead Propensity Score Matching (PSM) has been selected to estimate the causal treatment effect of ETS39 On the Scientific Methods Scale adapted for reconviction studies (Harper and Chitty 2005 National Offender Management Service 2005) PSM rates as a level 4 research design ldquothat controls for bias by using the most robust method of matching individuals on all variables that affect participation in the intervention as well as all variables that affect outcomerdquo40 As differences in the variables influencing the treatment and the outcome are controlled for after the treatment intervention the approach is defined as a retrospective quasi-experimental design
The basic idea of PSM is to select a group of untreated individuals that are statistically lsquosimilarrsquo to the group of treated individuals across the set of relevant observed characteristics measured at the pre-treatment (and pre-allocation) stage41 Once the group is well matched (little or no statistical difference in the means of the matching variables) to the treatment group it is an adequate control group to generate the proxy untreated outcome Differences between the outcomes of the treated and untreated groups can then be attributed to the intervention
38 ldquoAn RCT compares outcomes when the intervention is used to outcomes without the intervention or with an alternative (seen in the control group) In an RCT participants are randomly allocated to an intervention or a control group which differs systematically in the type or amount of the intervention received The groups are otherwise equivalent because all other differences are randomly distributedrdquo (National Offender Management Service 2005 p2)
39 In the lsquoScientific Methods Scale adapted for reconviction studiesrsquo (National Offender Management Service 2005) a five-level lsquostandard of researchrsquo scale (5 representing the highest standard) of methodologies to evaluate the impacts of an intervention on reoffending and other offence-related outcomes propensity score matching rates as a level 4 research design (RCT is the only level 5 method) Level 4 is defined as ldquoComparison group matched to intervention group on theoretically relevant factors eg risk of reconviction (well-matched comparison group)rdquo (National Offender Management Service 2005 p3)
40 National Offender Management Service (2005) p 341 Specifically PSM matches individuals based on their probability (propensity score) of participating in the
intervention programme given their observed characteristics
13
Matching methodology
The matching methodology used to generate the matched control group comprises five components suitability filter pre-selected matching variables matching algorithm the parsimonious PSM model and assessment of the match quality Consultation on the methodology employed was undertaken with analyst and policy colleagues at MoJ and NOMS
Suitability filter of potential control matches
The codification of the suitability criteria defining the prisoner needs and characteristics that determine selection into the programme presents the opportunity to control directly for selection bias Assuming that untreated prisoners satisfying the suitability criteria did not receive treatment due to practical barriers (for example ETS was not provided at the establishment the prisoner was participating on another programme or was movedreleased whilst on waiting list) non-participants could be filtered by the suitability criteria to yield an ETS-suitable pool of untreated potential control matches
Such a filter was successfully implemented though with an unexpected result As the OASys data provided did not include OGRS2 scores the risk requirement was assessed with respect to the OASys score This is not invalid as the guidance notes ldquoIf an offender passes the cut-off on one but not both scales [ie OGRS2 and OASys total weighted score] you can consider them to be suitable to progress to the needs assessment stagerdquo42
To ensure the relevance of the filter a cross-check was carried out by applying the same filter to the treatment group with the expectation of finding a high rate of compliance However this analysis revealed that a substantial proportion (up to 42) of ETS participants failed to satisfy even the basic need and risk requirements for ETS suitability43 This is the first noteworthy finding of this research and has important implications for the evaluation Full results are presented and discussed in the following Results section
The direct implication of this finding is that an explicit suitability criteria filter of the potential control pool would be unnecessarily restrictive seeing as the treatment group itself does not satisfy the criteria It also has an important implication for the potential effectiveness of the programme If the suitability criteria are designed so as to identify the individuals that are most likely to benefit from the intervention then a weak adherence to these suitability criteria would constrain the potential effectiveness that the intervention programme could actually achieve in practice (Andrews and Bonta 2010) This is an important point as a programme
42 HM Prison Service (2007) p543 It is important to note some caveats to this analysis (explained fully in the Results section) The specification
of the risk tool to OGRS2 or OASys was only introduced in August 2007 half-way through the period under analysis (March 2006 to September 2008) A secondary indicator of criminogenic needs the ETS Semi-Structured Interview was also used historically though emphasis was placed on the OASys Section 11 scores in the assessment of need There is also some flexibility allowed in the application of the suitability criteria individuals with an OASys or OGRS2 score within three points below the cut-off may be progressed to ETS and special considerations are made for indeterminate sentence prisoners and sex offenders
14
evaluation result of no statistically significant reduction in reconviction may actually be reflecting poor targeting rather than a poor programme
Pre-selected matching variables
Prior to undertaking the matching and outcome analysis a wide range of factors were identified as being the most important drivers of participation in the intervention and the reconviction outcome These variables have two functions First they form the basis of the full specification of the matching model Second the quality of the control group match is assessed by comparing its mean values with those of the treatment group on each one of these variables In addition to ETS suitability criteria and the standard static risk factors the list includes several dynamic risk factors unlike previous evaluations
The first group of factors identified are those that (should) determine the probability of treatment ndash the ETS suitability criteria level of criminogenic need risk of reconviction and responsivity and readiness criteria (motivation to change behaviour and whether the prisoner has problems with reading writing numeracy learning difficulties psychological problemsdepression or psychiatric problems)
The second group are static reconviction risk factors selected as the variables underpinning the OGRS3 score found to be a more accurate predictor of reconviction than OGRS2 and the Sentence Planning Risk Predictor (Howard et al 2009) Namely the individual static factors include age gender index offence type (explained below) the Copas rate44 sanctioning history (total previous convictions and previous severe convictions and their quadratics) Additional static risk factors from SPCR survey responses have also been included ethnicity (White Black Mixed Asian and Other background) marital status family criminal history
Every offence type has a distinct Home Office code of which there are more than 3000 which are grouped into 20 categories in the standardised OGRS classification After checking the distribution of the ETS participants across these 20 categories most had too few observations to be statistically useful Accordingly the 20 offence categories have been further grouped into six categories that are both meaningful (similar offences) and contain 20 or more treated prisoners45 The final offence type groupings with grouped OGRS categories are Violent (violence and public orderriot offences) Robbery Sexual (sexual offences not against a child sexual offences against a child and solicitingprostitution) Acquisitive (burglary (domestic) burglary (other) theft (non-motor) handling stolen goods fraud and forgery taking and driving away and related offences and theft from vehicles) Drug (drugs import export production or supply and drugs possessionsmall-scale supply) Other (abscondingbail offences other motoring drink driving criminal damage and any other offences)
44 The Copas rate (Copas and Marshall 1998) is a measure that reflects both the intensity and length of the offenderrsquos criminal career calculated as log [ (number of sanction occasions) (10 + years between first and current sanction) ] The higher the Copas rate the more convictions an offender has amassed in a given amount of time and the more likely it is that the offender will reoffend within one year
45 An exception is the lsquoOtherrsquo category the reference category for modelling which has 15 treated participants
15
Box 21 Matching variables pre-selected as being predictive of ETS participation and reconviction risk
Programme suitability criteria Need Sum of OASys Section 11 Thinking and Behaviour scores (OASys) Risk OASys total weighted score (OASys) Motivation to change behaviour (OASys) Problems with readingwritingnumeracy (OASys) Problems with learning difficulties (OASys) Problems with current psychological problemsdepression (OASys) Problems with current psychiatric problems (OASys)
Static risk factors Gender (SPCR) Age (SPCR) Marital status Married (SPCR) Marital status Living with a partner (SPCR) Ethnicity Any Mixed background (SPCR) Ethnicity Any Asian background (SPCR) Ethnicity Any Black background (SPCR) Ethnicity Any Other background (SPCR) Copas rate on release (PNC) Previous convictions (PNC) Previous convictions squared (PNC) Previous severe convictions (PNC) Previous severe convictions squared (PNC) Index offence type Violent (PNC) Index offence type Sexual (PNC) Index offence type Acquisitive (PNC) Index offence type Drug (PNC) Index offence type Robbery (PNC) Family member has been convicted of a non-motoring offence (SPCR) Family member has been in prison (SPCR)
Dynamic risk factors Agree Want to stop offending (SPCR) Disagree Want to stop offending (SPCR) Agree Want to get help to stop offending (SPCR) Disagree Want to get help to stop offending (SPCR) General attitude to offending CRIME-PICS (SPCR) Anticipation of reoffending CRIME-PICS (SPCR) Victim hurt denial CRIME-PICS (SPCR) Evaluation of crime as worthwhile CRIME-PICS (SPCR) Used class A drugs in the four weeks before custody (SPCR) Used class BC drugs in the four weeks before custody (SPCR) Injected illegal drugs in the four weeks before custody (SPCR) Transient accommodation prior to custody (SPCR) Sleeping rough prior to custody (SPCR) Educational (qualifications) attainment (SPCR) Was in paid work in the four weeks before custody (SPCR)
Note Data source is listed in parentheses
16
A range of dynamic risk factors found to be incrementally predictive of general reconviction in addition to static risk factors (Howard 2009) have also been included These factors are motivation to stop offending attitudes to offending drug use accommodation educational attainment and employment status before custody
Many of the factors are categorical and so have been converted to indicator variables (also known as lsquodummy variablesrsquo) For instance ethnicity has been split into five separate yesno variables ndash one for each individual ethnic background The full set of variables is listed in Box 21
Matching algorithm
A variety of propensity score matching methods are available to adjust for pre-treatment observable differences between the treatment group and untreated groups each best suited to particular types of data The algorithm developed to match the control group for this evaluation and the motivation underlying its choice are briefly explained here The propensity score matching analysis was undertaken in the Stata statistical software programme using the psmatch2 module (Leuven and Sianesi 2003)
First a logistic regression was used to predict the probability of treatment (the propensity score) for all treated and untreated prisoners based on their observed characteristics The resultant propensity scores summarise each prisonerrsquos characteristics on all matching variables in one measure that is used as the basis for matching
Since the sample consists of comparatively few treated prisoners in relation to many untreated ones radius matching (Dehejia and Wahba 2002) was chosen as the matching algorithm This technique uses the maximum amount of data whilst the imposition of a tolerance threshold avoids the risk of bad matches All untreated prisoners whose propensity score falls within a defined range of tolerance (radius calliper) of a treated prisonerrsquos score are matched to that prisoner A radius calliper of 005 of a standard deviation of the logit of the propensity score has been used46 The benefit of radius matching is lower propensity score variances than would result from one-to-one nearest-neighbour matching As a further step to ensure comparability prisoners with propensity scores outside the range of values where both treated and untreated observations are found were dropped a requirement of the technique47
46 The appropriate calliper size is not clearly prescribed by the empirical literature (Smith and Todd 2005) The inventors of propensity score matching Rosenbaum and Rubin (1983) recommend a calliper of a quarter of a standard deviation of the logit of the propensity score as appropriate in general This would be equivalent to 0236 in this case which was tried and rejected due to returning a weak match quality The radius calliper size was iteratively reduced until the point (005) that a further reduction would drop treated observations Sensitivity analysis was carried out on radius calliper size (00001 to 025) which found that the results were not highly sensitive to calliper size
47 Technically this is referred to as imposing common support
17
With a choice-based sample such as this participants are likely to be over-sampled relative to their frequency in the eligible prisoner population (Caliendo and Kopeinig 2005) To control for this over-sampling matching was undertaken on the odds-ratio of the propensity scores (Heckman and Smith 1995)48
The outcome of this methodology was that each ETS participant was matched with a synthetic control observation composed of the average of all non-participants sufficiently similar (propensity score within the radius limit) to the participant
Parsimonious PSM model
Due to the limited size of the sample there was a focus on parsimony (simplification without any loss of power) in development of the model Dropping insignificant variables from the logistic regression gains degrees of freedom (fewer parameters to be estimated) and observations (due to missing values on some variables) without losing explanatory power The final model was reduced to a smaller set of 16 variables listed in Box 2249 To check that this process did not introduce a bias the correlation of the propensity scores of the reduced model and the full model was checked and found to be greater than 091
Box 22 Parsimonious Propensity Score Matching model matching variables
Programme suitability criteria Need Sum of OASys Section 11 Thinking and Behaviour scores (OASys) Risk OASys total weighted score (OASys) Motivation to change behaviour (OASys) Problems with readingwritingnumeracy (OASys) Problems with current psychiatric problems (OASys)
Static risk factors Gender (SPCR) Age (SPCR) Index offence type Violent (PNC) Index offence type Sexual (PNC) Index offence type Acquisitive (PNC) Index offence type Drug (PNC) Index offence type Robbery (PNC)
Dynamic risk factors Agree Want to get help to stop offending (SPCR) Victim hurt denial CRIME-PICS (SPCR) Used class BC drugs in the four weeks before custody (SPCR) Sleeping rough prior to custody (SPCR)
Note Data source is listed in parentheses
48 Caliendo and Kopeinig (2005) note that weights are required to consistently estimate the probability of treatment when sampling is choice based However as an odds-ratio estimated using incorrect weights will be a scalar multiple of the true odds-ratio (a monotonic transformation of the propensity score) matching may proceed on the odds-ratio even when sampling weights are unknown (Heckman and Smith 1995)
49 The full model (including all 42 pre-selected variables) was run successively with the least significant variable dropped each time using the stepwise function with a confidence limit for retention equal to 01
18
Assessment of control match quality
The robustness of the calculated treatment effect depends on the quality of the match achieved The degree of lsquosimilarityrsquo between the treatment and the control group was tested using a range of statistical techniques (namely standardised bias reduction and t-tests of equality of means) Please refer to the Technical Annex for the detailed results of these tests
In summary equality of means testing confirmed no statistically significant difference between the treatment and matched control group across all 42 characteristics pre-selected as being predictive of ETS participation and reconviction risk The control group is therefore well matched on the pre-selected matching characteristics with a similar expected reconviction rate as the treatment group allowing robust estimation of the treatment effect
Whilst every effort has been made to remove the selection bias it is possible that an unmeasured bias may still remain uncontrolled Further checks on average sentence length and participation on other accredited OBP interventions (using the Offending Behaviour Programme Interventions Database) were carried out which revealed some differences between the treatment and control groups It was found that the average sentence length of the treatment group (975 days) was longer than that for the control group (727 days) It was also found that 6 of the treatment group and 2 of the control group had been on another accredited OBP during the SPCR sentence though both proportions are small
19
3 Results
The results of this evaluation show that ETS was effective in bringing about a statistically significant reduction in both the reconviction rate and frequency of reoffending in the year following release from custody for 257 prison-based participants on ETS between 2006 and 2008 Almost identical results were found for completers (when drop-outs were excluded) though the significance of the reduction in the one-year reconviction rate was lost due the reduction in the size of the sample
A secondary finding of the research was a low adherence to the suitability targeting criteria among those prisoners that actually received the programme over the period This suggests that the programme was not always administered to the most suitable group of prisoners which may have limited the effectiveness of the programme in reducing reoffending
The research findings are presented and summarised in this section The conclusions and policy-relevant implications of the results are discussed in the Implications section More detail on the results is contained in the Technical Annex
Effectiveness of ETS in reducing reoffendingThe impact of the programme is identified as the average causal effect of participation on the ETS programme (the treatment) on reconviction outcomes As the control group was created using a methodologically robust propensity score matching model and established as valid by tests on the quality of the match it represents a good proxy for the counterfactual untreated outcome of the treatment group50 The observed difference in the average conviction rates between the treatment and control groups may therefore be considered the causal effect of the ETS intervention known as the average treatment effect on the treated (ATT)
All programme participants
The reconviction rate and the frequency of reoffending of all ETS participants (including non-completers) was found to be significantly lower than the matched control group in the year following release from custody No statistically significant impact was found on the severe offence reconviction rate
The average reconviction outcomes of the treated and untreated groups and the difference between them (ATT with t-stat) are presented in Table 31 The results show that the proportion of programme participants that were reconvicted within one year (272) was six percentage points below that observed in the control group (335) and that this difference was statistically significant A statistically significant difference was also found in terms of frequency of reoffending as participants (607 offences) were reconvicted of 60 fewer recordable offences within one year per 100 released prisoners than the control group (1208 offences)
50 Testing revealed no statistical difference in the mean values of the two groups across all 42 variables pre-selected as being predictive of ETS participation and reconviction risk
20
These are the noteworthy results of this analysis as they show that ETS was successful in significantly reducing both the reconviction rate and frequency of reoffending of participants After contradictory evidence and debate the results seem to support Friendship et alsrsquo (2002) positive results though the magnitude of the effect is smaller Whilst the severe offences reconviction rate was lower in the treatment group the difference was not significant This is not surprising given the programme is not designed to target severe offending and the rarity of severe offences
Table 31 Impact of ETS on reconviction outcomes of the SPCR sample
SampleReconviction rate
(one-year)
Reoffences per 100 released prisoners
(one-year)
Severe offences reconviction rate
(one-year)Average outcomes
Treatment group (n=257) 272 607 08Matched control group 335 1208 09
Treatment effect (ATT) -62a -601b -01(t-stat) -204 -547 -013Note Average treatment effect on the treated (ATT) is the difference between the mean outcome of the
treatment group and the matched control groupa Statistically significant at the 005 levelb Statistically significant at the lt0001 level
Completers only
The evaluation has followed the lsquointention-to-treatrsquo approach in general (consistent with Colledge et al 1999) However not all participants completed the programme ndash 8 of the treated final sample did not complete the course As in previous evaluations non-completers have been removed from the analysis to test any sensitivity of the treatment effect to programme completion
21
The results are summarised in Table 32 showing an almost identical though not statistically significant reduction in the rate of reconviction for completers when drop-outs were excluded The loss in significance was most likely due to the reduction in the size of the sample The statistically significant reduction in the frequency of reoffending was retained with an almost identical effect size No significant impact was again found for the severe offences reconviction rate
Table 32 Impact of ETS on reconviction outcomes of the SPCR sample completers only
SampleReconviction rate (one-
year)
Reoffences per 100 released prisoners
(one-year)
Severe offences reconviction rate
(one-year)Average outcomesTreatment group (n=237) 270 599 08Matched control group 335 1208 09Treatment effect (ATT) -65 -609a 00(t-stat) -156 -321 -001Note Average treatment effect on the treated (ATT) is the difference between the mean outcome of the
treatment group and the matched control groupa Statistically significant at the 001 level
Completers of intervention programmes are often found to have a stronger effect than non-completers This may be due to a self-selection effect whereby completers may be more motivated or have fewer needs or have a lower risk of reoffending Therefore effectiveness of the programme should not be evaluated against completers alone whose outcomes may have been better even without the intervention Rather the true effect of the intervention as it is used in practice should be evaluated by considering all participants both completers and non-completers (Colledge et al 1999 National Offender Management Service 2005) Accordingly more weight should be placed on the findings for all participants
Assessment of suitability targeting
The HM Prison Service guidance to assess suitability for ETS and other OBPs notes
ldquoOne of the principles of effective interventions is appropriate targeting An offender is more likely to benefit from participation in an offending behaviour programme if heshe demonstrates levels of risk and need that are appropriate for the particular interventionrdquo51
To facilitate appropriate targeting HM Prison Service designed a set of risk need and responsivity suitability criteria to identify those prisoners that were most suitable for the programme These criteria were set out in the Context section Strict adherence to these criteria should ensure that ETS is appropriate and relevant for all participants
51 HM Prison Service (2007) p3
Figure 31 Need and risk score distributions for non-participant and ETS participant groups with suitability thresholds
Need Sum of OASys Section 11 Thinking and Behaviour scores (OASys)
Risk OASys total weighted score (OASys)
0
5
10
15
4 7 140
5
10
15
4 7 140 0
Per
cen
t
Per
cen
t
0
5
10
15
50 100 1500
Per
cen
t
0
5
10
15
50 100 1500
Per
cen
t
Non-participant
Non-participant
ETS participant
ETS participant
22
Need and risk requirements
The need and risk52 profiles of the participant and non-participant groups53 were compared The comparison is presented graphically in Figure 31 with needrisk ETS programme suitability thresholds marked with vertical red lines (observations to the right of the line rate as lsquosuitablersquo for ETS) In the case of need the dual thresholds of 7 or 4 (with at least one individual score of 2 indicating significant problems) are marked A single vertical red line for 56 and above is marked as the risk threshold
With regard to both need and risk the participant and non-participant distributions follow a broadly similar pattern The majority of the non-participant group had a needrisk profile that would have made them suitable for ETS This is good news for matching purposes as it means that similar prisoners at the pre-treatment stage could have been treated or remained untreated More importantly a lot of prisoners in the participant group fall to the left of the red vertical line in both charts ndash and so rated as lsquonot strictly suitablersquo for ETS
52 As the OASys data do not include OGRS2 it has only been possible to define suitability with respect to the OASys total weighted score This is not necessarily invalid as the guidance notes ldquoIf an offender passes the cut-off on one but not both scales [ie OGRS2 and OASys total weighted score] you can consider them to be suitable to progress to the needs assessment stagerdquo HM Prison Service (2007) p5
53 This analysis is based on the full sample of 3512 (316 participants and 3196 non-participants) and not the treatment and matched control groups
23
Further investigation of the need and risk (OASys total weighted score) scores revealed that only 58 of the participant group were suitable for ETS (met both need and risk requirements simultaneously) while 49 of the non-participant group would have been suitable (Table 33)
Table 33 ETS suitability criteria fulfilment non-participant and ETS participant groups
SuitabilityNon-participants ETS participants
N N Not strictly suitable for ETS 1629 510 134 424Strictly suitable for ETS 1567 490 182 576Total 3196 1000 316 1000NoteSuitability is defined with reference to risk (an OASys score 56 or above) and need (a total score of 7
or above and a total score of 4 or above with at least one individual score of 2 (indicating significant problems))
It is important to note some caveats to this analysis The suitability criteria for ETS have been reviewed and changed over time The ETS start dates of participants in the SPCR sample stretch from March 2006 to September 2008 whilst the specification of the risk tool as OGRS2 or OASys was only introduced in August 2007 (the Sentencing Planning Risk Predictor was used previously) Similarly this period covers a time when both a local semi-structured interview and the OASys assessment were sources of need information for programme staff As the programme did not itself change substantially during this period later indicators of suitability for the intervention are retrospectively relevant from a targeting perspective54 though the retrospective application of the later indicators provides no reflection of the accuracy in the application of the targeting criteria during the earlier period
There is also some flexibility allowed in the application of the suitability criteria individuals with an OASys or OGRS2 score within three points below the cut-off may be progressed to ETS and special considerations are made for indeterminate sentence prisoners and sex offenders The original indicator of criminogenic needs the ETS Semi-Structured Interview has gradually been replaced by OASys Section 11 scores as confirmed in later guidance (National Offender Management Service 2009)55
54 Assuming that amendments to the suitability identification tools over time represent improvements in targeting later indicators applied retrospectively are likely to provide a better indicator of suitability than older indicators Accordingly this analysis provides no reflection on the selection process of treatment managers at the time but rather a pure view of suitability of treated participants
55 later guidance also specified definition of risk groups suitable for ETS with reference to OGRS3 (score 50 or above)
24
Readiness and responsivity criteria
A similar comparative analysis was also carried out for the readiness and responsivity criteria The HM Prison Service (2007) guidance lists assessment items in the lsquoResponsivity Assessmentrsquo and lsquoReadiness Assessmentrsquo sections including intellectual ability literacy dyslexia mental and physical health psychopathic traits motivation to change behaviour disability However the guidance does not specify the data variables or the thresholds to be used To investigate these readiness and responsivity criteria the lsquoexclusion criteriarsquo for general offending programmes from the OASys Manual56 were used
Again the profiles of the participant and non-participant groups57 were compared with a similar pattern emerging Figure 32 plots the distributions side-by-side with the readiness and responsivity thresholds marked by red vertical lines (this time profiles to the right of the line are not strictly suited to ETS) As with the need and risk profiles the two distributions are unexpectedly similar with a number of the participant group recorded as lsquonot at allrsquo motivated or having lsquosignificant problemsrsquo More specifically of the participant group
109 were scored as lsquonot at allrsquo motivated to change their behaviour
74 had lsquosignificant problemsrsquo with readingwritingnumeracy
61 had lsquosignificant problemsrsquo with learning difficulties
103 had lsquosignificant problemsrsquo with current psychological problemsdepression and
58 had lsquosignificant problemsrsquo with current psychiatric problems
56 OASys development team (2001) p16757 This analysis is based on the full sample of 3512 (316 participants and 3196 non-participants) and not the
treatment and matched control groups
Figure 32 Readiness and responsivity score distributions for non-participant and ETS participant groups with suitability thresholds
0
20
40
60
Verymotivated
Quitemotivated
Not at all0
20
40
60
Verymotivated
Quitemotivated
Not at all
Per c
ent
Per c
ent
Non-participant ETS participant
Motivation (OASys)
0
50
100
No problems Someproblems
Significantproblems
Per c
ent
Non-participant
Problems with readingwritingnumeracy (OASys)
0No problems Some
problemsSignificantproblems
Per c
ent
ETS participant
020
6080
No problems Someproblems
Significantproblems
Per c
ent
Non-participant
Problems with learning difficulties (OASys)
0No problems Some
problemsSignificantproblems
Per c
ent
ETS participant
0
20
40
60
No problems Someproblems
Significantproblems
Per c
ent
Non-participant
Problems with current psychological probelmsdepression (OASys)
0
20
40
60
No problems Someproblems
Significantproblems
Per c
ent
ETS participant
4020
6080
40
50
100
0
50
100
No problems Someproblems
Significantproblems
Per c
ent
Non-participant
Problems with current psychological probelms (OASys)
0
50
100
No problems Someproblems
Significantproblems
Per c
ent
ETS participant
25
26
Analysis of treatment effect by suitability
To investigate the importance of adherence to the need and risk principles in participant targeting the reconviction outcomes of the treatment group were also analysed according to participant suitability As before suitability is defined with reference to risk (an OASys score 56 or above) and need (a total score of 7 or above and a total score of 4 or above with at least one individual score of 2 (indicating significant problems)) As there is some flexibility in the application of the criteria this is termed lsquostrict suitabilityrsquo
Of the treatment group 164 (64) were strictly suitable for ETS whereas 1404 (56) of the control group were strictly suitable The remainder of each group were not strictly suitable
The results of the analysis (Table 34) show that the one-year reconviction rate for strictly suitable treated offenders (172) was lower than that for not strictly suitable ones (329) Similarly the frequency of reoffending of strictly suitable offenders (398 reoffences) was also lower than that of the not strictly suitable offenders (726 reoffences)
Table 34 Impact of ETS on reconviction outcomes of the SPCR sample lsquonot strictly suitablersquo and lsquostrictly suitablersquo participants only
SampleReconviction rate
(one-year)
Reoffences per 100 released prisoners
(one-year)
Severe offences reconviction rate
(one-year)Not strictly suitable (n=93) 329 726 12Strictly suitable (n=164) 172 398 -
Caveats and limitations of the researchIt is important to note that the number of ETS-treated prisoners provided by SPCR (257) is a limited sample falling in the lower range of previous evaluation samples (from 114 to 2195 participants) as a result of a low intervention rate and missing data filters Results based on limited samples may not be reliable indicators of the wider population and in some cases the sample sizes may be too small to detect differences which may actually exist58 Tests of statistical significance are carried out on the results of this evaluation for this reason The low intervention rate means that there is a large pool (2514) from which to form a well-balanced matched control group It should also be noted that all SPCR data are self-reported
Whilst every effort has been made to remove the selection bias it is possible that an unmeasured bias may still remain uncontrolled Further checks revealed some differences between the treatment and control groups It was found that the average sentence length of the treatment group (975 days) was longer than that for the control group (727 days)
58 This caveat is more relevant where no effect is detected ndash in which case the correct conclusion may be that the sample was insufficient to detect an effect rather than that the intervention had no effect For a discussion of sample size detection power and reliability of reconviction rates please see Harper and Chitty (2004) p8
27
The possibility of multiple intervention participation has not been controlled for as the sample size did not permit such analysis Examination revealed that 6 of the treatment group and 2 of the control group had been on another accredited OBP during the SPCR sentence though both proportions are small It is also possible that prisoners may have participated on non-accredited OBPs or a substance misuse treatment during their SPCR sentence period which may have contributed to the observed treatment effect If the rate of participation in other programmes was higher in the ETS treated group the estimated treatment effect of ETS would represent a pooled effect of all treatments received and so may be overstated If the rate of participation in other programmes was higher in the ETS control group the estimated treatment effect of ETS may be understated
This evaluation has been limited to using one-year conviction rates as two-year reconviction outcome data will only become available in 12 monthsrsquo time Thus it is not possible at this time to conclude on the duration of the impact of ETS ndash that is to say whether the observed one-year effect endures two years on from release or whether it dissipates (as found by Cann et al 2003) It is planned to conduct a follow-up study of reconviction at the two-year post-release stage (please see the Further research section)
28
4 Implications
This report has evaluated the effectiveness of the prison-based ETS programme by linking participation to reconviction outcomes The evaluation results show that ETS was successful in significantly reducing both the reconviction rate and frequency of general reoffending of participants The most important implications of these results are outlined below
This research has added some clarity to the discordant evidence base on the effectiveness of ETS by improving on key methodological limitations of previous evaluation studies This provides a more solid evidence base of support on which to build intervention-based policy
The most important message for policy makers is that ETS the most frequently delivered offending behaviour programme over the past decade did work to significantly reduce reoffending in the short term (one year) at least This result should assist policy makers to prioritise and focus operational resources towards the most productive intervention efforts Though ETS has since been replaced by the Thinking Skills Programme (TSP) the results of this evaluation demonstrate that cognitive-behavioural OBPs can work to significantly reduce reoffending for offenders released from prison The findings are likely to be particularly relevant for TSP which represents a refresh and update of ETS in line with advances in theory and practice However these specific findings cannot be generalised to other cognitive-behavioural intervention programmes Each programme has its own distinct objectives delivery methods and targeted characteristics and so would require a discrete evaluation
For practitioners although the findings on reduced reconviction rates are encouraging and reflect a job well done there are also lessons to be learned A low adherence to the risk need and responsivity suitability criteria was found among those prisoners that actually received the programme between 2006 and 2008 This suggests that the programme was not always administered to the most suitable prisoners Given that research supports the importance of risk need and responsivity targeting for effective treatment (Hollin 1995 Taxman and Thanner 2006 Palmer et al 2009 Gendreau et al 2009 Andrews and Bonta 2010) and the finding of lower reconviction rates for strictly suitable prisoners this may have limited the effectiveness of the programme in reducing reoffending The fact that a significant reduction in reconviction was found in spite of this finding suggests that a stricter application of the targeting criteria might further enhance the effectiveness of the programme National Offender Management Service practitioners report that the accuracy of targeting has improved over time meaning that a similar evaluation of ETS in a later period (post-2008) or TSP might find an even more significant effect
29
Future researchers may be able to draw on the methodology developed for this research as a methodological blueprint for further evaluations The findings of this research could be complemented and enhanced by addressing some of the outstanding evidence gaps framed by a set of research questions and proposed research designs set out in the Further research section
30
5 Further research
Whilst this evaluation has added some clarity to the evidence base on the effectiveness of general cognitive-behavioural programmes evidence gaps remain These gaps are defined by the research questions listed below with suggested research designs that could provide robust answers to complement and enhance the findings in this paper
Duration of the reduction in reoffending effect Does ETS have a lasting impact or will the observed one-year effect have dissipated after two years as found by Cann et al (2003) It is planned to conduct a follow up study of the treated and matched control individuals of this evaluation two years after their release applying the same methodology to investigate the duration of the ETS impact in one yearrsquos time
Cost-effectiveness of the programme Is the cost of ETS provision justified by the observed reduction in reoffending The reduction in reoffences estimated in this evaluation could be used as the basis for a cost-benefit analysis of the ETS programme Linking the estimated reduction in reoffending to estimates of the social cost of criminal offences the avoided social costs of crime (the benefit) could be compared to data on the cost of ETS provision (estimated to be in the region of pound2000 per prisoner)59
Generalisability of the findings Would the observed effect be verified or even more significant in a larger sample By repeating the evaluation methodology but replacing SPCR variables with OASys data variables where possible the full population of prisoners undertaking ETS could be evaluated The downside to this approach is the compromised choice of data for dynamic risk factors Other benefits would be the ability to employ more matching variables and being able to evaluate some of the smaller accredited programmes This research could also be used as a methodological blueprint to evaluate substance misuse intervention programmes
What works for whom What are the characteristics of the prisoners that benefit most from ETS and other OBPs The difference in reconviction outcome for each treated prisoner compared with the matched control could be regressed on a range of treated prisonersrsquo characteristics to identify which kinds of offenders under which circumstances most benefit from undertaking ETS
The effectiveness of TSP Does ETSrsquos replacement the Thinking Skills Programme (TSP) have a lesser similar or greater impact on reconviction A similar evaluation methodology could be used to evaluate the effectiveness of TSP in reducing reconviction outcomes though this would not be possible for a couple of years as TSP was only introduced in 2009
59 Social Exclusion Unit (2002) p 81
31
Database of research findings What does the evidence base tell us about the effectiveness of ETS Policy makers are often influenced by the latest study to be published rather than the synthesised message of the collective body of evaluation research The formation and maintenance of a database of outcome studies could be used for systematic reviews and meta-analytic analysis to produce a comprehensive review of ETS efficacy to inform and guide policy makers and practitioners (for example see Tong and Farrington 2006)
In the longer term samples of the other cohort studies being conducted by MoJ ndash the probation sample of the Offender Management Community Cohort Study (OMCCS) and the juvenile offenders sample of the Juvenile Cohort Study (JCS) ndash could be similarly linked to the same management information databases (for example OASys) as linked to SPCR in this evaluation When combined with OASys assessment data and viewed as a collective database this would be the richest known single evidence base in existence on the static and dynamic factors involved in offending behaviour
32
6 Additional resources
Readers interested in researching further the issues and topics probed in this paper further may want to consult the following publications websites and other useful sources of information
HM Prison Service Offender Behaviour Programmes (OBPs) httpwwwhmprisonservicegovukadviceandsupportbeforeafterreleaseoffenderbehaviourprogrammes
Ministry of Justice Research httpwwwjusticegovukpublications
National Offender Management Service httpwwwjusticegovukaboutnomshtm
Correctional Services Accreditation Panel httpwwwjusticegovukaboutcorrectional-services-accreditationhtm
National Reducing Reoffending Delivery plan (National Offender Management Service (NOMS) website) httpnomsjusticegovuk
Social Exclusion Unit (Cabinet Office) httpwwwcabinetofficegovuksocial_exclusion_task_forceaspx
Office for National Statistics (ONS) httpwwwstatisticsgovuk
33
7 References
Andrews D A and Bonta J (2010) The psychology of criminal conduct (5th ed) New Providence NJ LexisNexis Matthew Bender
Blackburn R (1972) lsquoDimensions of hostility and aggression in abnormal offendersrsquo Journal
of Consulting and Clinical Psychology 38 pp 20ndash26
Caliendo M and Kopeinig S (2005) lsquoSome Practical Guidance for the Implementation of Propensity Score Matchingrsquo IZA Discussion Papers Series Discussion Paper No 1588 Institute for the Study of Labor (IZA)
Cann J Falshaw L Nugent F and Friendship C (2003) Understanding What Works
cognitive accredited skills programmes for adult men and young offenders Research Findings 226 London Home Office
Cann J (2006) Cognitive skills programmes impact on reducing reconviction among a
sample of female prisoners Home Office Research Study 276 London Home Office
Clarke A Simmonds R and Wydall S (2004) Delivering cognitive skills programmes in
prison a qualitative study Home Office Research Study 242 London Home Office
Clarke D A (2000) Theory Manual for Enhanced Thinking Skills Prepared for the Joint Prison Accreditation Panel London Home Office
Colledge M Collier P and Brand S (1999) Crime reduction programme and constructive
regimes in prison Programmes for offenders Guidance for evaluators Crime reduction programme ndash guidance note 2 Research Development and Statistics Directorate London Home Office
Copas J and Marshall P (1998) lsquoThe offender group reoffending scale A statistical reoffending score for use by probation officersrsquo Applied Statistics 47(1) 159ndash171
Dehejia RH and Wahba S (2002) lsquoPropensity Score-Matching Methods for Nonexperimental Causal Studiesrsquo Review of Economics and Statistics February 2002 Vol 84 No 1 pp 151ndash161
Eysenck S B and McGurk B J (1980) lsquoImpulsiveness and venturesomeness in a detention centre populationrsquo Psychological Reports 47 pp 1299ndash1306
34
Falshaw L Friendship C Travers R and Nugent F (2003) Searching for what works An
evaluation of cognitive skills programmes Home Office Research Study 206 London Home Office
Falshaw L Friendship C Blud L Travers R and Nugent F (2004) lsquoSearching for what works HM Prison Service accredited cognitive skills coursesrsquo British Journal of Forensic
Practice 6 (2) pp 3ndash13
Friendship C Blud L Erikson M and Travers R (2002) An evaluation of cognitive
behavioural treatment for prisoners Home Office Research Study 161 London Home Office
Frude N Honess T and Maguire M (1994) CRIME-PICS II Manual Cardiff Michael and Associates
Gendreau P Smith P and Theacuteriault YL (2009) lsquoChaos theory and correctional treatment Common sense correctional quackery and the law of fartcatchersrsquo Journal of Contemporary
Criminal Justice 25 384ndash396
Harper G and Chitty C (eds) (2004) The impact of corrections on re-offending A review of
lsquoWhat Worksrsquo (3rd ed) Home Office Research Study No 291 London Home Office
Heckman J and Smith J (1995) rsquoAssessing the Case for Social Experimentsrsquo Journal of
Economic Perspectives 9 85ndash110
HM Prison Service (2007) Assessing Suitability for Offending Behaviour Programmes Risk
Need amp Responsivity Guidance for Treatment Managers Offending Behaviour Programmes Unit HM Prison Service
Home Office (2006) A Five Year Strategy for Protecting the Public and Reducing Re-
offending London The Stationary Office
Hollin C R (1995) lsquoThe meaning and implications of ldquoprogramme integrityrdquorsquo In J McGuire (Ed) What works Reducing reoffending Guidelines from Research and Practice (pp 195ndash208) Chichester England John Wiley and Sons
Howard P (2009) Improving prediction of re-offending using the Offender Assessment
System Research Summary 209 London Ministry of Justice Available at httpwwwjusticegovukpublicationsdocsoasys-research-summary-02-09pdf
Howard P Francis B Soothill K and Humphreys L (2009) OGRS 3 the revised Offender
Group Reconviction Scale Research Summary 709 London Ministry of Justice
35
Leuven E and Sianesi B (2003) psmatch2 Stata module to perform full Mahalanobis and
propensity score matching common support graphing and covariate imbalance testing httpideasrepecorgcbocbocodes432001html version 315 2 May 2009
Mak A S (1991) lsquoPsychosocial control characteristics of delinquents and nondelinquentsrsquo Criminal Justice and Behaviour 18 (3) pp 297ndash303
McDougall C Clarbour J Perry A and Bowles R (2009) Evaluation of HM Prison Service
Enhanced Thinking Skills Programme Report on the implementation of a randomised
controlled trial London Ministry of Justice
McDougall C Clarbour J Perry A and Bowles R (2009) Evaluation of HM Prison Service
Enhanced Thinking Skills Programme Report on the outcomes of a randomised controlled
trial London Ministry of Justice
Ministry of Justice (2009) The Correctional Services Accreditation Panel Report 2008-
2009 Available at httpwwwjusticegovukpublicationsdocscorrectional-services-report-20080-09pdf
Ministry of Justice (2010) Reoffending of adults results from the 2008 cohort ndash England and
Wales Ministry of Justice Statistics bulletin London Ministry of Justice Available at httpwwwjusticegovukpublicationsdocsreoffending-adults-2008-cohortpdf
National Offender Management Service (2005) Understanding research methods and
findings lsquoWhat Worksrsquo Briefing 305 Available at httprdshomeofficegovukrdspdfs05wwbn3pdf
National Offender Management Service (2009) Suitability for Accredited Interventions Risk
Need amp Responsivity Targeting Criteria for Offender Managers and Treatment Managers
Interventions and Substance Misuse Group Directorate of Commissioning and Operational Policy National Offender Management Service May 2009
OASys Data Evaluation and Analysis Team O-DEAT (2010) OASys caveats notes and
limitations ndash layered OASys (May 10)
OASys development team (2001) Offender Assessment System OASys User Manual OASys Manual V2 Crown Copyright 2002
Palmer EJ McGuire J Hatcher RM Hounsome JC Bilby CAL and Hollin CR (2009) lsquoAllocation to offending behavior programs in the English and Welsh probation servicersquo Criminal Justice and Behavior 36 909ndash922
36
Rosenbaum P R and Rubin D B (1983) lsquoThe Central Role of the Propensity Score in Observational Studies for Causal Effectsrsquo Biometrika 70 41ndash55
Smith J and Todd P (2005) rsquoDoes matching overcome LaLondersquos critique of nonexperimental estimatorsrsquo Journal of Econometrics Elsevier vol 125(1-2) pages 305ndash353
Social Exclusion Unit (2002) Reducing re-offending by ex-prisoners Available from httpwwwcabinetofficegovukmediacabinetofficesocial_exclusion_task_forceassetspublications_1997_to_2006reducing_reportpdf
Stewart D (2008) The problems and needs of newly sentenced prisoners results from a
national survey Ministry of Justice Research Series 1608 Published online at httpwwwjusticegovukpublicationsresearch2008htm
Taxman FS and Thanner M (2006) lsquoRisk need and responsivity (RNR) It all dependsrsquo Crime and Delinquency 52 28ndash51
Tong LSJ and Farrington DP (2006) lsquoHow effective is the ldquoReasoning and Rehabilitationrdquo programme in reducing reoffending A meta-analysis of evaluations in four countriesrsquo Psychology Crime and Law 12 3ndash24
37
Appendix 1 Technical annex
Full set of matching variables (covariates)Programme suitability criteriaoasys_need Need Sum of OASys Section 11 Thinking and Behaviour scores
(OASys)oasys_score Risk OASys total weighted score (OASys)oasys_motiv Motivation to change behaviour (OASys)oasys_litnum Problems with readingwritingnumeracy (OASys)oasys_lrndiff Problems with learning difficulties (OASys)oasys_psychgl Problems with current psychological problemsdepression (OASys)oasys_psychtr Problems with current psychiatric problems (OASys)
Static risk factorsspcr_genderf Gender Female (SPCR)spcr_age Age (SPCR)spcr_marst_mar Marital status Married (SPCR)spcr_marst_lvp Marital status Living with a partner (SPCR)spcr_ethnic_mix Ethnicity Any Mixed background (SPCR)spcr_ethnic_as Ethnicity Any Asian background (SPCR)spcr_ethnic_bl Ethnicity Any Black background (SPCR)spcr_ethnic_oth Ethnicity Any Other background (SPCR)pnc_copas Copas rate on release (PNC)pnc_ttlprevconv Previous convictions (PNC)pnc_ttlprevconv2 Previous convictions squared (PNC)pnc_ttlprevconvsev Previous severe convictions (PNC)pnc_ttlprevconvsev2 Previous severe convictions squared (PNC)pnc_index_vio Index offence type Violent (PNC)pnc_index_sxl Index offence type Sexual (PNC)pnc_index_acq Index offence type Acquisitive (PNC)pnc_index_drg Index offence type Drug (PNC)pnc_index_rob Index offence type Robbery (PNC)spcr_famconv Family member has been convicted of a non-motoring offence
(SPCR)spcr_fampris Family member has been in prison (SPCR)
Dynamic risk factorsspcr_motivstoffy Agree Want to stop offending (SPCR)spcr_motivstoffn Disagree Want to stop offending (SPCR)spcr_motivhlpstoffy Agree Want to get help to stop offending (SPCR)spcr_motivhlpstoffn Disagree Want to get help to stop offending (SPCR)spcr_attg General attitude to offending CRIME-PICS (SPCR)spcr_atta Anticipation of reoffending CRIME-PICS (SPCR)spcr_attv Victim hurt denial CRIME-PICS (SPCR)spcr_atte Evaluation of crime as worthwhile CRIME-PICS (SPCR)spcr_drug4wka Used class A drugs in the four weeks before custody (SPCR)spcr_drug4wkbc Used class BC drugs in the four weeks before custody (SPCR)spcr_drug4wkinj Injected illegal drugs in the four weeks before custody (SPCR)spcr_accomtrans Transient accommodation prior to custody (SPCR)spcr_accomrough Sleeping rough prior to custody (SPCR)spcr_edqual Educational (qualifications) attainment (SPCR)spcr_job4wk Was in paid work in the four weeks before custody (SPCR)
38
Logistic regression model
Table A1 Logistic regression model of prisoner characteristics influencing probability of treatment (ETS) and reconviction outcomes
Coefficient Standard error P-valueETS suitabilityNeed (thinking and behaviour) 0082 0027 0002Risk (OASys score) 0005 0003 0069Motivation to change behaviour (OASys) 0323 0122 0008Problems with readingwritingnumeracy -0303 0116 0009Problems with current psychiatric problems 0335 0131 0011
GenderMale Reference
categoryFemale 0736 0177 0000
Age -0030 0009 0000
Index offence typeOther Reference
categoryViolent 1223 0296 0000Sexual 2094 0389 0000Acquisitive 0243 0313 0438Drug 1192 0309 0000Robbery 1552 0329 0000
Motivation to stop offendingDisagreed with ldquoI want to get help to stop offendingrdquo all other responses
Reference category
Agreed with ldquoI want to get help to stop offendingrdquo
0315 0091 0001
Offending-related attitudesVictim hurt denial 0078 0026 0003
Drug useUsed Class BC drugs in the 4 weeks before custody
-0195 0150 0193
AccommodationStable accommodation prior to custody Reference
categoryTemporary accommodation prior to custody Reference
categorySleeping rough prior to custody -0709 0409 0083
Constant -4933 0554 0000Notes Number of observations = 2771 (257 treated 2514 untreated) Pseudo R2 = 00958 LR
chi2(16)=16397 probgtchi2 00000
39
Calculation of the average treatment effect on the treated (ATT)
Outcome measures
pnc_reconvind Indicator of reconviction within one yearpnc_reofffreq Frequency of proven reoffending within one yearpnc_reconvindsev Indicator of severe offence reconviction within one year
Table A2 Average treatment effect on the treated (ATT)
Variable Sample Treated Controls(Difference)
ATTa
Standard error t-stat
pnc_reconvind Unmatched 0272 0370 (-0098) 0031 -311Matched ATT 0272 0335 -0062 0031 -204
pnc_reofffreq Unmatched 0607 1422 (-0815) 0182 -447Matched ATT 0607 1208 -0601 0110 -547
pnc_reconvindsev Unmatched 0008 0007 (0001) 0006 011Matched ATT 0008 0009 -0001 0006 -013
a ATT is the difference between the mean outcome of the treatment group and the matched control group
40
Tests of covariate balancing
Table A3 Means standardised bias reduction and t-tests for equality of means in the treatment and control groups before and after matching
Variable SampleMean
bias bias
reductiont-test
Treatment Control t pgttoasys_need Unmatched 7381 6703 203 299 000
Matched 7381 7269 34 834 039 070oasys_score Unmatched 77335 75658 48 070 049
Matched 77335 77060 08 836 009 093oasys_motiv Unmatched 1210 1141 110 165 010
Matched 1210 1201 15 864 017 087oasys_litnum Unmatched 0350 0416 -102 -150 013
Matched 0350 0361 -17 830 -020 084oasys_lrndiff Unmatched 0187 0184 05 008 094
Matched 0187 0180 13 -1510 014 089oasys_psychgl Unmatched 0486 0426 89 139 017
Matched 0486 0499 -19 791 -020 084oasys_psychtr Unmatched 0237 0142 194 327 000
Matched 0237 0224 27 861 028 078spcr_genderf Unmatched 0214 0124 243 408 000
Matched 0214 0199 39 838 041 068spcr_age Unmatched 28008 30216 -238 -349 000
Matched 28008 28364 -38 839 -046 065spcr_marst_mar Unmatched 0070 0093 -84 -123 022
Matched 0070 0075 -19 776 -023 082spcr_marst_lvp Unmatched 0296 0256 90 140 016
Matched 0296 0250 103 -149 117 024spcr_ethnic_mix Unmatched 0062 0038 110 187 006
Matched 0062 0040 100 92 112 026spcr_ethnic_as Unmatched 0047 0041 28 044 066
Matched 0047 0035 57 -1056 067 050spcr_ethnic_bl Unmatched 0035 0065 -137 -189 006
Matched 0035 0063 -127 76 -145 015spcr_ethnic_oth Unmatched 0000 0004 -89 -101 031
Matched 0000 0002 -51 431 -076 045pnc_copas Unmatched -0902 -0880 -27 -040 069
Matched -0902 -0910 10 644 011 091pnc_ttlprevconv Unmatched 10946 12746 -163 -227 002
Matched 10946 11580 -57 648 -069 049pnc_ttlprevconv2 Unmatched 212140 314300 -133 -163 010
Matched 212140 257960 -60 552 -082 041pnc_ttlprevconvsev
Unmatched 0132 0146 -34 -050 062Matched 0132 0165 -79 -1300 -087 039
pnc_ttlprevconvsev2
Unmatched 0163 0209 -57 -074 046Matched 0163 0239 -95 -657 -102 031
41
Variable SampleMean
bias bias
reductiont-test
Treated Control t pgttpnc_index_vio Unmatched 0327 0245 182 288 000
Matched 0327 0311 36 804 039 070pnc_index_sxl Unmatched 0078 0040 162 286 000
Matched 0078 0078 -03 982 -003 098pnc_index_acq Unmatched 0175 0303 -302 -430 000
Matched 0175 0195 -46 847 -057 057pnc_index_drg Unmatched 0218 0195 57 088 038
Matched 0218 0211 16 718 018 086pnc_index_rob Unmatched 0144 0065 261 469 000
Matched 0144 0133 37 858 037 071spcr_famconv Unmatched 0463 0403 121 185 006
Matched 0463 0433 60 503 067 050spcr_fampris Unmatched 0396 0334 129 200 005
Matched 0396 0354 88 322 098 033spcr_motivstoffy Unmatched 1720 1670 93 139 017
Matched 1720 1719 01 985 002 099spcr_motivstoffn Unmatched 0016 0010 40 065 052
Matched 0016 0007 58 -453 069 049spcr_motivhlpstoffy
Unmatched 1346 1085 338 498 000Matched 1346 1304 55 836 065 052
spcr_motivhlpstoffn
Unmatched 0097 0164 -166 -234 002Matched 0097 0107 -25 850 -031 076
spcr_attg Unmatched 58131 57962 23 033 074Matched 58131 58212 -11 518 -012 091
spcr_atta Unmatched 18393 18516 -50 -073 047Matched 18393 18547 -63 -257 -068 050
spcr_attv Unmatched 11825 10907 321 454 000Matched 11825 11681 50 843 061 054
spcr_atte Unmatched 13996 13809 60 092 036Matched 13996 13871 40 331 045 066
spcr_drug4wka Unmatched 0381 0419 -77 -118 024Matched 0381 0408 -55 289 -062 053
spcr_drug4wkbc Unmatched 0494 0499 -10 -015 088Matched 0494 0486 16 -637 019 085
spcr_drug4wkinj Unmatched 0109 0155 -135 -194 005Matched 0109 0143 -99 265 -114 025
spcr_accomtrans Unmatched 0054 0052 12 019 085Matched 0054 0058 -17 -360 -018 085
spcr_accomrough Unmatched 0027 0054 -138 -188 006Matched 0027 0032 -23 835 -030 076
spcr_edqual Unmatched 1965 1893 36 054 059Matched 1965 1915 25 308 028 078
spcr_job4wk Unmatched 0346 0331 32 049 062Matched 0346 0331 32 17 036 072
Figure A1 Risk OASys total weighted score (OASys) by treatment and control groups
Risk OASys weighted score
8
6
4
2
Per c
ent
Control
0
8
6
4
2
Per c
ent
Treatment
050 100 150 50 100 150
42
Distributions of matching variables by treatment and control groups
Table A4 Need Sum of OASys Section 11 Thinking and Behaviour scores (OASys) by treatment and control groups
Summed scoreControl Treatment
n Valid n Valid 0 111 44 44 1 04 041 89 35 35 6 23 232 126 50 50 11 43 433 156 62 62 13 51 514 219 87 87 24 93 935 234 93 93 19 74 746 262 104 104 23 89 897 281 112 112 37 144 1448 253 101 101 30 117 1179 211 84 84 29 113 11310 184 73 73 15 58 5811 147 58 58 18 70 7012 117 47 47 17 66 6613 62 25 25 7 27 2714 62 25 25 7 27 27Missing 0 00 0 00Total 2514 1000 1000 257 1000 1000Note Control group frequencies are unweighted (a weighted average of controls within the radius calliper is
used in the matching algorithm)
43
Table A5 Motivation to change behaviour (OASys) by treatment and control groups
RatingControl Treatment
n Valid n Valid Not at all 367 146 146 28 109 109Quite motivated 1426 567 567 147 572 572Very motivated 721 287 287 82 319 319Missing 0 00 0 00Total 2514 1000 1000 257 1000 1000Note Control group frequencies are unweighted (a weighted average of controls within the radius calliper is
used in the matching algorithm)
Table A6 Problems with readingwritingnumeracy (OASys) by treatment and control groups
ExtentControl Treatment
n Valid n Valid No problems 1735 690 690 187 728 728Some problems 512 204 204 50 195 195Significant problems 267 106 106 20 78 78Missing 0 00 0 00Total 2514 1000 1000 257 1000 1000Note Control group frequencies are unweighted (a weighted average of controls within the radius calliper is
used in the matching algorithm)
Table A7 Problems with learning difficulties (OASys) by treatment and control groups
ExtentControl Treatment
n Valid n Valid No problems 2185 869 869 226 879 879Some problems 195 78 78 14 54 54Significant problems 134 53 53 17 66 66Missing 0 00 0 00Total 2514 1000 1000 257 1000 1000Note Control group frequencies are unweighted (a weighted average of controls within the radius calliper is
used in the matching algorithm)
Table A8 Problems with current psychological problemsdepression (OASys) by treatment and control groups
Extent Control Treatment
n Valid n Valid No problems 1693 673 673 162 630 630Some problems 572 228 228 65 253 253Significant problems 249 99 99 30 117 117Missing 0 00 0 00Total 2514 1000 1000 257 1000 1000Note Control group frequencies are unweighted (a weighted average of controls within the radius calliper is
used in the matching algorithm)
Figure A2 Age (SPCR) by treatment and control groups
8
6
4
2
0
Per
cen
t
20 40 60 80
8
6
4
2
0
Per
cen
t
20 40 60 80Age (SPCR)
Control Treatment
44
Table A9 Problems with current psychiatric problems (OASys) by treatment and control groups
ExtentControl Treatment
n Valid n Valid No problems 2244 893 893 211 821 821Some problems 184 73 73 31 121 121Significant problems 86 34 34 15 58 58Missing 0 00 0 00Total 2514 1000 1000 257 1000 1000Note Control group frequencies are unweighted (a weighted average of controls within the radius calliper is
used in the matching algorithm)
Table A10 Gender (SPCR) by treatment and control groups
GenderControl Treatment
n Valid n Valid Male 2203 876 876 202 786 786Female 311 124 124 55 214 214Missing 0 00 0 00Total 2514 1000 1000 257 1000 1000Note Control group frequencies are unweighted (a weighted average of controls within the radius calliper is
used in the matching algorithm)
Figure A3 Copas rate on release (PNC) by treatment and control groups
10
5
0-4 -2 0 2
Per c
ent
10
5
0-4 -2 0 2
Per c
ent
COPAS rate on release (PNC)
Control Treatment
45
Table A11 Marital status (SPCR) by treatment and control groups
StatusControl Treatment
n Valid n Valid Married 234 93 93 18 70 70Living with partner 642 255 256 76 296 296Other 1636 651 651 163 634 634Missing 2 01 0 00Total 2514 1000 1000 257 1000 1000Note Control group frequencies are unweighted (a weighted average of controls within the radius calliper is
used in the matching algorithm)
Table A12 Ethnicity (SPCR) by treatment and control groups
Ethnic groupControl Treatment
n Valid n Valid Any White background 2142 852 852 220 856 856Any Mixed background 96 38 38 16 62 62Any Asian background 103 41 41 12 47 47Any Black background 163 65 65 9 35 35Any Other background 10 04 04 0 00 00Missing 0 00 0 00Total 2514 1000 1000 257 1000 1000Note Control group frequencies are unweighted (a weighted average of controls within the radius calliper is
used in the matching algorithm)
Figure A4 Total previous convictions (PNC) by treatment and control groups
30
20
10
050 100 150 200
30
20
10
050 100 150 200
Per c
ent
Per c
ent
Previous convictions (PNC)
Control Treatment
46
Table A13 Previous severe convictions (PNC) by treatment and control groups
NumberControl Treatment
n Valid n Valid 0 2205 877 877 227 883 8831 265 105 105 26 101 1012 34 14 14 4 16 163 5 02 02 0 00 004 5 02 02 0 00 00Missing 0 00 0 00Total 2514 1000 1000 257 1000 1000Note Control group frequencies are unweighted (a weighted average of controls within the radius calliper is
used in the matching algorithm)
Table A14 Grouped index offence type (PNC) by treatment and control groups
Offence type grouping
Control Treatmentn Valid n Valid
Other 384 153 153 15 58 58Violent 616 245 245 84 327 327Robbery 163 65 65 37 144 144Sexual 100 40 40 20 78 78Acquisitive 761 303 303 45 175 175Drug 490 195 195 56 218 218Missing 0 00 0 00Total 2514 1000 1000 257 1000 1000Note Control group frequencies are unweighted (a weighted average of controls within the radius calliper is
used in the matching algorithm)
47
Table A15 Family member has been convicted of a non-motoring offence (SPCR) by treatment and control groups
ResponseControl Treatment
n Valid n Valid No 1486 591 597 137 533 537Yes 1003 399 403 118 459 463Missing 25 10 2 08Total 2514 1000 1000 257 1000 1000Note Control group frequencies are unweighted (a weighted average of controls within the radius calliper is
used in the matching algorithm)
Table A16 Family member has been in prison (SPCR) by treatment and control groups
ResponseControl Treatment
n Valid n Valid No 1658 660 666 154 599 604Yes 831 331 334 101 393 396Missing 25 10 2 08Total 2514 1000 1000 257 1000 1000Note Control group frequencies are unweighted (a weighted average of controls within the radius calliper is
used in the matching algorithm)
Table A17 Agree Want to stop offending (SPCR) by treatment and control groups
ResponseControl Treatment
n Valid n Valid Other 101 40 40 9 35 35Agree 627 249 249 54 210 210Strongly agree 1786 710 710 194 755 755Missing 0 00 0 00Total 2514 1000 1000 257 1000 1000Note Control group frequencies are unweighted (a weighted average of controls within the radius calliper is
used in the matching algorithm)
Table A18 Disagree Want to stop offending (SPCR) by treatment and control groups
ResponseControl Treatment
n Valid n Valid Other 2498 994 994 254 988 988Disagree 7 03 03 2 08 08Strongly disagree 9 04 04 1 04 04Missing 0 00 0 00Total 2514 1000 1000 257 1000 1000Note Control group frequencies are unweighted (a weighted average of controls within the radius calliper is used in the matching algorithm)
Figure A5 General attitude to offending CRIME-PICS (SPCR) by treatment and control groups
15
10
5
020 40 60 80
Per c
ent
Control15
10
5
020 40 60 80
Per c
ent
Treatment
General attitude to offending CRIME-PICS (SPCR)
48
Table A19 Agree Want to get help to stop offending (SPCR) by treatment and control groups
ResponseControl Treatment
n Valid n Valid Other 725 288 288 40 156 156Agree 851 339 339 88 342 342Strongly agree 938 373 373 129 502 502Missing 0 00 0 00Total 2514 1000 1000 257 1000 1000Note Control group frequencies are unweighted (a weighted average of controls within the radius calliper is
used in the matching algorithm)
Table A20 Disagree Want to get help to stop offending (SPCR) by treatment and control groups
ResponseControl Treatment
n Valid n Valid Other 2174 865 865 237 922 922Disagree 268 107 107 15 58 58Strongly disagree 72 29 29 5 19 19Missing 0 00 0 00Total 2514 1000 1000 257 1000 1000Note Control group frequencies are unweighted (a weighted average of controls within the radius calliper is
used in the matching algorithm)
49
Table A21 Anticipation of reoffending CRIME-PICS (SPCR) by treatment and control groups
ScoreControl Treatment
n Valid n Valid 8 2 01 01 0 00 009 1 00 00 0 00 0010 3 01 01 1 04 0411 6 02 03 0 00 0012 14 06 06 1 04 0413 27 11 11 4 16 1614 46 18 19 8 31 3315 113 45 48 9 35 3716 201 80 85 18 70 7417 276 110 116 30 117 12318 628 250 265 65 253 26619 371 148 156 44 171 18020 287 114 121 30 117 12321 145 58 61 13 51 5322 106 42 45 9 35 3723 71 28 30 5 19 2024 29 12 12 2 08 0825 17 07 07 2 08 0826 14 06 06 2 08 0827 7 03 03 1 04 0428 3 01 01 0 00 0029 1 00 00 0 00 0030 6 02 03 0 00 00Missing 140 56 13 51Total 2514 1000 1000 257 1000 1000Note Control group frequencies are unweighted (a weighted average of controls within the radius calliper is
used in the matching algorithm)
50
Table A22 Victim hurt denial CRIME-PICS (SPCR) by treatment and control groups
ScoreControl Treatment
n Valid n Valid 3 69 27 27 2 08 084 47 19 19 2 08 085 59 23 23 1 04 046 136 54 54 6 23 237 104 41 41 4 16 168 155 62 62 14 54 549 129 51 51 20 78 7810 241 96 96 19 74 7411 133 53 53 8 31 3112 664 264 264 77 300 30013 257 102 102 38 148 14814 196 78 78 22 86 8615 324 129 129 44 171 171Missing 0 00 0 00Total 2514 1000 1000 257 1000 1000Note Control group frequencies are unweighted (a weighted average of controls within the radius calliper is
used in the matching algorithm)
Table A23 Evaluation of crime as worthwhile CRIME-PICS (SPCR) by treatment and control groups
ScoreControl Treatment
n Valid n Valid 4 1 00 00 1 04 045 5 02 02 1 04 046 16 06 06 2 08 087 26 10 11 2 08 088 68 27 28 4 16 169 96 38 39 9 35 3510 177 70 72 21 82 8311 197 78 80 13 51 5112 270 107 109 31 121 12213 235 93 95 24 93 9414 328 130 133 33 128 13015 266 106 108 24 93 9416 276 110 112 27 105 10617 229 91 93 24 93 9418 115 46 47 20 78 7919 94 37 38 12 47 4720 70 28 28 6 23 24Missing 45 18 3 12Total 2514 1000 1000 257 1000 1000Note Control group frequencies are unweighted (a weighted average of controls within the radius calliper is
used in the matching algorithm)
51
Table A24 Used class A drugs in the four weeks before custody (SPCR) by treatment and control groups
ResponseControl Treatment
n Valid n Valid No 1460 581 581 159 619 619Yes 1054 419 419 98 381 381Missing 0 00 0 00Total 2514 1000 1000 257 1000 1000Note Control group frequencies are unweighted (a weighted average of controls within the radius calliper is
used in the matching algorithm)
Table A25 Used class BC drugs in the four weeks before custody (SPCR) by treatment and control groups
ResponseControl Treatment
n Valid n Valid No 1259 501 501 130 506 506Yes 1255 499 499 127 494 494Missing 0 00 0 00Total 2514 1000 1000 257 1000 1000Note Control group frequencies are unweighted (a weighted average of controls within the radius calliper is
used in the matching algorithm)
Table A26 Injected illegal drugs in the four weeks before custody (SPCR) by treatment and control groups
ResponseControl Treatment
n Valid n Valid No 2121 844 845 228 887 891Yes 389 155 155 28 109 109Missing 4 02 1 04Total 2514 1000 1000 257 1000 1000Note Control group frequencies are unweighted (a weighted average of controls within the radius calliper is
used in the matching algorithm)
Table A27 Accommodation prior to custody (SPCR) by treatment and control groups
TypeControl Treatment
n Valid n Valid Stable accommodation 2247 894 894 236 918 918Transient accommodation 130 52 52 14 54 54Sleeping rough 137 54 54 7 27 27Missing 0 00 0 00Total 2514 1000 1000 257 1000 1000Note Control group frequencies are unweighted (a weighted average of controls within the radius calliper is
used in the matching algorithm)
52
Table A28 Educational (qualifications) attainment (SPCR) by treatment and control groups
Highest qualification attained
Control Treatment
n Valid
n Valid
No qualifications 1099 437 441 99 385 388Other qualifications (incl overseas) 66 26 26 7 27 27O levelGCSE grade D-G (or similar qualification) 372 148 149 47 183 184O levelGCSE Grades A-C (or similar qualification) 507 202 204 61 237 239Trade apprenticeships 87 35 35 6 23 24AAS levels 220 88 88 21 82 82Higher education diploma 57 23 23 11 43 43First degreepostgraduate degree 70 28 28 2 08 08Higher degreepostgraduate degree 13 05 05 1 04 04Missing 23 09 2 08Total 2514 1000 1000 257 1000 1000Note Control group frequencies are unweighted (a weighted average of controls within the radius calliper is
used in the matching algorithm)
Table A29 Was in paid work in the four weeks before custody (SPCR) by treatment and control groups
ResponseControl Treatment
n Valid n Valid No 1681 669 669 168 654 654Yes 832 331 331 89 346 346Missing 1 00 0 00Total 2514 1000 1000 257 1000 1000Note Control group frequencies are unweighted (a weighted average of controls within the radius calliper is
used in the matching algorithm)
Table A30 Reconviction indicator one-year (PNC) by treatment and control groups
IndicatorControl Treatment
n Valid n Valid No 1584 630 630 187 728 728Yes 930 370 370 70 272 272Missing 0 00 0 00Total 2514 1000 1000 257 1000 1000Note Control group frequencies are unweighted (a weighted average of controls within the radius calliper is
used in the matching algorithm)
53
Table A31 Frequency of reoffending one-year (PNC) by treatment and control groups
IndicatorControl Treatment
n Valid n Valid 0 1584 630 630 187 728 7281 495 197 197 54 210 2102 203 81 81 11 43 433 117 47 47 3 12 124 53 21 21 1 04 045 33 13 13 1 04 046 8 03 03 0 00 007 7 03 03 0 00 008 6 02 02 0 00 009 1 00 00 0 00 0010 2 01 01 0 00 0011 2 01 01 0 00 0013 0 00 00 0 00 0015 1 00 00 0 00 0018 1 00 00 0 00 0032 1 00 00 0 00 00Missing 0 00 0 00Total 2514 1000 1000 257 1000 1000Note Control group frequencies are unweighted (a weighted average of controls within the radius calliper is
used in the matching algorithm)
54
Table A32 Frequency of reoffences one-year (PNC) by treatment and control groups
IndicatorControl Treatment
n Valid n Valid 0 1584 630 630 187 728 7281 272 108 108 31 121 1212 181 72 72 15 58 583 117 47 47 15 58 584 91 36 36 2 08 085 65 26 26 3 12 126 42 17 17 2 08 087 38 15 15 1 04 048 32 13 13 1 04 049 20 08 08 0 00 0010 19 08 08 0 00 0011 15 06 06 0 00 0012 11 04 04 0 00 0013 6 02 02 0 00 0014 6 02 02 0 00 0015 5 02 02 0 00 0016 1 00 00 0 00 0017 0 00 00 0 00 0018 1 00 00 0 00 0019 1 00 00 0 00 0020 1 00 00 0 00 0021 2 01 01 0 00 0022 2 01 01 0 00 0025 1 00 00 0 00 0039 1 00 00 0 00 00Missing 0 00 0 00Total 2514 1000 1000 257 1000 1000Note Control group frequencies are unweighted (a weighted average of controls within the radius calliper is
used in the matching algorithm)
Table A33 Severe offences reconviction indicator one-year (PNC) by treatment and control groups
IndicatorControl Treatment
n Valid n Valid No 2496 993 993 255 992 992Yes 18 07 07 2 08 08Missing 0 00 0 00Total 2514 1000 1000 257 1000 1000Note Control group frequencies are unweighted (a weighted average of controls within the radius calliper is
used in the matching algorithm)
Ministry of Justice Research Series 1910Evaluation of the impact of the HM Prison Service Enhanced Thinking Skills programme on reoffendingThis research examined the impact of the Enhanced Thinking Skills (ETS) programme on the one-year reconviction outcomes of 257 prison-based participants between 2006 and 2008 Radius propensity score matching was used to match a comparison group that had no statistically significant difference (at the means) to the treatment group on any matching characteristic ETS was found to significantly reduce both the reconviction rate (six percentage points) and frequency (60 reoffences per 100 released prisoners) of general reoffending of participants No statistically significant impact was found on the severe offences reconviction rate Almost identical impacts were found for completers A stronger reduction in reconviction was found for participants meeting the suitability criteria Though the programme has been shown to be effective in practice the findings suggest that a stricter application of the targeting criteria might have further enhanced the effectiveness of the programme
ISBN 978 1 84099 418 6copy Crown copyrightProduced by the Ministry of JusticeAlternative format versions of this report are available on requestE-mail researchjusticegsigovukhttpwwwjusticegovukpublicationsresearchhtm
4
Previous evaluation researchPrevious evaluations of ETS have produced mixed results on the effectiveness of the programme Early findings of a statistically significant and large reduction in reconviction were later tempered by research studies finding little or no statistical differences between ETS participants and non-participants Results have also differed depending on whether starters or completers are included and whether a one- or two-year reconviction outcome is used Several reasons for the disparity in findings have been speculated with all studies citing the potentially important role of unmeasured dynamic factors This is a shortcoming that this study sought to address
All reconviction studies to date have used a retrospective quasi-experimental research design that compares the reconviction outcomes of the ETS treatment group with those of a comparison group matched on a narrow range of static risk factors
The first evaluation of ETS by Friendship et al (2002) examined the pre-accreditation ETS programme delivered by HM Prison Service (from 1992 to 1996) The research found statistically significant reductions in the two-year reconviction rate of male ETS participants Specifically participation in either ETS or Reasoning and Rehabilitation (RampR)22 was found to significantly reduce the two-year reconviction rates for medium-to-low (by 14 percentage points) and medium-to-high (11 percentage points) risk offenders No significant effect was found for either low or high risk offenders
Subsequent studies of the post-accreditation programme could not reproduce these positive results In contrast Falshaw et al (2003 2004) failed to find a statistically significant difference in the two-year reconviction rates of adult ETS participants (1996 to 1998) in any of the OGRS risk bands whether programme non-completers were included or excluded A similar evaluation by Cann et al (2003) investigated the temporal effects of ETS by studying both the one- and two-year reconviction rates for male adult and young offenders (1998 to 2000) Whilst no difference was detected for all adult males who had started the programme a significant reduction in the one-year rate was found for males (26 percentage points on average and 70 for high risk offenders) and young offenders (36 percentage points on average) who had completed the programme However these differences were not maintained a further year on with no significant effect found for any group at the two-year post-release stage suggesting that the impact of ETS on reoffending behaviour may be short-lived
The possibility of a differential gender impact of ETS was considered by Cann (2006) who assessed the impact of ETS on a group of female (only) participants ndash the only evaluation to consider female prisoners The results were similar to the post-accreditation evaluations of ETS delivered to males with no significant differences in the one- and two-year reconviction rates of female ETS participants
22 The researchers note that ldquo[a]s Reasoning and Rehabilitation (RampR) and Enhanced Thinking Skills (ETS) share the same theoretical basis the programmes are analysed alongside one anotherrdquo (Friendship et al 2002 pp2-3)
5
More recently a randomised control trial (RCT) evaluation of ETS in HM Prison Service by McDougall et al (2009) focused on the short-term impact of the programme They found that ETS was effective in reducing impulsivity and changing the self-reported offending-related thinking of adult male prisoners No examination of reconviction outcomes was possible however as ethical considerations of treatment denial meant that the comparison group also participated in an ETS programme later in their sentence prior to release Nonetheless as impulsivity has been linked to reoffending (Blackburn 1972 Eysenck and McGurk 1980 Mak 1991) this finding suggests an expected reduction in recidivism for participants This result supports earlier findings (Clarke et al 2004) that ETS participation brought short-term non-reconviction benefits including increased self-confidence developed interpersonal skills and improved prisoner behaviour The nature of prisonersrsquo motivations for participating in a cognitive behaviour programme was also found to be a key factor in assessing the effectiveness of the programme (Clarke et al 2004)
Rationale for this evaluation
Existing evaluation evidence on ETS is therefore inconclusive (McDougall et al 2009) Reflecting on the disagreement of later findings with those of Friendship et al (2002) it has been suggested (Falshaw et al 2003 Cann et al 2003) that the early large significant impact may have reflected an initial enthusiasm of programme tutors motivation of participants andor the focused nature of delivery prior to its accreditation and later expansion23 Such an explanation would if true create doubts about the efficacy of OBP accreditation and roll-out of programmes across the Prison Service
Alternatively another factor may drive the variability of evaluation results Whilst disagreeing in terms of research findings all previous evaluations of ETS note one common methodological limitation as a possible explanation of their findings the inability to control for potential differences in dynamic risk factors (Friendship et al 2002 Falshaw et al 2003 Cann et al 2003 Cann 2006) As very little data have been available to date on dynamic factors previous studies have been constrained to matching based on a narrow range of static risk factors alone (for example age gender ethnicity criminal career variables) Consequently potential selection bias due to differences in unmeasured dynamic risk between the participants and their comparators has not been controlled Such bias could plausibly account for the variation of the evidence to date
The key advantage and added value of this research is the opportunity to match using dynamic risk factors in addition to static ones afforded by SPCR prisoner survey and OASys data Some of the dynamic risk factors on which data are available are motivation to stop offending attitudes to crime substance misuse physical and mental health educational
23 For a qualitative examination of the process of ETS implementation and delivery in a prison context please see Clarke et al (2004)
6
attainment and skills level employment status accommodation status marital status and needs The prisoner survey also allows matching on additional rich static risk factors (for example family contact with the criminal justice system)
A further limitation of previous evaluations has been the reliance on Offenders Index data to assess reconviction which may not be the most complete source of such information (Falshaw et al 2003) The current study improves on this aspect by drawing its reconviction data from the Police National Computer the official source of criminal conviction histories
7
2 Approach
The research methodology of the study covering data sources final sample details and analysis techniques employed is summarised and explained in this section More details on technical points are provided in the Technical Annex
This evaluation assessed the impact of the HM Prison Service ETS programme on reoffending using a retrospective quasi-experimental research design that compared the one-year reconviction outcomes of participants with those of a matched comparison group that had not participated in the programme The research set out to test the hypothesis that ETS has no significant impact on the reconviction rates of programme participants
Based on the SPCR prisoner sample and incorporating data from the Offending Behaviour Programme Interventions Database Offender Assessment System (OASys) and the Police National Computer (PNC) the assembled dataset provides a profile of prisonersrsquo characteristics needs experiences and outcomes of unprecedented detail The combined dataset comprises more than 1800 variables on a final sample of 3277 prisoners
The comparison (matched control)24 group was generated using a statistical matching technique such that it is sufficiently lsquosimilarrsquo25 to the ETS participant (treatment) group to permit valid comparison The effect of this technique is to balance the programme suitability offending-risk characteristics and criminogenic needs across the treatment and matched control groups A strong match has been achieved taking account of 42 variables meaning that the treatment and control groups are statistically lsquosimilarrsquo or unbiased such that we would expect to observe the same reoffending outcomes for each group on average Any observed difference in the average reconviction rates between the two groups may therefore be assumed to be the causal effect of the ETS intervention known as the average treatment effect on the treated (ATT)
The analysis was carried out on an lsquointention-to-treatrsquo basis (consistent with Colledge et al 1999) whether the participant completed the ETS programme or not though analysis of completers only has also been run for completeness
24 A note on terminology used for the remainder of the report following the evaluation literature the term lsquotreatment grouprsquo is used in this report to refer to those prisoners in the sample that received ETS in the relevant sentence period Conversely the term lsquountreatedrsquo is used to distinguish those prisoners in the sample that did not receive ETS in the relevant sentence period The term lsquocontrolrsquo (and lsquomatched controlrsquo) is reserved to refer to the untreated prisoners that form part of the matched control group following propensity score matching
25 lsquoSimilarrsquo is defined as having mean values that are not statistically different from those of the participant group across a set of variables pre-selected as being simultaneously predictive of the probability of treatment and the probability of reconviction
8
Data sources and sample detailsAs the source of the novel dynamic risk factor data the base sample for the analysis is that of the SPCR prisoner survey The SPCR dataset is supplemented by merging to three further data sources data on which prisoners received ETS in what time period from the Offending Behaviour Programme Interventions Database data on the assessed need and risk of prisoners from the Offender Assessment System (OASys) and criminal history and reconviction data from the Police National Computer Each data source is described in turn
SPCR prisoner survey (wave 1)
Surveying Prisoner Crime Reduction (SPCR) is a large-scale longitudinal cohort study of nearly 4000 newly-sentenced adult prisoners in England and Wales comprising four waves of interviews conducted between 2005 and 2009
This evaluation uses wave 1 data only Wave 1 conducted at the point of reception into prison describes the characteristics and needs26 of the cohort of prisoners demographics background and family offending history educational achievements employment status physical and mental health substance misuse accommodation and relationships attitudes27 needs to help prevent them from reoffending and plans and expectations for the future (upon release from prison) All data are self-reported and as the survey responses relate to the start of the particular custodial sentence all responses are measured before any treatment could have commenced
Prisoners were selected from the Ministry of Justicersquos (MoJ) Inmate Information System (IIS) database and their current location found using MoJrsquos Local Inmate Data System (LIDS) The minimum sentence length accepted was one month due to the time taken to locate the prisoner and interview them and the maximum sentence length was four years to allow for a reasonable data-collection period Prisoners were recruited into the study on the basis of fully informed consent and ethical guidelines for social research were followed Prisoners were interviewed by specially trained researchers using computer-assisted (CAPI) questionnaires
Interview targets were set for every reception prison (except those with very low throughput) based on the proportional sizes of receptions at each prison Prison reception characteristics were found to be highly variable and targets were compiled using the most recent information available Over-sampling targets were calculated to allow for any difficulties in accessing prisoners Thus the interviews were drawn from 40 prisons from a possible 53 eligible prisons
26 The term lsquoneedsrsquo is used throughout to refer to a wide range of factors (associated with the pathways) which are generally understood to be related to offending sometimes known as ldquocriminogenic needsrdquo A summary of the general problems and needs of these newly sentenced prisoners has already been published (Stewart 2008)
27 Attitudes are measured using CRIME-PICS II (Frude et al 1994) a widely used and validated questionnaire-based instrument for examining and detecting changes in offendersrsquo attitudes to offending Special thanks are due to Jennifer Poyser in Offender Management Analytical Services at MoJ for the conversion of SPCR attitude question responses to CRIME-PICS II scores
9
The full sample (after removal of ineligible participants)28 at wave 1 was 3849 adult prisoners sentenced to between one month and four years29 This represents the base sample for this evaluation though the final sample will be smaller due to failed matches in database merging and data completion filters
Offending Behaviour Programme Interventions Database
To determine the treatment status of the base sample (that is which prisoners had received ETS during their sentence period) the SPCR wave 1 dataset was linked to the OBP prison interventions database compiled by the National Offender Management Service (NOMS) Rehabilitation Services Group30
The database is based on administrative records of interventions delivered to prisoners (71521 unique prisoner numbers) from 1994 to 2009 It covers accredited OBPs only including Controlling Anger and Learning how to Manage it (CALM) Cognitive Skills Booster (CSB) Cognitive Self Change Programme (CSCP) Enhanced Thinking Skills (ETS) Focus on Resettlement (FOR) Healthy Relationships Programme (HRP) Reasoning and Rehabilitation (RampR) Chromis JETS and Sex Offender Treatment Programme (SOTP)
When matched to the SPCR sample (by prisoner number) it was found that 449 (12) of the 3849 SPCR prisoners had received an accredited intervention The magnitude of this intervention rate was validated by comparison of total ETS programme participants and total prison population figures More specifically 371 (10) prisoners were identified as having participated in ETS within the SPCR sentence period All started the programme between March 2006 and September 200831 ETS was by far the most common OBP intervention delivered and the only individual programme with a sufficient number of participants to permit a statistical analysis of effectiveness
Offender Assessment System (OASys)
For verification of suitability for the programme and to allow matching of control prisoners based on these characteristics data are required on the risk and need of the prisoners in the sample This data requirement is fulfilled by the Offender Assessment System (OASys)
28 Twenty-eight participants were removed due to ineligibility Please see the SPCR Technical Report for more information
29 There are two sub-samples within SPCR Sample 1 (Reception Prisoners) is representative of the entire prison reception population (the lsquoflowrsquo into prison) at the time of sampling (n=1435) Sample 2 (Longer-term Prisoners) is a booster sample to reflect the higher proportion of longer-term prisoners in the prison population (the lsquostockrsquo of prisoners) (n=2414) Please see the SPCR Technical Report for more information This evaluation study uses the combined sample and does not distinguish between the two sub-samples That said ETS tends to be reserved for longer-term prisoners
30 Previously known as the Interventions amp Substance Misuse Group (ISMG)31 If a prisoner was recorded as receiving more than one ETS course in the SPCR sentence period the latest
start date was used
10
OASys is NOMSrsquos principal riskneed assessment and management tool for adult offenders in England and Wales and is used to assess suitability for ETS Introduced in 2001 OASys produces standardised assessments of offendersrsquo risks and needs by combining actuarial methods of prediction with structured professional judgement In terms of outputs OASys provides data on the likelihood of reconviction criminogenic factors (need) and risk of harm
The SPCR sample was matched to the OASys database by PNC number All OASys assessments completed for the prisoners in the SPCR sample subject to data completion criteria32 were provided by the OASys Data Evaluation and Analysis Team (O-DEAT) numbering some 2956433 Nonetheless as OASys assessments are not mandatory and the coverage of OASys is not universal an OASys assessment is available for only 3512 prisoners (316 of which were treated)
With an average of eight assessments provided per prisoner the one OASys assessment relevant to the instance of ETS participation was selected for each prisoner The method of selection differed for treated and untreated prisoners As the start date of ETS is known for each participant the most recent assessment prior to the start date was selected As there is no start date for the untreated group the OASys assessment completed closest (before or after) to the SPCR sentence prison reception date was selected
Police National Computer
Criminal conviction history and reconviction data were obtained from the Police National Computer (PNC) The SPCR sample was matched to the PNC database (June 2010 snapshot) using personal identifiers (surname forenames gender date of birth) returning 3615 valid matches34 Respondents must have been released for a minimum of one and a half years (allowing one year to reoffend and six months to be convicted) to be included in the matched sample Respondents that were deceased deported or had absconded were excluded from the sample
Final achieved sample details
Following merging of the four datasets 2771 of the 3849 full SPCR sample (and 257 of the 371 ETS participants) had complete data a valid OASys assessment matched to the PNC and had no missing data on any variables employed in the statistical modelling The sample included 2405 (87) men and 366 (13) women
32 All assessments provided met the following minimum standards of data completion Each of the scored sections (1 to 12) within the core OASys assessment must have had at least four-fifths of their scored items completed ndash ensuring that each criminogenic need was assessed properly and In the risk of serious harm sections the screening must have been completed the decision whether to complete a full risk analysis should have been consistent with the information provided and the four ratings of risk of serious harm in the community must have been completed (OASys Data Evaluation and Analysis Team 2010)
33 All OASys assessments used in the analysis are pre-OASys release 431 (August 2009) assessments34 Special thanks are due to Richard Boorman in Offender Management Analytical Services at MoJ for matching
the SPCR sample to the PNC and completing the reconviction analysis
11
The participant sample comprised 257 (9 of the final sample) treated prisoners who started ETS between March 2006 and September 2008 This includes 20 (8 of all treated) participants that did not complete the course a similar proportion observed in previous studies (Friendship et al 2002 Falshaw et al 2003 Cann et al 2003 Cann 2006) The remaining 2514 prisoners did not undertake ETS which provides a reasonable pool from which to select a matched control group35
Outcome measuresTo assess programme effectiveness the impact of ETS is measured with reference to the one-year reconviction outcomes of participants and comparators To reflect the fact that a successful outcome for ETS could include no reconviction (general andor severe) or a reduction in the frequency of reoffending three separate measures of proven reoffending36 are examined defined as follows
reconviction rate (one-year) binary (yesno) indicator of whether the offender was convicted of a recordable offence that was committed within the 12-month period after release from the SPCR custodial sentence
reoffending frequency (one-year) continuous measure of how many recordable offences the offender was convicted of that were committed within the 12-month period after release from the SPCR custodial sentence (note that there may be more than one offence per conviction) and
severe offence reconviction rate (one-year) binary (yesno) indicator of whether the offender was convicted of a severe offence that was committed within the 12-month follow-up period after release from the SPCR custodial sentence The designation of an offence as lsquoseverersquo follows a standard definition under which approximately 150 of the 3000 Home Office offence codes are defined as severe37
Evaluation research designTo evaluate the impact of ETS it would be desirable to compare each treated prisonerrsquos reconviction outcome after treatment with what it would have been without treatment The latter is of course not observable ndash a treated individual cannot have an untreated outcome ndash and so a proxy must be created
35 It is possible that prisoners (participants and non-participants) may have participated in other intervention programmes accredited (for example another OBP or substance misuse treatment) andor non-accredited (of varying quality) during their SPCR sentence period Analysis of the level of participation on other accredited OBPs by the treatment group and matched control groups is presented later in this section
36 An offender is said to have committed a proven reoffence if the offender receives a conviction (by a caution or guilty verdict) at court for the reoffence The reoffence must have been committed within the one-year follow up period and the conviction must follow either within that one-year follow up or in a further 6 months which is to allow time for the offence to be proven at court
37 Severe offence types include violence against the person (murder attempted murder manslaughter wounding) sexual offences (sexual assault rape sexual activity with a minor or a person with a mental disorder abuse of children through prostitution and pornography trafficking for sexual exploitation) aggravated vehicle taking and death by dangerous drink or drug driving A full list of severe offence types is available in lsquoAppendix G List of most serious (severe) offencesrsquo of Ministry of Justice (2010)
12
Due to the active selection mechanism for ETS treatment (see suitability criteria in section 1) it is likely that prisoners selected for treatment differ on average from untreated prisoners even before treatment commences ETS participants should be characterised by a medium-to-high reconviction risk and a high level of criminogenic needs whereas non-participants should have a profile that is more reflective of the general prison population This is known as selection bias For this reason any difference observed in a simple comparison of the average outcome of the treatment group with that of the untreated group could be explained by factors other than the intervention treatment It is important therefore to remove as much of the selection bias as possible between the treatment group and comparison groups prior to comparison of the average outcomes The Propensity Score Matching (Rosenbaum and Rubin 1983) statistical technique has been developed for this very purpose
A primer on Propensity Score Matching
Whilst only a Randomised Control Trial (RCT)38 can ensure a random distribution of any unobserved sources of potential bias ethical and practical considerations can mean that RCT is not an easy-to-use methodology to evaluate the impact of interventions on reconviction rates
Instead Propensity Score Matching (PSM) has been selected to estimate the causal treatment effect of ETS39 On the Scientific Methods Scale adapted for reconviction studies (Harper and Chitty 2005 National Offender Management Service 2005) PSM rates as a level 4 research design ldquothat controls for bias by using the most robust method of matching individuals on all variables that affect participation in the intervention as well as all variables that affect outcomerdquo40 As differences in the variables influencing the treatment and the outcome are controlled for after the treatment intervention the approach is defined as a retrospective quasi-experimental design
The basic idea of PSM is to select a group of untreated individuals that are statistically lsquosimilarrsquo to the group of treated individuals across the set of relevant observed characteristics measured at the pre-treatment (and pre-allocation) stage41 Once the group is well matched (little or no statistical difference in the means of the matching variables) to the treatment group it is an adequate control group to generate the proxy untreated outcome Differences between the outcomes of the treated and untreated groups can then be attributed to the intervention
38 ldquoAn RCT compares outcomes when the intervention is used to outcomes without the intervention or with an alternative (seen in the control group) In an RCT participants are randomly allocated to an intervention or a control group which differs systematically in the type or amount of the intervention received The groups are otherwise equivalent because all other differences are randomly distributedrdquo (National Offender Management Service 2005 p2)
39 In the lsquoScientific Methods Scale adapted for reconviction studiesrsquo (National Offender Management Service 2005) a five-level lsquostandard of researchrsquo scale (5 representing the highest standard) of methodologies to evaluate the impacts of an intervention on reoffending and other offence-related outcomes propensity score matching rates as a level 4 research design (RCT is the only level 5 method) Level 4 is defined as ldquoComparison group matched to intervention group on theoretically relevant factors eg risk of reconviction (well-matched comparison group)rdquo (National Offender Management Service 2005 p3)
40 National Offender Management Service (2005) p 341 Specifically PSM matches individuals based on their probability (propensity score) of participating in the
intervention programme given their observed characteristics
13
Matching methodology
The matching methodology used to generate the matched control group comprises five components suitability filter pre-selected matching variables matching algorithm the parsimonious PSM model and assessment of the match quality Consultation on the methodology employed was undertaken with analyst and policy colleagues at MoJ and NOMS
Suitability filter of potential control matches
The codification of the suitability criteria defining the prisoner needs and characteristics that determine selection into the programme presents the opportunity to control directly for selection bias Assuming that untreated prisoners satisfying the suitability criteria did not receive treatment due to practical barriers (for example ETS was not provided at the establishment the prisoner was participating on another programme or was movedreleased whilst on waiting list) non-participants could be filtered by the suitability criteria to yield an ETS-suitable pool of untreated potential control matches
Such a filter was successfully implemented though with an unexpected result As the OASys data provided did not include OGRS2 scores the risk requirement was assessed with respect to the OASys score This is not invalid as the guidance notes ldquoIf an offender passes the cut-off on one but not both scales [ie OGRS2 and OASys total weighted score] you can consider them to be suitable to progress to the needs assessment stagerdquo42
To ensure the relevance of the filter a cross-check was carried out by applying the same filter to the treatment group with the expectation of finding a high rate of compliance However this analysis revealed that a substantial proportion (up to 42) of ETS participants failed to satisfy even the basic need and risk requirements for ETS suitability43 This is the first noteworthy finding of this research and has important implications for the evaluation Full results are presented and discussed in the following Results section
The direct implication of this finding is that an explicit suitability criteria filter of the potential control pool would be unnecessarily restrictive seeing as the treatment group itself does not satisfy the criteria It also has an important implication for the potential effectiveness of the programme If the suitability criteria are designed so as to identify the individuals that are most likely to benefit from the intervention then a weak adherence to these suitability criteria would constrain the potential effectiveness that the intervention programme could actually achieve in practice (Andrews and Bonta 2010) This is an important point as a programme
42 HM Prison Service (2007) p543 It is important to note some caveats to this analysis (explained fully in the Results section) The specification
of the risk tool to OGRS2 or OASys was only introduced in August 2007 half-way through the period under analysis (March 2006 to September 2008) A secondary indicator of criminogenic needs the ETS Semi-Structured Interview was also used historically though emphasis was placed on the OASys Section 11 scores in the assessment of need There is also some flexibility allowed in the application of the suitability criteria individuals with an OASys or OGRS2 score within three points below the cut-off may be progressed to ETS and special considerations are made for indeterminate sentence prisoners and sex offenders
14
evaluation result of no statistically significant reduction in reconviction may actually be reflecting poor targeting rather than a poor programme
Pre-selected matching variables
Prior to undertaking the matching and outcome analysis a wide range of factors were identified as being the most important drivers of participation in the intervention and the reconviction outcome These variables have two functions First they form the basis of the full specification of the matching model Second the quality of the control group match is assessed by comparing its mean values with those of the treatment group on each one of these variables In addition to ETS suitability criteria and the standard static risk factors the list includes several dynamic risk factors unlike previous evaluations
The first group of factors identified are those that (should) determine the probability of treatment ndash the ETS suitability criteria level of criminogenic need risk of reconviction and responsivity and readiness criteria (motivation to change behaviour and whether the prisoner has problems with reading writing numeracy learning difficulties psychological problemsdepression or psychiatric problems)
The second group are static reconviction risk factors selected as the variables underpinning the OGRS3 score found to be a more accurate predictor of reconviction than OGRS2 and the Sentence Planning Risk Predictor (Howard et al 2009) Namely the individual static factors include age gender index offence type (explained below) the Copas rate44 sanctioning history (total previous convictions and previous severe convictions and their quadratics) Additional static risk factors from SPCR survey responses have also been included ethnicity (White Black Mixed Asian and Other background) marital status family criminal history
Every offence type has a distinct Home Office code of which there are more than 3000 which are grouped into 20 categories in the standardised OGRS classification After checking the distribution of the ETS participants across these 20 categories most had too few observations to be statistically useful Accordingly the 20 offence categories have been further grouped into six categories that are both meaningful (similar offences) and contain 20 or more treated prisoners45 The final offence type groupings with grouped OGRS categories are Violent (violence and public orderriot offences) Robbery Sexual (sexual offences not against a child sexual offences against a child and solicitingprostitution) Acquisitive (burglary (domestic) burglary (other) theft (non-motor) handling stolen goods fraud and forgery taking and driving away and related offences and theft from vehicles) Drug (drugs import export production or supply and drugs possessionsmall-scale supply) Other (abscondingbail offences other motoring drink driving criminal damage and any other offences)
44 The Copas rate (Copas and Marshall 1998) is a measure that reflects both the intensity and length of the offenderrsquos criminal career calculated as log [ (number of sanction occasions) (10 + years between first and current sanction) ] The higher the Copas rate the more convictions an offender has amassed in a given amount of time and the more likely it is that the offender will reoffend within one year
45 An exception is the lsquoOtherrsquo category the reference category for modelling which has 15 treated participants
15
Box 21 Matching variables pre-selected as being predictive of ETS participation and reconviction risk
Programme suitability criteria Need Sum of OASys Section 11 Thinking and Behaviour scores (OASys) Risk OASys total weighted score (OASys) Motivation to change behaviour (OASys) Problems with readingwritingnumeracy (OASys) Problems with learning difficulties (OASys) Problems with current psychological problemsdepression (OASys) Problems with current psychiatric problems (OASys)
Static risk factors Gender (SPCR) Age (SPCR) Marital status Married (SPCR) Marital status Living with a partner (SPCR) Ethnicity Any Mixed background (SPCR) Ethnicity Any Asian background (SPCR) Ethnicity Any Black background (SPCR) Ethnicity Any Other background (SPCR) Copas rate on release (PNC) Previous convictions (PNC) Previous convictions squared (PNC) Previous severe convictions (PNC) Previous severe convictions squared (PNC) Index offence type Violent (PNC) Index offence type Sexual (PNC) Index offence type Acquisitive (PNC) Index offence type Drug (PNC) Index offence type Robbery (PNC) Family member has been convicted of a non-motoring offence (SPCR) Family member has been in prison (SPCR)
Dynamic risk factors Agree Want to stop offending (SPCR) Disagree Want to stop offending (SPCR) Agree Want to get help to stop offending (SPCR) Disagree Want to get help to stop offending (SPCR) General attitude to offending CRIME-PICS (SPCR) Anticipation of reoffending CRIME-PICS (SPCR) Victim hurt denial CRIME-PICS (SPCR) Evaluation of crime as worthwhile CRIME-PICS (SPCR) Used class A drugs in the four weeks before custody (SPCR) Used class BC drugs in the four weeks before custody (SPCR) Injected illegal drugs in the four weeks before custody (SPCR) Transient accommodation prior to custody (SPCR) Sleeping rough prior to custody (SPCR) Educational (qualifications) attainment (SPCR) Was in paid work in the four weeks before custody (SPCR)
Note Data source is listed in parentheses
16
A range of dynamic risk factors found to be incrementally predictive of general reconviction in addition to static risk factors (Howard 2009) have also been included These factors are motivation to stop offending attitudes to offending drug use accommodation educational attainment and employment status before custody
Many of the factors are categorical and so have been converted to indicator variables (also known as lsquodummy variablesrsquo) For instance ethnicity has been split into five separate yesno variables ndash one for each individual ethnic background The full set of variables is listed in Box 21
Matching algorithm
A variety of propensity score matching methods are available to adjust for pre-treatment observable differences between the treatment group and untreated groups each best suited to particular types of data The algorithm developed to match the control group for this evaluation and the motivation underlying its choice are briefly explained here The propensity score matching analysis was undertaken in the Stata statistical software programme using the psmatch2 module (Leuven and Sianesi 2003)
First a logistic regression was used to predict the probability of treatment (the propensity score) for all treated and untreated prisoners based on their observed characteristics The resultant propensity scores summarise each prisonerrsquos characteristics on all matching variables in one measure that is used as the basis for matching
Since the sample consists of comparatively few treated prisoners in relation to many untreated ones radius matching (Dehejia and Wahba 2002) was chosen as the matching algorithm This technique uses the maximum amount of data whilst the imposition of a tolerance threshold avoids the risk of bad matches All untreated prisoners whose propensity score falls within a defined range of tolerance (radius calliper) of a treated prisonerrsquos score are matched to that prisoner A radius calliper of 005 of a standard deviation of the logit of the propensity score has been used46 The benefit of radius matching is lower propensity score variances than would result from one-to-one nearest-neighbour matching As a further step to ensure comparability prisoners with propensity scores outside the range of values where both treated and untreated observations are found were dropped a requirement of the technique47
46 The appropriate calliper size is not clearly prescribed by the empirical literature (Smith and Todd 2005) The inventors of propensity score matching Rosenbaum and Rubin (1983) recommend a calliper of a quarter of a standard deviation of the logit of the propensity score as appropriate in general This would be equivalent to 0236 in this case which was tried and rejected due to returning a weak match quality The radius calliper size was iteratively reduced until the point (005) that a further reduction would drop treated observations Sensitivity analysis was carried out on radius calliper size (00001 to 025) which found that the results were not highly sensitive to calliper size
47 Technically this is referred to as imposing common support
17
With a choice-based sample such as this participants are likely to be over-sampled relative to their frequency in the eligible prisoner population (Caliendo and Kopeinig 2005) To control for this over-sampling matching was undertaken on the odds-ratio of the propensity scores (Heckman and Smith 1995)48
The outcome of this methodology was that each ETS participant was matched with a synthetic control observation composed of the average of all non-participants sufficiently similar (propensity score within the radius limit) to the participant
Parsimonious PSM model
Due to the limited size of the sample there was a focus on parsimony (simplification without any loss of power) in development of the model Dropping insignificant variables from the logistic regression gains degrees of freedom (fewer parameters to be estimated) and observations (due to missing values on some variables) without losing explanatory power The final model was reduced to a smaller set of 16 variables listed in Box 2249 To check that this process did not introduce a bias the correlation of the propensity scores of the reduced model and the full model was checked and found to be greater than 091
Box 22 Parsimonious Propensity Score Matching model matching variables
Programme suitability criteria Need Sum of OASys Section 11 Thinking and Behaviour scores (OASys) Risk OASys total weighted score (OASys) Motivation to change behaviour (OASys) Problems with readingwritingnumeracy (OASys) Problems with current psychiatric problems (OASys)
Static risk factors Gender (SPCR) Age (SPCR) Index offence type Violent (PNC) Index offence type Sexual (PNC) Index offence type Acquisitive (PNC) Index offence type Drug (PNC) Index offence type Robbery (PNC)
Dynamic risk factors Agree Want to get help to stop offending (SPCR) Victim hurt denial CRIME-PICS (SPCR) Used class BC drugs in the four weeks before custody (SPCR) Sleeping rough prior to custody (SPCR)
Note Data source is listed in parentheses
48 Caliendo and Kopeinig (2005) note that weights are required to consistently estimate the probability of treatment when sampling is choice based However as an odds-ratio estimated using incorrect weights will be a scalar multiple of the true odds-ratio (a monotonic transformation of the propensity score) matching may proceed on the odds-ratio even when sampling weights are unknown (Heckman and Smith 1995)
49 The full model (including all 42 pre-selected variables) was run successively with the least significant variable dropped each time using the stepwise function with a confidence limit for retention equal to 01
18
Assessment of control match quality
The robustness of the calculated treatment effect depends on the quality of the match achieved The degree of lsquosimilarityrsquo between the treatment and the control group was tested using a range of statistical techniques (namely standardised bias reduction and t-tests of equality of means) Please refer to the Technical Annex for the detailed results of these tests
In summary equality of means testing confirmed no statistically significant difference between the treatment and matched control group across all 42 characteristics pre-selected as being predictive of ETS participation and reconviction risk The control group is therefore well matched on the pre-selected matching characteristics with a similar expected reconviction rate as the treatment group allowing robust estimation of the treatment effect
Whilst every effort has been made to remove the selection bias it is possible that an unmeasured bias may still remain uncontrolled Further checks on average sentence length and participation on other accredited OBP interventions (using the Offending Behaviour Programme Interventions Database) were carried out which revealed some differences between the treatment and control groups It was found that the average sentence length of the treatment group (975 days) was longer than that for the control group (727 days) It was also found that 6 of the treatment group and 2 of the control group had been on another accredited OBP during the SPCR sentence though both proportions are small
19
3 Results
The results of this evaluation show that ETS was effective in bringing about a statistically significant reduction in both the reconviction rate and frequency of reoffending in the year following release from custody for 257 prison-based participants on ETS between 2006 and 2008 Almost identical results were found for completers (when drop-outs were excluded) though the significance of the reduction in the one-year reconviction rate was lost due the reduction in the size of the sample
A secondary finding of the research was a low adherence to the suitability targeting criteria among those prisoners that actually received the programme over the period This suggests that the programme was not always administered to the most suitable group of prisoners which may have limited the effectiveness of the programme in reducing reoffending
The research findings are presented and summarised in this section The conclusions and policy-relevant implications of the results are discussed in the Implications section More detail on the results is contained in the Technical Annex
Effectiveness of ETS in reducing reoffendingThe impact of the programme is identified as the average causal effect of participation on the ETS programme (the treatment) on reconviction outcomes As the control group was created using a methodologically robust propensity score matching model and established as valid by tests on the quality of the match it represents a good proxy for the counterfactual untreated outcome of the treatment group50 The observed difference in the average conviction rates between the treatment and control groups may therefore be considered the causal effect of the ETS intervention known as the average treatment effect on the treated (ATT)
All programme participants
The reconviction rate and the frequency of reoffending of all ETS participants (including non-completers) was found to be significantly lower than the matched control group in the year following release from custody No statistically significant impact was found on the severe offence reconviction rate
The average reconviction outcomes of the treated and untreated groups and the difference between them (ATT with t-stat) are presented in Table 31 The results show that the proportion of programme participants that were reconvicted within one year (272) was six percentage points below that observed in the control group (335) and that this difference was statistically significant A statistically significant difference was also found in terms of frequency of reoffending as participants (607 offences) were reconvicted of 60 fewer recordable offences within one year per 100 released prisoners than the control group (1208 offences)
50 Testing revealed no statistical difference in the mean values of the two groups across all 42 variables pre-selected as being predictive of ETS participation and reconviction risk
20
These are the noteworthy results of this analysis as they show that ETS was successful in significantly reducing both the reconviction rate and frequency of reoffending of participants After contradictory evidence and debate the results seem to support Friendship et alsrsquo (2002) positive results though the magnitude of the effect is smaller Whilst the severe offences reconviction rate was lower in the treatment group the difference was not significant This is not surprising given the programme is not designed to target severe offending and the rarity of severe offences
Table 31 Impact of ETS on reconviction outcomes of the SPCR sample
SampleReconviction rate
(one-year)
Reoffences per 100 released prisoners
(one-year)
Severe offences reconviction rate
(one-year)Average outcomes
Treatment group (n=257) 272 607 08Matched control group 335 1208 09
Treatment effect (ATT) -62a -601b -01(t-stat) -204 -547 -013Note Average treatment effect on the treated (ATT) is the difference between the mean outcome of the
treatment group and the matched control groupa Statistically significant at the 005 levelb Statistically significant at the lt0001 level
Completers only
The evaluation has followed the lsquointention-to-treatrsquo approach in general (consistent with Colledge et al 1999) However not all participants completed the programme ndash 8 of the treated final sample did not complete the course As in previous evaluations non-completers have been removed from the analysis to test any sensitivity of the treatment effect to programme completion
21
The results are summarised in Table 32 showing an almost identical though not statistically significant reduction in the rate of reconviction for completers when drop-outs were excluded The loss in significance was most likely due to the reduction in the size of the sample The statistically significant reduction in the frequency of reoffending was retained with an almost identical effect size No significant impact was again found for the severe offences reconviction rate
Table 32 Impact of ETS on reconviction outcomes of the SPCR sample completers only
SampleReconviction rate (one-
year)
Reoffences per 100 released prisoners
(one-year)
Severe offences reconviction rate
(one-year)Average outcomesTreatment group (n=237) 270 599 08Matched control group 335 1208 09Treatment effect (ATT) -65 -609a 00(t-stat) -156 -321 -001Note Average treatment effect on the treated (ATT) is the difference between the mean outcome of the
treatment group and the matched control groupa Statistically significant at the 001 level
Completers of intervention programmes are often found to have a stronger effect than non-completers This may be due to a self-selection effect whereby completers may be more motivated or have fewer needs or have a lower risk of reoffending Therefore effectiveness of the programme should not be evaluated against completers alone whose outcomes may have been better even without the intervention Rather the true effect of the intervention as it is used in practice should be evaluated by considering all participants both completers and non-completers (Colledge et al 1999 National Offender Management Service 2005) Accordingly more weight should be placed on the findings for all participants
Assessment of suitability targeting
The HM Prison Service guidance to assess suitability for ETS and other OBPs notes
ldquoOne of the principles of effective interventions is appropriate targeting An offender is more likely to benefit from participation in an offending behaviour programme if heshe demonstrates levels of risk and need that are appropriate for the particular interventionrdquo51
To facilitate appropriate targeting HM Prison Service designed a set of risk need and responsivity suitability criteria to identify those prisoners that were most suitable for the programme These criteria were set out in the Context section Strict adherence to these criteria should ensure that ETS is appropriate and relevant for all participants
51 HM Prison Service (2007) p3
Figure 31 Need and risk score distributions for non-participant and ETS participant groups with suitability thresholds
Need Sum of OASys Section 11 Thinking and Behaviour scores (OASys)
Risk OASys total weighted score (OASys)
0
5
10
15
4 7 140
5
10
15
4 7 140 0
Per
cen
t
Per
cen
t
0
5
10
15
50 100 1500
Per
cen
t
0
5
10
15
50 100 1500
Per
cen
t
Non-participant
Non-participant
ETS participant
ETS participant
22
Need and risk requirements
The need and risk52 profiles of the participant and non-participant groups53 were compared The comparison is presented graphically in Figure 31 with needrisk ETS programme suitability thresholds marked with vertical red lines (observations to the right of the line rate as lsquosuitablersquo for ETS) In the case of need the dual thresholds of 7 or 4 (with at least one individual score of 2 indicating significant problems) are marked A single vertical red line for 56 and above is marked as the risk threshold
With regard to both need and risk the participant and non-participant distributions follow a broadly similar pattern The majority of the non-participant group had a needrisk profile that would have made them suitable for ETS This is good news for matching purposes as it means that similar prisoners at the pre-treatment stage could have been treated or remained untreated More importantly a lot of prisoners in the participant group fall to the left of the red vertical line in both charts ndash and so rated as lsquonot strictly suitablersquo for ETS
52 As the OASys data do not include OGRS2 it has only been possible to define suitability with respect to the OASys total weighted score This is not necessarily invalid as the guidance notes ldquoIf an offender passes the cut-off on one but not both scales [ie OGRS2 and OASys total weighted score] you can consider them to be suitable to progress to the needs assessment stagerdquo HM Prison Service (2007) p5
53 This analysis is based on the full sample of 3512 (316 participants and 3196 non-participants) and not the treatment and matched control groups
23
Further investigation of the need and risk (OASys total weighted score) scores revealed that only 58 of the participant group were suitable for ETS (met both need and risk requirements simultaneously) while 49 of the non-participant group would have been suitable (Table 33)
Table 33 ETS suitability criteria fulfilment non-participant and ETS participant groups
SuitabilityNon-participants ETS participants
N N Not strictly suitable for ETS 1629 510 134 424Strictly suitable for ETS 1567 490 182 576Total 3196 1000 316 1000NoteSuitability is defined with reference to risk (an OASys score 56 or above) and need (a total score of 7
or above and a total score of 4 or above with at least one individual score of 2 (indicating significant problems))
It is important to note some caveats to this analysis The suitability criteria for ETS have been reviewed and changed over time The ETS start dates of participants in the SPCR sample stretch from March 2006 to September 2008 whilst the specification of the risk tool as OGRS2 or OASys was only introduced in August 2007 (the Sentencing Planning Risk Predictor was used previously) Similarly this period covers a time when both a local semi-structured interview and the OASys assessment were sources of need information for programme staff As the programme did not itself change substantially during this period later indicators of suitability for the intervention are retrospectively relevant from a targeting perspective54 though the retrospective application of the later indicators provides no reflection of the accuracy in the application of the targeting criteria during the earlier period
There is also some flexibility allowed in the application of the suitability criteria individuals with an OASys or OGRS2 score within three points below the cut-off may be progressed to ETS and special considerations are made for indeterminate sentence prisoners and sex offenders The original indicator of criminogenic needs the ETS Semi-Structured Interview has gradually been replaced by OASys Section 11 scores as confirmed in later guidance (National Offender Management Service 2009)55
54 Assuming that amendments to the suitability identification tools over time represent improvements in targeting later indicators applied retrospectively are likely to provide a better indicator of suitability than older indicators Accordingly this analysis provides no reflection on the selection process of treatment managers at the time but rather a pure view of suitability of treated participants
55 later guidance also specified definition of risk groups suitable for ETS with reference to OGRS3 (score 50 or above)
24
Readiness and responsivity criteria
A similar comparative analysis was also carried out for the readiness and responsivity criteria The HM Prison Service (2007) guidance lists assessment items in the lsquoResponsivity Assessmentrsquo and lsquoReadiness Assessmentrsquo sections including intellectual ability literacy dyslexia mental and physical health psychopathic traits motivation to change behaviour disability However the guidance does not specify the data variables or the thresholds to be used To investigate these readiness and responsivity criteria the lsquoexclusion criteriarsquo for general offending programmes from the OASys Manual56 were used
Again the profiles of the participant and non-participant groups57 were compared with a similar pattern emerging Figure 32 plots the distributions side-by-side with the readiness and responsivity thresholds marked by red vertical lines (this time profiles to the right of the line are not strictly suited to ETS) As with the need and risk profiles the two distributions are unexpectedly similar with a number of the participant group recorded as lsquonot at allrsquo motivated or having lsquosignificant problemsrsquo More specifically of the participant group
109 were scored as lsquonot at allrsquo motivated to change their behaviour
74 had lsquosignificant problemsrsquo with readingwritingnumeracy
61 had lsquosignificant problemsrsquo with learning difficulties
103 had lsquosignificant problemsrsquo with current psychological problemsdepression and
58 had lsquosignificant problemsrsquo with current psychiatric problems
56 OASys development team (2001) p16757 This analysis is based on the full sample of 3512 (316 participants and 3196 non-participants) and not the
treatment and matched control groups
Figure 32 Readiness and responsivity score distributions for non-participant and ETS participant groups with suitability thresholds
0
20
40
60
Verymotivated
Quitemotivated
Not at all0
20
40
60
Verymotivated
Quitemotivated
Not at all
Per c
ent
Per c
ent
Non-participant ETS participant
Motivation (OASys)
0
50
100
No problems Someproblems
Significantproblems
Per c
ent
Non-participant
Problems with readingwritingnumeracy (OASys)
0No problems Some
problemsSignificantproblems
Per c
ent
ETS participant
020
6080
No problems Someproblems
Significantproblems
Per c
ent
Non-participant
Problems with learning difficulties (OASys)
0No problems Some
problemsSignificantproblems
Per c
ent
ETS participant
0
20
40
60
No problems Someproblems
Significantproblems
Per c
ent
Non-participant
Problems with current psychological probelmsdepression (OASys)
0
20
40
60
No problems Someproblems
Significantproblems
Per c
ent
ETS participant
4020
6080
40
50
100
0
50
100
No problems Someproblems
Significantproblems
Per c
ent
Non-participant
Problems with current psychological probelms (OASys)
0
50
100
No problems Someproblems
Significantproblems
Per c
ent
ETS participant
25
26
Analysis of treatment effect by suitability
To investigate the importance of adherence to the need and risk principles in participant targeting the reconviction outcomes of the treatment group were also analysed according to participant suitability As before suitability is defined with reference to risk (an OASys score 56 or above) and need (a total score of 7 or above and a total score of 4 or above with at least one individual score of 2 (indicating significant problems)) As there is some flexibility in the application of the criteria this is termed lsquostrict suitabilityrsquo
Of the treatment group 164 (64) were strictly suitable for ETS whereas 1404 (56) of the control group were strictly suitable The remainder of each group were not strictly suitable
The results of the analysis (Table 34) show that the one-year reconviction rate for strictly suitable treated offenders (172) was lower than that for not strictly suitable ones (329) Similarly the frequency of reoffending of strictly suitable offenders (398 reoffences) was also lower than that of the not strictly suitable offenders (726 reoffences)
Table 34 Impact of ETS on reconviction outcomes of the SPCR sample lsquonot strictly suitablersquo and lsquostrictly suitablersquo participants only
SampleReconviction rate
(one-year)
Reoffences per 100 released prisoners
(one-year)
Severe offences reconviction rate
(one-year)Not strictly suitable (n=93) 329 726 12Strictly suitable (n=164) 172 398 -
Caveats and limitations of the researchIt is important to note that the number of ETS-treated prisoners provided by SPCR (257) is a limited sample falling in the lower range of previous evaluation samples (from 114 to 2195 participants) as a result of a low intervention rate and missing data filters Results based on limited samples may not be reliable indicators of the wider population and in some cases the sample sizes may be too small to detect differences which may actually exist58 Tests of statistical significance are carried out on the results of this evaluation for this reason The low intervention rate means that there is a large pool (2514) from which to form a well-balanced matched control group It should also be noted that all SPCR data are self-reported
Whilst every effort has been made to remove the selection bias it is possible that an unmeasured bias may still remain uncontrolled Further checks revealed some differences between the treatment and control groups It was found that the average sentence length of the treatment group (975 days) was longer than that for the control group (727 days)
58 This caveat is more relevant where no effect is detected ndash in which case the correct conclusion may be that the sample was insufficient to detect an effect rather than that the intervention had no effect For a discussion of sample size detection power and reliability of reconviction rates please see Harper and Chitty (2004) p8
27
The possibility of multiple intervention participation has not been controlled for as the sample size did not permit such analysis Examination revealed that 6 of the treatment group and 2 of the control group had been on another accredited OBP during the SPCR sentence though both proportions are small It is also possible that prisoners may have participated on non-accredited OBPs or a substance misuse treatment during their SPCR sentence period which may have contributed to the observed treatment effect If the rate of participation in other programmes was higher in the ETS treated group the estimated treatment effect of ETS would represent a pooled effect of all treatments received and so may be overstated If the rate of participation in other programmes was higher in the ETS control group the estimated treatment effect of ETS may be understated
This evaluation has been limited to using one-year conviction rates as two-year reconviction outcome data will only become available in 12 monthsrsquo time Thus it is not possible at this time to conclude on the duration of the impact of ETS ndash that is to say whether the observed one-year effect endures two years on from release or whether it dissipates (as found by Cann et al 2003) It is planned to conduct a follow-up study of reconviction at the two-year post-release stage (please see the Further research section)
28
4 Implications
This report has evaluated the effectiveness of the prison-based ETS programme by linking participation to reconviction outcomes The evaluation results show that ETS was successful in significantly reducing both the reconviction rate and frequency of general reoffending of participants The most important implications of these results are outlined below
This research has added some clarity to the discordant evidence base on the effectiveness of ETS by improving on key methodological limitations of previous evaluation studies This provides a more solid evidence base of support on which to build intervention-based policy
The most important message for policy makers is that ETS the most frequently delivered offending behaviour programme over the past decade did work to significantly reduce reoffending in the short term (one year) at least This result should assist policy makers to prioritise and focus operational resources towards the most productive intervention efforts Though ETS has since been replaced by the Thinking Skills Programme (TSP) the results of this evaluation demonstrate that cognitive-behavioural OBPs can work to significantly reduce reoffending for offenders released from prison The findings are likely to be particularly relevant for TSP which represents a refresh and update of ETS in line with advances in theory and practice However these specific findings cannot be generalised to other cognitive-behavioural intervention programmes Each programme has its own distinct objectives delivery methods and targeted characteristics and so would require a discrete evaluation
For practitioners although the findings on reduced reconviction rates are encouraging and reflect a job well done there are also lessons to be learned A low adherence to the risk need and responsivity suitability criteria was found among those prisoners that actually received the programme between 2006 and 2008 This suggests that the programme was not always administered to the most suitable prisoners Given that research supports the importance of risk need and responsivity targeting for effective treatment (Hollin 1995 Taxman and Thanner 2006 Palmer et al 2009 Gendreau et al 2009 Andrews and Bonta 2010) and the finding of lower reconviction rates for strictly suitable prisoners this may have limited the effectiveness of the programme in reducing reoffending The fact that a significant reduction in reconviction was found in spite of this finding suggests that a stricter application of the targeting criteria might further enhance the effectiveness of the programme National Offender Management Service practitioners report that the accuracy of targeting has improved over time meaning that a similar evaluation of ETS in a later period (post-2008) or TSP might find an even more significant effect
29
Future researchers may be able to draw on the methodology developed for this research as a methodological blueprint for further evaluations The findings of this research could be complemented and enhanced by addressing some of the outstanding evidence gaps framed by a set of research questions and proposed research designs set out in the Further research section
30
5 Further research
Whilst this evaluation has added some clarity to the evidence base on the effectiveness of general cognitive-behavioural programmes evidence gaps remain These gaps are defined by the research questions listed below with suggested research designs that could provide robust answers to complement and enhance the findings in this paper
Duration of the reduction in reoffending effect Does ETS have a lasting impact or will the observed one-year effect have dissipated after two years as found by Cann et al (2003) It is planned to conduct a follow up study of the treated and matched control individuals of this evaluation two years after their release applying the same methodology to investigate the duration of the ETS impact in one yearrsquos time
Cost-effectiveness of the programme Is the cost of ETS provision justified by the observed reduction in reoffending The reduction in reoffences estimated in this evaluation could be used as the basis for a cost-benefit analysis of the ETS programme Linking the estimated reduction in reoffending to estimates of the social cost of criminal offences the avoided social costs of crime (the benefit) could be compared to data on the cost of ETS provision (estimated to be in the region of pound2000 per prisoner)59
Generalisability of the findings Would the observed effect be verified or even more significant in a larger sample By repeating the evaluation methodology but replacing SPCR variables with OASys data variables where possible the full population of prisoners undertaking ETS could be evaluated The downside to this approach is the compromised choice of data for dynamic risk factors Other benefits would be the ability to employ more matching variables and being able to evaluate some of the smaller accredited programmes This research could also be used as a methodological blueprint to evaluate substance misuse intervention programmes
What works for whom What are the characteristics of the prisoners that benefit most from ETS and other OBPs The difference in reconviction outcome for each treated prisoner compared with the matched control could be regressed on a range of treated prisonersrsquo characteristics to identify which kinds of offenders under which circumstances most benefit from undertaking ETS
The effectiveness of TSP Does ETSrsquos replacement the Thinking Skills Programme (TSP) have a lesser similar or greater impact on reconviction A similar evaluation methodology could be used to evaluate the effectiveness of TSP in reducing reconviction outcomes though this would not be possible for a couple of years as TSP was only introduced in 2009
59 Social Exclusion Unit (2002) p 81
31
Database of research findings What does the evidence base tell us about the effectiveness of ETS Policy makers are often influenced by the latest study to be published rather than the synthesised message of the collective body of evaluation research The formation and maintenance of a database of outcome studies could be used for systematic reviews and meta-analytic analysis to produce a comprehensive review of ETS efficacy to inform and guide policy makers and practitioners (for example see Tong and Farrington 2006)
In the longer term samples of the other cohort studies being conducted by MoJ ndash the probation sample of the Offender Management Community Cohort Study (OMCCS) and the juvenile offenders sample of the Juvenile Cohort Study (JCS) ndash could be similarly linked to the same management information databases (for example OASys) as linked to SPCR in this evaluation When combined with OASys assessment data and viewed as a collective database this would be the richest known single evidence base in existence on the static and dynamic factors involved in offending behaviour
32
6 Additional resources
Readers interested in researching further the issues and topics probed in this paper further may want to consult the following publications websites and other useful sources of information
HM Prison Service Offender Behaviour Programmes (OBPs) httpwwwhmprisonservicegovukadviceandsupportbeforeafterreleaseoffenderbehaviourprogrammes
Ministry of Justice Research httpwwwjusticegovukpublications
National Offender Management Service httpwwwjusticegovukaboutnomshtm
Correctional Services Accreditation Panel httpwwwjusticegovukaboutcorrectional-services-accreditationhtm
National Reducing Reoffending Delivery plan (National Offender Management Service (NOMS) website) httpnomsjusticegovuk
Social Exclusion Unit (Cabinet Office) httpwwwcabinetofficegovuksocial_exclusion_task_forceaspx
Office for National Statistics (ONS) httpwwwstatisticsgovuk
33
7 References
Andrews D A and Bonta J (2010) The psychology of criminal conduct (5th ed) New Providence NJ LexisNexis Matthew Bender
Blackburn R (1972) lsquoDimensions of hostility and aggression in abnormal offendersrsquo Journal
of Consulting and Clinical Psychology 38 pp 20ndash26
Caliendo M and Kopeinig S (2005) lsquoSome Practical Guidance for the Implementation of Propensity Score Matchingrsquo IZA Discussion Papers Series Discussion Paper No 1588 Institute for the Study of Labor (IZA)
Cann J Falshaw L Nugent F and Friendship C (2003) Understanding What Works
cognitive accredited skills programmes for adult men and young offenders Research Findings 226 London Home Office
Cann J (2006) Cognitive skills programmes impact on reducing reconviction among a
sample of female prisoners Home Office Research Study 276 London Home Office
Clarke A Simmonds R and Wydall S (2004) Delivering cognitive skills programmes in
prison a qualitative study Home Office Research Study 242 London Home Office
Clarke D A (2000) Theory Manual for Enhanced Thinking Skills Prepared for the Joint Prison Accreditation Panel London Home Office
Colledge M Collier P and Brand S (1999) Crime reduction programme and constructive
regimes in prison Programmes for offenders Guidance for evaluators Crime reduction programme ndash guidance note 2 Research Development and Statistics Directorate London Home Office
Copas J and Marshall P (1998) lsquoThe offender group reoffending scale A statistical reoffending score for use by probation officersrsquo Applied Statistics 47(1) 159ndash171
Dehejia RH and Wahba S (2002) lsquoPropensity Score-Matching Methods for Nonexperimental Causal Studiesrsquo Review of Economics and Statistics February 2002 Vol 84 No 1 pp 151ndash161
Eysenck S B and McGurk B J (1980) lsquoImpulsiveness and venturesomeness in a detention centre populationrsquo Psychological Reports 47 pp 1299ndash1306
34
Falshaw L Friendship C Travers R and Nugent F (2003) Searching for what works An
evaluation of cognitive skills programmes Home Office Research Study 206 London Home Office
Falshaw L Friendship C Blud L Travers R and Nugent F (2004) lsquoSearching for what works HM Prison Service accredited cognitive skills coursesrsquo British Journal of Forensic
Practice 6 (2) pp 3ndash13
Friendship C Blud L Erikson M and Travers R (2002) An evaluation of cognitive
behavioural treatment for prisoners Home Office Research Study 161 London Home Office
Frude N Honess T and Maguire M (1994) CRIME-PICS II Manual Cardiff Michael and Associates
Gendreau P Smith P and Theacuteriault YL (2009) lsquoChaos theory and correctional treatment Common sense correctional quackery and the law of fartcatchersrsquo Journal of Contemporary
Criminal Justice 25 384ndash396
Harper G and Chitty C (eds) (2004) The impact of corrections on re-offending A review of
lsquoWhat Worksrsquo (3rd ed) Home Office Research Study No 291 London Home Office
Heckman J and Smith J (1995) rsquoAssessing the Case for Social Experimentsrsquo Journal of
Economic Perspectives 9 85ndash110
HM Prison Service (2007) Assessing Suitability for Offending Behaviour Programmes Risk
Need amp Responsivity Guidance for Treatment Managers Offending Behaviour Programmes Unit HM Prison Service
Home Office (2006) A Five Year Strategy for Protecting the Public and Reducing Re-
offending London The Stationary Office
Hollin C R (1995) lsquoThe meaning and implications of ldquoprogramme integrityrdquorsquo In J McGuire (Ed) What works Reducing reoffending Guidelines from Research and Practice (pp 195ndash208) Chichester England John Wiley and Sons
Howard P (2009) Improving prediction of re-offending using the Offender Assessment
System Research Summary 209 London Ministry of Justice Available at httpwwwjusticegovukpublicationsdocsoasys-research-summary-02-09pdf
Howard P Francis B Soothill K and Humphreys L (2009) OGRS 3 the revised Offender
Group Reconviction Scale Research Summary 709 London Ministry of Justice
35
Leuven E and Sianesi B (2003) psmatch2 Stata module to perform full Mahalanobis and
propensity score matching common support graphing and covariate imbalance testing httpideasrepecorgcbocbocodes432001html version 315 2 May 2009
Mak A S (1991) lsquoPsychosocial control characteristics of delinquents and nondelinquentsrsquo Criminal Justice and Behaviour 18 (3) pp 297ndash303
McDougall C Clarbour J Perry A and Bowles R (2009) Evaluation of HM Prison Service
Enhanced Thinking Skills Programme Report on the implementation of a randomised
controlled trial London Ministry of Justice
McDougall C Clarbour J Perry A and Bowles R (2009) Evaluation of HM Prison Service
Enhanced Thinking Skills Programme Report on the outcomes of a randomised controlled
trial London Ministry of Justice
Ministry of Justice (2009) The Correctional Services Accreditation Panel Report 2008-
2009 Available at httpwwwjusticegovukpublicationsdocscorrectional-services-report-20080-09pdf
Ministry of Justice (2010) Reoffending of adults results from the 2008 cohort ndash England and
Wales Ministry of Justice Statistics bulletin London Ministry of Justice Available at httpwwwjusticegovukpublicationsdocsreoffending-adults-2008-cohortpdf
National Offender Management Service (2005) Understanding research methods and
findings lsquoWhat Worksrsquo Briefing 305 Available at httprdshomeofficegovukrdspdfs05wwbn3pdf
National Offender Management Service (2009) Suitability for Accredited Interventions Risk
Need amp Responsivity Targeting Criteria for Offender Managers and Treatment Managers
Interventions and Substance Misuse Group Directorate of Commissioning and Operational Policy National Offender Management Service May 2009
OASys Data Evaluation and Analysis Team O-DEAT (2010) OASys caveats notes and
limitations ndash layered OASys (May 10)
OASys development team (2001) Offender Assessment System OASys User Manual OASys Manual V2 Crown Copyright 2002
Palmer EJ McGuire J Hatcher RM Hounsome JC Bilby CAL and Hollin CR (2009) lsquoAllocation to offending behavior programs in the English and Welsh probation servicersquo Criminal Justice and Behavior 36 909ndash922
36
Rosenbaum P R and Rubin D B (1983) lsquoThe Central Role of the Propensity Score in Observational Studies for Causal Effectsrsquo Biometrika 70 41ndash55
Smith J and Todd P (2005) rsquoDoes matching overcome LaLondersquos critique of nonexperimental estimatorsrsquo Journal of Econometrics Elsevier vol 125(1-2) pages 305ndash353
Social Exclusion Unit (2002) Reducing re-offending by ex-prisoners Available from httpwwwcabinetofficegovukmediacabinetofficesocial_exclusion_task_forceassetspublications_1997_to_2006reducing_reportpdf
Stewart D (2008) The problems and needs of newly sentenced prisoners results from a
national survey Ministry of Justice Research Series 1608 Published online at httpwwwjusticegovukpublicationsresearch2008htm
Taxman FS and Thanner M (2006) lsquoRisk need and responsivity (RNR) It all dependsrsquo Crime and Delinquency 52 28ndash51
Tong LSJ and Farrington DP (2006) lsquoHow effective is the ldquoReasoning and Rehabilitationrdquo programme in reducing reoffending A meta-analysis of evaluations in four countriesrsquo Psychology Crime and Law 12 3ndash24
37
Appendix 1 Technical annex
Full set of matching variables (covariates)Programme suitability criteriaoasys_need Need Sum of OASys Section 11 Thinking and Behaviour scores
(OASys)oasys_score Risk OASys total weighted score (OASys)oasys_motiv Motivation to change behaviour (OASys)oasys_litnum Problems with readingwritingnumeracy (OASys)oasys_lrndiff Problems with learning difficulties (OASys)oasys_psychgl Problems with current psychological problemsdepression (OASys)oasys_psychtr Problems with current psychiatric problems (OASys)
Static risk factorsspcr_genderf Gender Female (SPCR)spcr_age Age (SPCR)spcr_marst_mar Marital status Married (SPCR)spcr_marst_lvp Marital status Living with a partner (SPCR)spcr_ethnic_mix Ethnicity Any Mixed background (SPCR)spcr_ethnic_as Ethnicity Any Asian background (SPCR)spcr_ethnic_bl Ethnicity Any Black background (SPCR)spcr_ethnic_oth Ethnicity Any Other background (SPCR)pnc_copas Copas rate on release (PNC)pnc_ttlprevconv Previous convictions (PNC)pnc_ttlprevconv2 Previous convictions squared (PNC)pnc_ttlprevconvsev Previous severe convictions (PNC)pnc_ttlprevconvsev2 Previous severe convictions squared (PNC)pnc_index_vio Index offence type Violent (PNC)pnc_index_sxl Index offence type Sexual (PNC)pnc_index_acq Index offence type Acquisitive (PNC)pnc_index_drg Index offence type Drug (PNC)pnc_index_rob Index offence type Robbery (PNC)spcr_famconv Family member has been convicted of a non-motoring offence
(SPCR)spcr_fampris Family member has been in prison (SPCR)
Dynamic risk factorsspcr_motivstoffy Agree Want to stop offending (SPCR)spcr_motivstoffn Disagree Want to stop offending (SPCR)spcr_motivhlpstoffy Agree Want to get help to stop offending (SPCR)spcr_motivhlpstoffn Disagree Want to get help to stop offending (SPCR)spcr_attg General attitude to offending CRIME-PICS (SPCR)spcr_atta Anticipation of reoffending CRIME-PICS (SPCR)spcr_attv Victim hurt denial CRIME-PICS (SPCR)spcr_atte Evaluation of crime as worthwhile CRIME-PICS (SPCR)spcr_drug4wka Used class A drugs in the four weeks before custody (SPCR)spcr_drug4wkbc Used class BC drugs in the four weeks before custody (SPCR)spcr_drug4wkinj Injected illegal drugs in the four weeks before custody (SPCR)spcr_accomtrans Transient accommodation prior to custody (SPCR)spcr_accomrough Sleeping rough prior to custody (SPCR)spcr_edqual Educational (qualifications) attainment (SPCR)spcr_job4wk Was in paid work in the four weeks before custody (SPCR)
38
Logistic regression model
Table A1 Logistic regression model of prisoner characteristics influencing probability of treatment (ETS) and reconviction outcomes
Coefficient Standard error P-valueETS suitabilityNeed (thinking and behaviour) 0082 0027 0002Risk (OASys score) 0005 0003 0069Motivation to change behaviour (OASys) 0323 0122 0008Problems with readingwritingnumeracy -0303 0116 0009Problems with current psychiatric problems 0335 0131 0011
GenderMale Reference
categoryFemale 0736 0177 0000
Age -0030 0009 0000
Index offence typeOther Reference
categoryViolent 1223 0296 0000Sexual 2094 0389 0000Acquisitive 0243 0313 0438Drug 1192 0309 0000Robbery 1552 0329 0000
Motivation to stop offendingDisagreed with ldquoI want to get help to stop offendingrdquo all other responses
Reference category
Agreed with ldquoI want to get help to stop offendingrdquo
0315 0091 0001
Offending-related attitudesVictim hurt denial 0078 0026 0003
Drug useUsed Class BC drugs in the 4 weeks before custody
-0195 0150 0193
AccommodationStable accommodation prior to custody Reference
categoryTemporary accommodation prior to custody Reference
categorySleeping rough prior to custody -0709 0409 0083
Constant -4933 0554 0000Notes Number of observations = 2771 (257 treated 2514 untreated) Pseudo R2 = 00958 LR
chi2(16)=16397 probgtchi2 00000
39
Calculation of the average treatment effect on the treated (ATT)
Outcome measures
pnc_reconvind Indicator of reconviction within one yearpnc_reofffreq Frequency of proven reoffending within one yearpnc_reconvindsev Indicator of severe offence reconviction within one year
Table A2 Average treatment effect on the treated (ATT)
Variable Sample Treated Controls(Difference)
ATTa
Standard error t-stat
pnc_reconvind Unmatched 0272 0370 (-0098) 0031 -311Matched ATT 0272 0335 -0062 0031 -204
pnc_reofffreq Unmatched 0607 1422 (-0815) 0182 -447Matched ATT 0607 1208 -0601 0110 -547
pnc_reconvindsev Unmatched 0008 0007 (0001) 0006 011Matched ATT 0008 0009 -0001 0006 -013
a ATT is the difference between the mean outcome of the treatment group and the matched control group
40
Tests of covariate balancing
Table A3 Means standardised bias reduction and t-tests for equality of means in the treatment and control groups before and after matching
Variable SampleMean
bias bias
reductiont-test
Treatment Control t pgttoasys_need Unmatched 7381 6703 203 299 000
Matched 7381 7269 34 834 039 070oasys_score Unmatched 77335 75658 48 070 049
Matched 77335 77060 08 836 009 093oasys_motiv Unmatched 1210 1141 110 165 010
Matched 1210 1201 15 864 017 087oasys_litnum Unmatched 0350 0416 -102 -150 013
Matched 0350 0361 -17 830 -020 084oasys_lrndiff Unmatched 0187 0184 05 008 094
Matched 0187 0180 13 -1510 014 089oasys_psychgl Unmatched 0486 0426 89 139 017
Matched 0486 0499 -19 791 -020 084oasys_psychtr Unmatched 0237 0142 194 327 000
Matched 0237 0224 27 861 028 078spcr_genderf Unmatched 0214 0124 243 408 000
Matched 0214 0199 39 838 041 068spcr_age Unmatched 28008 30216 -238 -349 000
Matched 28008 28364 -38 839 -046 065spcr_marst_mar Unmatched 0070 0093 -84 -123 022
Matched 0070 0075 -19 776 -023 082spcr_marst_lvp Unmatched 0296 0256 90 140 016
Matched 0296 0250 103 -149 117 024spcr_ethnic_mix Unmatched 0062 0038 110 187 006
Matched 0062 0040 100 92 112 026spcr_ethnic_as Unmatched 0047 0041 28 044 066
Matched 0047 0035 57 -1056 067 050spcr_ethnic_bl Unmatched 0035 0065 -137 -189 006
Matched 0035 0063 -127 76 -145 015spcr_ethnic_oth Unmatched 0000 0004 -89 -101 031
Matched 0000 0002 -51 431 -076 045pnc_copas Unmatched -0902 -0880 -27 -040 069
Matched -0902 -0910 10 644 011 091pnc_ttlprevconv Unmatched 10946 12746 -163 -227 002
Matched 10946 11580 -57 648 -069 049pnc_ttlprevconv2 Unmatched 212140 314300 -133 -163 010
Matched 212140 257960 -60 552 -082 041pnc_ttlprevconvsev
Unmatched 0132 0146 -34 -050 062Matched 0132 0165 -79 -1300 -087 039
pnc_ttlprevconvsev2
Unmatched 0163 0209 -57 -074 046Matched 0163 0239 -95 -657 -102 031
41
Variable SampleMean
bias bias
reductiont-test
Treated Control t pgttpnc_index_vio Unmatched 0327 0245 182 288 000
Matched 0327 0311 36 804 039 070pnc_index_sxl Unmatched 0078 0040 162 286 000
Matched 0078 0078 -03 982 -003 098pnc_index_acq Unmatched 0175 0303 -302 -430 000
Matched 0175 0195 -46 847 -057 057pnc_index_drg Unmatched 0218 0195 57 088 038
Matched 0218 0211 16 718 018 086pnc_index_rob Unmatched 0144 0065 261 469 000
Matched 0144 0133 37 858 037 071spcr_famconv Unmatched 0463 0403 121 185 006
Matched 0463 0433 60 503 067 050spcr_fampris Unmatched 0396 0334 129 200 005
Matched 0396 0354 88 322 098 033spcr_motivstoffy Unmatched 1720 1670 93 139 017
Matched 1720 1719 01 985 002 099spcr_motivstoffn Unmatched 0016 0010 40 065 052
Matched 0016 0007 58 -453 069 049spcr_motivhlpstoffy
Unmatched 1346 1085 338 498 000Matched 1346 1304 55 836 065 052
spcr_motivhlpstoffn
Unmatched 0097 0164 -166 -234 002Matched 0097 0107 -25 850 -031 076
spcr_attg Unmatched 58131 57962 23 033 074Matched 58131 58212 -11 518 -012 091
spcr_atta Unmatched 18393 18516 -50 -073 047Matched 18393 18547 -63 -257 -068 050
spcr_attv Unmatched 11825 10907 321 454 000Matched 11825 11681 50 843 061 054
spcr_atte Unmatched 13996 13809 60 092 036Matched 13996 13871 40 331 045 066
spcr_drug4wka Unmatched 0381 0419 -77 -118 024Matched 0381 0408 -55 289 -062 053
spcr_drug4wkbc Unmatched 0494 0499 -10 -015 088Matched 0494 0486 16 -637 019 085
spcr_drug4wkinj Unmatched 0109 0155 -135 -194 005Matched 0109 0143 -99 265 -114 025
spcr_accomtrans Unmatched 0054 0052 12 019 085Matched 0054 0058 -17 -360 -018 085
spcr_accomrough Unmatched 0027 0054 -138 -188 006Matched 0027 0032 -23 835 -030 076
spcr_edqual Unmatched 1965 1893 36 054 059Matched 1965 1915 25 308 028 078
spcr_job4wk Unmatched 0346 0331 32 049 062Matched 0346 0331 32 17 036 072
Figure A1 Risk OASys total weighted score (OASys) by treatment and control groups
Risk OASys weighted score
8
6
4
2
Per c
ent
Control
0
8
6
4
2
Per c
ent
Treatment
050 100 150 50 100 150
42
Distributions of matching variables by treatment and control groups
Table A4 Need Sum of OASys Section 11 Thinking and Behaviour scores (OASys) by treatment and control groups
Summed scoreControl Treatment
n Valid n Valid 0 111 44 44 1 04 041 89 35 35 6 23 232 126 50 50 11 43 433 156 62 62 13 51 514 219 87 87 24 93 935 234 93 93 19 74 746 262 104 104 23 89 897 281 112 112 37 144 1448 253 101 101 30 117 1179 211 84 84 29 113 11310 184 73 73 15 58 5811 147 58 58 18 70 7012 117 47 47 17 66 6613 62 25 25 7 27 2714 62 25 25 7 27 27Missing 0 00 0 00Total 2514 1000 1000 257 1000 1000Note Control group frequencies are unweighted (a weighted average of controls within the radius calliper is
used in the matching algorithm)
43
Table A5 Motivation to change behaviour (OASys) by treatment and control groups
RatingControl Treatment
n Valid n Valid Not at all 367 146 146 28 109 109Quite motivated 1426 567 567 147 572 572Very motivated 721 287 287 82 319 319Missing 0 00 0 00Total 2514 1000 1000 257 1000 1000Note Control group frequencies are unweighted (a weighted average of controls within the radius calliper is
used in the matching algorithm)
Table A6 Problems with readingwritingnumeracy (OASys) by treatment and control groups
ExtentControl Treatment
n Valid n Valid No problems 1735 690 690 187 728 728Some problems 512 204 204 50 195 195Significant problems 267 106 106 20 78 78Missing 0 00 0 00Total 2514 1000 1000 257 1000 1000Note Control group frequencies are unweighted (a weighted average of controls within the radius calliper is
used in the matching algorithm)
Table A7 Problems with learning difficulties (OASys) by treatment and control groups
ExtentControl Treatment
n Valid n Valid No problems 2185 869 869 226 879 879Some problems 195 78 78 14 54 54Significant problems 134 53 53 17 66 66Missing 0 00 0 00Total 2514 1000 1000 257 1000 1000Note Control group frequencies are unweighted (a weighted average of controls within the radius calliper is
used in the matching algorithm)
Table A8 Problems with current psychological problemsdepression (OASys) by treatment and control groups
Extent Control Treatment
n Valid n Valid No problems 1693 673 673 162 630 630Some problems 572 228 228 65 253 253Significant problems 249 99 99 30 117 117Missing 0 00 0 00Total 2514 1000 1000 257 1000 1000Note Control group frequencies are unweighted (a weighted average of controls within the radius calliper is
used in the matching algorithm)
Figure A2 Age (SPCR) by treatment and control groups
8
6
4
2
0
Per
cen
t
20 40 60 80
8
6
4
2
0
Per
cen
t
20 40 60 80Age (SPCR)
Control Treatment
44
Table A9 Problems with current psychiatric problems (OASys) by treatment and control groups
ExtentControl Treatment
n Valid n Valid No problems 2244 893 893 211 821 821Some problems 184 73 73 31 121 121Significant problems 86 34 34 15 58 58Missing 0 00 0 00Total 2514 1000 1000 257 1000 1000Note Control group frequencies are unweighted (a weighted average of controls within the radius calliper is
used in the matching algorithm)
Table A10 Gender (SPCR) by treatment and control groups
GenderControl Treatment
n Valid n Valid Male 2203 876 876 202 786 786Female 311 124 124 55 214 214Missing 0 00 0 00Total 2514 1000 1000 257 1000 1000Note Control group frequencies are unweighted (a weighted average of controls within the radius calliper is
used in the matching algorithm)
Figure A3 Copas rate on release (PNC) by treatment and control groups
10
5
0-4 -2 0 2
Per c
ent
10
5
0-4 -2 0 2
Per c
ent
COPAS rate on release (PNC)
Control Treatment
45
Table A11 Marital status (SPCR) by treatment and control groups
StatusControl Treatment
n Valid n Valid Married 234 93 93 18 70 70Living with partner 642 255 256 76 296 296Other 1636 651 651 163 634 634Missing 2 01 0 00Total 2514 1000 1000 257 1000 1000Note Control group frequencies are unweighted (a weighted average of controls within the radius calliper is
used in the matching algorithm)
Table A12 Ethnicity (SPCR) by treatment and control groups
Ethnic groupControl Treatment
n Valid n Valid Any White background 2142 852 852 220 856 856Any Mixed background 96 38 38 16 62 62Any Asian background 103 41 41 12 47 47Any Black background 163 65 65 9 35 35Any Other background 10 04 04 0 00 00Missing 0 00 0 00Total 2514 1000 1000 257 1000 1000Note Control group frequencies are unweighted (a weighted average of controls within the radius calliper is
used in the matching algorithm)
Figure A4 Total previous convictions (PNC) by treatment and control groups
30
20
10
050 100 150 200
30
20
10
050 100 150 200
Per c
ent
Per c
ent
Previous convictions (PNC)
Control Treatment
46
Table A13 Previous severe convictions (PNC) by treatment and control groups
NumberControl Treatment
n Valid n Valid 0 2205 877 877 227 883 8831 265 105 105 26 101 1012 34 14 14 4 16 163 5 02 02 0 00 004 5 02 02 0 00 00Missing 0 00 0 00Total 2514 1000 1000 257 1000 1000Note Control group frequencies are unweighted (a weighted average of controls within the radius calliper is
used in the matching algorithm)
Table A14 Grouped index offence type (PNC) by treatment and control groups
Offence type grouping
Control Treatmentn Valid n Valid
Other 384 153 153 15 58 58Violent 616 245 245 84 327 327Robbery 163 65 65 37 144 144Sexual 100 40 40 20 78 78Acquisitive 761 303 303 45 175 175Drug 490 195 195 56 218 218Missing 0 00 0 00Total 2514 1000 1000 257 1000 1000Note Control group frequencies are unweighted (a weighted average of controls within the radius calliper is
used in the matching algorithm)
47
Table A15 Family member has been convicted of a non-motoring offence (SPCR) by treatment and control groups
ResponseControl Treatment
n Valid n Valid No 1486 591 597 137 533 537Yes 1003 399 403 118 459 463Missing 25 10 2 08Total 2514 1000 1000 257 1000 1000Note Control group frequencies are unweighted (a weighted average of controls within the radius calliper is
used in the matching algorithm)
Table A16 Family member has been in prison (SPCR) by treatment and control groups
ResponseControl Treatment
n Valid n Valid No 1658 660 666 154 599 604Yes 831 331 334 101 393 396Missing 25 10 2 08Total 2514 1000 1000 257 1000 1000Note Control group frequencies are unweighted (a weighted average of controls within the radius calliper is
used in the matching algorithm)
Table A17 Agree Want to stop offending (SPCR) by treatment and control groups
ResponseControl Treatment
n Valid n Valid Other 101 40 40 9 35 35Agree 627 249 249 54 210 210Strongly agree 1786 710 710 194 755 755Missing 0 00 0 00Total 2514 1000 1000 257 1000 1000Note Control group frequencies are unweighted (a weighted average of controls within the radius calliper is
used in the matching algorithm)
Table A18 Disagree Want to stop offending (SPCR) by treatment and control groups
ResponseControl Treatment
n Valid n Valid Other 2498 994 994 254 988 988Disagree 7 03 03 2 08 08Strongly disagree 9 04 04 1 04 04Missing 0 00 0 00Total 2514 1000 1000 257 1000 1000Note Control group frequencies are unweighted (a weighted average of controls within the radius calliper is used in the matching algorithm)
Figure A5 General attitude to offending CRIME-PICS (SPCR) by treatment and control groups
15
10
5
020 40 60 80
Per c
ent
Control15
10
5
020 40 60 80
Per c
ent
Treatment
General attitude to offending CRIME-PICS (SPCR)
48
Table A19 Agree Want to get help to stop offending (SPCR) by treatment and control groups
ResponseControl Treatment
n Valid n Valid Other 725 288 288 40 156 156Agree 851 339 339 88 342 342Strongly agree 938 373 373 129 502 502Missing 0 00 0 00Total 2514 1000 1000 257 1000 1000Note Control group frequencies are unweighted (a weighted average of controls within the radius calliper is
used in the matching algorithm)
Table A20 Disagree Want to get help to stop offending (SPCR) by treatment and control groups
ResponseControl Treatment
n Valid n Valid Other 2174 865 865 237 922 922Disagree 268 107 107 15 58 58Strongly disagree 72 29 29 5 19 19Missing 0 00 0 00Total 2514 1000 1000 257 1000 1000Note Control group frequencies are unweighted (a weighted average of controls within the radius calliper is
used in the matching algorithm)
49
Table A21 Anticipation of reoffending CRIME-PICS (SPCR) by treatment and control groups
ScoreControl Treatment
n Valid n Valid 8 2 01 01 0 00 009 1 00 00 0 00 0010 3 01 01 1 04 0411 6 02 03 0 00 0012 14 06 06 1 04 0413 27 11 11 4 16 1614 46 18 19 8 31 3315 113 45 48 9 35 3716 201 80 85 18 70 7417 276 110 116 30 117 12318 628 250 265 65 253 26619 371 148 156 44 171 18020 287 114 121 30 117 12321 145 58 61 13 51 5322 106 42 45 9 35 3723 71 28 30 5 19 2024 29 12 12 2 08 0825 17 07 07 2 08 0826 14 06 06 2 08 0827 7 03 03 1 04 0428 3 01 01 0 00 0029 1 00 00 0 00 0030 6 02 03 0 00 00Missing 140 56 13 51Total 2514 1000 1000 257 1000 1000Note Control group frequencies are unweighted (a weighted average of controls within the radius calliper is
used in the matching algorithm)
50
Table A22 Victim hurt denial CRIME-PICS (SPCR) by treatment and control groups
ScoreControl Treatment
n Valid n Valid 3 69 27 27 2 08 084 47 19 19 2 08 085 59 23 23 1 04 046 136 54 54 6 23 237 104 41 41 4 16 168 155 62 62 14 54 549 129 51 51 20 78 7810 241 96 96 19 74 7411 133 53 53 8 31 3112 664 264 264 77 300 30013 257 102 102 38 148 14814 196 78 78 22 86 8615 324 129 129 44 171 171Missing 0 00 0 00Total 2514 1000 1000 257 1000 1000Note Control group frequencies are unweighted (a weighted average of controls within the radius calliper is
used in the matching algorithm)
Table A23 Evaluation of crime as worthwhile CRIME-PICS (SPCR) by treatment and control groups
ScoreControl Treatment
n Valid n Valid 4 1 00 00 1 04 045 5 02 02 1 04 046 16 06 06 2 08 087 26 10 11 2 08 088 68 27 28 4 16 169 96 38 39 9 35 3510 177 70 72 21 82 8311 197 78 80 13 51 5112 270 107 109 31 121 12213 235 93 95 24 93 9414 328 130 133 33 128 13015 266 106 108 24 93 9416 276 110 112 27 105 10617 229 91 93 24 93 9418 115 46 47 20 78 7919 94 37 38 12 47 4720 70 28 28 6 23 24Missing 45 18 3 12Total 2514 1000 1000 257 1000 1000Note Control group frequencies are unweighted (a weighted average of controls within the radius calliper is
used in the matching algorithm)
51
Table A24 Used class A drugs in the four weeks before custody (SPCR) by treatment and control groups
ResponseControl Treatment
n Valid n Valid No 1460 581 581 159 619 619Yes 1054 419 419 98 381 381Missing 0 00 0 00Total 2514 1000 1000 257 1000 1000Note Control group frequencies are unweighted (a weighted average of controls within the radius calliper is
used in the matching algorithm)
Table A25 Used class BC drugs in the four weeks before custody (SPCR) by treatment and control groups
ResponseControl Treatment
n Valid n Valid No 1259 501 501 130 506 506Yes 1255 499 499 127 494 494Missing 0 00 0 00Total 2514 1000 1000 257 1000 1000Note Control group frequencies are unweighted (a weighted average of controls within the radius calliper is
used in the matching algorithm)
Table A26 Injected illegal drugs in the four weeks before custody (SPCR) by treatment and control groups
ResponseControl Treatment
n Valid n Valid No 2121 844 845 228 887 891Yes 389 155 155 28 109 109Missing 4 02 1 04Total 2514 1000 1000 257 1000 1000Note Control group frequencies are unweighted (a weighted average of controls within the radius calliper is
used in the matching algorithm)
Table A27 Accommodation prior to custody (SPCR) by treatment and control groups
TypeControl Treatment
n Valid n Valid Stable accommodation 2247 894 894 236 918 918Transient accommodation 130 52 52 14 54 54Sleeping rough 137 54 54 7 27 27Missing 0 00 0 00Total 2514 1000 1000 257 1000 1000Note Control group frequencies are unweighted (a weighted average of controls within the radius calliper is
used in the matching algorithm)
52
Table A28 Educational (qualifications) attainment (SPCR) by treatment and control groups
Highest qualification attained
Control Treatment
n Valid
n Valid
No qualifications 1099 437 441 99 385 388Other qualifications (incl overseas) 66 26 26 7 27 27O levelGCSE grade D-G (or similar qualification) 372 148 149 47 183 184O levelGCSE Grades A-C (or similar qualification) 507 202 204 61 237 239Trade apprenticeships 87 35 35 6 23 24AAS levels 220 88 88 21 82 82Higher education diploma 57 23 23 11 43 43First degreepostgraduate degree 70 28 28 2 08 08Higher degreepostgraduate degree 13 05 05 1 04 04Missing 23 09 2 08Total 2514 1000 1000 257 1000 1000Note Control group frequencies are unweighted (a weighted average of controls within the radius calliper is
used in the matching algorithm)
Table A29 Was in paid work in the four weeks before custody (SPCR) by treatment and control groups
ResponseControl Treatment
n Valid n Valid No 1681 669 669 168 654 654Yes 832 331 331 89 346 346Missing 1 00 0 00Total 2514 1000 1000 257 1000 1000Note Control group frequencies are unweighted (a weighted average of controls within the radius calliper is
used in the matching algorithm)
Table A30 Reconviction indicator one-year (PNC) by treatment and control groups
IndicatorControl Treatment
n Valid n Valid No 1584 630 630 187 728 728Yes 930 370 370 70 272 272Missing 0 00 0 00Total 2514 1000 1000 257 1000 1000Note Control group frequencies are unweighted (a weighted average of controls within the radius calliper is
used in the matching algorithm)
53
Table A31 Frequency of reoffending one-year (PNC) by treatment and control groups
IndicatorControl Treatment
n Valid n Valid 0 1584 630 630 187 728 7281 495 197 197 54 210 2102 203 81 81 11 43 433 117 47 47 3 12 124 53 21 21 1 04 045 33 13 13 1 04 046 8 03 03 0 00 007 7 03 03 0 00 008 6 02 02 0 00 009 1 00 00 0 00 0010 2 01 01 0 00 0011 2 01 01 0 00 0013 0 00 00 0 00 0015 1 00 00 0 00 0018 1 00 00 0 00 0032 1 00 00 0 00 00Missing 0 00 0 00Total 2514 1000 1000 257 1000 1000Note Control group frequencies are unweighted (a weighted average of controls within the radius calliper is
used in the matching algorithm)
54
Table A32 Frequency of reoffences one-year (PNC) by treatment and control groups
IndicatorControl Treatment
n Valid n Valid 0 1584 630 630 187 728 7281 272 108 108 31 121 1212 181 72 72 15 58 583 117 47 47 15 58 584 91 36 36 2 08 085 65 26 26 3 12 126 42 17 17 2 08 087 38 15 15 1 04 048 32 13 13 1 04 049 20 08 08 0 00 0010 19 08 08 0 00 0011 15 06 06 0 00 0012 11 04 04 0 00 0013 6 02 02 0 00 0014 6 02 02 0 00 0015 5 02 02 0 00 0016 1 00 00 0 00 0017 0 00 00 0 00 0018 1 00 00 0 00 0019 1 00 00 0 00 0020 1 00 00 0 00 0021 2 01 01 0 00 0022 2 01 01 0 00 0025 1 00 00 0 00 0039 1 00 00 0 00 00Missing 0 00 0 00Total 2514 1000 1000 257 1000 1000Note Control group frequencies are unweighted (a weighted average of controls within the radius calliper is
used in the matching algorithm)
Table A33 Severe offences reconviction indicator one-year (PNC) by treatment and control groups
IndicatorControl Treatment
n Valid n Valid No 2496 993 993 255 992 992Yes 18 07 07 2 08 08Missing 0 00 0 00Total 2514 1000 1000 257 1000 1000Note Control group frequencies are unweighted (a weighted average of controls within the radius calliper is
used in the matching algorithm)
Ministry of Justice Research Series 1910Evaluation of the impact of the HM Prison Service Enhanced Thinking Skills programme on reoffendingThis research examined the impact of the Enhanced Thinking Skills (ETS) programme on the one-year reconviction outcomes of 257 prison-based participants between 2006 and 2008 Radius propensity score matching was used to match a comparison group that had no statistically significant difference (at the means) to the treatment group on any matching characteristic ETS was found to significantly reduce both the reconviction rate (six percentage points) and frequency (60 reoffences per 100 released prisoners) of general reoffending of participants No statistically significant impact was found on the severe offences reconviction rate Almost identical impacts were found for completers A stronger reduction in reconviction was found for participants meeting the suitability criteria Though the programme has been shown to be effective in practice the findings suggest that a stricter application of the targeting criteria might have further enhanced the effectiveness of the programme
ISBN 978 1 84099 418 6copy Crown copyrightProduced by the Ministry of JusticeAlternative format versions of this report are available on requestE-mail researchjusticegsigovukhttpwwwjusticegovukpublicationsresearchhtm
5
More recently a randomised control trial (RCT) evaluation of ETS in HM Prison Service by McDougall et al (2009) focused on the short-term impact of the programme They found that ETS was effective in reducing impulsivity and changing the self-reported offending-related thinking of adult male prisoners No examination of reconviction outcomes was possible however as ethical considerations of treatment denial meant that the comparison group also participated in an ETS programme later in their sentence prior to release Nonetheless as impulsivity has been linked to reoffending (Blackburn 1972 Eysenck and McGurk 1980 Mak 1991) this finding suggests an expected reduction in recidivism for participants This result supports earlier findings (Clarke et al 2004) that ETS participation brought short-term non-reconviction benefits including increased self-confidence developed interpersonal skills and improved prisoner behaviour The nature of prisonersrsquo motivations for participating in a cognitive behaviour programme was also found to be a key factor in assessing the effectiveness of the programme (Clarke et al 2004)
Rationale for this evaluation
Existing evaluation evidence on ETS is therefore inconclusive (McDougall et al 2009) Reflecting on the disagreement of later findings with those of Friendship et al (2002) it has been suggested (Falshaw et al 2003 Cann et al 2003) that the early large significant impact may have reflected an initial enthusiasm of programme tutors motivation of participants andor the focused nature of delivery prior to its accreditation and later expansion23 Such an explanation would if true create doubts about the efficacy of OBP accreditation and roll-out of programmes across the Prison Service
Alternatively another factor may drive the variability of evaluation results Whilst disagreeing in terms of research findings all previous evaluations of ETS note one common methodological limitation as a possible explanation of their findings the inability to control for potential differences in dynamic risk factors (Friendship et al 2002 Falshaw et al 2003 Cann et al 2003 Cann 2006) As very little data have been available to date on dynamic factors previous studies have been constrained to matching based on a narrow range of static risk factors alone (for example age gender ethnicity criminal career variables) Consequently potential selection bias due to differences in unmeasured dynamic risk between the participants and their comparators has not been controlled Such bias could plausibly account for the variation of the evidence to date
The key advantage and added value of this research is the opportunity to match using dynamic risk factors in addition to static ones afforded by SPCR prisoner survey and OASys data Some of the dynamic risk factors on which data are available are motivation to stop offending attitudes to crime substance misuse physical and mental health educational
23 For a qualitative examination of the process of ETS implementation and delivery in a prison context please see Clarke et al (2004)
6
attainment and skills level employment status accommodation status marital status and needs The prisoner survey also allows matching on additional rich static risk factors (for example family contact with the criminal justice system)
A further limitation of previous evaluations has been the reliance on Offenders Index data to assess reconviction which may not be the most complete source of such information (Falshaw et al 2003) The current study improves on this aspect by drawing its reconviction data from the Police National Computer the official source of criminal conviction histories
7
2 Approach
The research methodology of the study covering data sources final sample details and analysis techniques employed is summarised and explained in this section More details on technical points are provided in the Technical Annex
This evaluation assessed the impact of the HM Prison Service ETS programme on reoffending using a retrospective quasi-experimental research design that compared the one-year reconviction outcomes of participants with those of a matched comparison group that had not participated in the programme The research set out to test the hypothesis that ETS has no significant impact on the reconviction rates of programme participants
Based on the SPCR prisoner sample and incorporating data from the Offending Behaviour Programme Interventions Database Offender Assessment System (OASys) and the Police National Computer (PNC) the assembled dataset provides a profile of prisonersrsquo characteristics needs experiences and outcomes of unprecedented detail The combined dataset comprises more than 1800 variables on a final sample of 3277 prisoners
The comparison (matched control)24 group was generated using a statistical matching technique such that it is sufficiently lsquosimilarrsquo25 to the ETS participant (treatment) group to permit valid comparison The effect of this technique is to balance the programme suitability offending-risk characteristics and criminogenic needs across the treatment and matched control groups A strong match has been achieved taking account of 42 variables meaning that the treatment and control groups are statistically lsquosimilarrsquo or unbiased such that we would expect to observe the same reoffending outcomes for each group on average Any observed difference in the average reconviction rates between the two groups may therefore be assumed to be the causal effect of the ETS intervention known as the average treatment effect on the treated (ATT)
The analysis was carried out on an lsquointention-to-treatrsquo basis (consistent with Colledge et al 1999) whether the participant completed the ETS programme or not though analysis of completers only has also been run for completeness
24 A note on terminology used for the remainder of the report following the evaluation literature the term lsquotreatment grouprsquo is used in this report to refer to those prisoners in the sample that received ETS in the relevant sentence period Conversely the term lsquountreatedrsquo is used to distinguish those prisoners in the sample that did not receive ETS in the relevant sentence period The term lsquocontrolrsquo (and lsquomatched controlrsquo) is reserved to refer to the untreated prisoners that form part of the matched control group following propensity score matching
25 lsquoSimilarrsquo is defined as having mean values that are not statistically different from those of the participant group across a set of variables pre-selected as being simultaneously predictive of the probability of treatment and the probability of reconviction
8
Data sources and sample detailsAs the source of the novel dynamic risk factor data the base sample for the analysis is that of the SPCR prisoner survey The SPCR dataset is supplemented by merging to three further data sources data on which prisoners received ETS in what time period from the Offending Behaviour Programme Interventions Database data on the assessed need and risk of prisoners from the Offender Assessment System (OASys) and criminal history and reconviction data from the Police National Computer Each data source is described in turn
SPCR prisoner survey (wave 1)
Surveying Prisoner Crime Reduction (SPCR) is a large-scale longitudinal cohort study of nearly 4000 newly-sentenced adult prisoners in England and Wales comprising four waves of interviews conducted between 2005 and 2009
This evaluation uses wave 1 data only Wave 1 conducted at the point of reception into prison describes the characteristics and needs26 of the cohort of prisoners demographics background and family offending history educational achievements employment status physical and mental health substance misuse accommodation and relationships attitudes27 needs to help prevent them from reoffending and plans and expectations for the future (upon release from prison) All data are self-reported and as the survey responses relate to the start of the particular custodial sentence all responses are measured before any treatment could have commenced
Prisoners were selected from the Ministry of Justicersquos (MoJ) Inmate Information System (IIS) database and their current location found using MoJrsquos Local Inmate Data System (LIDS) The minimum sentence length accepted was one month due to the time taken to locate the prisoner and interview them and the maximum sentence length was four years to allow for a reasonable data-collection period Prisoners were recruited into the study on the basis of fully informed consent and ethical guidelines for social research were followed Prisoners were interviewed by specially trained researchers using computer-assisted (CAPI) questionnaires
Interview targets were set for every reception prison (except those with very low throughput) based on the proportional sizes of receptions at each prison Prison reception characteristics were found to be highly variable and targets were compiled using the most recent information available Over-sampling targets were calculated to allow for any difficulties in accessing prisoners Thus the interviews were drawn from 40 prisons from a possible 53 eligible prisons
26 The term lsquoneedsrsquo is used throughout to refer to a wide range of factors (associated with the pathways) which are generally understood to be related to offending sometimes known as ldquocriminogenic needsrdquo A summary of the general problems and needs of these newly sentenced prisoners has already been published (Stewart 2008)
27 Attitudes are measured using CRIME-PICS II (Frude et al 1994) a widely used and validated questionnaire-based instrument for examining and detecting changes in offendersrsquo attitudes to offending Special thanks are due to Jennifer Poyser in Offender Management Analytical Services at MoJ for the conversion of SPCR attitude question responses to CRIME-PICS II scores
9
The full sample (after removal of ineligible participants)28 at wave 1 was 3849 adult prisoners sentenced to between one month and four years29 This represents the base sample for this evaluation though the final sample will be smaller due to failed matches in database merging and data completion filters
Offending Behaviour Programme Interventions Database
To determine the treatment status of the base sample (that is which prisoners had received ETS during their sentence period) the SPCR wave 1 dataset was linked to the OBP prison interventions database compiled by the National Offender Management Service (NOMS) Rehabilitation Services Group30
The database is based on administrative records of interventions delivered to prisoners (71521 unique prisoner numbers) from 1994 to 2009 It covers accredited OBPs only including Controlling Anger and Learning how to Manage it (CALM) Cognitive Skills Booster (CSB) Cognitive Self Change Programme (CSCP) Enhanced Thinking Skills (ETS) Focus on Resettlement (FOR) Healthy Relationships Programme (HRP) Reasoning and Rehabilitation (RampR) Chromis JETS and Sex Offender Treatment Programme (SOTP)
When matched to the SPCR sample (by prisoner number) it was found that 449 (12) of the 3849 SPCR prisoners had received an accredited intervention The magnitude of this intervention rate was validated by comparison of total ETS programme participants and total prison population figures More specifically 371 (10) prisoners were identified as having participated in ETS within the SPCR sentence period All started the programme between March 2006 and September 200831 ETS was by far the most common OBP intervention delivered and the only individual programme with a sufficient number of participants to permit a statistical analysis of effectiveness
Offender Assessment System (OASys)
For verification of suitability for the programme and to allow matching of control prisoners based on these characteristics data are required on the risk and need of the prisoners in the sample This data requirement is fulfilled by the Offender Assessment System (OASys)
28 Twenty-eight participants were removed due to ineligibility Please see the SPCR Technical Report for more information
29 There are two sub-samples within SPCR Sample 1 (Reception Prisoners) is representative of the entire prison reception population (the lsquoflowrsquo into prison) at the time of sampling (n=1435) Sample 2 (Longer-term Prisoners) is a booster sample to reflect the higher proportion of longer-term prisoners in the prison population (the lsquostockrsquo of prisoners) (n=2414) Please see the SPCR Technical Report for more information This evaluation study uses the combined sample and does not distinguish between the two sub-samples That said ETS tends to be reserved for longer-term prisoners
30 Previously known as the Interventions amp Substance Misuse Group (ISMG)31 If a prisoner was recorded as receiving more than one ETS course in the SPCR sentence period the latest
start date was used
10
OASys is NOMSrsquos principal riskneed assessment and management tool for adult offenders in England and Wales and is used to assess suitability for ETS Introduced in 2001 OASys produces standardised assessments of offendersrsquo risks and needs by combining actuarial methods of prediction with structured professional judgement In terms of outputs OASys provides data on the likelihood of reconviction criminogenic factors (need) and risk of harm
The SPCR sample was matched to the OASys database by PNC number All OASys assessments completed for the prisoners in the SPCR sample subject to data completion criteria32 were provided by the OASys Data Evaluation and Analysis Team (O-DEAT) numbering some 2956433 Nonetheless as OASys assessments are not mandatory and the coverage of OASys is not universal an OASys assessment is available for only 3512 prisoners (316 of which were treated)
With an average of eight assessments provided per prisoner the one OASys assessment relevant to the instance of ETS participation was selected for each prisoner The method of selection differed for treated and untreated prisoners As the start date of ETS is known for each participant the most recent assessment prior to the start date was selected As there is no start date for the untreated group the OASys assessment completed closest (before or after) to the SPCR sentence prison reception date was selected
Police National Computer
Criminal conviction history and reconviction data were obtained from the Police National Computer (PNC) The SPCR sample was matched to the PNC database (June 2010 snapshot) using personal identifiers (surname forenames gender date of birth) returning 3615 valid matches34 Respondents must have been released for a minimum of one and a half years (allowing one year to reoffend and six months to be convicted) to be included in the matched sample Respondents that were deceased deported or had absconded were excluded from the sample
Final achieved sample details
Following merging of the four datasets 2771 of the 3849 full SPCR sample (and 257 of the 371 ETS participants) had complete data a valid OASys assessment matched to the PNC and had no missing data on any variables employed in the statistical modelling The sample included 2405 (87) men and 366 (13) women
32 All assessments provided met the following minimum standards of data completion Each of the scored sections (1 to 12) within the core OASys assessment must have had at least four-fifths of their scored items completed ndash ensuring that each criminogenic need was assessed properly and In the risk of serious harm sections the screening must have been completed the decision whether to complete a full risk analysis should have been consistent with the information provided and the four ratings of risk of serious harm in the community must have been completed (OASys Data Evaluation and Analysis Team 2010)
33 All OASys assessments used in the analysis are pre-OASys release 431 (August 2009) assessments34 Special thanks are due to Richard Boorman in Offender Management Analytical Services at MoJ for matching
the SPCR sample to the PNC and completing the reconviction analysis
11
The participant sample comprised 257 (9 of the final sample) treated prisoners who started ETS between March 2006 and September 2008 This includes 20 (8 of all treated) participants that did not complete the course a similar proportion observed in previous studies (Friendship et al 2002 Falshaw et al 2003 Cann et al 2003 Cann 2006) The remaining 2514 prisoners did not undertake ETS which provides a reasonable pool from which to select a matched control group35
Outcome measuresTo assess programme effectiveness the impact of ETS is measured with reference to the one-year reconviction outcomes of participants and comparators To reflect the fact that a successful outcome for ETS could include no reconviction (general andor severe) or a reduction in the frequency of reoffending three separate measures of proven reoffending36 are examined defined as follows
reconviction rate (one-year) binary (yesno) indicator of whether the offender was convicted of a recordable offence that was committed within the 12-month period after release from the SPCR custodial sentence
reoffending frequency (one-year) continuous measure of how many recordable offences the offender was convicted of that were committed within the 12-month period after release from the SPCR custodial sentence (note that there may be more than one offence per conviction) and
severe offence reconviction rate (one-year) binary (yesno) indicator of whether the offender was convicted of a severe offence that was committed within the 12-month follow-up period after release from the SPCR custodial sentence The designation of an offence as lsquoseverersquo follows a standard definition under which approximately 150 of the 3000 Home Office offence codes are defined as severe37
Evaluation research designTo evaluate the impact of ETS it would be desirable to compare each treated prisonerrsquos reconviction outcome after treatment with what it would have been without treatment The latter is of course not observable ndash a treated individual cannot have an untreated outcome ndash and so a proxy must be created
35 It is possible that prisoners (participants and non-participants) may have participated in other intervention programmes accredited (for example another OBP or substance misuse treatment) andor non-accredited (of varying quality) during their SPCR sentence period Analysis of the level of participation on other accredited OBPs by the treatment group and matched control groups is presented later in this section
36 An offender is said to have committed a proven reoffence if the offender receives a conviction (by a caution or guilty verdict) at court for the reoffence The reoffence must have been committed within the one-year follow up period and the conviction must follow either within that one-year follow up or in a further 6 months which is to allow time for the offence to be proven at court
37 Severe offence types include violence against the person (murder attempted murder manslaughter wounding) sexual offences (sexual assault rape sexual activity with a minor or a person with a mental disorder abuse of children through prostitution and pornography trafficking for sexual exploitation) aggravated vehicle taking and death by dangerous drink or drug driving A full list of severe offence types is available in lsquoAppendix G List of most serious (severe) offencesrsquo of Ministry of Justice (2010)
12
Due to the active selection mechanism for ETS treatment (see suitability criteria in section 1) it is likely that prisoners selected for treatment differ on average from untreated prisoners even before treatment commences ETS participants should be characterised by a medium-to-high reconviction risk and a high level of criminogenic needs whereas non-participants should have a profile that is more reflective of the general prison population This is known as selection bias For this reason any difference observed in a simple comparison of the average outcome of the treatment group with that of the untreated group could be explained by factors other than the intervention treatment It is important therefore to remove as much of the selection bias as possible between the treatment group and comparison groups prior to comparison of the average outcomes The Propensity Score Matching (Rosenbaum and Rubin 1983) statistical technique has been developed for this very purpose
A primer on Propensity Score Matching
Whilst only a Randomised Control Trial (RCT)38 can ensure a random distribution of any unobserved sources of potential bias ethical and practical considerations can mean that RCT is not an easy-to-use methodology to evaluate the impact of interventions on reconviction rates
Instead Propensity Score Matching (PSM) has been selected to estimate the causal treatment effect of ETS39 On the Scientific Methods Scale adapted for reconviction studies (Harper and Chitty 2005 National Offender Management Service 2005) PSM rates as a level 4 research design ldquothat controls for bias by using the most robust method of matching individuals on all variables that affect participation in the intervention as well as all variables that affect outcomerdquo40 As differences in the variables influencing the treatment and the outcome are controlled for after the treatment intervention the approach is defined as a retrospective quasi-experimental design
The basic idea of PSM is to select a group of untreated individuals that are statistically lsquosimilarrsquo to the group of treated individuals across the set of relevant observed characteristics measured at the pre-treatment (and pre-allocation) stage41 Once the group is well matched (little or no statistical difference in the means of the matching variables) to the treatment group it is an adequate control group to generate the proxy untreated outcome Differences between the outcomes of the treated and untreated groups can then be attributed to the intervention
38 ldquoAn RCT compares outcomes when the intervention is used to outcomes without the intervention or with an alternative (seen in the control group) In an RCT participants are randomly allocated to an intervention or a control group which differs systematically in the type or amount of the intervention received The groups are otherwise equivalent because all other differences are randomly distributedrdquo (National Offender Management Service 2005 p2)
39 In the lsquoScientific Methods Scale adapted for reconviction studiesrsquo (National Offender Management Service 2005) a five-level lsquostandard of researchrsquo scale (5 representing the highest standard) of methodologies to evaluate the impacts of an intervention on reoffending and other offence-related outcomes propensity score matching rates as a level 4 research design (RCT is the only level 5 method) Level 4 is defined as ldquoComparison group matched to intervention group on theoretically relevant factors eg risk of reconviction (well-matched comparison group)rdquo (National Offender Management Service 2005 p3)
40 National Offender Management Service (2005) p 341 Specifically PSM matches individuals based on their probability (propensity score) of participating in the
intervention programme given their observed characteristics
13
Matching methodology
The matching methodology used to generate the matched control group comprises five components suitability filter pre-selected matching variables matching algorithm the parsimonious PSM model and assessment of the match quality Consultation on the methodology employed was undertaken with analyst and policy colleagues at MoJ and NOMS
Suitability filter of potential control matches
The codification of the suitability criteria defining the prisoner needs and characteristics that determine selection into the programme presents the opportunity to control directly for selection bias Assuming that untreated prisoners satisfying the suitability criteria did not receive treatment due to practical barriers (for example ETS was not provided at the establishment the prisoner was participating on another programme or was movedreleased whilst on waiting list) non-participants could be filtered by the suitability criteria to yield an ETS-suitable pool of untreated potential control matches
Such a filter was successfully implemented though with an unexpected result As the OASys data provided did not include OGRS2 scores the risk requirement was assessed with respect to the OASys score This is not invalid as the guidance notes ldquoIf an offender passes the cut-off on one but not both scales [ie OGRS2 and OASys total weighted score] you can consider them to be suitable to progress to the needs assessment stagerdquo42
To ensure the relevance of the filter a cross-check was carried out by applying the same filter to the treatment group with the expectation of finding a high rate of compliance However this analysis revealed that a substantial proportion (up to 42) of ETS participants failed to satisfy even the basic need and risk requirements for ETS suitability43 This is the first noteworthy finding of this research and has important implications for the evaluation Full results are presented and discussed in the following Results section
The direct implication of this finding is that an explicit suitability criteria filter of the potential control pool would be unnecessarily restrictive seeing as the treatment group itself does not satisfy the criteria It also has an important implication for the potential effectiveness of the programme If the suitability criteria are designed so as to identify the individuals that are most likely to benefit from the intervention then a weak adherence to these suitability criteria would constrain the potential effectiveness that the intervention programme could actually achieve in practice (Andrews and Bonta 2010) This is an important point as a programme
42 HM Prison Service (2007) p543 It is important to note some caveats to this analysis (explained fully in the Results section) The specification
of the risk tool to OGRS2 or OASys was only introduced in August 2007 half-way through the period under analysis (March 2006 to September 2008) A secondary indicator of criminogenic needs the ETS Semi-Structured Interview was also used historically though emphasis was placed on the OASys Section 11 scores in the assessment of need There is also some flexibility allowed in the application of the suitability criteria individuals with an OASys or OGRS2 score within three points below the cut-off may be progressed to ETS and special considerations are made for indeterminate sentence prisoners and sex offenders
14
evaluation result of no statistically significant reduction in reconviction may actually be reflecting poor targeting rather than a poor programme
Pre-selected matching variables
Prior to undertaking the matching and outcome analysis a wide range of factors were identified as being the most important drivers of participation in the intervention and the reconviction outcome These variables have two functions First they form the basis of the full specification of the matching model Second the quality of the control group match is assessed by comparing its mean values with those of the treatment group on each one of these variables In addition to ETS suitability criteria and the standard static risk factors the list includes several dynamic risk factors unlike previous evaluations
The first group of factors identified are those that (should) determine the probability of treatment ndash the ETS suitability criteria level of criminogenic need risk of reconviction and responsivity and readiness criteria (motivation to change behaviour and whether the prisoner has problems with reading writing numeracy learning difficulties psychological problemsdepression or psychiatric problems)
The second group are static reconviction risk factors selected as the variables underpinning the OGRS3 score found to be a more accurate predictor of reconviction than OGRS2 and the Sentence Planning Risk Predictor (Howard et al 2009) Namely the individual static factors include age gender index offence type (explained below) the Copas rate44 sanctioning history (total previous convictions and previous severe convictions and their quadratics) Additional static risk factors from SPCR survey responses have also been included ethnicity (White Black Mixed Asian and Other background) marital status family criminal history
Every offence type has a distinct Home Office code of which there are more than 3000 which are grouped into 20 categories in the standardised OGRS classification After checking the distribution of the ETS participants across these 20 categories most had too few observations to be statistically useful Accordingly the 20 offence categories have been further grouped into six categories that are both meaningful (similar offences) and contain 20 or more treated prisoners45 The final offence type groupings with grouped OGRS categories are Violent (violence and public orderriot offences) Robbery Sexual (sexual offences not against a child sexual offences against a child and solicitingprostitution) Acquisitive (burglary (domestic) burglary (other) theft (non-motor) handling stolen goods fraud and forgery taking and driving away and related offences and theft from vehicles) Drug (drugs import export production or supply and drugs possessionsmall-scale supply) Other (abscondingbail offences other motoring drink driving criminal damage and any other offences)
44 The Copas rate (Copas and Marshall 1998) is a measure that reflects both the intensity and length of the offenderrsquos criminal career calculated as log [ (number of sanction occasions) (10 + years between first and current sanction) ] The higher the Copas rate the more convictions an offender has amassed in a given amount of time and the more likely it is that the offender will reoffend within one year
45 An exception is the lsquoOtherrsquo category the reference category for modelling which has 15 treated participants
15
Box 21 Matching variables pre-selected as being predictive of ETS participation and reconviction risk
Programme suitability criteria Need Sum of OASys Section 11 Thinking and Behaviour scores (OASys) Risk OASys total weighted score (OASys) Motivation to change behaviour (OASys) Problems with readingwritingnumeracy (OASys) Problems with learning difficulties (OASys) Problems with current psychological problemsdepression (OASys) Problems with current psychiatric problems (OASys)
Static risk factors Gender (SPCR) Age (SPCR) Marital status Married (SPCR) Marital status Living with a partner (SPCR) Ethnicity Any Mixed background (SPCR) Ethnicity Any Asian background (SPCR) Ethnicity Any Black background (SPCR) Ethnicity Any Other background (SPCR) Copas rate on release (PNC) Previous convictions (PNC) Previous convictions squared (PNC) Previous severe convictions (PNC) Previous severe convictions squared (PNC) Index offence type Violent (PNC) Index offence type Sexual (PNC) Index offence type Acquisitive (PNC) Index offence type Drug (PNC) Index offence type Robbery (PNC) Family member has been convicted of a non-motoring offence (SPCR) Family member has been in prison (SPCR)
Dynamic risk factors Agree Want to stop offending (SPCR) Disagree Want to stop offending (SPCR) Agree Want to get help to stop offending (SPCR) Disagree Want to get help to stop offending (SPCR) General attitude to offending CRIME-PICS (SPCR) Anticipation of reoffending CRIME-PICS (SPCR) Victim hurt denial CRIME-PICS (SPCR) Evaluation of crime as worthwhile CRIME-PICS (SPCR) Used class A drugs in the four weeks before custody (SPCR) Used class BC drugs in the four weeks before custody (SPCR) Injected illegal drugs in the four weeks before custody (SPCR) Transient accommodation prior to custody (SPCR) Sleeping rough prior to custody (SPCR) Educational (qualifications) attainment (SPCR) Was in paid work in the four weeks before custody (SPCR)
Note Data source is listed in parentheses
16
A range of dynamic risk factors found to be incrementally predictive of general reconviction in addition to static risk factors (Howard 2009) have also been included These factors are motivation to stop offending attitudes to offending drug use accommodation educational attainment and employment status before custody
Many of the factors are categorical and so have been converted to indicator variables (also known as lsquodummy variablesrsquo) For instance ethnicity has been split into five separate yesno variables ndash one for each individual ethnic background The full set of variables is listed in Box 21
Matching algorithm
A variety of propensity score matching methods are available to adjust for pre-treatment observable differences between the treatment group and untreated groups each best suited to particular types of data The algorithm developed to match the control group for this evaluation and the motivation underlying its choice are briefly explained here The propensity score matching analysis was undertaken in the Stata statistical software programme using the psmatch2 module (Leuven and Sianesi 2003)
First a logistic regression was used to predict the probability of treatment (the propensity score) for all treated and untreated prisoners based on their observed characteristics The resultant propensity scores summarise each prisonerrsquos characteristics on all matching variables in one measure that is used as the basis for matching
Since the sample consists of comparatively few treated prisoners in relation to many untreated ones radius matching (Dehejia and Wahba 2002) was chosen as the matching algorithm This technique uses the maximum amount of data whilst the imposition of a tolerance threshold avoids the risk of bad matches All untreated prisoners whose propensity score falls within a defined range of tolerance (radius calliper) of a treated prisonerrsquos score are matched to that prisoner A radius calliper of 005 of a standard deviation of the logit of the propensity score has been used46 The benefit of radius matching is lower propensity score variances than would result from one-to-one nearest-neighbour matching As a further step to ensure comparability prisoners with propensity scores outside the range of values where both treated and untreated observations are found were dropped a requirement of the technique47
46 The appropriate calliper size is not clearly prescribed by the empirical literature (Smith and Todd 2005) The inventors of propensity score matching Rosenbaum and Rubin (1983) recommend a calliper of a quarter of a standard deviation of the logit of the propensity score as appropriate in general This would be equivalent to 0236 in this case which was tried and rejected due to returning a weak match quality The radius calliper size was iteratively reduced until the point (005) that a further reduction would drop treated observations Sensitivity analysis was carried out on radius calliper size (00001 to 025) which found that the results were not highly sensitive to calliper size
47 Technically this is referred to as imposing common support
17
With a choice-based sample such as this participants are likely to be over-sampled relative to their frequency in the eligible prisoner population (Caliendo and Kopeinig 2005) To control for this over-sampling matching was undertaken on the odds-ratio of the propensity scores (Heckman and Smith 1995)48
The outcome of this methodology was that each ETS participant was matched with a synthetic control observation composed of the average of all non-participants sufficiently similar (propensity score within the radius limit) to the participant
Parsimonious PSM model
Due to the limited size of the sample there was a focus on parsimony (simplification without any loss of power) in development of the model Dropping insignificant variables from the logistic regression gains degrees of freedom (fewer parameters to be estimated) and observations (due to missing values on some variables) without losing explanatory power The final model was reduced to a smaller set of 16 variables listed in Box 2249 To check that this process did not introduce a bias the correlation of the propensity scores of the reduced model and the full model was checked and found to be greater than 091
Box 22 Parsimonious Propensity Score Matching model matching variables
Programme suitability criteria Need Sum of OASys Section 11 Thinking and Behaviour scores (OASys) Risk OASys total weighted score (OASys) Motivation to change behaviour (OASys) Problems with readingwritingnumeracy (OASys) Problems with current psychiatric problems (OASys)
Static risk factors Gender (SPCR) Age (SPCR) Index offence type Violent (PNC) Index offence type Sexual (PNC) Index offence type Acquisitive (PNC) Index offence type Drug (PNC) Index offence type Robbery (PNC)
Dynamic risk factors Agree Want to get help to stop offending (SPCR) Victim hurt denial CRIME-PICS (SPCR) Used class BC drugs in the four weeks before custody (SPCR) Sleeping rough prior to custody (SPCR)
Note Data source is listed in parentheses
48 Caliendo and Kopeinig (2005) note that weights are required to consistently estimate the probability of treatment when sampling is choice based However as an odds-ratio estimated using incorrect weights will be a scalar multiple of the true odds-ratio (a monotonic transformation of the propensity score) matching may proceed on the odds-ratio even when sampling weights are unknown (Heckman and Smith 1995)
49 The full model (including all 42 pre-selected variables) was run successively with the least significant variable dropped each time using the stepwise function with a confidence limit for retention equal to 01
18
Assessment of control match quality
The robustness of the calculated treatment effect depends on the quality of the match achieved The degree of lsquosimilarityrsquo between the treatment and the control group was tested using a range of statistical techniques (namely standardised bias reduction and t-tests of equality of means) Please refer to the Technical Annex for the detailed results of these tests
In summary equality of means testing confirmed no statistically significant difference between the treatment and matched control group across all 42 characteristics pre-selected as being predictive of ETS participation and reconviction risk The control group is therefore well matched on the pre-selected matching characteristics with a similar expected reconviction rate as the treatment group allowing robust estimation of the treatment effect
Whilst every effort has been made to remove the selection bias it is possible that an unmeasured bias may still remain uncontrolled Further checks on average sentence length and participation on other accredited OBP interventions (using the Offending Behaviour Programme Interventions Database) were carried out which revealed some differences between the treatment and control groups It was found that the average sentence length of the treatment group (975 days) was longer than that for the control group (727 days) It was also found that 6 of the treatment group and 2 of the control group had been on another accredited OBP during the SPCR sentence though both proportions are small
19
3 Results
The results of this evaluation show that ETS was effective in bringing about a statistically significant reduction in both the reconviction rate and frequency of reoffending in the year following release from custody for 257 prison-based participants on ETS between 2006 and 2008 Almost identical results were found for completers (when drop-outs were excluded) though the significance of the reduction in the one-year reconviction rate was lost due the reduction in the size of the sample
A secondary finding of the research was a low adherence to the suitability targeting criteria among those prisoners that actually received the programme over the period This suggests that the programme was not always administered to the most suitable group of prisoners which may have limited the effectiveness of the programme in reducing reoffending
The research findings are presented and summarised in this section The conclusions and policy-relevant implications of the results are discussed in the Implications section More detail on the results is contained in the Technical Annex
Effectiveness of ETS in reducing reoffendingThe impact of the programme is identified as the average causal effect of participation on the ETS programme (the treatment) on reconviction outcomes As the control group was created using a methodologically robust propensity score matching model and established as valid by tests on the quality of the match it represents a good proxy for the counterfactual untreated outcome of the treatment group50 The observed difference in the average conviction rates between the treatment and control groups may therefore be considered the causal effect of the ETS intervention known as the average treatment effect on the treated (ATT)
All programme participants
The reconviction rate and the frequency of reoffending of all ETS participants (including non-completers) was found to be significantly lower than the matched control group in the year following release from custody No statistically significant impact was found on the severe offence reconviction rate
The average reconviction outcomes of the treated and untreated groups and the difference between them (ATT with t-stat) are presented in Table 31 The results show that the proportion of programme participants that were reconvicted within one year (272) was six percentage points below that observed in the control group (335) and that this difference was statistically significant A statistically significant difference was also found in terms of frequency of reoffending as participants (607 offences) were reconvicted of 60 fewer recordable offences within one year per 100 released prisoners than the control group (1208 offences)
50 Testing revealed no statistical difference in the mean values of the two groups across all 42 variables pre-selected as being predictive of ETS participation and reconviction risk
20
These are the noteworthy results of this analysis as they show that ETS was successful in significantly reducing both the reconviction rate and frequency of reoffending of participants After contradictory evidence and debate the results seem to support Friendship et alsrsquo (2002) positive results though the magnitude of the effect is smaller Whilst the severe offences reconviction rate was lower in the treatment group the difference was not significant This is not surprising given the programme is not designed to target severe offending and the rarity of severe offences
Table 31 Impact of ETS on reconviction outcomes of the SPCR sample
SampleReconviction rate
(one-year)
Reoffences per 100 released prisoners
(one-year)
Severe offences reconviction rate
(one-year)Average outcomes
Treatment group (n=257) 272 607 08Matched control group 335 1208 09
Treatment effect (ATT) -62a -601b -01(t-stat) -204 -547 -013Note Average treatment effect on the treated (ATT) is the difference between the mean outcome of the
treatment group and the matched control groupa Statistically significant at the 005 levelb Statistically significant at the lt0001 level
Completers only
The evaluation has followed the lsquointention-to-treatrsquo approach in general (consistent with Colledge et al 1999) However not all participants completed the programme ndash 8 of the treated final sample did not complete the course As in previous evaluations non-completers have been removed from the analysis to test any sensitivity of the treatment effect to programme completion
21
The results are summarised in Table 32 showing an almost identical though not statistically significant reduction in the rate of reconviction for completers when drop-outs were excluded The loss in significance was most likely due to the reduction in the size of the sample The statistically significant reduction in the frequency of reoffending was retained with an almost identical effect size No significant impact was again found for the severe offences reconviction rate
Table 32 Impact of ETS on reconviction outcomes of the SPCR sample completers only
SampleReconviction rate (one-
year)
Reoffences per 100 released prisoners
(one-year)
Severe offences reconviction rate
(one-year)Average outcomesTreatment group (n=237) 270 599 08Matched control group 335 1208 09Treatment effect (ATT) -65 -609a 00(t-stat) -156 -321 -001Note Average treatment effect on the treated (ATT) is the difference between the mean outcome of the
treatment group and the matched control groupa Statistically significant at the 001 level
Completers of intervention programmes are often found to have a stronger effect than non-completers This may be due to a self-selection effect whereby completers may be more motivated or have fewer needs or have a lower risk of reoffending Therefore effectiveness of the programme should not be evaluated against completers alone whose outcomes may have been better even without the intervention Rather the true effect of the intervention as it is used in practice should be evaluated by considering all participants both completers and non-completers (Colledge et al 1999 National Offender Management Service 2005) Accordingly more weight should be placed on the findings for all participants
Assessment of suitability targeting
The HM Prison Service guidance to assess suitability for ETS and other OBPs notes
ldquoOne of the principles of effective interventions is appropriate targeting An offender is more likely to benefit from participation in an offending behaviour programme if heshe demonstrates levels of risk and need that are appropriate for the particular interventionrdquo51
To facilitate appropriate targeting HM Prison Service designed a set of risk need and responsivity suitability criteria to identify those prisoners that were most suitable for the programme These criteria were set out in the Context section Strict adherence to these criteria should ensure that ETS is appropriate and relevant for all participants
51 HM Prison Service (2007) p3
Figure 31 Need and risk score distributions for non-participant and ETS participant groups with suitability thresholds
Need Sum of OASys Section 11 Thinking and Behaviour scores (OASys)
Risk OASys total weighted score (OASys)
0
5
10
15
4 7 140
5
10
15
4 7 140 0
Per
cen
t
Per
cen
t
0
5
10
15
50 100 1500
Per
cen
t
0
5
10
15
50 100 1500
Per
cen
t
Non-participant
Non-participant
ETS participant
ETS participant
22
Need and risk requirements
The need and risk52 profiles of the participant and non-participant groups53 were compared The comparison is presented graphically in Figure 31 with needrisk ETS programme suitability thresholds marked with vertical red lines (observations to the right of the line rate as lsquosuitablersquo for ETS) In the case of need the dual thresholds of 7 or 4 (with at least one individual score of 2 indicating significant problems) are marked A single vertical red line for 56 and above is marked as the risk threshold
With regard to both need and risk the participant and non-participant distributions follow a broadly similar pattern The majority of the non-participant group had a needrisk profile that would have made them suitable for ETS This is good news for matching purposes as it means that similar prisoners at the pre-treatment stage could have been treated or remained untreated More importantly a lot of prisoners in the participant group fall to the left of the red vertical line in both charts ndash and so rated as lsquonot strictly suitablersquo for ETS
52 As the OASys data do not include OGRS2 it has only been possible to define suitability with respect to the OASys total weighted score This is not necessarily invalid as the guidance notes ldquoIf an offender passes the cut-off on one but not both scales [ie OGRS2 and OASys total weighted score] you can consider them to be suitable to progress to the needs assessment stagerdquo HM Prison Service (2007) p5
53 This analysis is based on the full sample of 3512 (316 participants and 3196 non-participants) and not the treatment and matched control groups
23
Further investigation of the need and risk (OASys total weighted score) scores revealed that only 58 of the participant group were suitable for ETS (met both need and risk requirements simultaneously) while 49 of the non-participant group would have been suitable (Table 33)
Table 33 ETS suitability criteria fulfilment non-participant and ETS participant groups
SuitabilityNon-participants ETS participants
N N Not strictly suitable for ETS 1629 510 134 424Strictly suitable for ETS 1567 490 182 576Total 3196 1000 316 1000NoteSuitability is defined with reference to risk (an OASys score 56 or above) and need (a total score of 7
or above and a total score of 4 or above with at least one individual score of 2 (indicating significant problems))
It is important to note some caveats to this analysis The suitability criteria for ETS have been reviewed and changed over time The ETS start dates of participants in the SPCR sample stretch from March 2006 to September 2008 whilst the specification of the risk tool as OGRS2 or OASys was only introduced in August 2007 (the Sentencing Planning Risk Predictor was used previously) Similarly this period covers a time when both a local semi-structured interview and the OASys assessment were sources of need information for programme staff As the programme did not itself change substantially during this period later indicators of suitability for the intervention are retrospectively relevant from a targeting perspective54 though the retrospective application of the later indicators provides no reflection of the accuracy in the application of the targeting criteria during the earlier period
There is also some flexibility allowed in the application of the suitability criteria individuals with an OASys or OGRS2 score within three points below the cut-off may be progressed to ETS and special considerations are made for indeterminate sentence prisoners and sex offenders The original indicator of criminogenic needs the ETS Semi-Structured Interview has gradually been replaced by OASys Section 11 scores as confirmed in later guidance (National Offender Management Service 2009)55
54 Assuming that amendments to the suitability identification tools over time represent improvements in targeting later indicators applied retrospectively are likely to provide a better indicator of suitability than older indicators Accordingly this analysis provides no reflection on the selection process of treatment managers at the time but rather a pure view of suitability of treated participants
55 later guidance also specified definition of risk groups suitable for ETS with reference to OGRS3 (score 50 or above)
24
Readiness and responsivity criteria
A similar comparative analysis was also carried out for the readiness and responsivity criteria The HM Prison Service (2007) guidance lists assessment items in the lsquoResponsivity Assessmentrsquo and lsquoReadiness Assessmentrsquo sections including intellectual ability literacy dyslexia mental and physical health psychopathic traits motivation to change behaviour disability However the guidance does not specify the data variables or the thresholds to be used To investigate these readiness and responsivity criteria the lsquoexclusion criteriarsquo for general offending programmes from the OASys Manual56 were used
Again the profiles of the participant and non-participant groups57 were compared with a similar pattern emerging Figure 32 plots the distributions side-by-side with the readiness and responsivity thresholds marked by red vertical lines (this time profiles to the right of the line are not strictly suited to ETS) As with the need and risk profiles the two distributions are unexpectedly similar with a number of the participant group recorded as lsquonot at allrsquo motivated or having lsquosignificant problemsrsquo More specifically of the participant group
109 were scored as lsquonot at allrsquo motivated to change their behaviour
74 had lsquosignificant problemsrsquo with readingwritingnumeracy
61 had lsquosignificant problemsrsquo with learning difficulties
103 had lsquosignificant problemsrsquo with current psychological problemsdepression and
58 had lsquosignificant problemsrsquo with current psychiatric problems
56 OASys development team (2001) p16757 This analysis is based on the full sample of 3512 (316 participants and 3196 non-participants) and not the
treatment and matched control groups
Figure 32 Readiness and responsivity score distributions for non-participant and ETS participant groups with suitability thresholds
0
20
40
60
Verymotivated
Quitemotivated
Not at all0
20
40
60
Verymotivated
Quitemotivated
Not at all
Per c
ent
Per c
ent
Non-participant ETS participant
Motivation (OASys)
0
50
100
No problems Someproblems
Significantproblems
Per c
ent
Non-participant
Problems with readingwritingnumeracy (OASys)
0No problems Some
problemsSignificantproblems
Per c
ent
ETS participant
020
6080
No problems Someproblems
Significantproblems
Per c
ent
Non-participant
Problems with learning difficulties (OASys)
0No problems Some
problemsSignificantproblems
Per c
ent
ETS participant
0
20
40
60
No problems Someproblems
Significantproblems
Per c
ent
Non-participant
Problems with current psychological probelmsdepression (OASys)
0
20
40
60
No problems Someproblems
Significantproblems
Per c
ent
ETS participant
4020
6080
40
50
100
0
50
100
No problems Someproblems
Significantproblems
Per c
ent
Non-participant
Problems with current psychological probelms (OASys)
0
50
100
No problems Someproblems
Significantproblems
Per c
ent
ETS participant
25
26
Analysis of treatment effect by suitability
To investigate the importance of adherence to the need and risk principles in participant targeting the reconviction outcomes of the treatment group were also analysed according to participant suitability As before suitability is defined with reference to risk (an OASys score 56 or above) and need (a total score of 7 or above and a total score of 4 or above with at least one individual score of 2 (indicating significant problems)) As there is some flexibility in the application of the criteria this is termed lsquostrict suitabilityrsquo
Of the treatment group 164 (64) were strictly suitable for ETS whereas 1404 (56) of the control group were strictly suitable The remainder of each group were not strictly suitable
The results of the analysis (Table 34) show that the one-year reconviction rate for strictly suitable treated offenders (172) was lower than that for not strictly suitable ones (329) Similarly the frequency of reoffending of strictly suitable offenders (398 reoffences) was also lower than that of the not strictly suitable offenders (726 reoffences)
Table 34 Impact of ETS on reconviction outcomes of the SPCR sample lsquonot strictly suitablersquo and lsquostrictly suitablersquo participants only
SampleReconviction rate
(one-year)
Reoffences per 100 released prisoners
(one-year)
Severe offences reconviction rate
(one-year)Not strictly suitable (n=93) 329 726 12Strictly suitable (n=164) 172 398 -
Caveats and limitations of the researchIt is important to note that the number of ETS-treated prisoners provided by SPCR (257) is a limited sample falling in the lower range of previous evaluation samples (from 114 to 2195 participants) as a result of a low intervention rate and missing data filters Results based on limited samples may not be reliable indicators of the wider population and in some cases the sample sizes may be too small to detect differences which may actually exist58 Tests of statistical significance are carried out on the results of this evaluation for this reason The low intervention rate means that there is a large pool (2514) from which to form a well-balanced matched control group It should also be noted that all SPCR data are self-reported
Whilst every effort has been made to remove the selection bias it is possible that an unmeasured bias may still remain uncontrolled Further checks revealed some differences between the treatment and control groups It was found that the average sentence length of the treatment group (975 days) was longer than that for the control group (727 days)
58 This caveat is more relevant where no effect is detected ndash in which case the correct conclusion may be that the sample was insufficient to detect an effect rather than that the intervention had no effect For a discussion of sample size detection power and reliability of reconviction rates please see Harper and Chitty (2004) p8
27
The possibility of multiple intervention participation has not been controlled for as the sample size did not permit such analysis Examination revealed that 6 of the treatment group and 2 of the control group had been on another accredited OBP during the SPCR sentence though both proportions are small It is also possible that prisoners may have participated on non-accredited OBPs or a substance misuse treatment during their SPCR sentence period which may have contributed to the observed treatment effect If the rate of participation in other programmes was higher in the ETS treated group the estimated treatment effect of ETS would represent a pooled effect of all treatments received and so may be overstated If the rate of participation in other programmes was higher in the ETS control group the estimated treatment effect of ETS may be understated
This evaluation has been limited to using one-year conviction rates as two-year reconviction outcome data will only become available in 12 monthsrsquo time Thus it is not possible at this time to conclude on the duration of the impact of ETS ndash that is to say whether the observed one-year effect endures two years on from release or whether it dissipates (as found by Cann et al 2003) It is planned to conduct a follow-up study of reconviction at the two-year post-release stage (please see the Further research section)
28
4 Implications
This report has evaluated the effectiveness of the prison-based ETS programme by linking participation to reconviction outcomes The evaluation results show that ETS was successful in significantly reducing both the reconviction rate and frequency of general reoffending of participants The most important implications of these results are outlined below
This research has added some clarity to the discordant evidence base on the effectiveness of ETS by improving on key methodological limitations of previous evaluation studies This provides a more solid evidence base of support on which to build intervention-based policy
The most important message for policy makers is that ETS the most frequently delivered offending behaviour programme over the past decade did work to significantly reduce reoffending in the short term (one year) at least This result should assist policy makers to prioritise and focus operational resources towards the most productive intervention efforts Though ETS has since been replaced by the Thinking Skills Programme (TSP) the results of this evaluation demonstrate that cognitive-behavioural OBPs can work to significantly reduce reoffending for offenders released from prison The findings are likely to be particularly relevant for TSP which represents a refresh and update of ETS in line with advances in theory and practice However these specific findings cannot be generalised to other cognitive-behavioural intervention programmes Each programme has its own distinct objectives delivery methods and targeted characteristics and so would require a discrete evaluation
For practitioners although the findings on reduced reconviction rates are encouraging and reflect a job well done there are also lessons to be learned A low adherence to the risk need and responsivity suitability criteria was found among those prisoners that actually received the programme between 2006 and 2008 This suggests that the programme was not always administered to the most suitable prisoners Given that research supports the importance of risk need and responsivity targeting for effective treatment (Hollin 1995 Taxman and Thanner 2006 Palmer et al 2009 Gendreau et al 2009 Andrews and Bonta 2010) and the finding of lower reconviction rates for strictly suitable prisoners this may have limited the effectiveness of the programme in reducing reoffending The fact that a significant reduction in reconviction was found in spite of this finding suggests that a stricter application of the targeting criteria might further enhance the effectiveness of the programme National Offender Management Service practitioners report that the accuracy of targeting has improved over time meaning that a similar evaluation of ETS in a later period (post-2008) or TSP might find an even more significant effect
29
Future researchers may be able to draw on the methodology developed for this research as a methodological blueprint for further evaluations The findings of this research could be complemented and enhanced by addressing some of the outstanding evidence gaps framed by a set of research questions and proposed research designs set out in the Further research section
30
5 Further research
Whilst this evaluation has added some clarity to the evidence base on the effectiveness of general cognitive-behavioural programmes evidence gaps remain These gaps are defined by the research questions listed below with suggested research designs that could provide robust answers to complement and enhance the findings in this paper
Duration of the reduction in reoffending effect Does ETS have a lasting impact or will the observed one-year effect have dissipated after two years as found by Cann et al (2003) It is planned to conduct a follow up study of the treated and matched control individuals of this evaluation two years after their release applying the same methodology to investigate the duration of the ETS impact in one yearrsquos time
Cost-effectiveness of the programme Is the cost of ETS provision justified by the observed reduction in reoffending The reduction in reoffences estimated in this evaluation could be used as the basis for a cost-benefit analysis of the ETS programme Linking the estimated reduction in reoffending to estimates of the social cost of criminal offences the avoided social costs of crime (the benefit) could be compared to data on the cost of ETS provision (estimated to be in the region of pound2000 per prisoner)59
Generalisability of the findings Would the observed effect be verified or even more significant in a larger sample By repeating the evaluation methodology but replacing SPCR variables with OASys data variables where possible the full population of prisoners undertaking ETS could be evaluated The downside to this approach is the compromised choice of data for dynamic risk factors Other benefits would be the ability to employ more matching variables and being able to evaluate some of the smaller accredited programmes This research could also be used as a methodological blueprint to evaluate substance misuse intervention programmes
What works for whom What are the characteristics of the prisoners that benefit most from ETS and other OBPs The difference in reconviction outcome for each treated prisoner compared with the matched control could be regressed on a range of treated prisonersrsquo characteristics to identify which kinds of offenders under which circumstances most benefit from undertaking ETS
The effectiveness of TSP Does ETSrsquos replacement the Thinking Skills Programme (TSP) have a lesser similar or greater impact on reconviction A similar evaluation methodology could be used to evaluate the effectiveness of TSP in reducing reconviction outcomes though this would not be possible for a couple of years as TSP was only introduced in 2009
59 Social Exclusion Unit (2002) p 81
31
Database of research findings What does the evidence base tell us about the effectiveness of ETS Policy makers are often influenced by the latest study to be published rather than the synthesised message of the collective body of evaluation research The formation and maintenance of a database of outcome studies could be used for systematic reviews and meta-analytic analysis to produce a comprehensive review of ETS efficacy to inform and guide policy makers and practitioners (for example see Tong and Farrington 2006)
In the longer term samples of the other cohort studies being conducted by MoJ ndash the probation sample of the Offender Management Community Cohort Study (OMCCS) and the juvenile offenders sample of the Juvenile Cohort Study (JCS) ndash could be similarly linked to the same management information databases (for example OASys) as linked to SPCR in this evaluation When combined with OASys assessment data and viewed as a collective database this would be the richest known single evidence base in existence on the static and dynamic factors involved in offending behaviour
32
6 Additional resources
Readers interested in researching further the issues and topics probed in this paper further may want to consult the following publications websites and other useful sources of information
HM Prison Service Offender Behaviour Programmes (OBPs) httpwwwhmprisonservicegovukadviceandsupportbeforeafterreleaseoffenderbehaviourprogrammes
Ministry of Justice Research httpwwwjusticegovukpublications
National Offender Management Service httpwwwjusticegovukaboutnomshtm
Correctional Services Accreditation Panel httpwwwjusticegovukaboutcorrectional-services-accreditationhtm
National Reducing Reoffending Delivery plan (National Offender Management Service (NOMS) website) httpnomsjusticegovuk
Social Exclusion Unit (Cabinet Office) httpwwwcabinetofficegovuksocial_exclusion_task_forceaspx
Office for National Statistics (ONS) httpwwwstatisticsgovuk
33
7 References
Andrews D A and Bonta J (2010) The psychology of criminal conduct (5th ed) New Providence NJ LexisNexis Matthew Bender
Blackburn R (1972) lsquoDimensions of hostility and aggression in abnormal offendersrsquo Journal
of Consulting and Clinical Psychology 38 pp 20ndash26
Caliendo M and Kopeinig S (2005) lsquoSome Practical Guidance for the Implementation of Propensity Score Matchingrsquo IZA Discussion Papers Series Discussion Paper No 1588 Institute for the Study of Labor (IZA)
Cann J Falshaw L Nugent F and Friendship C (2003) Understanding What Works
cognitive accredited skills programmes for adult men and young offenders Research Findings 226 London Home Office
Cann J (2006) Cognitive skills programmes impact on reducing reconviction among a
sample of female prisoners Home Office Research Study 276 London Home Office
Clarke A Simmonds R and Wydall S (2004) Delivering cognitive skills programmes in
prison a qualitative study Home Office Research Study 242 London Home Office
Clarke D A (2000) Theory Manual for Enhanced Thinking Skills Prepared for the Joint Prison Accreditation Panel London Home Office
Colledge M Collier P and Brand S (1999) Crime reduction programme and constructive
regimes in prison Programmes for offenders Guidance for evaluators Crime reduction programme ndash guidance note 2 Research Development and Statistics Directorate London Home Office
Copas J and Marshall P (1998) lsquoThe offender group reoffending scale A statistical reoffending score for use by probation officersrsquo Applied Statistics 47(1) 159ndash171
Dehejia RH and Wahba S (2002) lsquoPropensity Score-Matching Methods for Nonexperimental Causal Studiesrsquo Review of Economics and Statistics February 2002 Vol 84 No 1 pp 151ndash161
Eysenck S B and McGurk B J (1980) lsquoImpulsiveness and venturesomeness in a detention centre populationrsquo Psychological Reports 47 pp 1299ndash1306
34
Falshaw L Friendship C Travers R and Nugent F (2003) Searching for what works An
evaluation of cognitive skills programmes Home Office Research Study 206 London Home Office
Falshaw L Friendship C Blud L Travers R and Nugent F (2004) lsquoSearching for what works HM Prison Service accredited cognitive skills coursesrsquo British Journal of Forensic
Practice 6 (2) pp 3ndash13
Friendship C Blud L Erikson M and Travers R (2002) An evaluation of cognitive
behavioural treatment for prisoners Home Office Research Study 161 London Home Office
Frude N Honess T and Maguire M (1994) CRIME-PICS II Manual Cardiff Michael and Associates
Gendreau P Smith P and Theacuteriault YL (2009) lsquoChaos theory and correctional treatment Common sense correctional quackery and the law of fartcatchersrsquo Journal of Contemporary
Criminal Justice 25 384ndash396
Harper G and Chitty C (eds) (2004) The impact of corrections on re-offending A review of
lsquoWhat Worksrsquo (3rd ed) Home Office Research Study No 291 London Home Office
Heckman J and Smith J (1995) rsquoAssessing the Case for Social Experimentsrsquo Journal of
Economic Perspectives 9 85ndash110
HM Prison Service (2007) Assessing Suitability for Offending Behaviour Programmes Risk
Need amp Responsivity Guidance for Treatment Managers Offending Behaviour Programmes Unit HM Prison Service
Home Office (2006) A Five Year Strategy for Protecting the Public and Reducing Re-
offending London The Stationary Office
Hollin C R (1995) lsquoThe meaning and implications of ldquoprogramme integrityrdquorsquo In J McGuire (Ed) What works Reducing reoffending Guidelines from Research and Practice (pp 195ndash208) Chichester England John Wiley and Sons
Howard P (2009) Improving prediction of re-offending using the Offender Assessment
System Research Summary 209 London Ministry of Justice Available at httpwwwjusticegovukpublicationsdocsoasys-research-summary-02-09pdf
Howard P Francis B Soothill K and Humphreys L (2009) OGRS 3 the revised Offender
Group Reconviction Scale Research Summary 709 London Ministry of Justice
35
Leuven E and Sianesi B (2003) psmatch2 Stata module to perform full Mahalanobis and
propensity score matching common support graphing and covariate imbalance testing httpideasrepecorgcbocbocodes432001html version 315 2 May 2009
Mak A S (1991) lsquoPsychosocial control characteristics of delinquents and nondelinquentsrsquo Criminal Justice and Behaviour 18 (3) pp 297ndash303
McDougall C Clarbour J Perry A and Bowles R (2009) Evaluation of HM Prison Service
Enhanced Thinking Skills Programme Report on the implementation of a randomised
controlled trial London Ministry of Justice
McDougall C Clarbour J Perry A and Bowles R (2009) Evaluation of HM Prison Service
Enhanced Thinking Skills Programme Report on the outcomes of a randomised controlled
trial London Ministry of Justice
Ministry of Justice (2009) The Correctional Services Accreditation Panel Report 2008-
2009 Available at httpwwwjusticegovukpublicationsdocscorrectional-services-report-20080-09pdf
Ministry of Justice (2010) Reoffending of adults results from the 2008 cohort ndash England and
Wales Ministry of Justice Statistics bulletin London Ministry of Justice Available at httpwwwjusticegovukpublicationsdocsreoffending-adults-2008-cohortpdf
National Offender Management Service (2005) Understanding research methods and
findings lsquoWhat Worksrsquo Briefing 305 Available at httprdshomeofficegovukrdspdfs05wwbn3pdf
National Offender Management Service (2009) Suitability for Accredited Interventions Risk
Need amp Responsivity Targeting Criteria for Offender Managers and Treatment Managers
Interventions and Substance Misuse Group Directorate of Commissioning and Operational Policy National Offender Management Service May 2009
OASys Data Evaluation and Analysis Team O-DEAT (2010) OASys caveats notes and
limitations ndash layered OASys (May 10)
OASys development team (2001) Offender Assessment System OASys User Manual OASys Manual V2 Crown Copyright 2002
Palmer EJ McGuire J Hatcher RM Hounsome JC Bilby CAL and Hollin CR (2009) lsquoAllocation to offending behavior programs in the English and Welsh probation servicersquo Criminal Justice and Behavior 36 909ndash922
36
Rosenbaum P R and Rubin D B (1983) lsquoThe Central Role of the Propensity Score in Observational Studies for Causal Effectsrsquo Biometrika 70 41ndash55
Smith J and Todd P (2005) rsquoDoes matching overcome LaLondersquos critique of nonexperimental estimatorsrsquo Journal of Econometrics Elsevier vol 125(1-2) pages 305ndash353
Social Exclusion Unit (2002) Reducing re-offending by ex-prisoners Available from httpwwwcabinetofficegovukmediacabinetofficesocial_exclusion_task_forceassetspublications_1997_to_2006reducing_reportpdf
Stewart D (2008) The problems and needs of newly sentenced prisoners results from a
national survey Ministry of Justice Research Series 1608 Published online at httpwwwjusticegovukpublicationsresearch2008htm
Taxman FS and Thanner M (2006) lsquoRisk need and responsivity (RNR) It all dependsrsquo Crime and Delinquency 52 28ndash51
Tong LSJ and Farrington DP (2006) lsquoHow effective is the ldquoReasoning and Rehabilitationrdquo programme in reducing reoffending A meta-analysis of evaluations in four countriesrsquo Psychology Crime and Law 12 3ndash24
37
Appendix 1 Technical annex
Full set of matching variables (covariates)Programme suitability criteriaoasys_need Need Sum of OASys Section 11 Thinking and Behaviour scores
(OASys)oasys_score Risk OASys total weighted score (OASys)oasys_motiv Motivation to change behaviour (OASys)oasys_litnum Problems with readingwritingnumeracy (OASys)oasys_lrndiff Problems with learning difficulties (OASys)oasys_psychgl Problems with current psychological problemsdepression (OASys)oasys_psychtr Problems with current psychiatric problems (OASys)
Static risk factorsspcr_genderf Gender Female (SPCR)spcr_age Age (SPCR)spcr_marst_mar Marital status Married (SPCR)spcr_marst_lvp Marital status Living with a partner (SPCR)spcr_ethnic_mix Ethnicity Any Mixed background (SPCR)spcr_ethnic_as Ethnicity Any Asian background (SPCR)spcr_ethnic_bl Ethnicity Any Black background (SPCR)spcr_ethnic_oth Ethnicity Any Other background (SPCR)pnc_copas Copas rate on release (PNC)pnc_ttlprevconv Previous convictions (PNC)pnc_ttlprevconv2 Previous convictions squared (PNC)pnc_ttlprevconvsev Previous severe convictions (PNC)pnc_ttlprevconvsev2 Previous severe convictions squared (PNC)pnc_index_vio Index offence type Violent (PNC)pnc_index_sxl Index offence type Sexual (PNC)pnc_index_acq Index offence type Acquisitive (PNC)pnc_index_drg Index offence type Drug (PNC)pnc_index_rob Index offence type Robbery (PNC)spcr_famconv Family member has been convicted of a non-motoring offence
(SPCR)spcr_fampris Family member has been in prison (SPCR)
Dynamic risk factorsspcr_motivstoffy Agree Want to stop offending (SPCR)spcr_motivstoffn Disagree Want to stop offending (SPCR)spcr_motivhlpstoffy Agree Want to get help to stop offending (SPCR)spcr_motivhlpstoffn Disagree Want to get help to stop offending (SPCR)spcr_attg General attitude to offending CRIME-PICS (SPCR)spcr_atta Anticipation of reoffending CRIME-PICS (SPCR)spcr_attv Victim hurt denial CRIME-PICS (SPCR)spcr_atte Evaluation of crime as worthwhile CRIME-PICS (SPCR)spcr_drug4wka Used class A drugs in the four weeks before custody (SPCR)spcr_drug4wkbc Used class BC drugs in the four weeks before custody (SPCR)spcr_drug4wkinj Injected illegal drugs in the four weeks before custody (SPCR)spcr_accomtrans Transient accommodation prior to custody (SPCR)spcr_accomrough Sleeping rough prior to custody (SPCR)spcr_edqual Educational (qualifications) attainment (SPCR)spcr_job4wk Was in paid work in the four weeks before custody (SPCR)
38
Logistic regression model
Table A1 Logistic regression model of prisoner characteristics influencing probability of treatment (ETS) and reconviction outcomes
Coefficient Standard error P-valueETS suitabilityNeed (thinking and behaviour) 0082 0027 0002Risk (OASys score) 0005 0003 0069Motivation to change behaviour (OASys) 0323 0122 0008Problems with readingwritingnumeracy -0303 0116 0009Problems with current psychiatric problems 0335 0131 0011
GenderMale Reference
categoryFemale 0736 0177 0000
Age -0030 0009 0000
Index offence typeOther Reference
categoryViolent 1223 0296 0000Sexual 2094 0389 0000Acquisitive 0243 0313 0438Drug 1192 0309 0000Robbery 1552 0329 0000
Motivation to stop offendingDisagreed with ldquoI want to get help to stop offendingrdquo all other responses
Reference category
Agreed with ldquoI want to get help to stop offendingrdquo
0315 0091 0001
Offending-related attitudesVictim hurt denial 0078 0026 0003
Drug useUsed Class BC drugs in the 4 weeks before custody
-0195 0150 0193
AccommodationStable accommodation prior to custody Reference
categoryTemporary accommodation prior to custody Reference
categorySleeping rough prior to custody -0709 0409 0083
Constant -4933 0554 0000Notes Number of observations = 2771 (257 treated 2514 untreated) Pseudo R2 = 00958 LR
chi2(16)=16397 probgtchi2 00000
39
Calculation of the average treatment effect on the treated (ATT)
Outcome measures
pnc_reconvind Indicator of reconviction within one yearpnc_reofffreq Frequency of proven reoffending within one yearpnc_reconvindsev Indicator of severe offence reconviction within one year
Table A2 Average treatment effect on the treated (ATT)
Variable Sample Treated Controls(Difference)
ATTa
Standard error t-stat
pnc_reconvind Unmatched 0272 0370 (-0098) 0031 -311Matched ATT 0272 0335 -0062 0031 -204
pnc_reofffreq Unmatched 0607 1422 (-0815) 0182 -447Matched ATT 0607 1208 -0601 0110 -547
pnc_reconvindsev Unmatched 0008 0007 (0001) 0006 011Matched ATT 0008 0009 -0001 0006 -013
a ATT is the difference between the mean outcome of the treatment group and the matched control group
40
Tests of covariate balancing
Table A3 Means standardised bias reduction and t-tests for equality of means in the treatment and control groups before and after matching
Variable SampleMean
bias bias
reductiont-test
Treatment Control t pgttoasys_need Unmatched 7381 6703 203 299 000
Matched 7381 7269 34 834 039 070oasys_score Unmatched 77335 75658 48 070 049
Matched 77335 77060 08 836 009 093oasys_motiv Unmatched 1210 1141 110 165 010
Matched 1210 1201 15 864 017 087oasys_litnum Unmatched 0350 0416 -102 -150 013
Matched 0350 0361 -17 830 -020 084oasys_lrndiff Unmatched 0187 0184 05 008 094
Matched 0187 0180 13 -1510 014 089oasys_psychgl Unmatched 0486 0426 89 139 017
Matched 0486 0499 -19 791 -020 084oasys_psychtr Unmatched 0237 0142 194 327 000
Matched 0237 0224 27 861 028 078spcr_genderf Unmatched 0214 0124 243 408 000
Matched 0214 0199 39 838 041 068spcr_age Unmatched 28008 30216 -238 -349 000
Matched 28008 28364 -38 839 -046 065spcr_marst_mar Unmatched 0070 0093 -84 -123 022
Matched 0070 0075 -19 776 -023 082spcr_marst_lvp Unmatched 0296 0256 90 140 016
Matched 0296 0250 103 -149 117 024spcr_ethnic_mix Unmatched 0062 0038 110 187 006
Matched 0062 0040 100 92 112 026spcr_ethnic_as Unmatched 0047 0041 28 044 066
Matched 0047 0035 57 -1056 067 050spcr_ethnic_bl Unmatched 0035 0065 -137 -189 006
Matched 0035 0063 -127 76 -145 015spcr_ethnic_oth Unmatched 0000 0004 -89 -101 031
Matched 0000 0002 -51 431 -076 045pnc_copas Unmatched -0902 -0880 -27 -040 069
Matched -0902 -0910 10 644 011 091pnc_ttlprevconv Unmatched 10946 12746 -163 -227 002
Matched 10946 11580 -57 648 -069 049pnc_ttlprevconv2 Unmatched 212140 314300 -133 -163 010
Matched 212140 257960 -60 552 -082 041pnc_ttlprevconvsev
Unmatched 0132 0146 -34 -050 062Matched 0132 0165 -79 -1300 -087 039
pnc_ttlprevconvsev2
Unmatched 0163 0209 -57 -074 046Matched 0163 0239 -95 -657 -102 031
41
Variable SampleMean
bias bias
reductiont-test
Treated Control t pgttpnc_index_vio Unmatched 0327 0245 182 288 000
Matched 0327 0311 36 804 039 070pnc_index_sxl Unmatched 0078 0040 162 286 000
Matched 0078 0078 -03 982 -003 098pnc_index_acq Unmatched 0175 0303 -302 -430 000
Matched 0175 0195 -46 847 -057 057pnc_index_drg Unmatched 0218 0195 57 088 038
Matched 0218 0211 16 718 018 086pnc_index_rob Unmatched 0144 0065 261 469 000
Matched 0144 0133 37 858 037 071spcr_famconv Unmatched 0463 0403 121 185 006
Matched 0463 0433 60 503 067 050spcr_fampris Unmatched 0396 0334 129 200 005
Matched 0396 0354 88 322 098 033spcr_motivstoffy Unmatched 1720 1670 93 139 017
Matched 1720 1719 01 985 002 099spcr_motivstoffn Unmatched 0016 0010 40 065 052
Matched 0016 0007 58 -453 069 049spcr_motivhlpstoffy
Unmatched 1346 1085 338 498 000Matched 1346 1304 55 836 065 052
spcr_motivhlpstoffn
Unmatched 0097 0164 -166 -234 002Matched 0097 0107 -25 850 -031 076
spcr_attg Unmatched 58131 57962 23 033 074Matched 58131 58212 -11 518 -012 091
spcr_atta Unmatched 18393 18516 -50 -073 047Matched 18393 18547 -63 -257 -068 050
spcr_attv Unmatched 11825 10907 321 454 000Matched 11825 11681 50 843 061 054
spcr_atte Unmatched 13996 13809 60 092 036Matched 13996 13871 40 331 045 066
spcr_drug4wka Unmatched 0381 0419 -77 -118 024Matched 0381 0408 -55 289 -062 053
spcr_drug4wkbc Unmatched 0494 0499 -10 -015 088Matched 0494 0486 16 -637 019 085
spcr_drug4wkinj Unmatched 0109 0155 -135 -194 005Matched 0109 0143 -99 265 -114 025
spcr_accomtrans Unmatched 0054 0052 12 019 085Matched 0054 0058 -17 -360 -018 085
spcr_accomrough Unmatched 0027 0054 -138 -188 006Matched 0027 0032 -23 835 -030 076
spcr_edqual Unmatched 1965 1893 36 054 059Matched 1965 1915 25 308 028 078
spcr_job4wk Unmatched 0346 0331 32 049 062Matched 0346 0331 32 17 036 072
Figure A1 Risk OASys total weighted score (OASys) by treatment and control groups
Risk OASys weighted score
8
6
4
2
Per c
ent
Control
0
8
6
4
2
Per c
ent
Treatment
050 100 150 50 100 150
42
Distributions of matching variables by treatment and control groups
Table A4 Need Sum of OASys Section 11 Thinking and Behaviour scores (OASys) by treatment and control groups
Summed scoreControl Treatment
n Valid n Valid 0 111 44 44 1 04 041 89 35 35 6 23 232 126 50 50 11 43 433 156 62 62 13 51 514 219 87 87 24 93 935 234 93 93 19 74 746 262 104 104 23 89 897 281 112 112 37 144 1448 253 101 101 30 117 1179 211 84 84 29 113 11310 184 73 73 15 58 5811 147 58 58 18 70 7012 117 47 47 17 66 6613 62 25 25 7 27 2714 62 25 25 7 27 27Missing 0 00 0 00Total 2514 1000 1000 257 1000 1000Note Control group frequencies are unweighted (a weighted average of controls within the radius calliper is
used in the matching algorithm)
43
Table A5 Motivation to change behaviour (OASys) by treatment and control groups
RatingControl Treatment
n Valid n Valid Not at all 367 146 146 28 109 109Quite motivated 1426 567 567 147 572 572Very motivated 721 287 287 82 319 319Missing 0 00 0 00Total 2514 1000 1000 257 1000 1000Note Control group frequencies are unweighted (a weighted average of controls within the radius calliper is
used in the matching algorithm)
Table A6 Problems with readingwritingnumeracy (OASys) by treatment and control groups
ExtentControl Treatment
n Valid n Valid No problems 1735 690 690 187 728 728Some problems 512 204 204 50 195 195Significant problems 267 106 106 20 78 78Missing 0 00 0 00Total 2514 1000 1000 257 1000 1000Note Control group frequencies are unweighted (a weighted average of controls within the radius calliper is
used in the matching algorithm)
Table A7 Problems with learning difficulties (OASys) by treatment and control groups
ExtentControl Treatment
n Valid n Valid No problems 2185 869 869 226 879 879Some problems 195 78 78 14 54 54Significant problems 134 53 53 17 66 66Missing 0 00 0 00Total 2514 1000 1000 257 1000 1000Note Control group frequencies are unweighted (a weighted average of controls within the radius calliper is
used in the matching algorithm)
Table A8 Problems with current psychological problemsdepression (OASys) by treatment and control groups
Extent Control Treatment
n Valid n Valid No problems 1693 673 673 162 630 630Some problems 572 228 228 65 253 253Significant problems 249 99 99 30 117 117Missing 0 00 0 00Total 2514 1000 1000 257 1000 1000Note Control group frequencies are unweighted (a weighted average of controls within the radius calliper is
used in the matching algorithm)
Figure A2 Age (SPCR) by treatment and control groups
8
6
4
2
0
Per
cen
t
20 40 60 80
8
6
4
2
0
Per
cen
t
20 40 60 80Age (SPCR)
Control Treatment
44
Table A9 Problems with current psychiatric problems (OASys) by treatment and control groups
ExtentControl Treatment
n Valid n Valid No problems 2244 893 893 211 821 821Some problems 184 73 73 31 121 121Significant problems 86 34 34 15 58 58Missing 0 00 0 00Total 2514 1000 1000 257 1000 1000Note Control group frequencies are unweighted (a weighted average of controls within the radius calliper is
used in the matching algorithm)
Table A10 Gender (SPCR) by treatment and control groups
GenderControl Treatment
n Valid n Valid Male 2203 876 876 202 786 786Female 311 124 124 55 214 214Missing 0 00 0 00Total 2514 1000 1000 257 1000 1000Note Control group frequencies are unweighted (a weighted average of controls within the radius calliper is
used in the matching algorithm)
Figure A3 Copas rate on release (PNC) by treatment and control groups
10
5
0-4 -2 0 2
Per c
ent
10
5
0-4 -2 0 2
Per c
ent
COPAS rate on release (PNC)
Control Treatment
45
Table A11 Marital status (SPCR) by treatment and control groups
StatusControl Treatment
n Valid n Valid Married 234 93 93 18 70 70Living with partner 642 255 256 76 296 296Other 1636 651 651 163 634 634Missing 2 01 0 00Total 2514 1000 1000 257 1000 1000Note Control group frequencies are unweighted (a weighted average of controls within the radius calliper is
used in the matching algorithm)
Table A12 Ethnicity (SPCR) by treatment and control groups
Ethnic groupControl Treatment
n Valid n Valid Any White background 2142 852 852 220 856 856Any Mixed background 96 38 38 16 62 62Any Asian background 103 41 41 12 47 47Any Black background 163 65 65 9 35 35Any Other background 10 04 04 0 00 00Missing 0 00 0 00Total 2514 1000 1000 257 1000 1000Note Control group frequencies are unweighted (a weighted average of controls within the radius calliper is
used in the matching algorithm)
Figure A4 Total previous convictions (PNC) by treatment and control groups
30
20
10
050 100 150 200
30
20
10
050 100 150 200
Per c
ent
Per c
ent
Previous convictions (PNC)
Control Treatment
46
Table A13 Previous severe convictions (PNC) by treatment and control groups
NumberControl Treatment
n Valid n Valid 0 2205 877 877 227 883 8831 265 105 105 26 101 1012 34 14 14 4 16 163 5 02 02 0 00 004 5 02 02 0 00 00Missing 0 00 0 00Total 2514 1000 1000 257 1000 1000Note Control group frequencies are unweighted (a weighted average of controls within the radius calliper is
used in the matching algorithm)
Table A14 Grouped index offence type (PNC) by treatment and control groups
Offence type grouping
Control Treatmentn Valid n Valid
Other 384 153 153 15 58 58Violent 616 245 245 84 327 327Robbery 163 65 65 37 144 144Sexual 100 40 40 20 78 78Acquisitive 761 303 303 45 175 175Drug 490 195 195 56 218 218Missing 0 00 0 00Total 2514 1000 1000 257 1000 1000Note Control group frequencies are unweighted (a weighted average of controls within the radius calliper is
used in the matching algorithm)
47
Table A15 Family member has been convicted of a non-motoring offence (SPCR) by treatment and control groups
ResponseControl Treatment
n Valid n Valid No 1486 591 597 137 533 537Yes 1003 399 403 118 459 463Missing 25 10 2 08Total 2514 1000 1000 257 1000 1000Note Control group frequencies are unweighted (a weighted average of controls within the radius calliper is
used in the matching algorithm)
Table A16 Family member has been in prison (SPCR) by treatment and control groups
ResponseControl Treatment
n Valid n Valid No 1658 660 666 154 599 604Yes 831 331 334 101 393 396Missing 25 10 2 08Total 2514 1000 1000 257 1000 1000Note Control group frequencies are unweighted (a weighted average of controls within the radius calliper is
used in the matching algorithm)
Table A17 Agree Want to stop offending (SPCR) by treatment and control groups
ResponseControl Treatment
n Valid n Valid Other 101 40 40 9 35 35Agree 627 249 249 54 210 210Strongly agree 1786 710 710 194 755 755Missing 0 00 0 00Total 2514 1000 1000 257 1000 1000Note Control group frequencies are unweighted (a weighted average of controls within the radius calliper is
used in the matching algorithm)
Table A18 Disagree Want to stop offending (SPCR) by treatment and control groups
ResponseControl Treatment
n Valid n Valid Other 2498 994 994 254 988 988Disagree 7 03 03 2 08 08Strongly disagree 9 04 04 1 04 04Missing 0 00 0 00Total 2514 1000 1000 257 1000 1000Note Control group frequencies are unweighted (a weighted average of controls within the radius calliper is used in the matching algorithm)
Figure A5 General attitude to offending CRIME-PICS (SPCR) by treatment and control groups
15
10
5
020 40 60 80
Per c
ent
Control15
10
5
020 40 60 80
Per c
ent
Treatment
General attitude to offending CRIME-PICS (SPCR)
48
Table A19 Agree Want to get help to stop offending (SPCR) by treatment and control groups
ResponseControl Treatment
n Valid n Valid Other 725 288 288 40 156 156Agree 851 339 339 88 342 342Strongly agree 938 373 373 129 502 502Missing 0 00 0 00Total 2514 1000 1000 257 1000 1000Note Control group frequencies are unweighted (a weighted average of controls within the radius calliper is
used in the matching algorithm)
Table A20 Disagree Want to get help to stop offending (SPCR) by treatment and control groups
ResponseControl Treatment
n Valid n Valid Other 2174 865 865 237 922 922Disagree 268 107 107 15 58 58Strongly disagree 72 29 29 5 19 19Missing 0 00 0 00Total 2514 1000 1000 257 1000 1000Note Control group frequencies are unweighted (a weighted average of controls within the radius calliper is
used in the matching algorithm)
49
Table A21 Anticipation of reoffending CRIME-PICS (SPCR) by treatment and control groups
ScoreControl Treatment
n Valid n Valid 8 2 01 01 0 00 009 1 00 00 0 00 0010 3 01 01 1 04 0411 6 02 03 0 00 0012 14 06 06 1 04 0413 27 11 11 4 16 1614 46 18 19 8 31 3315 113 45 48 9 35 3716 201 80 85 18 70 7417 276 110 116 30 117 12318 628 250 265 65 253 26619 371 148 156 44 171 18020 287 114 121 30 117 12321 145 58 61 13 51 5322 106 42 45 9 35 3723 71 28 30 5 19 2024 29 12 12 2 08 0825 17 07 07 2 08 0826 14 06 06 2 08 0827 7 03 03 1 04 0428 3 01 01 0 00 0029 1 00 00 0 00 0030 6 02 03 0 00 00Missing 140 56 13 51Total 2514 1000 1000 257 1000 1000Note Control group frequencies are unweighted (a weighted average of controls within the radius calliper is
used in the matching algorithm)
50
Table A22 Victim hurt denial CRIME-PICS (SPCR) by treatment and control groups
ScoreControl Treatment
n Valid n Valid 3 69 27 27 2 08 084 47 19 19 2 08 085 59 23 23 1 04 046 136 54 54 6 23 237 104 41 41 4 16 168 155 62 62 14 54 549 129 51 51 20 78 7810 241 96 96 19 74 7411 133 53 53 8 31 3112 664 264 264 77 300 30013 257 102 102 38 148 14814 196 78 78 22 86 8615 324 129 129 44 171 171Missing 0 00 0 00Total 2514 1000 1000 257 1000 1000Note Control group frequencies are unweighted (a weighted average of controls within the radius calliper is
used in the matching algorithm)
Table A23 Evaluation of crime as worthwhile CRIME-PICS (SPCR) by treatment and control groups
ScoreControl Treatment
n Valid n Valid 4 1 00 00 1 04 045 5 02 02 1 04 046 16 06 06 2 08 087 26 10 11 2 08 088 68 27 28 4 16 169 96 38 39 9 35 3510 177 70 72 21 82 8311 197 78 80 13 51 5112 270 107 109 31 121 12213 235 93 95 24 93 9414 328 130 133 33 128 13015 266 106 108 24 93 9416 276 110 112 27 105 10617 229 91 93 24 93 9418 115 46 47 20 78 7919 94 37 38 12 47 4720 70 28 28 6 23 24Missing 45 18 3 12Total 2514 1000 1000 257 1000 1000Note Control group frequencies are unweighted (a weighted average of controls within the radius calliper is
used in the matching algorithm)
51
Table A24 Used class A drugs in the four weeks before custody (SPCR) by treatment and control groups
ResponseControl Treatment
n Valid n Valid No 1460 581 581 159 619 619Yes 1054 419 419 98 381 381Missing 0 00 0 00Total 2514 1000 1000 257 1000 1000Note Control group frequencies are unweighted (a weighted average of controls within the radius calliper is
used in the matching algorithm)
Table A25 Used class BC drugs in the four weeks before custody (SPCR) by treatment and control groups
ResponseControl Treatment
n Valid n Valid No 1259 501 501 130 506 506Yes 1255 499 499 127 494 494Missing 0 00 0 00Total 2514 1000 1000 257 1000 1000Note Control group frequencies are unweighted (a weighted average of controls within the radius calliper is
used in the matching algorithm)
Table A26 Injected illegal drugs in the four weeks before custody (SPCR) by treatment and control groups
ResponseControl Treatment
n Valid n Valid No 2121 844 845 228 887 891Yes 389 155 155 28 109 109Missing 4 02 1 04Total 2514 1000 1000 257 1000 1000Note Control group frequencies are unweighted (a weighted average of controls within the radius calliper is
used in the matching algorithm)
Table A27 Accommodation prior to custody (SPCR) by treatment and control groups
TypeControl Treatment
n Valid n Valid Stable accommodation 2247 894 894 236 918 918Transient accommodation 130 52 52 14 54 54Sleeping rough 137 54 54 7 27 27Missing 0 00 0 00Total 2514 1000 1000 257 1000 1000Note Control group frequencies are unweighted (a weighted average of controls within the radius calliper is
used in the matching algorithm)
52
Table A28 Educational (qualifications) attainment (SPCR) by treatment and control groups
Highest qualification attained
Control Treatment
n Valid
n Valid
No qualifications 1099 437 441 99 385 388Other qualifications (incl overseas) 66 26 26 7 27 27O levelGCSE grade D-G (or similar qualification) 372 148 149 47 183 184O levelGCSE Grades A-C (or similar qualification) 507 202 204 61 237 239Trade apprenticeships 87 35 35 6 23 24AAS levels 220 88 88 21 82 82Higher education diploma 57 23 23 11 43 43First degreepostgraduate degree 70 28 28 2 08 08Higher degreepostgraduate degree 13 05 05 1 04 04Missing 23 09 2 08Total 2514 1000 1000 257 1000 1000Note Control group frequencies are unweighted (a weighted average of controls within the radius calliper is
used in the matching algorithm)
Table A29 Was in paid work in the four weeks before custody (SPCR) by treatment and control groups
ResponseControl Treatment
n Valid n Valid No 1681 669 669 168 654 654Yes 832 331 331 89 346 346Missing 1 00 0 00Total 2514 1000 1000 257 1000 1000Note Control group frequencies are unweighted (a weighted average of controls within the radius calliper is
used in the matching algorithm)
Table A30 Reconviction indicator one-year (PNC) by treatment and control groups
IndicatorControl Treatment
n Valid n Valid No 1584 630 630 187 728 728Yes 930 370 370 70 272 272Missing 0 00 0 00Total 2514 1000 1000 257 1000 1000Note Control group frequencies are unweighted (a weighted average of controls within the radius calliper is
used in the matching algorithm)
53
Table A31 Frequency of reoffending one-year (PNC) by treatment and control groups
IndicatorControl Treatment
n Valid n Valid 0 1584 630 630 187 728 7281 495 197 197 54 210 2102 203 81 81 11 43 433 117 47 47 3 12 124 53 21 21 1 04 045 33 13 13 1 04 046 8 03 03 0 00 007 7 03 03 0 00 008 6 02 02 0 00 009 1 00 00 0 00 0010 2 01 01 0 00 0011 2 01 01 0 00 0013 0 00 00 0 00 0015 1 00 00 0 00 0018 1 00 00 0 00 0032 1 00 00 0 00 00Missing 0 00 0 00Total 2514 1000 1000 257 1000 1000Note Control group frequencies are unweighted (a weighted average of controls within the radius calliper is
used in the matching algorithm)
54
Table A32 Frequency of reoffences one-year (PNC) by treatment and control groups
IndicatorControl Treatment
n Valid n Valid 0 1584 630 630 187 728 7281 272 108 108 31 121 1212 181 72 72 15 58 583 117 47 47 15 58 584 91 36 36 2 08 085 65 26 26 3 12 126 42 17 17 2 08 087 38 15 15 1 04 048 32 13 13 1 04 049 20 08 08 0 00 0010 19 08 08 0 00 0011 15 06 06 0 00 0012 11 04 04 0 00 0013 6 02 02 0 00 0014 6 02 02 0 00 0015 5 02 02 0 00 0016 1 00 00 0 00 0017 0 00 00 0 00 0018 1 00 00 0 00 0019 1 00 00 0 00 0020 1 00 00 0 00 0021 2 01 01 0 00 0022 2 01 01 0 00 0025 1 00 00 0 00 0039 1 00 00 0 00 00Missing 0 00 0 00Total 2514 1000 1000 257 1000 1000Note Control group frequencies are unweighted (a weighted average of controls within the radius calliper is
used in the matching algorithm)
Table A33 Severe offences reconviction indicator one-year (PNC) by treatment and control groups
IndicatorControl Treatment
n Valid n Valid No 2496 993 993 255 992 992Yes 18 07 07 2 08 08Missing 0 00 0 00Total 2514 1000 1000 257 1000 1000Note Control group frequencies are unweighted (a weighted average of controls within the radius calliper is
used in the matching algorithm)
Ministry of Justice Research Series 1910Evaluation of the impact of the HM Prison Service Enhanced Thinking Skills programme on reoffendingThis research examined the impact of the Enhanced Thinking Skills (ETS) programme on the one-year reconviction outcomes of 257 prison-based participants between 2006 and 2008 Radius propensity score matching was used to match a comparison group that had no statistically significant difference (at the means) to the treatment group on any matching characteristic ETS was found to significantly reduce both the reconviction rate (six percentage points) and frequency (60 reoffences per 100 released prisoners) of general reoffending of participants No statistically significant impact was found on the severe offences reconviction rate Almost identical impacts were found for completers A stronger reduction in reconviction was found for participants meeting the suitability criteria Though the programme has been shown to be effective in practice the findings suggest that a stricter application of the targeting criteria might have further enhanced the effectiveness of the programme
ISBN 978 1 84099 418 6copy Crown copyrightProduced by the Ministry of JusticeAlternative format versions of this report are available on requestE-mail researchjusticegsigovukhttpwwwjusticegovukpublicationsresearchhtm

6
attainment and skills level employment status accommodation status marital status and needs The prisoner survey also allows matching on additional rich static risk factors (for example family contact with the criminal justice system)
A further limitation of previous evaluations has been the reliance on Offenders Index data to assess reconviction which may not be the most complete source of such information (Falshaw et al 2003) The current study improves on this aspect by drawing its reconviction data from the Police National Computer the official source of criminal conviction histories
7
2 Approach
The research methodology of the study covering data sources final sample details and analysis techniques employed is summarised and explained in this section More details on technical points are provided in the Technical Annex
This evaluation assessed the impact of the HM Prison Service ETS programme on reoffending using a retrospective quasi-experimental research design that compared the one-year reconviction outcomes of participants with those of a matched comparison group that had not participated in the programme The research set out to test the hypothesis that ETS has no significant impact on the reconviction rates of programme participants
Based on the SPCR prisoner sample and incorporating data from the Offending Behaviour Programme Interventions Database Offender Assessment System (OASys) and the Police National Computer (PNC) the assembled dataset provides a profile of prisonersrsquo characteristics needs experiences and outcomes of unprecedented detail The combined dataset comprises more than 1800 variables on a final sample of 3277 prisoners
The comparison (matched control)24 group was generated using a statistical matching technique such that it is sufficiently lsquosimilarrsquo25 to the ETS participant (treatment) group to permit valid comparison The effect of this technique is to balance the programme suitability offending-risk characteristics and criminogenic needs across the treatment and matched control groups A strong match has been achieved taking account of 42 variables meaning that the treatment and control groups are statistically lsquosimilarrsquo or unbiased such that we would expect to observe the same reoffending outcomes for each group on average Any observed difference in the average reconviction rates between the two groups may therefore be assumed to be the causal effect of the ETS intervention known as the average treatment effect on the treated (ATT)
The analysis was carried out on an lsquointention-to-treatrsquo basis (consistent with Colledge et al 1999) whether the participant completed the ETS programme or not though analysis of completers only has also been run for completeness
24 A note on terminology used for the remainder of the report following the evaluation literature the term lsquotreatment grouprsquo is used in this report to refer to those prisoners in the sample that received ETS in the relevant sentence period Conversely the term lsquountreatedrsquo is used to distinguish those prisoners in the sample that did not receive ETS in the relevant sentence period The term lsquocontrolrsquo (and lsquomatched controlrsquo) is reserved to refer to the untreated prisoners that form part of the matched control group following propensity score matching
25 lsquoSimilarrsquo is defined as having mean values that are not statistically different from those of the participant group across a set of variables pre-selected as being simultaneously predictive of the probability of treatment and the probability of reconviction
8
Data sources and sample detailsAs the source of the novel dynamic risk factor data the base sample for the analysis is that of the SPCR prisoner survey The SPCR dataset is supplemented by merging to three further data sources data on which prisoners received ETS in what time period from the Offending Behaviour Programme Interventions Database data on the assessed need and risk of prisoners from the Offender Assessment System (OASys) and criminal history and reconviction data from the Police National Computer Each data source is described in turn
SPCR prisoner survey (wave 1)
Surveying Prisoner Crime Reduction (SPCR) is a large-scale longitudinal cohort study of nearly 4000 newly-sentenced adult prisoners in England and Wales comprising four waves of interviews conducted between 2005 and 2009
This evaluation uses wave 1 data only Wave 1 conducted at the point of reception into prison describes the characteristics and needs26 of the cohort of prisoners demographics background and family offending history educational achievements employment status physical and mental health substance misuse accommodation and relationships attitudes27 needs to help prevent them from reoffending and plans and expectations for the future (upon release from prison) All data are self-reported and as the survey responses relate to the start of the particular custodial sentence all responses are measured before any treatment could have commenced
Prisoners were selected from the Ministry of Justicersquos (MoJ) Inmate Information System (IIS) database and their current location found using MoJrsquos Local Inmate Data System (LIDS) The minimum sentence length accepted was one month due to the time taken to locate the prisoner and interview them and the maximum sentence length was four years to allow for a reasonable data-collection period Prisoners were recruited into the study on the basis of fully informed consent and ethical guidelines for social research were followed Prisoners were interviewed by specially trained researchers using computer-assisted (CAPI) questionnaires
Interview targets were set for every reception prison (except those with very low throughput) based on the proportional sizes of receptions at each prison Prison reception characteristics were found to be highly variable and targets were compiled using the most recent information available Over-sampling targets were calculated to allow for any difficulties in accessing prisoners Thus the interviews were drawn from 40 prisons from a possible 53 eligible prisons
26 The term lsquoneedsrsquo is used throughout to refer to a wide range of factors (associated with the pathways) which are generally understood to be related to offending sometimes known as ldquocriminogenic needsrdquo A summary of the general problems and needs of these newly sentenced prisoners has already been published (Stewart 2008)
27 Attitudes are measured using CRIME-PICS II (Frude et al 1994) a widely used and validated questionnaire-based instrument for examining and detecting changes in offendersrsquo attitudes to offending Special thanks are due to Jennifer Poyser in Offender Management Analytical Services at MoJ for the conversion of SPCR attitude question responses to CRIME-PICS II scores
9
The full sample (after removal of ineligible participants)28 at wave 1 was 3849 adult prisoners sentenced to between one month and four years29 This represents the base sample for this evaluation though the final sample will be smaller due to failed matches in database merging and data completion filters
Offending Behaviour Programme Interventions Database
To determine the treatment status of the base sample (that is which prisoners had received ETS during their sentence period) the SPCR wave 1 dataset was linked to the OBP prison interventions database compiled by the National Offender Management Service (NOMS) Rehabilitation Services Group30
The database is based on administrative records of interventions delivered to prisoners (71521 unique prisoner numbers) from 1994 to 2009 It covers accredited OBPs only including Controlling Anger and Learning how to Manage it (CALM) Cognitive Skills Booster (CSB) Cognitive Self Change Programme (CSCP) Enhanced Thinking Skills (ETS) Focus on Resettlement (FOR) Healthy Relationships Programme (HRP) Reasoning and Rehabilitation (RampR) Chromis JETS and Sex Offender Treatment Programme (SOTP)
When matched to the SPCR sample (by prisoner number) it was found that 449 (12) of the 3849 SPCR prisoners had received an accredited intervention The magnitude of this intervention rate was validated by comparison of total ETS programme participants and total prison population figures More specifically 371 (10) prisoners were identified as having participated in ETS within the SPCR sentence period All started the programme between March 2006 and September 200831 ETS was by far the most common OBP intervention delivered and the only individual programme with a sufficient number of participants to permit a statistical analysis of effectiveness
Offender Assessment System (OASys)
For verification of suitability for the programme and to allow matching of control prisoners based on these characteristics data are required on the risk and need of the prisoners in the sample This data requirement is fulfilled by the Offender Assessment System (OASys)
28 Twenty-eight participants were removed due to ineligibility Please see the SPCR Technical Report for more information
29 There are two sub-samples within SPCR Sample 1 (Reception Prisoners) is representative of the entire prison reception population (the lsquoflowrsquo into prison) at the time of sampling (n=1435) Sample 2 (Longer-term Prisoners) is a booster sample to reflect the higher proportion of longer-term prisoners in the prison population (the lsquostockrsquo of prisoners) (n=2414) Please see the SPCR Technical Report for more information This evaluation study uses the combined sample and does not distinguish between the two sub-samples That said ETS tends to be reserved for longer-term prisoners
30 Previously known as the Interventions amp Substance Misuse Group (ISMG)31 If a prisoner was recorded as receiving more than one ETS course in the SPCR sentence period the latest
start date was used
10
OASys is NOMSrsquos principal riskneed assessment and management tool for adult offenders in England and Wales and is used to assess suitability for ETS Introduced in 2001 OASys produces standardised assessments of offendersrsquo risks and needs by combining actuarial methods of prediction with structured professional judgement In terms of outputs OASys provides data on the likelihood of reconviction criminogenic factors (need) and risk of harm
The SPCR sample was matched to the OASys database by PNC number All OASys assessments completed for the prisoners in the SPCR sample subject to data completion criteria32 were provided by the OASys Data Evaluation and Analysis Team (O-DEAT) numbering some 2956433 Nonetheless as OASys assessments are not mandatory and the coverage of OASys is not universal an OASys assessment is available for only 3512 prisoners (316 of which were treated)
With an average of eight assessments provided per prisoner the one OASys assessment relevant to the instance of ETS participation was selected for each prisoner The method of selection differed for treated and untreated prisoners As the start date of ETS is known for each participant the most recent assessment prior to the start date was selected As there is no start date for the untreated group the OASys assessment completed closest (before or after) to the SPCR sentence prison reception date was selected
Police National Computer
Criminal conviction history and reconviction data were obtained from the Police National Computer (PNC) The SPCR sample was matched to the PNC database (June 2010 snapshot) using personal identifiers (surname forenames gender date of birth) returning 3615 valid matches34 Respondents must have been released for a minimum of one and a half years (allowing one year to reoffend and six months to be convicted) to be included in the matched sample Respondents that were deceased deported or had absconded were excluded from the sample
Final achieved sample details
Following merging of the four datasets 2771 of the 3849 full SPCR sample (and 257 of the 371 ETS participants) had complete data a valid OASys assessment matched to the PNC and had no missing data on any variables employed in the statistical modelling The sample included 2405 (87) men and 366 (13) women
32 All assessments provided met the following minimum standards of data completion Each of the scored sections (1 to 12) within the core OASys assessment must have had at least four-fifths of their scored items completed ndash ensuring that each criminogenic need was assessed properly and In the risk of serious harm sections the screening must have been completed the decision whether to complete a full risk analysis should have been consistent with the information provided and the four ratings of risk of serious harm in the community must have been completed (OASys Data Evaluation and Analysis Team 2010)
33 All OASys assessments used in the analysis are pre-OASys release 431 (August 2009) assessments34 Special thanks are due to Richard Boorman in Offender Management Analytical Services at MoJ for matching
the SPCR sample to the PNC and completing the reconviction analysis
11
The participant sample comprised 257 (9 of the final sample) treated prisoners who started ETS between March 2006 and September 2008 This includes 20 (8 of all treated) participants that did not complete the course a similar proportion observed in previous studies (Friendship et al 2002 Falshaw et al 2003 Cann et al 2003 Cann 2006) The remaining 2514 prisoners did not undertake ETS which provides a reasonable pool from which to select a matched control group35
Outcome measuresTo assess programme effectiveness the impact of ETS is measured with reference to the one-year reconviction outcomes of participants and comparators To reflect the fact that a successful outcome for ETS could include no reconviction (general andor severe) or a reduction in the frequency of reoffending three separate measures of proven reoffending36 are examined defined as follows
reconviction rate (one-year) binary (yesno) indicator of whether the offender was convicted of a recordable offence that was committed within the 12-month period after release from the SPCR custodial sentence
reoffending frequency (one-year) continuous measure of how many recordable offences the offender was convicted of that were committed within the 12-month period after release from the SPCR custodial sentence (note that there may be more than one offence per conviction) and
severe offence reconviction rate (one-year) binary (yesno) indicator of whether the offender was convicted of a severe offence that was committed within the 12-month follow-up period after release from the SPCR custodial sentence The designation of an offence as lsquoseverersquo follows a standard definition under which approximately 150 of the 3000 Home Office offence codes are defined as severe37
Evaluation research designTo evaluate the impact of ETS it would be desirable to compare each treated prisonerrsquos reconviction outcome after treatment with what it would have been without treatment The latter is of course not observable ndash a treated individual cannot have an untreated outcome ndash and so a proxy must be created
35 It is possible that prisoners (participants and non-participants) may have participated in other intervention programmes accredited (for example another OBP or substance misuse treatment) andor non-accredited (of varying quality) during their SPCR sentence period Analysis of the level of participation on other accredited OBPs by the treatment group and matched control groups is presented later in this section
36 An offender is said to have committed a proven reoffence if the offender receives a conviction (by a caution or guilty verdict) at court for the reoffence The reoffence must have been committed within the one-year follow up period and the conviction must follow either within that one-year follow up or in a further 6 months which is to allow time for the offence to be proven at court
37 Severe offence types include violence against the person (murder attempted murder manslaughter wounding) sexual offences (sexual assault rape sexual activity with a minor or a person with a mental disorder abuse of children through prostitution and pornography trafficking for sexual exploitation) aggravated vehicle taking and death by dangerous drink or drug driving A full list of severe offence types is available in lsquoAppendix G List of most serious (severe) offencesrsquo of Ministry of Justice (2010)
12
Due to the active selection mechanism for ETS treatment (see suitability criteria in section 1) it is likely that prisoners selected for treatment differ on average from untreated prisoners even before treatment commences ETS participants should be characterised by a medium-to-high reconviction risk and a high level of criminogenic needs whereas non-participants should have a profile that is more reflective of the general prison population This is known as selection bias For this reason any difference observed in a simple comparison of the average outcome of the treatment group with that of the untreated group could be explained by factors other than the intervention treatment It is important therefore to remove as much of the selection bias as possible between the treatment group and comparison groups prior to comparison of the average outcomes The Propensity Score Matching (Rosenbaum and Rubin 1983) statistical technique has been developed for this very purpose
A primer on Propensity Score Matching
Whilst only a Randomised Control Trial (RCT)38 can ensure a random distribution of any unobserved sources of potential bias ethical and practical considerations can mean that RCT is not an easy-to-use methodology to evaluate the impact of interventions on reconviction rates
Instead Propensity Score Matching (PSM) has been selected to estimate the causal treatment effect of ETS39 On the Scientific Methods Scale adapted for reconviction studies (Harper and Chitty 2005 National Offender Management Service 2005) PSM rates as a level 4 research design ldquothat controls for bias by using the most robust method of matching individuals on all variables that affect participation in the intervention as well as all variables that affect outcomerdquo40 As differences in the variables influencing the treatment and the outcome are controlled for after the treatment intervention the approach is defined as a retrospective quasi-experimental design
The basic idea of PSM is to select a group of untreated individuals that are statistically lsquosimilarrsquo to the group of treated individuals across the set of relevant observed characteristics measured at the pre-treatment (and pre-allocation) stage41 Once the group is well matched (little or no statistical difference in the means of the matching variables) to the treatment group it is an adequate control group to generate the proxy untreated outcome Differences between the outcomes of the treated and untreated groups can then be attributed to the intervention
38 ldquoAn RCT compares outcomes when the intervention is used to outcomes without the intervention or with an alternative (seen in the control group) In an RCT participants are randomly allocated to an intervention or a control group which differs systematically in the type or amount of the intervention received The groups are otherwise equivalent because all other differences are randomly distributedrdquo (National Offender Management Service 2005 p2)
39 In the lsquoScientific Methods Scale adapted for reconviction studiesrsquo (National Offender Management Service 2005) a five-level lsquostandard of researchrsquo scale (5 representing the highest standard) of methodologies to evaluate the impacts of an intervention on reoffending and other offence-related outcomes propensity score matching rates as a level 4 research design (RCT is the only level 5 method) Level 4 is defined as ldquoComparison group matched to intervention group on theoretically relevant factors eg risk of reconviction (well-matched comparison group)rdquo (National Offender Management Service 2005 p3)
40 National Offender Management Service (2005) p 341 Specifically PSM matches individuals based on their probability (propensity score) of participating in the
intervention programme given their observed characteristics
13
Matching methodology
The matching methodology used to generate the matched control group comprises five components suitability filter pre-selected matching variables matching algorithm the parsimonious PSM model and assessment of the match quality Consultation on the methodology employed was undertaken with analyst and policy colleagues at MoJ and NOMS
Suitability filter of potential control matches
The codification of the suitability criteria defining the prisoner needs and characteristics that determine selection into the programme presents the opportunity to control directly for selection bias Assuming that untreated prisoners satisfying the suitability criteria did not receive treatment due to practical barriers (for example ETS was not provided at the establishment the prisoner was participating on another programme or was movedreleased whilst on waiting list) non-participants could be filtered by the suitability criteria to yield an ETS-suitable pool of untreated potential control matches
Such a filter was successfully implemented though with an unexpected result As the OASys data provided did not include OGRS2 scores the risk requirement was assessed with respect to the OASys score This is not invalid as the guidance notes ldquoIf an offender passes the cut-off on one but not both scales [ie OGRS2 and OASys total weighted score] you can consider them to be suitable to progress to the needs assessment stagerdquo42
To ensure the relevance of the filter a cross-check was carried out by applying the same filter to the treatment group with the expectation of finding a high rate of compliance However this analysis revealed that a substantial proportion (up to 42) of ETS participants failed to satisfy even the basic need and risk requirements for ETS suitability43 This is the first noteworthy finding of this research and has important implications for the evaluation Full results are presented and discussed in the following Results section
The direct implication of this finding is that an explicit suitability criteria filter of the potential control pool would be unnecessarily restrictive seeing as the treatment group itself does not satisfy the criteria It also has an important implication for the potential effectiveness of the programme If the suitability criteria are designed so as to identify the individuals that are most likely to benefit from the intervention then a weak adherence to these suitability criteria would constrain the potential effectiveness that the intervention programme could actually achieve in practice (Andrews and Bonta 2010) This is an important point as a programme
42 HM Prison Service (2007) p543 It is important to note some caveats to this analysis (explained fully in the Results section) The specification
of the risk tool to OGRS2 or OASys was only introduced in August 2007 half-way through the period under analysis (March 2006 to September 2008) A secondary indicator of criminogenic needs the ETS Semi-Structured Interview was also used historically though emphasis was placed on the OASys Section 11 scores in the assessment of need There is also some flexibility allowed in the application of the suitability criteria individuals with an OASys or OGRS2 score within three points below the cut-off may be progressed to ETS and special considerations are made for indeterminate sentence prisoners and sex offenders
14
evaluation result of no statistically significant reduction in reconviction may actually be reflecting poor targeting rather than a poor programme
Pre-selected matching variables
Prior to undertaking the matching and outcome analysis a wide range of factors were identified as being the most important drivers of participation in the intervention and the reconviction outcome These variables have two functions First they form the basis of the full specification of the matching model Second the quality of the control group match is assessed by comparing its mean values with those of the treatment group on each one of these variables In addition to ETS suitability criteria and the standard static risk factors the list includes several dynamic risk factors unlike previous evaluations
The first group of factors identified are those that (should) determine the probability of treatment ndash the ETS suitability criteria level of criminogenic need risk of reconviction and responsivity and readiness criteria (motivation to change behaviour and whether the prisoner has problems with reading writing numeracy learning difficulties psychological problemsdepression or psychiatric problems)
The second group are static reconviction risk factors selected as the variables underpinning the OGRS3 score found to be a more accurate predictor of reconviction than OGRS2 and the Sentence Planning Risk Predictor (Howard et al 2009) Namely the individual static factors include age gender index offence type (explained below) the Copas rate44 sanctioning history (total previous convictions and previous severe convictions and their quadratics) Additional static risk factors from SPCR survey responses have also been included ethnicity (White Black Mixed Asian and Other background) marital status family criminal history
Every offence type has a distinct Home Office code of which there are more than 3000 which are grouped into 20 categories in the standardised OGRS classification After checking the distribution of the ETS participants across these 20 categories most had too few observations to be statistically useful Accordingly the 20 offence categories have been further grouped into six categories that are both meaningful (similar offences) and contain 20 or more treated prisoners45 The final offence type groupings with grouped OGRS categories are Violent (violence and public orderriot offences) Robbery Sexual (sexual offences not against a child sexual offences against a child and solicitingprostitution) Acquisitive (burglary (domestic) burglary (other) theft (non-motor) handling stolen goods fraud and forgery taking and driving away and related offences and theft from vehicles) Drug (drugs import export production or supply and drugs possessionsmall-scale supply) Other (abscondingbail offences other motoring drink driving criminal damage and any other offences)
44 The Copas rate (Copas and Marshall 1998) is a measure that reflects both the intensity and length of the offenderrsquos criminal career calculated as log [ (number of sanction occasions) (10 + years between first and current sanction) ] The higher the Copas rate the more convictions an offender has amassed in a given amount of time and the more likely it is that the offender will reoffend within one year
45 An exception is the lsquoOtherrsquo category the reference category for modelling which has 15 treated participants
15
Box 21 Matching variables pre-selected as being predictive of ETS participation and reconviction risk
Programme suitability criteria Need Sum of OASys Section 11 Thinking and Behaviour scores (OASys) Risk OASys total weighted score (OASys) Motivation to change behaviour (OASys) Problems with readingwritingnumeracy (OASys) Problems with learning difficulties (OASys) Problems with current psychological problemsdepression (OASys) Problems with current psychiatric problems (OASys)
Static risk factors Gender (SPCR) Age (SPCR) Marital status Married (SPCR) Marital status Living with a partner (SPCR) Ethnicity Any Mixed background (SPCR) Ethnicity Any Asian background (SPCR) Ethnicity Any Black background (SPCR) Ethnicity Any Other background (SPCR) Copas rate on release (PNC) Previous convictions (PNC) Previous convictions squared (PNC) Previous severe convictions (PNC) Previous severe convictions squared (PNC) Index offence type Violent (PNC) Index offence type Sexual (PNC) Index offence type Acquisitive (PNC) Index offence type Drug (PNC) Index offence type Robbery (PNC) Family member has been convicted of a non-motoring offence (SPCR) Family member has been in prison (SPCR)
Dynamic risk factors Agree Want to stop offending (SPCR) Disagree Want to stop offending (SPCR) Agree Want to get help to stop offending (SPCR) Disagree Want to get help to stop offending (SPCR) General attitude to offending CRIME-PICS (SPCR) Anticipation of reoffending CRIME-PICS (SPCR) Victim hurt denial CRIME-PICS (SPCR) Evaluation of crime as worthwhile CRIME-PICS (SPCR) Used class A drugs in the four weeks before custody (SPCR) Used class BC drugs in the four weeks before custody (SPCR) Injected illegal drugs in the four weeks before custody (SPCR) Transient accommodation prior to custody (SPCR) Sleeping rough prior to custody (SPCR) Educational (qualifications) attainment (SPCR) Was in paid work in the four weeks before custody (SPCR)
Note Data source is listed in parentheses
16
A range of dynamic risk factors found to be incrementally predictive of general reconviction in addition to static risk factors (Howard 2009) have also been included These factors are motivation to stop offending attitudes to offending drug use accommodation educational attainment and employment status before custody
Many of the factors are categorical and so have been converted to indicator variables (also known as lsquodummy variablesrsquo) For instance ethnicity has been split into five separate yesno variables ndash one for each individual ethnic background The full set of variables is listed in Box 21
Matching algorithm
A variety of propensity score matching methods are available to adjust for pre-treatment observable differences between the treatment group and untreated groups each best suited to particular types of data The algorithm developed to match the control group for this evaluation and the motivation underlying its choice are briefly explained here The propensity score matching analysis was undertaken in the Stata statistical software programme using the psmatch2 module (Leuven and Sianesi 2003)
First a logistic regression was used to predict the probability of treatment (the propensity score) for all treated and untreated prisoners based on their observed characteristics The resultant propensity scores summarise each prisonerrsquos characteristics on all matching variables in one measure that is used as the basis for matching
Since the sample consists of comparatively few treated prisoners in relation to many untreated ones radius matching (Dehejia and Wahba 2002) was chosen as the matching algorithm This technique uses the maximum amount of data whilst the imposition of a tolerance threshold avoids the risk of bad matches All untreated prisoners whose propensity score falls within a defined range of tolerance (radius calliper) of a treated prisonerrsquos score are matched to that prisoner A radius calliper of 005 of a standard deviation of the logit of the propensity score has been used46 The benefit of radius matching is lower propensity score variances than would result from one-to-one nearest-neighbour matching As a further step to ensure comparability prisoners with propensity scores outside the range of values where both treated and untreated observations are found were dropped a requirement of the technique47
46 The appropriate calliper size is not clearly prescribed by the empirical literature (Smith and Todd 2005) The inventors of propensity score matching Rosenbaum and Rubin (1983) recommend a calliper of a quarter of a standard deviation of the logit of the propensity score as appropriate in general This would be equivalent to 0236 in this case which was tried and rejected due to returning a weak match quality The radius calliper size was iteratively reduced until the point (005) that a further reduction would drop treated observations Sensitivity analysis was carried out on radius calliper size (00001 to 025) which found that the results were not highly sensitive to calliper size
47 Technically this is referred to as imposing common support
17
With a choice-based sample such as this participants are likely to be over-sampled relative to their frequency in the eligible prisoner population (Caliendo and Kopeinig 2005) To control for this over-sampling matching was undertaken on the odds-ratio of the propensity scores (Heckman and Smith 1995)48
The outcome of this methodology was that each ETS participant was matched with a synthetic control observation composed of the average of all non-participants sufficiently similar (propensity score within the radius limit) to the participant
Parsimonious PSM model
Due to the limited size of the sample there was a focus on parsimony (simplification without any loss of power) in development of the model Dropping insignificant variables from the logistic regression gains degrees of freedom (fewer parameters to be estimated) and observations (due to missing values on some variables) without losing explanatory power The final model was reduced to a smaller set of 16 variables listed in Box 2249 To check that this process did not introduce a bias the correlation of the propensity scores of the reduced model and the full model was checked and found to be greater than 091
Box 22 Parsimonious Propensity Score Matching model matching variables
Programme suitability criteria Need Sum of OASys Section 11 Thinking and Behaviour scores (OASys) Risk OASys total weighted score (OASys) Motivation to change behaviour (OASys) Problems with readingwritingnumeracy (OASys) Problems with current psychiatric problems (OASys)
Static risk factors Gender (SPCR) Age (SPCR) Index offence type Violent (PNC) Index offence type Sexual (PNC) Index offence type Acquisitive (PNC) Index offence type Drug (PNC) Index offence type Robbery (PNC)
Dynamic risk factors Agree Want to get help to stop offending (SPCR) Victim hurt denial CRIME-PICS (SPCR) Used class BC drugs in the four weeks before custody (SPCR) Sleeping rough prior to custody (SPCR)
Note Data source is listed in parentheses
48 Caliendo and Kopeinig (2005) note that weights are required to consistently estimate the probability of treatment when sampling is choice based However as an odds-ratio estimated using incorrect weights will be a scalar multiple of the true odds-ratio (a monotonic transformation of the propensity score) matching may proceed on the odds-ratio even when sampling weights are unknown (Heckman and Smith 1995)
49 The full model (including all 42 pre-selected variables) was run successively with the least significant variable dropped each time using the stepwise function with a confidence limit for retention equal to 01
18
Assessment of control match quality
The robustness of the calculated treatment effect depends on the quality of the match achieved The degree of lsquosimilarityrsquo between the treatment and the control group was tested using a range of statistical techniques (namely standardised bias reduction and t-tests of equality of means) Please refer to the Technical Annex for the detailed results of these tests
In summary equality of means testing confirmed no statistically significant difference between the treatment and matched control group across all 42 characteristics pre-selected as being predictive of ETS participation and reconviction risk The control group is therefore well matched on the pre-selected matching characteristics with a similar expected reconviction rate as the treatment group allowing robust estimation of the treatment effect
Whilst every effort has been made to remove the selection bias it is possible that an unmeasured bias may still remain uncontrolled Further checks on average sentence length and participation on other accredited OBP interventions (using the Offending Behaviour Programme Interventions Database) were carried out which revealed some differences between the treatment and control groups It was found that the average sentence length of the treatment group (975 days) was longer than that for the control group (727 days) It was also found that 6 of the treatment group and 2 of the control group had been on another accredited OBP during the SPCR sentence though both proportions are small
19
3 Results
The results of this evaluation show that ETS was effective in bringing about a statistically significant reduction in both the reconviction rate and frequency of reoffending in the year following release from custody for 257 prison-based participants on ETS between 2006 and 2008 Almost identical results were found for completers (when drop-outs were excluded) though the significance of the reduction in the one-year reconviction rate was lost due the reduction in the size of the sample
A secondary finding of the research was a low adherence to the suitability targeting criteria among those prisoners that actually received the programme over the period This suggests that the programme was not always administered to the most suitable group of prisoners which may have limited the effectiveness of the programme in reducing reoffending
The research findings are presented and summarised in this section The conclusions and policy-relevant implications of the results are discussed in the Implications section More detail on the results is contained in the Technical Annex
Effectiveness of ETS in reducing reoffendingThe impact of the programme is identified as the average causal effect of participation on the ETS programme (the treatment) on reconviction outcomes As the control group was created using a methodologically robust propensity score matching model and established as valid by tests on the quality of the match it represents a good proxy for the counterfactual untreated outcome of the treatment group50 The observed difference in the average conviction rates between the treatment and control groups may therefore be considered the causal effect of the ETS intervention known as the average treatment effect on the treated (ATT)
All programme participants
The reconviction rate and the frequency of reoffending of all ETS participants (including non-completers) was found to be significantly lower than the matched control group in the year following release from custody No statistically significant impact was found on the severe offence reconviction rate
The average reconviction outcomes of the treated and untreated groups and the difference between them (ATT with t-stat) are presented in Table 31 The results show that the proportion of programme participants that were reconvicted within one year (272) was six percentage points below that observed in the control group (335) and that this difference was statistically significant A statistically significant difference was also found in terms of frequency of reoffending as participants (607 offences) were reconvicted of 60 fewer recordable offences within one year per 100 released prisoners than the control group (1208 offences)
50 Testing revealed no statistical difference in the mean values of the two groups across all 42 variables pre-selected as being predictive of ETS participation and reconviction risk
20
These are the noteworthy results of this analysis as they show that ETS was successful in significantly reducing both the reconviction rate and frequency of reoffending of participants After contradictory evidence and debate the results seem to support Friendship et alsrsquo (2002) positive results though the magnitude of the effect is smaller Whilst the severe offences reconviction rate was lower in the treatment group the difference was not significant This is not surprising given the programme is not designed to target severe offending and the rarity of severe offences
Table 31 Impact of ETS on reconviction outcomes of the SPCR sample
SampleReconviction rate
(one-year)
Reoffences per 100 released prisoners
(one-year)
Severe offences reconviction rate
(one-year)Average outcomes
Treatment group (n=257) 272 607 08Matched control group 335 1208 09
Treatment effect (ATT) -62a -601b -01(t-stat) -204 -547 -013Note Average treatment effect on the treated (ATT) is the difference between the mean outcome of the
treatment group and the matched control groupa Statistically significant at the 005 levelb Statistically significant at the lt0001 level
Completers only
The evaluation has followed the lsquointention-to-treatrsquo approach in general (consistent with Colledge et al 1999) However not all participants completed the programme ndash 8 of the treated final sample did not complete the course As in previous evaluations non-completers have been removed from the analysis to test any sensitivity of the treatment effect to programme completion
21
The results are summarised in Table 32 showing an almost identical though not statistically significant reduction in the rate of reconviction for completers when drop-outs were excluded The loss in significance was most likely due to the reduction in the size of the sample The statistically significant reduction in the frequency of reoffending was retained with an almost identical effect size No significant impact was again found for the severe offences reconviction rate
Table 32 Impact of ETS on reconviction outcomes of the SPCR sample completers only
SampleReconviction rate (one-
year)
Reoffences per 100 released prisoners
(one-year)
Severe offences reconviction rate
(one-year)Average outcomesTreatment group (n=237) 270 599 08Matched control group 335 1208 09Treatment effect (ATT) -65 -609a 00(t-stat) -156 -321 -001Note Average treatment effect on the treated (ATT) is the difference between the mean outcome of the
treatment group and the matched control groupa Statistically significant at the 001 level
Completers of intervention programmes are often found to have a stronger effect than non-completers This may be due to a self-selection effect whereby completers may be more motivated or have fewer needs or have a lower risk of reoffending Therefore effectiveness of the programme should not be evaluated against completers alone whose outcomes may have been better even without the intervention Rather the true effect of the intervention as it is used in practice should be evaluated by considering all participants both completers and non-completers (Colledge et al 1999 National Offender Management Service 2005) Accordingly more weight should be placed on the findings for all participants
Assessment of suitability targeting
The HM Prison Service guidance to assess suitability for ETS and other OBPs notes
ldquoOne of the principles of effective interventions is appropriate targeting An offender is more likely to benefit from participation in an offending behaviour programme if heshe demonstrates levels of risk and need that are appropriate for the particular interventionrdquo51
To facilitate appropriate targeting HM Prison Service designed a set of risk need and responsivity suitability criteria to identify those prisoners that were most suitable for the programme These criteria were set out in the Context section Strict adherence to these criteria should ensure that ETS is appropriate and relevant for all participants
51 HM Prison Service (2007) p3
Figure 31 Need and risk score distributions for non-participant and ETS participant groups with suitability thresholds
Need Sum of OASys Section 11 Thinking and Behaviour scores (OASys)
Risk OASys total weighted score (OASys)
0
5
10
15
4 7 140
5
10
15
4 7 140 0
Per
cen
t
Per
cen
t
0
5
10
15
50 100 1500
Per
cen
t
0
5
10
15
50 100 1500
Per
cen
t
Non-participant
Non-participant
ETS participant
ETS participant
22
Need and risk requirements
The need and risk52 profiles of the participant and non-participant groups53 were compared The comparison is presented graphically in Figure 31 with needrisk ETS programme suitability thresholds marked with vertical red lines (observations to the right of the line rate as lsquosuitablersquo for ETS) In the case of need the dual thresholds of 7 or 4 (with at least one individual score of 2 indicating significant problems) are marked A single vertical red line for 56 and above is marked as the risk threshold
With regard to both need and risk the participant and non-participant distributions follow a broadly similar pattern The majority of the non-participant group had a needrisk profile that would have made them suitable for ETS This is good news for matching purposes as it means that similar prisoners at the pre-treatment stage could have been treated or remained untreated More importantly a lot of prisoners in the participant group fall to the left of the red vertical line in both charts ndash and so rated as lsquonot strictly suitablersquo for ETS
52 As the OASys data do not include OGRS2 it has only been possible to define suitability with respect to the OASys total weighted score This is not necessarily invalid as the guidance notes ldquoIf an offender passes the cut-off on one but not both scales [ie OGRS2 and OASys total weighted score] you can consider them to be suitable to progress to the needs assessment stagerdquo HM Prison Service (2007) p5
53 This analysis is based on the full sample of 3512 (316 participants and 3196 non-participants) and not the treatment and matched control groups
23
Further investigation of the need and risk (OASys total weighted score) scores revealed that only 58 of the participant group were suitable for ETS (met both need and risk requirements simultaneously) while 49 of the non-participant group would have been suitable (Table 33)
Table 33 ETS suitability criteria fulfilment non-participant and ETS participant groups
SuitabilityNon-participants ETS participants
N N Not strictly suitable for ETS 1629 510 134 424Strictly suitable for ETS 1567 490 182 576Total 3196 1000 316 1000NoteSuitability is defined with reference to risk (an OASys score 56 or above) and need (a total score of 7
or above and a total score of 4 or above with at least one individual score of 2 (indicating significant problems))
It is important to note some caveats to this analysis The suitability criteria for ETS have been reviewed and changed over time The ETS start dates of participants in the SPCR sample stretch from March 2006 to September 2008 whilst the specification of the risk tool as OGRS2 or OASys was only introduced in August 2007 (the Sentencing Planning Risk Predictor was used previously) Similarly this period covers a time when both a local semi-structured interview and the OASys assessment were sources of need information for programme staff As the programme did not itself change substantially during this period later indicators of suitability for the intervention are retrospectively relevant from a targeting perspective54 though the retrospective application of the later indicators provides no reflection of the accuracy in the application of the targeting criteria during the earlier period
There is also some flexibility allowed in the application of the suitability criteria individuals with an OASys or OGRS2 score within three points below the cut-off may be progressed to ETS and special considerations are made for indeterminate sentence prisoners and sex offenders The original indicator of criminogenic needs the ETS Semi-Structured Interview has gradually been replaced by OASys Section 11 scores as confirmed in later guidance (National Offender Management Service 2009)55
54 Assuming that amendments to the suitability identification tools over time represent improvements in targeting later indicators applied retrospectively are likely to provide a better indicator of suitability than older indicators Accordingly this analysis provides no reflection on the selection process of treatment managers at the time but rather a pure view of suitability of treated participants
55 later guidance also specified definition of risk groups suitable for ETS with reference to OGRS3 (score 50 or above)
24
Readiness and responsivity criteria
A similar comparative analysis was also carried out for the readiness and responsivity criteria The HM Prison Service (2007) guidance lists assessment items in the lsquoResponsivity Assessmentrsquo and lsquoReadiness Assessmentrsquo sections including intellectual ability literacy dyslexia mental and physical health psychopathic traits motivation to change behaviour disability However the guidance does not specify the data variables or the thresholds to be used To investigate these readiness and responsivity criteria the lsquoexclusion criteriarsquo for general offending programmes from the OASys Manual56 were used
Again the profiles of the participant and non-participant groups57 were compared with a similar pattern emerging Figure 32 plots the distributions side-by-side with the readiness and responsivity thresholds marked by red vertical lines (this time profiles to the right of the line are not strictly suited to ETS) As with the need and risk profiles the two distributions are unexpectedly similar with a number of the participant group recorded as lsquonot at allrsquo motivated or having lsquosignificant problemsrsquo More specifically of the participant group
109 were scored as lsquonot at allrsquo motivated to change their behaviour
74 had lsquosignificant problemsrsquo with readingwritingnumeracy
61 had lsquosignificant problemsrsquo with learning difficulties
103 had lsquosignificant problemsrsquo with current psychological problemsdepression and
58 had lsquosignificant problemsrsquo with current psychiatric problems
56 OASys development team (2001) p16757 This analysis is based on the full sample of 3512 (316 participants and 3196 non-participants) and not the
treatment and matched control groups
Figure 32 Readiness and responsivity score distributions for non-participant and ETS participant groups with suitability thresholds
0
20
40
60
Verymotivated
Quitemotivated
Not at all0
20
40
60
Verymotivated
Quitemotivated
Not at all
Per c
ent
Per c
ent
Non-participant ETS participant
Motivation (OASys)
0
50
100
No problems Someproblems
Significantproblems
Per c
ent
Non-participant
Problems with readingwritingnumeracy (OASys)
0No problems Some
problemsSignificantproblems
Per c
ent
ETS participant
020
6080
No problems Someproblems
Significantproblems
Per c
ent
Non-participant
Problems with learning difficulties (OASys)
0No problems Some
problemsSignificantproblems
Per c
ent
ETS participant
0
20
40
60
No problems Someproblems
Significantproblems
Per c
ent
Non-participant
Problems with current psychological probelmsdepression (OASys)
0
20
40
60
No problems Someproblems
Significantproblems
Per c
ent
ETS participant
4020
6080
40
50
100
0
50
100
No problems Someproblems
Significantproblems
Per c
ent
Non-participant
Problems with current psychological probelms (OASys)
0
50
100
No problems Someproblems
Significantproblems
Per c
ent
ETS participant
25
26
Analysis of treatment effect by suitability
To investigate the importance of adherence to the need and risk principles in participant targeting the reconviction outcomes of the treatment group were also analysed according to participant suitability As before suitability is defined with reference to risk (an OASys score 56 or above) and need (a total score of 7 or above and a total score of 4 or above with at least one individual score of 2 (indicating significant problems)) As there is some flexibility in the application of the criteria this is termed lsquostrict suitabilityrsquo
Of the treatment group 164 (64) were strictly suitable for ETS whereas 1404 (56) of the control group were strictly suitable The remainder of each group were not strictly suitable
The results of the analysis (Table 34) show that the one-year reconviction rate for strictly suitable treated offenders (172) was lower than that for not strictly suitable ones (329) Similarly the frequency of reoffending of strictly suitable offenders (398 reoffences) was also lower than that of the not strictly suitable offenders (726 reoffences)
Table 34 Impact of ETS on reconviction outcomes of the SPCR sample lsquonot strictly suitablersquo and lsquostrictly suitablersquo participants only
SampleReconviction rate
(one-year)
Reoffences per 100 released prisoners
(one-year)
Severe offences reconviction rate
(one-year)Not strictly suitable (n=93) 329 726 12Strictly suitable (n=164) 172 398 -
Caveats and limitations of the researchIt is important to note that the number of ETS-treated prisoners provided by SPCR (257) is a limited sample falling in the lower range of previous evaluation samples (from 114 to 2195 participants) as a result of a low intervention rate and missing data filters Results based on limited samples may not be reliable indicators of the wider population and in some cases the sample sizes may be too small to detect differences which may actually exist58 Tests of statistical significance are carried out on the results of this evaluation for this reason The low intervention rate means that there is a large pool (2514) from which to form a well-balanced matched control group It should also be noted that all SPCR data are self-reported
Whilst every effort has been made to remove the selection bias it is possible that an unmeasured bias may still remain uncontrolled Further checks revealed some differences between the treatment and control groups It was found that the average sentence length of the treatment group (975 days) was longer than that for the control group (727 days)
58 This caveat is more relevant where no effect is detected ndash in which case the correct conclusion may be that the sample was insufficient to detect an effect rather than that the intervention had no effect For a discussion of sample size detection power and reliability of reconviction rates please see Harper and Chitty (2004) p8
27
The possibility of multiple intervention participation has not been controlled for as the sample size did not permit such analysis Examination revealed that 6 of the treatment group and 2 of the control group had been on another accredited OBP during the SPCR sentence though both proportions are small It is also possible that prisoners may have participated on non-accredited OBPs or a substance misuse treatment during their SPCR sentence period which may have contributed to the observed treatment effect If the rate of participation in other programmes was higher in the ETS treated group the estimated treatment effect of ETS would represent a pooled effect of all treatments received and so may be overstated If the rate of participation in other programmes was higher in the ETS control group the estimated treatment effect of ETS may be understated
This evaluation has been limited to using one-year conviction rates as two-year reconviction outcome data will only become available in 12 monthsrsquo time Thus it is not possible at this time to conclude on the duration of the impact of ETS ndash that is to say whether the observed one-year effect endures two years on from release or whether it dissipates (as found by Cann et al 2003) It is planned to conduct a follow-up study of reconviction at the two-year post-release stage (please see the Further research section)
28
4 Implications
This report has evaluated the effectiveness of the prison-based ETS programme by linking participation to reconviction outcomes The evaluation results show that ETS was successful in significantly reducing both the reconviction rate and frequency of general reoffending of participants The most important implications of these results are outlined below
This research has added some clarity to the discordant evidence base on the effectiveness of ETS by improving on key methodological limitations of previous evaluation studies This provides a more solid evidence base of support on which to build intervention-based policy
The most important message for policy makers is that ETS the most frequently delivered offending behaviour programme over the past decade did work to significantly reduce reoffending in the short term (one year) at least This result should assist policy makers to prioritise and focus operational resources towards the most productive intervention efforts Though ETS has since been replaced by the Thinking Skills Programme (TSP) the results of this evaluation demonstrate that cognitive-behavioural OBPs can work to significantly reduce reoffending for offenders released from prison The findings are likely to be particularly relevant for TSP which represents a refresh and update of ETS in line with advances in theory and practice However these specific findings cannot be generalised to other cognitive-behavioural intervention programmes Each programme has its own distinct objectives delivery methods and targeted characteristics and so would require a discrete evaluation
For practitioners although the findings on reduced reconviction rates are encouraging and reflect a job well done there are also lessons to be learned A low adherence to the risk need and responsivity suitability criteria was found among those prisoners that actually received the programme between 2006 and 2008 This suggests that the programme was not always administered to the most suitable prisoners Given that research supports the importance of risk need and responsivity targeting for effective treatment (Hollin 1995 Taxman and Thanner 2006 Palmer et al 2009 Gendreau et al 2009 Andrews and Bonta 2010) and the finding of lower reconviction rates for strictly suitable prisoners this may have limited the effectiveness of the programme in reducing reoffending The fact that a significant reduction in reconviction was found in spite of this finding suggests that a stricter application of the targeting criteria might further enhance the effectiveness of the programme National Offender Management Service practitioners report that the accuracy of targeting has improved over time meaning that a similar evaluation of ETS in a later period (post-2008) or TSP might find an even more significant effect
29
Future researchers may be able to draw on the methodology developed for this research as a methodological blueprint for further evaluations The findings of this research could be complemented and enhanced by addressing some of the outstanding evidence gaps framed by a set of research questions and proposed research designs set out in the Further research section
30
5 Further research
Whilst this evaluation has added some clarity to the evidence base on the effectiveness of general cognitive-behavioural programmes evidence gaps remain These gaps are defined by the research questions listed below with suggested research designs that could provide robust answers to complement and enhance the findings in this paper
Duration of the reduction in reoffending effect Does ETS have a lasting impact or will the observed one-year effect have dissipated after two years as found by Cann et al (2003) It is planned to conduct a follow up study of the treated and matched control individuals of this evaluation two years after their release applying the same methodology to investigate the duration of the ETS impact in one yearrsquos time
Cost-effectiveness of the programme Is the cost of ETS provision justified by the observed reduction in reoffending The reduction in reoffences estimated in this evaluation could be used as the basis for a cost-benefit analysis of the ETS programme Linking the estimated reduction in reoffending to estimates of the social cost of criminal offences the avoided social costs of crime (the benefit) could be compared to data on the cost of ETS provision (estimated to be in the region of pound2000 per prisoner)59
Generalisability of the findings Would the observed effect be verified or even more significant in a larger sample By repeating the evaluation methodology but replacing SPCR variables with OASys data variables where possible the full population of prisoners undertaking ETS could be evaluated The downside to this approach is the compromised choice of data for dynamic risk factors Other benefits would be the ability to employ more matching variables and being able to evaluate some of the smaller accredited programmes This research could also be used as a methodological blueprint to evaluate substance misuse intervention programmes
What works for whom What are the characteristics of the prisoners that benefit most from ETS and other OBPs The difference in reconviction outcome for each treated prisoner compared with the matched control could be regressed on a range of treated prisonersrsquo characteristics to identify which kinds of offenders under which circumstances most benefit from undertaking ETS
The effectiveness of TSP Does ETSrsquos replacement the Thinking Skills Programme (TSP) have a lesser similar or greater impact on reconviction A similar evaluation methodology could be used to evaluate the effectiveness of TSP in reducing reconviction outcomes though this would not be possible for a couple of years as TSP was only introduced in 2009
59 Social Exclusion Unit (2002) p 81
31
Database of research findings What does the evidence base tell us about the effectiveness of ETS Policy makers are often influenced by the latest study to be published rather than the synthesised message of the collective body of evaluation research The formation and maintenance of a database of outcome studies could be used for systematic reviews and meta-analytic analysis to produce a comprehensive review of ETS efficacy to inform and guide policy makers and practitioners (for example see Tong and Farrington 2006)
In the longer term samples of the other cohort studies being conducted by MoJ ndash the probation sample of the Offender Management Community Cohort Study (OMCCS) and the juvenile offenders sample of the Juvenile Cohort Study (JCS) ndash could be similarly linked to the same management information databases (for example OASys) as linked to SPCR in this evaluation When combined with OASys assessment data and viewed as a collective database this would be the richest known single evidence base in existence on the static and dynamic factors involved in offending behaviour
32
6 Additional resources
Readers interested in researching further the issues and topics probed in this paper further may want to consult the following publications websites and other useful sources of information
HM Prison Service Offender Behaviour Programmes (OBPs) httpwwwhmprisonservicegovukadviceandsupportbeforeafterreleaseoffenderbehaviourprogrammes
Ministry of Justice Research httpwwwjusticegovukpublications
National Offender Management Service httpwwwjusticegovukaboutnomshtm
Correctional Services Accreditation Panel httpwwwjusticegovukaboutcorrectional-services-accreditationhtm
National Reducing Reoffending Delivery plan (National Offender Management Service (NOMS) website) httpnomsjusticegovuk
Social Exclusion Unit (Cabinet Office) httpwwwcabinetofficegovuksocial_exclusion_task_forceaspx
Office for National Statistics (ONS) httpwwwstatisticsgovuk
33
7 References
Andrews D A and Bonta J (2010) The psychology of criminal conduct (5th ed) New Providence NJ LexisNexis Matthew Bender
Blackburn R (1972) lsquoDimensions of hostility and aggression in abnormal offendersrsquo Journal
of Consulting and Clinical Psychology 38 pp 20ndash26
Caliendo M and Kopeinig S (2005) lsquoSome Practical Guidance for the Implementation of Propensity Score Matchingrsquo IZA Discussion Papers Series Discussion Paper No 1588 Institute for the Study of Labor (IZA)
Cann J Falshaw L Nugent F and Friendship C (2003) Understanding What Works
cognitive accredited skills programmes for adult men and young offenders Research Findings 226 London Home Office
Cann J (2006) Cognitive skills programmes impact on reducing reconviction among a
sample of female prisoners Home Office Research Study 276 London Home Office
Clarke A Simmonds R and Wydall S (2004) Delivering cognitive skills programmes in
prison a qualitative study Home Office Research Study 242 London Home Office
Clarke D A (2000) Theory Manual for Enhanced Thinking Skills Prepared for the Joint Prison Accreditation Panel London Home Office
Colledge M Collier P and Brand S (1999) Crime reduction programme and constructive
regimes in prison Programmes for offenders Guidance for evaluators Crime reduction programme ndash guidance note 2 Research Development and Statistics Directorate London Home Office
Copas J and Marshall P (1998) lsquoThe offender group reoffending scale A statistical reoffending score for use by probation officersrsquo Applied Statistics 47(1) 159ndash171
Dehejia RH and Wahba S (2002) lsquoPropensity Score-Matching Methods for Nonexperimental Causal Studiesrsquo Review of Economics and Statistics February 2002 Vol 84 No 1 pp 151ndash161
Eysenck S B and McGurk B J (1980) lsquoImpulsiveness and venturesomeness in a detention centre populationrsquo Psychological Reports 47 pp 1299ndash1306
34
Falshaw L Friendship C Travers R and Nugent F (2003) Searching for what works An
evaluation of cognitive skills programmes Home Office Research Study 206 London Home Office
Falshaw L Friendship C Blud L Travers R and Nugent F (2004) lsquoSearching for what works HM Prison Service accredited cognitive skills coursesrsquo British Journal of Forensic
Practice 6 (2) pp 3ndash13
Friendship C Blud L Erikson M and Travers R (2002) An evaluation of cognitive
behavioural treatment for prisoners Home Office Research Study 161 London Home Office
Frude N Honess T and Maguire M (1994) CRIME-PICS II Manual Cardiff Michael and Associates
Gendreau P Smith P and Theacuteriault YL (2009) lsquoChaos theory and correctional treatment Common sense correctional quackery and the law of fartcatchersrsquo Journal of Contemporary
Criminal Justice 25 384ndash396
Harper G and Chitty C (eds) (2004) The impact of corrections on re-offending A review of
lsquoWhat Worksrsquo (3rd ed) Home Office Research Study No 291 London Home Office
Heckman J and Smith J (1995) rsquoAssessing the Case for Social Experimentsrsquo Journal of
Economic Perspectives 9 85ndash110
HM Prison Service (2007) Assessing Suitability for Offending Behaviour Programmes Risk
Need amp Responsivity Guidance for Treatment Managers Offending Behaviour Programmes Unit HM Prison Service
Home Office (2006) A Five Year Strategy for Protecting the Public and Reducing Re-
offending London The Stationary Office
Hollin C R (1995) lsquoThe meaning and implications of ldquoprogramme integrityrdquorsquo In J McGuire (Ed) What works Reducing reoffending Guidelines from Research and Practice (pp 195ndash208) Chichester England John Wiley and Sons
Howard P (2009) Improving prediction of re-offending using the Offender Assessment
System Research Summary 209 London Ministry of Justice Available at httpwwwjusticegovukpublicationsdocsoasys-research-summary-02-09pdf
Howard P Francis B Soothill K and Humphreys L (2009) OGRS 3 the revised Offender
Group Reconviction Scale Research Summary 709 London Ministry of Justice
35
Leuven E and Sianesi B (2003) psmatch2 Stata module to perform full Mahalanobis and
propensity score matching common support graphing and covariate imbalance testing httpideasrepecorgcbocbocodes432001html version 315 2 May 2009
Mak A S (1991) lsquoPsychosocial control characteristics of delinquents and nondelinquentsrsquo Criminal Justice and Behaviour 18 (3) pp 297ndash303
McDougall C Clarbour J Perry A and Bowles R (2009) Evaluation of HM Prison Service
Enhanced Thinking Skills Programme Report on the implementation of a randomised
controlled trial London Ministry of Justice
McDougall C Clarbour J Perry A and Bowles R (2009) Evaluation of HM Prison Service
Enhanced Thinking Skills Programme Report on the outcomes of a randomised controlled
trial London Ministry of Justice
Ministry of Justice (2009) The Correctional Services Accreditation Panel Report 2008-
2009 Available at httpwwwjusticegovukpublicationsdocscorrectional-services-report-20080-09pdf
Ministry of Justice (2010) Reoffending of adults results from the 2008 cohort ndash England and
Wales Ministry of Justice Statistics bulletin London Ministry of Justice Available at httpwwwjusticegovukpublicationsdocsreoffending-adults-2008-cohortpdf
National Offender Management Service (2005) Understanding research methods and
findings lsquoWhat Worksrsquo Briefing 305 Available at httprdshomeofficegovukrdspdfs05wwbn3pdf
National Offender Management Service (2009) Suitability for Accredited Interventions Risk
Need amp Responsivity Targeting Criteria for Offender Managers and Treatment Managers
Interventions and Substance Misuse Group Directorate of Commissioning and Operational Policy National Offender Management Service May 2009
OASys Data Evaluation and Analysis Team O-DEAT (2010) OASys caveats notes and
limitations ndash layered OASys (May 10)
OASys development team (2001) Offender Assessment System OASys User Manual OASys Manual V2 Crown Copyright 2002
Palmer EJ McGuire J Hatcher RM Hounsome JC Bilby CAL and Hollin CR (2009) lsquoAllocation to offending behavior programs in the English and Welsh probation servicersquo Criminal Justice and Behavior 36 909ndash922
36
Rosenbaum P R and Rubin D B (1983) lsquoThe Central Role of the Propensity Score in Observational Studies for Causal Effectsrsquo Biometrika 70 41ndash55
Smith J and Todd P (2005) rsquoDoes matching overcome LaLondersquos critique of nonexperimental estimatorsrsquo Journal of Econometrics Elsevier vol 125(1-2) pages 305ndash353
Social Exclusion Unit (2002) Reducing re-offending by ex-prisoners Available from httpwwwcabinetofficegovukmediacabinetofficesocial_exclusion_task_forceassetspublications_1997_to_2006reducing_reportpdf
Stewart D (2008) The problems and needs of newly sentenced prisoners results from a
national survey Ministry of Justice Research Series 1608 Published online at httpwwwjusticegovukpublicationsresearch2008htm
Taxman FS and Thanner M (2006) lsquoRisk need and responsivity (RNR) It all dependsrsquo Crime and Delinquency 52 28ndash51
Tong LSJ and Farrington DP (2006) lsquoHow effective is the ldquoReasoning and Rehabilitationrdquo programme in reducing reoffending A meta-analysis of evaluations in four countriesrsquo Psychology Crime and Law 12 3ndash24
37
Appendix 1 Technical annex
Full set of matching variables (covariates)Programme suitability criteriaoasys_need Need Sum of OASys Section 11 Thinking and Behaviour scores
(OASys)oasys_score Risk OASys total weighted score (OASys)oasys_motiv Motivation to change behaviour (OASys)oasys_litnum Problems with readingwritingnumeracy (OASys)oasys_lrndiff Problems with learning difficulties (OASys)oasys_psychgl Problems with current psychological problemsdepression (OASys)oasys_psychtr Problems with current psychiatric problems (OASys)
Static risk factorsspcr_genderf Gender Female (SPCR)spcr_age Age (SPCR)spcr_marst_mar Marital status Married (SPCR)spcr_marst_lvp Marital status Living with a partner (SPCR)spcr_ethnic_mix Ethnicity Any Mixed background (SPCR)spcr_ethnic_as Ethnicity Any Asian background (SPCR)spcr_ethnic_bl Ethnicity Any Black background (SPCR)spcr_ethnic_oth Ethnicity Any Other background (SPCR)pnc_copas Copas rate on release (PNC)pnc_ttlprevconv Previous convictions (PNC)pnc_ttlprevconv2 Previous convictions squared (PNC)pnc_ttlprevconvsev Previous severe convictions (PNC)pnc_ttlprevconvsev2 Previous severe convictions squared (PNC)pnc_index_vio Index offence type Violent (PNC)pnc_index_sxl Index offence type Sexual (PNC)pnc_index_acq Index offence type Acquisitive (PNC)pnc_index_drg Index offence type Drug (PNC)pnc_index_rob Index offence type Robbery (PNC)spcr_famconv Family member has been convicted of a non-motoring offence
(SPCR)spcr_fampris Family member has been in prison (SPCR)
Dynamic risk factorsspcr_motivstoffy Agree Want to stop offending (SPCR)spcr_motivstoffn Disagree Want to stop offending (SPCR)spcr_motivhlpstoffy Agree Want to get help to stop offending (SPCR)spcr_motivhlpstoffn Disagree Want to get help to stop offending (SPCR)spcr_attg General attitude to offending CRIME-PICS (SPCR)spcr_atta Anticipation of reoffending CRIME-PICS (SPCR)spcr_attv Victim hurt denial CRIME-PICS (SPCR)spcr_atte Evaluation of crime as worthwhile CRIME-PICS (SPCR)spcr_drug4wka Used class A drugs in the four weeks before custody (SPCR)spcr_drug4wkbc Used class BC drugs in the four weeks before custody (SPCR)spcr_drug4wkinj Injected illegal drugs in the four weeks before custody (SPCR)spcr_accomtrans Transient accommodation prior to custody (SPCR)spcr_accomrough Sleeping rough prior to custody (SPCR)spcr_edqual Educational (qualifications) attainment (SPCR)spcr_job4wk Was in paid work in the four weeks before custody (SPCR)
38
Logistic regression model
Table A1 Logistic regression model of prisoner characteristics influencing probability of treatment (ETS) and reconviction outcomes
Coefficient Standard error P-valueETS suitabilityNeed (thinking and behaviour) 0082 0027 0002Risk (OASys score) 0005 0003 0069Motivation to change behaviour (OASys) 0323 0122 0008Problems with readingwritingnumeracy -0303 0116 0009Problems with current psychiatric problems 0335 0131 0011
GenderMale Reference
categoryFemale 0736 0177 0000
Age -0030 0009 0000
Index offence typeOther Reference
categoryViolent 1223 0296 0000Sexual 2094 0389 0000Acquisitive 0243 0313 0438Drug 1192 0309 0000Robbery 1552 0329 0000
Motivation to stop offendingDisagreed with ldquoI want to get help to stop offendingrdquo all other responses
Reference category
Agreed with ldquoI want to get help to stop offendingrdquo
0315 0091 0001
Offending-related attitudesVictim hurt denial 0078 0026 0003
Drug useUsed Class BC drugs in the 4 weeks before custody
-0195 0150 0193
AccommodationStable accommodation prior to custody Reference
categoryTemporary accommodation prior to custody Reference
categorySleeping rough prior to custody -0709 0409 0083
Constant -4933 0554 0000Notes Number of observations = 2771 (257 treated 2514 untreated) Pseudo R2 = 00958 LR
chi2(16)=16397 probgtchi2 00000
39
Calculation of the average treatment effect on the treated (ATT)
Outcome measures
pnc_reconvind Indicator of reconviction within one yearpnc_reofffreq Frequency of proven reoffending within one yearpnc_reconvindsev Indicator of severe offence reconviction within one year
Table A2 Average treatment effect on the treated (ATT)
Variable Sample Treated Controls(Difference)
ATTa
Standard error t-stat
pnc_reconvind Unmatched 0272 0370 (-0098) 0031 -311Matched ATT 0272 0335 -0062 0031 -204
pnc_reofffreq Unmatched 0607 1422 (-0815) 0182 -447Matched ATT 0607 1208 -0601 0110 -547
pnc_reconvindsev Unmatched 0008 0007 (0001) 0006 011Matched ATT 0008 0009 -0001 0006 -013
a ATT is the difference between the mean outcome of the treatment group and the matched control group
40
Tests of covariate balancing
Table A3 Means standardised bias reduction and t-tests for equality of means in the treatment and control groups before and after matching
Variable SampleMean
bias bias
reductiont-test
Treatment Control t pgttoasys_need Unmatched 7381 6703 203 299 000
Matched 7381 7269 34 834 039 070oasys_score Unmatched 77335 75658 48 070 049
Matched 77335 77060 08 836 009 093oasys_motiv Unmatched 1210 1141 110 165 010
Matched 1210 1201 15 864 017 087oasys_litnum Unmatched 0350 0416 -102 -150 013
Matched 0350 0361 -17 830 -020 084oasys_lrndiff Unmatched 0187 0184 05 008 094
Matched 0187 0180 13 -1510 014 089oasys_psychgl Unmatched 0486 0426 89 139 017
Matched 0486 0499 -19 791 -020 084oasys_psychtr Unmatched 0237 0142 194 327 000
Matched 0237 0224 27 861 028 078spcr_genderf Unmatched 0214 0124 243 408 000
Matched 0214 0199 39 838 041 068spcr_age Unmatched 28008 30216 -238 -349 000
Matched 28008 28364 -38 839 -046 065spcr_marst_mar Unmatched 0070 0093 -84 -123 022
Matched 0070 0075 -19 776 -023 082spcr_marst_lvp Unmatched 0296 0256 90 140 016
Matched 0296 0250 103 -149 117 024spcr_ethnic_mix Unmatched 0062 0038 110 187 006
Matched 0062 0040 100 92 112 026spcr_ethnic_as Unmatched 0047 0041 28 044 066
Matched 0047 0035 57 -1056 067 050spcr_ethnic_bl Unmatched 0035 0065 -137 -189 006
Matched 0035 0063 -127 76 -145 015spcr_ethnic_oth Unmatched 0000 0004 -89 -101 031
Matched 0000 0002 -51 431 -076 045pnc_copas Unmatched -0902 -0880 -27 -040 069
Matched -0902 -0910 10 644 011 091pnc_ttlprevconv Unmatched 10946 12746 -163 -227 002
Matched 10946 11580 -57 648 -069 049pnc_ttlprevconv2 Unmatched 212140 314300 -133 -163 010
Matched 212140 257960 -60 552 -082 041pnc_ttlprevconvsev
Unmatched 0132 0146 -34 -050 062Matched 0132 0165 -79 -1300 -087 039
pnc_ttlprevconvsev2
Unmatched 0163 0209 -57 -074 046Matched 0163 0239 -95 -657 -102 031
41
Variable SampleMean
bias bias
reductiont-test
Treated Control t pgttpnc_index_vio Unmatched 0327 0245 182 288 000
Matched 0327 0311 36 804 039 070pnc_index_sxl Unmatched 0078 0040 162 286 000
Matched 0078 0078 -03 982 -003 098pnc_index_acq Unmatched 0175 0303 -302 -430 000
Matched 0175 0195 -46 847 -057 057pnc_index_drg Unmatched 0218 0195 57 088 038
Matched 0218 0211 16 718 018 086pnc_index_rob Unmatched 0144 0065 261 469 000
Matched 0144 0133 37 858 037 071spcr_famconv Unmatched 0463 0403 121 185 006
Matched 0463 0433 60 503 067 050spcr_fampris Unmatched 0396 0334 129 200 005
Matched 0396 0354 88 322 098 033spcr_motivstoffy Unmatched 1720 1670 93 139 017
Matched 1720 1719 01 985 002 099spcr_motivstoffn Unmatched 0016 0010 40 065 052
Matched 0016 0007 58 -453 069 049spcr_motivhlpstoffy
Unmatched 1346 1085 338 498 000Matched 1346 1304 55 836 065 052
spcr_motivhlpstoffn
Unmatched 0097 0164 -166 -234 002Matched 0097 0107 -25 850 -031 076
spcr_attg Unmatched 58131 57962 23 033 074Matched 58131 58212 -11 518 -012 091
spcr_atta Unmatched 18393 18516 -50 -073 047Matched 18393 18547 -63 -257 -068 050
spcr_attv Unmatched 11825 10907 321 454 000Matched 11825 11681 50 843 061 054
spcr_atte Unmatched 13996 13809 60 092 036Matched 13996 13871 40 331 045 066
spcr_drug4wka Unmatched 0381 0419 -77 -118 024Matched 0381 0408 -55 289 -062 053
spcr_drug4wkbc Unmatched 0494 0499 -10 -015 088Matched 0494 0486 16 -637 019 085
spcr_drug4wkinj Unmatched 0109 0155 -135 -194 005Matched 0109 0143 -99 265 -114 025
spcr_accomtrans Unmatched 0054 0052 12 019 085Matched 0054 0058 -17 -360 -018 085
spcr_accomrough Unmatched 0027 0054 -138 -188 006Matched 0027 0032 -23 835 -030 076
spcr_edqual Unmatched 1965 1893 36 054 059Matched 1965 1915 25 308 028 078
spcr_job4wk Unmatched 0346 0331 32 049 062Matched 0346 0331 32 17 036 072
Figure A1 Risk OASys total weighted score (OASys) by treatment and control groups
Risk OASys weighted score
8
6
4
2
Per c
ent
Control
0
8
6
4
2
Per c
ent
Treatment
050 100 150 50 100 150
42
Distributions of matching variables by treatment and control groups
Table A4 Need Sum of OASys Section 11 Thinking and Behaviour scores (OASys) by treatment and control groups
Summed scoreControl Treatment
n Valid n Valid 0 111 44 44 1 04 041 89 35 35 6 23 232 126 50 50 11 43 433 156 62 62 13 51 514 219 87 87 24 93 935 234 93 93 19 74 746 262 104 104 23 89 897 281 112 112 37 144 1448 253 101 101 30 117 1179 211 84 84 29 113 11310 184 73 73 15 58 5811 147 58 58 18 70 7012 117 47 47 17 66 6613 62 25 25 7 27 2714 62 25 25 7 27 27Missing 0 00 0 00Total 2514 1000 1000 257 1000 1000Note Control group frequencies are unweighted (a weighted average of controls within the radius calliper is
used in the matching algorithm)
43
Table A5 Motivation to change behaviour (OASys) by treatment and control groups
RatingControl Treatment
n Valid n Valid Not at all 367 146 146 28 109 109Quite motivated 1426 567 567 147 572 572Very motivated 721 287 287 82 319 319Missing 0 00 0 00Total 2514 1000 1000 257 1000 1000Note Control group frequencies are unweighted (a weighted average of controls within the radius calliper is
used in the matching algorithm)
Table A6 Problems with readingwritingnumeracy (OASys) by treatment and control groups
ExtentControl Treatment
n Valid n Valid No problems 1735 690 690 187 728 728Some problems 512 204 204 50 195 195Significant problems 267 106 106 20 78 78Missing 0 00 0 00Total 2514 1000 1000 257 1000 1000Note Control group frequencies are unweighted (a weighted average of controls within the radius calliper is
used in the matching algorithm)
Table A7 Problems with learning difficulties (OASys) by treatment and control groups
ExtentControl Treatment
n Valid n Valid No problems 2185 869 869 226 879 879Some problems 195 78 78 14 54 54Significant problems 134 53 53 17 66 66Missing 0 00 0 00Total 2514 1000 1000 257 1000 1000Note Control group frequencies are unweighted (a weighted average of controls within the radius calliper is
used in the matching algorithm)
Table A8 Problems with current psychological problemsdepression (OASys) by treatment and control groups
Extent Control Treatment
n Valid n Valid No problems 1693 673 673 162 630 630Some problems 572 228 228 65 253 253Significant problems 249 99 99 30 117 117Missing 0 00 0 00Total 2514 1000 1000 257 1000 1000Note Control group frequencies are unweighted (a weighted average of controls within the radius calliper is
used in the matching algorithm)
Figure A2 Age (SPCR) by treatment and control groups
8
6
4
2
0
Per
cen
t
20 40 60 80
8
6
4
2
0
Per
cen
t
20 40 60 80Age (SPCR)
Control Treatment
44
Table A9 Problems with current psychiatric problems (OASys) by treatment and control groups
ExtentControl Treatment
n Valid n Valid No problems 2244 893 893 211 821 821Some problems 184 73 73 31 121 121Significant problems 86 34 34 15 58 58Missing 0 00 0 00Total 2514 1000 1000 257 1000 1000Note Control group frequencies are unweighted (a weighted average of controls within the radius calliper is
used in the matching algorithm)
Table A10 Gender (SPCR) by treatment and control groups
GenderControl Treatment
n Valid n Valid Male 2203 876 876 202 786 786Female 311 124 124 55 214 214Missing 0 00 0 00Total 2514 1000 1000 257 1000 1000Note Control group frequencies are unweighted (a weighted average of controls within the radius calliper is
used in the matching algorithm)
Figure A3 Copas rate on release (PNC) by treatment and control groups
10
5
0-4 -2 0 2
Per c
ent
10
5
0-4 -2 0 2
Per c
ent
COPAS rate on release (PNC)
Control Treatment
45
Table A11 Marital status (SPCR) by treatment and control groups
StatusControl Treatment
n Valid n Valid Married 234 93 93 18 70 70Living with partner 642 255 256 76 296 296Other 1636 651 651 163 634 634Missing 2 01 0 00Total 2514 1000 1000 257 1000 1000Note Control group frequencies are unweighted (a weighted average of controls within the radius calliper is
used in the matching algorithm)
Table A12 Ethnicity (SPCR) by treatment and control groups
Ethnic groupControl Treatment
n Valid n Valid Any White background 2142 852 852 220 856 856Any Mixed background 96 38 38 16 62 62Any Asian background 103 41 41 12 47 47Any Black background 163 65 65 9 35 35Any Other background 10 04 04 0 00 00Missing 0 00 0 00Total 2514 1000 1000 257 1000 1000Note Control group frequencies are unweighted (a weighted average of controls within the radius calliper is
used in the matching algorithm)
Figure A4 Total previous convictions (PNC) by treatment and control groups
30
20
10
050 100 150 200
30
20
10
050 100 150 200
Per c
ent
Per c
ent
Previous convictions (PNC)
Control Treatment
46
Table A13 Previous severe convictions (PNC) by treatment and control groups
NumberControl Treatment
n Valid n Valid 0 2205 877 877 227 883 8831 265 105 105 26 101 1012 34 14 14 4 16 163 5 02 02 0 00 004 5 02 02 0 00 00Missing 0 00 0 00Total 2514 1000 1000 257 1000 1000Note Control group frequencies are unweighted (a weighted average of controls within the radius calliper is
used in the matching algorithm)
Table A14 Grouped index offence type (PNC) by treatment and control groups
Offence type grouping
Control Treatmentn Valid n Valid
Other 384 153 153 15 58 58Violent 616 245 245 84 327 327Robbery 163 65 65 37 144 144Sexual 100 40 40 20 78 78Acquisitive 761 303 303 45 175 175Drug 490 195 195 56 218 218Missing 0 00 0 00Total 2514 1000 1000 257 1000 1000Note Control group frequencies are unweighted (a weighted average of controls within the radius calliper is
used in the matching algorithm)
47
Table A15 Family member has been convicted of a non-motoring offence (SPCR) by treatment and control groups
ResponseControl Treatment
n Valid n Valid No 1486 591 597 137 533 537Yes 1003 399 403 118 459 463Missing 25 10 2 08Total 2514 1000 1000 257 1000 1000Note Control group frequencies are unweighted (a weighted average of controls within the radius calliper is
used in the matching algorithm)
Table A16 Family member has been in prison (SPCR) by treatment and control groups
ResponseControl Treatment
n Valid n Valid No 1658 660 666 154 599 604Yes 831 331 334 101 393 396Missing 25 10 2 08Total 2514 1000 1000 257 1000 1000Note Control group frequencies are unweighted (a weighted average of controls within the radius calliper is
used in the matching algorithm)
Table A17 Agree Want to stop offending (SPCR) by treatment and control groups
ResponseControl Treatment
n Valid n Valid Other 101 40 40 9 35 35Agree 627 249 249 54 210 210Strongly agree 1786 710 710 194 755 755Missing 0 00 0 00Total 2514 1000 1000 257 1000 1000Note Control group frequencies are unweighted (a weighted average of controls within the radius calliper is
used in the matching algorithm)
Table A18 Disagree Want to stop offending (SPCR) by treatment and control groups
ResponseControl Treatment
n Valid n Valid Other 2498 994 994 254 988 988Disagree 7 03 03 2 08 08Strongly disagree 9 04 04 1 04 04Missing 0 00 0 00Total 2514 1000 1000 257 1000 1000Note Control group frequencies are unweighted (a weighted average of controls within the radius calliper is used in the matching algorithm)
Figure A5 General attitude to offending CRIME-PICS (SPCR) by treatment and control groups
15
10
5
020 40 60 80
Per c
ent
Control15
10
5
020 40 60 80
Per c
ent
Treatment
General attitude to offending CRIME-PICS (SPCR)
48
Table A19 Agree Want to get help to stop offending (SPCR) by treatment and control groups
ResponseControl Treatment
n Valid n Valid Other 725 288 288 40 156 156Agree 851 339 339 88 342 342Strongly agree 938 373 373 129 502 502Missing 0 00 0 00Total 2514 1000 1000 257 1000 1000Note Control group frequencies are unweighted (a weighted average of controls within the radius calliper is
used in the matching algorithm)
Table A20 Disagree Want to get help to stop offending (SPCR) by treatment and control groups
ResponseControl Treatment
n Valid n Valid Other 2174 865 865 237 922 922Disagree 268 107 107 15 58 58Strongly disagree 72 29 29 5 19 19Missing 0 00 0 00Total 2514 1000 1000 257 1000 1000Note Control group frequencies are unweighted (a weighted average of controls within the radius calliper is
used in the matching algorithm)
49
Table A21 Anticipation of reoffending CRIME-PICS (SPCR) by treatment and control groups
ScoreControl Treatment
n Valid n Valid 8 2 01 01 0 00 009 1 00 00 0 00 0010 3 01 01 1 04 0411 6 02 03 0 00 0012 14 06 06 1 04 0413 27 11 11 4 16 1614 46 18 19 8 31 3315 113 45 48 9 35 3716 201 80 85 18 70 7417 276 110 116 30 117 12318 628 250 265 65 253 26619 371 148 156 44 171 18020 287 114 121 30 117 12321 145 58 61 13 51 5322 106 42 45 9 35 3723 71 28 30 5 19 2024 29 12 12 2 08 0825 17 07 07 2 08 0826 14 06 06 2 08 0827 7 03 03 1 04 0428 3 01 01 0 00 0029 1 00 00 0 00 0030 6 02 03 0 00 00Missing 140 56 13 51Total 2514 1000 1000 257 1000 1000Note Control group frequencies are unweighted (a weighted average of controls within the radius calliper is
used in the matching algorithm)
50
Table A22 Victim hurt denial CRIME-PICS (SPCR) by treatment and control groups
ScoreControl Treatment
n Valid n Valid 3 69 27 27 2 08 084 47 19 19 2 08 085 59 23 23 1 04 046 136 54 54 6 23 237 104 41 41 4 16 168 155 62 62 14 54 549 129 51 51 20 78 7810 241 96 96 19 74 7411 133 53 53 8 31 3112 664 264 264 77 300 30013 257 102 102 38 148 14814 196 78 78 22 86 8615 324 129 129 44 171 171Missing 0 00 0 00Total 2514 1000 1000 257 1000 1000Note Control group frequencies are unweighted (a weighted average of controls within the radius calliper is
used in the matching algorithm)
Table A23 Evaluation of crime as worthwhile CRIME-PICS (SPCR) by treatment and control groups
ScoreControl Treatment
n Valid n Valid 4 1 00 00 1 04 045 5 02 02 1 04 046 16 06 06 2 08 087 26 10 11 2 08 088 68 27 28 4 16 169 96 38 39 9 35 3510 177 70 72 21 82 8311 197 78 80 13 51 5112 270 107 109 31 121 12213 235 93 95 24 93 9414 328 130 133 33 128 13015 266 106 108 24 93 9416 276 110 112 27 105 10617 229 91 93 24 93 9418 115 46 47 20 78 7919 94 37 38 12 47 4720 70 28 28 6 23 24Missing 45 18 3 12Total 2514 1000 1000 257 1000 1000Note Control group frequencies are unweighted (a weighted average of controls within the radius calliper is
used in the matching algorithm)
51
Table A24 Used class A drugs in the four weeks before custody (SPCR) by treatment and control groups
ResponseControl Treatment
n Valid n Valid No 1460 581 581 159 619 619Yes 1054 419 419 98 381 381Missing 0 00 0 00Total 2514 1000 1000 257 1000 1000Note Control group frequencies are unweighted (a weighted average of controls within the radius calliper is
used in the matching algorithm)
Table A25 Used class BC drugs in the four weeks before custody (SPCR) by treatment and control groups
ResponseControl Treatment
n Valid n Valid No 1259 501 501 130 506 506Yes 1255 499 499 127 494 494Missing 0 00 0 00Total 2514 1000 1000 257 1000 1000Note Control group frequencies are unweighted (a weighted average of controls within the radius calliper is
used in the matching algorithm)
Table A26 Injected illegal drugs in the four weeks before custody (SPCR) by treatment and control groups
ResponseControl Treatment
n Valid n Valid No 2121 844 845 228 887 891Yes 389 155 155 28 109 109Missing 4 02 1 04Total 2514 1000 1000 257 1000 1000Note Control group frequencies are unweighted (a weighted average of controls within the radius calliper is
used in the matching algorithm)
Table A27 Accommodation prior to custody (SPCR) by treatment and control groups
TypeControl Treatment
n Valid n Valid Stable accommodation 2247 894 894 236 918 918Transient accommodation 130 52 52 14 54 54Sleeping rough 137 54 54 7 27 27Missing 0 00 0 00Total 2514 1000 1000 257 1000 1000Note Control group frequencies are unweighted (a weighted average of controls within the radius calliper is
used in the matching algorithm)
52
Table A28 Educational (qualifications) attainment (SPCR) by treatment and control groups
Highest qualification attained
Control Treatment
n Valid
n Valid
No qualifications 1099 437 441 99 385 388Other qualifications (incl overseas) 66 26 26 7 27 27O levelGCSE grade D-G (or similar qualification) 372 148 149 47 183 184O levelGCSE Grades A-C (or similar qualification) 507 202 204 61 237 239Trade apprenticeships 87 35 35 6 23 24AAS levels 220 88 88 21 82 82Higher education diploma 57 23 23 11 43 43First degreepostgraduate degree 70 28 28 2 08 08Higher degreepostgraduate degree 13 05 05 1 04 04Missing 23 09 2 08Total 2514 1000 1000 257 1000 1000Note Control group frequencies are unweighted (a weighted average of controls within the radius calliper is
used in the matching algorithm)
Table A29 Was in paid work in the four weeks before custody (SPCR) by treatment and control groups
ResponseControl Treatment
n Valid n Valid No 1681 669 669 168 654 654Yes 832 331 331 89 346 346Missing 1 00 0 00Total 2514 1000 1000 257 1000 1000Note Control group frequencies are unweighted (a weighted average of controls within the radius calliper is
used in the matching algorithm)
Table A30 Reconviction indicator one-year (PNC) by treatment and control groups
IndicatorControl Treatment
n Valid n Valid No 1584 630 630 187 728 728Yes 930 370 370 70 272 272Missing 0 00 0 00Total 2514 1000 1000 257 1000 1000Note Control group frequencies are unweighted (a weighted average of controls within the radius calliper is
used in the matching algorithm)
53
Table A31 Frequency of reoffending one-year (PNC) by treatment and control groups
IndicatorControl Treatment
n Valid n Valid 0 1584 630 630 187 728 7281 495 197 197 54 210 2102 203 81 81 11 43 433 117 47 47 3 12 124 53 21 21 1 04 045 33 13 13 1 04 046 8 03 03 0 00 007 7 03 03 0 00 008 6 02 02 0 00 009 1 00 00 0 00 0010 2 01 01 0 00 0011 2 01 01 0 00 0013 0 00 00 0 00 0015 1 00 00 0 00 0018 1 00 00 0 00 0032 1 00 00 0 00 00Missing 0 00 0 00Total 2514 1000 1000 257 1000 1000Note Control group frequencies are unweighted (a weighted average of controls within the radius calliper is
used in the matching algorithm)
54
Table A32 Frequency of reoffences one-year (PNC) by treatment and control groups
IndicatorControl Treatment
n Valid n Valid 0 1584 630 630 187 728 7281 272 108 108 31 121 1212 181 72 72 15 58 583 117 47 47 15 58 584 91 36 36 2 08 085 65 26 26 3 12 126 42 17 17 2 08 087 38 15 15 1 04 048 32 13 13 1 04 049 20 08 08 0 00 0010 19 08 08 0 00 0011 15 06 06 0 00 0012 11 04 04 0 00 0013 6 02 02 0 00 0014 6 02 02 0 00 0015 5 02 02 0 00 0016 1 00 00 0 00 0017 0 00 00 0 00 0018 1 00 00 0 00 0019 1 00 00 0 00 0020 1 00 00 0 00 0021 2 01 01 0 00 0022 2 01 01 0 00 0025 1 00 00 0 00 0039 1 00 00 0 00 00Missing 0 00 0 00Total 2514 1000 1000 257 1000 1000Note Control group frequencies are unweighted (a weighted average of controls within the radius calliper is
used in the matching algorithm)
Table A33 Severe offences reconviction indicator one-year (PNC) by treatment and control groups
IndicatorControl Treatment
n Valid n Valid No 2496 993 993 255 992 992Yes 18 07 07 2 08 08Missing 0 00 0 00Total 2514 1000 1000 257 1000 1000Note Control group frequencies are unweighted (a weighted average of controls within the radius calliper is
used in the matching algorithm)
Ministry of Justice Research Series 1910Evaluation of the impact of the HM Prison Service Enhanced Thinking Skills programme on reoffendingThis research examined the impact of the Enhanced Thinking Skills (ETS) programme on the one-year reconviction outcomes of 257 prison-based participants between 2006 and 2008 Radius propensity score matching was used to match a comparison group that had no statistically significant difference (at the means) to the treatment group on any matching characteristic ETS was found to significantly reduce both the reconviction rate (six percentage points) and frequency (60 reoffences per 100 released prisoners) of general reoffending of participants No statistically significant impact was found on the severe offences reconviction rate Almost identical impacts were found for completers A stronger reduction in reconviction was found for participants meeting the suitability criteria Though the programme has been shown to be effective in practice the findings suggest that a stricter application of the targeting criteria might have further enhanced the effectiveness of the programme
ISBN 978 1 84099 418 6copy Crown copyrightProduced by the Ministry of JusticeAlternative format versions of this report are available on requestE-mail researchjusticegsigovukhttpwwwjusticegovukpublicationsresearchhtm

8
Data sources and sample detailsAs the source of the novel dynamic risk factor data the base sample for the analysis is that of the SPCR prisoner survey The SPCR dataset is supplemented by merging to three further data sources data on which prisoners received ETS in what time period from the Offending Behaviour Programme Interventions Database data on the assessed need and risk of prisoners from the Offender Assessment System (OASys) and criminal history and reconviction data from the Police National Computer Each data source is described in turn
SPCR prisoner survey (wave 1)
Surveying Prisoner Crime Reduction (SPCR) is a large-scale longitudinal cohort study of nearly 4000 newly-sentenced adult prisoners in England and Wales comprising four waves of interviews conducted between 2005 and 2009
This evaluation uses wave 1 data only Wave 1 conducted at the point of reception into prison describes the characteristics and needs26 of the cohort of prisoners demographics background and family offending history educational achievements employment status physical and mental health substance misuse accommodation and relationships attitudes27 needs to help prevent them from reoffending and plans and expectations for the future (upon release from prison) All data are self-reported and as the survey responses relate to the start of the particular custodial sentence all responses are measured before any treatment could have commenced
Prisoners were selected from the Ministry of Justicersquos (MoJ) Inmate Information System (IIS) database and their current location found using MoJrsquos Local Inmate Data System (LIDS) The minimum sentence length accepted was one month due to the time taken to locate the prisoner and interview them and the maximum sentence length was four years to allow for a reasonable data-collection period Prisoners were recruited into the study on the basis of fully informed consent and ethical guidelines for social research were followed Prisoners were interviewed by specially trained researchers using computer-assisted (CAPI) questionnaires
Interview targets were set for every reception prison (except those with very low throughput) based on the proportional sizes of receptions at each prison Prison reception characteristics were found to be highly variable and targets were compiled using the most recent information available Over-sampling targets were calculated to allow for any difficulties in accessing prisoners Thus the interviews were drawn from 40 prisons from a possible 53 eligible prisons
26 The term lsquoneedsrsquo is used throughout to refer to a wide range of factors (associated with the pathways) which are generally understood to be related to offending sometimes known as ldquocriminogenic needsrdquo A summary of the general problems and needs of these newly sentenced prisoners has already been published (Stewart 2008)
27 Attitudes are measured using CRIME-PICS II (Frude et al 1994) a widely used and validated questionnaire-based instrument for examining and detecting changes in offendersrsquo attitudes to offending Special thanks are due to Jennifer Poyser in Offender Management Analytical Services at MoJ for the conversion of SPCR attitude question responses to CRIME-PICS II scores
9
The full sample (after removal of ineligible participants)28 at wave 1 was 3849 adult prisoners sentenced to between one month and four years29 This represents the base sample for this evaluation though the final sample will be smaller due to failed matches in database merging and data completion filters
Offending Behaviour Programme Interventions Database
To determine the treatment status of the base sample (that is which prisoners had received ETS during their sentence period) the SPCR wave 1 dataset was linked to the OBP prison interventions database compiled by the National Offender Management Service (NOMS) Rehabilitation Services Group30
The database is based on administrative records of interventions delivered to prisoners (71521 unique prisoner numbers) from 1994 to 2009 It covers accredited OBPs only including Controlling Anger and Learning how to Manage it (CALM) Cognitive Skills Booster (CSB) Cognitive Self Change Programme (CSCP) Enhanced Thinking Skills (ETS) Focus on Resettlement (FOR) Healthy Relationships Programme (HRP) Reasoning and Rehabilitation (RampR) Chromis JETS and Sex Offender Treatment Programme (SOTP)
When matched to the SPCR sample (by prisoner number) it was found that 449 (12) of the 3849 SPCR prisoners had received an accredited intervention The magnitude of this intervention rate was validated by comparison of total ETS programme participants and total prison population figures More specifically 371 (10) prisoners were identified as having participated in ETS within the SPCR sentence period All started the programme between March 2006 and September 200831 ETS was by far the most common OBP intervention delivered and the only individual programme with a sufficient number of participants to permit a statistical analysis of effectiveness
Offender Assessment System (OASys)
For verification of suitability for the programme and to allow matching of control prisoners based on these characteristics data are required on the risk and need of the prisoners in the sample This data requirement is fulfilled by the Offender Assessment System (OASys)
28 Twenty-eight participants were removed due to ineligibility Please see the SPCR Technical Report for more information
29 There are two sub-samples within SPCR Sample 1 (Reception Prisoners) is representative of the entire prison reception population (the lsquoflowrsquo into prison) at the time of sampling (n=1435) Sample 2 (Longer-term Prisoners) is a booster sample to reflect the higher proportion of longer-term prisoners in the prison population (the lsquostockrsquo of prisoners) (n=2414) Please see the SPCR Technical Report for more information This evaluation study uses the combined sample and does not distinguish between the two sub-samples That said ETS tends to be reserved for longer-term prisoners
30 Previously known as the Interventions amp Substance Misuse Group (ISMG)31 If a prisoner was recorded as receiving more than one ETS course in the SPCR sentence period the latest
start date was used
10
OASys is NOMSrsquos principal riskneed assessment and management tool for adult offenders in England and Wales and is used to assess suitability for ETS Introduced in 2001 OASys produces standardised assessments of offendersrsquo risks and needs by combining actuarial methods of prediction with structured professional judgement In terms of outputs OASys provides data on the likelihood of reconviction criminogenic factors (need) and risk of harm
The SPCR sample was matched to the OASys database by PNC number All OASys assessments completed for the prisoners in the SPCR sample subject to data completion criteria32 were provided by the OASys Data Evaluation and Analysis Team (O-DEAT) numbering some 2956433 Nonetheless as OASys assessments are not mandatory and the coverage of OASys is not universal an OASys assessment is available for only 3512 prisoners (316 of which were treated)
With an average of eight assessments provided per prisoner the one OASys assessment relevant to the instance of ETS participation was selected for each prisoner The method of selection differed for treated and untreated prisoners As the start date of ETS is known for each participant the most recent assessment prior to the start date was selected As there is no start date for the untreated group the OASys assessment completed closest (before or after) to the SPCR sentence prison reception date was selected
Police National Computer
Criminal conviction history and reconviction data were obtained from the Police National Computer (PNC) The SPCR sample was matched to the PNC database (June 2010 snapshot) using personal identifiers (surname forenames gender date of birth) returning 3615 valid matches34 Respondents must have been released for a minimum of one and a half years (allowing one year to reoffend and six months to be convicted) to be included in the matched sample Respondents that were deceased deported or had absconded were excluded from the sample
Final achieved sample details
Following merging of the four datasets 2771 of the 3849 full SPCR sample (and 257 of the 371 ETS participants) had complete data a valid OASys assessment matched to the PNC and had no missing data on any variables employed in the statistical modelling The sample included 2405 (87) men and 366 (13) women
32 All assessments provided met the following minimum standards of data completion Each of the scored sections (1 to 12) within the core OASys assessment must have had at least four-fifths of their scored items completed ndash ensuring that each criminogenic need was assessed properly and In the risk of serious harm sections the screening must have been completed the decision whether to complete a full risk analysis should have been consistent with the information provided and the four ratings of risk of serious harm in the community must have been completed (OASys Data Evaluation and Analysis Team 2010)
33 All OASys assessments used in the analysis are pre-OASys release 431 (August 2009) assessments34 Special thanks are due to Richard Boorman in Offender Management Analytical Services at MoJ for matching
the SPCR sample to the PNC and completing the reconviction analysis
11
The participant sample comprised 257 (9 of the final sample) treated prisoners who started ETS between March 2006 and September 2008 This includes 20 (8 of all treated) participants that did not complete the course a similar proportion observed in previous studies (Friendship et al 2002 Falshaw et al 2003 Cann et al 2003 Cann 2006) The remaining 2514 prisoners did not undertake ETS which provides a reasonable pool from which to select a matched control group35
Outcome measuresTo assess programme effectiveness the impact of ETS is measured with reference to the one-year reconviction outcomes of participants and comparators To reflect the fact that a successful outcome for ETS could include no reconviction (general andor severe) or a reduction in the frequency of reoffending three separate measures of proven reoffending36 are examined defined as follows
reconviction rate (one-year) binary (yesno) indicator of whether the offender was convicted of a recordable offence that was committed within the 12-month period after release from the SPCR custodial sentence
reoffending frequency (one-year) continuous measure of how many recordable offences the offender was convicted of that were committed within the 12-month period after release from the SPCR custodial sentence (note that there may be more than one offence per conviction) and
severe offence reconviction rate (one-year) binary (yesno) indicator of whether the offender was convicted of a severe offence that was committed within the 12-month follow-up period after release from the SPCR custodial sentence The designation of an offence as lsquoseverersquo follows a standard definition under which approximately 150 of the 3000 Home Office offence codes are defined as severe37
Evaluation research designTo evaluate the impact of ETS it would be desirable to compare each treated prisonerrsquos reconviction outcome after treatment with what it would have been without treatment The latter is of course not observable ndash a treated individual cannot have an untreated outcome ndash and so a proxy must be created
35 It is possible that prisoners (participants and non-participants) may have participated in other intervention programmes accredited (for example another OBP or substance misuse treatment) andor non-accredited (of varying quality) during their SPCR sentence period Analysis of the level of participation on other accredited OBPs by the treatment group and matched control groups is presented later in this section
36 An offender is said to have committed a proven reoffence if the offender receives a conviction (by a caution or guilty verdict) at court for the reoffence The reoffence must have been committed within the one-year follow up period and the conviction must follow either within that one-year follow up or in a further 6 months which is to allow time for the offence to be proven at court
37 Severe offence types include violence against the person (murder attempted murder manslaughter wounding) sexual offences (sexual assault rape sexual activity with a minor or a person with a mental disorder abuse of children through prostitution and pornography trafficking for sexual exploitation) aggravated vehicle taking and death by dangerous drink or drug driving A full list of severe offence types is available in lsquoAppendix G List of most serious (severe) offencesrsquo of Ministry of Justice (2010)
12
Due to the active selection mechanism for ETS treatment (see suitability criteria in section 1) it is likely that prisoners selected for treatment differ on average from untreated prisoners even before treatment commences ETS participants should be characterised by a medium-to-high reconviction risk and a high level of criminogenic needs whereas non-participants should have a profile that is more reflective of the general prison population This is known as selection bias For this reason any difference observed in a simple comparison of the average outcome of the treatment group with that of the untreated group could be explained by factors other than the intervention treatment It is important therefore to remove as much of the selection bias as possible between the treatment group and comparison groups prior to comparison of the average outcomes The Propensity Score Matching (Rosenbaum and Rubin 1983) statistical technique has been developed for this very purpose
A primer on Propensity Score Matching
Whilst only a Randomised Control Trial (RCT)38 can ensure a random distribution of any unobserved sources of potential bias ethical and practical considerations can mean that RCT is not an easy-to-use methodology to evaluate the impact of interventions on reconviction rates
Instead Propensity Score Matching (PSM) has been selected to estimate the causal treatment effect of ETS39 On the Scientific Methods Scale adapted for reconviction studies (Harper and Chitty 2005 National Offender Management Service 2005) PSM rates as a level 4 research design ldquothat controls for bias by using the most robust method of matching individuals on all variables that affect participation in the intervention as well as all variables that affect outcomerdquo40 As differences in the variables influencing the treatment and the outcome are controlled for after the treatment intervention the approach is defined as a retrospective quasi-experimental design
The basic idea of PSM is to select a group of untreated individuals that are statistically lsquosimilarrsquo to the group of treated individuals across the set of relevant observed characteristics measured at the pre-treatment (and pre-allocation) stage41 Once the group is well matched (little or no statistical difference in the means of the matching variables) to the treatment group it is an adequate control group to generate the proxy untreated outcome Differences between the outcomes of the treated and untreated groups can then be attributed to the intervention
38 ldquoAn RCT compares outcomes when the intervention is used to outcomes without the intervention or with an alternative (seen in the control group) In an RCT participants are randomly allocated to an intervention or a control group which differs systematically in the type or amount of the intervention received The groups are otherwise equivalent because all other differences are randomly distributedrdquo (National Offender Management Service 2005 p2)
39 In the lsquoScientific Methods Scale adapted for reconviction studiesrsquo (National Offender Management Service 2005) a five-level lsquostandard of researchrsquo scale (5 representing the highest standard) of methodologies to evaluate the impacts of an intervention on reoffending and other offence-related outcomes propensity score matching rates as a level 4 research design (RCT is the only level 5 method) Level 4 is defined as ldquoComparison group matched to intervention group on theoretically relevant factors eg risk of reconviction (well-matched comparison group)rdquo (National Offender Management Service 2005 p3)
40 National Offender Management Service (2005) p 341 Specifically PSM matches individuals based on their probability (propensity score) of participating in the
intervention programme given their observed characteristics
13
Matching methodology
The matching methodology used to generate the matched control group comprises five components suitability filter pre-selected matching variables matching algorithm the parsimonious PSM model and assessment of the match quality Consultation on the methodology employed was undertaken with analyst and policy colleagues at MoJ and NOMS
Suitability filter of potential control matches
The codification of the suitability criteria defining the prisoner needs and characteristics that determine selection into the programme presents the opportunity to control directly for selection bias Assuming that untreated prisoners satisfying the suitability criteria did not receive treatment due to practical barriers (for example ETS was not provided at the establishment the prisoner was participating on another programme or was movedreleased whilst on waiting list) non-participants could be filtered by the suitability criteria to yield an ETS-suitable pool of untreated potential control matches
Such a filter was successfully implemented though with an unexpected result As the OASys data provided did not include OGRS2 scores the risk requirement was assessed with respect to the OASys score This is not invalid as the guidance notes ldquoIf an offender passes the cut-off on one but not both scales [ie OGRS2 and OASys total weighted score] you can consider them to be suitable to progress to the needs assessment stagerdquo42
To ensure the relevance of the filter a cross-check was carried out by applying the same filter to the treatment group with the expectation of finding a high rate of compliance However this analysis revealed that a substantial proportion (up to 42) of ETS participants failed to satisfy even the basic need and risk requirements for ETS suitability43 This is the first noteworthy finding of this research and has important implications for the evaluation Full results are presented and discussed in the following Results section
The direct implication of this finding is that an explicit suitability criteria filter of the potential control pool would be unnecessarily restrictive seeing as the treatment group itself does not satisfy the criteria It also has an important implication for the potential effectiveness of the programme If the suitability criteria are designed so as to identify the individuals that are most likely to benefit from the intervention then a weak adherence to these suitability criteria would constrain the potential effectiveness that the intervention programme could actually achieve in practice (Andrews and Bonta 2010) This is an important point as a programme
42 HM Prison Service (2007) p543 It is important to note some caveats to this analysis (explained fully in the Results section) The specification
of the risk tool to OGRS2 or OASys was only introduced in August 2007 half-way through the period under analysis (March 2006 to September 2008) A secondary indicator of criminogenic needs the ETS Semi-Structured Interview was also used historically though emphasis was placed on the OASys Section 11 scores in the assessment of need There is also some flexibility allowed in the application of the suitability criteria individuals with an OASys or OGRS2 score within three points below the cut-off may be progressed to ETS and special considerations are made for indeterminate sentence prisoners and sex offenders
14
evaluation result of no statistically significant reduction in reconviction may actually be reflecting poor targeting rather than a poor programme
Pre-selected matching variables
Prior to undertaking the matching and outcome analysis a wide range of factors were identified as being the most important drivers of participation in the intervention and the reconviction outcome These variables have two functions First they form the basis of the full specification of the matching model Second the quality of the control group match is assessed by comparing its mean values with those of the treatment group on each one of these variables In addition to ETS suitability criteria and the standard static risk factors the list includes several dynamic risk factors unlike previous evaluations
The first group of factors identified are those that (should) determine the probability of treatment ndash the ETS suitability criteria level of criminogenic need risk of reconviction and responsivity and readiness criteria (motivation to change behaviour and whether the prisoner has problems with reading writing numeracy learning difficulties psychological problemsdepression or psychiatric problems)
The second group are static reconviction risk factors selected as the variables underpinning the OGRS3 score found to be a more accurate predictor of reconviction than OGRS2 and the Sentence Planning Risk Predictor (Howard et al 2009) Namely the individual static factors include age gender index offence type (explained below) the Copas rate44 sanctioning history (total previous convictions and previous severe convictions and their quadratics) Additional static risk factors from SPCR survey responses have also been included ethnicity (White Black Mixed Asian and Other background) marital status family criminal history
Every offence type has a distinct Home Office code of which there are more than 3000 which are grouped into 20 categories in the standardised OGRS classification After checking the distribution of the ETS participants across these 20 categories most had too few observations to be statistically useful Accordingly the 20 offence categories have been further grouped into six categories that are both meaningful (similar offences) and contain 20 or more treated prisoners45 The final offence type groupings with grouped OGRS categories are Violent (violence and public orderriot offences) Robbery Sexual (sexual offences not against a child sexual offences against a child and solicitingprostitution) Acquisitive (burglary (domestic) burglary (other) theft (non-motor) handling stolen goods fraud and forgery taking and driving away and related offences and theft from vehicles) Drug (drugs import export production or supply and drugs possessionsmall-scale supply) Other (abscondingbail offences other motoring drink driving criminal damage and any other offences)
44 The Copas rate (Copas and Marshall 1998) is a measure that reflects both the intensity and length of the offenderrsquos criminal career calculated as log [ (number of sanction occasions) (10 + years between first and current sanction) ] The higher the Copas rate the more convictions an offender has amassed in a given amount of time and the more likely it is that the offender will reoffend within one year
45 An exception is the lsquoOtherrsquo category the reference category for modelling which has 15 treated participants
15
Box 21 Matching variables pre-selected as being predictive of ETS participation and reconviction risk
Programme suitability criteria Need Sum of OASys Section 11 Thinking and Behaviour scores (OASys) Risk OASys total weighted score (OASys) Motivation to change behaviour (OASys) Problems with readingwritingnumeracy (OASys) Problems with learning difficulties (OASys) Problems with current psychological problemsdepression (OASys) Problems with current psychiatric problems (OASys)
Static risk factors Gender (SPCR) Age (SPCR) Marital status Married (SPCR) Marital status Living with a partner (SPCR) Ethnicity Any Mixed background (SPCR) Ethnicity Any Asian background (SPCR) Ethnicity Any Black background (SPCR) Ethnicity Any Other background (SPCR) Copas rate on release (PNC) Previous convictions (PNC) Previous convictions squared (PNC) Previous severe convictions (PNC) Previous severe convictions squared (PNC) Index offence type Violent (PNC) Index offence type Sexual (PNC) Index offence type Acquisitive (PNC) Index offence type Drug (PNC) Index offence type Robbery (PNC) Family member has been convicted of a non-motoring offence (SPCR) Family member has been in prison (SPCR)
Dynamic risk factors Agree Want to stop offending (SPCR) Disagree Want to stop offending (SPCR) Agree Want to get help to stop offending (SPCR) Disagree Want to get help to stop offending (SPCR) General attitude to offending CRIME-PICS (SPCR) Anticipation of reoffending CRIME-PICS (SPCR) Victim hurt denial CRIME-PICS (SPCR) Evaluation of crime as worthwhile CRIME-PICS (SPCR) Used class A drugs in the four weeks before custody (SPCR) Used class BC drugs in the four weeks before custody (SPCR) Injected illegal drugs in the four weeks before custody (SPCR) Transient accommodation prior to custody (SPCR) Sleeping rough prior to custody (SPCR) Educational (qualifications) attainment (SPCR) Was in paid work in the four weeks before custody (SPCR)
Note Data source is listed in parentheses
16
A range of dynamic risk factors found to be incrementally predictive of general reconviction in addition to static risk factors (Howard 2009) have also been included These factors are motivation to stop offending attitudes to offending drug use accommodation educational attainment and employment status before custody
Many of the factors are categorical and so have been converted to indicator variables (also known as lsquodummy variablesrsquo) For instance ethnicity has been split into five separate yesno variables ndash one for each individual ethnic background The full set of variables is listed in Box 21
Matching algorithm
A variety of propensity score matching methods are available to adjust for pre-treatment observable differences between the treatment group and untreated groups each best suited to particular types of data The algorithm developed to match the control group for this evaluation and the motivation underlying its choice are briefly explained here The propensity score matching analysis was undertaken in the Stata statistical software programme using the psmatch2 module (Leuven and Sianesi 2003)
First a logistic regression was used to predict the probability of treatment (the propensity score) for all treated and untreated prisoners based on their observed characteristics The resultant propensity scores summarise each prisonerrsquos characteristics on all matching variables in one measure that is used as the basis for matching
Since the sample consists of comparatively few treated prisoners in relation to many untreated ones radius matching (Dehejia and Wahba 2002) was chosen as the matching algorithm This technique uses the maximum amount of data whilst the imposition of a tolerance threshold avoids the risk of bad matches All untreated prisoners whose propensity score falls within a defined range of tolerance (radius calliper) of a treated prisonerrsquos score are matched to that prisoner A radius calliper of 005 of a standard deviation of the logit of the propensity score has been used46 The benefit of radius matching is lower propensity score variances than would result from one-to-one nearest-neighbour matching As a further step to ensure comparability prisoners with propensity scores outside the range of values where both treated and untreated observations are found were dropped a requirement of the technique47
46 The appropriate calliper size is not clearly prescribed by the empirical literature (Smith and Todd 2005) The inventors of propensity score matching Rosenbaum and Rubin (1983) recommend a calliper of a quarter of a standard deviation of the logit of the propensity score as appropriate in general This would be equivalent to 0236 in this case which was tried and rejected due to returning a weak match quality The radius calliper size was iteratively reduced until the point (005) that a further reduction would drop treated observations Sensitivity analysis was carried out on radius calliper size (00001 to 025) which found that the results were not highly sensitive to calliper size
47 Technically this is referred to as imposing common support
17
With a choice-based sample such as this participants are likely to be over-sampled relative to their frequency in the eligible prisoner population (Caliendo and Kopeinig 2005) To control for this over-sampling matching was undertaken on the odds-ratio of the propensity scores (Heckman and Smith 1995)48
The outcome of this methodology was that each ETS participant was matched with a synthetic control observation composed of the average of all non-participants sufficiently similar (propensity score within the radius limit) to the participant
Parsimonious PSM model
Due to the limited size of the sample there was a focus on parsimony (simplification without any loss of power) in development of the model Dropping insignificant variables from the logistic regression gains degrees of freedom (fewer parameters to be estimated) and observations (due to missing values on some variables) without losing explanatory power The final model was reduced to a smaller set of 16 variables listed in Box 2249 To check that this process did not introduce a bias the correlation of the propensity scores of the reduced model and the full model was checked and found to be greater than 091
Box 22 Parsimonious Propensity Score Matching model matching variables
Programme suitability criteria Need Sum of OASys Section 11 Thinking and Behaviour scores (OASys) Risk OASys total weighted score (OASys) Motivation to change behaviour (OASys) Problems with readingwritingnumeracy (OASys) Problems with current psychiatric problems (OASys)
Static risk factors Gender (SPCR) Age (SPCR) Index offence type Violent (PNC) Index offence type Sexual (PNC) Index offence type Acquisitive (PNC) Index offence type Drug (PNC) Index offence type Robbery (PNC)
Dynamic risk factors Agree Want to get help to stop offending (SPCR) Victim hurt denial CRIME-PICS (SPCR) Used class BC drugs in the four weeks before custody (SPCR) Sleeping rough prior to custody (SPCR)
Note Data source is listed in parentheses
48 Caliendo and Kopeinig (2005) note that weights are required to consistently estimate the probability of treatment when sampling is choice based However as an odds-ratio estimated using incorrect weights will be a scalar multiple of the true odds-ratio (a monotonic transformation of the propensity score) matching may proceed on the odds-ratio even when sampling weights are unknown (Heckman and Smith 1995)
49 The full model (including all 42 pre-selected variables) was run successively with the least significant variable dropped each time using the stepwise function with a confidence limit for retention equal to 01
18
Assessment of control match quality
The robustness of the calculated treatment effect depends on the quality of the match achieved The degree of lsquosimilarityrsquo between the treatment and the control group was tested using a range of statistical techniques (namely standardised bias reduction and t-tests of equality of means) Please refer to the Technical Annex for the detailed results of these tests
In summary equality of means testing confirmed no statistically significant difference between the treatment and matched control group across all 42 characteristics pre-selected as being predictive of ETS participation and reconviction risk The control group is therefore well matched on the pre-selected matching characteristics with a similar expected reconviction rate as the treatment group allowing robust estimation of the treatment effect
Whilst every effort has been made to remove the selection bias it is possible that an unmeasured bias may still remain uncontrolled Further checks on average sentence length and participation on other accredited OBP interventions (using the Offending Behaviour Programme Interventions Database) were carried out which revealed some differences between the treatment and control groups It was found that the average sentence length of the treatment group (975 days) was longer than that for the control group (727 days) It was also found that 6 of the treatment group and 2 of the control group had been on another accredited OBP during the SPCR sentence though both proportions are small
19
3 Results
The results of this evaluation show that ETS was effective in bringing about a statistically significant reduction in both the reconviction rate and frequency of reoffending in the year following release from custody for 257 prison-based participants on ETS between 2006 and 2008 Almost identical results were found for completers (when drop-outs were excluded) though the significance of the reduction in the one-year reconviction rate was lost due the reduction in the size of the sample
A secondary finding of the research was a low adherence to the suitability targeting criteria among those prisoners that actually received the programme over the period This suggests that the programme was not always administered to the most suitable group of prisoners which may have limited the effectiveness of the programme in reducing reoffending
The research findings are presented and summarised in this section The conclusions and policy-relevant implications of the results are discussed in the Implications section More detail on the results is contained in the Technical Annex
Effectiveness of ETS in reducing reoffendingThe impact of the programme is identified as the average causal effect of participation on the ETS programme (the treatment) on reconviction outcomes As the control group was created using a methodologically robust propensity score matching model and established as valid by tests on the quality of the match it represents a good proxy for the counterfactual untreated outcome of the treatment group50 The observed difference in the average conviction rates between the treatment and control groups may therefore be considered the causal effect of the ETS intervention known as the average treatment effect on the treated (ATT)
All programme participants
The reconviction rate and the frequency of reoffending of all ETS participants (including non-completers) was found to be significantly lower than the matched control group in the year following release from custody No statistically significant impact was found on the severe offence reconviction rate
The average reconviction outcomes of the treated and untreated groups and the difference between them (ATT with t-stat) are presented in Table 31 The results show that the proportion of programme participants that were reconvicted within one year (272) was six percentage points below that observed in the control group (335) and that this difference was statistically significant A statistically significant difference was also found in terms of frequency of reoffending as participants (607 offences) were reconvicted of 60 fewer recordable offences within one year per 100 released prisoners than the control group (1208 offences)
50 Testing revealed no statistical difference in the mean values of the two groups across all 42 variables pre-selected as being predictive of ETS participation and reconviction risk
20
These are the noteworthy results of this analysis as they show that ETS was successful in significantly reducing both the reconviction rate and frequency of reoffending of participants After contradictory evidence and debate the results seem to support Friendship et alsrsquo (2002) positive results though the magnitude of the effect is smaller Whilst the severe offences reconviction rate was lower in the treatment group the difference was not significant This is not surprising given the programme is not designed to target severe offending and the rarity of severe offences
Table 31 Impact of ETS on reconviction outcomes of the SPCR sample
SampleReconviction rate
(one-year)
Reoffences per 100 released prisoners
(one-year)
Severe offences reconviction rate
(one-year)Average outcomes
Treatment group (n=257) 272 607 08Matched control group 335 1208 09
Treatment effect (ATT) -62a -601b -01(t-stat) -204 -547 -013Note Average treatment effect on the treated (ATT) is the difference between the mean outcome of the
treatment group and the matched control groupa Statistically significant at the 005 levelb Statistically significant at the lt0001 level
Completers only
The evaluation has followed the lsquointention-to-treatrsquo approach in general (consistent with Colledge et al 1999) However not all participants completed the programme ndash 8 of the treated final sample did not complete the course As in previous evaluations non-completers have been removed from the analysis to test any sensitivity of the treatment effect to programme completion
21
The results are summarised in Table 32 showing an almost identical though not statistically significant reduction in the rate of reconviction for completers when drop-outs were excluded The loss in significance was most likely due to the reduction in the size of the sample The statistically significant reduction in the frequency of reoffending was retained with an almost identical effect size No significant impact was again found for the severe offences reconviction rate
Table 32 Impact of ETS on reconviction outcomes of the SPCR sample completers only
SampleReconviction rate (one-
year)
Reoffences per 100 released prisoners
(one-year)
Severe offences reconviction rate
(one-year)Average outcomesTreatment group (n=237) 270 599 08Matched control group 335 1208 09Treatment effect (ATT) -65 -609a 00(t-stat) -156 -321 -001Note Average treatment effect on the treated (ATT) is the difference between the mean outcome of the
treatment group and the matched control groupa Statistically significant at the 001 level
Completers of intervention programmes are often found to have a stronger effect than non-completers This may be due to a self-selection effect whereby completers may be more motivated or have fewer needs or have a lower risk of reoffending Therefore effectiveness of the programme should not be evaluated against completers alone whose outcomes may have been better even without the intervention Rather the true effect of the intervention as it is used in practice should be evaluated by considering all participants both completers and non-completers (Colledge et al 1999 National Offender Management Service 2005) Accordingly more weight should be placed on the findings for all participants
Assessment of suitability targeting
The HM Prison Service guidance to assess suitability for ETS and other OBPs notes
ldquoOne of the principles of effective interventions is appropriate targeting An offender is more likely to benefit from participation in an offending behaviour programme if heshe demonstrates levels of risk and need that are appropriate for the particular interventionrdquo51
To facilitate appropriate targeting HM Prison Service designed a set of risk need and responsivity suitability criteria to identify those prisoners that were most suitable for the programme These criteria were set out in the Context section Strict adherence to these criteria should ensure that ETS is appropriate and relevant for all participants
51 HM Prison Service (2007) p3
Figure 31 Need and risk score distributions for non-participant and ETS participant groups with suitability thresholds
Need Sum of OASys Section 11 Thinking and Behaviour scores (OASys)
Risk OASys total weighted score (OASys)
0
5
10
15
4 7 140
5
10
15
4 7 140 0
Per
cen
t
Per
cen
t
0
5
10
15
50 100 1500
Per
cen
t
0
5
10
15
50 100 1500
Per
cen
t
Non-participant
Non-participant
ETS participant
ETS participant
22
Need and risk requirements
The need and risk52 profiles of the participant and non-participant groups53 were compared The comparison is presented graphically in Figure 31 with needrisk ETS programme suitability thresholds marked with vertical red lines (observations to the right of the line rate as lsquosuitablersquo for ETS) In the case of need the dual thresholds of 7 or 4 (with at least one individual score of 2 indicating significant problems) are marked A single vertical red line for 56 and above is marked as the risk threshold
With regard to both need and risk the participant and non-participant distributions follow a broadly similar pattern The majority of the non-participant group had a needrisk profile that would have made them suitable for ETS This is good news for matching purposes as it means that similar prisoners at the pre-treatment stage could have been treated or remained untreated More importantly a lot of prisoners in the participant group fall to the left of the red vertical line in both charts ndash and so rated as lsquonot strictly suitablersquo for ETS
52 As the OASys data do not include OGRS2 it has only been possible to define suitability with respect to the OASys total weighted score This is not necessarily invalid as the guidance notes ldquoIf an offender passes the cut-off on one but not both scales [ie OGRS2 and OASys total weighted score] you can consider them to be suitable to progress to the needs assessment stagerdquo HM Prison Service (2007) p5
53 This analysis is based on the full sample of 3512 (316 participants and 3196 non-participants) and not the treatment and matched control groups
23
Further investigation of the need and risk (OASys total weighted score) scores revealed that only 58 of the participant group were suitable for ETS (met both need and risk requirements simultaneously) while 49 of the non-participant group would have been suitable (Table 33)
Table 33 ETS suitability criteria fulfilment non-participant and ETS participant groups
SuitabilityNon-participants ETS participants
N N Not strictly suitable for ETS 1629 510 134 424Strictly suitable for ETS 1567 490 182 576Total 3196 1000 316 1000NoteSuitability is defined with reference to risk (an OASys score 56 or above) and need (a total score of 7
or above and a total score of 4 or above with at least one individual score of 2 (indicating significant problems))
It is important to note some caveats to this analysis The suitability criteria for ETS have been reviewed and changed over time The ETS start dates of participants in the SPCR sample stretch from March 2006 to September 2008 whilst the specification of the risk tool as OGRS2 or OASys was only introduced in August 2007 (the Sentencing Planning Risk Predictor was used previously) Similarly this period covers a time when both a local semi-structured interview and the OASys assessment were sources of need information for programme staff As the programme did not itself change substantially during this period later indicators of suitability for the intervention are retrospectively relevant from a targeting perspective54 though the retrospective application of the later indicators provides no reflection of the accuracy in the application of the targeting criteria during the earlier period
There is also some flexibility allowed in the application of the suitability criteria individuals with an OASys or OGRS2 score within three points below the cut-off may be progressed to ETS and special considerations are made for indeterminate sentence prisoners and sex offenders The original indicator of criminogenic needs the ETS Semi-Structured Interview has gradually been replaced by OASys Section 11 scores as confirmed in later guidance (National Offender Management Service 2009)55
54 Assuming that amendments to the suitability identification tools over time represent improvements in targeting later indicators applied retrospectively are likely to provide a better indicator of suitability than older indicators Accordingly this analysis provides no reflection on the selection process of treatment managers at the time but rather a pure view of suitability of treated participants
55 later guidance also specified definition of risk groups suitable for ETS with reference to OGRS3 (score 50 or above)
24
Readiness and responsivity criteria
A similar comparative analysis was also carried out for the readiness and responsivity criteria The HM Prison Service (2007) guidance lists assessment items in the lsquoResponsivity Assessmentrsquo and lsquoReadiness Assessmentrsquo sections including intellectual ability literacy dyslexia mental and physical health psychopathic traits motivation to change behaviour disability However the guidance does not specify the data variables or the thresholds to be used To investigate these readiness and responsivity criteria the lsquoexclusion criteriarsquo for general offending programmes from the OASys Manual56 were used
Again the profiles of the participant and non-participant groups57 were compared with a similar pattern emerging Figure 32 plots the distributions side-by-side with the readiness and responsivity thresholds marked by red vertical lines (this time profiles to the right of the line are not strictly suited to ETS) As with the need and risk profiles the two distributions are unexpectedly similar with a number of the participant group recorded as lsquonot at allrsquo motivated or having lsquosignificant problemsrsquo More specifically of the participant group
109 were scored as lsquonot at allrsquo motivated to change their behaviour
74 had lsquosignificant problemsrsquo with readingwritingnumeracy
61 had lsquosignificant problemsrsquo with learning difficulties
103 had lsquosignificant problemsrsquo with current psychological problemsdepression and
58 had lsquosignificant problemsrsquo with current psychiatric problems
56 OASys development team (2001) p16757 This analysis is based on the full sample of 3512 (316 participants and 3196 non-participants) and not the
treatment and matched control groups
Figure 32 Readiness and responsivity score distributions for non-participant and ETS participant groups with suitability thresholds
0
20
40
60
Verymotivated
Quitemotivated
Not at all0
20
40
60
Verymotivated
Quitemotivated
Not at all
Per c
ent
Per c
ent
Non-participant ETS participant
Motivation (OASys)
0
50
100
No problems Someproblems
Significantproblems
Per c
ent
Non-participant
Problems with readingwritingnumeracy (OASys)
0No problems Some
problemsSignificantproblems
Per c
ent
ETS participant
020
6080
No problems Someproblems
Significantproblems
Per c
ent
Non-participant
Problems with learning difficulties (OASys)
0No problems Some
problemsSignificantproblems
Per c
ent
ETS participant
0
20
40
60
No problems Someproblems
Significantproblems
Per c
ent
Non-participant
Problems with current psychological probelmsdepression (OASys)
0
20
40
60
No problems Someproblems
Significantproblems
Per c
ent
ETS participant
4020
6080
40
50
100
0
50
100
No problems Someproblems
Significantproblems
Per c
ent
Non-participant
Problems with current psychological probelms (OASys)
0
50
100
No problems Someproblems
Significantproblems
Per c
ent
ETS participant
25
26
Analysis of treatment effect by suitability
To investigate the importance of adherence to the need and risk principles in participant targeting the reconviction outcomes of the treatment group were also analysed according to participant suitability As before suitability is defined with reference to risk (an OASys score 56 or above) and need (a total score of 7 or above and a total score of 4 or above with at least one individual score of 2 (indicating significant problems)) As there is some flexibility in the application of the criteria this is termed lsquostrict suitabilityrsquo
Of the treatment group 164 (64) were strictly suitable for ETS whereas 1404 (56) of the control group were strictly suitable The remainder of each group were not strictly suitable
The results of the analysis (Table 34) show that the one-year reconviction rate for strictly suitable treated offenders (172) was lower than that for not strictly suitable ones (329) Similarly the frequency of reoffending of strictly suitable offenders (398 reoffences) was also lower than that of the not strictly suitable offenders (726 reoffences)
Table 34 Impact of ETS on reconviction outcomes of the SPCR sample lsquonot strictly suitablersquo and lsquostrictly suitablersquo participants only
SampleReconviction rate
(one-year)
Reoffences per 100 released prisoners
(one-year)
Severe offences reconviction rate
(one-year)Not strictly suitable (n=93) 329 726 12Strictly suitable (n=164) 172 398 -
Caveats and limitations of the researchIt is important to note that the number of ETS-treated prisoners provided by SPCR (257) is a limited sample falling in the lower range of previous evaluation samples (from 114 to 2195 participants) as a result of a low intervention rate and missing data filters Results based on limited samples may not be reliable indicators of the wider population and in some cases the sample sizes may be too small to detect differences which may actually exist58 Tests of statistical significance are carried out on the results of this evaluation for this reason The low intervention rate means that there is a large pool (2514) from which to form a well-balanced matched control group It should also be noted that all SPCR data are self-reported
Whilst every effort has been made to remove the selection bias it is possible that an unmeasured bias may still remain uncontrolled Further checks revealed some differences between the treatment and control groups It was found that the average sentence length of the treatment group (975 days) was longer than that for the control group (727 days)
58 This caveat is more relevant where no effect is detected ndash in which case the correct conclusion may be that the sample was insufficient to detect an effect rather than that the intervention had no effect For a discussion of sample size detection power and reliability of reconviction rates please see Harper and Chitty (2004) p8
27
The possibility of multiple intervention participation has not been controlled for as the sample size did not permit such analysis Examination revealed that 6 of the treatment group and 2 of the control group had been on another accredited OBP during the SPCR sentence though both proportions are small It is also possible that prisoners may have participated on non-accredited OBPs or a substance misuse treatment during their SPCR sentence period which may have contributed to the observed treatment effect If the rate of participation in other programmes was higher in the ETS treated group the estimated treatment effect of ETS would represent a pooled effect of all treatments received and so may be overstated If the rate of participation in other programmes was higher in the ETS control group the estimated treatment effect of ETS may be understated
This evaluation has been limited to using one-year conviction rates as two-year reconviction outcome data will only become available in 12 monthsrsquo time Thus it is not possible at this time to conclude on the duration of the impact of ETS ndash that is to say whether the observed one-year effect endures two years on from release or whether it dissipates (as found by Cann et al 2003) It is planned to conduct a follow-up study of reconviction at the two-year post-release stage (please see the Further research section)
28
4 Implications
This report has evaluated the effectiveness of the prison-based ETS programme by linking participation to reconviction outcomes The evaluation results show that ETS was successful in significantly reducing both the reconviction rate and frequency of general reoffending of participants The most important implications of these results are outlined below
This research has added some clarity to the discordant evidence base on the effectiveness of ETS by improving on key methodological limitations of previous evaluation studies This provides a more solid evidence base of support on which to build intervention-based policy
The most important message for policy makers is that ETS the most frequently delivered offending behaviour programme over the past decade did work to significantly reduce reoffending in the short term (one year) at least This result should assist policy makers to prioritise and focus operational resources towards the most productive intervention efforts Though ETS has since been replaced by the Thinking Skills Programme (TSP) the results of this evaluation demonstrate that cognitive-behavioural OBPs can work to significantly reduce reoffending for offenders released from prison The findings are likely to be particularly relevant for TSP which represents a refresh and update of ETS in line with advances in theory and practice However these specific findings cannot be generalised to other cognitive-behavioural intervention programmes Each programme has its own distinct objectives delivery methods and targeted characteristics and so would require a discrete evaluation
For practitioners although the findings on reduced reconviction rates are encouraging and reflect a job well done there are also lessons to be learned A low adherence to the risk need and responsivity suitability criteria was found among those prisoners that actually received the programme between 2006 and 2008 This suggests that the programme was not always administered to the most suitable prisoners Given that research supports the importance of risk need and responsivity targeting for effective treatment (Hollin 1995 Taxman and Thanner 2006 Palmer et al 2009 Gendreau et al 2009 Andrews and Bonta 2010) and the finding of lower reconviction rates for strictly suitable prisoners this may have limited the effectiveness of the programme in reducing reoffending The fact that a significant reduction in reconviction was found in spite of this finding suggests that a stricter application of the targeting criteria might further enhance the effectiveness of the programme National Offender Management Service practitioners report that the accuracy of targeting has improved over time meaning that a similar evaluation of ETS in a later period (post-2008) or TSP might find an even more significant effect
29
Future researchers may be able to draw on the methodology developed for this research as a methodological blueprint for further evaluations The findings of this research could be complemented and enhanced by addressing some of the outstanding evidence gaps framed by a set of research questions and proposed research designs set out in the Further research section
30
5 Further research
Whilst this evaluation has added some clarity to the evidence base on the effectiveness of general cognitive-behavioural programmes evidence gaps remain These gaps are defined by the research questions listed below with suggested research designs that could provide robust answers to complement and enhance the findings in this paper
Duration of the reduction in reoffending effect Does ETS have a lasting impact or will the observed one-year effect have dissipated after two years as found by Cann et al (2003) It is planned to conduct a follow up study of the treated and matched control individuals of this evaluation two years after their release applying the same methodology to investigate the duration of the ETS impact in one yearrsquos time
Cost-effectiveness of the programme Is the cost of ETS provision justified by the observed reduction in reoffending The reduction in reoffences estimated in this evaluation could be used as the basis for a cost-benefit analysis of the ETS programme Linking the estimated reduction in reoffending to estimates of the social cost of criminal offences the avoided social costs of crime (the benefit) could be compared to data on the cost of ETS provision (estimated to be in the region of pound2000 per prisoner)59
Generalisability of the findings Would the observed effect be verified or even more significant in a larger sample By repeating the evaluation methodology but replacing SPCR variables with OASys data variables where possible the full population of prisoners undertaking ETS could be evaluated The downside to this approach is the compromised choice of data for dynamic risk factors Other benefits would be the ability to employ more matching variables and being able to evaluate some of the smaller accredited programmes This research could also be used as a methodological blueprint to evaluate substance misuse intervention programmes
What works for whom What are the characteristics of the prisoners that benefit most from ETS and other OBPs The difference in reconviction outcome for each treated prisoner compared with the matched control could be regressed on a range of treated prisonersrsquo characteristics to identify which kinds of offenders under which circumstances most benefit from undertaking ETS
The effectiveness of TSP Does ETSrsquos replacement the Thinking Skills Programme (TSP) have a lesser similar or greater impact on reconviction A similar evaluation methodology could be used to evaluate the effectiveness of TSP in reducing reconviction outcomes though this would not be possible for a couple of years as TSP was only introduced in 2009
59 Social Exclusion Unit (2002) p 81
31
Database of research findings What does the evidence base tell us about the effectiveness of ETS Policy makers are often influenced by the latest study to be published rather than the synthesised message of the collective body of evaluation research The formation and maintenance of a database of outcome studies could be used for systematic reviews and meta-analytic analysis to produce a comprehensive review of ETS efficacy to inform and guide policy makers and practitioners (for example see Tong and Farrington 2006)
In the longer term samples of the other cohort studies being conducted by MoJ ndash the probation sample of the Offender Management Community Cohort Study (OMCCS) and the juvenile offenders sample of the Juvenile Cohort Study (JCS) ndash could be similarly linked to the same management information databases (for example OASys) as linked to SPCR in this evaluation When combined with OASys assessment data and viewed as a collective database this would be the richest known single evidence base in existence on the static and dynamic factors involved in offending behaviour
32
6 Additional resources
Readers interested in researching further the issues and topics probed in this paper further may want to consult the following publications websites and other useful sources of information
HM Prison Service Offender Behaviour Programmes (OBPs) httpwwwhmprisonservicegovukadviceandsupportbeforeafterreleaseoffenderbehaviourprogrammes
Ministry of Justice Research httpwwwjusticegovukpublications
National Offender Management Service httpwwwjusticegovukaboutnomshtm
Correctional Services Accreditation Panel httpwwwjusticegovukaboutcorrectional-services-accreditationhtm
National Reducing Reoffending Delivery plan (National Offender Management Service (NOMS) website) httpnomsjusticegovuk
Social Exclusion Unit (Cabinet Office) httpwwwcabinetofficegovuksocial_exclusion_task_forceaspx
Office for National Statistics (ONS) httpwwwstatisticsgovuk
33
7 References
Andrews D A and Bonta J (2010) The psychology of criminal conduct (5th ed) New Providence NJ LexisNexis Matthew Bender
Blackburn R (1972) lsquoDimensions of hostility and aggression in abnormal offendersrsquo Journal
of Consulting and Clinical Psychology 38 pp 20ndash26
Caliendo M and Kopeinig S (2005) lsquoSome Practical Guidance for the Implementation of Propensity Score Matchingrsquo IZA Discussion Papers Series Discussion Paper No 1588 Institute for the Study of Labor (IZA)
Cann J Falshaw L Nugent F and Friendship C (2003) Understanding What Works
cognitive accredited skills programmes for adult men and young offenders Research Findings 226 London Home Office
Cann J (2006) Cognitive skills programmes impact on reducing reconviction among a
sample of female prisoners Home Office Research Study 276 London Home Office
Clarke A Simmonds R and Wydall S (2004) Delivering cognitive skills programmes in
prison a qualitative study Home Office Research Study 242 London Home Office
Clarke D A (2000) Theory Manual for Enhanced Thinking Skills Prepared for the Joint Prison Accreditation Panel London Home Office
Colledge M Collier P and Brand S (1999) Crime reduction programme and constructive
regimes in prison Programmes for offenders Guidance for evaluators Crime reduction programme ndash guidance note 2 Research Development and Statistics Directorate London Home Office
Copas J and Marshall P (1998) lsquoThe offender group reoffending scale A statistical reoffending score for use by probation officersrsquo Applied Statistics 47(1) 159ndash171
Dehejia RH and Wahba S (2002) lsquoPropensity Score-Matching Methods for Nonexperimental Causal Studiesrsquo Review of Economics and Statistics February 2002 Vol 84 No 1 pp 151ndash161
Eysenck S B and McGurk B J (1980) lsquoImpulsiveness and venturesomeness in a detention centre populationrsquo Psychological Reports 47 pp 1299ndash1306
34
Falshaw L Friendship C Travers R and Nugent F (2003) Searching for what works An
evaluation of cognitive skills programmes Home Office Research Study 206 London Home Office
Falshaw L Friendship C Blud L Travers R and Nugent F (2004) lsquoSearching for what works HM Prison Service accredited cognitive skills coursesrsquo British Journal of Forensic
Practice 6 (2) pp 3ndash13
Friendship C Blud L Erikson M and Travers R (2002) An evaluation of cognitive
behavioural treatment for prisoners Home Office Research Study 161 London Home Office
Frude N Honess T and Maguire M (1994) CRIME-PICS II Manual Cardiff Michael and Associates
Gendreau P Smith P and Theacuteriault YL (2009) lsquoChaos theory and correctional treatment Common sense correctional quackery and the law of fartcatchersrsquo Journal of Contemporary
Criminal Justice 25 384ndash396
Harper G and Chitty C (eds) (2004) The impact of corrections on re-offending A review of
lsquoWhat Worksrsquo (3rd ed) Home Office Research Study No 291 London Home Office
Heckman J and Smith J (1995) rsquoAssessing the Case for Social Experimentsrsquo Journal of
Economic Perspectives 9 85ndash110
HM Prison Service (2007) Assessing Suitability for Offending Behaviour Programmes Risk
Need amp Responsivity Guidance for Treatment Managers Offending Behaviour Programmes Unit HM Prison Service
Home Office (2006) A Five Year Strategy for Protecting the Public and Reducing Re-
offending London The Stationary Office
Hollin C R (1995) lsquoThe meaning and implications of ldquoprogramme integrityrdquorsquo In J McGuire (Ed) What works Reducing reoffending Guidelines from Research and Practice (pp 195ndash208) Chichester England John Wiley and Sons
Howard P (2009) Improving prediction of re-offending using the Offender Assessment
System Research Summary 209 London Ministry of Justice Available at httpwwwjusticegovukpublicationsdocsoasys-research-summary-02-09pdf
Howard P Francis B Soothill K and Humphreys L (2009) OGRS 3 the revised Offender
Group Reconviction Scale Research Summary 709 London Ministry of Justice
35
Leuven E and Sianesi B (2003) psmatch2 Stata module to perform full Mahalanobis and
propensity score matching common support graphing and covariate imbalance testing httpideasrepecorgcbocbocodes432001html version 315 2 May 2009
Mak A S (1991) lsquoPsychosocial control characteristics of delinquents and nondelinquentsrsquo Criminal Justice and Behaviour 18 (3) pp 297ndash303
McDougall C Clarbour J Perry A and Bowles R (2009) Evaluation of HM Prison Service
Enhanced Thinking Skills Programme Report on the implementation of a randomised
controlled trial London Ministry of Justice
McDougall C Clarbour J Perry A and Bowles R (2009) Evaluation of HM Prison Service
Enhanced Thinking Skills Programme Report on the outcomes of a randomised controlled
trial London Ministry of Justice
Ministry of Justice (2009) The Correctional Services Accreditation Panel Report 2008-
2009 Available at httpwwwjusticegovukpublicationsdocscorrectional-services-report-20080-09pdf
Ministry of Justice (2010) Reoffending of adults results from the 2008 cohort ndash England and
Wales Ministry of Justice Statistics bulletin London Ministry of Justice Available at httpwwwjusticegovukpublicationsdocsreoffending-adults-2008-cohortpdf
National Offender Management Service (2005) Understanding research methods and
findings lsquoWhat Worksrsquo Briefing 305 Available at httprdshomeofficegovukrdspdfs05wwbn3pdf
National Offender Management Service (2009) Suitability for Accredited Interventions Risk
Need amp Responsivity Targeting Criteria for Offender Managers and Treatment Managers
Interventions and Substance Misuse Group Directorate of Commissioning and Operational Policy National Offender Management Service May 2009
OASys Data Evaluation and Analysis Team O-DEAT (2010) OASys caveats notes and
limitations ndash layered OASys (May 10)
OASys development team (2001) Offender Assessment System OASys User Manual OASys Manual V2 Crown Copyright 2002
Palmer EJ McGuire J Hatcher RM Hounsome JC Bilby CAL and Hollin CR (2009) lsquoAllocation to offending behavior programs in the English and Welsh probation servicersquo Criminal Justice and Behavior 36 909ndash922
36
Rosenbaum P R and Rubin D B (1983) lsquoThe Central Role of the Propensity Score in Observational Studies for Causal Effectsrsquo Biometrika 70 41ndash55
Smith J and Todd P (2005) rsquoDoes matching overcome LaLondersquos critique of nonexperimental estimatorsrsquo Journal of Econometrics Elsevier vol 125(1-2) pages 305ndash353
Social Exclusion Unit (2002) Reducing re-offending by ex-prisoners Available from httpwwwcabinetofficegovukmediacabinetofficesocial_exclusion_task_forceassetspublications_1997_to_2006reducing_reportpdf
Stewart D (2008) The problems and needs of newly sentenced prisoners results from a
national survey Ministry of Justice Research Series 1608 Published online at httpwwwjusticegovukpublicationsresearch2008htm
Taxman FS and Thanner M (2006) lsquoRisk need and responsivity (RNR) It all dependsrsquo Crime and Delinquency 52 28ndash51
Tong LSJ and Farrington DP (2006) lsquoHow effective is the ldquoReasoning and Rehabilitationrdquo programme in reducing reoffending A meta-analysis of evaluations in four countriesrsquo Psychology Crime and Law 12 3ndash24
37
Appendix 1 Technical annex
Full set of matching variables (covariates)Programme suitability criteriaoasys_need Need Sum of OASys Section 11 Thinking and Behaviour scores
(OASys)oasys_score Risk OASys total weighted score (OASys)oasys_motiv Motivation to change behaviour (OASys)oasys_litnum Problems with readingwritingnumeracy (OASys)oasys_lrndiff Problems with learning difficulties (OASys)oasys_psychgl Problems with current psychological problemsdepression (OASys)oasys_psychtr Problems with current psychiatric problems (OASys)
Static risk factorsspcr_genderf Gender Female (SPCR)spcr_age Age (SPCR)spcr_marst_mar Marital status Married (SPCR)spcr_marst_lvp Marital status Living with a partner (SPCR)spcr_ethnic_mix Ethnicity Any Mixed background (SPCR)spcr_ethnic_as Ethnicity Any Asian background (SPCR)spcr_ethnic_bl Ethnicity Any Black background (SPCR)spcr_ethnic_oth Ethnicity Any Other background (SPCR)pnc_copas Copas rate on release (PNC)pnc_ttlprevconv Previous convictions (PNC)pnc_ttlprevconv2 Previous convictions squared (PNC)pnc_ttlprevconvsev Previous severe convictions (PNC)pnc_ttlprevconvsev2 Previous severe convictions squared (PNC)pnc_index_vio Index offence type Violent (PNC)pnc_index_sxl Index offence type Sexual (PNC)pnc_index_acq Index offence type Acquisitive (PNC)pnc_index_drg Index offence type Drug (PNC)pnc_index_rob Index offence type Robbery (PNC)spcr_famconv Family member has been convicted of a non-motoring offence
(SPCR)spcr_fampris Family member has been in prison (SPCR)
Dynamic risk factorsspcr_motivstoffy Agree Want to stop offending (SPCR)spcr_motivstoffn Disagree Want to stop offending (SPCR)spcr_motivhlpstoffy Agree Want to get help to stop offending (SPCR)spcr_motivhlpstoffn Disagree Want to get help to stop offending (SPCR)spcr_attg General attitude to offending CRIME-PICS (SPCR)spcr_atta Anticipation of reoffending CRIME-PICS (SPCR)spcr_attv Victim hurt denial CRIME-PICS (SPCR)spcr_atte Evaluation of crime as worthwhile CRIME-PICS (SPCR)spcr_drug4wka Used class A drugs in the four weeks before custody (SPCR)spcr_drug4wkbc Used class BC drugs in the four weeks before custody (SPCR)spcr_drug4wkinj Injected illegal drugs in the four weeks before custody (SPCR)spcr_accomtrans Transient accommodation prior to custody (SPCR)spcr_accomrough Sleeping rough prior to custody (SPCR)spcr_edqual Educational (qualifications) attainment (SPCR)spcr_job4wk Was in paid work in the four weeks before custody (SPCR)
38
Logistic regression model
Table A1 Logistic regression model of prisoner characteristics influencing probability of treatment (ETS) and reconviction outcomes
Coefficient Standard error P-valueETS suitabilityNeed (thinking and behaviour) 0082 0027 0002Risk (OASys score) 0005 0003 0069Motivation to change behaviour (OASys) 0323 0122 0008Problems with readingwritingnumeracy -0303 0116 0009Problems with current psychiatric problems 0335 0131 0011
GenderMale Reference
categoryFemale 0736 0177 0000
Age -0030 0009 0000
Index offence typeOther Reference
categoryViolent 1223 0296 0000Sexual 2094 0389 0000Acquisitive 0243 0313 0438Drug 1192 0309 0000Robbery 1552 0329 0000
Motivation to stop offendingDisagreed with ldquoI want to get help to stop offendingrdquo all other responses
Reference category
Agreed with ldquoI want to get help to stop offendingrdquo
0315 0091 0001
Offending-related attitudesVictim hurt denial 0078 0026 0003
Drug useUsed Class BC drugs in the 4 weeks before custody
-0195 0150 0193
AccommodationStable accommodation prior to custody Reference
categoryTemporary accommodation prior to custody Reference
categorySleeping rough prior to custody -0709 0409 0083
Constant -4933 0554 0000Notes Number of observations = 2771 (257 treated 2514 untreated) Pseudo R2 = 00958 LR
chi2(16)=16397 probgtchi2 00000
39
Calculation of the average treatment effect on the treated (ATT)
Outcome measures
pnc_reconvind Indicator of reconviction within one yearpnc_reofffreq Frequency of proven reoffending within one yearpnc_reconvindsev Indicator of severe offence reconviction within one year
Table A2 Average treatment effect on the treated (ATT)
Variable Sample Treated Controls(Difference)
ATTa
Standard error t-stat
pnc_reconvind Unmatched 0272 0370 (-0098) 0031 -311Matched ATT 0272 0335 -0062 0031 -204
pnc_reofffreq Unmatched 0607 1422 (-0815) 0182 -447Matched ATT 0607 1208 -0601 0110 -547
pnc_reconvindsev Unmatched 0008 0007 (0001) 0006 011Matched ATT 0008 0009 -0001 0006 -013
a ATT is the difference between the mean outcome of the treatment group and the matched control group
40
Tests of covariate balancing
Table A3 Means standardised bias reduction and t-tests for equality of means in the treatment and control groups before and after matching
Variable SampleMean
bias bias
reductiont-test
Treatment Control t pgttoasys_need Unmatched 7381 6703 203 299 000
Matched 7381 7269 34 834 039 070oasys_score Unmatched 77335 75658 48 070 049
Matched 77335 77060 08 836 009 093oasys_motiv Unmatched 1210 1141 110 165 010
Matched 1210 1201 15 864 017 087oasys_litnum Unmatched 0350 0416 -102 -150 013
Matched 0350 0361 -17 830 -020 084oasys_lrndiff Unmatched 0187 0184 05 008 094
Matched 0187 0180 13 -1510 014 089oasys_psychgl Unmatched 0486 0426 89 139 017
Matched 0486 0499 -19 791 -020 084oasys_psychtr Unmatched 0237 0142 194 327 000
Matched 0237 0224 27 861 028 078spcr_genderf Unmatched 0214 0124 243 408 000
Matched 0214 0199 39 838 041 068spcr_age Unmatched 28008 30216 -238 -349 000
Matched 28008 28364 -38 839 -046 065spcr_marst_mar Unmatched 0070 0093 -84 -123 022
Matched 0070 0075 -19 776 -023 082spcr_marst_lvp Unmatched 0296 0256 90 140 016
Matched 0296 0250 103 -149 117 024spcr_ethnic_mix Unmatched 0062 0038 110 187 006
Matched 0062 0040 100 92 112 026spcr_ethnic_as Unmatched 0047 0041 28 044 066
Matched 0047 0035 57 -1056 067 050spcr_ethnic_bl Unmatched 0035 0065 -137 -189 006
Matched 0035 0063 -127 76 -145 015spcr_ethnic_oth Unmatched 0000 0004 -89 -101 031
Matched 0000 0002 -51 431 -076 045pnc_copas Unmatched -0902 -0880 -27 -040 069
Matched -0902 -0910 10 644 011 091pnc_ttlprevconv Unmatched 10946 12746 -163 -227 002
Matched 10946 11580 -57 648 -069 049pnc_ttlprevconv2 Unmatched 212140 314300 -133 -163 010
Matched 212140 257960 -60 552 -082 041pnc_ttlprevconvsev
Unmatched 0132 0146 -34 -050 062Matched 0132 0165 -79 -1300 -087 039
pnc_ttlprevconvsev2
Unmatched 0163 0209 -57 -074 046Matched 0163 0239 -95 -657 -102 031
41
Variable SampleMean
bias bias
reductiont-test
Treated Control t pgttpnc_index_vio Unmatched 0327 0245 182 288 000
Matched 0327 0311 36 804 039 070pnc_index_sxl Unmatched 0078 0040 162 286 000
Matched 0078 0078 -03 982 -003 098pnc_index_acq Unmatched 0175 0303 -302 -430 000
Matched 0175 0195 -46 847 -057 057pnc_index_drg Unmatched 0218 0195 57 088 038
Matched 0218 0211 16 718 018 086pnc_index_rob Unmatched 0144 0065 261 469 000
Matched 0144 0133 37 858 037 071spcr_famconv Unmatched 0463 0403 121 185 006
Matched 0463 0433 60 503 067 050spcr_fampris Unmatched 0396 0334 129 200 005
Matched 0396 0354 88 322 098 033spcr_motivstoffy Unmatched 1720 1670 93 139 017
Matched 1720 1719 01 985 002 099spcr_motivstoffn Unmatched 0016 0010 40 065 052
Matched 0016 0007 58 -453 069 049spcr_motivhlpstoffy
Unmatched 1346 1085 338 498 000Matched 1346 1304 55 836 065 052
spcr_motivhlpstoffn
Unmatched 0097 0164 -166 -234 002Matched 0097 0107 -25 850 -031 076
spcr_attg Unmatched 58131 57962 23 033 074Matched 58131 58212 -11 518 -012 091
spcr_atta Unmatched 18393 18516 -50 -073 047Matched 18393 18547 -63 -257 -068 050
spcr_attv Unmatched 11825 10907 321 454 000Matched 11825 11681 50 843 061 054
spcr_atte Unmatched 13996 13809 60 092 036Matched 13996 13871 40 331 045 066
spcr_drug4wka Unmatched 0381 0419 -77 -118 024Matched 0381 0408 -55 289 -062 053
spcr_drug4wkbc Unmatched 0494 0499 -10 -015 088Matched 0494 0486 16 -637 019 085
spcr_drug4wkinj Unmatched 0109 0155 -135 -194 005Matched 0109 0143 -99 265 -114 025
spcr_accomtrans Unmatched 0054 0052 12 019 085Matched 0054 0058 -17 -360 -018 085
spcr_accomrough Unmatched 0027 0054 -138 -188 006Matched 0027 0032 -23 835 -030 076
spcr_edqual Unmatched 1965 1893 36 054 059Matched 1965 1915 25 308 028 078
spcr_job4wk Unmatched 0346 0331 32 049 062Matched 0346 0331 32 17 036 072
Figure A1 Risk OASys total weighted score (OASys) by treatment and control groups
Risk OASys weighted score
8
6
4
2
Per c
ent
Control
0
8
6
4
2
Per c
ent
Treatment
050 100 150 50 100 150
42
Distributions of matching variables by treatment and control groups
Table A4 Need Sum of OASys Section 11 Thinking and Behaviour scores (OASys) by treatment and control groups
Summed scoreControl Treatment
n Valid n Valid 0 111 44 44 1 04 041 89 35 35 6 23 232 126 50 50 11 43 433 156 62 62 13 51 514 219 87 87 24 93 935 234 93 93 19 74 746 262 104 104 23 89 897 281 112 112 37 144 1448 253 101 101 30 117 1179 211 84 84 29 113 11310 184 73 73 15 58 5811 147 58 58 18 70 7012 117 47 47 17 66 6613 62 25 25 7 27 2714 62 25 25 7 27 27Missing 0 00 0 00Total 2514 1000 1000 257 1000 1000Note Control group frequencies are unweighted (a weighted average of controls within the radius calliper is
used in the matching algorithm)
43
Table A5 Motivation to change behaviour (OASys) by treatment and control groups
RatingControl Treatment
n Valid n Valid Not at all 367 146 146 28 109 109Quite motivated 1426 567 567 147 572 572Very motivated 721 287 287 82 319 319Missing 0 00 0 00Total 2514 1000 1000 257 1000 1000Note Control group frequencies are unweighted (a weighted average of controls within the radius calliper is
used in the matching algorithm)
Table A6 Problems with readingwritingnumeracy (OASys) by treatment and control groups
ExtentControl Treatment
n Valid n Valid No problems 1735 690 690 187 728 728Some problems 512 204 204 50 195 195Significant problems 267 106 106 20 78 78Missing 0 00 0 00Total 2514 1000 1000 257 1000 1000Note Control group frequencies are unweighted (a weighted average of controls within the radius calliper is
used in the matching algorithm)
Table A7 Problems with learning difficulties (OASys) by treatment and control groups
ExtentControl Treatment
n Valid n Valid No problems 2185 869 869 226 879 879Some problems 195 78 78 14 54 54Significant problems 134 53 53 17 66 66Missing 0 00 0 00Total 2514 1000 1000 257 1000 1000Note Control group frequencies are unweighted (a weighted average of controls within the radius calliper is
used in the matching algorithm)
Table A8 Problems with current psychological problemsdepression (OASys) by treatment and control groups
Extent Control Treatment
n Valid n Valid No problems 1693 673 673 162 630 630Some problems 572 228 228 65 253 253Significant problems 249 99 99 30 117 117Missing 0 00 0 00Total 2514 1000 1000 257 1000 1000Note Control group frequencies are unweighted (a weighted average of controls within the radius calliper is
used in the matching algorithm)
Figure A2 Age (SPCR) by treatment and control groups
8
6
4
2
0
Per
cen
t
20 40 60 80
8
6
4
2
0
Per
cen
t
20 40 60 80Age (SPCR)
Control Treatment
44
Table A9 Problems with current psychiatric problems (OASys) by treatment and control groups
ExtentControl Treatment
n Valid n Valid No problems 2244 893 893 211 821 821Some problems 184 73 73 31 121 121Significant problems 86 34 34 15 58 58Missing 0 00 0 00Total 2514 1000 1000 257 1000 1000Note Control group frequencies are unweighted (a weighted average of controls within the radius calliper is
used in the matching algorithm)
Table A10 Gender (SPCR) by treatment and control groups
GenderControl Treatment
n Valid n Valid Male 2203 876 876 202 786 786Female 311 124 124 55 214 214Missing 0 00 0 00Total 2514 1000 1000 257 1000 1000Note Control group frequencies are unweighted (a weighted average of controls within the radius calliper is
used in the matching algorithm)
Figure A3 Copas rate on release (PNC) by treatment and control groups
10
5
0-4 -2 0 2
Per c
ent
10
5
0-4 -2 0 2
Per c
ent
COPAS rate on release (PNC)
Control Treatment
45
Table A11 Marital status (SPCR) by treatment and control groups
StatusControl Treatment
n Valid n Valid Married 234 93 93 18 70 70Living with partner 642 255 256 76 296 296Other 1636 651 651 163 634 634Missing 2 01 0 00Total 2514 1000 1000 257 1000 1000Note Control group frequencies are unweighted (a weighted average of controls within the radius calliper is
used in the matching algorithm)
Table A12 Ethnicity (SPCR) by treatment and control groups
Ethnic groupControl Treatment
n Valid n Valid Any White background 2142 852 852 220 856 856Any Mixed background 96 38 38 16 62 62Any Asian background 103 41 41 12 47 47Any Black background 163 65 65 9 35 35Any Other background 10 04 04 0 00 00Missing 0 00 0 00Total 2514 1000 1000 257 1000 1000Note Control group frequencies are unweighted (a weighted average of controls within the radius calliper is
used in the matching algorithm)
Figure A4 Total previous convictions (PNC) by treatment and control groups
30
20
10
050 100 150 200
30
20
10
050 100 150 200
Per c
ent
Per c
ent
Previous convictions (PNC)
Control Treatment
46
Table A13 Previous severe convictions (PNC) by treatment and control groups
NumberControl Treatment
n Valid n Valid 0 2205 877 877 227 883 8831 265 105 105 26 101 1012 34 14 14 4 16 163 5 02 02 0 00 004 5 02 02 0 00 00Missing 0 00 0 00Total 2514 1000 1000 257 1000 1000Note Control group frequencies are unweighted (a weighted average of controls within the radius calliper is
used in the matching algorithm)
Table A14 Grouped index offence type (PNC) by treatment and control groups
Offence type grouping
Control Treatmentn Valid n Valid
Other 384 153 153 15 58 58Violent 616 245 245 84 327 327Robbery 163 65 65 37 144 144Sexual 100 40 40 20 78 78Acquisitive 761 303 303 45 175 175Drug 490 195 195 56 218 218Missing 0 00 0 00Total 2514 1000 1000 257 1000 1000Note Control group frequencies are unweighted (a weighted average of controls within the radius calliper is
used in the matching algorithm)
47
Table A15 Family member has been convicted of a non-motoring offence (SPCR) by treatment and control groups
ResponseControl Treatment
n Valid n Valid No 1486 591 597 137 533 537Yes 1003 399 403 118 459 463Missing 25 10 2 08Total 2514 1000 1000 257 1000 1000Note Control group frequencies are unweighted (a weighted average of controls within the radius calliper is
used in the matching algorithm)
Table A16 Family member has been in prison (SPCR) by treatment and control groups
ResponseControl Treatment
n Valid n Valid No 1658 660 666 154 599 604Yes 831 331 334 101 393 396Missing 25 10 2 08Total 2514 1000 1000 257 1000 1000Note Control group frequencies are unweighted (a weighted average of controls within the radius calliper is
used in the matching algorithm)
Table A17 Agree Want to stop offending (SPCR) by treatment and control groups
ResponseControl Treatment
n Valid n Valid Other 101 40 40 9 35 35Agree 627 249 249 54 210 210Strongly agree 1786 710 710 194 755 755Missing 0 00 0 00Total 2514 1000 1000 257 1000 1000Note Control group frequencies are unweighted (a weighted average of controls within the radius calliper is
used in the matching algorithm)
Table A18 Disagree Want to stop offending (SPCR) by treatment and control groups
ResponseControl Treatment
n Valid n Valid Other 2498 994 994 254 988 988Disagree 7 03 03 2 08 08Strongly disagree 9 04 04 1 04 04Missing 0 00 0 00Total 2514 1000 1000 257 1000 1000Note Control group frequencies are unweighted (a weighted average of controls within the radius calliper is used in the matching algorithm)
Figure A5 General attitude to offending CRIME-PICS (SPCR) by treatment and control groups
15
10
5
020 40 60 80
Per c
ent
Control15
10
5
020 40 60 80
Per c
ent
Treatment
General attitude to offending CRIME-PICS (SPCR)
48
Table A19 Agree Want to get help to stop offending (SPCR) by treatment and control groups
ResponseControl Treatment
n Valid n Valid Other 725 288 288 40 156 156Agree 851 339 339 88 342 342Strongly agree 938 373 373 129 502 502Missing 0 00 0 00Total 2514 1000 1000 257 1000 1000Note Control group frequencies are unweighted (a weighted average of controls within the radius calliper is
used in the matching algorithm)
Table A20 Disagree Want to get help to stop offending (SPCR) by treatment and control groups
ResponseControl Treatment
n Valid n Valid Other 2174 865 865 237 922 922Disagree 268 107 107 15 58 58Strongly disagree 72 29 29 5 19 19Missing 0 00 0 00Total 2514 1000 1000 257 1000 1000Note Control group frequencies are unweighted (a weighted average of controls within the radius calliper is
used in the matching algorithm)
49
Table A21 Anticipation of reoffending CRIME-PICS (SPCR) by treatment and control groups
ScoreControl Treatment
n Valid n Valid 8 2 01 01 0 00 009 1 00 00 0 00 0010 3 01 01 1 04 0411 6 02 03 0 00 0012 14 06 06 1 04 0413 27 11 11 4 16 1614 46 18 19 8 31 3315 113 45 48 9 35 3716 201 80 85 18 70 7417 276 110 116 30 117 12318 628 250 265 65 253 26619 371 148 156 44 171 18020 287 114 121 30 117 12321 145 58 61 13 51 5322 106 42 45 9 35 3723 71 28 30 5 19 2024 29 12 12 2 08 0825 17 07 07 2 08 0826 14 06 06 2 08 0827 7 03 03 1 04 0428 3 01 01 0 00 0029 1 00 00 0 00 0030 6 02 03 0 00 00Missing 140 56 13 51Total 2514 1000 1000 257 1000 1000Note Control group frequencies are unweighted (a weighted average of controls within the radius calliper is
used in the matching algorithm)
50
Table A22 Victim hurt denial CRIME-PICS (SPCR) by treatment and control groups
ScoreControl Treatment
n Valid n Valid 3 69 27 27 2 08 084 47 19 19 2 08 085 59 23 23 1 04 046 136 54 54 6 23 237 104 41 41 4 16 168 155 62 62 14 54 549 129 51 51 20 78 7810 241 96 96 19 74 7411 133 53 53 8 31 3112 664 264 264 77 300 30013 257 102 102 38 148 14814 196 78 78 22 86 8615 324 129 129 44 171 171Missing 0 00 0 00Total 2514 1000 1000 257 1000 1000Note Control group frequencies are unweighted (a weighted average of controls within the radius calliper is
used in the matching algorithm)
Table A23 Evaluation of crime as worthwhile CRIME-PICS (SPCR) by treatment and control groups
ScoreControl Treatment
n Valid n Valid 4 1 00 00 1 04 045 5 02 02 1 04 046 16 06 06 2 08 087 26 10 11 2 08 088 68 27 28 4 16 169 96 38 39 9 35 3510 177 70 72 21 82 8311 197 78 80 13 51 5112 270 107 109 31 121 12213 235 93 95 24 93 9414 328 130 133 33 128 13015 266 106 108 24 93 9416 276 110 112 27 105 10617 229 91 93 24 93 9418 115 46 47 20 78 7919 94 37 38 12 47 4720 70 28 28 6 23 24Missing 45 18 3 12Total 2514 1000 1000 257 1000 1000Note Control group frequencies are unweighted (a weighted average of controls within the radius calliper is
used in the matching algorithm)
51
Table A24 Used class A drugs in the four weeks before custody (SPCR) by treatment and control groups
ResponseControl Treatment
n Valid n Valid No 1460 581 581 159 619 619Yes 1054 419 419 98 381 381Missing 0 00 0 00Total 2514 1000 1000 257 1000 1000Note Control group frequencies are unweighted (a weighted average of controls within the radius calliper is
used in the matching algorithm)
Table A25 Used class BC drugs in the four weeks before custody (SPCR) by treatment and control groups
ResponseControl Treatment
n Valid n Valid No 1259 501 501 130 506 506Yes 1255 499 499 127 494 494Missing 0 00 0 00Total 2514 1000 1000 257 1000 1000Note Control group frequencies are unweighted (a weighted average of controls within the radius calliper is
used in the matching algorithm)
Table A26 Injected illegal drugs in the four weeks before custody (SPCR) by treatment and control groups
ResponseControl Treatment
n Valid n Valid No 2121 844 845 228 887 891Yes 389 155 155 28 109 109Missing 4 02 1 04Total 2514 1000 1000 257 1000 1000Note Control group frequencies are unweighted (a weighted average of controls within the radius calliper is
used in the matching algorithm)
Table A27 Accommodation prior to custody (SPCR) by treatment and control groups
TypeControl Treatment
n Valid n Valid Stable accommodation 2247 894 894 236 918 918Transient accommodation 130 52 52 14 54 54Sleeping rough 137 54 54 7 27 27Missing 0 00 0 00Total 2514 1000 1000 257 1000 1000Note Control group frequencies are unweighted (a weighted average of controls within the radius calliper is
used in the matching algorithm)
52
Table A28 Educational (qualifications) attainment (SPCR) by treatment and control groups
Highest qualification attained
Control Treatment
n Valid
n Valid
No qualifications 1099 437 441 99 385 388Other qualifications (incl overseas) 66 26 26 7 27 27O levelGCSE grade D-G (or similar qualification) 372 148 149 47 183 184O levelGCSE Grades A-C (or similar qualification) 507 202 204 61 237 239Trade apprenticeships 87 35 35 6 23 24AAS levels 220 88 88 21 82 82Higher education diploma 57 23 23 11 43 43First degreepostgraduate degree 70 28 28 2 08 08Higher degreepostgraduate degree 13 05 05 1 04 04Missing 23 09 2 08Total 2514 1000 1000 257 1000 1000Note Control group frequencies are unweighted (a weighted average of controls within the radius calliper is
used in the matching algorithm)
Table A29 Was in paid work in the four weeks before custody (SPCR) by treatment and control groups
ResponseControl Treatment
n Valid n Valid No 1681 669 669 168 654 654Yes 832 331 331 89 346 346Missing 1 00 0 00Total 2514 1000 1000 257 1000 1000Note Control group frequencies are unweighted (a weighted average of controls within the radius calliper is
used in the matching algorithm)
Table A30 Reconviction indicator one-year (PNC) by treatment and control groups
IndicatorControl Treatment
n Valid n Valid No 1584 630 630 187 728 728Yes 930 370 370 70 272 272Missing 0 00 0 00Total 2514 1000 1000 257 1000 1000Note Control group frequencies are unweighted (a weighted average of controls within the radius calliper is
used in the matching algorithm)
53
Table A31 Frequency of reoffending one-year (PNC) by treatment and control groups
IndicatorControl Treatment
n Valid n Valid 0 1584 630 630 187 728 7281 495 197 197 54 210 2102 203 81 81 11 43 433 117 47 47 3 12 124 53 21 21 1 04 045 33 13 13 1 04 046 8 03 03 0 00 007 7 03 03 0 00 008 6 02 02 0 00 009 1 00 00 0 00 0010 2 01 01 0 00 0011 2 01 01 0 00 0013 0 00 00 0 00 0015 1 00 00 0 00 0018 1 00 00 0 00 0032 1 00 00 0 00 00Missing 0 00 0 00Total 2514 1000 1000 257 1000 1000Note Control group frequencies are unweighted (a weighted average of controls within the radius calliper is
used in the matching algorithm)
54
Table A32 Frequency of reoffences one-year (PNC) by treatment and control groups
IndicatorControl Treatment
n Valid n Valid 0 1584 630 630 187 728 7281 272 108 108 31 121 1212 181 72 72 15 58 583 117 47 47 15 58 584 91 36 36 2 08 085 65 26 26 3 12 126 42 17 17 2 08 087 38 15 15 1 04 048 32 13 13 1 04 049 20 08 08 0 00 0010 19 08 08 0 00 0011 15 06 06 0 00 0012 11 04 04 0 00 0013 6 02 02 0 00 0014 6 02 02 0 00 0015 5 02 02 0 00 0016 1 00 00 0 00 0017 0 00 00 0 00 0018 1 00 00 0 00 0019 1 00 00 0 00 0020 1 00 00 0 00 0021 2 01 01 0 00 0022 2 01 01 0 00 0025 1 00 00 0 00 0039 1 00 00 0 00 00Missing 0 00 0 00Total 2514 1000 1000 257 1000 1000Note Control group frequencies are unweighted (a weighted average of controls within the radius calliper is
used in the matching algorithm)
Table A33 Severe offences reconviction indicator one-year (PNC) by treatment and control groups
IndicatorControl Treatment
n Valid n Valid No 2496 993 993 255 992 992Yes 18 07 07 2 08 08Missing 0 00 0 00Total 2514 1000 1000 257 1000 1000Note Control group frequencies are unweighted (a weighted average of controls within the radius calliper is
used in the matching algorithm)
Ministry of Justice Research Series 1910Evaluation of the impact of the HM Prison Service Enhanced Thinking Skills programme on reoffendingThis research examined the impact of the Enhanced Thinking Skills (ETS) programme on the one-year reconviction outcomes of 257 prison-based participants between 2006 and 2008 Radius propensity score matching was used to match a comparison group that had no statistically significant difference (at the means) to the treatment group on any matching characteristic ETS was found to significantly reduce both the reconviction rate (six percentage points) and frequency (60 reoffences per 100 released prisoners) of general reoffending of participants No statistically significant impact was found on the severe offences reconviction rate Almost identical impacts were found for completers A stronger reduction in reconviction was found for participants meeting the suitability criteria Though the programme has been shown to be effective in practice the findings suggest that a stricter application of the targeting criteria might have further enhanced the effectiveness of the programme
ISBN 978 1 84099 418 6copy Crown copyrightProduced by the Ministry of JusticeAlternative format versions of this report are available on requestE-mail researchjusticegsigovukhttpwwwjusticegovukpublicationsresearchhtm
10
OASys is NOMSrsquos principal riskneed assessment and management tool for adult offenders in England and Wales and is used to assess suitability for ETS Introduced in 2001 OASys produces standardised assessments of offendersrsquo risks and needs by combining actuarial methods of prediction with structured professional judgement In terms of outputs OASys provides data on the likelihood of reconviction criminogenic factors (need) and risk of harm
The SPCR sample was matched to the OASys database by PNC number All OASys assessments completed for the prisoners in the SPCR sample subject to data completion criteria32 were provided by the OASys Data Evaluation and Analysis Team (O-DEAT) numbering some 2956433 Nonetheless as OASys assessments are not mandatory and the coverage of OASys is not universal an OASys assessment is available for only 3512 prisoners (316 of which were treated)
With an average of eight assessments provided per prisoner the one OASys assessment relevant to the instance of ETS participation was selected for each prisoner The method of selection differed for treated and untreated prisoners As the start date of ETS is known for each participant the most recent assessment prior to the start date was selected As there is no start date for the untreated group the OASys assessment completed closest (before or after) to the SPCR sentence prison reception date was selected
Police National Computer
Criminal conviction history and reconviction data were obtained from the Police National Computer (PNC) The SPCR sample was matched to the PNC database (June 2010 snapshot) using personal identifiers (surname forenames gender date of birth) returning 3615 valid matches34 Respondents must have been released for a minimum of one and a half years (allowing one year to reoffend and six months to be convicted) to be included in the matched sample Respondents that were deceased deported or had absconded were excluded from the sample
Final achieved sample details
Following merging of the four datasets 2771 of the 3849 full SPCR sample (and 257 of the 371 ETS participants) had complete data a valid OASys assessment matched to the PNC and had no missing data on any variables employed in the statistical modelling The sample included 2405 (87) men and 366 (13) women
32 All assessments provided met the following minimum standards of data completion Each of the scored sections (1 to 12) within the core OASys assessment must have had at least four-fifths of their scored items completed ndash ensuring that each criminogenic need was assessed properly and In the risk of serious harm sections the screening must have been completed the decision whether to complete a full risk analysis should have been consistent with the information provided and the four ratings of risk of serious harm in the community must have been completed (OASys Data Evaluation and Analysis Team 2010)
33 All OASys assessments used in the analysis are pre-OASys release 431 (August 2009) assessments34 Special thanks are due to Richard Boorman in Offender Management Analytical Services at MoJ for matching
the SPCR sample to the PNC and completing the reconviction analysis
11
The participant sample comprised 257 (9 of the final sample) treated prisoners who started ETS between March 2006 and September 2008 This includes 20 (8 of all treated) participants that did not complete the course a similar proportion observed in previous studies (Friendship et al 2002 Falshaw et al 2003 Cann et al 2003 Cann 2006) The remaining 2514 prisoners did not undertake ETS which provides a reasonable pool from which to select a matched control group35
Outcome measuresTo assess programme effectiveness the impact of ETS is measured with reference to the one-year reconviction outcomes of participants and comparators To reflect the fact that a successful outcome for ETS could include no reconviction (general andor severe) or a reduction in the frequency of reoffending three separate measures of proven reoffending36 are examined defined as follows
reconviction rate (one-year) binary (yesno) indicator of whether the offender was convicted of a recordable offence that was committed within the 12-month period after release from the SPCR custodial sentence
reoffending frequency (one-year) continuous measure of how many recordable offences the offender was convicted of that were committed within the 12-month period after release from the SPCR custodial sentence (note that there may be more than one offence per conviction) and
severe offence reconviction rate (one-year) binary (yesno) indicator of whether the offender was convicted of a severe offence that was committed within the 12-month follow-up period after release from the SPCR custodial sentence The designation of an offence as lsquoseverersquo follows a standard definition under which approximately 150 of the 3000 Home Office offence codes are defined as severe37
Evaluation research designTo evaluate the impact of ETS it would be desirable to compare each treated prisonerrsquos reconviction outcome after treatment with what it would have been without treatment The latter is of course not observable ndash a treated individual cannot have an untreated outcome ndash and so a proxy must be created
35 It is possible that prisoners (participants and non-participants) may have participated in other intervention programmes accredited (for example another OBP or substance misuse treatment) andor non-accredited (of varying quality) during their SPCR sentence period Analysis of the level of participation on other accredited OBPs by the treatment group and matched control groups is presented later in this section
36 An offender is said to have committed a proven reoffence if the offender receives a conviction (by a caution or guilty verdict) at court for the reoffence The reoffence must have been committed within the one-year follow up period and the conviction must follow either within that one-year follow up or in a further 6 months which is to allow time for the offence to be proven at court
37 Severe offence types include violence against the person (murder attempted murder manslaughter wounding) sexual offences (sexual assault rape sexual activity with a minor or a person with a mental disorder abuse of children through prostitution and pornography trafficking for sexual exploitation) aggravated vehicle taking and death by dangerous drink or drug driving A full list of severe offence types is available in lsquoAppendix G List of most serious (severe) offencesrsquo of Ministry of Justice (2010)
12
Due to the active selection mechanism for ETS treatment (see suitability criteria in section 1) it is likely that prisoners selected for treatment differ on average from untreated prisoners even before treatment commences ETS participants should be characterised by a medium-to-high reconviction risk and a high level of criminogenic needs whereas non-participants should have a profile that is more reflective of the general prison population This is known as selection bias For this reason any difference observed in a simple comparison of the average outcome of the treatment group with that of the untreated group could be explained by factors other than the intervention treatment It is important therefore to remove as much of the selection bias as possible between the treatment group and comparison groups prior to comparison of the average outcomes The Propensity Score Matching (Rosenbaum and Rubin 1983) statistical technique has been developed for this very purpose
A primer on Propensity Score Matching
Whilst only a Randomised Control Trial (RCT)38 can ensure a random distribution of any unobserved sources of potential bias ethical and practical considerations can mean that RCT is not an easy-to-use methodology to evaluate the impact of interventions on reconviction rates
Instead Propensity Score Matching (PSM) has been selected to estimate the causal treatment effect of ETS39 On the Scientific Methods Scale adapted for reconviction studies (Harper and Chitty 2005 National Offender Management Service 2005) PSM rates as a level 4 research design ldquothat controls for bias by using the most robust method of matching individuals on all variables that affect participation in the intervention as well as all variables that affect outcomerdquo40 As differences in the variables influencing the treatment and the outcome are controlled for after the treatment intervention the approach is defined as a retrospective quasi-experimental design
The basic idea of PSM is to select a group of untreated individuals that are statistically lsquosimilarrsquo to the group of treated individuals across the set of relevant observed characteristics measured at the pre-treatment (and pre-allocation) stage41 Once the group is well matched (little or no statistical difference in the means of the matching variables) to the treatment group it is an adequate control group to generate the proxy untreated outcome Differences between the outcomes of the treated and untreated groups can then be attributed to the intervention
38 ldquoAn RCT compares outcomes when the intervention is used to outcomes without the intervention or with an alternative (seen in the control group) In an RCT participants are randomly allocated to an intervention or a control group which differs systematically in the type or amount of the intervention received The groups are otherwise equivalent because all other differences are randomly distributedrdquo (National Offender Management Service 2005 p2)
39 In the lsquoScientific Methods Scale adapted for reconviction studiesrsquo (National Offender Management Service 2005) a five-level lsquostandard of researchrsquo scale (5 representing the highest standard) of methodologies to evaluate the impacts of an intervention on reoffending and other offence-related outcomes propensity score matching rates as a level 4 research design (RCT is the only level 5 method) Level 4 is defined as ldquoComparison group matched to intervention group on theoretically relevant factors eg risk of reconviction (well-matched comparison group)rdquo (National Offender Management Service 2005 p3)
40 National Offender Management Service (2005) p 341 Specifically PSM matches individuals based on their probability (propensity score) of participating in the
intervention programme given their observed characteristics
13
Matching methodology
The matching methodology used to generate the matched control group comprises five components suitability filter pre-selected matching variables matching algorithm the parsimonious PSM model and assessment of the match quality Consultation on the methodology employed was undertaken with analyst and policy colleagues at MoJ and NOMS
Suitability filter of potential control matches
The codification of the suitability criteria defining the prisoner needs and characteristics that determine selection into the programme presents the opportunity to control directly for selection bias Assuming that untreated prisoners satisfying the suitability criteria did not receive treatment due to practical barriers (for example ETS was not provided at the establishment the prisoner was participating on another programme or was movedreleased whilst on waiting list) non-participants could be filtered by the suitability criteria to yield an ETS-suitable pool of untreated potential control matches
Such a filter was successfully implemented though with an unexpected result As the OASys data provided did not include OGRS2 scores the risk requirement was assessed with respect to the OASys score This is not invalid as the guidance notes ldquoIf an offender passes the cut-off on one but not both scales [ie OGRS2 and OASys total weighted score] you can consider them to be suitable to progress to the needs assessment stagerdquo42
To ensure the relevance of the filter a cross-check was carried out by applying the same filter to the treatment group with the expectation of finding a high rate of compliance However this analysis revealed that a substantial proportion (up to 42) of ETS participants failed to satisfy even the basic need and risk requirements for ETS suitability43 This is the first noteworthy finding of this research and has important implications for the evaluation Full results are presented and discussed in the following Results section
The direct implication of this finding is that an explicit suitability criteria filter of the potential control pool would be unnecessarily restrictive seeing as the treatment group itself does not satisfy the criteria It also has an important implication for the potential effectiveness of the programme If the suitability criteria are designed so as to identify the individuals that are most likely to benefit from the intervention then a weak adherence to these suitability criteria would constrain the potential effectiveness that the intervention programme could actually achieve in practice (Andrews and Bonta 2010) This is an important point as a programme
42 HM Prison Service (2007) p543 It is important to note some caveats to this analysis (explained fully in the Results section) The specification
of the risk tool to OGRS2 or OASys was only introduced in August 2007 half-way through the period under analysis (March 2006 to September 2008) A secondary indicator of criminogenic needs the ETS Semi-Structured Interview was also used historically though emphasis was placed on the OASys Section 11 scores in the assessment of need There is also some flexibility allowed in the application of the suitability criteria individuals with an OASys or OGRS2 score within three points below the cut-off may be progressed to ETS and special considerations are made for indeterminate sentence prisoners and sex offenders
14
evaluation result of no statistically significant reduction in reconviction may actually be reflecting poor targeting rather than a poor programme
Pre-selected matching variables
Prior to undertaking the matching and outcome analysis a wide range of factors were identified as being the most important drivers of participation in the intervention and the reconviction outcome These variables have two functions First they form the basis of the full specification of the matching model Second the quality of the control group match is assessed by comparing its mean values with those of the treatment group on each one of these variables In addition to ETS suitability criteria and the standard static risk factors the list includes several dynamic risk factors unlike previous evaluations
The first group of factors identified are those that (should) determine the probability of treatment ndash the ETS suitability criteria level of criminogenic need risk of reconviction and responsivity and readiness criteria (motivation to change behaviour and whether the prisoner has problems with reading writing numeracy learning difficulties psychological problemsdepression or psychiatric problems)
The second group are static reconviction risk factors selected as the variables underpinning the OGRS3 score found to be a more accurate predictor of reconviction than OGRS2 and the Sentence Planning Risk Predictor (Howard et al 2009) Namely the individual static factors include age gender index offence type (explained below) the Copas rate44 sanctioning history (total previous convictions and previous severe convictions and their quadratics) Additional static risk factors from SPCR survey responses have also been included ethnicity (White Black Mixed Asian and Other background) marital status family criminal history
Every offence type has a distinct Home Office code of which there are more than 3000 which are grouped into 20 categories in the standardised OGRS classification After checking the distribution of the ETS participants across these 20 categories most had too few observations to be statistically useful Accordingly the 20 offence categories have been further grouped into six categories that are both meaningful (similar offences) and contain 20 or more treated prisoners45 The final offence type groupings with grouped OGRS categories are Violent (violence and public orderriot offences) Robbery Sexual (sexual offences not against a child sexual offences against a child and solicitingprostitution) Acquisitive (burglary (domestic) burglary (other) theft (non-motor) handling stolen goods fraud and forgery taking and driving away and related offences and theft from vehicles) Drug (drugs import export production or supply and drugs possessionsmall-scale supply) Other (abscondingbail offences other motoring drink driving criminal damage and any other offences)
44 The Copas rate (Copas and Marshall 1998) is a measure that reflects both the intensity and length of the offenderrsquos criminal career calculated as log [ (number of sanction occasions) (10 + years between first and current sanction) ] The higher the Copas rate the more convictions an offender has amassed in a given amount of time and the more likely it is that the offender will reoffend within one year
45 An exception is the lsquoOtherrsquo category the reference category for modelling which has 15 treated participants
15
Box 21 Matching variables pre-selected as being predictive of ETS participation and reconviction risk
Programme suitability criteria Need Sum of OASys Section 11 Thinking and Behaviour scores (OASys) Risk OASys total weighted score (OASys) Motivation to change behaviour (OASys) Problems with readingwritingnumeracy (OASys) Problems with learning difficulties (OASys) Problems with current psychological problemsdepression (OASys) Problems with current psychiatric problems (OASys)
Static risk factors Gender (SPCR) Age (SPCR) Marital status Married (SPCR) Marital status Living with a partner (SPCR) Ethnicity Any Mixed background (SPCR) Ethnicity Any Asian background (SPCR) Ethnicity Any Black background (SPCR) Ethnicity Any Other background (SPCR) Copas rate on release (PNC) Previous convictions (PNC) Previous convictions squared (PNC) Previous severe convictions (PNC) Previous severe convictions squared (PNC) Index offence type Violent (PNC) Index offence type Sexual (PNC) Index offence type Acquisitive (PNC) Index offence type Drug (PNC) Index offence type Robbery (PNC) Family member has been convicted of a non-motoring offence (SPCR) Family member has been in prison (SPCR)
Dynamic risk factors Agree Want to stop offending (SPCR) Disagree Want to stop offending (SPCR) Agree Want to get help to stop offending (SPCR) Disagree Want to get help to stop offending (SPCR) General attitude to offending CRIME-PICS (SPCR) Anticipation of reoffending CRIME-PICS (SPCR) Victim hurt denial CRIME-PICS (SPCR) Evaluation of crime as worthwhile CRIME-PICS (SPCR) Used class A drugs in the four weeks before custody (SPCR) Used class BC drugs in the four weeks before custody (SPCR) Injected illegal drugs in the four weeks before custody (SPCR) Transient accommodation prior to custody (SPCR) Sleeping rough prior to custody (SPCR) Educational (qualifications) attainment (SPCR) Was in paid work in the four weeks before custody (SPCR)
Note Data source is listed in parentheses
16
A range of dynamic risk factors found to be incrementally predictive of general reconviction in addition to static risk factors (Howard 2009) have also been included These factors are motivation to stop offending attitudes to offending drug use accommodation educational attainment and employment status before custody
Many of the factors are categorical and so have been converted to indicator variables (also known as lsquodummy variablesrsquo) For instance ethnicity has been split into five separate yesno variables ndash one for each individual ethnic background The full set of variables is listed in Box 21
Matching algorithm
A variety of propensity score matching methods are available to adjust for pre-treatment observable differences between the treatment group and untreated groups each best suited to particular types of data The algorithm developed to match the control group for this evaluation and the motivation underlying its choice are briefly explained here The propensity score matching analysis was undertaken in the Stata statistical software programme using the psmatch2 module (Leuven and Sianesi 2003)
First a logistic regression was used to predict the probability of treatment (the propensity score) for all treated and untreated prisoners based on their observed characteristics The resultant propensity scores summarise each prisonerrsquos characteristics on all matching variables in one measure that is used as the basis for matching
Since the sample consists of comparatively few treated prisoners in relation to many untreated ones radius matching (Dehejia and Wahba 2002) was chosen as the matching algorithm This technique uses the maximum amount of data whilst the imposition of a tolerance threshold avoids the risk of bad matches All untreated prisoners whose propensity score falls within a defined range of tolerance (radius calliper) of a treated prisonerrsquos score are matched to that prisoner A radius calliper of 005 of a standard deviation of the logit of the propensity score has been used46 The benefit of radius matching is lower propensity score variances than would result from one-to-one nearest-neighbour matching As a further step to ensure comparability prisoners with propensity scores outside the range of values where both treated and untreated observations are found were dropped a requirement of the technique47
46 The appropriate calliper size is not clearly prescribed by the empirical literature (Smith and Todd 2005) The inventors of propensity score matching Rosenbaum and Rubin (1983) recommend a calliper of a quarter of a standard deviation of the logit of the propensity score as appropriate in general This would be equivalent to 0236 in this case which was tried and rejected due to returning a weak match quality The radius calliper size was iteratively reduced until the point (005) that a further reduction would drop treated observations Sensitivity analysis was carried out on radius calliper size (00001 to 025) which found that the results were not highly sensitive to calliper size
47 Technically this is referred to as imposing common support
17
With a choice-based sample such as this participants are likely to be over-sampled relative to their frequency in the eligible prisoner population (Caliendo and Kopeinig 2005) To control for this over-sampling matching was undertaken on the odds-ratio of the propensity scores (Heckman and Smith 1995)48
The outcome of this methodology was that each ETS participant was matched with a synthetic control observation composed of the average of all non-participants sufficiently similar (propensity score within the radius limit) to the participant
Parsimonious PSM model
Due to the limited size of the sample there was a focus on parsimony (simplification without any loss of power) in development of the model Dropping insignificant variables from the logistic regression gains degrees of freedom (fewer parameters to be estimated) and observations (due to missing values on some variables) without losing explanatory power The final model was reduced to a smaller set of 16 variables listed in Box 2249 To check that this process did not introduce a bias the correlation of the propensity scores of the reduced model and the full model was checked and found to be greater than 091
Box 22 Parsimonious Propensity Score Matching model matching variables
Programme suitability criteria Need Sum of OASys Section 11 Thinking and Behaviour scores (OASys) Risk OASys total weighted score (OASys) Motivation to change behaviour (OASys) Problems with readingwritingnumeracy (OASys) Problems with current psychiatric problems (OASys)
Static risk factors Gender (SPCR) Age (SPCR) Index offence type Violent (PNC) Index offence type Sexual (PNC) Index offence type Acquisitive (PNC) Index offence type Drug (PNC) Index offence type Robbery (PNC)
Dynamic risk factors Agree Want to get help to stop offending (SPCR) Victim hurt denial CRIME-PICS (SPCR) Used class BC drugs in the four weeks before custody (SPCR) Sleeping rough prior to custody (SPCR)
Note Data source is listed in parentheses
48 Caliendo and Kopeinig (2005) note that weights are required to consistently estimate the probability of treatment when sampling is choice based However as an odds-ratio estimated using incorrect weights will be a scalar multiple of the true odds-ratio (a monotonic transformation of the propensity score) matching may proceed on the odds-ratio even when sampling weights are unknown (Heckman and Smith 1995)
49 The full model (including all 42 pre-selected variables) was run successively with the least significant variable dropped each time using the stepwise function with a confidence limit for retention equal to 01
18
Assessment of control match quality
The robustness of the calculated treatment effect depends on the quality of the match achieved The degree of lsquosimilarityrsquo between the treatment and the control group was tested using a range of statistical techniques (namely standardised bias reduction and t-tests of equality of means) Please refer to the Technical Annex for the detailed results of these tests
In summary equality of means testing confirmed no statistically significant difference between the treatment and matched control group across all 42 characteristics pre-selected as being predictive of ETS participation and reconviction risk The control group is therefore well matched on the pre-selected matching characteristics with a similar expected reconviction rate as the treatment group allowing robust estimation of the treatment effect
Whilst every effort has been made to remove the selection bias it is possible that an unmeasured bias may still remain uncontrolled Further checks on average sentence length and participation on other accredited OBP interventions (using the Offending Behaviour Programme Interventions Database) were carried out which revealed some differences between the treatment and control groups It was found that the average sentence length of the treatment group (975 days) was longer than that for the control group (727 days) It was also found that 6 of the treatment group and 2 of the control group had been on another accredited OBP during the SPCR sentence though both proportions are small
19
3 Results
The results of this evaluation show that ETS was effective in bringing about a statistically significant reduction in both the reconviction rate and frequency of reoffending in the year following release from custody for 257 prison-based participants on ETS between 2006 and 2008 Almost identical results were found for completers (when drop-outs were excluded) though the significance of the reduction in the one-year reconviction rate was lost due the reduction in the size of the sample
A secondary finding of the research was a low adherence to the suitability targeting criteria among those prisoners that actually received the programme over the period This suggests that the programme was not always administered to the most suitable group of prisoners which may have limited the effectiveness of the programme in reducing reoffending
The research findings are presented and summarised in this section The conclusions and policy-relevant implications of the results are discussed in the Implications section More detail on the results is contained in the Technical Annex
Effectiveness of ETS in reducing reoffendingThe impact of the programme is identified as the average causal effect of participation on the ETS programme (the treatment) on reconviction outcomes As the control group was created using a methodologically robust propensity score matching model and established as valid by tests on the quality of the match it represents a good proxy for the counterfactual untreated outcome of the treatment group50 The observed difference in the average conviction rates between the treatment and control groups may therefore be considered the causal effect of the ETS intervention known as the average treatment effect on the treated (ATT)
All programme participants
The reconviction rate and the frequency of reoffending of all ETS participants (including non-completers) was found to be significantly lower than the matched control group in the year following release from custody No statistically significant impact was found on the severe offence reconviction rate
The average reconviction outcomes of the treated and untreated groups and the difference between them (ATT with t-stat) are presented in Table 31 The results show that the proportion of programme participants that were reconvicted within one year (272) was six percentage points below that observed in the control group (335) and that this difference was statistically significant A statistically significant difference was also found in terms of frequency of reoffending as participants (607 offences) were reconvicted of 60 fewer recordable offences within one year per 100 released prisoners than the control group (1208 offences)
50 Testing revealed no statistical difference in the mean values of the two groups across all 42 variables pre-selected as being predictive of ETS participation and reconviction risk
20
These are the noteworthy results of this analysis as they show that ETS was successful in significantly reducing both the reconviction rate and frequency of reoffending of participants After contradictory evidence and debate the results seem to support Friendship et alsrsquo (2002) positive results though the magnitude of the effect is smaller Whilst the severe offences reconviction rate was lower in the treatment group the difference was not significant This is not surprising given the programme is not designed to target severe offending and the rarity of severe offences
Table 31 Impact of ETS on reconviction outcomes of the SPCR sample
SampleReconviction rate
(one-year)
Reoffences per 100 released prisoners
(one-year)
Severe offences reconviction rate
(one-year)Average outcomes
Treatment group (n=257) 272 607 08Matched control group 335 1208 09
Treatment effect (ATT) -62a -601b -01(t-stat) -204 -547 -013Note Average treatment effect on the treated (ATT) is the difference between the mean outcome of the
treatment group and the matched control groupa Statistically significant at the 005 levelb Statistically significant at the lt0001 level
Completers only
The evaluation has followed the lsquointention-to-treatrsquo approach in general (consistent with Colledge et al 1999) However not all participants completed the programme ndash 8 of the treated final sample did not complete the course As in previous evaluations non-completers have been removed from the analysis to test any sensitivity of the treatment effect to programme completion
21
The results are summarised in Table 32 showing an almost identical though not statistically significant reduction in the rate of reconviction for completers when drop-outs were excluded The loss in significance was most likely due to the reduction in the size of the sample The statistically significant reduction in the frequency of reoffending was retained with an almost identical effect size No significant impact was again found for the severe offences reconviction rate
Table 32 Impact of ETS on reconviction outcomes of the SPCR sample completers only
SampleReconviction rate (one-
year)
Reoffences per 100 released prisoners
(one-year)
Severe offences reconviction rate
(one-year)Average outcomesTreatment group (n=237) 270 599 08Matched control group 335 1208 09Treatment effect (ATT) -65 -609a 00(t-stat) -156 -321 -001Note Average treatment effect on the treated (ATT) is the difference between the mean outcome of the
treatment group and the matched control groupa Statistically significant at the 001 level
Completers of intervention programmes are often found to have a stronger effect than non-completers This may be due to a self-selection effect whereby completers may be more motivated or have fewer needs or have a lower risk of reoffending Therefore effectiveness of the programme should not be evaluated against completers alone whose outcomes may have been better even without the intervention Rather the true effect of the intervention as it is used in practice should be evaluated by considering all participants both completers and non-completers (Colledge et al 1999 National Offender Management Service 2005) Accordingly more weight should be placed on the findings for all participants
Assessment of suitability targeting
The HM Prison Service guidance to assess suitability for ETS and other OBPs notes
ldquoOne of the principles of effective interventions is appropriate targeting An offender is more likely to benefit from participation in an offending behaviour programme if heshe demonstrates levels of risk and need that are appropriate for the particular interventionrdquo51
To facilitate appropriate targeting HM Prison Service designed a set of risk need and responsivity suitability criteria to identify those prisoners that were most suitable for the programme These criteria were set out in the Context section Strict adherence to these criteria should ensure that ETS is appropriate and relevant for all participants
51 HM Prison Service (2007) p3
Figure 31 Need and risk score distributions for non-participant and ETS participant groups with suitability thresholds
Need Sum of OASys Section 11 Thinking and Behaviour scores (OASys)
Risk OASys total weighted score (OASys)
0
5
10
15
4 7 140
5
10
15
4 7 140 0
Per
cen
t
Per
cen
t
0
5
10
15
50 100 1500
Per
cen
t
0
5
10
15
50 100 1500
Per
cen
t
Non-participant
Non-participant
ETS participant
ETS participant
22
Need and risk requirements
The need and risk52 profiles of the participant and non-participant groups53 were compared The comparison is presented graphically in Figure 31 with needrisk ETS programme suitability thresholds marked with vertical red lines (observations to the right of the line rate as lsquosuitablersquo for ETS) In the case of need the dual thresholds of 7 or 4 (with at least one individual score of 2 indicating significant problems) are marked A single vertical red line for 56 and above is marked as the risk threshold
With regard to both need and risk the participant and non-participant distributions follow a broadly similar pattern The majority of the non-participant group had a needrisk profile that would have made them suitable for ETS This is good news for matching purposes as it means that similar prisoners at the pre-treatment stage could have been treated or remained untreated More importantly a lot of prisoners in the participant group fall to the left of the red vertical line in both charts ndash and so rated as lsquonot strictly suitablersquo for ETS
52 As the OASys data do not include OGRS2 it has only been possible to define suitability with respect to the OASys total weighted score This is not necessarily invalid as the guidance notes ldquoIf an offender passes the cut-off on one but not both scales [ie OGRS2 and OASys total weighted score] you can consider them to be suitable to progress to the needs assessment stagerdquo HM Prison Service (2007) p5
53 This analysis is based on the full sample of 3512 (316 participants and 3196 non-participants) and not the treatment and matched control groups
23
Further investigation of the need and risk (OASys total weighted score) scores revealed that only 58 of the participant group were suitable for ETS (met both need and risk requirements simultaneously) while 49 of the non-participant group would have been suitable (Table 33)
Table 33 ETS suitability criteria fulfilment non-participant and ETS participant groups
SuitabilityNon-participants ETS participants
N N Not strictly suitable for ETS 1629 510 134 424Strictly suitable for ETS 1567 490 182 576Total 3196 1000 316 1000NoteSuitability is defined with reference to risk (an OASys score 56 or above) and need (a total score of 7
or above and a total score of 4 or above with at least one individual score of 2 (indicating significant problems))
It is important to note some caveats to this analysis The suitability criteria for ETS have been reviewed and changed over time The ETS start dates of participants in the SPCR sample stretch from March 2006 to September 2008 whilst the specification of the risk tool as OGRS2 or OASys was only introduced in August 2007 (the Sentencing Planning Risk Predictor was used previously) Similarly this period covers a time when both a local semi-structured interview and the OASys assessment were sources of need information for programme staff As the programme did not itself change substantially during this period later indicators of suitability for the intervention are retrospectively relevant from a targeting perspective54 though the retrospective application of the later indicators provides no reflection of the accuracy in the application of the targeting criteria during the earlier period
There is also some flexibility allowed in the application of the suitability criteria individuals with an OASys or OGRS2 score within three points below the cut-off may be progressed to ETS and special considerations are made for indeterminate sentence prisoners and sex offenders The original indicator of criminogenic needs the ETS Semi-Structured Interview has gradually been replaced by OASys Section 11 scores as confirmed in later guidance (National Offender Management Service 2009)55
54 Assuming that amendments to the suitability identification tools over time represent improvements in targeting later indicators applied retrospectively are likely to provide a better indicator of suitability than older indicators Accordingly this analysis provides no reflection on the selection process of treatment managers at the time but rather a pure view of suitability of treated participants
55 later guidance also specified definition of risk groups suitable for ETS with reference to OGRS3 (score 50 or above)
24
Readiness and responsivity criteria
A similar comparative analysis was also carried out for the readiness and responsivity criteria The HM Prison Service (2007) guidance lists assessment items in the lsquoResponsivity Assessmentrsquo and lsquoReadiness Assessmentrsquo sections including intellectual ability literacy dyslexia mental and physical health psychopathic traits motivation to change behaviour disability However the guidance does not specify the data variables or the thresholds to be used To investigate these readiness and responsivity criteria the lsquoexclusion criteriarsquo for general offending programmes from the OASys Manual56 were used
Again the profiles of the participant and non-participant groups57 were compared with a similar pattern emerging Figure 32 plots the distributions side-by-side with the readiness and responsivity thresholds marked by red vertical lines (this time profiles to the right of the line are not strictly suited to ETS) As with the need and risk profiles the two distributions are unexpectedly similar with a number of the participant group recorded as lsquonot at allrsquo motivated or having lsquosignificant problemsrsquo More specifically of the participant group
109 were scored as lsquonot at allrsquo motivated to change their behaviour
74 had lsquosignificant problemsrsquo with readingwritingnumeracy
61 had lsquosignificant problemsrsquo with learning difficulties
103 had lsquosignificant problemsrsquo with current psychological problemsdepression and
58 had lsquosignificant problemsrsquo with current psychiatric problems
56 OASys development team (2001) p16757 This analysis is based on the full sample of 3512 (316 participants and 3196 non-participants) and not the
treatment and matched control groups
Figure 32 Readiness and responsivity score distributions for non-participant and ETS participant groups with suitability thresholds
0
20
40
60
Verymotivated
Quitemotivated
Not at all0
20
40
60
Verymotivated
Quitemotivated
Not at all
Per c
ent
Per c
ent
Non-participant ETS participant
Motivation (OASys)
0
50
100
No problems Someproblems
Significantproblems
Per c
ent
Non-participant
Problems with readingwritingnumeracy (OASys)
0No problems Some
problemsSignificantproblems
Per c
ent
ETS participant
020
6080
No problems Someproblems
Significantproblems
Per c
ent
Non-participant
Problems with learning difficulties (OASys)
0No problems Some
problemsSignificantproblems
Per c
ent
ETS participant
0
20
40
60
No problems Someproblems
Significantproblems
Per c
ent
Non-participant
Problems with current psychological probelmsdepression (OASys)
0
20
40
60
No problems Someproblems
Significantproblems
Per c
ent
ETS participant
4020
6080
40
50
100
0
50
100
No problems Someproblems
Significantproblems
Per c
ent
Non-participant
Problems with current psychological probelms (OASys)
0
50
100
No problems Someproblems
Significantproblems
Per c
ent
ETS participant
25
26
Analysis of treatment effect by suitability
To investigate the importance of adherence to the need and risk principles in participant targeting the reconviction outcomes of the treatment group were also analysed according to participant suitability As before suitability is defined with reference to risk (an OASys score 56 or above) and need (a total score of 7 or above and a total score of 4 or above with at least one individual score of 2 (indicating significant problems)) As there is some flexibility in the application of the criteria this is termed lsquostrict suitabilityrsquo
Of the treatment group 164 (64) were strictly suitable for ETS whereas 1404 (56) of the control group were strictly suitable The remainder of each group were not strictly suitable
The results of the analysis (Table 34) show that the one-year reconviction rate for strictly suitable treated offenders (172) was lower than that for not strictly suitable ones (329) Similarly the frequency of reoffending of strictly suitable offenders (398 reoffences) was also lower than that of the not strictly suitable offenders (726 reoffences)
Table 34 Impact of ETS on reconviction outcomes of the SPCR sample lsquonot strictly suitablersquo and lsquostrictly suitablersquo participants only
SampleReconviction rate
(one-year)
Reoffences per 100 released prisoners
(one-year)
Severe offences reconviction rate
(one-year)Not strictly suitable (n=93) 329 726 12Strictly suitable (n=164) 172 398 -
Caveats and limitations of the researchIt is important to note that the number of ETS-treated prisoners provided by SPCR (257) is a limited sample falling in the lower range of previous evaluation samples (from 114 to 2195 participants) as a result of a low intervention rate and missing data filters Results based on limited samples may not be reliable indicators of the wider population and in some cases the sample sizes may be too small to detect differences which may actually exist58 Tests of statistical significance are carried out on the results of this evaluation for this reason The low intervention rate means that there is a large pool (2514) from which to form a well-balanced matched control group It should also be noted that all SPCR data are self-reported
Whilst every effort has been made to remove the selection bias it is possible that an unmeasured bias may still remain uncontrolled Further checks revealed some differences between the treatment and control groups It was found that the average sentence length of the treatment group (975 days) was longer than that for the control group (727 days)
58 This caveat is more relevant where no effect is detected ndash in which case the correct conclusion may be that the sample was insufficient to detect an effect rather than that the intervention had no effect For a discussion of sample size detection power and reliability of reconviction rates please see Harper and Chitty (2004) p8
27
The possibility of multiple intervention participation has not been controlled for as the sample size did not permit such analysis Examination revealed that 6 of the treatment group and 2 of the control group had been on another accredited OBP during the SPCR sentence though both proportions are small It is also possible that prisoners may have participated on non-accredited OBPs or a substance misuse treatment during their SPCR sentence period which may have contributed to the observed treatment effect If the rate of participation in other programmes was higher in the ETS treated group the estimated treatment effect of ETS would represent a pooled effect of all treatments received and so may be overstated If the rate of participation in other programmes was higher in the ETS control group the estimated treatment effect of ETS may be understated
This evaluation has been limited to using one-year conviction rates as two-year reconviction outcome data will only become available in 12 monthsrsquo time Thus it is not possible at this time to conclude on the duration of the impact of ETS ndash that is to say whether the observed one-year effect endures two years on from release or whether it dissipates (as found by Cann et al 2003) It is planned to conduct a follow-up study of reconviction at the two-year post-release stage (please see the Further research section)
28
4 Implications
This report has evaluated the effectiveness of the prison-based ETS programme by linking participation to reconviction outcomes The evaluation results show that ETS was successful in significantly reducing both the reconviction rate and frequency of general reoffending of participants The most important implications of these results are outlined below
This research has added some clarity to the discordant evidence base on the effectiveness of ETS by improving on key methodological limitations of previous evaluation studies This provides a more solid evidence base of support on which to build intervention-based policy
The most important message for policy makers is that ETS the most frequently delivered offending behaviour programme over the past decade did work to significantly reduce reoffending in the short term (one year) at least This result should assist policy makers to prioritise and focus operational resources towards the most productive intervention efforts Though ETS has since been replaced by the Thinking Skills Programme (TSP) the results of this evaluation demonstrate that cognitive-behavioural OBPs can work to significantly reduce reoffending for offenders released from prison The findings are likely to be particularly relevant for TSP which represents a refresh and update of ETS in line with advances in theory and practice However these specific findings cannot be generalised to other cognitive-behavioural intervention programmes Each programme has its own distinct objectives delivery methods and targeted characteristics and so would require a discrete evaluation
For practitioners although the findings on reduced reconviction rates are encouraging and reflect a job well done there are also lessons to be learned A low adherence to the risk need and responsivity suitability criteria was found among those prisoners that actually received the programme between 2006 and 2008 This suggests that the programme was not always administered to the most suitable prisoners Given that research supports the importance of risk need and responsivity targeting for effective treatment (Hollin 1995 Taxman and Thanner 2006 Palmer et al 2009 Gendreau et al 2009 Andrews and Bonta 2010) and the finding of lower reconviction rates for strictly suitable prisoners this may have limited the effectiveness of the programme in reducing reoffending The fact that a significant reduction in reconviction was found in spite of this finding suggests that a stricter application of the targeting criteria might further enhance the effectiveness of the programme National Offender Management Service practitioners report that the accuracy of targeting has improved over time meaning that a similar evaluation of ETS in a later period (post-2008) or TSP might find an even more significant effect
29
Future researchers may be able to draw on the methodology developed for this research as a methodological blueprint for further evaluations The findings of this research could be complemented and enhanced by addressing some of the outstanding evidence gaps framed by a set of research questions and proposed research designs set out in the Further research section
30
5 Further research
Whilst this evaluation has added some clarity to the evidence base on the effectiveness of general cognitive-behavioural programmes evidence gaps remain These gaps are defined by the research questions listed below with suggested research designs that could provide robust answers to complement and enhance the findings in this paper
Duration of the reduction in reoffending effect Does ETS have a lasting impact or will the observed one-year effect have dissipated after two years as found by Cann et al (2003) It is planned to conduct a follow up study of the treated and matched control individuals of this evaluation two years after their release applying the same methodology to investigate the duration of the ETS impact in one yearrsquos time
Cost-effectiveness of the programme Is the cost of ETS provision justified by the observed reduction in reoffending The reduction in reoffences estimated in this evaluation could be used as the basis for a cost-benefit analysis of the ETS programme Linking the estimated reduction in reoffending to estimates of the social cost of criminal offences the avoided social costs of crime (the benefit) could be compared to data on the cost of ETS provision (estimated to be in the region of pound2000 per prisoner)59
Generalisability of the findings Would the observed effect be verified or even more significant in a larger sample By repeating the evaluation methodology but replacing SPCR variables with OASys data variables where possible the full population of prisoners undertaking ETS could be evaluated The downside to this approach is the compromised choice of data for dynamic risk factors Other benefits would be the ability to employ more matching variables and being able to evaluate some of the smaller accredited programmes This research could also be used as a methodological blueprint to evaluate substance misuse intervention programmes
What works for whom What are the characteristics of the prisoners that benefit most from ETS and other OBPs The difference in reconviction outcome for each treated prisoner compared with the matched control could be regressed on a range of treated prisonersrsquo characteristics to identify which kinds of offenders under which circumstances most benefit from undertaking ETS
The effectiveness of TSP Does ETSrsquos replacement the Thinking Skills Programme (TSP) have a lesser similar or greater impact on reconviction A similar evaluation methodology could be used to evaluate the effectiveness of TSP in reducing reconviction outcomes though this would not be possible for a couple of years as TSP was only introduced in 2009
59 Social Exclusion Unit (2002) p 81
31
Database of research findings What does the evidence base tell us about the effectiveness of ETS Policy makers are often influenced by the latest study to be published rather than the synthesised message of the collective body of evaluation research The formation and maintenance of a database of outcome studies could be used for systematic reviews and meta-analytic analysis to produce a comprehensive review of ETS efficacy to inform and guide policy makers and practitioners (for example see Tong and Farrington 2006)
In the longer term samples of the other cohort studies being conducted by MoJ ndash the probation sample of the Offender Management Community Cohort Study (OMCCS) and the juvenile offenders sample of the Juvenile Cohort Study (JCS) ndash could be similarly linked to the same management information databases (for example OASys) as linked to SPCR in this evaluation When combined with OASys assessment data and viewed as a collective database this would be the richest known single evidence base in existence on the static and dynamic factors involved in offending behaviour
32
6 Additional resources
Readers interested in researching further the issues and topics probed in this paper further may want to consult the following publications websites and other useful sources of information
HM Prison Service Offender Behaviour Programmes (OBPs) httpwwwhmprisonservicegovukadviceandsupportbeforeafterreleaseoffenderbehaviourprogrammes
Ministry of Justice Research httpwwwjusticegovukpublications
National Offender Management Service httpwwwjusticegovukaboutnomshtm
Correctional Services Accreditation Panel httpwwwjusticegovukaboutcorrectional-services-accreditationhtm
National Reducing Reoffending Delivery plan (National Offender Management Service (NOMS) website) httpnomsjusticegovuk
Social Exclusion Unit (Cabinet Office) httpwwwcabinetofficegovuksocial_exclusion_task_forceaspx
Office for National Statistics (ONS) httpwwwstatisticsgovuk
33
7 References
Andrews D A and Bonta J (2010) The psychology of criminal conduct (5th ed) New Providence NJ LexisNexis Matthew Bender
Blackburn R (1972) lsquoDimensions of hostility and aggression in abnormal offendersrsquo Journal
of Consulting and Clinical Psychology 38 pp 20ndash26
Caliendo M and Kopeinig S (2005) lsquoSome Practical Guidance for the Implementation of Propensity Score Matchingrsquo IZA Discussion Papers Series Discussion Paper No 1588 Institute for the Study of Labor (IZA)
Cann J Falshaw L Nugent F and Friendship C (2003) Understanding What Works
cognitive accredited skills programmes for adult men and young offenders Research Findings 226 London Home Office
Cann J (2006) Cognitive skills programmes impact on reducing reconviction among a
sample of female prisoners Home Office Research Study 276 London Home Office
Clarke A Simmonds R and Wydall S (2004) Delivering cognitive skills programmes in
prison a qualitative study Home Office Research Study 242 London Home Office
Clarke D A (2000) Theory Manual for Enhanced Thinking Skills Prepared for the Joint Prison Accreditation Panel London Home Office
Colledge M Collier P and Brand S (1999) Crime reduction programme and constructive
regimes in prison Programmes for offenders Guidance for evaluators Crime reduction programme ndash guidance note 2 Research Development and Statistics Directorate London Home Office
Copas J and Marshall P (1998) lsquoThe offender group reoffending scale A statistical reoffending score for use by probation officersrsquo Applied Statistics 47(1) 159ndash171
Dehejia RH and Wahba S (2002) lsquoPropensity Score-Matching Methods for Nonexperimental Causal Studiesrsquo Review of Economics and Statistics February 2002 Vol 84 No 1 pp 151ndash161
Eysenck S B and McGurk B J (1980) lsquoImpulsiveness and venturesomeness in a detention centre populationrsquo Psychological Reports 47 pp 1299ndash1306
34
Falshaw L Friendship C Travers R and Nugent F (2003) Searching for what works An
evaluation of cognitive skills programmes Home Office Research Study 206 London Home Office
Falshaw L Friendship C Blud L Travers R and Nugent F (2004) lsquoSearching for what works HM Prison Service accredited cognitive skills coursesrsquo British Journal of Forensic
Practice 6 (2) pp 3ndash13
Friendship C Blud L Erikson M and Travers R (2002) An evaluation of cognitive
behavioural treatment for prisoners Home Office Research Study 161 London Home Office
Frude N Honess T and Maguire M (1994) CRIME-PICS II Manual Cardiff Michael and Associates
Gendreau P Smith P and Theacuteriault YL (2009) lsquoChaos theory and correctional treatment Common sense correctional quackery and the law of fartcatchersrsquo Journal of Contemporary
Criminal Justice 25 384ndash396
Harper G and Chitty C (eds) (2004) The impact of corrections on re-offending A review of
lsquoWhat Worksrsquo (3rd ed) Home Office Research Study No 291 London Home Office
Heckman J and Smith J (1995) rsquoAssessing the Case for Social Experimentsrsquo Journal of
Economic Perspectives 9 85ndash110
HM Prison Service (2007) Assessing Suitability for Offending Behaviour Programmes Risk
Need amp Responsivity Guidance for Treatment Managers Offending Behaviour Programmes Unit HM Prison Service
Home Office (2006) A Five Year Strategy for Protecting the Public and Reducing Re-
offending London The Stationary Office
Hollin C R (1995) lsquoThe meaning and implications of ldquoprogramme integrityrdquorsquo In J McGuire (Ed) What works Reducing reoffending Guidelines from Research and Practice (pp 195ndash208) Chichester England John Wiley and Sons
Howard P (2009) Improving prediction of re-offending using the Offender Assessment
System Research Summary 209 London Ministry of Justice Available at httpwwwjusticegovukpublicationsdocsoasys-research-summary-02-09pdf
Howard P Francis B Soothill K and Humphreys L (2009) OGRS 3 the revised Offender
Group Reconviction Scale Research Summary 709 London Ministry of Justice
35
Leuven E and Sianesi B (2003) psmatch2 Stata module to perform full Mahalanobis and
propensity score matching common support graphing and covariate imbalance testing httpideasrepecorgcbocbocodes432001html version 315 2 May 2009
Mak A S (1991) lsquoPsychosocial control characteristics of delinquents and nondelinquentsrsquo Criminal Justice and Behaviour 18 (3) pp 297ndash303
McDougall C Clarbour J Perry A and Bowles R (2009) Evaluation of HM Prison Service
Enhanced Thinking Skills Programme Report on the implementation of a randomised
controlled trial London Ministry of Justice
McDougall C Clarbour J Perry A and Bowles R (2009) Evaluation of HM Prison Service
Enhanced Thinking Skills Programme Report on the outcomes of a randomised controlled
trial London Ministry of Justice
Ministry of Justice (2009) The Correctional Services Accreditation Panel Report 2008-
2009 Available at httpwwwjusticegovukpublicationsdocscorrectional-services-report-20080-09pdf
Ministry of Justice (2010) Reoffending of adults results from the 2008 cohort ndash England and
Wales Ministry of Justice Statistics bulletin London Ministry of Justice Available at httpwwwjusticegovukpublicationsdocsreoffending-adults-2008-cohortpdf
National Offender Management Service (2005) Understanding research methods and
findings lsquoWhat Worksrsquo Briefing 305 Available at httprdshomeofficegovukrdspdfs05wwbn3pdf
National Offender Management Service (2009) Suitability for Accredited Interventions Risk
Need amp Responsivity Targeting Criteria for Offender Managers and Treatment Managers
Interventions and Substance Misuse Group Directorate of Commissioning and Operational Policy National Offender Management Service May 2009
OASys Data Evaluation and Analysis Team O-DEAT (2010) OASys caveats notes and
limitations ndash layered OASys (May 10)
OASys development team (2001) Offender Assessment System OASys User Manual OASys Manual V2 Crown Copyright 2002
Palmer EJ McGuire J Hatcher RM Hounsome JC Bilby CAL and Hollin CR (2009) lsquoAllocation to offending behavior programs in the English and Welsh probation servicersquo Criminal Justice and Behavior 36 909ndash922
36
Rosenbaum P R and Rubin D B (1983) lsquoThe Central Role of the Propensity Score in Observational Studies for Causal Effectsrsquo Biometrika 70 41ndash55
Smith J and Todd P (2005) rsquoDoes matching overcome LaLondersquos critique of nonexperimental estimatorsrsquo Journal of Econometrics Elsevier vol 125(1-2) pages 305ndash353
Social Exclusion Unit (2002) Reducing re-offending by ex-prisoners Available from httpwwwcabinetofficegovukmediacabinetofficesocial_exclusion_task_forceassetspublications_1997_to_2006reducing_reportpdf
Stewart D (2008) The problems and needs of newly sentenced prisoners results from a
national survey Ministry of Justice Research Series 1608 Published online at httpwwwjusticegovukpublicationsresearch2008htm
Taxman FS and Thanner M (2006) lsquoRisk need and responsivity (RNR) It all dependsrsquo Crime and Delinquency 52 28ndash51
Tong LSJ and Farrington DP (2006) lsquoHow effective is the ldquoReasoning and Rehabilitationrdquo programme in reducing reoffending A meta-analysis of evaluations in four countriesrsquo Psychology Crime and Law 12 3ndash24
37
Appendix 1 Technical annex
Full set of matching variables (covariates)Programme suitability criteriaoasys_need Need Sum of OASys Section 11 Thinking and Behaviour scores
(OASys)oasys_score Risk OASys total weighted score (OASys)oasys_motiv Motivation to change behaviour (OASys)oasys_litnum Problems with readingwritingnumeracy (OASys)oasys_lrndiff Problems with learning difficulties (OASys)oasys_psychgl Problems with current psychological problemsdepression (OASys)oasys_psychtr Problems with current psychiatric problems (OASys)
Static risk factorsspcr_genderf Gender Female (SPCR)spcr_age Age (SPCR)spcr_marst_mar Marital status Married (SPCR)spcr_marst_lvp Marital status Living with a partner (SPCR)spcr_ethnic_mix Ethnicity Any Mixed background (SPCR)spcr_ethnic_as Ethnicity Any Asian background (SPCR)spcr_ethnic_bl Ethnicity Any Black background (SPCR)spcr_ethnic_oth Ethnicity Any Other background (SPCR)pnc_copas Copas rate on release (PNC)pnc_ttlprevconv Previous convictions (PNC)pnc_ttlprevconv2 Previous convictions squared (PNC)pnc_ttlprevconvsev Previous severe convictions (PNC)pnc_ttlprevconvsev2 Previous severe convictions squared (PNC)pnc_index_vio Index offence type Violent (PNC)pnc_index_sxl Index offence type Sexual (PNC)pnc_index_acq Index offence type Acquisitive (PNC)pnc_index_drg Index offence type Drug (PNC)pnc_index_rob Index offence type Robbery (PNC)spcr_famconv Family member has been convicted of a non-motoring offence
(SPCR)spcr_fampris Family member has been in prison (SPCR)
Dynamic risk factorsspcr_motivstoffy Agree Want to stop offending (SPCR)spcr_motivstoffn Disagree Want to stop offending (SPCR)spcr_motivhlpstoffy Agree Want to get help to stop offending (SPCR)spcr_motivhlpstoffn Disagree Want to get help to stop offending (SPCR)spcr_attg General attitude to offending CRIME-PICS (SPCR)spcr_atta Anticipation of reoffending CRIME-PICS (SPCR)spcr_attv Victim hurt denial CRIME-PICS (SPCR)spcr_atte Evaluation of crime as worthwhile CRIME-PICS (SPCR)spcr_drug4wka Used class A drugs in the four weeks before custody (SPCR)spcr_drug4wkbc Used class BC drugs in the four weeks before custody (SPCR)spcr_drug4wkinj Injected illegal drugs in the four weeks before custody (SPCR)spcr_accomtrans Transient accommodation prior to custody (SPCR)spcr_accomrough Sleeping rough prior to custody (SPCR)spcr_edqual Educational (qualifications) attainment (SPCR)spcr_job4wk Was in paid work in the four weeks before custody (SPCR)
38
Logistic regression model
Table A1 Logistic regression model of prisoner characteristics influencing probability of treatment (ETS) and reconviction outcomes
Coefficient Standard error P-valueETS suitabilityNeed (thinking and behaviour) 0082 0027 0002Risk (OASys score) 0005 0003 0069Motivation to change behaviour (OASys) 0323 0122 0008Problems with readingwritingnumeracy -0303 0116 0009Problems with current psychiatric problems 0335 0131 0011
GenderMale Reference
categoryFemale 0736 0177 0000
Age -0030 0009 0000
Index offence typeOther Reference
categoryViolent 1223 0296 0000Sexual 2094 0389 0000Acquisitive 0243 0313 0438Drug 1192 0309 0000Robbery 1552 0329 0000
Motivation to stop offendingDisagreed with ldquoI want to get help to stop offendingrdquo all other responses
Reference category
Agreed with ldquoI want to get help to stop offendingrdquo
0315 0091 0001
Offending-related attitudesVictim hurt denial 0078 0026 0003
Drug useUsed Class BC drugs in the 4 weeks before custody
-0195 0150 0193
AccommodationStable accommodation prior to custody Reference
categoryTemporary accommodation prior to custody Reference
categorySleeping rough prior to custody -0709 0409 0083
Constant -4933 0554 0000Notes Number of observations = 2771 (257 treated 2514 untreated) Pseudo R2 = 00958 LR
chi2(16)=16397 probgtchi2 00000
39
Calculation of the average treatment effect on the treated (ATT)
Outcome measures
pnc_reconvind Indicator of reconviction within one yearpnc_reofffreq Frequency of proven reoffending within one yearpnc_reconvindsev Indicator of severe offence reconviction within one year
Table A2 Average treatment effect on the treated (ATT)
Variable Sample Treated Controls(Difference)
ATTa
Standard error t-stat
pnc_reconvind Unmatched 0272 0370 (-0098) 0031 -311Matched ATT 0272 0335 -0062 0031 -204
pnc_reofffreq Unmatched 0607 1422 (-0815) 0182 -447Matched ATT 0607 1208 -0601 0110 -547
pnc_reconvindsev Unmatched 0008 0007 (0001) 0006 011Matched ATT 0008 0009 -0001 0006 -013
a ATT is the difference between the mean outcome of the treatment group and the matched control group
40
Tests of covariate balancing
Table A3 Means standardised bias reduction and t-tests for equality of means in the treatment and control groups before and after matching
Variable SampleMean
bias bias
reductiont-test
Treatment Control t pgttoasys_need Unmatched 7381 6703 203 299 000
Matched 7381 7269 34 834 039 070oasys_score Unmatched 77335 75658 48 070 049
Matched 77335 77060 08 836 009 093oasys_motiv Unmatched 1210 1141 110 165 010
Matched 1210 1201 15 864 017 087oasys_litnum Unmatched 0350 0416 -102 -150 013
Matched 0350 0361 -17 830 -020 084oasys_lrndiff Unmatched 0187 0184 05 008 094
Matched 0187 0180 13 -1510 014 089oasys_psychgl Unmatched 0486 0426 89 139 017
Matched 0486 0499 -19 791 -020 084oasys_psychtr Unmatched 0237 0142 194 327 000
Matched 0237 0224 27 861 028 078spcr_genderf Unmatched 0214 0124 243 408 000
Matched 0214 0199 39 838 041 068spcr_age Unmatched 28008 30216 -238 -349 000
Matched 28008 28364 -38 839 -046 065spcr_marst_mar Unmatched 0070 0093 -84 -123 022
Matched 0070 0075 -19 776 -023 082spcr_marst_lvp Unmatched 0296 0256 90 140 016
Matched 0296 0250 103 -149 117 024spcr_ethnic_mix Unmatched 0062 0038 110 187 006
Matched 0062 0040 100 92 112 026spcr_ethnic_as Unmatched 0047 0041 28 044 066
Matched 0047 0035 57 -1056 067 050spcr_ethnic_bl Unmatched 0035 0065 -137 -189 006
Matched 0035 0063 -127 76 -145 015spcr_ethnic_oth Unmatched 0000 0004 -89 -101 031
Matched 0000 0002 -51 431 -076 045pnc_copas Unmatched -0902 -0880 -27 -040 069
Matched -0902 -0910 10 644 011 091pnc_ttlprevconv Unmatched 10946 12746 -163 -227 002
Matched 10946 11580 -57 648 -069 049pnc_ttlprevconv2 Unmatched 212140 314300 -133 -163 010
Matched 212140 257960 -60 552 -082 041pnc_ttlprevconvsev
Unmatched 0132 0146 -34 -050 062Matched 0132 0165 -79 -1300 -087 039
pnc_ttlprevconvsev2
Unmatched 0163 0209 -57 -074 046Matched 0163 0239 -95 -657 -102 031
41
Variable SampleMean
bias bias
reductiont-test
Treated Control t pgttpnc_index_vio Unmatched 0327 0245 182 288 000
Matched 0327 0311 36 804 039 070pnc_index_sxl Unmatched 0078 0040 162 286 000
Matched 0078 0078 -03 982 -003 098pnc_index_acq Unmatched 0175 0303 -302 -430 000
Matched 0175 0195 -46 847 -057 057pnc_index_drg Unmatched 0218 0195 57 088 038
Matched 0218 0211 16 718 018 086pnc_index_rob Unmatched 0144 0065 261 469 000
Matched 0144 0133 37 858 037 071spcr_famconv Unmatched 0463 0403 121 185 006
Matched 0463 0433 60 503 067 050spcr_fampris Unmatched 0396 0334 129 200 005
Matched 0396 0354 88 322 098 033spcr_motivstoffy Unmatched 1720 1670 93 139 017
Matched 1720 1719 01 985 002 099spcr_motivstoffn Unmatched 0016 0010 40 065 052
Matched 0016 0007 58 -453 069 049spcr_motivhlpstoffy
Unmatched 1346 1085 338 498 000Matched 1346 1304 55 836 065 052
spcr_motivhlpstoffn
Unmatched 0097 0164 -166 -234 002Matched 0097 0107 -25 850 -031 076
spcr_attg Unmatched 58131 57962 23 033 074Matched 58131 58212 -11 518 -012 091
spcr_atta Unmatched 18393 18516 -50 -073 047Matched 18393 18547 -63 -257 -068 050
spcr_attv Unmatched 11825 10907 321 454 000Matched 11825 11681 50 843 061 054
spcr_atte Unmatched 13996 13809 60 092 036Matched 13996 13871 40 331 045 066
spcr_drug4wka Unmatched 0381 0419 -77 -118 024Matched 0381 0408 -55 289 -062 053
spcr_drug4wkbc Unmatched 0494 0499 -10 -015 088Matched 0494 0486 16 -637 019 085
spcr_drug4wkinj Unmatched 0109 0155 -135 -194 005Matched 0109 0143 -99 265 -114 025
spcr_accomtrans Unmatched 0054 0052 12 019 085Matched 0054 0058 -17 -360 -018 085
spcr_accomrough Unmatched 0027 0054 -138 -188 006Matched 0027 0032 -23 835 -030 076
spcr_edqual Unmatched 1965 1893 36 054 059Matched 1965 1915 25 308 028 078
spcr_job4wk Unmatched 0346 0331 32 049 062Matched 0346 0331 32 17 036 072
Figure A1 Risk OASys total weighted score (OASys) by treatment and control groups
Risk OASys weighted score
8
6
4
2
Per c
ent
Control
0
8
6
4
2
Per c
ent
Treatment
050 100 150 50 100 150
42
Distributions of matching variables by treatment and control groups
Table A4 Need Sum of OASys Section 11 Thinking and Behaviour scores (OASys) by treatment and control groups
Summed scoreControl Treatment
n Valid n Valid 0 111 44 44 1 04 041 89 35 35 6 23 232 126 50 50 11 43 433 156 62 62 13 51 514 219 87 87 24 93 935 234 93 93 19 74 746 262 104 104 23 89 897 281 112 112 37 144 1448 253 101 101 30 117 1179 211 84 84 29 113 11310 184 73 73 15 58 5811 147 58 58 18 70 7012 117 47 47 17 66 6613 62 25 25 7 27 2714 62 25 25 7 27 27Missing 0 00 0 00Total 2514 1000 1000 257 1000 1000Note Control group frequencies are unweighted (a weighted average of controls within the radius calliper is
used in the matching algorithm)
43
Table A5 Motivation to change behaviour (OASys) by treatment and control groups
RatingControl Treatment
n Valid n Valid Not at all 367 146 146 28 109 109Quite motivated 1426 567 567 147 572 572Very motivated 721 287 287 82 319 319Missing 0 00 0 00Total 2514 1000 1000 257 1000 1000Note Control group frequencies are unweighted (a weighted average of controls within the radius calliper is
used in the matching algorithm)
Table A6 Problems with readingwritingnumeracy (OASys) by treatment and control groups
ExtentControl Treatment
n Valid n Valid No problems 1735 690 690 187 728 728Some problems 512 204 204 50 195 195Significant problems 267 106 106 20 78 78Missing 0 00 0 00Total 2514 1000 1000 257 1000 1000Note Control group frequencies are unweighted (a weighted average of controls within the radius calliper is
used in the matching algorithm)
Table A7 Problems with learning difficulties (OASys) by treatment and control groups
ExtentControl Treatment
n Valid n Valid No problems 2185 869 869 226 879 879Some problems 195 78 78 14 54 54Significant problems 134 53 53 17 66 66Missing 0 00 0 00Total 2514 1000 1000 257 1000 1000Note Control group frequencies are unweighted (a weighted average of controls within the radius calliper is
used in the matching algorithm)
Table A8 Problems with current psychological problemsdepression (OASys) by treatment and control groups
Extent Control Treatment
n Valid n Valid No problems 1693 673 673 162 630 630Some problems 572 228 228 65 253 253Significant problems 249 99 99 30 117 117Missing 0 00 0 00Total 2514 1000 1000 257 1000 1000Note Control group frequencies are unweighted (a weighted average of controls within the radius calliper is
used in the matching algorithm)
Figure A2 Age (SPCR) by treatment and control groups
8
6
4
2
0
Per
cen
t
20 40 60 80
8
6
4
2
0
Per
cen
t
20 40 60 80Age (SPCR)
Control Treatment
44
Table A9 Problems with current psychiatric problems (OASys) by treatment and control groups
ExtentControl Treatment
n Valid n Valid No problems 2244 893 893 211 821 821Some problems 184 73 73 31 121 121Significant problems 86 34 34 15 58 58Missing 0 00 0 00Total 2514 1000 1000 257 1000 1000Note Control group frequencies are unweighted (a weighted average of controls within the radius calliper is
used in the matching algorithm)
Table A10 Gender (SPCR) by treatment and control groups
GenderControl Treatment
n Valid n Valid Male 2203 876 876 202 786 786Female 311 124 124 55 214 214Missing 0 00 0 00Total 2514 1000 1000 257 1000 1000Note Control group frequencies are unweighted (a weighted average of controls within the radius calliper is
used in the matching algorithm)
Figure A3 Copas rate on release (PNC) by treatment and control groups
10
5
0-4 -2 0 2
Per c
ent
10
5
0-4 -2 0 2
Per c
ent
COPAS rate on release (PNC)
Control Treatment
45
Table A11 Marital status (SPCR) by treatment and control groups
StatusControl Treatment
n Valid n Valid Married 234 93 93 18 70 70Living with partner 642 255 256 76 296 296Other 1636 651 651 163 634 634Missing 2 01 0 00Total 2514 1000 1000 257 1000 1000Note Control group frequencies are unweighted (a weighted average of controls within the radius calliper is
used in the matching algorithm)
Table A12 Ethnicity (SPCR) by treatment and control groups
Ethnic groupControl Treatment
n Valid n Valid Any White background 2142 852 852 220 856 856Any Mixed background 96 38 38 16 62 62Any Asian background 103 41 41 12 47 47Any Black background 163 65 65 9 35 35Any Other background 10 04 04 0 00 00Missing 0 00 0 00Total 2514 1000 1000 257 1000 1000Note Control group frequencies are unweighted (a weighted average of controls within the radius calliper is
used in the matching algorithm)
Figure A4 Total previous convictions (PNC) by treatment and control groups
30
20
10
050 100 150 200
30
20
10
050 100 150 200
Per c
ent
Per c
ent
Previous convictions (PNC)
Control Treatment
46
Table A13 Previous severe convictions (PNC) by treatment and control groups
NumberControl Treatment
n Valid n Valid 0 2205 877 877 227 883 8831 265 105 105 26 101 1012 34 14 14 4 16 163 5 02 02 0 00 004 5 02 02 0 00 00Missing 0 00 0 00Total 2514 1000 1000 257 1000 1000Note Control group frequencies are unweighted (a weighted average of controls within the radius calliper is
used in the matching algorithm)
Table A14 Grouped index offence type (PNC) by treatment and control groups
Offence type grouping
Control Treatmentn Valid n Valid
Other 384 153 153 15 58 58Violent 616 245 245 84 327 327Robbery 163 65 65 37 144 144Sexual 100 40 40 20 78 78Acquisitive 761 303 303 45 175 175Drug 490 195 195 56 218 218Missing 0 00 0 00Total 2514 1000 1000 257 1000 1000Note Control group frequencies are unweighted (a weighted average of controls within the radius calliper is
used in the matching algorithm)
47
Table A15 Family member has been convicted of a non-motoring offence (SPCR) by treatment and control groups
ResponseControl Treatment
n Valid n Valid No 1486 591 597 137 533 537Yes 1003 399 403 118 459 463Missing 25 10 2 08Total 2514 1000 1000 257 1000 1000Note Control group frequencies are unweighted (a weighted average of controls within the radius calliper is
used in the matching algorithm)
Table A16 Family member has been in prison (SPCR) by treatment and control groups
ResponseControl Treatment
n Valid n Valid No 1658 660 666 154 599 604Yes 831 331 334 101 393 396Missing 25 10 2 08Total 2514 1000 1000 257 1000 1000Note Control group frequencies are unweighted (a weighted average of controls within the radius calliper is
used in the matching algorithm)
Table A17 Agree Want to stop offending (SPCR) by treatment and control groups
ResponseControl Treatment
n Valid n Valid Other 101 40 40 9 35 35Agree 627 249 249 54 210 210Strongly agree 1786 710 710 194 755 755Missing 0 00 0 00Total 2514 1000 1000 257 1000 1000Note Control group frequencies are unweighted (a weighted average of controls within the radius calliper is
used in the matching algorithm)
Table A18 Disagree Want to stop offending (SPCR) by treatment and control groups
ResponseControl Treatment
n Valid n Valid Other 2498 994 994 254 988 988Disagree 7 03 03 2 08 08Strongly disagree 9 04 04 1 04 04Missing 0 00 0 00Total 2514 1000 1000 257 1000 1000Note Control group frequencies are unweighted (a weighted average of controls within the radius calliper is used in the matching algorithm)
Figure A5 General attitude to offending CRIME-PICS (SPCR) by treatment and control groups
15
10
5
020 40 60 80
Per c
ent
Control15
10
5
020 40 60 80
Per c
ent
Treatment
General attitude to offending CRIME-PICS (SPCR)
48
Table A19 Agree Want to get help to stop offending (SPCR) by treatment and control groups
ResponseControl Treatment
n Valid n Valid Other 725 288 288 40 156 156Agree 851 339 339 88 342 342Strongly agree 938 373 373 129 502 502Missing 0 00 0 00Total 2514 1000 1000 257 1000 1000Note Control group frequencies are unweighted (a weighted average of controls within the radius calliper is
used in the matching algorithm)
Table A20 Disagree Want to get help to stop offending (SPCR) by treatment and control groups
ResponseControl Treatment
n Valid n Valid Other 2174 865 865 237 922 922Disagree 268 107 107 15 58 58Strongly disagree 72 29 29 5 19 19Missing 0 00 0 00Total 2514 1000 1000 257 1000 1000Note Control group frequencies are unweighted (a weighted average of controls within the radius calliper is
used in the matching algorithm)
49
Table A21 Anticipation of reoffending CRIME-PICS (SPCR) by treatment and control groups
ScoreControl Treatment
n Valid n Valid 8 2 01 01 0 00 009 1 00 00 0 00 0010 3 01 01 1 04 0411 6 02 03 0 00 0012 14 06 06 1 04 0413 27 11 11 4 16 1614 46 18 19 8 31 3315 113 45 48 9 35 3716 201 80 85 18 70 7417 276 110 116 30 117 12318 628 250 265 65 253 26619 371 148 156 44 171 18020 287 114 121 30 117 12321 145 58 61 13 51 5322 106 42 45 9 35 3723 71 28 30 5 19 2024 29 12 12 2 08 0825 17 07 07 2 08 0826 14 06 06 2 08 0827 7 03 03 1 04 0428 3 01 01 0 00 0029 1 00 00 0 00 0030 6 02 03 0 00 00Missing 140 56 13 51Total 2514 1000 1000 257 1000 1000Note Control group frequencies are unweighted (a weighted average of controls within the radius calliper is
used in the matching algorithm)
50
Table A22 Victim hurt denial CRIME-PICS (SPCR) by treatment and control groups
ScoreControl Treatment
n Valid n Valid 3 69 27 27 2 08 084 47 19 19 2 08 085 59 23 23 1 04 046 136 54 54 6 23 237 104 41 41 4 16 168 155 62 62 14 54 549 129 51 51 20 78 7810 241 96 96 19 74 7411 133 53 53 8 31 3112 664 264 264 77 300 30013 257 102 102 38 148 14814 196 78 78 22 86 8615 324 129 129 44 171 171Missing 0 00 0 00Total 2514 1000 1000 257 1000 1000Note Control group frequencies are unweighted (a weighted average of controls within the radius calliper is
used in the matching algorithm)
Table A23 Evaluation of crime as worthwhile CRIME-PICS (SPCR) by treatment and control groups
ScoreControl Treatment
n Valid n Valid 4 1 00 00 1 04 045 5 02 02 1 04 046 16 06 06 2 08 087 26 10 11 2 08 088 68 27 28 4 16 169 96 38 39 9 35 3510 177 70 72 21 82 8311 197 78 80 13 51 5112 270 107 109 31 121 12213 235 93 95 24 93 9414 328 130 133 33 128 13015 266 106 108 24 93 9416 276 110 112 27 105 10617 229 91 93 24 93 9418 115 46 47 20 78 7919 94 37 38 12 47 4720 70 28 28 6 23 24Missing 45 18 3 12Total 2514 1000 1000 257 1000 1000Note Control group frequencies are unweighted (a weighted average of controls within the radius calliper is
used in the matching algorithm)
51
Table A24 Used class A drugs in the four weeks before custody (SPCR) by treatment and control groups
ResponseControl Treatment
n Valid n Valid No 1460 581 581 159 619 619Yes 1054 419 419 98 381 381Missing 0 00 0 00Total 2514 1000 1000 257 1000 1000Note Control group frequencies are unweighted (a weighted average of controls within the radius calliper is
used in the matching algorithm)
Table A25 Used class BC drugs in the four weeks before custody (SPCR) by treatment and control groups
ResponseControl Treatment
n Valid n Valid No 1259 501 501 130 506 506Yes 1255 499 499 127 494 494Missing 0 00 0 00Total 2514 1000 1000 257 1000 1000Note Control group frequencies are unweighted (a weighted average of controls within the radius calliper is
used in the matching algorithm)
Table A26 Injected illegal drugs in the four weeks before custody (SPCR) by treatment and control groups
ResponseControl Treatment
n Valid n Valid No 2121 844 845 228 887 891Yes 389 155 155 28 109 109Missing 4 02 1 04Total 2514 1000 1000 257 1000 1000Note Control group frequencies are unweighted (a weighted average of controls within the radius calliper is
used in the matching algorithm)
Table A27 Accommodation prior to custody (SPCR) by treatment and control groups
TypeControl Treatment
n Valid n Valid Stable accommodation 2247 894 894 236 918 918Transient accommodation 130 52 52 14 54 54Sleeping rough 137 54 54 7 27 27Missing 0 00 0 00Total 2514 1000 1000 257 1000 1000Note Control group frequencies are unweighted (a weighted average of controls within the radius calliper is
used in the matching algorithm)
52
Table A28 Educational (qualifications) attainment (SPCR) by treatment and control groups
Highest qualification attained
Control Treatment
n Valid
n Valid
No qualifications 1099 437 441 99 385 388Other qualifications (incl overseas) 66 26 26 7 27 27O levelGCSE grade D-G (or similar qualification) 372 148 149 47 183 184O levelGCSE Grades A-C (or similar qualification) 507 202 204 61 237 239Trade apprenticeships 87 35 35 6 23 24AAS levels 220 88 88 21 82 82Higher education diploma 57 23 23 11 43 43First degreepostgraduate degree 70 28 28 2 08 08Higher degreepostgraduate degree 13 05 05 1 04 04Missing 23 09 2 08Total 2514 1000 1000 257 1000 1000Note Control group frequencies are unweighted (a weighted average of controls within the radius calliper is
used in the matching algorithm)
Table A29 Was in paid work in the four weeks before custody (SPCR) by treatment and control groups
ResponseControl Treatment
n Valid n Valid No 1681 669 669 168 654 654Yes 832 331 331 89 346 346Missing 1 00 0 00Total 2514 1000 1000 257 1000 1000Note Control group frequencies are unweighted (a weighted average of controls within the radius calliper is
used in the matching algorithm)
Table A30 Reconviction indicator one-year (PNC) by treatment and control groups
IndicatorControl Treatment
n Valid n Valid No 1584 630 630 187 728 728Yes 930 370 370 70 272 272Missing 0 00 0 00Total 2514 1000 1000 257 1000 1000Note Control group frequencies are unweighted (a weighted average of controls within the radius calliper is
used in the matching algorithm)
53
Table A31 Frequency of reoffending one-year (PNC) by treatment and control groups
IndicatorControl Treatment
n Valid n Valid 0 1584 630 630 187 728 7281 495 197 197 54 210 2102 203 81 81 11 43 433 117 47 47 3 12 124 53 21 21 1 04 045 33 13 13 1 04 046 8 03 03 0 00 007 7 03 03 0 00 008 6 02 02 0 00 009 1 00 00 0 00 0010 2 01 01 0 00 0011 2 01 01 0 00 0013 0 00 00 0 00 0015 1 00 00 0 00 0018 1 00 00 0 00 0032 1 00 00 0 00 00Missing 0 00 0 00Total 2514 1000 1000 257 1000 1000Note Control group frequencies are unweighted (a weighted average of controls within the radius calliper is
used in the matching algorithm)
54
Table A32 Frequency of reoffences one-year (PNC) by treatment and control groups
IndicatorControl Treatment
n Valid n Valid 0 1584 630 630 187 728 7281 272 108 108 31 121 1212 181 72 72 15 58 583 117 47 47 15 58 584 91 36 36 2 08 085 65 26 26 3 12 126 42 17 17 2 08 087 38 15 15 1 04 048 32 13 13 1 04 049 20 08 08 0 00 0010 19 08 08 0 00 0011 15 06 06 0 00 0012 11 04 04 0 00 0013 6 02 02 0 00 0014 6 02 02 0 00 0015 5 02 02 0 00 0016 1 00 00 0 00 0017 0 00 00 0 00 0018 1 00 00 0 00 0019 1 00 00 0 00 0020 1 00 00 0 00 0021 2 01 01 0 00 0022 2 01 01 0 00 0025 1 00 00 0 00 0039 1 00 00 0 00 00Missing 0 00 0 00Total 2514 1000 1000 257 1000 1000Note Control group frequencies are unweighted (a weighted average of controls within the radius calliper is
used in the matching algorithm)
Table A33 Severe offences reconviction indicator one-year (PNC) by treatment and control groups
IndicatorControl Treatment
n Valid n Valid No 2496 993 993 255 992 992Yes 18 07 07 2 08 08Missing 0 00 0 00Total 2514 1000 1000 257 1000 1000Note Control group frequencies are unweighted (a weighted average of controls within the radius calliper is
used in the matching algorithm)
Ministry of Justice Research Series 1910Evaluation of the impact of the HM Prison Service Enhanced Thinking Skills programme on reoffendingThis research examined the impact of the Enhanced Thinking Skills (ETS) programme on the one-year reconviction outcomes of 257 prison-based participants between 2006 and 2008 Radius propensity score matching was used to match a comparison group that had no statistically significant difference (at the means) to the treatment group on any matching characteristic ETS was found to significantly reduce both the reconviction rate (six percentage points) and frequency (60 reoffences per 100 released prisoners) of general reoffending of participants No statistically significant impact was found on the severe offences reconviction rate Almost identical impacts were found for completers A stronger reduction in reconviction was found for participants meeting the suitability criteria Though the programme has been shown to be effective in practice the findings suggest that a stricter application of the targeting criteria might have further enhanced the effectiveness of the programme
ISBN 978 1 84099 418 6copy Crown copyrightProduced by the Ministry of JusticeAlternative format versions of this report are available on requestE-mail researchjusticegsigovukhttpwwwjusticegovukpublicationsresearchhtm
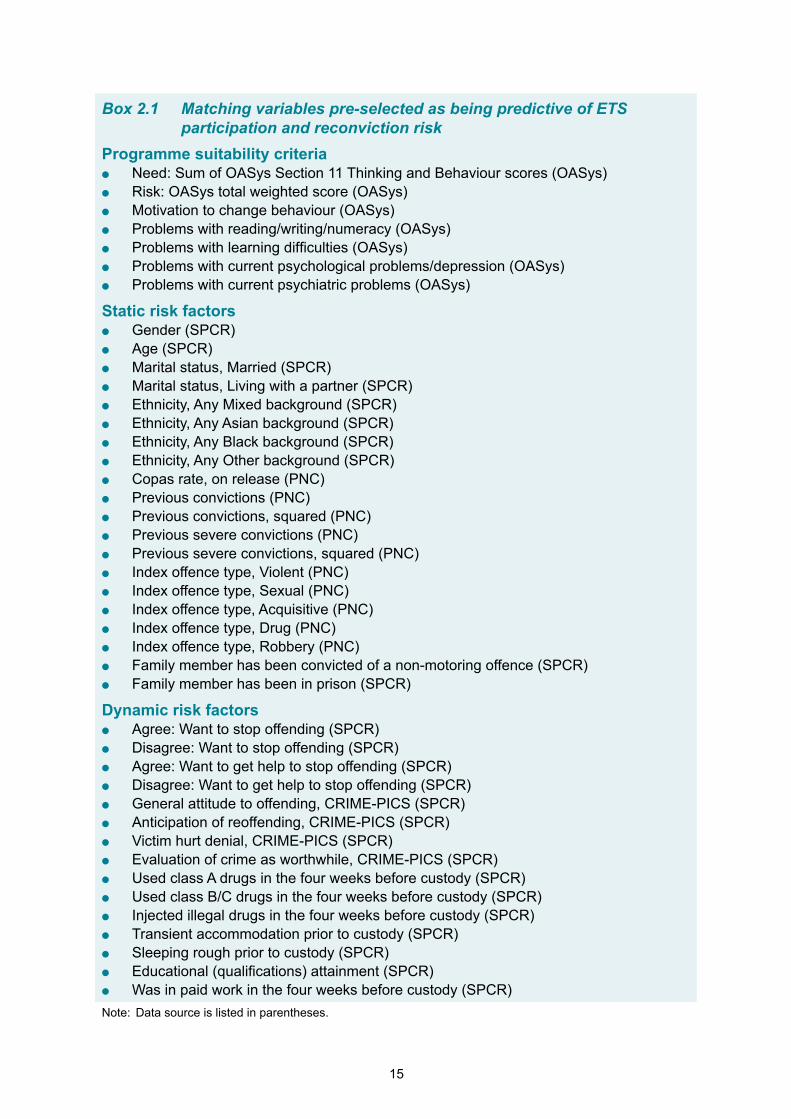
15
Box 21 Matching variables pre-selected as being predictive of ETS participation and reconviction risk
Programme suitability criteria Need Sum of OASys Section 11 Thinking and Behaviour scores (OASys) Risk OASys total weighted score (OASys) Motivation to change behaviour (OASys) Problems with readingwritingnumeracy (OASys) Problems with learning difficulties (OASys) Problems with current psychological problemsdepression (OASys) Problems with current psychiatric problems (OASys)
Static risk factors Gender (SPCR) Age (SPCR) Marital status Married (SPCR) Marital status Living with a partner (SPCR) Ethnicity Any Mixed background (SPCR) Ethnicity Any Asian background (SPCR) Ethnicity Any Black background (SPCR) Ethnicity Any Other background (SPCR) Copas rate on release (PNC) Previous convictions (PNC) Previous convictions squared (PNC) Previous severe convictions (PNC) Previous severe convictions squared (PNC) Index offence type Violent (PNC) Index offence type Sexual (PNC) Index offence type Acquisitive (PNC) Index offence type Drug (PNC) Index offence type Robbery (PNC) Family member has been convicted of a non-motoring offence (SPCR) Family member has been in prison (SPCR)
Dynamic risk factors Agree Want to stop offending (SPCR) Disagree Want to stop offending (SPCR) Agree Want to get help to stop offending (SPCR) Disagree Want to get help to stop offending (SPCR) General attitude to offending CRIME-PICS (SPCR) Anticipation of reoffending CRIME-PICS (SPCR) Victim hurt denial CRIME-PICS (SPCR) Evaluation of crime as worthwhile CRIME-PICS (SPCR) Used class A drugs in the four weeks before custody (SPCR) Used class BC drugs in the four weeks before custody (SPCR) Injected illegal drugs in the four weeks before custody (SPCR) Transient accommodation prior to custody (SPCR) Sleeping rough prior to custody (SPCR) Educational (qualifications) attainment (SPCR) Was in paid work in the four weeks before custody (SPCR)
Note Data source is listed in parentheses
16
A range of dynamic risk factors found to be incrementally predictive of general reconviction in addition to static risk factors (Howard 2009) have also been included These factors are motivation to stop offending attitudes to offending drug use accommodation educational attainment and employment status before custody
Many of the factors are categorical and so have been converted to indicator variables (also known as lsquodummy variablesrsquo) For instance ethnicity has been split into five separate yesno variables ndash one for each individual ethnic background The full set of variables is listed in Box 21
Matching algorithm
A variety of propensity score matching methods are available to adjust for pre-treatment observable differences between the treatment group and untreated groups each best suited to particular types of data The algorithm developed to match the control group for this evaluation and the motivation underlying its choice are briefly explained here The propensity score matching analysis was undertaken in the Stata statistical software programme using the psmatch2 module (Leuven and Sianesi 2003)
First a logistic regression was used to predict the probability of treatment (the propensity score) for all treated and untreated prisoners based on their observed characteristics The resultant propensity scores summarise each prisonerrsquos characteristics on all matching variables in one measure that is used as the basis for matching
Since the sample consists of comparatively few treated prisoners in relation to many untreated ones radius matching (Dehejia and Wahba 2002) was chosen as the matching algorithm This technique uses the maximum amount of data whilst the imposition of a tolerance threshold avoids the risk of bad matches All untreated prisoners whose propensity score falls within a defined range of tolerance (radius calliper) of a treated prisonerrsquos score are matched to that prisoner A radius calliper of 005 of a standard deviation of the logit of the propensity score has been used46 The benefit of radius matching is lower propensity score variances than would result from one-to-one nearest-neighbour matching As a further step to ensure comparability prisoners with propensity scores outside the range of values where both treated and untreated observations are found were dropped a requirement of the technique47
46 The appropriate calliper size is not clearly prescribed by the empirical literature (Smith and Todd 2005) The inventors of propensity score matching Rosenbaum and Rubin (1983) recommend a calliper of a quarter of a standard deviation of the logit of the propensity score as appropriate in general This would be equivalent to 0236 in this case which was tried and rejected due to returning a weak match quality The radius calliper size was iteratively reduced until the point (005) that a further reduction would drop treated observations Sensitivity analysis was carried out on radius calliper size (00001 to 025) which found that the results were not highly sensitive to calliper size
47 Technically this is referred to as imposing common support
17
With a choice-based sample such as this participants are likely to be over-sampled relative to their frequency in the eligible prisoner population (Caliendo and Kopeinig 2005) To control for this over-sampling matching was undertaken on the odds-ratio of the propensity scores (Heckman and Smith 1995)48
The outcome of this methodology was that each ETS participant was matched with a synthetic control observation composed of the average of all non-participants sufficiently similar (propensity score within the radius limit) to the participant
Parsimonious PSM model
Due to the limited size of the sample there was a focus on parsimony (simplification without any loss of power) in development of the model Dropping insignificant variables from the logistic regression gains degrees of freedom (fewer parameters to be estimated) and observations (due to missing values on some variables) without losing explanatory power The final model was reduced to a smaller set of 16 variables listed in Box 2249 To check that this process did not introduce a bias the correlation of the propensity scores of the reduced model and the full model was checked and found to be greater than 091
Box 22 Parsimonious Propensity Score Matching model matching variables
Programme suitability criteria Need Sum of OASys Section 11 Thinking and Behaviour scores (OASys) Risk OASys total weighted score (OASys) Motivation to change behaviour (OASys) Problems with readingwritingnumeracy (OASys) Problems with current psychiatric problems (OASys)
Static risk factors Gender (SPCR) Age (SPCR) Index offence type Violent (PNC) Index offence type Sexual (PNC) Index offence type Acquisitive (PNC) Index offence type Drug (PNC) Index offence type Robbery (PNC)
Dynamic risk factors Agree Want to get help to stop offending (SPCR) Victim hurt denial CRIME-PICS (SPCR) Used class BC drugs in the four weeks before custody (SPCR) Sleeping rough prior to custody (SPCR)
Note Data source is listed in parentheses
48 Caliendo and Kopeinig (2005) note that weights are required to consistently estimate the probability of treatment when sampling is choice based However as an odds-ratio estimated using incorrect weights will be a scalar multiple of the true odds-ratio (a monotonic transformation of the propensity score) matching may proceed on the odds-ratio even when sampling weights are unknown (Heckman and Smith 1995)
49 The full model (including all 42 pre-selected variables) was run successively with the least significant variable dropped each time using the stepwise function with a confidence limit for retention equal to 01
18
Assessment of control match quality
The robustness of the calculated treatment effect depends on the quality of the match achieved The degree of lsquosimilarityrsquo between the treatment and the control group was tested using a range of statistical techniques (namely standardised bias reduction and t-tests of equality of means) Please refer to the Technical Annex for the detailed results of these tests
In summary equality of means testing confirmed no statistically significant difference between the treatment and matched control group across all 42 characteristics pre-selected as being predictive of ETS participation and reconviction risk The control group is therefore well matched on the pre-selected matching characteristics with a similar expected reconviction rate as the treatment group allowing robust estimation of the treatment effect
Whilst every effort has been made to remove the selection bias it is possible that an unmeasured bias may still remain uncontrolled Further checks on average sentence length and participation on other accredited OBP interventions (using the Offending Behaviour Programme Interventions Database) were carried out which revealed some differences between the treatment and control groups It was found that the average sentence length of the treatment group (975 days) was longer than that for the control group (727 days) It was also found that 6 of the treatment group and 2 of the control group had been on another accredited OBP during the SPCR sentence though both proportions are small
19
3 Results
The results of this evaluation show that ETS was effective in bringing about a statistically significant reduction in both the reconviction rate and frequency of reoffending in the year following release from custody for 257 prison-based participants on ETS between 2006 and 2008 Almost identical results were found for completers (when drop-outs were excluded) though the significance of the reduction in the one-year reconviction rate was lost due the reduction in the size of the sample
A secondary finding of the research was a low adherence to the suitability targeting criteria among those prisoners that actually received the programme over the period This suggests that the programme was not always administered to the most suitable group of prisoners which may have limited the effectiveness of the programme in reducing reoffending
The research findings are presented and summarised in this section The conclusions and policy-relevant implications of the results are discussed in the Implications section More detail on the results is contained in the Technical Annex
Effectiveness of ETS in reducing reoffendingThe impact of the programme is identified as the average causal effect of participation on the ETS programme (the treatment) on reconviction outcomes As the control group was created using a methodologically robust propensity score matching model and established as valid by tests on the quality of the match it represents a good proxy for the counterfactual untreated outcome of the treatment group50 The observed difference in the average conviction rates between the treatment and control groups may therefore be considered the causal effect of the ETS intervention known as the average treatment effect on the treated (ATT)
All programme participants
The reconviction rate and the frequency of reoffending of all ETS participants (including non-completers) was found to be significantly lower than the matched control group in the year following release from custody No statistically significant impact was found on the severe offence reconviction rate
The average reconviction outcomes of the treated and untreated groups and the difference between them (ATT with t-stat) are presented in Table 31 The results show that the proportion of programme participants that were reconvicted within one year (272) was six percentage points below that observed in the control group (335) and that this difference was statistically significant A statistically significant difference was also found in terms of frequency of reoffending as participants (607 offences) were reconvicted of 60 fewer recordable offences within one year per 100 released prisoners than the control group (1208 offences)
50 Testing revealed no statistical difference in the mean values of the two groups across all 42 variables pre-selected as being predictive of ETS participation and reconviction risk
20
These are the noteworthy results of this analysis as they show that ETS was successful in significantly reducing both the reconviction rate and frequency of reoffending of participants After contradictory evidence and debate the results seem to support Friendship et alsrsquo (2002) positive results though the magnitude of the effect is smaller Whilst the severe offences reconviction rate was lower in the treatment group the difference was not significant This is not surprising given the programme is not designed to target severe offending and the rarity of severe offences
Table 31 Impact of ETS on reconviction outcomes of the SPCR sample
SampleReconviction rate
(one-year)
Reoffences per 100 released prisoners
(one-year)
Severe offences reconviction rate
(one-year)Average outcomes
Treatment group (n=257) 272 607 08Matched control group 335 1208 09
Treatment effect (ATT) -62a -601b -01(t-stat) -204 -547 -013Note Average treatment effect on the treated (ATT) is the difference between the mean outcome of the
treatment group and the matched control groupa Statistically significant at the 005 levelb Statistically significant at the lt0001 level
Completers only
The evaluation has followed the lsquointention-to-treatrsquo approach in general (consistent with Colledge et al 1999) However not all participants completed the programme ndash 8 of the treated final sample did not complete the course As in previous evaluations non-completers have been removed from the analysis to test any sensitivity of the treatment effect to programme completion
21
The results are summarised in Table 32 showing an almost identical though not statistically significant reduction in the rate of reconviction for completers when drop-outs were excluded The loss in significance was most likely due to the reduction in the size of the sample The statistically significant reduction in the frequency of reoffending was retained with an almost identical effect size No significant impact was again found for the severe offences reconviction rate
Table 32 Impact of ETS on reconviction outcomes of the SPCR sample completers only
SampleReconviction rate (one-
year)
Reoffences per 100 released prisoners
(one-year)
Severe offences reconviction rate
(one-year)Average outcomesTreatment group (n=237) 270 599 08Matched control group 335 1208 09Treatment effect (ATT) -65 -609a 00(t-stat) -156 -321 -001Note Average treatment effect on the treated (ATT) is the difference between the mean outcome of the
treatment group and the matched control groupa Statistically significant at the 001 level
Completers of intervention programmes are often found to have a stronger effect than non-completers This may be due to a self-selection effect whereby completers may be more motivated or have fewer needs or have a lower risk of reoffending Therefore effectiveness of the programme should not be evaluated against completers alone whose outcomes may have been better even without the intervention Rather the true effect of the intervention as it is used in practice should be evaluated by considering all participants both completers and non-completers (Colledge et al 1999 National Offender Management Service 2005) Accordingly more weight should be placed on the findings for all participants
Assessment of suitability targeting
The HM Prison Service guidance to assess suitability for ETS and other OBPs notes
ldquoOne of the principles of effective interventions is appropriate targeting An offender is more likely to benefit from participation in an offending behaviour programme if heshe demonstrates levels of risk and need that are appropriate for the particular interventionrdquo51
To facilitate appropriate targeting HM Prison Service designed a set of risk need and responsivity suitability criteria to identify those prisoners that were most suitable for the programme These criteria were set out in the Context section Strict adherence to these criteria should ensure that ETS is appropriate and relevant for all participants
51 HM Prison Service (2007) p3
Figure 31 Need and risk score distributions for non-participant and ETS participant groups with suitability thresholds
Need Sum of OASys Section 11 Thinking and Behaviour scores (OASys)
Risk OASys total weighted score (OASys)
0
5
10
15
4 7 140
5
10
15
4 7 140 0
Per
cen
t
Per
cen
t
0
5
10
15
50 100 1500
Per
cen
t
0
5
10
15
50 100 1500
Per
cen
t
Non-participant
Non-participant
ETS participant
ETS participant
22
Need and risk requirements
The need and risk52 profiles of the participant and non-participant groups53 were compared The comparison is presented graphically in Figure 31 with needrisk ETS programme suitability thresholds marked with vertical red lines (observations to the right of the line rate as lsquosuitablersquo for ETS) In the case of need the dual thresholds of 7 or 4 (with at least one individual score of 2 indicating significant problems) are marked A single vertical red line for 56 and above is marked as the risk threshold
With regard to both need and risk the participant and non-participant distributions follow a broadly similar pattern The majority of the non-participant group had a needrisk profile that would have made them suitable for ETS This is good news for matching purposes as it means that similar prisoners at the pre-treatment stage could have been treated or remained untreated More importantly a lot of prisoners in the participant group fall to the left of the red vertical line in both charts ndash and so rated as lsquonot strictly suitablersquo for ETS
52 As the OASys data do not include OGRS2 it has only been possible to define suitability with respect to the OASys total weighted score This is not necessarily invalid as the guidance notes ldquoIf an offender passes the cut-off on one but not both scales [ie OGRS2 and OASys total weighted score] you can consider them to be suitable to progress to the needs assessment stagerdquo HM Prison Service (2007) p5
53 This analysis is based on the full sample of 3512 (316 participants and 3196 non-participants) and not the treatment and matched control groups
23
Further investigation of the need and risk (OASys total weighted score) scores revealed that only 58 of the participant group were suitable for ETS (met both need and risk requirements simultaneously) while 49 of the non-participant group would have been suitable (Table 33)
Table 33 ETS suitability criteria fulfilment non-participant and ETS participant groups
SuitabilityNon-participants ETS participants
N N Not strictly suitable for ETS 1629 510 134 424Strictly suitable for ETS 1567 490 182 576Total 3196 1000 316 1000NoteSuitability is defined with reference to risk (an OASys score 56 or above) and need (a total score of 7
or above and a total score of 4 or above with at least one individual score of 2 (indicating significant problems))
It is important to note some caveats to this analysis The suitability criteria for ETS have been reviewed and changed over time The ETS start dates of participants in the SPCR sample stretch from March 2006 to September 2008 whilst the specification of the risk tool as OGRS2 or OASys was only introduced in August 2007 (the Sentencing Planning Risk Predictor was used previously) Similarly this period covers a time when both a local semi-structured interview and the OASys assessment were sources of need information for programme staff As the programme did not itself change substantially during this period later indicators of suitability for the intervention are retrospectively relevant from a targeting perspective54 though the retrospective application of the later indicators provides no reflection of the accuracy in the application of the targeting criteria during the earlier period
There is also some flexibility allowed in the application of the suitability criteria individuals with an OASys or OGRS2 score within three points below the cut-off may be progressed to ETS and special considerations are made for indeterminate sentence prisoners and sex offenders The original indicator of criminogenic needs the ETS Semi-Structured Interview has gradually been replaced by OASys Section 11 scores as confirmed in later guidance (National Offender Management Service 2009)55
54 Assuming that amendments to the suitability identification tools over time represent improvements in targeting later indicators applied retrospectively are likely to provide a better indicator of suitability than older indicators Accordingly this analysis provides no reflection on the selection process of treatment managers at the time but rather a pure view of suitability of treated participants
55 later guidance also specified definition of risk groups suitable for ETS with reference to OGRS3 (score 50 or above)
24
Readiness and responsivity criteria
A similar comparative analysis was also carried out for the readiness and responsivity criteria The HM Prison Service (2007) guidance lists assessment items in the lsquoResponsivity Assessmentrsquo and lsquoReadiness Assessmentrsquo sections including intellectual ability literacy dyslexia mental and physical health psychopathic traits motivation to change behaviour disability However the guidance does not specify the data variables or the thresholds to be used To investigate these readiness and responsivity criteria the lsquoexclusion criteriarsquo for general offending programmes from the OASys Manual56 were used
Again the profiles of the participant and non-participant groups57 were compared with a similar pattern emerging Figure 32 plots the distributions side-by-side with the readiness and responsivity thresholds marked by red vertical lines (this time profiles to the right of the line are not strictly suited to ETS) As with the need and risk profiles the two distributions are unexpectedly similar with a number of the participant group recorded as lsquonot at allrsquo motivated or having lsquosignificant problemsrsquo More specifically of the participant group
109 were scored as lsquonot at allrsquo motivated to change their behaviour
74 had lsquosignificant problemsrsquo with readingwritingnumeracy
61 had lsquosignificant problemsrsquo with learning difficulties
103 had lsquosignificant problemsrsquo with current psychological problemsdepression and
58 had lsquosignificant problemsrsquo with current psychiatric problems
56 OASys development team (2001) p16757 This analysis is based on the full sample of 3512 (316 participants and 3196 non-participants) and not the
treatment and matched control groups
Figure 32 Readiness and responsivity score distributions for non-participant and ETS participant groups with suitability thresholds
0
20
40
60
Verymotivated
Quitemotivated
Not at all0
20
40
60
Verymotivated
Quitemotivated
Not at all
Per c
ent
Per c
ent
Non-participant ETS participant
Motivation (OASys)
0
50
100
No problems Someproblems
Significantproblems
Per c
ent
Non-participant
Problems with readingwritingnumeracy (OASys)
0No problems Some
problemsSignificantproblems
Per c
ent
ETS participant
020
6080
No problems Someproblems
Significantproblems
Per c
ent
Non-participant
Problems with learning difficulties (OASys)
0No problems Some
problemsSignificantproblems
Per c
ent
ETS participant
0
20
40
60
No problems Someproblems
Significantproblems
Per c
ent
Non-participant
Problems with current psychological probelmsdepression (OASys)
0
20
40
60
No problems Someproblems
Significantproblems
Per c
ent
ETS participant
4020
6080
40
50
100
0
50
100
No problems Someproblems
Significantproblems
Per c
ent
Non-participant
Problems with current psychological probelms (OASys)
0
50
100
No problems Someproblems
Significantproblems
Per c
ent
ETS participant
25
26
Analysis of treatment effect by suitability
To investigate the importance of adherence to the need and risk principles in participant targeting the reconviction outcomes of the treatment group were also analysed according to participant suitability As before suitability is defined with reference to risk (an OASys score 56 or above) and need (a total score of 7 or above and a total score of 4 or above with at least one individual score of 2 (indicating significant problems)) As there is some flexibility in the application of the criteria this is termed lsquostrict suitabilityrsquo
Of the treatment group 164 (64) were strictly suitable for ETS whereas 1404 (56) of the control group were strictly suitable The remainder of each group were not strictly suitable
The results of the analysis (Table 34) show that the one-year reconviction rate for strictly suitable treated offenders (172) was lower than that for not strictly suitable ones (329) Similarly the frequency of reoffending of strictly suitable offenders (398 reoffences) was also lower than that of the not strictly suitable offenders (726 reoffences)
Table 34 Impact of ETS on reconviction outcomes of the SPCR sample lsquonot strictly suitablersquo and lsquostrictly suitablersquo participants only
SampleReconviction rate
(one-year)
Reoffences per 100 released prisoners
(one-year)
Severe offences reconviction rate
(one-year)Not strictly suitable (n=93) 329 726 12Strictly suitable (n=164) 172 398 -
Caveats and limitations of the researchIt is important to note that the number of ETS-treated prisoners provided by SPCR (257) is a limited sample falling in the lower range of previous evaluation samples (from 114 to 2195 participants) as a result of a low intervention rate and missing data filters Results based on limited samples may not be reliable indicators of the wider population and in some cases the sample sizes may be too small to detect differences which may actually exist58 Tests of statistical significance are carried out on the results of this evaluation for this reason The low intervention rate means that there is a large pool (2514) from which to form a well-balanced matched control group It should also be noted that all SPCR data are self-reported
Whilst every effort has been made to remove the selection bias it is possible that an unmeasured bias may still remain uncontrolled Further checks revealed some differences between the treatment and control groups It was found that the average sentence length of the treatment group (975 days) was longer than that for the control group (727 days)
58 This caveat is more relevant where no effect is detected ndash in which case the correct conclusion may be that the sample was insufficient to detect an effect rather than that the intervention had no effect For a discussion of sample size detection power and reliability of reconviction rates please see Harper and Chitty (2004) p8
27
The possibility of multiple intervention participation has not been controlled for as the sample size did not permit such analysis Examination revealed that 6 of the treatment group and 2 of the control group had been on another accredited OBP during the SPCR sentence though both proportions are small It is also possible that prisoners may have participated on non-accredited OBPs or a substance misuse treatment during their SPCR sentence period which may have contributed to the observed treatment effect If the rate of participation in other programmes was higher in the ETS treated group the estimated treatment effect of ETS would represent a pooled effect of all treatments received and so may be overstated If the rate of participation in other programmes was higher in the ETS control group the estimated treatment effect of ETS may be understated
This evaluation has been limited to using one-year conviction rates as two-year reconviction outcome data will only become available in 12 monthsrsquo time Thus it is not possible at this time to conclude on the duration of the impact of ETS ndash that is to say whether the observed one-year effect endures two years on from release or whether it dissipates (as found by Cann et al 2003) It is planned to conduct a follow-up study of reconviction at the two-year post-release stage (please see the Further research section)
28
4 Implications
This report has evaluated the effectiveness of the prison-based ETS programme by linking participation to reconviction outcomes The evaluation results show that ETS was successful in significantly reducing both the reconviction rate and frequency of general reoffending of participants The most important implications of these results are outlined below
This research has added some clarity to the discordant evidence base on the effectiveness of ETS by improving on key methodological limitations of previous evaluation studies This provides a more solid evidence base of support on which to build intervention-based policy
The most important message for policy makers is that ETS the most frequently delivered offending behaviour programme over the past decade did work to significantly reduce reoffending in the short term (one year) at least This result should assist policy makers to prioritise and focus operational resources towards the most productive intervention efforts Though ETS has since been replaced by the Thinking Skills Programme (TSP) the results of this evaluation demonstrate that cognitive-behavioural OBPs can work to significantly reduce reoffending for offenders released from prison The findings are likely to be particularly relevant for TSP which represents a refresh and update of ETS in line with advances in theory and practice However these specific findings cannot be generalised to other cognitive-behavioural intervention programmes Each programme has its own distinct objectives delivery methods and targeted characteristics and so would require a discrete evaluation
For practitioners although the findings on reduced reconviction rates are encouraging and reflect a job well done there are also lessons to be learned A low adherence to the risk need and responsivity suitability criteria was found among those prisoners that actually received the programme between 2006 and 2008 This suggests that the programme was not always administered to the most suitable prisoners Given that research supports the importance of risk need and responsivity targeting for effective treatment (Hollin 1995 Taxman and Thanner 2006 Palmer et al 2009 Gendreau et al 2009 Andrews and Bonta 2010) and the finding of lower reconviction rates for strictly suitable prisoners this may have limited the effectiveness of the programme in reducing reoffending The fact that a significant reduction in reconviction was found in spite of this finding suggests that a stricter application of the targeting criteria might further enhance the effectiveness of the programme National Offender Management Service practitioners report that the accuracy of targeting has improved over time meaning that a similar evaluation of ETS in a later period (post-2008) or TSP might find an even more significant effect
29
Future researchers may be able to draw on the methodology developed for this research as a methodological blueprint for further evaluations The findings of this research could be complemented and enhanced by addressing some of the outstanding evidence gaps framed by a set of research questions and proposed research designs set out in the Further research section
30
5 Further research
Whilst this evaluation has added some clarity to the evidence base on the effectiveness of general cognitive-behavioural programmes evidence gaps remain These gaps are defined by the research questions listed below with suggested research designs that could provide robust answers to complement and enhance the findings in this paper
Duration of the reduction in reoffending effect Does ETS have a lasting impact or will the observed one-year effect have dissipated after two years as found by Cann et al (2003) It is planned to conduct a follow up study of the treated and matched control individuals of this evaluation two years after their release applying the same methodology to investigate the duration of the ETS impact in one yearrsquos time
Cost-effectiveness of the programme Is the cost of ETS provision justified by the observed reduction in reoffending The reduction in reoffences estimated in this evaluation could be used as the basis for a cost-benefit analysis of the ETS programme Linking the estimated reduction in reoffending to estimates of the social cost of criminal offences the avoided social costs of crime (the benefit) could be compared to data on the cost of ETS provision (estimated to be in the region of pound2000 per prisoner)59
Generalisability of the findings Would the observed effect be verified or even more significant in a larger sample By repeating the evaluation methodology but replacing SPCR variables with OASys data variables where possible the full population of prisoners undertaking ETS could be evaluated The downside to this approach is the compromised choice of data for dynamic risk factors Other benefits would be the ability to employ more matching variables and being able to evaluate some of the smaller accredited programmes This research could also be used as a methodological blueprint to evaluate substance misuse intervention programmes
What works for whom What are the characteristics of the prisoners that benefit most from ETS and other OBPs The difference in reconviction outcome for each treated prisoner compared with the matched control could be regressed on a range of treated prisonersrsquo characteristics to identify which kinds of offenders under which circumstances most benefit from undertaking ETS
The effectiveness of TSP Does ETSrsquos replacement the Thinking Skills Programme (TSP) have a lesser similar or greater impact on reconviction A similar evaluation methodology could be used to evaluate the effectiveness of TSP in reducing reconviction outcomes though this would not be possible for a couple of years as TSP was only introduced in 2009
59 Social Exclusion Unit (2002) p 81
31
Database of research findings What does the evidence base tell us about the effectiveness of ETS Policy makers are often influenced by the latest study to be published rather than the synthesised message of the collective body of evaluation research The formation and maintenance of a database of outcome studies could be used for systematic reviews and meta-analytic analysis to produce a comprehensive review of ETS efficacy to inform and guide policy makers and practitioners (for example see Tong and Farrington 2006)
In the longer term samples of the other cohort studies being conducted by MoJ ndash the probation sample of the Offender Management Community Cohort Study (OMCCS) and the juvenile offenders sample of the Juvenile Cohort Study (JCS) ndash could be similarly linked to the same management information databases (for example OASys) as linked to SPCR in this evaluation When combined with OASys assessment data and viewed as a collective database this would be the richest known single evidence base in existence on the static and dynamic factors involved in offending behaviour
32
6 Additional resources
Readers interested in researching further the issues and topics probed in this paper further may want to consult the following publications websites and other useful sources of information
HM Prison Service Offender Behaviour Programmes (OBPs) httpwwwhmprisonservicegovukadviceandsupportbeforeafterreleaseoffenderbehaviourprogrammes
Ministry of Justice Research httpwwwjusticegovukpublications
National Offender Management Service httpwwwjusticegovukaboutnomshtm
Correctional Services Accreditation Panel httpwwwjusticegovukaboutcorrectional-services-accreditationhtm
National Reducing Reoffending Delivery plan (National Offender Management Service (NOMS) website) httpnomsjusticegovuk
Social Exclusion Unit (Cabinet Office) httpwwwcabinetofficegovuksocial_exclusion_task_forceaspx
Office for National Statistics (ONS) httpwwwstatisticsgovuk
33
7 References
Andrews D A and Bonta J (2010) The psychology of criminal conduct (5th ed) New Providence NJ LexisNexis Matthew Bender
Blackburn R (1972) lsquoDimensions of hostility and aggression in abnormal offendersrsquo Journal
of Consulting and Clinical Psychology 38 pp 20ndash26
Caliendo M and Kopeinig S (2005) lsquoSome Practical Guidance for the Implementation of Propensity Score Matchingrsquo IZA Discussion Papers Series Discussion Paper No 1588 Institute for the Study of Labor (IZA)
Cann J Falshaw L Nugent F and Friendship C (2003) Understanding What Works
cognitive accredited skills programmes for adult men and young offenders Research Findings 226 London Home Office
Cann J (2006) Cognitive skills programmes impact on reducing reconviction among a
sample of female prisoners Home Office Research Study 276 London Home Office
Clarke A Simmonds R and Wydall S (2004) Delivering cognitive skills programmes in
prison a qualitative study Home Office Research Study 242 London Home Office
Clarke D A (2000) Theory Manual for Enhanced Thinking Skills Prepared for the Joint Prison Accreditation Panel London Home Office
Colledge M Collier P and Brand S (1999) Crime reduction programme and constructive
regimes in prison Programmes for offenders Guidance for evaluators Crime reduction programme ndash guidance note 2 Research Development and Statistics Directorate London Home Office
Copas J and Marshall P (1998) lsquoThe offender group reoffending scale A statistical reoffending score for use by probation officersrsquo Applied Statistics 47(1) 159ndash171
Dehejia RH and Wahba S (2002) lsquoPropensity Score-Matching Methods for Nonexperimental Causal Studiesrsquo Review of Economics and Statistics February 2002 Vol 84 No 1 pp 151ndash161
Eysenck S B and McGurk B J (1980) lsquoImpulsiveness and venturesomeness in a detention centre populationrsquo Psychological Reports 47 pp 1299ndash1306
34
Falshaw L Friendship C Travers R and Nugent F (2003) Searching for what works An
evaluation of cognitive skills programmes Home Office Research Study 206 London Home Office
Falshaw L Friendship C Blud L Travers R and Nugent F (2004) lsquoSearching for what works HM Prison Service accredited cognitive skills coursesrsquo British Journal of Forensic
Practice 6 (2) pp 3ndash13
Friendship C Blud L Erikson M and Travers R (2002) An evaluation of cognitive
behavioural treatment for prisoners Home Office Research Study 161 London Home Office
Frude N Honess T and Maguire M (1994) CRIME-PICS II Manual Cardiff Michael and Associates
Gendreau P Smith P and Theacuteriault YL (2009) lsquoChaos theory and correctional treatment Common sense correctional quackery and the law of fartcatchersrsquo Journal of Contemporary
Criminal Justice 25 384ndash396
Harper G and Chitty C (eds) (2004) The impact of corrections on re-offending A review of
lsquoWhat Worksrsquo (3rd ed) Home Office Research Study No 291 London Home Office
Heckman J and Smith J (1995) rsquoAssessing the Case for Social Experimentsrsquo Journal of
Economic Perspectives 9 85ndash110
HM Prison Service (2007) Assessing Suitability for Offending Behaviour Programmes Risk
Need amp Responsivity Guidance for Treatment Managers Offending Behaviour Programmes Unit HM Prison Service
Home Office (2006) A Five Year Strategy for Protecting the Public and Reducing Re-
offending London The Stationary Office
Hollin C R (1995) lsquoThe meaning and implications of ldquoprogramme integrityrdquorsquo In J McGuire (Ed) What works Reducing reoffending Guidelines from Research and Practice (pp 195ndash208) Chichester England John Wiley and Sons
Howard P (2009) Improving prediction of re-offending using the Offender Assessment
System Research Summary 209 London Ministry of Justice Available at httpwwwjusticegovukpublicationsdocsoasys-research-summary-02-09pdf
Howard P Francis B Soothill K and Humphreys L (2009) OGRS 3 the revised Offender
Group Reconviction Scale Research Summary 709 London Ministry of Justice
35
Leuven E and Sianesi B (2003) psmatch2 Stata module to perform full Mahalanobis and
propensity score matching common support graphing and covariate imbalance testing httpideasrepecorgcbocbocodes432001html version 315 2 May 2009
Mak A S (1991) lsquoPsychosocial control characteristics of delinquents and nondelinquentsrsquo Criminal Justice and Behaviour 18 (3) pp 297ndash303
McDougall C Clarbour J Perry A and Bowles R (2009) Evaluation of HM Prison Service
Enhanced Thinking Skills Programme Report on the implementation of a randomised
controlled trial London Ministry of Justice
McDougall C Clarbour J Perry A and Bowles R (2009) Evaluation of HM Prison Service
Enhanced Thinking Skills Programme Report on the outcomes of a randomised controlled
trial London Ministry of Justice
Ministry of Justice (2009) The Correctional Services Accreditation Panel Report 2008-
2009 Available at httpwwwjusticegovukpublicationsdocscorrectional-services-report-20080-09pdf
Ministry of Justice (2010) Reoffending of adults results from the 2008 cohort ndash England and
Wales Ministry of Justice Statistics bulletin London Ministry of Justice Available at httpwwwjusticegovukpublicationsdocsreoffending-adults-2008-cohortpdf
National Offender Management Service (2005) Understanding research methods and
findings lsquoWhat Worksrsquo Briefing 305 Available at httprdshomeofficegovukrdspdfs05wwbn3pdf
National Offender Management Service (2009) Suitability for Accredited Interventions Risk
Need amp Responsivity Targeting Criteria for Offender Managers and Treatment Managers
Interventions and Substance Misuse Group Directorate of Commissioning and Operational Policy National Offender Management Service May 2009
OASys Data Evaluation and Analysis Team O-DEAT (2010) OASys caveats notes and
limitations ndash layered OASys (May 10)
OASys development team (2001) Offender Assessment System OASys User Manual OASys Manual V2 Crown Copyright 2002
Palmer EJ McGuire J Hatcher RM Hounsome JC Bilby CAL and Hollin CR (2009) lsquoAllocation to offending behavior programs in the English and Welsh probation servicersquo Criminal Justice and Behavior 36 909ndash922
36
Rosenbaum P R and Rubin D B (1983) lsquoThe Central Role of the Propensity Score in Observational Studies for Causal Effectsrsquo Biometrika 70 41ndash55
Smith J and Todd P (2005) rsquoDoes matching overcome LaLondersquos critique of nonexperimental estimatorsrsquo Journal of Econometrics Elsevier vol 125(1-2) pages 305ndash353
Social Exclusion Unit (2002) Reducing re-offending by ex-prisoners Available from httpwwwcabinetofficegovukmediacabinetofficesocial_exclusion_task_forceassetspublications_1997_to_2006reducing_reportpdf
Stewart D (2008) The problems and needs of newly sentenced prisoners results from a
national survey Ministry of Justice Research Series 1608 Published online at httpwwwjusticegovukpublicationsresearch2008htm
Taxman FS and Thanner M (2006) lsquoRisk need and responsivity (RNR) It all dependsrsquo Crime and Delinquency 52 28ndash51
Tong LSJ and Farrington DP (2006) lsquoHow effective is the ldquoReasoning and Rehabilitationrdquo programme in reducing reoffending A meta-analysis of evaluations in four countriesrsquo Psychology Crime and Law 12 3ndash24
37
Appendix 1 Technical annex
Full set of matching variables (covariates)Programme suitability criteriaoasys_need Need Sum of OASys Section 11 Thinking and Behaviour scores
(OASys)oasys_score Risk OASys total weighted score (OASys)oasys_motiv Motivation to change behaviour (OASys)oasys_litnum Problems with readingwritingnumeracy (OASys)oasys_lrndiff Problems with learning difficulties (OASys)oasys_psychgl Problems with current psychological problemsdepression (OASys)oasys_psychtr Problems with current psychiatric problems (OASys)
Static risk factorsspcr_genderf Gender Female (SPCR)spcr_age Age (SPCR)spcr_marst_mar Marital status Married (SPCR)spcr_marst_lvp Marital status Living with a partner (SPCR)spcr_ethnic_mix Ethnicity Any Mixed background (SPCR)spcr_ethnic_as Ethnicity Any Asian background (SPCR)spcr_ethnic_bl Ethnicity Any Black background (SPCR)spcr_ethnic_oth Ethnicity Any Other background (SPCR)pnc_copas Copas rate on release (PNC)pnc_ttlprevconv Previous convictions (PNC)pnc_ttlprevconv2 Previous convictions squared (PNC)pnc_ttlprevconvsev Previous severe convictions (PNC)pnc_ttlprevconvsev2 Previous severe convictions squared (PNC)pnc_index_vio Index offence type Violent (PNC)pnc_index_sxl Index offence type Sexual (PNC)pnc_index_acq Index offence type Acquisitive (PNC)pnc_index_drg Index offence type Drug (PNC)pnc_index_rob Index offence type Robbery (PNC)spcr_famconv Family member has been convicted of a non-motoring offence
(SPCR)spcr_fampris Family member has been in prison (SPCR)
Dynamic risk factorsspcr_motivstoffy Agree Want to stop offending (SPCR)spcr_motivstoffn Disagree Want to stop offending (SPCR)spcr_motivhlpstoffy Agree Want to get help to stop offending (SPCR)spcr_motivhlpstoffn Disagree Want to get help to stop offending (SPCR)spcr_attg General attitude to offending CRIME-PICS (SPCR)spcr_atta Anticipation of reoffending CRIME-PICS (SPCR)spcr_attv Victim hurt denial CRIME-PICS (SPCR)spcr_atte Evaluation of crime as worthwhile CRIME-PICS (SPCR)spcr_drug4wka Used class A drugs in the four weeks before custody (SPCR)spcr_drug4wkbc Used class BC drugs in the four weeks before custody (SPCR)spcr_drug4wkinj Injected illegal drugs in the four weeks before custody (SPCR)spcr_accomtrans Transient accommodation prior to custody (SPCR)spcr_accomrough Sleeping rough prior to custody (SPCR)spcr_edqual Educational (qualifications) attainment (SPCR)spcr_job4wk Was in paid work in the four weeks before custody (SPCR)
38
Logistic regression model
Table A1 Logistic regression model of prisoner characteristics influencing probability of treatment (ETS) and reconviction outcomes
Coefficient Standard error P-valueETS suitabilityNeed (thinking and behaviour) 0082 0027 0002Risk (OASys score) 0005 0003 0069Motivation to change behaviour (OASys) 0323 0122 0008Problems with readingwritingnumeracy -0303 0116 0009Problems with current psychiatric problems 0335 0131 0011
GenderMale Reference
categoryFemale 0736 0177 0000
Age -0030 0009 0000
Index offence typeOther Reference
categoryViolent 1223 0296 0000Sexual 2094 0389 0000Acquisitive 0243 0313 0438Drug 1192 0309 0000Robbery 1552 0329 0000
Motivation to stop offendingDisagreed with ldquoI want to get help to stop offendingrdquo all other responses
Reference category
Agreed with ldquoI want to get help to stop offendingrdquo
0315 0091 0001
Offending-related attitudesVictim hurt denial 0078 0026 0003
Drug useUsed Class BC drugs in the 4 weeks before custody
-0195 0150 0193
AccommodationStable accommodation prior to custody Reference
categoryTemporary accommodation prior to custody Reference
categorySleeping rough prior to custody -0709 0409 0083
Constant -4933 0554 0000Notes Number of observations = 2771 (257 treated 2514 untreated) Pseudo R2 = 00958 LR
chi2(16)=16397 probgtchi2 00000
39
Calculation of the average treatment effect on the treated (ATT)
Outcome measures
pnc_reconvind Indicator of reconviction within one yearpnc_reofffreq Frequency of proven reoffending within one yearpnc_reconvindsev Indicator of severe offence reconviction within one year
Table A2 Average treatment effect on the treated (ATT)
Variable Sample Treated Controls(Difference)
ATTa
Standard error t-stat
pnc_reconvind Unmatched 0272 0370 (-0098) 0031 -311Matched ATT 0272 0335 -0062 0031 -204
pnc_reofffreq Unmatched 0607 1422 (-0815) 0182 -447Matched ATT 0607 1208 -0601 0110 -547
pnc_reconvindsev Unmatched 0008 0007 (0001) 0006 011Matched ATT 0008 0009 -0001 0006 -013
a ATT is the difference between the mean outcome of the treatment group and the matched control group
40
Tests of covariate balancing
Table A3 Means standardised bias reduction and t-tests for equality of means in the treatment and control groups before and after matching
Variable SampleMean
bias bias
reductiont-test
Treatment Control t pgttoasys_need Unmatched 7381 6703 203 299 000
Matched 7381 7269 34 834 039 070oasys_score Unmatched 77335 75658 48 070 049
Matched 77335 77060 08 836 009 093oasys_motiv Unmatched 1210 1141 110 165 010
Matched 1210 1201 15 864 017 087oasys_litnum Unmatched 0350 0416 -102 -150 013
Matched 0350 0361 -17 830 -020 084oasys_lrndiff Unmatched 0187 0184 05 008 094
Matched 0187 0180 13 -1510 014 089oasys_psychgl Unmatched 0486 0426 89 139 017
Matched 0486 0499 -19 791 -020 084oasys_psychtr Unmatched 0237 0142 194 327 000
Matched 0237 0224 27 861 028 078spcr_genderf Unmatched 0214 0124 243 408 000
Matched 0214 0199 39 838 041 068spcr_age Unmatched 28008 30216 -238 -349 000
Matched 28008 28364 -38 839 -046 065spcr_marst_mar Unmatched 0070 0093 -84 -123 022
Matched 0070 0075 -19 776 -023 082spcr_marst_lvp Unmatched 0296 0256 90 140 016
Matched 0296 0250 103 -149 117 024spcr_ethnic_mix Unmatched 0062 0038 110 187 006
Matched 0062 0040 100 92 112 026spcr_ethnic_as Unmatched 0047 0041 28 044 066
Matched 0047 0035 57 -1056 067 050spcr_ethnic_bl Unmatched 0035 0065 -137 -189 006
Matched 0035 0063 -127 76 -145 015spcr_ethnic_oth Unmatched 0000 0004 -89 -101 031
Matched 0000 0002 -51 431 -076 045pnc_copas Unmatched -0902 -0880 -27 -040 069
Matched -0902 -0910 10 644 011 091pnc_ttlprevconv Unmatched 10946 12746 -163 -227 002
Matched 10946 11580 -57 648 -069 049pnc_ttlprevconv2 Unmatched 212140 314300 -133 -163 010
Matched 212140 257960 -60 552 -082 041pnc_ttlprevconvsev
Unmatched 0132 0146 -34 -050 062Matched 0132 0165 -79 -1300 -087 039
pnc_ttlprevconvsev2
Unmatched 0163 0209 -57 -074 046Matched 0163 0239 -95 -657 -102 031
41
Variable SampleMean
bias bias
reductiont-test
Treated Control t pgttpnc_index_vio Unmatched 0327 0245 182 288 000
Matched 0327 0311 36 804 039 070pnc_index_sxl Unmatched 0078 0040 162 286 000
Matched 0078 0078 -03 982 -003 098pnc_index_acq Unmatched 0175 0303 -302 -430 000
Matched 0175 0195 -46 847 -057 057pnc_index_drg Unmatched 0218 0195 57 088 038
Matched 0218 0211 16 718 018 086pnc_index_rob Unmatched 0144 0065 261 469 000
Matched 0144 0133 37 858 037 071spcr_famconv Unmatched 0463 0403 121 185 006
Matched 0463 0433 60 503 067 050spcr_fampris Unmatched 0396 0334 129 200 005
Matched 0396 0354 88 322 098 033spcr_motivstoffy Unmatched 1720 1670 93 139 017
Matched 1720 1719 01 985 002 099spcr_motivstoffn Unmatched 0016 0010 40 065 052
Matched 0016 0007 58 -453 069 049spcr_motivhlpstoffy
Unmatched 1346 1085 338 498 000Matched 1346 1304 55 836 065 052
spcr_motivhlpstoffn
Unmatched 0097 0164 -166 -234 002Matched 0097 0107 -25 850 -031 076
spcr_attg Unmatched 58131 57962 23 033 074Matched 58131 58212 -11 518 -012 091
spcr_atta Unmatched 18393 18516 -50 -073 047Matched 18393 18547 -63 -257 -068 050
spcr_attv Unmatched 11825 10907 321 454 000Matched 11825 11681 50 843 061 054
spcr_atte Unmatched 13996 13809 60 092 036Matched 13996 13871 40 331 045 066
spcr_drug4wka Unmatched 0381 0419 -77 -118 024Matched 0381 0408 -55 289 -062 053
spcr_drug4wkbc Unmatched 0494 0499 -10 -015 088Matched 0494 0486 16 -637 019 085
spcr_drug4wkinj Unmatched 0109 0155 -135 -194 005Matched 0109 0143 -99 265 -114 025
spcr_accomtrans Unmatched 0054 0052 12 019 085Matched 0054 0058 -17 -360 -018 085
spcr_accomrough Unmatched 0027 0054 -138 -188 006Matched 0027 0032 -23 835 -030 076
spcr_edqual Unmatched 1965 1893 36 054 059Matched 1965 1915 25 308 028 078
spcr_job4wk Unmatched 0346 0331 32 049 062Matched 0346 0331 32 17 036 072
Figure A1 Risk OASys total weighted score (OASys) by treatment and control groups
Risk OASys weighted score
8
6
4
2
Per c
ent
Control
0
8
6
4
2
Per c
ent
Treatment
050 100 150 50 100 150
42
Distributions of matching variables by treatment and control groups
Table A4 Need Sum of OASys Section 11 Thinking and Behaviour scores (OASys) by treatment and control groups
Summed scoreControl Treatment
n Valid n Valid 0 111 44 44 1 04 041 89 35 35 6 23 232 126 50 50 11 43 433 156 62 62 13 51 514 219 87 87 24 93 935 234 93 93 19 74 746 262 104 104 23 89 897 281 112 112 37 144 1448 253 101 101 30 117 1179 211 84 84 29 113 11310 184 73 73 15 58 5811 147 58 58 18 70 7012 117 47 47 17 66 6613 62 25 25 7 27 2714 62 25 25 7 27 27Missing 0 00 0 00Total 2514 1000 1000 257 1000 1000Note Control group frequencies are unweighted (a weighted average of controls within the radius calliper is
used in the matching algorithm)
43
Table A5 Motivation to change behaviour (OASys) by treatment and control groups
RatingControl Treatment
n Valid n Valid Not at all 367 146 146 28 109 109Quite motivated 1426 567 567 147 572 572Very motivated 721 287 287 82 319 319Missing 0 00 0 00Total 2514 1000 1000 257 1000 1000Note Control group frequencies are unweighted (a weighted average of controls within the radius calliper is
used in the matching algorithm)
Table A6 Problems with readingwritingnumeracy (OASys) by treatment and control groups
ExtentControl Treatment
n Valid n Valid No problems 1735 690 690 187 728 728Some problems 512 204 204 50 195 195Significant problems 267 106 106 20 78 78Missing 0 00 0 00Total 2514 1000 1000 257 1000 1000Note Control group frequencies are unweighted (a weighted average of controls within the radius calliper is
used in the matching algorithm)
Table A7 Problems with learning difficulties (OASys) by treatment and control groups
ExtentControl Treatment
n Valid n Valid No problems 2185 869 869 226 879 879Some problems 195 78 78 14 54 54Significant problems 134 53 53 17 66 66Missing 0 00 0 00Total 2514 1000 1000 257 1000 1000Note Control group frequencies are unweighted (a weighted average of controls within the radius calliper is
used in the matching algorithm)
Table A8 Problems with current psychological problemsdepression (OASys) by treatment and control groups
Extent Control Treatment
n Valid n Valid No problems 1693 673 673 162 630 630Some problems 572 228 228 65 253 253Significant problems 249 99 99 30 117 117Missing 0 00 0 00Total 2514 1000 1000 257 1000 1000Note Control group frequencies are unweighted (a weighted average of controls within the radius calliper is
used in the matching algorithm)
Figure A2 Age (SPCR) by treatment and control groups
8
6
4
2
0
Per
cen
t
20 40 60 80
8
6
4
2
0
Per
cen
t
20 40 60 80Age (SPCR)
Control Treatment
44
Table A9 Problems with current psychiatric problems (OASys) by treatment and control groups
ExtentControl Treatment
n Valid n Valid No problems 2244 893 893 211 821 821Some problems 184 73 73 31 121 121Significant problems 86 34 34 15 58 58Missing 0 00 0 00Total 2514 1000 1000 257 1000 1000Note Control group frequencies are unweighted (a weighted average of controls within the radius calliper is
used in the matching algorithm)
Table A10 Gender (SPCR) by treatment and control groups
GenderControl Treatment
n Valid n Valid Male 2203 876 876 202 786 786Female 311 124 124 55 214 214Missing 0 00 0 00Total 2514 1000 1000 257 1000 1000Note Control group frequencies are unweighted (a weighted average of controls within the radius calliper is
used in the matching algorithm)
Figure A3 Copas rate on release (PNC) by treatment and control groups
10
5
0-4 -2 0 2
Per c
ent
10
5
0-4 -2 0 2
Per c
ent
COPAS rate on release (PNC)
Control Treatment
45
Table A11 Marital status (SPCR) by treatment and control groups
StatusControl Treatment
n Valid n Valid Married 234 93 93 18 70 70Living with partner 642 255 256 76 296 296Other 1636 651 651 163 634 634Missing 2 01 0 00Total 2514 1000 1000 257 1000 1000Note Control group frequencies are unweighted (a weighted average of controls within the radius calliper is
used in the matching algorithm)
Table A12 Ethnicity (SPCR) by treatment and control groups
Ethnic groupControl Treatment
n Valid n Valid Any White background 2142 852 852 220 856 856Any Mixed background 96 38 38 16 62 62Any Asian background 103 41 41 12 47 47Any Black background 163 65 65 9 35 35Any Other background 10 04 04 0 00 00Missing 0 00 0 00Total 2514 1000 1000 257 1000 1000Note Control group frequencies are unweighted (a weighted average of controls within the radius calliper is
used in the matching algorithm)
Figure A4 Total previous convictions (PNC) by treatment and control groups
30
20
10
050 100 150 200
30
20
10
050 100 150 200
Per c
ent
Per c
ent
Previous convictions (PNC)
Control Treatment
46
Table A13 Previous severe convictions (PNC) by treatment and control groups
NumberControl Treatment
n Valid n Valid 0 2205 877 877 227 883 8831 265 105 105 26 101 1012 34 14 14 4 16 163 5 02 02 0 00 004 5 02 02 0 00 00Missing 0 00 0 00Total 2514 1000 1000 257 1000 1000Note Control group frequencies are unweighted (a weighted average of controls within the radius calliper is
used in the matching algorithm)
Table A14 Grouped index offence type (PNC) by treatment and control groups
Offence type grouping
Control Treatmentn Valid n Valid
Other 384 153 153 15 58 58Violent 616 245 245 84 327 327Robbery 163 65 65 37 144 144Sexual 100 40 40 20 78 78Acquisitive 761 303 303 45 175 175Drug 490 195 195 56 218 218Missing 0 00 0 00Total 2514 1000 1000 257 1000 1000Note Control group frequencies are unweighted (a weighted average of controls within the radius calliper is
used in the matching algorithm)
47
Table A15 Family member has been convicted of a non-motoring offence (SPCR) by treatment and control groups
ResponseControl Treatment
n Valid n Valid No 1486 591 597 137 533 537Yes 1003 399 403 118 459 463Missing 25 10 2 08Total 2514 1000 1000 257 1000 1000Note Control group frequencies are unweighted (a weighted average of controls within the radius calliper is
used in the matching algorithm)
Table A16 Family member has been in prison (SPCR) by treatment and control groups
ResponseControl Treatment
n Valid n Valid No 1658 660 666 154 599 604Yes 831 331 334 101 393 396Missing 25 10 2 08Total 2514 1000 1000 257 1000 1000Note Control group frequencies are unweighted (a weighted average of controls within the radius calliper is
used in the matching algorithm)
Table A17 Agree Want to stop offending (SPCR) by treatment and control groups
ResponseControl Treatment
n Valid n Valid Other 101 40 40 9 35 35Agree 627 249 249 54 210 210Strongly agree 1786 710 710 194 755 755Missing 0 00 0 00Total 2514 1000 1000 257 1000 1000Note Control group frequencies are unweighted (a weighted average of controls within the radius calliper is
used in the matching algorithm)
Table A18 Disagree Want to stop offending (SPCR) by treatment and control groups
ResponseControl Treatment
n Valid n Valid Other 2498 994 994 254 988 988Disagree 7 03 03 2 08 08Strongly disagree 9 04 04 1 04 04Missing 0 00 0 00Total 2514 1000 1000 257 1000 1000Note Control group frequencies are unweighted (a weighted average of controls within the radius calliper is used in the matching algorithm)
Figure A5 General attitude to offending CRIME-PICS (SPCR) by treatment and control groups
15
10
5
020 40 60 80
Per c
ent
Control15
10
5
020 40 60 80
Per c
ent
Treatment
General attitude to offending CRIME-PICS (SPCR)
48
Table A19 Agree Want to get help to stop offending (SPCR) by treatment and control groups
ResponseControl Treatment
n Valid n Valid Other 725 288 288 40 156 156Agree 851 339 339 88 342 342Strongly agree 938 373 373 129 502 502Missing 0 00 0 00Total 2514 1000 1000 257 1000 1000Note Control group frequencies are unweighted (a weighted average of controls within the radius calliper is
used in the matching algorithm)
Table A20 Disagree Want to get help to stop offending (SPCR) by treatment and control groups
ResponseControl Treatment
n Valid n Valid Other 2174 865 865 237 922 922Disagree 268 107 107 15 58 58Strongly disagree 72 29 29 5 19 19Missing 0 00 0 00Total 2514 1000 1000 257 1000 1000Note Control group frequencies are unweighted (a weighted average of controls within the radius calliper is
used in the matching algorithm)
49
Table A21 Anticipation of reoffending CRIME-PICS (SPCR) by treatment and control groups
ScoreControl Treatment
n Valid n Valid 8 2 01 01 0 00 009 1 00 00 0 00 0010 3 01 01 1 04 0411 6 02 03 0 00 0012 14 06 06 1 04 0413 27 11 11 4 16 1614 46 18 19 8 31 3315 113 45 48 9 35 3716 201 80 85 18 70 7417 276 110 116 30 117 12318 628 250 265 65 253 26619 371 148 156 44 171 18020 287 114 121 30 117 12321 145 58 61 13 51 5322 106 42 45 9 35 3723 71 28 30 5 19 2024 29 12 12 2 08 0825 17 07 07 2 08 0826 14 06 06 2 08 0827 7 03 03 1 04 0428 3 01 01 0 00 0029 1 00 00 0 00 0030 6 02 03 0 00 00Missing 140 56 13 51Total 2514 1000 1000 257 1000 1000Note Control group frequencies are unweighted (a weighted average of controls within the radius calliper is
used in the matching algorithm)
50
Table A22 Victim hurt denial CRIME-PICS (SPCR) by treatment and control groups
ScoreControl Treatment
n Valid n Valid 3 69 27 27 2 08 084 47 19 19 2 08 085 59 23 23 1 04 046 136 54 54 6 23 237 104 41 41 4 16 168 155 62 62 14 54 549 129 51 51 20 78 7810 241 96 96 19 74 7411 133 53 53 8 31 3112 664 264 264 77 300 30013 257 102 102 38 148 14814 196 78 78 22 86 8615 324 129 129 44 171 171Missing 0 00 0 00Total 2514 1000 1000 257 1000 1000Note Control group frequencies are unweighted (a weighted average of controls within the radius calliper is
used in the matching algorithm)
Table A23 Evaluation of crime as worthwhile CRIME-PICS (SPCR) by treatment and control groups
ScoreControl Treatment
n Valid n Valid 4 1 00 00 1 04 045 5 02 02 1 04 046 16 06 06 2 08 087 26 10 11 2 08 088 68 27 28 4 16 169 96 38 39 9 35 3510 177 70 72 21 82 8311 197 78 80 13 51 5112 270 107 109 31 121 12213 235 93 95 24 93 9414 328 130 133 33 128 13015 266 106 108 24 93 9416 276 110 112 27 105 10617 229 91 93 24 93 9418 115 46 47 20 78 7919 94 37 38 12 47 4720 70 28 28 6 23 24Missing 45 18 3 12Total 2514 1000 1000 257 1000 1000Note Control group frequencies are unweighted (a weighted average of controls within the radius calliper is
used in the matching algorithm)
51
Table A24 Used class A drugs in the four weeks before custody (SPCR) by treatment and control groups
ResponseControl Treatment
n Valid n Valid No 1460 581 581 159 619 619Yes 1054 419 419 98 381 381Missing 0 00 0 00Total 2514 1000 1000 257 1000 1000Note Control group frequencies are unweighted (a weighted average of controls within the radius calliper is
used in the matching algorithm)
Table A25 Used class BC drugs in the four weeks before custody (SPCR) by treatment and control groups
ResponseControl Treatment
n Valid n Valid No 1259 501 501 130 506 506Yes 1255 499 499 127 494 494Missing 0 00 0 00Total 2514 1000 1000 257 1000 1000Note Control group frequencies are unweighted (a weighted average of controls within the radius calliper is
used in the matching algorithm)
Table A26 Injected illegal drugs in the four weeks before custody (SPCR) by treatment and control groups
ResponseControl Treatment
n Valid n Valid No 2121 844 845 228 887 891Yes 389 155 155 28 109 109Missing 4 02 1 04Total 2514 1000 1000 257 1000 1000Note Control group frequencies are unweighted (a weighted average of controls within the radius calliper is
used in the matching algorithm)
Table A27 Accommodation prior to custody (SPCR) by treatment and control groups
TypeControl Treatment
n Valid n Valid Stable accommodation 2247 894 894 236 918 918Transient accommodation 130 52 52 14 54 54Sleeping rough 137 54 54 7 27 27Missing 0 00 0 00Total 2514 1000 1000 257 1000 1000Note Control group frequencies are unweighted (a weighted average of controls within the radius calliper is
used in the matching algorithm)
52
Table A28 Educational (qualifications) attainment (SPCR) by treatment and control groups
Highest qualification attained
Control Treatment
n Valid
n Valid
No qualifications 1099 437 441 99 385 388Other qualifications (incl overseas) 66 26 26 7 27 27O levelGCSE grade D-G (or similar qualification) 372 148 149 47 183 184O levelGCSE Grades A-C (or similar qualification) 507 202 204 61 237 239Trade apprenticeships 87 35 35 6 23 24AAS levels 220 88 88 21 82 82Higher education diploma 57 23 23 11 43 43First degreepostgraduate degree 70 28 28 2 08 08Higher degreepostgraduate degree 13 05 05 1 04 04Missing 23 09 2 08Total 2514 1000 1000 257 1000 1000Note Control group frequencies are unweighted (a weighted average of controls within the radius calliper is
used in the matching algorithm)
Table A29 Was in paid work in the four weeks before custody (SPCR) by treatment and control groups
ResponseControl Treatment
n Valid n Valid No 1681 669 669 168 654 654Yes 832 331 331 89 346 346Missing 1 00 0 00Total 2514 1000 1000 257 1000 1000Note Control group frequencies are unweighted (a weighted average of controls within the radius calliper is
used in the matching algorithm)
Table A30 Reconviction indicator one-year (PNC) by treatment and control groups
IndicatorControl Treatment
n Valid n Valid No 1584 630 630 187 728 728Yes 930 370 370 70 272 272Missing 0 00 0 00Total 2514 1000 1000 257 1000 1000Note Control group frequencies are unweighted (a weighted average of controls within the radius calliper is
used in the matching algorithm)
53
Table A31 Frequency of reoffending one-year (PNC) by treatment and control groups
IndicatorControl Treatment
n Valid n Valid 0 1584 630 630 187 728 7281 495 197 197 54 210 2102 203 81 81 11 43 433 117 47 47 3 12 124 53 21 21 1 04 045 33 13 13 1 04 046 8 03 03 0 00 007 7 03 03 0 00 008 6 02 02 0 00 009 1 00 00 0 00 0010 2 01 01 0 00 0011 2 01 01 0 00 0013 0 00 00 0 00 0015 1 00 00 0 00 0018 1 00 00 0 00 0032 1 00 00 0 00 00Missing 0 00 0 00Total 2514 1000 1000 257 1000 1000Note Control group frequencies are unweighted (a weighted average of controls within the radius calliper is
used in the matching algorithm)
54
Table A32 Frequency of reoffences one-year (PNC) by treatment and control groups
IndicatorControl Treatment
n Valid n Valid 0 1584 630 630 187 728 7281 272 108 108 31 121 1212 181 72 72 15 58 583 117 47 47 15 58 584 91 36 36 2 08 085 65 26 26 3 12 126 42 17 17 2 08 087 38 15 15 1 04 048 32 13 13 1 04 049 20 08 08 0 00 0010 19 08 08 0 00 0011 15 06 06 0 00 0012 11 04 04 0 00 0013 6 02 02 0 00 0014 6 02 02 0 00 0015 5 02 02 0 00 0016 1 00 00 0 00 0017 0 00 00 0 00 0018 1 00 00 0 00 0019 1 00 00 0 00 0020 1 00 00 0 00 0021 2 01 01 0 00 0022 2 01 01 0 00 0025 1 00 00 0 00 0039 1 00 00 0 00 00Missing 0 00 0 00Total 2514 1000 1000 257 1000 1000Note Control group frequencies are unweighted (a weighted average of controls within the radius calliper is
used in the matching algorithm)
Table A33 Severe offences reconviction indicator one-year (PNC) by treatment and control groups
IndicatorControl Treatment
n Valid n Valid No 2496 993 993 255 992 992Yes 18 07 07 2 08 08Missing 0 00 0 00Total 2514 1000 1000 257 1000 1000Note Control group frequencies are unweighted (a weighted average of controls within the radius calliper is
used in the matching algorithm)
Ministry of Justice Research Series 1910Evaluation of the impact of the HM Prison Service Enhanced Thinking Skills programme on reoffendingThis research examined the impact of the Enhanced Thinking Skills (ETS) programme on the one-year reconviction outcomes of 257 prison-based participants between 2006 and 2008 Radius propensity score matching was used to match a comparison group that had no statistically significant difference (at the means) to the treatment group on any matching characteristic ETS was found to significantly reduce both the reconviction rate (six percentage points) and frequency (60 reoffences per 100 released prisoners) of general reoffending of participants No statistically significant impact was found on the severe offences reconviction rate Almost identical impacts were found for completers A stronger reduction in reconviction was found for participants meeting the suitability criteria Though the programme has been shown to be effective in practice the findings suggest that a stricter application of the targeting criteria might have further enhanced the effectiveness of the programme
ISBN 978 1 84099 418 6copy Crown copyrightProduced by the Ministry of JusticeAlternative format versions of this report are available on requestE-mail researchjusticegsigovukhttpwwwjusticegovukpublicationsresearchhtm
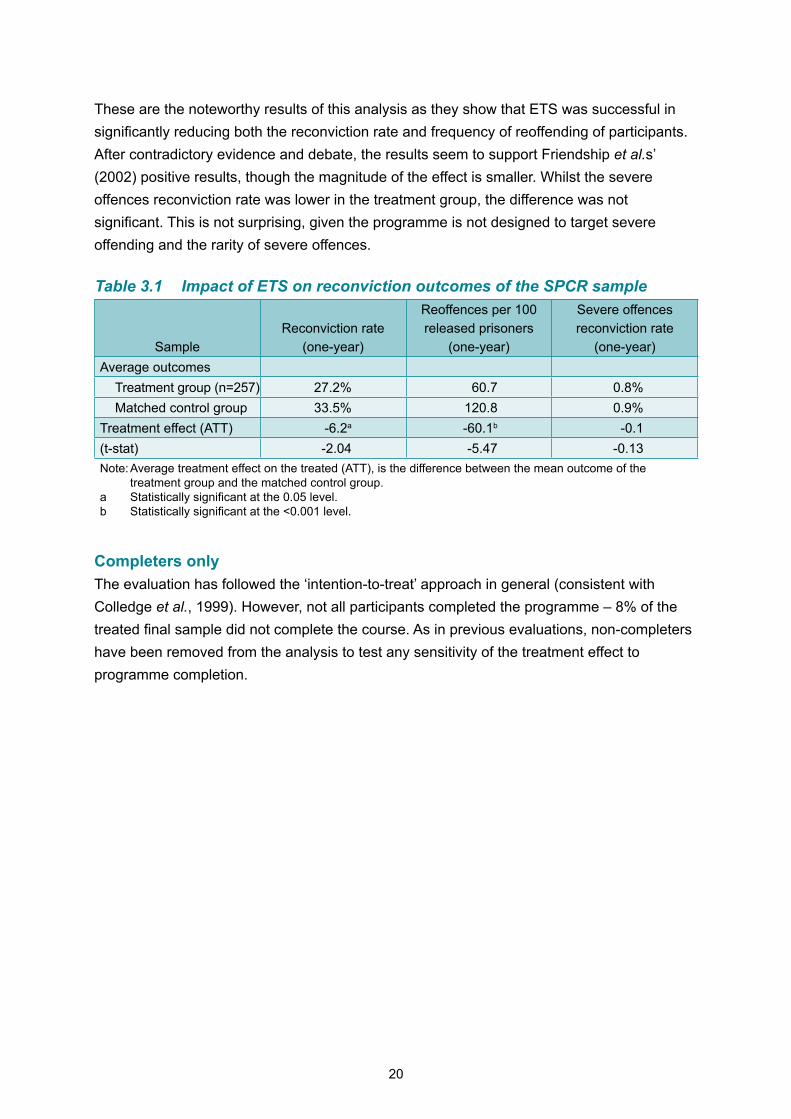
20
These are the noteworthy results of this analysis as they show that ETS was successful in significantly reducing both the reconviction rate and frequency of reoffending of participants After contradictory evidence and debate the results seem to support Friendship et alsrsquo (2002) positive results though the magnitude of the effect is smaller Whilst the severe offences reconviction rate was lower in the treatment group the difference was not significant This is not surprising given the programme is not designed to target severe offending and the rarity of severe offences
Table 31 Impact of ETS on reconviction outcomes of the SPCR sample
SampleReconviction rate
(one-year)
Reoffences per 100 released prisoners
(one-year)
Severe offences reconviction rate
(one-year)Average outcomes
Treatment group (n=257) 272 607 08Matched control group 335 1208 09
Treatment effect (ATT) -62a -601b -01(t-stat) -204 -547 -013Note Average treatment effect on the treated (ATT) is the difference between the mean outcome of the
treatment group and the matched control groupa Statistically significant at the 005 levelb Statistically significant at the lt0001 level
Completers only
The evaluation has followed the lsquointention-to-treatrsquo approach in general (consistent with Colledge et al 1999) However not all participants completed the programme ndash 8 of the treated final sample did not complete the course As in previous evaluations non-completers have been removed from the analysis to test any sensitivity of the treatment effect to programme completion
21
The results are summarised in Table 32 showing an almost identical though not statistically significant reduction in the rate of reconviction for completers when drop-outs were excluded The loss in significance was most likely due to the reduction in the size of the sample The statistically significant reduction in the frequency of reoffending was retained with an almost identical effect size No significant impact was again found for the severe offences reconviction rate
Table 32 Impact of ETS on reconviction outcomes of the SPCR sample completers only
SampleReconviction rate (one-
year)
Reoffences per 100 released prisoners
(one-year)
Severe offences reconviction rate
(one-year)Average outcomesTreatment group (n=237) 270 599 08Matched control group 335 1208 09Treatment effect (ATT) -65 -609a 00(t-stat) -156 -321 -001Note Average treatment effect on the treated (ATT) is the difference between the mean outcome of the
treatment group and the matched control groupa Statistically significant at the 001 level
Completers of intervention programmes are often found to have a stronger effect than non-completers This may be due to a self-selection effect whereby completers may be more motivated or have fewer needs or have a lower risk of reoffending Therefore effectiveness of the programme should not be evaluated against completers alone whose outcomes may have been better even without the intervention Rather the true effect of the intervention as it is used in practice should be evaluated by considering all participants both completers and non-completers (Colledge et al 1999 National Offender Management Service 2005) Accordingly more weight should be placed on the findings for all participants
Assessment of suitability targeting
The HM Prison Service guidance to assess suitability for ETS and other OBPs notes
ldquoOne of the principles of effective interventions is appropriate targeting An offender is more likely to benefit from participation in an offending behaviour programme if heshe demonstrates levels of risk and need that are appropriate for the particular interventionrdquo51
To facilitate appropriate targeting HM Prison Service designed a set of risk need and responsivity suitability criteria to identify those prisoners that were most suitable for the programme These criteria were set out in the Context section Strict adherence to these criteria should ensure that ETS is appropriate and relevant for all participants
51 HM Prison Service (2007) p3
Figure 31 Need and risk score distributions for non-participant and ETS participant groups with suitability thresholds
Need Sum of OASys Section 11 Thinking and Behaviour scores (OASys)
Risk OASys total weighted score (OASys)
0
5
10
15
4 7 140
5
10
15
4 7 140 0
Per
cen
t
Per
cen
t
0
5
10
15
50 100 1500
Per
cen
t
0
5
10
15
50 100 1500
Per
cen
t
Non-participant
Non-participant
ETS participant
ETS participant
22
Need and risk requirements
The need and risk52 profiles of the participant and non-participant groups53 were compared The comparison is presented graphically in Figure 31 with needrisk ETS programme suitability thresholds marked with vertical red lines (observations to the right of the line rate as lsquosuitablersquo for ETS) In the case of need the dual thresholds of 7 or 4 (with at least one individual score of 2 indicating significant problems) are marked A single vertical red line for 56 and above is marked as the risk threshold
With regard to both need and risk the participant and non-participant distributions follow a broadly similar pattern The majority of the non-participant group had a needrisk profile that would have made them suitable for ETS This is good news for matching purposes as it means that similar prisoners at the pre-treatment stage could have been treated or remained untreated More importantly a lot of prisoners in the participant group fall to the left of the red vertical line in both charts ndash and so rated as lsquonot strictly suitablersquo for ETS
52 As the OASys data do not include OGRS2 it has only been possible to define suitability with respect to the OASys total weighted score This is not necessarily invalid as the guidance notes ldquoIf an offender passes the cut-off on one but not both scales [ie OGRS2 and OASys total weighted score] you can consider them to be suitable to progress to the needs assessment stagerdquo HM Prison Service (2007) p5
53 This analysis is based on the full sample of 3512 (316 participants and 3196 non-participants) and not the treatment and matched control groups
23
Further investigation of the need and risk (OASys total weighted score) scores revealed that only 58 of the participant group were suitable for ETS (met both need and risk requirements simultaneously) while 49 of the non-participant group would have been suitable (Table 33)
Table 33 ETS suitability criteria fulfilment non-participant and ETS participant groups
SuitabilityNon-participants ETS participants
N N Not strictly suitable for ETS 1629 510 134 424Strictly suitable for ETS 1567 490 182 576Total 3196 1000 316 1000NoteSuitability is defined with reference to risk (an OASys score 56 or above) and need (a total score of 7
or above and a total score of 4 or above with at least one individual score of 2 (indicating significant problems))
It is important to note some caveats to this analysis The suitability criteria for ETS have been reviewed and changed over time The ETS start dates of participants in the SPCR sample stretch from March 2006 to September 2008 whilst the specification of the risk tool as OGRS2 or OASys was only introduced in August 2007 (the Sentencing Planning Risk Predictor was used previously) Similarly this period covers a time when both a local semi-structured interview and the OASys assessment were sources of need information for programme staff As the programme did not itself change substantially during this period later indicators of suitability for the intervention are retrospectively relevant from a targeting perspective54 though the retrospective application of the later indicators provides no reflection of the accuracy in the application of the targeting criteria during the earlier period
There is also some flexibility allowed in the application of the suitability criteria individuals with an OASys or OGRS2 score within three points below the cut-off may be progressed to ETS and special considerations are made for indeterminate sentence prisoners and sex offenders The original indicator of criminogenic needs the ETS Semi-Structured Interview has gradually been replaced by OASys Section 11 scores as confirmed in later guidance (National Offender Management Service 2009)55
54 Assuming that amendments to the suitability identification tools over time represent improvements in targeting later indicators applied retrospectively are likely to provide a better indicator of suitability than older indicators Accordingly this analysis provides no reflection on the selection process of treatment managers at the time but rather a pure view of suitability of treated participants
55 later guidance also specified definition of risk groups suitable for ETS with reference to OGRS3 (score 50 or above)
24
Readiness and responsivity criteria
A similar comparative analysis was also carried out for the readiness and responsivity criteria The HM Prison Service (2007) guidance lists assessment items in the lsquoResponsivity Assessmentrsquo and lsquoReadiness Assessmentrsquo sections including intellectual ability literacy dyslexia mental and physical health psychopathic traits motivation to change behaviour disability However the guidance does not specify the data variables or the thresholds to be used To investigate these readiness and responsivity criteria the lsquoexclusion criteriarsquo for general offending programmes from the OASys Manual56 were used
Again the profiles of the participant and non-participant groups57 were compared with a similar pattern emerging Figure 32 plots the distributions side-by-side with the readiness and responsivity thresholds marked by red vertical lines (this time profiles to the right of the line are not strictly suited to ETS) As with the need and risk profiles the two distributions are unexpectedly similar with a number of the participant group recorded as lsquonot at allrsquo motivated or having lsquosignificant problemsrsquo More specifically of the participant group
109 were scored as lsquonot at allrsquo motivated to change their behaviour
74 had lsquosignificant problemsrsquo with readingwritingnumeracy
61 had lsquosignificant problemsrsquo with learning difficulties
103 had lsquosignificant problemsrsquo with current psychological problemsdepression and
58 had lsquosignificant problemsrsquo with current psychiatric problems
56 OASys development team (2001) p16757 This analysis is based on the full sample of 3512 (316 participants and 3196 non-participants) and not the
treatment and matched control groups
Figure 32 Readiness and responsivity score distributions for non-participant and ETS participant groups with suitability thresholds
0
20
40
60
Verymotivated
Quitemotivated
Not at all0
20
40
60
Verymotivated
Quitemotivated
Not at all
Per c
ent
Per c
ent
Non-participant ETS participant
Motivation (OASys)
0
50
100
No problems Someproblems
Significantproblems
Per c
ent
Non-participant
Problems with readingwritingnumeracy (OASys)
0No problems Some
problemsSignificantproblems
Per c
ent
ETS participant
020
6080
No problems Someproblems
Significantproblems
Per c
ent
Non-participant
Problems with learning difficulties (OASys)
0No problems Some
problemsSignificantproblems
Per c
ent
ETS participant
0
20
40
60
No problems Someproblems
Significantproblems
Per c
ent
Non-participant
Problems with current psychological probelmsdepression (OASys)
0
20
40
60
No problems Someproblems
Significantproblems
Per c
ent
ETS participant
4020
6080
40
50
100
0
50
100
No problems Someproblems
Significantproblems
Per c
ent
Non-participant
Problems with current psychological probelms (OASys)
0
50
100
No problems Someproblems
Significantproblems
Per c
ent
ETS participant
25
26
Analysis of treatment effect by suitability
To investigate the importance of adherence to the need and risk principles in participant targeting the reconviction outcomes of the treatment group were also analysed according to participant suitability As before suitability is defined with reference to risk (an OASys score 56 or above) and need (a total score of 7 or above and a total score of 4 or above with at least one individual score of 2 (indicating significant problems)) As there is some flexibility in the application of the criteria this is termed lsquostrict suitabilityrsquo
Of the treatment group 164 (64) were strictly suitable for ETS whereas 1404 (56) of the control group were strictly suitable The remainder of each group were not strictly suitable
The results of the analysis (Table 34) show that the one-year reconviction rate for strictly suitable treated offenders (172) was lower than that for not strictly suitable ones (329) Similarly the frequency of reoffending of strictly suitable offenders (398 reoffences) was also lower than that of the not strictly suitable offenders (726 reoffences)
Table 34 Impact of ETS on reconviction outcomes of the SPCR sample lsquonot strictly suitablersquo and lsquostrictly suitablersquo participants only
SampleReconviction rate
(one-year)
Reoffences per 100 released prisoners
(one-year)
Severe offences reconviction rate
(one-year)Not strictly suitable (n=93) 329 726 12Strictly suitable (n=164) 172 398 -
Caveats and limitations of the researchIt is important to note that the number of ETS-treated prisoners provided by SPCR (257) is a limited sample falling in the lower range of previous evaluation samples (from 114 to 2195 participants) as a result of a low intervention rate and missing data filters Results based on limited samples may not be reliable indicators of the wider population and in some cases the sample sizes may be too small to detect differences which may actually exist58 Tests of statistical significance are carried out on the results of this evaluation for this reason The low intervention rate means that there is a large pool (2514) from which to form a well-balanced matched control group It should also be noted that all SPCR data are self-reported
Whilst every effort has been made to remove the selection bias it is possible that an unmeasured bias may still remain uncontrolled Further checks revealed some differences between the treatment and control groups It was found that the average sentence length of the treatment group (975 days) was longer than that for the control group (727 days)
58 This caveat is more relevant where no effect is detected ndash in which case the correct conclusion may be that the sample was insufficient to detect an effect rather than that the intervention had no effect For a discussion of sample size detection power and reliability of reconviction rates please see Harper and Chitty (2004) p8
27
The possibility of multiple intervention participation has not been controlled for as the sample size did not permit such analysis Examination revealed that 6 of the treatment group and 2 of the control group had been on another accredited OBP during the SPCR sentence though both proportions are small It is also possible that prisoners may have participated on non-accredited OBPs or a substance misuse treatment during their SPCR sentence period which may have contributed to the observed treatment effect If the rate of participation in other programmes was higher in the ETS treated group the estimated treatment effect of ETS would represent a pooled effect of all treatments received and so may be overstated If the rate of participation in other programmes was higher in the ETS control group the estimated treatment effect of ETS may be understated
This evaluation has been limited to using one-year conviction rates as two-year reconviction outcome data will only become available in 12 monthsrsquo time Thus it is not possible at this time to conclude on the duration of the impact of ETS ndash that is to say whether the observed one-year effect endures two years on from release or whether it dissipates (as found by Cann et al 2003) It is planned to conduct a follow-up study of reconviction at the two-year post-release stage (please see the Further research section)
28
4 Implications
This report has evaluated the effectiveness of the prison-based ETS programme by linking participation to reconviction outcomes The evaluation results show that ETS was successful in significantly reducing both the reconviction rate and frequency of general reoffending of participants The most important implications of these results are outlined below
This research has added some clarity to the discordant evidence base on the effectiveness of ETS by improving on key methodological limitations of previous evaluation studies This provides a more solid evidence base of support on which to build intervention-based policy
The most important message for policy makers is that ETS the most frequently delivered offending behaviour programme over the past decade did work to significantly reduce reoffending in the short term (one year) at least This result should assist policy makers to prioritise and focus operational resources towards the most productive intervention efforts Though ETS has since been replaced by the Thinking Skills Programme (TSP) the results of this evaluation demonstrate that cognitive-behavioural OBPs can work to significantly reduce reoffending for offenders released from prison The findings are likely to be particularly relevant for TSP which represents a refresh and update of ETS in line with advances in theory and practice However these specific findings cannot be generalised to other cognitive-behavioural intervention programmes Each programme has its own distinct objectives delivery methods and targeted characteristics and so would require a discrete evaluation
For practitioners although the findings on reduced reconviction rates are encouraging and reflect a job well done there are also lessons to be learned A low adherence to the risk need and responsivity suitability criteria was found among those prisoners that actually received the programme between 2006 and 2008 This suggests that the programme was not always administered to the most suitable prisoners Given that research supports the importance of risk need and responsivity targeting for effective treatment (Hollin 1995 Taxman and Thanner 2006 Palmer et al 2009 Gendreau et al 2009 Andrews and Bonta 2010) and the finding of lower reconviction rates for strictly suitable prisoners this may have limited the effectiveness of the programme in reducing reoffending The fact that a significant reduction in reconviction was found in spite of this finding suggests that a stricter application of the targeting criteria might further enhance the effectiveness of the programme National Offender Management Service practitioners report that the accuracy of targeting has improved over time meaning that a similar evaluation of ETS in a later period (post-2008) or TSP might find an even more significant effect
29
Future researchers may be able to draw on the methodology developed for this research as a methodological blueprint for further evaluations The findings of this research could be complemented and enhanced by addressing some of the outstanding evidence gaps framed by a set of research questions and proposed research designs set out in the Further research section
30
5 Further research
Whilst this evaluation has added some clarity to the evidence base on the effectiveness of general cognitive-behavioural programmes evidence gaps remain These gaps are defined by the research questions listed below with suggested research designs that could provide robust answers to complement and enhance the findings in this paper
Duration of the reduction in reoffending effect Does ETS have a lasting impact or will the observed one-year effect have dissipated after two years as found by Cann et al (2003) It is planned to conduct a follow up study of the treated and matched control individuals of this evaluation two years after their release applying the same methodology to investigate the duration of the ETS impact in one yearrsquos time
Cost-effectiveness of the programme Is the cost of ETS provision justified by the observed reduction in reoffending The reduction in reoffences estimated in this evaluation could be used as the basis for a cost-benefit analysis of the ETS programme Linking the estimated reduction in reoffending to estimates of the social cost of criminal offences the avoided social costs of crime (the benefit) could be compared to data on the cost of ETS provision (estimated to be in the region of pound2000 per prisoner)59
Generalisability of the findings Would the observed effect be verified or even more significant in a larger sample By repeating the evaluation methodology but replacing SPCR variables with OASys data variables where possible the full population of prisoners undertaking ETS could be evaluated The downside to this approach is the compromised choice of data for dynamic risk factors Other benefits would be the ability to employ more matching variables and being able to evaluate some of the smaller accredited programmes This research could also be used as a methodological blueprint to evaluate substance misuse intervention programmes
What works for whom What are the characteristics of the prisoners that benefit most from ETS and other OBPs The difference in reconviction outcome for each treated prisoner compared with the matched control could be regressed on a range of treated prisonersrsquo characteristics to identify which kinds of offenders under which circumstances most benefit from undertaking ETS
The effectiveness of TSP Does ETSrsquos replacement the Thinking Skills Programme (TSP) have a lesser similar or greater impact on reconviction A similar evaluation methodology could be used to evaluate the effectiveness of TSP in reducing reconviction outcomes though this would not be possible for a couple of years as TSP was only introduced in 2009
59 Social Exclusion Unit (2002) p 81
31
Database of research findings What does the evidence base tell us about the effectiveness of ETS Policy makers are often influenced by the latest study to be published rather than the synthesised message of the collective body of evaluation research The formation and maintenance of a database of outcome studies could be used for systematic reviews and meta-analytic analysis to produce a comprehensive review of ETS efficacy to inform and guide policy makers and practitioners (for example see Tong and Farrington 2006)
In the longer term samples of the other cohort studies being conducted by MoJ ndash the probation sample of the Offender Management Community Cohort Study (OMCCS) and the juvenile offenders sample of the Juvenile Cohort Study (JCS) ndash could be similarly linked to the same management information databases (for example OASys) as linked to SPCR in this evaluation When combined with OASys assessment data and viewed as a collective database this would be the richest known single evidence base in existence on the static and dynamic factors involved in offending behaviour
32
6 Additional resources
Readers interested in researching further the issues and topics probed in this paper further may want to consult the following publications websites and other useful sources of information
HM Prison Service Offender Behaviour Programmes (OBPs) httpwwwhmprisonservicegovukadviceandsupportbeforeafterreleaseoffenderbehaviourprogrammes
Ministry of Justice Research httpwwwjusticegovukpublications
National Offender Management Service httpwwwjusticegovukaboutnomshtm
Correctional Services Accreditation Panel httpwwwjusticegovukaboutcorrectional-services-accreditationhtm
National Reducing Reoffending Delivery plan (National Offender Management Service (NOMS) website) httpnomsjusticegovuk
Social Exclusion Unit (Cabinet Office) httpwwwcabinetofficegovuksocial_exclusion_task_forceaspx
Office for National Statistics (ONS) httpwwwstatisticsgovuk
33
7 References
Andrews D A and Bonta J (2010) The psychology of criminal conduct (5th ed) New Providence NJ LexisNexis Matthew Bender
Blackburn R (1972) lsquoDimensions of hostility and aggression in abnormal offendersrsquo Journal
of Consulting and Clinical Psychology 38 pp 20ndash26
Caliendo M and Kopeinig S (2005) lsquoSome Practical Guidance for the Implementation of Propensity Score Matchingrsquo IZA Discussion Papers Series Discussion Paper No 1588 Institute for the Study of Labor (IZA)
Cann J Falshaw L Nugent F and Friendship C (2003) Understanding What Works
cognitive accredited skills programmes for adult men and young offenders Research Findings 226 London Home Office
Cann J (2006) Cognitive skills programmes impact on reducing reconviction among a
sample of female prisoners Home Office Research Study 276 London Home Office
Clarke A Simmonds R and Wydall S (2004) Delivering cognitive skills programmes in
prison a qualitative study Home Office Research Study 242 London Home Office
Clarke D A (2000) Theory Manual for Enhanced Thinking Skills Prepared for the Joint Prison Accreditation Panel London Home Office
Colledge M Collier P and Brand S (1999) Crime reduction programme and constructive
regimes in prison Programmes for offenders Guidance for evaluators Crime reduction programme ndash guidance note 2 Research Development and Statistics Directorate London Home Office
Copas J and Marshall P (1998) lsquoThe offender group reoffending scale A statistical reoffending score for use by probation officersrsquo Applied Statistics 47(1) 159ndash171
Dehejia RH and Wahba S (2002) lsquoPropensity Score-Matching Methods for Nonexperimental Causal Studiesrsquo Review of Economics and Statistics February 2002 Vol 84 No 1 pp 151ndash161
Eysenck S B and McGurk B J (1980) lsquoImpulsiveness and venturesomeness in a detention centre populationrsquo Psychological Reports 47 pp 1299ndash1306
34
Falshaw L Friendship C Travers R and Nugent F (2003) Searching for what works An
evaluation of cognitive skills programmes Home Office Research Study 206 London Home Office
Falshaw L Friendship C Blud L Travers R and Nugent F (2004) lsquoSearching for what works HM Prison Service accredited cognitive skills coursesrsquo British Journal of Forensic
Practice 6 (2) pp 3ndash13
Friendship C Blud L Erikson M and Travers R (2002) An evaluation of cognitive
behavioural treatment for prisoners Home Office Research Study 161 London Home Office
Frude N Honess T and Maguire M (1994) CRIME-PICS II Manual Cardiff Michael and Associates
Gendreau P Smith P and Theacuteriault YL (2009) lsquoChaos theory and correctional treatment Common sense correctional quackery and the law of fartcatchersrsquo Journal of Contemporary
Criminal Justice 25 384ndash396
Harper G and Chitty C (eds) (2004) The impact of corrections on re-offending A review of
lsquoWhat Worksrsquo (3rd ed) Home Office Research Study No 291 London Home Office
Heckman J and Smith J (1995) rsquoAssessing the Case for Social Experimentsrsquo Journal of
Economic Perspectives 9 85ndash110
HM Prison Service (2007) Assessing Suitability for Offending Behaviour Programmes Risk
Need amp Responsivity Guidance for Treatment Managers Offending Behaviour Programmes Unit HM Prison Service
Home Office (2006) A Five Year Strategy for Protecting the Public and Reducing Re-
offending London The Stationary Office
Hollin C R (1995) lsquoThe meaning and implications of ldquoprogramme integrityrdquorsquo In J McGuire (Ed) What works Reducing reoffending Guidelines from Research and Practice (pp 195ndash208) Chichester England John Wiley and Sons
Howard P (2009) Improving prediction of re-offending using the Offender Assessment
System Research Summary 209 London Ministry of Justice Available at httpwwwjusticegovukpublicationsdocsoasys-research-summary-02-09pdf
Howard P Francis B Soothill K and Humphreys L (2009) OGRS 3 the revised Offender
Group Reconviction Scale Research Summary 709 London Ministry of Justice
35
Leuven E and Sianesi B (2003) psmatch2 Stata module to perform full Mahalanobis and
propensity score matching common support graphing and covariate imbalance testing httpideasrepecorgcbocbocodes432001html version 315 2 May 2009
Mak A S (1991) lsquoPsychosocial control characteristics of delinquents and nondelinquentsrsquo Criminal Justice and Behaviour 18 (3) pp 297ndash303
McDougall C Clarbour J Perry A and Bowles R (2009) Evaluation of HM Prison Service
Enhanced Thinking Skills Programme Report on the implementation of a randomised
controlled trial London Ministry of Justice
McDougall C Clarbour J Perry A and Bowles R (2009) Evaluation of HM Prison Service
Enhanced Thinking Skills Programme Report on the outcomes of a randomised controlled
trial London Ministry of Justice
Ministry of Justice (2009) The Correctional Services Accreditation Panel Report 2008-
2009 Available at httpwwwjusticegovukpublicationsdocscorrectional-services-report-20080-09pdf
Ministry of Justice (2010) Reoffending of adults results from the 2008 cohort ndash England and
Wales Ministry of Justice Statistics bulletin London Ministry of Justice Available at httpwwwjusticegovukpublicationsdocsreoffending-adults-2008-cohortpdf
National Offender Management Service (2005) Understanding research methods and
findings lsquoWhat Worksrsquo Briefing 305 Available at httprdshomeofficegovukrdspdfs05wwbn3pdf
National Offender Management Service (2009) Suitability for Accredited Interventions Risk
Need amp Responsivity Targeting Criteria for Offender Managers and Treatment Managers
Interventions and Substance Misuse Group Directorate of Commissioning and Operational Policy National Offender Management Service May 2009
OASys Data Evaluation and Analysis Team O-DEAT (2010) OASys caveats notes and
limitations ndash layered OASys (May 10)
OASys development team (2001) Offender Assessment System OASys User Manual OASys Manual V2 Crown Copyright 2002
Palmer EJ McGuire J Hatcher RM Hounsome JC Bilby CAL and Hollin CR (2009) lsquoAllocation to offending behavior programs in the English and Welsh probation servicersquo Criminal Justice and Behavior 36 909ndash922
36
Rosenbaum P R and Rubin D B (1983) lsquoThe Central Role of the Propensity Score in Observational Studies for Causal Effectsrsquo Biometrika 70 41ndash55
Smith J and Todd P (2005) rsquoDoes matching overcome LaLondersquos critique of nonexperimental estimatorsrsquo Journal of Econometrics Elsevier vol 125(1-2) pages 305ndash353
Social Exclusion Unit (2002) Reducing re-offending by ex-prisoners Available from httpwwwcabinetofficegovukmediacabinetofficesocial_exclusion_task_forceassetspublications_1997_to_2006reducing_reportpdf
Stewart D (2008) The problems and needs of newly sentenced prisoners results from a
national survey Ministry of Justice Research Series 1608 Published online at httpwwwjusticegovukpublicationsresearch2008htm
Taxman FS and Thanner M (2006) lsquoRisk need and responsivity (RNR) It all dependsrsquo Crime and Delinquency 52 28ndash51
Tong LSJ and Farrington DP (2006) lsquoHow effective is the ldquoReasoning and Rehabilitationrdquo programme in reducing reoffending A meta-analysis of evaluations in four countriesrsquo Psychology Crime and Law 12 3ndash24
37
Appendix 1 Technical annex
Full set of matching variables (covariates)Programme suitability criteriaoasys_need Need Sum of OASys Section 11 Thinking and Behaviour scores
(OASys)oasys_score Risk OASys total weighted score (OASys)oasys_motiv Motivation to change behaviour (OASys)oasys_litnum Problems with readingwritingnumeracy (OASys)oasys_lrndiff Problems with learning difficulties (OASys)oasys_psychgl Problems with current psychological problemsdepression (OASys)oasys_psychtr Problems with current psychiatric problems (OASys)
Static risk factorsspcr_genderf Gender Female (SPCR)spcr_age Age (SPCR)spcr_marst_mar Marital status Married (SPCR)spcr_marst_lvp Marital status Living with a partner (SPCR)spcr_ethnic_mix Ethnicity Any Mixed background (SPCR)spcr_ethnic_as Ethnicity Any Asian background (SPCR)spcr_ethnic_bl Ethnicity Any Black background (SPCR)spcr_ethnic_oth Ethnicity Any Other background (SPCR)pnc_copas Copas rate on release (PNC)pnc_ttlprevconv Previous convictions (PNC)pnc_ttlprevconv2 Previous convictions squared (PNC)pnc_ttlprevconvsev Previous severe convictions (PNC)pnc_ttlprevconvsev2 Previous severe convictions squared (PNC)pnc_index_vio Index offence type Violent (PNC)pnc_index_sxl Index offence type Sexual (PNC)pnc_index_acq Index offence type Acquisitive (PNC)pnc_index_drg Index offence type Drug (PNC)pnc_index_rob Index offence type Robbery (PNC)spcr_famconv Family member has been convicted of a non-motoring offence
(SPCR)spcr_fampris Family member has been in prison (SPCR)
Dynamic risk factorsspcr_motivstoffy Agree Want to stop offending (SPCR)spcr_motivstoffn Disagree Want to stop offending (SPCR)spcr_motivhlpstoffy Agree Want to get help to stop offending (SPCR)spcr_motivhlpstoffn Disagree Want to get help to stop offending (SPCR)spcr_attg General attitude to offending CRIME-PICS (SPCR)spcr_atta Anticipation of reoffending CRIME-PICS (SPCR)spcr_attv Victim hurt denial CRIME-PICS (SPCR)spcr_atte Evaluation of crime as worthwhile CRIME-PICS (SPCR)spcr_drug4wka Used class A drugs in the four weeks before custody (SPCR)spcr_drug4wkbc Used class BC drugs in the four weeks before custody (SPCR)spcr_drug4wkinj Injected illegal drugs in the four weeks before custody (SPCR)spcr_accomtrans Transient accommodation prior to custody (SPCR)spcr_accomrough Sleeping rough prior to custody (SPCR)spcr_edqual Educational (qualifications) attainment (SPCR)spcr_job4wk Was in paid work in the four weeks before custody (SPCR)
38
Logistic regression model
Table A1 Logistic regression model of prisoner characteristics influencing probability of treatment (ETS) and reconviction outcomes
Coefficient Standard error P-valueETS suitabilityNeed (thinking and behaviour) 0082 0027 0002Risk (OASys score) 0005 0003 0069Motivation to change behaviour (OASys) 0323 0122 0008Problems with readingwritingnumeracy -0303 0116 0009Problems with current psychiatric problems 0335 0131 0011
GenderMale Reference
categoryFemale 0736 0177 0000
Age -0030 0009 0000
Index offence typeOther Reference
categoryViolent 1223 0296 0000Sexual 2094 0389 0000Acquisitive 0243 0313 0438Drug 1192 0309 0000Robbery 1552 0329 0000
Motivation to stop offendingDisagreed with ldquoI want to get help to stop offendingrdquo all other responses
Reference category
Agreed with ldquoI want to get help to stop offendingrdquo
0315 0091 0001
Offending-related attitudesVictim hurt denial 0078 0026 0003
Drug useUsed Class BC drugs in the 4 weeks before custody
-0195 0150 0193
AccommodationStable accommodation prior to custody Reference
categoryTemporary accommodation prior to custody Reference
categorySleeping rough prior to custody -0709 0409 0083
Constant -4933 0554 0000Notes Number of observations = 2771 (257 treated 2514 untreated) Pseudo R2 = 00958 LR
chi2(16)=16397 probgtchi2 00000
39
Calculation of the average treatment effect on the treated (ATT)
Outcome measures
pnc_reconvind Indicator of reconviction within one yearpnc_reofffreq Frequency of proven reoffending within one yearpnc_reconvindsev Indicator of severe offence reconviction within one year
Table A2 Average treatment effect on the treated (ATT)
Variable Sample Treated Controls(Difference)
ATTa
Standard error t-stat
pnc_reconvind Unmatched 0272 0370 (-0098) 0031 -311Matched ATT 0272 0335 -0062 0031 -204
pnc_reofffreq Unmatched 0607 1422 (-0815) 0182 -447Matched ATT 0607 1208 -0601 0110 -547
pnc_reconvindsev Unmatched 0008 0007 (0001) 0006 011Matched ATT 0008 0009 -0001 0006 -013
a ATT is the difference between the mean outcome of the treatment group and the matched control group
40
Tests of covariate balancing
Table A3 Means standardised bias reduction and t-tests for equality of means in the treatment and control groups before and after matching
Variable SampleMean
bias bias
reductiont-test
Treatment Control t pgttoasys_need Unmatched 7381 6703 203 299 000
Matched 7381 7269 34 834 039 070oasys_score Unmatched 77335 75658 48 070 049
Matched 77335 77060 08 836 009 093oasys_motiv Unmatched 1210 1141 110 165 010
Matched 1210 1201 15 864 017 087oasys_litnum Unmatched 0350 0416 -102 -150 013
Matched 0350 0361 -17 830 -020 084oasys_lrndiff Unmatched 0187 0184 05 008 094
Matched 0187 0180 13 -1510 014 089oasys_psychgl Unmatched 0486 0426 89 139 017
Matched 0486 0499 -19 791 -020 084oasys_psychtr Unmatched 0237 0142 194 327 000
Matched 0237 0224 27 861 028 078spcr_genderf Unmatched 0214 0124 243 408 000
Matched 0214 0199 39 838 041 068spcr_age Unmatched 28008 30216 -238 -349 000
Matched 28008 28364 -38 839 -046 065spcr_marst_mar Unmatched 0070 0093 -84 -123 022
Matched 0070 0075 -19 776 -023 082spcr_marst_lvp Unmatched 0296 0256 90 140 016
Matched 0296 0250 103 -149 117 024spcr_ethnic_mix Unmatched 0062 0038 110 187 006
Matched 0062 0040 100 92 112 026spcr_ethnic_as Unmatched 0047 0041 28 044 066
Matched 0047 0035 57 -1056 067 050spcr_ethnic_bl Unmatched 0035 0065 -137 -189 006
Matched 0035 0063 -127 76 -145 015spcr_ethnic_oth Unmatched 0000 0004 -89 -101 031
Matched 0000 0002 -51 431 -076 045pnc_copas Unmatched -0902 -0880 -27 -040 069
Matched -0902 -0910 10 644 011 091pnc_ttlprevconv Unmatched 10946 12746 -163 -227 002
Matched 10946 11580 -57 648 -069 049pnc_ttlprevconv2 Unmatched 212140 314300 -133 -163 010
Matched 212140 257960 -60 552 -082 041pnc_ttlprevconvsev
Unmatched 0132 0146 -34 -050 062Matched 0132 0165 -79 -1300 -087 039
pnc_ttlprevconvsev2
Unmatched 0163 0209 -57 -074 046Matched 0163 0239 -95 -657 -102 031
41
Variable SampleMean
bias bias
reductiont-test
Treated Control t pgttpnc_index_vio Unmatched 0327 0245 182 288 000
Matched 0327 0311 36 804 039 070pnc_index_sxl Unmatched 0078 0040 162 286 000
Matched 0078 0078 -03 982 -003 098pnc_index_acq Unmatched 0175 0303 -302 -430 000
Matched 0175 0195 -46 847 -057 057pnc_index_drg Unmatched 0218 0195 57 088 038
Matched 0218 0211 16 718 018 086pnc_index_rob Unmatched 0144 0065 261 469 000
Matched 0144 0133 37 858 037 071spcr_famconv Unmatched 0463 0403 121 185 006
Matched 0463 0433 60 503 067 050spcr_fampris Unmatched 0396 0334 129 200 005
Matched 0396 0354 88 322 098 033spcr_motivstoffy Unmatched 1720 1670 93 139 017
Matched 1720 1719 01 985 002 099spcr_motivstoffn Unmatched 0016 0010 40 065 052
Matched 0016 0007 58 -453 069 049spcr_motivhlpstoffy
Unmatched 1346 1085 338 498 000Matched 1346 1304 55 836 065 052
spcr_motivhlpstoffn
Unmatched 0097 0164 -166 -234 002Matched 0097 0107 -25 850 -031 076
spcr_attg Unmatched 58131 57962 23 033 074Matched 58131 58212 -11 518 -012 091
spcr_atta Unmatched 18393 18516 -50 -073 047Matched 18393 18547 -63 -257 -068 050
spcr_attv Unmatched 11825 10907 321 454 000Matched 11825 11681 50 843 061 054
spcr_atte Unmatched 13996 13809 60 092 036Matched 13996 13871 40 331 045 066
spcr_drug4wka Unmatched 0381 0419 -77 -118 024Matched 0381 0408 -55 289 -062 053
spcr_drug4wkbc Unmatched 0494 0499 -10 -015 088Matched 0494 0486 16 -637 019 085
spcr_drug4wkinj Unmatched 0109 0155 -135 -194 005Matched 0109 0143 -99 265 -114 025
spcr_accomtrans Unmatched 0054 0052 12 019 085Matched 0054 0058 -17 -360 -018 085
spcr_accomrough Unmatched 0027 0054 -138 -188 006Matched 0027 0032 -23 835 -030 076
spcr_edqual Unmatched 1965 1893 36 054 059Matched 1965 1915 25 308 028 078
spcr_job4wk Unmatched 0346 0331 32 049 062Matched 0346 0331 32 17 036 072
Figure A1 Risk OASys total weighted score (OASys) by treatment and control groups
Risk OASys weighted score
8
6
4
2
Per c
ent
Control
0
8
6
4
2
Per c
ent
Treatment
050 100 150 50 100 150
42
Distributions of matching variables by treatment and control groups
Table A4 Need Sum of OASys Section 11 Thinking and Behaviour scores (OASys) by treatment and control groups
Summed scoreControl Treatment
n Valid n Valid 0 111 44 44 1 04 041 89 35 35 6 23 232 126 50 50 11 43 433 156 62 62 13 51 514 219 87 87 24 93 935 234 93 93 19 74 746 262 104 104 23 89 897 281 112 112 37 144 1448 253 101 101 30 117 1179 211 84 84 29 113 11310 184 73 73 15 58 5811 147 58 58 18 70 7012 117 47 47 17 66 6613 62 25 25 7 27 2714 62 25 25 7 27 27Missing 0 00 0 00Total 2514 1000 1000 257 1000 1000Note Control group frequencies are unweighted (a weighted average of controls within the radius calliper is
used in the matching algorithm)
43
Table A5 Motivation to change behaviour (OASys) by treatment and control groups
RatingControl Treatment
n Valid n Valid Not at all 367 146 146 28 109 109Quite motivated 1426 567 567 147 572 572Very motivated 721 287 287 82 319 319Missing 0 00 0 00Total 2514 1000 1000 257 1000 1000Note Control group frequencies are unweighted (a weighted average of controls within the radius calliper is
used in the matching algorithm)
Table A6 Problems with readingwritingnumeracy (OASys) by treatment and control groups
ExtentControl Treatment
n Valid n Valid No problems 1735 690 690 187 728 728Some problems 512 204 204 50 195 195Significant problems 267 106 106 20 78 78Missing 0 00 0 00Total 2514 1000 1000 257 1000 1000Note Control group frequencies are unweighted (a weighted average of controls within the radius calliper is
used in the matching algorithm)
Table A7 Problems with learning difficulties (OASys) by treatment and control groups
ExtentControl Treatment
n Valid n Valid No problems 2185 869 869 226 879 879Some problems 195 78 78 14 54 54Significant problems 134 53 53 17 66 66Missing 0 00 0 00Total 2514 1000 1000 257 1000 1000Note Control group frequencies are unweighted (a weighted average of controls within the radius calliper is
used in the matching algorithm)
Table A8 Problems with current psychological problemsdepression (OASys) by treatment and control groups
Extent Control Treatment
n Valid n Valid No problems 1693 673 673 162 630 630Some problems 572 228 228 65 253 253Significant problems 249 99 99 30 117 117Missing 0 00 0 00Total 2514 1000 1000 257 1000 1000Note Control group frequencies are unweighted (a weighted average of controls within the radius calliper is
used in the matching algorithm)
Figure A2 Age (SPCR) by treatment and control groups
8
6
4
2
0
Per
cen
t
20 40 60 80
8
6
4
2
0
Per
cen
t
20 40 60 80Age (SPCR)
Control Treatment
44
Table A9 Problems with current psychiatric problems (OASys) by treatment and control groups
ExtentControl Treatment
n Valid n Valid No problems 2244 893 893 211 821 821Some problems 184 73 73 31 121 121Significant problems 86 34 34 15 58 58Missing 0 00 0 00Total 2514 1000 1000 257 1000 1000Note Control group frequencies are unweighted (a weighted average of controls within the radius calliper is
used in the matching algorithm)
Table A10 Gender (SPCR) by treatment and control groups
GenderControl Treatment
n Valid n Valid Male 2203 876 876 202 786 786Female 311 124 124 55 214 214Missing 0 00 0 00Total 2514 1000 1000 257 1000 1000Note Control group frequencies are unweighted (a weighted average of controls within the radius calliper is
used in the matching algorithm)
Figure A3 Copas rate on release (PNC) by treatment and control groups
10
5
0-4 -2 0 2
Per c
ent
10
5
0-4 -2 0 2
Per c
ent
COPAS rate on release (PNC)
Control Treatment
45
Table A11 Marital status (SPCR) by treatment and control groups
StatusControl Treatment
n Valid n Valid Married 234 93 93 18 70 70Living with partner 642 255 256 76 296 296Other 1636 651 651 163 634 634Missing 2 01 0 00Total 2514 1000 1000 257 1000 1000Note Control group frequencies are unweighted (a weighted average of controls within the radius calliper is
used in the matching algorithm)
Table A12 Ethnicity (SPCR) by treatment and control groups
Ethnic groupControl Treatment
n Valid n Valid Any White background 2142 852 852 220 856 856Any Mixed background 96 38 38 16 62 62Any Asian background 103 41 41 12 47 47Any Black background 163 65 65 9 35 35Any Other background 10 04 04 0 00 00Missing 0 00 0 00Total 2514 1000 1000 257 1000 1000Note Control group frequencies are unweighted (a weighted average of controls within the radius calliper is
used in the matching algorithm)
Figure A4 Total previous convictions (PNC) by treatment and control groups
30
20
10
050 100 150 200
30
20
10
050 100 150 200
Per c
ent
Per c
ent
Previous convictions (PNC)
Control Treatment
46
Table A13 Previous severe convictions (PNC) by treatment and control groups
NumberControl Treatment
n Valid n Valid 0 2205 877 877 227 883 8831 265 105 105 26 101 1012 34 14 14 4 16 163 5 02 02 0 00 004 5 02 02 0 00 00Missing 0 00 0 00Total 2514 1000 1000 257 1000 1000Note Control group frequencies are unweighted (a weighted average of controls within the radius calliper is
used in the matching algorithm)
Table A14 Grouped index offence type (PNC) by treatment and control groups
Offence type grouping
Control Treatmentn Valid n Valid
Other 384 153 153 15 58 58Violent 616 245 245 84 327 327Robbery 163 65 65 37 144 144Sexual 100 40 40 20 78 78Acquisitive 761 303 303 45 175 175Drug 490 195 195 56 218 218Missing 0 00 0 00Total 2514 1000 1000 257 1000 1000Note Control group frequencies are unweighted (a weighted average of controls within the radius calliper is
used in the matching algorithm)
47
Table A15 Family member has been convicted of a non-motoring offence (SPCR) by treatment and control groups
ResponseControl Treatment
n Valid n Valid No 1486 591 597 137 533 537Yes 1003 399 403 118 459 463Missing 25 10 2 08Total 2514 1000 1000 257 1000 1000Note Control group frequencies are unweighted (a weighted average of controls within the radius calliper is
used in the matching algorithm)
Table A16 Family member has been in prison (SPCR) by treatment and control groups
ResponseControl Treatment
n Valid n Valid No 1658 660 666 154 599 604Yes 831 331 334 101 393 396Missing 25 10 2 08Total 2514 1000 1000 257 1000 1000Note Control group frequencies are unweighted (a weighted average of controls within the radius calliper is
used in the matching algorithm)
Table A17 Agree Want to stop offending (SPCR) by treatment and control groups
ResponseControl Treatment
n Valid n Valid Other 101 40 40 9 35 35Agree 627 249 249 54 210 210Strongly agree 1786 710 710 194 755 755Missing 0 00 0 00Total 2514 1000 1000 257 1000 1000Note Control group frequencies are unweighted (a weighted average of controls within the radius calliper is
used in the matching algorithm)
Table A18 Disagree Want to stop offending (SPCR) by treatment and control groups
ResponseControl Treatment
n Valid n Valid Other 2498 994 994 254 988 988Disagree 7 03 03 2 08 08Strongly disagree 9 04 04 1 04 04Missing 0 00 0 00Total 2514 1000 1000 257 1000 1000Note Control group frequencies are unweighted (a weighted average of controls within the radius calliper is used in the matching algorithm)
Figure A5 General attitude to offending CRIME-PICS (SPCR) by treatment and control groups
15
10
5
020 40 60 80
Per c
ent
Control15
10
5
020 40 60 80
Per c
ent
Treatment
General attitude to offending CRIME-PICS (SPCR)
48
Table A19 Agree Want to get help to stop offending (SPCR) by treatment and control groups
ResponseControl Treatment
n Valid n Valid Other 725 288 288 40 156 156Agree 851 339 339 88 342 342Strongly agree 938 373 373 129 502 502Missing 0 00 0 00Total 2514 1000 1000 257 1000 1000Note Control group frequencies are unweighted (a weighted average of controls within the radius calliper is
used in the matching algorithm)
Table A20 Disagree Want to get help to stop offending (SPCR) by treatment and control groups
ResponseControl Treatment
n Valid n Valid Other 2174 865 865 237 922 922Disagree 268 107 107 15 58 58Strongly disagree 72 29 29 5 19 19Missing 0 00 0 00Total 2514 1000 1000 257 1000 1000Note Control group frequencies are unweighted (a weighted average of controls within the radius calliper is
used in the matching algorithm)
49
Table A21 Anticipation of reoffending CRIME-PICS (SPCR) by treatment and control groups
ScoreControl Treatment
n Valid n Valid 8 2 01 01 0 00 009 1 00 00 0 00 0010 3 01 01 1 04 0411 6 02 03 0 00 0012 14 06 06 1 04 0413 27 11 11 4 16 1614 46 18 19 8 31 3315 113 45 48 9 35 3716 201 80 85 18 70 7417 276 110 116 30 117 12318 628 250 265 65 253 26619 371 148 156 44 171 18020 287 114 121 30 117 12321 145 58 61 13 51 5322 106 42 45 9 35 3723 71 28 30 5 19 2024 29 12 12 2 08 0825 17 07 07 2 08 0826 14 06 06 2 08 0827 7 03 03 1 04 0428 3 01 01 0 00 0029 1 00 00 0 00 0030 6 02 03 0 00 00Missing 140 56 13 51Total 2514 1000 1000 257 1000 1000Note Control group frequencies are unweighted (a weighted average of controls within the radius calliper is
used in the matching algorithm)
50
Table A22 Victim hurt denial CRIME-PICS (SPCR) by treatment and control groups
ScoreControl Treatment
n Valid n Valid 3 69 27 27 2 08 084 47 19 19 2 08 085 59 23 23 1 04 046 136 54 54 6 23 237 104 41 41 4 16 168 155 62 62 14 54 549 129 51 51 20 78 7810 241 96 96 19 74 7411 133 53 53 8 31 3112 664 264 264 77 300 30013 257 102 102 38 148 14814 196 78 78 22 86 8615 324 129 129 44 171 171Missing 0 00 0 00Total 2514 1000 1000 257 1000 1000Note Control group frequencies are unweighted (a weighted average of controls within the radius calliper is
used in the matching algorithm)
Table A23 Evaluation of crime as worthwhile CRIME-PICS (SPCR) by treatment and control groups
ScoreControl Treatment
n Valid n Valid 4 1 00 00 1 04 045 5 02 02 1 04 046 16 06 06 2 08 087 26 10 11 2 08 088 68 27 28 4 16 169 96 38 39 9 35 3510 177 70 72 21 82 8311 197 78 80 13 51 5112 270 107 109 31 121 12213 235 93 95 24 93 9414 328 130 133 33 128 13015 266 106 108 24 93 9416 276 110 112 27 105 10617 229 91 93 24 93 9418 115 46 47 20 78 7919 94 37 38 12 47 4720 70 28 28 6 23 24Missing 45 18 3 12Total 2514 1000 1000 257 1000 1000Note Control group frequencies are unweighted (a weighted average of controls within the radius calliper is
used in the matching algorithm)
51
Table A24 Used class A drugs in the four weeks before custody (SPCR) by treatment and control groups
ResponseControl Treatment
n Valid n Valid No 1460 581 581 159 619 619Yes 1054 419 419 98 381 381Missing 0 00 0 00Total 2514 1000 1000 257 1000 1000Note Control group frequencies are unweighted (a weighted average of controls within the radius calliper is
used in the matching algorithm)
Table A25 Used class BC drugs in the four weeks before custody (SPCR) by treatment and control groups
ResponseControl Treatment
n Valid n Valid No 1259 501 501 130 506 506Yes 1255 499 499 127 494 494Missing 0 00 0 00Total 2514 1000 1000 257 1000 1000Note Control group frequencies are unweighted (a weighted average of controls within the radius calliper is
used in the matching algorithm)
Table A26 Injected illegal drugs in the four weeks before custody (SPCR) by treatment and control groups
ResponseControl Treatment
n Valid n Valid No 2121 844 845 228 887 891Yes 389 155 155 28 109 109Missing 4 02 1 04Total 2514 1000 1000 257 1000 1000Note Control group frequencies are unweighted (a weighted average of controls within the radius calliper is
used in the matching algorithm)
Table A27 Accommodation prior to custody (SPCR) by treatment and control groups
TypeControl Treatment
n Valid n Valid Stable accommodation 2247 894 894 236 918 918Transient accommodation 130 52 52 14 54 54Sleeping rough 137 54 54 7 27 27Missing 0 00 0 00Total 2514 1000 1000 257 1000 1000Note Control group frequencies are unweighted (a weighted average of controls within the radius calliper is
used in the matching algorithm)
52
Table A28 Educational (qualifications) attainment (SPCR) by treatment and control groups
Highest qualification attained
Control Treatment
n Valid
n Valid
No qualifications 1099 437 441 99 385 388Other qualifications (incl overseas) 66 26 26 7 27 27O levelGCSE grade D-G (or similar qualification) 372 148 149 47 183 184O levelGCSE Grades A-C (or similar qualification) 507 202 204 61 237 239Trade apprenticeships 87 35 35 6 23 24AAS levels 220 88 88 21 82 82Higher education diploma 57 23 23 11 43 43First degreepostgraduate degree 70 28 28 2 08 08Higher degreepostgraduate degree 13 05 05 1 04 04Missing 23 09 2 08Total 2514 1000 1000 257 1000 1000Note Control group frequencies are unweighted (a weighted average of controls within the radius calliper is
used in the matching algorithm)
Table A29 Was in paid work in the four weeks before custody (SPCR) by treatment and control groups
ResponseControl Treatment
n Valid n Valid No 1681 669 669 168 654 654Yes 832 331 331 89 346 346Missing 1 00 0 00Total 2514 1000 1000 257 1000 1000Note Control group frequencies are unweighted (a weighted average of controls within the radius calliper is
used in the matching algorithm)
Table A30 Reconviction indicator one-year (PNC) by treatment and control groups
IndicatorControl Treatment
n Valid n Valid No 1584 630 630 187 728 728Yes 930 370 370 70 272 272Missing 0 00 0 00Total 2514 1000 1000 257 1000 1000Note Control group frequencies are unweighted (a weighted average of controls within the radius calliper is
used in the matching algorithm)
53
Table A31 Frequency of reoffending one-year (PNC) by treatment and control groups
IndicatorControl Treatment
n Valid n Valid 0 1584 630 630 187 728 7281 495 197 197 54 210 2102 203 81 81 11 43 433 117 47 47 3 12 124 53 21 21 1 04 045 33 13 13 1 04 046 8 03 03 0 00 007 7 03 03 0 00 008 6 02 02 0 00 009 1 00 00 0 00 0010 2 01 01 0 00 0011 2 01 01 0 00 0013 0 00 00 0 00 0015 1 00 00 0 00 0018 1 00 00 0 00 0032 1 00 00 0 00 00Missing 0 00 0 00Total 2514 1000 1000 257 1000 1000Note Control group frequencies are unweighted (a weighted average of controls within the radius calliper is
used in the matching algorithm)
54
Table A32 Frequency of reoffences one-year (PNC) by treatment and control groups
IndicatorControl Treatment
n Valid n Valid 0 1584 630 630 187 728 7281 272 108 108 31 121 1212 181 72 72 15 58 583 117 47 47 15 58 584 91 36 36 2 08 085 65 26 26 3 12 126 42 17 17 2 08 087 38 15 15 1 04 048 32 13 13 1 04 049 20 08 08 0 00 0010 19 08 08 0 00 0011 15 06 06 0 00 0012 11 04 04 0 00 0013 6 02 02 0 00 0014 6 02 02 0 00 0015 5 02 02 0 00 0016 1 00 00 0 00 0017 0 00 00 0 00 0018 1 00 00 0 00 0019 1 00 00 0 00 0020 1 00 00 0 00 0021 2 01 01 0 00 0022 2 01 01 0 00 0025 1 00 00 0 00 0039 1 00 00 0 00 00Missing 0 00 0 00Total 2514 1000 1000 257 1000 1000Note Control group frequencies are unweighted (a weighted average of controls within the radius calliper is
used in the matching algorithm)
Table A33 Severe offences reconviction indicator one-year (PNC) by treatment and control groups
IndicatorControl Treatment
n Valid n Valid No 2496 993 993 255 992 992Yes 18 07 07 2 08 08Missing 0 00 0 00Total 2514 1000 1000 257 1000 1000Note Control group frequencies are unweighted (a weighted average of controls within the radius calliper is
used in the matching algorithm)
Ministry of Justice Research Series 1910Evaluation of the impact of the HM Prison Service Enhanced Thinking Skills programme on reoffendingThis research examined the impact of the Enhanced Thinking Skills (ETS) programme on the one-year reconviction outcomes of 257 prison-based participants between 2006 and 2008 Radius propensity score matching was used to match a comparison group that had no statistically significant difference (at the means) to the treatment group on any matching characteristic ETS was found to significantly reduce both the reconviction rate (six percentage points) and frequency (60 reoffences per 100 released prisoners) of general reoffending of participants No statistically significant impact was found on the severe offences reconviction rate Almost identical impacts were found for completers A stronger reduction in reconviction was found for participants meeting the suitability criteria Though the programme has been shown to be effective in practice the findings suggest that a stricter application of the targeting criteria might have further enhanced the effectiveness of the programme
ISBN 978 1 84099 418 6copy Crown copyrightProduced by the Ministry of JusticeAlternative format versions of this report are available on requestE-mail researchjusticegsigovukhttpwwwjusticegovukpublicationsresearchhtm
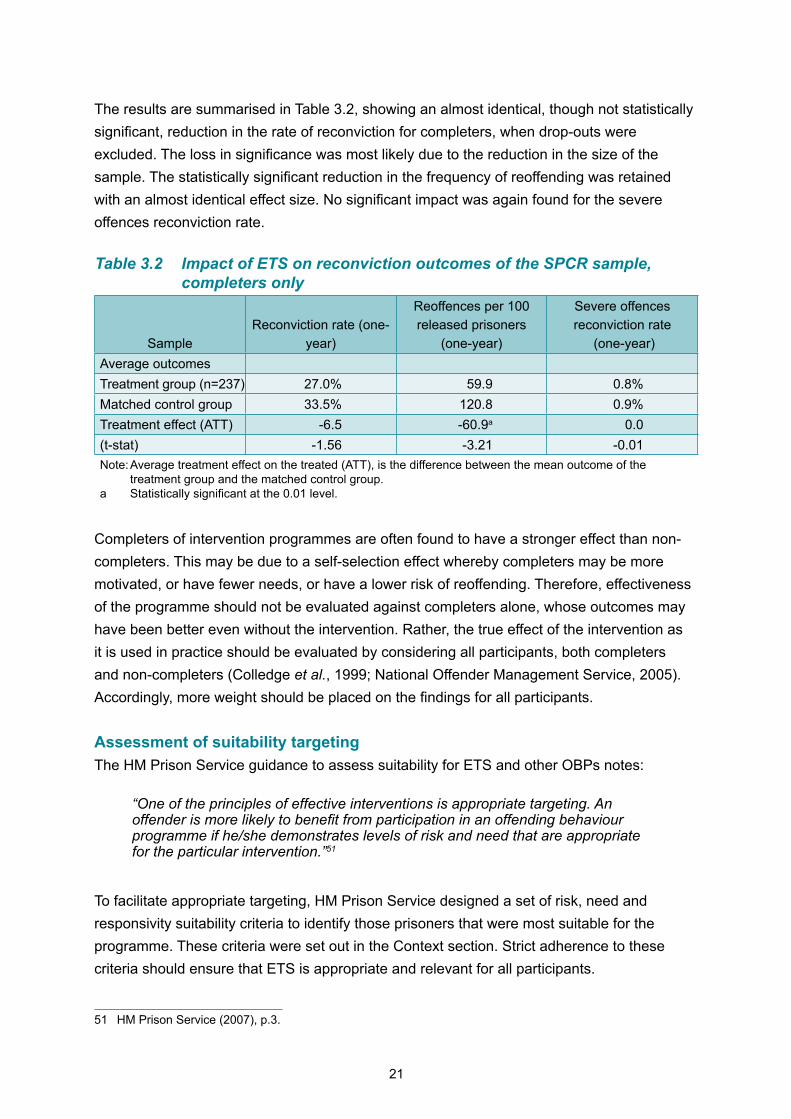
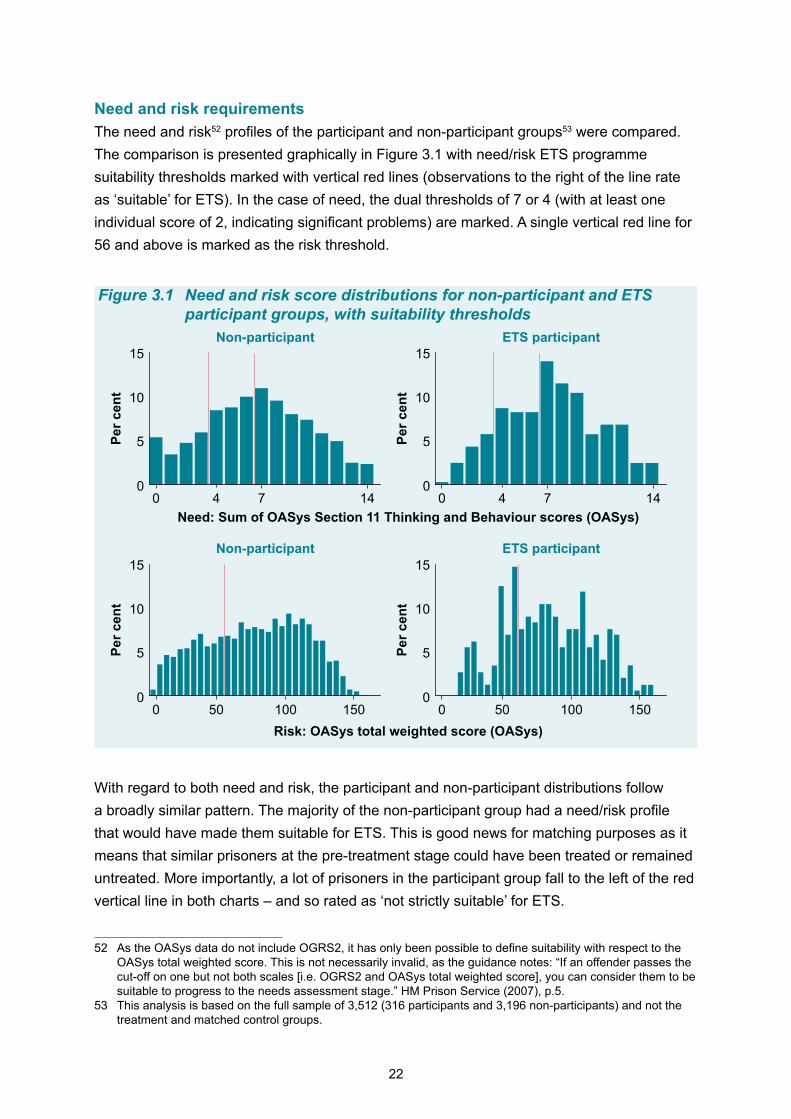
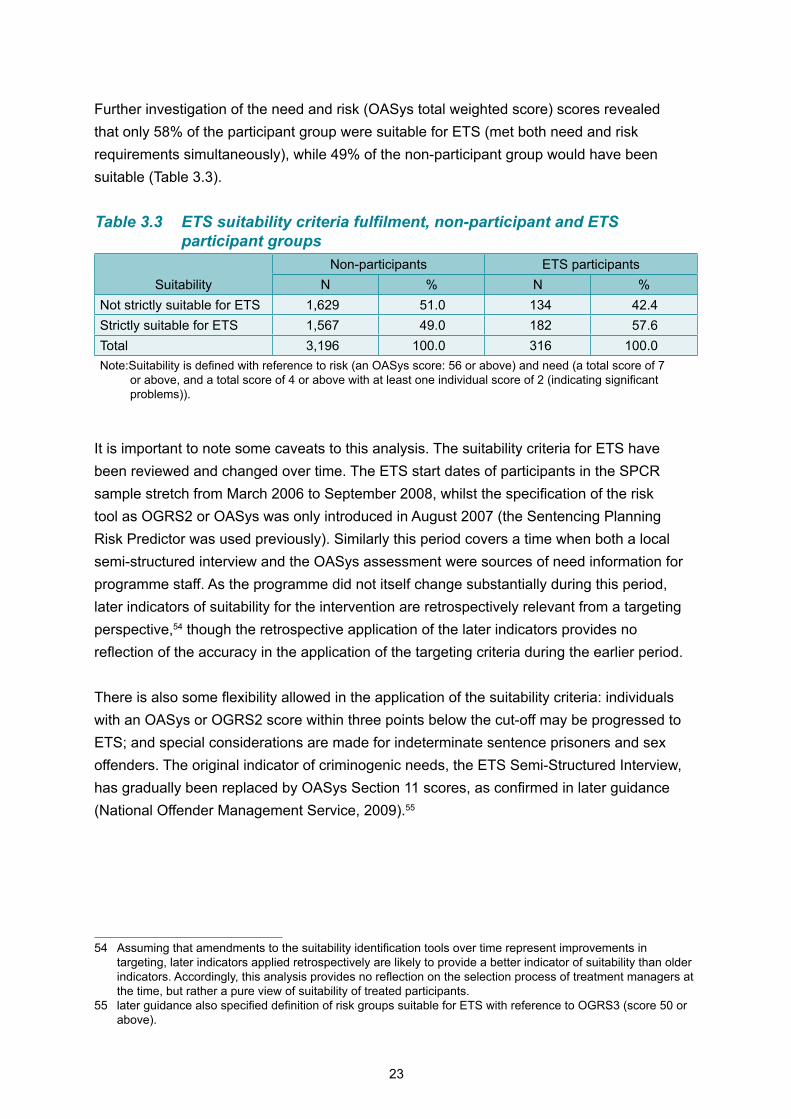
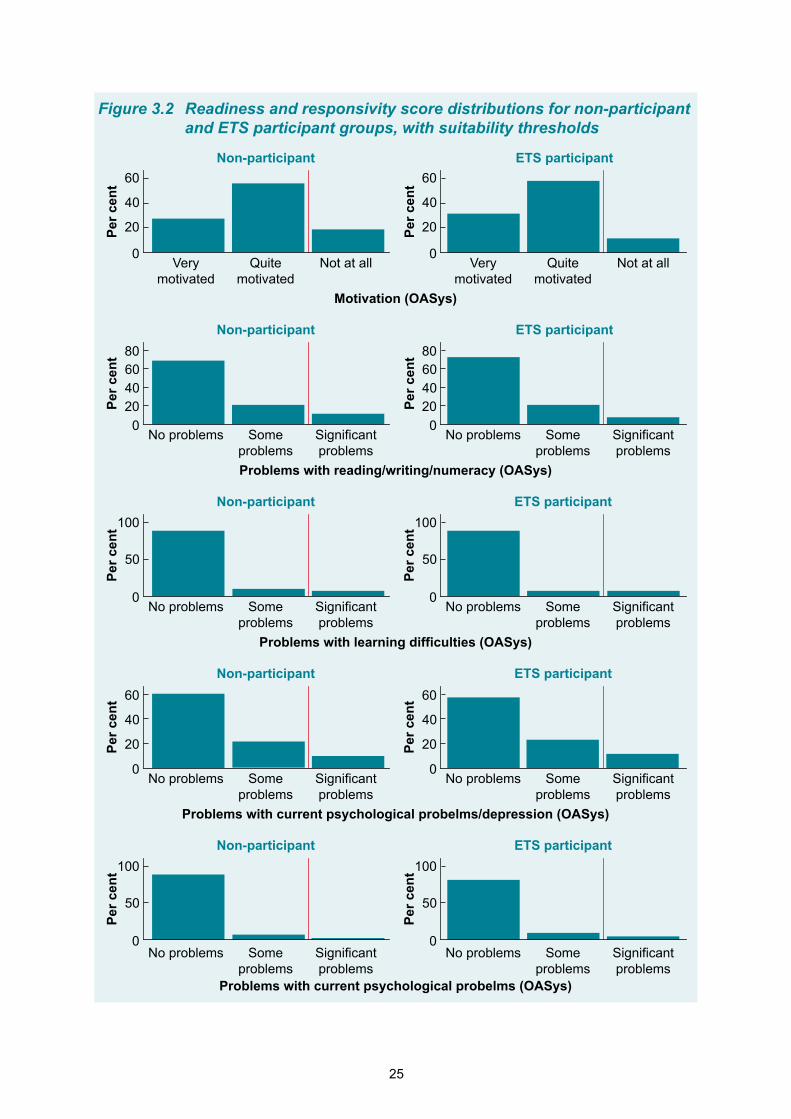
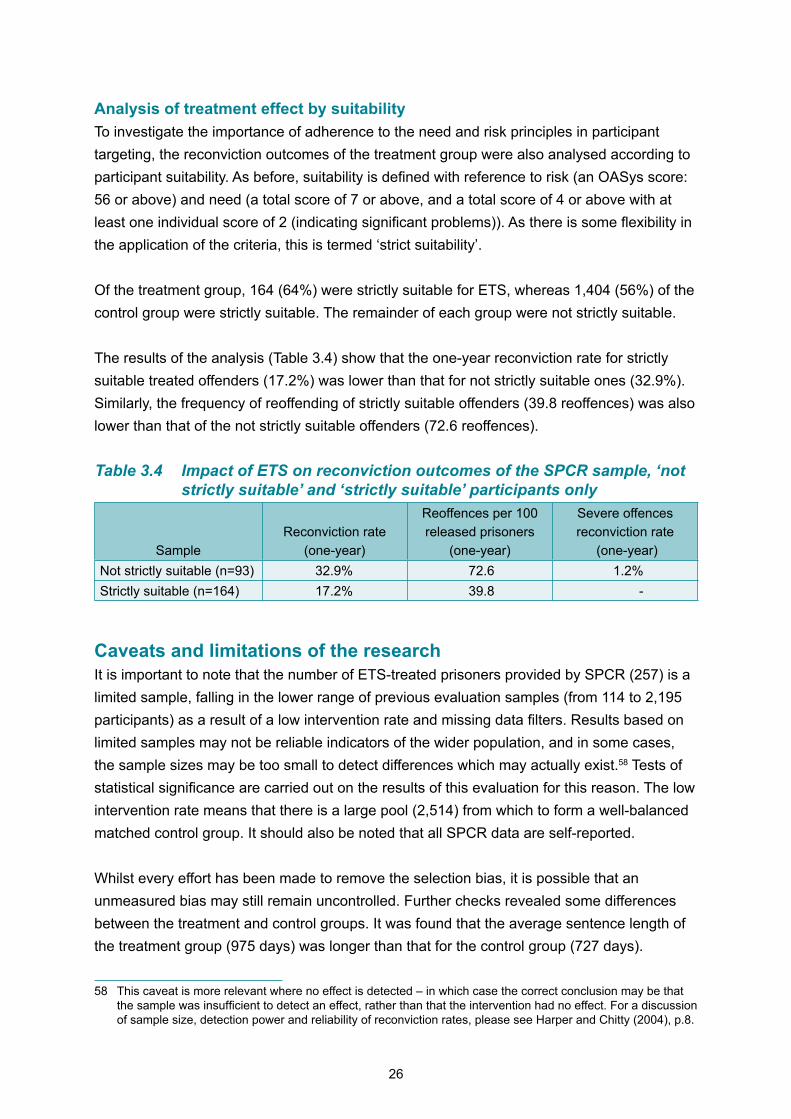
30
5 Further research
Whilst this evaluation has added some clarity to the evidence base on the effectiveness of general cognitive-behavioural programmes evidence gaps remain These gaps are defined by the research questions listed below with suggested research designs that could provide robust answers to complement and enhance the findings in this paper
Duration of the reduction in reoffending effect Does ETS have a lasting impact or will the observed one-year effect have dissipated after two years as found by Cann et al (2003) It is planned to conduct a follow up study of the treated and matched control individuals of this evaluation two years after their release applying the same methodology to investigate the duration of the ETS impact in one yearrsquos time
Cost-effectiveness of the programme Is the cost of ETS provision justified by the observed reduction in reoffending The reduction in reoffences estimated in this evaluation could be used as the basis for a cost-benefit analysis of the ETS programme Linking the estimated reduction in reoffending to estimates of the social cost of criminal offences the avoided social costs of crime (the benefit) could be compared to data on the cost of ETS provision (estimated to be in the region of pound2000 per prisoner)59
Generalisability of the findings Would the observed effect be verified or even more significant in a larger sample By repeating the evaluation methodology but replacing SPCR variables with OASys data variables where possible the full population of prisoners undertaking ETS could be evaluated The downside to this approach is the compromised choice of data for dynamic risk factors Other benefits would be the ability to employ more matching variables and being able to evaluate some of the smaller accredited programmes This research could also be used as a methodological blueprint to evaluate substance misuse intervention programmes
What works for whom What are the characteristics of the prisoners that benefit most from ETS and other OBPs The difference in reconviction outcome for each treated prisoner compared with the matched control could be regressed on a range of treated prisonersrsquo characteristics to identify which kinds of offenders under which circumstances most benefit from undertaking ETS
The effectiveness of TSP Does ETSrsquos replacement the Thinking Skills Programme (TSP) have a lesser similar or greater impact on reconviction A similar evaluation methodology could be used to evaluate the effectiveness of TSP in reducing reconviction outcomes though this would not be possible for a couple of years as TSP was only introduced in 2009
59 Social Exclusion Unit (2002) p 81
31
Database of research findings What does the evidence base tell us about the effectiveness of ETS Policy makers are often influenced by the latest study to be published rather than the synthesised message of the collective body of evaluation research The formation and maintenance of a database of outcome studies could be used for systematic reviews and meta-analytic analysis to produce a comprehensive review of ETS efficacy to inform and guide policy makers and practitioners (for example see Tong and Farrington 2006)
In the longer term samples of the other cohort studies being conducted by MoJ ndash the probation sample of the Offender Management Community Cohort Study (OMCCS) and the juvenile offenders sample of the Juvenile Cohort Study (JCS) ndash could be similarly linked to the same management information databases (for example OASys) as linked to SPCR in this evaluation When combined with OASys assessment data and viewed as a collective database this would be the richest known single evidence base in existence on the static and dynamic factors involved in offending behaviour
32
6 Additional resources
Readers interested in researching further the issues and topics probed in this paper further may want to consult the following publications websites and other useful sources of information
HM Prison Service Offender Behaviour Programmes (OBPs) httpwwwhmprisonservicegovukadviceandsupportbeforeafterreleaseoffenderbehaviourprogrammes
Ministry of Justice Research httpwwwjusticegovukpublications
National Offender Management Service httpwwwjusticegovukaboutnomshtm
Correctional Services Accreditation Panel httpwwwjusticegovukaboutcorrectional-services-accreditationhtm
National Reducing Reoffending Delivery plan (National Offender Management Service (NOMS) website) httpnomsjusticegovuk
Social Exclusion Unit (Cabinet Office) httpwwwcabinetofficegovuksocial_exclusion_task_forceaspx
Office for National Statistics (ONS) httpwwwstatisticsgovuk
33
7 References
Andrews D A and Bonta J (2010) The psychology of criminal conduct (5th ed) New Providence NJ LexisNexis Matthew Bender
Blackburn R (1972) lsquoDimensions of hostility and aggression in abnormal offendersrsquo Journal
of Consulting and Clinical Psychology 38 pp 20ndash26
Caliendo M and Kopeinig S (2005) lsquoSome Practical Guidance for the Implementation of Propensity Score Matchingrsquo IZA Discussion Papers Series Discussion Paper No 1588 Institute for the Study of Labor (IZA)
Cann J Falshaw L Nugent F and Friendship C (2003) Understanding What Works
cognitive accredited skills programmes for adult men and young offenders Research Findings 226 London Home Office
Cann J (2006) Cognitive skills programmes impact on reducing reconviction among a
sample of female prisoners Home Office Research Study 276 London Home Office
Clarke A Simmonds R and Wydall S (2004) Delivering cognitive skills programmes in
prison a qualitative study Home Office Research Study 242 London Home Office
Clarke D A (2000) Theory Manual for Enhanced Thinking Skills Prepared for the Joint Prison Accreditation Panel London Home Office
Colledge M Collier P and Brand S (1999) Crime reduction programme and constructive
regimes in prison Programmes for offenders Guidance for evaluators Crime reduction programme ndash guidance note 2 Research Development and Statistics Directorate London Home Office
Copas J and Marshall P (1998) lsquoThe offender group reoffending scale A statistical reoffending score for use by probation officersrsquo Applied Statistics 47(1) 159ndash171
Dehejia RH and Wahba S (2002) lsquoPropensity Score-Matching Methods for Nonexperimental Causal Studiesrsquo Review of Economics and Statistics February 2002 Vol 84 No 1 pp 151ndash161
Eysenck S B and McGurk B J (1980) lsquoImpulsiveness and venturesomeness in a detention centre populationrsquo Psychological Reports 47 pp 1299ndash1306
34
Falshaw L Friendship C Travers R and Nugent F (2003) Searching for what works An
evaluation of cognitive skills programmes Home Office Research Study 206 London Home Office
Falshaw L Friendship C Blud L Travers R and Nugent F (2004) lsquoSearching for what works HM Prison Service accredited cognitive skills coursesrsquo British Journal of Forensic
Practice 6 (2) pp 3ndash13
Friendship C Blud L Erikson M and Travers R (2002) An evaluation of cognitive
behavioural treatment for prisoners Home Office Research Study 161 London Home Office
Frude N Honess T and Maguire M (1994) CRIME-PICS II Manual Cardiff Michael and Associates
Gendreau P Smith P and Theacuteriault YL (2009) lsquoChaos theory and correctional treatment Common sense correctional quackery and the law of fartcatchersrsquo Journal of Contemporary
Criminal Justice 25 384ndash396
Harper G and Chitty C (eds) (2004) The impact of corrections on re-offending A review of
lsquoWhat Worksrsquo (3rd ed) Home Office Research Study No 291 London Home Office
Heckman J and Smith J (1995) rsquoAssessing the Case for Social Experimentsrsquo Journal of
Economic Perspectives 9 85ndash110
HM Prison Service (2007) Assessing Suitability for Offending Behaviour Programmes Risk
Need amp Responsivity Guidance for Treatment Managers Offending Behaviour Programmes Unit HM Prison Service
Home Office (2006) A Five Year Strategy for Protecting the Public and Reducing Re-
offending London The Stationary Office
Hollin C R (1995) lsquoThe meaning and implications of ldquoprogramme integrityrdquorsquo In J McGuire (Ed) What works Reducing reoffending Guidelines from Research and Practice (pp 195ndash208) Chichester England John Wiley and Sons
Howard P (2009) Improving prediction of re-offending using the Offender Assessment
System Research Summary 209 London Ministry of Justice Available at httpwwwjusticegovukpublicationsdocsoasys-research-summary-02-09pdf
Howard P Francis B Soothill K and Humphreys L (2009) OGRS 3 the revised Offender
Group Reconviction Scale Research Summary 709 London Ministry of Justice
35
Leuven E and Sianesi B (2003) psmatch2 Stata module to perform full Mahalanobis and
propensity score matching common support graphing and covariate imbalance testing httpideasrepecorgcbocbocodes432001html version 315 2 May 2009
Mak A S (1991) lsquoPsychosocial control characteristics of delinquents and nondelinquentsrsquo Criminal Justice and Behaviour 18 (3) pp 297ndash303
McDougall C Clarbour J Perry A and Bowles R (2009) Evaluation of HM Prison Service
Enhanced Thinking Skills Programme Report on the implementation of a randomised
controlled trial London Ministry of Justice
McDougall C Clarbour J Perry A and Bowles R (2009) Evaluation of HM Prison Service
Enhanced Thinking Skills Programme Report on the outcomes of a randomised controlled
trial London Ministry of Justice
Ministry of Justice (2009) The Correctional Services Accreditation Panel Report 2008-
2009 Available at httpwwwjusticegovukpublicationsdocscorrectional-services-report-20080-09pdf
Ministry of Justice (2010) Reoffending of adults results from the 2008 cohort ndash England and
Wales Ministry of Justice Statistics bulletin London Ministry of Justice Available at httpwwwjusticegovukpublicationsdocsreoffending-adults-2008-cohortpdf
National Offender Management Service (2005) Understanding research methods and
findings lsquoWhat Worksrsquo Briefing 305 Available at httprdshomeofficegovukrdspdfs05wwbn3pdf
National Offender Management Service (2009) Suitability for Accredited Interventions Risk
Need amp Responsivity Targeting Criteria for Offender Managers and Treatment Managers
Interventions and Substance Misuse Group Directorate of Commissioning and Operational Policy National Offender Management Service May 2009
OASys Data Evaluation and Analysis Team O-DEAT (2010) OASys caveats notes and
limitations ndash layered OASys (May 10)
OASys development team (2001) Offender Assessment System OASys User Manual OASys Manual V2 Crown Copyright 2002
Palmer EJ McGuire J Hatcher RM Hounsome JC Bilby CAL and Hollin CR (2009) lsquoAllocation to offending behavior programs in the English and Welsh probation servicersquo Criminal Justice and Behavior 36 909ndash922
36
Rosenbaum P R and Rubin D B (1983) lsquoThe Central Role of the Propensity Score in Observational Studies for Causal Effectsrsquo Biometrika 70 41ndash55
Smith J and Todd P (2005) rsquoDoes matching overcome LaLondersquos critique of nonexperimental estimatorsrsquo Journal of Econometrics Elsevier vol 125(1-2) pages 305ndash353
Social Exclusion Unit (2002) Reducing re-offending by ex-prisoners Available from httpwwwcabinetofficegovukmediacabinetofficesocial_exclusion_task_forceassetspublications_1997_to_2006reducing_reportpdf
Stewart D (2008) The problems and needs of newly sentenced prisoners results from a
national survey Ministry of Justice Research Series 1608 Published online at httpwwwjusticegovukpublicationsresearch2008htm
Taxman FS and Thanner M (2006) lsquoRisk need and responsivity (RNR) It all dependsrsquo Crime and Delinquency 52 28ndash51
Tong LSJ and Farrington DP (2006) lsquoHow effective is the ldquoReasoning and Rehabilitationrdquo programme in reducing reoffending A meta-analysis of evaluations in four countriesrsquo Psychology Crime and Law 12 3ndash24
37
Appendix 1 Technical annex
Full set of matching variables (covariates)Programme suitability criteriaoasys_need Need Sum of OASys Section 11 Thinking and Behaviour scores
(OASys)oasys_score Risk OASys total weighted score (OASys)oasys_motiv Motivation to change behaviour (OASys)oasys_litnum Problems with readingwritingnumeracy (OASys)oasys_lrndiff Problems with learning difficulties (OASys)oasys_psychgl Problems with current psychological problemsdepression (OASys)oasys_psychtr Problems with current psychiatric problems (OASys)
Static risk factorsspcr_genderf Gender Female (SPCR)spcr_age Age (SPCR)spcr_marst_mar Marital status Married (SPCR)spcr_marst_lvp Marital status Living with a partner (SPCR)spcr_ethnic_mix Ethnicity Any Mixed background (SPCR)spcr_ethnic_as Ethnicity Any Asian background (SPCR)spcr_ethnic_bl Ethnicity Any Black background (SPCR)spcr_ethnic_oth Ethnicity Any Other background (SPCR)pnc_copas Copas rate on release (PNC)pnc_ttlprevconv Previous convictions (PNC)pnc_ttlprevconv2 Previous convictions squared (PNC)pnc_ttlprevconvsev Previous severe convictions (PNC)pnc_ttlprevconvsev2 Previous severe convictions squared (PNC)pnc_index_vio Index offence type Violent (PNC)pnc_index_sxl Index offence type Sexual (PNC)pnc_index_acq Index offence type Acquisitive (PNC)pnc_index_drg Index offence type Drug (PNC)pnc_index_rob Index offence type Robbery (PNC)spcr_famconv Family member has been convicted of a non-motoring offence
(SPCR)spcr_fampris Family member has been in prison (SPCR)
Dynamic risk factorsspcr_motivstoffy Agree Want to stop offending (SPCR)spcr_motivstoffn Disagree Want to stop offending (SPCR)spcr_motivhlpstoffy Agree Want to get help to stop offending (SPCR)spcr_motivhlpstoffn Disagree Want to get help to stop offending (SPCR)spcr_attg General attitude to offending CRIME-PICS (SPCR)spcr_atta Anticipation of reoffending CRIME-PICS (SPCR)spcr_attv Victim hurt denial CRIME-PICS (SPCR)spcr_atte Evaluation of crime as worthwhile CRIME-PICS (SPCR)spcr_drug4wka Used class A drugs in the four weeks before custody (SPCR)spcr_drug4wkbc Used class BC drugs in the four weeks before custody (SPCR)spcr_drug4wkinj Injected illegal drugs in the four weeks before custody (SPCR)spcr_accomtrans Transient accommodation prior to custody (SPCR)spcr_accomrough Sleeping rough prior to custody (SPCR)spcr_edqual Educational (qualifications) attainment (SPCR)spcr_job4wk Was in paid work in the four weeks before custody (SPCR)
38
Logistic regression model
Table A1 Logistic regression model of prisoner characteristics influencing probability of treatment (ETS) and reconviction outcomes
Coefficient Standard error P-valueETS suitabilityNeed (thinking and behaviour) 0082 0027 0002Risk (OASys score) 0005 0003 0069Motivation to change behaviour (OASys) 0323 0122 0008Problems with readingwritingnumeracy -0303 0116 0009Problems with current psychiatric problems 0335 0131 0011
GenderMale Reference
categoryFemale 0736 0177 0000
Age -0030 0009 0000
Index offence typeOther Reference
categoryViolent 1223 0296 0000Sexual 2094 0389 0000Acquisitive 0243 0313 0438Drug 1192 0309 0000Robbery 1552 0329 0000
Motivation to stop offendingDisagreed with ldquoI want to get help to stop offendingrdquo all other responses
Reference category
Agreed with ldquoI want to get help to stop offendingrdquo
0315 0091 0001
Offending-related attitudesVictim hurt denial 0078 0026 0003
Drug useUsed Class BC drugs in the 4 weeks before custody
-0195 0150 0193
AccommodationStable accommodation prior to custody Reference
categoryTemporary accommodation prior to custody Reference
categorySleeping rough prior to custody -0709 0409 0083
Constant -4933 0554 0000Notes Number of observations = 2771 (257 treated 2514 untreated) Pseudo R2 = 00958 LR
chi2(16)=16397 probgtchi2 00000
39
Calculation of the average treatment effect on the treated (ATT)
Outcome measures
pnc_reconvind Indicator of reconviction within one yearpnc_reofffreq Frequency of proven reoffending within one yearpnc_reconvindsev Indicator of severe offence reconviction within one year
Table A2 Average treatment effect on the treated (ATT)
Variable Sample Treated Controls(Difference)
ATTa
Standard error t-stat
pnc_reconvind Unmatched 0272 0370 (-0098) 0031 -311Matched ATT 0272 0335 -0062 0031 -204
pnc_reofffreq Unmatched 0607 1422 (-0815) 0182 -447Matched ATT 0607 1208 -0601 0110 -547
pnc_reconvindsev Unmatched 0008 0007 (0001) 0006 011Matched ATT 0008 0009 -0001 0006 -013
a ATT is the difference between the mean outcome of the treatment group and the matched control group
40
Tests of covariate balancing
Table A3 Means standardised bias reduction and t-tests for equality of means in the treatment and control groups before and after matching
Variable SampleMean
bias bias
reductiont-test
Treatment Control t pgttoasys_need Unmatched 7381 6703 203 299 000
Matched 7381 7269 34 834 039 070oasys_score Unmatched 77335 75658 48 070 049
Matched 77335 77060 08 836 009 093oasys_motiv Unmatched 1210 1141 110 165 010
Matched 1210 1201 15 864 017 087oasys_litnum Unmatched 0350 0416 -102 -150 013
Matched 0350 0361 -17 830 -020 084oasys_lrndiff Unmatched 0187 0184 05 008 094
Matched 0187 0180 13 -1510 014 089oasys_psychgl Unmatched 0486 0426 89 139 017
Matched 0486 0499 -19 791 -020 084oasys_psychtr Unmatched 0237 0142 194 327 000
Matched 0237 0224 27 861 028 078spcr_genderf Unmatched 0214 0124 243 408 000
Matched 0214 0199 39 838 041 068spcr_age Unmatched 28008 30216 -238 -349 000
Matched 28008 28364 -38 839 -046 065spcr_marst_mar Unmatched 0070 0093 -84 -123 022
Matched 0070 0075 -19 776 -023 082spcr_marst_lvp Unmatched 0296 0256 90 140 016
Matched 0296 0250 103 -149 117 024spcr_ethnic_mix Unmatched 0062 0038 110 187 006
Matched 0062 0040 100 92 112 026spcr_ethnic_as Unmatched 0047 0041 28 044 066
Matched 0047 0035 57 -1056 067 050spcr_ethnic_bl Unmatched 0035 0065 -137 -189 006
Matched 0035 0063 -127 76 -145 015spcr_ethnic_oth Unmatched 0000 0004 -89 -101 031
Matched 0000 0002 -51 431 -076 045pnc_copas Unmatched -0902 -0880 -27 -040 069
Matched -0902 -0910 10 644 011 091pnc_ttlprevconv Unmatched 10946 12746 -163 -227 002
Matched 10946 11580 -57 648 -069 049pnc_ttlprevconv2 Unmatched 212140 314300 -133 -163 010
Matched 212140 257960 -60 552 -082 041pnc_ttlprevconvsev
Unmatched 0132 0146 -34 -050 062Matched 0132 0165 -79 -1300 -087 039
pnc_ttlprevconvsev2
Unmatched 0163 0209 -57 -074 046Matched 0163 0239 -95 -657 -102 031
41
Variable SampleMean
bias bias
reductiont-test
Treated Control t pgttpnc_index_vio Unmatched 0327 0245 182 288 000
Matched 0327 0311 36 804 039 070pnc_index_sxl Unmatched 0078 0040 162 286 000
Matched 0078 0078 -03 982 -003 098pnc_index_acq Unmatched 0175 0303 -302 -430 000
Matched 0175 0195 -46 847 -057 057pnc_index_drg Unmatched 0218 0195 57 088 038
Matched 0218 0211 16 718 018 086pnc_index_rob Unmatched 0144 0065 261 469 000
Matched 0144 0133 37 858 037 071spcr_famconv Unmatched 0463 0403 121 185 006
Matched 0463 0433 60 503 067 050spcr_fampris Unmatched 0396 0334 129 200 005
Matched 0396 0354 88 322 098 033spcr_motivstoffy Unmatched 1720 1670 93 139 017
Matched 1720 1719 01 985 002 099spcr_motivstoffn Unmatched 0016 0010 40 065 052
Matched 0016 0007 58 -453 069 049spcr_motivhlpstoffy
Unmatched 1346 1085 338 498 000Matched 1346 1304 55 836 065 052
spcr_motivhlpstoffn
Unmatched 0097 0164 -166 -234 002Matched 0097 0107 -25 850 -031 076
spcr_attg Unmatched 58131 57962 23 033 074Matched 58131 58212 -11 518 -012 091
spcr_atta Unmatched 18393 18516 -50 -073 047Matched 18393 18547 -63 -257 -068 050
spcr_attv Unmatched 11825 10907 321 454 000Matched 11825 11681 50 843 061 054
spcr_atte Unmatched 13996 13809 60 092 036Matched 13996 13871 40 331 045 066
spcr_drug4wka Unmatched 0381 0419 -77 -118 024Matched 0381 0408 -55 289 -062 053
spcr_drug4wkbc Unmatched 0494 0499 -10 -015 088Matched 0494 0486 16 -637 019 085
spcr_drug4wkinj Unmatched 0109 0155 -135 -194 005Matched 0109 0143 -99 265 -114 025
spcr_accomtrans Unmatched 0054 0052 12 019 085Matched 0054 0058 -17 -360 -018 085
spcr_accomrough Unmatched 0027 0054 -138 -188 006Matched 0027 0032 -23 835 -030 076
spcr_edqual Unmatched 1965 1893 36 054 059Matched 1965 1915 25 308 028 078
spcr_job4wk Unmatched 0346 0331 32 049 062Matched 0346 0331 32 17 036 072
Figure A1 Risk OASys total weighted score (OASys) by treatment and control groups
Risk OASys weighted score
8
6
4
2
Per c
ent
Control
0
8
6
4
2
Per c
ent
Treatment
050 100 150 50 100 150
42
Distributions of matching variables by treatment and control groups
Table A4 Need Sum of OASys Section 11 Thinking and Behaviour scores (OASys) by treatment and control groups
Summed scoreControl Treatment
n Valid n Valid 0 111 44 44 1 04 041 89 35 35 6 23 232 126 50 50 11 43 433 156 62 62 13 51 514 219 87 87 24 93 935 234 93 93 19 74 746 262 104 104 23 89 897 281 112 112 37 144 1448 253 101 101 30 117 1179 211 84 84 29 113 11310 184 73 73 15 58 5811 147 58 58 18 70 7012 117 47 47 17 66 6613 62 25 25 7 27 2714 62 25 25 7 27 27Missing 0 00 0 00Total 2514 1000 1000 257 1000 1000Note Control group frequencies are unweighted (a weighted average of controls within the radius calliper is
used in the matching algorithm)
43
Table A5 Motivation to change behaviour (OASys) by treatment and control groups
RatingControl Treatment
n Valid n Valid Not at all 367 146 146 28 109 109Quite motivated 1426 567 567 147 572 572Very motivated 721 287 287 82 319 319Missing 0 00 0 00Total 2514 1000 1000 257 1000 1000Note Control group frequencies are unweighted (a weighted average of controls within the radius calliper is
used in the matching algorithm)
Table A6 Problems with readingwritingnumeracy (OASys) by treatment and control groups
ExtentControl Treatment
n Valid n Valid No problems 1735 690 690 187 728 728Some problems 512 204 204 50 195 195Significant problems 267 106 106 20 78 78Missing 0 00 0 00Total 2514 1000 1000 257 1000 1000Note Control group frequencies are unweighted (a weighted average of controls within the radius calliper is
used in the matching algorithm)
Table A7 Problems with learning difficulties (OASys) by treatment and control groups
ExtentControl Treatment
n Valid n Valid No problems 2185 869 869 226 879 879Some problems 195 78 78 14 54 54Significant problems 134 53 53 17 66 66Missing 0 00 0 00Total 2514 1000 1000 257 1000 1000Note Control group frequencies are unweighted (a weighted average of controls within the radius calliper is
used in the matching algorithm)
Table A8 Problems with current psychological problemsdepression (OASys) by treatment and control groups
Extent Control Treatment
n Valid n Valid No problems 1693 673 673 162 630 630Some problems 572 228 228 65 253 253Significant problems 249 99 99 30 117 117Missing 0 00 0 00Total 2514 1000 1000 257 1000 1000Note Control group frequencies are unweighted (a weighted average of controls within the radius calliper is
used in the matching algorithm)
Figure A2 Age (SPCR) by treatment and control groups
8
6
4
2
0
Per
cen
t
20 40 60 80
8
6
4
2
0
Per
cen
t
20 40 60 80Age (SPCR)
Control Treatment
44
Table A9 Problems with current psychiatric problems (OASys) by treatment and control groups
ExtentControl Treatment
n Valid n Valid No problems 2244 893 893 211 821 821Some problems 184 73 73 31 121 121Significant problems 86 34 34 15 58 58Missing 0 00 0 00Total 2514 1000 1000 257 1000 1000Note Control group frequencies are unweighted (a weighted average of controls within the radius calliper is
used in the matching algorithm)
Table A10 Gender (SPCR) by treatment and control groups
GenderControl Treatment
n Valid n Valid Male 2203 876 876 202 786 786Female 311 124 124 55 214 214Missing 0 00 0 00Total 2514 1000 1000 257 1000 1000Note Control group frequencies are unweighted (a weighted average of controls within the radius calliper is
used in the matching algorithm)
Figure A3 Copas rate on release (PNC) by treatment and control groups
10
5
0-4 -2 0 2
Per c
ent
10
5
0-4 -2 0 2
Per c
ent
COPAS rate on release (PNC)
Control Treatment
45
Table A11 Marital status (SPCR) by treatment and control groups
StatusControl Treatment
n Valid n Valid Married 234 93 93 18 70 70Living with partner 642 255 256 76 296 296Other 1636 651 651 163 634 634Missing 2 01 0 00Total 2514 1000 1000 257 1000 1000Note Control group frequencies are unweighted (a weighted average of controls within the radius calliper is
used in the matching algorithm)
Table A12 Ethnicity (SPCR) by treatment and control groups
Ethnic groupControl Treatment
n Valid n Valid Any White background 2142 852 852 220 856 856Any Mixed background 96 38 38 16 62 62Any Asian background 103 41 41 12 47 47Any Black background 163 65 65 9 35 35Any Other background 10 04 04 0 00 00Missing 0 00 0 00Total 2514 1000 1000 257 1000 1000Note Control group frequencies are unweighted (a weighted average of controls within the radius calliper is
used in the matching algorithm)
Figure A4 Total previous convictions (PNC) by treatment and control groups
30
20
10
050 100 150 200
30
20
10
050 100 150 200
Per c
ent
Per c
ent
Previous convictions (PNC)
Control Treatment
46
Table A13 Previous severe convictions (PNC) by treatment and control groups
NumberControl Treatment
n Valid n Valid 0 2205 877 877 227 883 8831 265 105 105 26 101 1012 34 14 14 4 16 163 5 02 02 0 00 004 5 02 02 0 00 00Missing 0 00 0 00Total 2514 1000 1000 257 1000 1000Note Control group frequencies are unweighted (a weighted average of controls within the radius calliper is
used in the matching algorithm)
Table A14 Grouped index offence type (PNC) by treatment and control groups
Offence type grouping
Control Treatmentn Valid n Valid
Other 384 153 153 15 58 58Violent 616 245 245 84 327 327Robbery 163 65 65 37 144 144Sexual 100 40 40 20 78 78Acquisitive 761 303 303 45 175 175Drug 490 195 195 56 218 218Missing 0 00 0 00Total 2514 1000 1000 257 1000 1000Note Control group frequencies are unweighted (a weighted average of controls within the radius calliper is
used in the matching algorithm)
47
Table A15 Family member has been convicted of a non-motoring offence (SPCR) by treatment and control groups
ResponseControl Treatment
n Valid n Valid No 1486 591 597 137 533 537Yes 1003 399 403 118 459 463Missing 25 10 2 08Total 2514 1000 1000 257 1000 1000Note Control group frequencies are unweighted (a weighted average of controls within the radius calliper is
used in the matching algorithm)
Table A16 Family member has been in prison (SPCR) by treatment and control groups
ResponseControl Treatment
n Valid n Valid No 1658 660 666 154 599 604Yes 831 331 334 101 393 396Missing 25 10 2 08Total 2514 1000 1000 257 1000 1000Note Control group frequencies are unweighted (a weighted average of controls within the radius calliper is
used in the matching algorithm)
Table A17 Agree Want to stop offending (SPCR) by treatment and control groups
ResponseControl Treatment
n Valid n Valid Other 101 40 40 9 35 35Agree 627 249 249 54 210 210Strongly agree 1786 710 710 194 755 755Missing 0 00 0 00Total 2514 1000 1000 257 1000 1000Note Control group frequencies are unweighted (a weighted average of controls within the radius calliper is
used in the matching algorithm)
Table A18 Disagree Want to stop offending (SPCR) by treatment and control groups
ResponseControl Treatment
n Valid n Valid Other 2498 994 994 254 988 988Disagree 7 03 03 2 08 08Strongly disagree 9 04 04 1 04 04Missing 0 00 0 00Total 2514 1000 1000 257 1000 1000Note Control group frequencies are unweighted (a weighted average of controls within the radius calliper is used in the matching algorithm)
Figure A5 General attitude to offending CRIME-PICS (SPCR) by treatment and control groups
15
10
5
020 40 60 80
Per c
ent
Control15
10
5
020 40 60 80
Per c
ent
Treatment
General attitude to offending CRIME-PICS (SPCR)
48
Table A19 Agree Want to get help to stop offending (SPCR) by treatment and control groups
ResponseControl Treatment
n Valid n Valid Other 725 288 288 40 156 156Agree 851 339 339 88 342 342Strongly agree 938 373 373 129 502 502Missing 0 00 0 00Total 2514 1000 1000 257 1000 1000Note Control group frequencies are unweighted (a weighted average of controls within the radius calliper is
used in the matching algorithm)
Table A20 Disagree Want to get help to stop offending (SPCR) by treatment and control groups
ResponseControl Treatment
n Valid n Valid Other 2174 865 865 237 922 922Disagree 268 107 107 15 58 58Strongly disagree 72 29 29 5 19 19Missing 0 00 0 00Total 2514 1000 1000 257 1000 1000Note Control group frequencies are unweighted (a weighted average of controls within the radius calliper is
used in the matching algorithm)
49
Table A21 Anticipation of reoffending CRIME-PICS (SPCR) by treatment and control groups
ScoreControl Treatment
n Valid n Valid 8 2 01 01 0 00 009 1 00 00 0 00 0010 3 01 01 1 04 0411 6 02 03 0 00 0012 14 06 06 1 04 0413 27 11 11 4 16 1614 46 18 19 8 31 3315 113 45 48 9 35 3716 201 80 85 18 70 7417 276 110 116 30 117 12318 628 250 265 65 253 26619 371 148 156 44 171 18020 287 114 121 30 117 12321 145 58 61 13 51 5322 106 42 45 9 35 3723 71 28 30 5 19 2024 29 12 12 2 08 0825 17 07 07 2 08 0826 14 06 06 2 08 0827 7 03 03 1 04 0428 3 01 01 0 00 0029 1 00 00 0 00 0030 6 02 03 0 00 00Missing 140 56 13 51Total 2514 1000 1000 257 1000 1000Note Control group frequencies are unweighted (a weighted average of controls within the radius calliper is
used in the matching algorithm)
50
Table A22 Victim hurt denial CRIME-PICS (SPCR) by treatment and control groups
ScoreControl Treatment
n Valid n Valid 3 69 27 27 2 08 084 47 19 19 2 08 085 59 23 23 1 04 046 136 54 54 6 23 237 104 41 41 4 16 168 155 62 62 14 54 549 129 51 51 20 78 7810 241 96 96 19 74 7411 133 53 53 8 31 3112 664 264 264 77 300 30013 257 102 102 38 148 14814 196 78 78 22 86 8615 324 129 129 44 171 171Missing 0 00 0 00Total 2514 1000 1000 257 1000 1000Note Control group frequencies are unweighted (a weighted average of controls within the radius calliper is
used in the matching algorithm)
Table A23 Evaluation of crime as worthwhile CRIME-PICS (SPCR) by treatment and control groups
ScoreControl Treatment
n Valid n Valid 4 1 00 00 1 04 045 5 02 02 1 04 046 16 06 06 2 08 087 26 10 11 2 08 088 68 27 28 4 16 169 96 38 39 9 35 3510 177 70 72 21 82 8311 197 78 80 13 51 5112 270 107 109 31 121 12213 235 93 95 24 93 9414 328 130 133 33 128 13015 266 106 108 24 93 9416 276 110 112 27 105 10617 229 91 93 24 93 9418 115 46 47 20 78 7919 94 37 38 12 47 4720 70 28 28 6 23 24Missing 45 18 3 12Total 2514 1000 1000 257 1000 1000Note Control group frequencies are unweighted (a weighted average of controls within the radius calliper is
used in the matching algorithm)
51
Table A24 Used class A drugs in the four weeks before custody (SPCR) by treatment and control groups
ResponseControl Treatment
n Valid n Valid No 1460 581 581 159 619 619Yes 1054 419 419 98 381 381Missing 0 00 0 00Total 2514 1000 1000 257 1000 1000Note Control group frequencies are unweighted (a weighted average of controls within the radius calliper is
used in the matching algorithm)
Table A25 Used class BC drugs in the four weeks before custody (SPCR) by treatment and control groups
ResponseControl Treatment
n Valid n Valid No 1259 501 501 130 506 506Yes 1255 499 499 127 494 494Missing 0 00 0 00Total 2514 1000 1000 257 1000 1000Note Control group frequencies are unweighted (a weighted average of controls within the radius calliper is
used in the matching algorithm)
Table A26 Injected illegal drugs in the four weeks before custody (SPCR) by treatment and control groups
ResponseControl Treatment
n Valid n Valid No 2121 844 845 228 887 891Yes 389 155 155 28 109 109Missing 4 02 1 04Total 2514 1000 1000 257 1000 1000Note Control group frequencies are unweighted (a weighted average of controls within the radius calliper is
used in the matching algorithm)
Table A27 Accommodation prior to custody (SPCR) by treatment and control groups
TypeControl Treatment
n Valid n Valid Stable accommodation 2247 894 894 236 918 918Transient accommodation 130 52 52 14 54 54Sleeping rough 137 54 54 7 27 27Missing 0 00 0 00Total 2514 1000 1000 257 1000 1000Note Control group frequencies are unweighted (a weighted average of controls within the radius calliper is
used in the matching algorithm)
52
Table A28 Educational (qualifications) attainment (SPCR) by treatment and control groups
Highest qualification attained
Control Treatment
n Valid
n Valid
No qualifications 1099 437 441 99 385 388Other qualifications (incl overseas) 66 26 26 7 27 27O levelGCSE grade D-G (or similar qualification) 372 148 149 47 183 184O levelGCSE Grades A-C (or similar qualification) 507 202 204 61 237 239Trade apprenticeships 87 35 35 6 23 24AAS levels 220 88 88 21 82 82Higher education diploma 57 23 23 11 43 43First degreepostgraduate degree 70 28 28 2 08 08Higher degreepostgraduate degree 13 05 05 1 04 04Missing 23 09 2 08Total 2514 1000 1000 257 1000 1000Note Control group frequencies are unweighted (a weighted average of controls within the radius calliper is
used in the matching algorithm)
Table A29 Was in paid work in the four weeks before custody (SPCR) by treatment and control groups
ResponseControl Treatment
n Valid n Valid No 1681 669 669 168 654 654Yes 832 331 331 89 346 346Missing 1 00 0 00Total 2514 1000 1000 257 1000 1000Note Control group frequencies are unweighted (a weighted average of controls within the radius calliper is
used in the matching algorithm)
Table A30 Reconviction indicator one-year (PNC) by treatment and control groups
IndicatorControl Treatment
n Valid n Valid No 1584 630 630 187 728 728Yes 930 370 370 70 272 272Missing 0 00 0 00Total 2514 1000 1000 257 1000 1000Note Control group frequencies are unweighted (a weighted average of controls within the radius calliper is
used in the matching algorithm)
53
Table A31 Frequency of reoffending one-year (PNC) by treatment and control groups
IndicatorControl Treatment
n Valid n Valid 0 1584 630 630 187 728 7281 495 197 197 54 210 2102 203 81 81 11 43 433 117 47 47 3 12 124 53 21 21 1 04 045 33 13 13 1 04 046 8 03 03 0 00 007 7 03 03 0 00 008 6 02 02 0 00 009 1 00 00 0 00 0010 2 01 01 0 00 0011 2 01 01 0 00 0013 0 00 00 0 00 0015 1 00 00 0 00 0018 1 00 00 0 00 0032 1 00 00 0 00 00Missing 0 00 0 00Total 2514 1000 1000 257 1000 1000Note Control group frequencies are unweighted (a weighted average of controls within the radius calliper is
used in the matching algorithm)
54
Table A32 Frequency of reoffences one-year (PNC) by treatment and control groups
IndicatorControl Treatment
n Valid n Valid 0 1584 630 630 187 728 7281 272 108 108 31 121 1212 181 72 72 15 58 583 117 47 47 15 58 584 91 36 36 2 08 085 65 26 26 3 12 126 42 17 17 2 08 087 38 15 15 1 04 048 32 13 13 1 04 049 20 08 08 0 00 0010 19 08 08 0 00 0011 15 06 06 0 00 0012 11 04 04 0 00 0013 6 02 02 0 00 0014 6 02 02 0 00 0015 5 02 02 0 00 0016 1 00 00 0 00 0017 0 00 00 0 00 0018 1 00 00 0 00 0019 1 00 00 0 00 0020 1 00 00 0 00 0021 2 01 01 0 00 0022 2 01 01 0 00 0025 1 00 00 0 00 0039 1 00 00 0 00 00Missing 0 00 0 00Total 2514 1000 1000 257 1000 1000Note Control group frequencies are unweighted (a weighted average of controls within the radius calliper is
used in the matching algorithm)
Table A33 Severe offences reconviction indicator one-year (PNC) by treatment and control groups
IndicatorControl Treatment
n Valid n Valid No 2496 993 993 255 992 992Yes 18 07 07 2 08 08Missing 0 00 0 00Total 2514 1000 1000 257 1000 1000Note Control group frequencies are unweighted (a weighted average of controls within the radius calliper is
used in the matching algorithm)
Ministry of Justice Research Series 1910Evaluation of the impact of the HM Prison Service Enhanced Thinking Skills programme on reoffendingThis research examined the impact of the Enhanced Thinking Skills (ETS) programme on the one-year reconviction outcomes of 257 prison-based participants between 2006 and 2008 Radius propensity score matching was used to match a comparison group that had no statistically significant difference (at the means) to the treatment group on any matching characteristic ETS was found to significantly reduce both the reconviction rate (six percentage points) and frequency (60 reoffences per 100 released prisoners) of general reoffending of participants No statistically significant impact was found on the severe offences reconviction rate Almost identical impacts were found for completers A stronger reduction in reconviction was found for participants meeting the suitability criteria Though the programme has been shown to be effective in practice the findings suggest that a stricter application of the targeting criteria might have further enhanced the effectiveness of the programme
ISBN 978 1 84099 418 6copy Crown copyrightProduced by the Ministry of JusticeAlternative format versions of this report are available on requestE-mail researchjusticegsigovukhttpwwwjusticegovukpublicationsresearchhtm
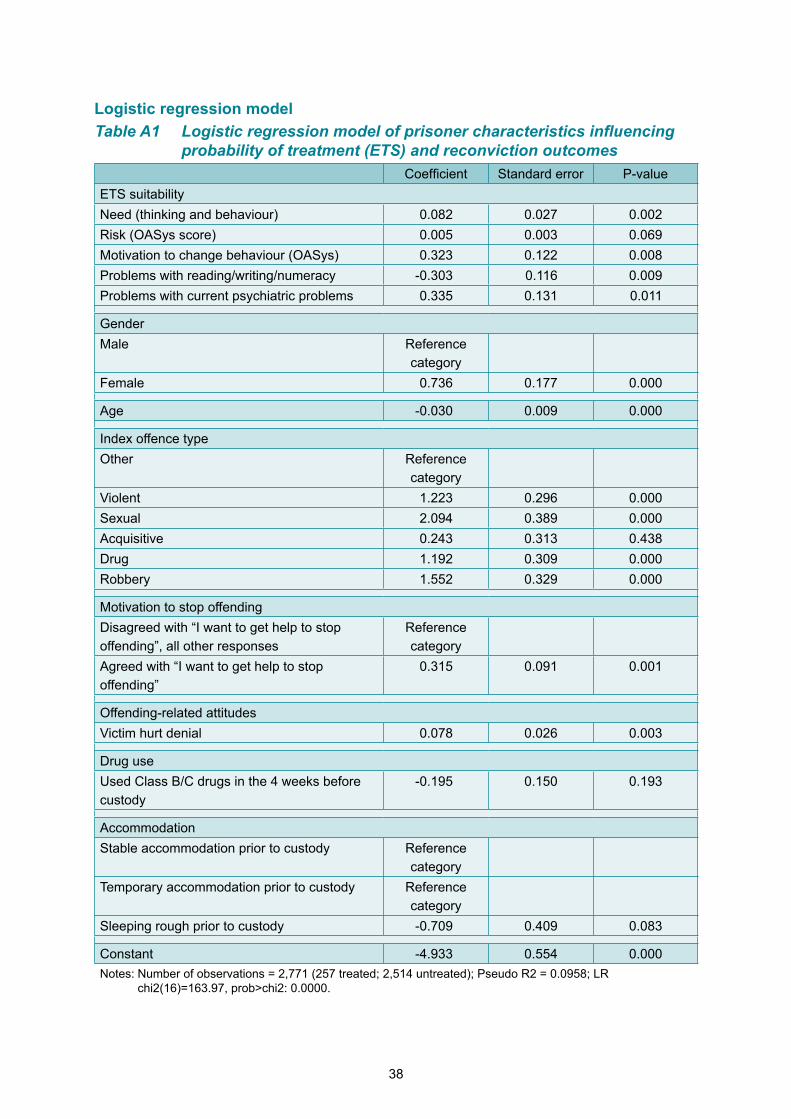
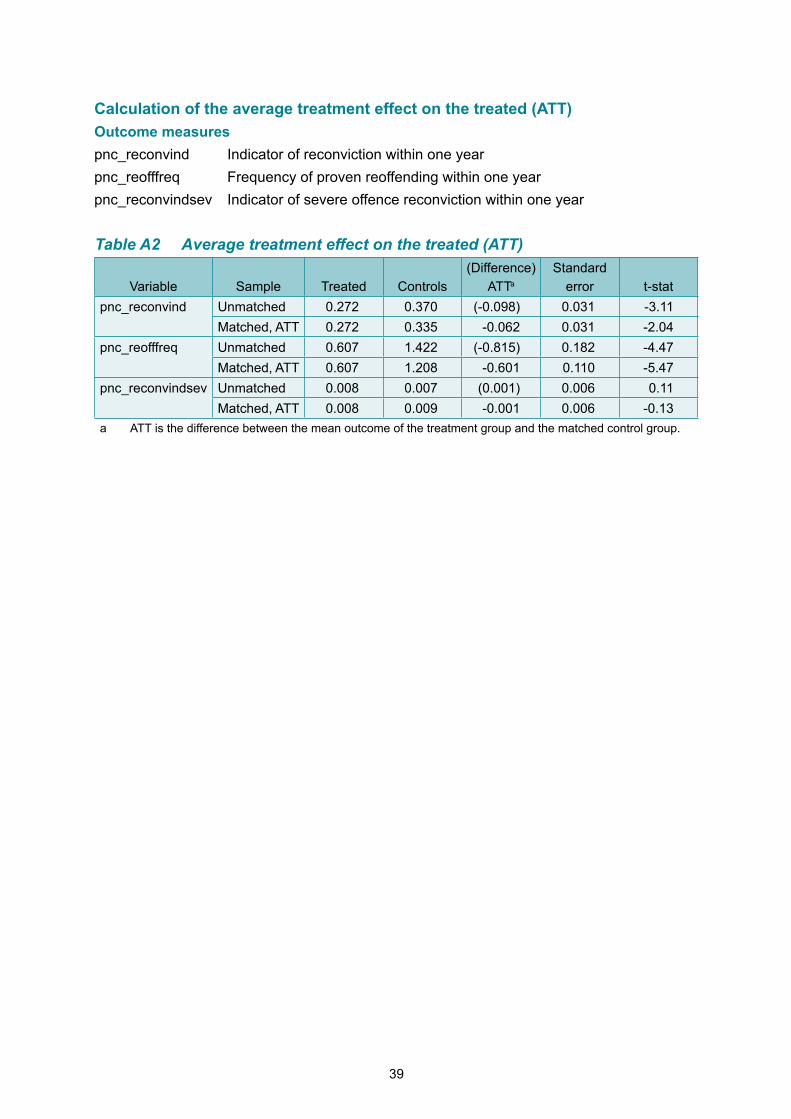
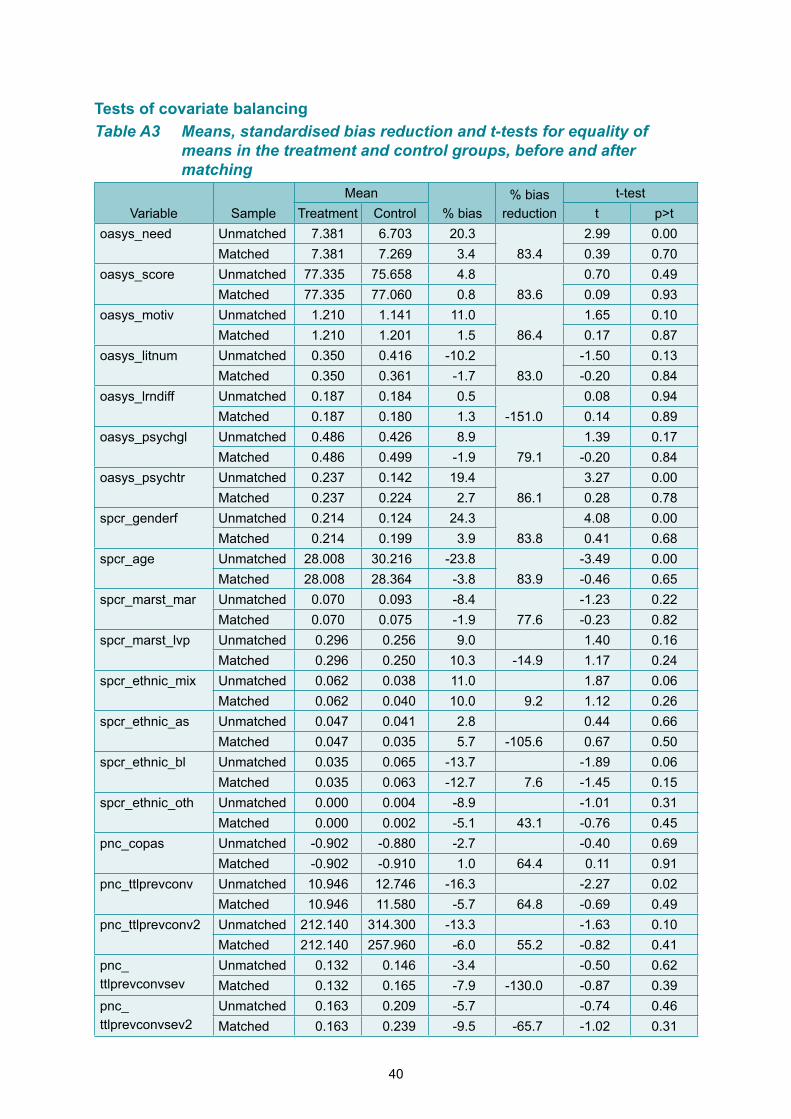
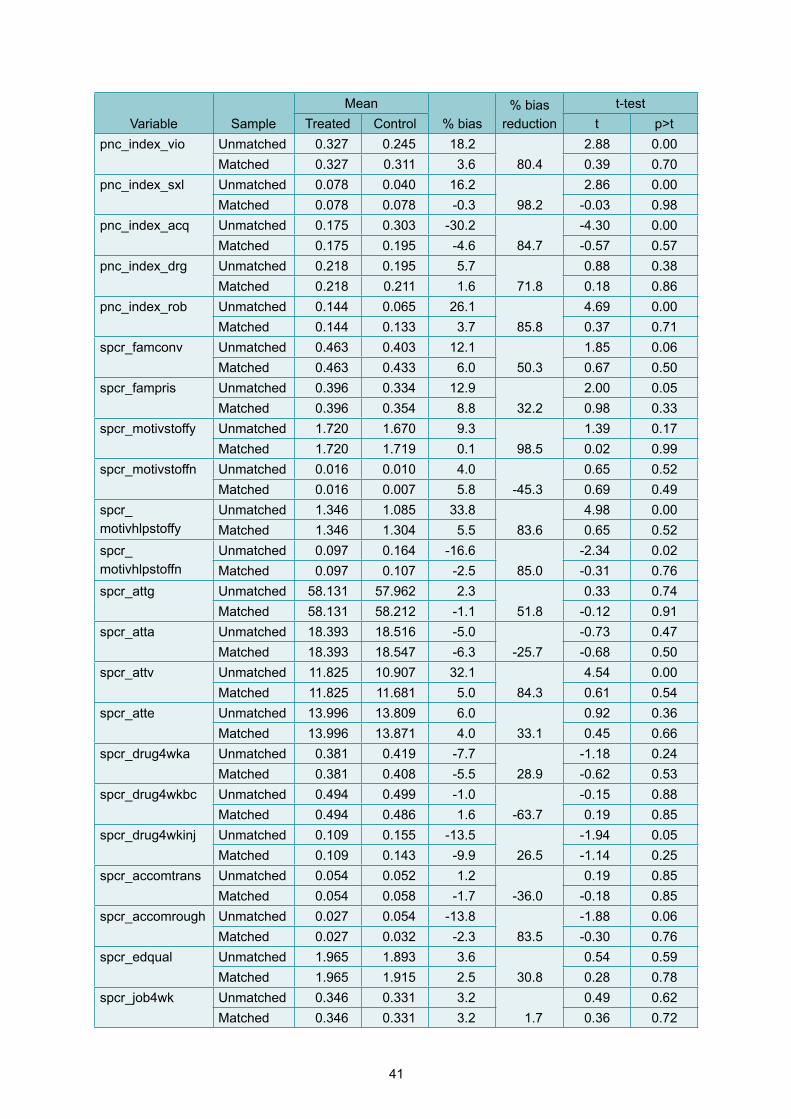
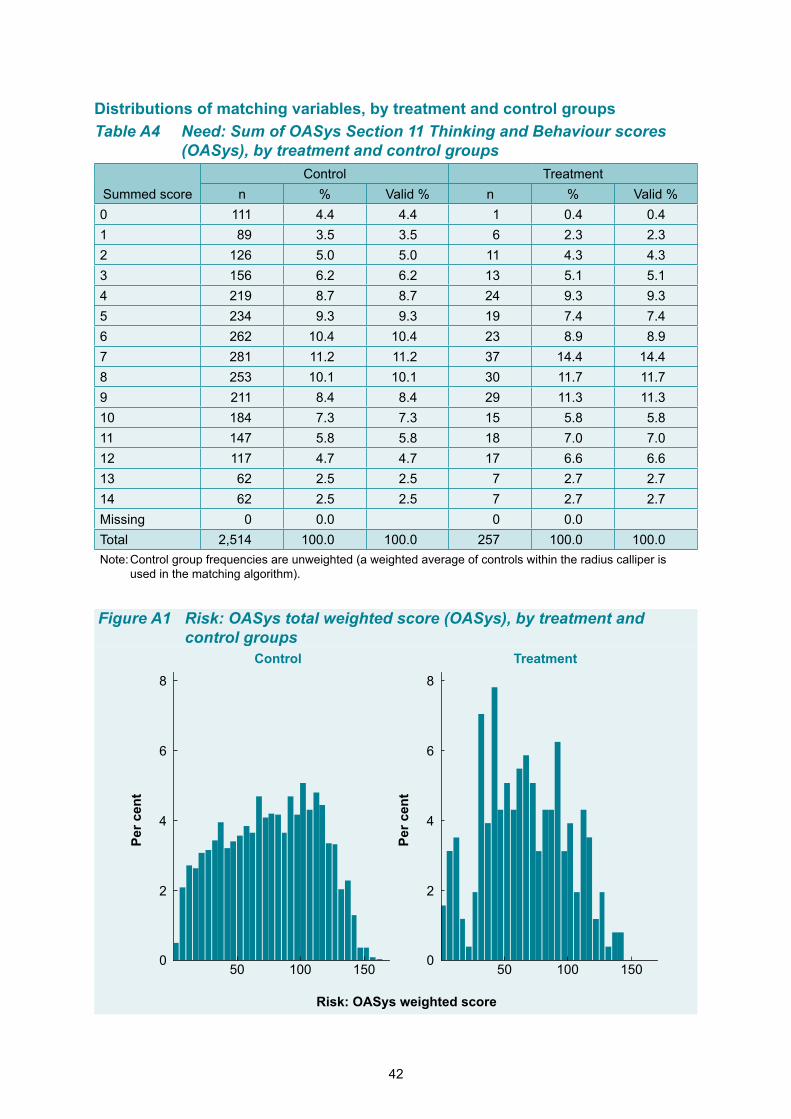
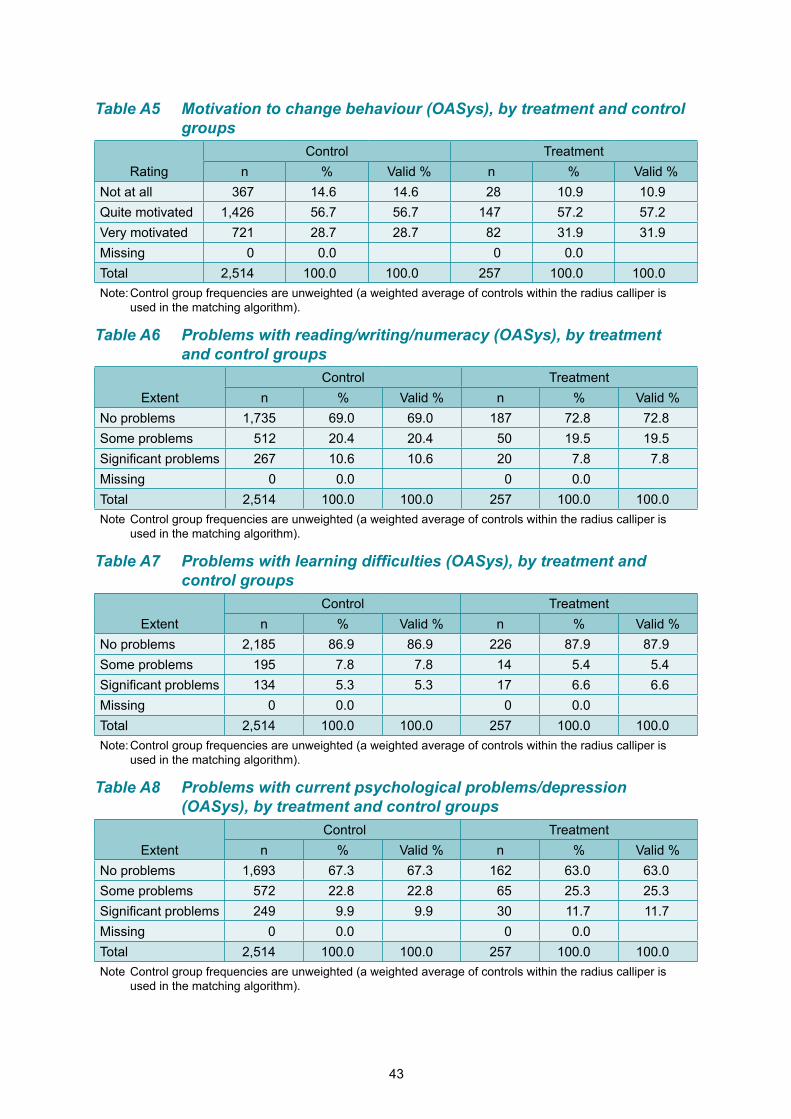
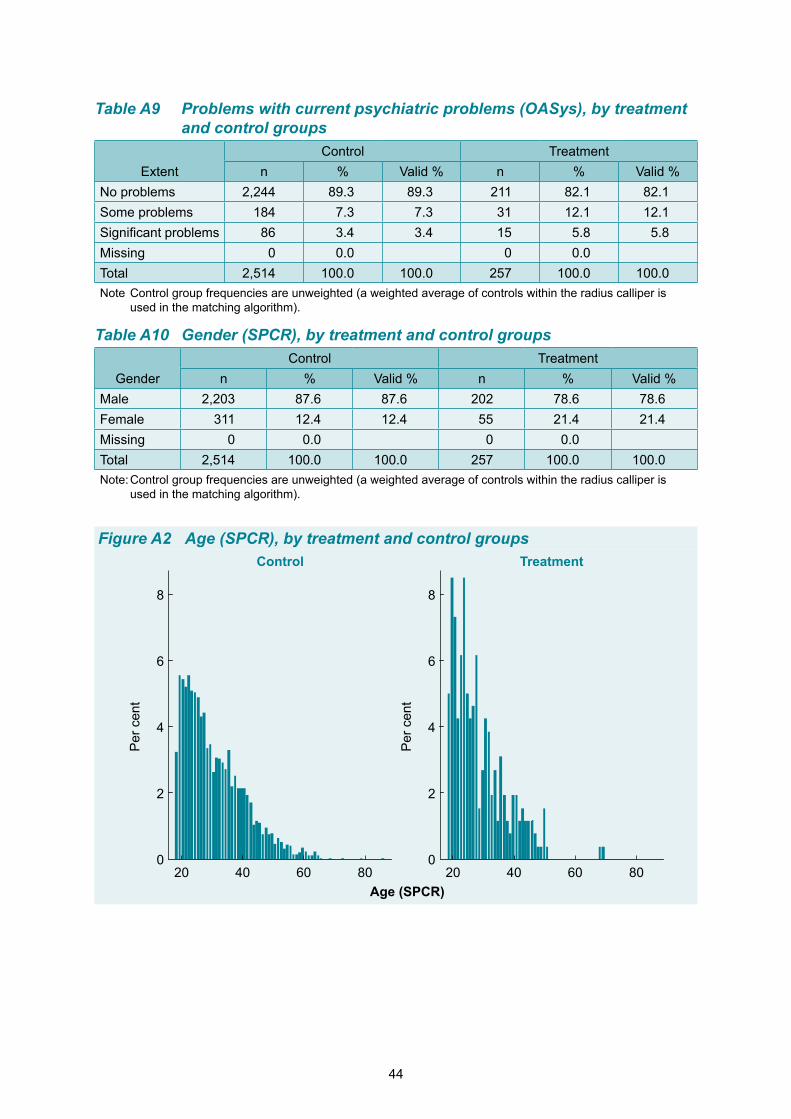
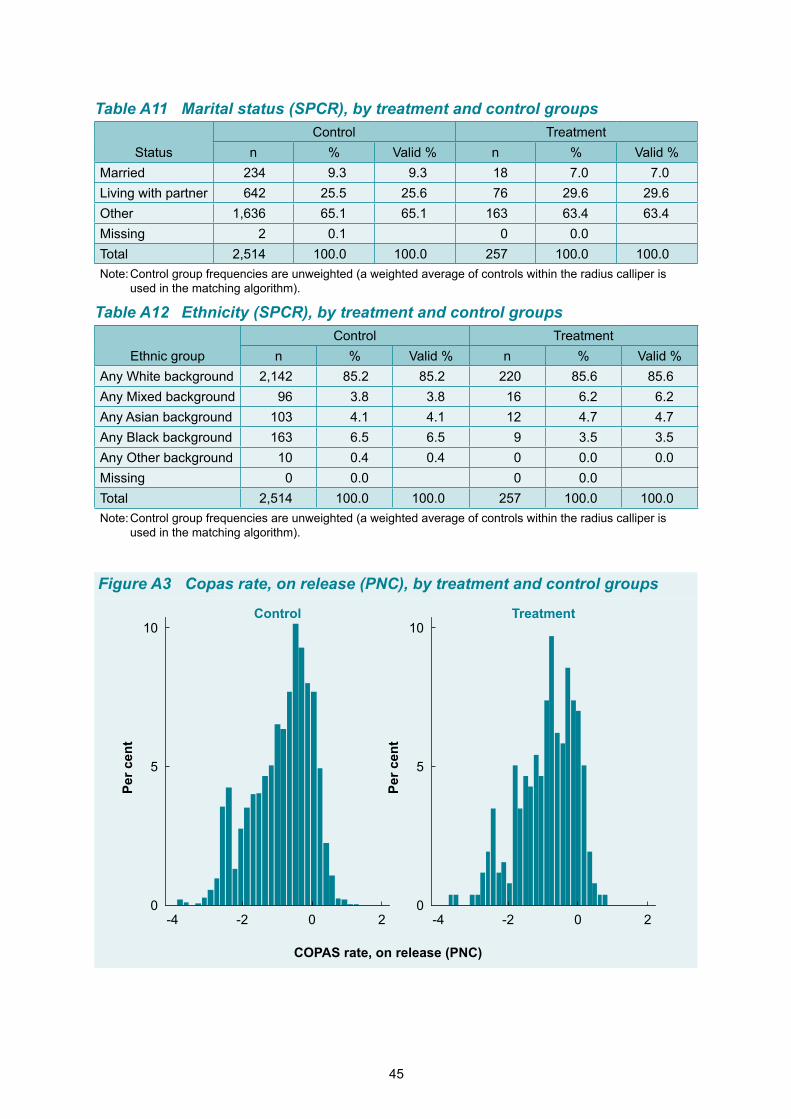
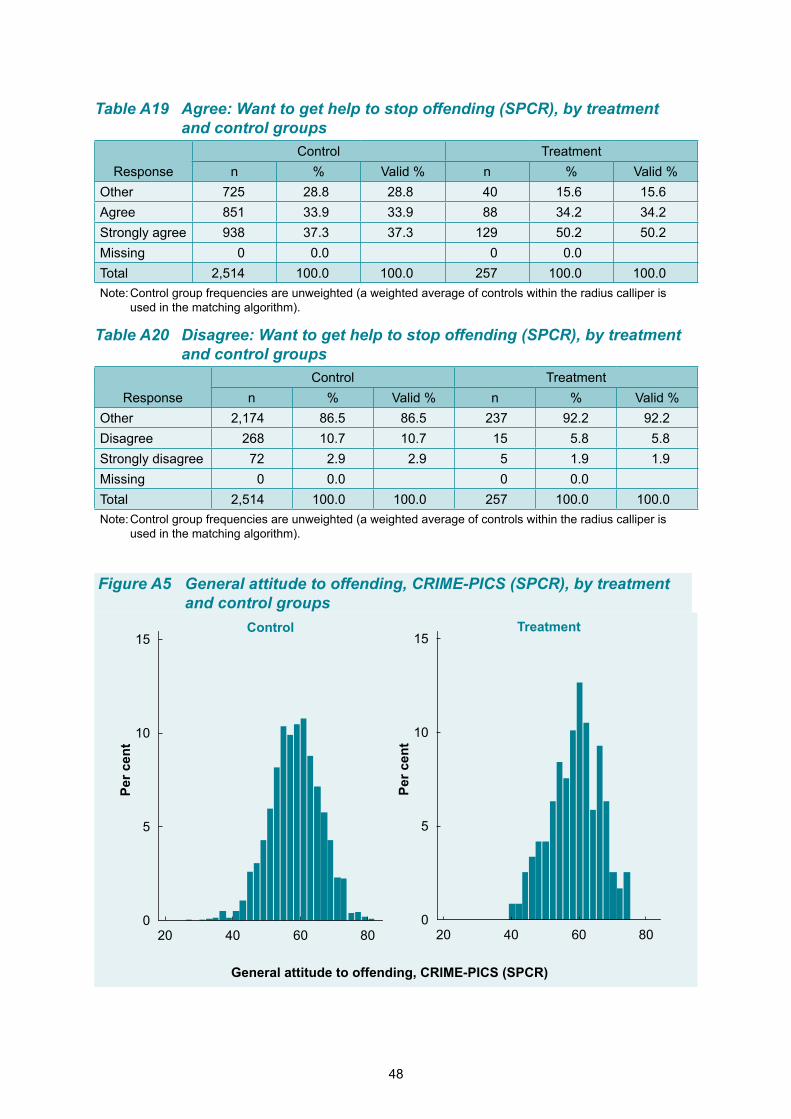
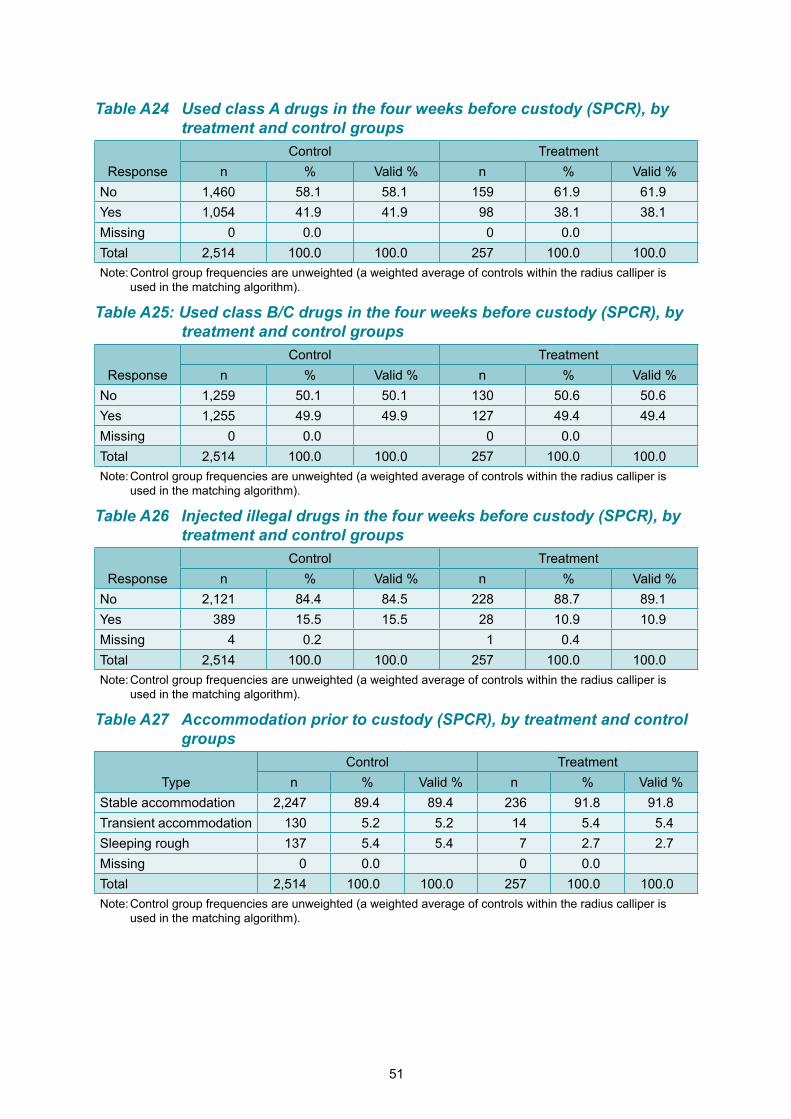
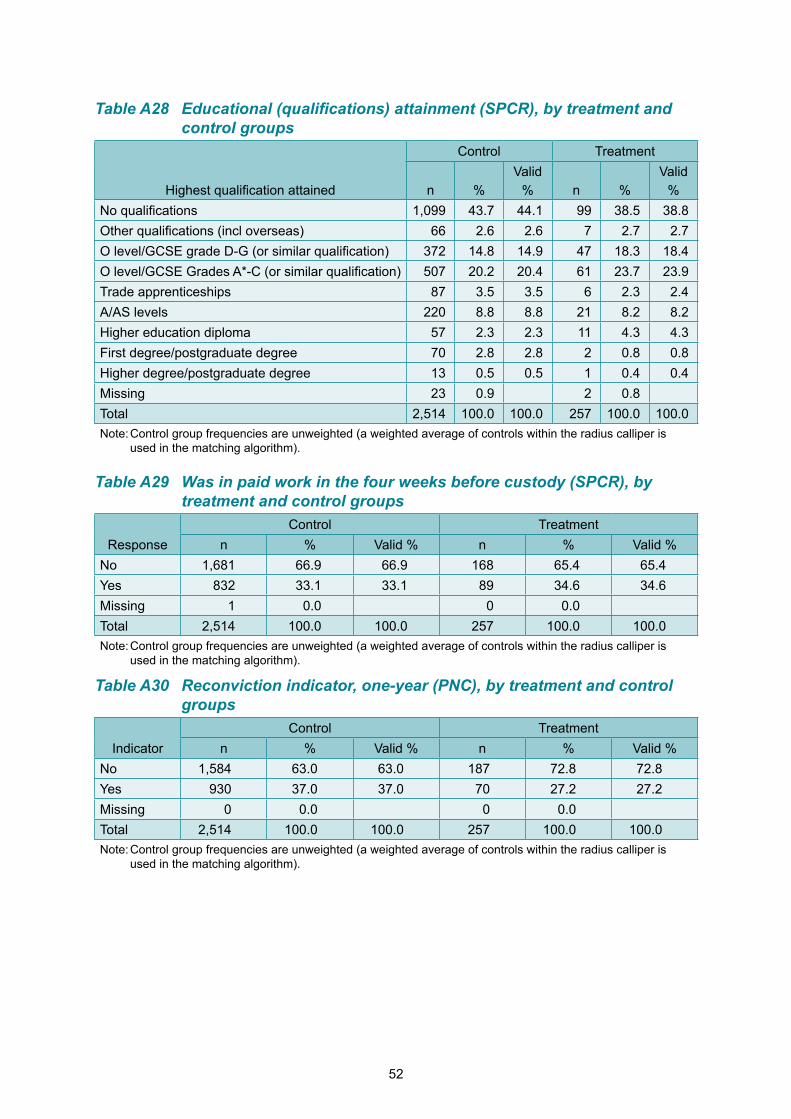
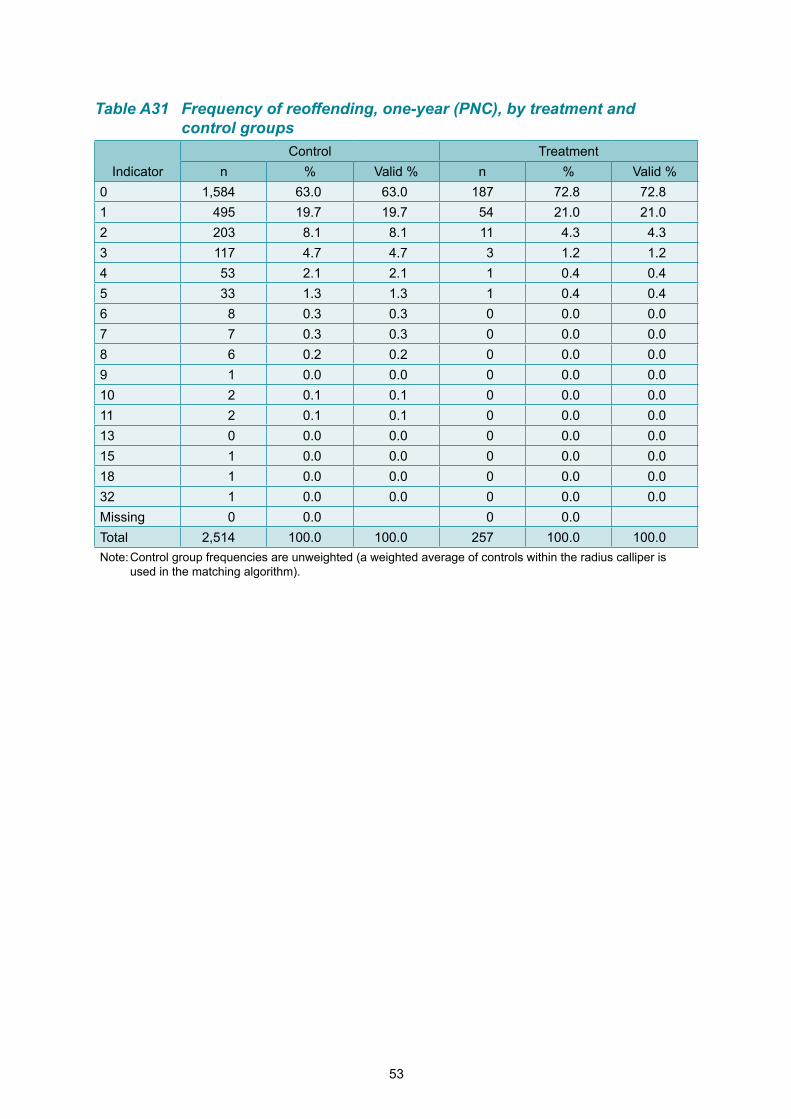
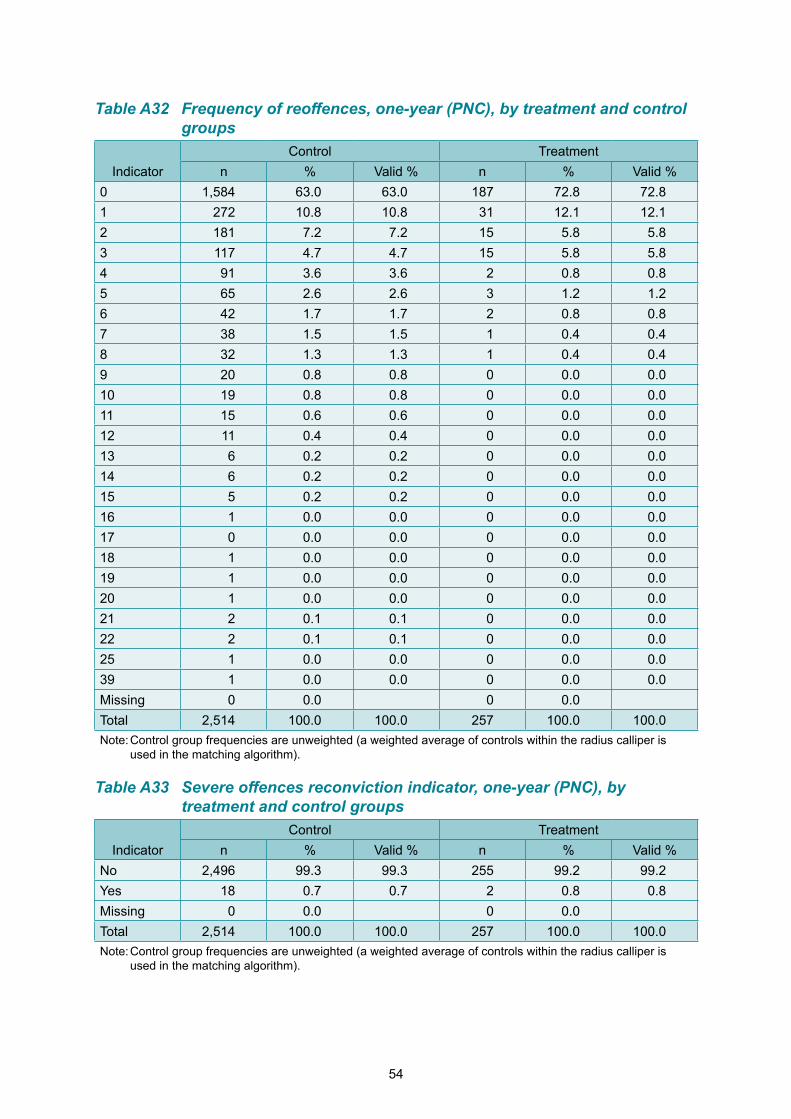