Embed Size (px)
Citation preview

For comments, suggestions or further inquiries please contact:
Philippine Institute for Development Studies Surian sa mga Pag-aaral Pangkaunlaran ng Pilipinas
The PIDS Discussion Paper Series constitutes studies that are preliminary and subject to further revisions. They are being circulated in a limited number of copies only for purposes of soliciting comments and suggestions for further refinements. The studies under the Series are unedited and unreviewed.
The views and opinions expressed are those of the author(s) and do not necessarily reflect those of the Institute.
Not for quotation without permission from the author(s) and the Institute.
The Research Information Staff, Philippine Institute for Development Studies 18th Floor, Three Cyberpod Centris – North Tower, EDSA corner Quezon Avenue, 1100 Quezon City, Philippines Tel Numbers: (63-2) 3721291 and 3721292; E-mail: [email protected] visit our website at http://www.pids.gov.ph
Evaluation of the Impact of the Agricultural Insurance Program of PCIC
on Rice Producers in Region VI
DISCUSSION PAPER SERIES NO. 2016-43
Gay Defiesta and Hanny John Mediodia
December 2016

Evaluation of the Impact of the Agricultural Insurance Program of the Philippine Crop Insurance Corporation (PCIC) on Rice
Producers in Region VI (Western Visayas)
Gay Defiesta and Hanny John Mediodia Division of Social Sciences, College of Arts and Sciences
University of the Philippines Visayas, Miag-ao, Iloilo [email protected]
Abstract
Rice is the most important agricultural commodity in Western Visayas, being one of top producers of rice in the country. Rice production however is a highly risky venture in a disaster-prone Philippines. Output declines were observed in the recent years mostly due to natural disasters. Moreover, majority of the rice farms in the region are small farm holders who are more vulnerable to crop damages and diseases. To reduce small farmers’ vulnerability, the government provides social insurance through the Philippine Crop Insurance Corporation (PCIC). Crop insurance is viewed as a risk management tool that can stabilize farmer’s income and consumption after experiencing perils hence a promising strategy to reduce poverty. Presently, Philippine Crop Insurance Corporation survives out of a huge subsidy from the government. With the substantial amount of public funds that goes to PCIC, it is important to know whether its services brings positive impacts to small-scale farmers. The results of the impact evaluation showed that crop insurance had a positive impact on rice farmers during the period of observation. It increased access to credit, smoothen consumption and increased net income from rice production. The impact on income is particularly pronounced among smaller farms. It is recommended that PCIC should expand to small farm holders to maximize the benefits of the crop insurance program.
Keywords: Impact Evaluation, Crop Insurance, Rice farmers, Western Visayas

2
Chapter 1: Introduction
Rationale
Agriculture is an important sector in Western Visayas for its contribution
to the regional economy and employment. The most recent statistics in 2014
show that agriculture’s gross value added (GVA) in the region amounts to
Php61,309,000 or 8.54 percent of the national aggregate. This is the fourth
highest in the country, next to Central Luzon, Calabarzon and Northern
Mindanao. In terms of employment, the agricultural sector in region VI employs
the most number of people with an incidence of 1.206 million or 10.22 percent
of the total agricultural employment in the country. Unfortunately, the declining
performance of agriculture at the national level can also be observed in Western
Visayas. For the years 2012 to 2014, the average decline in GVA in real terms
in agriculture in the region is roughly more than two percent. Meanwhile, labor
statistics reveal that agricultural workers are among the lowest wage earners
compared to other sectors in the country (Albert, 2013). It is not surprising
therefore for poverty in agriculture to be pervasive and not improving since
2006. Given the challenges posed by climate change and disasters plaguing
the country, farmers are even more vulnerable to income losses, poverty and
food insecurity.
Because of the heavy reliance of a large number of people on
agriculture, the government has been providing various agricultural projects to
enhance production and secure livelihoods. One of these is the provision of
agricultural insurance to lessen farmers’ vulnerability to crop diseases and
natural disasters. Agricultural insurance or crop insurance is a risk-mitigating

3
scheme that aims to maintain small farmers’ income and consumption following
a disaster that caused crop destruction and losses.
Currently, the Philippine Crop Insurance Corporation (PCIC) carries out
its services owing to a huge subsidy provided by the government through its
various programs for marginalized groups such as the agrarian reform
beneficiaries (ARBs). For more than three decades from 1981 to 2013,
however, PCIC has been operating on a negative average net income of Php
8.417 million (Reyes et al., 2015). Without these subsidies, PCIC will not be
viable financially and hence cannot sustain itself. With the substantial amount
of public funds that goes to PCIC, it is important to know whether it creates
positive impacts on small-scale farmers’ income and standard of living.
This research is part of the bigger study headed by Dr. Celia Reyes of
the Philippine Institute for Development Studies (PIDS). The focus of this study
is the impacts of PCIC’s crop insurance on the wellbeing and the ability to cope
with risks of rice farmers in Western Visayas.
Background on Philippine Crop Insurance Corporation and its Insurance Products for Rice
The Philippine Crop Insurance Corporation (PCIC), a government
owned and controlled corporation under the Department of Agriculture (DA), is
the sole provider of crop insurance in the country. The basic mandate of PCIC
is to provide insurance protection to the country’s agricultural producers
particularly the subsistence farmers, against loss of their crops and/or non-crop
agricultural assets on account of natural calamities such as typhoons, floods,
droughts, earthquakes and volcanic eruptions, plant pests and diseases, and/or

4
other perils, as well as provide guarantee cover for production loans extended
by lending institutions to agricultural producers for crops not yet covered by
insurance.” (Lifted from PCIC website, italics mine).
Rice insurance is one of the first and major products of PCIC. The object
of the insurance is the standing rice crop planted on the farmland specified in
the insurance application and which the assured farmer has an insurable
interest on (lifted from the PCIC brochure, Italics mine).
Coverage is based on cost of inputs shown by the farm plan and budget,
plus an additional amount of up to 20 percent of the expected yield value. The
maximum cover is Php41, 000 – Php50,000 for inbred varieties and Php50,000
– Php65,000 for hybrid. Rice insurance is of two types, one that covers multiple
risks and another that assures only of losses arising from natural disasters.
Multi–risk covers crop losses brought about by natural disasters, pest
infestation (rats, locusts armyworms/cutworms, stemborer, blackbugs and
brown planthopper/hopperburn) and plant diseases (tungro, rice blast/neck rot,
grassy stunt, bacterial leaf blight and sheath blight). The natural disaster cover
on the other hand, is limited to losses caused by natural calamities, which
includes typhoons, floods, drought, earthquakes and volcanic eruption.
The insurance premium rate varies per season, risk classification and
amount of subsidy received from lending institutions and government. All
borrowing individual farmers and groups are eligible for crop insurance if they
have obtained production loans from lending institutions that are participants of
either rice production programs implemented by the government or credit
programs sponsored by Government Owned and Controlled Corporations
(GOCCs)/Government Financial Institutions (GFIs)/Non-Government
5
Organizations (NGOs)/Department of Interior and Local Government (DILG)-
Local Government Units (LGUs). Self-financed farmers/farmer groups’
eligibility for crop insurance is dependent on their willingness to be subjected to
the technical supervision of the agricultural production technician accredited by
the PCIC. Lastly, all Farmer Organization (FO) or People’s Organization (PO)
or group of farmers are qualified as specified under the Government
Corporation Insurance System (GCIS).
Farms are also screened for insurance coverage. The eligibility criteria
include presence of effective irrigation and drainage systems, accessibility to
regular means of transportation, production suitability specified by the
recommended package of technology and located in an area with stable peace
and order situation and where there are no threats to health. Moreover, the
farm should not be a portion of riverbed, lakebed, marshland, shoreline or
riverbank. Rainfed farms are qualified but only during wet season.
The PCIC require several documents for rice insurance application.
These requirements vary for individuals and groups. The requirements
common to all, are the Farm Plan and Budget (FPB), which must provide details
on the inputs used and the schedule of farm activities; and the Location Sketch
Plan (LSP)/Control Map (CM) which should specify landmarks and names of
adjacent lots owners.
Farmers or farmer groups may lodge their insurance applications at the
lending institutions where they acquired loans, at the PCIC regional offices or
with PCIC authorized underwriters. Applications may be filed on any day prior
to the planting date until 15 days thereafter.
If loss caused by perils covered by the insurance is experienced, the

6
farmer should file a written Notice of Loss (NL) to the PCIC regional office within
ten days following the damage occurrence and prior to the expected date of
harvest. For losses that are slow occurring and full magnitude is not known
immediately, oftentimes arising from pest infestation, disease or drought, the
NL should be submitted as soon as the damage is discovered. Filing of NL
should also not be later than 20 days before the harvest schedule. The most
important information provided on the NL are the name of the farmer with crop
insurance, CIC and lot number; time when the loss occurred; stage of
cultivation; nature, cause and extent of loss. The farmer or an immediate family
member may claim for indemnity by filling out the PCIC Indemnity Form and
submit this to the regional or satellite office within 45 days following the loss.
Before claims are paid, the PCIC conducts verification and assessment
of insured farms with damaged crops. A two-person team of adjuster, from
PCIC and the DILG/DA/NIA, visits farms to validate notices of loss (NL). Losses
are categorized either as total, partial or no loss. Total loss means the damage
is 90 percent and above; partial loss means damage of more than 10 percent
but below 90 percent of damage; and no loss if damage is just 10 percent and
below. The bases for determining the amount of indemnity paid to the farmer
are the stage of cultivation when the loss occurred; actual cost of production
input (CPI) indicated on the farm plan and budget (FPB); and percentage of
yield loss. To facilitate fast payment of claims, PCIC sets the settlement period
to a maximum of 60 calendar days from the filing of claims. Claims are deemed
approved by PCIC when not acted upon within 60 days.
The other benefits bundled with rice insurance are term insurance and
rebate. Rice insurance comes with a death benefit rider amounting to
7
Php10,000 for every farmer below 75 years old that dies within the period of
coverage. Another benefit is the 10 percent premium rebate, entitled to farmers
with crop insurance who were not able to file indemnity claim for three
consecutive seasons.
Aside from its regular insurance, PCIC also have special programs that
offers rice insurance for free to eligible farmers and farmer groups. Under the
regular program, farmers pay 45 percent share of the premium and the
government shoulders the remaining 55 percent. In the special programs,
farmers enjoy 100 percent subsidy. Currently, PCIC is implementing four
special crop insurance programs, one of these is the Weather Adverse Rice
Areas (WARA). The main target beneficiaries of WARA are farmers located in
areas most vulnerable to climate change with the objective of providing cover
for crop losses arising from weather variability and adverse changes in climate.
WARA is jointly implemented with the Department of Agriculture.
Another special program is Sikat Saka, a rice insurance program tied
with credit. Sikat Saka is carried out with the Department of Agriculture and
Land Bank of the Philippines (LBP). It serves as the credit facility of the Food
Staples Sufficiency Program of the DA. The amount of cover per hectare can
be as high as the loan extended by Land Bank but not to exceed the maximum
cover set by PCIC.
The Department of Agrarian reform in partnership with DA, LandBank of
the Philippines and PCIC also provides free crop insurance under the Agrarian
Production Credit Program and Credit Assistance Program for Program
Beneficiaries Development (APCP-CAP-PBD). The APCP-CAP-PBD is
intended as a low cost credit-financing scheme, market support and

8
development assistance for agrarian reform beneficiaries (ARBs) and their
family members. This is also categorized under the special insurance programs
of PCIC.
Similar to the other special programs of PCIC, the Registry System for
Basic Sectors in Agriculture – Agricultural Insurance Program (RSBSA-AIP)
also provides fully subsidized crop insurance for subsistence farmers included
in the RBSA list. The special insurance program is being financed by the
national government.
In 2014, the PCIC implemented a temporary special insurance program
that gave free crop insurance to help farmers and fishers affected by typhoon
Yolanda. The regions that benefitted were regions 6, 7 and 8. The Yolanda
special program lasted only until 2015.
The PCIC also partners with local government units to provide crop
insurance. In Western Visayas, only Capiz and Negros Occidental had specific
programs that provided free or subsidized crop insurance for selected farmer
beneficiaries. Capiz has the Viable Insurance for Capiz (VIC) Farmers. This
PCIC partnership and Capiz Provincial government partnership started in April
14, 2012, aimed at providing 5,000 rice farmers covering 5,000 hectares of rice
farmland. The program included 16 municipalities of Capiz and its capital,
Roxas city. The program is a multi-risk rice crop insurance that covers
Php10,000 to Php15,000 of losses. The crop insurance also includes accident
and dismemberment riders with Php 50,000 coverage.
The same partnership was fostered by PCIC with the provincial
government of Negros Occidental in 2011. The program in Negros Occidental
was the Negros First Universal Crop Insurance Program (NFUCIP). The initial
9
target was to provide crop insurance subsidy to 10,000 farmers. Out of the
P840 premium amount, Php500 will be shouldered by NFUCIP and the
remaining amount of Php340 will be paid by the farmer. The 500 pesos is
actually a premium payment loan to be repaid by the farmer after harvest
season. The program covers only farmers not included by the RSBSA program
of PCIC. The purpose of NFUCIP is to make crop insurance more accessible
to small farm holders that did not benefit from the special programs of PCIC.
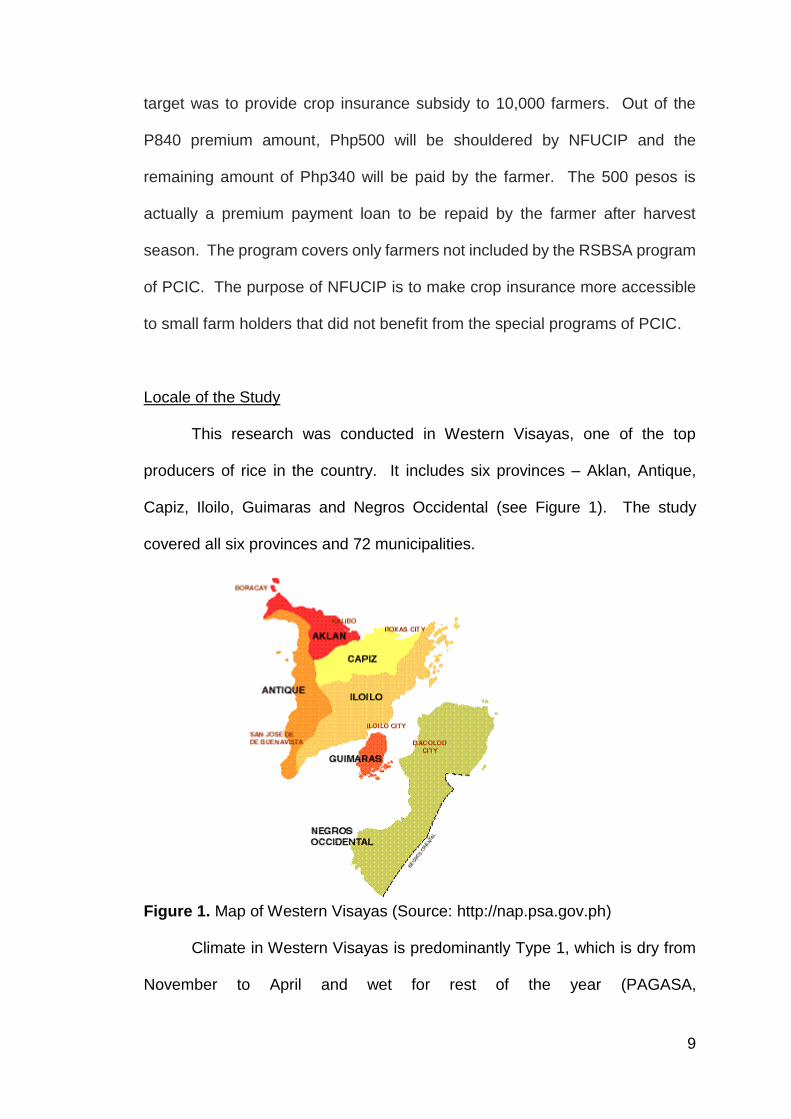
Locale of the Study
This research was conducted in Western Visayas, one of the top
producers of rice in the country. It includes six provinces – Aklan, Antique,
Capiz, Iloilo, Guimaras and Negros Occidental (see Figure 1). The study
covered all six provinces and 72 municipalities.
Figure 1. Map of Western Visayas (Source: http://nap.psa.gov.ph)
Climate in Western Visayas is predominantly Type 1, which is dry from
November to April and wet for rest of the year (PAGASA,

10
http://pagasa.dost.gov.ph/index.php/climate-of-the-philippines). The region
has 16 cities and 117 municipalities. Its total population is at 7.1 million as of
the 2010 census and growing annually at rate of 1.35 percent.
Western Visayas’ gross domestic product (GDP) in 2013 reached Php
270.56 billion, about four percent of the national GDP. Poverty incidence is 22.8
percent, slightly lower compared to the national average of 25.2 percent.
Agriculture is one of the major economic drivers of region 6, contributing 36.8
percent and 23.5 percent to regional employment and output respectively. The
total land area devoted to agricultural production is 666,917 hectares.
Rice is the most important agricultural commodity of the region. It
accounts for one-fourth (24.87 percent) of the total regional value added in
agriculture and about 11-13 percent of the total national production. Rice
production in Western Visayas has been quite erratic for the last six years since
2010. The total rice output was 1.7 million metric tons in 2010, this increased
to 2.92 million mt in 2012 but declined in 2013 to 2.09 million mt. Production
declined further in 2014 to 2.052 million mt and slightly increased to 2.056
million mt in 2015. The major causes of these declines are mostly extreme
weather events such as strong typhoon, heavy rains or El Nino.
Iloilo province is the biggest producer of palay among the six provinces
of region 6, contributing 37-43 percent of the regional palay output. Negros
Occidental comes second and contributes about 21-24 percent. The third
biggest rice producer is Capiz, with an output equivalent to 14-19 percent of the
region’s total rice output.

11
Table 1: Volume and Percent distribution of Palay Production by Province in Western Visayas from 2010-2015.
Location 2010 % 2011 % 2012 % 2013 % 2014 % 2015 %
Aklan 103,625 6 126,657 6 129,645 6 135,293 6 104,712 5 106,329 5
Antique 211,466 12 287,036 13 273,468 12 286,622 14 280,084 14 285,203 14
Capiz 335,608 19 349,094 16 360,914 16 322,388 15 291,158 14 256,823 12
Guimaras 42,716 2 51,413 2 55,425 2 46,066 2 51,202 2 40,154 2
Iloilo 659,970 37 959,239 43 995,402 43 822,452 39 846,636 41 877,076 43
Negros Occidental
436,308 24 471,599 21 477,347 21 477,969 23 478,782 23 491,239 24
Total 1,789,693 100 2,245,038 100 2,292,201 100 2,090,790 100 2,052,574 100 2,056,824 100
Rice farm gate prices in Western Visayas is also not stable. For the
three year period from 2013 to 2015, average farm gate prices per kilogram
were Php15.36, Php 18.65 and Php16.70 respectively. The average net return
per hectare per annum from 2013-2015 are Php7,897; P22,852 and
Php17,670.
Rice Farming in Western Visayas
Rice farming in the Western Visayas lasts for three to four months.
There are two cropping cycles for one year, depending on water availability.
Farms with access to regular irrigation however, can have as much as three
cropping periods. The first cropping period falls during the rainy season.
Planting or sowing commences either in May or June while harvest starts from
September or October. The second cropping period falls during the dry season.
The production cycle starts in either October or November lasting until January
or February.
More than half of the farms in Region 6 are rainfed. The total area
devoted to rice from 2013 to 2015 is about 619,105 hectares on average but
only 48 percent is irrigated and the remaining 52 percent is rain fed. Moreover,

12
“the irrigation systems of the National Irrigation Administration are mostly run-
off the river type, which make the 35% to 45% irrigated rice areas similar to rain
fed conditions during the dry cropping season” (PhilRice Negros, 2012).
Table 2: Physical Area and Percent Distribution of Farms Devoted to Rice by Irrigation Type in Western Visayas from 2013-2015.
Irrigation Type
2013 2014 2015
Area (ha) % Area (ha) % Area (ha) %
Irrigated 288,187 47 296,174 48 304,733 49
Rainfed 328,086 53 322,553 52 317,582 51
Total 616,273 100 618,727 100 622,315 100
Rice planting methods vary depending on water availability. Some
farmers use transplanting technique while others are into direct seeding which
can be done by broadcast, drilling or by dibbling. Direct seeding requires fewer
labor and places less stress on the plant compared to transplanting. The
disadvantages however include exposure of seeds to pests such as birds and
snails, more seed requirement and greater crop-weed competition.
Most farmers in Region 6 plant only one crop on their field. This is also
true for rice farms in Western Visayas. Mono-cropping is the most common
cropping system. The more enterprising farmers however, are into
intercropping or growing other crops simultaneously or interchangeably with
rice after it is harvested. The most common crops planted with rice are
mungbean and watermelon. Watermelon is usually planted after rice is
harvested.
Rice farmers in Western Visayas use inbred varieties. Only a few use
hybrid variety. This is due to the higher cost of hybrid seeds compared to inbred
seeds. Another reason is attitude towards new technology. Farmers do not

13
easily take on new technology, they tend to stick to the one that they are
accustomed to.
Inorganic fertilizers such as Urea, Complete (14-14-14), Ammosul and
Ammopho, are still the most commonly used fertilizers for rice farms in the
region. The average usage of Urea and Complete for the period of five years
from 2010 to 2014 are 87.2 kgs/hectare and 68.5 kgs/hectare respectively.
Usage of Ammosul at 35.9 kg/ha and Ammopho at 28.8 kg/ha was much lesser
during the same period.
Labor utilization depends on the size of the farm. Smaller farms of less
than a hectare are usually tilled by their owner and use only unpaid family labor.
Farm work are oftentimes done manually or with an aid of a carabao/cow for
plowing. Labor, if ever hired, is paid either on a daily per piecework basis or
through pakyaw system or contract labor arrangement. Under the pakyaw
system, labor is paid depending on the contract price agreement, the prevailing
rate in the barangay is usually being followed. Contract labor is hired to either
do a portion of the farming process such as land preparation; or the whole
production process from land preparation to harvesting. Farmers involved in
doing all the farm work are shareworkers, who serve as the farm’s regular
laborers and are paid by the percentage share of the harvest.

14
Chapter 2: Framework
Insurance as a Risk Management Tool
In a disaster prone country like the Philippines, rice farmers face a lot of
hazards brought about by extreme weather events, pests and crop diseases.
All these pose threats to production, income and food security that renders
small-scale farming households highly vulnerable. This is true for Western
Visayas when Typhoon Yolanda struck the region in 2013. Farmers and fishers
were among the hardest hit. Most of them had difficulty recovering from the
calamity due to lack of sufficient safety nets.
Crop insurance can serve as a buffer following major disasters such as
typhoon Yolanda. In countries like China and Vietnam, crop insurance have
played a major role in maintaining food and livelihood security among farmers,
fishers and aquaculture operators.
Source: PIDS presentation
Figure 2. Role of Insurance

15
The diagram above shows the role of crop insurance as a risk
management tool. Its purpose is to manage perils intrinsic in agricultural
production, stabilize farmers’ finances and enhance their access to credit. Crop
insurance therefore is viewed as an important solution to lessen farmers’
vulnerability by providing protection from risks. It can serve as safety net when
disasters strike by smoothing income and consumption. With insurance, the
negative impacts from crop damages are reduced and farmers are able
continue farming and recover faster from damage. Moreover, potential benefits
from insurance can even extend beyond risk protection. It can increase
farmers’ access to formal credit; promote good agricultural practices and
encourage investment in more productive farming technologies.
Theory of Change
The impacts of crop insurance on farmers’ well-being is best illustrated
by the theory of change developed for this project.
Figure 3. Theory of change

16
The theory of change shown by the figure above provides details on the
impacts of crop insurance on farmers. The inputs for the intervention are PCIC
capitalization for personnel salaries and operating expenses, national and local
government budgetary allocations for premium subsidy, services of PCIC
personnel and PCIC regional and extension offices. The activities include
designing of insurance products, identifying eligible farmers for insurance,
fostering partnerships with formal credit institutions, LGUs and other
stakeholders and building capacities of PCIC partners. The primary output is
the offering of crop insurance to qualified farmers. These cause intermediate
outcomes of enrolment of qualified farmers to insurance, enhanced access to
credit, investment in productive activities and receipt of indemnity claims from
PCIC when shocks occur. The final outcome is stabilized income leading to
smoothened consumption, increased savings and investment in productive
assets. The intermediate and final outcomes are eventually translated into
positive impacts of reducing transient and chronic poverty among farmers.
Based on this theory of change, this study aims to determine whether these
impacts are indeed realized with crop insurance.
Objective
This study is anchored on the theory of change explained above. The
aim of this study is to assess the impact of crop insurance on rice farmers’ well
being in Western Visayas particularly on their net income from rice farming.
17
Chapter 3: Methodology
The research follows a quasi-experimental design to evaluate the
impacts of crop insurance program on rice farmers. Unlike, randomized
controlled trials (RCTs), quasi-experiments lack random assignment (UNICEF,
2014). Quasi - experiments are appropriate for projects that were already
implemented like the crop insurance program of the PCIC.
The period covered by the study is two years, from October 2013 to
October 2015. The eligible population consists of rice farmers included in the
Registry System for Basic Sectors in Agriculture (RSBSA) list and were located
in areas where there were indemnity claims.
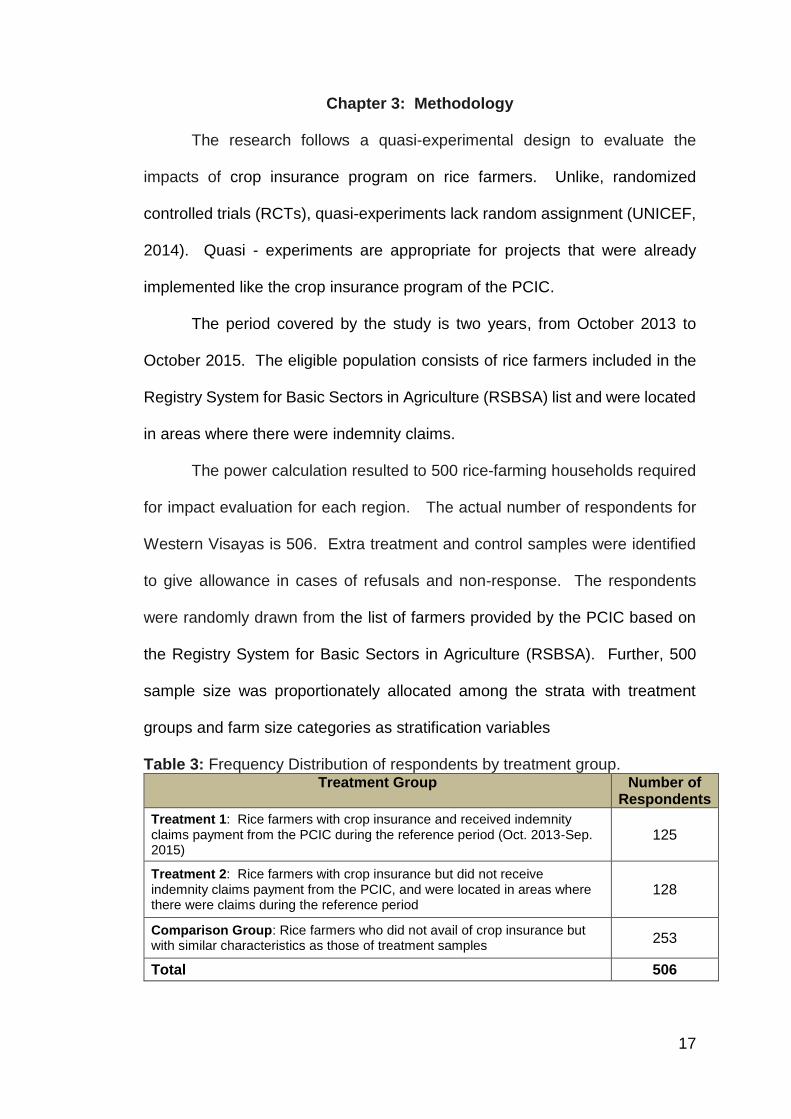
The power calculation resulted to 500 rice-farming households required
for impact evaluation for each region. The actual number of respondents for
Western Visayas is 506. Extra treatment and control samples were identified
to give allowance in cases of refusals and non-response. The respondents
were randomly drawn from the list of farmers provided by the PCIC based on
the Registry System for Basic Sectors in Agriculture (RSBSA). Further, 500
sample size was proportionately allocated among the strata with treatment
groups and farm size categories as stratification variables
Table 3: Frequency Distribution of respondents by treatment group. Treatment Group Number of
Respondents
Treatment 1: Rice farmers with crop insurance and received indemnity claims payment from the PCIC during the reference period (Oct. 2013-Sep. 2015)
125
Treatment 2: Rice farmers with crop insurance but did not receive indemnity claims payment from the PCIC, and were located in areas where there were claims during the reference period
128
Comparison Group: Rice farmers who did not avail of crop insurance but with similar characteristics as those of treatment samples
253
Total 506

18
Control samples were identified based on five (or at least 3) critical
matching variables, namely: area devoted to rice, farm location, ARB status,
access to irrigation, and farm tenure status.
Data were gathered through a survey that made use of a questionnaire
administered using a tablet computer. The instrument included questions
pertaining to respondent/household information, housing, household and
assets, access to physical infrastructure, economic support and agricultural
services, farm characteristics, production and farm income, credit availment
practices, income and other receipts, shocks and coping, risk mitigation
strategies in crop production, utilization of indemnity claim payment, and
willingness to pay for rice insurance. The data were analyzed using probit
regression, random effects panel regression and t-tests.

19
Chapter 4: Results
Profile of Rice Farmers and Household
The rice farmers included in the study were mostly married males (87
percent) and generally advanced in years, aged fifty years and above. Almost
all are literate with 99 percent having at least primary education; which makes
only about four out of the 506 not having any formal schooling. Moreover, one-
third or 33 percent either reached or graduated college. Farming experience
on the other hand, varies from one year to 79 years but majority are
experienced farmers who are into farming for more than 20 years.
Table 4. Profile of Farmers by Treatment Group
With Insurance,
with claims
With insurance,
without claims
Without insurance
Total
Age (years) 54 53 54 54
HH Size 4.5 4.6 4.4 4.5
Sex (percent)
Male 85.6 88.3 86.2 86.6
Female 14.4 11.7 13.8 13.4
Education (percent)
No grade Completed 1.6 0.8 0.4 0.8
Primary 39.2 43.8 45.1 43.3
Secondary 22.4 16.4 26.5 22.9
Post-secondary/Tertiary 36.8 39.1 28.1 33.0
Civil Status (percent)
Single 8.8 5.5 9.1 8.1
Married 82.4 86.7 75.5 80.0
Widowed 7.2 6.3 11.5 9.1
Divorced/Separated 0.4 0.2
Common Law/Live-in 1.6 0.8 3.6 2.4
Unknown/No answer 0.8 0.2
Average Years in Farming 27 25 26 26

20
The farming households included in the research, have an average
size of 4.5 members, which is almost the same as the national average of 4.6
Of the 506 farmers respondents, only 257 (50.8 percent) are members of
farmer’s organization, most of whom availed agricultural insurance. As
presented in the table below, only few farmers are members of cooperatives
(3.0 percent) and most are members of farmer’s organizations (43.7 percent).
Many farmers’ cooperatives have been established in the municipalities of the
region but most of these were not sustained due to financial problems.
Table 5: Percentage Distribution of Farmers, by type of organization and treatment group, 2014-2015
With Insurance,
with claims (n=125)
With insurance,
without claims (n=128)
Without
insurance
(n=253)
Total
(n=506)
Farmer's Association 52.0 56.3 33.2 43.7
Cooperative 4.8 5.5 0.8 3.0
Senior Citizens Organization 0.0 1.6 4.0 2.4
Agrarian Reform Beneficiary Organization 0.8 2.3 0.4 1.0
Others 0.8 0.8 0.8 0.8
Total 58.4 66.4 39.1 50.8
Household assets are indicators of lifestyle and provide a picture of a
household’s standard of living. Compared to the other two groups, a bigger
percentage of farmers belonging to T1 or those with insurance and with
claims own more high value household assets such as motorcycle,
refrigerator, washing machine and personal computer compared to the other
two group of farmers. In almost all type of household assets in the list, T1
farmers have higher ownership percentage compared to the other two groups
of farmers.

21
Table 6. Percentage Distribution of Households by Type of Household Asset
With Insurance, with claims
(n=125)
With insurance,
without claims (n=128)
Without
insurance (n=253)
Total
(n=506)
Car 4.8 3.1 4.0 4.0
Motorcycle 43.2 27.3 37.9 36.6
Airconditioning Unit 4.8 1.6 2.4 2.8
Washing Machine 13.6 11.7 7.9 10.3
Stove 16.8 4.7 11.9 11.3
Refrigerator 46.4 32.0 37.2 38.1
Personal Computer 8.0 4.7 6.3 6.3
Cellular Phone 89.6 87.5 84.6 86.6
Audio Component 8.8 9.4 8.7 8.9
Karaoke/Videoke Machine 4.0 3.9 4.0 4.0
DVD/CD/VCD Player 24.8 29.7 31.2 29.2
Television 84.8 81.3 79.1 81.0
Radio/Cassette Player 51.2 48.4 44.3 47.0
Farm assets consist of equipment, machines, tools and facilities used in
crop production and harvesting. The same trend is observed as with household
assets, the group of farmers with crop insurance and has received indemnity
payments had more farms assets compared to the other respondent groups.
These assets are also of high value such as hand tractor, thresher, storage
facility and pump and are not easily affordable. This indicates that more T1
farmers are able to afford such equipment compared to the other farmers in the
study.
Table 7. Percentage of Households by Type of Farm Asset
With Insurance, with
claims (n=125)
With insurance,
without claims (n=128)
Without
insurance (n=253)
Total
(n=506)
4-wheel Tractor 1.6 0.0 0.4 0.6
Hand Tractor 32.8 16.4 24.5 24.5
Truck 0.8 1.6 1.2 1.2
Thresher 15.2 6.3 12.6 11.7
Plow 32.8 30.5 26.5 29.1
Storage/Bodega 4.0 1.6 3.6 3.2
Jetmatic Pump 18.4 12.5 13.8 14.6
Cart 4.0 5.5 4.7 4.7

22
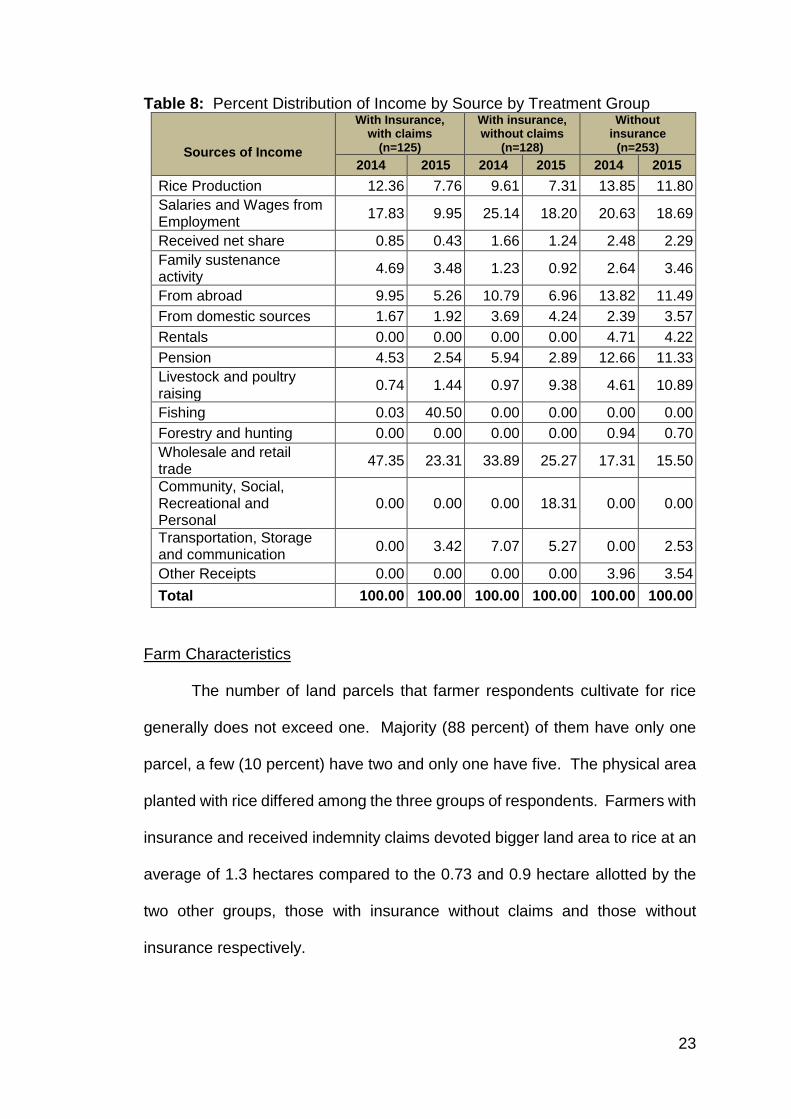
Sources of Income
The rice farming households included in the study have at least 15
sources of income. The sources that contribute more to total household income
are rice production, employment, local and international remittances, wholesale
and retail trade. Rice production added about 7 – 14 percent to household
income during the reference period. Wholesale and retail trade contributed the
highest portion of income, from 15 – 47 percent. Wholesale and retail trade
includes sari-sari store operation and other businesses.
Income from rice production declined in 2015 across all treatment
groups. This is not only for rice crop production but for almost all income
sources. For treatment 1 farmers, the decline in rice production, remittances,
pension and retail trade were compensated by income from fishing. Among
Treatment 2 farmers, livestock and community and social and recreational
income increased to cover for the decreases in income from rice farming,
salaries and wages and remittances. For farmers without insurance, the
decrease in rice farming, salaries and wages were offset by increases in,
income from livestock and poultry and transportation.
23
Table 8: Percent Distribution of Income by Source by Treatment Group
Sources of Income
With Insurance, with claims
(n=125)
With insurance, without claims
(n=128)
Without insurance
(n=253)
2014 2015 2014 2015 2014 2015
Rice Production 12.36 7.76 9.61 7.31 13.85 11.80
Salaries and Wages from Employment
17.83 9.95 25.14 18.20 20.63 18.69
Received net share 0.85 0.43 1.66 1.24 2.48 2.29
Family sustenance activity
4.69 3.48 1.23 0.92 2.64 3.46
From abroad 9.95 5.26 10.79 6.96 13.82 11.49
From domestic sources 1.67 1.92 3.69 4.24 2.39 3.57
Rentals 0.00 0.00 0.00 0.00 4.71 4.22
Pension 4.53 2.54 5.94 2.89 12.66 11.33
Livestock and poultry raising
0.74 1.44 0.97 9.38 4.61 10.89
Fishing 0.03 40.50 0.00 0.00 0.00 0.00
Forestry and hunting 0.00 0.00 0.00 0.00 0.94 0.70
Wholesale and retail trade
47.35 23.31 33.89 25.27 17.31 15.50
Community, Social, Recreational and Personal
0.00 0.00 0.00 18.31 0.00 0.00
Transportation, Storage and communication
0.00 3.42 7.07 5.27 0.00 2.53
Other Receipts 0.00 0.00 0.00 0.00 3.96 3.54
Total 100.00 100.00 100.00 100.00 100.00 100.00
Farm Characteristics
The number of land parcels that farmer respondents cultivate for rice
generally does not exceed one. Majority (88 percent) of them have only one
parcel, a few (10 percent) have two and only one have five. The physical area
planted with rice differed among the three groups of respondents. Farmers with
insurance and received indemnity claims devoted bigger land area to rice at an
average of 1.3 hectares compared to the 0.73 and 0.9 hectare allotted by the
two other groups, those with insurance without claims and those without
insurance respectively.

24
While farm sizes devoted to rice were different in the three treatment
groups, cropping system is not. An overwhelming majority (92 percent) did not
plant any other crop aside from rice. Only eight percent of the respondents
practiced intercropping. This result implies that most rice farmer respondents
are not into crop diversification because it entails additional knowledge of
farming techniques of other crops. Intercropping also requires more capital
outlay because it is a different production process with different inputs and labor
needs.
The most common land tenure for the sample rice farms is full ownership
followed by tenanted and leased/rented. About 42-50 percent of the farmers
across the three groups of respondents fully own the farm lots that they
cultivate, about 19-26 percent are tenants or shareholders, about the same
percentage (20-24 percent) are leaseholders. The other types of tenure status
are holders of certificates of land ownership awards (CLOA) or similar
arrangements.
Table 9. Characteristics of Farms by Treatment Group
With Insurance,
with claims
With insurance,
without claims
Without insurance
Total
Average Number of Parcels Planted 1.2 1.15 1.14 1.16
Average Physical Area Planted (ha) 1.3 0.73 0.97 0.99
Cropping System (percent)
Monocropping 92.7 92.6 91.7 92.2
Intercropping 7.3 7.4 7.6 7.5
Both 0.7 0.3
Tenurial Status by Farm Parcel (%)
Fully Owned 45.3 50.0 42.4 45.1
Tenanted 22.7 18.9 26.0 23.4
Rented/Leased 20.0 23.6 22.9 22.4
Held under CLOA 4.0 4.1 2.8 3.4
Owner-like possession on other than CLT/CLOA
2.0 0.7 0.7 1.0
Others 6.0 2.7 5.2 4.8
25
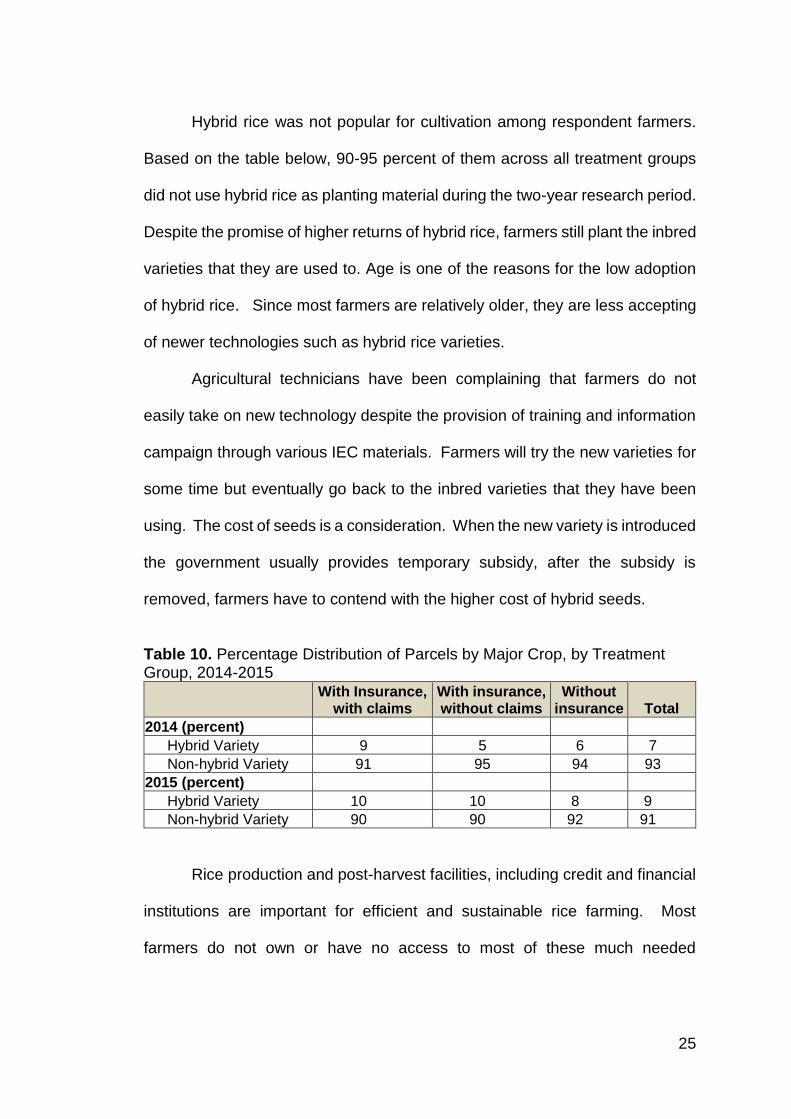
Hybrid rice was not popular for cultivation among respondent farmers.
Based on the table below, 90-95 percent of them across all treatment groups
did not use hybrid rice as planting material during the two-year research period.
Despite the promise of higher returns of hybrid rice, farmers still plant the inbred
varieties that they are used to. Age is one of the reasons for the low adoption
of hybrid rice. Since most farmers are relatively older, they are less accepting
of newer technologies such as hybrid rice varieties.
Agricultural technicians have been complaining that farmers do not
easily take on new technology despite the provision of training and information
campaign through various IEC materials. Farmers will try the new varieties for
some time but eventually go back to the inbred varieties that they have been
using. The cost of seeds is a consideration. When the new variety is introduced
the government usually provides temporary subsidy, after the subsidy is
removed, farmers have to contend with the higher cost of hybrid seeds.
Table 10. Percentage Distribution of Parcels by Major Crop, by Treatment Group, 2014-2015
With Insurance,
with claims With insurance, without claims
Without insurance Total
2014 (percent)
Hybrid Variety 9 5 6 7
Non-hybrid Variety 91 95 94 93
2015 (percent)
Hybrid Variety 10 10 8 9
Non-hybrid Variety 90 90 92 91
Rice production and post-harvest facilities, including credit and financial
institutions are important for efficient and sustainable rice farming. Most
farmers do not own or have no access to most of these much needed

26
equipment and facilities but some are available in the barangay. Awareness
among farmers is important, so that availment is possible when the need arises.
Among the facilities that at least 30 percent of the farmers across
treatment groups are aware of are related to rice production and harvesting,
such as sun drying pavement, thresher and rice mill. These facilities are widely
available and well-known in the community because of high demand.
Threshers and rice mills for example are common post-harvest facilities that all
farmers must be aware of because these are necessary after harvesting rice.
Rice threshing and milling services are widely available in most rice farming
barangays in the region.
Many farmers are also aware of agriculture enterprises and cooperatives
existing in their barangay. This reflects again that their awareness of facilities
depends on their need for these facilities. Agriculture enterprises and credit
institutions, which includes seller of inputs and sources of credit are well-known
among farmers because these are the sources of farming inputs and
microfinancing needs. Awareness of cooperatives is also high because either
they are part or were invited to be member of the organization. Moreover,
since cooperatives are supported by the local government, farmers must have
received numerous information about these in trainings and meetings initiated
by the municipal agriculture office.

27
Table 11. Percentage of Households by Type Awareness of Existence of Facilities in the Barangay
With Insurance, with claims
(n=125)
With insurance,
without claims (n=128)
Without
insurance
(n=253)
Total
(n=506)
Traditional sun-drying pavement 51.2 48.4 45.8 47.8
Flatbed dryer 14.4 6.3 7.5 8.9
Mechanical dryer 8.0 10.9 9.5 9.5
Other dryer 4.0 3.1 1.2 2.4
Thresher 66.4 62.5 60.5 62.5
Harvester-thresher 7.2 9.4 7.9 8.1
Sheller 6.4 5.5 5.5 5.7
Corn sheller 0.8 0.8 0.8 0.8
Single pass rice mill 32.8 34.4 26.1 29.8
Multi pass rice mill 8.0 4.7 3.2 4.7
In-house storage 15.2 9.4 9.1 9.9
Communal storage 2.4 3.1 2.4 2.6
Government warehouse 4.0 2.3 3.6 3.4
Private commercial warehouse 4.8 3.9 4.3 4.3
Agricultural produce market 16.8 25.8 18.6 20.0
Fertilizer dealer 16.8 23.4 17.8 19.0
Pesticide dealer 17.6 23.4 17.8 19.2
Seeds dealer 16.8 21.9 17.0 18.2
Feeds dealer 13.6 21.1 15.0 16.2
Agriculture & enterprise development/training
45.6 44.5 39.1 42.1
Banks 7.2 16.4 10.3 11.1
Cooperatives 36.0 36.7 30.0 33.2
Microfinance institutions 20.0 18.8 15.4 17.4
Credit institutions 6.4 12.5 7.1 8.3
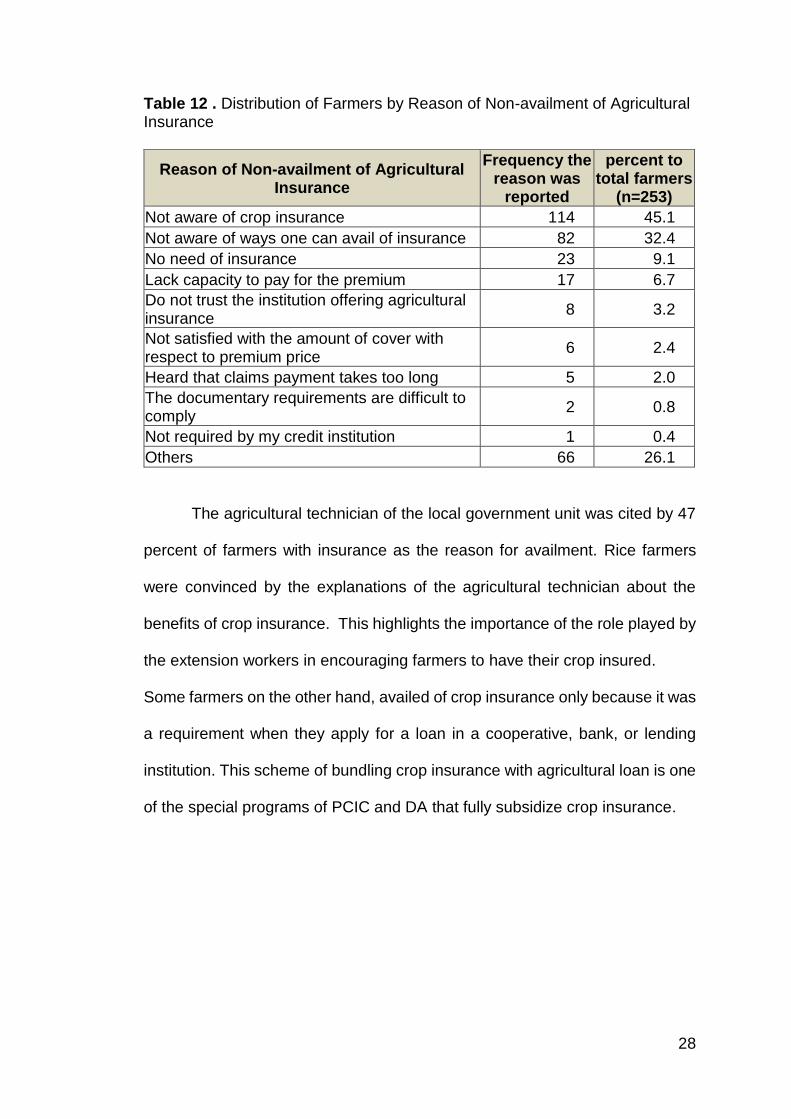
Awareness of Agricultural Insurance
The survey also gathered data on the knowledge and attitude of the rice
farmers toward agricultural insurance. Those who did not avail crop insurance
are either not aware of crop insurance or not aware of the ways to avail of
insurance.
28
Table 12 . Distribution of Farmers by Reason of Non-availment of Agricultural Insurance
Reason of Non-availment of Agricultural Insurance
Frequency the reason was
reported
percent to total farmers
(n=253)
Not aware of crop insurance 114 45.1
Not aware of ways one can avail of insurance 82 32.4
No need of insurance 23 9.1
Lack capacity to pay for the premium 17 6.7
Do not trust the institution offering agricultural insurance
8 3.2
Not satisfied with the amount of cover with respect to premium price
6 2.4
Heard that claims payment takes too long 5 2.0
The documentary requirements are difficult to comply
2 0.8
Not required by my credit institution 1 0.4
Others 66 26.1
The agricultural technician of the local government unit was cited by 47
percent of farmers with insurance as the reason for availment. Rice farmers
were convinced by the explanations of the agricultural technician about the
benefits of crop insurance. This highlights the importance of the role played by
the extension workers in encouraging farmers to have their crop insured.
Some farmers on the other hand, availed of crop insurance only because it was
a requirement when they apply for a loan in a cooperative, bank, or lending
institution. This scheme of bundling crop insurance with agricultural loan is one
of the special programs of PCIC and DA that fully subsidize crop insurance.

29
Table 13 . Distribution of Rice Farmers by Reason of Availment of Agricultural Insurance
Reason of Availment of Agricultural Insurance
With insurance, with claims (n=125)
With insurance, without claims
(n=128)
Freq percent Freq percent
The agricultural technician in our LGU
63 50.4 56 43.8
Beneficiary of free insurance program of the government
7 5.6 8 6.3
Requirement for me to get a loan in my cooperative/lending institution/bank
7 5.6 3 2.3
My neighbor/friend/relative was able to claim and encouraged me
7 5.6 4 3.1
Saw an advertisement or television program on agricultural insurance
1 0.8 0 0.0
Others 20 16 7 5.5
Majority (42 percent) of the rice farmers whose farms had crop insurance
from 2014 to 2015, paid the premium from their own pocket. These are the
paying farmers under the regular crop insurance program of the PCIC. The
beneficiaries of the special programs are about 28 percent. These rice farmers
were recipients of free crop insurance from either Sikat Saka Program, WARA,
RSBSA or APCP-CAP-PBD.
Table 14. Distribution of Rice Farmers by Source of Premium Payment of Agricultural Insurance and Treatment Group
Source of Premium Payment
With insurance, with claims (n=125)
With insurance, without claims (n=128)
Freq percent Freq percent
Out of pocket 62 49.6 46 35.9
Free insurance from government program
41 32.8 30 23.4
Part of the loan from creditor 3 2.4 1 0.8
Borrowed from relative/friend/neighbor
1 0.8

30
Out of the 125 rice farmers with crop insurance and received indemnity
claims in 2014 or 2015, 86% or 107 consistently insure their farms. Similarly,
majority (65 percent) of farmers with crop insurance but without claims have
been getting crop insurance on a regular basis. While farmers who did not have
crop insurance mostly lacked awareness of where and how to apply for crop
insurance. Some of them however, decided not to avail of crop insurance either
due to insufficient funds to pay for the premium or because of negative
perception about crop insurance. Others did not get insurance regularly
because they fail to beat the application deadline.
Table 15. Percentage Distribution of Farmers by Reason for Not Availing Agricultural Insurance Regularly and Treatment Group
With Insurance, with claims
(n=125)
With insurance,
without claims (n=128)
Total
(n=253)
I do not have enough money to pay for it 2.4 0.8 1.6
I do not think insurance is helpful to my farming activities
0.8 0.0 0.4
I did not reach the deadline for applying this cropping season
0.0 9.4 4.7
I do not know how to avail of agricultural insurance (where to apply, etc.)
2.4 10.2 6.3
A relative/friend/neighbor told me that they had difficulty getting indemnity claims
0.0 0.8 0.4
Others 8.8 14.1 11.5
Total 14.4 35.2 24.9
The average amount of rice insurance cover per hectare of the
respondents were PhP18,430 and PhP18,739 for 2014 and 2015, respectively.
The average amount of insurance cover for farmers without indemnity payment
claims is higher compared with the farmers with claims. Rice farmers with

31
smaller farms on the other hand, have the highest per hectare insurance cover
in both years.
Table 16. Average amount of insurance cover per hectare (PHP) by treatment group and farm size, 2014-2015
Farm Size 2014 2015
With Claims
Without Claims All
With Claims
Without Claims All
0.5 ha & below 22,414 22,020 22,115 18,085 24,881 22,368
> 0.5 ha to 1.0 ha 14,866 20,494 17,477 17,536 19,434 18,537
> 1.0 ha 17,597 15,866 17,241 17,186 12,745 16,289
All farm sizes 17,090 20,221 18,430 17,455 20,376 18,739
Availment of Crop Insurance The rice farmers in this study did not have insurance coverage for the
whole duration of the research. Some of them have crop insurance for one
planting season only. This is evident in the percentage of insurance cover
shown by Table 5, which shows that some farmers did not have insurance in
either 2014 or 2015. What is notable however is that the percentage of
insurance coverage among of those with claims (81 percent for the two periods)
is much higher compared to those without claims (64 percent for two periods).
This means that farmers who received indemnity payments were availing of
crop insurance more regularly compared to those who did not receive claims.
Table 17. Percentage Distribution of Parcels Covered by Crop Insurance, by Treatment Group, 2014-2015.
With Insurance, with claims
With insurance, without claims
2014
Not Covered 22 40
Covered 78 60
2015
Not Covered 16 32
Covered 84 68
32
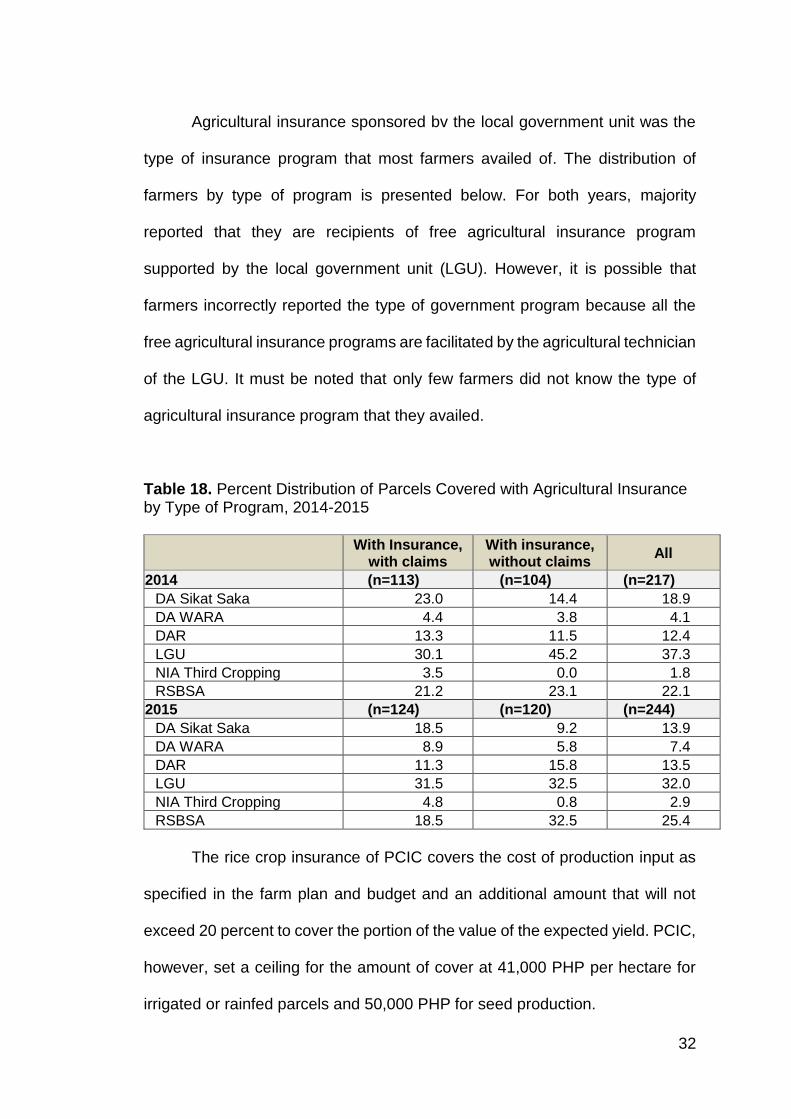
Agricultural insurance sponsored bv the local government unit was the
type of insurance program that most farmers availed of. The distribution of
farmers by type of program is presented below. For both years, majority
reported that they are recipients of free agricultural insurance program
supported by the local government unit (LGU). However, it is possible that
farmers incorrectly reported the type of government program because all the
free agricultural insurance programs are facilitated by the agricultural technician
of the LGU. It must be noted that only few farmers did not know the type of
agricultural insurance program that they availed.
Table 18. Percent Distribution of Parcels Covered with Agricultural Insurance by Type of Program, 2014-2015
With Insurance,
with claims With insurance, without claims
All
2014 (n=113) (n=104) (n=217)
DA Sikat Saka 23.0 14.4 18.9
DA WARA 4.4 3.8 4.1
DAR 13.3 11.5 12.4
LGU 30.1 45.2 37.3
NIA Third Cropping 3.5 0.0 1.8
RSBSA 21.2 23.1 22.1
2015 (n=124) (n=120) (n=244)
DA Sikat Saka 18.5 9.2 13.9
DA WARA 8.9 5.8 7.4
DAR 11.3 15.8 13.5
LGU 31.5 32.5 32.0
NIA Third Cropping 4.8 0.8 2.9
RSBSA 18.5 32.5 25.4
The rice crop insurance of PCIC covers the cost of production input as
specified in the farm plan and budget and an additional amount that will not
exceed 20 percent to cover the portion of the value of the expected yield. PCIC,
however, set a ceiling for the amount of cover at 41,000 PHP per hectare for
irrigated or rainfed parcels and 50,000 PHP for seed production.
33
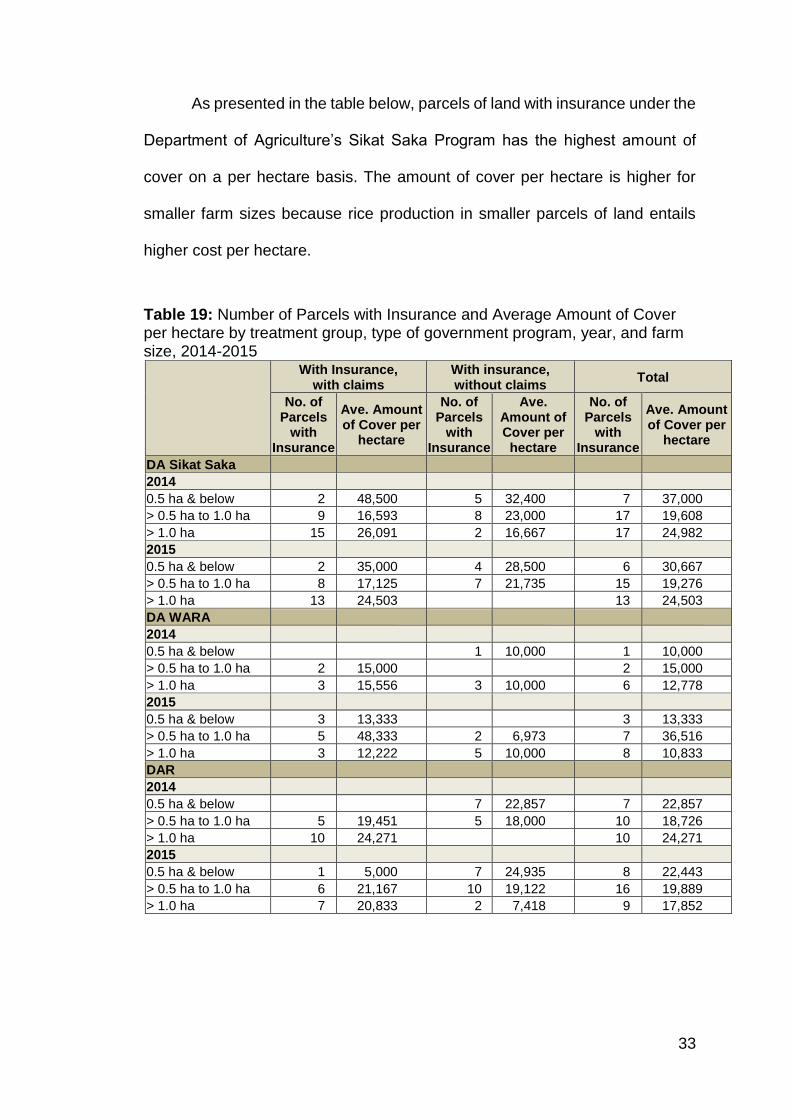
As presented in the table below, parcels of land with insurance under the
Department of Agriculture’s Sikat Saka Program has the highest amount of
cover on a per hectare basis. The amount of cover per hectare is higher for
smaller farm sizes because rice production in smaller parcels of land entails
higher cost per hectare.
Table 19: Number of Parcels with Insurance and Average Amount of Cover per hectare by treatment group, type of government program, year, and farm size, 2014-2015
With Insurance, with claims
With insurance, without claims
Total
No. of Parcels
with Insurance
Ave. Amount of Cover per
hectare
No. of Parcels
with Insurance
Ave. Amount of Cover per hectare
No. of Parcels
with Insurance
Ave. Amount of Cover per
hectare
DA Sikat Saka
2014
0.5 ha & below 2 48,500 5 32,400 7 37,000
> 0.5 ha to 1.0 ha 9 16,593 8 23,000 17 19,608
> 1.0 ha 15 26,091 2 16,667 17 24,982
2015
0.5 ha & below 2 35,000 4 28,500 6 30,667
> 0.5 ha to 1.0 ha 8 17,125 7 21,735 15 19,276
> 1.0 ha 13 24,503 13 24,503
DA WARA
2014
0.5 ha & below 1 10,000 1 10,000
> 0.5 ha to 1.0 ha 2 15,000 2 15,000
> 1.0 ha 3 15,556 3 10,000 6 12,778
2015
0.5 ha & below 3 13,333 3 13,333
> 0.5 ha to 1.0 ha 5 48,333 2 6,973 7 36,516
> 1.0 ha 3 12,222 5 10,000 8 10,833
DAR
2014
0.5 ha & below 7 22,857 7 22,857
> 0.5 ha to 1.0 ha 5 19,451 5 18,000 10 18,726
> 1.0 ha 10 24,271 10 24,271
2015
0.5 ha & below 1 5,000 7 24,935 8 22,443
> 0.5 ha to 1.0 ha 6 21,167 10 19,122 16 19,889
> 1.0 ha 7 20,833 2 7,418 9 17,852
34
Table 19: Continuation
With Insurance, with claims
With insurance, without claims
Total
No. of Parcels
with Insurance
Ave. Amount of Cover per
hectare
No. of Parcels
with Insurance
Ave. Amount of Cover per hectare
No. of Parcels
with Insurance
Ave. Amount of Cover per
hectare
LGU
2014
0.5 ha & below 2 20,000 13 20,062 15 20,053
> 0.5 ha to 1.0 ha 11 9,198 24 21,118 35 17,371
> 1.0 ha 19 11,332 10 15,600 29 12,804
2015
0.5 ha & below 5 18,000 13 27,000 18 24,500
> 0.5 ha to 1.0 ha 11 15,682 20 18,973 31 17,805
> 1.0 ha 22 12,037 7 11,810 29 11,982
NIA Third Cropping
2014
> 1.0 ha 4 29,100 4 29,100
2015
> 0.5 ha to 1.0 ha 1 16,667 1 16,667
> 1.0 ha 6 28,420 6 28,420
RSBSA
2014
0.5 ha & below 11 22,727 11 22,727
> 0.5 ha to 1.0 ha 14 18,231 7 18,776 21 18,413
> 1.0 ha 10 14,755 6 18,976 16 16,338
2015
0.5 ha & below 2 23,889 19 22,632 21 22,751
> 0.5 ha to 1.0 ha 11 20,303 14 18,469 25 19,276
> 1.0 ha 10 16,348 6 17,901 16 16,930
Do not know
2014
0.5 ha & below 10 17,680 7 18,011 17 17,816
> 0.5 ha to 1.0 ha 11 12,727 1 10,000 12 12,500
> 1.0 ha 20 13,268 20 13,268
2015
0.5 ha & below 14 16,823 3 25,000 17 18,266
> 0.5 ha to 1.0 ha 12 14,755 4 28,795 16 18,265
> 1.0 ha 18 14,324 18 14,324
TOTAL 306 17,767 234 20,303 540 18,866
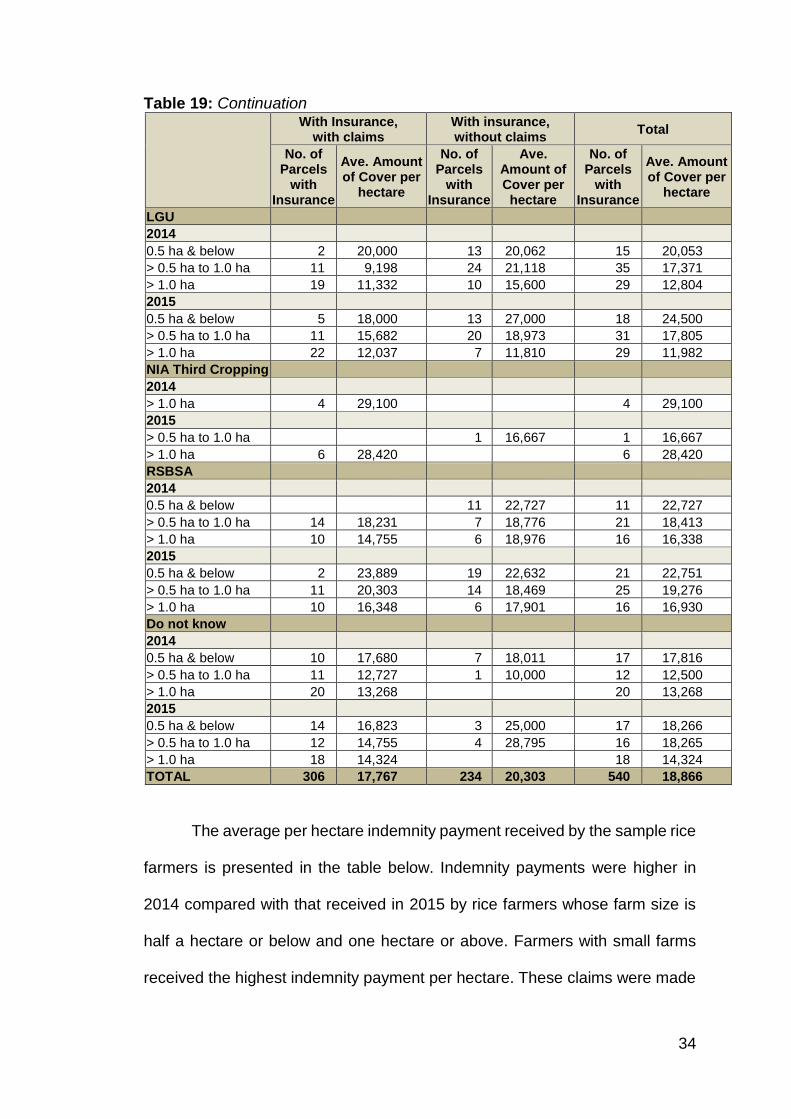
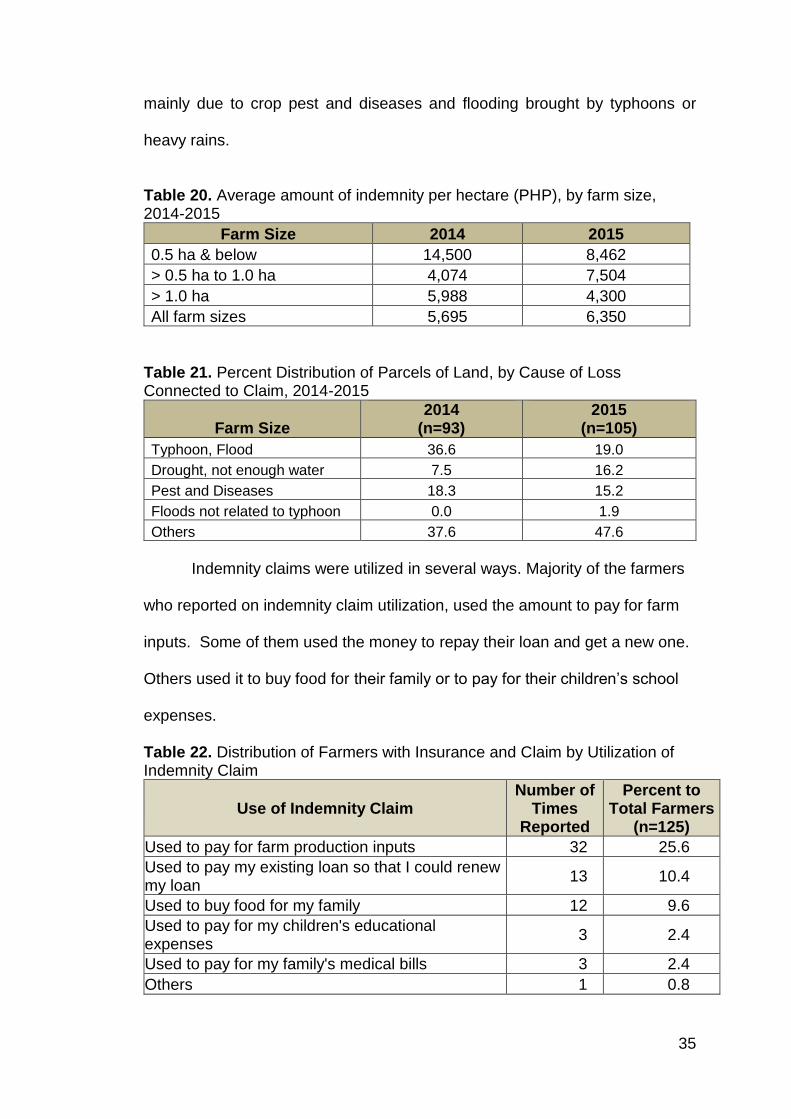
The average per hectare indemnity payment received by the sample rice
farmers is presented in the table below. Indemnity payments were higher in
2014 compared with that received in 2015 by rice farmers whose farm size is
half a hectare or below and one hectare or above. Farmers with small farms
received the highest indemnity payment per hectare. These claims were made
35
mainly due to crop pest and diseases and flooding brought by typhoons or
heavy rains.
Table 20. Average amount of indemnity per hectare (PHP), by farm size, 2014-2015
Farm Size 2014 2015
0.5 ha & below 14,500 8,462
> 0.5 ha to 1.0 ha 4,074 7,504
> 1.0 ha 5,988 4,300
All farm sizes 5,695 6,350
Table 21. Percent Distribution of Parcels of Land, by Cause of Loss Connected to Claim, 2014-2015
Farm Size 2014
(n=93) 2015
(n=105)
Typhoon, Flood 36.6 19.0
Drought, not enough water 7.5 16.2
Pest and Diseases 18.3 15.2
Floods not related to typhoon 0.0 1.9
Others 37.6 47.6
Indemnity claims were utilized in several ways. Majority of the farmers
who reported on indemnity claim utilization, used the amount to pay for farm
inputs. Some of them used the money to repay their loan and get a new one.
Others used it to buy food for their family or to pay for their children’s school
expenses.
Table 22. Distribution of Farmers with Insurance and Claim by Utilization of Indemnity Claim
Use of Indemnity Claim Number of
Times Reported
Percent to Total Farmers
(n=125)
Used to pay for farm production inputs 32 25.6
Used to pay my existing loan so that I could renew my loan
13 10.4
Used to buy food for my family 12 9.6
Used to pay for my children's educational expenses
3 2.4
Used to pay for my family's medical bills 3 2.4
Others 1 0.8

36
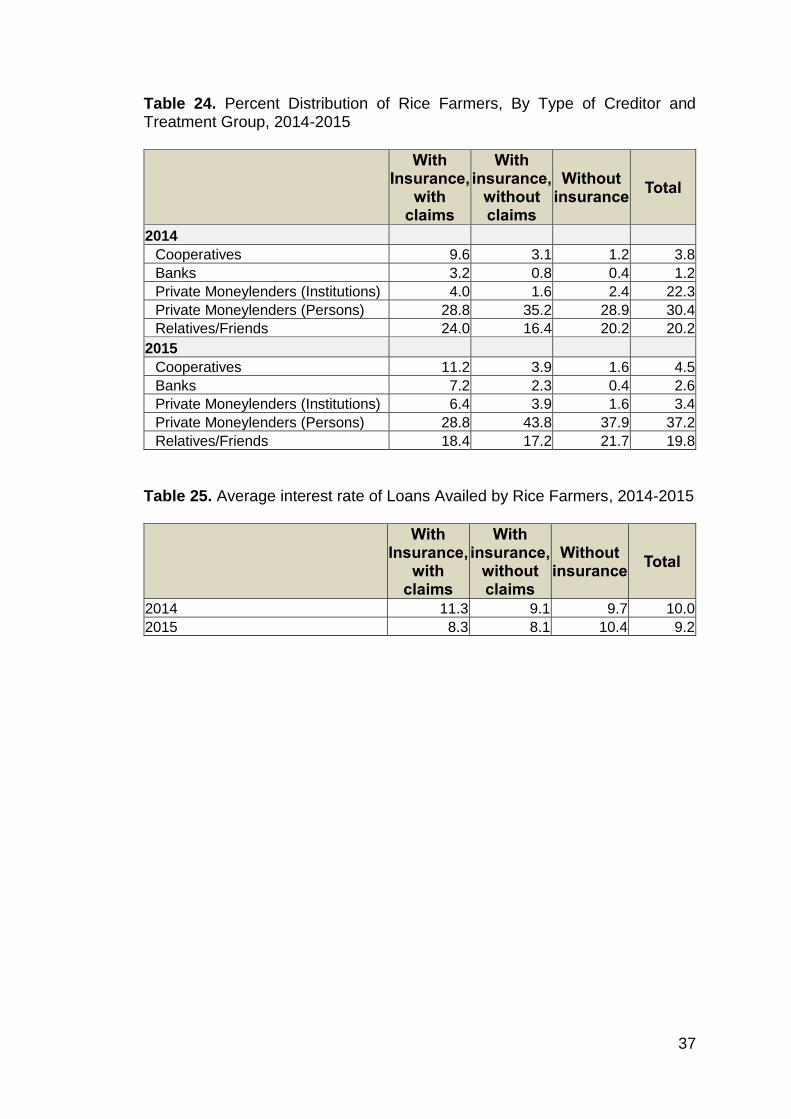
Loan Availment
The next three tables present information on loan availment of sample
rice farmers in Western Visayas. For both 2014 and 2015, majority of the
farmers borrowed from informal creditors, either from individual private
moneylenders, relative or friend. The percent of rice farmers borrowing from
formal credit such as cooperatives or banks is only 4.9 percent and 7.1 percent
for 2014 and 2015, respectively. The average interest rate for 2014 is 10.0
percent and 9.2 percent for 2015. Most the farmers reported that they used the
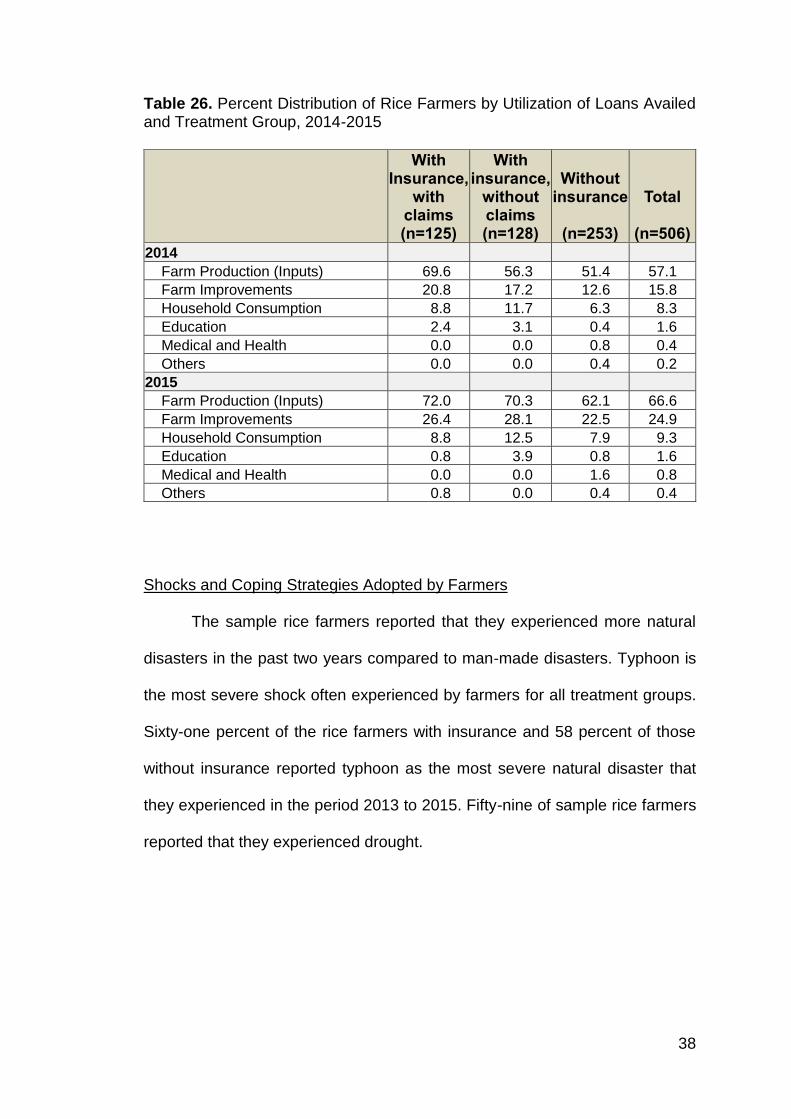
loan proceeds for rice farming-related expenses for farm production inputs or
farm improvement. Others used the loaned amount for household consumption,
children’s education, and medical expenses.
Table 23. Distribution of Rice Farmers, by Type of Creditor (Formal/ Informal), 2014-2015
With Insurance,
with claims With insurance, without claims
Without insurance
Total
2014
Formal 16
(12.8%) 5
(3.9%) 4
(1.6%) 25
(4.9%)
Informal 71
(56.8%) 68
(53.1%) 130 (51.4%)
269 (53.2%)
Total 87
( 69.6%) 73
(57%) 134
(53%)
2015
Formal 23
(18.4%) 8
(6.25%) 5
(2%) 36
(7.1%)
Informal 67
(53.6%) 83
(64.8%) 155
(61.3%) 305
(60.3%)
Total 90(72%) 91(71.1%) 200 (63.3%)
37
Table 24. Percent Distribution of Rice Farmers, By Type of Creditor and Treatment Group, 2014-2015
With Insurance,
with claims
With insurance,
without claims
Without insurance
Total
2014
Cooperatives 9.6 3.1 1.2 3.8
Banks 3.2 0.8 0.4 1.2
Private Moneylenders (Institutions) 4.0 1.6 2.4 22.3
Private Moneylenders (Persons) 28.8 35.2 28.9 30.4
Relatives/Friends 24.0 16.4 20.2 20.2
2015
Cooperatives 11.2 3.9 1.6 4.5
Banks 7.2 2.3 0.4 2.6
Private Moneylenders (Institutions) 6.4 3.9 1.6 3.4
Private Moneylenders (Persons) 28.8 43.8 37.9 37.2
Relatives/Friends 18.4 17.2 21.7 19.8
Table 25. Average interest rate of Loans Availed by Rice Farmers, 2014-2015
With Insurance,
with claims
With insurance,
without claims
Without insurance
Total
2014 11.3 9.1 9.7 10.0
2015 8.3 8.1 10.4 9.2
38
Table 26. Percent Distribution of Rice Farmers by Utilization of Loans Availed and Treatment Group, 2014-2015
With Insurance,
with claims (n=125)
With insurance,
without claims (n=128)
Without
insurance
(n=253)
Total
(n=506)
2014
Farm Production (Inputs) 69.6 56.3 51.4 57.1
Farm Improvements 20.8 17.2 12.6 15.8
Household Consumption 8.8 11.7 6.3 8.3
Education 2.4 3.1 0.4 1.6
Medical and Health 0.0 0.0 0.8 0.4
Others 0.0 0.0 0.4 0.2
2015
Farm Production (Inputs) 72.0 70.3 62.1 66.6
Farm Improvements 26.4 28.1 22.5 24.9
Household Consumption 8.8 12.5 7.9 9.3
Education 0.8 3.9 0.8 1.6
Medical and Health 0.0 0.0 1.6 0.8
Others 0.8 0.0 0.4 0.4
Shocks and Coping Strategies Adopted by Farmers
The sample rice farmers reported that they experienced more natural
disasters in the past two years compared to man-made disasters. Typhoon is
the most severe shock often experienced by farmers for all treatment groups.
Sixty-one percent of the rice farmers with insurance and 58 percent of those
without insurance reported typhoon as the most severe natural disaster that
they experienced in the period 2013 to 2015. Fifty-nine of sample rice farmers
reported that they experienced drought.

39
Table 27. Percent Distribution Farmers by of Most Severe Shocks Experienced During the Past Two Years, by Treatment Group
With Insurance, with claims
(n=125)
With insurance,
without claims (n=128)
Without
insurance
(n=253)
Total
(n=506)
Natural Disaster
Typhoon 62.4 60.9 58.9 60.3
Drought 8.8 15.6 11.1 11.7
Pest Infestation 5.6 2.3 4.3 4.2
Flood 5.6 3.1 4.0 4.2
Epidemic/Disease Outbreak 2.4 2.3 0.4 1.4
Man-made Disaster
Increase in Food Prices 2.4 0.0 0.0 0.6
Serious Accident of Family Member 0.0 0.0 1.2 0.6
Death of a Family Member 0.8 1.6 2.8 2.0
Financial Crises 5.6 0.0 1.6 2.2
None 1.6 1.6 0.8 1.2
Sample rice farmers in Western Visayas employed different strategies
to cope with the impacts of the most severe natural disaster that they
experienced in the last two years. The tables that follow present the different
coping strategies of rice farmers, classified into food-related, non-food,
education-related, health-related, assistance, and other strategies.
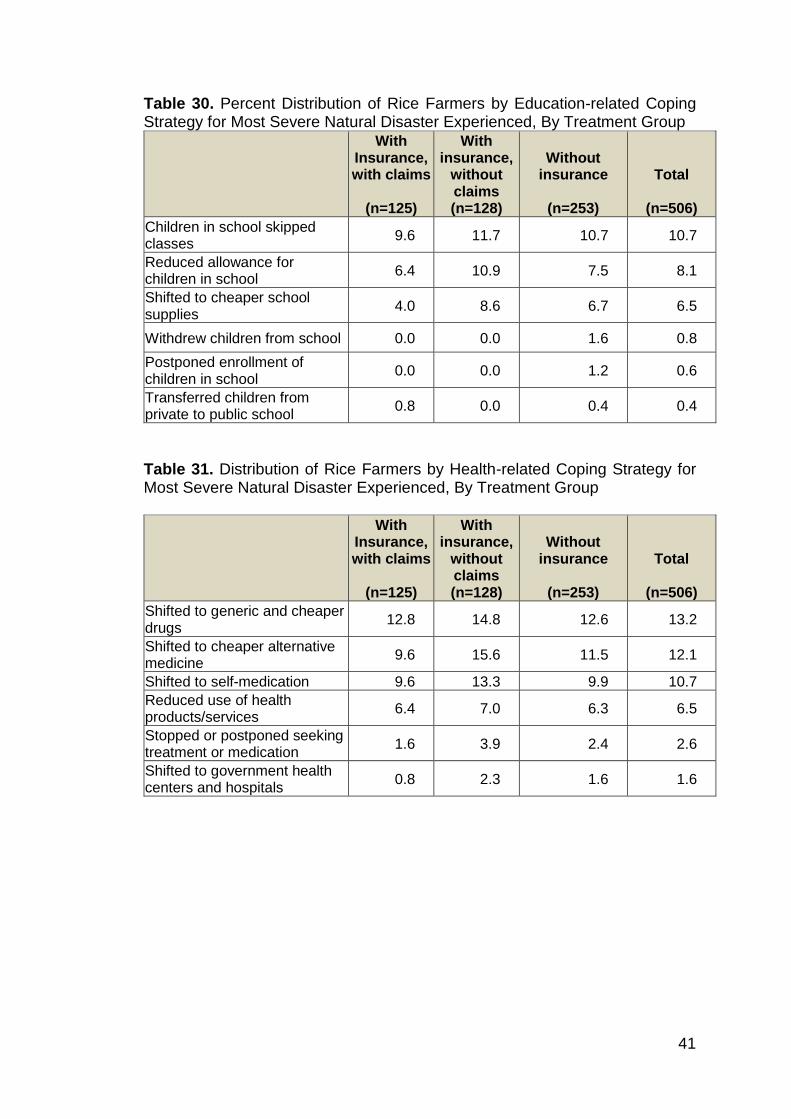
The rice farming household included in the study, generally reduced
spending to cope with the impacts of the most severe natural disaster. Most of
them shifted to cheaper food items, limited the use of electricity, shifted to
generic and cheaper drugs, or requested their children to skip classes. In terms
of assistance, most of the farmers relied on the government, relatives and
friends for support.

40
Table 28. Percent Distribution of Rice Farmers by Food-related Coping Strategy for Most Severe Natural Disaster Experienced, By Treatment Group
With Insurance, with claims
(n=125)
With insurance,
without claims (n=128)
Without
insurance
(n=253)
Total
(n=506)
Shifted to cheaper food items 36.8 35.2 32.0 34.0
Ate less preferred food 31.2 31.3 26.5 28.9
Relied more on own produce 25.6 25.8 22.5 24.1
Ate more ready-to-cook food 27.2 23.4 22.1 23.7
Consumed staple food only 22.4 24.2 19.8 21.5
Skipped meals 20.8 12.5 14.6 15.6
Lessened the frequency of dining out
15.2 15.6 13.8 14.6
Bought food on credit 14.4 15.6 13.8 14.4
Bought cooked food 12.8 8.6 8.7 9.7
Reduced portions 28.8 22.7 22.1 4.2
Relied on school feeding 0.8 0.8 2.4 1.6
Table 29. Percent Distribution of Rice Farmers by Non-Food Coping Strategy for Most Severe Natural Disaster Experienced, By Treatment Group
With Insurance, with claims
(n=125)
With insurance,
without claims (n=128)
Without
insurance
(n=253)
Total
(n=506)
Limited use of electricity 17.6 14.8 13.0 14.6
Shifted to cheaper means of transportation
9.6 14.1 12.6 12.3
Shifted to cheaper fuel sources
7.2 6.3 6.7 6.7
Limited use of cooking fuel 6.4 4.7 6.7 6.1
Limited use of water 5.6 7.8 5.9 6.3
Skipped/postponed consuming products/services
4.8 3.1 4.3 4.2
Bought second-hand items 0.8 1.6 1.2 1.2
Shifted to residential unit with cheaper rent
0.0 0.0 1.2 0.6
41
Table 30. Percent Distribution of Rice Farmers by Education-related Coping Strategy for Most Severe Natural Disaster Experienced, By Treatment Group
With Insurance, with claims
(n=125)
With insurance,
without claims (n=128)
Without
insurance
(n=253)
Total
(n=506)
Children in school skipped classes
9.6 11.7 10.7 10.7
Reduced allowance for children in school
6.4 10.9 7.5 8.1
Shifted to cheaper school supplies
4.0 8.6 6.7 6.5
Withdrew children from school 0.0 0.0 1.6 0.8
Postponed enrollment of children in school
0.0 0.0 1.2 0.6
Transferred children from private to public school
0.8 0.0 0.4 0.4
Table 31. Distribution of Rice Farmers by Health-related Coping Strategy for Most Severe Natural Disaster Experienced, By Treatment Group
With Insurance, with claims
(n=125)
With insurance,
without claims (n=128)
Without
insurance
(n=253)
Total
(n=506)
Shifted to generic and cheaper drugs
12.8 14.8 12.6 13.2
Shifted to cheaper alternative medicine
9.6 15.6 11.5 12.1
Shifted to self-medication 9.6 13.3 9.9 10.7
Reduced use of health products/services
6.4 7.0 6.3 6.5
Stopped or postponed seeking treatment or medication
1.6 3.9 2.4 2.6
Shifted to government health centers and hospitals
0.8 2.3 1.6 1.6

42
Table 32. Percent Distribution of Rice Farmers by Health-related by Coping Strategy through Receipt of Assistance for Most Severe Natural Disaster Experienced, By Treatment Group
With Insurance, with claims
(n=125)
With insurance,
without claims (n=128)
Without
insurance
(n=253)
Total
(n=506)
Assistance from the government
32.8 24.2 24.5 26.5
Financial support from relatives 20.0 14.8 15.8 16.6
Assistance from the private sector
13.6 12.5 9.9 11.5
Other material support from relatives
12.0 14.1 11.1 12.1
Financial support from friends/neighbors
8.8 7.8 7.1 7.7
Other material support from friends/neighbors
8.0 7.8 5.1 6.5
Table 33. Percent Distribution of Rice Farmers by Demographic and Other Coping Strategies for Most Severe Natural Disaster Experienced, By Treatment Group
With Insurance, with claims
(n=125)
With insurance,
without claims (n=128)
Without
insurance
(n=253)
Total
(n=506)
Spent less time for recreation 8.0 11.7 9.5 9.7
Postponed childbearing 4.0 7.0 5.9 5.7
Worked overtime 2.4 6.3 4.0 4.2
Transferred to temporary housing/evacuation center
4.0 3.9 3.6 3.8
Members from other households moved in (to cut expenses)
3.2 2.3 1.2 2.0
Members moved away 0.8 0.8 0.8 0.8
Farmers employ risk mitigation strategies to lessen the adverse impacts
of natural and man-made disasters. In the case of the sample rice farmers in
Western Visayas, the primary risk mitigation strategy was adoption of an earlier

43
or later planting date which reported by more than 26 percent of the sample.
This strategy was employed both in the wet and dry seasons. Other farmers
used rice varieties with high resilience, high temperature tolerance, or
resistance to salinity, drought and flood.
Table 34. Distribution of Farmers by Risk Mitigation Strategy in Crop Production, By Type of Season
Dry Season Wet Season
Adopting earlier or later planting date 135 136
Use of varieties with high resilience, high temperature tolerance, resistance to salinity, drought and flood
27 27
Crop rotation 16 12
Alteration of farm management practices 11 9
Use of site specific nutrient management 7 5
Integrated pest management 5 5
Crop diversification 3 5
Product diversification 4 1
Others 3 4
The respondents were requested to rate the different product and
service characteristics of PCIC based on their own experience, with a highest
rating of 4 (Very Satisfactory), and a lowest rating of 1 (Very Unsatisfactory).
The table below shows the average rating for the different characteristics by
farmers with insurance, both with and without claims. Those who avail
agricultural insurance are generally satisfied with the services provided by
PCIC.
High rating was given on the affordability of the premium payment and
the number of forms to be filled out for enrollment and the ease of
accomplishing them. However, rice farmers are expecting improvement in the
sufficiency of the actual indemnity received so that the amount will be enough

44
to finance next season's planting. Farmers also gave a much lower score on
the length of time of processing of claims from filing to actual receipt of
indemnity. This indicates that farmers find this too long and believe that this
service should be shortened by the PCIC.
Table 35. Farmers’ Ratings of PCIC products and services.
With
insurance, with claims
With insurance,
without claims
Total
The number of forms to be filled up for enrollment and the ease of accomplishing them
3.1 3.0 3.1
The accessibility of the PCIC office 2.9 2.9 2.9
The affordability of the premium payment
3.2 3.2 3.2
The accessibility of payment channels available for paying the premium (via loan deduction, etc.)
3.1 2.9 3.0
The sufficiency of the risks covered when compared to risks faced by farmers in crop production
3.0 3.1 3.0
The adequacy of the amount of cover to be received when a loss occurs for financing next season’s planting
2.7 2.7 2.7
Available feedbacking mechanisms (communication channels) in case of questions in enrollment or claims
2.9 2.8 2.8
The procedure for filing indemnity claims (forms to be filled up, etc.)
3 2.7 2.9
The objectivity of assessment in processing the indemnity claims
2.9 2.7 2.8
The sufficiency of the actual indemnity received to finance next season's planting
2.6 2.5 2.6
Length of time of processing claims from filing to actual receipt of indemnity
2.6 2.6 2.6
Overall satisfaction with PCIC's products and services
2.9 2.8 2.9

45
Net Income from Production Net income from crop production shows all earnings from rice plus
indemnity receipts less costs and insurance premium. The average net income
of all farmers in 2014 and 2015 were positive. Those with bigger farms earned
the highest net incomes and treatment groups. Interestingly, smaller sized
farms of half a hectare and below have higher net earnings compared with
bigger farms, of more than half to one hectare. This can be observed for groups
with insurance but not among farmers without crop insurance.
Figure 4. Net income of rice farmers, by treatment group and farm size, 2014-2015
Table 36. Net income of rice farmers, by treatment group and farm size, 2014-2015
To determine if crop insurance has impact on rice farmers’ net income,
the difference between the groups were estimated. The first column in table 26
0
20000
40000
60000
80000
100000
120000
0.5 ha &below
> 0.5 ha to 1.0ha
> 1.0 ha 0.5 ha &below
> 0.5 ha to 1.0ha
> 1.0 ha
2014 2015
With Insurance with Claims With Insurance without Claims Without Insurance
Treatment Farm Size 2014 2015
With Insurance with Claims
0.5 ha & below 67,880 61,325
> 0.5 ha to 1.0 ha 57,253 48,039
> 1.0 ha 53,431 69,610
With Insurance without Claims
0.5 ha & below 47,974 48,399
> 0.5 ha to 1.0 ha 25,639 24,767
> 1.0 ha 93,181 100,199
Without Insurance
0.5 ha & below 35,949 30,677
> 0.5 ha to 1.0 ha 39,482 43,178
> 1.0 ha 62,507 55,980

46
shows the difference in net income of farmers with insurance and without
insurance. For 2014, the positive difference in income can only be observed
among smaller farms. The year 2015 shows improvement such that smaller
and bigger farms experienced positive impact from insurance. For both years,
the highest income difference was among farmers with smaller farms.
The second column shows the difference in net income from rice
production of farmers with insurance with indemnity claims and those without
insurance. In 2014, only the bigger farms have negative income difference, for
the other two farm size categories the difference is positive. While in 2015
positive income difference is observable in all farm size categories. Similarly,
the highest positive income difference is observed among small farms.
The last column shows the difference in incomes of farmers with
insurance without claims and the farmers without insurance. For both years
2014 and 2015, all farmers with crop insurance without claims earned higher
incomes than farmers that did not avail of crop insurance except for those with
farm sizes of 0.5 ha to 1 ha. The difference in income increases as farm size
increases. When all three groups of rice farmers, according to treatment
category and farm size were compared in terms of income difference, it is
notable that positive income is higher between farmers with insurance with
claims and farmers whose farms do not have crop insurance. Moreover, the
income indifference is more pronounced between smaller farms with insurance
with claims and without insurance. The highest income difference is therefore
between farmers with insured rice farms and with claims and farmers with
uninsured farms of the smallest farm size category.
47
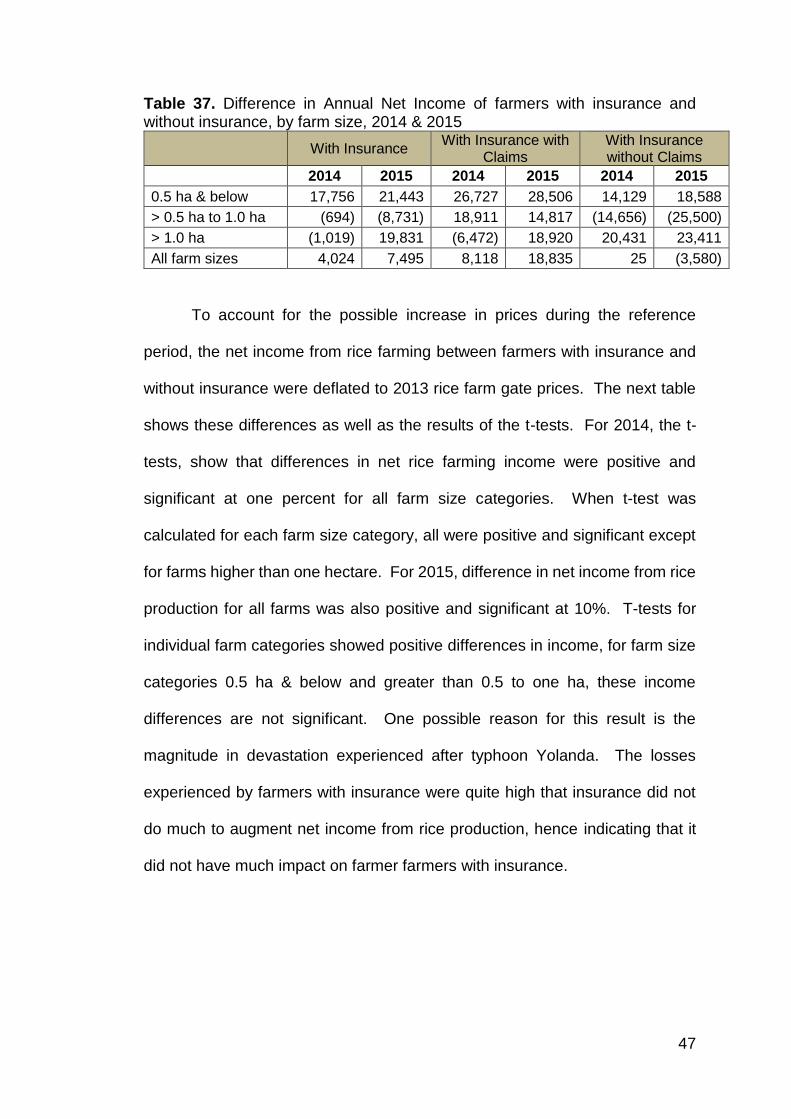
Table 37. Difference in Annual Net Income of farmers with insurance and without insurance, by farm size, 2014 & 2015
With Insurance With Insurance with
Claims With Insurance without Claims
2014 2015 2014 2015 2014 2015
0.5 ha & below 17,756 21,443 26,727 28,506 14,129 18,588
> 0.5 ha to 1.0 ha (694) (8,731) 18,911 14,817 (14,656) (25,500)
> 1.0 ha (1,019) 19,831 (6,472) 18,920 20,431 23,411
All farm sizes 4,024 7,495 8,118 18,835 25 (3,580)
To account for the possible increase in prices during the reference
period, the net income from rice farming between farmers with insurance and
without insurance were deflated to 2013 rice farm gate prices. The next table
shows these differences as well as the results of the t-tests. For 2014, the t-
tests, show that differences in net rice farming income were positive and
significant at one percent for all farm size categories. When t-test was
calculated for each farm size category, all were positive and significant except
for farms higher than one hectare. For 2015, difference in net income from rice
production for all farms was also positive and significant at 10%. T-tests for
individual farm categories showed positive differences in income, for farm size
categories 0.5 ha & below and greater than 0.5 to one ha, these income
differences are not significant. One possible reason for this result is the
magnitude in devastation experienced after typhoon Yolanda. The losses
experienced by farmers with insurance were quite high that insurance did not
do much to augment net income from rice production, hence indicating that it
did not have much impact on farmer farmers with insurance.

48
Table 38. Statistical comparison of Net Farm Income per hectare between Rice Farmers with and without Agricultural Insurance in Western Visayas, by Farm Size, 2014-2015
Farm Size Income Difference in 2014
(in Php) Income Difference in 2015
(in Php)
0.5 ha. & below 2,376** 1,298ns
> 0.5 to 1 ha. 1,363** 184ns
> 1 ha. 1,353ns 2,376**
All Farm Sizes 1,714*** 1,177*
Note: Diff = Difference in net farm income per hectare of rice farmers with and without
insurance; ns not significant; * significant at 10%; ** significant at 5%; *** significant at 1%
Factors Affecting Insurance Uptake Farmers will continue to get crop insurance if it is useful to them. Uptake
also reveals the preference of farmers for less risky ventures and access to
credit. The demand for rice insurance among farmer respondents in Western
Visayas was determined using Random Effects Probit Model. The dependent
variable is availment of insurance in 2015, which takes the value of one if the
farmer availed of rice insurance in 2015 and zero if she/he did not. The control
variables were year; experience of rain shock in the past; farmer’s and
household characteristics which includes sex, educational attainment, farming
experience, dependency ratio; indices for household assets, agricultural
assets, membership in organization and social protection, insurance availment;
type of crop, access to irrigation, flood topography, cropping system, land area
devoted to rice, government transfer, non-farm wage, non-farm entrepreneurial
activities and PCIC priority area.
Out of the abovementioned explanatory variables, seven came out to be
statistically significant (see Table 39) at one percent, five percent and 10
percent levels of significance. These are year, experience of past rain shock,
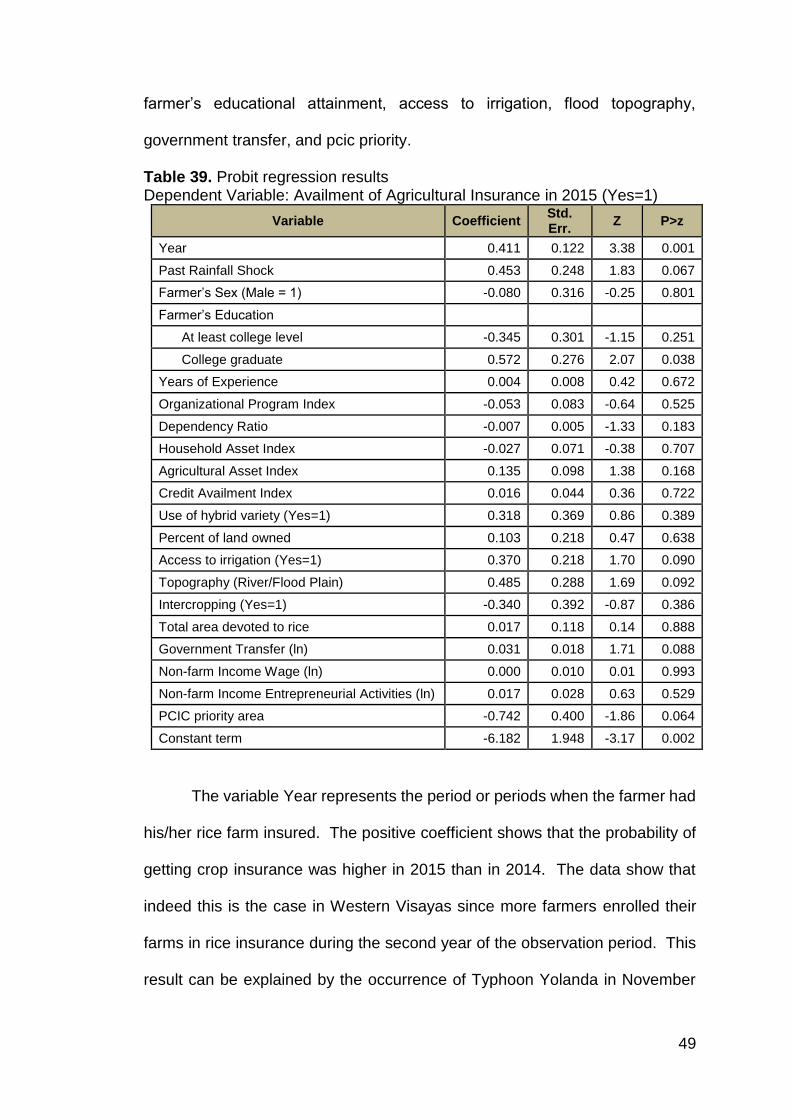
49
farmer’s educational attainment, access to irrigation, flood topography,
government transfer, and pcic priority.
Table 39. Probit regression results Dependent Variable: Availment of Agricultural Insurance in 2015 (Yes=1)
Variable Coefficient Std. Err.
Z P>z
Year 0.411 0.122 3.38 0.001
Past Rainfall Shock 0.453 0.248 1.83 0.067
Farmer’s Sex (Male = 1) -0.080 0.316 -0.25 0.801
Farmer’s Education
At least college level -0.345 0.301 -1.15 0.251
College graduate 0.572 0.276 2.07 0.038
Years of Experience 0.004 0.008 0.42 0.672
Organizational Program Index -0.053 0.083 -0.64 0.525
Dependency Ratio -0.007 0.005 -1.33 0.183
Household Asset Index -0.027 0.071 -0.38 0.707
Agricultural Asset Index 0.135 0.098 1.38 0.168
Credit Availment Index 0.016 0.044 0.36 0.722
Use of hybrid variety (Yes=1) 0.318 0.369 0.86 0.389
Percent of land owned 0.103 0.218 0.47 0.638
Access to irrigation (Yes=1) 0.370 0.218 1.70 0.090
Topography (River/Flood Plain) 0.485 0.288 1.69 0.092
Intercropping (Yes=1) -0.340 0.392 -0.87 0.386
Total area devoted to rice 0.017 0.118 0.14 0.888
Government Transfer (ln) 0.031 0.018 1.71 0.088
Non-farm Income Wage (ln) 0.000 0.010 0.01 0.993
Non-farm Income Entrepreneurial Activities (ln) 0.017 0.028 0.63 0.529
PCIC priority area -0.742 0.400 -1.86 0.064
Constant term -6.182 1.948 -3.17 0.002
The variable Year represents the period or periods when the farmer had
his/her rice farm insured. The positive coefficient shows that the probability of
getting crop insurance was higher in 2015 than in 2014. The data show that
indeed this is the case in Western Visayas since more farmers enrolled their
farms in rice insurance during the second year of the observation period. This
result can be explained by the occurrence of Typhoon Yolanda in November

50
2013 which devastated Western Visayas. The fairly recent experience of a very
strong typhoon could be one reason for the higher uptake of crop insurance in
2015. Although most farmers had already harvested their palay when the
typhoon struck, the massive destruction left behind could be a compelling
motive that prodded the farmers to insure their crop. Moreover, the PCIC
implemented special program Yolanda, which gave out free rice insurance in
Yolanda-affected areas in Western Visayas. The Yolanda program started
during the second quarter of 2014 thus covering the 2014-2015 cropping
period.
Another explanatory variable that significantly influenced the probability
of availment of rice insurance among farmers in Region 6 was farmer’s
experience of past rain shock. This is a dummy variable that took the value of
one when the farmer had past experience of rain shock and zero if none. The
coefficient is positive which implies that the probability of rice insurance uptake
increases with farmers’ previous experience of heavy rains which could have
either damaged their own or other farmers’ rice farms in the vicinity. The result
indicates that risk aversion is much higher when perils have been experienced
before. The risk aversion translates into enrollment of rice parcels in insurance.
The farmer’s educational attainment, particularly those who had at least
some college education, came out as significant in affecting the dependent
variable. The coefficient turned out to be positive such that the probability of
getting crop insurance increases if the farmer has reached college. This result
is consistent with expectation that the higher the educational attainment, the
more knowledgeable farmers are pertaining to crop production risk mitigating
mechanisms such as insurance.

51
Access to irrigation is also one of the regressors that significantly affect
the likelihood of a rice farm being insured. The result for this variable shows a
positive coefficient implying that access to irrigation increases the probability
that a farmer will enroll his rice farm in crop insurance. One of PCIC’s criteria
to qualify for crop insurance is the presence of an effective irrigation system in
the area where the farm is located. Hence, farmers whose farms are accessible
to irrigation have a higher tendency to get crop insurance.
Topography (river/flood plain) is a dummy variable that assumes the
value of one if the rice farm is flood-prone and zero if it is not. A positive beta
coefficient for this variable means that the probability that a farmer will have rice
insurance is higher if his parcel devoted to rice has the tendency to be flooded.
Indeed the result obtained for this variable is positive. This finding supports the
expectation that risk aversion increases the likelihood of crop insurance uptake.
Another variable that significantly affect the dependent variable is
government transfers (in natural logarithm) which corresponds to the amount
of government assistance that the farming household receives such as
conditional cash transfer and other subsidies. The sign of the coefficient is
positive which implies that the probability of crop insurance uptake increases
with the amount of government transfers. The special programs of PCIC are
intended for needy farming households hence most likely these farmers who
availed of these free insurance also recipients of government transfers.
Lastly, the coefficient of variable PCIC priority area came out as
statistically significant with a negative coefficient. This variable is a dummy that
takes the value of one or zero, one if the insured farm is located in the in the
same province/municipality as the PCIC office and zero otherwise. The

52
expectation is that the nearest farms to PCIC would be prioritized in terms of
crop insurance provision. The result of the probit regression for this variable
implies the opposite of this expectation. For rice farmers in Western Visayas,
the probability of getting their farms insured is higher when the area is not within
the province or municipality where the PCIC office is located. PCIC therefore
does not only serve the farmers nearest to them, rather they serve those that
fit the eligibility criteria and these farmers may not necessarily near their office.
Impact of Crop Insurance on Income from Rice Farming Impact of insurance on rice farmer’s income were determined using
random effects panel data regression. The regression was first applied on data
for all farms then for each of the three farm size categories. Regression
analysis was done for all sample farmers and for matched sample. Matched
samples are pairs of rice farmers with insurance and without insurance that
satisfy at least three of the five critical matching variables – area devoted to
rice, farm location, ARB status, access to irrigation, and farm tenure status. The
result for all farms (Table 40) show that variables affecting net income from rice
were the following--- if the shock caused farm losses, farmer’s age, square of
farmer’s age, farmer’s sex, availment index, irrigation access, cropping system,
non-farm wage and non-farm income from entrepreneurial activities.
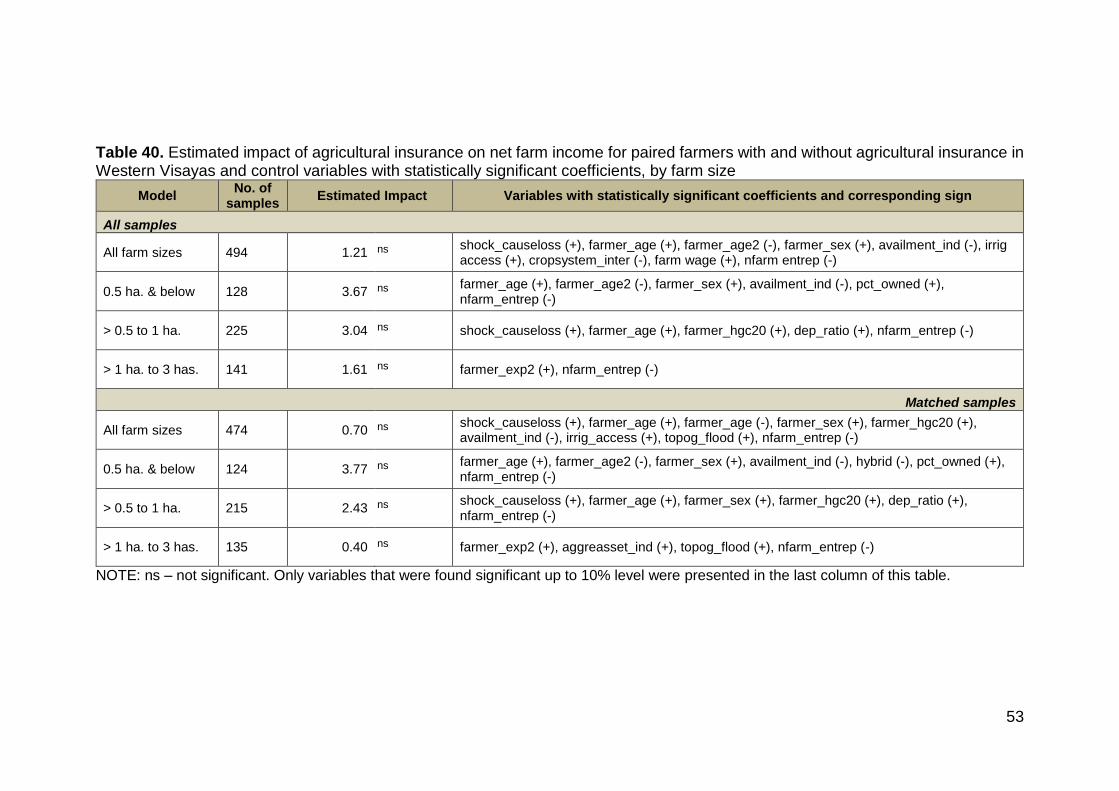
53
Table 40. Estimated impact of agricultural insurance on net farm income for paired farmers with and without agricultural insurance in Western Visayas and control variables with statistically significant coefficients, by farm size
Model No. of
samples Estimated Impact Variables with statistically significant coefficients and corresponding sign
All samples
All farm sizes 494 1.21 ns shock_causeloss (+), farmer_age (+), farmer_age2 (-), farmer_sex (+), availment_ind (-), irrig access (+), cropsystem_inter (-), farm wage (+), nfarm entrep (-)
0.5 ha. & below 128 3.67 ns farmer_age (+), farmer_age2 (-), farmer_sex (+), availment_ind (-), pct_owned (+), nfarm_entrep (-)
> 0.5 to 1 ha. 225 3.04 ns shock_causeloss (+), farmer_age (+), farmer_hgc20 (+), dep_ratio (+), nfarm_entrep (-)
> 1 ha. to 3 has. 141 1.61 ns farmer_exp2 (+), nfarm_entrep (-)
Matched samples
All farm sizes 474 0.70 ns shock_causeloss (+), farmer_age (+), farmer_age (-), farmer_sex (+), farmer_hgc20 (+), availment_ind (-), irrig_access (+), topog_flood (+), nfarm_entrep (-)
0.5 ha. & below 124 3.77 ns farmer_age (+), farmer_age2 (-), farmer_sex (+), availment_ind (-), hybrid (-), pct_owned (+), nfarm_entrep (-)
> 0.5 to 1 ha. 215 2.43 ns shock_causeloss (+), farmer_age (+), farmer_sex (+), farmer_hgc20 (+), dep_ratio (+), nfarm_entrep (-)
> 1 ha. to 3 has. 135 0.40 ns farmer_exp2 (+), aggreasset_ind (+), topog_flood (+), nfarm_entrep (-)
NOTE: ns – not significant. Only variables that were found significant up to 10% level were presented in the last column of this table.
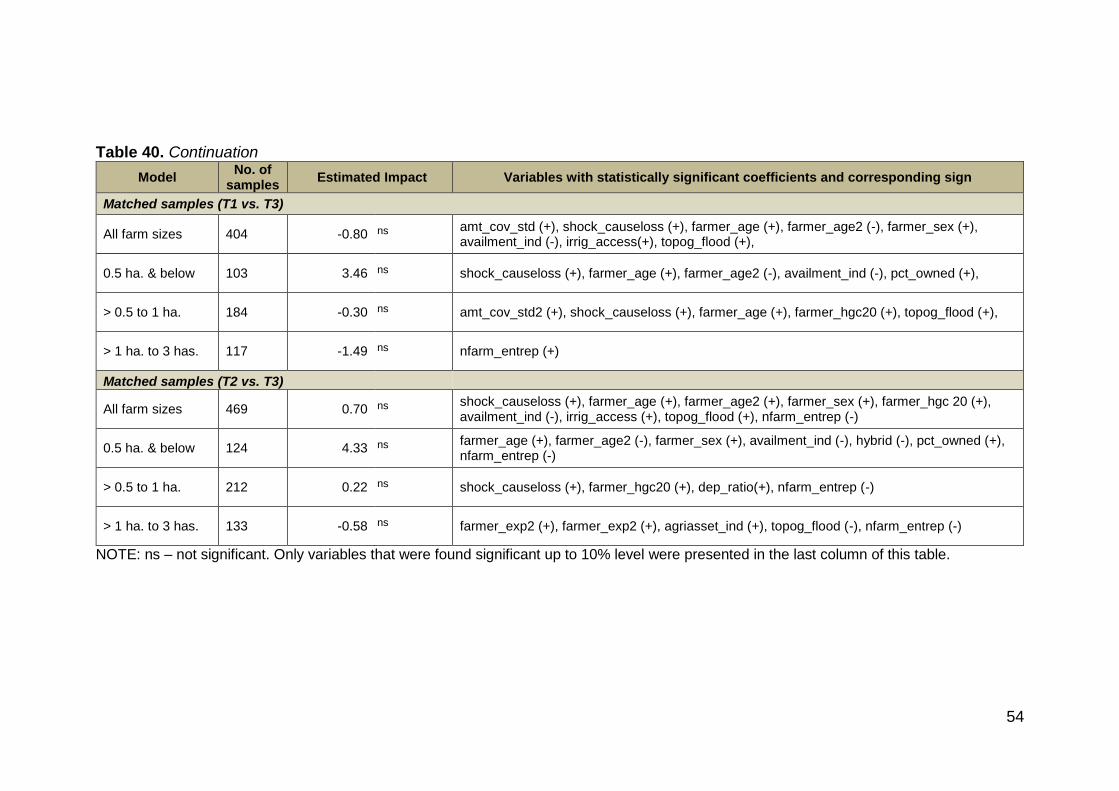
54
Table 40. Continuation
Model No. of
samples Estimated Impact Variables with statistically significant coefficients and corresponding sign
Matched samples (T1 vs. T3)
All farm sizes 404 -0.80 ns amt_cov_std (+), shock_causeloss (+), farmer_age (+), farmer_age2 (-), farmer_sex (+), availment_ind (-), irrig_access(+), topog_flood (+),
0.5 ha. & below 103 3.46 ns shock_causeloss (+), farmer_age (+), farmer_age2 (-), availment_ind (-), pct_owned (+),
> 0.5 to 1 ha. 184 -0.30 ns amt_cov_std2 (+), shock_causeloss (+), farmer_age (+), farmer_hgc20 (+), topog_flood (+),
> 1 ha. to 3 has. 117 -1.49 ns nfarm_entrep (+)
Matched samples (T2 vs. T3)
All farm sizes 469 0.70 ns shock_causeloss (+), farmer_age (+), farmer_age2 (+), farmer_sex (+), farmer_hgc 20 (+), availment_ind (-), irrig_access (+), topog_flood (+), nfarm_entrep (-)
0.5 ha. & below 124 4.33 ns farmer_age (+), farmer_age2 (-), farmer_sex (+), availment_ind (-), hybrid (-), pct_owned (+), nfarm_entrep (-)
> 0.5 to 1 ha. 212 0.22 ns shock_causeloss (+), farmer_hgc20 (+), dep_ratio(+), nfarm_entrep (-)
> 1 ha. to 3 has. 133 -0.58 ns farmer_exp2 (+), farmer_exp2 (+), agriasset_ind (+), topog_flood (-), nfarm_entrep (-)
NOTE: ns – not significant. Only variables that were found significant up to 10% level were presented in the last column of this table.
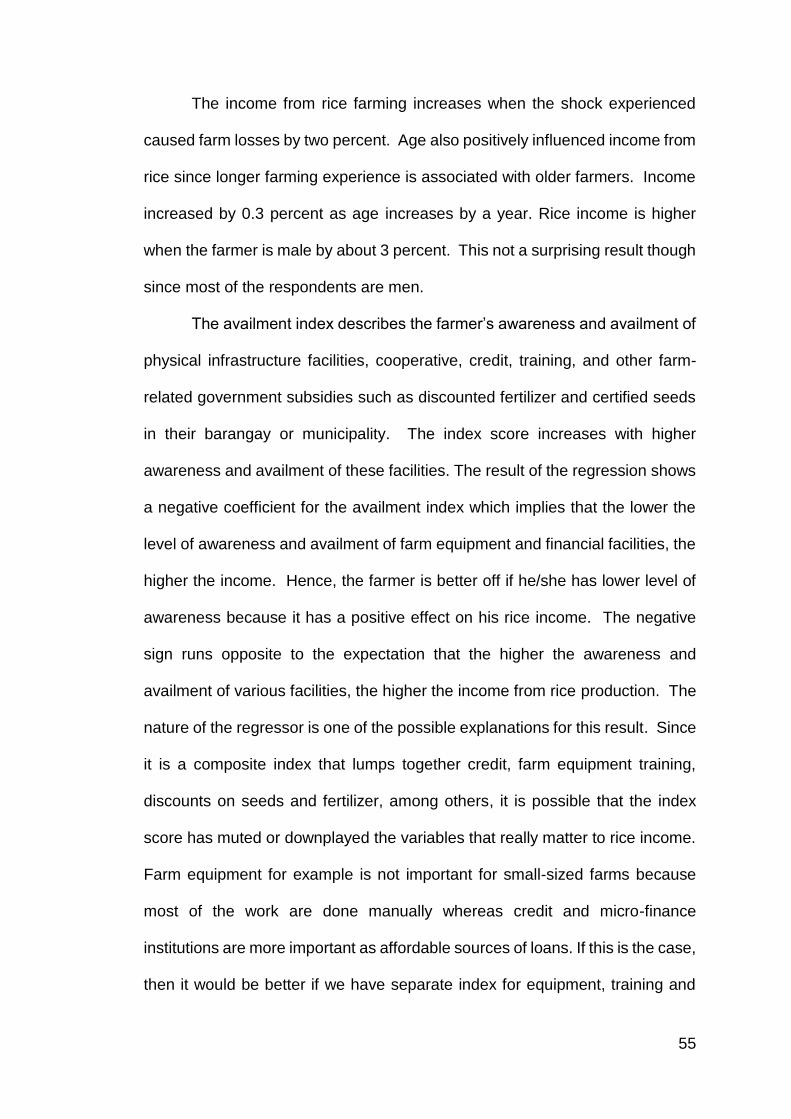
55
The income from rice farming increases when the shock experienced
caused farm losses by two percent. Age also positively influenced income from
rice since longer farming experience is associated with older farmers. Income
increased by 0.3 percent as age increases by a year. Rice income is higher
when the farmer is male by about 3 percent. This not a surprising result though
since most of the respondents are men.
The availment index describes the farmer’s awareness and availment of
physical infrastructure facilities, cooperative, credit, training, and other farm-
related government subsidies such as discounted fertilizer and certified seeds
in their barangay or municipality. The index score increases with higher
awareness and availment of these facilities. The result of the regression shows
a negative coefficient for the availment index which implies that the lower the
level of awareness and availment of farm equipment and financial facilities, the
higher the income. Hence, the farmer is better off if he/she has lower level of
awareness because it has a positive effect on his rice income. The negative
sign runs opposite to the expectation that the higher the awareness and
availment of various facilities, the higher the income from rice production. The
nature of the regressor is one of the possible explanations for this result. Since
it is a composite index that lumps together credit, farm equipment training,
discounts on seeds and fertilizer, among others, it is possible that the index
score has muted or downplayed the variables that really matter to rice income.
Farm equipment for example is not important for small-sized farms because
most of the work are done manually whereas credit and micro-finance
institutions are more important as affordable sources of loans. If this is the case,
then it would be better if we have separate index for equipment, training and
56
financial facilities. Another possible reason is that farmers do not really rely on
these facilities for their rice farming needs. They may have their own equipment
or may not have the need for it, hence scoring low in the index. Moreover, most
of them have been relying on their own funds to finance rice farming and seldom
availed of credit.
Irrigation access increases net farm income by 2.4 percent. Flood
topography also showed positive relationship with net farm income. This means
that it the farm is located in a flood-prone area, income is higher by 3.4 percent.
This result seem to be a paradox because we expect that flood prone areas to
generate lesser income to farmers but if we relate this finding to the result from
the probit regression above, it may not be that inconsistent. Since farmers
know that their farm is prone to flooding, they have already devised coping
mechanisms to mitigate losses such as adopting the appropriate seed sowing
method or changing the planting calendar to avoid heavy rains that are
damaging to crops. Insurance is also an important risk mitigating strategy. As
shown by the Probit regression, rice farmers with flood-prone farms have the
higher likelihood to get insurance.
Water availability is generally favorable to rice farming. Most rice
farmers in the region and particularly in Iloilo, have their own shallow tube wells
as fallback during prolonged dry season or when irrigation is not available.
Hence, a flood-prone farm topography can have positive effects on rice income
because the farmer doesn’t have to pump water (a common practice in Western
Visayas) to irrigate the farm thus lessening production cost. Moreover,
irrigation flow is also better for low lying farms they may have up to three
cropping seasons.
57
The variable cropsystem_inter is a dummy variable for type of cropping
system which takes on the value of one if the farmer is intercropping rice with
other crops. Since intercropping is either the cultivation of two or more crops
simultaneously on the same farm or planting the other crop after the harvest of
the other crop. The coefficient implies that if the farmer is intercropping rice
with other crop/s, net income from rice will be lower by 3.3 percent.
Intercropping may decrease rice income but not necessarily income from all
crops, hence the farmer is not necessarily worse off. Indeed the reduction in
rice income is highly probable since intercropping with another crop
simultaneously with rice will necessarily reduce area planted to rice and income
as well. Similarly, if another crop (e.g.watermelon) is planted after rice is
harvested devoting the next planting season to another crop will decrease rice
production and income from rice. Farmers in Western Visayas, intercrop with
high value crops such as mungbean or watermelon to augment income or when
farmgate price of palay is low or when the weather is favorable for the other
crop.
Non-farm wages is also one of the factors that significantly affect income
from rice farming. The positive beta coefficient shows that a one percent
increase in non-farm wages results to a .083 percent increase in income from
rice production. Higher income from wages earned non-farm related work
implies possible additional capitalization for rice farming, hence the positive
relationship of non-farm wages to the dependent variable. Non-farm
entrepreneurship income on the other hand causes net income from rice to
decline, such that a one percent increase in earnings from non-farm

58
entrepreneurial activities will reduce net income from rice farming by 0.1854
percent.
The impact of insurance on rice farming is indicated by the coefficient of
the predicted probability of crop insurance availment is also presented in Table
40. Based on the coefficient, having crop insurance increases net income from
rice farming by 1.2 percent. Although the variable is not a significant predictor
of net income from rice production, it shows that impact is positive.
The model was also applied to each farm size category to estimate the
impact of crop insurance on net income from rice production. For farms of 0.5
ha. & below, the factors that significantly affect net income are farmer’s age and
sex, availment index, parcel tenure status, and non-farm entrepreneurial
income. Almost the same explanatory variables came out as significant
predictors except for the dummy variable parcel tenure status, which has a
value of one if the parcel is owned by the farmer and zero if not. The positive
sign of the coefficient shows that net income from rice farming increases by one
percent if the farmer is the landowner. As for the impact of crop insurance, the
coefficient of the probability of insurance availment shows that the effect of crop
insurance on net income from rice farming is 1.25 percent. If the farmer gets
crop insurance, his/her income increases by the above-mentioned magnitude.
The availment variable however has minimal influence on income as indicated
by the p-value.
The regression results for farm size categories, greater than 0.5 to 1 ha,
and greater than 1 hectare to 3 hectares, reveal that the impacts of crop
insurance are 3 percent and 1.6 percent, respectively, although not significant.

59
Regressions were also done for matched samples, with insurance and
without insurance (T1,T2 and T3); with insurance with indemnity claims and
without insurance (T1 and T3); with insurance with claims and with insurance
without claims (T1 and T2); and with insurance without claims and without
insurance. The independent variables that came out to significantly affect the
net rice production income were similar. What is noteworthy however is how
the impact of is crop insurance on net income increases as farm size category
decreases such that for bigger sized farms the effect of having crop insurance
is lesser compared with small sized farms. This is true whether the impact is
positive or negative. In cases where impact of crop insurance is negative, the
negative impact is lesser on small farms compared with bigger farms.

60
Chapter 5: Summary, Conclusions, and Recommendations Summary and Conclusions This study hypothesized that crop insurance as a risk management tool
will increase income of rice farmers. The results of the study show that rice
farmers in Western Visayas are mostly married males who are typically in their
50s, belonging to a household with 4.5 members and had least elementary
education. On the average, their farm size is only one hectare while their
farming experience is 26 years.
Majority of the farmers with crop insurance were enrolled in the program
for two consecutive years. Majority of those who availed of crop insurance for
two consecutive years were the ones who received indemnity payments.
The most common reason cited by farmers for getting crop insurance is the
information given by their agricultural technician from the LGU. Those who did
not have crop insurance on the other hand, explained that lack of knowledge
about crop insurance or about the process of enrollment prevented them from
getting one.
Rice farming operations are generally self-financed by farmer respondents.
Borrowing is done only if savings are insufficient. Sources of credit are mostly
informal such as the local moneylender or relatives and friends. Loans availed
are often used to purchase farm production inputs, for farm improvement, and
household consumption.
The results of the Probit regression analysis reveal that the likelihood of
farmers enrolling their rice farm to crop insurance increases in the year 2015, if
the farmer has previous experience of rain shock, receives government transfer
and has some college education. Farm characteristics such as access to
61
effective irrigation and being flood-prone have also a positive effect on
likelihood of uptake of rice insurance. On the other hand, being a PCIC priority
area has inversely affected the probability of availment.
Typhoon and drought are the most severe shocks experienced by rice
farmers in Region VI in the last two years. The most common farming
adaptation method is changing the planting calendar. Coping mechanisms in
consumption on the other hand, include shifting to cheaper food items, reducing
electricity consumption, letting children skip school and limiting recreational
activities. In terms of healthcare, coping strategies are shifting to cheaper
medicines or self-medication.
Half of the farmers who received indemnity payments used the money to
finance farming operation for the next planting season. Others used it either for
food or school expenses.
The result of the impact evaluation shows that insurance has positive impact
on the income of rice farmers. The random effects panel regression show that
crop insurance raised the income of rice farmers in Western Visayas compared
to the control without insurance. The regression results further showed that
when farm size was considered, the positive impact of crop insurance increases
as farm size decreases. This finding is consistent for various regressions on
different matched samples.
This results of the impact evaluation lead us to the following conclusions for
Western Visayas’ rice farmers. Risk aversion and experience of peril are
compelling reasons why farmers assure their rice farms. Government transfers
increases the uptake of crop insurance among farmers. PCIC does not only
serve rice farmers who are conveniently located near their offices despite the

62
lack of personnel, they also serve farmers in other provinces and municipalities.
Distance from the PCIC office therefore is not important, farmer’s will get crop
insurance as long as they are qualified and eligible.
The bundling of credit and crop insurance improved the rice farmers’ access
to credit. Crop insurance have positive impact on the income of rice farmers.
Farmers with smaller farm sizes benefitted more from crop insurance compared
to bigger farms. The impact of rice insurance on farmers’ incomes is negative
between those with crop insurance with indemnity claims and those that have
no insurance. The losses can be very high that indemnity payments are not
enough to cover for these losses
Recommendations Based on the results and conclusions, the following are the
recommendations: One is to increase penetration rate among small farm
holders. The municipal farm technicians can be tapped to help in the awareness
campaign of crop insurance since they are in constant communication with the
farmers. Enhance the impact of crop insurance among bigger farms by
designing more crop insurance packages that benefits them.
One of the best practices of PCIC crop insurance is the bundling with
formal credit. This mechanism not only enhances access to formal credit
among farmers but also encourages credit institutions to increase availability of
loans to agriculture. It is recommended that this system be expanded to widen
the available credit for farmers.
It is also recommended that PCIC services be improved particularly the
processing and releasing time of indemnity claims. One option is to put up
satellite offices in strategic areas so farmers can easily access PCIC services.