Embed Size (px)
Citation preview


Evaluation of the New Zealand Health Care Home, 2010-2016
25 January 2017
Evaluation of the New Zealand Health Care Home EY i
Our thanks to the PHO and practice staff who offered their time so willingly in providing data for this evaluation.
This document has been prepared by Ernst & Young (EY) for the N4 PHOs. The information contained in this document is derived from provided data and private sources (e.g. interviews and correspondence), which we believe to be reliable and accurate but, without further investigation, their accuracy, completeness or correctness cannot be warranted. This information is supplied on the condition that EY, and any partner or employee of EY, are not liable for any error or inaccuracy contained herein, whether negligently caused or otherwise, or for loss or damage suffered by any person due to such error, omission or inaccuracy as a result of such supply. This document is provided for the sole use of the N4 PHOs. We shall have no responsibility whatsoever to any third party in respect of the contents of this report.
For further information please contact:
Dr Gary Jackson [email protected]
Ernst & Young
2 Takutai Square, Britomart, Auckland 1010, New Zealand
Citation: Evaluation of the New Zealand Health Care Home, 2010-2016. Auckland: Ernst & Young, 2017.
Evaluation of the New Zealand Health Care Home EY ii
Table of contents
1. Executive summary ...................................................................................................................... 1
1.1 Project purpose ...................................................................................................................... 1
1.2 Evaluation approach .............................................................................................................. 1
1.3 Key findings and discussion .................................................................................................. 1
1.4 Summary of recommendations .............................................................................................. 3
1.5 Conclusion ............................................................................................................................. 4
2. Detailed findings ........................................................................................................................... 5
2.1 Implementation ...................................................................................................................... 5
2.2 Performance .......................................................................................................................... 7
2.3 Efficiency................................................................................................................................ 8
3. The Health Care Home ................................................................................................................ 9
3.1 The genesis of the HCH ........................................................................................................ 9
3.2 HCH core elements ............................................................................................................... 9
3.3 HCH practice funding model ................................................................................................ 10
3.4 Broadening interest in HCH ................................................................................................. 11
3.5 HCH standards .................................................................................................................... 11
3.6 Improving patient and staff experience ................................................................................ 13
3.7 New workforce roles ............................................................................................................ 13
3.8 Quality .................................................................................................................................. 14
3.9 Difference from traditional general practice ......................................................................... 14
3.10 Adoption to date ................................................................................................................... 15
4. Evaluation approach................................................................................................................... 16
4.1 Evaluation summary ............................................................................................................ 16
5. Performance framework and programme logic .......................................................................... 18
5.1 Performance measures in use in New Zealand and elsewhere .......................................... 18
5.2 Development of a logic model ............................................................................................. 20
5.3 Development of the performance framework ...................................................................... 20
5.4 Logic model and performance framework ........................................................................... 20
6. Implementation path ................................................................................................................... 29
6.1 The journey .......................................................................................................................... 29
6.2 New Zealand Health Care Home Implementation Tool ....................................................... 29
6.3 Alignment to the HCH model ............................................................................................... 30
6.4 How the tool works .............................................................................................................. 31
6.5 When to use the tool ............................................................................................................ 32
6.6 Measuring the implementation journey ................................................................................ 32
6.7 Conclusion from self-assessments ...................................................................................... 42
7. Process evaluation ..................................................................................................................... 43
7.1 Summary of findings ............................................................................................................ 43
7.2 Approach.............................................................................................................................. 44
7.3 Analysis framework .............................................................................................................. 44
7.4 Participating practices .......................................................................................................... 44
7.5 Source documents ............................................................................................................... 45
7.6 Additional data ..................................................................................................................... 46
7.7 Elements of the Health Care Home – model of care changes over time ............................ 47
7.8 Patient and staff perceptions over time ............................................................................... 55
Evaluation of the New Zealand Health Care Home EY iii
7.9 Access and equity ................................................................................................................ 59
7.10 A financial case study .......................................................................................................... 60
7.11 Conclusion from meta-analysis ........................................................................................... 60
8. Quantitative analysis .................................................................................................................. 61
8.1 Summary.............................................................................................................................. 61
8.2 Analysis framework .............................................................................................................. 62
8.3 Practice demography ........................................................................................................... 64
8.4 Patient touches .................................................................................................................... 68
8.5 Emergency department ....................................................................................................... 69
8.6 Inpatient care ....................................................................................................................... 72
8.7 Outpatient care .................................................................................................................... 79
8.8 Partial implementation ......................................................................................................... 80
9. Conclusion .................................................................................................................................. 81
Appendix A Summary of national and international primary care performance indicators .............. 82
Appendix B Partially implemented HCH practices............................................................................ 86
Appendix C Domains of the NZ HCH Implementation Tool .............................................................. 92
Navigating this report
Chapter 1 provides an executive summary of the report
Chapter 2 provides a list of findings from the body of the report
Chapter 3 provides some important information on the HCH model, how it was developed in New Zealand, and how it is being implemented
Chapter 4 describes the approach taken to the evaluation and to the development of the HCH performance framework
Chapter 5 describes the HCH logic model and performance framework, and the rationale underpinning them
Chapter 6 describes the development of a tool to measure implementation progress and describes the results from four practices who used the tool
Chapter 7 describes the outcomes of a meta-analysis of previous evaluations undertaken of the New Zealand HCH
Chapter 8 describes the results of a quantitative analysis of hospital activity data
Chapter 9 draws some conclusions from the entire evaluation
Evaluation of the New Zealand Health Care Home EY 1
1. Executive summary
This report describes the outcomes of a 2016 evaluation of the Pinnacle Midlands Health Network (PMHN) Health Care Home (HCH) model, which has been adopted by 15 PMHN practices. Some Pegasus, Compass and ProCare practices have also adopted (or are in the process of adopting) aspects of the model. The outcomes of this evaluation are of interest to all these organisations and more broadly to New Zealand primary and secondary care stakeholders.
1.1 Project purpose
The purpose of this project was to undertake an independent evaluation of the HCH model of care that incorporated findings of past evaluation work and identified future performance measures and potential future impacts of the model. Specific objectives were:
1. To provide an independent evaluation of the HCH model of care, that included consideration of the previous evaluation objectives used by PMHN
2. To develop an enduring performance framework for the HCH model of care including measures, and associated data definitions (and subsequently collection and analysis).
1.2 Evaluation approach
Initially a logic model was developed for the HCH, which formed the basis for a performance framework, with indicative measures. This was tested in its early stages with practices and PHOs at a meeting in June 2016. An assessment tool, the New Zealand Health Care Home Implementation Tool was developed to support self-assessment of progress towards achieving the elements of the HCH. The evaluation itself consisted of four main components:
► A meta-analysis of previous evaluations
► A two-day workshop in June 2016
► Analysis of the results provided by four practices who applied the New Zealand Health Care Home Implementation Tool to measure their progress to becoming a HCH
► A quantitative analysis of secondary care activity data that could reasonably be expected to show impact from the change to the HCH model in local practices, based on the six practices that had been running the model from 2013 or before. Control practices were selected based on being relatively close in size and geography to the HCH practices, but they had fewer Māori and Pacific enrollees on average, and were less deprived than their HCH counterparts. A wide range of practice styles and types were represented - in 2015 practice sizes ranged from 4,000 to 10,000,
average deprivation levels 4 to 8, and proportion of Māori or Pacific enrolees from 10 to 50%. Geographically two practices were in Hamilton, three in rural Waikato, and one in Christchurch.
1.3 Key findings and discussion
The HCH model was developed in response to the imperative to change the way general practice is provided. Drivers included the ageing workforce and predicted shortages of GPs, increasing rates of preventable chronic conditions, and increasing demand on an already stressed hospital system. The HCH model has been evolving since its initial conception in 2010 and now, in 2016, there are clear and enduring changes to the way participating practices do business.
The systematic development seen in the HCH practices is not necessarily seen in non-HCH practices. Examples include the active register of high needs patients, nurses trained to plan and co-ordinate care, and having electronic care plans in place and visible on the PMS. These and other foundational elements of the HCH have been well established in those practices who were early adopters,
Evaluation of the New Zealand Health Care Home EY 2
although not across all elements in all practices (refer self-assessments). HCH improvements such as visual displays and huddles were reported to lead to better achievement of health targets. Importantly, the work required to move a practice to the HCH model was multidimensional, entailed significant change management and took time.
An advantage for this evaluation was the ability to access progressive evaluation data from the commencement of the model. After five years, there had been a fundamental shift across all areas of the business but this was incremental and some changes took longer than others to achieve. For example proactive care management required the initial changes in acute demand management to be bedded in to allow clinician time to be re-deployed.
While future practices will benefit from the lessons learnt by ‘early adopter’ practices, it is likely that the level of investment in time and effort experienced by the early adopters will still be necessary for sustainable implementation.
1.3.1 Patient experience
Iterative evaluations have demonstrated a progression in actions, attitudes and experience for patients and providers in response to the new model. Feedback from patients and providers was positive, despite initial misgivings from some practice staff. By 2015 in most domains responses were higher in HCH practices. In some domains, such as feeling part of the care team and increased self-care/self-management, patients of HCH practices rated their practices slightly lower than those from other (non-control) practices. Workshop participants noted that it takes time for some patients to become used to the new way of working, and clear communications were important.
Improvements to the patient experience focused on: saving patient time through improved triaging and reduced face to face visits; improving telephone access (through the Patient Access Centre or PAC in the case of PMHN practices) as illustrated by lower levels of call abandonment; and improving and standardising co-ordinated proactive care. Telephone call abandonment rate at peaks times dropped from 18-25% to 1-7% for the HCHs. One practice estimated an overall saving of 44 weeks of patient time over a 12 month period.
Adoption of the patient portal in HCH practices has been significantly higher than the control practices, further aiding patient engagement and saving patient time. By quarter 2 2016, 41% of the patients in the included HCH practices were registered for the patient portal (range 17 – 77%). By comparison, the selected control practices were at 19% (range 2%-24%).
1.3.2 The practice
Once past the initial implementation period staff were positive about the new model, generally rating it higher than the traditional model of general practice. New workforce roles were created, including medical centre assistants, clinical pharmacists, and social and community workers, which increased team-based care and reduced reliance on general practitioners (GPs). This allowed clinicians to work at the top of their scopes of practice, with participating practices reporting increases in efficiency and release of clinician capacity through processes initiated as part of the HCH model.
For example, one practice reported that allocating telephone slots between GP / nurse and patient in the early morning enabled a reduction of up to 40% in unplanned same day appointments for acute issues. At a workshop held in June 2016 HCH practices noted a 30% reduction in same day unplanned appointments ‘as a minimum’, with one practice suggesting a 50-60% reduction with their mature model comparing 2016 to 2011.
Increased patient ‘touches’ were achieved with a reduction in GP and nursing FTEs. The fact that the model appeared to increase capacity in general practice was an important positive finding, and this should continue to be monitored as part of the overall HCH performance framework. Doctors had similar face to face time with patients compared to before the model implementation, but this time was more planned and considered to be more productive. Anecdotally, the model has supported GPs to stay in practice and reinvigorated their approach to their work. Two practices had specifically reported increases in patient activity (15% and 7%) in 2012 following implementation, but also of note was the reported increase in capacity to allocate more care time to those patients requiring it.
Evaluation of the New Zealand Health Care Home EY 3
Overall enrolled patient numbers remained steady across HCH implementation, with a low turnover of 3-4% per quarter. If anything, retention improved during the implementation period. Some practices had closed books for a time as a change management controlling response, so increases in enrolments were not expected.
Internal stakeholders reported that all HCH sites within PMHN had maintained or slightly improved their financial performance under the new model. Individual sites experienced staff changes, movement in patient numbers or other locally driven issues that had an impact on financial performance, but this was not related to the HCH. Reported lower income (through lower co-payments through lower face-to-face doctor contacts) and higher costs associated with the model were largely offset through increased flexible funding, and some increase in co-payments from virtual care and increased nursing co-payment income.
1.3.3 System effects
Analysis of secondary care activity data did not reveal significant differences in activity between HCH practices and control practices from 2011 through to 2015. It was noted that the higher Māori/Pacific and deprived populations in HCH practices did not translate into higher outpatient clinic ‘did not attend’ (DNA) rates compared with matched control practices, as might have been expected. Also, there was a trend for HCH non-admitted ED attendances to have a small increase while controls had a significant rise, but the inter-group difference overall was not statistically significant.
Proactive care management for long term conditions is one of the key components of the logic model that drives the expectation of improvements in emergency department (ED), hospitalisation and ambulatory sensitive hospitalisation (ASH) rates, but this:
► Takes time to take effect
► Was a relatively late addition to the HCH implementation path for the practices in this analysis
► Is being addressed through other initiatives nationally, and by DHBs and PHOs working in an alliancing environment, which may obscure any specific HCH effect.
Note that no risk adjustment was undertaken for this analysis. As an ‘open cohort’ study, with the practice populations changing each quarter at ~3-4%, patients moving practices may skew the utilisation data – for example if more complex patients differentially enrolled/switched to HCH practices.
1.4 Summary of recommendations
It is recommended that:
► The efforts to describe the key elements of the HCH and develop standards that enable
assessment of an organisation’s fidelity to the model, should continue. The self-assessment tool developed for this evaluation should continue to be adjusted in line with adaptations to HCH elements and standards
► The performance framework developed for this evaluation should be reviewed by N4, with a view to finalising and describing performance indicators, based on the process and outcome measures described in the framework. Some initial work has been done on this, which can form the basis for further refinement and development of a data dictionary
► Any future planning for wider rollout of the HCH in New Zealand should recognise the inter-linked multiple changes needed, and factor into model planning the necessary time and effort required to build a sustainable model and effectively embed changes.
► Areas that were not specifically examined in this review could be usefully evaluated in future work. This would include financial aspects, and improvements in staff retention, at both practice
Evaluation of the New Zealand Health Care Home EY 4
and network levels. The quantitative analysis would benefit from having more practices included, and more time to have shown an effect, so could be usefully repeated in a year’s time. Some form of risk adjustment is recommended. Further sub-categories that might be added include the elderly, frail elderly, and patients with chronic disease.
► Patient experience, especially that of Māori and Pacific, should continue to be monitored and reported. An improved patient experience is essential to the success of the HCH model. Quantification of the saved patient time might usefully illustrate the gains made there.
► Any elements of the model that have not yet been successfully implemented in most early adopters (after 4-5 years) should be reviewed for relevance and adapted or removed.
1.5 Conclusion
The implementation of the HCH model was ambitious and based on a driving need to change the way general practice was provided. There has been a sustained investment over five years to achieve the changes to the HCH model. It appears, from the perspectives of both patients and providers, that the model has achieved positive changes. In addition, there is reported evidence of increased clinical capacity within existing operational funding in practices as a result of implementing the HCH model.
Future HCH model rollouts should consider the lessons learned from these early implementations, but also recognise the need for substantial investment in time and effort to achieve sustainable change.
Evaluation of the New Zealand Health Care Home EY 5
2. Detailed findings
This chapter lists all findings from the body of the report.
2.1 Implementation
The three methods of assessing implementation were:
► Meta-analysis of previous evaluations
► A two-day workshop in June 2016
► Review of the results from four completed self-assessments using the New Zealand Health Care Home Implementation Tool
The following findings were developed regarding implementation:
2.1.1 Changes in primary care service utilisation
► Quantitative data from the previous evaluations showed increasing uptake of key elements of the model over time, including use of the patient portal and use of alternative means for patient consultations. The HCH model of care appeared, based on qualitative data, to be achieving many of its expressed aims, however assumptions about the applicability of some elements of the model (e.g. “fishing”) may need to be revisited.
► While practices that have been implementing the HCH model for longer appear to be close to achieving the ‘threshold’ score on self-assessment, examination of elements within each domain identify specific areas of activity where more focus might be required. Based on the results of four completed self-assessments, it appears that the local context and patient profile may shape which domains of the HCH are implemented more easily than others. For example, a practice which is already firmly embedded in the local service system may find it easier to achieve some of the elements of co-ordinated and integrated care.
► It took time to make changes of the magnitude of the transition to a HCH model of practice. Based on self-assessment of practices in early stage implementation, changes to business models, efficiency and infrastructure appear to require more time and investment than some of the other domains. Allowing adequate time and maintaining realistic expectations while expecting measurable change required balancing and rebalancing organisational effort and commitment.
► At least one practice1 reported no negative effect on the bottom line after implementing the HCH (not including implementation investments), even though there was a re-alignment of time/effort from different care team members. Other practices, both PMHN-owned and privately owned, noted operational funding remained similar before and after (again excluding implementation costs).
► Two practices reported in 2012 an increase in patient consultations. There was a 12% increase in patient touches between 2010 and 2015, notably in virtual consultations. This occurred at the same time as a decrease in GP and nursing FTE, demonstrating increased capacity.
► In Q2 2016 41% of the patients in the included HCH practices were registered for the patient portal (range 17-77%). By comparison, the selected control practices were at 19% (range 2%-24%).
1 Travis Medical Centre
Evaluation of the New Zealand Health Care Home EY 6
2.1.2 Patient experience
► Improvements to the patient experience focused on: saving patient time through improved triaging and reduced face to face visits; improving telephone access (PAC for PMHN practices) as illustrated by lower levels of call abandonment; and improving and standardising co-ordinated proactive care. Over 12 months, one practice estimated a saving of 44.45 weeks of patient time, through effective GP triaging and offering alternatives to face to face care in the surgery.
► When compared to baseline practices in 2015, the average differences in patient experience between evaluation practices and other practices were minimal on a number of elements for patient self-care/self-management and patient as part of the team.
► Patient views and experiences were invaluable in assessing the impact and value of changes.
► Patients needed to be informed about the changes and why they were happening and were likely to require sustained education and support as the HCH model bedded down. Patient perceptions and experience, particularly for Māori and Pacific, need to continue to be monitored.
2.1.3 Impact for providers
► The changes required to implement the model were significant and impacted on practice staff. It took time for staff to adjust to the new way of working and to see benefits in this. Once comfortable with the HCH system staff generally rated it higher than the traditional model of general practice.
► There were anecdotal reports that the HCH model had increased sustainability for stressed GPs, with one example provided of a GP who had been intending to retire choosing to remain in the business because of the perceived advantages of the HCH model.
► The model allowed care team members to work at the top of their scopes of practice, and this was generally viewed positively. Key elements of this were the strengthening of team care and the introduction of new roles in the team – medical centre assistant, clinical pharmacist, and social and community workers.
► Staff were likely to require sustained education and support to maximise use of the key enablers for the HCH model of care.
2.1.4 New Zealand Health Care Home Implementation Tool
► Self-assessment is subjective and dependent on interpretation of the meaning of elements within domains. For baselining and comparability, the Tool can be applied with an external facilitator, to achieve higher inter-rater reliability. For practices applying the Tool, it provides an ongoing assessment against the domains of the HCH and a means of tracking and refocusing effort.
► Based on the results of the four completed self-assessments, it appears that local context and patient profile may shape the relative ease with which domains of the HCH are implemented. For example, a practice which is already firmly embedded in the local service system may find it easier to achieve some of the elements of co-ordinated and integrated care. For practices in the early stages of implementation, changes to business models, efficiency and infrastructure appear to require more time and investment than some of the other domains. Practices also commented that while an element might be present in the practice, and could be ‘ticked’, often that function continued improving as practice staff became more familiar with the changed approach.
Evaluation of the New Zealand Health Care Home EY 7
2.2 Performance
Key findings from the quantitative analysis include:
2.2.1 Changes in primary care service utilisation
► A wide range of practice styles and types were represented in the HCH practices included in this quantitative analysis. In 2015 practice sizes ranged from 4,000 to 10,000, average deprivation
levels 4 to 8, and proportion of Māori or Pacific enrolees from 10 to 50%. Geographically two practices were in Hamilton, three in rural Waikato, and one in Christchurch.
► While control practices were relatively close in size and geography to the HCH practices they had fewer Māori and Pacific enrolees on average, and were less deprived than their HCH counterparts. HCH practices had more children aged 0-14 and fewer enrolees aged 75+ than controls, but moved closer over the course of the study period.
► Overall enrolled patient numbers remained steady across HCH implementation, with a low turnover of 3-4% per quarter. If anything, retention improved during the implementation period. Some practices had closed books for a time as a change management controlling response, so increases in enrolments were not expected.
2.2.2 Changes in secondary care utilisation
► An important caveat for the secondary data analysis is the nature of the ‘open cohort’ analysis being undertaken. The analysis takes the population registered at the practice each quarter and checks the utilisation. To the extent that the changes in the population from quarter to quarter are random this will be robust. Any tendency for this not to be random, for example if more complex patients differentially enrolled/switched to HCH practices, then the utilisation data might be skewed.
► Little difference in secondary care utilisation was evident in comparing HCH and control practices:
► For non-admitted ED attendances, after removing an outlier practice, HCHs had a small non-significant rise, while the relevant controls showed a significant rise.
► For all acute admissions, and ambulatory sensitive hospitalisations (ASH) in 15-74 year olds specifically there was a rise across both groups. For ASH in children control practices had a marginally significant increase compared to a non-significant increase in HCH practices, but the time trends do not appear very different.
► Outpatient non-attendance (DNA) rates fell in both HCH and control practices, while remaining largely steady in other N4 practices overall. The higher Māori/Pacific and deprived populations in HCH practices did not translate into higher DNA rates compared with the control practices as might be expected.
► Overall for secondary care utilisation impacts there may have been a lower increase in non-admitted ED attendances compared with controls, and a lower increase in 0-14 ASH. Increases in bed days, 15-74 year-old ASH or indeed all medical-surgical admissions were similar to control practices – despite the significant change processes entered into by the HCH practices.
► Proactive care management for chronic conditions is one of the key components of the logic model that drives the expectation of improvements in ED, hospitalisation and ASH rates, but this:
► Takes time to take effect
► Was a relatively late addition to the HCH implementation path for the practices in this analysis
Evaluation of the New Zealand Health Care Home EY 8
► Is being addressed through other initiatives nationally, and by DHBs and PHOs working in an alliancing environment, which may obscure any specific HCH effect
2.3 Efficiency
Although a full efficiency review was not in the scope of the evaluation, the following information was provided to the evaluators based on internal review.
► All HCH sites within PMHN have maintained or slightly improved their financial performance under the new model. Individual sites have experienced staff changes, movement in patient numbers or other locally driven issues that have had an impact on financial performance but this has not been related to the HCH.
► The HCH funding flows require practices to change their management of cash flows. Lower overall income from GP co-payments are generated under the HCH as virtual care and extended consults are introduced. Additional costs are introduced in the practice including PAC (the telephony service) and new staff roles and staff ratios. These costs are, however, largely offset through increased flexible funding, and some increase in co-payments from virtual care and increased nursing co-payment income.
► Within PMHN, the HCH as a phase 1 reengineered general practice operates within the existing funding – that is, capitation/first level funding plus use of flexible funding to top up monthly capitation payments. It has, however, required some disinvestment in some services that have been funded through flexible funding in the past, often where DHBs have underfunded services (e.g. high needs podiatry care).
► Establishment costs beyond the first few HCH sites has been funded by PMHN from reserves and income produced through other activity. In some areas DHBs are now contributing towards the establishment costs which will allow a broader and more effective model to develop.
Evaluation of the New Zealand Health Care Home EY 9
3. The Health Care Home
This chapter provides some important information on the HCH model, how it was developed in New Zealand and how it is being implemented.
3.1 The genesis of the HCH
The HCH model is based on a model developed by Group Health. Group Health is a co-operative of 450 doctors who provide care to approximately 580,000 residents of Washington State and Northern Idaho. In 2010 members of the PMHN team travelled to Seattle to investigate the Medical Home model being implemented by Group Health. The Group Health model, based on the patient centred medical home, completely reengineered the way general practice was provided. This major reform was in response to resource and demand challenges like those also being experienced in New Zealand and other developed nations.
These challenges included:
► An increasing shortage of GPs ► An ageing population and an ageing workforce ► Increasing hospital demand
Within PMHN there was an appetite for new evidence-based models of practice and for widening scope to include other clinical disciplines in primary care, and an interest in increasing efficiency within a quality framework.
Modelled on the Group Health experience2, but customised to New Zealand conditions, the PMHN HCH model of care began operation in three practices (NorthCare Grandview, NorthCare Pukete and NorthCare Thomas Road) in 2010. At that time, it was called the Integrated Family Health Centre (IFHC) model.
It has since been refined and further adapted, based on implementation learnings.
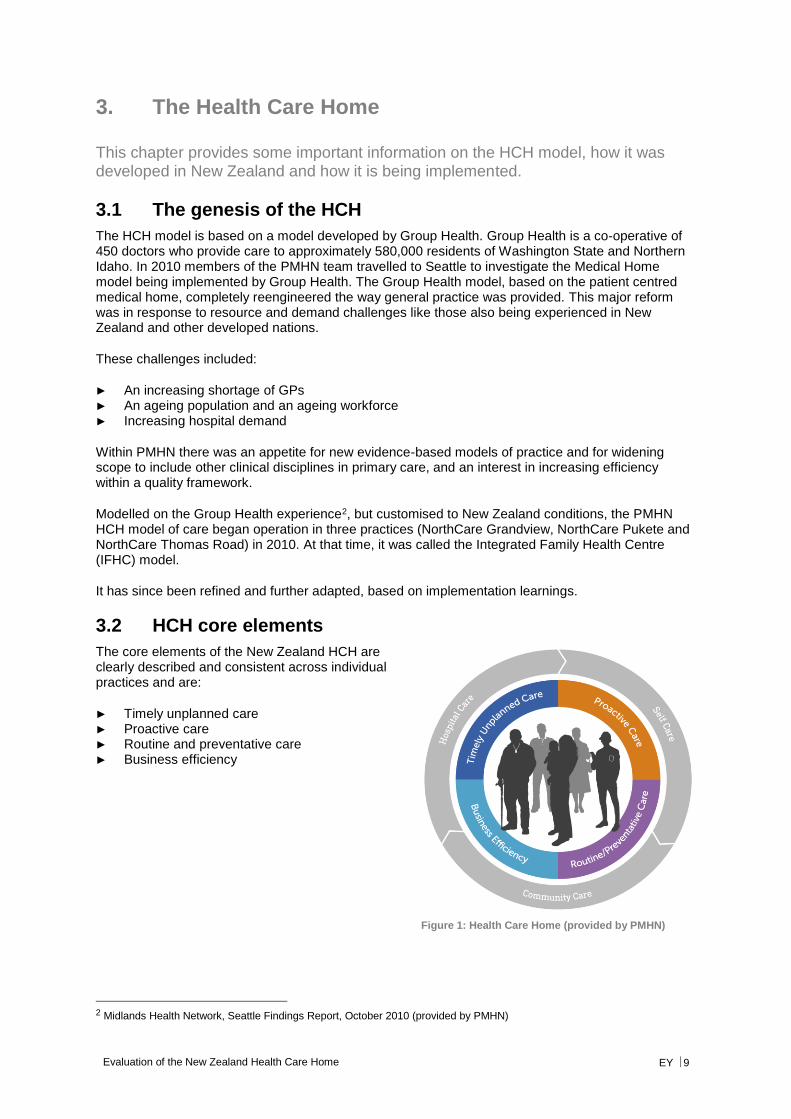
3.2 HCH core elements
The core elements of the New Zealand HCH are clearly described and consistent across individual practices and are:
► Timely unplanned care ► Proactive care ► Routine and preventative care ► Business efficiency
2 Midlands Health Network, Seattle Findings Report, October 2010 (provided by PMHN)
Figure 1: Health Care Home (provided by PMHN)
Evaluation of the New Zealand Health Care Home EY 10
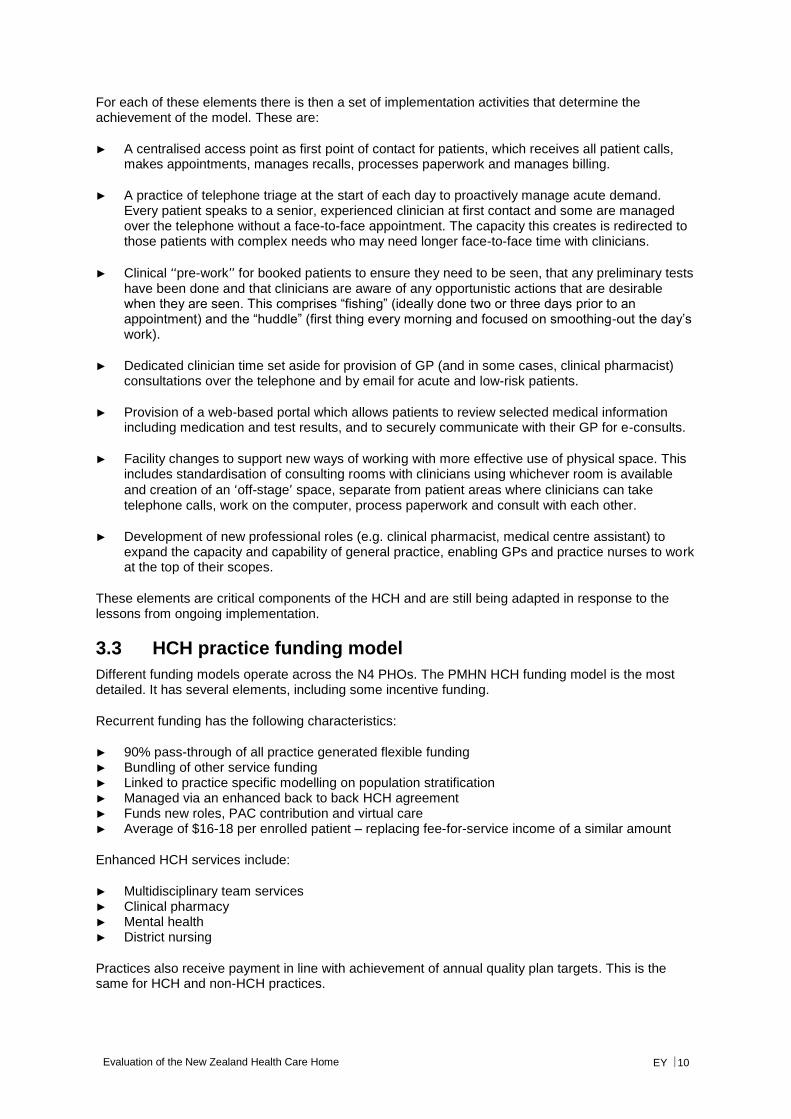
For each of these elements there is then a set of implementation activities that determine the achievement of the model. These are:
► A centralised access point as first point of contact for patients, which receives all patient calls, makes appointments, manages recalls, processes paperwork and manages billing.
► A practice of telephone triage at the start of each day to proactively manage acute demand. Every patient speaks to a senior, experienced clinician at first contact and some are managed over the telephone without a face-to-face appointment. The capacity this creates is redirected to those patients with complex needs who may need longer face-to-face time with clinicians.
► Clinical “pre-work” for booked patients to ensure they need to be seen, that any preliminary tests have been done and that clinicians are aware of any opportunistic actions that are desirable when they are seen. This comprises “fishing” (ideally done two or three days prior to an appointment) and the “huddle” (first thing every morning and focused on smoothing-out the day’s work).
► Dedicated clinician time set aside for provision of GP (and in some cases, clinical pharmacist) consultations over the telephone and by email for acute and low-risk patients.
► Provision of a web-based portal which allows patients to review selected medical information including medication and test results, and to securely communicate with their GP for e-consults.
► Facility changes to support new ways of working with more effective use of physical space. This includes standardisation of consulting rooms with clinicians using whichever room is available
and creation of an ‘off-stage’ space, separate from patient areas where clinicians can take telephone calls, work on the computer, process paperwork and consult with each other.
► Development of new professional roles (e.g. clinical pharmacist, medical centre assistant) to expand the capacity and capability of general practice, enabling GPs and practice nurses to work at the top of their scopes.
These elements are critical components of the HCH and are still being adapted in response to the lessons from ongoing implementation.
3.3 HCH practice funding model
Different funding models operate across the N4 PHOs. The PMHN HCH funding model is the most detailed. It has several elements, including some incentive funding.
Recurrent funding has the following characteristics:
► 90% pass-through of all practice generated flexible funding ► Bundling of other service funding ► Linked to practice specific modelling on population stratification ► Managed via an enhanced back to back HCH agreement ► Funds new roles, PAC contribution and virtual care ► Average of $16-18 per enrolled patient – replacing fee-for-service income of a similar amount
Enhanced HCH services include:
► Multidisciplinary team services ► Clinical pharmacy ► Mental health ► District nursing
Practices also receive payment in line with achievement of annual quality plan targets. This is the same for HCH and non-HCH practices.
Evaluation of the New Zealand Health Care Home EY 11
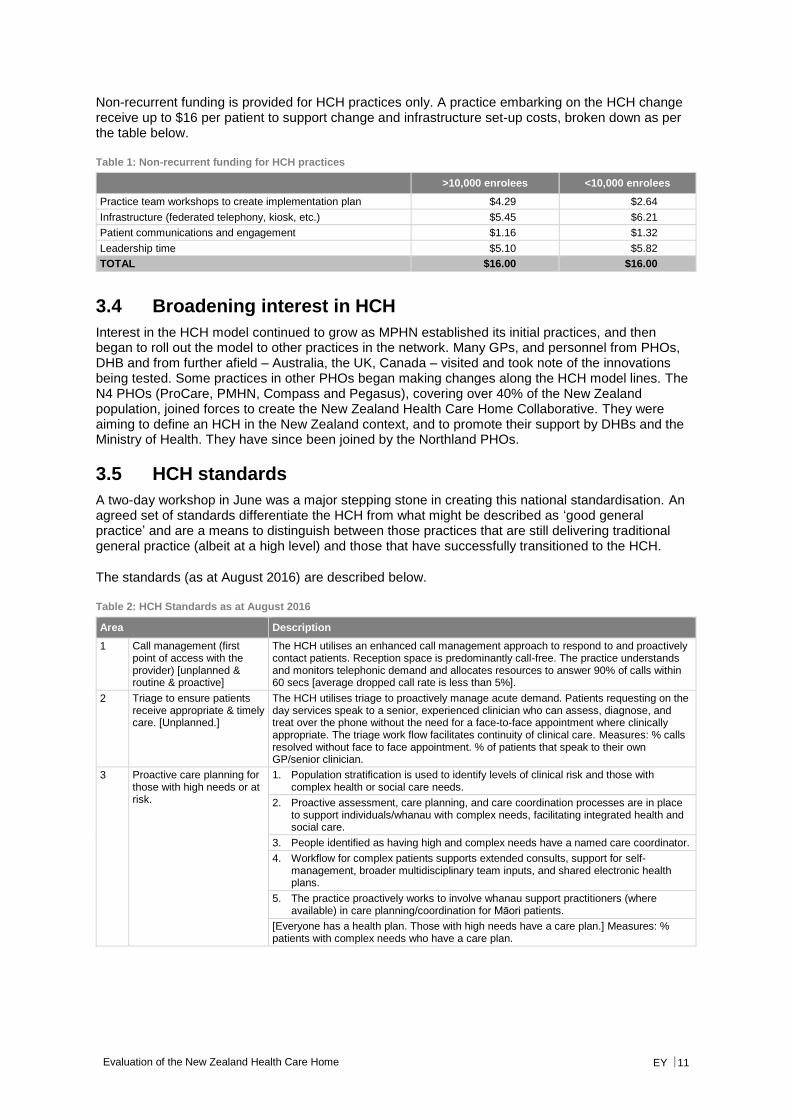
Non-recurrent funding is provided for HCH practices only. A practice embarking on the HCH change receive up to $16 per patient to support change and infrastructure set-up costs, broken down as per the table below.
Table 1: Non-recurrent funding for HCH practices
>10,000 enrolees <10,000 enrolees
Practice team workshops to create implementation plan $4.29 $2.64
Infrastructure (federated telephony, kiosk, etc.) $5.45 $6.21
Patient communications and engagement $1.16 $1.32
Leadership time $5.10 $5.82
TOTAL $16.00 $16.00
3.4 Broadening interest in HCH
Interest in the HCH model continued to grow as MPHN established its initial practices, and then began to roll out the model to other practices in the network. Many GPs, and personnel from PHOs, DHB and from further afield – Australia, the UK, Canada – visited and took note of the innovations being tested. Some practices in other PHOs began making changes along the HCH model lines. The N4 PHOs (ProCare, PMHN, Compass and Pegasus), covering over 40% of the New Zealand population, joined forces to create the New Zealand Health Care Home Collaborative. They were aiming to define an HCH in the New Zealand context, and to promote their support by DHBs and the Ministry of Health. They have since been joined by the Northland PHOs.
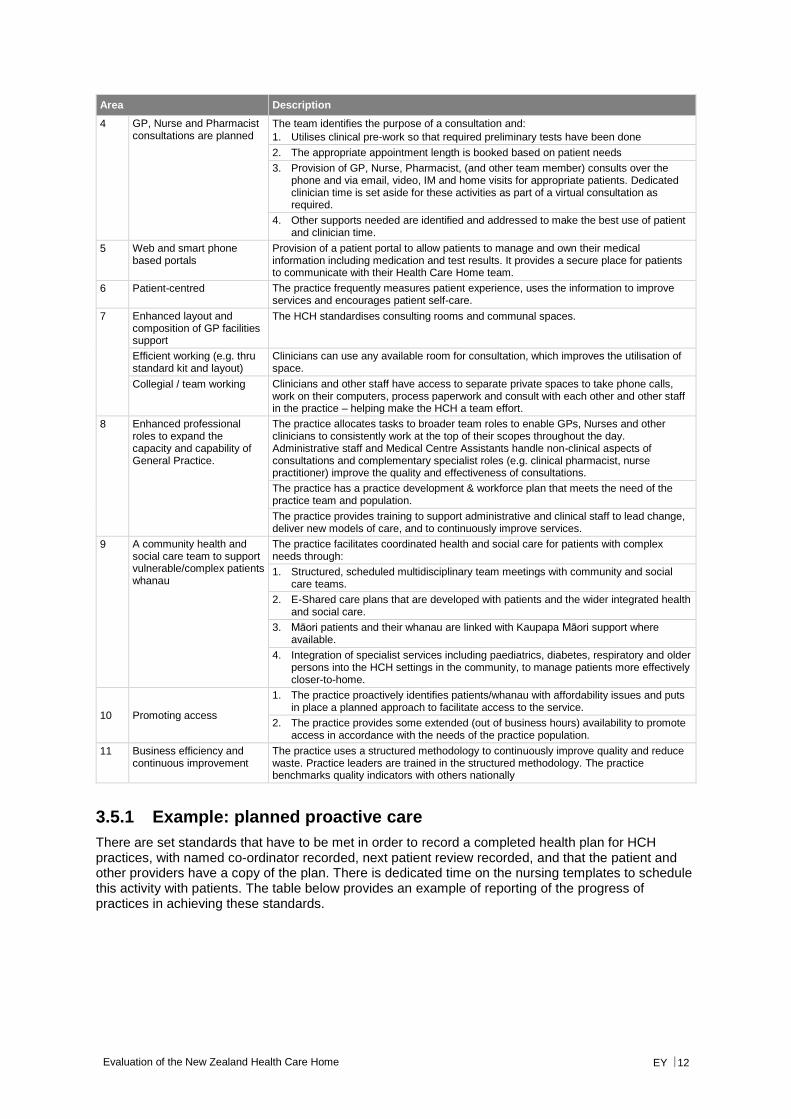
3.5 HCH standards
A two-day workshop in June was a major stepping stone in creating this national standardisation. An agreed set of standards differentiate the HCH from what might be described as ‘good general practice’ and are a means to distinguish between those practices that are still delivering traditional general practice (albeit at a high level) and those that have successfully transitioned to the HCH.
The standards (as at August 2016) are described below.
Table 2: HCH Standards as at August 2016
Area Description
1 Call management (first point of access with the provider) [unplanned & routine & proactive]
The HCH utilises an enhanced call management approach to respond to and proactively contact patients. Reception space is predominantly call-free. The practice understands and monitors telephonic demand and allocates resources to answer 90% of calls within 60 secs [average dropped call rate is less than 5%].
2 Triage to ensure patients receive appropriate & timely care. [Unplanned.]
The HCH utilises triage to proactively manage acute demand. Patients requesting on the day services speak to a senior, experienced clinician who can assess, diagnose, and treat over the phone without the need for a face-to-face appointment where clinically appropriate. The triage work flow facilitates continuity of clinical care. Measures: % calls resolved without face to face appointment. % of patients that speak to their own GP/senior clinician.
3 Proactive care planning for those with high needs or at risk.
1. Population stratification is used to identify levels of clinical risk and those with complex health or social care needs.
2. Proactive assessment, care planning, and care coordination processes are in place to support individuals/whanau with complex needs, facilitating integrated health and social care.
3. People identified as having high and complex needs have a named care coordinator.
4. Workflow for complex patients supports extended consults, support for self-management, broader multidisciplinary team inputs, and shared electronic health plans.
5. The practice proactively works to involve whanau support practitioners (where available) in care planning/coordination for Māori patients.
[Everyone has a health plan. Those with high needs have a care plan.] Measures: % patients with complex needs who have a care plan.
Evaluation of the New Zealand Health Care Home EY 12
Area Description
4 GP, Nurse and Pharmacist consultations are planned
The team identifies the purpose of a consultation and:
1. Utilises clinical pre-work so that required preliminary tests have been done
2. The appropriate appointment length is booked based on patient needs
3. Provision of GP, Nurse, Pharmacist, (and other team member) consults over the phone and via email, video, IM and home visits for appropriate patients. Dedicated clinician time is set aside for these activities as part of a virtual consultation as required.
4. Other supports needed are identified and addressed to make the best use of patient and clinician time.
5 Web and smart phone based portals
Provision of a patient portal to allow patients to manage and own their medical information including medication and test results. It provides a secure place for patients to communicate with their Health Care Home team.
6 Patient-centred The practice frequently measures patient experience, uses the information to improve services and encourages patient self-care.
7 Enhanced layout and composition of GP facilities support
The HCH standardises consulting rooms and communal spaces.
Efficient working (e.g. thru standard kit and layout)
Clinicians can use any available room for consultation, which improves the utilisation of space.
Collegial / team working Clinicians and other staff have access to separate private spaces to take phone calls, work on their computers, process paperwork and consult with each other and other staff in the practice – helping make the HCH a team effort.
8 Enhanced professional roles to expand the capacity and capability of General Practice.
The practice allocates tasks to broader team roles to enable GPs, Nurses and other clinicians to consistently work at the top of their scopes throughout the day. Administrative staff and Medical Centre Assistants handle non-clinical aspects of consultations and complementary specialist roles (e.g. clinical pharmacist, nurse practitioner) improve the quality and effectiveness of consultations.
The practice has a practice development & workforce plan that meets the need of the practice team and population.
The practice provides training to support administrative and clinical staff to lead change, deliver new models of care, and to continuously improve services.
9 A community health and social care team to support vulnerable/complex patients whanau
The practice facilitates coordinated health and social care for patients with complex needs through:
1. Structured, scheduled multidisciplinary team meetings with community and social care teams.
2. E-Shared care plans that are developed with patients and the wider integrated health and social care.
3. Māori patients and their whanau are linked with Kaupapa Māori support where available.
4. Integration of specialist services including paediatrics, diabetes, respiratory and older persons into the HCH settings in the community, to manage patients more effectively closer-to-home.
10 Promoting access
1. The practice proactively identifies patients/whanau with affordability issues and puts in place a planned approach to facilitate access to the service.
2. The practice provides some extended (out of business hours) availability to promote access in accordance with the needs of the practice population.
11 Business efficiency and continuous improvement
The practice uses a structured methodology to continuously improve quality and reduce waste. Practice leaders are trained in the structured methodology. The practice benchmarks quality indicators with others nationally
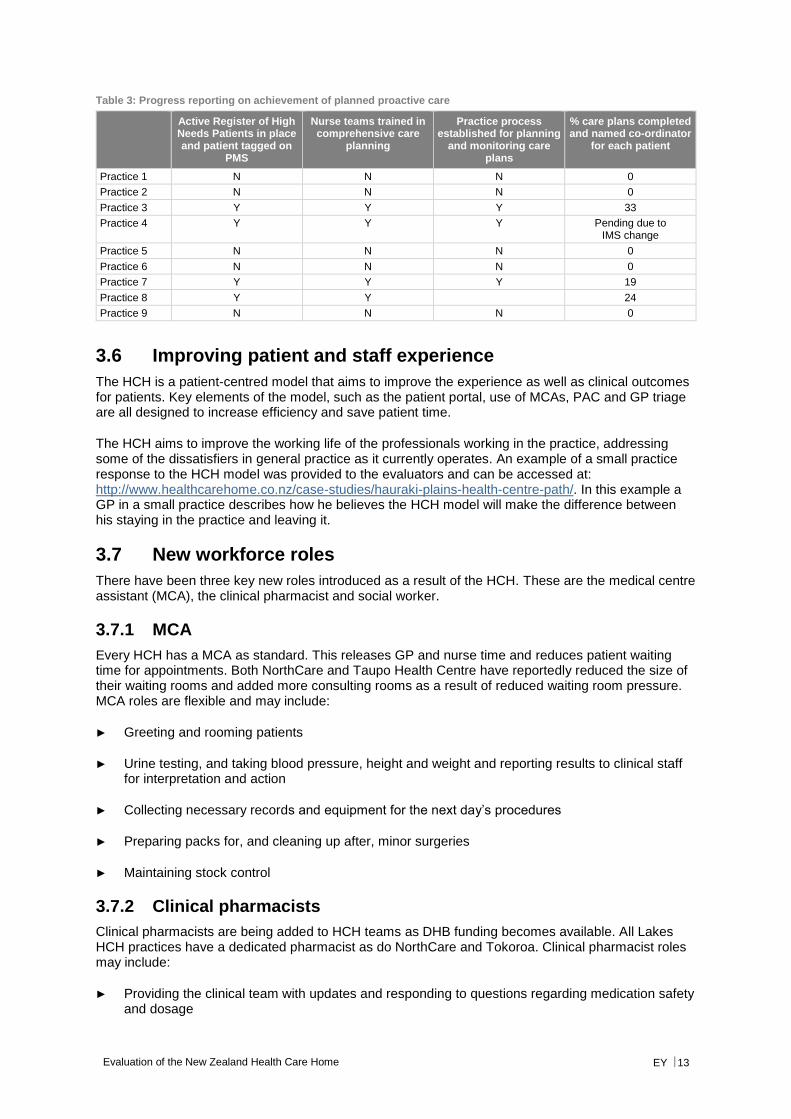
3.5.1 Example: planned proactive care
There are set standards that have to be met in order to record a completed health plan for HCH practices, with named co-ordinator recorded, next patient review recorded, and that the patient and other providers have a copy of the plan. There is dedicated time on the nursing templates to schedule this activity with patients. The table below provides an example of reporting of the progress of practices in achieving these standards.
Evaluation of the New Zealand Health Care Home EY 13
Table 3: Progress reporting on achievement of planned proactive care
Active Register of High Needs Patients in place and patient tagged on
PMS
Nurse teams trained in comprehensive care
planning
Practice process established for planning
and monitoring care plans
% care plans completed and named co-ordinator
for each patient
Practice 1 N N N 0
Practice 2 N N N 0
Practice 3 Y Y Y 33
Practice 4 Y Y Y Pending due to IMS change
Practice 5 N N N 0
Practice 6 N N N 0
Practice 7 Y Y Y 19
Practice 8 Y Y 24
Practice 9 N N N 0
3.6 Improving patient and staff experience
The HCH is a patient-centred model that aims to improve the experience as well as clinical outcomes for patients. Key elements of the model, such as the patient portal, use of MCAs, PAC and GP triage are all designed to increase efficiency and save patient time.
The HCH aims to improve the working life of the professionals working in the practice, addressing some of the dissatisfiers in general practice as it currently operates. An example of a small practice response to the HCH model was provided to the evaluators and can be accessed at: http://www.healthcarehome.co.nz/case-studies/hauraki-plains-health-centre-path/. In this example a GP in a small practice describes how he believes the HCH model will make the difference between his staying in the practice and leaving it.
3.7 New workforce roles
There have been three key new roles introduced as a result of the HCH. These are the medical centre assistant (MCA), the clinical pharmacist and social worker.
3.7.1 MCA
Every HCH has a MCA as standard. This releases GP and nurse time and reduces patient waiting time for appointments. Both NorthCare and Taupo Health Centre have reportedly reduced the size of their waiting rooms and added more consulting rooms as a result of reduced waiting room pressure. MCA roles are flexible and may include:
► Greeting and rooming patients
► Urine testing, and taking blood pressure, height and weight and reporting results to clinical staff for interpretation and action
► Collecting necessary records and equipment for the next day’s procedures
► Preparing packs for, and cleaning up after, minor surgeries
► Maintaining stock control
3.7.2 Clinical pharmacists
Clinical pharmacists are being added to HCH teams as DHB funding becomes available. All Lakes HCH practices have a dedicated pharmacist as do NorthCare and Tokoroa. Clinical pharmacist roles may include:
► Providing the clinical team with updates and responding to questions regarding medication safety and dosage

Evaluation of the New Zealand Health Care Home EY 14
► Working as part of the clinical team to review and optimise patient medications for patients
► Holding phone or face-to-face consultations with patients to review medications
► Reviewing hospital discharge notes to check for errors and that medications are appropriate
► Following up discharged patients
► Ordering blood tests and referring patients for a GP consultation if necessary
3.7.3 Social and community workers
PMHN is piloting a practice based social worker in the Coromandel HCH practice and community health workers in Te Awamutu and Taupo. The evaluators were provided with a written article on the community health worker in Te Awamutu. The role is part of the HCH team and works closely with doctors and nurses in the practice. The role provides a link between patients and their families and the health care team, as well as supporting patients in managing their diabetes.
3.8 Quality
Putting in place live visual displays and morning huddles focused on quality improves the practice achievement of targets. Actions on areas for concern are recorded on the HCH action plan.
3.9 Difference from traditional general practice
The HCH differs from traditional general practice (even ‘good general practice’) in that it fundamentally shifts the focus of the practice from the GP to the patient. This is not a small thing and requires a significant degree of reengineering. It means the activities of the practice become aimed at improving access, experience and outcomes for patients and their families, rather than the professional demands of the clinical staff. It recognises that general practice is part of a wider system of primary health care that interacts with patients and shapes their overall health and wellbeing.
The HCH builds a model of care that is centred around the patient’s needs and aspirations and therefore uses the skills and capacity of the entire practice team (clinical and non-clinical) rather than viewing the extended health team as accessories to GP care. It builds business efficiency and standardisation of facilities and processes into the model practice, rather than relying on the preferences of individual clinicians.
Fundamentally the model aims to achieve a shift from:
► A system/provider driven care model to a patient driven care model
► Face to face to virtual care where appropriate
► Reactive care to as much planned care as possible
► A universal model to care that is personalised to patient need and context, using a team approach across sectors
► A siloed, fragmented provider environment to one that is a well co-ordinated, shared care environment
► Providers surviving the working day to providers enjoying the day
► Vulnerable practices to practices that are viable in the longer term

Evaluation of the New Zealand Health Care Home EY 15
3.10 Adoption to date
In addition to the initial three practices, other PMHN practices have subsequently adopted the model (to a current total of 15). Some Pegasus, Compass and ProCare practices have also adopted (or are in the process of adopting) aspects of the model. Each practice is likely to have variants of the model, have variable implementation of each component of the model, and be at different stages of the implementation sequence.
Evaluation of the New Zealand Health Care Home EY 16
4. Evaluation approach
This chapter describes the approach to the evaluation and to the development of a HCH performance framework.
4.1 Evaluation summary
4.1.1 Scope
A formal evaluation approach for PMHN practices was agreed with the Ministry of Health and carried out by the University of Waikato initially, and then by Marinal Services, using qualitative and quantitative methods. Additional quantitative work was carried out by the Health Intelligence team at PMHN through to 2014.
The N4 group recently identified the need for further evaluation with the following components:
► Identifying an enduring performance framework for the HCH model of care, including measures, and associated data definitions (and subsequently collection and analysis)
► Identifying the historic/current information available to develop a report on the performance of the HCH model to date
► Preparation of an independent evaluation report using the available data and incorporating the findings of past evaluation work, and pointing to future measures and potential future impacts of the model
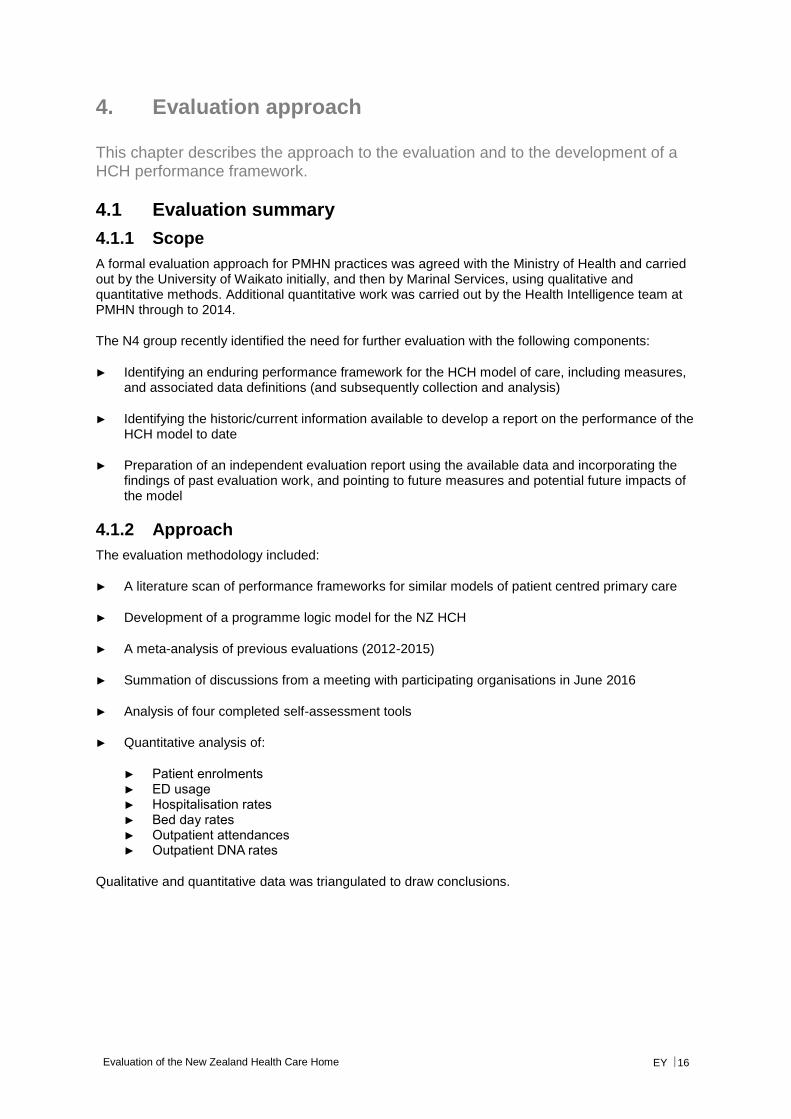
4.1.2 Approach
The evaluation methodology included:
► A literature scan of performance frameworks for similar models of patient centred primary care
► Development of a programme logic model for the NZ HCH
► A meta-analysis of previous evaluations (2012-2015)
► Summation of discussions from a meeting with participating organisations in June 2016
► Analysis of four completed self-assessment tools
► Quantitative analysis of:
► Patient enrolments ► ED usage ► Hospitalisation rates ► Bed day rates ► Outpatient attendances ► Outpatient DNA rates
Qualitative and quantitative data was triangulated to draw conclusions.
Evaluation of the New Zealand Health Care Home EY 17
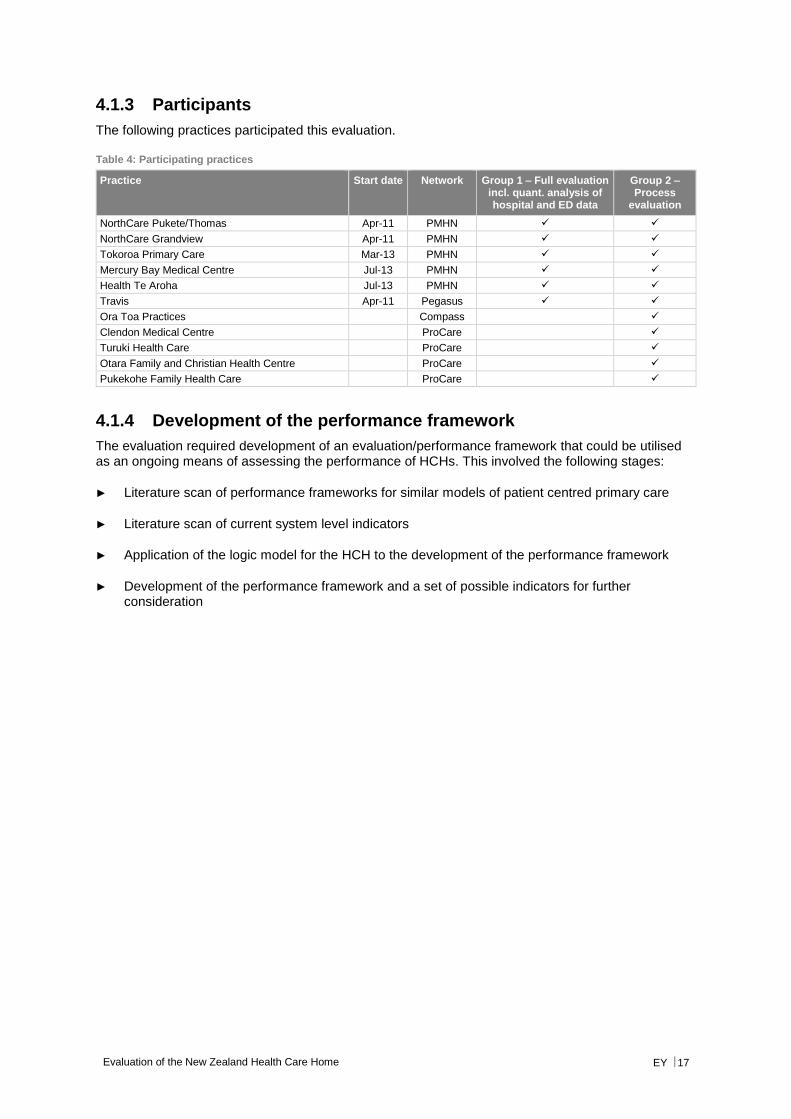
4.1.3 Participants
The following practices participated this evaluation.
Table 4: Participating practices
Practice Start date Network Group 1 – Full evaluation incl. quant. analysis of hospital and ED data
Group 2 – Process
evaluation
NorthCare Pukete/Thomas Apr-11 PMHN
NorthCare Grandview Apr-11 PMHN
Tokoroa Primary Care Mar-13 PMHN
Mercury Bay Medical Centre Jul-13 PMHN
Health Te Aroha Jul-13 PMHN
Travis Apr-11 Pegasus
Ora Toa Practices Compass
Clendon Medical Centre ProCare
Turuki Health Care ProCare
Otara Family and Christian Health Centre ProCare
Pukekohe Family Health Care ProCare
4.1.4 Development of the performance framework
The evaluation required development of an evaluation/performance framework that could be utilised as an ongoing means of assessing the performance of HCHs. This involved the following stages:
► Literature scan of performance frameworks for similar models of patient centred primary care
► Literature scan of current system level indicators
► Application of the logic model for the HCH to the development of the performance framework
► Development of the performance framework and a set of possible indicators for further consideration
Evaluation of the New Zealand Health Care Home EY 18
5. Performance framework and programme logic
This chapter describes the HCH logic model and performance framework, and the rationale underpinning them.
5.1 Performance measures in use in New Zealand and elsewhere
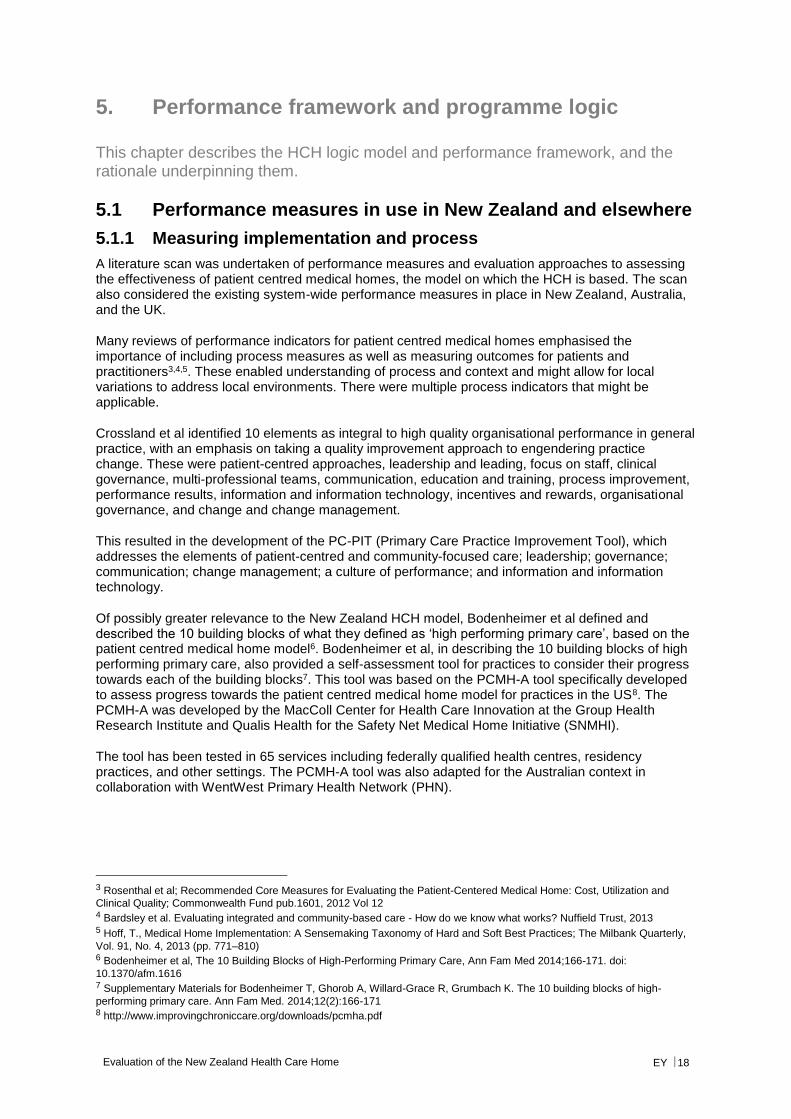
5.1.1 Measuring implementation and process
A literature scan was undertaken of performance measures and evaluation approaches to assessing the effectiveness of patient centred medical homes, the model on which the HCH is based. The scan also considered the existing system-wide performance measures in place in New Zealand, Australia, and the UK.
Many reviews of performance indicators for patient centred medical homes emphasised the importance of including process measures as well as measuring outcomes for patients and practitioners3,4,5. These enabled understanding of process and context and might allow for local variations to address local environments. There were multiple process indicators that might be applicable.
Crossland et al identified 10 elements as integral to high quality organisational performance in general practice, with an emphasis on taking a quality improvement approach to engendering practice change. These were patient-centred approaches, leadership and leading, focus on staff, clinical governance, multi-professional teams, communication, education and training, process improvement, performance results, information and information technology, incentives and rewards, organisational governance, and change and change management.
This resulted in the development of the PC-PIT (Primary Care Practice Improvement Tool), which addresses the elements of patient-centred and community-focused care; leadership; governance; communication; change management; a culture of performance; and information and information technology.
Of possibly greater relevance to the New Zealand HCH model, Bodenheimer et al defined and described the 10 building blocks of what they defined as ‘high performing primary care’, based on the patient centred medical home model6. Bodenheimer et al, in describing the 10 building blocks of high performing primary care, also provided a self-assessment tool for practices to consider their progress towards each of the building blocks7. This tool was based on the PCMH-A tool specifically developed to assess progress towards the patient centred medical home model for practices in the US8. The PCMH-A was developed by the MacColl Center for Health Care Innovation at the Group Health Research Institute and Qualis Health for the Safety Net Medical Home Initiative (SNMHI).
The tool has been tested in 65 services including federally qualified health centres, residency practices, and other settings. The PCMH-A tool was also adapted for the Australian context in collaboration with WentWest Primary Health Network (PHN).
3 Rosenthal et al; Recommended Core Measures for Evaluating the Patient-Centered Medical Home: Cost, Utilization and
Clinical Quality; Commonwealth Fund pub.1601, 2012 Vol 12 4 Bardsley et al. Evaluating integrated and community-based care - How do we know what works? Nuffield Trust, 2013 5 Hoff, T., Medical Home Implementation: A Sensemaking Taxonomy of Hard and Soft Best Practices; The Milbank Quarterly,
Vol. 91, No. 4, 2013 (pp. 771–810) 6 Bodenheimer et al, The 10 Building Blocks of High-Performing Primary Care, Ann Fam Med 2014;166-171. doi:
10.1370/afm.1616 7 Supplementary Materials for Bodenheimer T, Ghorob A, Willard-Grace R, Grumbach K. The 10 building blocks of high-
performing primary care. Ann Fam Med. 2014;12(2):166-171 8 http://www.improvingchroniccare.org/downloads/pcmha.pdf
Evaluation of the New Zealand Health Care Home EY 19
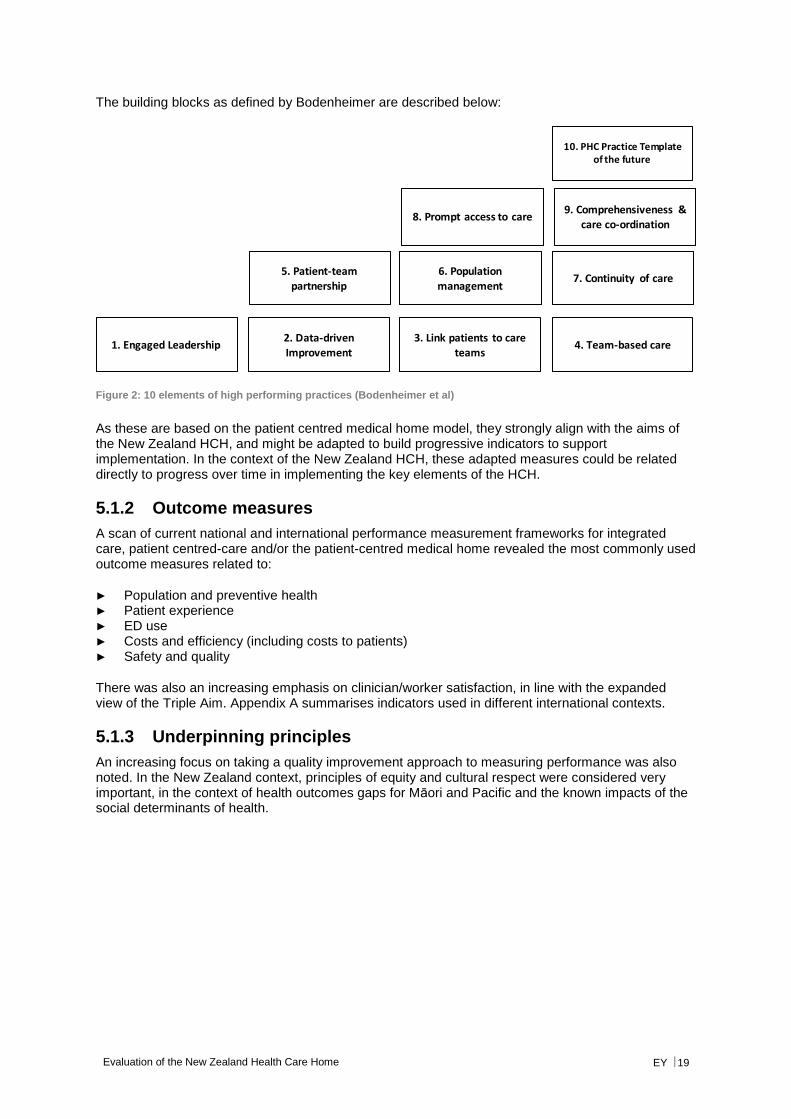
The building blocks as defined by Bodenheimer are described below:
Figure 2: 10 elements of high performing practices (Bodenheimer et al)
As these are based on the patient centred medical home model, they strongly align with the aims of the New Zealand HCH, and might be adapted to build progressive indicators to support implementation. In the context of the New Zealand HCH, these adapted measures could be related directly to progress over time in implementing the key elements of the HCH.
5.1.2 Outcome measures
A scan of current national and international performance measurement frameworks for integrated care, patient centred-care and/or the patient-centred medical home revealed the most commonly used outcome measures related to:
► Population and preventive health ► Patient experience ► ED use ► Costs and efficiency (including costs to patients) ► Safety and quality
There was also an increasing emphasis on clinician/worker satisfaction, in line with the expanded view of the Triple Aim. Appendix A summarises indicators used in different international contexts.
5.1.3 Underpinning principles
An increasing focus on taking a quality improvement approach to measuring performance was also noted. In the New Zealand context, principles of equity and cultural respect were considered very important, in the context of health outcomes gaps for Māori and Pacific and the known impacts of the social determinants of health.
2. Data-driven
Improvement
3. Link patients to care
teams4. Team-based care1. Engaged Leadership
5. Patient-team partnership
6. Population management
7. Continuity of care
8. Prompt access to care9. Comprehensiveness &
care co-ordination
10. PHC Practice Template of the future
Evaluation of the New Zealand Health Care Home EY 20
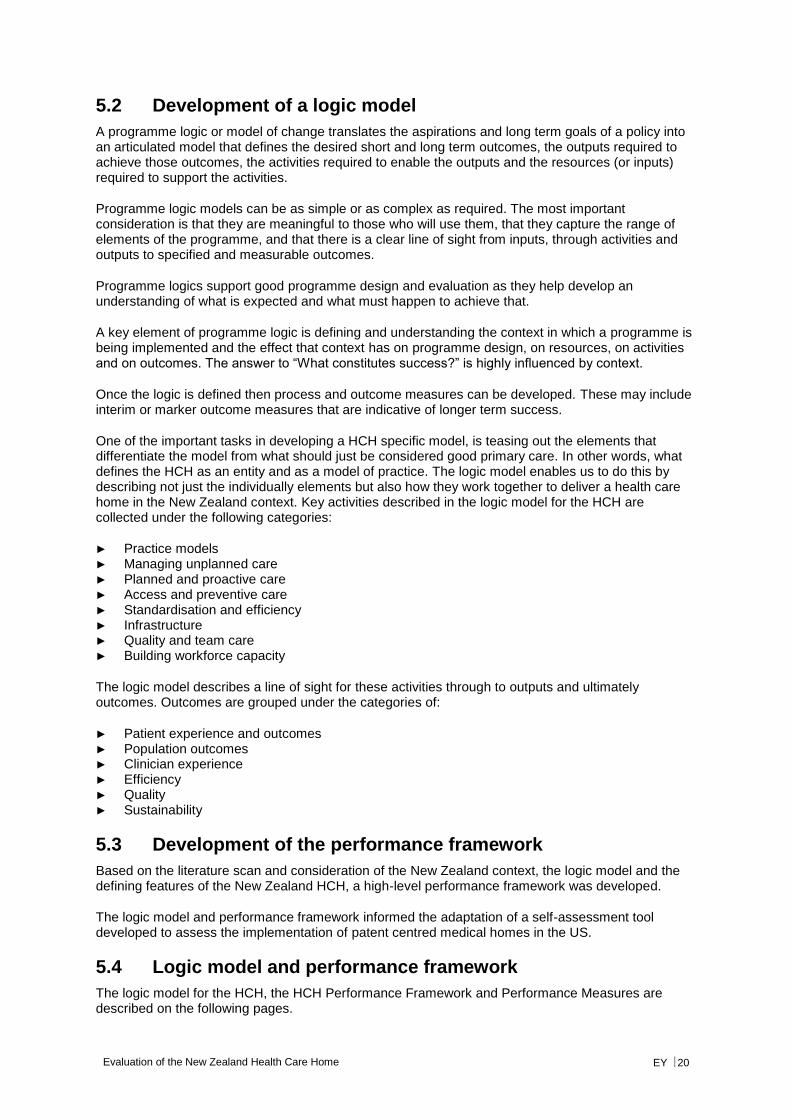
5.2 Development of a logic model
A programme logic or model of change translates the aspirations and long term goals of a policy into an articulated model that defines the desired short and long term outcomes, the outputs required to achieve those outcomes, the activities required to enable the outputs and the resources (or inputs) required to support the activities.
Programme logic models can be as simple or as complex as required. The most important consideration is that they are meaningful to those who will use them, that they capture the range of elements of the programme, and that there is a clear line of sight from inputs, through activities and outputs to specified and measurable outcomes.
Programme logics support good programme design and evaluation as they help develop an understanding of what is expected and what must happen to achieve that.
A key element of programme logic is defining and understanding the context in which a programme is being implemented and the effect that context has on programme design, on resources, on activities and on outcomes. The answer to “What constitutes success?” is highly influenced by context.
Once the logic is defined then process and outcome measures can be developed. These may include interim or marker outcome measures that are indicative of longer term success.
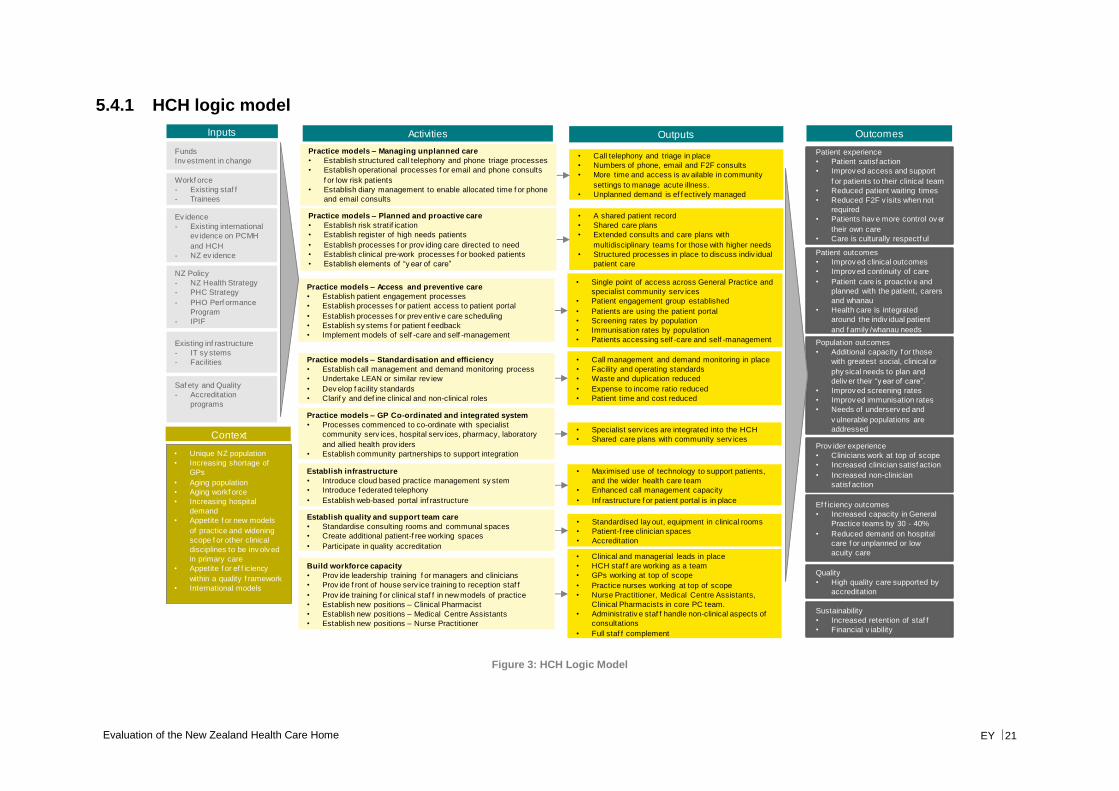
One of the important tasks in developing a HCH specific model, is teasing out the elements that differentiate the model from what should just be considered good primary care. In other words, what defines the HCH as an entity and as a model of practice. The logic model enables us to do this by describing not just the individually elements but also how they work together to deliver a health care home in the New Zealand context. Key activities described in the logic model for the HCH are collected under the following categories:
► Practice models ► Managing unplanned care ► Planned and proactive care ► Access and preventive care ► Standardisation and efficiency ► Infrastructure ► Quality and team care ► Building workforce capacity
The logic model describes a line of sight for these activities through to outputs and ultimately outcomes. Outcomes are grouped under the categories of:
► Patient experience and outcomes ► Population outcomes ► Clinician experience ► Efficiency ► Quality ► Sustainability
5.3 Development of the performance framework
Based on the literature scan and consideration of the New Zealand context, the logic model and the defining features of the New Zealand HCH, a high-level performance framework was developed.
The logic model and performance framework informed the adaptation of a self-assessment tool developed to assess the implementation of patent centred medical homes in the US.
5.4 Logic model and performance framework
The logic model for the HCH, the HCH Performance Framework and Performance Measures are described on the following pages.
Evaluation of the New Zealand Health Care Home EY 21
5.4.1 HCH logic model
Figure 3: HCH Logic Model
• Clinical and managerial leads in place
• HCH staf f are working as a team
• GPs working at top of scope
• Practice nurses working at top of scope
• Nurse Practitioner, Medical Centre Assistants,
Clinical Pharmacists in core PC team.
• Administrativ e staf f handle non-clinical aspects of
consultations
• Full staf f complement
Patient outcomes
• Improv ed clinical outcomes
• Improv ed continuity of care
• Patient care is proactiv e and
planned with the patient, carers
and whanau
• Health care is integrated
around the indiv idual patient
and f amily /whanau needs
Funds
Inv estment in change• Call telephony and triage in place
• Numbers of phone, email and F2F consults
• More time and access is av ailable in community
settings to manage acute illness.
• Unplanned demand is ef f ectively managed
• Specialist serv ices are integrated into the HCH
• Shared care plans with community serv ices
• A shared patient record
• Shared care plans
• Extended consults and care plans with
multidisciplinary teams f or those with higher needs
• Structured processes in place to discuss indiv idual
patient care
• Maximised use of technology to support patients,
and the wider health care team
• Enhanced call management capacity
• Inf rastructure f or patient portal is in place
• Single point of access across General Practice and
specialist community serv ices
• Patient engagement group established
• Patients are using the patient portal
• Screening rates by population
• Immunisation rates by population
• Patients accessing self -care and self -management
Patient experience
• Patient satisf action
• Improv ed access and support
f or patients to their clinical team
• Reduced patient waiting times
• Reduced F2F v isits when not
required
• Patients hav e more control ov er
their own care
• Care is culturally respectf ul
Population outcomes
• Additional capacity f or those
with greatest social, clinical or
phy sical needs to plan and
deliv er their “y ear of care”.
• Improv ed screening rates
• Improv ed immunisation rates
• Needs of underserv ed and
v ulnerable populations are
addressed
Ef f iciency outcomes
• Increased capacity in General
Practice teams by 30 - 40%
• Reduced demand on hospital
care f or unplanned or low
acuity care
Practice models – Planned and proactive care
• Establish risk stratif ication
• Establish register of high needs patients
• Establish processes f or prov iding care directed to need
• Establish clinical pre-work processes f or booked patients
• Establish elements of “y ear of care”
Build workforce capacity
• Prov ide leadership training f or managers and clinicians
• Prov ide f ront of house serv ice training to reception staf f
• Prov ide training f or clinical staf f in new models of practice
• Establish new positions – Clinical Pharmacist
• Establish new positions – Medical Centre Assistants
• Establish new positions – Nurse Practitioner
Establish infrastructure
• Introduce cloud based practice management sy stem
• Introduce f ederated telephony
• Establish web-based portal inf rastructure
Ev idence
- Existing international
ev idence on PCMH
and HCH
- NZ ev idence
NZ Policy
- NZ Health Strategy
- PHC Strategy
- PHO Perf ormance
Program
- IPIF
Existing inf rastructure
- IT sy stems
- Facilities
Practice models – Managing unplanned care
• Establish structured call telephony and phone triage processes
• Establish operational processes f or email and phone consults
f or low risk patients
• Establish diary management to enable allocated time f or phone
and email consults
Prov ider experience
• Clinicians work at top of scope
• Increased clinician satisf action
• Increased non-clinician
satisf action
Inputs Activities Outputs Outcomes
Workf orce
- Existing staf f
- Trainees
Practice models – Standardisation and efficiency
• Establish call management and demand monitoring process
• Undertake LEAN or similar rev iew
• Dev elop f acility standards
• Clarif y and def ine clinical and non-clinical roles
Practice models – Access and preventive care
• Establish patient engagement processes
• Establish processes f or patient access to patient portal
• Establish processes f or prev entiv e care scheduling
• Establish sy stems f or patient f eedback
• Implement models of self -care and self -management
Practice models – GP Co-ordinated and integrated system
• Processes commenced to co-ordinate with specialist
community serv ices, hospital serv ices, pharmacy, laboratory
and allied health prov iders
• Establish community partnerships to support integration
Context
• Unique NZ population
• Increasing shortage of
GPs
• Aging population
• Aging workf orce
• Increasing hospital
demand
• Appetite f or new models
of practice and widening
scope f or other clinical
disciplines to be inv olv ed
in primary care
• Appetite f or ef f iciency
within a quality f ramework
• International models
• Call management and demand monitoring in place
• Facility and operating standards
• Waste and duplication reduced
• Expense to income ratio reduced
• Patient time and cost reduced
Saf ety and Quality
- Accreditation
programs
Sustainability
• Increased retention of staf f
• Financial v iability
Establish quality and support team care
• Standardise consulting rooms and communal spaces
• Create additional patient-f ree working spaces
• Participate in quality accreditation
• Standardised lay out, equipment in clinical rooms
• Patient-f ree clinician spaces
• Accreditation
Quality
• High quality care supported by
accreditation

Evaluation of the New Zealand Health Care Home EY 22
5.4.2 HCH performance framework
Figure 4: HCH Performance Framework
Continual QI and Safety supported by accreditation
Equity
Cultural Respect
Outcomes
Processes
Managing Unplanned Care
• Call management
• Phone triage
• Federated telephony in place
• Call standards set
Planned Pro-active Care
• “Year of Care”
• Clinical pre-work
• Register of high needs patients
• Self-care Management available online
Access & Preventive Care
• Phone and email consults
• Patient portal
• Extended opening hours
• Health inequalities identified & addressed
• Cultural respect
Efficiency & Standardisation
• More effective use of space
• New professional roles
• Accreditation
• Enhanced telephony & cloud based PMS
GP Co-ordination & Integration
• Integrated community health & social care team
• Single point of access
• Shared Electronic Health Record in place
HCH High Performance
Graded progress towards reaching key elements of the Health Care Home
Patient experience
Patient satisfaction
Improved access & support for
patients to their clinical team
Reduced patient waiting times
Reduced F2F visits when not required
Patients have more control over their
own care
Care is culturally respectful
Efficiency & Sustainability
Increased capacity in General
Practice teams by 30 - 40%
Reduced demand on hospital care for
unplanned or low acuity care
Increased retention of staff
Financial viability
Population health
Additional capacity for those with greatest
social, clinical or physical needs to plan &
deliver their “year of care”.
Improved screening rates
Improved immunisation rates
Needs of underserved & vulnerable
populations are addressed
Provider experience
Clinicians work at top of scope
Increased clinician satisfaction
Increased non-clinician
satisfaction
Patient Outcomes
Improved clinical outcomes
Improved continuity of care
Patient care is proactive & planned
with the patient, carers & whanau
Health care is integrated around the
individual patient & family/whanau
needs
Evaluation of the New Zealand Health Care Home EY 23
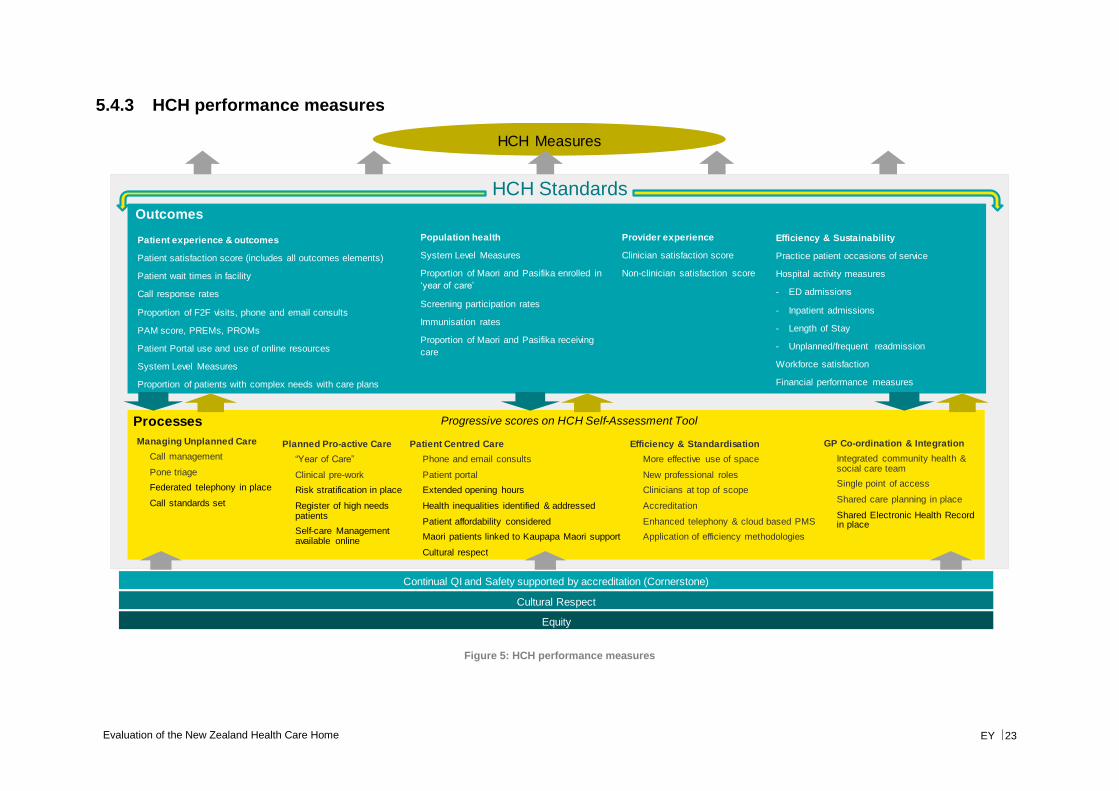
5.4.3 HCH performance measures
Figure 5: HCH performance measures
Continual QI and Safety supported by accreditation (Cornerstone)
Equity
Cultural Respect
Outcomes
Processes
Managing Unplanned Care
• Call management
• Pone triage
• Federated telephony in place
• Call standards set
Planned Pro-active Care
• “Year of Care”
• Clinical pre-work
• Risk stratification in place
• Register of high needs patients
• Self-care Management available online
Patient Centred Care
• Phone and email consults
• Patient portal
• Extended opening hours
• Health inequalities identified & addressed
• Patient affordability considered
• Maori patients linked to Kaupapa Maori support
• Cultural respect
Efficiency & Standardisation
• More effective use of space
• New professional roles
• Clinicians at top of scope
• Accreditation
• Enhanced telephony & cloud based PMS
• Application of efficiency methodologies
GP Co-ordination & Integration
• Integrated community health & social care team
• Single point of access
• Shared care planning in place
• Shared Electronic Health Record in place
HCH Measures
Progressive scores on HCH Self-Assessment Tool
Patient experience & outcomes
Patient satisfaction score (includes all outcomes elements)
Patient wait times in facility
Call response rates
Proportion of F2F visits, phone and email consults
PAM score, PREMs, PROMs
Patient Portal use and use of online resources
System Level Measures
Proportion of patients with complex needs with care plans
Efficiency & Sustainability
Practice patient occasions of service
Hospital activity measures
- ED admissions
- Inpatient admissions
- Length of Stay
- Unplanned/frequent readmission
Workforce satisfaction
Financial performance measures
Population health
System Level Measures
Proportion of Maori and Pasifika enrolled in
‘year of care’
Screening participation rates
Immunisation rates
Proportion of Maori and Pasifika receiving
care
Provider experience
Clinician satisfaction score
Non-clinician satisfaction score
HCH Standards
Evaluation of the New Zealand Health Care Home EY 24
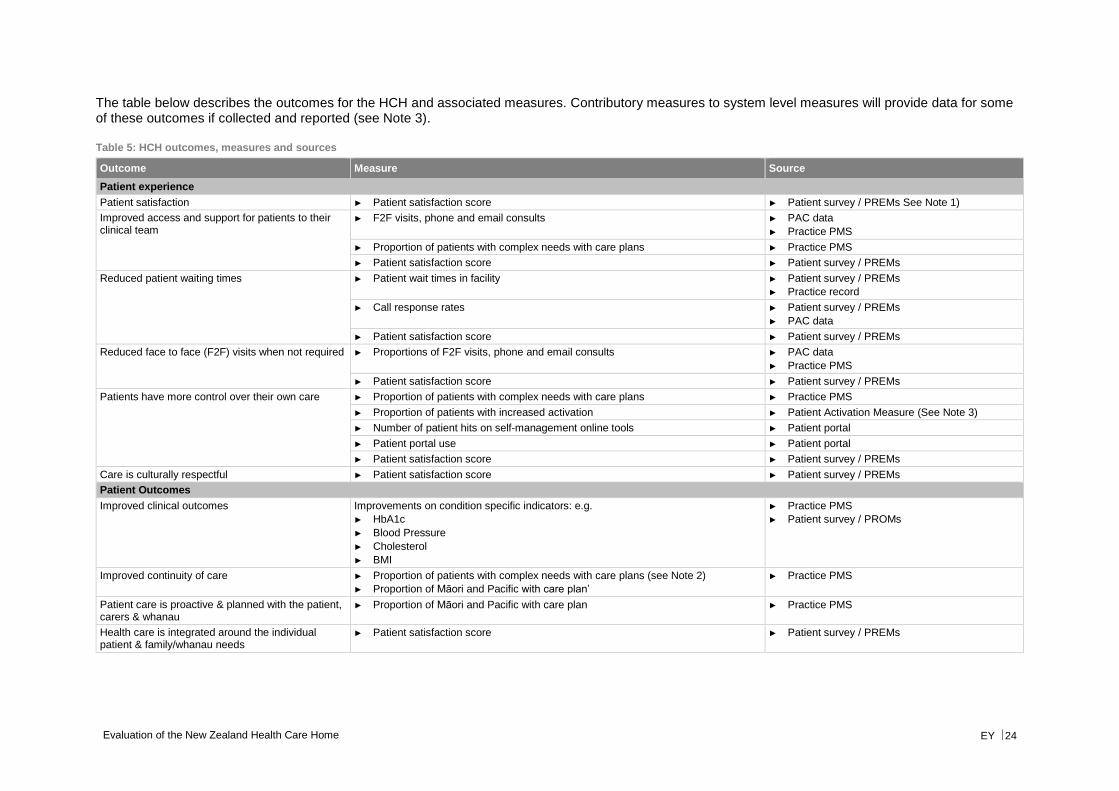
The table below describes the outcomes for the HCH and associated measures. Contributory measures to system level measures will provide data for some of these outcomes if collected and reported (see Note 3).
Table 5: HCH outcomes, measures and sources
Outcome Measure Source
Patient experience
Patient satisfaction ► Patient satisfaction score ► Patient survey / PREMs See Note 1)
Improved access and support for patients to their clinical team
► F2F visits, phone and email consults ► PAC data
► Practice PMS
► Proportion of patients with complex needs with care plans ► Practice PMS
► Patient satisfaction score ► Patient survey / PREMs
Reduced patient waiting times ► Patient wait times in facility ► Patient survey / PREMs
► Practice record
► Call response rates ► Patient survey / PREMs
► PAC data
► Patient satisfaction score ► Patient survey / PREMs
Reduced face to face (F2F) visits when not required ► Proportions of F2F visits, phone and email consults ► PAC data
► Practice PMS
► Patient satisfaction score ► Patient survey / PREMs
Patients have more control over their own care ► Proportion of patients with complex needs with care plans ► Practice PMS
► Proportion of patients with increased activation ► Patient Activation Measure (See Note 3)
► Number of patient hits on self-management online tools ► Patient portal
► Patient portal use ► Patient portal
► Patient satisfaction score ► Patient survey / PREMs
Care is culturally respectful ► Patient satisfaction score ► Patient survey / PREMs
Patient Outcomes
Improved clinical outcomes Improvements on condition specific indicators: e.g.
► HbA1c
► Blood Pressure
► Cholesterol
► BMI
► Practice PMS
► Patient survey / PROMs
Improved continuity of care ► Proportion of patients with complex needs with care plans (see Note 2)
► Proportion of Māori and Pacific with care plan’
► Practice PMS
Patient care is proactive & planned with the patient, carers & whanau
► Proportion of Māori and Pacific with care plan ► Practice PMS
Health care is integrated around the individual patient & family/whanau needs
► Patient satisfaction score ► Patient survey / PREMs
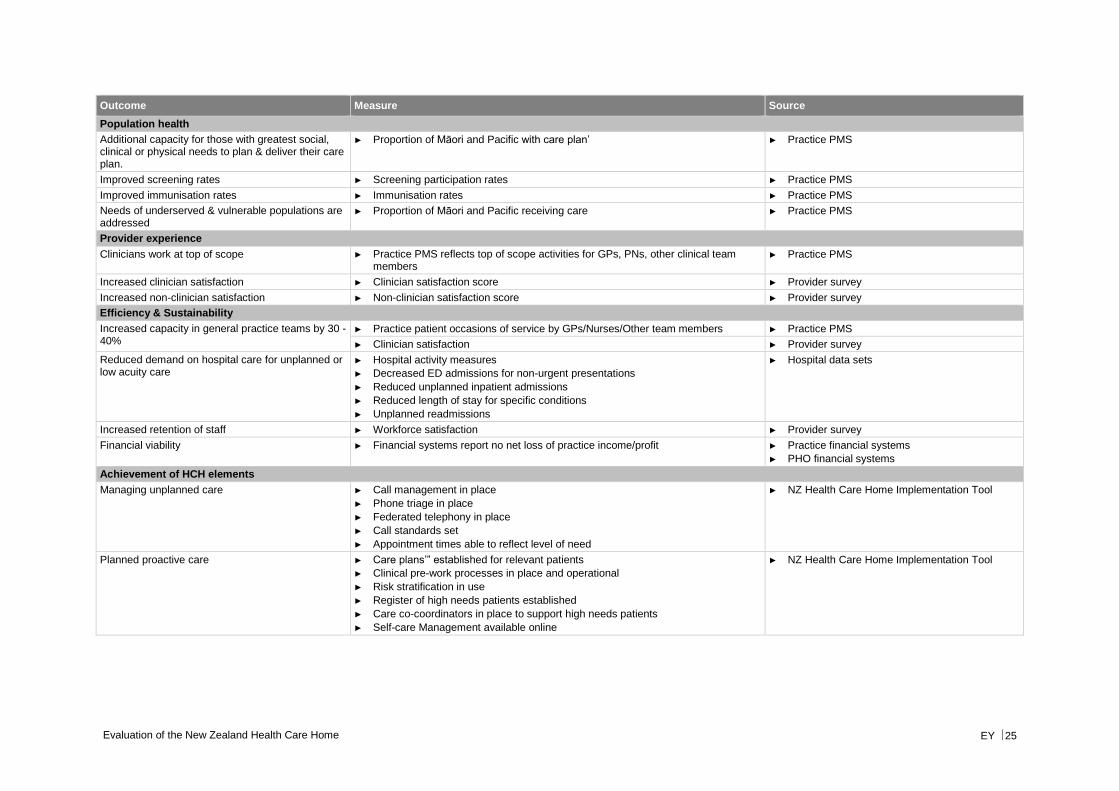
Evaluation of the New Zealand Health Care Home EY 25
Outcome Measure Source
Population health
Additional capacity for those with greatest social, clinical or physical needs to plan & deliver their care plan.
► Proportion of Māori and Pacific with care plan’ ► Practice PMS
Improved screening rates ► Screening participation rates ► Practice PMS
Improved immunisation rates ► Immunisation rates ► Practice PMS
Needs of underserved & vulnerable populations are addressed
► Proportion of Māori and Pacific receiving care ► Practice PMS
Provider experience
Clinicians work at top of scope ► Practice PMS reflects top of scope activities for GPs, PNs, other clinical team members
► Practice PMS
Increased clinician satisfaction ► Clinician satisfaction score ► Provider survey
Increased non-clinician satisfaction ► Non-clinician satisfaction score ► Provider survey
Efficiency & Sustainability
Increased capacity in general practice teams by 30 - 40%
► Practice patient occasions of service by GPs/Nurses/Other team members ► Practice PMS
► Clinician satisfaction ► Provider survey
Reduced demand on hospital care for unplanned or low acuity care
► Hospital activity measures
► Decreased ED admissions for non-urgent presentations
► Reduced unplanned inpatient admissions
► Reduced length of stay for specific conditions
► Unplanned readmissions
► Hospital data sets
Increased retention of staff ► Workforce satisfaction ► Provider survey
Financial viability ► Financial systems report no net loss of practice income/profit ► Practice financial systems
► PHO financial systems
Achievement of HCH elements
Managing unplanned care ► Call management in place
► Phone triage in place
► Federated telephony in place
► Call standards set
► Appointment times able to reflect level of need
► NZ Health Care Home Implementation Tool
Planned proactive care ► Care plans’” established for relevant patients
► Clinical pre-work processes in place and operational
► Risk stratification in use
► Register of high needs patients established
► Care co-coordinators in place to support high needs patients
► Self-care Management available online
► NZ Health Care Home Implementation Tool
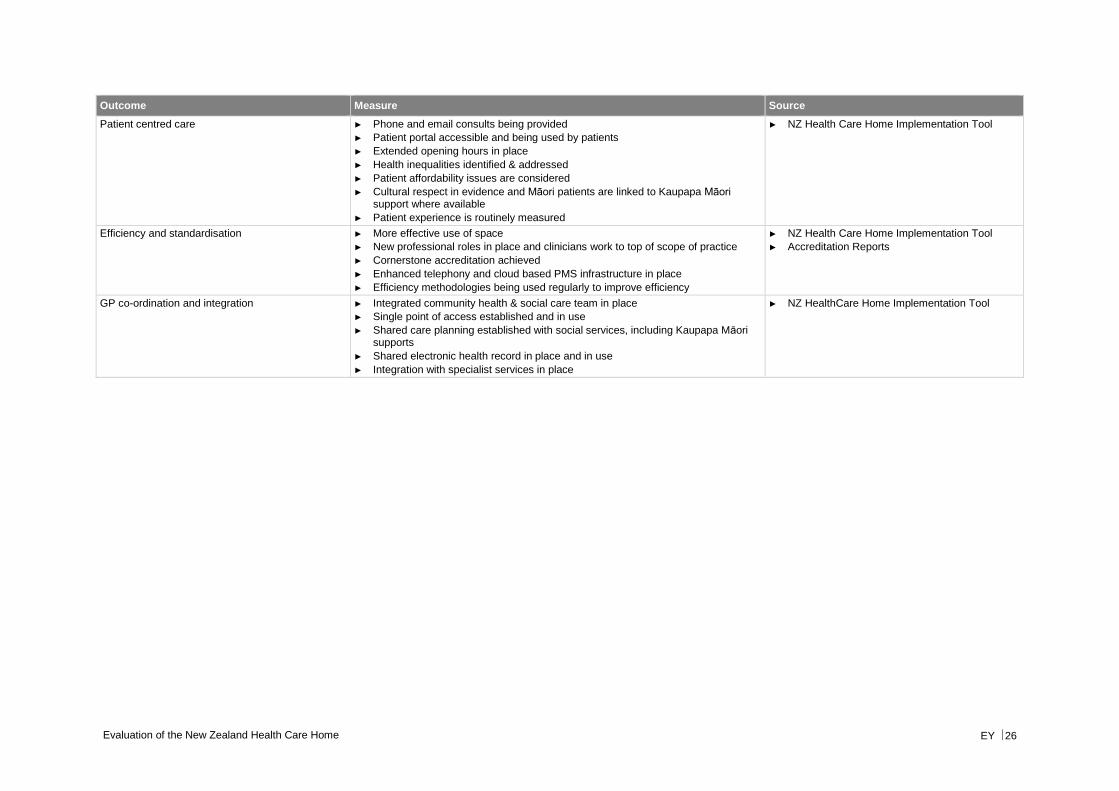
Evaluation of the New Zealand Health Care Home EY 26
Outcome Measure Source
Patient centred care ► Phone and email consults being provided
► Patient portal accessible and being used by patients
► Extended opening hours in place
► Health inequalities identified & addressed
► Patient affordability issues are considered
► Cultural respect in evidence and Māori patients are linked to Kaupapa Māori support where available
► Patient experience is routinely measured
► NZ Health Care Home Implementation Tool
Efficiency and standardisation
► More effective use of space
► New professional roles in place and clinicians work to top of scope of practice
► Cornerstone accreditation achieved
► Enhanced telephony and cloud based PMS infrastructure in place
► Efficiency methodologies being used regularly to improve efficiency
► NZ Health Care Home Implementation Tool
► Accreditation Reports
GP co-ordination and integration
► Integrated community health & social care team in place
► Single point of access established and in use
► Shared care planning established with social services, including Kaupapa Māori supports
► Shared electronic health record in place and in use
► Integration with specialist services in place
► NZ HealthCare Home Implementation Tool
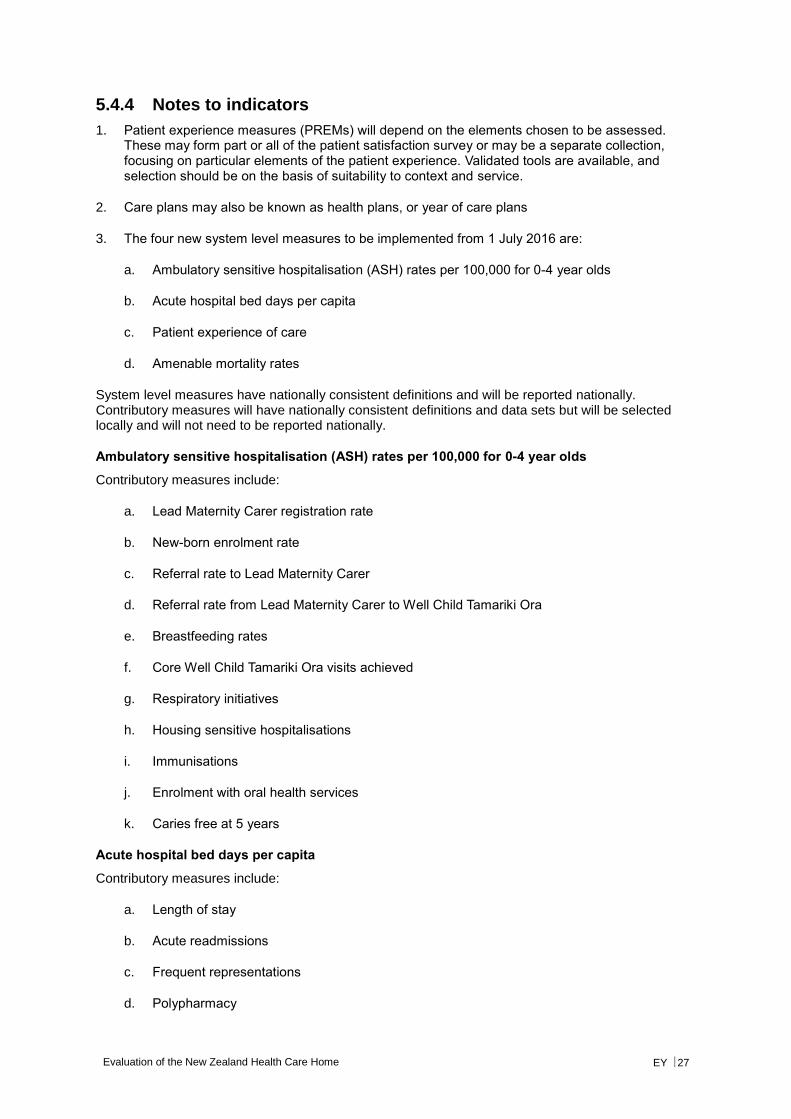
Evaluation of the New Zealand Health Care Home EY 27
5.4.4 Notes to indicators
1. Patient experience measures (PREMs) will depend on the elements chosen to be assessed. These may form part or all of the patient satisfaction survey or may be a separate collection, focusing on particular elements of the patient experience. Validated tools are available, and selection should be on the basis of suitability to context and service.
2. Care plans may also be known as health plans, or year of care plans
3. The four new system level measures to be implemented from 1 July 2016 are:
a. Ambulatory sensitive hospitalisation (ASH) rates per 100,000 for 0-4 year olds
b. Acute hospital bed days per capita
c. Patient experience of care
d. Amenable mortality rates
System level measures have nationally consistent definitions and will be reported nationally. Contributory measures will have nationally consistent definitions and data sets but will be selected locally and will not need to be reported nationally.
Ambulatory sensitive hospitalisation (ASH) rates per 100,000 for 0-4 year olds
Contributory measures include:
a. Lead Maternity Carer registration rate
b. New-born enrolment rate
c. Referral rate to Lead Maternity Carer
d. Referral rate from Lead Maternity Carer to Well Child Tamariki Ora
e. Breastfeeding rates
f. Core Well Child Tamariki Ora visits achieved
g. Respiratory initiatives
h. Housing sensitive hospitalisations
i. Immunisations
j. Enrolment with oral health services
k. Caries free at 5 years
Acute hospital bed days per capita
Contributory measures include:
a. Length of stay
b. Acute readmissions
c. Frequent representations
d. Polypharmacy
Evaluation of the New Zealand Health Care Home EY 28
e. Flu vaccinations in the elderly
f. Cardiovascular disease risk assessment
g. Smoking rates
h. Admission rates – ASH
i. Emergency department health target
Patient experience of care
Contributory measures include:
a. Portal uptake and use
b. DHB inpatient care survey
c. Uptake of primary care patient experience survey
d. Sentinel events in hospital and primary care
e. Access to diagnostics
f. Admissions for drug reactions
g. Quality and safety markers
Amenable mortality
Contributory measures include:
a. Cancer screening and treatment timeliness
b. Cardiovascular risk management
c. Other chronic disorder management (chronic obstructive pulmonary disorder, diabetes)
d. Injuries (unintentional, self-harm) prevention
e. Smoking rates
4. The patient activation measure (PAM) is a reliable patient-reported measure that describes the knowledge, skills and confidence a person has in managing their own health and health care. A low level of activation is correlated with patients taking a less active role in staying healthy (including following the GP’s advice).
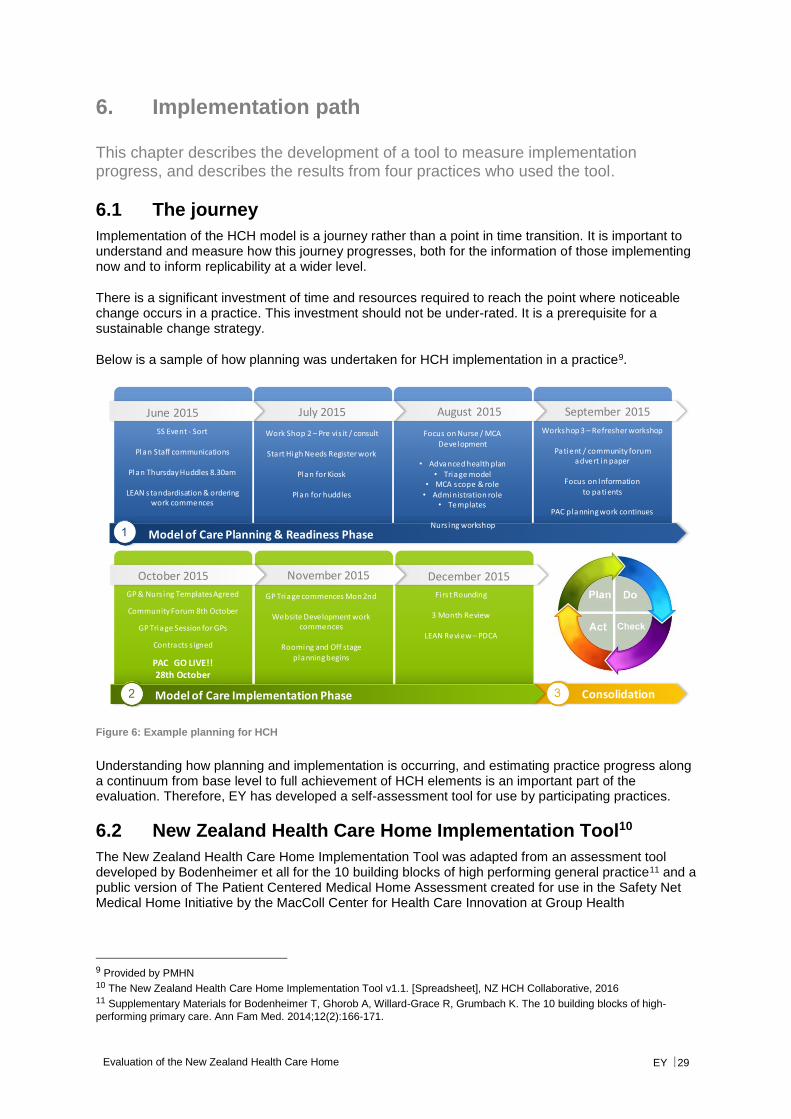
Evaluation of the New Zealand Health Care Home EY 29
6. Implementation path
This chapter describes the development of a tool to measure implementation progress, and describes the results from four practices who used the tool.
6.1 The journey
Implementation of the HCH model is a journey rather than a point in time transition. It is important to understand and measure how this journey progresses, both for the information of those implementing now and to inform replicability at a wider level.
There is a significant investment of time and resources required to reach the point where noticeable change occurs in a practice. This investment should not be under-rated. It is a prerequisite for a sustainable change strategy.
Below is a sample of how planning was undertaken for HCH implementation in a practice9.
Figure 6: Example planning for HCH
Understanding how planning and implementation is occurring, and estimating practice progress along a continuum from base level to full achievement of HCH elements is an important part of the evaluation. Therefore, EY has developed a self-assessment tool for use by participating practices.
6.2 New Zealand Health Care Home Implementation Tool10
The New Zealand Health Care Home Implementation Tool was adapted from an assessment tool developed by Bodenheimer et all for the 10 building blocks of high performing general practice11 and a public version of The Patient Centered Medical Home Assessment created for use in the Safety Net Medical Home Initiative by the MacColl Center for Health Care Innovation at Group Health
9 Provided by PMHN 10 The New Zealand Health Care Home Implementation Tool v1.1. [Spreadsheet], NZ HCH Collaborative, 2016 11 Supplementary Materials for Bodenheimer T, Ghorob A, Willard-Grace R, Grumbach K. The 10 building blocks of high-
performing primary care. Ann Fam Med. 2014;12(2):166-171.
Model of Care Planning & Readiness Phase
June 2015 July 2015 August 2015 September 2015
5S Event - Sort
Plan Staff communications
Plan Thursday Huddles 8.30am
LEAN standardisation & ordering work commences
Work Shop 2 – Pre vis it / consult
Start High Needs Register work
Plan for Kiosk
Plan for huddles
Focus on Nurse / MCA Development
• Advanced health plan• Triage model
• MCA scope & role• Administration role
• Templates
Nurs ing workshop
Workshop 3 – Refresher workshop
Patient / community forum advert in paper
Focus on Informationto patients
PAC planning work continues
Model of Care Implementation Phase
October 2015
GP & Nurs ing Templates Agreed
Community Forum 8th October
GP Triage Session for GPs
Contracts s igned
PAC GO LIVE!!28th October
November 2015 December 2015
GP Triage commences Mon 2nd
Website Development workcommences
Rooming and Off stage planning begins
Firs t Rounding
3 Month Review
LEAN Review – PDCA
Consolidation
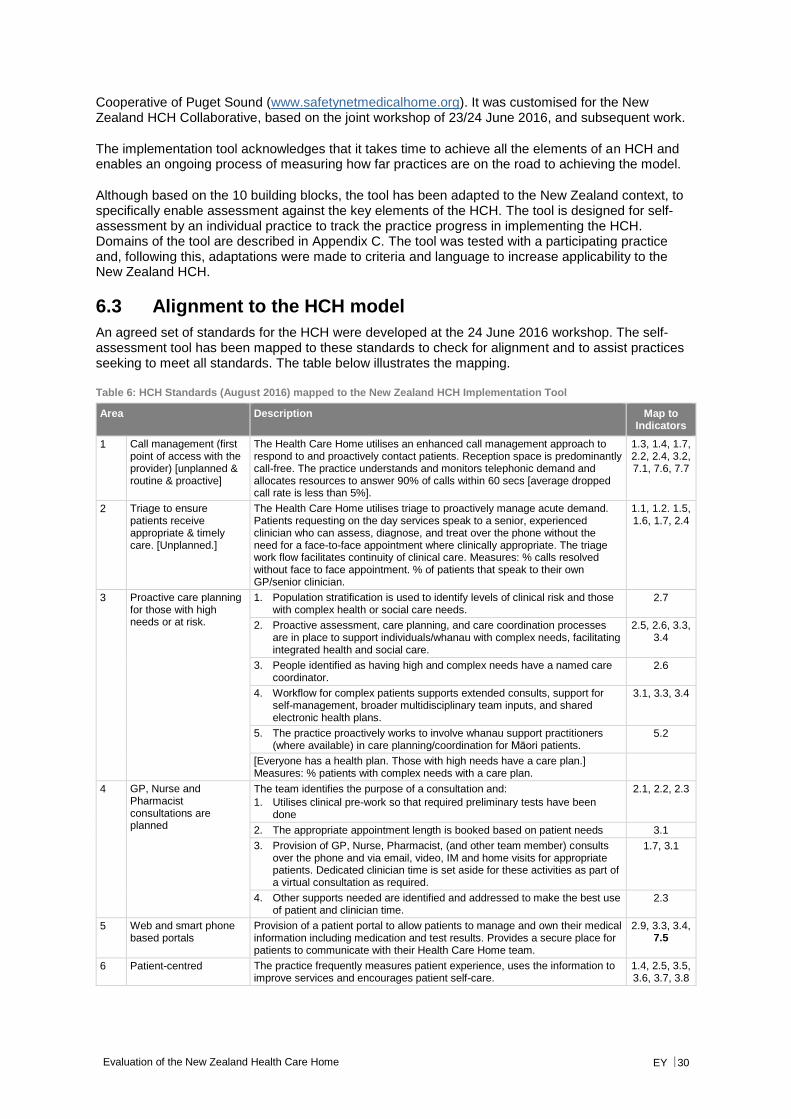
Evaluation of the New Zealand Health Care Home EY 30
Cooperative of Puget Sound (www.safetynetmedicalhome.org). It was customised for the New Zealand HCH Collaborative, based on the joint workshop of 23/24 June 2016, and subsequent work.
The implementation tool acknowledges that it takes time to achieve all the elements of an HCH and enables an ongoing process of measuring how far practices are on the road to achieving the model.
Although based on the 10 building blocks, the tool has been adapted to the New Zealand context, to specifically enable assessment against the key elements of the HCH. The tool is designed for self-assessment by an individual practice to track the practice progress in implementing the HCH. Domains of the tool are described in Appendix C. The tool was tested with a participating practice and, following this, adaptations were made to criteria and language to increase applicability to the New Zealand HCH.
6.3 Alignment to the HCH model
An agreed set of standards for the HCH were developed at the 24 June 2016 workshop. The self-assessment tool has been mapped to these standards to check for alignment and to assist practices seeking to meet all standards. The table below illustrates the mapping.
Table 6: HCH Standards (August 2016) mapped to the New Zealand HCH Implementation Tool
Area Description Map to Indicators
1 Call management (first point of access with the provider) [unplanned & routine & proactive]
The Health Care Home utilises an enhanced call management approach to respond to and proactively contact patients. Reception space is predominantly call-free. The practice understands and monitors telephonic demand and allocates resources to answer 90% of calls within 60 secs [average dropped call rate is less than 5%].
1.3, 1.4, 1.7, 2.2, 2.4, 3.2, 7.1, 7.6, 7.7
2 Triage to ensure patients receive appropriate & timely care. [Unplanned.]
The Health Care Home utilises triage to proactively manage acute demand. Patients requesting on the day services speak to a senior, experienced clinician who can assess, diagnose, and treat over the phone without the need for a face-to-face appointment where clinically appropriate. The triage work flow facilitates continuity of clinical care. Measures: % calls resolved without face to face appointment. % of patients that speak to their own GP/senior clinician.
1.1, 1.2. 1.5, 1.6, 1.7, 2.4
3 Proactive care planning for those with high needs or at risk.
1. Population stratification is used to identify levels of clinical risk and those with complex health or social care needs.
2.7
2. Proactive assessment, care planning, and care coordination processes are in place to support individuals/whanau with complex needs, facilitating integrated health and social care.
2.5, 2.6, 3.3, 3.4
3. People identified as having high and complex needs have a named care coordinator.
2.6
4. Workflow for complex patients supports extended consults, support for self-management, broader multidisciplinary team inputs, and shared electronic health plans.
3.1, 3.3, 3.4
5. The practice proactively works to involve whanau support practitioners (where available) in care planning/coordination for Māori patients.
5.2
[Everyone has a health plan. Those with high needs have a care plan.] Measures: % patients with complex needs with a care plan.
4 GP, Nurse and Pharmacist consultations are planned
The team identifies the purpose of a consultation and:
1. Utilises clinical pre-work so that required preliminary tests have been done
2.1, 2.2, 2.3
2. The appropriate appointment length is booked based on patient needs 3.1
3. Provision of GP, Nurse, Pharmacist, (and other team member) consults over the phone and via email, video, IM and home visits for appropriate patients. Dedicated clinician time is set aside for these activities as part of a virtual consultation as required.
1.7, 3.1
4. Other supports needed are identified and addressed to make the best use of patient and clinician time.
2.3
5 Web and smart phone based portals
Provision of a patient portal to allow patients to manage and own their medical information including medication and test results. Provides a secure place for patients to communicate with their Health Care Home team.
2.9, 3.3, 3.4, 7.5
6 Patient-centred The practice frequently measures patient experience, uses the information to improve services and encourages patient self-care.
1.4, 2.5, 3.5, 3.6, 3.7, 3.8
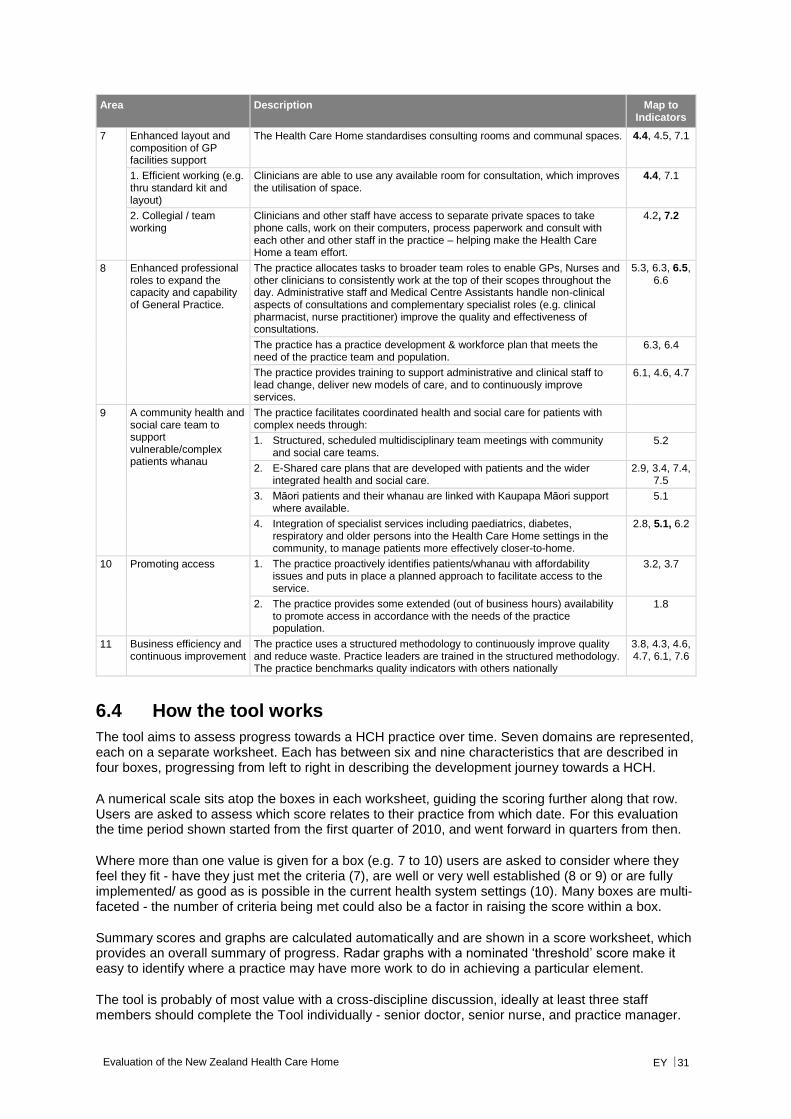
Evaluation of the New Zealand Health Care Home EY 31
Area Description Map to Indicators
7 Enhanced layout and composition of GP facilities support
The Health Care Home standardises consulting rooms and communal spaces. 4.4, 4.5, 7.1
1. Efficient working (e.g. thru standard kit and layout)
Clinicians are able to use any available room for consultation, which improves the utilisation of space.
4.4, 7.1
2. Collegial / team working
Clinicians and other staff have access to separate private spaces to take phone calls, work on their computers, process paperwork and consult with each other and other staff in the practice – helping make the Health Care Home a team effort.
4.2, 7.2
8 Enhanced professional roles to expand the capacity and capability of General Practice.
The practice allocates tasks to broader team roles to enable GPs, Nurses and other clinicians to consistently work at the top of their scopes throughout the day. Administrative staff and Medical Centre Assistants handle non-clinical aspects of consultations and complementary specialist roles (e.g. clinical pharmacist, nurse practitioner) improve the quality and effectiveness of consultations.
5.3, 6.3, 6.5, 6.6
The practice has a practice development & workforce plan that meets the need of the practice team and population.
6.3, 6.4
The practice provides training to support administrative and clinical staff to lead change, deliver new models of care, and to continuously improve services.
6.1, 4.6, 4.7
9 A community health and social care team to support vulnerable/complex patients whanau
The practice facilitates coordinated health and social care for patients with complex needs through:
1. Structured, scheduled multidisciplinary team meetings with community and social care teams.
5.2
2. E-Shared care plans that are developed with patients and the wider integrated health and social care.
2.9, 3.4, 7.4, 7.5
3. Māori patients and their whanau are linked with Kaupapa Māori support where available.
5.1
4. Integration of specialist services including paediatrics, diabetes, respiratory and older persons into the Health Care Home settings in the community, to manage patients more effectively closer-to-home.
2.8, 5.1, 6.2
10 Promoting access 1. The practice proactively identifies patients/whanau with affordability issues and puts in place a planned approach to facilitate access to the service.
3.2, 3.7
2. The practice provides some extended (out of business hours) availability to promote access in accordance with the needs of the practice population.
1.8
11 Business efficiency and continuous improvement
The practice uses a structured methodology to continuously improve quality and reduce waste. Practice leaders are trained in the structured methodology. The practice benchmarks quality indicators with others nationally
3.8, 4.3, 4.6, 4.7, 6.1, 7.6
6.4 How the tool works
The tool aims to assess progress towards a HCH practice over time. Seven domains are represented, each on a separate worksheet. Each has between six and nine characteristics that are described in four boxes, progressing from left to right in describing the development journey towards a HCH.
A numerical scale sits atop the boxes in each worksheet, guiding the scoring further along that row. Users are asked to assess which score relates to their practice from which date. For this evaluation the time period shown started from the first quarter of 2010, and went forward in quarters from then.
Where more than one value is given for a box (e.g. 7 to 10) users are asked to consider where they feel they fit - have they just met the criteria (7), are well or very well established (8 or 9) or are fully implemented/ as good as is possible in the current health system settings (10). Many boxes are multi-faceted - the number of criteria being met could also be a factor in raising the score within a box.
Summary scores and graphs are calculated automatically and are shown in a score worksheet, which provides an overall summary of progress. Radar graphs with a nominated ‘threshold’ score make it easy to identify where a practice may have more work to do in achieving a particular element.
The tool is probably of most value with a cross-discipline discussion, ideally at least three staff members should complete the Tool individually - senior doctor, senior nurse, and practice manager.
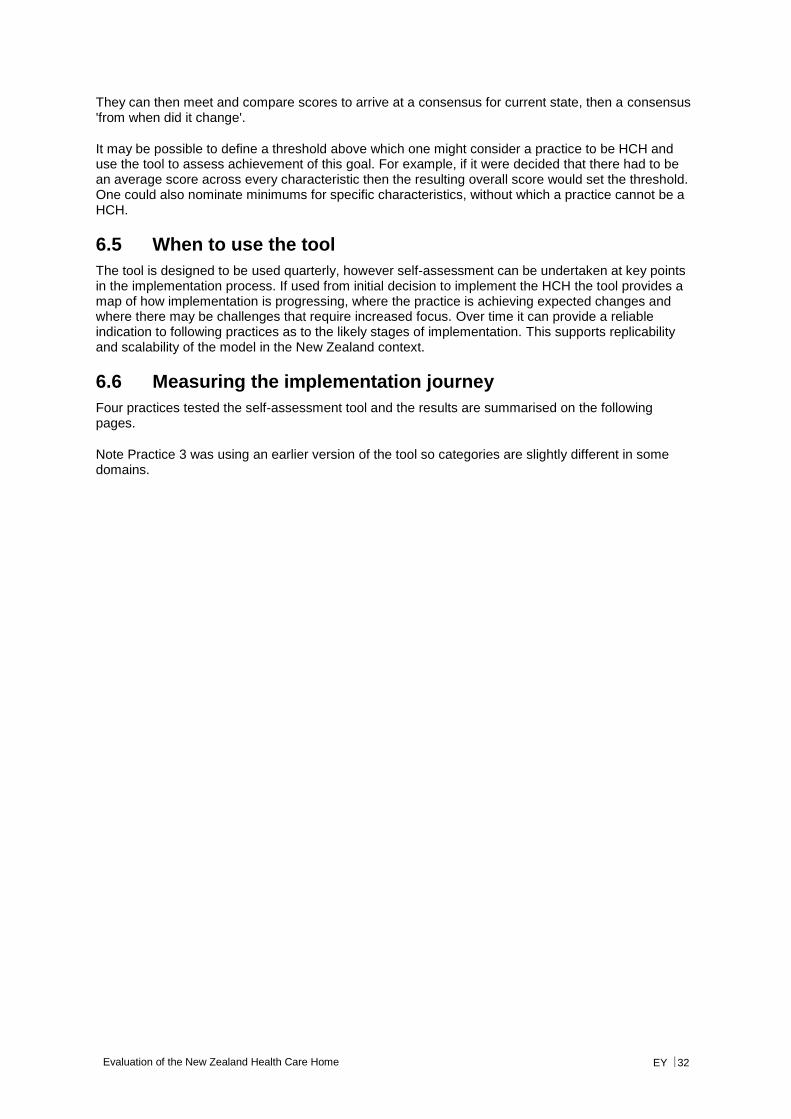
Evaluation of the New Zealand Health Care Home EY 32
They can then meet and compare scores to arrive at a consensus for current state, then a consensus 'from when did it change'.
It may be possible to define a threshold above which one might consider a practice to be HCH and use the tool to assess achievement of this goal. For example, if it were decided that there had to be an average score across every characteristic then the resulting overall score would set the threshold. One could also nominate minimums for specific characteristics, without which a practice cannot be a HCH.
6.5 When to use the tool
The tool is designed to be used quarterly, however self-assessment can be undertaken at key points in the implementation process. If used from initial decision to implement the HCH the tool provides a map of how implementation is progressing, where the practice is achieving expected changes and where there may be challenges that require increased focus. Over time it can provide a reliable indication to following practices as to the likely stages of implementation. This supports replicability and scalability of the model in the New Zealand context.
6.6 Measuring the implementation journey
Four practices tested the self-assessment tool and the results are summarised on the following pages.
Note Practice 3 was using an earlier version of the tool so categories are slightly different in some domains.
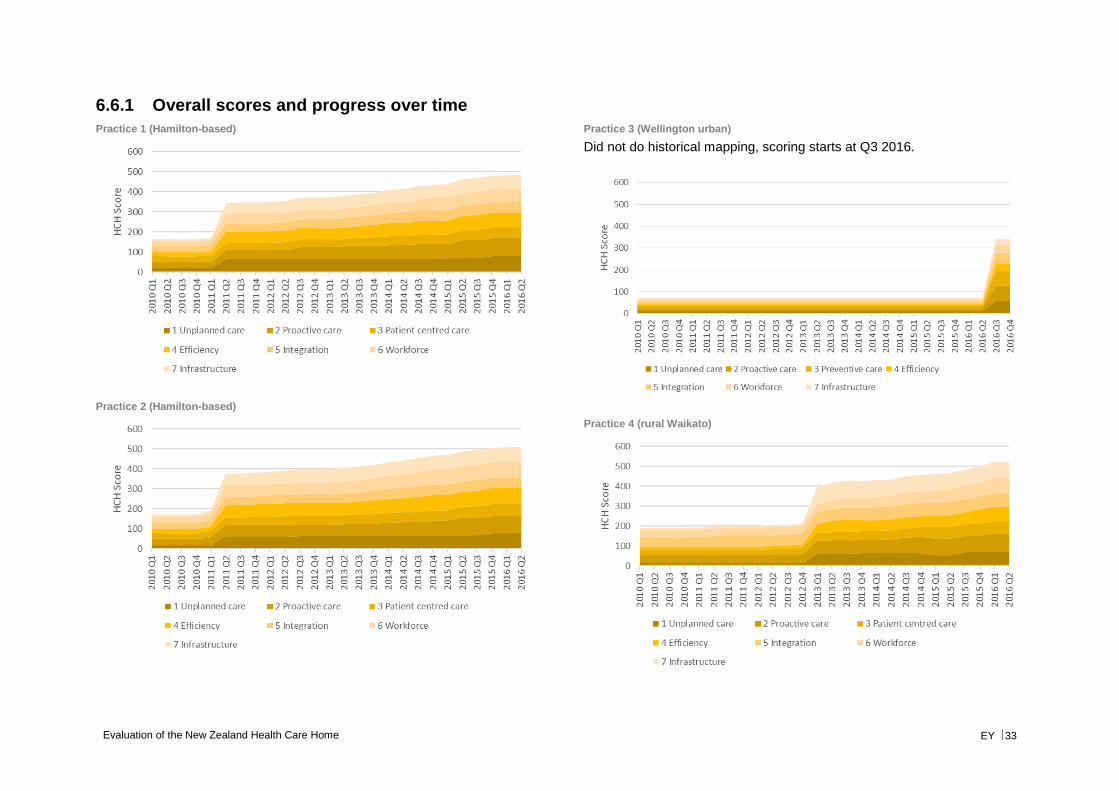
Evaluation of the New Zealand Health Care Home EY 33
6.6.1 Overall scores and progress over time
Practice 1 (Hamilton-based)
Practice 2 (Hamilton-based)
Practice 3 (Wellington urban)
Did not do historical mapping, scoring starts at Q3 2016.
Practice 4 (rural Waikato)
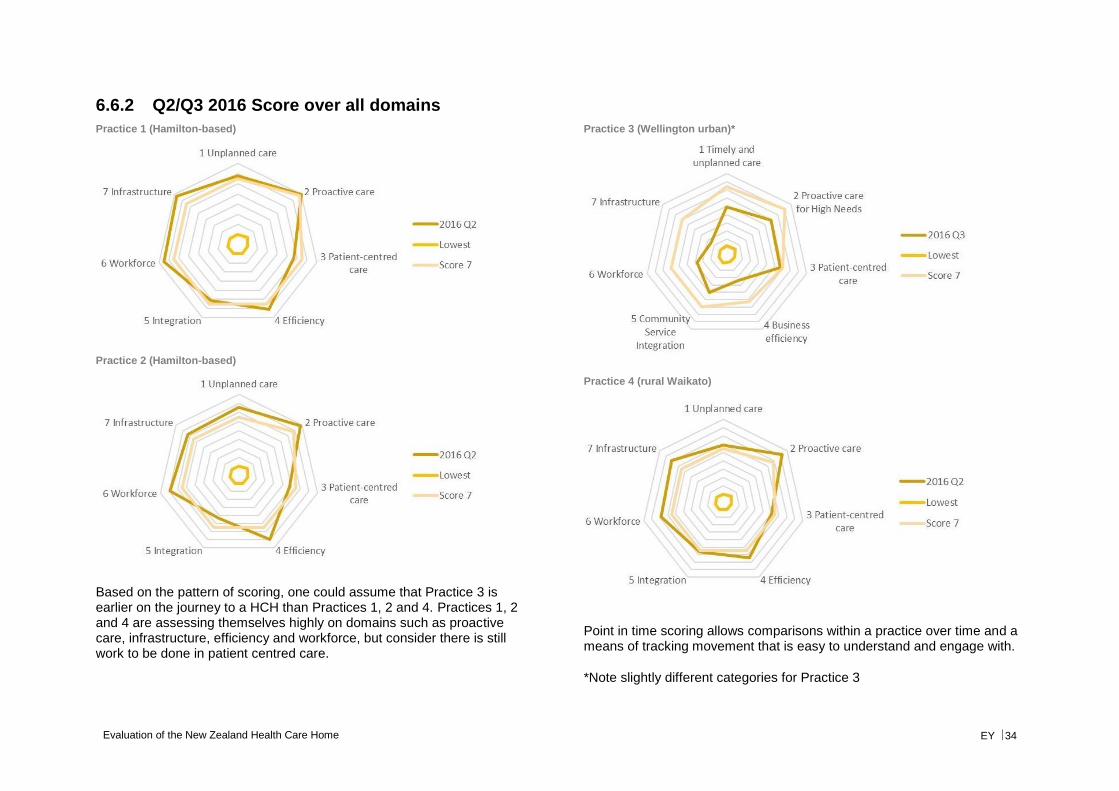
Evaluation of the New Zealand Health Care Home EY 34
6.6.2 Q2/Q3 2016 Score over all domains
Practice 1 (Hamilton-based)
Practice 2 (Hamilton-based)
Based on the pattern of scoring, one could assume that Practice 3 is earlier on the journey to a HCH than Practices 1, 2 and 4. Practices 1, 2 and 4 are assessing themselves highly on domains such as proactive care, infrastructure, efficiency and workforce, but consider there is still work to be done in patient centred care.
Practice 3 (Wellington urban)*
Practice 4 (rural Waikato)
Point in time scoring allows comparisons within a practice over time and a means of tracking movement that is easy to understand and engage with.
*Note slightly different categories for Practice 3
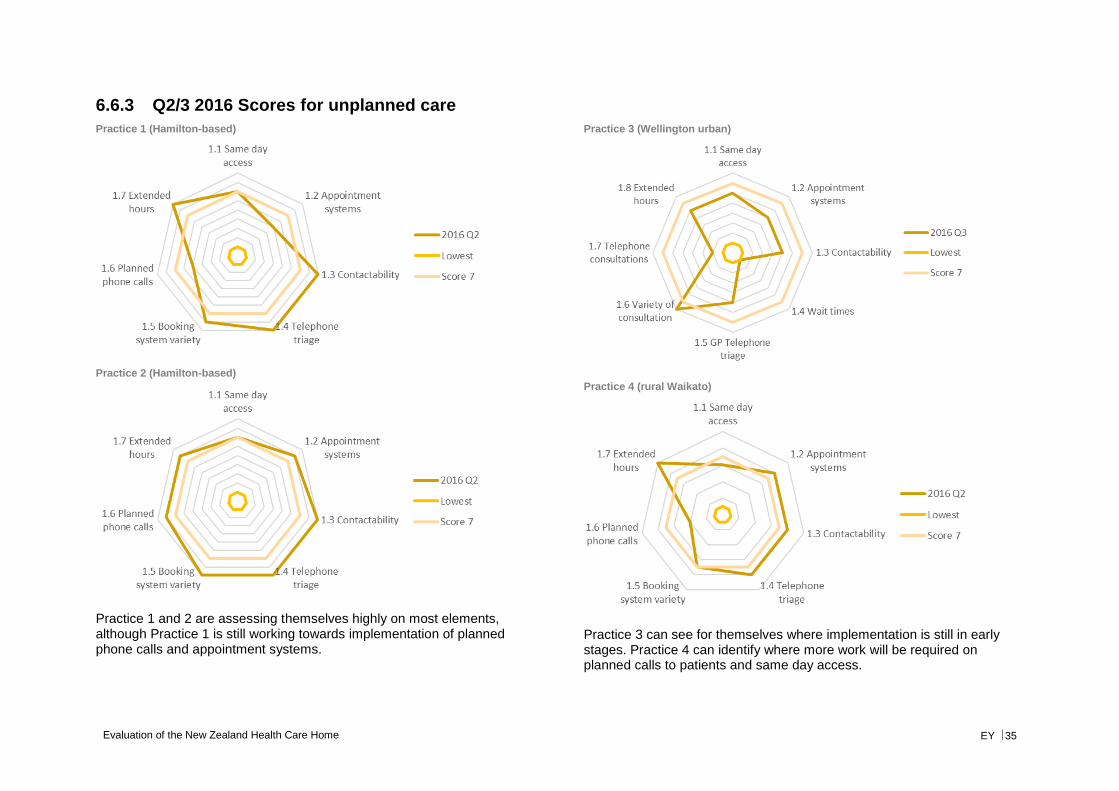
Evaluation of the New Zealand Health Care Home EY 35
6.6.3 Q2/3 2016 Scores for unplanned care
Practice 1 (Hamilton-based)
Practice 2 (Hamilton-based)
Practice 1 and 2 are assessing themselves highly on most elements, although Practice 1 is still working towards implementation of planned phone calls and appointment systems.
Practice 3 (Wellington urban)
Practice 4 (rural Waikato)
Practice 3 can see for themselves where implementation is still in early stages. Practice 4 can identify where more work will be required on planned calls to patients and same day access.
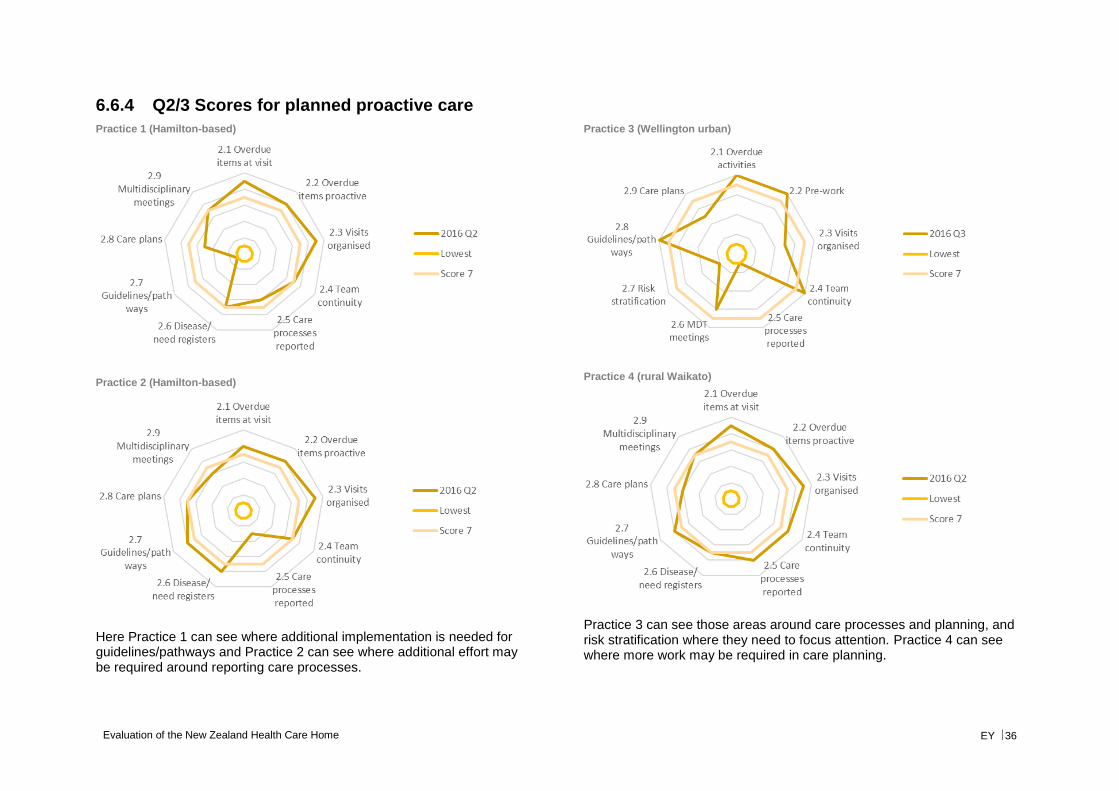
Evaluation of the New Zealand Health Care Home EY 36
6.6.4 Q2/3 Scores for planned proactive care
Practice 1 (Hamilton-based)
Practice 2 (Hamilton-based)
Here Practice 1 can see where additional implementation is needed for guidelines/pathways and Practice 2 can see where additional effort may be required around reporting care processes.
Practice 3 (Wellington urban)
Practice 4 (rural Waikato)
Practice 3 can see those areas around care processes and planning, and risk stratification where they need to focus attention. Practice 4 can see where more work may be required in care planning.
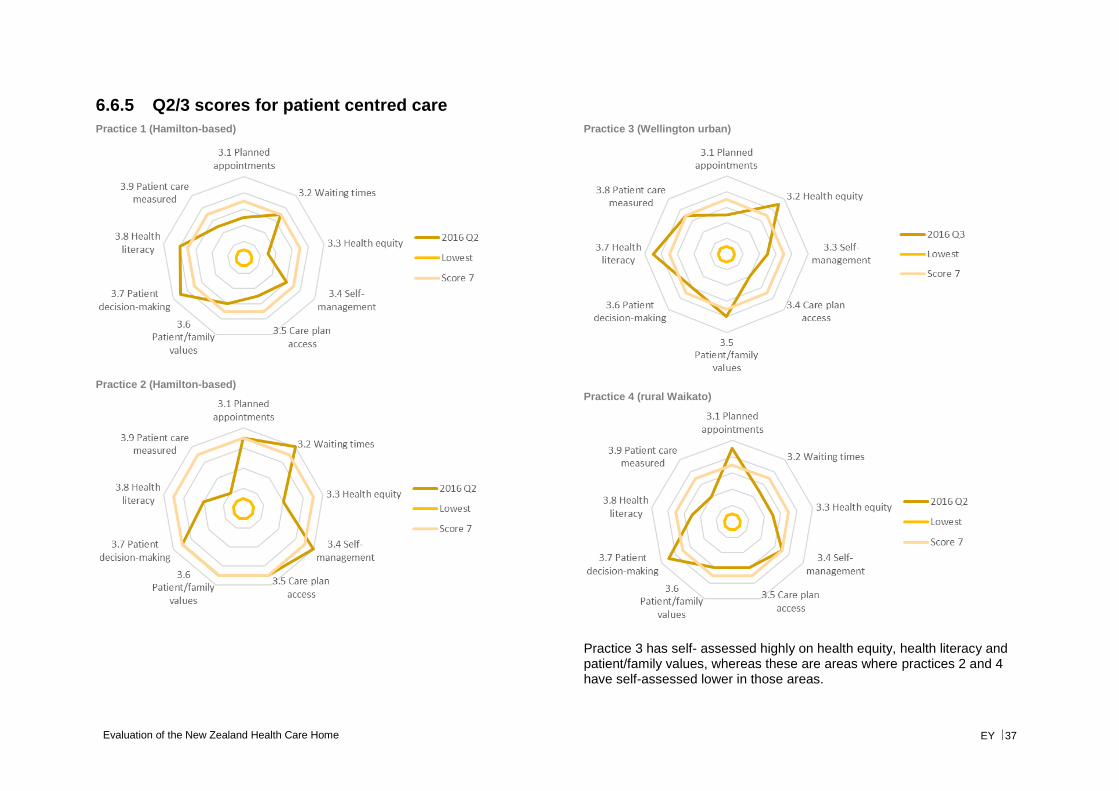
Evaluation of the New Zealand Health Care Home EY 37
6.6.5 Q2/3 scores for patient centred care
Practice 1 (Hamilton-based)
Practice 2 (Hamilton-based)
Practice 3 (Wellington urban)
Practice 4 (rural Waikato)
Practice 3 has self- assessed highly on health equity, health literacy and patient/family values, whereas these are areas where practices 2 and 4 have self-assessed lower in those areas.
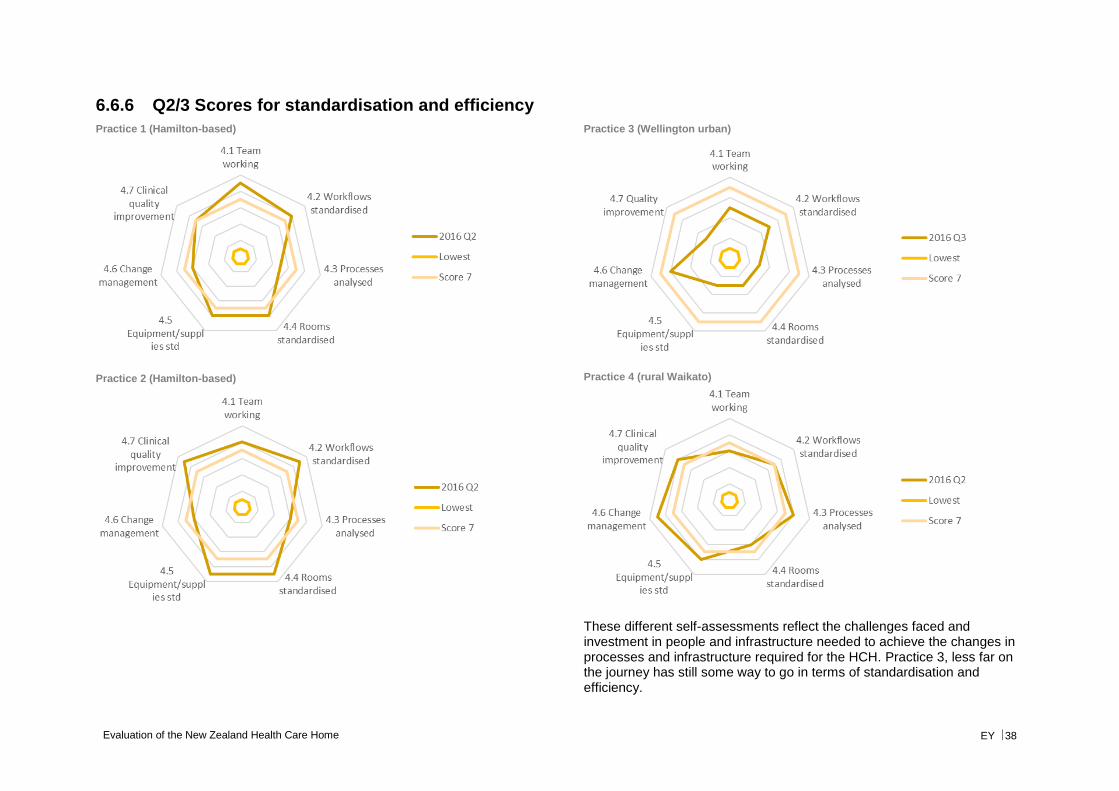
Evaluation of the New Zealand Health Care Home EY 38
6.6.6 Q2/3 Scores for standardisation and efficiency
Practice 1 (Hamilton-based)
Practice 2 (Hamilton-based)
Practice 3 (Wellington urban)
Practice 4 (rural Waikato)
These different self-assessments reflect the challenges faced and investment in people and infrastructure needed to achieve the changes in processes and infrastructure required for the HCH. Practice 3, less far on the journey has still some way to go in terms of standardisation and efficiency.
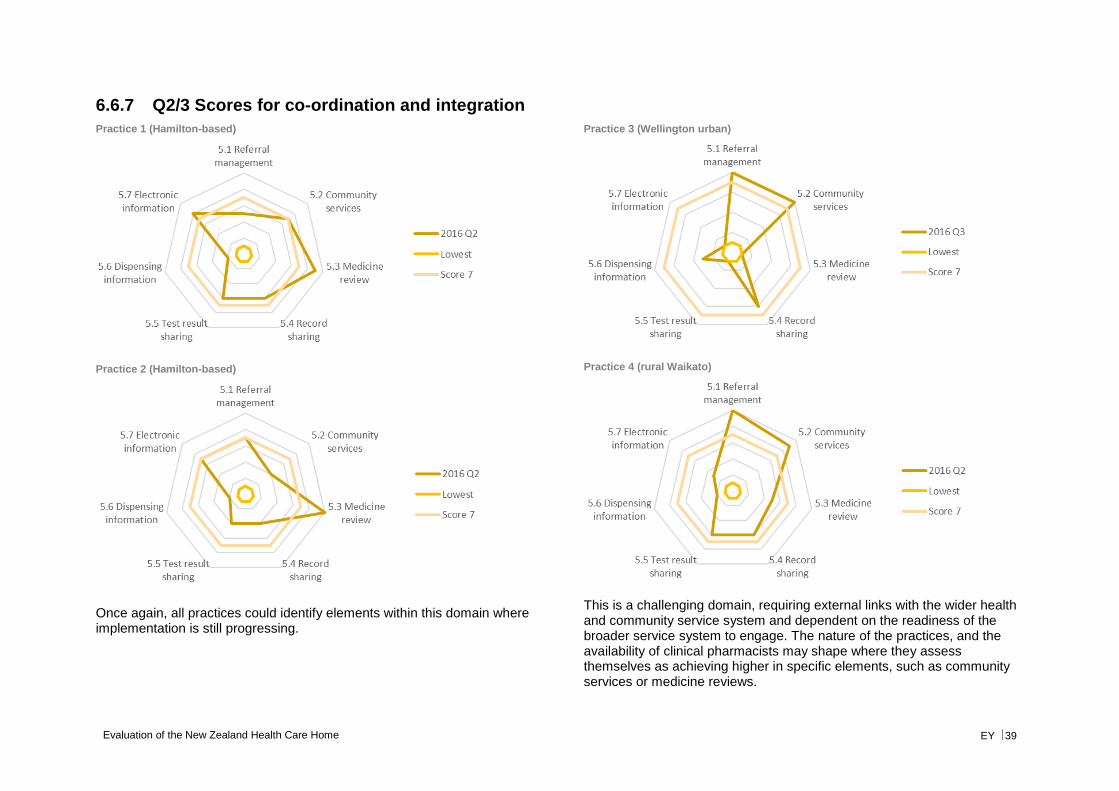
Evaluation of the New Zealand Health Care Home EY 39
6.6.7 Q2/3 Scores for co-ordination and integration
Practice 1 (Hamilton-based)
Practice 2 (Hamilton-based)
Once again, all practices could identify elements within this domain where implementation is still progressing.
Practice 3 (Wellington urban)
Practice 4 (rural Waikato)
This is a challenging domain, requiring external links with the wider health and community service system and dependent on the readiness of the broader service system to engage. The nature of the practices, and the availability of clinical pharmacists may shape where they assess themselves as achieving higher in specific elements, such as community services or medicine reviews.
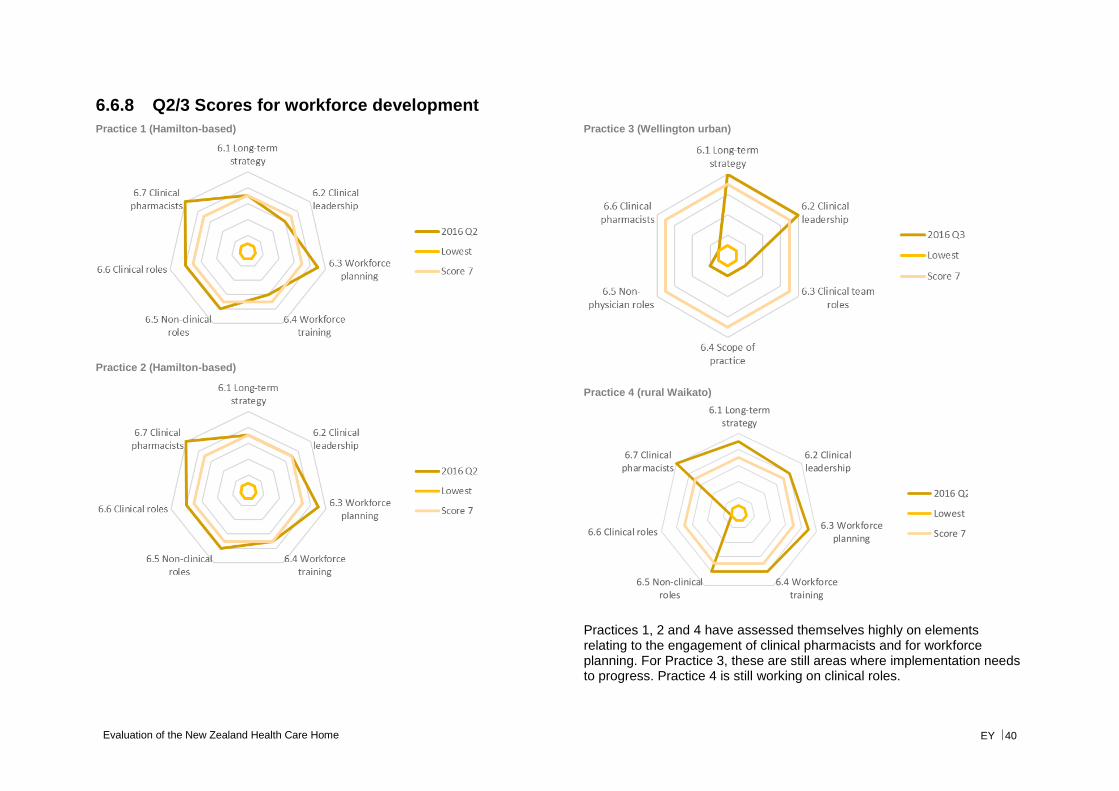
Evaluation of the New Zealand Health Care Home EY 40
6.6.8 Q2/3 Scores for workforce development
Practice 1 (Hamilton-based)
Practice 2 (Hamilton-based)
Practice 3 (Wellington urban)
Practice 4 (rural Waikato)
Practices 1, 2 and 4 have assessed themselves highly on elements relating to the engagement of clinical pharmacists and for workforce planning. For Practice 3, these are still areas where implementation needs to progress. Practice 4 is still working on clinical roles.
6.1 Long-termstrategy
6.2 Clinicalleadership
6.3 Workforceplanning
6.4 Workforcetraining
6.5 Non-clinicalroles
6.6 Clinical roles
6.7 Clinicalpharmacists
2016 Q2
Lowest
Score 7
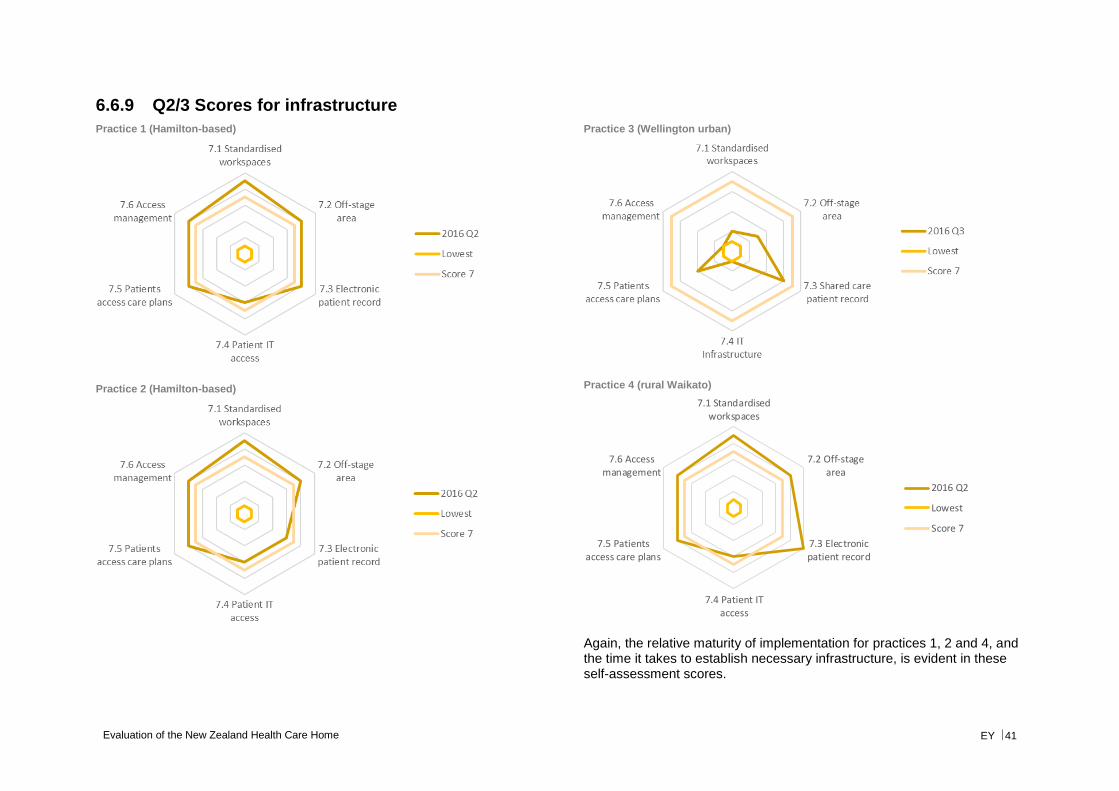
Evaluation of the New Zealand Health Care Home EY 41
6.6.9 Q2/3 Scores for infrastructure
Practice 1 (Hamilton-based)
Practice 2 (Hamilton-based)
Practice 3 (Wellington urban)
Practice 4 (rural Waikato)
Again, the relative maturity of implementation for practices 1, 2 and 4, and the time it takes to establish necessary infrastructure, is evident in these self-assessment scores.
7.1 Standardisedworkspaces
7.2 Off-stagearea
7.3 Electronicpatient record
7.4 Patient ITaccess
7.5 Patientsaccess care plans
7.6 Accessmanagement
2016 Q2
Lowest
Score 7
Evaluation of the New Zealand Health Care Home EY 42
6.7 Conclusion from self-assessments
Based on the results of four completed self-assessments, it appears that the local context and patient profile may shape which domains of the HCH are implemented more easily than others. For example, a practice which is already firmly embedded in the local service system may find it easier to achieve some of the elements of co-ordinated and integrated care.
While practices that have been implementing the HCH model for longer appear to be close to achieving the ‘threshold’ score in each domain, examination of elements within each domain identify specific areas of activity where more focus might be required.
For practices in the early stages of implementation, changes to business models, efficiency and infrastructure appear to require more time and investment than some of the other domains. Practices also commented that while an element might be present in the practice, and could be ‘ticked’, often that function continued improving as practice staff became more familiar with the changed approach. An example given here was telephone triage by GPs, where initially 20-30% of calls were able to be managed without a same day appointment, but after a few years this had risen to 50-60% (workshop participant GP).
Self-assessment is subjective and dependent on interpretation of the meaning of elements within domains. For baselining and comparability, the tool can be applied with an external facilitator, to achieve higher inter-rater reliability.
For practices applying the tool, it provides an ongoing assessment against the domains of the HCH and a means of tracking and refocusing effort.
Evaluation of the New Zealand Health Care Home EY 43
7. Process evaluation
This chapter describes the outcomes of a meta-analysis of previous evaluations undertaken of the HCH.
7.1 Summary of findings
The following findings were extracted from the review of previous evaluations:
► The HCH model of care appears, based on qualitative data, to be achieving many of its expressed aims, however assumptions about the applicability of some elements of the model (e.g. “fishing”) may need to be revisited.
► Quantitative data from previous evaluations shows increasing uptake of key elements of the model over time, including use of the patient portal and use of alternative means for patient consultations.
► At least one practice12 has reported no negative effect on the bottom line after implementing the HCH (not including implementation investments), even though there is a re-alignment of time/effort from different care team members.
► The model allows care team members to work at the top of their scope, and this is generally viewed positively.
► When compared to baseline practices in 2015, the average differences in patient experience between evaluation practices and other practices were minimal on a number of elements for patient self-care/self-management and patient as part of the team.
► It takes time to make changes of the magnitude of the transition to a HCH model. Allowing this time and maintaining realistic expectations while expecting measurable change requires balancing and rebalancing of organisational effort and commitment.
► The changes required to implement the model were significant and impacted on practice staff. It took time for staff to adjust to the new way of working and to see benefits in this. Once comfortable with the HCH system staff generally rated it higher than the traditional model of general practice.
► Patient views and experiences are invaluable in assessing the impact and value of changes. Patients need to be informed about the changes and why they are happening. Patient perceptions and experience, particularly Māori and Pacific, need to continue to be monitored. The patient-centred nature of the changes was noted and appreciated.
► Staff and patients will require sustained education and support to maximise use of the key enablers for the HCH model.
► Facility and other infrastructure changes take time and this should be factored into expectations of outcomes that are dependent on them.
12 Travis Medical Centre
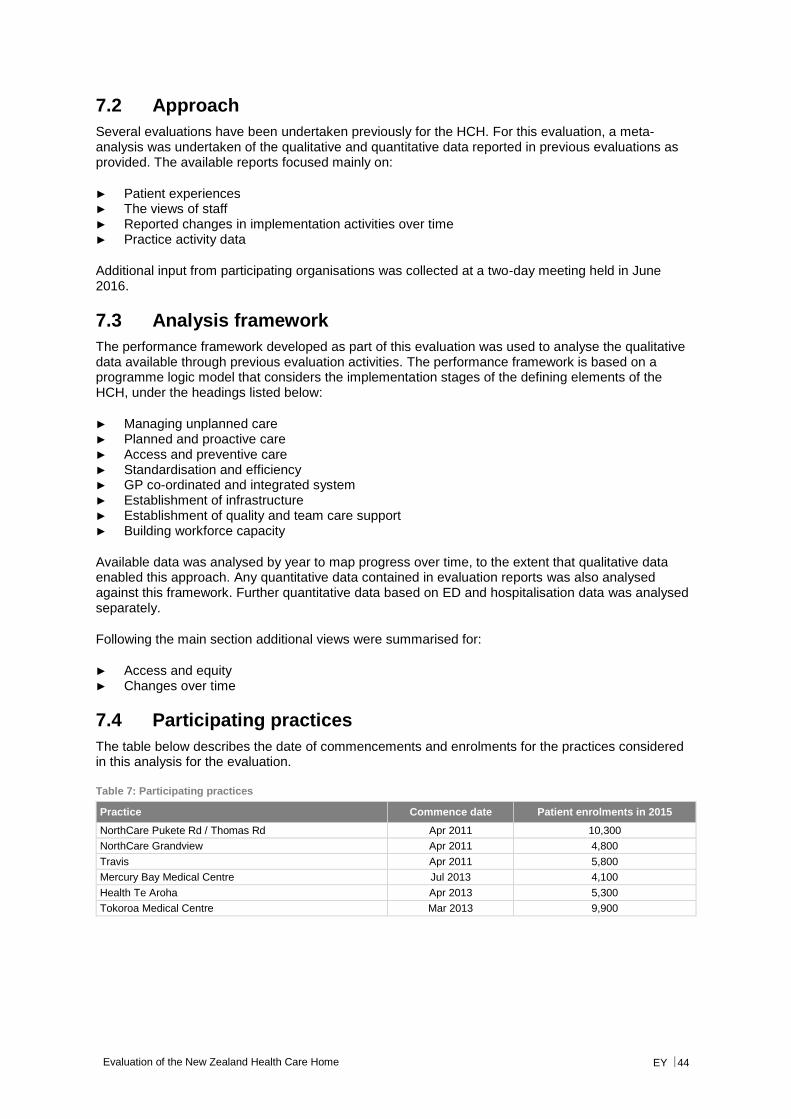
Evaluation of the New Zealand Health Care Home EY 44
7.2 Approach
Several evaluations have been undertaken previously for the HCH. For this evaluation, a meta-analysis was undertaken of the qualitative and quantitative data reported in previous evaluations as provided. The available reports focused mainly on:
► Patient experiences ► The views of staff ► Reported changes in implementation activities over time ► Practice activity data
Additional input from participating organisations was collected at a two-day meeting held in June 2016.
7.3 Analysis framework
The performance framework developed as part of this evaluation was used to analyse the qualitative data available through previous evaluation activities. The performance framework is based on a programme logic model that considers the implementation stages of the defining elements of the HCH, under the headings listed below:
► Managing unplanned care ► Planned and proactive care ► Access and preventive care ► Standardisation and efficiency ► GP co-ordinated and integrated system ► Establishment of infrastructure ► Establishment of quality and team care support ► Building workforce capacity
Available data was analysed by year to map progress over time, to the extent that qualitative data enabled this approach. Any quantitative data contained in evaluation reports was also analysed against this framework. Further quantitative data based on ED and hospitalisation data was analysed separately.
Following the main section additional views were summarised for:
► Access and equity ► Changes over time
7.4 Participating practices
The table below describes the date of commencements and enrolments for the practices considered in this analysis for the evaluation.
Table 7: Participating practices
Practice Commence date Patient enrolments in 2015
NorthCare Pukete Rd / Thomas Rd Apr 2011 10,300
NorthCare Grandview Apr 2011 4,800
Travis Apr 2011 5,800
Mercury Bay Medical Centre Jul 2013 4,100
Health Te Aroha Apr 2013 5,300
Tokoroa Medical Centre Mar 2013 9,900
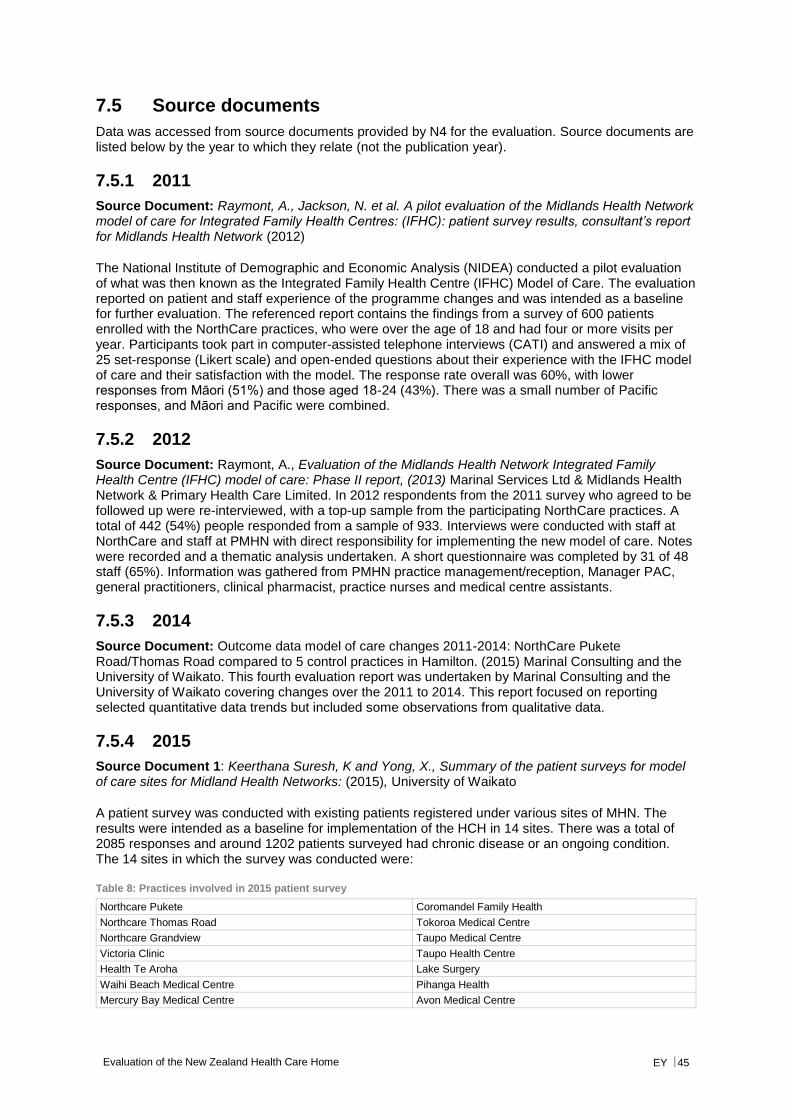
Evaluation of the New Zealand Health Care Home EY 45
7.5 Source documents
Data was accessed from source documents provided by N4 for the evaluation. Source documents are listed below by the year to which they relate (not the publication year).
7.5.1 2011
Source Document: Raymont, A., Jackson, N. et al. A pilot evaluation of the Midlands Health Network model of care for Integrated Family Health Centres: (IFHC): patient survey results, consultant’s report for Midlands Health Network (2012)
The National Institute of Demographic and Economic Analysis (NIDEA) conducted a pilot evaluation of what was then known as the Integrated Family Health Centre (IFHC) Model of Care. The evaluation reported on patient and staff experience of the programme changes and was intended as a baseline for further evaluation. The referenced report contains the findings from a survey of 600 patients enrolled with the NorthCare practices, who were over the age of 18 and had four or more visits per year. Participants took part in computer-assisted telephone interviews (CATI) and answered a mix of 25 set-response (Likert scale) and open-ended questions about their experience with the IFHC model of care and their satisfaction with the model. The response rate overall was 60%, with lower responses from Māori (51%) and those aged 18-24 (43%). There was a small number of Pacific responses, and Māori and Pacific were combined.
7.5.2 2012
Source Document: Raymont, A., Evaluation of the Midlands Health Network Integrated Family Health Centre (IFHC) model of care: Phase II report, (2013) Marinal Services Ltd & Midlands Health Network & Primary Health Care Limited. In 2012 respondents from the 2011 survey who agreed to be followed up were re-interviewed, with a top-up sample from the participating NorthCare practices. A total of 442 (54%) people responded from a sample of 933. Interviews were conducted with staff at NorthCare and staff at PMHN with direct responsibility for implementing the new model of care. Notes were recorded and a thematic analysis undertaken. A short questionnaire was completed by 31 of 48 staff (65%). Information was gathered from PMHN practice management/reception, Manager PAC, general practitioners, clinical pharmacist, practice nurses and medical centre assistants.
7.5.3 2014
Source Document: Outcome data model of care changes 2011-2014: NorthCare Pukete Road/Thomas Road compared to 5 control practices in Hamilton. (2015) Marinal Consulting and the University of Waikato. This fourth evaluation report was undertaken by Marinal Consulting and the University of Waikato covering changes over the 2011 to 2014. This report focused on reporting selected quantitative data trends but included some observations from qualitative data.
7.5.4 2015
Source Document 1: Keerthana Suresh, K and Yong, X., Summary of the patient surveys for model of care sites for Midland Health Networks: (2015), University of Waikato
A patient survey was conducted with existing patients registered under various sites of MHN. The results were intended as a baseline for implementation of the HCH in 14 sites. There was a total of 2085 responses and around 1202 patients surveyed had chronic disease or an ongoing condition. The 14 sites in which the survey was conducted were:
Table 8: Practices involved in 2015 patient survey
Northcare Pukete Coromandel Family Health
Northcare Thomas Road Tokoroa Medical Centre
Northcare Grandview Taupo Medical Centre
Victoria Clinic Taupo Health Centre
Health Te Aroha Lake Surgery
Waihi Beach Medical Centre Pihanga Health
Mercury Bay Medical Centre Avon Medical Centre
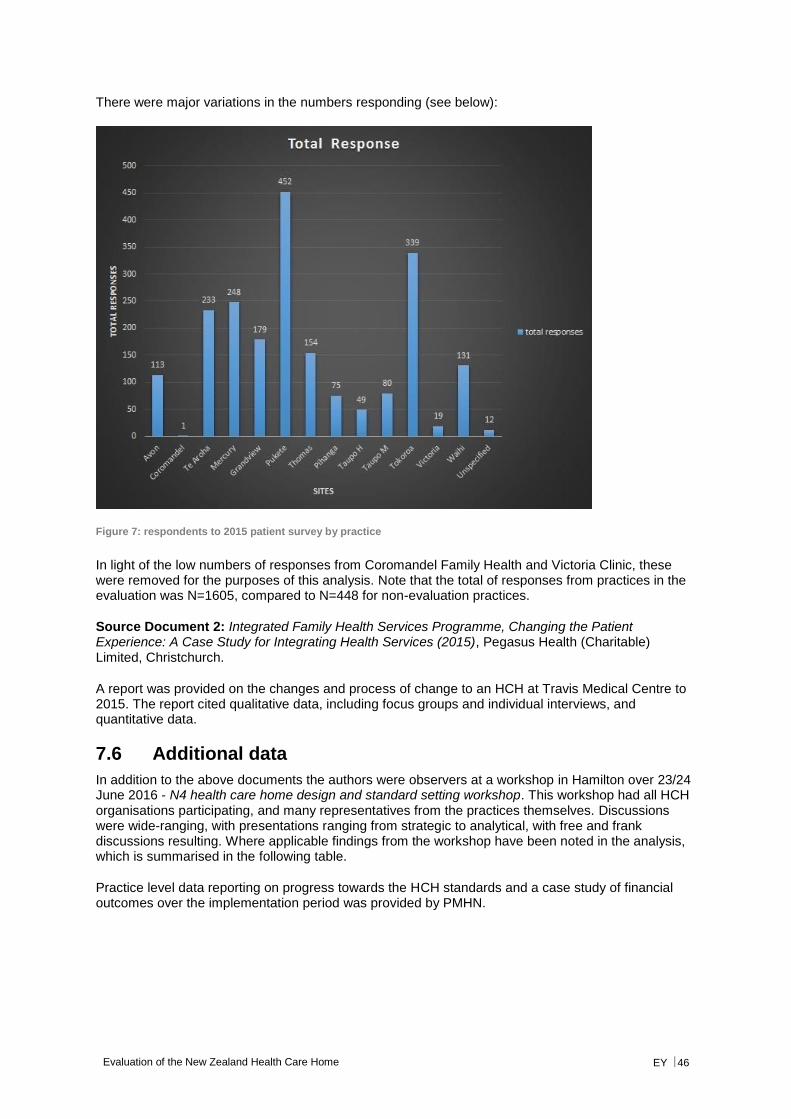
Evaluation of the New Zealand Health Care Home EY 46
There were major variations in the numbers responding (see below):
Figure 7: respondents to 2015 patient survey by practice
In light of the low numbers of responses from Coromandel Family Health and Victoria Clinic, these were removed for the purposes of this analysis. Note that the total of responses from practices in the evaluation was N=1605, compared to N=448 for non-evaluation practices.
Source Document 2: Integrated Family Health Services Programme, Changing the Patient Experience: A Case Study for Integrating Health Services (2015), Pegasus Health (Charitable) Limited, Christchurch.
A report was provided on the changes and process of change to an HCH at Travis Medical Centre to 2015. The report cited qualitative data, including focus groups and individual interviews, and quantitative data.
7.6 Additional data
In addition to the above documents the authors were observers at a workshop in Hamilton over 23/24 June 2016 - N4 health care home design and standard setting workshop. This workshop had all HCH organisations participating, and many representatives from the practices themselves. Discussions were wide-ranging, with presentations ranging from strategic to analytical, with free and frank discussions resulting. Where applicable findings from the workshop have been noted in the analysis, which is summarised in the following table.
Practice level data reporting on progress towards the HCH standards and a case study of financial outcomes over the implementation period was provided by PMHN.
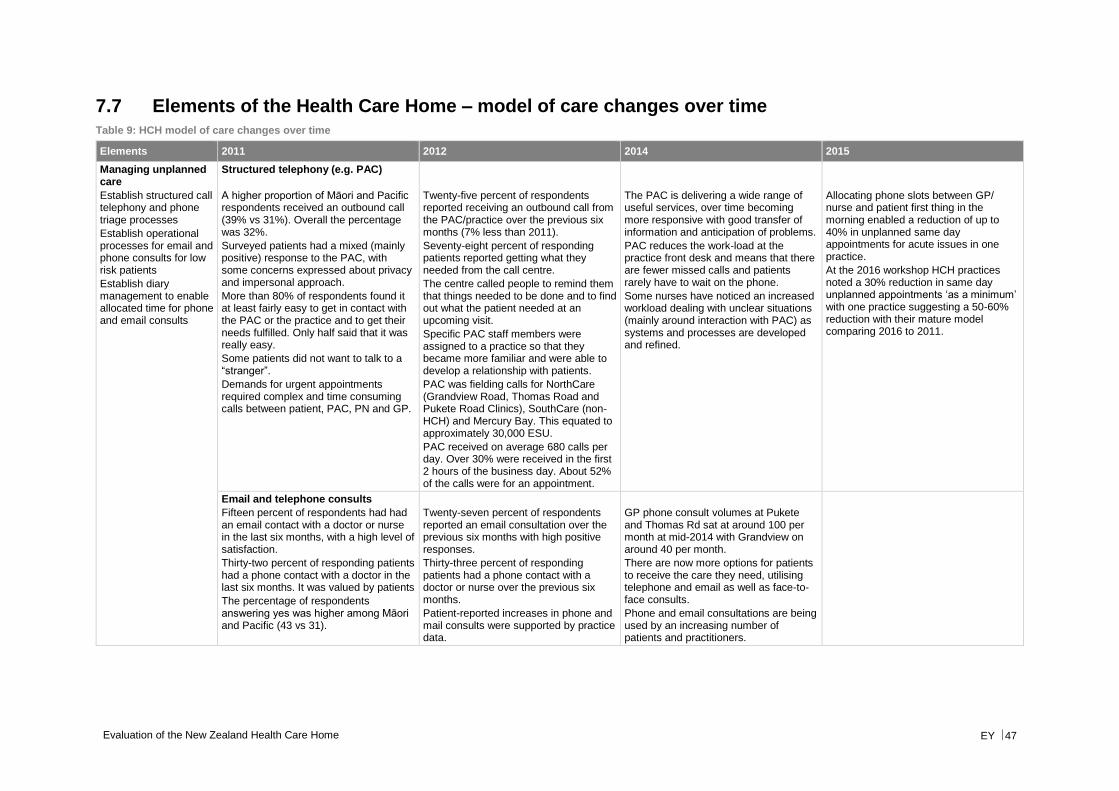
Evaluation of the New Zealand Health Care Home EY 47
7.7 Elements of the Health Care Home – model of care changes over time Table 9: HCH model of care changes over time
Elements 2011 2012 2014 2015
Managing unplanned care
Establish structured call telephony and phone triage processes
Establish operational processes for email and phone consults for low risk patients
Establish diary management to enable allocated time for phone and email consults
Structured telephony (e.g. PAC)
A higher proportion of Māori and Pacific respondents received an outbound call (39% vs 31%). Overall the percentage was 32%.
Surveyed patients had a mixed (mainly positive) response to the PAC, with some concerns expressed about privacy and impersonal approach.
More than 80% of respondents found it at least fairly easy to get in contact with the PAC or the practice and to get their needs fulfilled. Only half said that it was really easy.
Some patients did not want to talk to a “stranger”.
Demands for urgent appointments required complex and time consuming calls between patient, PAC, PN and GP.
Twenty-five percent of respondents reported receiving an outbound call from the PAC/practice over the previous six months (7% less than 2011).
Seventy-eight percent of responding patients reported getting what they needed from the call centre.
The centre called people to remind them that things needed to be done and to find out what the patient needed at an upcoming visit.
Specific PAC staff members were assigned to a practice so that they became more familiar and were able to develop a relationship with patients.
PAC was fielding calls for NorthCare (Grandview Road, Thomas Road and Pukete Road Clinics), SouthCare (non-HCH) and Mercury Bay. This equated to approximately 30,000 ESU.
PAC received on average 680 calls per day. Over 30% were received in the first 2 hours of the business day. About 52% of the calls were for an appointment.
The PAC is delivering a wide range of useful services, over time becoming more responsive with good transfer of information and anticipation of problems.
PAC reduces the work-load at the practice front desk and means that there are fewer missed calls and patients rarely have to wait on the phone.
Some nurses have noticed an increased workload dealing with unclear situations (mainly around interaction with PAC) as systems and processes are developed and refined.
Allocating phone slots between GP/ nurse and patient first thing in the morning enabled a reduction of up to 40% in unplanned same day appointments for acute issues in one practice.
At the 2016 workshop HCH practices noted a 30% reduction in same day unplanned appointments ‘as a minimum’ with one practice suggesting a 50-60% reduction with their mature model comparing 2016 to 2011.
Email and telephone consults
Fifteen percent of respondents had had an email contact with a doctor or nurse in the last six months, with a high level of satisfaction.
Thirty-two percent of responding patients had a phone contact with a doctor in the last six months. It was valued by patients
The percentage of respondents answering yes was higher among Māori and Pacific (43 vs 31).
Twenty-seven percent of respondents reported an email consultation over the previous six months with high positive responses.
Thirty-three percent of responding patients had a phone contact with a doctor or nurse over the previous six months.
Patient-reported increases in phone and mail consults were supported by practice data.
GP phone consult volumes at Pukete and Thomas Rd sat at around 100 per month at mid-2014 with Grandview on around 40 per month.
There are now more options for patients to receive the care they need, utilising telephone and email as well as face-to-face consults.
Phone and email consultations are being used by an increasing number of patients and practitioners.
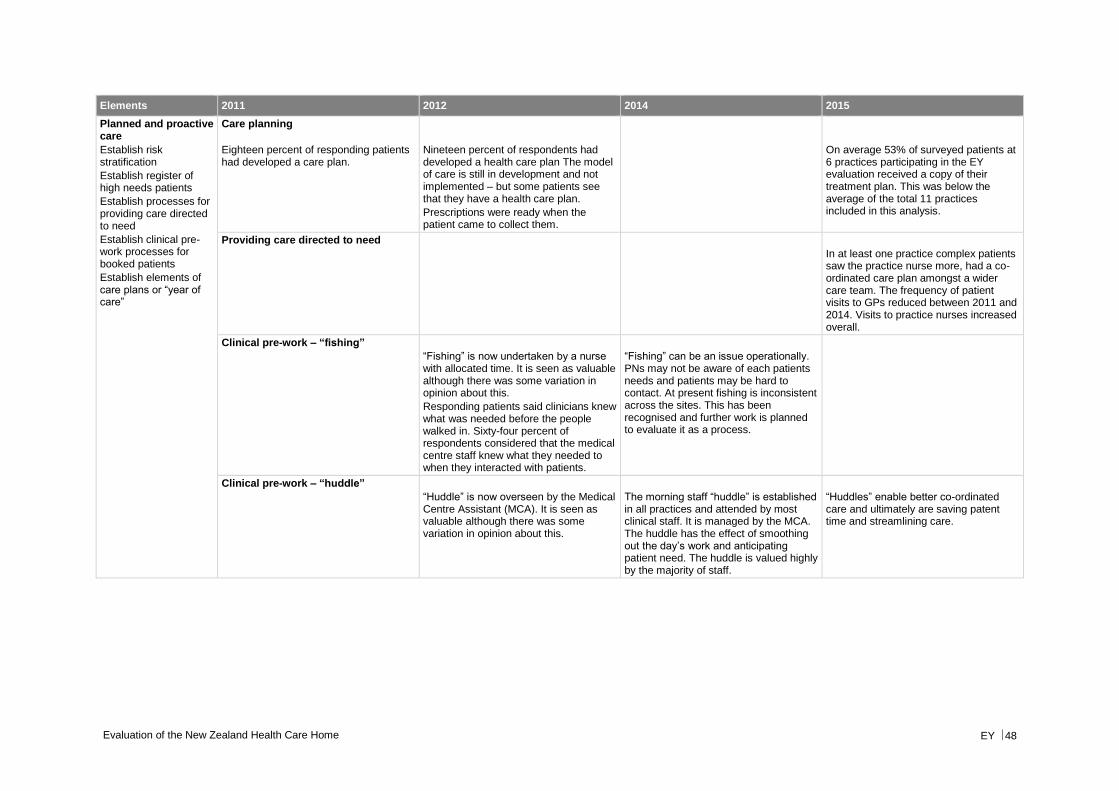
Evaluation of the New Zealand Health Care Home EY 48
Elements 2011 2012 2014 2015
Planned and proactive care
Establish risk stratification
Establish register of high needs patients
Establish processes for providing care directed to need
Establish clinical pre-work processes for booked patients
Establish elements of care plans or “year of care”
Care planning
Eighteen percent of responding patients had developed a care plan.
Nineteen percent of respondents had developed a health care plan The model of care is still in development and not implemented – but some patients see that they have a health care plan.
Prescriptions were ready when the patient came to collect them.
On average 53% of surveyed patients at 6 practices participating in the EY evaluation received a copy of their treatment plan. This was below the average of the total 11 practices included in this analysis.
Providing care directed to need
In at least one practice complex patients saw the practice nurse more, had a co-ordinated care plan amongst a wider care team. The frequency of patient visits to GPs reduced between 2011 and 2014. Visits to practice nurses increased overall.
Clinical pre-work – “fishing”
“Fishing” is now undertaken by a nurse with allocated time. It is seen as valuable although there was some variation in opinion about this.
Responding patients said clinicians knew what was needed before the people walked in. Sixty-four percent of respondents considered that the medical centre staff knew what they needed to when they interacted with patients.
“Fishing” can be an issue operationally. PNs may not be aware of each patients needs and patients may be hard to contact. At present fishing is inconsistent across the sites. This has been recognised and further work is planned to evaluate it as a process.
Clinical pre-work – “huddle”
“Huddle” is now overseen by the Medical Centre Assistant (MCA). It is seen as valuable although there was some variation in opinion about this.
The morning staff “huddle” is established in all practices and attended by most clinical staff. It is managed by the MCA. The huddle has the effect of smoothing out the day’s work and anticipating patient need. The huddle is valued highly by the majority of staff.
“Huddles” enable better co-ordinated care and ultimately are saving patent time and streamlining care.
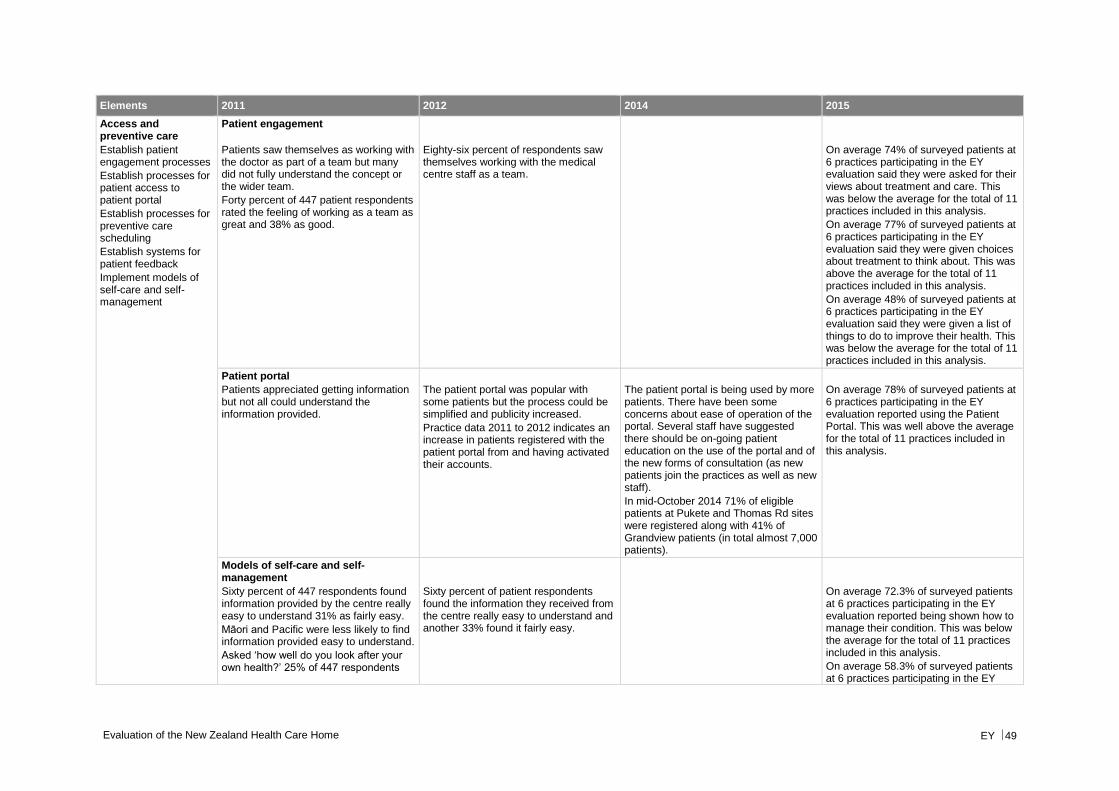
Evaluation of the New Zealand Health Care Home EY 49
Elements 2011 2012 2014 2015
Access and preventive care
Establish patient engagement processes
Establish processes for patient access to patient portal
Establish processes for preventive care scheduling
Establish systems for patient feedback
Implement models of self-care and self-management
Patient engagement
Patients saw themselves as working with the doctor as part of a team but many did not fully understand the concept or the wider team.
Forty percent of 447 patient respondents rated the feeling of working as a team as great and 38% as good.
Eighty-six percent of respondents saw themselves working with the medical centre staff as a team.
On average 74% of surveyed patients at 6 practices participating in the EY evaluation said they were asked for their views about treatment and care. This was below the average for the total of 11 practices included in this analysis.
On average 77% of surveyed patients at 6 practices participating in the EY evaluation said they were given choices about treatment to think about. This was above the average for the total of 11 practices included in this analysis.
On average 48% of surveyed patients at 6 practices participating in the EY evaluation said they were given a list of things to do to improve their health. This was below the average for the total of 11 practices included in this analysis.
Patient portal
Patients appreciated getting information but not all could understand the information provided.
The patient portal was popular with some patients but the process could be simplified and publicity increased.
Practice data 2011 to 2012 indicates an increase in patients registered with the patient portal from and having activated their accounts.
The patient portal is being used by more patients. There have been some concerns about ease of operation of the portal. Several staff have suggested there should be on-going patient education on the use of the portal and of the new forms of consultation (as new patients join the practices as well as new staff).
In mid-October 2014 71% of eligible patients at Pukete and Thomas Rd sites were registered along with 41% of Grandview patients (in total almost 7,000 patients).
On average 78% of surveyed patients at 6 practices participating in the EY evaluation reported using the Patient Portal. This was well above the average for the total of 11 practices included in this analysis.
Models of self-care and self-management
Sixty percent of 447 respondents found information provided by the centre really easy to understand 31% as fairly easy.
Māori and Pacific were less likely to find information provided easy to understand.
Asked ‘how well do you look after your own health?’ 25% of 447 respondents
Sixty percent of patient respondents found the information they received from the centre really easy to understand and another 33% found it fairly easy.
On average 72.3% of surveyed patients at 6 practices participating in the EY evaluation reported being shown how to manage their condition. This was below the average for the total of 11 practices included in this analysis.
On average 58.3% of surveyed patients at 6 practices participating in the EY
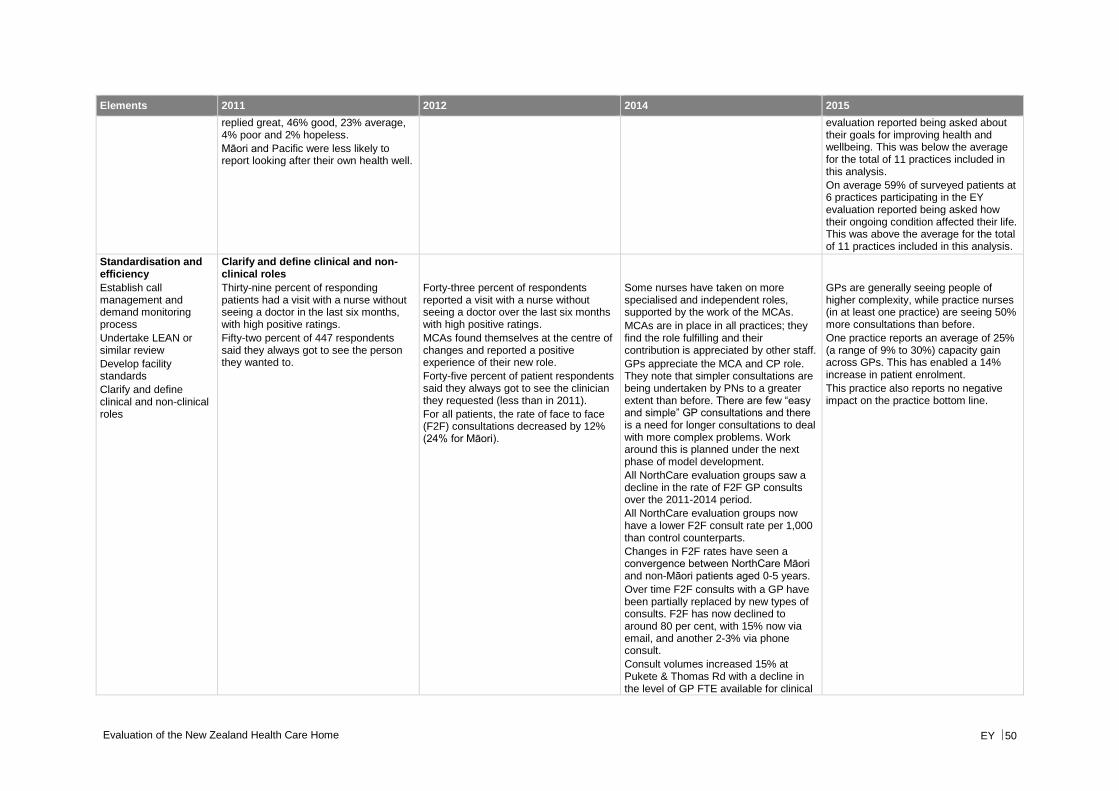
Evaluation of the New Zealand Health Care Home EY 50
Elements 2011 2012 2014 2015
replied great, 46% good, 23% average, 4% poor and 2% hopeless.
Māori and Pacific were less likely to report looking after their own health well.
evaluation reported being asked about their goals for improving health and wellbeing. This was below the average for the total of 11 practices included in this analysis.
On average 59% of surveyed patients at 6 practices participating in the EY evaluation reported being asked how their ongoing condition affected their life. This was above the average for the total of 11 practices included in this analysis.
Standardisation and efficiency
Establish call management and demand monitoring process
Undertake LEAN or similar review
Develop facility standards
Clarify and define clinical and non-clinical roles
Clarify and define clinical and non-clinical roles
Thirty-nine percent of responding patients had a visit with a nurse without seeing a doctor in the last six months, with high positive ratings.
Fifty-two percent of 447 respondents said they always got to see the person they wanted to.
Forty-three percent of respondents reported a visit with a nurse without seeing a doctor over the last six months with high positive ratings.
MCAs found themselves at the centre of changes and reported a positive experience of their new role.
Forty-five percent of patient respondents said they always got to see the clinician they requested (less than in 2011).
For all patients, the rate of face to face (F2F) consultations decreased by 12% (24% for Māori).
Some nurses have taken on more specialised and independent roles, supported by the work of the MCAs.
MCAs are in place in all practices; they find the role fulfilling and their contribution is appreciated by other staff.
GPs appreciate the MCA and CP role. They note that simpler consultations are being undertaken by PNs to a greater extent than before. There are few “easy and simple” GP consultations and there is a need for longer consultations to deal with more complex problems. Work around this is planned under the next phase of model development.
All NorthCare evaluation groups saw a decline in the rate of F2F GP consults over the 2011-2014 period.
All NorthCare evaluation groups now have a lower F2F consult rate per 1,000 than control counterparts.
Changes in F2F rates have seen a convergence between NorthCare Māori and non-Māori patients aged 0-5 years.
Over time F2F consults with a GP have been partially replaced by new types of consults. F2F has now declined to around 80 per cent, with 15% now via email, and another 2-3% via phone consult.
Consult volumes increased 15% at Pukete & Thomas Rd with a decline in the level of GP FTE available for clinical
GPs are generally seeing people of higher complexity, while practice nurses (in at least one practice) are seeing 50% more consultations than before.
One practice reports an average of 25% (a range of 9% to 30%) capacity gain across GPs. This has enabled a 14% increase in patient enrolment.
This practice also reports no negative impact on the practice bottom line.
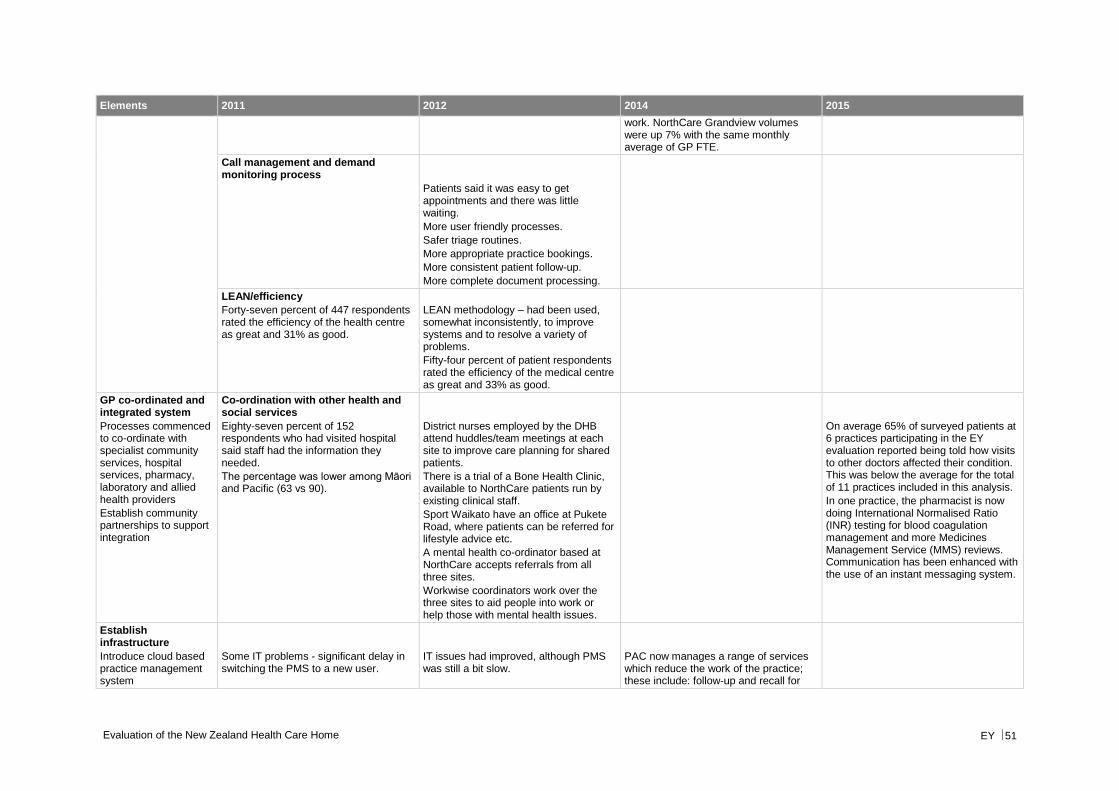
Evaluation of the New Zealand Health Care Home EY 51
Elements 2011 2012 2014 2015
work. NorthCare Grandview volumes were up 7% with the same monthly average of GP FTE.
Call management and demand monitoring process
Patients said it was easy to get appointments and there was little waiting.
More user friendly processes.
Safer triage routines.
More appropriate practice bookings.
More consistent patient follow-up.
More complete document processing.
LEAN/efficiency
Forty-seven percent of 447 respondents rated the efficiency of the health centre as great and 31% as good.
LEAN methodology – had been used, somewhat inconsistently, to improve systems and to resolve a variety of problems.
Fifty-four percent of patient respondents rated the efficiency of the medical centre as great and 33% as good.
GP co-ordinated and integrated system
Processes commenced to co-ordinate with specialist community services, hospital services, pharmacy, laboratory and allied health providers
Establish community partnerships to support integration
Co-ordination with other health and social services
Eighty-seven percent of 152 respondents who had visited hospital said staff had the information they needed.
The percentage was lower among Māori and Pacific (63 vs 90).
District nurses employed by the DHB attend huddles/team meetings at each site to improve care planning for shared patients.
There is a trial of a Bone Health Clinic, available to NorthCare patients run by existing clinical staff.
Sport Waikato have an office at Pukete Road, where patients can be referred for lifestyle advice etc.
A mental health co-ordinator based at NorthCare accepts referrals from all three sites.
Workwise coordinators work over the three sites to aid people into work or help those with mental health issues.
On average 65% of surveyed patients at 6 practices participating in the EY evaluation reported being told how visits to other doctors affected their condition. This was below the average for the total of 11 practices included in this analysis.
In one practice, the pharmacist is now doing International Normalised Ratio (INR) testing for blood coagulation management and more Medicines Management Service (MMS) reviews. Communication has been enhanced with the use of an instant messaging system.
Establish infrastructure
Introduce cloud based practice management system
Some IT problems - significant delay in switching the PMS to a new user.
IT issues had improved, although PMS was still a bit slow.
PAC now manages a range of services which reduce the work of the practice; these include: follow-up and recall for
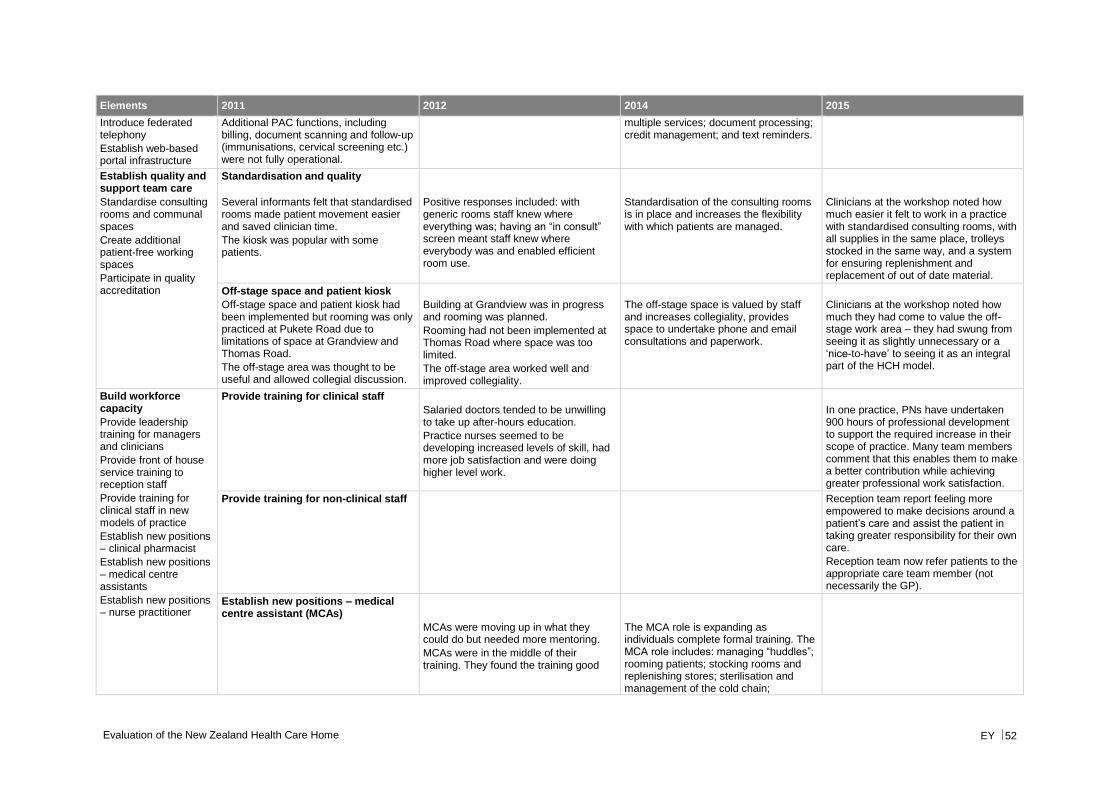
Evaluation of the New Zealand Health Care Home EY 52
Elements 2011 2012 2014 2015
Introduce federated telephony
Establish web-based portal infrastructure
Additional PAC functions, including billing, document scanning and follow-up (immunisations, cervical screening etc.) were not fully operational.
multiple services; document processing; credit management; and text reminders.
Establish quality and support team care
Standardise consulting rooms and communal spaces
Create additional patient-free working spaces
Participate in quality accreditation
Standardisation and quality
Several informants felt that standardised rooms made patient movement easier and saved clinician time.
The kiosk was popular with some patients.
Positive responses included: with generic rooms staff knew where everything was; having an “in consult” screen meant staff knew where everybody was and enabled efficient room use.
Standardisation of the consulting rooms is in place and increases the flexibility with which patients are managed.
Clinicians at the workshop noted how much easier it felt to work in a practice with standardised consulting rooms, with all supplies in the same place, trolleys stocked in the same way, and a system for ensuring replenishment and replacement of out of date material.
Off-stage space and patient kiosk
Off-stage space and patient kiosk had been implemented but rooming was only practiced at Pukete Road due to limitations of space at Grandview and Thomas Road.
The off-stage area was thought to be useful and allowed collegial discussion.
Building at Grandview was in progress and rooming was planned.
Rooming had not been implemented at Thomas Road where space was too limited.
The off-stage area worked well and improved collegiality.
The off-stage space is valued by staff and increases collegiality, provides space to undertake phone and email consultations and paperwork.
Clinicians at the workshop noted how much they had come to value the off-stage work area – they had swung from seeing it as slightly unnecessary or a ‘nice-to-have’ to seeing it as an integral part of the HCH model.
Build workforce capacity
Provide leadership training for managers and clinicians
Provide front of house service training to reception staff
Provide training for clinical staff in new models of practice
Establish new positions – clinical pharmacist
Establish new positions – medical centre assistants
Establish new positions – nurse practitioner
Provide training for clinical staff
Salaried doctors tended to be unwilling to take up after-hours education.
Practice nurses seemed to be developing increased levels of skill, had more job satisfaction and were doing higher level work.
In one practice, PNs have undertaken 900 hours of professional development to support the required increase in their scope of practice. Many team members comment that this enables them to make a better contribution while achieving greater professional work satisfaction.
Provide training for non-clinical staff Reception team report feeling more empowered to make decisions around a patient’s care and assist the patient in taking greater responsibility for their own care.
Reception team now refer patients to the appropriate care team member (not necessarily the GP).
Establish new positions – medical centre assistant (MCAs)
MCAs were moving up in what they could do but needed more mentoring.
MCAs were in the middle of their training. They found the training good
The MCA role is expanding as individuals complete formal training. The MCA role includes: managing “huddles”; rooming patients; stocking rooms and replenishing stores; sterilisation and management of the cold chain;
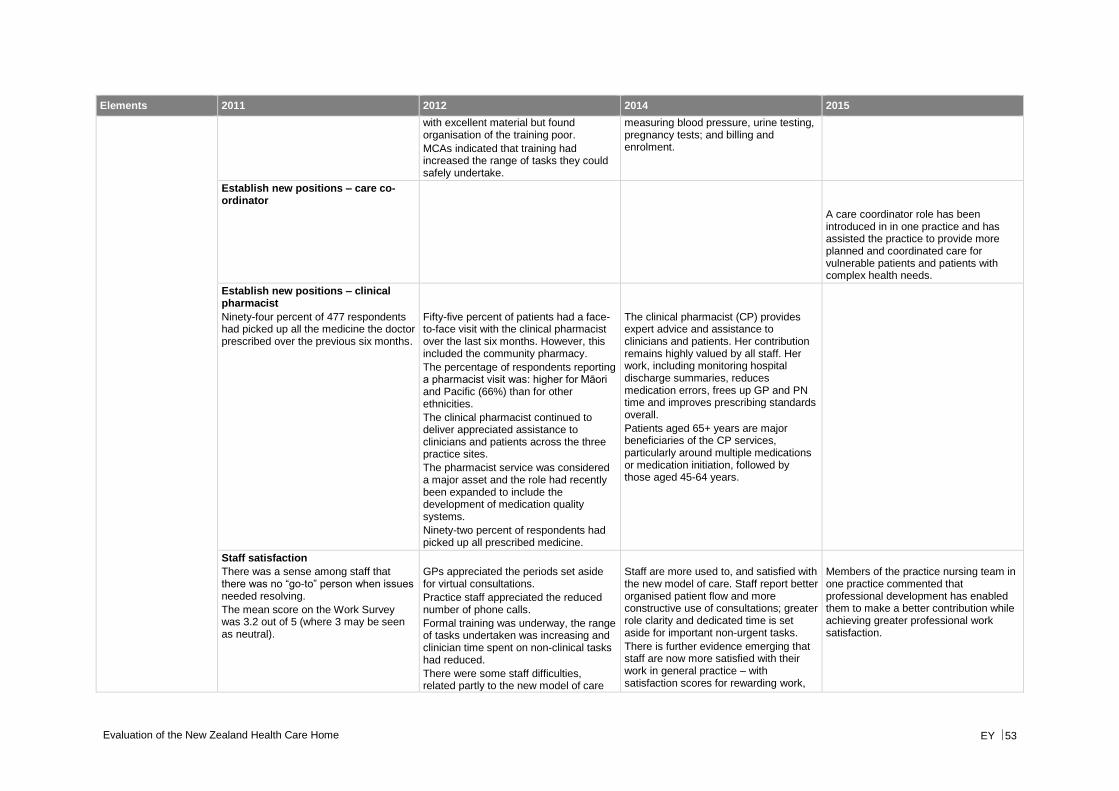
Evaluation of the New Zealand Health Care Home EY 53
Elements 2011 2012 2014 2015
with excellent material but found organisation of the training poor.
MCAs indicated that training had increased the range of tasks they could safely undertake.
measuring blood pressure, urine testing, pregnancy tests; and billing and enrolment.
Establish new positions – care co-ordinator
A care coordinator role has been introduced in in one practice and has assisted the practice to provide more planned and coordinated care for vulnerable patients and patients with complex health needs.
Establish new positions – clinical pharmacist
Ninety-four percent of 477 respondents had picked up all the medicine the doctor prescribed over the previous six months.
Fifty-five percent of patients had a face-to-face visit with the clinical pharmacist over the last six months. However, this included the community pharmacy.
The percentage of respondents reporting a pharmacist visit was: higher for Māori and Pacific (66%) than for other ethnicities.
The clinical pharmacist continued to deliver appreciated assistance to clinicians and patients across the three practice sites.
The pharmacist service was considered a major asset and the role had recently been expanded to include the development of medication quality systems.
Ninety-two percent of respondents had picked up all prescribed medicine.
The clinical pharmacist (CP) provides expert advice and assistance to clinicians and patients. Her contribution remains highly valued by all staff. Her work, including monitoring hospital discharge summaries, reduces medication errors, frees up GP and PN time and improves prescribing standards overall.
Patients aged 65+ years are major beneficiaries of the CP services, particularly around multiple medications or medication initiation, followed by those aged 45-64 years.
Staff satisfaction
There was a sense among staff that there was no “go-to” person when issues needed resolving.
The mean score on the Work Survey was 3.2 out of 5 (where 3 may be seen as neutral).
GPs appreciated the periods set aside for virtual consultations.
Practice staff appreciated the reduced number of phone calls.
Formal training was underway, the range of tasks undertaken was increasing and clinician time spent on non-clinical tasks had reduced.
There were some staff difficulties, related partly to the new model of care
Staff are more used to, and satisfied with the new model of care. Staff report better organised patient flow and more constructive use of consultations; greater role clarity and dedicated time is set aside for important non-urgent tasks.
There is further evidence emerging that staff are now more satisfied with their work in general practice – with satisfaction scores for rewarding work,
Members of the practice nursing team in one practice commented that professional development has enabled them to make a better contribution while achieving greater professional work satisfaction.
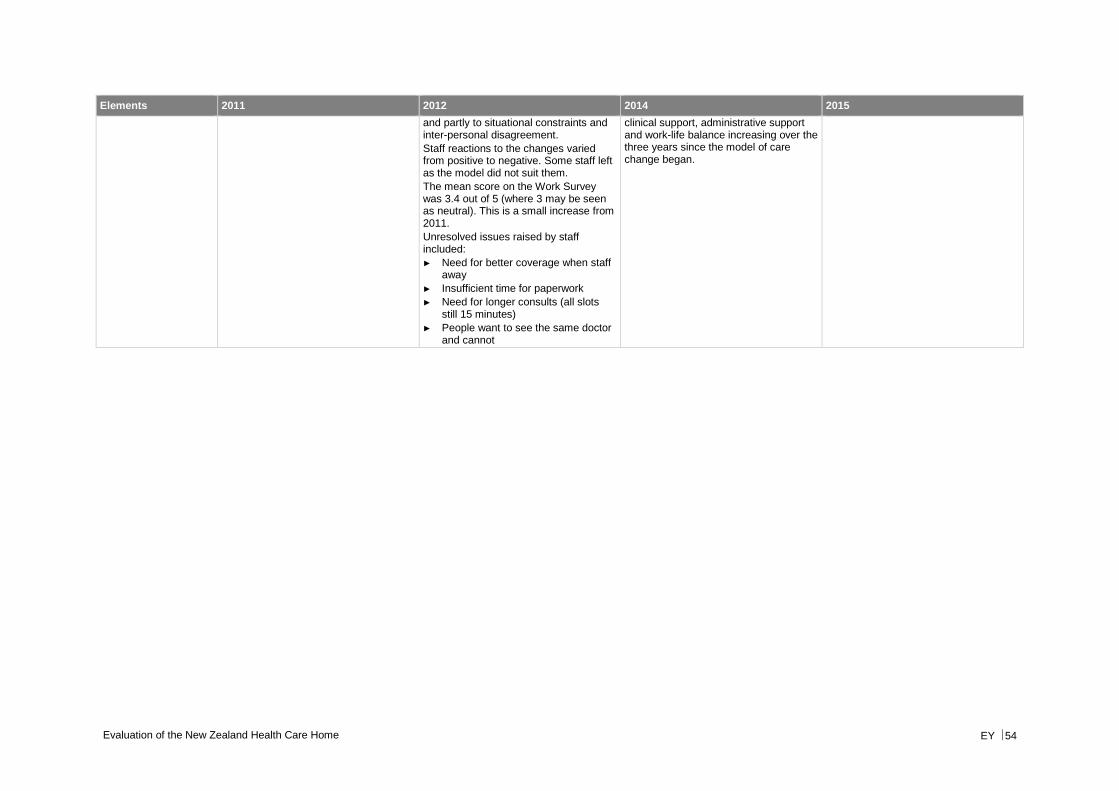
Evaluation of the New Zealand Health Care Home EY 54
Elements 2011 2012 2014 2015
and partly to situational constraints and inter-personal disagreement.
Staff reactions to the changes varied from positive to negative. Some staff left as the model did not suit them.
The mean score on the Work Survey was 3.4 out of 5 (where 3 may be seen as neutral). This is a small increase from 2011.
Unresolved issues raised by staff included:
► Need for better coverage when staff away
► Insufficient time for paperwork
► Need for longer consults (all slots still 15 minutes)
► People want to see the same doctor and cannot
clinical support, administrative support and work-life balance increasing over the three years since the model of care change began.
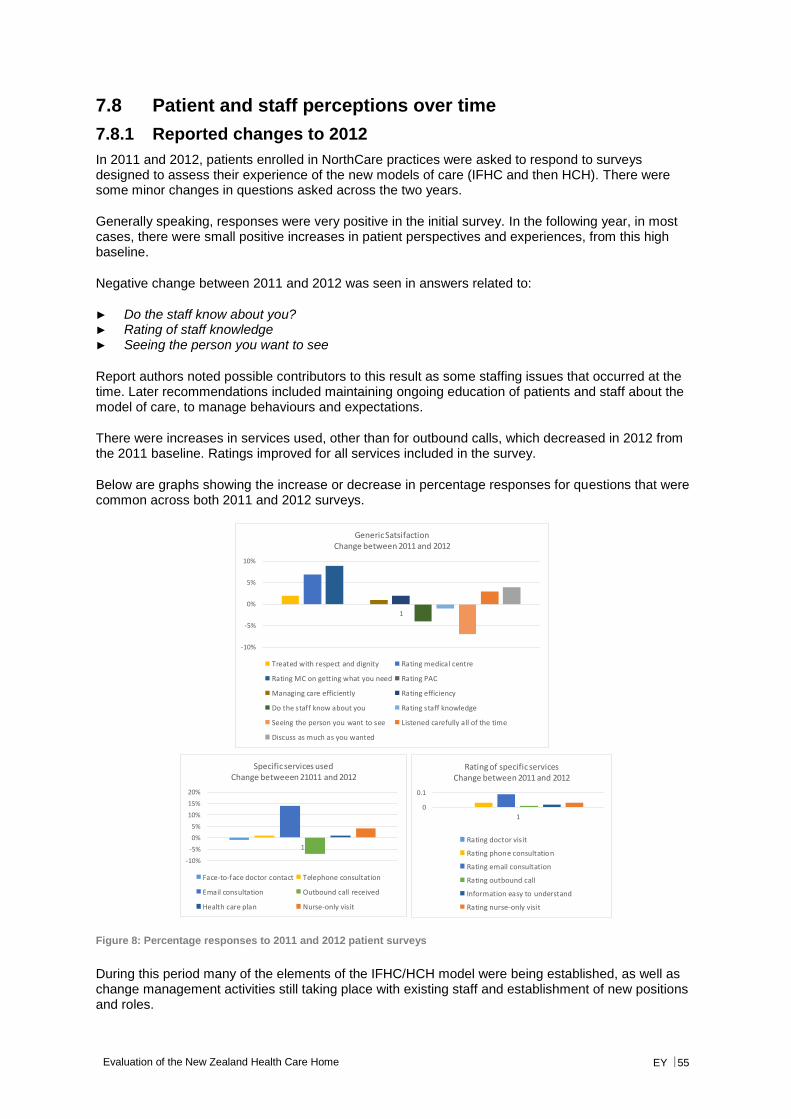
Evaluation of the New Zealand Health Care Home EY 55
7.8 Patient and staff perceptions over time
7.8.1 Reported changes to 2012
In 2011 and 2012, patients enrolled in NorthCare practices were asked to respond to surveys designed to assess their experience of the new models of care (IFHC and then HCH). There were some minor changes in questions asked across the two years.
Generally speaking, responses were very positive in the initial survey. In the following year, in most cases, there were small positive increases in patient perspectives and experiences, from this high baseline.
Negative change between 2011 and 2012 was seen in answers related to:
► Do the staff know about you? ► Rating of staff knowledge ► Seeing the person you want to see
Report authors noted possible contributors to this result as some staffing issues that occurred at the time. Later recommendations included maintaining ongoing education of patients and staff about the model of care, to manage behaviours and expectations.
There were increases in services used, other than for outbound calls, which decreased in 2012 from the 2011 baseline. Ratings improved for all services included in the survey.
Below are graphs showing the increase or decrease in percentage responses for questions that were common across both 2011 and 2012 surveys.
Figure 8: Percentage responses to 2011 and 2012 patient surveys
During this period many of the elements of the IFHC/HCH model were being established, as well as change management activities still taking place with existing staff and establishment of new positions and roles.
-10%
-5%
0%
5%
10%
1
Generic SatsifactionChange between 2011 and 2012
Treated with respect and dignity Rating medical centre
Rating MC on getting what you need Rating PAC
Managing care efficiently Rating efficiency
Do the staff know about you Rating staff knowledge
Seeing the person you want to see Listened carefully all of the time
Discuss as much as you wanted
-10%
-5%
0%
5%
10%
15%
20%
1
Specific services usedChange betweeen 21011 and 2012
Face-to-face doctor contact Telephone consultation
Email consultation Outbound call received
Health care plan Nurse-only visit
0
0.1
1
Rating of specific servicesChange between 2011 and 2012
Rating doctor visit
Rating phone consultation
Rating email consultation
Rating outbound call
Information easy to understand
Rating nurse-only visit
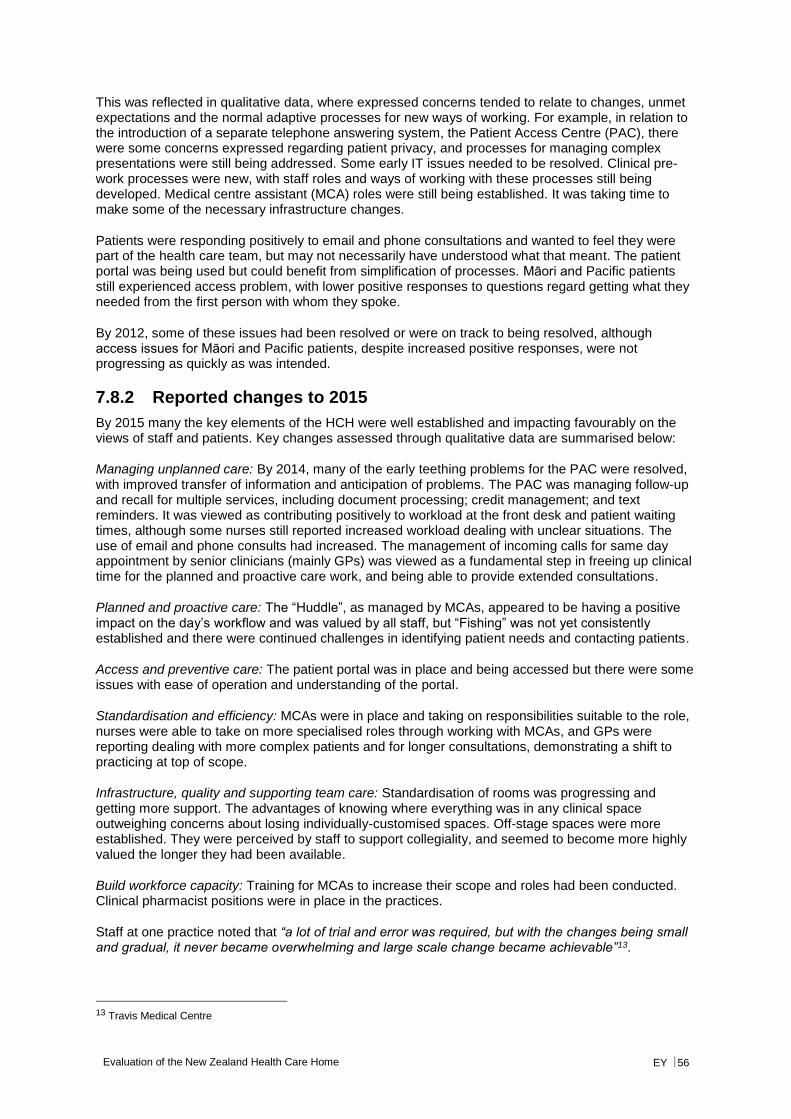
Evaluation of the New Zealand Health Care Home EY 56
This was reflected in qualitative data, where expressed concerns tended to relate to changes, unmet expectations and the normal adaptive processes for new ways of working. For example, in relation to the introduction of a separate telephone answering system, the Patient Access Centre (PAC), there were some concerns expressed regarding patient privacy, and processes for managing complex presentations were still being addressed. Some early IT issues needed to be resolved. Clinical pre-work processes were new, with staff roles and ways of working with these processes still being developed. Medical centre assistant (MCA) roles were still being established. It was taking time to make some of the necessary infrastructure changes.
Patients were responding positively to email and phone consultations and wanted to feel they were part of the health care team, but may not necessarily have understood what that meant. The patient portal was being used but could benefit from simplification of processes. Māori and Pacific patients still experienced access problem, with lower positive responses to questions regard getting what they needed from the first person with whom they spoke.
By 2012, some of these issues had been resolved or were on track to being resolved, although access issues for Māori and Pacific patients, despite increased positive responses, were not progressing as quickly as was intended.
7.8.2 Reported changes to 2015
By 2015 many the key elements of the HCH were well established and impacting favourably on the views of staff and patients. Key changes assessed through qualitative data are summarised below:
Managing unplanned care: By 2014, many of the early teething problems for the PAC were resolved, with improved transfer of information and anticipation of problems. The PAC was managing follow-up and recall for multiple services, including document processing; credit management; and text reminders. It was viewed as contributing positively to workload at the front desk and patient waiting times, although some nurses still reported increased workload dealing with unclear situations. The use of email and phone consults had increased. The management of incoming calls for same day appointment by senior clinicians (mainly GPs) was viewed as a fundamental step in freeing up clinical time for the planned and proactive care work, and being able to provide extended consultations.
Planned and proactive care: The “Huddle”, as managed by MCAs, appeared to be having a positive impact on the day’s workflow and was valued by all staff, but “Fishing” was not yet consistently established and there were continued challenges in identifying patient needs and contacting patients.
Access and preventive care: The patient portal was in place and being accessed but there were some issues with ease of operation and understanding of the portal.
Standardisation and efficiency: MCAs were in place and taking on responsibilities suitable to the role, nurses were able to take on more specialised roles through working with MCAs, and GPs were reporting dealing with more complex patients and for longer consultations, demonstrating a shift to practicing at top of scope.
Infrastructure, quality and supporting team care: Standardisation of rooms was progressing and getting more support. The advantages of knowing where everything was in any clinical space outweighing concerns about losing individually-customised spaces. Off-stage spaces were more established. They were perceived by staff to support collegiality, and seemed to become more highly valued the longer they had been available.
Build workforce capacity: Training for MCAs to increase their scope and roles had been conducted. Clinical pharmacist positions were in place in the practices.
Staff at one practice noted that “a lot of trial and error was required, but with the changes being small and gradual, it never became overwhelming and large scale change became achievable”13.
13 Travis Medical Centre
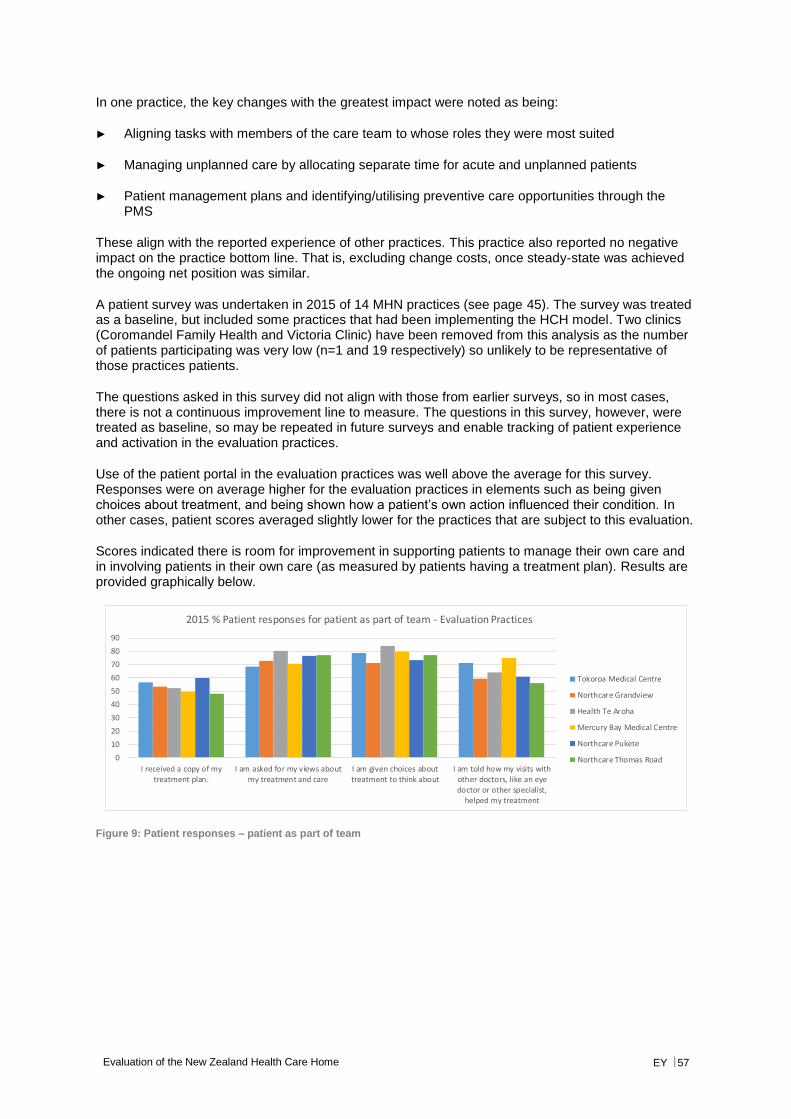
Evaluation of the New Zealand Health Care Home EY 57
In one practice, the key changes with the greatest impact were noted as being:
► Aligning tasks with members of the care team to whose roles they were most suited
► Managing unplanned care by allocating separate time for acute and unplanned patients
► Patient management plans and identifying/utilising preventive care opportunities through the PMS
These align with the reported experience of other practices. This practice also reported no negative impact on the practice bottom line. That is, excluding change costs, once steady-state was achieved the ongoing net position was similar.
A patient survey was undertaken in 2015 of 14 MHN practices (see page 45). The survey was treated as a baseline, but included some practices that had been implementing the HCH model. Two clinics (Coromandel Family Health and Victoria Clinic) have been removed from this analysis as the number of patients participating was very low (n=1 and 19 respectively) so unlikely to be representative of those practices patients.
The questions asked in this survey did not align with those from earlier surveys, so in most cases, there is not a continuous improvement line to measure. The questions in this survey, however, were treated as baseline, so may be repeated in future surveys and enable tracking of patient experience and activation in the evaluation practices.
Use of the patient portal in the evaluation practices was well above the average for this survey. Responses were on average higher for the evaluation practices in elements such as being given choices about treatment, and being shown how a patient’s own action influenced their condition. In other cases, patient scores averaged slightly lower for the practices that are subject to this evaluation.
Scores indicated there is room for improvement in supporting patients to manage their own care and in involving patients in their own care (as measured by patients having a treatment plan). Results are provided graphically below.
Figure 9: Patient responses – patient as part of team
0
10
20
30
40
50
60
70
80
90
I received a copy of mytreatment plan.
I am asked for my views aboutmy treatment and care
I am given choices abouttreatment to think about
I am told how my visits withother doctors, like an eyedoctor or other specialist,
helped my treatment
2015 % Patient responses for patient as part of team - Evaluation Practices
Tokoroa Medical Centre
Northcare Grandview
Health Te Aroha
Mercury Bay Medical Centre
Northcare Pukete
Northcare Thomas Road
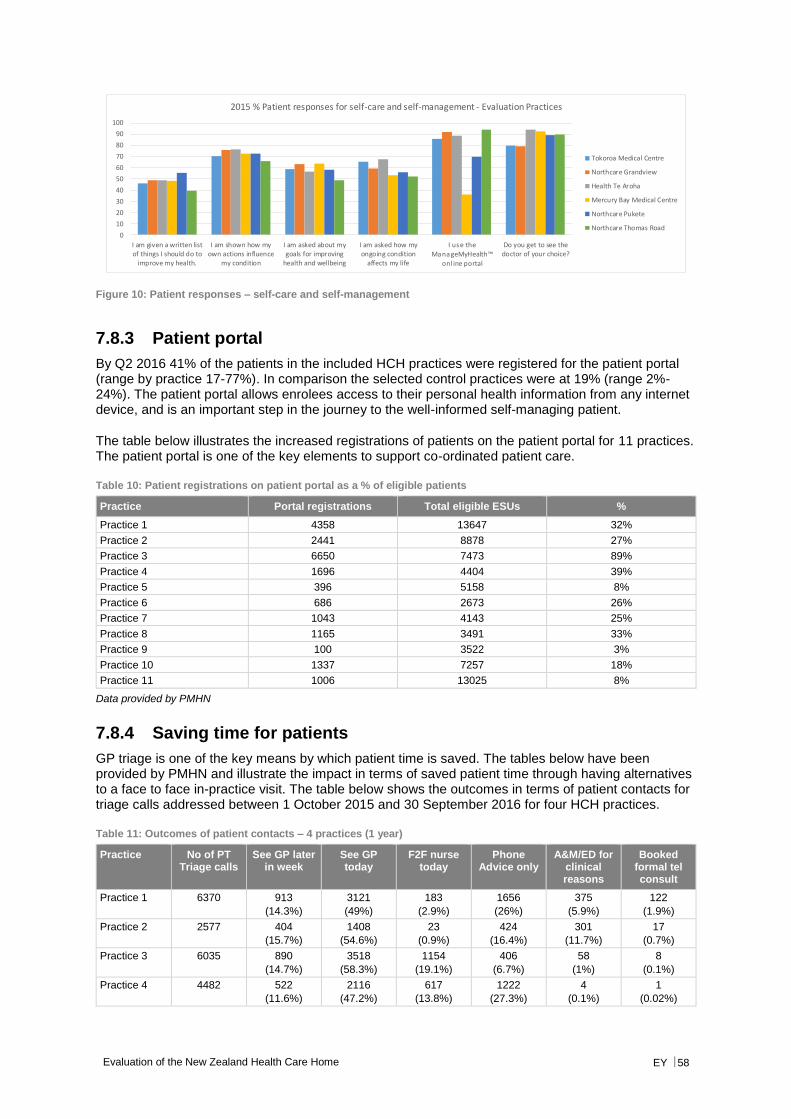
Evaluation of the New Zealand Health Care Home EY 58
Figure 10: Patient responses – self-care and self-management
7.8.3 Patient portal
By Q2 2016 41% of the patients in the included HCH practices were registered for the patient portal (range by practice 17-77%). In comparison the selected control practices were at 19% (range 2%-24%). The patient portal allows enrolees access to their personal health information from any internet device, and is an important step in the journey to the well-informed self-managing patient.
The table below illustrates the increased registrations of patients on the patient portal for 11 practices. The patient portal is one of the key elements to support co-ordinated patient care.
Table 10: Patient registrations on patient portal as a % of eligible patients
Practice Portal registrations Total eligible ESUs %
Practice 1 4358 13647 32%
Practice 2 2441 8878 27%
Practice 3 6650 7473 89%
Practice 4 1696 4404 39%
Practice 5 396 5158 8%
Practice 6 686 2673 26%
Practice 7 1043 4143 25%
Practice 8 1165 3491 33%
Practice 9 100 3522 3%
Practice 10 1337 7257 18%
Practice 11 1006 13025 8%
Data provided by PMHN
7.8.4 Saving time for patients
GP triage is one of the key means by which patient time is saved. The tables below have been provided by PMHN and illustrate the impact in terms of saved patient time through having alternatives to a face to face in-practice visit. The table below shows the outcomes in terms of patient contacts for triage calls addressed between 1 October 2015 and 30 September 2016 for four HCH practices.
Table 11: Outcomes of patient contacts – 4 practices (1 year)
Practice No of PT Triage calls
See GP later in week
See GP today
F2F nurse today
Phone Advice only
A&M/ED for clinical reasons
Booked formal tel consult
Practice 1 6370 913
(14.3%)
3121
(49%)
183
(2.9%)
1656
(26%)
375
(5.9%)
122
(1.9%)
Practice 2 2577 404
(15.7%)
1408
(54.6%)
23
(0.9%)
424
(16.4%)
301
(11.7%)
17
(0.7%)
Practice 3 6035 890
(14.7%)
3518
(58.3%)
1154
(19.1%)
406
(6.7%)
58
(1%)
8
(0.1%)
Practice 4 4482 522
(11.6%)
2116
(47.2%)
617
(13.8%)
1222
(27.3%)
4
(0.1%)
1
(0.02%)
0
10
20
30
40
50
60
70
80
90
100
I am given a written listof things I should do to
improve my health.
I am shown how myown actions influence
my condition
I am asked about mygoals for improving
health and wellbeing
I am asked how myongoing condition
affects my life
I use the ManageMyHealth™
onl ine portal
Do you get to see thedoctor of your choice?
2015 % Patient responses for self-care and self-management - Evaluation Practices
Tokoroa Medical Centre
Northcare Grandview
Health Te Aroha
Mercury Bay Medical Centre
Northcare Pukete
Northcare Thomas Road

Evaluation of the New Zealand Health Care Home EY 59
The table below translates these contacts into saved time for patients.
Table 12: Time saved for patients from triage and subsequent contacts – 4 practices (1 year)
Practice # Patients Different Experience
Patients avoiding surgery visit
Patients time saved (hrs)*
Patient time saved (weeks)**
Practice 1 2691
(42.2%)
1778 1778 44.45
Practice 2 845
(32.8)
441 441 10.1
Practice 3 1304
(21.6%)
414 414 10.4
Practice 4 1745
(38.9%)
1223 1223 30.5
*Assuming on average an hour is saved per patient **Assuming a 40-hour working week
The table below quantifies GP time saved though GP triage.
Table 13: GP time saved from triage and subsequent contacts – 4 practices (1 year)
Practice GP time saved with Ph advice (mins)*
GP time saved (hrs)
Average time saved/week (hrs)
Practice 1 16560 276 5.3
Practice 2 4240 70.7 1.36
Practice 3 4060 67.7 1.3
Practice 4 12,220 203.7 3.9
*Assuming 10 minutes saved on each consultation
7.8.5 Improving telephone access
All HCH practices identified a 18-25% call abandonment rate at peak times during the HCH modelling phase (this phenomenon is often invisible to practices unless specifically audited). However data reported for 2016 shows a substantial decrease in call abandonment rates for all participating practices. Reported call abandonment rates in 2016 varied from 1.59% to 7.73%. The PAC answered 294,087 calls across 10 PMHN sites (not all sites have been with PAC for the full year). Patients waited an average of 38 seconds for their call to be answered and 4.5% of calls were abandoned at peak times.
7.8.6 Improving staff experience
The HCH aims to improve the working life of the professionals working in the practice, addressing some of the dissatisfiers in general practice as it currently operates. An example of a small practice response to the HCH model was provided to the evaluators and can be accessed at: http://www.healthcarehome.co.nz/case-studies/hauraki-plains-health-centre-path/. In this example a GP in a small practice describes how he believes the HCH model will make the difference between his staying in the practice and leaving it.
7.9 Access and equity
In 2011 a higher proportion of Māori and Pacific respondents received an outbound call than non-Māori and Pacific respondents (39% vs 31%). The percentage of respondents receiving an outbound call in 2012 was higher for Māori and Pacific at 40%.
The percentage of respondents reporting a phone consult with a doctor in 2011 was also higher among Māori and Pacific (43% vs 31%). In 2012, the percentage of respondents with a telephone consultation with a doctor or nurse had increased for Māori and Pacific at 44%.
In 2011 the percentage of respondents saying they had a face-to-face visit with a doctor in the last six months was lower among Māori and Pacific (86% vs 93%). In 2012 this had changed and the percentage of respondents with a doctor visit was higher for Māori and Pacific (98% vs 91%). Practice
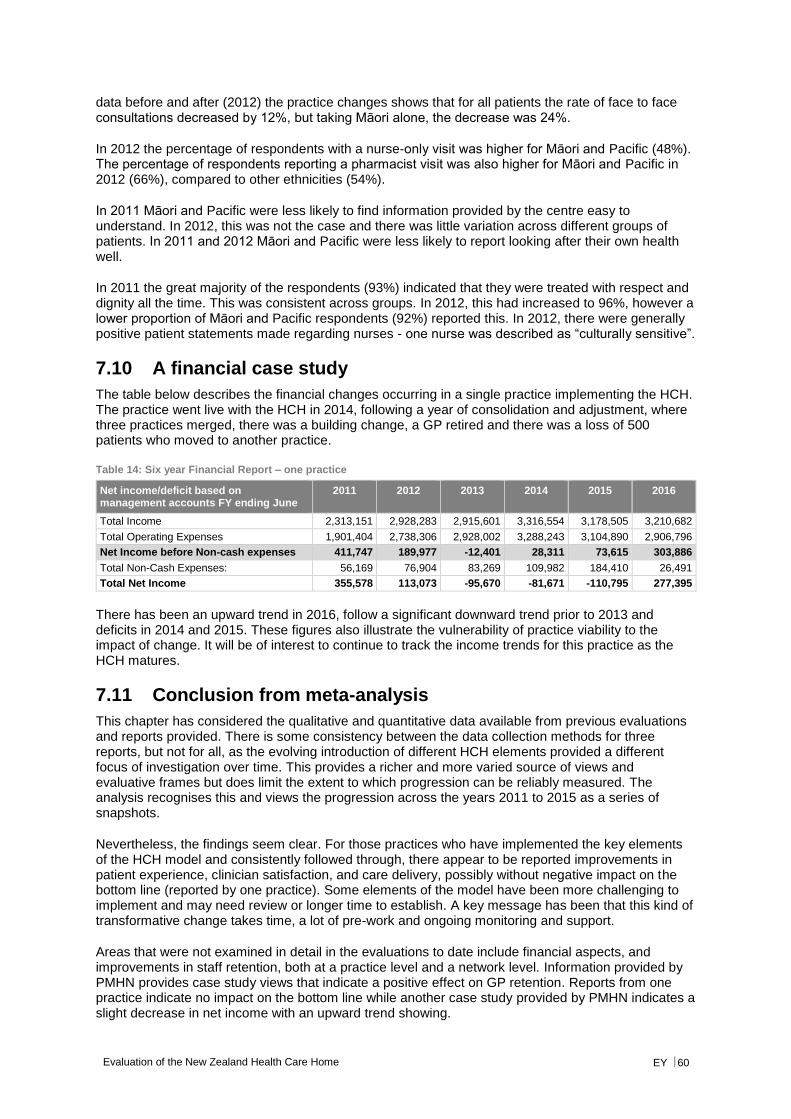
Evaluation of the New Zealand Health Care Home EY 60
data before and after (2012) the practice changes shows that for all patients the rate of face to face consultations decreased by 12%, but taking Māori alone, the decrease was 24%.
In 2012 the percentage of respondents with a nurse-only visit was higher for Māori and Pacific (48%). The percentage of respondents reporting a pharmacist visit was also higher for Māori and Pacific in 2012 (66%), compared to other ethnicities (54%).
In 2011 Māori and Pacific were less likely to find information provided by the centre easy to understand. In 2012, this was not the case and there was little variation across different groups of patients. In 2011 and 2012 Māori and Pacific were less likely to report looking after their own health well.
In 2011 the great majority of the respondents (93%) indicated that they were treated with respect and dignity all the time. This was consistent across groups. In 2012, this had increased to 96%, however a lower proportion of Māori and Pacific respondents (92%) reported this. In 2012, there were generally positive patient statements made regarding nurses - one nurse was described as “culturally sensitive”.
7.10 A financial case study
The table below describes the financial changes occurring in a single practice implementing the HCH. The practice went live with the HCH in 2014, following a year of consolidation and adjustment, where three practices merged, there was a building change, a GP retired and there was a loss of 500 patients who moved to another practice.
Table 14: Six year Financial Report – one practice
Net income/deficit based on management accounts FY ending June
2011 2012 2013 2014 2015 2016
Total Income 2,313,151 2,928,283 2,915,601 3,316,554 3,178,505 3,210,682
Total Operating Expenses 1,901,404 2,738,306 2,928,002 3,288,243 3,104,890 2,906,796
Net Income before Non-cash expenses 411,747 189,977 -12,401 28,311 73,615 303,886
Total Non-Cash Expenses: 56,169 76,904 83,269 109,982 184,410 26,491
Total Net Income 355,578 113,073 -95,670 -81,671 -110,795 277,395
There has been an upward trend in 2016, follow a significant downward trend prior to 2013 and deficits in 2014 and 2015. These figures also illustrate the vulnerability of practice viability to the impact of change. It will be of interest to continue to track the income trends for this practice as the HCH matures.
7.11 Conclusion from meta-analysis
This chapter has considered the qualitative and quantitative data available from previous evaluations and reports provided. There is some consistency between the data collection methods for three reports, but not for all, as the evolving introduction of different HCH elements provided a different focus of investigation over time. This provides a richer and more varied source of views and evaluative frames but does limit the extent to which progression can be reliably measured. The analysis recognises this and views the progression across the years 2011 to 2015 as a series of snapshots.
Nevertheless, the findings seem clear. For those practices who have implemented the key elements of the HCH model and consistently followed through, there appear to be reported improvements in patient experience, clinician satisfaction, and care delivery, possibly without negative impact on the bottom line (reported by one practice). Some elements of the model have been more challenging to implement and may need review or longer time to establish. A key message has been that this kind of transformative change takes time, a lot of pre-work and ongoing monitoring and support.
Areas that were not examined in detail in the evaluations to date include financial aspects, and improvements in staff retention, both at a practice level and a network level. Information provided by PMHN provides case study views that indicate a positive effect on GP retention. Reports from one practice indicate no impact on the bottom line while another case study provided by PMHN indicates a slight decrease in net income with an upward trend showing.

Evaluation of the New Zealand Health Care Home EY 61
8. Quantitative analysis
This chapter describes the results of a quantitative analysis of activity data that might be affected by the HCH and data on practice activity provided through the PMHN.
8.1 Summary
An analysis was undertaken of the data held in the New Zealand National Collections to assess the potential impacts of the HCH model on secondary care utilisation. Changes in patient enrolment numbers were also noted together with data on practice activity changes. Practice level data provided by PMHN was also examined. Areas covered included:
► Patient enrolments ► Patient touches ► ED usage ► Hospitalisation rates ► Bed day rates ► Outpatient attendances ► Outpatient DNA rates
Key findings include:
► A wide range of practice styles and types are represented in the HCH practices included in this quantitative analysis. In 2015 practice sizes ranged from 4,000 to 10,000, average deprivation levels 4 to 8 and proportion of Māori or Pacific enrolees from 10 to 50%. Geographically two practices were in Hamilton, three in rural Waikato, and one in Christchurch.
► While control practices were relatively close in size and geography to the HCH practices they had fewer Māori and Pacific enrolees on average, and were less deprived than their HCH counterparts. HCH practices had more children aged 0-14 and fewer enrolees aged 75+ than controls, but moved closer over the course of the study period.
► Overall enrolled patient numbers remained steady across HCH implementation, with a low turnover of 3-4% per quarter. If anything retention improved during the implementation period. Some practices had closed books for a time as a change management controlling response, so increases in enrolments were not expected.
► Improvements to the patient experience focused on: saving patient time through improved triaging and reduced face to face visits; improving telephone access (PAC for PMHN practices) as illustrated by lower levels of call abandonment; and improving and standardising co-ordinated proactive care. Over 12 months, one practice estimated a saving of 44.45 weeks of patient time, through effective GP triaging and offering alternatives to face to face care in the surgery.
► Two practices reported in 2012 an increase in patient consultations. There was a 12% increase in patient touches between 2010 and 2015, notably in virtual consultations. This occurred at the same time as a decrease in GP and nursing FTE, demonstrating increased capacity.
► In Q2 2016 41% of the patients in the included HCH practices were registered for the patient portal (range 17-77%). By comparison, the selected control practices were at 19% (range 2%-24%).
► Little difference in secondary care utilisation was evident in comparing HCH and control practices:
► For non-admitted ED attendances, after removing an outlier practice HCHs had a small non-significant rise, while the relevant controls showed a significant rise.
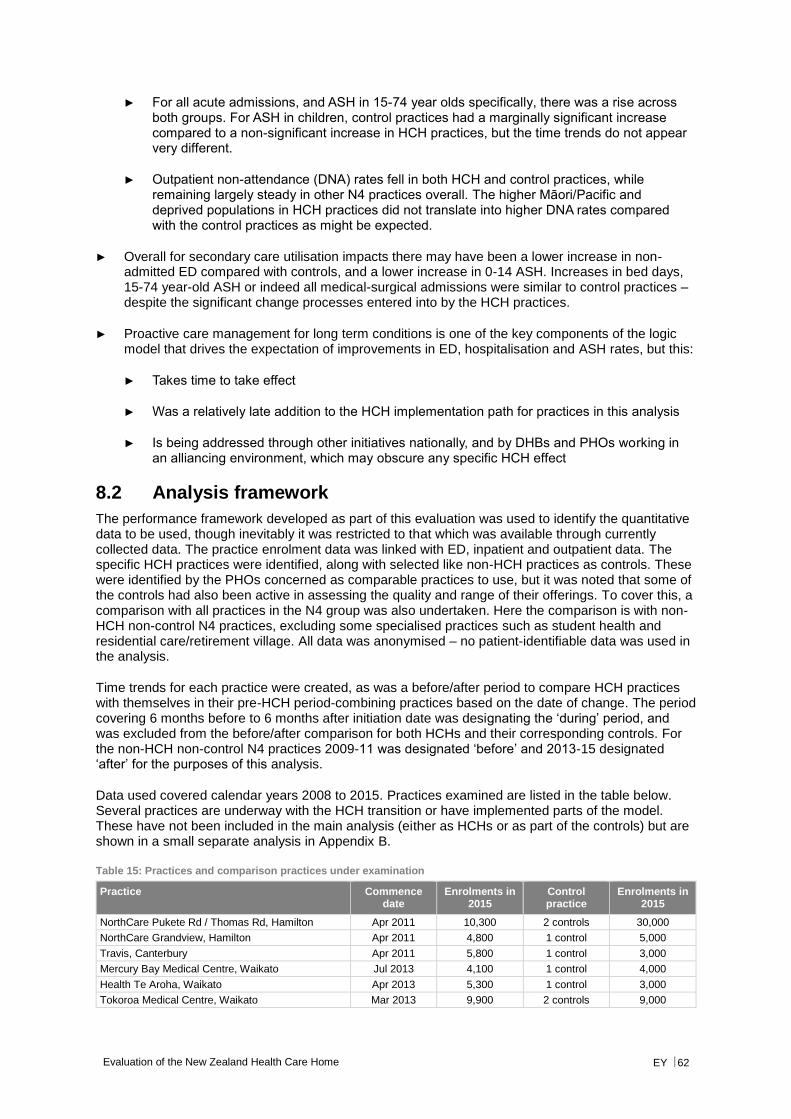
Evaluation of the New Zealand Health Care Home EY 62
► For all acute admissions, and ASH in 15-74 year olds specifically, there was a rise across both groups. For ASH in children, control practices had a marginally significant increase compared to a non-significant increase in HCH practices, but the time trends do not appear very different.
► Outpatient non-attendance (DNA) rates fell in both HCH and control practices, while remaining largely steady in other N4 practices overall. The higher Māori/Pacific and deprived populations in HCH practices did not translate into higher DNA rates compared with the control practices as might be expected.
► Overall for secondary care utilisation impacts there may have been a lower increase in non-admitted ED compared with controls, and a lower increase in 0-14 ASH. Increases in bed days, 15-74 year-old ASH or indeed all medical-surgical admissions were similar to control practices – despite the significant change processes entered into by the HCH practices.
► Proactive care management for long term conditions is one of the key components of the logic model that drives the expectation of improvements in ED, hospitalisation and ASH rates, but this:
► Takes time to take effect
► Was a relatively late addition to the HCH implementation path for practices in this analysis
► Is being addressed through other initiatives nationally, and by DHBs and PHOs working in an alliancing environment, which may obscure any specific HCH effect
8.2 Analysis framework
The performance framework developed as part of this evaluation was used to identify the quantitative data to be used, though inevitably it was restricted to that which was available through currently collected data. The practice enrolment data was linked with ED, inpatient and outpatient data. The specific HCH practices were identified, along with selected like non-HCH practices as controls. These were identified by the PHOs concerned as comparable practices to use, but it was noted that some of the controls had also been active in assessing the quality and range of their offerings. To cover this, a comparison with all practices in the N4 group was also undertaken. Here the comparison is with non-HCH non-control N4 practices, excluding some specialised practices such as student health and residential care/retirement village. All data was anonymised – no patient-identifiable data was used in the analysis.
Time trends for each practice were created, as was a before/after period to compare HCH practices with themselves in their pre-HCH period-combining practices based on the date of change. The period covering 6 months before to 6 months after initiation date was designating the ‘during’ period, and was excluded from the before/after comparison for both HCHs and their corresponding controls. For the non-HCH non-control N4 practices 2009-11 was designated ‘before’ and 2013-15 designated ‘after’ for the purposes of this analysis.
Data used covered calendar years 2008 to 2015. Practices examined are listed in the table below. Several practices are underway with the HCH transition or have implemented parts of the model. These have not been included in the main analysis (either as HCHs or as part of the controls) but are shown in a small separate analysis in Appendix B.
Table 15: Practices and comparison practices under examination
Practice Commence date
Enrolments in 2015
Control practice
Enrolments in 2015
NorthCare Pukete Rd / Thomas Rd, Hamilton Apr 2011 10,300 2 controls 30,000
NorthCare Grandview, Hamilton Apr 2011 4,800 1 control 5,000
Travis, Canterbury Apr 2011 5,800 1 control 3,000
Mercury Bay Medical Centre, Waikato Jul 2013 4,100 1 control 4,000
Health Te Aroha, Waikato Apr 2013 5,300 1 control 3,000
Tokoroa Medical Centre, Waikato Mar 2013 9,900 2 controls 9,000

Evaluation of the New Zealand Health Care Home EY 63
Practice Commence date
Enrolments in 2015
Control practice
Enrolments in 2015
Other practices with partial implementations
Clendon Medical Centre, Auckland 8,650
Otara Family & Christian Health Centre, Auckland 8,600
Pukekohe Family Health Care, Waikato 19,100
Turuki Healthcare, Auckland 5,300
Newlands Medical Centre, Wellington 9,200
Hora te Pai, Wellington 2,900
8.2.1 Analysis limitations
This analysis is of an ‘open cohort’, with the practice populations changing each quarter. The analysis takes the population registered at the practice at the start of each quarter and checks the utilisation for that quarter. This relies on the changes in the population from quarter to quarter to be basically random; that is not changing the utilisation risk. Any tendency for this not to be random, for example if more complex patients differentially enrolled/switched to HCH practices, then the utilisation data might be skewed. No risk adjustment was undertaken for this analysis.
Another issue to note is the ‘commence date’ used to generate the before/after analyses. As has come through the qualitative work, and shown through the HCH implementation tool, the change management process around moving to the HCH model takes considerable time. While practices may have started changes in 2010 to ‘go live’ in 2011, they continue adapting and changing, and bringing in new elements over the following years. Pragmatically we show the changes here based on the official ‘go live’ dates, but the varying implementation paths and timings will soften measurement of the impacts of the changes that might accrue in terms of the full HCH model. For example, many of the more proactive care components of the model only came on line more latterly once time was freed up from acute call management and response. It is this improved care of chronic conditions that is one of the key components of the logic model that drives the expectation of improvements in ED, hospitalisation and ASH rates, but this might be expected to appear at a later stage.
Practices close to the HCH practices geographically and in size have been selected as controls. However the controls themselves have not been standing still. There has been significant PHO and DHB activity over the past five years (and longer) around chronic care management, ED diversion and improvements in integration, which might be expected to impact on both HCH and controls. These changes cannot be easily disentangled from any changes due to HCH implementation.
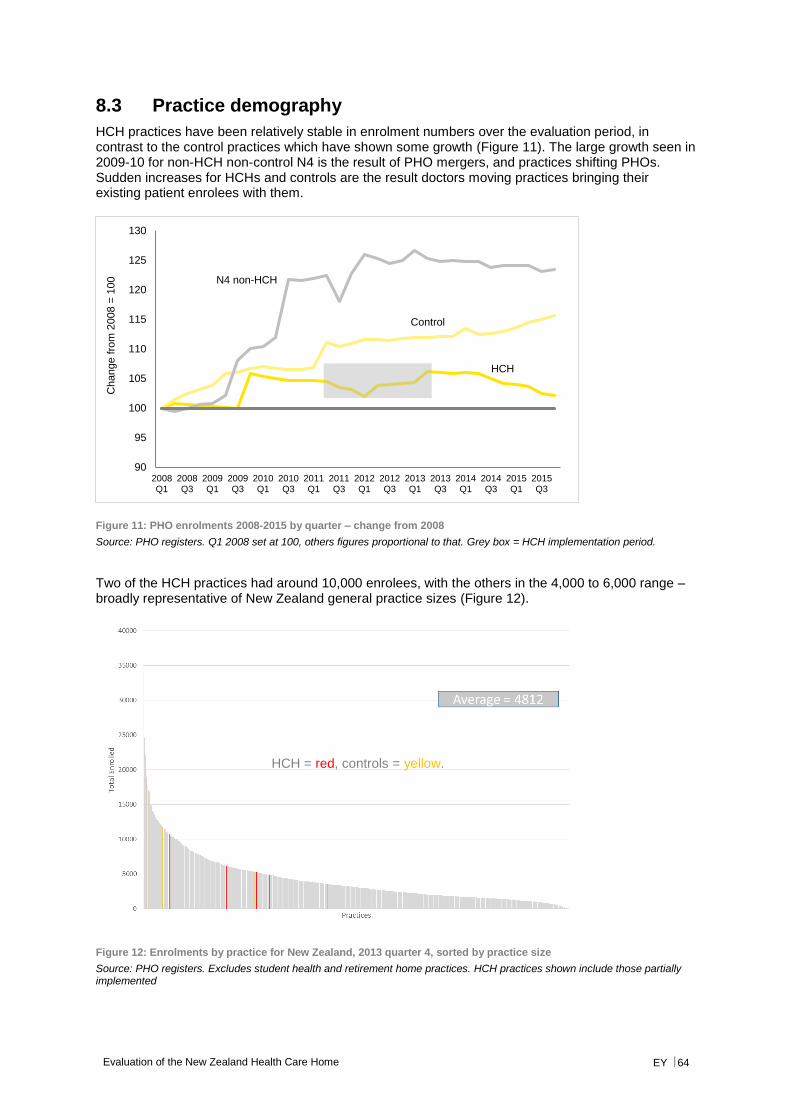
Evaluation of the New Zealand Health Care Home EY 64
8.3 Practice demography
HCH practices have been relatively stable in enrolment numbers over the evaluation period, in contrast to the control practices which have shown some growth (Figure 11). The large growth seen in 2009-10 for non-HCH non-control N4 is the result of PHO mergers, and practices shifting PHOs. Sudden increases for HCHs and controls are the result doctors moving practices bringing their existing patient enrolees with them.
Figure 11: PHO enrolments 2008-2015 by quarter – change from 2008
Source: PHO registers. Q1 2008 set at 100, others figures proportional to that. Grey box = HCH implementation period.
Two of the HCH practices had around 10,000 enrolees, with the others in the 4,000 to 6,000 range – broadly representative of New Zealand general practice sizes (Figure 12).
Figure 12: Enrolments by practice for New Zealand, 2013 quarter 4, sorted by practice size
Source: PHO registers. Excludes student health and retirement home practices. HCH practices shown include those partially implemented
HCH
Control
N4 non-HCH
90
95
100
105
110
115
120
125
130
2008Q1
2008Q3
2009Q1
2009Q3
2010Q1
2010Q3
2011Q1
2011Q3
2012Q1
2012Q3
2013Q1
2013Q3
2014Q1
2014Q3
2015Q1
2015Q3
Change f
rom
2008 =
100
HCH = red, controls = yellow.
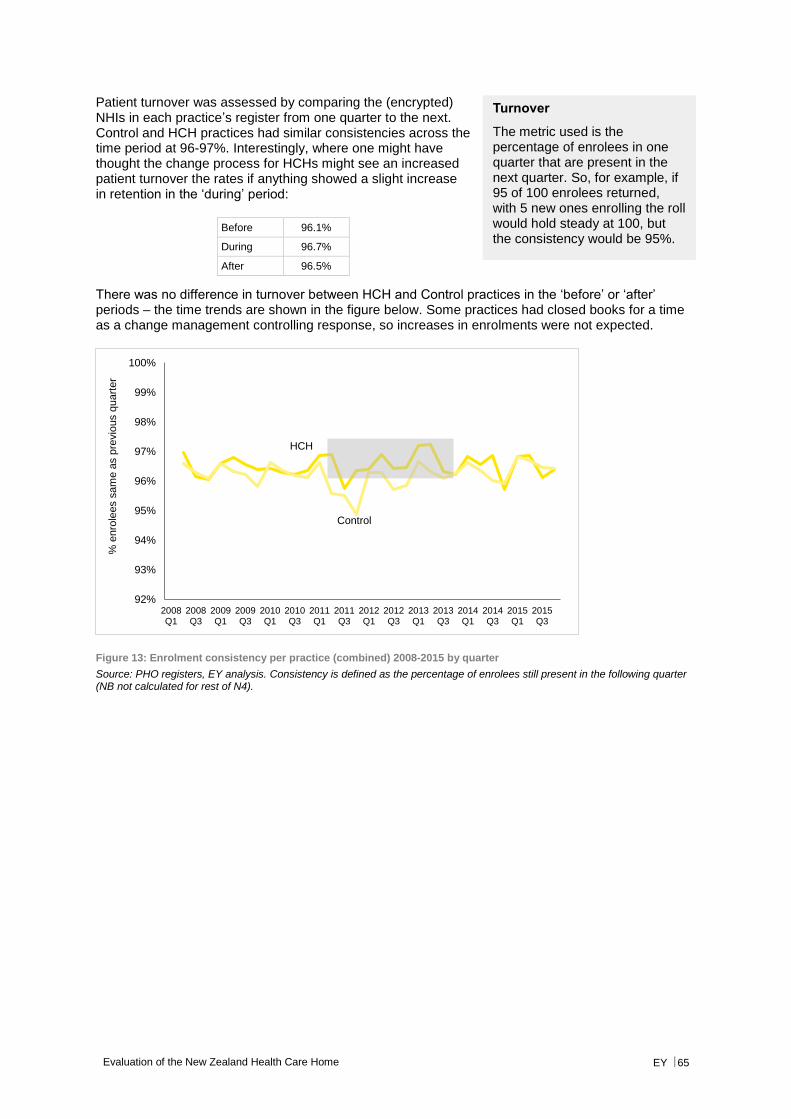
Evaluation of the New Zealand Health Care Home EY 65
Patient turnover was assessed by comparing the (encrypted) NHIs in each practice’s register from one quarter to the next. Control and HCH practices had similar consistencies across the time period at 96-97%. Interestingly, where one might have thought the change process for HCHs might see an increased patient turnover the rates if anything showed a slight increase in retention in the ‘during’ period:
Before 96.1%
During 96.7%
After 96.5%
There was no difference in turnover between HCH and Control practices in the ‘before’ or ‘after’ periods – the time trends are shown in the figure below. Some practices had closed books for a time as a change management controlling response, so increases in enrolments were not expected.
Figure 13: Enrolment consistency per practice (combined) 2008-2015 by quarter
Source: PHO registers, EY analysis. Consistency is defined as the percentage of enrolees still present in the following quarter (NB not calculated for rest of N4).
HCH
Control
92%
93%
94%
95%
96%
97%
98%
99%
100%
2008Q1
2008Q3
2009Q1
2009Q3
2010Q1
2010Q3
2011Q1
2011Q3
2012Q1
2012Q3
2013Q1
2013Q3
2014Q1
2014Q3
2015Q1
2015Q3
% e
nro
lees s
am
e a
s p
revio
us q
uart
er
Turnover
The metric used is the percentage of enrolees in one quarter that are present in the next quarter. So, for example, if 95 of 100 enrolees returned, with 5 new ones enrolling the roll would hold steady at 100, but the consistency would be 95%.
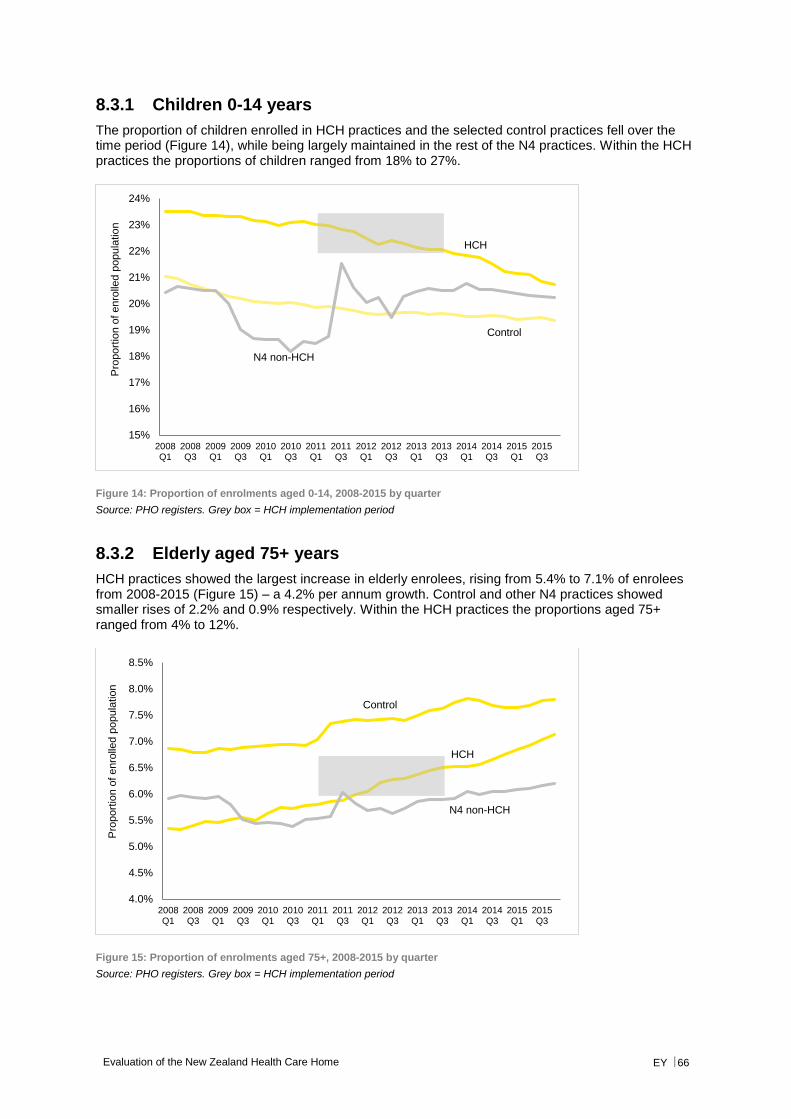
Evaluation of the New Zealand Health Care Home EY 66
8.3.1 Children 0-14 years
The proportion of children enrolled in HCH practices and the selected control practices fell over the time period (Figure 14), while being largely maintained in the rest of the N4 practices. Within the HCH practices the proportions of children ranged from 18% to 27%.
Figure 14: Proportion of enrolments aged 0-14, 2008-2015 by quarter
Source: PHO registers. Grey box = HCH implementation period
8.3.2 Elderly aged 75+ years
HCH practices showed the largest increase in elderly enrolees, rising from 5.4% to 7.1% of enrolees from 2008-2015 (Figure 15) – a 4.2% per annum growth. Control and other N4 practices showed smaller rises of 2.2% and 0.9% respectively. Within the HCH practices the proportions aged 75+ ranged from 4% to 12%.
Figure 15: Proportion of enrolments aged 75+, 2008-2015 by quarter
Source: PHO registers. Grey box = HCH implementation period
HCH
Control
N4 non-HCH
15%
16%
17%
18%
19%
20%
21%
22%
23%
24%
2008Q1
2008Q3
2009Q1
2009Q3
2010Q1
2010Q3
2011Q1
2011Q3
2012Q1
2012Q3
2013Q1
2013Q3
2014Q1
2014Q3
2015Q1
2015Q3
Pro
port
ion o
f enro
lled p
opula
tio
n
HCH
Control
N4 non-HCH
4.0%
4.5%
5.0%
5.5%
6.0%
6.5%
7.0%
7.5%
8.0%
8.5%
2008Q1
2008Q3
2009Q1
2009Q3
2010Q1
2010Q3
2011Q1
2011Q3
2012Q1
2012Q3
2013Q1
2013Q3
2014Q1
2014Q3
2015Q1
2015Q3
Pro
port
ion o
f enro
lled p
opula
tio
n
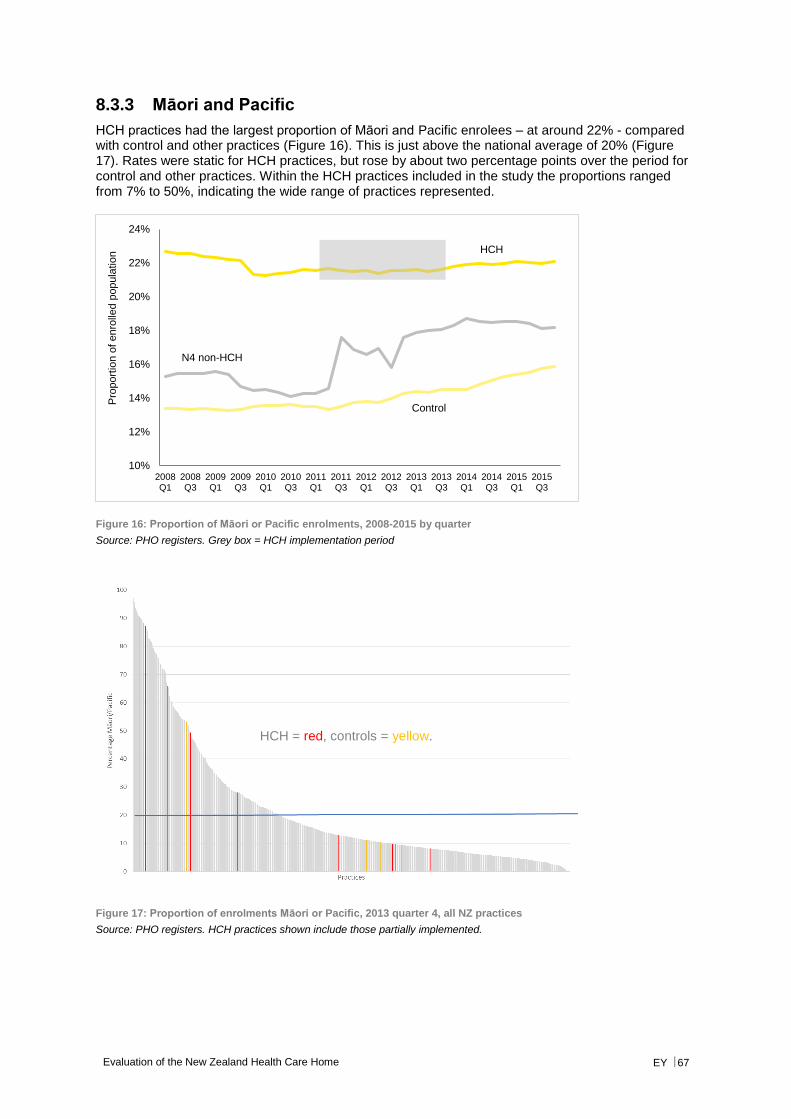
Evaluation of the New Zealand Health Care Home EY 67
8.3.3 Māori and Pacific
HCH practices had the largest proportion of Māori and Pacific enrolees – at around 22% - compared with control and other practices (Figure 16). This is just above the national average of 20% (Figure 17). Rates were static for HCH practices, but rose by about two percentage points over the period for control and other practices. Within the HCH practices included in the study the proportions ranged from 7% to 50%, indicating the wide range of practices represented.
Figure 16: Proportion of Māori or Pacific enrolments, 2008-2015 by quarter
Source: PHO registers. Grey box = HCH implementation period
Figure 17: Proportion of enrolments Māori or Pacific, 2013 quarter 4, all NZ practices
Source: PHO registers. HCH practices shown include those partially implemented.
HCH
Control
N4 non-HCH
10%
12%
14%
16%
18%
20%
22%
24%
2008Q1
2008Q3
2009Q1
2009Q3
2010Q1
2010Q3
2011Q1
2011Q3
2012Q1
2012Q3
2013Q1
2013Q3
2014Q1
2014Q3
2015Q1
2015Q3
Pro
port
ion o
f enro
lled p
opula
tio
n
HCH = red, controls = yellow.
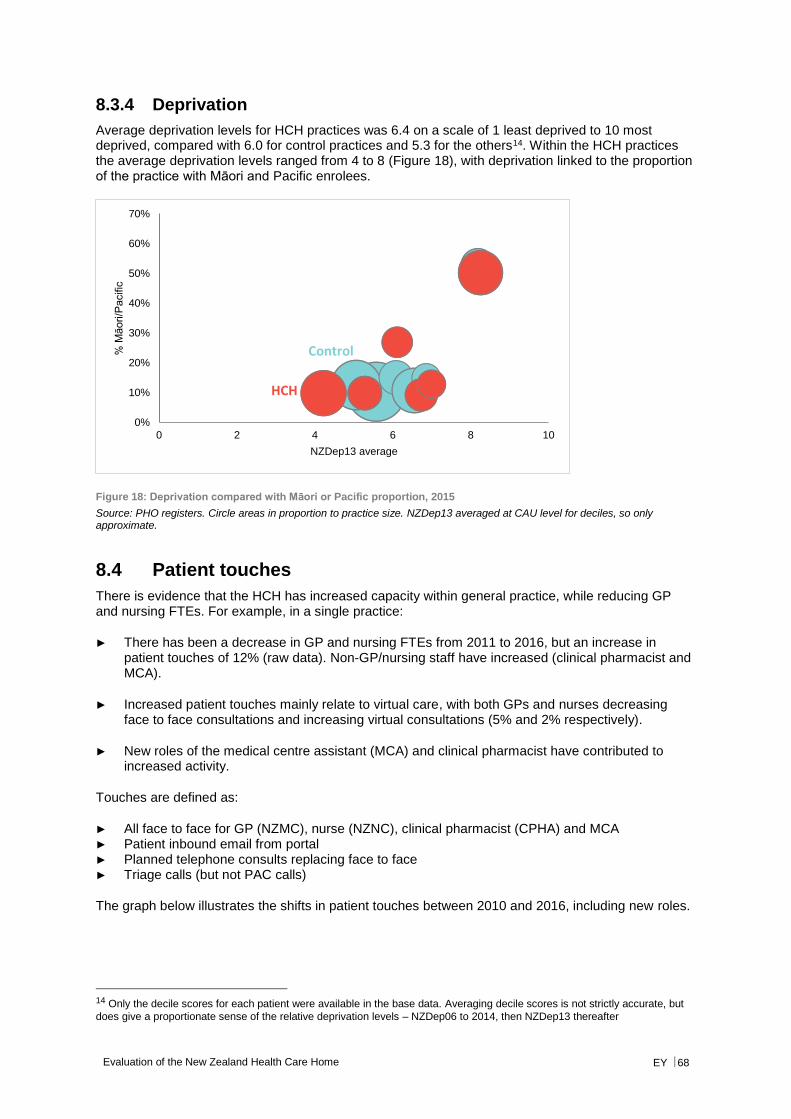
Evaluation of the New Zealand Health Care Home EY 68
8.3.4 Deprivation
Average deprivation levels for HCH practices was 6.4 on a scale of 1 least deprived to 10 most deprived, compared with 6.0 for control practices and 5.3 for the others14. Within the HCH practices the average deprivation levels ranged from 4 to 8 (Figure 18), with deprivation linked to the proportion of the practice with Māori and Pacific enrolees.
Figure 18: Deprivation compared with Māori or Pacific proportion, 2015
Source: PHO registers. Circle areas in proportion to practice size. NZDep13 averaged at CAU level for deciles, so only approximate.
8.4 Patient touches
There is evidence that the HCH has increased capacity within general practice, while reducing GP and nursing FTEs. For example, in a single practice:
► There has been a decrease in GP and nursing FTEs from 2011 to 2016, but an increase in patient touches of 12% (raw data). Non-GP/nursing staff have increased (clinical pharmacist and MCA).
► Increased patient touches mainly relate to virtual care, with both GPs and nurses decreasing face to face consultations and increasing virtual consultations (5% and 2% respectively).
► New roles of the medical centre assistant (MCA) and clinical pharmacist have contributed to increased activity.
Touches are defined as:
► All face to face for GP (NZMC), nurse (NZNC), clinical pharmacist (CPHA) and MCA ► Patient inbound email from portal ► Planned telephone consults replacing face to face ► Triage calls (but not PAC calls)
The graph below illustrates the shifts in patient touches between 2010 and 2016, including new roles.
14 Only the decile scores for each patient were available in the base data. Averaging decile scores is not strictly accurate, but
does give a proportionate sense of the relative deprivation levels – NZDep06 to 2014, then NZDep13 thereafter
0%
10%
20%
30%
40%
50%
60%
70%
0 2 4 6 8 10
% M
āori/P
acific
NZDep13 average
HCH
Control
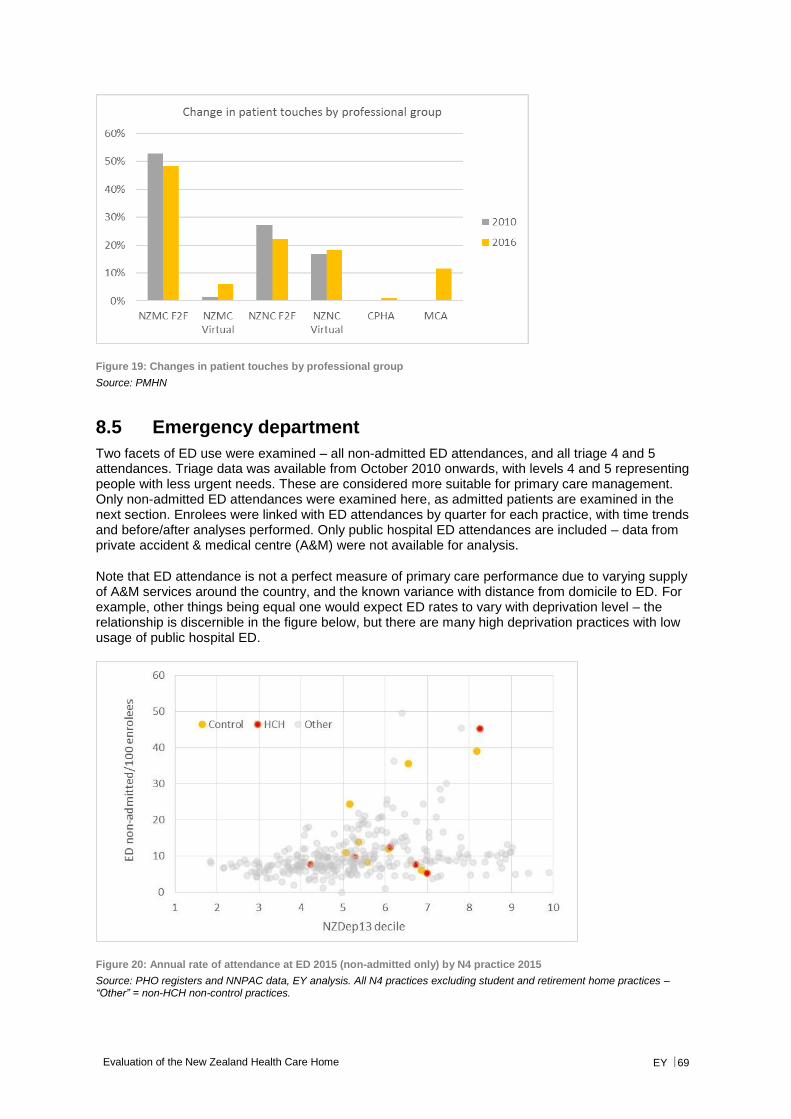
Evaluation of the New Zealand Health Care Home EY 69
Figure 19: Changes in patient touches by professional group
Source: PMHN
8.5 Emergency department
Two facets of ED use were examined – all non-admitted ED attendances, and all triage 4 and 5 attendances. Triage data was available from October 2010 onwards, with levels 4 and 5 representing people with less urgent needs. These are considered more suitable for primary care management. Only non-admitted ED attendances were examined here, as admitted patients are examined in the next section. Enrolees were linked with ED attendances by quarter for each practice, with time trends and before/after analyses performed. Only public hospital ED attendances are included – data from private accident & medical centre (A&M) were not available for analysis.
Note that ED attendance is not a perfect measure of primary care performance due to varying supply of A&M services around the country, and the known variance with distance from domicile to ED. For example, other things being equal one would expect ED rates to vary with deprivation level – the relationship is discernible in the figure below, but there are many high deprivation practices with low usage of public hospital ED.
Figure 20: Annual rate of attendance at ED 2015 (non-admitted only) by N4 practice 2015
Source: PHO registers and NNPAC data, EY analysis. All N4 practices excluding student and retirement home practices – “Other” = non-HCH non-control practices.
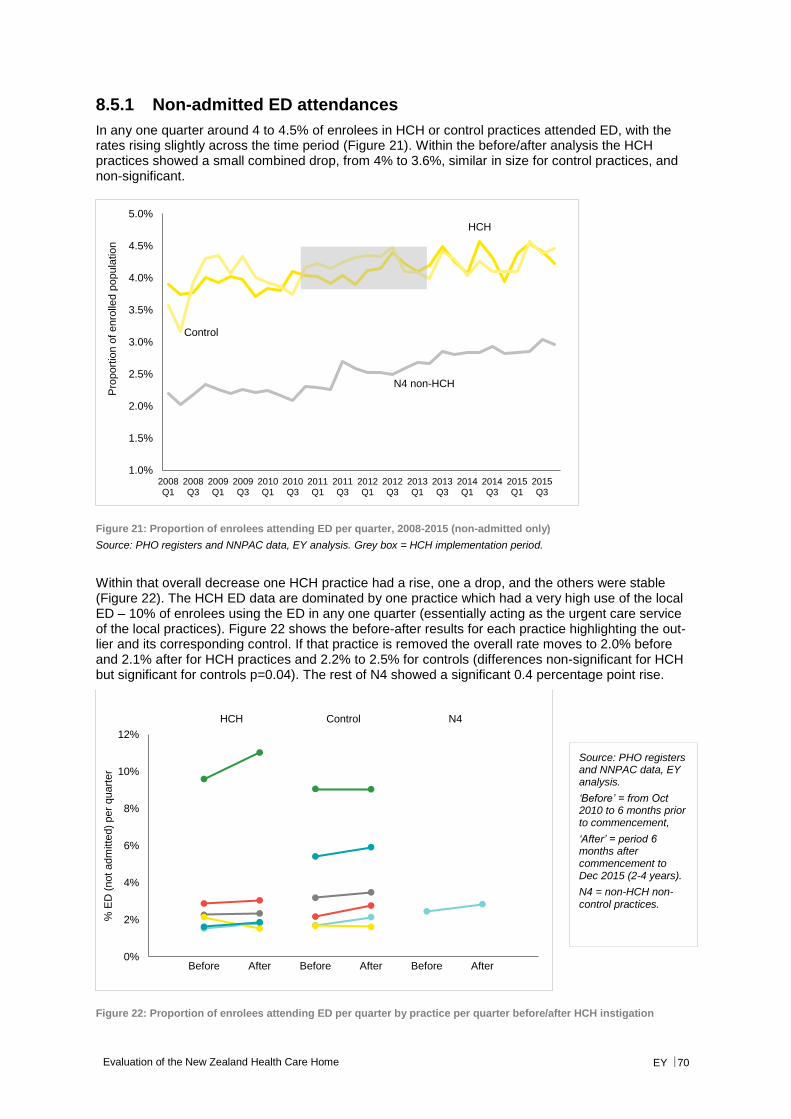
Evaluation of the New Zealand Health Care Home EY 70
8.5.1 Non-admitted ED attendances
In any one quarter around 4 to 4.5% of enrolees in HCH or control practices attended ED, with the rates rising slightly across the time period (Figure 21). Within the before/after analysis the HCH practices showed a small combined drop, from 4% to 3.6%, similar in size for control practices, and non-significant.
Figure 21: Proportion of enrolees attending ED per quarter, 2008-2015 (non-admitted only)
Source: PHO registers and NNPAC data, EY analysis. Grey box = HCH implementation period.
Within that overall decrease one HCH practice had a rise, one a drop, and the others were stable (Figure 22). The HCH ED data are dominated by one practice which had a very high use of the local ED – 10% of enrolees using the ED in any one quarter (essentially acting as the urgent care service of the local practices). Figure 22 shows the before-after results for each practice highlighting the out-lier and its corresponding control. If that practice is removed the overall rate moves to 2.0% before and 2.1% after for HCH practices and 2.2% to 2.5% for controls (differences non-significant for HCH but significant for controls p=0.04). The rest of N4 showed a significant 0.4 percentage point rise.
Figure 22: Proportion of enrolees attending ED per quarter by practice per quarter before/after HCH instigation
HCH
Control
N4 non-HCH
1.0%
1.5%
2.0%
2.5%
3.0%
3.5%
4.0%
4.5%
5.0%
2008Q1
2008Q3
2009Q1
2009Q3
2010Q1
2010Q3
2011Q1
2011Q3
2012Q1
2012Q3
2013Q1
2013Q3
2014Q1
2014Q3
2015Q1
2015Q3
Pro
port
ion o
f enro
lled p
opula
tio
n
0%
2%
4%
6%
8%
10%
12%
% E
D (
not adm
itte
d)
per
quart
er
Before After Before After Before After
HCH Control N4
Source: PHO registers and NNPAC data, EY analysis.
‘Before’ = from Oct 2010 to 6 months prior to commencement,
‘After’ = period 6 months after commencement to Dec 2015 (2-4 years).
N4 = non-HCH non-control practices.
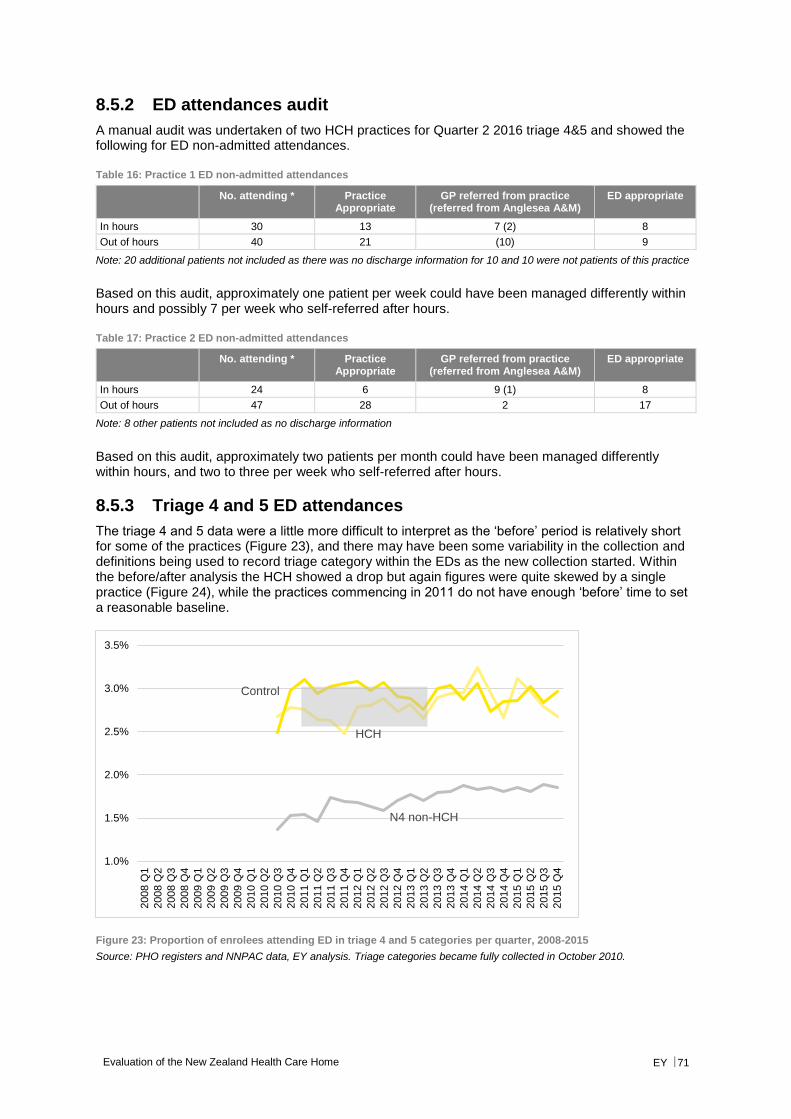
Evaluation of the New Zealand Health Care Home EY 71
8.5.2 ED attendances audit
A manual audit was undertaken of two HCH practices for Quarter 2 2016 triage 4&5 and showed the following for ED non-admitted attendances.
Table 16: Practice 1 ED non-admitted attendances
No. attending * Practice Appropriate
GP referred from practice (referred from Anglesea A&M)
ED appropriate
In hours 30 13 7 (2) 8
Out of hours 40 21 (10) 9
Note: 20 additional patients not included as there was no discharge information for 10 and 10 were not patients of this practice
Based on this audit, approximately one patient per week could have been managed differently within hours and possibly 7 per week who self-referred after hours.
Table 17: Practice 2 ED non-admitted attendances
No. attending * Practice Appropriate
GP referred from practice (referred from Anglesea A&M)
ED appropriate
In hours 24 6 9 (1) 8
Out of hours 47 28 2 17
Note: 8 other patients not included as no discharge information
Based on this audit, approximately two patients per month could have been managed differently within hours, and two to three per week who self-referred after hours.
8.5.3 Triage 4 and 5 ED attendances
The triage 4 and 5 data were a little more difficult to interpret as the ‘before’ period is relatively short for some of the practices (Figure 23), and there may have been some variability in the collection and definitions being used to record triage category within the EDs as the new collection started. Within the before/after analysis the HCH showed a drop but again figures were quite skewed by a single practice (Figure 24), while the practices commencing in 2011 do not have enough ‘before’ time to set a reasonable baseline.
Figure 23: Proportion of enrolees attending ED in triage 4 and 5 categories per quarter, 2008-2015
Source: PHO registers and NNPAC data, EY analysis. Triage categories became fully collected in October 2010.
HCH
Control
N4 non-HCH
1.0%
1.5%
2.0%
2.5%
3.0%
3.5%
2008 Q
1
2008 Q
2
2008 Q
3
2008 Q
4
2009 Q
1
2009 Q
2
2009 Q
3
2009 Q
4
2010 Q
1
2010 Q
2
2010 Q
3
2010 Q
4
2011 Q
1
2011 Q
2
2011 Q
3
2011 Q
4
2012 Q
1
2012 Q
2
2012 Q
3
2012 Q
4
2013 Q
1
2013 Q
2
2013 Q
3
2013 Q
4
2014 Q
1
2014 Q
2
2014 Q
3
2014 Q
4
2015 Q
1
2015 Q
2
2015 Q
3
2015 Q
4
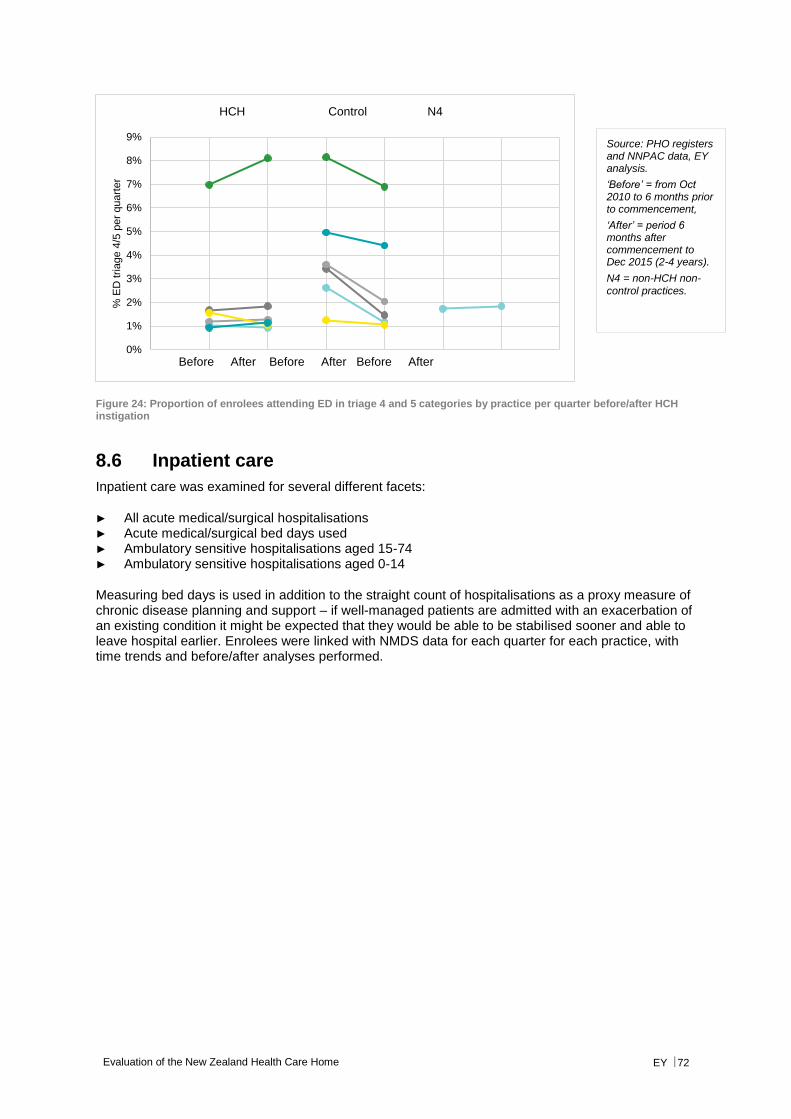
Evaluation of the New Zealand Health Care Home EY 72
Figure 24: Proportion of enrolees attending ED in triage 4 and 5 categories by practice per quarter before/after HCH instigation
8.6 Inpatient care
Inpatient care was examined for several different facets:
► All acute medical/surgical hospitalisations ► Acute medical/surgical bed days used ► Ambulatory sensitive hospitalisations aged 15-74 ► Ambulatory sensitive hospitalisations aged 0-14
Measuring bed days is used in addition to the straight count of hospitalisations as a proxy measure of chronic disease planning and support – if well-managed patients are admitted with an exacerbation of an existing condition it might be expected that they would be able to be stabilised sooner and able to leave hospital earlier. Enrolees were linked with NMDS data for each quarter for each practice, with time trends and before/after analyses performed.
0%
1%
2%
3%
4%
5%
6%
7%
8%
9%
% E
D tria
ge 4
/5 p
er
quart
er
HCH Control N4
Before After Before After Before After
Source: PHO registers and NNPAC data, EY analysis.
‘Before’ = from Oct 2010 to 6 months prior to commencement,
‘After’ = period 6 months after commencement to Dec 2015 (2-4 years).
N4 = non-HCH non-
control practices.
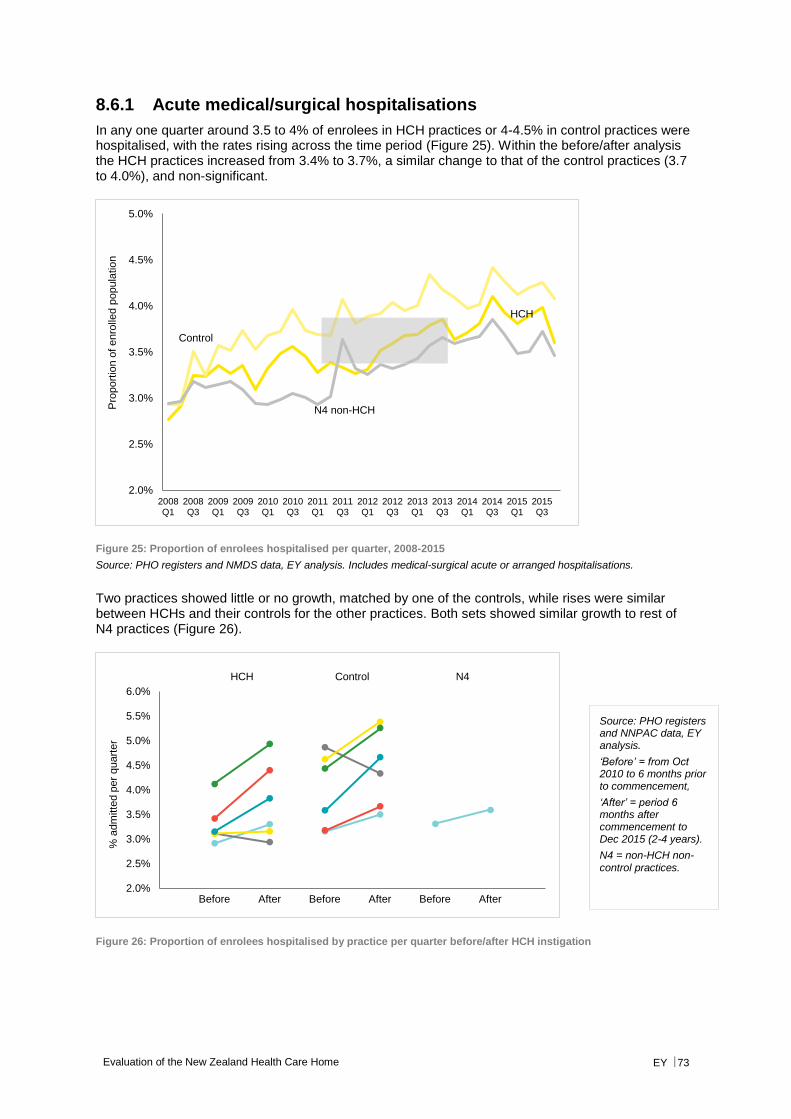
Evaluation of the New Zealand Health Care Home EY 73
8.6.1 Acute medical/surgical hospitalisations
In any one quarter around 3.5 to 4% of enrolees in HCH practices or 4-4.5% in control practices were hospitalised, with the rates rising across the time period (Figure 25). Within the before/after analysis the HCH practices increased from 3.4% to 3.7%, a similar change to that of the control practices (3.7 to 4.0%), and non-significant.
Figure 25: Proportion of enrolees hospitalised per quarter, 2008-2015
Source: PHO registers and NMDS data, EY analysis. Includes medical-surgical acute or arranged hospitalisations.
Two practices showed little or no growth, matched by one of the controls, while rises were similar between HCHs and their controls for the other practices. Both sets showed similar growth to rest of N4 practices (Figure 26).
Figure 26: Proportion of enrolees hospitalised by practice per quarter before/after HCH instigation
HCH
Control
N4 non-HCH
2.0%
2.5%
3.0%
3.5%
4.0%
4.5%
5.0%
2008Q1
2008Q3
2009Q1
2009Q3
2010Q1
2010Q3
2011Q1
2011Q3
2012Q1
2012Q3
2013Q1
2013Q3
2014Q1
2014Q3
2015Q1
2015Q3
Pro
port
ion o
f enro
lled p
opula
tio
n
2.0%
2.5%
3.0%
3.5%
4.0%
4.5%
5.0%
5.5%
6.0%
% a
dm
itte
d p
er
quart
er
Before After Before After Before After
HCH Control N4
Source: PHO registers and NNPAC data, EY analysis.
‘Before’ = from Oct 2010 to 6 months prior to commencement,
‘After’ = period 6 months after commencement to Dec 2015 (2-4 years).
N4 = non-HCH non-control practices.
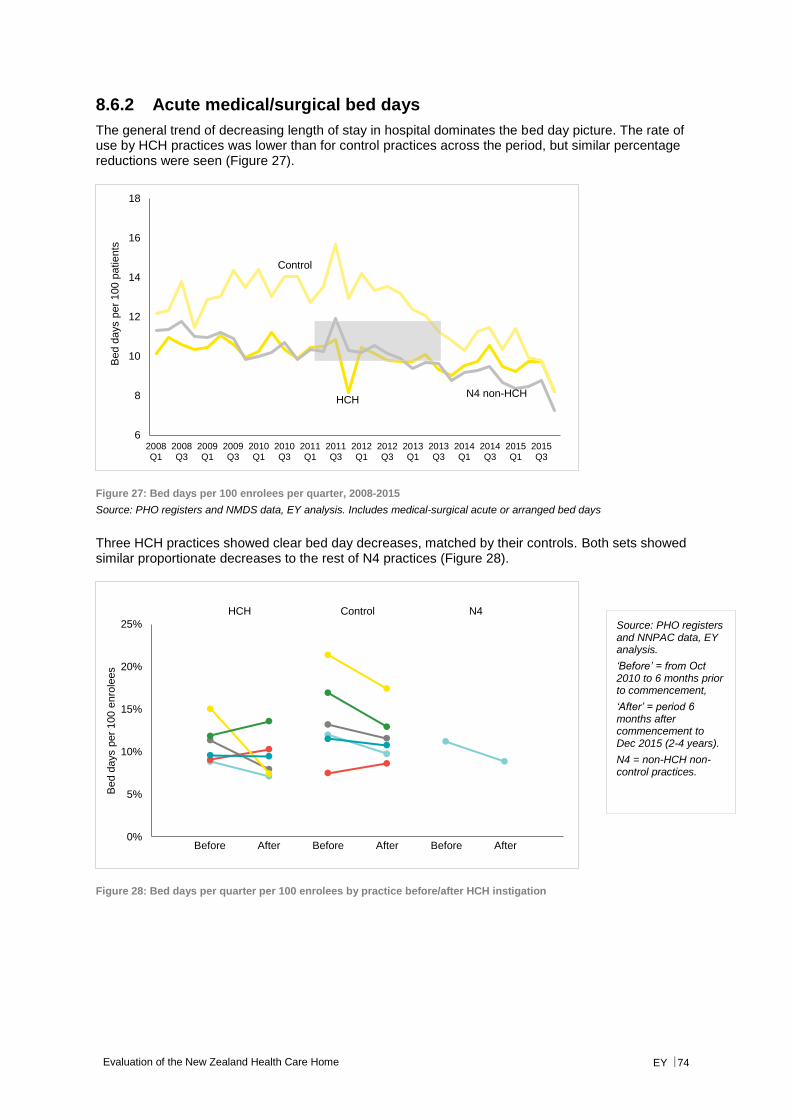
Evaluation of the New Zealand Health Care Home EY 74
8.6.2 Acute medical/surgical bed days
The general trend of decreasing length of stay in hospital dominates the bed day picture. The rate of use by HCH practices was lower than for control practices across the period, but similar percentage reductions were seen (Figure 27).
Figure 27: Bed days per 100 enrolees per quarter, 2008-2015
Source: PHO registers and NMDS data, EY analysis. Includes medical-surgical acute or arranged bed days
Three HCH practices showed clear bed day decreases, matched by their controls. Both sets showed similar proportionate decreases to the rest of N4 practices (Figure 28).
Figure 28: Bed days per quarter per 100 enrolees by practice before/after HCH instigation
HCH
Control
N4 non-HCH
6
8
10
12
14
16
18
2008Q1
2008Q3
2009Q1
2009Q3
2010Q1
2010Q3
2011Q1
2011Q3
2012Q1
2012Q3
2013Q1
2013Q3
2014Q1
2014Q3
2015Q1
2015Q3
Bed d
ays p
er
100 p
atie
nts
0%
5%
10%
15%
20%
25%
Bed d
ays p
er
100 e
nro
lees
Before After Before After Before After
HCH Control N4
Source: PHO registers and NNPAC data, EY analysis.
‘Before’ = from Oct 2010 to 6 months prior to commencement,
‘After’ = period 6 months after commencement to Dec 2015 (2-4 years).
N4 = non-HCH non-control practices.
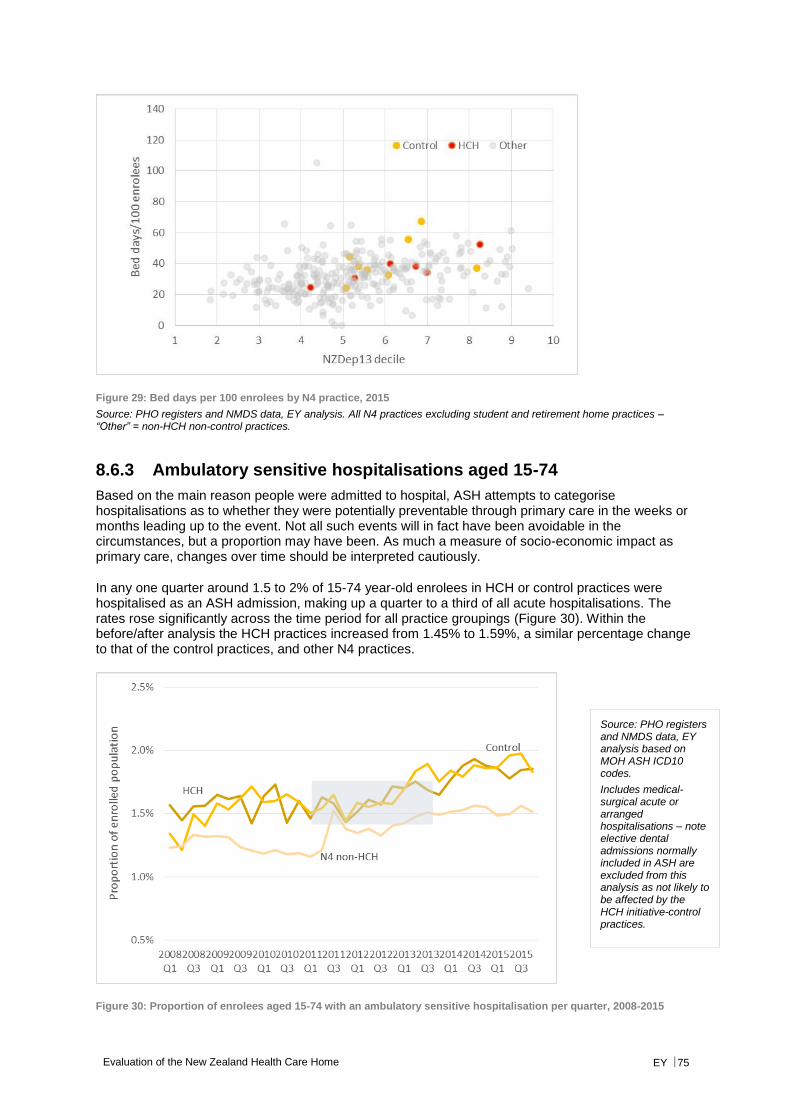
Evaluation of the New Zealand Health Care Home EY 75
Figure 29: Bed days per 100 enrolees by N4 practice, 2015
Source: PHO registers and NMDS data, EY analysis. All N4 practices excluding student and retirement home practices – “Other” = non-HCH non-control practices.
8.6.3 Ambulatory sensitive hospitalisations aged 15-74
Based on the main reason people were admitted to hospital, ASH attempts to categorise hospitalisations as to whether they were potentially preventable through primary care in the weeks or months leading up to the event. Not all such events will in fact have been avoidable in the circumstances, but a proportion may have been. As much a measure of socio-economic impact as primary care, changes over time should be interpreted cautiously.
In any one quarter around 1.5 to 2% of 15-74 year-old enrolees in HCH or control practices were hospitalised as an ASH admission, making up a quarter to a third of all acute hospitalisations. The rates rose significantly across the time period for all practice groupings (Figure 30). Within the before/after analysis the HCH practices increased from 1.45% to 1.59%, a similar percentage change to that of the control practices, and other N4 practices.
Figure 30: Proportion of enrolees aged 15-74 with an ambulatory sensitive hospitalisation per quarter, 2008-2015
Source: PHO registers and NMDS data, EY analysis based on MOH ASH ICD10 codes.
Includes medical-surgical acute or arranged hospitalisations – note elective dental admissions normally included in ASH are excluded from this analysis as not likely to be affected by the HCH initiative-control practices.
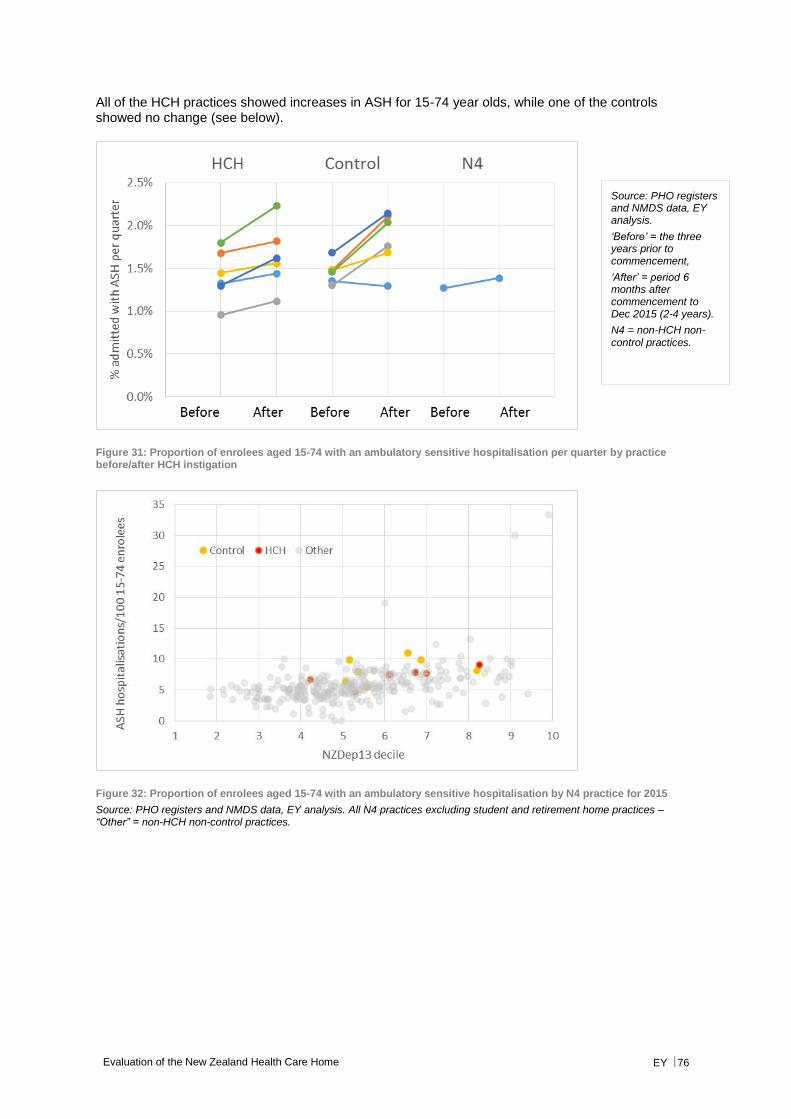
Evaluation of the New Zealand Health Care Home EY 76
All of the HCH practices showed increases in ASH for 15-74 year olds, while one of the controls showed no change (see below).
Figure 31: Proportion of enrolees aged 15-74 with an ambulatory sensitive hospitalisation per quarter by practice before/after HCH instigation
Figure 32: Proportion of enrolees aged 15-74 with an ambulatory sensitive hospitalisation by N4 practice for 2015
Source: PHO registers and NMDS data, EY analysis. All N4 practices excluding student and retirement home practices – “Other” = non-HCH non-control practices.
Source: PHO registers and NMDS data, EY analysis.
‘Before’ = the three years prior to commencement,
‘After’ = period 6 months after commencement to Dec 2015 (2-4 years).
N4 = non-HCH non-control practices.
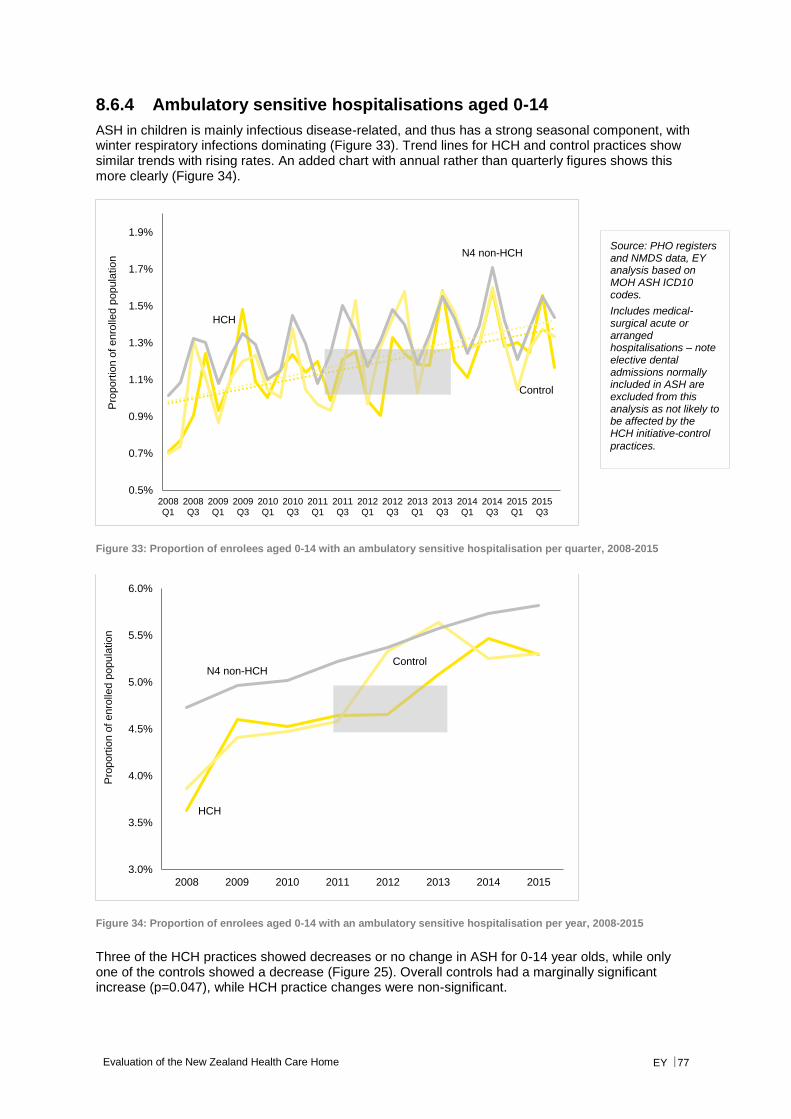
Evaluation of the New Zealand Health Care Home EY 77
8.6.4 Ambulatory sensitive hospitalisations aged 0-14
ASH in children is mainly infectious disease-related, and thus has a strong seasonal component, with winter respiratory infections dominating (Figure 33). Trend lines for HCH and control practices show similar trends with rising rates. An added chart with annual rather than quarterly figures shows this more clearly (Figure 34).
Figure 33: Proportion of enrolees aged 0-14 with an ambulatory sensitive hospitalisation per quarter, 2008-2015
Figure 34: Proportion of enrolees aged 0-14 with an ambulatory sensitive hospitalisation per year, 2008-2015
Three of the HCH practices showed decreases or no change in ASH for 0-14 year olds, while only one of the controls showed a decrease (Figure 25). Overall controls had a marginally significant increase (p=0.047), while HCH practice changes were non-significant.
HCH
Control
N4 non-HCH
0.5%
0.7%
0.9%
1.1%
1.3%
1.5%
1.7%
1.9%
2008Q1
2008Q3
2009Q1
2009Q3
2010Q1
2010Q3
2011Q1
2011Q3
2012Q1
2012Q3
2013Q1
2013Q3
2014Q1
2014Q3
2015Q1
2015Q3
Pro
port
ion o
f enro
lled p
opula
tio
n
HCH
ControlN4 non-HCH
3.0%
3.5%
4.0%
4.5%
5.0%
5.5%
6.0%
2008 2009 2010 2011 2012 2013 2014 2015
Pro
port
ion o
f enro
lled p
opula
tio
n
Source: PHO registers and NMDS data, EY analysis based on MOH ASH ICD10 codes.
Includes medical-surgical acute or arranged hospitalisations – note elective dental admissions normally included in ASH are excluded from this analysis as not likely to be affected by the HCH initiative-control
practices.
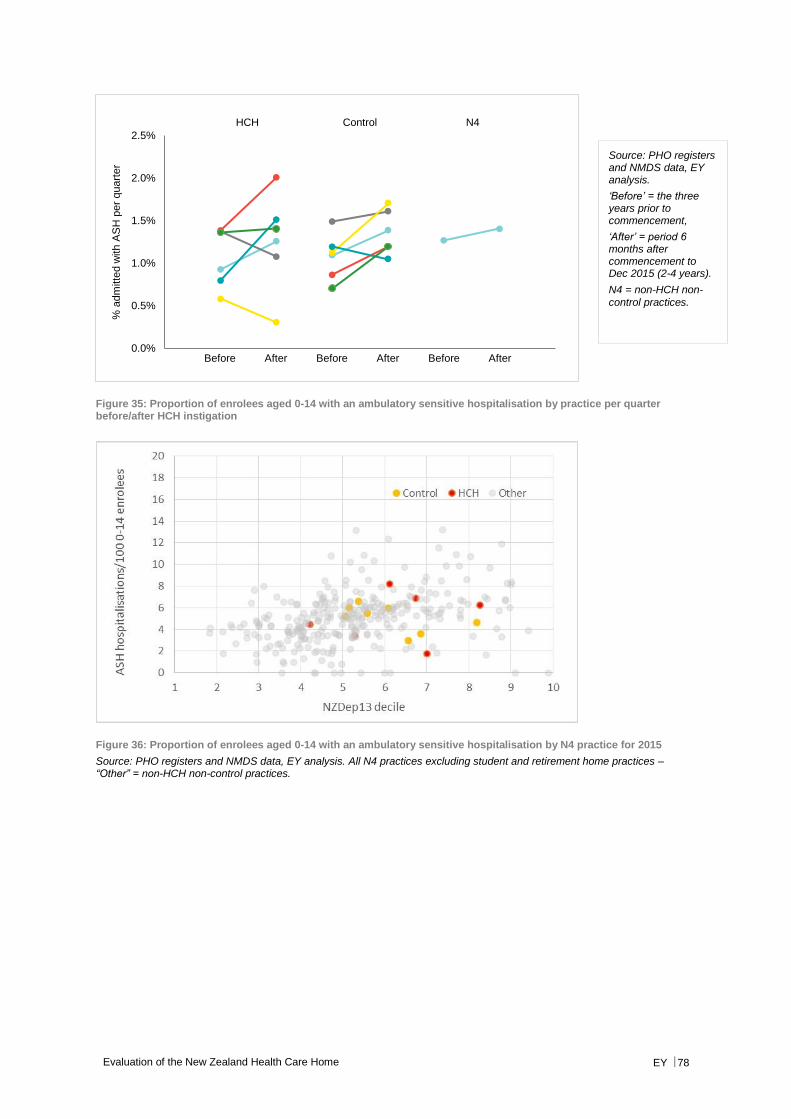
Evaluation of the New Zealand Health Care Home EY 78
Figure 35: Proportion of enrolees aged 0-14 with an ambulatory sensitive hospitalisation by practice per quarter before/after HCH instigation
Figure 36: Proportion of enrolees aged 0-14 with an ambulatory sensitive hospitalisation by N4 practice for 2015
Source: PHO registers and NMDS data, EY analysis. All N4 practices excluding student and retirement home practices – “Other” = non-HCH non-control practices.
0.0%
0.5%
1.0%
1.5%
2.0%
2.5%
% a
dm
itte
d w
ith A
SH
per
quart
er
Before After Before After Before After
HCH Control N4
Source: PHO registers and NMDS data, EY analysis.
‘Before’ = the three years prior to commencement,
‘After’ = period 6 months after commencement to Dec 2015 (2-4 years).
N4 = non-HCH non-
control practices.
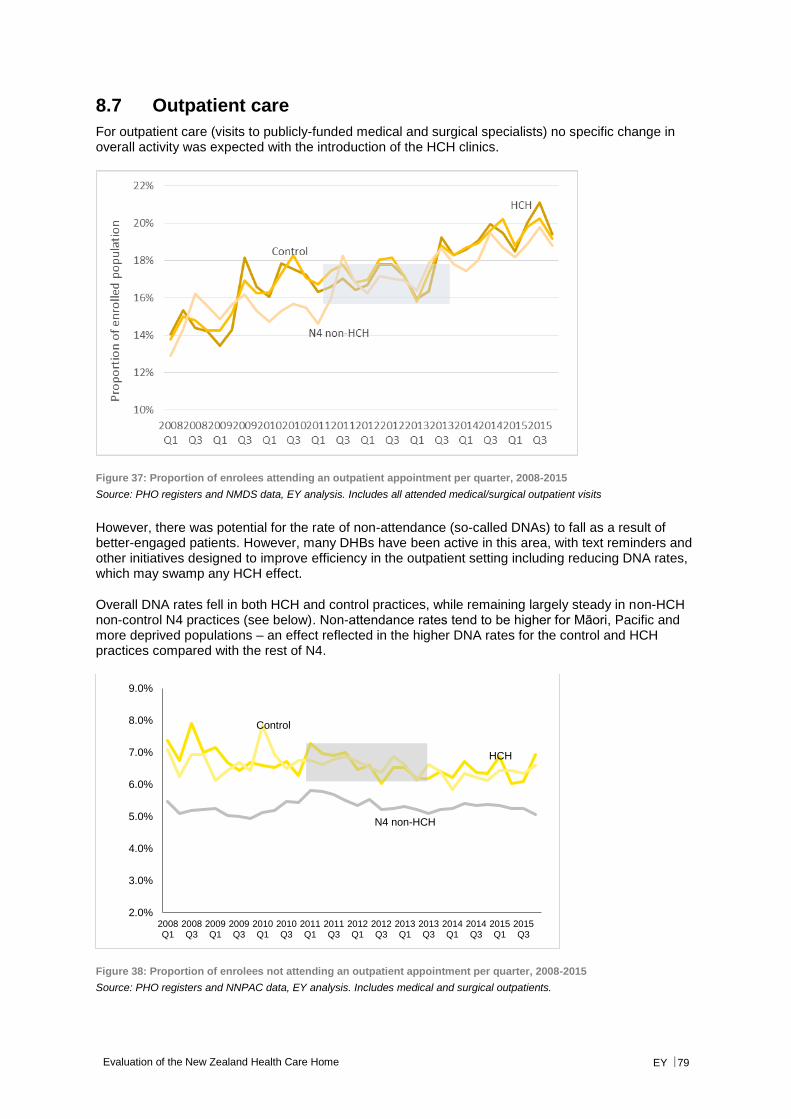
Evaluation of the New Zealand Health Care Home EY 79
8.7 Outpatient care
For outpatient care (visits to publicly-funded medical and surgical specialists) no specific change in overall activity was expected with the introduction of the HCH clinics.
Figure 37: Proportion of enrolees attending an outpatient appointment per quarter, 2008-2015
Source: PHO registers and NMDS data, EY analysis. Includes all attended medical/surgical outpatient visits
However, there was potential for the rate of non-attendance (so-called DNAs) to fall as a result of better-engaged patients. However, many DHBs have been active in this area, with text reminders and other initiatives designed to improve efficiency in the outpatient setting including reducing DNA rates, which may swamp any HCH effect.
Overall DNA rates fell in both HCH and control practices, while remaining largely steady in non-HCH non-control N4 practices (see below). Non-attendance rates tend to be higher for Māori, Pacific and more deprived populations – an effect reflected in the higher DNA rates for the control and HCH practices compared with the rest of N4.
Figure 38: Proportion of enrolees not attending an outpatient appointment per quarter, 2008-2015
Source: PHO registers and NNPAC data, EY analysis. Includes medical and surgical outpatients.
HCH
Control
N4 non-HCH
2.0%
3.0%
4.0%
5.0%
6.0%
7.0%
8.0%
9.0%
2008Q1
2008Q3
2009Q1
2009Q3
2010Q1
2010Q3
2011Q1
2011Q3
2012Q1
2012Q3
2013Q1
2013Q3
2014Q1
2014Q3
2015Q1
2015Q3
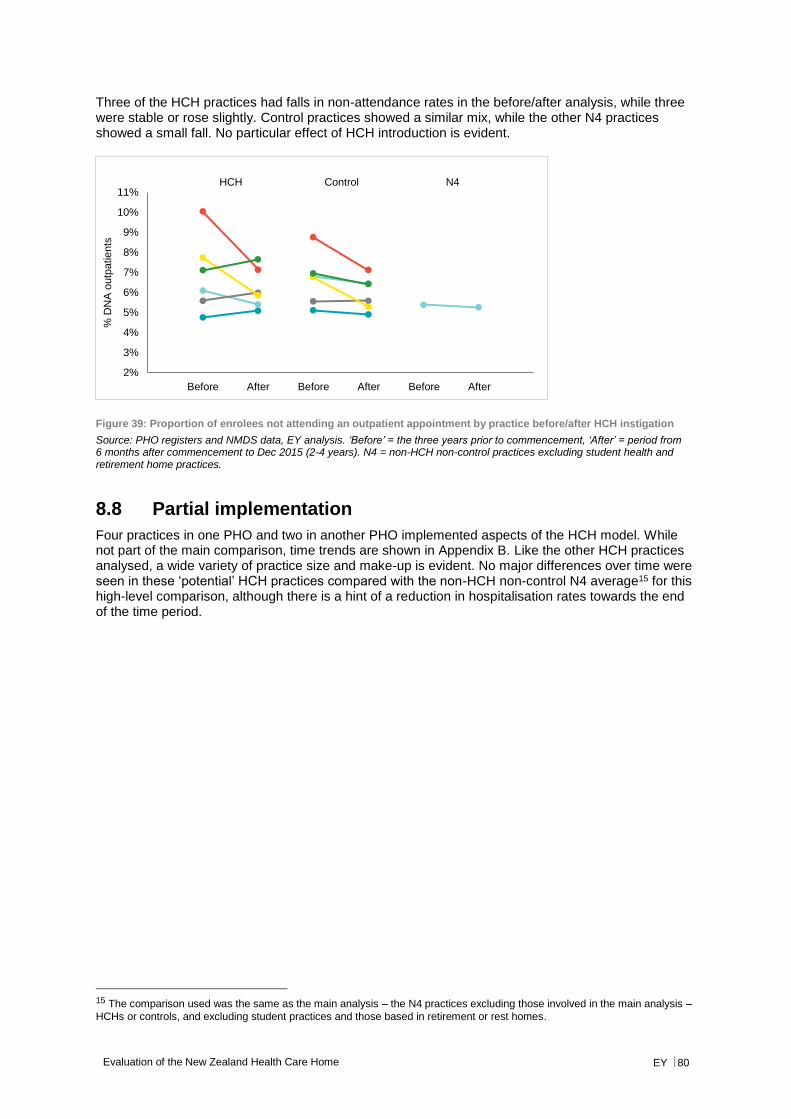
Evaluation of the New Zealand Health Care Home EY 80
Three of the HCH practices had falls in non-attendance rates in the before/after analysis, while three were stable or rose slightly. Control practices showed a similar mix, while the other N4 practices showed a small fall. No particular effect of HCH introduction is evident.
Figure 39: Proportion of enrolees not attending an outpatient appointment by practice before/after HCH instigation
Source: PHO registers and NMDS data, EY analysis. ‘Before’ = the three years prior to commencement, ‘After’ = period from 6 months after commencement to Dec 2015 (2-4 years). N4 = non-HCH non-control practices excluding student health and retirement home practices.
8.8 Partial implementation
Four practices in one PHO and two in another PHO implemented aspects of the HCH model. While not part of the main comparison, time trends are shown in Appendix B. Like the other HCH practices analysed, a wide variety of practice size and make-up is evident. No major differences over time were seen in these ‘potential’ HCH practices compared with the non-HCH non-control N4 average15 for this high-level comparison, although there is a hint of a reduction in hospitalisation rates towards the end of the time period.
15 The comparison used was the same as the main analysis – the N4 practices excluding those involved in the main analysis –
HCHs or controls, and excluding student practices and those based in retirement or rest homes.
2%
3%
4%
5%
6%
7%
8%
9%
10%
11%
% D
NA
outp
atie
nts
Before After Before After Before After
HCH Control N4

Evaluation of the New Zealand Health Care Home EY 81
9. Conclusion
This evaluation of the New Zealand Health Care Home draws together previous qualitative evaluations and analyses quantitative data related to hospital activity. The defining feature of the evaluation was the development of a programme logic model that described the elements of the HCH and tracked them to desired outcomes. This then formed the foundations for a HCH Performance Framework and the identification of a possible set of indicators. These will require further discussion.
The evaluation findings have generally been positive with regards to the implementation of the model, although quantitative analysis of hospital data has not shown significant changes. This evaluation provides information that is of interest nationally and to other practices considering implementing the HCH.
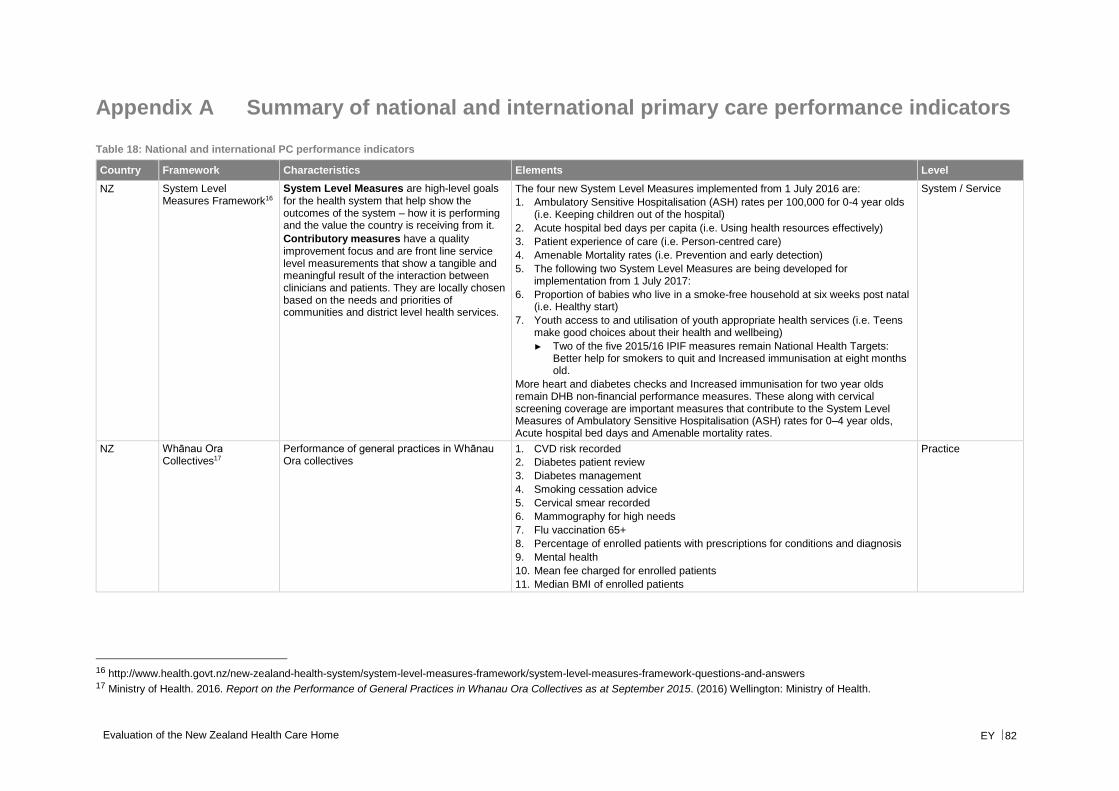
Evaluation of the New Zealand Health Care Home EY 82
Appendix A Summary of national and international primary care performance indicators
Table 18: National and international PC performance indicators
Country Framework Characteristics Elements Level
NZ System Level Measures Framework16
System Level Measures are high-level goals for the health system that help show the outcomes of the system – how it is performing and the value the country is receiving from it.
Contributory measures have a quality improvement focus and are front line service level measurements that show a tangible and meaningful result of the interaction between clinicians and patients. They are locally chosen based on the needs and priorities of communities and district level health services.
The four new System Level Measures implemented from 1 July 2016 are:
1. Ambulatory Sensitive Hospitalisation (ASH) rates per 100,000 for 0-4 year olds (i.e. Keeping children out of the hospital)
2. Acute hospital bed days per capita (i.e. Using health resources effectively)
3. Patient experience of care (i.e. Person-centred care)
4. Amenable Mortality rates (i.e. Prevention and early detection)
5. The following two System Level Measures are being developed for implementation from 1 July 2017:
6. Proportion of babies who live in a smoke-free household at six weeks post natal (i.e. Healthy start)
7. Youth access to and utilisation of youth appropriate health services (i.e. Teens make good choices about their health and wellbeing)
► Two of the five 2015/16 IPIF measures remain National Health Targets: Better help for smokers to quit and Increased immunisation at eight months old.
More heart and diabetes checks and Increased immunisation for two year olds remain DHB non-financial performance measures. These along with cervical screening coverage are important measures that contribute to the System Level Measures of Ambulatory Sensitive Hospitalisation (ASH) rates for 0–4 year olds, Acute hospital bed days and Amenable mortality rates.
System / Service
NZ Whānau Ora Collectives17
Performance of general practices in Whānau Ora collectives
1. CVD risk recorded
2. Diabetes patient review
3. Diabetes management
4. Smoking cessation advice
5. Cervical smear recorded
6. Mammography for high needs
7. Flu vaccination 65+
8. Percentage of enrolled patients with prescriptions for conditions and diagnosis
9. Mental health
10. Mean fee charged for enrolled patients
11. Median BMI of enrolled patients
Practice
16 http://www.health.govt.nz/new-zealand-health-system/system-level-measures-framework/system-level-measures-framework-questions-and-answers 17 Ministry of Health. 2016. Report on the Performance of General Practices in Whanau Ora Collectives as at September 2015. (2016) Wellington: Ministry of Health.
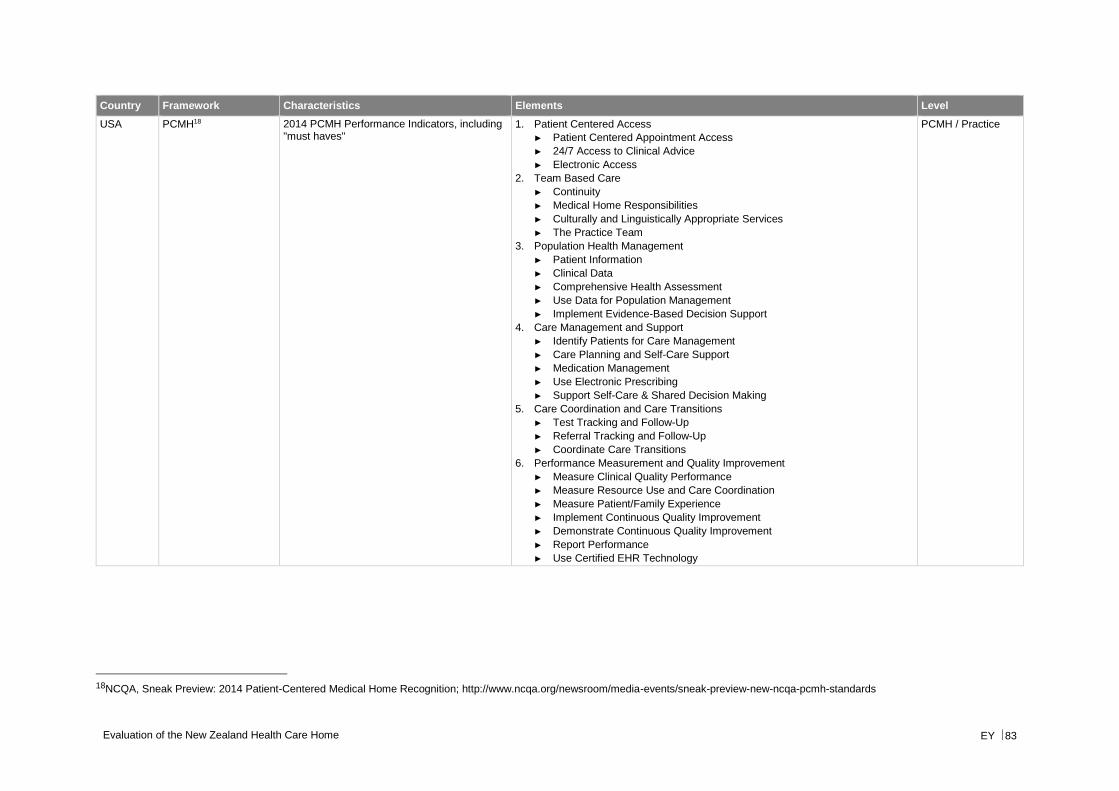
Evaluation of the New Zealand Health Care Home EY 83
Country Framework Characteristics Elements Level
USA PCMH18 2014 PCMH Performance Indicators, including "must haves"
1. Patient Centered Access
► Patient Centered Appointment Access
► 24/7 Access to Clinical Advice
► Electronic Access
2. Team Based Care
► Continuity
► Medical Home Responsibilities
► Culturally and Linguistically Appropriate Services
► The Practice Team
3. Population Health Management
► Patient Information
► Clinical Data
► Comprehensive Health Assessment
► Use Data for Population Management
► Implement Evidence-Based Decision Support
4. Care Management and Support
► Identify Patients for Care Management
► Care Planning and Self-Care Support
► Medication Management
► Use Electronic Prescribing
► Support Self-Care & Shared Decision Making
5. Care Coordination and Care Transitions
► Test Tracking and Follow-Up
► Referral Tracking and Follow-Up
► Coordinate Care Transitions
6. Performance Measurement and Quality Improvement
► Measure Clinical Quality Performance
► Measure Resource Use and Care Coordination
► Measure Patient/Family Experience
► Implement Continuous Quality Improvement
► Demonstrate Continuous Quality Improvement
► Report Performance
► Use Certified EHR Technology
PCMH / Practice
18NCQA, Sneak Preview: 2014 Patient-Centered Medical Home Recognition; http://www.ncqa.org/newsroom/media-events/sneak-preview-new-ncqa-pcmh-standards
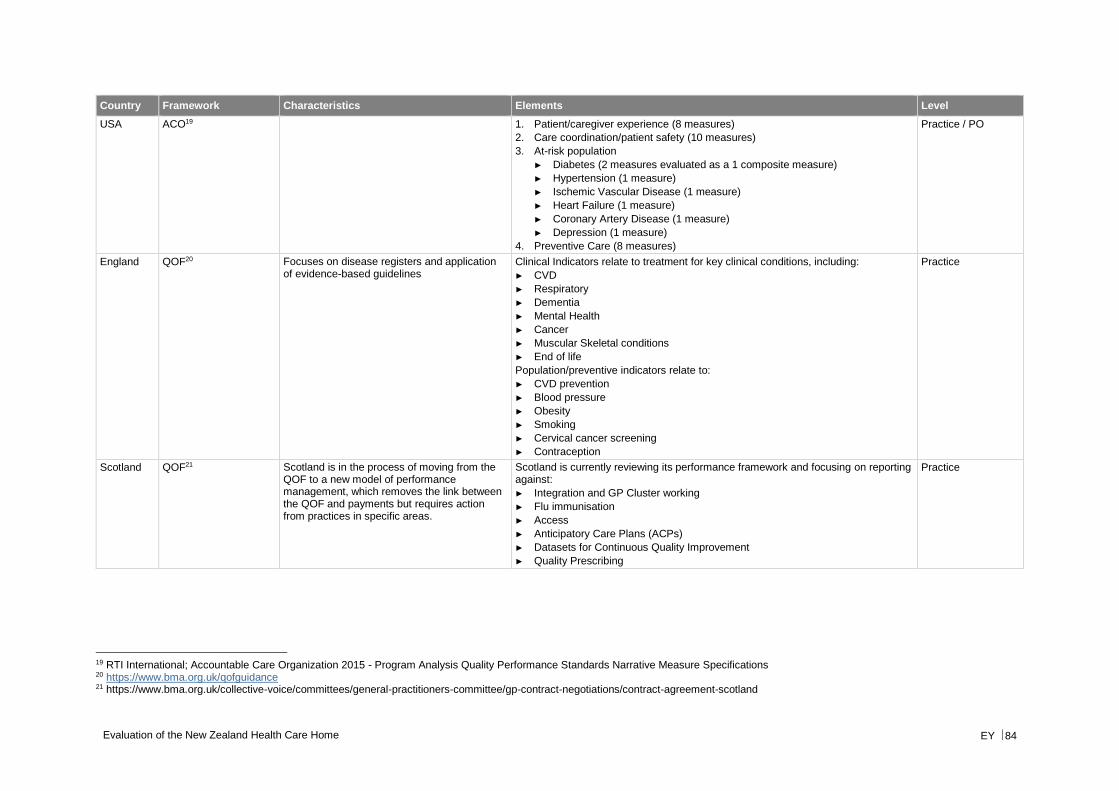
Evaluation of the New Zealand Health Care Home EY 84
Country Framework Characteristics Elements Level
USA ACO19 1. Patient/caregiver experience (8 measures)
2. Care coordination/patient safety (10 measures)
3. At-risk population
► Diabetes (2 measures evaluated as a 1 composite measure)
► Hypertension (1 measure)
► Ischemic Vascular Disease (1 measure)
► Heart Failure (1 measure)
► Coronary Artery Disease (1 measure)
► Depression (1 measure)
4. Preventive Care (8 measures)
Practice / PO
England QOF20 Focuses on disease registers and application of evidence-based guidelines
Clinical Indicators relate to treatment for key clinical conditions, including:
► CVD
► Respiratory
► Dementia
► Mental Health
► Cancer
► Muscular Skeletal conditions
► End of life
Population/preventive indicators relate to:
► CVD prevention
► Blood pressure
► Obesity
► Smoking
► Cervical cancer screening
► Contraception
Practice
Scotland QOF21 Scotland is in the process of moving from the QOF to a new model of performance management, which removes the link between the QOF and payments but requires action from practices in specific areas.
Scotland is currently reviewing its performance framework and focusing on reporting against:
► Integration and GP Cluster working
► Flu immunisation
► Access
► Anticipatory Care Plans (ACPs)
► Datasets for Continuous Quality Improvement
► Quality Prescribing
Practice
19 RTI International; Accountable Care Organization 2015 - Program Analysis Quality Performance Standards Narrative Measure Specifications 20 https://www.bma.org.uk/qofguidance 21 https://www.bma.org.uk/collective-voice/committees/general-practitioners-committee/gp-contract-negotiations/contract-agreement-scotland
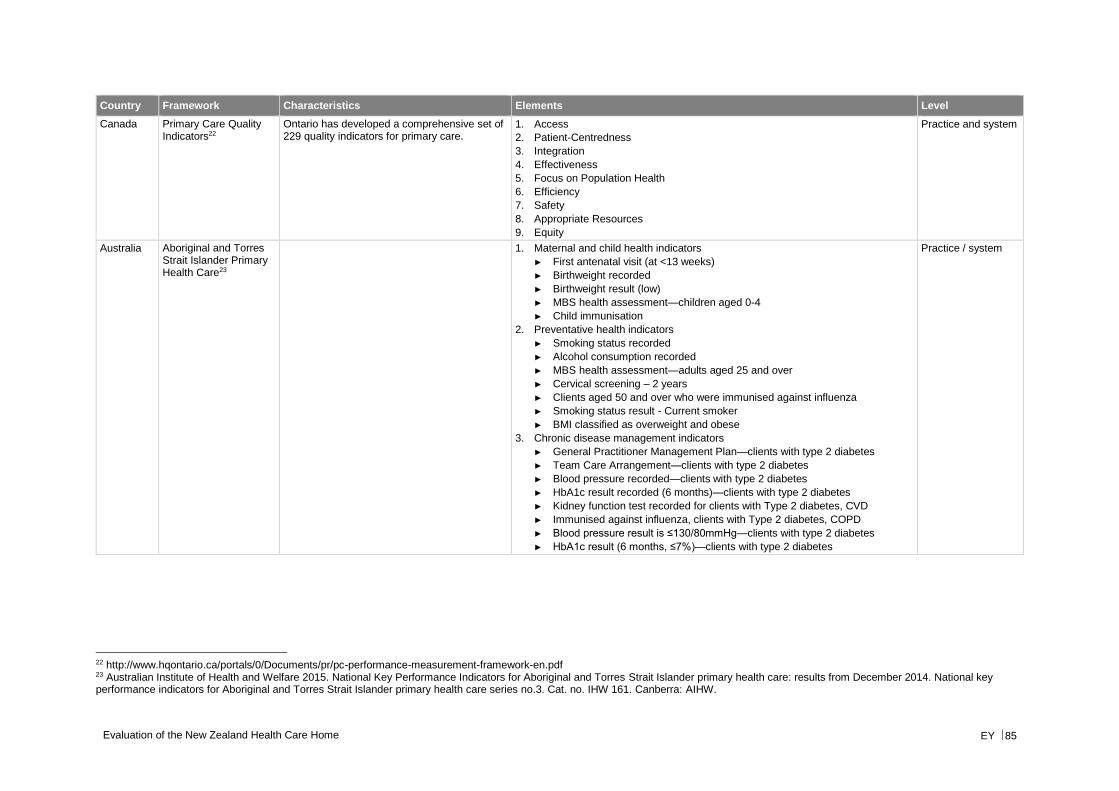
Evaluation of the New Zealand Health Care Home EY 85
Country Framework Characteristics Elements Level
Canada Primary Care Quality Indicators22
Ontario has developed a comprehensive set of 229 quality indicators for primary care.
1. Access
2. Patient-Centredness
3. Integration
4. Effectiveness
5. Focus on Population Health
6. Efficiency
7. Safety
8. Appropriate Resources
9. Equity
Practice and system
Australia Aboriginal and Torres Strait Islander Primary Health Care23
1. Maternal and child health indicators
► First antenatal visit (at <13 weeks)
► Birthweight recorded
► Birthweight result (low)
► MBS health assessment—children aged 0-4
► Child immunisation
2. Preventative health indicators
► Smoking status recorded
► Alcohol consumption recorded
► MBS health assessment—adults aged 25 and over
► Cervical screening – 2 years
► Clients aged 50 and over who were immunised against influenza
► Smoking status result - Current smoker
► BMI classified as overweight and obese
3. Chronic disease management indicators
► General Practitioner Management Plan—clients with type 2 diabetes
► Team Care Arrangement—clients with type 2 diabetes
► Blood pressure recorded—clients with type 2 diabetes
► HbA1c result recorded (6 months)—clients with type 2 diabetes
► Kidney function test recorded for clients with Type 2 diabetes, CVD
► Immunised against influenza, clients with Type 2 diabetes, COPD
► Blood pressure result is ≤130/80mmHg—clients with type 2 diabetes
► HbA1c result (6 months, ≤7%)—clients with type 2 diabetes
Practice / system
22 http://www.hqontario.ca/portals/0/Documents/pr/pc-performance-measurement-framework-en.pdf 23 Australian Institute of Health and Welfare 2015. National Key Performance Indicators for Aboriginal and Torres Strait Islander primary health care: results from December 2014. National key performance indicators for Aboriginal and Torres Strait Islander primary health care series no.3. Cat. no. IHW 161. Canberra: AIHW.
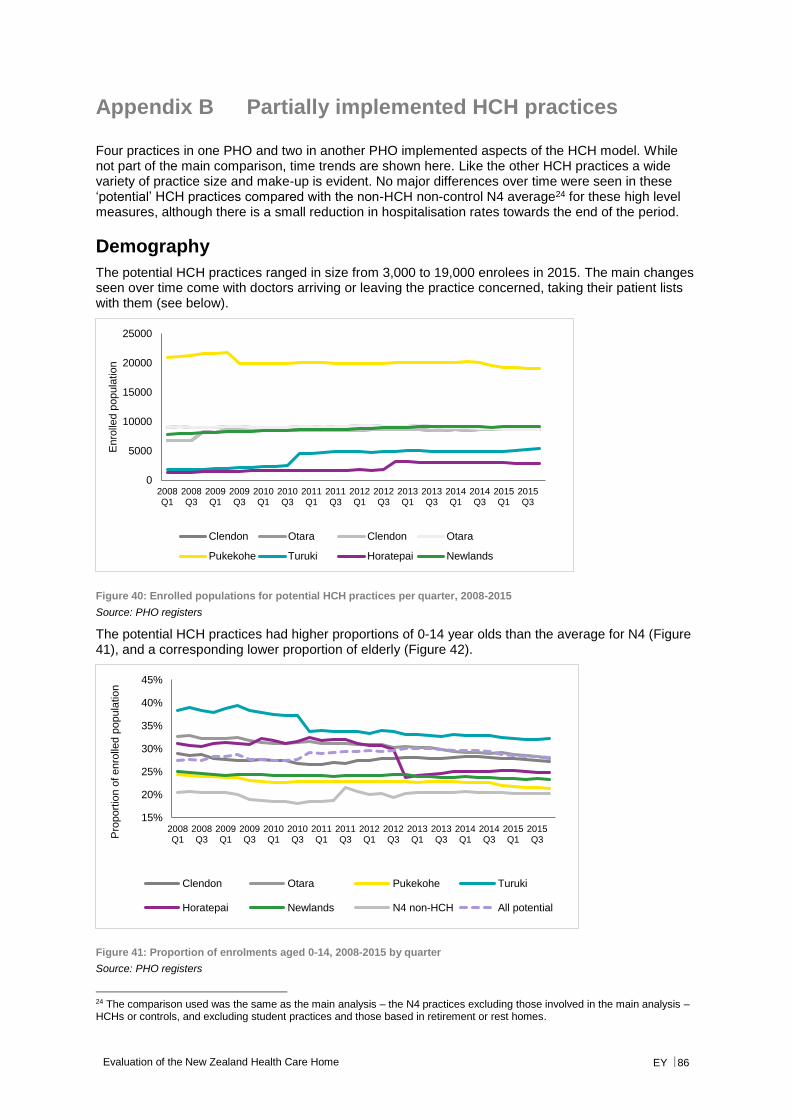
Evaluation of the New Zealand Health Care Home EY 86
Appendix B Partially implemented HCH practices
Four practices in one PHO and two in another PHO implemented aspects of the HCH model. While not part of the main comparison, time trends are shown here. Like the other HCH practices a wide variety of practice size and make-up is evident. No major differences over time were seen in these ‘potential’ HCH practices compared with the non-HCH non-control N4 average24 for these high level measures, although there is a small reduction in hospitalisation rates towards the end of the period.
Demography
The potential HCH practices ranged in size from 3,000 to 19,000 enrolees in 2015. The main changes seen over time come with doctors arriving or leaving the practice concerned, taking their patient lists with them (see below).
Figure 40: Enrolled populations for potential HCH practices per quarter, 2008-2015
Source: PHO registers
The potential HCH practices had higher proportions of 0-14 year olds than the average for N4 (Figure 41), and a corresponding lower proportion of elderly (Figure 42).
Figure 41: Proportion of enrolments aged 0-14, 2008-2015 by quarter
Source: PHO registers
24 The comparison used was the same as the main analysis – the N4 practices excluding those involved in the main analysis – HCHs or controls, and excluding student practices and those based in retirement or rest homes.
0
5000
10000
15000
20000
25000
2008Q1
2008Q3
2009Q1
2009Q3
2010Q1
2010Q3
2011Q1
2011Q3
2012Q1
2012Q3
2013Q1
2013Q3
2014Q1
2014Q3
2015Q1
2015Q3
Enro
lled p
opula
tio
n
Clendon Otara Clendon Otara
Pukekohe Turuki Horatepai Newlands
15%
20%
25%
30%
35%
40%
45%
2008Q1
2008Q3
2009Q1
2009Q3
2010Q1
2010Q3
2011Q1
2011Q3
2012Q1
2012Q3
2013Q1
2013Q3
2014Q1
2014Q3
2015Q1
2015Q3P
roport
ion o
f enro
lled p
opula
tio
n
Clendon Otara Pukekohe Turuki
Horatepai Newlands N4 non-HCH All potential
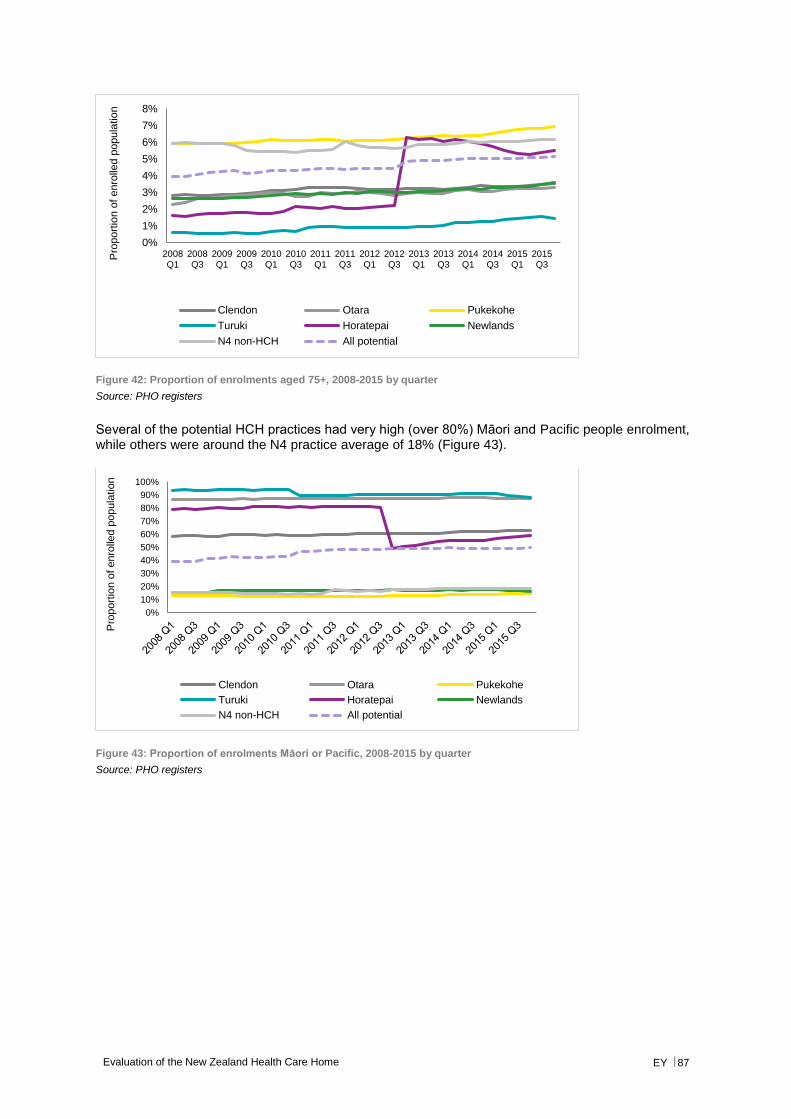
Evaluation of the New Zealand Health Care Home EY 87
Figure 42: Proportion of enrolments aged 75+, 2008-2015 by quarter
Source: PHO registers
Several of the potential HCH practices had very high (over 80%) Māori and Pacific people enrolment, while others were around the N4 practice average of 18% (Figure 43).
Figure 43: Proportion of enrolments Māori or Pacific, 2008-2015 by quarter
Source: PHO registers
0%
1%
2%
3%
4%
5%
6%
7%
8%
2008Q1
2008Q3
2009Q1
2009Q3
2010Q1
2010Q3
2011Q1
2011Q3
2012Q1
2012Q3
2013Q1
2013Q3
2014Q1
2014Q3
2015Q1
2015Q3
Pro
port
ion o
f enro
lled p
opula
tio
n
Clendon Otara Pukekohe
Turuki Horatepai Newlands
N4 non-HCH All potential
0%
10%
20%
30%
40%
50%
60%
70%
80%
90%
100%
Pro
port
ion o
f enro
lled p
opula
tio
n
Clendon Otara Pukekohe
Turuki Horatepai Newlands
N4 non-HCH All potential

Evaluation of the New Zealand Health Care Home EY 88
Utilisation
ED non-admitted attendance rates varied across the practices, but the overall trend was for the potential HCH practices was similar to that for non-HCH N4 practices overall (Figure 44). If one takes calendar year 2015 and compares with calendar year 2011 then the potential HCH practices increased 0.4 percentage points, while non-HCH N4 practices increased 0.5.
Figure 44: Proportion of enrolees attending ED per quarter, 2008-2015 (non-admitted only)
Source: PHO registers and NNPAC data, EY analysis
ED triage 4 and 5 attendance rates showed similar variability across the practices, with a similar overall trend. Comparing 2015 with 2011 potential HCH practices and non-HCH N4 practices both increased 0.2 percentage points.
Figure 45: Proportion of enrolees attending ED in triage 4 and 5 categories per quarter, 2008-2015
Source: PHO registers and NNPAC data, EY analysis
In any one quarter 3% to 5% of enrolees in potential HCH practices were hospitalised for an acute medical/surgical condition, with the rates rising across the time period (Figure 46). Increases were similar to that for the non-HCH N4 practices across the 8 years, but comparing 2015 with 2011 the potential HCH practices showed no growth in aggregate, while the non-HCH N4 practices showed a 0.3 percentage point growth.
0.0%
0.5%
1.0%
1.5%
2.0%
2.5%
3.0%
3.5%
4.0%
4.5%
5.0%
Pro
port
ion o
f enro
lled p
opula
tio
n
Clendon Otara Pukekohe
Turuki Horatepai Newlands
N4 non-HCH All potential
0.0%
0.5%
1.0%
1.5%
2.0%
2.5%
Pro
port
ion o
f enro
lled p
opula
tio
n
Clendon Otara Pukekohe
Turuki Horatepai Newlands
N4 non-HCH All potential
2011 2015 Diff
Clendon 2.4% 2.6% 0.2%
Otara 2.4% 3.1% 0.6%
Pukekohe 1.0% 1.0% 0.1%
Turuki 2.7% 3.7% 0.9%
Horatepai 1.7% 2.1% 0.4%
Newlands 2.4% 2.8% 0.4%
All potential 1.9% 2.2% 0.4%
N4 non-HCH 2.5% 2.9% 0.5%
2011 2015 Diff
Clendon 1.4% 1.5% 0.1%
Otara 1.4% 1.8% 0.4%
Pukekohe 0.5% 0.6% 0.0%
Turuki 1.8% 2.2% 0.4%
Horatepai 1.1% 1.3% 0.2%
Newlands 1.6% 1.7% 0.1%
All potential 1.1% 1.3% 0.2%
N4 non-HCH 1.6% 1.9% 0.2%
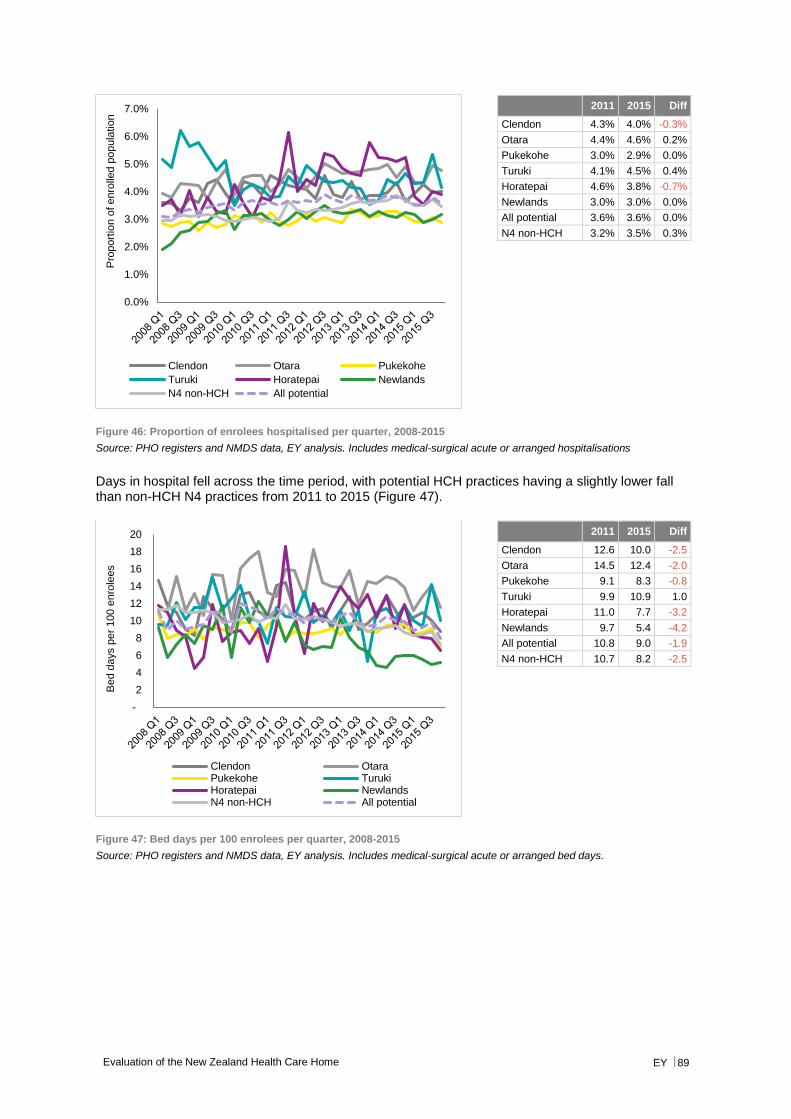
Evaluation of the New Zealand Health Care Home EY 89
Figure 46: Proportion of enrolees hospitalised per quarter, 2008-2015
Source: PHO registers and NMDS data, EY analysis. Includes medical-surgical acute or arranged hospitalisations
Days in hospital fell across the time period, with potential HCH practices having a slightly lower fall than non-HCH N4 practices from 2011 to 2015 (Figure 47).
Figure 47: Bed days per 100 enrolees per quarter, 2008-2015
Source: PHO registers and NMDS data, EY analysis. Includes medical-surgical acute or arranged bed days.
0.0%
1.0%
2.0%
3.0%
4.0%
5.0%
6.0%
7.0%P
roport
ion o
f enro
lled p
opula
tio
n
Clendon Otara Pukekohe
Turuki Horatepai Newlands
N4 non-HCH All potential
-
2
4
6
8
10
12
14
16
18
20
Bed d
ays p
er
100 e
nro
lees
Clendon OtaraPukekohe TurukiHoratepai NewlandsN4 non-HCH All potential
2011 2015 Diff
Clendon 4.3% 4.0% -0.3%
Otara 4.4% 4.6% 0.2%
Pukekohe 3.0% 2.9% 0.0%
Turuki 4.1% 4.5% 0.4%
Horatepai 4.6% 3.8% -0.7%
Newlands 3.0% 3.0% 0.0%
All potential 3.6% 3.6% 0.0%
N4 non-HCH 3.2% 3.5% 0.3%
2011 2015 Diff
Clendon 12.6 10.0 -2.5
Otara 14.5 12.4 -2.0
Pukekohe 9.1 8.3 -0.8
Turuki 9.9 10.9 1.0
Horatepai 11.0 7.7 -3.2
Newlands 9.7 5.4 -4.2
All potential 10.8 9.0 -1.9
N4 non-HCH 10.7 8.2 -2.5
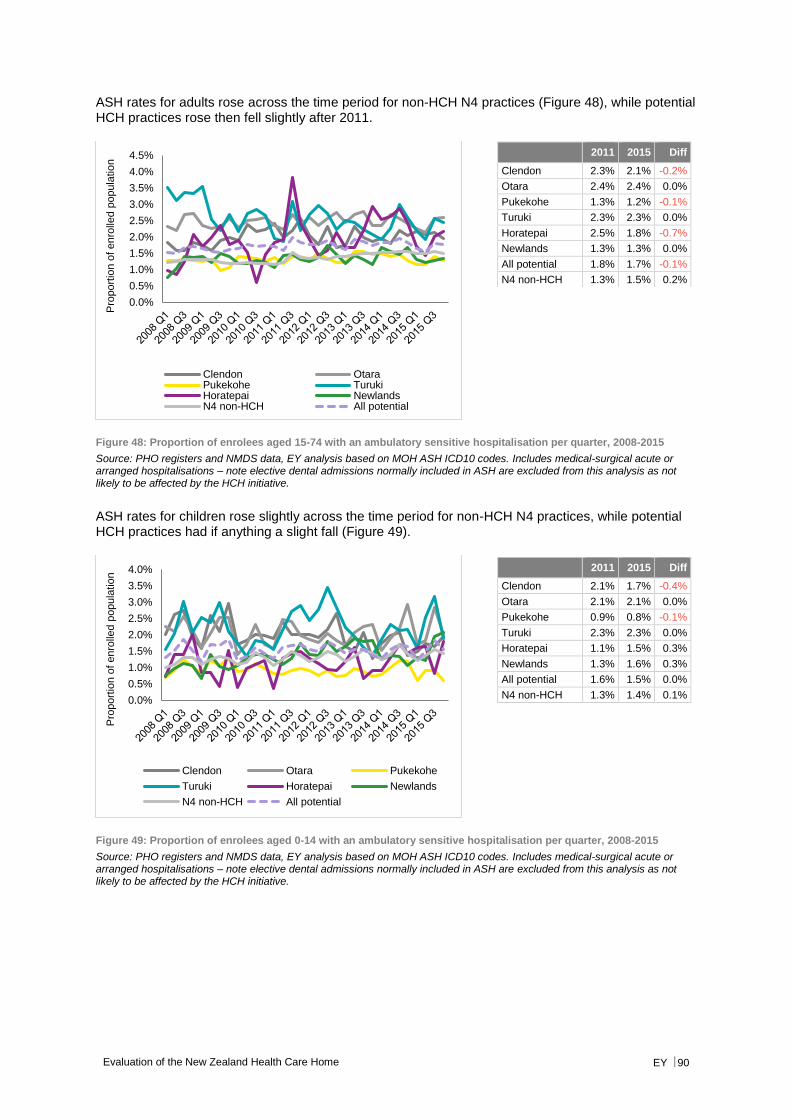
Evaluation of the New Zealand Health Care Home EY 90
ASH rates for adults rose across the time period for non-HCH N4 practices (Figure 48), while potential HCH practices rose then fell slightly after 2011.
Figure 48: Proportion of enrolees aged 15-74 with an ambulatory sensitive hospitalisation per quarter, 2008-2015
Source: PHO registers and NMDS data, EY analysis based on MOH ASH ICD10 codes. Includes medical-surgical acute or arranged hospitalisations – note elective dental admissions normally included in ASH are excluded from this analysis as not likely to be affected by the HCH initiative.
ASH rates for children rose slightly across the time period for non-HCH N4 practices, while potential HCH practices had if anything a slight fall (Figure 49).
Figure 49: Proportion of enrolees aged 0-14 with an ambulatory sensitive hospitalisation per quarter, 2008-2015
Source: PHO registers and NMDS data, EY analysis based on MOH ASH ICD10 codes. Includes medical-surgical acute or arranged hospitalisations – note elective dental admissions normally included in ASH are excluded from this analysis as not likely to be affected by the HCH initiative.
0.0%
0.5%
1.0%
1.5%
2.0%
2.5%
3.0%
3.5%
4.0%
4.5%
Pro
port
ion o
f enro
lled p
opula
tio
n
Clendon OtaraPukekohe TurukiHoratepai NewlandsN4 non-HCH All potential
0.0%
0.5%
1.0%
1.5%
2.0%
2.5%
3.0%
3.5%
4.0%
Pro
port
ion o
f enro
lled p
opula
tio
n
Clendon Otara Pukekohe
Turuki Horatepai Newlands
N4 non-HCH All potential
2011 2015 Diff
Clendon 2.3% 2.1% -0.2%
Otara 2.4% 2.4% 0.0%
Pukekohe 1.3% 1.2% -0.1%
Turuki 2.3% 2.3% 0.0%
Horatepai 2.5% 1.8% -0.7%
Newlands 1.3% 1.3% 0.0%
All potential 1.8% 1.7% -0.1%
N4 non-HCH 1.3% 1.5% 0.2%
2011 2015 Diff
Clendon 2.1% 1.7% -0.4%
Otara 2.1% 2.1% 0.0%
Pukekohe 0.9% 0.8% -0.1%
Turuki 2.3% 2.3% 0.0%
Horatepai 1.1% 1.5% 0.3%
Newlands 1.3% 1.6% 0.3%
All potential 1.6% 1.5% 0.0%
N4 non-HCH 1.3% 1.4% 0.1%
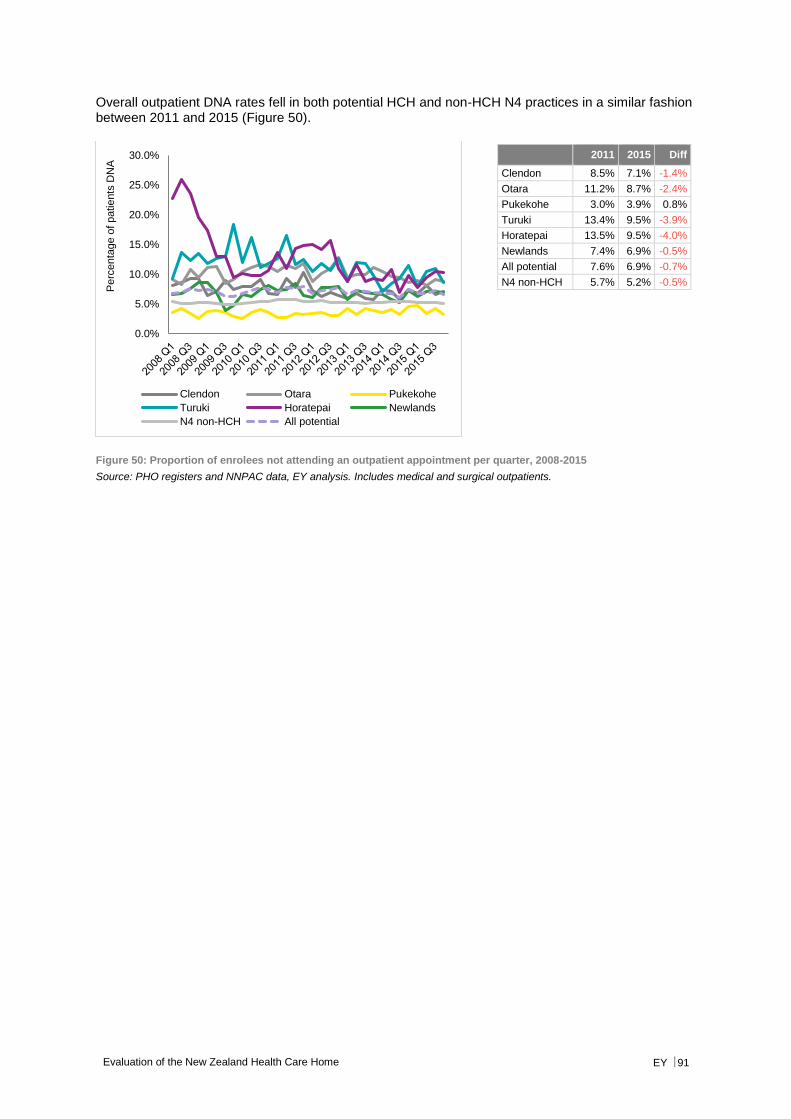
Evaluation of the New Zealand Health Care Home EY 91
Overall outpatient DNA rates fell in both potential HCH and non-HCH N4 practices in a similar fashion between 2011 and 2015 (Figure 50).
Figure 50: Proportion of enrolees not attending an outpatient appointment per quarter, 2008-2015
Source: PHO registers and NNPAC data, EY analysis. Includes medical and surgical outpatients.
0.0%
5.0%
10.0%
15.0%
20.0%
25.0%
30.0%
Perc
enta
ge o
f patie
nts
DN
A
Clendon Otara Pukekohe
Turuki Horatepai Newlands
N4 non-HCH All potential
2011 2015 Diff
Clendon 8.5% 7.1% -1.4%
Otara 11.2% 8.7% -2.4%
Pukekohe 3.0% 3.9% 0.8%
Turuki 13.4% 9.5% -3.9%
Horatepai 13.5% 9.5% -4.0%
Newlands 7.4% 6.9% -0.5%
All potential 7.6% 6.9% -0.7%
N4 non-HCH 5.7% 5.2% -0.5%
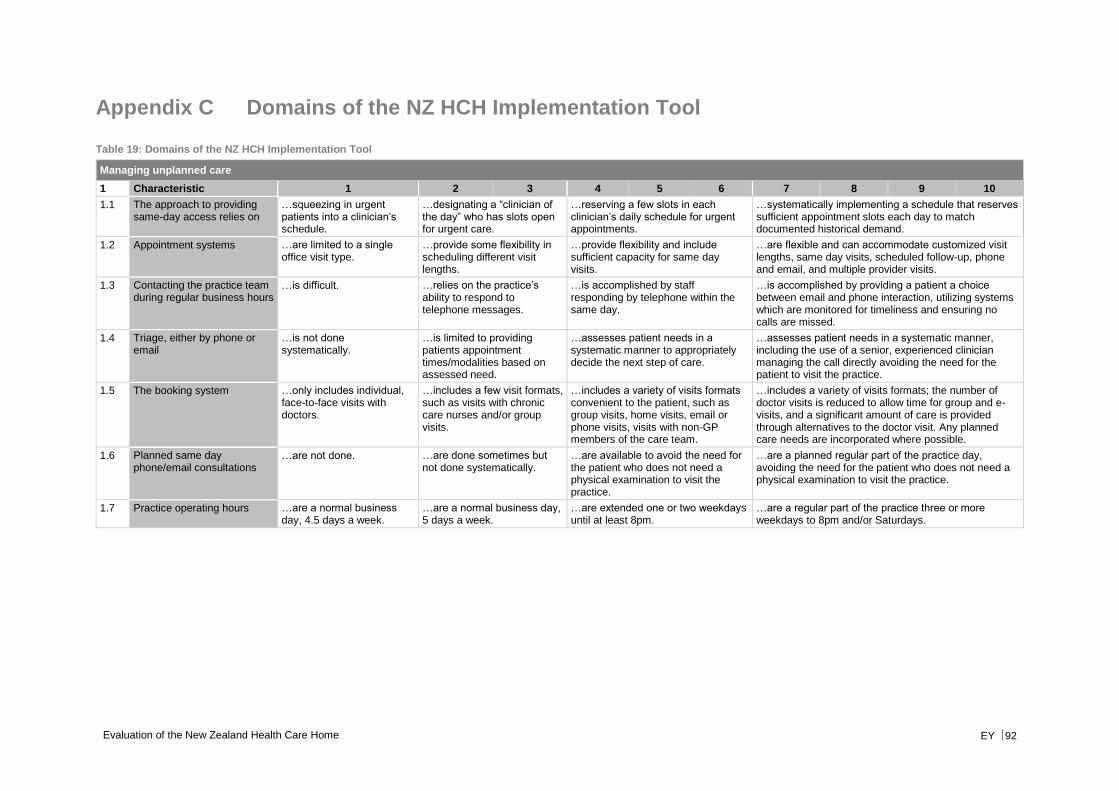
Evaluation of the New Zealand Health Care Home EY 92
Appendix C Domains of the NZ HCH Implementation Tool
Table 19: Domains of the NZ HCH Implementation Tool
Managing unplanned care
1 Characteristic 1 2 3 4 5 6 7 8 9 10
1.1 The approach to providing same-day access relies on
…squeezing in urgent patients into a clinician’s schedule.
…designating a “clinician of the day” who has slots open for urgent care.
…reserving a few slots in each clinician’s daily schedule for urgent appointments.
…systematically implementing a schedule that reserves sufficient appointment slots each day to match documented historical demand.
1.2 Appointment systems …are limited to a single office visit type.
…provide some flexibility in scheduling different visit lengths.
…provide flexibility and include sufficient capacity for same day visits.
…are flexible and can accommodate customized visit lengths, same day visits, scheduled follow-up, phone and email, and multiple provider visits.
1.3 Contacting the practice team during regular business hours
…is difficult. …relies on the practice’s ability to respond to telephone messages.
…is accomplished by staff responding by telephone within the same day.
…is accomplished by providing a patient a choice between email and phone interaction, utilizing systems which are monitored for timeliness and ensuring no calls are missed.
1.4 Triage, either by phone or email
…is not done systematically.
…is limited to providing patients appointment times/modalities based on assessed need.
…assesses patient needs in a systematic manner to appropriately decide the next step of care.
…assesses patient needs in a systematic manner, including the use of a senior, experienced clinician managing the call directly avoiding the need for the patient to visit the practice.
1.5 The booking system …only includes individual, face-to-face visits with doctors.
…includes a few visit formats, such as visits with chronic care nurses and/or group visits.
…includes a variety of visits formats convenient to the patient, such as group visits, home visits, email or phone visits, visits with non-GP members of the care team.
…includes a variety of visits formats; the number of doctor visits is reduced to allow time for group and e-visits, and a significant amount of care is provided through alternatives to the doctor visit. Any planned care needs are incorporated where possible.
1.6 Planned same day phone/email consultations
…are not done. …are done sometimes but not done systematically.
…are available to avoid the need for the patient who does not need a physical examination to visit the practice.
…are a planned regular part of the practice day, avoiding the need for the patient who does not need a physical examination to visit the practice.
1.7 Practice operating hours …are a normal business day, 4.5 days a week.
…are a normal business day, 5 days a week.
…are extended one or two weekdays until at least 8pm.
…are a regular part of the practice three or more weekdays to 8pm and/or Saturdays.
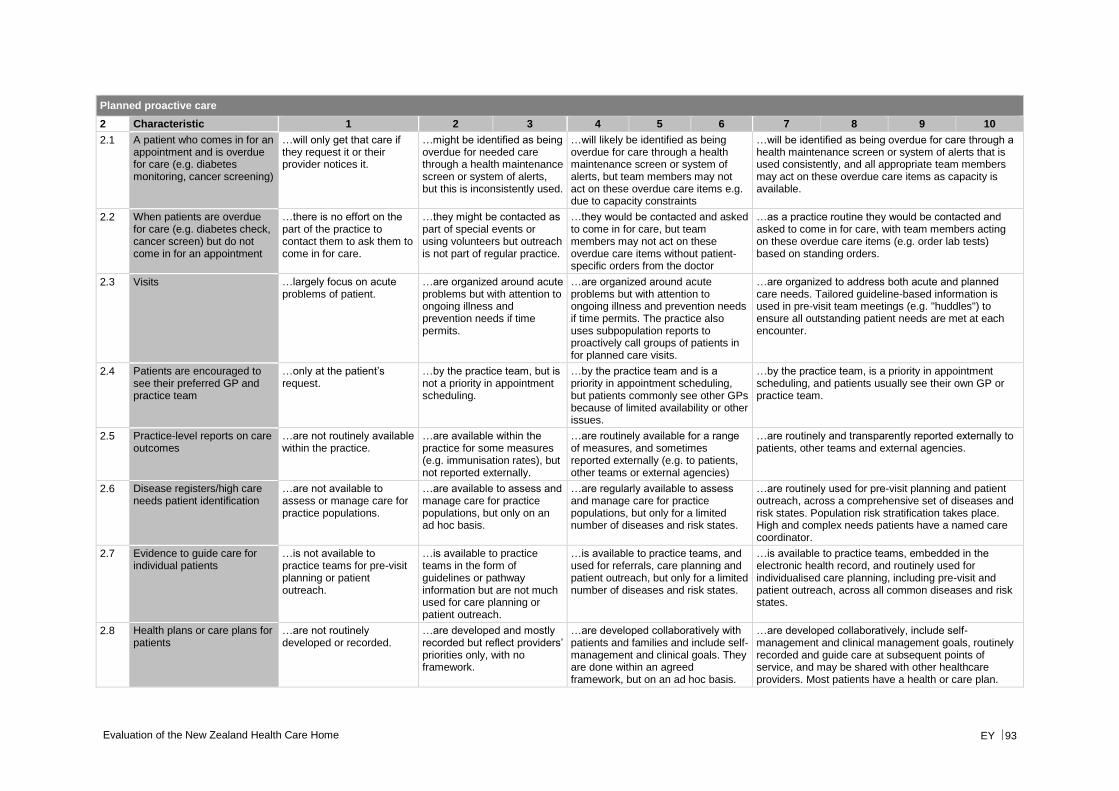
Evaluation of the New Zealand Health Care Home EY 93
Planned proactive care
2 Characteristic 1 2 3 4 5 6 7 8 9 10
2.1 A patient who comes in for an appointment and is overdue for care (e.g. diabetes monitoring, cancer screening)
…will only get that care if they request it or their provider notices it.
…might be identified as being overdue for needed care through a health maintenance screen or system of alerts, but this is inconsistently used.
…will likely be identified as being overdue for care through a health maintenance screen or system of alerts, but team members may not act on these overdue care items e.g. due to capacity constraints
…will be identified as being overdue for care through a health maintenance screen or system of alerts that is used consistently, and all appropriate team members may act on these overdue care items as capacity is available.
2.2 When patients are overdue for care (e.g. diabetes check, cancer screen) but do not come in for an appointment
…there is no effort on the part of the practice to contact them to ask them to come in for care.
…they might be contacted as part of special events or using volunteers but outreach is not part of regular practice.
…they would be contacted and asked to come in for care, but team members may not act on these overdue care items without patient-specific orders from the doctor
…as a practice routine they would be contacted and asked to come in for care, with team members acting on these overdue care items (e.g. order lab tests) based on standing orders.
2.3 Visits …largely focus on acute problems of patient.
…are organized around acute problems but with attention to ongoing illness and prevention needs if time permits.
…are organized around acute problems but with attention to ongoing illness and prevention needs if time permits. The practice also uses subpopulation reports to proactively call groups of patients in for planned care visits.
…are organized to address both acute and planned care needs. Tailored guideline-based information is used in pre-visit team meetings (e.g. "huddles") to ensure all outstanding patient needs are met at each encounter.
2.4 Patients are encouraged to see their preferred GP and practice team
…only at the patient’s request.
…by the practice team, but is not a priority in appointment scheduling.
…by the practice team and is a priority in appointment scheduling, but patients commonly see other GPs because of limited availability or other issues.
…by the practice team, is a priority in appointment scheduling, and patients usually see their own GP or practice team.
2.5 Practice-level reports on care outcomes
…are not routinely available within the practice.
…are available within the practice for some measures (e.g. immunisation rates), but not reported externally.
…are routinely available for a range of measures, and sometimes reported externally (e.g. to patients, other teams or external agencies)
…are routinely and transparently reported externally to patients, other teams and external agencies.
2.6 Disease registers/high care needs patient identification
…are not available to assess or manage care for practice populations.
…are available to assess and manage care for practice populations, but only on an ad hoc basis.
…are regularly available to assess and manage care for practice populations, but only for a limited number of diseases and risk states.
…are routinely used for pre-visit planning and patient outreach, across a comprehensive set of diseases and risk states. Population risk stratification takes place. High and complex needs patients have a named care coordinator.
2.7 Evidence to guide care for individual patients
…is not available to practice teams for pre-visit planning or patient outreach.
…is available to practice teams in the form of guidelines or pathway information but are not much used for care planning or patient outreach.
…is available to practice teams, and used for referrals, care planning and patient outreach, but only for a limited number of diseases and risk states.
…is available to practice teams, embedded in the electronic health record, and routinely used for individualised care planning, including pre-visit and patient outreach, across all common diseases and risk states.
2.8 Health plans or care plans for patients
…are not routinely developed or recorded.
…are developed and mostly recorded but reflect providers’ priorities only, with no framework.
…are developed collaboratively with patients and families and include self-management and clinical goals. They are done within an agreed framework, but on an ad hoc basis.
…are developed collaboratively, include self-management and clinical management goals, routinely recorded and guide care at subsequent points of service, and may be shared with other healthcare providers. Most patients have a health or care plan.
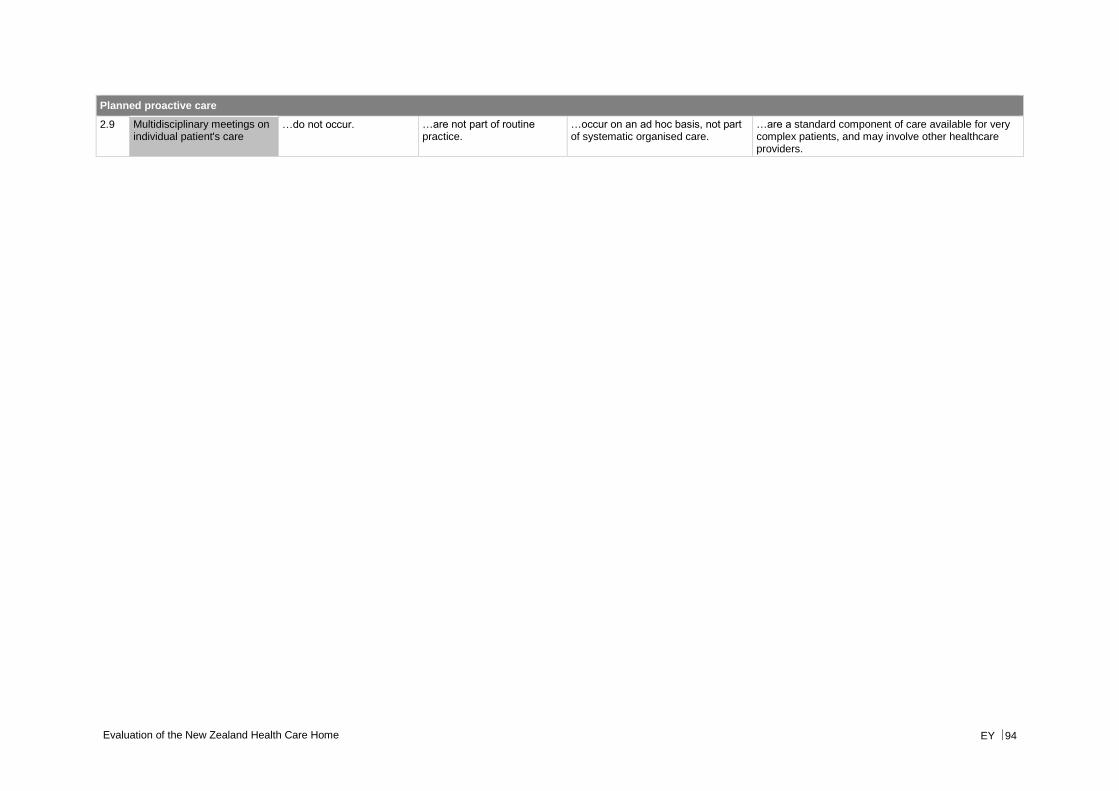
Evaluation of the New Zealand Health Care Home EY 94
Planned proactive care
2.9 Multidisciplinary meetings on individual patient's care
…do not occur. …are not part of routine practice.
…occur on an ad hoc basis, not part of systematic organised care.
…are a standard component of care available for very complex patients, and may involve other healthcare providers.
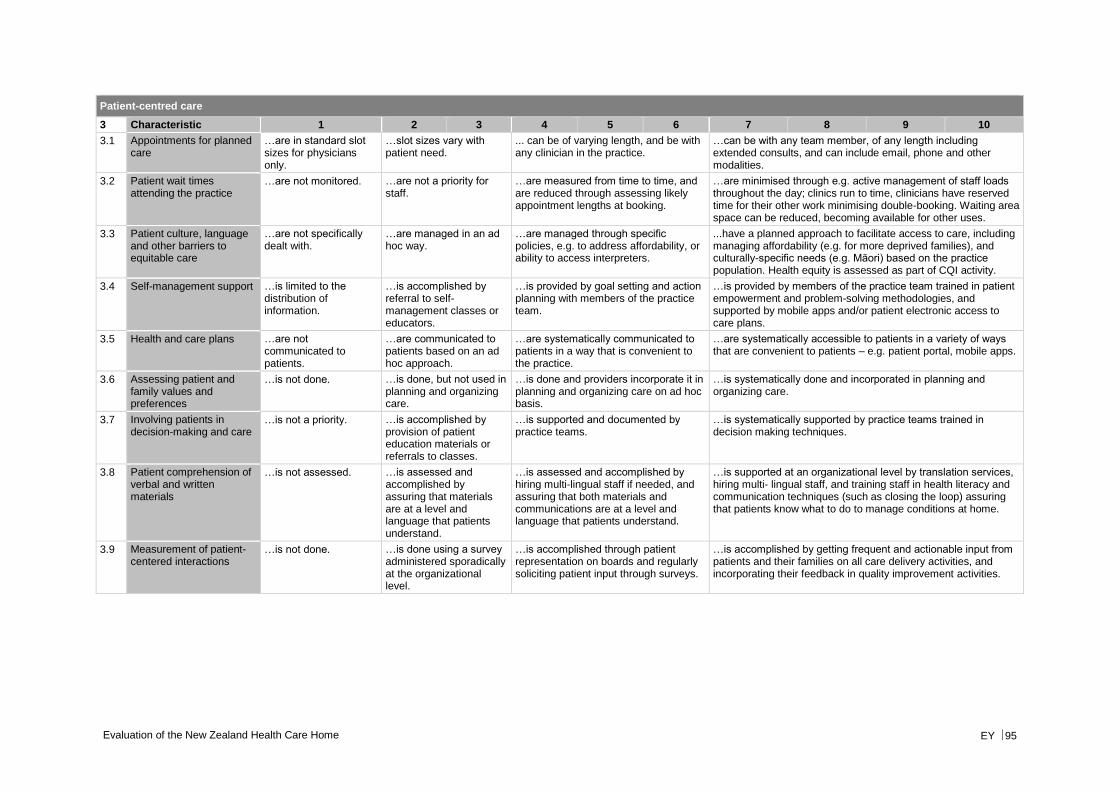
Evaluation of the New Zealand Health Care Home EY 95
Patient-centred care
3 Characteristic 1 2 3 4 5 6 7 8 9 10
3.1 Appointments for planned care
…are in standard slot sizes for physicians only.
…slot sizes vary with patient need.
... can be of varying length, and be with any clinician in the practice.
…can be with any team member, of any length including extended consults, and can include email, phone and other modalities.
3.2 Patient wait times attending the practice
…are not monitored. …are not a priority for staff.
…are measured from time to time, and are reduced through assessing likely appointment lengths at booking.
…are minimised through e.g. active management of staff loads throughout the day; clinics run to time, clinicians have reserved time for their other work minimising double-booking. Waiting area space can be reduced, becoming available for other uses.
3.3 Patient culture, language and other barriers to equitable care
…are not specifically dealt with.
…are managed in an ad hoc way.
…are managed through specific policies, e.g. to address affordability, or ability to access interpreters.
...have a planned approach to facilitate access to care, including managing affordability (e.g. for more deprived families), and culturally-specific needs (e.g. Māori) based on the practice population. Health equity is assessed as part of CQI activity.
3.4 Self-management support …is limited to the distribution of information.
…is accomplished by referral to self- management classes or educators.
…is provided by goal setting and action planning with members of the practice team.
…is provided by members of the practice team trained in patient empowerment and problem-solving methodologies, and supported by mobile apps and/or patient electronic access to care plans.
3.5 Health and care plans …are not communicated to patients.
…are communicated to patients based on an ad hoc approach.
…are systematically communicated to patients in a way that is convenient to the practice.
…are systematically accessible to patients in a variety of ways that are convenient to patients – e.g. patient portal, mobile apps.
3.6 Assessing patient and family values and preferences
…is not done. …is done, but not used in planning and organizing care.
…is done and providers incorporate it in planning and organizing care on ad hoc basis.
…is systematically done and incorporated in planning and organizing care.
3.7 Involving patients in decision-making and care
…is not a priority. …is accomplished by provision of patient education materials or referrals to classes.
…is supported and documented by practice teams.
…is systematically supported by practice teams trained in decision making techniques.
3.8 Patient comprehension of verbal and written materials
…is not assessed. …is assessed and accomplished by assuring that materials are at a level and language that patients understand.
…is assessed and accomplished by hiring multi-lingual staff if needed, and assuring that both materials and communications are at a level and language that patients understand.
…is supported at an organizational level by translation services, hiring multi- lingual staff, and training staff in health literacy and communication techniques (such as closing the loop) assuring that patients know what to do to manage conditions at home.
3.9 Measurement of patient-centered interactions
…is not done. …is done using a survey administered sporadically at the organizational level.
…is accomplished through patient representation on boards and regularly soliciting patient input through surveys.
…is accomplished by getting frequent and actionable input from patients and their families on all care delivery activities, and incorporating their feedback in quality improvement activities.
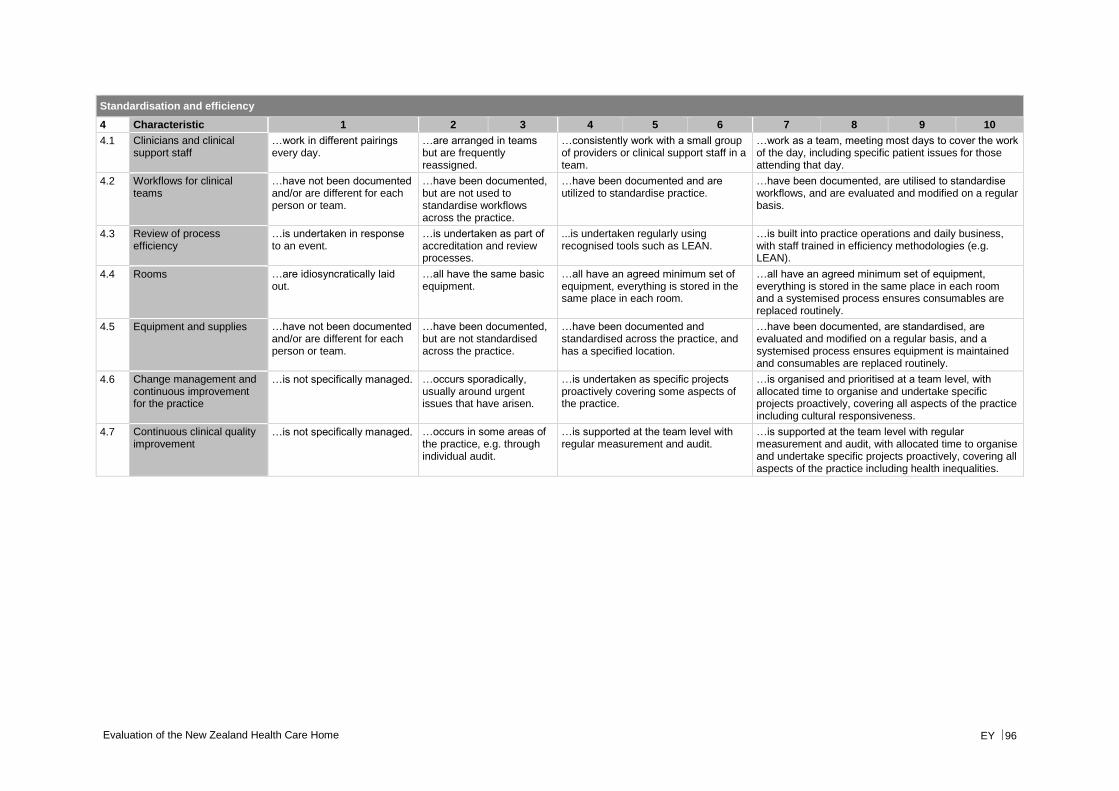
Evaluation of the New Zealand Health Care Home EY 96
Standardisation and efficiency
4 Characteristic 1 2 3 4 5 6 7 8 9 10
4.1 Clinicians and clinical support staff
…work in different pairings every day.
…are arranged in teams but are frequently reassigned.
…consistently work with a small group of providers or clinical support staff in a team.
…work as a team, meeting most days to cover the work of the day, including specific patient issues for those attending that day.
4.2 Workflows for clinical teams
…have not been documented and/or are different for each person or team.
…have been documented, but are not used to standardise workflows across the practice.
…have been documented and are utilized to standardise practice.
…have been documented, are utilised to standardise workflows, and are evaluated and modified on a regular basis.
4.3 Review of process efficiency
…is undertaken in response to an event.
…is undertaken as part of accreditation and review processes.
...is undertaken regularly using recognised tools such as LEAN.
…is built into practice operations and daily business, with staff trained in efficiency methodologies (e.g. LEAN).
4.4 Rooms …are idiosyncratically laid out.
…all have the same basic equipment.
…all have an agreed minimum set of equipment, everything is stored in the same place in each room.
…all have an agreed minimum set of equipment, everything is stored in the same place in each room and a systemised process ensures consumables are replaced routinely.
4.5 Equipment and supplies …have not been documented and/or are different for each person or team.
…have been documented, but are not standardised across the practice.
…have been documented and standardised across the practice, and has a specified location.
…have been documented, are standardised, are evaluated and modified on a regular basis, and a systemised process ensures equipment is maintained and consumables are replaced routinely.
4.6 Change management and continuous improvement for the practice
…is not specifically managed. …occurs sporadically, usually around urgent issues that have arisen.
…is undertaken as specific projects proactively covering some aspects of the practice.
…is organised and prioritised at a team level, with allocated time to organise and undertake specific projects proactively, covering all aspects of the practice including cultural responsiveness.
4.7 Continuous clinical quality improvement
…is not specifically managed. …occurs in some areas of the practice, e.g. through individual audit.
…is supported at the team level with regular measurement and audit.
…is supported at the team level with regular measurement and audit, with allocated time to organise and undertake specific projects proactively, covering all aspects of the practice including health inequalities.
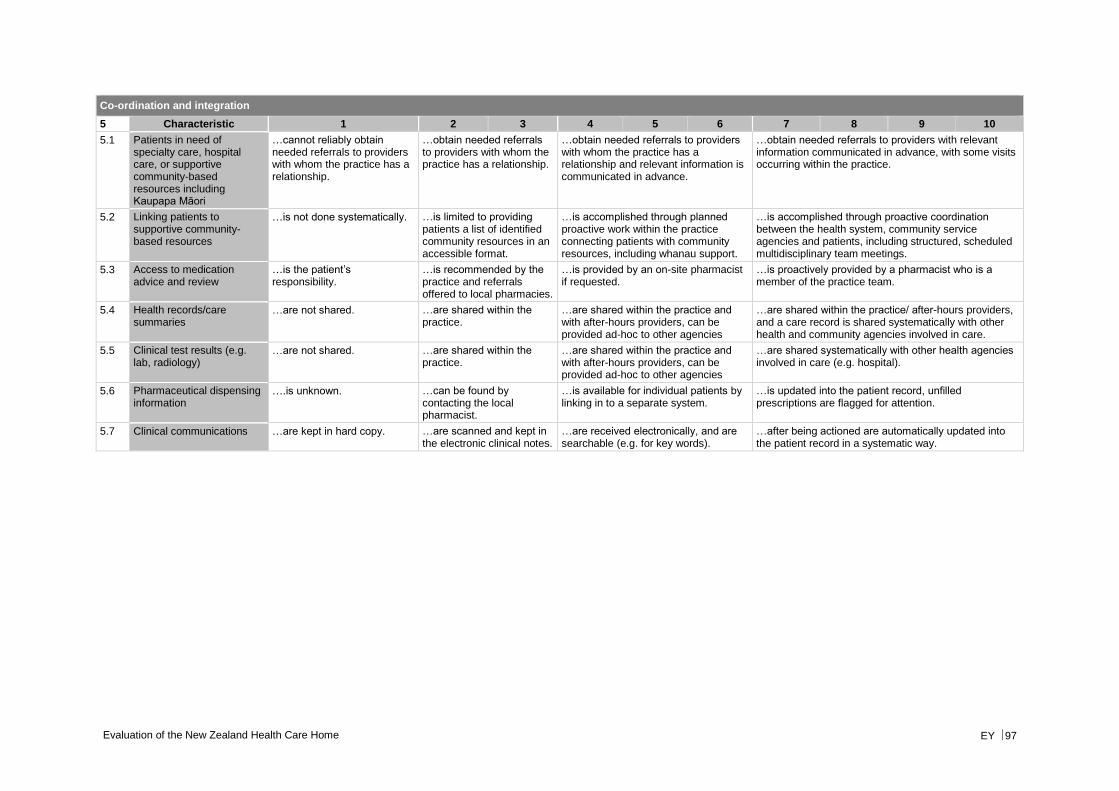
Evaluation of the New Zealand Health Care Home EY 97
Co-ordination and integration
5 Characteristic 1 2 3 4 5 6 7 8 9 10
5.1 Patients in need of specialty care, hospital care, or supportive community-based resources including Kaupapa Māori
…cannot reliably obtain needed referrals to providers with whom the practice has a relationship.
…obtain needed referrals to providers with whom the practice has a relationship.
…obtain needed referrals to providers with whom the practice has a relationship and relevant information is communicated in advance.
…obtain needed referrals to providers with relevant information communicated in advance, with some visits occurring within the practice.
5.2 Linking patients to supportive community- based resources
…is not done systematically. …is limited to providing patients a list of identified community resources in an accessible format.
…is accomplished through planned proactive work within the practice connecting patients with community resources, including whanau support.
…is accomplished through proactive coordination between the health system, community service agencies and patients, including structured, scheduled multidisciplinary team meetings.
5.3 Access to medication advice and review
…is the patient’s responsibility.
…is recommended by the practice and referrals offered to local pharmacies.
…is provided by an on-site pharmacist if requested.
…is proactively provided by a pharmacist who is a member of the practice team.
5.4 Health records/care summaries
…are not shared. …are shared within the practice.
…are shared within the practice and with after-hours providers, can be provided ad-hoc to other agencies
…are shared within the practice/ after-hours providers, and a care record is shared systematically with other health and community agencies involved in care.
5.5 Clinical test results (e.g. lab, radiology)
…are not shared. …are shared within the practice.
…are shared within the practice and with after-hours providers, can be provided ad-hoc to other agencies
…are shared systematically with other health agencies involved in care (e.g. hospital).
5.6 Pharmaceutical dispensing information
….is unknown. …can be found by contacting the local pharmacist.
…is available for individual patients by linking in to a separate system.
…is updated into the patient record, unfilled prescriptions are flagged for attention.
5.7 Clinical communications …are kept in hard copy. …are scanned and kept in the electronic clinical notes.
…are received electronically, and are searchable (e.g. for key words).
…after being actioned are automatically updated into the patient record in a systematic way.
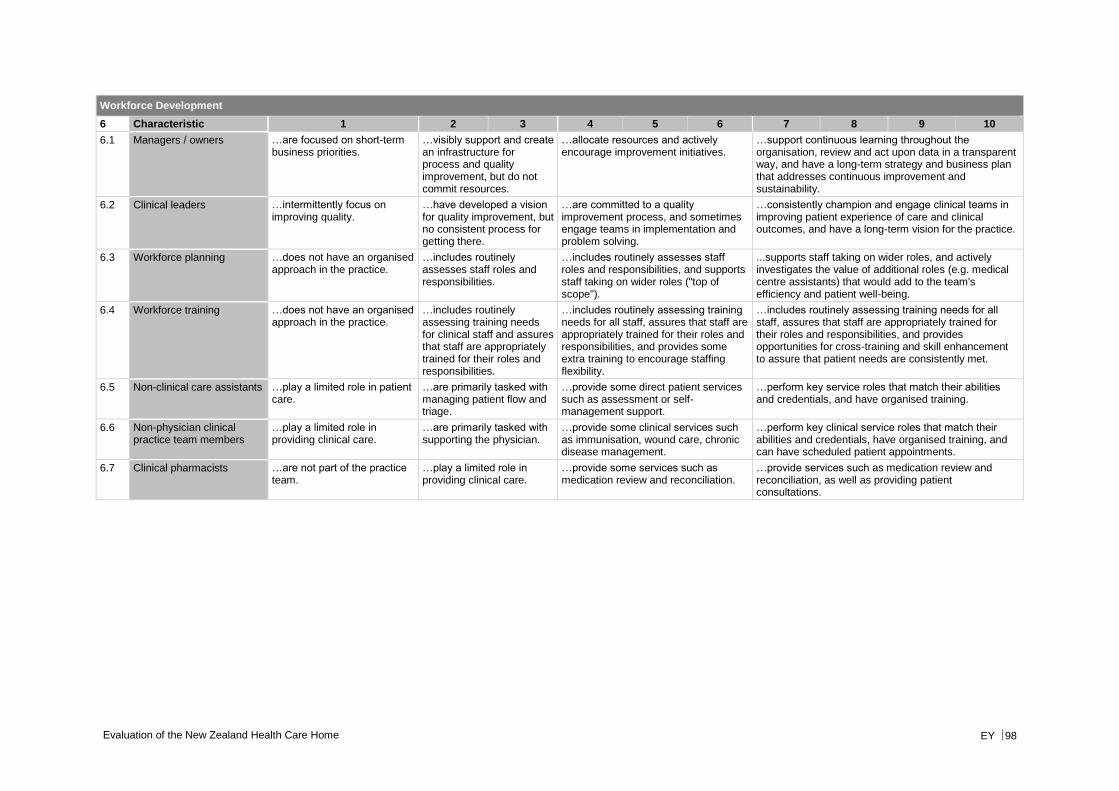
Evaluation of the New Zealand Health Care Home EY 98
Workforce Development
6 Characteristic 1 2 3 4 5 6 7 8 9 10
6.1 Managers / owners …are focused on short-term business priorities.
…visibly support and create an infrastructure for process and quality improvement, but do not commit resources.
…allocate resources and actively encourage improvement initiatives.
…support continuous learning throughout the organisation, review and act upon data in a transparent way, and have a long-term strategy and business plan that addresses continuous improvement and sustainability.
6.2 Clinical leaders …intermittently focus on improving quality.
…have developed a vision for quality improvement, but no consistent process for getting there.
…are committed to a quality improvement process, and sometimes engage teams in implementation and problem solving.
…consistently champion and engage clinical teams in improving patient experience of care and clinical outcomes, and have a long-term vision for the practice.
6.3 Workforce planning …does not have an organised approach in the practice.
…includes routinely assesses staff roles and responsibilities.
…includes routinely assesses staff roles and responsibilities, and supports staff taking on wider roles ("top of scope").
...supports staff taking on wider roles, and actively investigates the value of additional roles (e.g. medical centre assistants) that would add to the team's efficiency and patient well-being.
6.4 Workforce training …does not have an organised approach in the practice.
…includes routinely assessing training needs for clinical staff and assures that staff are appropriately trained for their roles and responsibilities.
…includes routinely assessing training needs for all staff, assures that staff are appropriately trained for their roles and responsibilities, and provides some extra training to encourage staffing flexibility.
…includes routinely assessing training needs for all staff, assures that staff are appropriately trained for their roles and responsibilities, and provides opportunities for cross-training and skill enhancement to assure that patient needs are consistently met.
6.5 Non-clinical care assistants …play a limited role in patient care.
…are primarily tasked with managing patient flow and triage.
…provide some direct patient services such as assessment or self-management support.
…perform key service roles that match their abilities and credentials, and have organised training.
6.6 Non-physician clinical practice team members
…play a limited role in providing clinical care.
…are primarily tasked with supporting the physician.
…provide some clinical services such as immunisation, wound care, chronic disease management.
…perform key clinical service roles that match their abilities and credentials, have organised training, and can have scheduled patient appointments.
6.7 Clinical pharmacists …are not part of the practice team.
…play a limited role in providing clinical care.
…provide some services such as medication review and reconciliation.
…provide services such as medication review and reconciliation, as well as providing patient consultations.
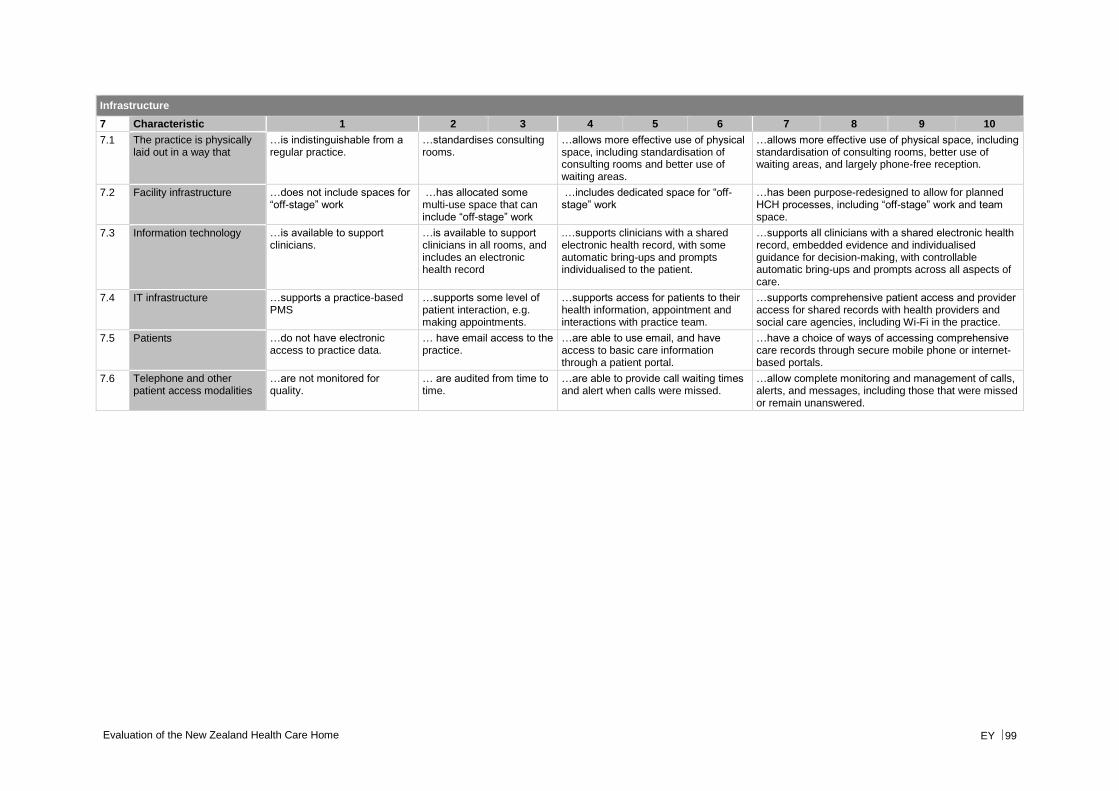
Evaluation of the New Zealand Health Care Home EY 99
Infrastructure
7 Characteristic 1 2 3 4 5 6 7 8 9 10
7.1 The practice is physically laid out in a way that
…is indistinguishable from a regular practice.
…standardises consulting rooms.
…allows more effective use of physical space, including standardisation of consulting rooms and better use of waiting areas.
…allows more effective use of physical space, including standardisation of consulting rooms, better use of waiting areas, and largely phone-free reception.
7.2 Facility infrastructure …does not include spaces for “off-stage” work
…has allocated some multi-use space that can include “off-stage” work
…includes dedicated space for “off-stage” work
…has been purpose-redesigned to allow for planned HCH processes, including “off-stage” work and team space.
7.3 Information technology …is available to support clinicians.
…is available to support clinicians in all rooms, and includes an electronic health record
.…supports clinicians with a shared electronic health record, with some automatic bring-ups and prompts individualised to the patient.
…supports all clinicians with a shared electronic health record, embedded evidence and individualised guidance for decision-making, with controllable automatic bring-ups and prompts across all aspects of care.
7.4 IT infrastructure …supports a practice-based PMS
…supports some level of patient interaction, e.g. making appointments.
…supports access for patients to their health information, appointment and interactions with practice team.
…supports comprehensive patient access and provider access for shared records with health providers and social care agencies, including Wi-Fi in the practice.
7.5 Patients …do not have electronic access to practice data.
… have email access to the practice.
…are able to use email, and have access to basic care information through a patient portal.
…have a choice of ways of accessing comprehensive care records through secure mobile phone or internet-based portals.
7.6 Telephone and other patient access modalities
…are not monitored for quality.
… are audited from time to time.
…are able to provide call waiting times and alert when calls were missed.
…allow complete monitoring and management of calls, alerts, and messages, including those that were missed or remain unanswered.

EY | Assurance | Tax | Transactions | Advisory About EY EY is a global leader in assurance, tax, transaction and advisory services. The insights and quality services we deliver help build trust and confidence in the capital markets and in economies the world over. We develop outstanding leaders who team to deliver on our promises to all of our stakeholders. In so doing, we play a critical role in building a better working world for our people, for our clients and for our communities.
EY refers to the global organisation and may refer to one or more of the member firms of Ernst & Young Global Limited, each of which is a separate legal entity. Ernst & Young Global Limited, a UK company limited by guarantee, does not provide services to clients. For more information about our organisation, please visit ey.com.
©2017 Ernst & Young, New Zealand. All Rights Reserved.
ey.com