Embed Size (px)
Citation preview

ublication No. 0 1 -OOiA-002
EVALUATION OF FLUID BED DECO
OF PHOSPHOGYPSUM
EPO
PREPARED BY ZELLARS-WILLCA , INC.
UNDER A GRANT SPONSORED BY THE
STITUTE OF PHOSPHATE RESEA
BARTOW, FLORIDA
August, 1982
FIPR-Ol-002A-002 COPY 2
FLORIDA INSTITUTE OF PHOSPHATE RESEARCH

.EVALUATION,OF THE FLUID BED DECOMPOSITION OF PHOSPHOGYPSUM
FINAL REPORT
BY
ZELLARS-WILLIAMS, INC. P. 0. Box 2008
Lakeland, Florida 33806 - 2008
Principal Investigator: A. P. Kouloheris
Prepared for
FLORIDA INSTITUTE OF PHOSPHATE RESEARCH 1855 West Main Street
Bartow, Florida 33830
Project Manager: G. Michael Lloyd, Jr.
August, 1982
PREPARED UNDER CONTRACT NO. 80-Ol-002A
DISCLAIMER
The contents of this report are reproduced herein as received from the contractor.
The opinions, findings, and conclusions expressed herein are not necessarily those of the Florida Institute of Phosphate Research, nor does mention of company names or products con- stitute endorsement by the Florida Institute of Phosphate Research.

PURPOSE
INTRODUCTION General Process Description
PROJECT OBJECTIVES Feed Prepara t ion Thermal Decompos i t ion
TABLE OF CONTENTS
PROCESS DEVELOPMENT METHODOLOGY AND PROCEDURES Feed Preparation Thermal Decomposition Engineering and Economics
TEST RESULTS Raw Materials Characterization Gypsum Prepara t ion Thermal Decomposition
ENGINEERING AND ECONOMICS Gypsum Preparation Engineering Design Thermal Decomposition Engineering Design Cost Engineering and Economics Sulfur Burning Operating Cost Basis ISU Process Operating Cost Basis Steam Credit
CONCLUSIONS
RECOMMENDATIONS
APPENDICES Appendix A Appendix B Appendix C Appendix D
Paqe
1
2 2
5
:
2 13 15
94
35

LIST OF FIGURES
1. The investigation of the ISU thermal decomposition for phosphogypsum
2. Schematic diagram of the hydrocyclone testing circuit used in the initial dewatering studies
3. Schematic diagram of equipment used in the gravity thickening tests
4. Schematic diagram of filtration equipment used in dewatering/ washing tests
5.
6.
7.
Schematic of CE-Raymond pilot cage mill flash dryer
Schematic diagram of the combusion tube furnace
Simplified schematic diagram of the ISU fluidited bed reaction system
8. Comparison of size distributions of phosphogypsum samples used in studies with “Typical”
9.
10.
11.
Overall mass balance from f locculant
phosphogypsum
process simulation test w i thout
Overall mass balance from flocculation
process simulation test w ith
Desulfurization versus reaction time for briquetted phosphogypsum in the combustion tube furnace with an alternating atmosphere of CO (2 min.) and 02 (1 min.)
12.
13.
14. Desulfurization versus % coal in the feed for briquetted gypsum at a
15. Desu desu
16. Desu
-- 30 minute desulfuritation time 53
furitation versus % coal in briquetted gypsum at a 15 minute furization time 54
furitation versus reaction time for co-briquetted gypsum and
Desulfurization versus reaction time for briquetted phosphogypsum in the combustion tube furnace with an alternating atmosphere of 10% CO (2 min.) and 2% 02 (1 min.)
Desulfur izat ion versus reaction time for briquetted phosphogypsum in the combustion tube furnace with an alternating atmosphere of CO (2 min.) and 02 (1 min.)
coal
Page
4
7
9
11
12
14
16
19
33
34
47
49
SO
55

LIST OF FIGURES (Cont’d)
Paqe
17. Effect of gypsum feed rate on retention time in the Fluidized Bed Reactor
18. Overall percent desulfuritation vs. gypsum feed rate
19. Desulfurization of entrained solids vs. gypsum feed rate
20. Percent of feed entrained vs. gypsum feed rate
64
66
68
69
I.
II.
III.
IV.
V.
VI.
VI I.
VI I I.
IX.
X.
XI.
Xl I.
XIII.
XIV.
xv.
XVI.
XVI I.
XVIII
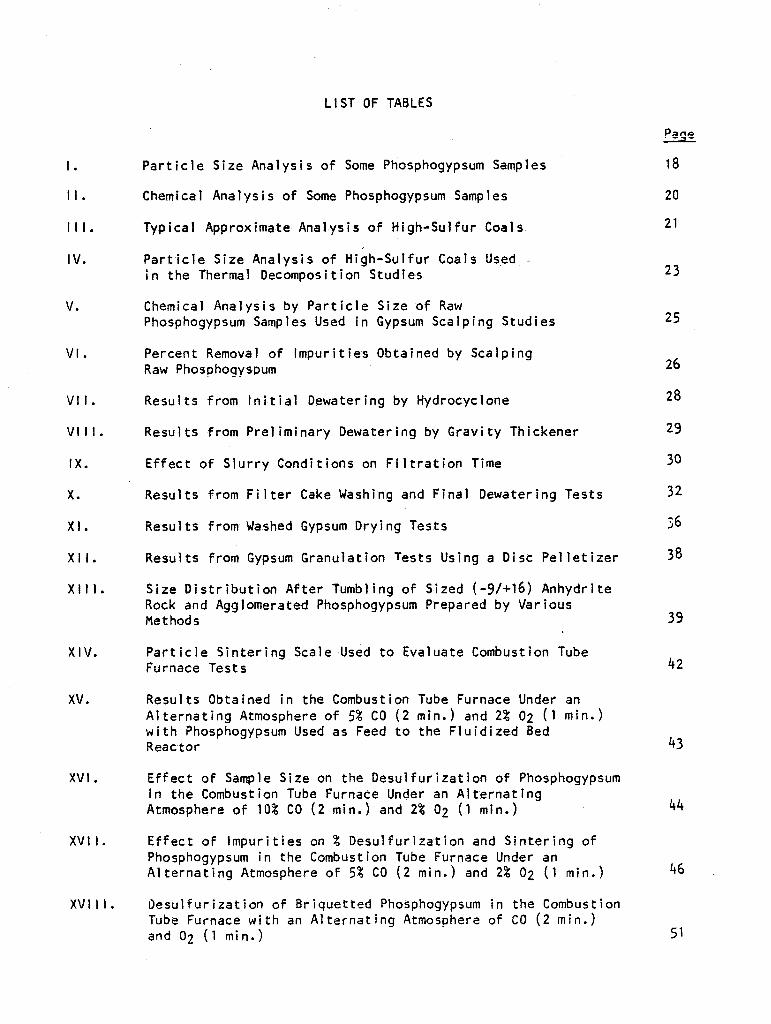
LIST OF TABLES
Particle Size Analysis of Some Phosphogypsum Samples
Chemical Analysis of Some Phosphogypsum Samples
Typical Approximate Analysis of High-Sulfur Coals
Particle Size Analysis of High-Sulfur Coals Used - in the Thermal Decomposition Studies
Chemical Analysis by Particle Size of Raw Phosphogypsum Samples Used in Gypsum Scalping Studies
Percent Removal of Impurities Obtained by Scalping Raw Phosphogyspum
Results from Initial Oewatering by Hydrocyclone
Results from Preliminary Dewatering by Gravity Thickener
Effect of Slurry Conditions on Filtration Time
Results from Filter Cake Washing and Final Dewatering Tests
Results from Washed Gypsum Drying Tests
Results from Gypsum Granulation Tests Using a Disc Pelletiter
Size Distribution After Tumbling of Sized (-g/+16) Anhydrite Rock and Agglomerated Phosphogypsum Prepared by Various Methods
Particle Sintering Scale Used to Evaluate Combustion Tube Furnace Tests
Results Obtained in the Combustion Tube Furnace Under an Alternating Atmosphere of 5% CO (2 min.) and 2% 02 (1 min.) with Phosphogypsum Used as Feed to the Fluidized Bed Reactor
Effect of Sample Size on the Desulfuritation of Phosphoqypsum in the Combustion Tube Furnace Under an Alternating ’ -.’ Atmosphere of 10% CO (2 min.) and 2% 02 (1 min.)
Effect of Impurities on 5; Desulfuritation and Sintering of Phosphogypsum in the Combustion Tube Furnace Under an Alternating Atmosphere OF 5% CO (2 min.) and 2% 02 (1 min.
Desulfurization of Briquetted Phosphogypsum in the Combust Tube Furnace with an Alternating Atmosphere of CO (2 min.) and 02 ( 1 mi n. )
)
ion
Page
18
20
21
23
25
26
28
29
30
32
36
38
39
42
43
44
46
51
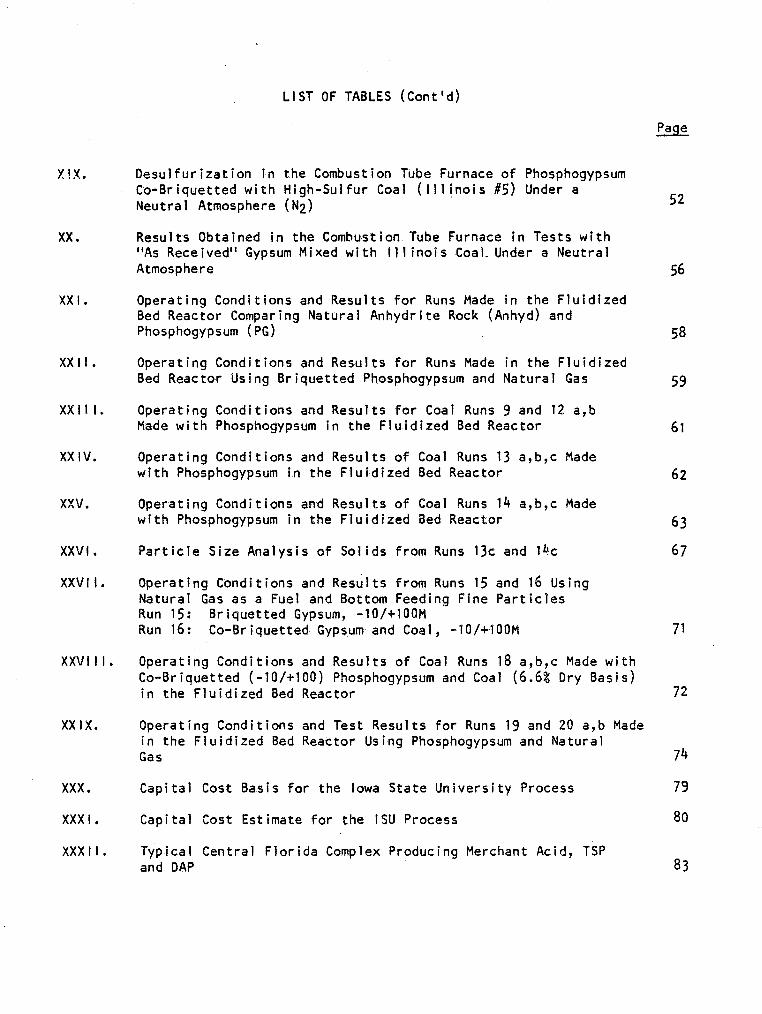
LIST OF TABLES (Cont’d)
X!X.
xx.
xx I.
XXI I *
XXII I.
xx IV.
xxv.
XXVI.
XXVI I.
XXVIII.
xx IX.
xxx l
xxx I.
xxx I I *
Desulfurization in the Combustion Tube Furnace of Phosphogypsum Co-Briquetted with High-Sulfur Coal (llli,nois #5) Under a Neu t ra 1 Atmosphere ( N2)
Results Obtained in the Combustion Tube Furnace in Tests with “As Received” Gypsum Mixed with Illinois Coal. Under a Neutral Atmosphere
Operating Conditions and Results for Runs Made in the Fluidized Bed Reactor Comparinq Natural Anhydrite Rock (Anhyd) and Phosphogypsum (PG) -
Operating Conditions and Results for Runs Made Bed Reactor Using Br iquetted Phosphogypsum and
Operating Conditions and Results for Coal Runs
in the Fluidized Natural Gas 59
9 and 12 a,b Made with Phosphogypsum in the Fluidized Bed Reactor 61
Operating Conditions and Results of Coal Runs 13 a,b,c Made with Phosphogypsum in the Fluidized Bed Reactor
Operating Conditions and Results of Coal Runs 14 a,b,c Made with Phosphogypsum in the Fluidized Bed Reactor
Particle Size Analysis of Solids from Runs 13c and 14~
Operating Conditions and Results from Runs 15 and lb Using Natural Gas as a Fuel and Bottom Feeding Fine Particles Run 15: Briquetted Gypsum, -lO/+lOOM Run 16: Co-Br iquetted Gypsum and Coal, -lO/+lOOM
Operating Conditions and Results of Coal Runs 18 a,b,c Made with Co-Briquetted (-lO/+lOO) Phosphogypsum and Coal (6.6% Dry Basis) in the Fluidized Bed Reactor
Operating Conditions and Test Results for Runs 19 and 20 a,b Made in the Fluidized Bed Reactor Using Phosphogypsum and Natural Gas
Capital Cost Basis for the Iowa State University Process
Capital Cost Estimate for the ISU Process
Typical Central Florida Complex Producing Merchant Acid, TSP and DAP
Page
52
56
58
62
63
67
71
72
74
79
80
83
LIST OF TABLES (Cont'd)
Page
xxx1 I I.
xxx IV.
I.
XXXVII.
XXXVIII.
XXXIX.
XL.
XLI.
XLII.
Sulfuric Acid Operating Cost Summary (Liquid Sulfur Burning) ($125/LT Sulfur)
Sulfuric Acid Operating Cost Summary (ISU Process) ($125/LT Sulfur)
Sulfuric Acid Operating Cost Summary (Liquid Sulfur Burning) ($155/LT Sulfur)
Sulfuric Acid Operating Cost Summary (ISU Process) ($lSS/LT Sulfur)
Process Steam Production Cost (For ISU Process)
Sulfuric Acid Plant Conversion Cost (For ISU Process)
H2SO4 Acid Manufacturing Comparison
Operating Cost for Gypsum Make-up
Breakeven Sulfur Price without Lime Credit
Breakeven Sulfur Price with Lime Credit
84
85
86
87
88
89
90
91
92
92

PURPOSE
On July 1, 1981, the Florida Institute of Phosphate Research (FIPR) contracted Zellars-Williams, inc. (ZW) to investigate and evaluate the thermal decomposition of phosphogypsum to SO2 and CaO by the Iowa State University (ISU) process (FIPR Award Number 80-01402A - Phase II). This report documents the work completed during the project and contains the overall state of the process development through the termination of Phase II of the project on May 31, 1982.
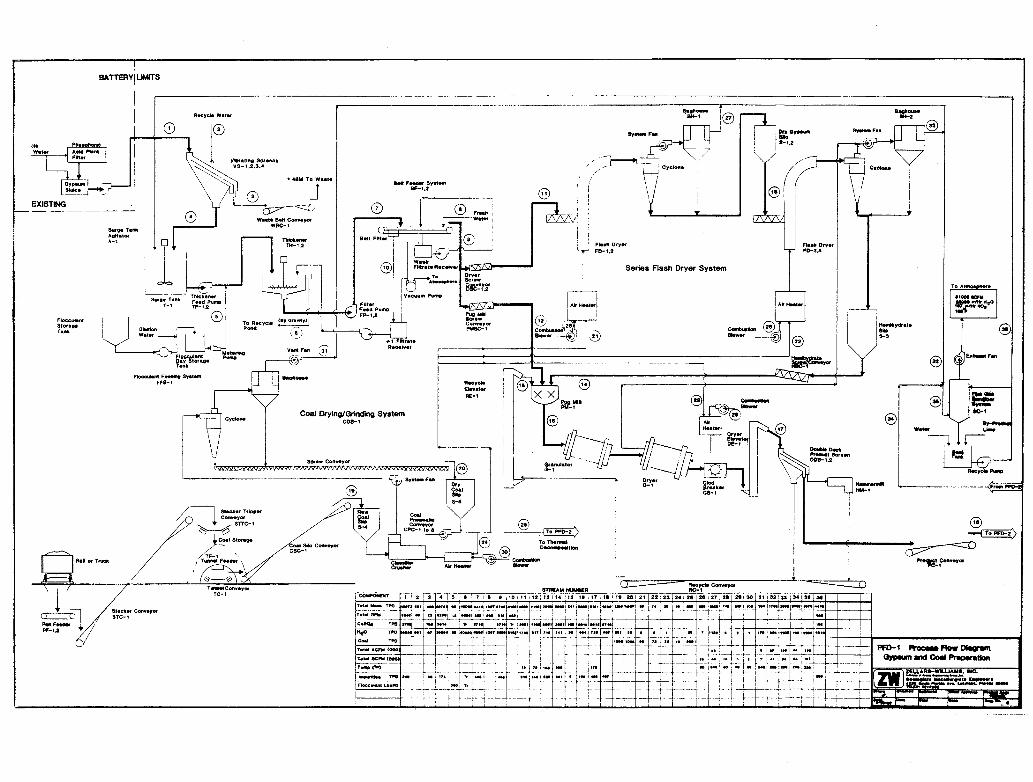
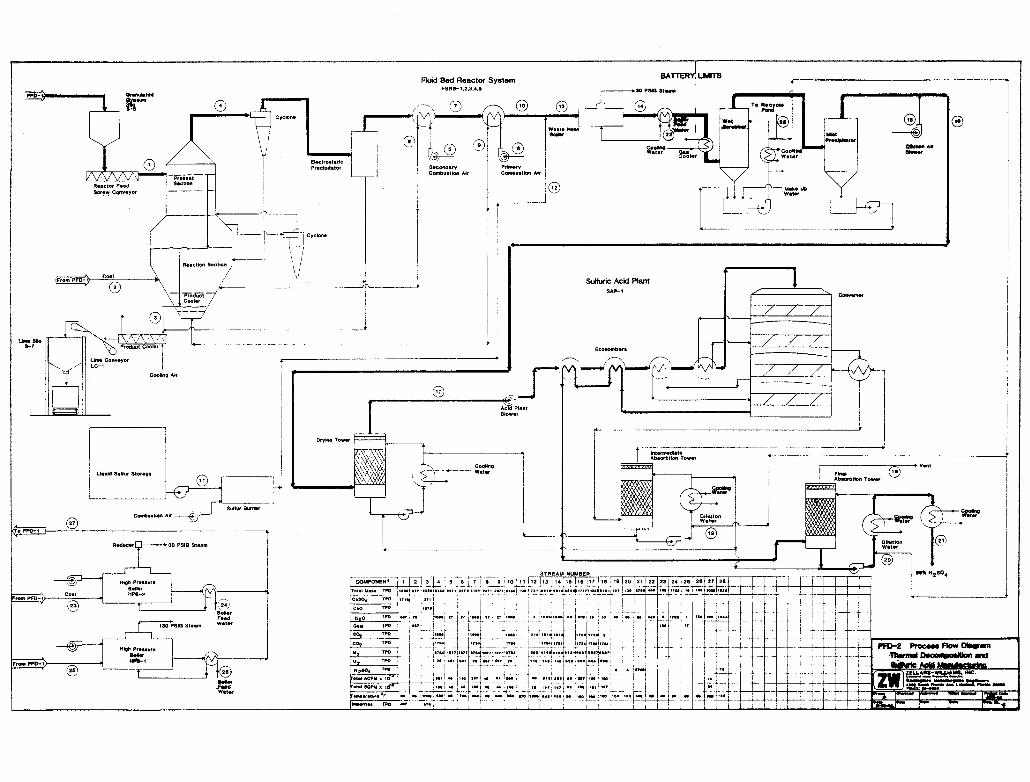
Included in this report is the data developed from the study, an overall process description, and an economic analysis of the process. In addition,
process flow diagrams and material and heat balances have been developed for a full-scale plant (4,700 tons gypsum/day) of the thermal decomposition process as well as the gypsum feed preparation process.
-2-
The present investigation 1 i terature search by ZW to find
INTRODUCTION
was initiated upon the completion of a a promising process which utilizes by-product
phosphogypsum from phosphoric acid production (Gypsum By-Product Exploitation: Phase I), The process chosen at that time as having the most potential for development was one (patented by Dr. T. 0. Wheelock) which was developed to thermally decompose crushed anhydrite rock in a fluidized bed reactor to form sulfur dioxide, for sulfuric acid production, and calcium oxide as’ products. This process was selected because it produces a raw-material (H2SO4) vital to the Fertilizer Industry and a by-product lime that could have a potential market value for slimes consolidation and waste water neutralization-uses also vital to the Fertilizer Industry.
As part of Phase I , a seminar on the process was held at ISU with phosphate industry representatives in attendance. Included in the presentation to industry was a feasibility demonstration run of the thermal decomposition process conducted on a 6-inch diameter fluidized bed reactor with natural gas as a fuel.
The second phase of the project, of which this is the final report, involved adapting and testing the process for use with phosphogypsum, using high-sulfur coal as a fuel for the reactor. As a part of the study, a procedure for the pre-treatment of the phosphogypsum was tested and a process developed to perform this function. The thermal decomposition tests were conducted at two l.evels of investiqation: 1) batch studies in a modified combustion tube furnace; and 2) continuous operation in the ISU 6-inch fluidized bed bench scale reactor.
Capital and operating cost estimates are included in this report. In addition, detailed process flowsheets for a 4,700 TPD facility have been included in this study. A prel iminary cost evaluation of the developed process has been carried out.
General Process Description
The I SU process was originally invented and tested for the desulfurization of ground natural anhydrite rock (calcium sulfate) into calcium oxide (CaO) and sulfur dioxide (SO2) in a fluidized bed reactor fired by natural gas. The innovative concept involved the presence of two zones within the fluidized bed, a reducing zone in the bottom portion of the bed and an oxidizing zone in the upper portion. This concept developed from the finding that under reducing conditions calcium sulfate (CaSO4) decomposed to CaO, S02, and calcium sulfide (CaS) at a lower temperature than it did under oxidizing conditions. The oxidizing zone in the reactor was then used to convert the CaS Formed in the reducing zone to CaO, S02, and a small amount of Ca SO4. Internal circulation of the bed material subjected it to alternating reducing/oxidizing conditions resulting in a high desulfurization efficiency.

-3-
The overall process concept at the beginning of the project consisted of the following steps: a) Clean-up of the phosphogypsum was required to reduce impuriti.es to a level similar to that of natural anhydrite so that sintering of the particles would be minimized thereby minimizing materials build-up in the reactor while obtaining high desulfurization. b) Particle size enlargement of the feed to the thermal decomposition step was also required as part of the pretreatment process to minimize unreacted particle entrainment in the off-gas as a result of the high gas velocities in the reactor. c) Decomposi t ion was to be carried out in a two-tone fluidized bed reactor using high-sulfur coal as the fuel. d) The reactor off-gas would be converted to sulfuric acid in a plant similar to those_ being used in sulfur- burning processes.
This report describes and discusses in detail the test work and results of this project. An integrated approach of receiving the phosphogypsum raw material to producing final lizSO acid was taken as,shown in Figure 1.

-5-
PROJECT OBJECTIVES
The overal 1 objective of this project was to develop a process to produce a clean SO2 gas from phosphogypsum using high sulfur coal as the fuel, based on the ISU thermal decomposition process. The capital and operating cost estimates for the process were to be developed as we1 1. Specific objectives are further defined by area below.
Feed Preparation
The objective of the feed preparation studies was to develop a detai led battery limits design for a process that will produce a consistent quality gypsum feed to the thermal decomposition area. This process design was based on bench or pilot scale equipment tests, depending on scale-up requirements. The results obtained from these studies were used as the design criteria for preliminary equipment sizing and cost estimation.
Thermal Decomposition
The objective of the testing conducted by ISU was to develop a process design for the thermal decompos i t ion of pretreated phosphogypsum in a fluidized bed reactor using high-sulfur coal as the fuel. This process design was based on laboratory and bench scale equipment tests. The results obtained from this work were used for full-scale equipment sizing and cost estimation. The economic analysis of the process considers the capital and operat,:ng cost estimates for both the feed preparation and thermal decomposition processes.

-6-
PROCESS DEVELOPMENT METHODOLOGY AND PROCEDURES
Feed Preoaration
Preliminary results at ISU indicated that some degree of phosphogypsum clean-up was required before it could be used in the fluidized bed reactor. In addition, the individual partiele size of the feed had to be of a size which could sustain the high velocities required with the fluid bed reactor without becoming entrained in the off-gas.
Phosphogypsum clean-up studies were conducted -in ‘such a way that each unit operation cons i dered for the overal 1 process could be examined independently under various operating conditions. On the basis of these tests the type of equipment used for each step in the process was selected. Brief descriptions of the procedures used for the individual unit operation studies are discussed below.
Scalping
Requirements for scalping inerts and potential harmful impurities from phosphogypsum were determined by conducting sieve analysis on the gypsum and analyzing the resulting particle size fractions for total P205, water soluble P205, acid insolubles, and fluorine. Sieve analyses were conducted as outi i ned
53 by W.
1.
2.
on pages 14 through 18 of “Testing Sieves and fhei r Uses”, Handbook S. Tyler, Inc. (Mentor, Ohio) with the following exceptions:
Because dihydrate gypsum readily loses its crystal1 ine waters of hydration at elevated temperatures, all drying was done in an oven set at 500 C. Samples were allowed to dry for 16 hours before weighing.
When wet screening gypsum, cool ing pond water was used to wash the gypsum through the sieves. This was done because gypsum and some of the contaminates present in the gypsum are partially soluble in fresh water; the cooling pond water is saturated with gypsum.
Initial Dewaterinq
Because of the low solids concentration of the gypsum sluice stream, the majority of the water needs to be removed to minimize the hydraulic load on the downstream solids-liquid separation.
Gypsum dewa ter i ng tests were conducted using a 3-inch hydrocyclone. Parameters investigated were: 3) pressure differential,
1) apex diameter, 2) vortex finder diameter, and 4) feed solids concentration.
Gypsum feed slurry was prepared by mixing gypsum obtained from a producer’s gypsum pile with water in a pre-calculated ratio. The specific gravity of the slurry was then measured to check percent solids of the slurry. A diagram of the hydrocyclone test circuit is shown in Figure 2.
The slurry was pumped to the hydrocyclone and the overflow and underflow returned to a sump. A recycle line was placed on the pump discharge so that

-7-
VENT
t
3 INCH CYCLONE
RECYCLE VALVE
SUMP CENTRIFUGAL PUMP
FIGURE 2. Schematic diagram of the hydrocyclone testing circuit used in the initial dewatering studies.

-a-
the pressure across the cyclone could be adjusted. The pressure across the cyc 1 one was measured by a pressure gauge mounted on the cyclone inlet. Overflow and underflow rates were obtained by collecting the respective flows over a timed interval and weighing the sample. The specific gravity was measured for each flow to determine the percent sol ids. Random check samp 1 es were also collected for moisture determination as a check of the specific gravity versus solids concentration relationship used for evaluating the test. Because the size distribution of phosphogypsum may be altered when subjected to centrifugal pumping due to the fluid shear produced in the pump, fresh gypsum was used after every other test.
Slurry thickening tests were also conducted in a 33-inch continuous bench-scale thickener equipped with a slowly revolving rake. Tests were run both with and without flocculant used as a settling aid so that thickener performance under both sets of conditions could be compared. In addition to this, the thickener was tested as a top fed thickener and as a sludge bed fed thickener in which the dilute slurry is introduced below the solid/liquid interface. Sludge bed fed thickeners offer a distinct advantage over the top fed type thickener as far as overflow clarity is concerned, particularly when flocculants are used to aid settling.
Peed slurry was prepared by mixing a pre-weighed quantity of gypsum with recycle water obtained from a phosphoric acid plant’s cooling pond. After mixing, a sample of the slurry was taken for the determination of percent sol ids. Flocculant, when used, was diluted to a concentration of 0.05 to 0.1 percent before each test.
The feed slurry was pumped to the thickener by a metering pump. Before entering the thickener, flocculant, when used9 was introduced into the slurry line and mixed by an in-line static mixer. The supernatant overflowed the thickener by gravity and was collected in a graduated cylinder. Underf 1 ow slurry was pumped from the thickener. Before overflow and underflow rates were measured, the system was al lowed to reach equilibrium and the underflow pump adjusted so that the interface remained at a constant level. of the bench-scale thickening test equipment is shown in Figure 3.
A diagram _
Fi 1 tration
A vacuum f i 1 ter was judged to be the most suitable method to remove most of the remaining water-soluble impurities and to further dewater the gypsum prior to drying. Because filter cake washing was desirable, a procedure representative of horizontal filters such as a tilting pan or belt filter was tested.
Filtration tests were carried out on a 6-inch diameter buchner-type test filtef, used to simulate horizontal filters, covered with a monofilament polypropylene filter cloth. Problems were encountered with being able to hold a constant vacuum on the filter due to the low air pumping capacity of the available vacuum pumps. This was greatly improved by insta; 1 ing a lo-gallon reservoir in the vacuum system. Fi 1 ter vacuum ranged from 15 to 18 inches of mercury during the tests. Gypsum slurry used in these tests was obtained from an operating plant’s gypsum sluice. Sol ids content of the slurry was about 4 percent in the sluice stream. The solids content used in the filtration tests

-9-
4
C
GYPSUM FEED $L
SLURRY PUMP FLOCCULANT
PUMP TANK
TOP FED FEED LINE
c ma-- ---
-7
BENCH SCALE THICKENER
SUPERNATANT
I Lil GRADUATED CYLINDER
I
I t SLUDZED~
IN-LINE MIXER
-- -J FEED LINE
IGE BED
GRADUATED CYLINDER
FLCI;W&LANT
FIGURE 3. Schematic diagram of equipment used in the gravity tf?ickening tests.

-lO-
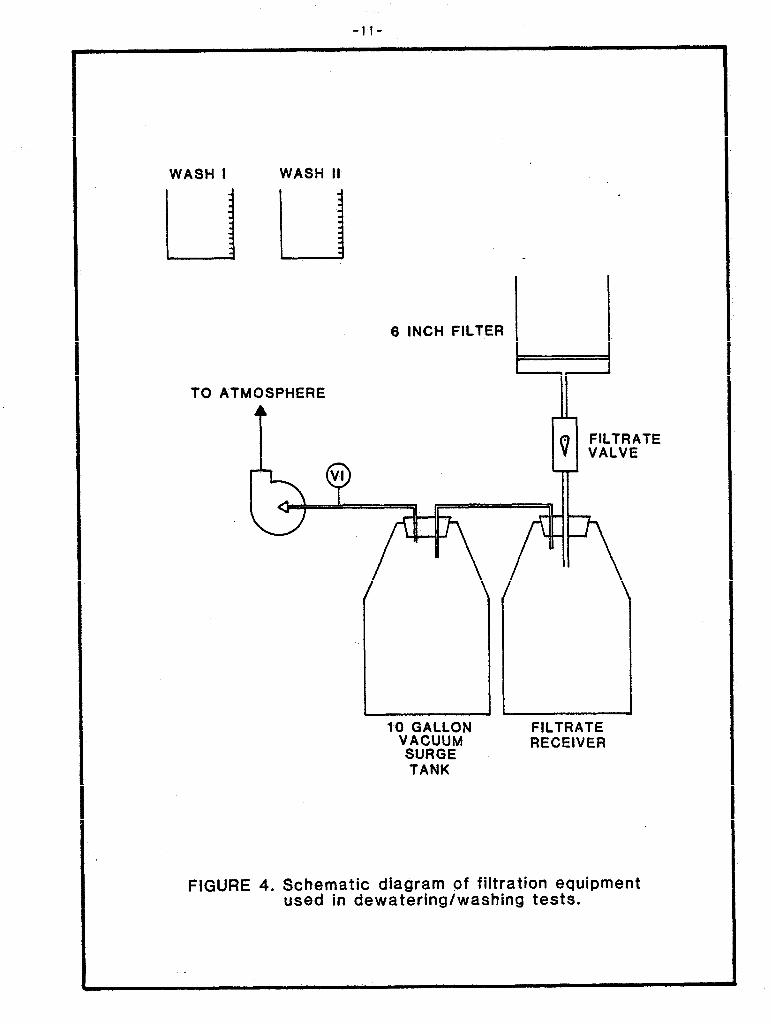
was obtained by allowing the gypsum to settle and decanting the supernatant. After a test, the filter cake was dried at 500 C for 16 hours to determine the free water content. The filter cake was then dried an additonal 6 to 16 hours at 25OoC for crystalline water determination, The dried anhydri te gypsum was then submitted for chemical analysis. equipment is shown in Figure 4.
A schematic diagram of the f i 1 tration
Filtration testing was done batch-wise, the sample used for each test being taken from an agitated tank containing the bulk sample. The procedure was as follows: the vacuum pump was started and the vacuum in the surge tanks allowed to level off at 18 inches of mercury while the sample was obtained and the washes, if used, prepared; the slurry was then poured onto the filter and the fi 1 trate valve opened as a stopwatch was started; the slurry was al lowed to filter until the liquid disappeared from the surface of the filter cake; if washing tests were being conducted the wash liquid was gently poured onto the filter cake at this point; and, after the completion of the washi,ng tests the filter cake was allowed to vacuum dry for 15 to 35 seconds before the filtrate valve was shut and the test terminated. Filtration rates were calculated from the dry solids weight and the filtration time.
Simulation Testing
In order to evaluate the overall gypsum clean-up process, the unit operations were combined in process simulation runs. Two composite tests were conducted using the results obtained from each unit operations test to select equipment and operating parameters. Feed gypsum slurry was prepared from gypsum sluice samples. The sample was then pumped onto a static 48smesh screen . Because a static screen was used blinding of the screen by near 48-mesh material occurred and had to be washed through the screen by recirculating some of the supernatant in the catch basin under the screen. The screened material was then fed to the thickener in the sludge bed fed mode. In one test, flocculant was added as described above, the other test had no flocculant added. The thickened underflow was collected for filtration. Filtration was carried out using two counter-current displacement each with the final wash being fresh water. were recorded for the calculation of filtration rate. A drying time was used in both tests. Samples of each stream analysis.
Dry i nq
washes of one Filtration times
30 second filter were obtained for
Drying of the phosphogypsum filter cake is required to reduce the thermal load on the fluidited bed reactor. In addition, by drying a portion of the calcium sulfate dihydrite crystalline water, an easily agglomerated, attrition-resistant granule can be made.
An evaluation of alternate methods for drying gypsum was made on the basis of its physical character i st its and the degree of drying required. Flash drying was chosen for testing because the fine particle size of the gypsum allows for complete entrainment of the product in the hot gas stream, In addition, flash drying is well suited to controlling the product exit moisture within specific 1 imits with the minimum amount of response time. A schematic of the pilot unit (CE-Raymond cage mi 11 flash dryer) used for testing is shown in Figure 5.
-11-
WASH I
u
WASH Ii
I
TO ATMOSPHERE
$1
6 INCH FILTER
-I-
SURGE TANK
FILTRATE RECEIVER
FiGURE 4. Schematic diagram of filtration equipment used in dewateringJwashing tests.

n Blower
Blower
I ma-1 -ir+
Mixer I Conveyor C0ngo.40.heu I II
Raw Feed
t-
*;vrf-‘;ct
Conditioning
fl - T2 - T3 -
Cage Mill
Inlet temperature Vent temperature Product temperature
Figure 5. Schematic of GE-Raymond pilot cage mill flash dryer.

-13-
Aqglomeration
In most of the fluid bed reactor tests conducted at ISU, the dry gypsum feed supplied by ZW was roll briquetted, crushed, and sized by ISU as a final feed preparation step. However, considering the magnitude of a full-scale operation with a capacity of approximately 200 TPH dry gypsum, the capital and operating costs of roll briquetting as a means of agglomerating the feed would be prohibitive.
An agglomerating method which is well known and accepted in the phosphate industry is drum granulation. The advantages of this -type of agglomeration are : 1) low capital cost, 2) high capacity, and 3) ease of operation. At present, gypsum is successfully being agglomerated on a full scale disc pelletizer which is similar in principle to a drum granulator. The product from the pellitizer is 95 percent -16 +32 mesh material so that very 1 ittle recycle of product is necessary. A binder is added during the pelletization as a hardening agent. Agglomeration testing was carried out by FEECO International (Green Bay, Wisconsin) on a 16-inch diameter disc pelletizer. The results obtained from the disc pel letizer were used as scale-up requirements for a drum granulator. Testing of the attrition resistance of the agglomerated particles was carried out with the “Tumbl ing Test” procedure described in Appendix A.
Thermal Decomposition
Laboratory Combustion Tube Furnace
Laboratory tube furnace tests were conducted in order to generate additional data so that the results could be correlated with performance in the fluidized bed reactor. Tube furnace tests provide a simple method to predict a gypsum feed sample’s performance in the fluidited bed reactor. These tests were al so used to evaluate some of the process parameters which are applicable to the fluidized bed reactor tests.
A diagram of the combustion tube furnace is shown in Figure 6. A weighed sample of phosphogypsum was placed in the combustion boat and the boat inserted into the hot zone of the preheated tube for the desulfurization per i od. While the sample was in the tube, the atmosphere was control led by passing put if ied gas through the tube. Upon completion of the test the boat was withdrawn to the end of the tube and the tube flushed with nitrogen whi le the boat cooled. The detailed procedure of the tube furnace test is presented in Appendix A.
Fluidited Bed Reactor
Fluidized bed reactor tests were used to obtain data on the ISU thermal decomposition process under dynamic conditions. Tests on the bench-scale reactor were conducted to obtain design data for the thermal decomposition process using phosphogypsum as a feed and low-cost high-sulfur coal as a fuel source.
The fluidized bed reactor consists of a 6-inch ceramic tube which is located within an electric furnace. Prepared gypsum and the fuel (either natural gas or high-sulfur coal) are continuously fed into the reactor along

TO VENT P-
t ELECTRIC FURNACE -
TIMER 8 SOLENOID
NITROGEN CARSON MONOXIDE
FIGURE 6. Schematic diagram of the combustion tube furnace.
-15-
with the air required for combustion. Reacted solids overflow from the reactor through a ceramic tube and are collected in canisters which are periodically emptied. A simplified diagram of the ISU reaction system is shown in Figure 7. The combustion air is introduced into the reactor in such a way that two zones are present within the fluidired bed. Part of the air required for combustion (primary air) is fed to the bottom of the bed in an amount that is stoichiometrically deficient for combustion. In doing this a reducing gas (carbon monoxide) is produced which allows thermal decomposition to occur at a lower temperature. Additional air (secondary air) is then introduced in about the middle of the fluidized bed so that combustion is complete and calcium sulfide produced in the reducing zone is oxidized to sulfur dioxide and calcium oxide. The fluidized bed procedure is described in detail in Appendix A.
Enqineerinq and Economics
A material balance for a 1,000 TPD P2O5 phosphoric acid plant was used along with the bench scale and pi lot plant test results to determine the size and number of the major pieces of equipment. Process flow diagrams were then developed and the auxillary equipment required for materials handling were determined. A sulfuric acid plant was sized based on the off-gas composition from the thermal decomposition process.
The equipment specifications were then presented to equipment manufacturer’s representatives and the delivered cost of each item obtained. Accepted factors for additional materials and labor were used to calculate the installed equipmen-t cost. These costs were used to develop the total fixed capital cost.
From this data the operating cost for a complex producing 2,700 TPD 100 percent H2SO4 (required for a 1,000 TPD P2O5 phosphoric acid plant) were calculated using the cost basis presented in the Engineering and Economics section of this report. It should be noted here that the accuracy of the estimates are of the preliminary engineering type that is 215 percent.

PRWARY AIR
FLUlDlZED BED
REACTOR
GYPSUM FEEDER
TO ATMOSOYERE . .
SETTLING CHAMBER
SECONDARY AIR
COAL FEEDER
\I
OVERFLOW PRODUCT
7 CANISTER
i
I I
NATURAL GAS
FIGURE 7. Simplified schematic diagram of the ISU fluidized bed reaction system.

-17-
TEST RESULTS
Raw Material Characterization
The phosphogypsum samples used in the study were typical of gypsum produced by wet-process phosphoric acid manufacturing using Central Florida
phosphate rock. Impurities present in the gypsum were mostly compounds of fluorine, phosphate, and acid insoluble compounds (silica). The particle size distribution of the phosphogypsum samples was 72 percent -48/+325 mesh and 27 percent -325 mesh (-44 microns).
The high-sulfur coals studied covered a wide range of analyses. content of the coals ranged from 2.9 to 3.8 percent, and ash from 6.2 percent. The heating values were between 10,000 and 14,500 BTU/pound.
Phosphoqypsum
The gypsum used in the study was obtained from an operating Florida phosphoric acid producer’s complex. Two samples were used
(Tyler)
Sulfur to 16.6
Central for the
majority of work in the study. Sample 1 was taken from a phosphoric acid producers gypsum pile for use in the gypsum drying and agglomeration studies and the thermal decomposition tests. The gypsum pile sample consisted of approximately 7.5 tons of phosphogypsum. Sample 2, used in the gypsum clean- up studies for the gypsum preparation process, was obtained directly from the discharge of the phosphoric acid plant’s gypsum disposal stream. This sample was used for the characterization, filtration/washing and process simulation studies.
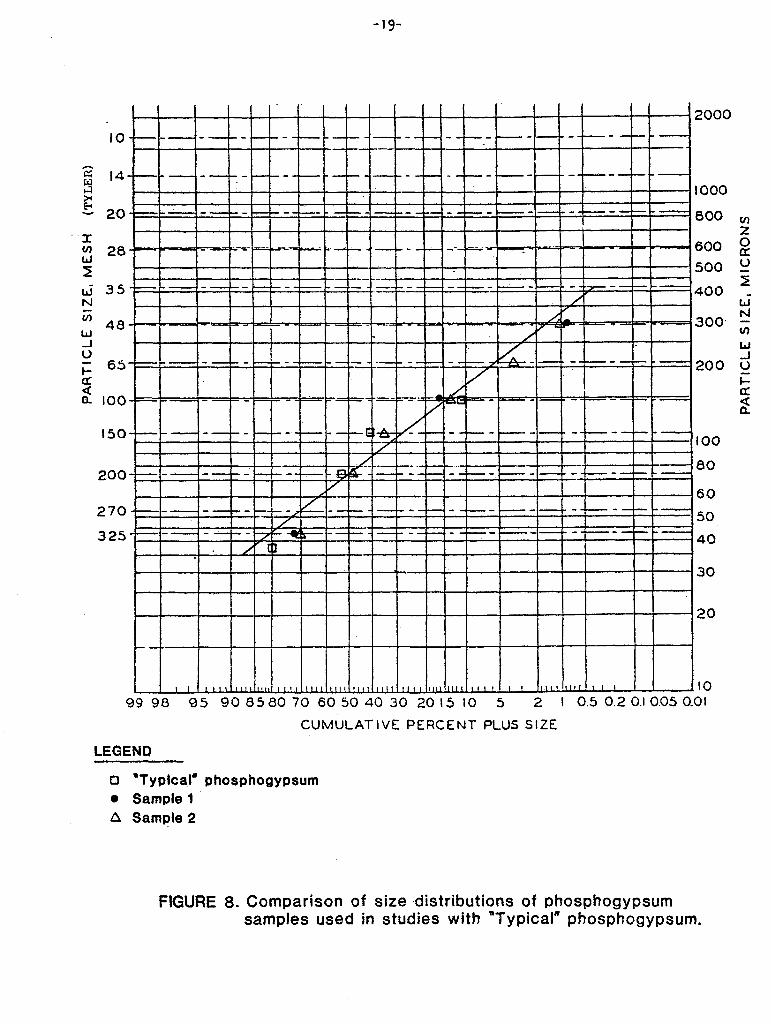
The particle size distributions of the phosphogypsum samples used are shown in Table I along with that of a “typ i ca 1” phosphogypsum produced from a phosphoric acid plant operating with Central Florida phosphate rock. These data, represented graphically in Figure 8, show that the particle size distributions of the samples tested are nearly identical to that published as being a typical sample. Analysis showed the samples to consist mostly of minus 65 mesh material (96.6 percent).
The chemical analysis of the gypsum samples studied is shown in Table I I. Less contamination by water-soluble P2O5 and F in Sample 1 (compared to Sample 2) is probably due to the leaching of these compounds, while they were stored in the plants gypsum pile. The samples used in the study have a chemical composition similar to the typical values reported in the literature.
In addition to the samples mentioned, several smaller samples were procured for testing in the laboratory tube furnace and the early fluidized bed reactor test i ng. These results are discussed in the section on thermal decomposition testing.
Hiqh Sulfur Coal
Several high-sulfur coals were tested in the thermal decomposition studies. The composition of the coals tested is shown in Table III. Among the coals tested, Iowa coal had the lowest heating value and provided the most

-18-
Screen Size (Tyler)
+48 -48+65
-65+100 -100+150 -150+200 -200+325 -324+400
Table I Particle Size Analysis of Some Phosphogypsum Samples
Opening microns
3oo 212 150 106
:z
38
"Typical I' Valuesa .Sample lb % by Weight % by Weight
0.8
11.8 15.2 29.1 12.9
57.6 27.6
aSource: Phosphoric Acid by A. V. Slack; Volume I.
bSample 1 was obtained from a plant's existing gypsum disposal pile.
CSample 2 was obtained from an operating plant's gypsum sluice stream.
Sample 2c % by Weiqht
0.9 2.5 10.9 21.7 13.5 21.6
-19-
I.2 N iii W
6 i ;r d
14
20
28
800 m
z 600 n z
I I 1 I I I I I I I I I I I 500 li 35-7
I I ! I /_-.=-_----_c _ _j__j I I I r- I I I I
.._ I I I I /f I I '400 _ .I
Kl 46 300, ;;
!? 6S 200 u
i
100 U
150 100
200 00
60 270 50
325 40
I I I . I ‘30
I I 20
I I ,118 llIuJ.lI Ill,. 05 0085807d
‘l&J_,!, I,,, I,,, II,, III &&II,, 60504030 2015 IO
, , III! II!! I I t .I0 99 96 5 2 I 0.5 0.2 0.1 0.05 0.01
LEGENP
0 “Typical’ 0 Sample 1 A Sample 2
CUMULATIVE PERCENT PLUS SIZE
phosphogypsum
FIGURE 8. Comparison of size distributions of phosphogypsum samples used in studies with “Typical” phosphogypsum.

-2o-
Table I I Chemical Analysis of Some Phosphogypsum Samples
Analysis, % “Typical” Valuesa Sample lb
Total P205 0.8-l .O 1.0
Water Soluble P2O5 0.2-0.3
Acid Insoluble LO-3.0d :::
Fluoride 0.7-0.9 0.3
8
aSource : Phosphorus and Potassium No. 94
bSample 1 was obtained from a plant’s existing gypsum disposal pile.
CSample 2 was obtained from an operating plantas gypsum sluice stream. Sample was dewatered on a vacuum filter prior to analysis.
Sample F
1.7
1:; 2.3
dThe value listed is for SiOp rather than acid insolubles.

-21-
Table Ill Typical Approximate Analysis of High-Sulfur Coals
Coal Volatile Fixed
Matter Carbon Ash Sulfur Heating Value
BTU/lb.
Pittsburgh
Illinois
Iowa
Pittsburgh 8a
Illinois Sb
Illinois 5&6c
Iowa, Louilia 4d
36.8 57.0 6.2 2.9 14,470
38.6 50.0 11.4 3.8 12,600
35.9 34.1 16.6 3.2 9,927
__ __ 12.7 2.9 12,900
-_ -_ 13.7 3.2 11,900
__ _- 8.7 2.0 _-
-- -- 16.6 3.2 9,930
I
aUsed in runs 17b through 18d.
bUsed in runs 13a through 14~.
=Used in runs 10, 12a, and 12b.
dUsed in run 9.
-22-
sulfur per BTU. Illinois coal was used in the majority of the fluidired bed reactor tests, due to its heating value being typical of the various high- sulfur coals available. While the sulfur/BTU ratio of the Illinois coal is similar to the Iowa coal, the heating value obtained from the Illinois coal is 27 percent greater due to the higher carbon content. Pittsburgh coal had the greatest heating value of the high-sulfur coals studied and about a 33 percent lower sulfur/BTU ratio than the other coals.
The particle size distribution of the coals used in the fluidized bed reactor tests is shown in Table IV. Two size ranges of coal were studied in the fluidi,ted bed tests. The samples were scalped at minus 20 mesh or 60 mesh before being used in a test. Initially, finely ground coal t-60 mesh) was used in the reactor but problems occurred in feeding the material caused by bridging in the screw feeder hopper. The coarser (-20 mesh) material was used for all tests after run 12b.

-23-
Table IV Particle Size Analysis of High-Sulfur Coals
Used in the Thermal Decomposition Studies
Coal I owa Illinois (1) (2) ( 1
Sieve Size % by Weight % by Weight % by ieight % by Weiqht
+60 0.1 0.6 64.5 73.0
-60+100 13.2 0.4 16.7 12.0
-100+150 8.2 27.4 9.9 6.0
-150+200 7:2 18.8 -- --
-200+270 8.1 9.8 4.1 5.0
-270 63.2 43.0 4.8 4.0
Note (1) - Run 9 Note (2) - Runs 12 a,b
Note (3) - Runs 13 a,b,c, 14 a,b,c Note (4) - Runs 17b, 18 a,b,c, and 20 a,b
-24-
Gypsum Preparation
Preliminary clean-up studies were done to investigate the applicability of conventional process equipment to the pretreatment of phosphogypsum. This pretreatment must result in a product of consistent qua1 ity that can be used as the feed to the thermal decomposition process without causing sintering of the bed. The unit operations were studied individually to find the best methods of obtaining the required pretreatment.
The results obtained in the pretreatment studies showed that gypsum preparation can be accomplished using conventional. process equipment. The
removal of impurities during phosphogypsum clean-up resulted in a material that had satisfactory performance in fluidized bed reactor testing.
Analysis of the gypsum preparation tests gave the criteria for the select ion of the required equipment. A summar screening rate of the scalping operation 2.5 TPH/ft. I
of the criteria are:
(continuous thickener) 2.8 GPM/ft.2 ; initial dewatering rate
with the addition of flocculant to the feed at 0.07 pounds/ton solid; and, a filtration rate of 5.0 TPD gypsum/ft.2.
A two-step flash drying process which dried 70 percent of the gypsum to hemihydrate resulted in the best technique in treating the gypsum for granulation. The granules produced were of the -12/+32 mesh size range.
The data obtained from the unit operations testing were used to select the type of equipment to be used in the pretreatment process design. The unit operations data and the results obtained from the simulation tests were then used to develop the design criteria for full-scale process equipment.
Scalping
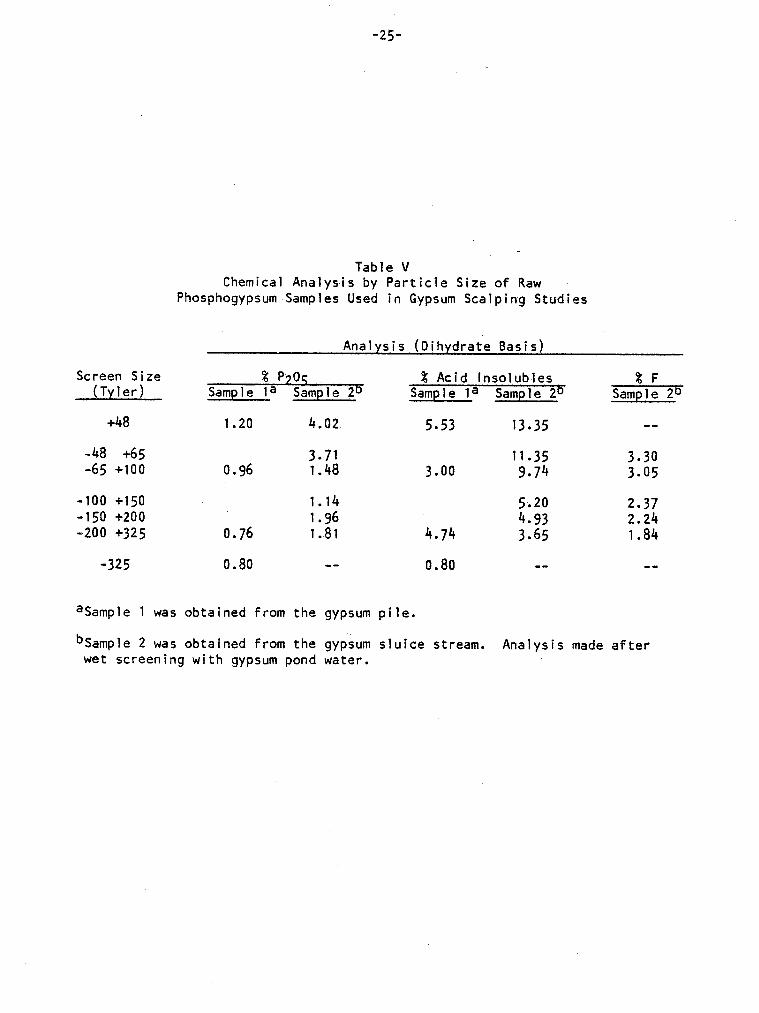
The chemical analysis by particle size for the raw phosphogypsum samples is shown in Table V. These analyses show that the +65 mesh material contains a higher percentage of impurities such as P205 and acid insolubles than do the finer size fractions. Further analysis showed that about 75 percent of the P205 contained in coarse material was water -insoluble (possibly in the form of unreacted phosphate rock) and, thus, could not be removed by a washing operation.
Table VI shows the minimum expected impurity removal obtainable by scalping out the +65 mesh material from a gypsum sample obtained during good plant operation. Although this scalping test does not show a level impurity removal , the scalping step should be included in the flowsheet. At times, when the phosphoric acid plant reaction conditions are upset or during reactor clean-out, the oversize material could be a considerably larger portion of the sample and contain a higher impurity concentration. As an example, before scalping, one sample tested contained 27.8 percent +48 mesh. Impurities contained in this portion of the sample represented 50 percent of the total P2O5 and 65 percent of the total acid insolubles.
Initial Dewnterinq
The next step in the preparation process is to separate the majority of the water from the screen undersize gypsum slurry in order to minimize the
-25-
Screen Size (Tyler)
% P7Or; % Acid lnsolubles %F Sample la Sample 2O Sample la Sample 2b Sample 2b
+48 1.20 4.02 5.53 13.35 --
-48 +65 3.71 11.35 3.30 -65 +100 0.96 1.48 3.00 9.74 3.05
-100 +150 1.14 5.20 2.37 -150 +200 1.96 4.93 2.24 -200 +325 0.76 1.81 4.74 3.65 1.84
-325
Table V Chemical Analysis by Particle Size of Raw
Phosphogypsum Samples Used in Gypsum Scalping Studies
0.80 -- 0.80 -- --
aSample 1 was obtained from the gypsum pile.
bSample 2 was obtained from the gypsum sluice stream. Analysis made after wet screening with gypsum pond water.

-26-
Table VI Percent Removal of Impurities Obtained
by Sealping Raw Phosphogypsum
% Total P205
% WSa P2O5
% ISb P205
% Acid insoluble
aWater Soluble
bWater Insoluble
Before Scalpinq
0.82
0.30
0.52
4.05
After Scalpinq % Removal
0.78 4.9
0.29 343
0.49 508
3.86 4.7

-27-
hydraulic load on the downstream vacuum filter. Two al ternate dewater ing methods were chosen for investigation; i.e., hydrocycloning and gravity thickening.
In the first method, a nominal 3-inch diameter hydrocyclone was chosen for dewatering tests based upon design considerations of capacity, underflow solids concentration, and recovery of gypsum in the underflow.
The results of the tests (Table VI I) indicate that a satisfactory range of underflow solids concentration (34 to 62 percent solids) is attainable. However,. the high solids concentration in the cyclone overflow resulted in 1 imi ting the overal 1 recovery of the gypsum. Due to the poor qua1 ity of the hydrocyclone overflow, this method of dewatering is considered impractical from the standpoint of having to separate and recover the fine gypsum from the overflow stream prior to releasing it into the plant recycle water system.
The second dewatering method tested was gravity thickening. A 3f-inch diameter thickener was used for the testing which was done on a continuous basis allowing time for equilibrium conditions to be reached prior to measuring flowrates and sampling the streams. The thickener was fed both as a conventional top-fed thickener and as a sludge-bed-fed thickener. In a top- fed thickener, the pulp is introduced above the level of the sludge bed. Sludge-bed-fed thickeners have the feed input below the sludge bed level. This offers distinct advantages over the top-fed thickener as far as overflow clarity is concerned, particularly when flocculants are used to aid settling. In all tests the sludge bed was gently stirred by a slowly revolving rake.
Tests were conducted on both types of thickeners, with and without flocculant being added as a settling aid. The results of the tests are shown in Table VIII, In general, the results indicate that satisfactory underflow solids concentrations can be obtained with both types of thickeners. The addition of flocculant to the feed prior to thickening resulted in a dramatic increase in throughput and a substantial improvement in the quality of the overflow water. The addition of flocculant also minimizes the possibility of flow interruption due to overcompaction of the solids in the bed.
Filtration/Washinq/Final Dewaterinq
These final steps in the clean-up operation are components of the overall process for removing soluble impurities from the gypsum prior to drying. Vacuum filtration was chosen as a potential means of further dewatering the gypsum to minimize drying costs while providing the ability to effectively wash the cake. Filtration/washing tests were conducted on a 6-inch diameter batch filter equipped with monofilament polypropylene filter cloth.
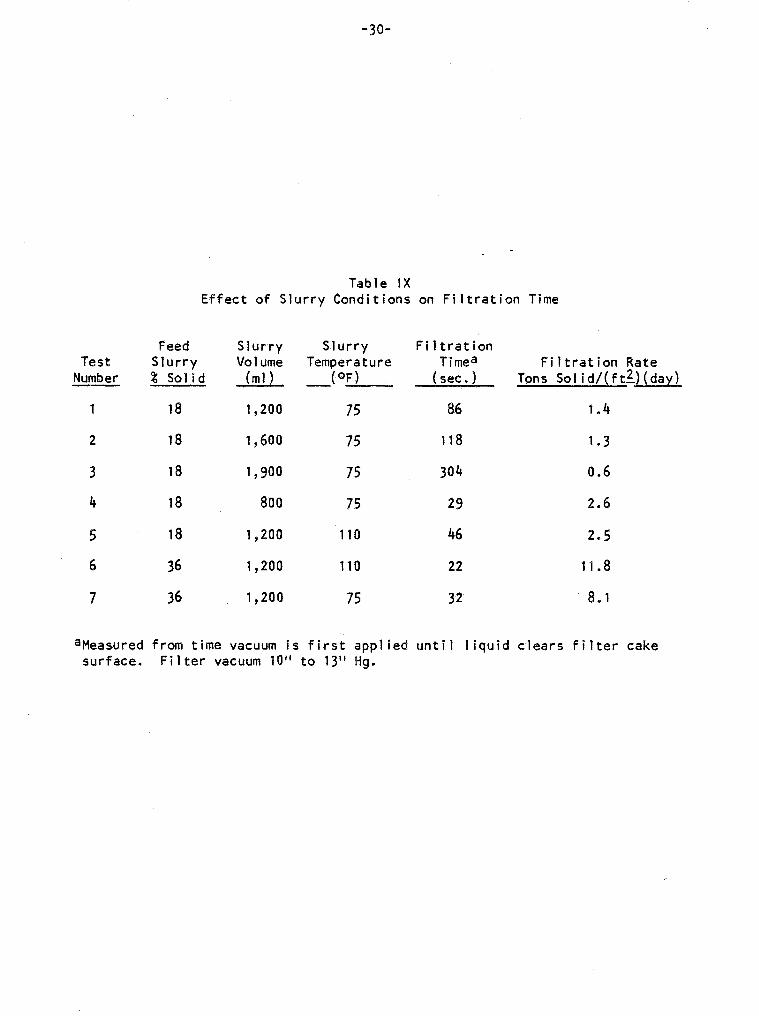
The filtration tests were conducted using “as is” gypsum slurry samples (Sample 2 prior to dewatering) obtained from an operating phosphoric acid plant’s disposal stream. Due to the high liquid to solid ratio, filtration rates (in terms of solids throughput), were relatively low for the dilute slurries. Later tests showed that filtration rates increased an average of six-fold with an increase in solids concentration dewater ing (Table IX).
resulting from initial

-28-
Test Feed Number gpm % Solid
He-la 31.8 19.0
HC-2a 38.5 19.0
HC-3= -- 15.0
HC-4d 7.4 15.0
HC-5d 22.6 55.0
HC-6d 11.2 19.0
HC-7d 18.3 lg.0
Table VII Results from Initial
Dewatering by Hydrocyclone
Overflow Underflow gpm % Solid m% Solid
32b 25.9 4.0 5.9 62.2
50b 31.7 6.5 6.8 59.2
Underflow very wet, test terminated
3b 5.2 4aO 2.2 36.0
32b 14,5 2.0 8.1 34.0
10 8.0 4.0 3.2 47.0
20 12.4 1.0 5.9 47.0
% Recovery of Gypsum in Underflow
83
73
0..
82
92
86
97
aVortex Finder 3/4", Apex l/2"
bPressure gauge malfunction,BP extrapolated from Kreb's 0313-664 cyclone capacity curve.
Wortex Finder l/2", Apex l/2"
dVortex Finder l/Z", Apex 3/8"

I -2g-
Table VIII Results from Preliminary Dewatering by Gravity Thickener
Parameters TFa SBFb TFc
w/o Floe w/o Floe w/ Floe
Feed Rate (gpm/ft2) 05 .4 2.7
Feed Solids Concentration (% by weight) 17 17
Overflow Sol ids Concentration (ppm) 2,000 2,000
Unders Sol ids Concentration (% by weight) 59 56
Overs/Unders Volumetric Split
Flocculant Dosage (lb/ton Solids)
3.7:1 3.4:1
__- W-W
aConventional top-fed thickener - no flocculant addition.
bSludge - bed-fed thickener - no flocculant addition.
22
50
43
1.3:1
007
SBFd w/ Floe
2.9
22
50
42
1.2:1
.07
CConventional top-fed thickener with Nalco Flocculant 7873 added.
dSludge - bed-fed thickener with Nalco Flocculant 7873 added.
-3o-
Test Number
1
2
3
4
5
6
7
feed Slurry % Solid
18
18
18
18
18
36
36
Table IX Effect of Slurry Conditions on Filtration Time
Slurry Slurry Filtration Vo 1 ume Temperature Timea
(ml 1 __(OF) (sec.)
1,200 75 86
I ,600 75 118 1.3
1,900
800 75 29 2.6
1,200 110 46
1,200
1,200 75 32
75
110
304
22
Fi 1 trat ion Rate Tons Solid/(f&(day)
1.4
0.6
2.5
11.8
8.1
aMeasured from time vacuum is first applied until liquid clears filter cake surface. Filter vacuum 10” to 13” Hg.

-31-
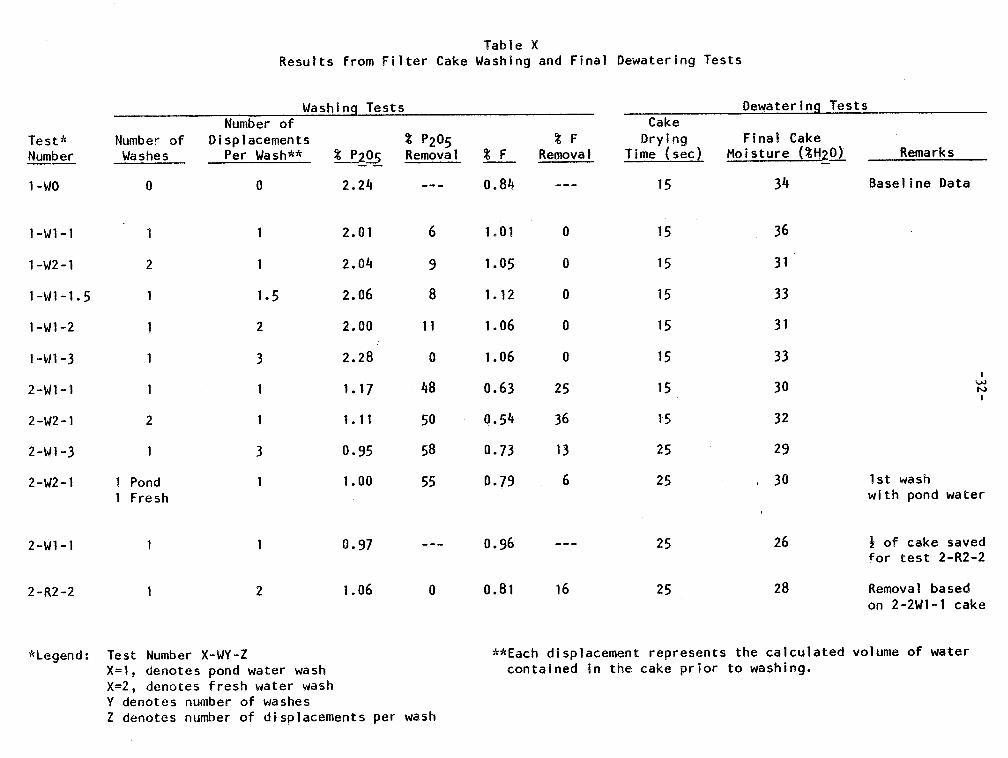
The next series of tests (Table X) was conducted to determine the cake washing and cake drying (final dewatering) properties of the gypsum. Test
number l-W0 consisted only of dewatering the gypsum slurry and letting the cake vacuum dry for 15 seconds - no washing was conducted. The cake was then oven-dried and. analyzed for P2O5 and F on- a di hydrate basis. These were used throughout the washing tests as a basis for computing efficiencies.
analyses removal
The washing tests were conducted using both recycle pond water* (used as the final wash during primary f i 1 tration) and fresh water. The results indicated that washing with recycle pond water was not -effective in removing impurities. One wash with one displacement** of fresh water was sufficient for removing 48 percent of the P2O5 and 25 percent of the fluorine. Increasing the wash to three displacement volumes resulted in removing 58 percent of the P2O5 in the cake. However, because of the additional cost of extra fresh water required for the two extra volumes, it was decided a counter-current wash would be more appropriate. This was substantiated in the simulation tests discussed in the next section.
In test 2-R2-2, where the gypsum from test 2-2WI-1 was repulped in two displacement volumes of fresh water and refiltered, no additional P2O5 and very little fluorine was removed which indicates that displacement washing is an effective means of achieving the desired upgrading. High-temperature sinter ing tests were conducted on “as is” and washed gypsum samples obtained from tests I-WO, l-Wl-1, l-W2-1, 2-Wl-1, and 2-W2-1, in order to evaluate the effectiveness of the washing procedure. The results are discussed in the thermal decomposition section. In general, it was found that the fresh water washed gypsum (Tests 2-Wl and 2-22) exhibited less tendency to sinter, thereby minimizing the possibility of mechanical difficulty in the fluidized bed reaction system brought about by build up of partially reacted phosphogypsum.
Table X also shows the relationship between cake drying time and final cake moisture. The moisture analysis represents the percent free moisture of the d i hydrate gypsum. The moisture ranged from 30 to 36 percent for a 15- second drying (vacuum) time and from 26 to 30 percent for a 25-second drying time. The vacuum in al 1 tests ranged between 16 to 18 in Hg.
Simulation Test inq
As mentioned previously, the information supplied by the preliminary clean-up studies was used in selecting the equipment and the operating parameters for the simulation runs. The results of the simulation testing are summarized and presented in the form of overall mass balances shown in Figures 9 and 10.
*Source of the water is the recycle cooling pond at the same facility from which the gypsum slurry was prccured. **Each displacement represents the calculated volume of water contained in the cake prior to washing.

7 76.5 93.* 1 0.8 6.7 0.4 4.8 0.6 11.4 9.1 88.2 662.1 508.5
8. it. - 1 0.9 8.2 0.9 8.1 0.7~12;O - - Trace . 587.5 Note: W.S. - Water Sotublo
v4 r THICKENER
FILTER
FIGURE 9. Overall mass balance from process simulation test without flocculant.

-34-
Note: W.S. - Water Soiuble
Flocculant 0.04 IbsJton Solid
7
FIGURE 10. Overall mass balance from process simulation test with flocculation

-35-
The scalping operation removed 0.9 percent of the total P205 in the feed slurry. However, most of this was of a water insoluble form. Approximately 75 percent of the insoluble P205 (total P205 less the water soluble P205) fed to the scalping operation was removed as +48 mesh.
The addition of flocculant to the thickener feed greatly improved the overflow clarity even at the low dosage used. Upon initial dewatering, a higher percent solids was obtained in the thickener underflow when flocculant was used (Figure 10) than resulted from previous thickener tests. This was probably caused by the combined effects of a reduced thickener feed rate (1.3 gpm/ft2 for both tests) and lower flocculant dosage (0~04 lbs. f locculantfton solids).
Filtration and washing results were similar for both tests. Filtration rates with and without f locculant were 4.7 and 5.0 tons sol ids/ft2/day, respectively. The removal of P205 (based on Test I-WO, Table X) was greater than 70 percent.
The data generated from these runs provided the necessary design triter ia for preliminary equipment sizing. Extensive pilot plant work, consisting of continuous running with a wide range of operating parameters would have to be performed prior to establishing definitive equipment sizing and cost est imat ion.
In later sections, a brief description of the overall phosphogypsum clean-up process is presented along with a list of the design criteria used in sizing equipment for each step of the process.
Drying
Table XI lists the data obtained by CE-Raymond during the two-day flash drying testing program (runs 1 through 6). Some problems were experienced with buildup at the feed entry point when feeding the as-received gypsum at 36 percent moisture because of its sticky nature. The problem was overcome by preconditioning the feed with recycled dry material so that the resulting feed moisture was 16 percent (day 2 of the tests). Any lumps formed as a result of preconditioning are broken up by the cage mi 11 immediately downstream of the entry point. The gypsum is carried up to the cyclone by the hot gas entering the mi! 1 and the dry product exits the system through the bottom of the cyclone. The fines exiting the top of the cyclone are collected in a baghouse and are recombined with the dry product.
A production run of 3.25 tons of washed phosphogypsum was run by Fluid Energy (Hatfield, Pa.) with results similar to those obtained by CE-Raymond. initially, the gypsum tended to cake in the dryer but after slight modifications to the unit, this problem was corrected and no further problems were encountered. Feed moisture was about 21 percent for these tests. Dry gypsum exited the system at about 160°F and contained 0.5 percent free moisture.
In general, the results of the tests indicate that the flash dryer is well suited for drying gypsum to within the specified limits of moisture. The advantages of flash drying over other types of drying are ease of operation and low capital investment.

-36-
Run Numbera
Cyclone P (In.H20)
inlet Temp. (OF)
Vent. Temp. (OF)
Product Temp. (OF)
Feed % Moisture
Product % Moisture
Dry Produet Rate
(#/hr)
Table XI ‘Results from Washed Gypsum Drying Tests
1 2 3
4.2 4.0 388
‘1,100 1,400 J,O50
250 225 220
185 160 170
36 36 36
0.5 4.0 1.0
100 270 168 180 217 212
4
3.5
1,140
240
185
36
0.4
_5b 6b
4.5 3.5
700 700
200 185
180 170
16 16
085
aAn additional run (No. 7! not shown in Table) was made as a production run of 3.25 tons (dry basis) for the fluidized bed reactor testing.
bRuns 5 and 6 were made with conditioned feed.

-37-
Aqglomeration
Particle agglomeration of the gypsum feed used for the thermal decomposition studies was for the most part carried out on a roll briquetter at ISU. This method produced a particle of satisfactory resistance to attrition in the fluidized bed reactor but was judged to be an uneconomical method for implementation in a full-scale plant. Briquetting requires a large capital investment due to the low capacity of the units. In addition, operating costs for briquetters are high because of the intense pressures used to obtain particle cohesion.
An agglomerating method which is well known and-accepted in the phosphate industry is drum granulation. Granulation tests were conducted by FEECO International (Green Bay, Wisconson) to investigate methods of obtaining particles with attrition resistance similar to that obtained by roll briquetting. Among the methods studied were partial drying of the gypsum crystalline water prior to granulation and using a binder mixed with the
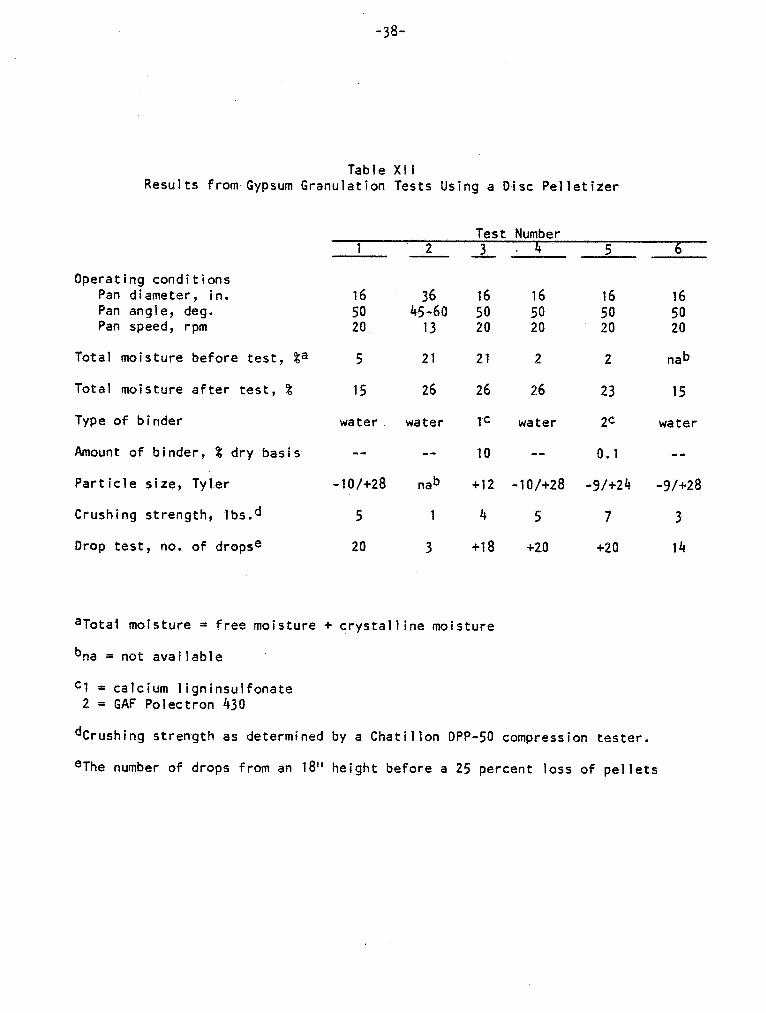
gypsum. The resuls from the granulation tests are shown in Table XII.
From the results of these tests it is seen that to obtain a satisfactory particle it is required that either some of the crystal 1 ine water be removed or a binder added. By drying the gypsum to 5 percent total moisture prior to granulating, a crushing strength of 5 pounds was achieved and 20 drops were required in the drop test to produce a 25 percent degradation in the particles. It appears from these tests that this method gave a slightly stronger particle than was obtained in Test 3 which was a bench-scale test under the conditions of the production run. The production run was used to produce particles for fluidized bed reactor testing. Bincier was used in the production run because Feeco did not have the faci 1 ities to dry the gypsum as required in Test 1 in bulk quantities. In a plant scale operation, the use of this binder would not be practical because it results in an increased operating cost of $22/tori at a dosage of 10 percent by weight (dosage used in the production run).
Particle attrition tes’ts were conducted on several of the feeds used in the fluidized bed reactor studies. These tests were run on samples as prepared and after heating to 11OOoC in order to determine the degree of particle attrition expected in the reactor. These results are listed in Table XII I.
The data indicates that phosphogypsum is more resistant to particle attrition than anhydrite rock. This is even more evident after the sample has been fired prior to the tumbling test. The granulated phosphogypsum showed the least amount of degradation of the samples tested with only about 5 percent of the sample breaking down to particles less than 32 mesh. Co- briquetted phosphogypsum and coal was almost as resistant to particle attrition as the granulated gypsum.
The roll briquetted phosphogypsum, used for most cf the fluidized bed reactor tests, showed the highest amount of fines generation for the phosphogypsum agglomeration procedures tested.
-38-
Table XI I Results from Gypsum Granulation Tests Using a Disc Pelletizer
Operating conditions Pan diameter, in. Pan angle, deg. Pan speed, rpm
Total moisture before test, %a
Total moisture after test, %
Type of binder
Amount of binder, % dry basis
Particle size, Tyler
Crushing strength, .lbsed
Drop test, no. of dropse
Test Number 1 .Y
L 3 -4
16
50 20,
5
15
water
--
-lo/+28
s
20
36 45-60
13
21
26
water
SW
na b
1
3
16 16 16 50 50 50 20 20 20
21 2 2
26 26 23
1c water 2c
10 -- 0.1
+12 -1 o/+28 -g/+24
4 5 7
+18 +20 +20
afotaj moisture = free moisture + crystalline moisture
b na = not available
cl * calcium ligninsulfonate 2 = GAF Polectron 430
5
16 50 20
nab
15
water
_-
-g/c28
3
14
dCrushing strength as determined by a Chatillon DPP-50 compression tester.
eThe number of drops from an 18” height before a 25 percent loss of pellets

-39-
Table X1II Size Distribution After Tumbling of Sized (-g/+16)
Anhydrite Rock and Agglomerated Phosphogypsum Prepared by Various Methods
Material
Crushed Anhydrite
Hand Pressed Phosphoqypsum
Roll Briquetted Phosphoqyspum
Granulated Phosphoqypsum
Co-Briquetted Phosphogypsum and Coal
Form
Unfired Unfired Fired Fired
Unfired Unf-i red Fired Fired
Unfired Unfired Fired Fired
Unfired Unfired Fired Fired
Unfired Unfired Fired Fired
Particle Size Distribution (-g/+16) (-16/+32) (-32/+60) -60
70.8 22.9 1.2 5.1 60.4 28.3 1.2 10.1 27.3 38.4 10.2 24.1 18.5 37.6 11.2 32.7
89.8 6.2 1.1 85.0 5.4 1.0 77.4 15.6 1.0 72.5 10.9 1.2
z 6.0 15.4
48.4 32.2 12.0 7.4 45.5 32.8 _ 11.9 10.0 33.2 45.5 17.6 3.6 31.7 45.0 17.3 6.0
;z 88:2 84.0
0.8
6YI 10:4
0.1 2.4 0.2 4.5 1.2 3.8 0.3 5.3
;;*; 73:8 71.0
6.5 1.0 2.8 6.8 1.2 3.8
22.0 0.6 3.7 22.5 1.1 5.4

-4o-
Thermal Decomposition
As mentioned previously, thermal decomposition testing was carried out at two levels of investigation. Static laboratory combustion tube furnace tests were run in order to predict the performance of the various feeds in the fluidized bed reactor by a simple test method. In addition to testing feed materials, the tube furnace was used to evaluate the effect of some of the process parameters prior to fluidized bed reactor tests. The second level of testing involved dynamic tests in the bench scale fluidized bed reactor. In these tests information on operating conditions, capacity, and desulfurization in a continuous reactor were obtained.
Results obtained from the tube furnace tests showed that the desul furization reaction rate was proport ional to the amount of reductant present. Samples reacted under an atmosphere of 10 percent CO were essentially completely desulfurized in one-half the time required under an atmosphere of S percent CO. When coal (a stronger reducing agent) was mixed with gypsum, the reaction time was reduced to one-third of the time.
At desulfurization times of 20 minutes and longer, the reactor temperatures tested (1,100, 1,150, or l,20OoC) had no apparent effect on the degree of desulfuritation. At a desulfurization time of less than 20 minutes, lower reaction temperatures generally resulted in less desulfurization.
The average particle size of the sample also showed a negligible effect when desulfurization times of more than 20 minutes were tested. At shorter react ion times, the rate of desulfurization appeared to be inversely proportional to the particle size of the sample (tube or fluid bed).
Preliminary tests in which fine “as received” gypsum was mixed with ground coa 1 to simulate a rotary table calciner gave excel lent results indicating that this type of equipment might be an alternative to the fluidized bed reactor.
The technical feasibility of decomposing phosphogypsum with high-sulfur coal in the fluidized bed reactor was consistently demonstrated during the study. Overal 1, the results obtained when feeding phosphogypsum to the reactor were significantly better than had been obtained with natural anhydr i te, with the exception that phosphogypsum showed a slightly higher degree of scaling. Using high-sulfur coal presented few problems in the operation of the reactor. The problems that were encountered were limited to feeding the coal and were corrected by redesigning the feed equipment and increasing the coal particle size.
Results from the tests showed the maximum acceptable space velocity in the reactor to be 6 feet per second. lbs/hour for the bench scale reactor.
This is equivalent to a capacity of 34 If heat recovery was incorporated into
the system a higher capacity could be obtained at the same superficial velocity. Overall desulfurization at these rates wds about 90 percent.
As in the combustion tube furnace tests, the particle size of the gypsym showed a negligable effect on the desulfurization of the gypsum at residence

-4l-
times of 30 minutes or more. The net effect of a larger particle was that less unreac ted gY psum was entrained resulting in higher overal 1
desulfur.itation.
The reactor off -gas in these tests ranged between 3.5 to 4.5 volume percent SO2 when analyzed by gas chromatography. The primary dilutants in the off -gas were nitrogen (70-75 percent), carbon dioxide (ii-18 percent), and
water vapor (S-ii percent). As with capacity, the SO2 concentration in the off-gas would be higher if heat recovery techniques were used.
Preliminary tests conducted using high-sulfur coal co-briquetted with phosphogypsum gave promi s i ng resul ts. The advantage of- this method is that a
jed since the reductant is a part of ion ranged from 84 to 90
size of the feed used
conventional single zone reactor may be the particle fed to the reactor. Overa percent in these tests, even with the (-lo/+100 mesh).
1:: f
desulfuritat ine particle
Laboratory Tube Furnace Testing
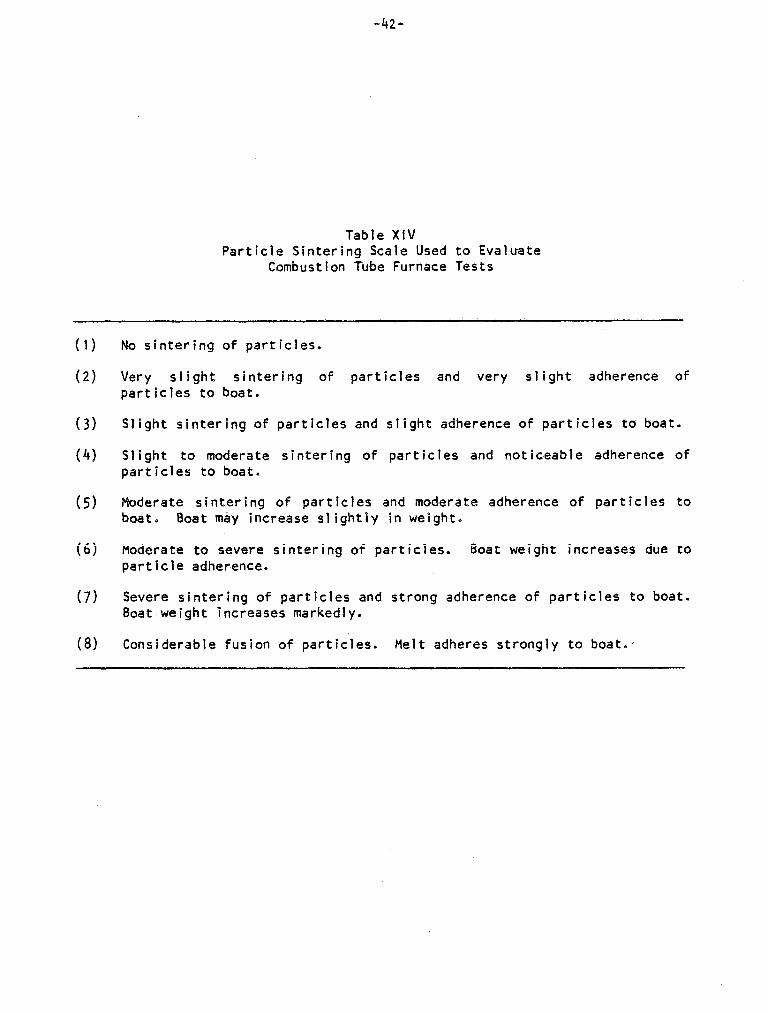
As mentioned previously, tube furnace tests were used to screen potential feed for the fluidized bed reactor. Responses measured from these tests were the percent desulfurization and the degree of sintering of the particles. The particle sintering scale used for these tests is described in Table XIV. Percent desulfurization is calculated from the chemical analysis of the feed and the reacted solids.
Tests conducted early in the program gave some inconsistent results due to ineffective control of the oxidizing and reducing gases. Also, the procedure used in the early test required additional development before fully reliable results could be obtained. For these reasons some of the results reported in previous status reports have been deleted. The tests reported include the runs conducted to screen feed to the fiuidized bed reactor and the tube furnace investigations into some of the operating parameters critical to fluidized bed operation.
Tests Us i nq an Al ternat ing Atmosphere. The results obtained from testing the material used as feed for the bench-scale reactor are shown in Table XV.
The tube furnace reactor was also used to investigate some of the process parameters involved in the decomposition reaction. Areas investigated include reductant concentration, reaction temperature, and reaction time. The results obtained from these tests were used as guide1 ines for operation of the bench scale fluidized bed reactor.
The weight of sample placed in the combustion boat when running tube furnace tests with an alternating oxidizing/reducing atmosphere was shown to be critical. The results obtained in studying sample size are shown in Table XVI. When a one gram sample was used in the tests, desulfurization of the phosphogypsum was significantly reduced because of poor reducing gas diffusion into the sample bed. This effect was more pronounced when shorter reaction times were being studied than in tests with retention times of greater than 30 minutes.
-42-
Table XIV Particle Sintering Scale Used to Evaluate
Combustion Tube Furnace Tests
(1) No sintering of particles.
(2) Very slight sintering of particles and very slight adherence of particles to boat.
(3) Slight sintering of particles and slight adherence of particles to boat.
(4) Slight to moderate sintering of particles and noticeable adherence of particles to boat.
(5) gIo;rate sintering of particles and moderate adherence of particles to * Boat may increase slightly in weight,
(6) Moderate t 0 severe sintering of particles. Boat weight increases due to particle adherence.
(7) Severe sintering of particles and strong adherence of particles to boat. Boat weight increases markedly.
(8) Considerable fusion of particles. Melt adheres strongly to boat.-

Sample
la
1Aa
1Bb
1cc
-4.3-
Table XV Results Obtained in the Combustion Tube Furnace Under an
Alternating Atmosphere of 5% CO (2 min.) and 2% 02 (1 min.) with Phosphogypsum Used as
Feed to the Fluidized Bed Reactor
Desulfuritation Time
(minutes)
60
60
60
60
45
30
Temperature Sintering % (OC) Scale Desulfurization
1150 100
100
91
97
100
98
1200
1150
1200
1150
1150
aSamples 1 and IA are essentially the same. Sample 1A was obtained from the same manufacturers gypsum pile- but at an earlier date.
bSample 1B is granualated gypsum made from Sample 1 containing 4 percent Calcium Lignosulfonate Binder.
% s=
0.0
0.0
1.4
1.3
0.0
0.6
CSample 1C is gypsum from Sample 1 which had been co-briquetted with 6.6% coal.

-44-
Table XVI
Effect of Sample Size on the Desulfurization of Phosphogypsum in the Combustion Tube Furnace Under
Alternating Atmosphere of 10% CO (2 min.) and 2% 02 (1
Particle Mesh
-32/+60 -32/+60
-32/+60 1.0 15 -32/+60 0.5 15
-100%+200 -100/+200
-100/+2DO -100/+200
Sample ,$. Wt.
1.0 0.5
1.0 0.5
1.0 0.5
Time Sint. Solids Comp., % Desulf. (min.) Scale Ca F&l3 z= %
10 10
10 10
15 15
an min.)
43 28 58 7
65: la 0.5 fz
44 17 0.8 51 2 2.3
68:
;i
77 92

-45-
Tube furnace tests on samples which had been prepared in the f i ltration studies are shown in Table XVI 1. Sintering of the particles was higher for samples desulfurized at 12000C. Al so, those samples which had been washed with water obtained from the phosphoric acid plants cooling pond showed more sintering than samples which had received a fresh water wash.
The desulfurization of the samples showed no relationship to the slight degree of particle sintering that occurred in some of the samples. Desulfuritation was 97 to 99 percent at l150°C regardless of the type of wash used.
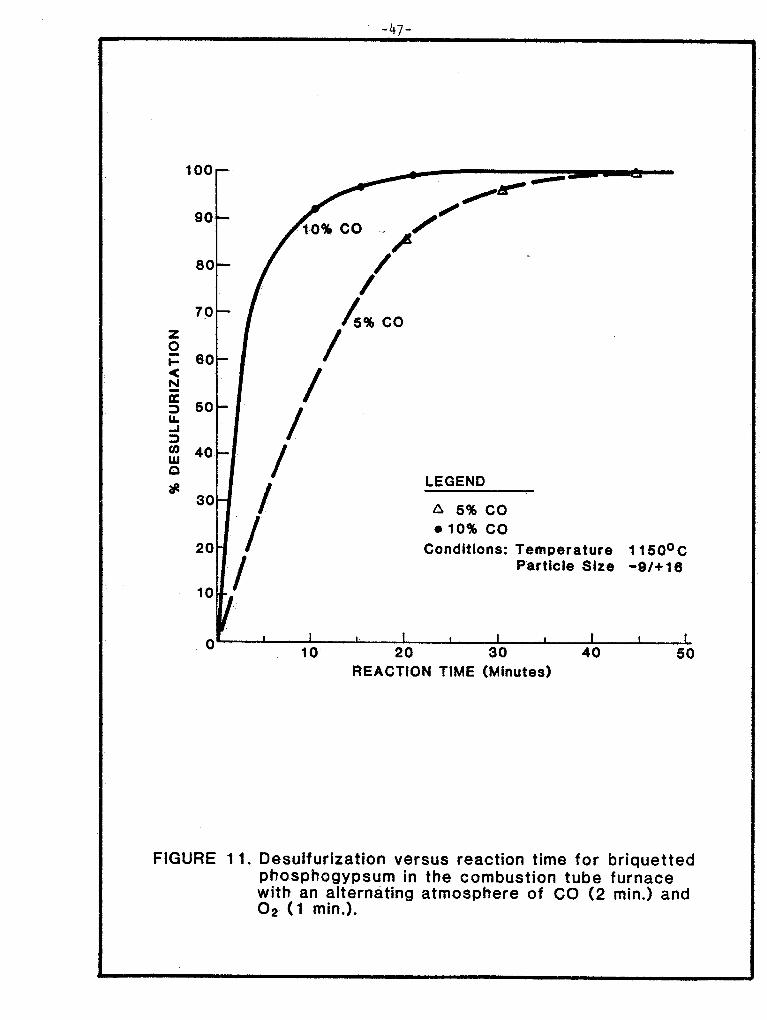
The effect of carbon monoxide concentration in _ the reducing gas on desulfurization is shown in Figure 11. From this data, it is seen that with a 5 percent CO concentration approximately 30 minutes are required for 95 percent desul furizat ion. However, this level of desulfurization can be obtained in 15 minutes at 10 percent CO. In the fluidited bed reactor, CO concentration is controlled by the ratio of primary air to fuel.

-46-
Table XVII _ -
Effect of Impurities on % Desulfurization and Sintering of Phosphogypsum in the Combustion Tube Furnace Under an Alternating
Atmosphere of 5% CO (2 min.) and 2% 02 (1 min.)
Sample Desulf. Gypsum Analysis Sinterinq % Desulf. Number Time (min) %!?5 - %F 1,lsoo~ 1,200oc 1,150oc
1 -wo 60 2-2 0.8 3 5 98
I-WI-1 60 2.0 1.0 3 5 98
I-w2-1 60 2.0 1.1 2 4 99
2-WI-1 60 9.2 0.6 2 4 99
2-w2-1 60 4.1 0.5 11 2 97
-lr7-
1
FIGURE 11.
80-
/
7.0 - / 5% co
80- /
LEGEND
f3 5% co e 10% co
Conditions: Temperature 1150°C Particle Size -s/+te
t 1 I 1 , I t I I I 10 20 30 40 50
REACTION TIME (Minutes)
Desulfurization versus reaction time for briquetted phosphogypsum in the combustion tube furnace with an alterndting atmosphere of CO (2 min.) and 02 (1 min.).

-4a-
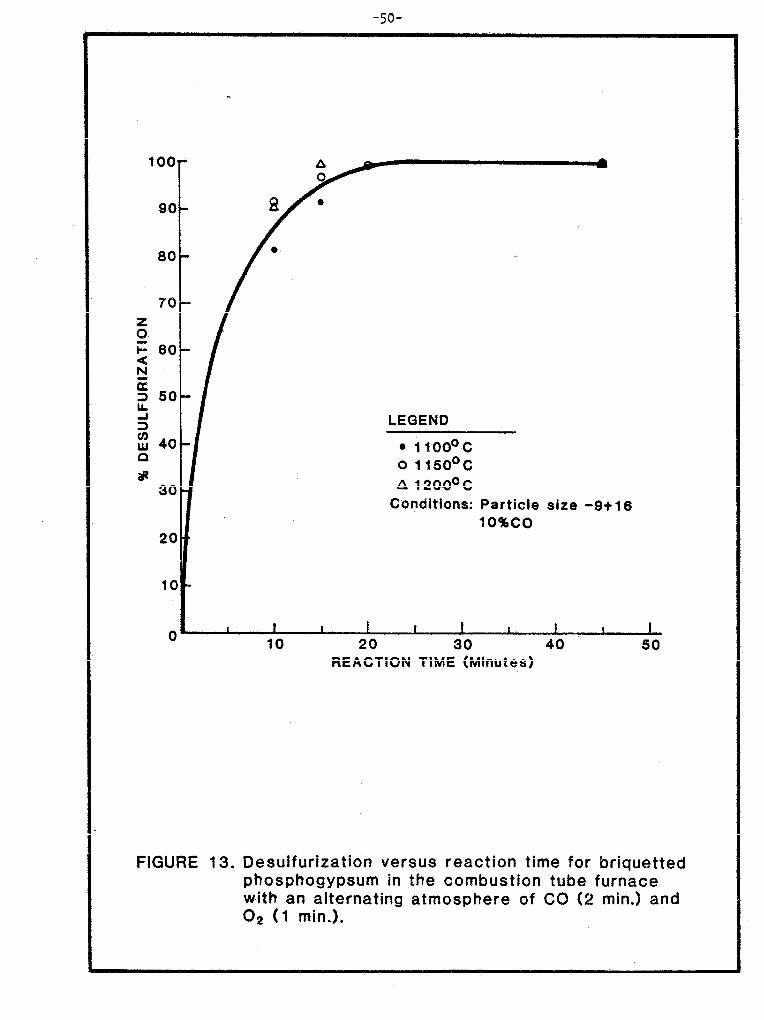
The particle size of the briquetted gypsum was shown to have no signif icant effect on desulfurization at reaction times greater than 15 minutes. This data is presented graphically in Figure 12. The effect of reaction temperatures (1100, 1150, and 1200°C) on desulfurization in the tube furnace at a 10 percent CO concentration is shown in Figure 13. At react ion times greater than 20 minutes desulfurization was complete regardless of the reaction temperature. When shorter reaction times were tested (10 and 15 minutes) the desulfurization at 1150 and 1200 oC was about the same. At 1lOOoC desulfurization was significantly lower, The results from the tube furnace tests are presented in Table XVIII.
Tests Usinq Co-briquetted Gypsum and Coal. The desulfurization of phosphogypsum when co-briquetted with high-sulfur coa! was also studied in the tube furnace. In these tests the reductant is the carbon contained in the coal. The gypsum is allowed to react under an atmosphere of N2 gas without an additional oxidizing or reducing agent present. The data obtained from these tests is presented in Table XIX.
The optimum coal concentration in the briquet appears to vary according to the reaction temperture and reaction time. At a reaction time of 30 minutes and above, 7 percent wt/wt dry coal to dry gypsum, appears to be the optimum coal concentration (Figure 14). However, Figure 15 shows that at IlOOoC and a reaction time of 15 minutes the optimum coal concentration may be somewhat greater than 8 percent.
Figure 14 also shows that there is no significant difference between the desulfurization obtained at 1lOOoC and that obtained at higher temperatures when a 30 minute reaction time is used.
Oesulfurization versus reaction time is plotted in Figure 16 for the three temperatures studied. From this data, it can be seen that at 12OOoC and 115OOC the desulfurization rate is approximately the same. At 1lOOoC this rate is significantly lower at 15 minutes reaction time but after 30 minutes the reaction is completed.
Miscellaneous Tube Furnace Tests. As part of the investigation into al ternate equipment to the fluidized bed reactor for the decomposition of phosphogypsum, tests were run in the combustion tube furnace which simulated those conditions found in a revolving table calciner. In these tests “as rece i ved” dry gypsum was mixed with ground coal and a .25-inch bed (5 grams of material) placed in the combustion boat. The sample was then placed in the preheated tube furnace and reacted under a neutral atmosphere. Desulfuritation was 99 percent at a retention time of 15 and 30 minutes when 7 percent coal was used in the mixture (Table XX). These results show that the intimate coal/gypsum contact present in the briquet is not necessary for the reaction to occur. When the depth of the material in the combustion boat was increased to 0.40 inches a desulfurization of 96% was obtained. The effect of material depth on desulfurization is difficult to determine due to the limited number of tests conducted.
Bench Scale Fluidized Bed Reactor Testing
Preliminary Runs Usinq Natural Gas. About 30 runs were made during the project in the ISU bench-scale fluidized bed reaction system. Initial ly, runs were made to compare operation of the reactor when phosphogypsum is used to that obtained when operating with crushed anhydrite rock. This was done

-49-
LEGEND
l -9+16 0 -16+32
0 -32+60 A As received
Conditions’: Temperature 1 100°
FIGURE 12.
REACTION TlME (Minutes)
Desulfurization versus reaction time for briquetted phosphogypsum in the combustion tube furnace with an alternating atmosphere of 10% CO (2 min.) and 2% O2 (1 min.).
90
80
20
10
0
LEGEND
l 1100”c 0 1150°C a 12ooOc
Conditions: Partic’le size -9t 16 lO%CO
FIGURE 13.
20 30 40 50 REACTION TIME (Minutes)
Desuifurization versus reaction time for briquetted phosphogypsum in the combustion tube furnace with an alternating atmosphere of CO (2 min.) and O2 (1 min.).


-52-
Table XIX
Temp. (OC> P-
4,100
1,150
1,200
1,100
1,150
1,200
1,100
1,150
1,200
1,100
1,150
1,200
Time 4% % Coal & Feed (wt/wt dry basis)
1% 8% (min.) % Des. Esl % Des. % Sp % Des:* % S= % Des. % S=
* 5 gm. initial sample wt.
5 27
5 51
5 55
15 57
15 61
15 65
30 58
30 60
30 62
60 57
60 62
60 78
Desulfurization in the Combustion Tube Furnace of Phosphogypsum Co-Briquetted with High-Sulfur
Coal (Illinois #5) Under a Neutral Atmosphere (N2)
2.2
0.9
0.2
0.0
0.0
0.0
0.0
0.0
0.0
0.0
0.0
0.0
29 4.5
57 2.7
69 0.9
em __
87 0.0
88 0.0
87 0.1
88 0.0
90 0.0
88 0.0
88 0.0
94 0.0
32 5.6 35 7.0
61 3.9 62 4.9
79 2.3 82 3.8
72 3.2 75 4.5
98 0.2 94 2.5
99 0.2 95 2.3
98 0.4 94 2.4
99 0.1 95 2.3
99 0.0 94 205
100 0.0 94 2,8
99 o-0 95 2.1
99 0.0 95 2.5

-C?-
loo-
90-
80-
70-
: i= a 80- N E
z so-
: g 40- LEGEND
* l 11oooc
30- 0 115ooc
A 1200’C 20- Conditions: Desuifurization time 30 min.
Particle size : -9+18 mesh
lo-
0 I I I I I
4 5 8 i s % COAL IN FEED
FIGURE 14. Desulfurization veisus % coal in the feed for briquetted gypsum at a 30 minute desulfurization time.

LEGEND
l 11oooc
0 1150°C
Q 12oo*c
.
Conditions: Desulfurization time 15 min.
Particle size : -9+16 mesh
I
4 I I I I
5 6 7 8
% COAL IN GYPSUM
FIGURE 15. Desulfurization versus % coal in briquetted gypsum at a 15 minute desulfurization time.

-cc_
90
80
2(3
tc
c
LEGEND
0 lloo”c 0 115ooc
I?r 12oooc
Conditions: 7% Coal Particle size: -9+18 mesh
I
10
I I I
20 30 40
REACTlON TIME (Minutes)
I 1 50 60
FIGURE 16. Desulfurization versus reaction time for co-briquetted gypsum and coal (7%).

-56-
Table XX _ -
Results Obtained in the Combustion Tube Furnace in Tests with "As Received" Gypsum Mixed with Illinois Coal
Under a Neutral Atmosphere
% Coal Temp. Bed Depth Desulf. Time 7 a oC inches Minutes Sint. % Desulf. sl= Sint. % Desulf. 2X
1150 0.25 15 3 99 0.0 3 96 1.5
1150 0.25 30 3 99 0.0 3 96 1.5
1150 0.40 15 3 96 1.2 __ __ __

-57-
because of the vast exper i ence ISU has collected in developing the decomposition process for operation with anhydrite and the concern that impurities present in phosphogypsum may interfere with the operation of the reactor . Natural gas was used as the fuel in this stage of the process development.
The results obtained from the natural gas runs are shown in Table XXI. Br iquetted gypsum gave better overal 1 results than those obtained in the fluidized bed reactor when operating with crushed anhydrite. Oesulfurization was slightly higher when phosphogypsum was fed to the reactor. The br iquetted gypsum also showed substantially less entrainment due to the briquetts higher resistance to attrition and its increased strength upon firing.
_ -
The next set of tests were run to study the effects of the modifications made to the reactor (see Appendix B) to improve its performance and reduce the down time between runs. The operating conditions and test results are given in Table XXII.
Tests 6a and 6b were run in the original reactor with a 22 inch bed at residence times of 2.2 hours and 1.8 hours, respectively. The residence time is determined by weighing the mass of material left in the bed after each run and dividing that mass by the feed rate. Both the mass and the feed rate are converted to a Ca basis prior to calculating the residence time. Desulfurization of the overflow solids was 86 percent for both tests. Calcium recovery in the overflow sol ids was 90 percent for Run 6a and 86 percent for Run 6b. Entrainment rate, based on the so-1 ids collected in the settling chamber, was negligible in both tests. Accumulation rate on the reactor walls was approximately 0.7 pounds/hour when averaged over the duration of the runs.
Run 7 was the first test in the modified reactor which had a 34 inch bed. After a few hours into the run a positive pressure in the reactor was encountered and the run had to be terminated. Phosphogypsum had been fed for only 3.5 hours before stopping the test; therefore, steady-state conditions had not been achieved. Analysis of the overflow product showed it was 94 percent desulfurized. Considerably more entrained material (1.2 pounds/hour) was collected in the settling chamber during the test than in previous phosphogypsum runs due to the increased gas velocity in the upper portion of the reactor resulting from the new top. As is common on a full-scale fluidited bed reactor, an expanded freeboard will be included in the design in order to reduce the particle entrainment rate in the off-gas. After the reactor had cooled, it was discovered that the vent pipe beyond the ejector was partly filled with water. Due to cold weather, moisture in the off-gas condensed in the vent pipe causing the build-up of pressure in the reactor. inspection of the reactor top revealed only a small amount of loosely adhering solids indicating that some progress had been made toward eliminating solids accumulation in the reactor.
For Run 8, the vent pipe was insulated and the ejector placed at the end of it. This succeeded in preventing positive reactor pressure due to condensation in the vent pipe. Solids residence time was reduced to 1.7 hours for this test, as compared to 2.9 hours for Run 7. The particle entrainment rate was slightly less - 0.8 pounds/hour versus 1.2 for Run 7. Some problems were encountered in this run with the off-gas sampling; however, SO2 was analyzed and found to be approximately 5 percent. Desulfurization of the overflow solids was 86 percent and 83 percent of the calcium fed to the process was accounted for in the overflow.
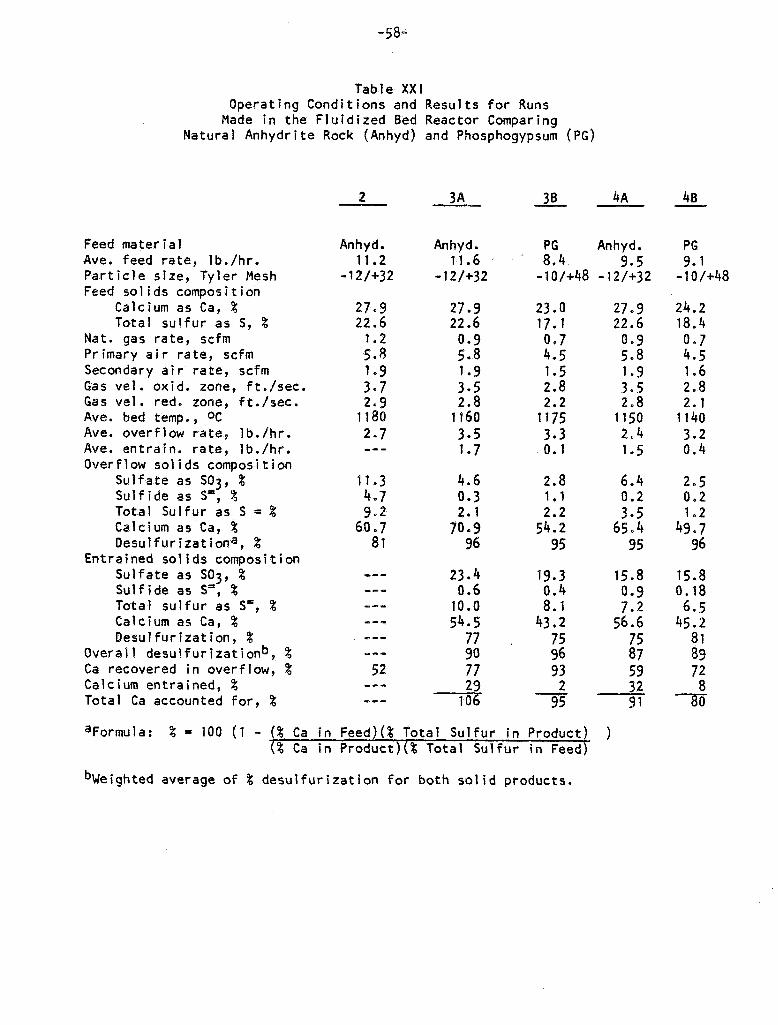
-5s
Table XXI Operating Conditions and Results for Runs
Made in the Fluidized Bed Reactor Comparing Natural Anhydrite Rock (Anhyd) and Phosphogypsum (PG)
Feed mater ial Ave. feed rate, lb./hr. Particle size, Tyler Mesh Feed solids composition
Calcium as Ca, % Total sulfur as S, %
Nat. gas rate, scfm Primary air rate, scfm Secondary air rate, scfm Gas vel. oxid. zone, ft./set. Gas vel. red. zone9 ft./set. Ave. bed temp., ‘X Ave. overflow rate, lb./hr. Ave. entrain. rate, lb./hr. Overflow solids composition
Sulfate as S03, % Sulfide as S’, % Total Sulfur as. S = % Calcium as Ca, % Oesulfuritationa, %
Entrained solids composition Sulfate as S03, % Sulfide as S3, % Total sulfur as S’, % Calcium as Ca, % Desulfurization, %
Overall desulfurizationb, % Ca recovered in overflow, % Calcium entrained, % Total Ca accounted for, %
2
Anhyd. 11.2
-12/+32
27.9 22.6
;:;
::;
2.9 1180
2.7 a--
11.3
;:: 60.7
81
_-- _P_ -0s _-- 0-B P__
52 --- __-
3A
Anhyd. 11.6
-12/+32
27.9 22.6
;:t
1.9
z ll&.l
3.5 1.7
4.6 0.3
7:;;
23.4 0.6
10.0
54,s
;:
77
-$z
_3%_ 4A 4B
- 8pG4 Anhyd.
9.5 -lo/+48 -12/+32
23.0 17.1
:::
1.5 2.8 2.2
1175 3.3 0.1
27.9 22.6
0.9 5.8
i:;
1150 2.4
1.5
2.8 6.4 1.1
5::; ;::
65.4
95 95
19.3 15.8
43:2 z
0.9
5;:;
;z ;;
93 59
4 ;:
PG 9.1
-lo/+48
24.2 18.4
II:: 1.6 2.8 2.1
1140
3.2 0.4
205 0.2
4;::
96
15.8 0.18
6-s 45.2
81 89 72
4
aFormula: % = 100 (1 - (% Ca in Feed)(% Total Sulfur in Product) ) (% Ca in Product)(% Total Sulfur in Feed)
bWeighted average of % desulfurization for both solid products.

-59-
Table XXII Operating Conditions and Results for Runs Made in the Fluidized Bed Reactor Using Briquetted Phosphogypsum and Natural Gas
Run Number _ ba bb 7 8
Average feed rate, lb/hr 10.2 12.2 13.5 14.6 Particle size, Tyler Mesh -lo/+48 -lo/+48 - -lo/+48 -lo/+48
Feed solids composition Calcium as Ca, % Total sulfur as S', %
23.8 23.8 22.4 22.0 17.7 17.7 17.8 17.7
Natural gas rate, scfm Primary air rate, scfm Secondary air rate, scfm Gas vel. oxid. zone, ft./see. Gas. vel. red. zone, ft./set. Average bed temperature, oC Average overflow rate, lb/hr Average entrain. rate, lb/hr
1.5 2.7 2.1 1150 4.2 0.0
Overflow solids composition Sulfate as SO3,_% Sulfide a's S', % Total Sulfur as S", % Calcium as Ca, % Desulfurization, %
2.8 0.4
5::: 96
Entrained solids composition Sulfates SO3, % Sulfide as S', % Total sulfur as S=, % Calcium as Ca, % Desulfurization, %
23.0
;:: 37.8
67
Ca recovered in overflow, % Calcium entrained, %
Total desulfurization, % 96 TO
Total Ca accounted for, % 6 Ave. solids residence time, hr. 2.2
Offgas analysis
N2, % CO2, % H20, % SO2, % 02, % CO2, %
--_ --- --- --- --- --_
t:; ::; 1.5 1.5 2.7 2.8 2.1 2.1 1150 1150 4.9 4.4 0.0 1.2
3.8 6.2 0.0 0.2 1.6 2.6
'"9: 58947
15.2 30.5
33
e-w
_a_
MS_
___
w-s
___
SW_ _a- __- Mm- -w-
s-v -we -e- __- w-w ---
0.8 3.2
::: 2.4 1150 4.8 0.8
3.8 0.0
5::: 97
13.0
;:: 51.8 86
68-77 8-T 11-18
3-5 "Be s-m

-6O-
Fluidited Bed Tests Usinq Coal. Test 9 was the first test in which coal was used to fire the fluidized bed reactor. Results from this test are shown in Table XXII I. Despite experimental difficulty, the feasibility of using coal to thermally decompose phosphogypsum was proven in this test. Because of deficiencies in the coal feeding system, about 50 percent excess coal was fed to the reactor. This resulted in poor oxidizing conditions in the upper zone of the fluidized bed which in turn resulted in a reduced level of desulfurization and a high sulfide content in the reacted sol ids. Desulfurization was 71 percent and 82 percent for the overflow and the entrained solids, respectively. Overall desulfurization for the run was 74 percent.
Runs 10 and 11 were aborted due to problems in feedinq coal. In run 10, the coal rate varied over a wide range and could not be c&trolled reliably: In run 11, the coal was fed in through the four primary air ports at the bottom of the reactor. One of the ports plugged and the reactor was shut down due to improper fluidization - one quadrant of the bed was not being utilized.
The results from Runs 12a and 12b are also shown in Table XXI I I. Coa 1 feed rates were better controlled in these tests than in the previous runs. In Run 12a, the overflow sol ids contained relatively high sulfide concentrations, again indicating poor oxidizing conditions as occurred in Run 9. The overall percent desulfurization for this test was 80 percent. In Run 12b, the secondary air rate was increased 66 percent. This greatiy reduced the sulfide content of the overflow product and resulted in an overall desulfurization of 91 percent. Run 12b was the first completely successful coal-fired run. The technical feasibility of the ISU process to decompose phosphogypsum while obtaining a high sulfur recovery was proven. Another significant aspect of Run 12b is the reduction in retention time from 2 hours to 1.3 hours.
Upon evaluation of the data generated in runs 12a and 12b it was decided that the feasibility of desulfurizing phosphogypsum by the ISU process using high-sulfur coal as a fuel had been proven. The methods and techniques required for coal feeding had been developed to the extent that the fuel rate could be controlled as well as when operating with natural gas, After the completion of these runs, the study was directed towards the evaluation of some of the process operating parameters; namely, unit capacity and the effect of gypsum particle size on percent desulfurization.
The effects of capacity on desulfurization of phosphogypsum and entrainment of reacted solids were studied in Tests 13 and 14. Operat i ng conditions and results are listed in Tables XXIV and XXV, respectively.
As phosphogypsum feed rate to the fluidized bed reactor is increased, the corresponding air rates must also be increased. The effect of this is a higher gas velocity in the reactor which in turn expands the fluidized bed, decreasing the bed density. This results in a non-linear relationship between the gypsum feed rate and sol ids particle retention time. In Figure 17, the relationship between the feed rate and retention time for runs using gypsum sized at -lo+48 mesh (Tyler) is shown. In the range of feed rates studied, the relationship between feed rate and retention time is approximately linear. At rates on either side of the range studied, one would expect the curve to approach the axis asymptotically.

-6l-
Table XXIII
Operating Conditions and Results for Coal Runs 9 and 12 a,b Made with Phosphogypsum in the Fluidized Bed Reactor
Average feed rate, lb/hr 14.1 21.1 20.6 Particle size, Tyler mesh -lo/+48 4 O/+48 -1 O/+48
Feed solids composition Calcium as Ca, % Total sulfur as S, %
High-sulfur coal source Coal feed rate, lb/hr Primary air rate, scfm Secondary air rate, scfm Gas vel. red. zone, fps Gas vel. oxid. tone, fps Average bed temperature, OC Average overflow rate, lb/hr Average entrainment rate, lb/hr
Overflow solids composition Sulfate as S03, % Sulfide as S', % Total sulfur as S', % Calcium as Ca, % Desulfurization, %
Entrained solids composition Sulfate as S03, % Sulfide as S', % Total sulfur as S=, % Calcium as Ca, % Desulfurization, %
Overall desulfurization, % Ca recovery in overflow, % Calcium entrained, % Total Ca accounted for, % Average solids residence time, hr.
Offgas analysis
N2, % CO2, % H20, % SO2, %
Run Number 12a 12b 9
22.0 22.4 22.4
17.3 17.8 17.8
Iowa 6.7
;:;
2:4 1150 4.7 1.6
3.0 10.0 11.2 49.6
71
Z:: 5.8
41.4 82
74 78 75 79
$k g 2.1 --_
59-79 10-11 6
2-4
Illinois 6.5 6.6 1.5
::: 1150 6.3 3.3
Illinois
::: 2.5
::: 1150 5.3 2.7
3.6 0.2 1.6
59.9 97
10.7 16.1
z 2; 29.1 44:4
71 81
65 20
3-::
2;
$ 1.3
68 15
4-Y

-62-
Table XXIV
Operating Conditions and Results of Coal Runs 13 a,b,c Made with Phosphogypsum in the Fluidized Bed Reactor
13a Run Number
13b
Average feed rate, lb/hr 28.6 24-7 Particle size, Tyler mesh
28.7 -lo/+48 -1 o/+48 -lo/c48
Feed solids composition Calcium as Ca, % Total sulfur as S”, %
High-sulfur coal source Coal feed rate, Ib/hr Primary air rate, scfm Secondary air rate, scfm Gas vel. red. zone, fps Gas vel. oxid. zone, fps Average bed temperature, OC Average overflow rate, lb/hr Average entrainment rate, Ib/hr
Overflow solids composition Sulfate as SO3p % Sulfide as S”, % Total sulfur as S”, % Calcium as Ca, $ Desulfuritation, %
Entrained solids composition Sulfate as SO3? % Sulfide as S”, % Total sulfur as S”, % Calcium as Ca, % Desulfurization, %
Overall desulfurization, % Ca recovery in overflow, % Calcium entrained, % Total Ca accounted for, % Average solids retention time, hr.
Offgas analysis
N2, % CO29 % H20, % SO29 % 027 % co, %
22.7 22.7 22.7 17.8 17.8 17.8
Illinois
21,: 2.0
::: 1150 6.4 1.8
Illinois
z
i:;
llS0 6.7 3.3
Illinois 8.2 10.7
::: 5.6
1150
;:;
2.8 4*4 0.5 0.0 1.6 1.8
57.9 57.2 97 96
7.6 0.0
5;:: 93
9.2 1.5
4::: 85
12.0
;:: 44.6 8s
"Z g:8
37.3 67
94 92 79 68
3 3 __ em
83 66 28 i@ 0.5
69.5 68.8 18.0 17.0 704 8.4 4.5 4.4 0.0 1.4 0.6 0.0
69.0 17.0 8.9
zJ 010

-63-
Table XXV
Operating Conditions and Results of Coal Runs 14 a,b,c Made with Phosphogypsum in the Fluidized Ded Reactor
14a Run Number
14b
Average feed rate, lb/hr 24.6 29.3 34.0 Particle size, Tyler Mesh -lo/+28 -lo/+28 -lo/+28
Feed solids composition Calcium as Ca, % Total sulfur as S”, %
High-sulfur coal source Coal feed rate, lb/hr Primary air rate, scfm Secondary ai r rate, scfm Gas vel. red. zone, fps Gas vel. oxid. zone, fps Average bed temperature, oC Average overflow rate, lb/hr Average entrainment rate, lb/hr
Overflow solids composition Sulfate as SO3, % Sulfide as S’, % Total sulfur as S’, % Calcium as Ca, % Desulfurization, %
Entrained solids composition Sulfate as S03, % Sulfide as S’, % Total sulfur as S’, % Calcium as Ca, % Desulfuritation, %
Overall desulfurization, % Ca recovery in overflow, % Calcium entrained, % Total Ca accounted for, % Average solids residence time, hr.
Offgas analysis
N2, % CO2, % H20, % SO2, % 02, % co, %
22.6 22.6 22.6 17.7 17.7 17.7
Illinois Illinois Illinois 6.4 8.4 9.5 8.6 10.7 11.6
::: ;:: ::: 4.5 5.6 6.2
1150 1150 1150 8.2 8.8 9.9 2.0 3.4 5.3
5.6 0.05
5::; 95
5.8 0.05 2.4
56.5 95
8.8 0.0
5:::
92
6.0
;::
278z
9.3
::: 36.0
84
16.4 0.4
4:::
79
;:
$ __
92 75 18
93 --
87
:: 100 0.5
Air 70.1 69.5 Leak 17.3 16.2
in 7.8 8.2 System 3.5 4.1
1.5 1.3 2.0 0.0 0.0 0.0
14c
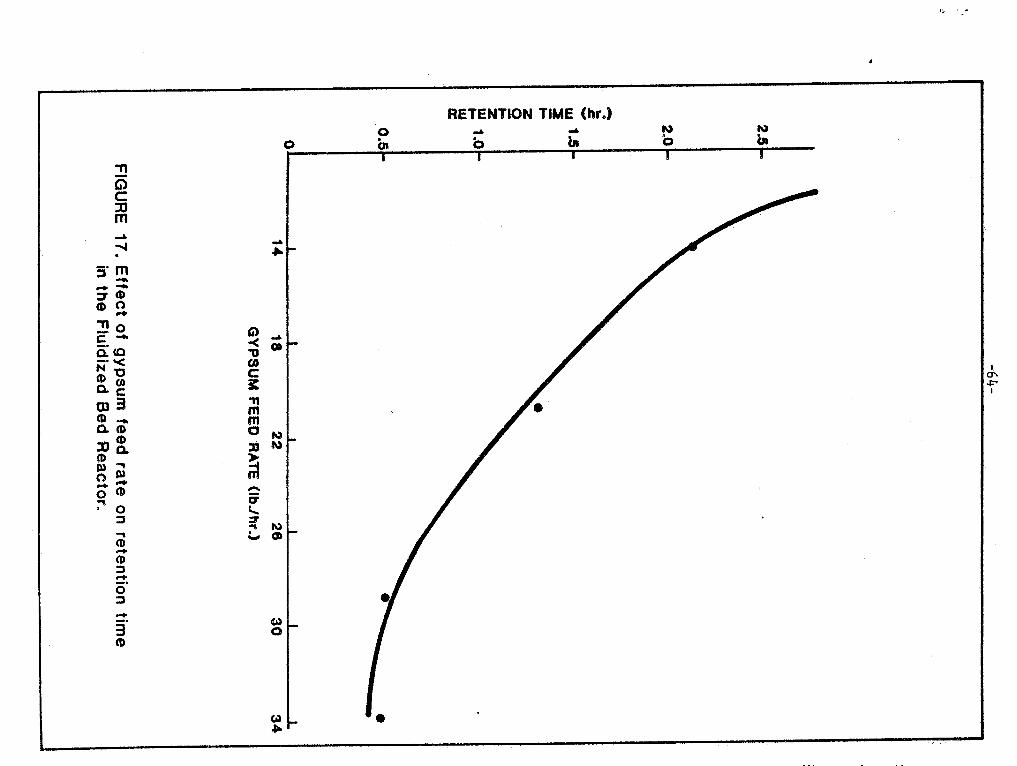
,
RETENTllON TIME (hr.)
G ii I I
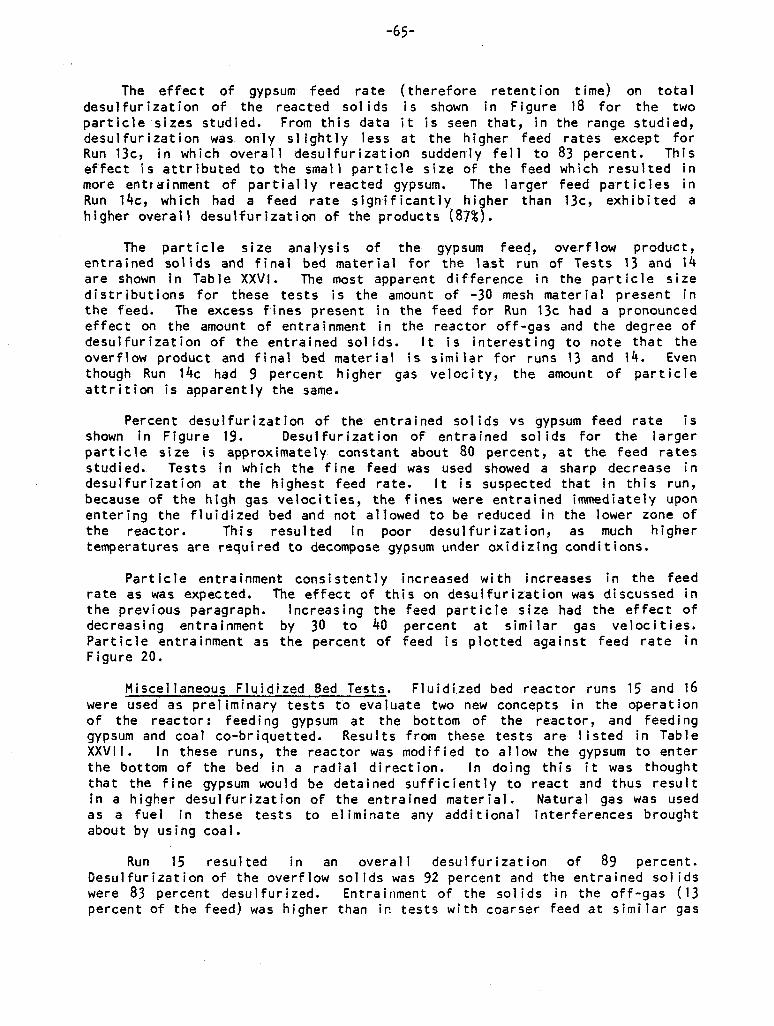
-65-
The effect of gypsum feed rate (therefore retention time) on total desulfurization of the reacted solids is shown in Figure 18 for the two particle -sizes studied. From this data it is seen that, in desulfuritation was only slightly less at the higher feed Run 13c, in which overall desulfurization suddenly fell to effect is attributed to the small particle size of the feed more entrainment of partially reacted gypsum. The larger Run lk, which had a feed rate significantly higher than higher overall desulfurization of the products (87%).
the range studied, rates except for 83 percent. This which resulted in feed particles in
13c, exhibited a
The particle size analysis of the gypsum feecl, overflow product, entrained solids and final bed material for the last run of Tests 13 and 14 are shown in Table XXVI. The most apparent difference in the particle size distributions for these tests is the amount of -30 mesh material present in the feed. The excess fines present in the feed for Run 13~ had a pronounced effect on the amount of entrainment in the reactor off-gas and the degree of desulfurization of the entrained solids. It is interesting to note that the overflow product and final bed material is similar for runs 13 and 14. Even though Run 14~ had 9 percent higher gas velocity, the amount of particle attrition is apparently the same.
Percent desulfurization of the entrained solids vs gypsum feed rate is shown in Figure 19. Desulfurization of entrained solids for the larger particle size is approximately constant about 80 percent, at the feed rates studied. Tests in which the fine feed was used showed a sharp decrease in desulfurization at the highest feed rate. It is suspected that in this run, because of the high gas velocities, the fines were entrained immediately upon entering the fluidized bed and not allowed to be reduced in the lower zone of the reactor . This resulted in poor desulfurization, as much higher temperatures are required to decompose gypsum under oxidizing conditions.
Particle entrainment consistently increased with increases in the feed rate as was expected. The effect of this on desulfurization was discussed in the previous paragraph. Increasing the feed particle size had the effect of dec reas i ng entrainment by 30 to 40 percent at similar gas velocities. Particle entrainment as the percent of feed is plotted against feed rate in Figure 20.
Miscellaneous Fluidized Bed Tests. Fluidized bed reactor runs 15 and 16 were used as prel iminary tests to evaluate two new concepts in the operation of the reactor: feeding gypsum at the bottom of the reactor, and feeding gypsum and coal co-briquetted. Results from these tests are listed in Table XXVII. In these runs, the reactor was modified to al low the gypsum to enter the bottom of the bed in a radial direction. In doing this it was thought that the fine gypsum would be detained sufficiently to react and thus result in a higher desulfurization of the entrained material. Natural gas was used as a fuel in these tests to eliminate any additional interferences brought about by using coal.
Run 15 resulted in an overal 1 desulfurization of 89 percent. Desulfurization of the overflow solids was 92 percent and the entrained solids were 83 percent desulfurized. Entrainment of the solids in the off-gas (13 percent of the feed) was higher than ir. tests with coarser feed at similar gas
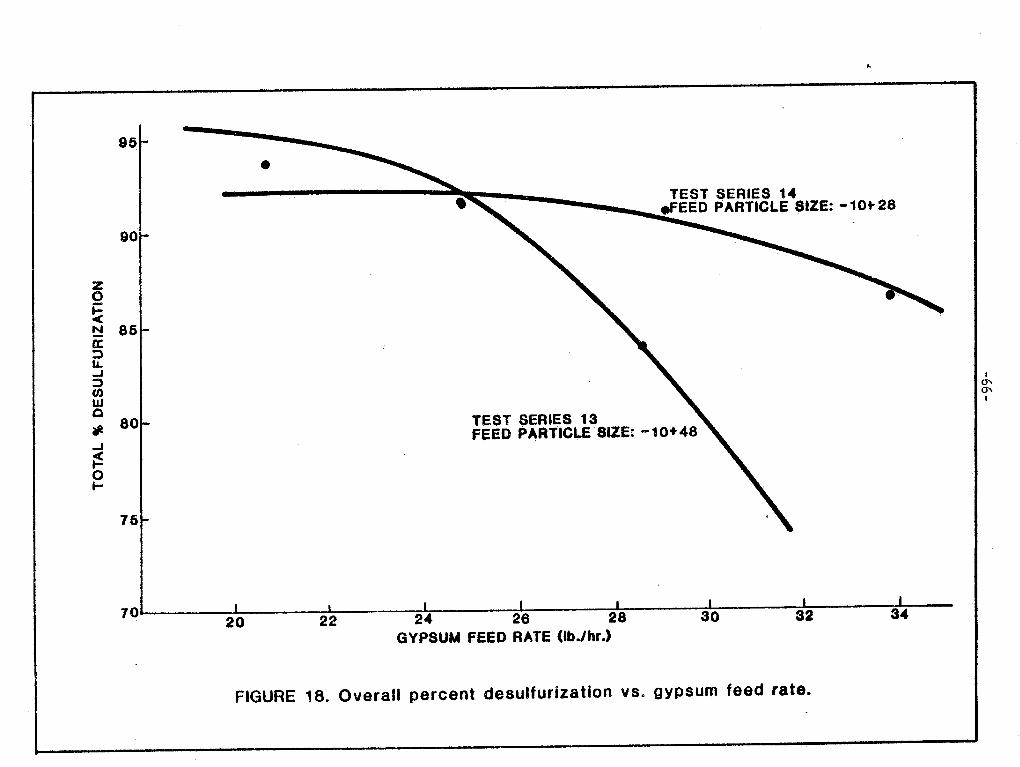

-67-
Table XXVI
Particle Size Analysis of Solids from Runs 13c and 14c
Run 13c
Overflow % wt
26
Feed % wt
45
Entrained % wt.
i-
Final Bed % wt.
37
45
Mesh Size
-10+14
- 14+20
-20+28
-28+35
-35+48
-48+100
-100+200
-200
27 49 _-
13 20 9
30
24
19
9
9
13
4 10 4
4 1 1
1 __
_- _- __
_- _-
Run 14~
Feed %
46
Overflow Entrained Final Bed % wt % wt. % wt.
me 36
Mesh Site
-10+14
-14+20
-20+28
-28+35
-35+48
-48+100
-100+200
-200
25
33 50
18 20
3 39
27 15
36 7 3 5
13
13
2 _- __
1 _-
5
3
we __ __
_- _- __


-7o-
velocities and feed rates, (4.5 ft/sec) using
as evidenced when comparing do+28 mesh feed versus run 15 (4.0
the results of run 14a ft/sec) using -lo+100
mesh feed. However, desulfuritation of the entrained mater ial was approximately the same for Run 15 as for Run 14a. Limited desulfurization of the entrained solids may have been do to the relatively shallow bed available in the ISU reactor.
In run 16, phosphogypsum, co-briquetted with Illinois coal, was fed to the reactor. The importance of this concept is that because the coal acts as the reductant, a two-zone atmosphere is not required in the reactor. In addition to this, results obtained from tube furnace_ tests indicated the reaction of calcium sulfate and coal occurs at a faster rate than the reaction between calcium sulfate and carbon monoxide.
The overflow sol ids were 96 percent desulfurized. Overa 11 desulfurization of the gypsum was 89 percent in this run due to a large amount of entrainment in the off-gas caused by the fine particle size and lower desulfurization of the entrained solids. Subsequent tube furnace tests indicated that insufficient coal was used in the briquet and that the optimum amount is 7 percent by weight rather than the 6.1 percent used in this run.
In addition to the coal ratio, some problems were encountered with keeping a neutral atmosphere in the reactor. The CO and 02 concentrations in the off-gas varied somewhat during the run.
Samples of the overflow and entrained solids were analyzed for fluorine so that the fluorine balance could be calculated and an estimate of the fluorine concentration of the off-gas could be made. These calculations showed the off-gas to contain 133 ppm F in run 15 and 107 ppm in Run 16 (Table XXVI I). It is expected that most of the fluorine would be removed by the scrubber downstream from the decomposition reactor.
Run 17 was aborted before steady state conditions could be achieved because of problems occurring in the off-gas systems. This test was to be run with co-briquetted phosphogypsum with 6.6 percent coal using natural gas as a fuel (run 17a) and then coal (run 17b) as the auxilliary fuel.
Four runs were conducted in Test 18 using gypsum co-briquetted with 6.6 percent coal as a feed material (see Table XXVI I I). These runs were used to investigate desulfurization under various levels of reducing and/or oxidizing conditions in the reactor to identify the best conditions when operating with a single zone. Run 18d was conducted to compare desulfurization of co- briquetted gypsum in a single zone reactor to that in a 2-tone reactor.
Oesulfurization of the overflow product was 96 to 97 percent in all four tests. Overall desulfurization ranged from 84 percent under slightly oxidizing conditions to 90 percent when a near neutral atomosphere was maintained. Entrainment rate ranged from 20 to 23.5 percent of the feed because of the fine particles present in the feed.
Operating the reactor, with coal incorporated into the briquetted feed, with two zones gave no advantage over single zone operation. In addition to this, precise control of the reactor atmosphere appears not to be necessary to obtain good desulfurization of the gypsum.
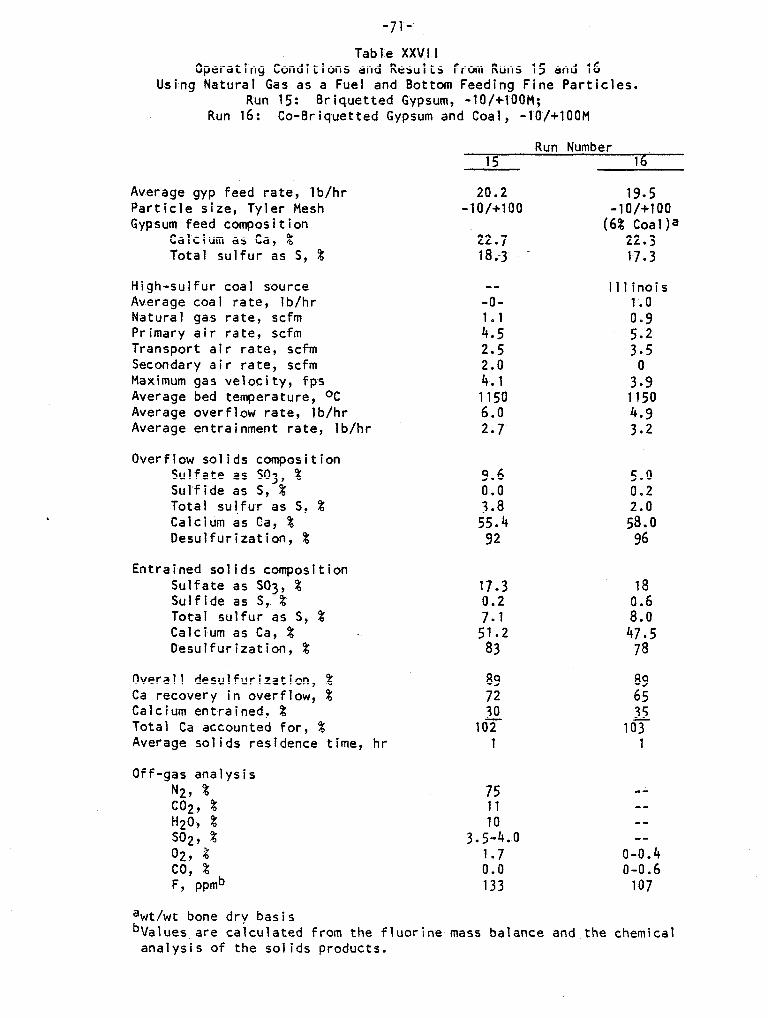
-7l-
Table XXVII Operating Conditions and Results from Runs 15 and 16
Using Natural Gas as a Fuel and Bottom Feeding Fine Particles. Run 15: Briquetted Gypsum, -lO/+lOOM;
Run 16: Co-Briquetted Gypsum and Goal, -lO/+lOOM
Average gyp feed rate, lb/hr Part idle-size, Tyler Mesh Gypsum feed compos i t ion
Calcium as Ca, % Total sulfur as S, %
Run Number 15 16
20.2 19.5 -lO/+lOO -1O/+lOO
(6% Coal)a 22.7 22.3 18.m3 - 17.3
High-sulfur coal source Average coal rate, lb/hr Natural gas rate, scfm Primary air rate, scfm Transport air rate, scfm Secondary air rate, scfm Maximum gas velocity, fps Average bed temperature, OC Average overflow rate, lb/hr Average entrainment rate, Ib/hr
_w
-o-
1:: 2-S
2:: 1150 6.0 2.7
Illinois 1.0
;::
3.5 0
3.9 1150 4.9 3.2
Overflow solids composition Sulfate as SO3, % Sulfide as S, % Total sul_fur as S, % Calcium as Ca, % Desulfurization, %
9.6 5.0 ;:: 0.2
55.4 528'.:
92 96
Entrained solids composition Sulfate as SOg, % Sulfide as S, % Total sulfur as S, % Calcium as Ca, % Desulfurization, %
17.3 18 0.2 7.1 ;::
51.2 47.5 83 78
Overall desulfurization, % Ca recovery in overflow, % Calcium entrained, % Total Ca accounted for, % Average solids residence time, hr
a9 89 72 65 30
102 35
103 1 1
Off-gas analysis
N2, % co29 % H20, % so29 % 02, % co, %
F, pwb
75 ..L 11 _-
3.5z.o
_- --
1.7 o-o.4 0.0 O-0.6 133 107
awt/wt bone dry basis L “Values are calculated from the fluorine mass balance and the chemical
analysis of the solids products.

-72-
Table XXVIII Operating Conditions and Results of Coal
Runs 18 a,b,c,d Made with Co-Briquetted (-lO/+lOO) Phosphogypsum.and Coal (6.6 % Dry Basis) in
the Fluidized Bed Reactor
Run Number
'8a - - - 18b 18c 18d
Average gyp feed rate, lb/hr 29.7 29.5. - 29.4 29.5 Particle size, Tyler mesh -lO/+lOO -lO/+lOO -10/+100 -lO/+lOO
Feed solids composition Calcium as Ca, %
Total sulfur as S, %
High-sulfur coal source Coal feed rate, lb/hr Primary air rate, scfm Secondary air rate, scfm Gas vel. red. zone, fps Gas vel. oxid. zone, fps Average bed temperature, OC Average overflow rate, lb/hr Average entrainment rate, lb/hr
21.8 21.8 21.8 21.8 17.2 17.2 17.2 17.2
Pittsburgh Pittsburgh Pittsburgh Pittsburgh
7.8 7.7 8.0 8.6 12.2 ---
5.0 -.._
1150
::;
12.7 w-e
5.2 _a-
1150
13.3 m-w
5.4 ___
1150
:I;
11.7
1:; 5.4 1150
Ei
Overflow solids composition Sulfate as SO3, % Sulfide as S', % Total sulfur as S, % Calcium as Ca, % Desulfurization, %
3.6 0.1
5::: 97
Ki 1:4
56.7 97
4.5 0.0 1.8
ss962
4.0 0.0 1.6
56.2 96
Entrained solids composition Sulfate as S03, % Sulfide as S', % Total sulfur as S, % Calcium as Ca, % Desulfurization, %
14.8
::; 40.5
79
12.8 0.7 5.8
40.9 82
20.2
::; 41.3
73
20.1
k:: 4218
74
Overall desulfurization, % 89 Ca recovery in overflow, % 61 Calcium entrained, 8 39 Total Ca accounted for, % 100
E 38 la4
87 58
&
Offgas analysis CO2 + so2, %a
02, % co, %
25 26 26 24 0.1 0.3 0.9 1.9 0.5 0.1 0.3 0.2
aAcid gas analysis by the Orsat Method.

-73-
All gas analyses in these tests were done by the Orsat method because of suspected errors present when analysis was done by the gas chromatograph. The
Orsat method analyzes the sum of CO2 and SO2 (acid gas). According to this method, the acid gas concentration was about 25 percent. This is slightly higher than obtained by the chromatograph which averaged 20 percent CO2 + SO2. Assuming the ratio of SO2 and CO2 is similar to the average obtained in the chromatograph, this would result in an SO2 concentration of 4.7 percent in the reactor off-gas.
In run 19, dry “as received” gypsum was fed to the reactor to which overflow product from a previous run had been introduced to establish the initial fluidized bed (see Table XXIX). During operation of the unit, additional by-product lime was continuously fed at a rate of 3.2 pounds per hour to maintain the bed. Analysis of the overflow product showed that the material was 97 percent desulfurized. However, this result may be misleading due to the presence of recycled overflow. Overall desulfurization of the entrained and overflow solids was 61 percent (compared to 74 percent when calculated by analysis) if all of the unaccounted for calcium is assumed to have the same composition as the entrained material. Because of the poor accountability of calcium (solids) it is difficult to relate the results of this test with the other fluidited bed reactor tests.
Runs 20a and 20b were conducted in order to compare gypsum which had been roll briquetted to gypsum granulated by FEECO. As predicted by the tumbling tests, particle entrainment, resulting from particle attrition in the reactor was less for the granulated gypsum. Desulfurization of the overflow product was 96 and 97 percent and overall desulfuritation was 93 and 91 percent for runs 20a and 20b, respectively.
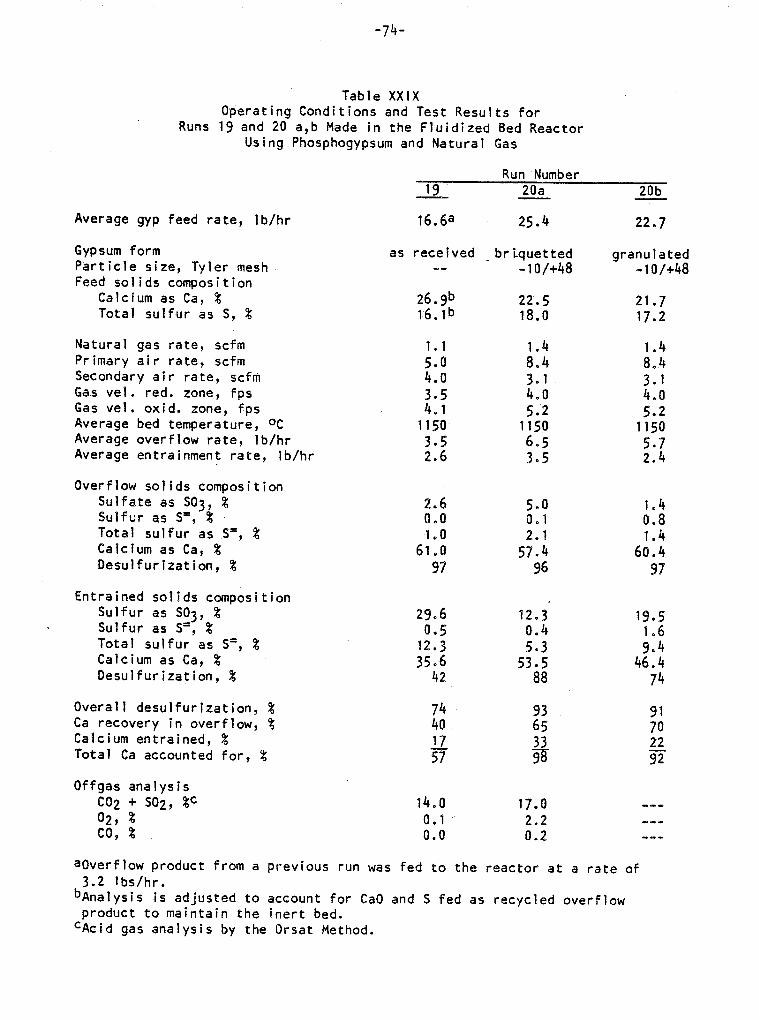
-74-
Table XXIX Operating Conditions and Test Results for
Runs 19 and 20 a,b tlade in the Fluidized Bed Reactor Using Phosphogypsum and Natural Gas
Average gyp feed rate, Ib/hr
Gypsum form Particle size, Tyler mesh Feed solids composition
Calcium as Ca, % Total sulfur as S, %
Natural gas rate, scfm Primary air rate, scfm Secondary air rate, scfm Gas vel. red. zone, fps Gas vel. oxid. zone, fps Average bed temperature, oC Average overflow rate, lb/hr Average entrainment rate, Ib/hr
Overflow solids composition Sulfate as S03, % Sulfur as S', % Total sulfur as Y, % Calcium as Ca, % Desulfuritation, %
Entrained solids composition Sulfur as S03, % Sulfur as S', % Total sulfur as Y, % Calcium as Ca, % Desulfuritation, %
Overall desulfurization, % Ca recovery in overflow, % Calcium entrained, % Total Ca accounted for, %
Offgas analysis co2 + so2, %c
02, % co, %
19 Run Number
20a 20b
16.6a
as received briquetted granulated -_ -lo/+48 -lo/+48
1.1
2::
t:: 1150
:*z .
2.6 0.0
61::
97
29.6 0.5
12.3 35.6
42
14.0 0.1 0.0
25.4
4
22.7
22.5 21.7 18.0 17.2
A:::
2:; 5.2 1150 6.5 3.5
1.4 0.8
6:::: 97
12.3 0.4 5.3
53i85
19.5
;? 46:4
74
69:
g
17.0 2.2 0.2
;;
22 92
_-_ -_- __-
aoverflow product from a previous run was fed to the reactor at a rate of 3.2 lbs/hr.
bAnalysis is adjusted to account for CaO and S fed as recycled overflow product to maintain the inert bed.
CAcid gas analysis by the Orsat Method.
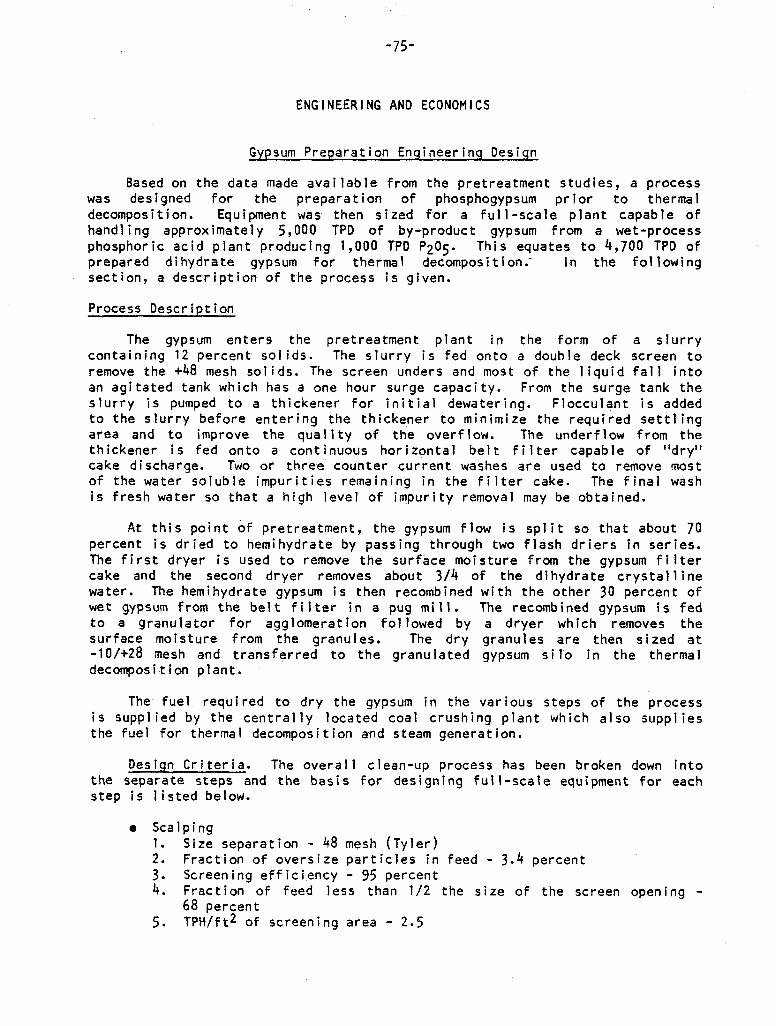
-75-
ENGINEERING AND ECONOMICS
Gypsum Preparation Engineerinq Design
Based on the data made available from the pretreatment studies, a process was designed for the preparation of phosphogypsum prior to thermal decomposition. Equipment was then sized for a full-scale plant capable of handling approximately 5,000 TPD of by-product gypsum from a wet-process phosphoric acid plant producing 1,000 TPD P205. This equates to 4,700 TPD of prepared dihydrate gypsum for thermal decomposition. in the following sect ion, a description of the process is given.
Process Description
The gypsum enters the pretreatment plant in the form of a slurry containing 12 percent solids. The slurry is fed onto a double deck screen to remove the +48 mesh solids. The screen unders and most of the liquid fall into an agitated tank which has a one hour surge capacity. From the surge tank the slurry is pumped to a thickener for initial dewatering. Flocculant is added to the slurry before entering the thickener to minimize the required settling area and to improve the quality of the overflow. The underflow from the thickener is fed onto a continuous horizontal belt filter capable of “dry” cake d i scharge. Two or three counter current washes are used to remove most of the water soluble impurities remaining in the filter cake. The final wash is fresh water so that a high level of impurity removal may be obtained.
At this point of pretreatment, the gypsum flow is spl it so that about 70 percent is dried to hemihydrate by passing through two flash driers in series. The first dryer is used to remove the surface moisture from the gypsum f i 1 ter cake and the second dryer removes about 3/4 of the dihydrate crystalline water. The hemihydrate gypsum is then recombined with the other 30 percent of wet gypsum from the belt filter in a pug mill. The recombined gypsum is fed to a granulator for agglomeration fol lowed by a dryer which removes the surface moisture from the granules. The dry granules are then sized at -TO/+28 mesh and transferred to the granulated gypsum silo in the thermal decomposition plant.
The fuel required to dry the gypsum in the various steps of the process is supplied by the centrally located coal crushing plant which also suppl ies the fuel for thermal decomposition and steam generation.
Desiqn Criteria. The overal 1 clean-up process has been broken down into the separate steps and the basis for designing full-scale equipment for each step is listed below.
0 Scalping 1. Size separation - 48 mesh (Tyler)
:: Fraction of oversize particles in feed - 3.4 percent Screening efficiency - 95 percent
4. Fraction of feed less than l/2 the size of the screen opening - 68 percent
5. TPtVft2 of screening area - 2.5
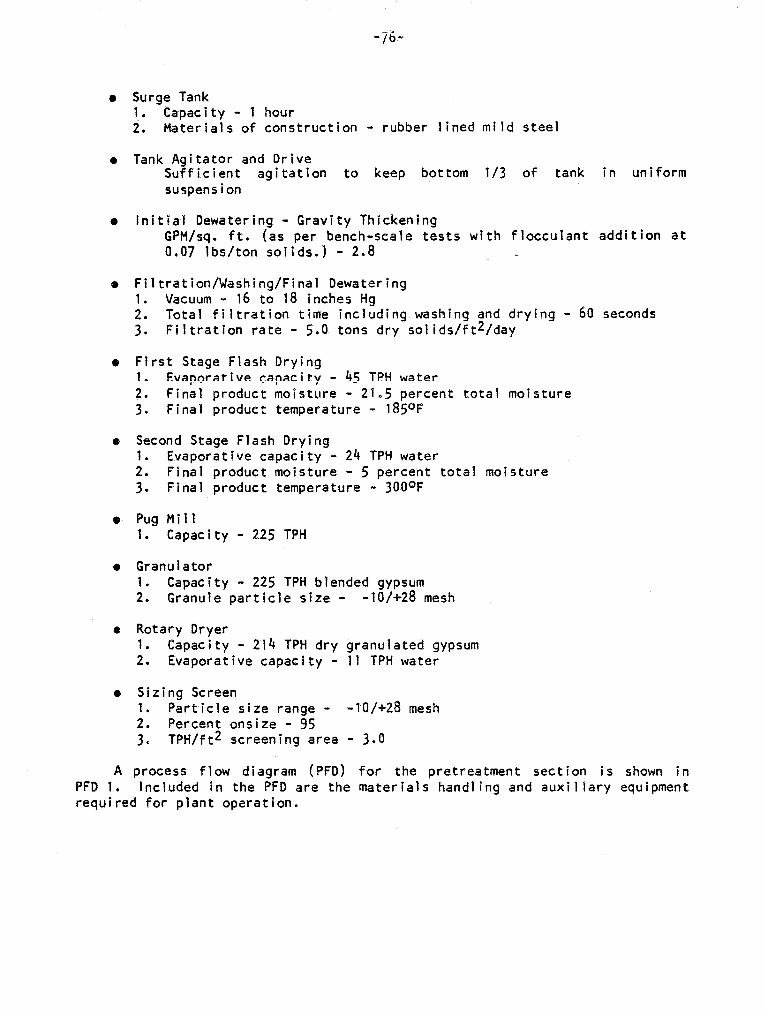
-76-
a Surge Tank 1. Capacity - 1 hour 2. Materials of construction - rubber lined mild steel
l Tank Agitator and Drive Sufficient agitation to keep bottom l/3 of tank in uniform suspension
l Initial Dewatering - Gravity Thickening GPM/sq. ft. (as per bench-scale tests with f locculant addition at 0.07 lbs/ton solids.) - 2.8 _ -
o Filtration/Washing/Final Dewatering 1. Vacuum - 16 to 18 inches Hg
:: Total filtration time including washing and drying - 60 seconds Fi 1 tration rate - 5.0 tons dry solids/ft2/day
e First Stage Flash Drying 1. Evaporative capacity - 45 TPH water
:: Final product moisture - 21.5 percent total moisture Final product temperature - 185OF
e Second Stage Flash Drying 1. Evaporative capacity - 24 TPH water 2. Final product moisture - 5 percent total moisture 3. Final product temperature - 300°F
a PugMill 1. Capacity - 225 TPH
e Granulator 1. Capacity - 225 TPH blended gypsum 2. Granule particle size - -lo/+28 mesh
e Rotary Dryer 1. Capac i ty - 214 TPH dry granulated gypsum 2. Evaporative capacity - 11 TPH water
0 Sizing Screen 1. Particle size - range -lo/+28 mesh 2. Percent onsize - 95 3. TPH/ft2 screening area - 3.0
A process flow diagram (PFD) for the pretreatment section is shown in PFD 1. Included in the PFD are the materials handling and auxillary equipment required for plant operation.
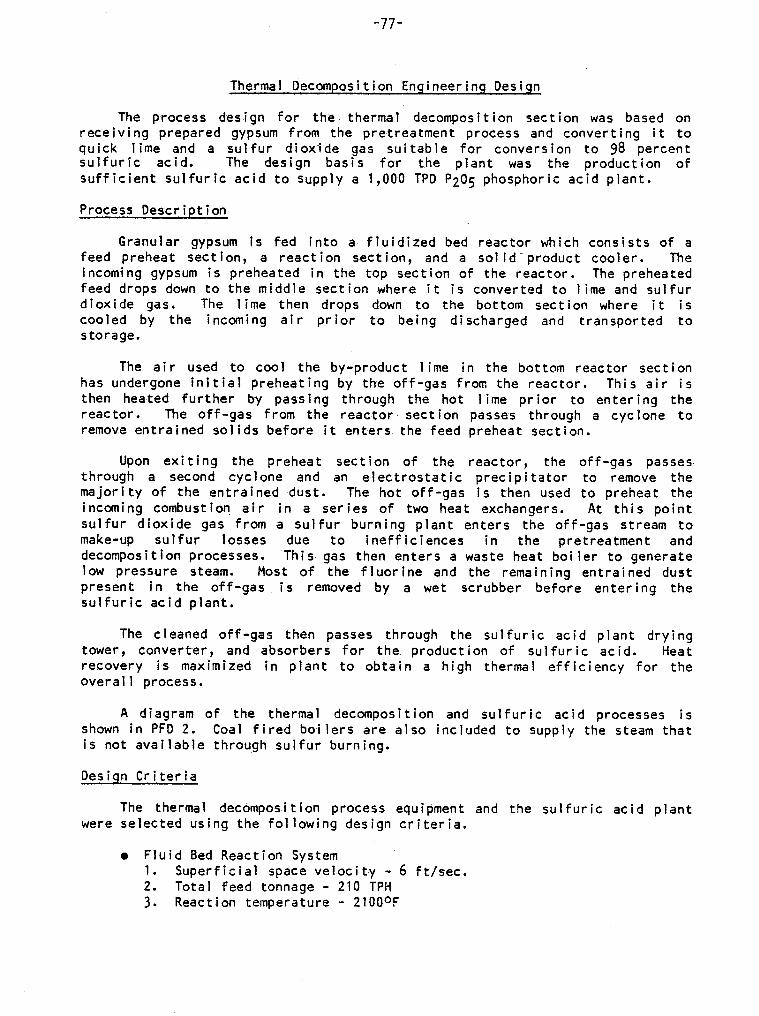
-77-
Thermal Decomposition Enqineerinq Design
The process design for the thermal decomposition section was based on receiving prepared gypsum from the pretreatment process and converting it to quick lime and a sulfur diox‘ide gas suitable for conversion to 98 percent sulfuric acid. The design basis for the plant was the production of sufficient sulfuric acid to supply a 1,000 TPD P205 phosphoric acid plant.
Process Description
Granular gypsum is fed into a fluidized bed reactor which consists of a feed preheat section, a reaction section, and a sol id-product cooler. The incoming gypsum is preheated in the top section of the reactor. The preheated feed drops down to the middle section where it is converted to lime and sulfur dioxide gas. The lime then drops down to the bottom section where it is cooled by the incoming air prior to being discharged and transported to storage.
The air used to cool the by-product lime in the bottom reactor section has undergone initial preheating by the off-gas from the reactor. This air is then heated further by passing through the hot lime prior to entering the reactor . The off-gas from the reactor. section passes through a cyclone to remove entrained solids before it enters the feed preheat section.
Upon exiting the preheat section of the reactor, the off-gas passes. through a second cyclone and an electrostatic precipitator to remove the majority of the entrained dust. The hot off-gas is then used to preheat the incoming combustion. air in a series of two heat exchangers. At this point sulfur dioxide gas from a sulfur burning plant enters the off-gas stream to make-up sulfur 105ses due to inefficiences in the pretreatment and decomposition processes. This gas then enters a waste heat boiler to generate low pressure steam. Most of the fluorine and the remaining entrained dust present in the off-gas. is removed by a wet scrubber before entering the sulfuric acid plant.
The cleaned off-gas then pas-ses through the sulfuric acid plant drying tower, converter, and absorbers for the production of sulfuric acid. Heat recovery is maximized in plant to obtain a high thermal efficiency for the overall process.
A diagram of the thermal decomposition and sulfuric acid processes is shown in PFD 2. Coal fired boilers are also included to supply the steam is not available through sulfur burning.
Design Criteria
The thermal decomposition process equipment and the sulfuric acid p were selected using the following design criteria,
a Fluid Bed Reaction System 1. Superficial space velocity - 6 ft/sec. 2. Total feed tonnage - 210 TPH 3. Reaction temperature - 21000F
t hat
ant

-7a-
l Sulfuric Acid Plant 1. Sulfuric acid production rate - 2,700 TPD 2. Incom9ng gas SO2 concentration - a.0 percent
l High Pressure Steam ‘Boiler 1. Capacity - 13,000 lbs/hr @ 130 PSIG 2. Fuel - high-sulfur coal
l Low Pressure Steam Boiler 1. Capacity - 150,000 lbs/hr @ 30 PSIG 2. Fuel - high-sulfur coal
Equipment Selection
Full scale process equipment was selected using the design criteria listed in the above sections and the process flow diagrams which have been developed for gypsum pretreatment and thermal decomposition. For the major pieces of equipment in the overall process such as the fluidized bed reactors, flash dryers, and belt filters, package units were sized by equipment manufacturers. An equipment list and p9ant layout are included in Appendix C of the report.
Cost Enqineerinq and Economics
In order to evaluate the potential profitabi 1 ity of the ISU process, capital and operating costs for a full-scale plant were developed based on the process as shown in -the PFDs, Included in these eosts is a double absorbtion sulfuric acid plant which is similar to the sulfuric acid p9ants used in metal lurgical processes. Al so, high and low pressure steam boilers are inc9uded so a direct comparison can be made between sulfuric acid production costs by the ISU process and a double absorbtion sulfur-burning process. The operating costs are expressed in terms of dollars per short ton 100 percent sulfuric acid.
Capital Cost Est imat ion
Equipment sizes were determined from the data obtained in the process development testing and the data listed in Tabte XXX. Auxi 1 iary equipment size was determined from the plant layout (Appendix C) and the tonnages being hand1 ed. From this data, and discussions with equipment manufacturers representatives, specific equipment was selected and de1 ivered costs were determined.
On major package items such as the fluidized bed reaction system, flash dryers, and coal preparation, written quotes were obtained based on the data mentioned above. Conventional process equipment costs were taken verbally and were based on the criteria listed previously and those developed in the plant layout. Published factors for installation and additional materials were then used to determine installed equipment costs.
A breakdown of the capital costs for the ISU process is given in Table XXXI. Included in the capital are equipment costs for the sulfuric acid plant and for steam generation.
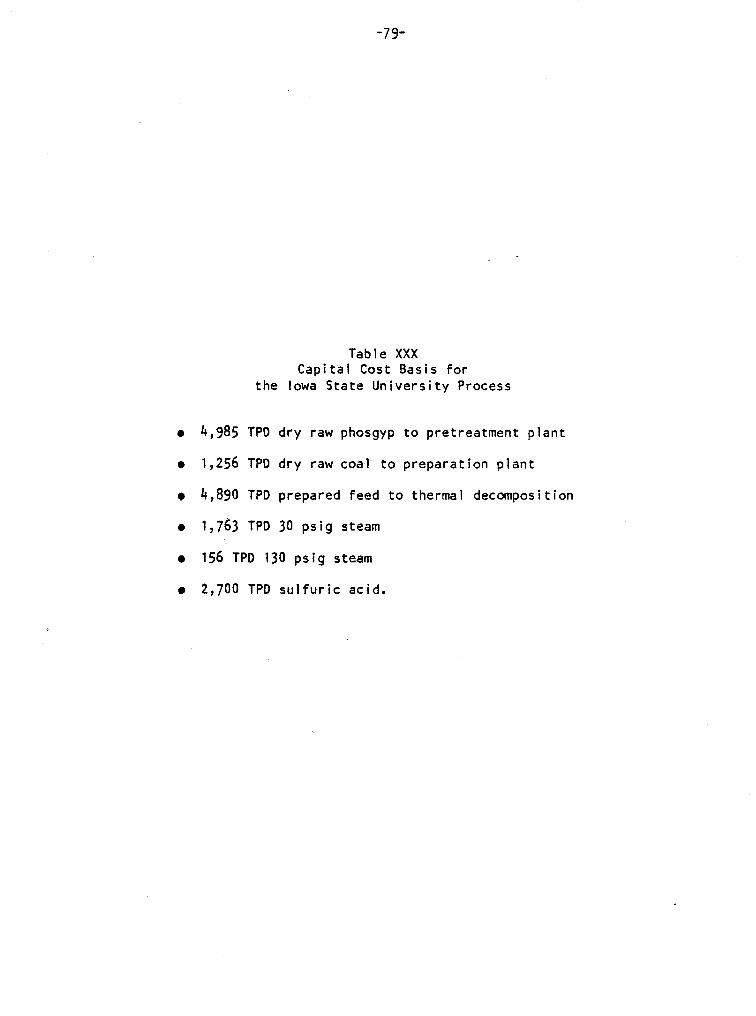
-79-
Table XXX Capital Cost Basis for
the Iowa State University Process
a 4,985 TPD dry raw phosgyp to pretreatment plant
l 1,256 TPD dry raw coal to preparation plant
l 4,890 TPD prepared feed to thermal decomposition
l 1,763 TPD 30 psig steam
l 156 TPD 130 psig steam
l 2,700 TPD sulfuric acid.

-8O-
Table XXX1 Capital Cost Estimate for the ISU Process
Component
Delivered Equipment*
Installation Materials Labor Sub-total
Sales Tax (5% of Installed Material)
Fringes 30% of Labor
Total Direct Cost
Field Distribution (10% Direct)
Engineering (10% of Direct for Peed Preparation & 5% for Thermal Decomposition)
Total Direct 6 Indirect
Contingency 10%
Total Fixed Capital
2,700 TPD Sulfuric Acid Plant Conversion Cost**
Steam Generation
Grand Total Fixed Capital
Cost Per Plant Section Thermal Feed
Preparation Decomposition
$ g,400,000
2,000,000 1,500,000 3,500,OOO
100,000
450,000
$13,450,000
1,345,OOO
T,345,000
16,140,OOo
1,614,OOo
$17,754,000
$30,900,000
10,000,000
+$%I 500,000
2,010,000 2,460,OOO
$50,?10,000 $63,560,000
5,011,000 6,356,OOO
2,505,500 3,85D,500
57,626,500
5,762,OOO
$639388,500
Total Cost
$40,300,000
20,200,000
600,000
739766JOO
7,376,OOO
$81,142,500
g,ooo,ooo
4,500,000
$g4,642,500
*Includes 5% sales tax, plus shipment to plant site. All equipment cost as per equipment list and spec.
**Difference between $45,000,000 and $36,000,000 for S-burning conventional plant.
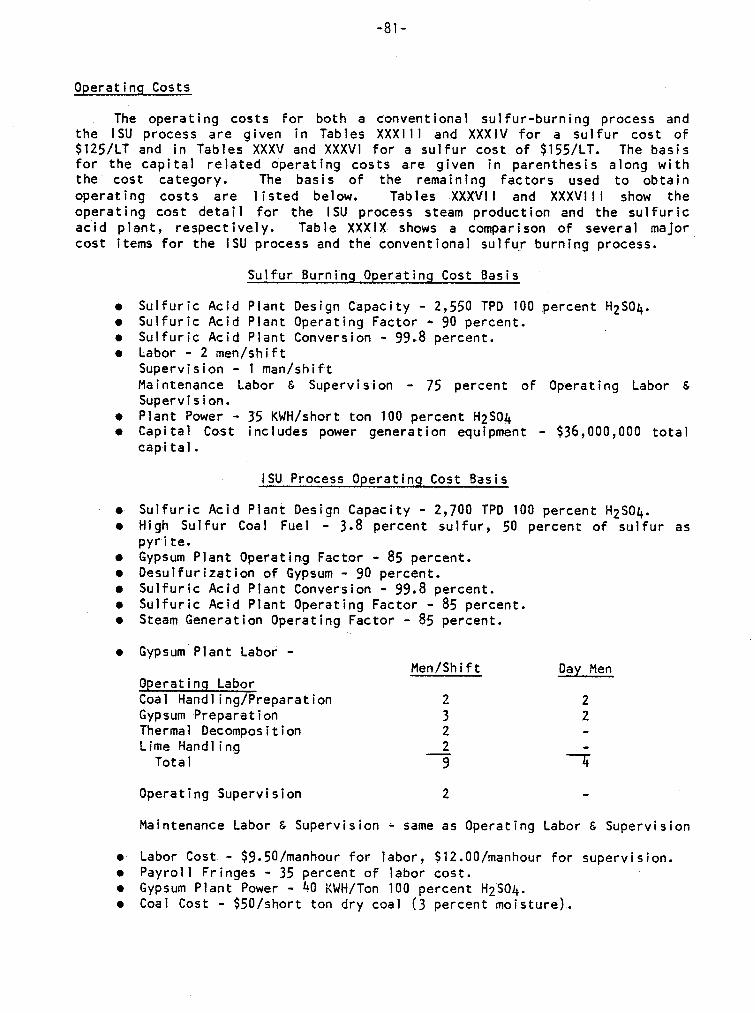
-81-
Operatinq Costs
The operating costs for both a conventional sulfur-burning process and the ISU process are given in Tables XXXIII and XXXIV for a sulfur cost of $125/LT and in Tables XXXV and XXXVI for a sulfur cost of $155/LT. The basis for the capital related operating costs are given in parenthesis along with the cost category. The basis of the remaining factors used to obtain operating costs are listed below. Tables XXXVII and XXXVIII show the operating cost detail for the ISU process steam production and the sulfuric acid plant, respectively. Table XXXIX shows a comparison of several major cost items for the ISU process and the conventional sulfu_r burning process.
Sulfur Burninq Operating Cost Basis
0
l
l
0
0
0
Sulfuric Acid Plant Design Capacity - 2,550 TPD 100 percent H2SO4. Sulfuric Acid Plant Operating Factor - 90 percent. Sulfuric Acid Plant Conversion - 99.8 percent. Labor - 2 men/shift Supervision - 1 man/shift Maintenance Labor & Supervision - 75 percent of Operating Labor E Supervision. Plant Power - 35 KWH/short ton 100 percent H2SO4 Capital Cost includes power generation equipment - $36,000,000 total capital.
ISU Process Operatinq Cost Basis
Sulfuric Acid Plant Design Capacity - 2,700 TPD 100 percent H2SO4. High Sulfur Coal Fuel - 3.8 percent sulfur, 50 percent of sulfur as pyrite. Gypsum Plant Operating Factor - 85 percent. Desulfurization of Gypsum - 90 percent. Sulfuric Acid Plant Conversion - 99.8 percent. Sulfuric Acid Plant Operating Factor - 85 percent. Steam Generation Operating Factor - 85 percent.
Gypsum Plant Labor -
Operating Labor Coal Handling/Preparation Gypsum Preparation Thermal Decomposition Lime Handling
Total
Men/Shift Day Men
2 3 2
a 2 2
-z
Operating Supervision 2
Maintenance Labor & Supervision i same as Operating Labor & Supervision
l Labor Cost - $9.50/manhour for labor, $12.00/manhour for supervision. l Payroll Fringes - 35 percent of labor cost. 0 Gypsum Plant Power - 40 KWH/Ton 100 percent H2SO4. 0 Coal Cost - $50/short ton dry coal (3 percent moisture).

-82-
e Power Cost - $O.O52/KWH e Gypsum Plant Fuel - 8.06 MMBTU/short ton 100 percent H2SO4. e No credit for elimination of gypsum disposal ponds to allow for the
uncertainity of lime disposal.
Finally, the production costs for steam generation and the sulfuric acid conversion used in the ISU process are broken down in Tables XXXIV and XXXV.
Steam Credit
Based on data for a typical Central Florida complex producing merchant acid, DAP, TSP, the steam production will vary with product distribution; the following represents an average case (see Table XXXII).
2550 STPD 100% H2SO4, Double contact plant
Total steam produced - 255,000$ at 474 psig
1) Turbine generator - 78,000 $ at 230 psig, 625oF which represents 33
percent of the total energy available from sulfur burning. This
converts to 78 KWH KWH ST H2SO4 with 35 ST H2SO4
required to run the H2SO4
plant leaving a net production of 43 KWH
ST H2SO4' _
21 High pressure steam for miscellaneous heating - 19,600 $ at 230 psig
saturated which represents 8 percent of the total energy. There is
no credit taken for this
3) Process steam for export
represents 59 percent of
valued as BTU's produced
sulfur coal.
Operating cost additions for
as it is required to run the H2SO4 plant.
LB - 157,000 HR at 55 psig saturated which
the total available energy. This steam is
at 80 percent efficiency by burning high
sulfur make-up with gypsum:
108 TPD X x 136 CaS04= 459 TPD CaS04 additional 32s -
459 TPD CaS04 3716 TPD CaSU<
x 100% _ = 12% increase in gypsum consumption
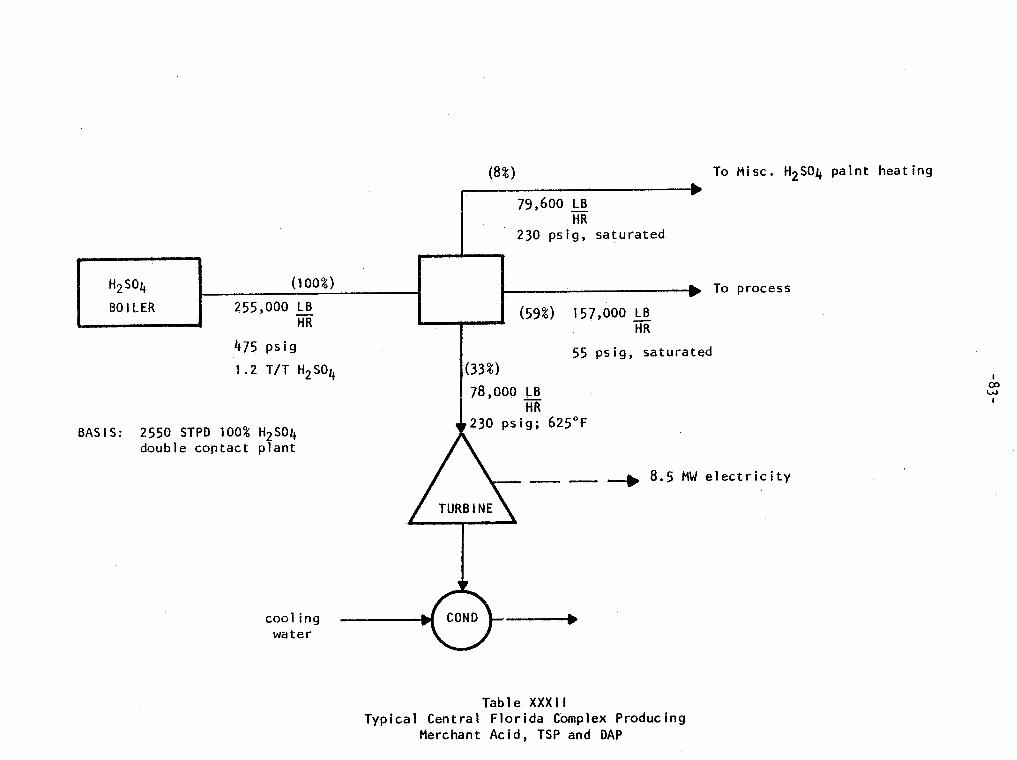
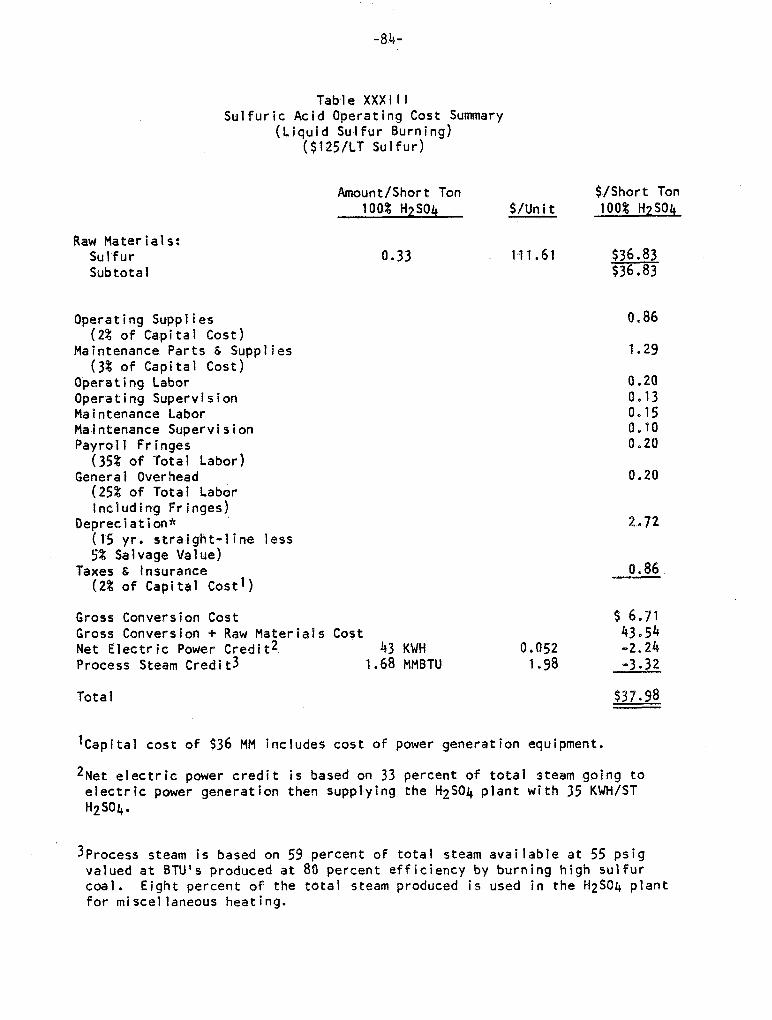
-84-
Table XXXII1 Sulfuric Acid Operating Cost Summary
(Liquid Sulfur Burning) ($125/LT Sulfur) _
ials: Raw Mater Sulfur Subtota 1
Operating . _ Supplies (2% of Capital Cost9
Maintenance Parts G Supplies (3% of Capital Cost)
Operating Labor Operating Supervision Maintenance Labor Maintenance Supervision Payroll Fringes
(35% of Total Labor) General Overhead
(25% of Total Labor Including Fringes)
Depreciation* (15 yr. straight-line less 5% Salvage Value)
Taxes & Insurance (2% of Capital Cost19
Amount/Short Ton $/Short Ton
100% H9S04 $/Unit 100% H9S04
0.33 l-11.61 ::66.88; .
0.86
1.29
0.20 0.13 0.15 0.10 0.20
0.20
2.72
0.86
Gross Conversion Cost $ 6.7! Gross Conversion + Raw Materials Cost Net Electric Power Credit2 43 KWH
Process Steam Credit3 1.68 MMBTU 0.052
1.98
4:$ -3: 32
Total $37.98
‘Capital cost of $36 MM includes cost of power generation equipment.
2Net electric power credit is based on 33 percent of total steam going to electric power generation then supplying the H2SO4 plant with 35 KWH/ST H2SO4.
3Process steam is based on 59 percent of total steam available at 55 psig valued at BTU’s produced at 80 percent efficiency by burning high sulfur coal. Eight percent of the total steam produced is used in the H2SO4 plant for miscellaneous heating.

-85-
Table XXXIV Sulfuric Acid Operating Cost Summary
(ISU Process) ($125/LT Sulfur)
Raw Materials: Phosphogypsum Sulfur High Sulfur Coal Subtotal
1.74 o- 0.04 lkl 4?6.
0.32
Electric Power Operating Supplies
(2% of Capital Cost) Maintenance Parts E Supplies
(5% of Capital Cost) Operating Labor Operating Supervision Maintenance Labor Maintenance Supervision Payroll Fringes
(35% of Total Labor) General Overhead
(25% of Total Labor including Fringes)
Depreciation (15 yr. straight line less 5% Salvage Value)
Taxes & insurance (2% of Capital Cost)
Sulfuric Acid Plant Conversion Cost2
40 KWH 0.052
Gross Conversion Cost Gross Conversion + Raw Material Cost Process Steam Credit3 Process Steam Production Cost4
0.31 MM BTU
Amount/Short Ton 100% HpS04
$/Short Ton $/Unit 100% H7S04
50 16.00 $20146
4.84
0.99 0.25 0.99 0.25 0:87
0.84
6.13
1.94
1.98
Total $58.11
'Capital cost of $81,142,500 is for feed preparation, thermal decomposition and coal handling areas.
2This includes all of the costs to convert the clean Table XXXVIII.
SO2 into H2SO4. See
3This is the steam produced in the waste heat boiler valued as BTU's produced
at 80 percent efficiency by burning high sulfur coa 1.
4This includes all of the costs to generate the rema ining steam required for
process not produced by the waste heat boiler. See Table XXXVII.

Raw Materials: Sulfur Subtotal
-a6-
Table XXXV Sulfuric Acid Operating Cost Summary
(Liquid Sulfur Burning) ($155/LT Sulfur)
Amount/Short Ton $/Short Ton 100% H2S04 $/Unit 180% H7S04
Operating Supplies (2% of Capital Cost)
Maintenance Parts 6 Supplies (3% of Capital’ Cost)
Opera t i ng Labor Operating Supervision Maintenance Labor Maintenance Supervision Payroll Fringes
(35% of Total Labor) Genera 1 Overhead
(25% of Total Labor Including Fringes)
Depreciation* (IS yro straight-line less 5% Salvage Value)
Taxes & insurance (2% of Capital Cost’)
Gross Conversion Cost $ 6.71
0.33 138.39 $45.67 $45.67
0.86
1.29
D.2D 0.13 0.15 8.10 0.20
0.20
2.72
0.86 --
Gross Conversion + Raw Materials Cost 52.38 Net Electric Power Credit2 43 KWH 0.052 -2.24
Process Steam Credi t3 1.68 MMBTU 1.98 -3.32
Total $46.82
‘Capital cost of $36 MM includes cost of power generation equipment.
2Net electric power credit is based on 33 percent of total steam going to electric power generation then supplying the H2SO4 plant with 35 KWH/ST H2SO4.
3Process steam is based on 59 percent of total steam available at 55 psig valued at BTU’s produced at 80 percent efficiency by burning high sulfur coal. Eight percent of the total steam produced is used in the H2S04 plant for miscellaneous heating.

-87-
Raw Materials: Phosphogypsum Sulfur High Sulfur Coal Subtotal
Table XXXVI Sulfuric Acid Operating Cost Summary
(ISU Process) ($155/LT Sulfur)
Amount/Short Ton 100% H7S04
Electric Power Operating Supplies
(2% of Capital Cost) Maintenance Parts 6 Supplies
(5% of Capital Cost) Operating Labor Operating Supervision Maintenance Labor Maintenance Supervision Payroll Fringes
(35% of Total Labor) General Overhead
(25% of Total Labor including Fringes)
Depreciation (15 yr. straight line less 5% Salvage Value)
Taxes & insurance (2% of Capital Cost)
Sulfuric Acid Plant Conversion Cost2
1.74 -o- 0.04 lYK39 0.32 50
40 KWH
Gross Conversion Cost Gross Conversion + Raw Material Cost Process Steam Credit3 Process Steam Production Cost4
0.31 MM BTU
Total
$/Short Ton S/Unit 100% H7SO4
-o- 5.54
lk.bO $21.54
0.052 $ 2.08 1.94
1.98
4.84
0.99 0.25 0.99 0.25 0.87
0.84
6.13
1.94
11.76
$:2*:: -0:61 5.38
$59.39
ICapital cost of $81,142,50O is for feed preparation, thermal decomposition and coal handling areas.
2This includes all of the costs to convert the clean SO2 into H2SO4. See Table XXXVIII.
3This is the steam produced in the waste heat boiler valued as BTU's produced at 80 percent efficiency by burning high sulfur coal.
4This includes all of the costs to generate the remaining steam required for process not produced by the waste heat boiler. See Table XXXVII.

-88-
Table XXXVII Process Steam Production Cost
(For ISU Process)
High Sulfur Coal
Electric Power
Amount/Short Ton 100% H7S04
0.08 ST
2.2 KWH
$/Un i t
50
D.052
$/Short Ton 100% H7SO4
$4.00
0.11
Operating Supplies (2% of Capital Cost*)
Maintenance Parts & Supplies (8% of Capital Cost*)
Operating Labor Operating Supervision Maintenance Labor Maintenance Supervision Payroll Fringes
(35% of Total Labor) General Overhead
(25% of Total Labor Including Fringes)
Depreciation* (15 yr. straight line less 5% Salvage Value)
Taxes & Insurance (2% of Capital Cost*)
Total $5.38
0.11
0.27
0.10 0.03 0.10 0.03 0.09
0.09
0.34
0.11
*Capital cost of $4.5 MM for boilers and associated equipment.

Table XXXVIII Sulfuric Acid Plant Conversion Cost
(For ISU Process)
Electric Power Operating Supplies
(2% of Capital Cost*) Maintenance Parts ft Supplies
(3% of Capital Cost*) Operating Labor Operating Supervision Maintenance Labor Maintenance Supervision Payroll fringes (35% of Total Labor)
General Overhead (25% of Total Labor Including Fringes)
Depreciation*
ia:,Y;, ::;$X::, Taxes & Insurance
(2% of Capital Costk:)
Amount/Short Ton 100% H7S04
69 KWH
$/Short Ton $/Un i t 100% H7SO4
0.052 $ 3.59 1.07
1.65
0.20 0.13 0.15 0.10 0.20
0.20
3.40
1.07
Total $11.76
*Capital cost of $45 MM for the H2SO4 plant.

-9o-
Table XXXIX H2SO4 Acid Manufacturing Comparison
$/Short Ton 100% H2SO4
Sulfur High Sulfur Coal
Subtotal Raw Materials Gross Conversion Cost
Gross Conversion Et R.M. Steam
Total
SlZS/LT Sulfur ISU Su,f"Sr155'LT ISU Burninq Process Burning Process
$36.83 $ 4.46 $45.67 __ 16.00 __ x L
3z 20.46 45.67 21.54
e 32.88 6.71 32.88
4:*;: Y: y;," 54.42
. . . 4.77
$37.98 $58,91 $45.82 $59.19

-g1-
Table XL Operating Cost for Gypsum Make-up
1)
21
3)
1)
2)
3)
Electric power - assume ISU process electric power increases by 12 percent as throughput must increase by 12 percent.
$2.08 x 0.12 = $0.25/ST H2s04
Fuel - assume ISU process fuel increases by 12 percent
$16.00 x 0.12 = $1.92/ST H2SO4
Extra capital cost - at present capital of 4,985 TPO gypsum fixed capital cost is $81,142,500; apply 0.6 factor.
0.6 = 81,142,500
X 1 .
= 81,142.S x = $85,546,088
Extra depreciatioi (15 yrs S/L) = $0.40/tori H2SO4
Net Gain
Extra Charqes:
l Electric power l Fuel l Depreciation
$/ton H2SO4: 0.25 $/ton H2SO4: 1.92 S/ton H2SO4: 0.40
$2.57
Sulfur Charqes: (ST25/LT)
Net Gain: $4.46 - $2.57 = $1.89/tori ~2~04
$4.46
Sulfur Cost S/tT
125 135 145 155 175 200 225
Sulfuric Acid Cost ($/ST H2SO4) Sulfur ISU Process ISU Process Burning (S Make-up) (w/Gypsum Make-up)
37.98 58.11 56.22 40.93 43.87
:z;: 56.22 56.22
46.82 59:19 56.22 52.72 59.90 56.22 60.08 60.79 56.22 67.44 61.69 56.22

-92-
Table XL1 Breakeven Sulfur Price without Lime Credit
b) With Gypsum Make-up
c, + 1.15 = 56.22
Table XLII Breakeven Sulfur Price with
Following calculations show the lime credit breakeven situation of the ISU process of two and $155/LT.
At $125/LT Sulfur Cost
Lime Credit
($/ton lime) required for a levels of sulfur prices of $125
$58.11 : $37.98 = $23.38 0.86 Ton Lime* Ton Lime
Ton H2SO4
*refers to pilot plant produced lime at 66.3% available CaO.
At $155/LT Sulfur Cost
$59.1; 86$46.82 = $14.38 . Ton Lime

-93-
CONCLUSIONS
The main purpose of the project was to investigate the viabi 1 ity of the ISU process for thermally decomposing phosphogypsum to sulfur dioxide and 1 ime, using high sulfur coal as fuel. A premise of the study was that phosphogypsum would be prepared for thermal decomposition in a two-stage fluid bed reactor by cleaning, agglomeration, and partial dehydration. Cone 1 us ions resulting from the study of the ISU process are as follows:
l The ISU process, using high sulfur coal qs fuel, is a technically feasible method of thermally decomposing prepared phosphogypsum. Tests conducted in the ISU bench scale fluid bed reactor demonstrated 90 percent desulfurization of the prepared phosphogypsum. The decomposition products were sulfur dioxide and low-grade lime.
0 Conversion of the sulfur dioxide product to sulfuric acid in a metallurgical sulfuric acid plant is technically feasible; however, acid production costs are not competitive with conventional sulfur burning. For example at sulfur prices of $125 and $155/LT, the cost of conventional sulfuric acid is estimated at $37.98 and $46.82/ST of acid, respectively; correspondingly, the ISU process cost is expected to be $58.11 and $59.13/ST of acid, respectively (see Table XL).
l Commercial feasibility for the ISU process and subsequent production of sulfuric acid would require a considerable increase in the cost of elemental sulfur and/or a credit for the by-product 1 ime. Breakeven analysis, assuming $50 per ton of de1 ivered coal, indicates a sulfur cost of $187 per long ton or a by-product 1 ime credit of $23.38 per short ton (see Tables XLI and XLII).
o Additional investigations of potential reaction mechanisms, alternate thermal process equipment, and fuel substitutes are warranted as are studies of by-product lime utilization.

-g4-
RECOMMENDATIONS
the Therma 1 decomposition of phosphogypsum with conversion of the sulfur dioxide product to sulfur capital investment and results in non-competitive investigations of the ISU process is not recommended
1 SU process and d requires large costs. Further
ic aci acid at this time. Future
studies should be directed at improving the economic feasibility of thermally decomposing phosphogypsum. A program comprising five elements is proposed.
I. Evaluation of By-Product Cime _
Lime is one of the products normally resulting from thermal decomposition of gypsum. It is recommended that applications for the quantity and quality of lime obtained from phosphogypsum be investigated. Any credit for by- product lime will improve the economics of thermal decomposition of phosphogypsum.
II. Evaluation of Fuel Substitutes
The cost of fuel is and wi 11 cant inue to be of great importance. Alternate sources such as high sulfur petroleum coke should be evaluated.
III. investigate Alternate Reaction Mechanisms
It is recommended that the thermodynamics of al ternate react ion mechanisms be evaluated and that reaction mechanisms having potential be tested in a batch scale. The purpose of this work is to identify react ions that would reduce temperatures and/or fuel requirements, or yield a product less expensive to convert to sulfuric acid.
IV. Invest igate Al ternate Thermal Process Equipment
Preliminary investigations indicated that the two-zone fluid bed reactor specified in the ISU process was not essential for thermal decomposition of phosphogypsum. A study of alternate thermal reactors is recommended. There is potential here to reduce the capital cost of the thermal reactor as well as el imi nate capital and operating costs required to agglomerate the phosphogypsum. A preliminary analysis of this potential is given in the Appendix using the Moving Bed Calciner as an example.
V. Coordination of Studies
Studies I through IV should be directed and their results coordinated so that the technical and economic feasibility of alternate thermal decomposition processes can be evaluated prior to recommending curtailment or continuation of the program, especially to the high-cost, pilot-plant stage.

-95-
APPENDICES

-96-
APPENDIX A

-97-
APPEND IX A TEST PROCEDURES
Tumblinq Test
The tumbling test was carried out by placing a sample of the agglomerated material (-10/+18M) in a steel drum measuring 8.5 inches in diameter and
equipped with three lifting bars. The drum was then revolved at a speed of 42 rpm for 15 minutes. At the end of that time the sample was removed and the particle size distribution determined. The sample was then returned to the drum and tumbled for an additional 15 minutes. The particle size distribution of the sample was again determined. The tendency for the particle to degrade in the fluidited bed was considered to be proportional to the amount of -35 mesh material produced in the tumbling test.
Combustion Tube Furnace Test
The combustion tube furnace was constructed of two parallel zirconium silicate tubes of about l-inch diameter. The tubes are centrally located in an electric furnace and extend approximately 2 inches beyond the furnace shell. The hot zone of the furnace is the centrally located section, about 4 inches long, where the heating elements are located. The atmosphere in the tubes is controlled by passing purified gas through the furnace. A schematic diagram of the combustion tube furnace is shown in Figure 6 in the body of the report.
The sample to be used for testing is prepared by briquetting. The briquets are then crushed and sized to obtain the desired particle size. The amount of sample used in each run is determined by the reaction time to be used and the conditions being tested. The sample amounts used with an alternating reducing/oxidizing atmosphere were as follows.
If a lo-minute reaction time is used, 0.25 grams are placed in the combustion boat. When a 45 minute or longer reaction time is used, a 1.0 gram sample is placed in the boat. Al 1 other tests are run with 0.50 gram samples. Tests in which coal is used as the reductant are run with 5.0 gram samples unless otherwise noted. A minimum of 3.0 grams of reacted solids are required for chemical analysis so that the extent of desulfurization can be calculated. Several runs under a set of conditions need to be completed to collect enough reacted sotids for analysis when an alternating atmosphere is being tested. The procedure for a combustion tube furnace test follows.
The furnace is preheated to the temperature being studied. The on/off
cycle and the flow rates of the gases are set. The concentration of the gas is determined by the ratio of the reactant gas (oxygen or carbon monoxide) to nitrogen which is continuously passed through the tube. When ei ther co- briquetted or mixed gypsum and coal is being tested, the sample is reacted under a steady stream of nitrogen.
After the conditions have been set the sample is placed in a combustion boat and inserted into the tube. In tests using an alternating atmosphere,

-98-
the gypsum is allowed to preheat under nitrogen before the ‘alternating atmosphere is begun and the desulfurization time started. When coal is contained in the sample, desulfurization time isstarted upon insertion of the sample into the furnace. After the react ion time has elapsed the sample is moved to the cool end of the furnace and al lowed to cool under an atmosphere of nitrogen so that sulfides formed in the reaction are not oxidized. After cooling the sample is removed and saved for chemical analysis.
Pluidized Bed Reactor
Before a series of tests can be conducted- on- the ISU bench-scale fluidized bed reactor, the feeds for the runs need to be prepared. Gypsum preparation is the most time consuming of the preparatory procedures.
The phosphogypsum, when received at ISU, has already been washed and the surface moisture removed. Gypsum is agglomerated on a roll briquetter which has a capac i ty of 15 pounds per hour. After briquetting, the gypsum is crushed by passing the briquettes through a roll crusher. Crushing is done in two or three steps, depending on the desired particle size, to reduce the amount of fines produced. The crushed gypsum is then sized by screening. Oversize material is crushed and sized again while the undersize material, which accounts for 30 percent to 50 percent of the briquetted gypsum, is recycled to the roll briquetter. The result of this is that, at a reactor feed rate of 30 pounds/hour, it can take up to four hours of gypsum preparation to produce one hour of feed.
Coal used for fluidized bed reactor testing is first dried at 10S°C in a 1 abora tory oven. Only a few pounds may be dried at a time by this method so several days are requi red. After drying, the coal is crushed and ground and the oversize particles scalped out. Grinding and screening require about half a day to produce enough for a series of tests.
The reactor is initially heated to about 8000~ by an electric furnace. About 12 hours are required to heat to this temperature. Once the reactor reaches 800oC the primary air and secondary air are started and the air-= opera ted ejector actuated to heat up the settl ing chamber and f i 1 ter to prevent condensation upon start-up.
When the reactor temperature has stabi 1 ized, overf!ow product from a previous run is fed to the reactor through the gypsum feeding system. Once overflow appears at the sight-glass, the gypsum feed bin is emptied and filled with the sized gypsum feed.
Providing the reactor temperature is above 8000~ (to insure combustion), natural gas is started to bring the reactor to operating temperature. The temperature climbs rapidly at this point, reaching 1,OOOoC in about half an hour.
Gypsum feed is started after the reactor reaches 1,OOOoC. The gypsum is fed at comparatively low rates at this stage so the reactor temperature continues to increase at a steady pace.
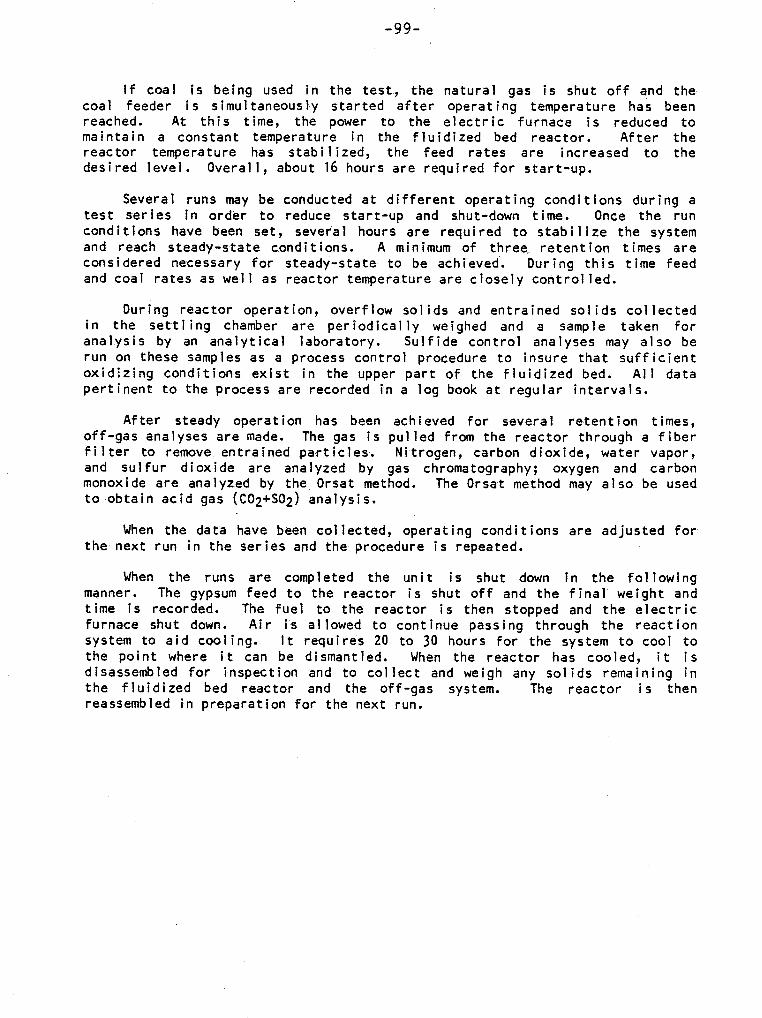
-99-
If coal is being used in the test, the natural gas is shut off and the coal feeder is simultaneously started after operating temperature has been reached. At this time, the power to the electric furnace is reduced to maintain a constant temperature in the fluidized bed reactor. After the reactor temperature has stabilized, the feed rates are increased to the desired level. Overall, about 16 hours are required for start-up.
Several runs may be conducted at different operating conditions during a test series in order to reduce start-up and shut-down time. Once the run conditions have been set, several hours are required to stabi 1 ite the system and reach steady-state conditions. A minimum of three_ retention times are considered necessary for steady-state to be achieved-. During this time feed and coal rates as well as reactor temperature are closely controlled.
During reactor operation, overflow solids and entrained solids collected in the settling chamber are periodically weighed and a sample taken for analysis by an analytical laboratory. Sulfide control analyses may also be run on these samples as a process control procedure to insure that sufficient oxidizing conditions exist in the upper part of the fluidized bed. Al 1 data pertinent to the process are recorded in a log book at regular intervals.
After steady operation has been achieved for several retention times, off-gas analyses are made. The gas is pulled from the reactor through a fiber filter to remove entrained particles. Nitrogen, carbon dioxide, water vapor, and sulfur dioxide are analyzed by gas chromatography; oxygen and carbon monoxide are analyzed by the Orsat method. The Orsat method may also be used to obtain acid gas (CO2+SO2) analysis.
When the data have been co1 lected, operating conditions are adjusted for the next run in the series and the procedure is repeated.
When the runs are completed the unit is shut down in the following manner. The gypsum feed to the reactor is shut off and the final weight and time is recorded. The fuel to the reactor is then stopped and the electric furnace shut down. Air is allowed to continue passing through the reaction system to aid cooling. It requires 20 to 30 hours for the system to cool to the point where it can be dismantled. When the reactor has cooled, it is disassembled for inspection and to collect and weigh any sol ids remaining in the fluidized bed reactor and the off-gas system. The reactor is then reassembled in preparation for the next run.

-lOO-
APPENDIX 8

-lcll-
APPENDIX I3 DESCRIPTION OF THE ISU BENCH SCALE REACTION SYSTEM
The bench scale fluidized bed reac-tion system has undergone several modif ications to improve its performance and/or allow various methods of feeding gypsum or coal to the reactor. The main body of the reactor is a silicone carbide ceramic tube measuring 6 inches in diameter by 60 inches in length. The tube is enclosed in an electric furnace which is used for preheating the system during start-up and to reduce heat losses through the reactor walls during operation.
Gypsum is metered to a transporting air stream by a pulsed air system. The rate at which gypsum is fed is controlled by adjusting the on/off interval of the pulsed air. The sealed gypsum feed bin is located on a scale so that feed rates may be measured by weight loss. This bin can hold about 85 pounds of briquetted gypsum when full and therefore may require being ref i 1 led several times during a test series.
Air and natural gas streams to the reactor are measured through precalibrated rotometers.
The off-gas exits the reactor through a pipe located in the side of the reac tar top. The off -gas passes through a baffled settl i ng chamber to remove the majority of entrained solids and then to an ejector which vents to the atmosphere. The ejector is operated so as to maintain a slight negative pressure in the reactor.
The fluidized bed reactor had a configuration as shown in Figure A-l during the preliminary runs 2a through 6. The gypsum feed was metered into the secondary air stream for transport to the reactor. The feed entered through the bottom of the reactor and discharged into approximately the middle of the bed in an upward direction. The bed depth in the configuration shown in Figure A-l was about 22 inches. Primary air and natural gas were mixed in a manifold and introduced through’four evenly spaced ports in the reactor bottom. The reactor top was made of castable refractory material and was designed with an expanded freeboard 10 inches in diameter. The expanded freeboard resulted in a reduced gas velocity which. reduced particle entrainment in the off-gas.
After run 6, the reactor was modif ied as shown in Figure A-2. Modifications to the reactor were made in order to improve reactor operation and to allow feeding coal and sampling the reactor off-gas. To accommodate these modifications a new top was designed for the reactor. Severa 1 prob 1 ems were encountered with the original all-refractory top due to cracks developing during a run. In order to circumvent leakage through these cracks the new top was constructed of refractory 1 ined steel. Because of the added weight of the top and the thickness of the 1 ining, it was necessary to reduce the inside diameter to 6 inches in order to provide the proper support structure and maintain a good seal with the reactor body. Included in the design of the new top was a port to allow feeding gypsum into the fluidited bed in a downward direction so that the accumulation of solids on the reactor walls and top
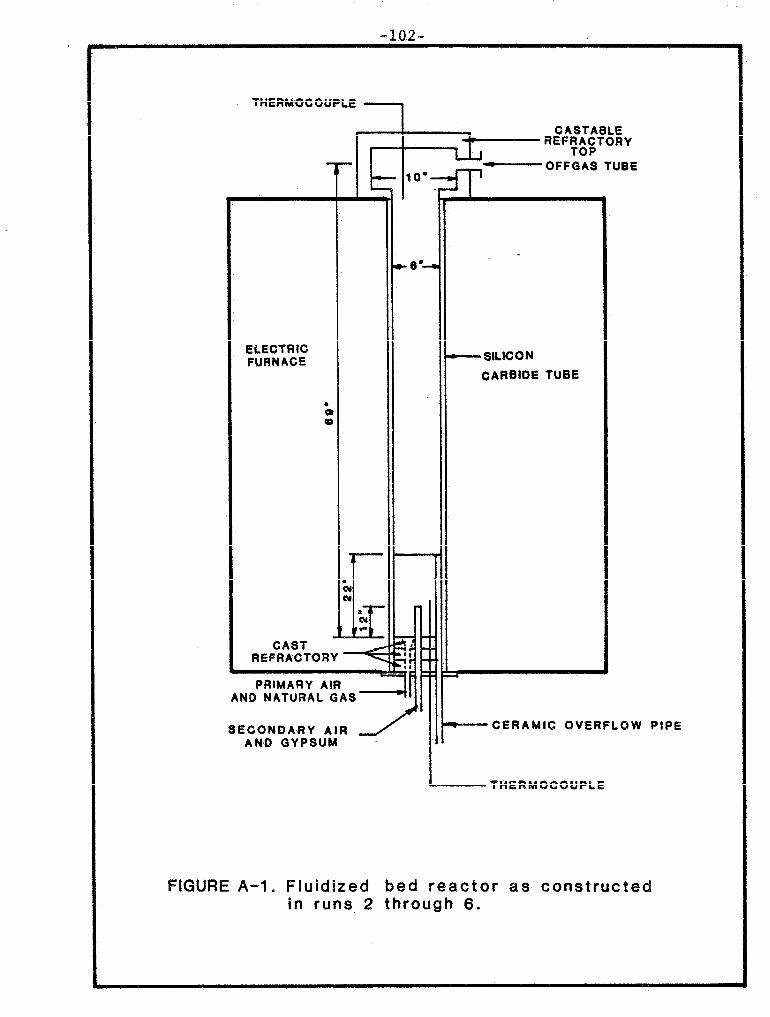
THERMOCOUPLE 1
ELECTRIC FURNACE
GASTAStE
I REFMCpTORY
- OFFGAS TUBE
PRIMARY AIR AND NATURAL GAS
SECONDARY AIR AN0 GYPSUM
CARBIDE TUBE
-CERAMIC OMERFLQW PIPE
-THERMDCOUPL.E
FIGURE A-l. Fluidized bed reactor as constructed in runs, 2 through 6.
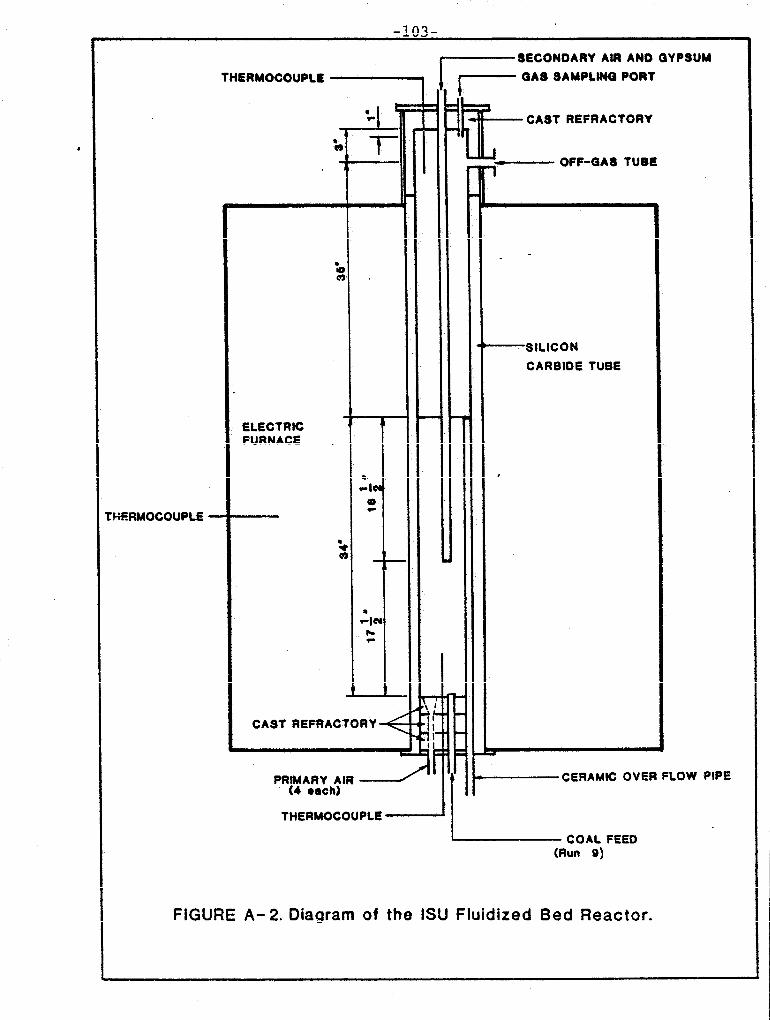
‘F;FRMOCOUPLE -
THERMOCOUPLE
ELECTRIC FURNACE
CAST REFRACTORY +
8ECONDARY AIR AN0 GYPSUM
I GA8 SAIIPLINQ PORT
‘?E-- CAST REFRACTORY
- OFF-GAS TUBE
c -SILICON
CARBIDE TUBE
L -
,
d
P CERAMIC OVER FLOW PIPE
THERMOCOUPLE -
L-- COAL FEED (Run. 9)
FIGURE A-2. Diagram of the ISU Fluidized Bed Reactor.

-104-
would be reduced. Ports were also provided for sampling and analyzing the off-gas. A longer sol ids overflow tube was inserted in the reactor bottom so that bed depth was increased from 22 inches to 34 inches.
Primary air enters the fluidized bed reactor through four ports, which are spaced 90 degrees apart in the reactor bottom. For Runs 9 and 10, a portion of the primary air (the transport air) was used to transport the coal, which entered the reactor through a centrally located port in the bottom. In later runs, this was changed to improve the fuel distribution in the reactor. In these later runs the coal and all of the primary air were introduced through the four primary air ports. Al 1 air flows to the_ reactor are measured by calibrated rotometers.
Ground coal is fed into the transport air stream by a sealed vibra-screw feeder in which the hopper and screw mechanism are under a sl ight pressure of nitrogen. The coal falls through a sight-glass before entering the transport air stream so visual confirmation of coal flow can be made. The feed rate is adjusted by controlling the feeder screw rpm. The coal rate is metered by diverting the transport air stream through a filter and measuring the time required to collect the required amount of coal. Before entering the reactor, the transport air (with the entrained coal) and the primary air are joined.
The secondary air and gypsum feed enter the reactor through a l-inch diameter ceramic tube centered in the reactor top. The tube extends into the middle of the fluidized bed. Secondary air and gypsum are discharged in a downward direction to reduce channeling of the secondary air and splashing of partly reacted sol ids on the reactor walls,
The product gas exits the reactor through a refractory lined pipe located on the side of the reactor top. A gas sampl ing probe is posit ioned just above the product gas exit. After the off-gas exits the reactor it passes through a baffled settling chamber to remove most of the entrained particles which are collected in a removable container attached to the apex of the cone-shaped tank bottom. The remaining particles are removed in a fiber glass filter before being vented. The reactor top and off-gas system are kept at a slight negative pressure by a compressed air ejector.
The majority of the solids exit the reactor by a l-inch diameter overflow tube located along the inside wall of the reactor. This tube extends 34 inches into the reactor and is used to control the fluidized bed depth. Solids overflow through a sight-glass and are collected in a removable container mounted onto the overflow tube. The overall fluidized bed reaction system is shown in Figure A-3.
For Runs 15 through 18d the reactor was slightly modified in an attempt to increase the desulfurization of the fines entrained in the off-gas. The reactor configuration for these runs was similar to that used in run 9 with the exception that the straight ceramic tube used to feed coal in run 9 was replaced by a quartz tube with a go-degree bend just above the bottom of the r eat tor . This tube was used for introducing gypsum radially into the bottom of the reactor. Natural gas was used as the fuel for these tests. The bed depth in these runs remained at 34 inches.
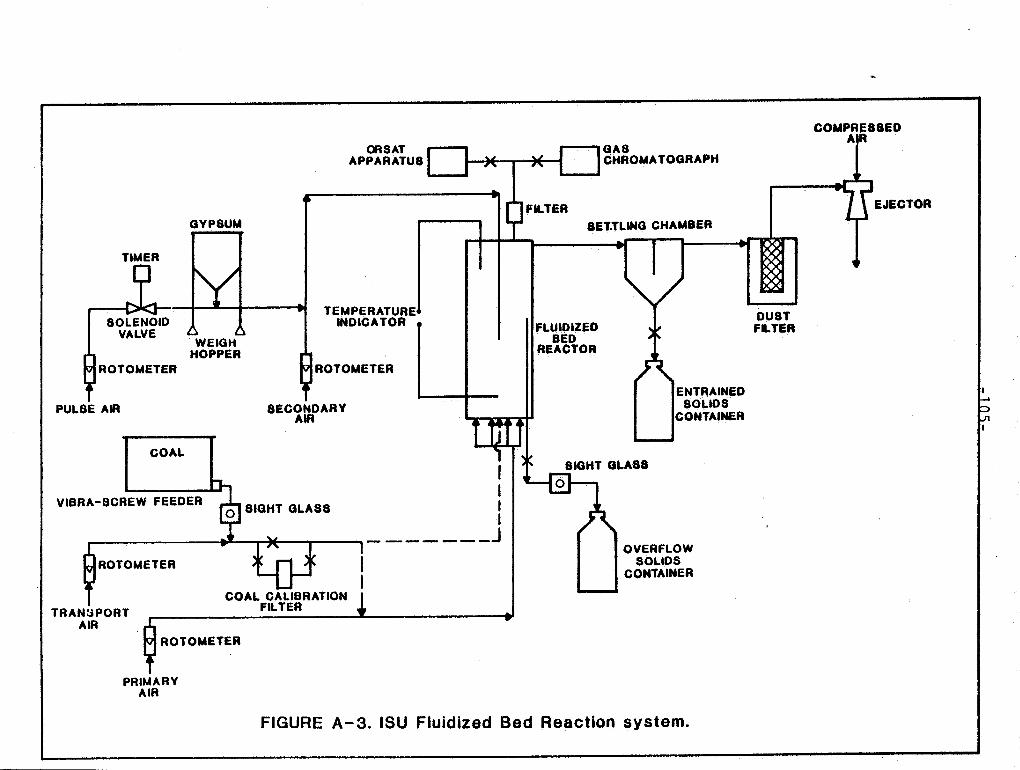

-%06-
The configuration of the reactor as used in runs 17 through 18 was the same as for previous runs. Co-agglomerated gypsum was fed radially to the bottom of the reactor by the pulsed air system and auxil lary coal was fed through the screw feeder.
In run 19 the reactor was radially fed and natural gas was used as the fuel.
The final runs, 20a and b, were fed through the top in a downward direction as in tests 7 through 14.
-107-
Appendix C

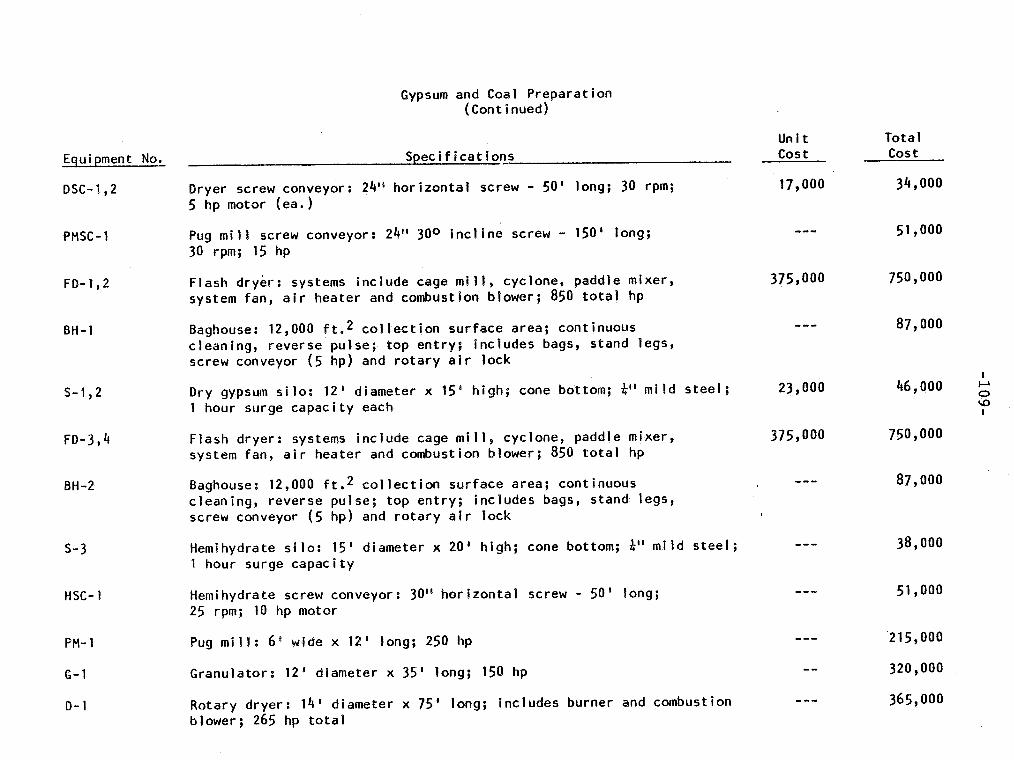


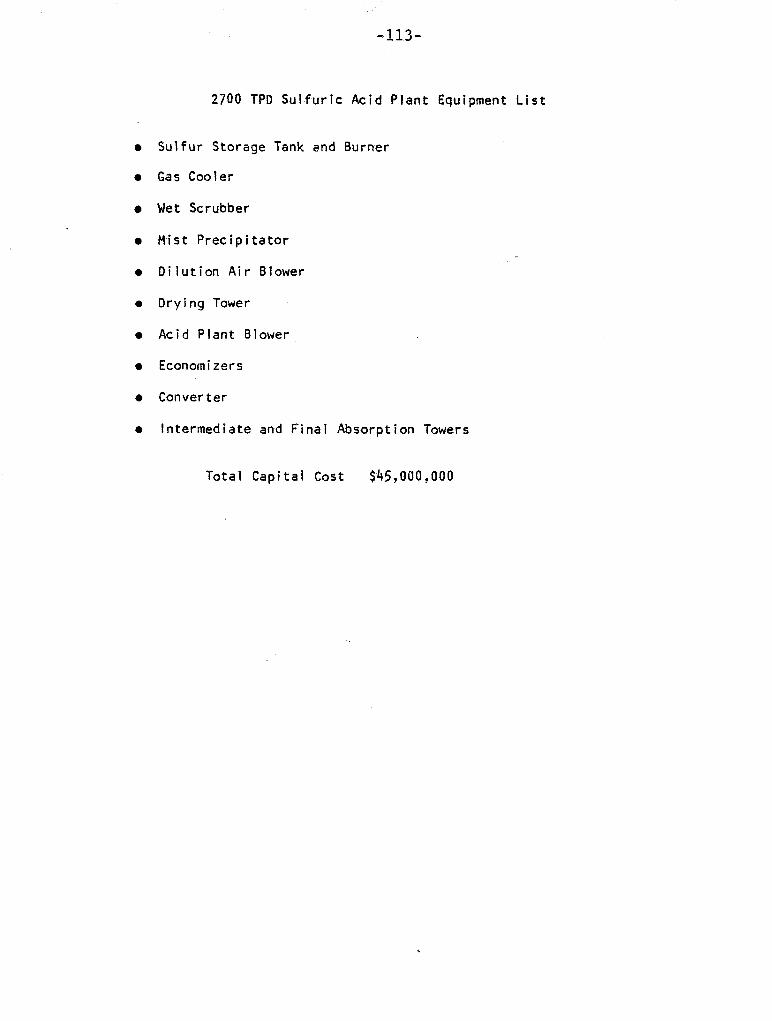
-113-
27DO TPD Sulfuric Acid Plant Equipment List
l Sulfur Storage Tank and Burner
o Gas Cooler
l Wet Scrubber
0 Mist Precipitator
o Dilution Air Blower
8 Drying Tower
l Acid Plant Blower
l Economizers
0 Converter
l Intermediate and Final Absorption Towers
Total Capital Cost $45,000,000

-114-
Steam Generation Equipment Package
Equipment No. Description Delivered
cost
HPB-1 High pressure boiler
l 150,000 lb/hr @ 150 psig l pressure reducer to 30 psig l burner f, blower - 400 hp
$2,500,000
HP%-2 High pressure boiler l 13,000 lb/hr steam @ 130 psig l burner & blower - 40 hp
250,000
Total $2,750,000


-116-
Appendix D

-117-
APPENDIX D INVESTIGATIONS INTO ALTERNATIVE THERMAL DECOMPOSITION EQUIPMENT
Preliminary investigations into the use of high temperature reactors other than the two-zone fluidized bed reactor were conducted during the project. These alternatives to the fluidized bed include the rotary kiln, flash calciner, revolving table calciner, and a conventional single zone fluidited bed reactor. In the case of the flash calciner and the conventional fluidized bed reactor, preliminary experiments were conducted to obtain a first order evaluation of their performance in the_ thermal decomposition of phosphogypsum by the I SU process. A discussion of the results obtained from this investigation follows.
Rotary Kiln
The rotary kiln, used in many thermal processes including the Krupp process which decomposes gypsum to produce sulfuric acid and cement, was ruled out for the following reason. In order to obtain a capacity at a capital equivalent to the fluidized bed reactor, the gas velocity in a direct fired unit would be similar or even higher to that present in the fluidized bed reactor . Thi.s would result in high entrainment of the gypsum. As a result, it was concluded that the fluidized bed reactor would be preferable. Indirect fired rotary kilns were considered to be inappropriate due to the increased energy consumption resulting from inefficient heat transfer and the lack of appropriate materials of construction for the high temperatures involved.
Flash Calciner
A flash calciner should be considered because the fine particle size of non-agglomerated gypsum results in an easily entrainable solid in this type of system. Further, the fine particle size provides a large surface area and a reduced particle volume for gaseous diffusion to occur, possibly resulting in an increase in the rate of reaction.
Although actual flash calcination tests were not conducted, simulated reactor operation in Run 19 (Table XXVI I I) was believed to be similar to a flash calciner in that fine gypsum was fed to the reactor. In this test, by- product 1 ime from a previous test was used as an inert bed in the reactor so that additional residence time was provided during the gypsum’s migration through the bed.
The results of this test indicate that ther,e was insufficient holding time in this type of system. A calcium balance of the feeds and products shows that 32 percent of the calcium fed to the process was the coarse by- product lime used as an inert bed. A rough estimate of the desul furization of the feeds to the reactor may be made by performing a sulfur mass balance if it is assumed that the unaccounted for calcium was of a composition similar to the recovered entrained mater ial. This would result in an overal 1 desulfurization of 62 percent with most of the losses being unreacted gypsum. However, actual flash calciner tests are recommended.
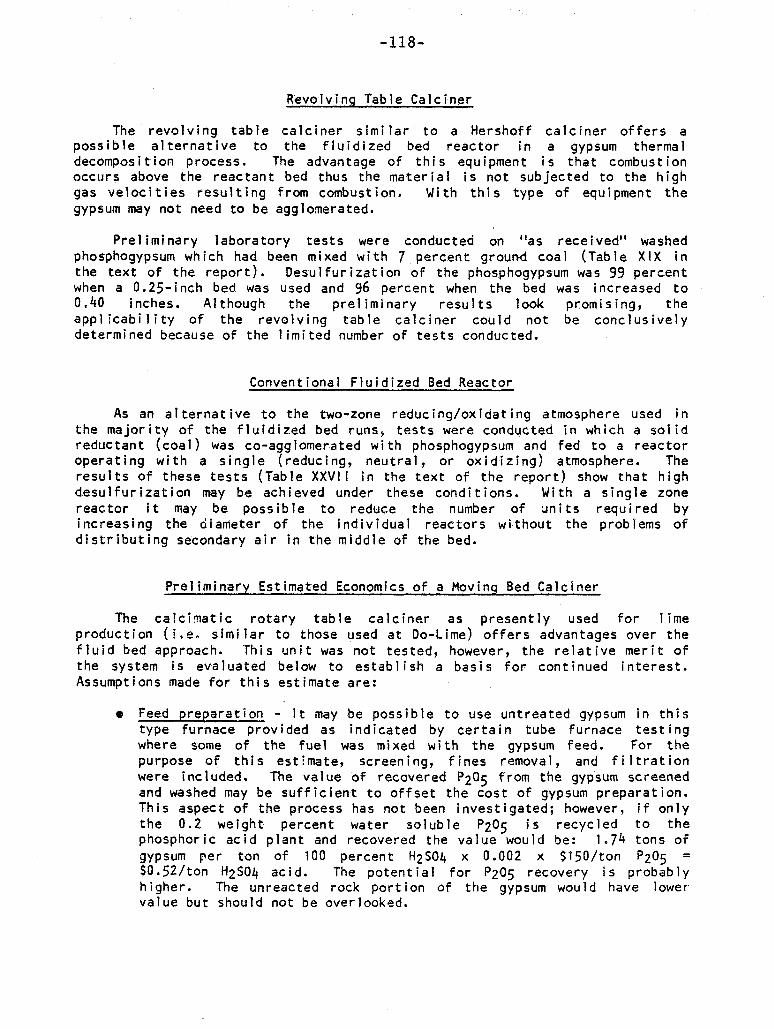
-11s
Revolving Table Calciner
The revolving table calciner similar to a Hershoff calciner offers a possible alternative to the fluidized bed reactor in a gypsum therma 1 decomposition process. The advantage of this equipment is that combustion occurs above the reactant bed thus the material is not subjected to the high gas velocities resulting from combustion. With this type of equipment the gypsum may not need to be agglomerated.
Preliminary laboratory tests were conducted on “as received” washed phosphogypsum which had been mixed with 7 percent ground coal (Table XIX in the text of the report). Desulfurization of the phosphogypsum was 99 percent when a 0.25-inch bed was used and 56 percent when the bed was increased to 0.40 inches. Al though the preliminary results 1 ook promising, the appl icabi 1 ity of the revolving table calciner could not be conclusively determined because of the limited number of tests conducted.
Conventional Fluidited Bed Reactor
As an alternative to the two-zone reducing/oxidating atmosphere used in the majority of the fluidized bed runs, tests were conducted in which a solid reductant (coal) was co-agglomerated with phosphogypsum and fed to a reactor operating with a single (reducing, neutral, or oxidizing) atmosphere. The results of these tests (Table XXVI I in the text of the report) show that high desulfurization may be achieved under these conditions. With a single zone reactor it may be possible to reduce the number of units requ i red by increasing the diameter of the individual reactors without the problems of distributing secondary air in the middle of the bed.
Preliminary Estimated Economics of a Movinq Bed Calciner
The calcimatic rotary table calciner as presently used for lime production (i.e, similar to those used at Do-Lime) offers advantages over the fluid bed approach. This unit was not tested, however, the relative merit of the system is evaluated below to establish a basis for continued interest. Assumptions made for this estimate are:
e Feed preparation - It may be possible to use untreated gypsum in this type furnace provided as indicated by certain tube furnace testing where some of the fuel was mixed with the gypsum feed. For the purpose of this estimate, screening, fines removal, and filtration were included. The value of recovered P205 from the gypsum screened and washed may be sufficient to offset the cost of gypsum preparation. This aspect of the process has not been investigated; however, if only the 0.2 weight percent water soluble P205 is recycled to the phosphoric acid plant and recovered the value would be: 1.74 tons of gypsum per ton of 100 percent H2SO4 x 0.002 x $lSO/ton P205 = $0.52/tori H2SO4 acid. The potent ia 1 for P2O5 recovery is probably higher. The unreacted rock portion of the gypsum would have lower value but should not be overlooked.

-119-
The gypsum would be dried by indirect heating countercurrent to the hot calciner gas as the gypsum is fed to the calciner.
These facilities are estimated to cost about $4,OOO,OOO total fixed capital.
l Fuel Preparation - The high sulfur coal used for the primary evaluation was costed at $f;O/ton delivered plus coal preparation facilities as a fixed capital of $3,500,000. This coal averaged about 3.8 percent sulfur and 12,600 BUP/pound heating value. Investigation of alternate fuels has been conducted recently and it is evident that petroleum coke from heavy Mexican crude wili be abundant in the near future. This coke will be 8 to 9 percent sulfur and difficult to sell for most uses. Pit-coke should be ideal for use in this appl ication. Powdered Pit Coke (14,000 BTU/pound) at 8 percent sulfur delivered and ready for firing could be delivered at about $40 per ton. This would el iminate the coal preparation costs requiring silos and feeding equipment, only at about $1,200,000. A recovery of 90 percent of the sulfur in the coke was assumed. Coke use was estimated at 0.28 tons per ton of acid.
l Thermal Decomposition - For the purpose of this estimate, approximately the same conditions were assumed for the table calciner as for the fluid bed; however, due to the reduction in dust load and other advantages the capital co5 t is estimated to be about $58,000,000. Based on this, the operating cost was computed as shown in the attached table. It is seen that potentially the cost can be reduced from the present level of $58.11 to $44.64.

-120-
Appendix Table O-I Sulfuric Acid Operating Cost Summary
of Conceptual Moving Bed Process ($125/LT Sulfur)
Amount/Shot t Ton 100% H7S04 $/Un i t
$/Short Ton 100% H7SO4
Raw Materials: Phosphogypsum Sulfur High Sulfur Coke Subtotal
_ -
1.74 -O- -0. 0.02 111.61 2,123 0.28 40 11.20
f13143
Electric Power Operating Supplies
(2% of Capital Cost) flaintenanee Parts & Supplies
(5% of Capital Cost) Opera t i ng Labor Operating Supervision Ma i ntenance Labor Maintenance Supervision Payroll Fringes (35% of Total Labor)
General Overhead (25% of Total Labor Including Fringes)
Depreciation (15 yr. straight line less 5% Salvage Value)
Taxes d Insurance (2% of Capital Cost)
Sulfuric Acid Plant Conversion Cost2
18 KWH 0.052 $ 0.94 1.51
3.77
0.99 0.25 0.99 0.25 0.8j
-3.35x0.6 = 2.01 0.70,
5.34
0.94
11.76
Gross Conversion Cost $26.41 Gross Conversion + Raw Material Cost 39.84 Process Steam Credit3 Process Steam Production Cost4
0.16 MM BTU 1.98 -0.32 4.58
Total $44.64
‘Capital cost of $63,200,000 is for feed preparation, thermal decomposition and coal hand1 ing areas.
2This includes all of the costs to convert the clean SO2 into H2SO4.
3This is the steam produced in the waste heat boiler valued as BTU’s produced at 80 percent efficiency by burning high sulfur coal.
4This includes all of the costs to generate the remaining steam required for process not produced by the waste heat boiler.