Embed Size (px)
Citation preview
Evaluation of EADRSI ‐ January 2011 Page 1
Evaluation of the Expanding Access to Diabetic Retinopathy Screening Initiative
January 2011
Prepared for:
California HealthCare Foundation 1438 Webster Street, Suite 400 Oakland, CA 94612
Prepared by:
Quade & Associates Sacramento, CA 95833
Author:
Robert Quade, Ph.D., MBA
Evaluation of EADRSI ‐ January 2011 Page 2
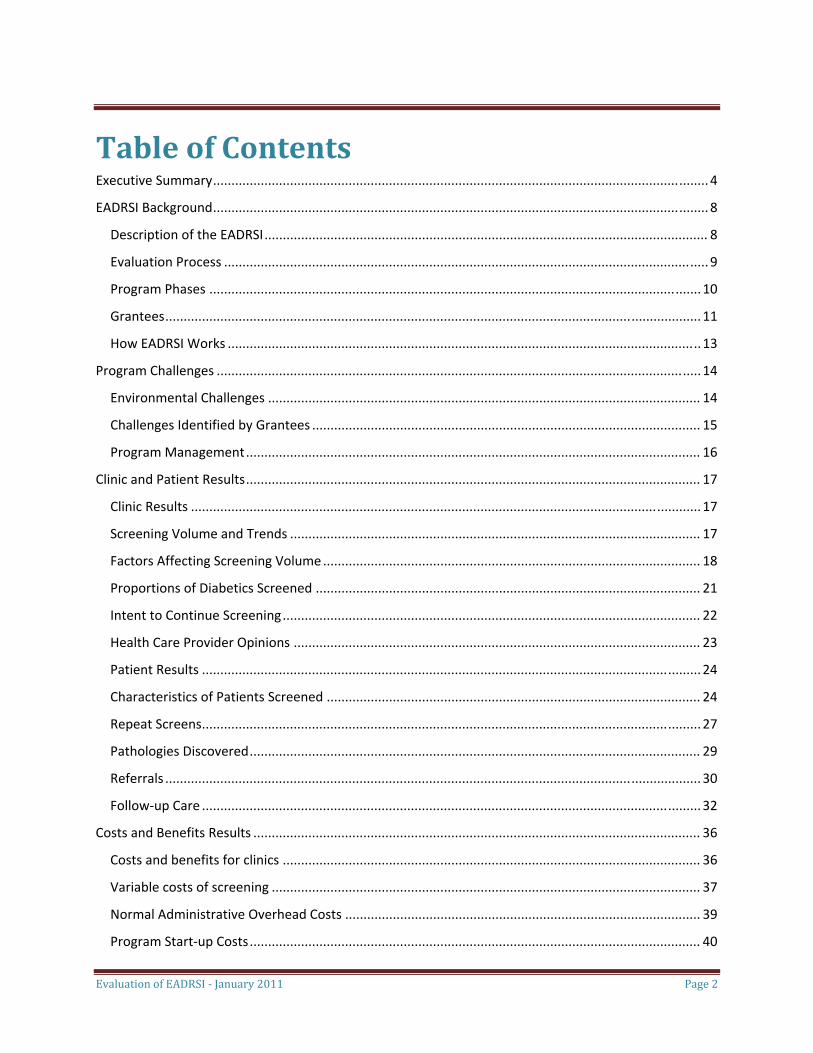
Table of Contents Executive Summary ....................................................................................................................................... 4
EADRSI Background ....................................................................................................................................... 8
Description of the EADRSI ......................................................................................................................... 8
Evaluation Process .................................................................................................................................... 9
Program Phases ...................................................................................................................................... 10
Grantees .................................................................................................................................................. 11
How EADRSI Works ................................................................................................................................. 13
Program Challenges .................................................................................................................................... 14
Environmental Challenges ...................................................................................................................... 14
Challenges Identified by Grantees .......................................................................................................... 15
Program Management ............................................................................................................................ 16
Clinic and Patient Results ............................................................................................................................ 17
Clinic Results ........................................................................................................................................... 17
Screening Volume and Trends ................................................................................................................ 17
Factors Affecting Screening Volume ....................................................................................................... 18
Proportions of Diabetics Screened ......................................................................................................... 21
Intent to Continue Screening .................................................................................................................. 22
Health Care Provider Opinions ............................................................................................................... 23
Patient Results ........................................................................................................................................ 24
Characteristics of Patients Screened ...................................................................................................... 24
Repeat Screens ........................................................................................................................................ 27
Pathologies Discovered ........................................................................................................................... 29
Referrals .................................................................................................................................................. 30
Follow‐up Care ........................................................................................................................................ 32
Costs and Benefits Results .......................................................................................................................... 36
Costs and benefits for clinics .................................................................................................................. 36
Variable costs of screening ..................................................................................................................... 37
Normal Administrative Overhead Costs ................................................................................................. 39
Program Start‐up Costs ........................................................................................................................... 40
Evaluation of EADRSI ‐ January 2011 Page 3
Total Clinic Costs ..................................................................................................................................... 41
Costs and benefits for patients ............................................................................................................... 42
Fees charged to patients ......................................................................................................................... 43
Costs and benefits for society ................................................................................................................. 44
Costs and Benefits for the Network ........................................................................................................ 46
Lessons Learned .......................................................................................................................................... 49
Program champions remain important. ................................................................................................. 49
Flexibility in scheduling is needed for point‐of‐care screening. ............................................................. 50
Moving the camera is one strategy for reaching more diabetics, but it presents challenges. ............... 51
Technical support is important. .............................................................................................................. 52
Everything takes longer than expected. ................................................................................................. 53
Other lessons and promising practices. .................................................................................................. 54
Recommendations for the Future .............................................................................................................. 55
Get more patients into repeat screens. .................................................................................................. 55
Build volume to support sustainability and growth. ............................................................................... 56
Develop a network structure to be more responsive to changes in the environment. ......................... 59
Get more patients into follow‐up care. .................................................................................................. 60
Appendices .................................................................................................................................................. 63
Appendix One: Evaluation Processes and Resources ............................................................................ 64
Appendix Two: Variables included in EyePACS Database ...................................................................... 67
Appendix Three. Characteristics of Patients Screened Through EADRSI ................................................ 70
Appendix Four: Pathologies Discovered ................................................................................................ 73
Appendix Five: Participating Grantees ................................................................................................... 75
Appendix Six: Estimated Effect of a Read Fee Increase ......................................................................... 78
Evaluation of EADRSI ‐ January 2011 Page 4
Executive Summary Diabetic retinopathy is the leading cause of blindness among working‐age adults in the United States, but early detection and treatment have proven potential to reduce the resulting vision loss by 90%. The patient often sees no symptoms of diabetic retinopathy until vision is lost, so annual eye exams are recommended in order to detect changes in the retina associated with retinopathy. Still, nearly half of all diabetics nationally do not get these annual eye exams, and the proportion of diabetic patients getting this eye care is even lower in California's safety net.
The California HealthCare Foundation launched the Expanding Access to Diabetic Retinopathy Screening Initiative (EADRSI) in 2007 to use telemedicine to address patient barriers to diabetic eye care by reducing the cost to the patient and eliminating the need to travel, get a separate appointment and go to an unfamiliar place for care. This three‐year, $1.8 million program was designed to enable up to 100 safety‐net clinics to provide diabetic retinopathy screening for at least 1,000 diabetics each. Trained photographers at each screening site would capture digital images of patients' retinas and upload the images and patient information to the Internet where a certified consultant would read the images. Clinic staff would then access the consultant's findings and direct the patient into follow‐up care as appropriate. The improved access to diabetic eye screens was made possible by a screening network using the Internet and EyePACS software designed specifically for the network.
The EADRSI grew out of a pilot project involving 13 safety‐net clinics that was begun in 2005 under the direction of Dr. Jorge Cuadros of the UC Berkeley School of Optometry. That pilot project was designed to reduce screening costs by the use of open‐source software developed for the project (EyePACS), and the use of specially certified optometrists as consulting readers. The fee for reading a case was set at $15, well below the cost of alternatives. Building on this foundation, EADRSI was designed to bring this screening to scale.
The evaluation of EADRSI was developed around five questions identified by CHCF, addressing the effect on health, cost effectiveness, impact on clinic operations, provider satisfaction, and reimbursement experiences. The primary source of data was the EyePACS database supplemented by interviews with grantee personnel and program principals.
Major Findings
• EADRSI has clearly demonstrated that telemedicine can be deployed for retinopathy screening on a large scale. Between January 1, 2008 and December 31, 2010, a total of 53,188 screens by 60 grantees were completed through the EADRSI. Many patients were screened more than once over this three‐year period, but at least 42,000 unique individuals have been screened.
• The patients screened through EADRSI had limited access to diabetic eye care. Nearly two‐thirds of all patients screened were uninsured. Many people screened through EADRSI had gone much longer than the recommended one year between exams: more than 25% of the screens were for patients
Evaluation of EADRSI ‐ January 2011 Page 5
whose last exam had been at least two years prior to the screen, and an additional 20% had never had a diabetic eye exam.
• Clinics showed great variability in screening volumes, with only one grantee consistently meeting the goal of screening 1,000 patients a year. The average grantee had annual screening volume of just over 400 cases, but one grantee was able to consistently screen more than 1,400 patients per year. At the other extreme, more than 30% of grantees had annualized screening volumes of less than 250 cases. This suggests that the original target of 1,000 screens per year for each screening site was unrealistic, but it also suggests that there is a potential to expand screening if more clinics adopted the successful screening strategies of top producers.
• A higher proportion of diabetics received eye screening than had received eye exams before the project began. In the year prior to EADRSI, the average participating clinics referred 26% of their patients to diabetic eye exams. During EADRSI, the average clinic was able to directly screen more than 30% of their diabetics, with an unknown number of additional patients continuing to get traditional eye exams.
• Screening through the EADRSI has found 4,611 cases with some level of sight‐threatening retinopathy. The EADRSI reached patients who stood to benefit greatly from this program, as evidenced by the tremendous reservoir of pathology discovered. Overall, nearly 20,000 patients were found to have some level of pathology, with 7% having more than one pathology. Among these were the 4,611 patients with severe non‐proliferative diabetic retinopathy, proliferative diabetic retinopathy, and/or clinically significant macular edema who were deemed to be at high risk of losing their vision. The identification of this pathology resulted in immediate benefit to those patients for whom follow‐up care was available.
• EADRSI has made substantial progress in providing one‐time screens but this screening has not become institutionalized in most clinics as an annual event. Diabetic patients are supposed to return to eye care each year, although some are asked to return at a shorter interval in order to monitor potentially emerging pathology at low cost. This is not happening. Nearly 90% of all patients screened have been screened only once during the three years of the program. Of the 6.3% of all patients asked to return sooner than one year, fewer than 15% have returned at all, and two‐thirds of these patients did not return until more than one year after their screen.
• Getting patients to follow‐up care has presented substantial problems. Once a patient is found to have advanced pathology, they may be referred to a specialist for examination, monitoring and treatment. Approximately 15% of all patients screened through EADRSI received "referrals to a specialist for a specific condition", but a study of patients screened in the first year of EADRSI and needing follow‐up care found that fewer than 30% had been successful in accessing that care more than a year after their screen. Of those that did access care, the average wait period was nearly 7 months. Patients were lost at all stages of the referral process, but follow‐up care was more difficult to access for uninsured patients, patients in Los Angeles County, and Latin American patients. Time lags may be important. Not only do they provide more time for the pathology to progress, but longer wait times were associated with much lower kept‐appointment rates.
Evaluation of EADRSI ‐ January 2011 Page 6
• Clinics are independently acting to improve access to follow‐up care. Clinics are increasingly recognizing the problem of access to follow‐up care, and many are taking action to improve that access. Many reported strengthening referral processes, developing stronger relationships with local specialists, and using a patient's retinal images to educate them about the importance of follow‐up care. A few grantees are in the process of establishing internal capacity to treat retinopathy, and one grantee has negotiated with local specialists to accept the results of follow‐up exams conducted by clinic optometrists to speed up the process, avoid unnecessary referrals, and provide patients with a lower‐costs alternative. As of yet, there is no coordination of these efforts.
• Patients and the state are realizing benefits from the screening program, with most costs accruing to the screening network and participating clinics. There is a net benefit to the state from reduced costs associated with vision loss, even with 70% of the potential benefit lost due to challenges in accessing follow‐up care. Grantees are absorbing much of the cost of screening, with some clinics charging patients a small fee to cover the cost of reading images. To date, there has been little reimbursement to help offset costs, but the implementation of AB175 in November 2010 will allow reimbursements for screens read by optometrists for patients covered by MediCal Fee‐For‐Service. Historically, these patients have made up less than 5% of the total screened.
• The screening network model needs to change if the network is going to be sustainable. A leaner operating budget has been proposed with reductions in administration, support and camera purchases. UC Berkeley was successful at establishing and expanding a network to connect screening sites with consultants, but current screening volume is not sufficient to cover the costs of operating that network as it was implemented during EADRSI. As the program moves forward the network will need to operate with a substantially leaner budget, a commitment to continue, and a new business plan.
• Participants noted other benefits from the program. Several grantees reported that there was a greater organizational emphasis on diabetic care, often extending to other specialty care. Patients themselves were more motivated to manage their diabetes once they were able to see lesions in their own retinas. Many grantees also reported a more positive opinion of telemedicine in general. At many sites, medical assistants were excited to be involved in the program, and morale was elevated.
Issues for the Future
The benefit of EADRSI is clear, but more needs to be done for the safety net to fully realize the potential benefit, and to ensure that the program continues to grow and serve the patients who need this care.
Patient issues.
• Get more patients into follow‐up care. Actually getting patients into treatment is outside the scope of this initiative, but it has emerged as a major area of concern. Fewer than 30% of patients referred into follow‐up care for retinopathies detected through EADRSI made and kept appointments with an eye specialist for that care. While access to specialty care is a challenge, especially for uninsured patients, the potential gains from the EADRSI will not be fully realized until all patients are able to get treatment for the pathologies discovered through screening. The fundamental problem is a lack
Evaluation of EADRSI ‐ January 2011 Page 7
of resources for specialty care for the uninsured, but there are steps that can be taken to improve outcomes and address some of the barriers to access faced by safety‐net patients.
• Get more patients into repeat screens. It is clear that the EADRSI resulted in an increase in the number of diabetics who get eye care, but there are two patient recruitment areas that need improvement.
• Annual diabetic eye exams are recommended by the American Diabetes Association and the American Optometric Association, but just over 10% of patients screened through EADRSI actually returned for a second screen. Screening has not become an annual event for most.
• More frequent eye exams were recommended by network readers for more than 4,500 patients (8.8% of total screened). Patients were referred into a repeat exam in less than one year to monitor a condition, but nearly 85% of these patients were not screened again, and two‐thirds of the patients who did repeat screens did so after more than a year had passed.
Some grantees are independently beginning to develop processes to identify diabetic patients needing one or both types of repeat screens. For those clinics that have implemented electronic diabetic registers linked to EyePACS, this is a matter of having procedures to pull this information and begin the scheduling process. Most grantees do not have these systems in place, and face greater challenges. Solving this problem will result in better eye care, and greater screening volume for the network.
Network issues.
• Build volume to support network sustainability. The network's business model is based on the difference between the $15 per case fee charged to clinics and the $5 per case fee paid to consulting readers. With a sufficient number of cases being read by network readers the network would be able to generate enough revenue to cover costs and be sustainable in the long run. During EADRSI, network operations were supported by grant funding as the "business" was built. As the funding ends, the network's revenues still fall short of covering past levels of administrative and support expenses, and do not cover camera depreciation and replacement costs. A short‐term solution is to cut technical and administrative support expenses, but in the long run it will be necessary to build screening volume. Adding new sites and replacing aging cameras depends on this growth.
• Develop a structure to be more responsive to changes in the environment. While the network itself represents change in the delivery of diabetic eye care, the network has also been slow to react to changes in the environment. The network is must be able to react quickly to changes in reimbursement policies, the entry of new competitors for screening volume, and to take advantage of partnerships with potential to improve sustainability and continuity of care. While the UCB School of Optometry continually monitors the program environment and technical developments in diabetic eye care, the development of sound business and marketing plans would guide the network's growth and allow it to quickly meet challenges and opportunities.
Evaluation of EADRSI ‐ January 2011 Page 8
EADRSI Background Diabetic retinopathy is the leading cause of blindness among working‐age adults in the United States, but early detection and treatment has the potential to reduce vision loss by 90%. The effective use of telemedicine to screen patients for diabetic retinopathy has been well documented for decades. It compares well to traditional diabetic eye exams at discovering pathology, and is among the most cost‐effective preventive health measures available. It is especially well suited to the safety net where it addresses access barriers by allowing patients to be screened during a primary care visit at their regular clinic, and often at lower cost.
The EADRSI was designed to address patient barriers to necessary diabetic eye care, and it did this through reductions in cost and the patient's need to travel, set a separate appointment, and go to a strange place for care.
Description of the EADRSI The Expanding Access to Diabetic Retinopathy Screening Initiative (EADRSI) was built upon a pilot project begun in 2005 with 13 safety‐net clinics primarily located in California's Central Valley. The pilot project used EyePACS, web‐based software for capturing retinal images, combining the images with patient information, and providing a medium for communication between the patient's provider and a remote consultant who "reads" the images and returns findings and makes referrals. The pilot project was funded by the California HealthCare Foundation (CHCF) through the California Telemedicine and eHealth Center (CTEC), and was led by Dr. Jorge Cuadros of the School of Optometry at the University of California at Berkeley (UCB). This system is currently in use at other sites in California and Mexico.
This screening network serves as infrastructure that connects diabetic safety‐net patients to eye specialists, avoiding many of the traditional barriers to access. The UCB School of Optometry provides training and certification for readers on the network, and also provides training and support for screening sites on the network. In addition, UCB maintains the software and has organized storage for images and patient information.
Many of the unique features of the EADRSI screening program were developed and tested through the pilot project.
• EyePACS is open‐source software developed by UCB that facilitates two‐way, asynchronous communication between the capture site and the consultant who "reads" the case and returns findings.
Evaluation of EADRSI ‐ January 2011 Page 9
• Optometrists are certified as readers through training developed by UCB. Many other screening programs use ophthalmologists as readers.1
• Image capture and reading protocols and procedures were developed specific to this application in safety‐net clinics.
• Low read fees. Clinics are charged a fee of $15 per case to have specialists in the UCB network examine images and other patient information and return diagnoses and make referrals as appropriate.
Beginning in January 2008, CHCF made the investment in the EADRSI in order to move beyond demonstration projects and establish a self‐sustaining program that would facilitate retinopathy screening at scale. Specifically, the goal of the EADRSI was to provide timely access to recommended annual diabetic eye screening for patients with diabetes in up to 100 safety‐net and rural clinics in the state. Doing so was expected to prevent blindness and other diabetes‐related eye disease. In the planning stages it was decided that the Initiative would be considered successful if it was able to:
• Establish a self‐sustaining diabetic retinopathy screening program serving up to 10% of all underserved patients with diabetes in California clinics (or 100,000 people) over 3 years;
• Reduce the number of people with diabetes going blind due to late or delayed screening;
• Reduce public payer costs due to disability (i.e. costs associated with blindness); and
• Develop a model for other clinics outside of the EADRSI to easily adopt and maintain or access a digital retinopathy screening program.
Evaluation Process The evaluation was guided by five evaluation questions identified by CHCF prior to the beginning of EADRSI.
• How effective is the program in affecting the identified health indicators and outcomes?
• Is the diabetic retinopathy program cost effective?
• What is the impact of diabetic retinopathy screening on operational processes, efficiencies, and quality of care, and to what extent can such a screening program be self‐sustaining?
• What impact, if any, does diabetic retinopathy screening have on primary care provider and specialist satisfaction with this technology?
• What challenges are faced by federally qualified health centers in seeking reimbursement for program services based on current regulations? What progress has been made in developing mechanisms?
1 During the course of the EADRSI, the California Legislature passed AB175, adding optometrists to the list of specialists who could be reimbursed by Medi‐Cal for diabetic retinopathy screens.
Evaluation of EADRSI ‐ January 2011 Page 10
EyePACS provided a rich data set describing the patients screened, pathologies discovered, and referral recommendations. This was supplemented with qualitative information developed through a series of interviews with program personnel.
Program Phases The EADRSI was launched in January 2008 with the first of three rounds of grantees.
Round One The first phase involved 29 grantees including six that had participated in the pilot project. Three grants went to coalitions sharing a single camera in an effort to reach more diabetics, and eight moved the camera to different sites within their own organization. Twelve grantees with previous screening experience began screening immediately. Two more began in February, with the rest being launched over sixteen months. Delays were generally reported as administrative. Two of the grantees withdrew from the EADRSI almost as soon as they were launched.2 Round Two Phase Two began nearly a year later with an additional 13 grantees approved, but one grantee withdrew before getting a camera.3 One grantee had previous screening experience.4 The time between approval and the first successful screen ranged between four and sixteen months. The proposals were simpler, with no coalitions sharing a camera or proposals to move the camera between locations. Two of the remaining 12 grantees have stopped screening after a successful launch. Both of these grantees had struggled to recruit patients to screening, and had been put on probation by UCB. Round Three The third phase of the EADRSI relied on a Request for Proposals issued in July 2010, with proposals approved from July through the end of October. Proposals came in slowly at first, but there was a rush of strong proposals at the end of the term of the Initiative. In all, thirteen new grantees were approved in this phase, but as of December 31, 2010, only two of these grantees had completed a screen. New approaches were proposed, including a retail pharmacy and a nursing education program in addition to clinics. Moving Forward
2 One grantee cited an inability to cover the costs of screening, and the other was the last site to launch after 15 months of administrative and technical discussions. This grantee may have been exhausted from the administrative difficulties. 3 This grantee was unable to resolve a contract issue regarding liability. 4 One of the Phase Two grantees was a new screening site for an organization that had started as a pilot project. There was organizational experience, but it was still necessary to familiarize staff at the new location with the screening process. That this process took six months is testimony to the challenges associated with moving a camera to a new location.
Evaluation of EADRSI ‐ January 2011 Page 11
As the EADRSI ends, it is expected that screening will continue. Clinics that have been accepted into the EADRSI but not yet launched will get cameras and training, and it will be possible for new clinics to join the network if they have their own fundus cameras.5 The network will be available to connect screening sites with consulting readers, and some level of technical assistance will be available.
Grantees The RFP for the EADRSI stipulated that each safety‐net grantee was expected to screen at least 1,000 diabetics per year, and multiple strategies were proposed by grantees to reach this target.6 This criterion effectively limited the number of organizations that could be included in the screening program, with this volume particularly beyond the capacity of most rural clinics. Creative approaches were used by many grantees to be able to hit this target:
• Single location grantees. In the simplest case, a single clinic would have enough diabetic patients to hit the target of 1,000 screens per year. Only twenty clinics participating in the EADRSI were large enough to have at least 1,000 diabetics. About one‐third of these grantees were located in Los Angeles, with another one‐third in the Central Valley. Five had begun as pilot projects. Some of the more successful grantees fell into this category.
• Referrals from other clinics within a system. Many grantees were large organizations operating multiple sites. Patients would be referred to a central screening site from other sites. Although this approach would not address transportation barriers, this was a reasonable tactic to serve patients for whom the primary barrier was the cost of an exam.
• Camera movement between clinics in a system. An alternative approach was to move the camera to the patients by rotating it through clinics. Most left the camera at one clinic for months before moving it to the next, but this approach often resulted in downtime associated with the move. A more successful strategy moved the camera to a new site for a "screening day" before returning to the central location. While this approach did address transportation barriers faced by patients, it did add to the administrative burden. Ten grantees tried moving the camera between sites within their own organization. One grantee found this too difficult and ultimately left the camera at a single location.
• Referrals from other organizations. Only two grantees proposed this approach. Both were large, urban programs with working relationships with other nearly community clinics. For one grantee, UCB set EyePACS Site ID codes to track cases by the patient's home clinic, and this grantee was extraordinarily successful. This coding not only allowed the grantee to properly route the findings back to the appropriate clinic, but it also showed how successful this
5 A fundus camera is used to capture images of the retina. 6 The target of 1,000 screens per year was arbitrary, and did not represent the result of any cost/volume/profit analysis. It was based loosely on the recognition that the investment in a camera should be covered by a minimum volume of screening. Since only one clinic was able to consistently maintain this volume, it could be concluded that the original target was not realistic.
Evaluation of EADRSI ‐ January 2011 Page 12
approach could be for generating screening volume.7 This arrangement was not duplicated for the other grantee.
• Camera movement between different organizations. This was the most challenging approach as it added the challenges of coordination between different organizations to the challenges of moving the camera. It was attempted by only three coalitions of organizations. One quickly withdrew, citing a lack of administrative and financial resources. A second has continued, and occasionally able to achieve a satisfactory level of volume, but downtime between moves is measured in months and maintaining photographer skills has been a substantial challenge. The third coalition is a special case, with a pre‐existing arrangement with UCB to store the camera, deliver it to clinics on screening days, and even capture the images.
EADRSI also received and approved proposals for more unusual approaches to screening.
• Retail Pharmacy. One novel proposal approved in Phase Three came from a chain of retail pharmacies serving primarily safety‐net clients. Screenings for retinopathy would be conducted in a clinic associated with the pharmacy, and the findings would be communicated to the patient's primary care provider if one existed. If this project was successful, the expectation was that it would be replicated throughout the network of pharmacies. Unfortunately, the attempt has not succeeded and the camera has been recalled. Challenges with space, staffing and coordination between the pharmacy and the associated clinic were exacerbated by technical problems with the camera.
• Nursing Education. A second novel proposal in Phase Three involved the use of mobile screening by nursing students developing skills at working with the community. Once trained on the use of the camera, the students would work with safety‐net clinics in a three‐county rural area to screen diabetics, with the findings returned to the patient's primary care provider. A faculty member was trained on the fundus camera and EyePACS, with the plan that he would then train a new cadre of students each semester. Unfortunately, this novel project has not succeeded and the camera has been returned. The primary challenge reported was the inability to sustain a volume of screening necessary to justify the camera investment. Thirteen screens were completed before the project was abandoned.
• Mobile Screening. One Phase One proposal involved the use of a mobile diabetes unit to reach patients spread out across desert areas.8 A total of 214 screens were completed through this unit and it is expected to continue bringing access to these isolated communities.
Overall, a total of 60 grantees successfully participated in EADRSI as of the end of 2010, with the number actually screening in one month hitting 50 at the Initiative's peak in June 2010. This number includes programs from three phases of granting, plus pilot projects and organizations that conducted screens as
7 This one grantee screened 766 patients for other organizations. That is more than the total screened by 30 other grantees. 8 Diabetes screening had actually been added to a successful mobile unit several years before EADRSI began as part of the American Indian Diabetic Telemedicine Grant Program funded by The California Endowment through the California Telemedicine and eHealth Center. The EADRSI updated this existing program with a new camera and the use of the EyePACS software.
Evaluation of EADRSI ‐ January 2011 Page 13
part of a trial program. Most grantees received the use of cameras as part of their grant, but other grantees purchased cameras, already had cameras, or received cameras through other sources. Some grantees had as many as three cameras screening at the same time.
How EADRSI Works
1. Recruitment of patients to screening American Diabetes Association (ADA) guidelines recommend annual eye exams for diabetics, but nationally only slightly more than half of all diabetics get those exams, with lower eye exam rates achieved in safety net clinics.9 The EADRSI added another process by which safety‐net clinics could get appropriate eye care for their diabetics, with the telemedicine approach addressing many of the identified barriers to eye care.
The original intention of the EADRSI was that diabetic patients would be screened as part of the primary care visit. The provider would refer the patient to screening during that visit, and before the patient left the clinic a trained photographer would capture images. There would be no need for an additional appointment that might be missed, and this element of diabetic care easily could be coordinated with the rest of the patient's care with the provider in control of the process.
In practice, each grantee developed its own approach to recruiting patients to screening. Most continued to screen patients as part of the primary care visit when the availability of the patient, photographer and space occurred simultaneously, but scheduling patients into screening days evolved as the dominant strategy. While this forced patients to visit the clinic just for a screen, it did allow for an orderly scheduling of screens that eliminated competing demands on photographer time. Most grantees reported that this was necessary to coordinate with work schedules.
Grantees also reported that the use of screening days was more effective than referring patients into traditional eye exams. For uninsured patients, getting screened through the EADRSI was cheaper, and often involved less transportation. Grantees in Los Angeles County also reported that it was easier to screen patients than it was to complete the paperwork necessary to refer them into the County's eye care.
2. Screening process In the EADRSI, clinic personnel capture a set of eight digital images of patients' eyes using a fundus camera, and then upload those images with appropriate patient information to the Internet for remote assessment.10 These photographers are typically medical assistants, but grantees also employed a range of technicians, case managers, and nurses in this role. Each screening site was recommended to have
9 Closer to home, diabetic patients covered by Medi‐Cal have an eye exam rate of 54.7%. Annual Eye Exam Rates by California County: Fee‐for‐Service (FFS) Medicare Beneficiaries with Diabetes, July 2006‐June 2007. Uninsured patients are likely to have had a lower rate of diabetic eye exams. 10 The standard set of images includes three retinal and one external image per eye. In practice, there is some variability. A listing of the data fields in EyePACS is provided in the appendix to this report.
Evaluation of EADRSI ‐ January 2011 Page 14
between two and four trained photographers to provide back‐up and consistency in the case of staff turnover. All photographers were trained and certified by UCB prior to screening patients, and UCB has been providing refresher training for photographers when requested.
Once the patient information and images were uploaded, a consulting reader would examine the images and information. The reader's diagnosis and referral for that case would be uploaded to the Internet to be retrieved by clinic personnel and routed appropriately through the clinic. UCB recruited, trained and certified each reader prior to that specialist reading any cases, with 55 individuals reading at least one case in the EADRSI. Most of these readers are optometrists, but not all operate within the UCB network of readers: some participating clinics had their own optometrists read the screens, two grantees contracted for reading services with local eye specialists in order to maintain the relationships that would help obtain treatment for patients who needed that care, and two other networks of readers have completed reads for grantees.11
3. Follow up care It is the clinic's responsibility to notify the patient of any referrals, and each grantee independently developed their own system for doing this. Actually getting the patient into follow‐up care has emerged as one of the major challenges associated with this screening program, although follow‐up care is outside the scope of the EADRSI.12
Program Challenges Environmental Challenges There are three environmental factors that should be kept in mind as a context for the program.
• The EADRSI was launched at the beginning of the current economic recession, at a time when rising unemployment placed increased demands on the safety‐net clinics to serve growing numbers of people affected by economic conditions. In this environment, it is a testimony to the importance attached to diabetic eye care by safety‐net clinics that so many are continuing to absorb costs and screen. To date, only two grantees have dropped out of the program specifically citing economic concerns. EADRSI has been designed to be a lower‐cost, more convenient alternative to traditional eye exams. As such, the timing is right for this program.
• Personnel at safety‐net clinics often wear many hats. Increased demand for time in one project may be met at the cost of reducing effort in other areas. Many grantees have used new funding sources to implement electronic health records (EHRs) during the term of their involvement with EADRSI, often relying on the same staff to manage the efforts. EHR implementation
11 The Southern California College of Optometry has been the provider of reads for a group of four clinics in Los Angeles. More recently, Drew University received an NIH grant to implement a teleophthalmology program and absorbed those clinics into their program. 12 A more in depth presentation of experiences and practices associated with getting patients into necessary follow‐up care is presented in the Recommendations for the Future section of this report.
Evaluation of EADRSI ‐ January 2011 Page 15
generally has taken precedence when it conflicts with retinopathy screening implementation, and this has been the reported cause of several slow starts to screening.13
• Real resources are being expended to support this screening program, effectively without reimbursement from payers. Most of the patients served by the EADRSI are uninsured, and clinics have to absorb the cost of screening these patients, or they have to pass the cost on through co‐pays. Until recently, there was no reimbursement for publically‐insured patients. At least partially in response to the demonstrated effectiveness of the EADRSI, AB175 took effect on November 1, 2010. As a result, Medi‐Cal is beginning reimbursement for screening through telemedicine when the readers are optometrists. It is too early to determine the effect that this will have on the screening programs begun through EADRSI, but it is likely to result in more eye care for more diabetic patients.
Challenges Identified by Grantees While grantees have regularly expressed great appreciation for the Initiative, the situation is not all positive. All grantees saw some challenges, but they also seemed to be committed to addressing those remaining issues. When asked to describe the challenges they saw, respondents identified the following issues with which they were currently concerned:
• Problems with follow‐up care are becoming increasingly important. As organizations became more aware of diabetic eye care, they also became more aware of the problems that diabetic patients had accessing that care after they were found to have advanced diabetic retinopathy. For many, this is the final piece of the puzzle that is needed for diabetic patients, especially the uninsured, to get proper eye care.
• Staffing remains an issue. This covers several, smaller issues:
o Photographer turnover. Many sites rely on a single photographer, and if that photographer leaves, screening stops. Keeping more than one photographer actively screening requires a moderate level of screening.14
o Conflict with other duties. Most photographers are medical assistants, and have other duties that must be met in a timely fashion. They are not always available to capture images when the patient has a primary care visit.
o Time commitments. Most grantees set aside one or two days per week for image capture, and block out staff time to match. Adding additional screening days is a struggle.
13 The network's technical assistance has extended to linking EyePACS to i2i software for some grantees. With full integration, this linkage allows easier entry of patient information into EyePACS and the transfer of findings from EyePACS back to patient's records in i2i. There remains a learning curve for grantees to take full advantage of this linkage, but there is great potential for addressing patient recruitment issues. 14 Some of the most successful programs have relied on a single individual who drove the program from a photographer position. When that photographer remains with the program, great things happen.
Evaluation of EADRSI ‐ January 2011 Page 16
• Patient recruitment issues still exist. Nearly all respondents reported having made major changes in the way they recruited patients to screening, and about half reported being satisfied with the processes they had developed.
o The primary problem was identifying and reaching all diabetics who needed eye care. While an electronic diabetic register simplifies the identification of patients, not all clinics in the safety net had these systems. Alternative approaches took more staff time. One grantee reported having their scheduling clerks identify diabetic patients needing eye care when they called for an appointment. They would then try to schedule diabetic care visits for those patients into one of two screening days each week.
o Coordination of photographer availability with patient screening visits was a challenge for many clinics, especially those that attempted to provide screens as part of the primary care visit without prior arrangements.
o Identifying patients screened in one year but needing a second annual screen was an emerging challenge for many grantees. None reported being satisfied with current procedures.
• A very few providers are not supporting the program. One grantee reported that providers at that clinic were not enthusiastic about the use of telemedicine for screening purposes.15 At all other sites however, providers were reported to be positive about the program, and all providers responding to the end of program survey reported that they supported continuing screening at their clinics.
At no point in the end‐of‐program interviews did these challenges seem to be dampening grantee enthusiasm for the program. Rather, they were evidence that even after three years grantees were continuing to find challenges, and they were still committed to addressing those challenges.
Program Management The UC Berkeley program management team was reorganized half‐way through the EADRSI, with the timing of this reorganization coincident with changes in program activity. Prior to this reorganization, total screening volume had risen regularly from one month to the next as new screening sites were added regularly and the average screening volume per site consistently increased.
The second half of the EADRSI saw less growth in screening volume and the number of sites actively screening, but there were notable improvements in quality parameters. The turnaround time between
15 No providers from this site completed the end‐of‐program survey. The proponents of screening all left the organization shortly after the camera was delivered, and the program administrator was put in the position of having to sell providers on the process. Complicating matters, this grantee is currently involved in another telemedicine program, and providers were not happy with that program. One story from that other program is illustrative. A store‐and‐forward case was sent to a specialist who did not respond with findings for two weeks. The patient's provider began asking for those findings within the promised time span, and other providers became aware of the frustration associated with the long turnaround. While the findings were ultimately returned, another provider at the clinic had already made the diagnosis. This story should remind us that disappointment with one program can affect the success of other programs.
Evaluation of EADRSI ‐ January 2011 Page 17
case upload and the return of findings decreased, with the number of cases with excessive turnaround times declining substantially. Reader referral protocols were further standardized, with substantial decreases in variability between readers for referral rates, and an increase in specificity to reflect the economics of the safety net. The original technical support field staff were replaced by optometrists who provided support to grantees. Over the same period however, screening volume and the number of active sites rose slowly and had periods of decline punctuated by a sharp spike in volume in the spring of 2010. 16
Clinic and Patient Results A combination of EyePACS data and grantee interviews has been used to develop a series of results for participating clinics and patients served by the program.
Clinic Results
Screening Volume and Trends Between January 1, 2008 and December 31, 2010, a total of 53,188 screens were completed through the EADRSI, clearly demonstrating that telemedicine can be effectively deployed for diabetic retinopathy screening on a large scale. Many patients were screened more than once over this three‐year period, but at least 42,000 unique individuals have been screened through the program.17 While not all clinics were able to track diabetic eye exam rates prior to the EADRSI, this translates into more than 1,800 additional people receiving diabetic eye care for those clinics that did track these data. One highly successful grantee was able to consistently screen more than 1,400 patients annually, but no other grantee was able to maintain the target rate of 1,000 screens per year.
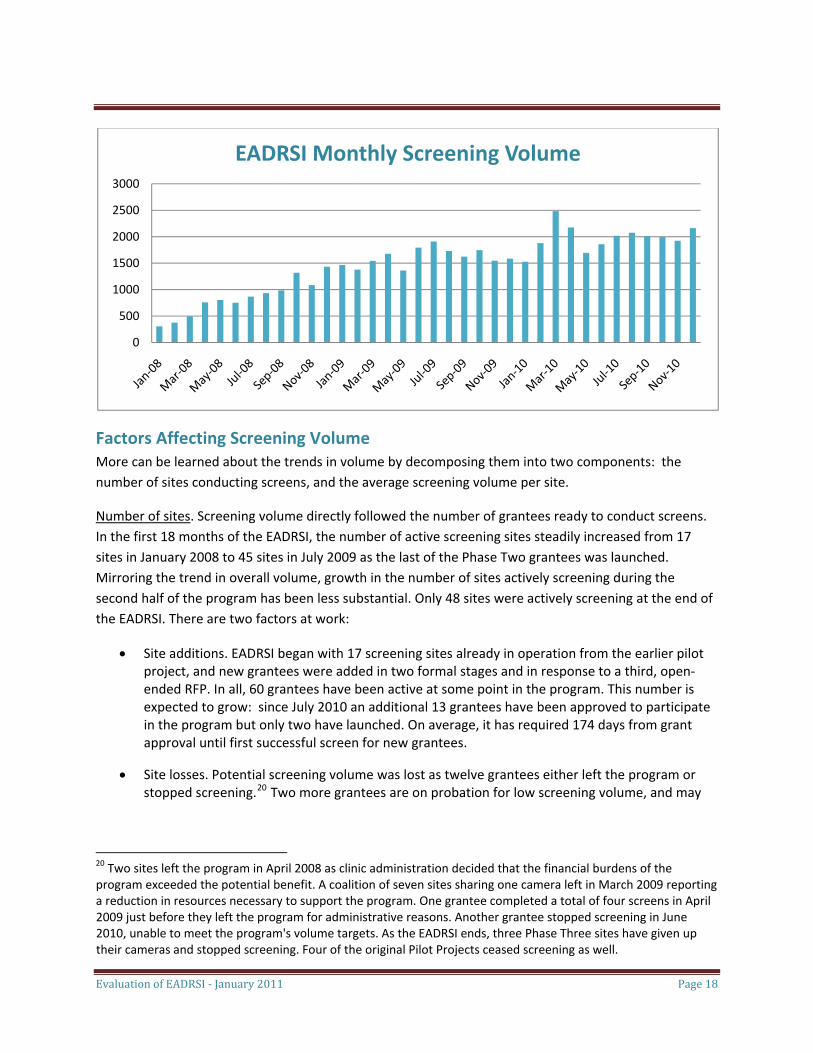
For purposes of understanding screening activity the EADRSI can be broken into two halves. There was an unmistakable and consistent upward trend in screening volume through the first 18 months, with each month‐to‐month decline immediately followed by a new record high volume the next month.18 This growth trend broke down in the second half of the program as monthly screening volumes tended to range between 1,500 and 2,000 cases per month with two months that broke out of this range on the upside.19 Monthly screening volume did peak at 2,484 cases in March 2010, providing an indication of the potential volume that could be achieved from the program.
16 This pattern can be seen in the monthly screening volume graph on page18. 17 The uncertainty in this statement is due to missing patient identifiers: three programs did not enter these data. The actual number of unique patients is likely to exceed the estimate of 42,000. 18 Extrapolating this growth trend led to an estimate of monthly volume exceeding 3,300 screens by the end of the EADRSI. 19 Fitting ordinary least squares to the monthly screening volume yielded a month‐to‐month increase of 81.5 screens per month over the first 18 months, and a month‐to‐month increase of only 32.7 over the last 15 months. The difference in slopes was statistically significant: program growth slowed substantially.
EADRSI Monthly Screening Volume
0
500
1000
1500
2000
2500
3000
Factors Affecting Screening Volume More can be learned about the trends in volume by decomposing them into two components: the number of sites conducting screens, and the average screening volume per site.
Number of sites. Screening volume directly followed the number of grantees ready to conduct screens. In the first 18 months of the EADRSI, the number of active screening sites steadily increased from 17 sites in January 2008 to 45 sites in July 2009 as the last of the Phase Two grantees was launched. Mirroring the trend in overall volume, growth in the number of sites actively screening during the second half of the program has been less substantial. Only 48 sites were actively screening at the end of the EADRSI. There are two factors at work:
• Site additions. EADRSI began with 17 screening sites already in operation from the earlier pilot project, and new grantees were added in two formal stages and in response to a third, open‐ended RFP. In all, 60 grantees have been active at some point in the program. This number is expected to grow: since July 2010 an additional 13 grantees have been approved to participate in the program but only two have launched. On average, it has required 174 days from grant approval until first successful screen for new grantees.
• Site losses. Potential screening volume was lost as twelve grantees either left the program or stopped screening.20 Two more grantees are on probation for low screening volume, and may
Evaluation of EADRSI ‐ January 2011 Page 18
20 Two sites left the program in April 2008 as clinic administration decided that the financial burdens of the program exceeded the potential benefit. A coalition of seven sites sharing one camera left in March 2009 reporting a reduction in resources necessary to support the program. One grantee completed a total of four screens in April 2009 just before they left the program for administrative reasons. Another grantee stopped screening in June 2010, unable to meet the program's volume targets. As the EADRSI ends, three Phase Three sites have given up their cameras and stopped screening. Four of the original Pilot Projects ceased screening as well.
Evaluation of EADRSI ‐ January 2011 Page 19
leave before the end of the program.21 In addition to these permanent losses, there have been temporary lapses in screening activity as grantees have moved the camera from one location to another or have dealt with camera or staff issues.22
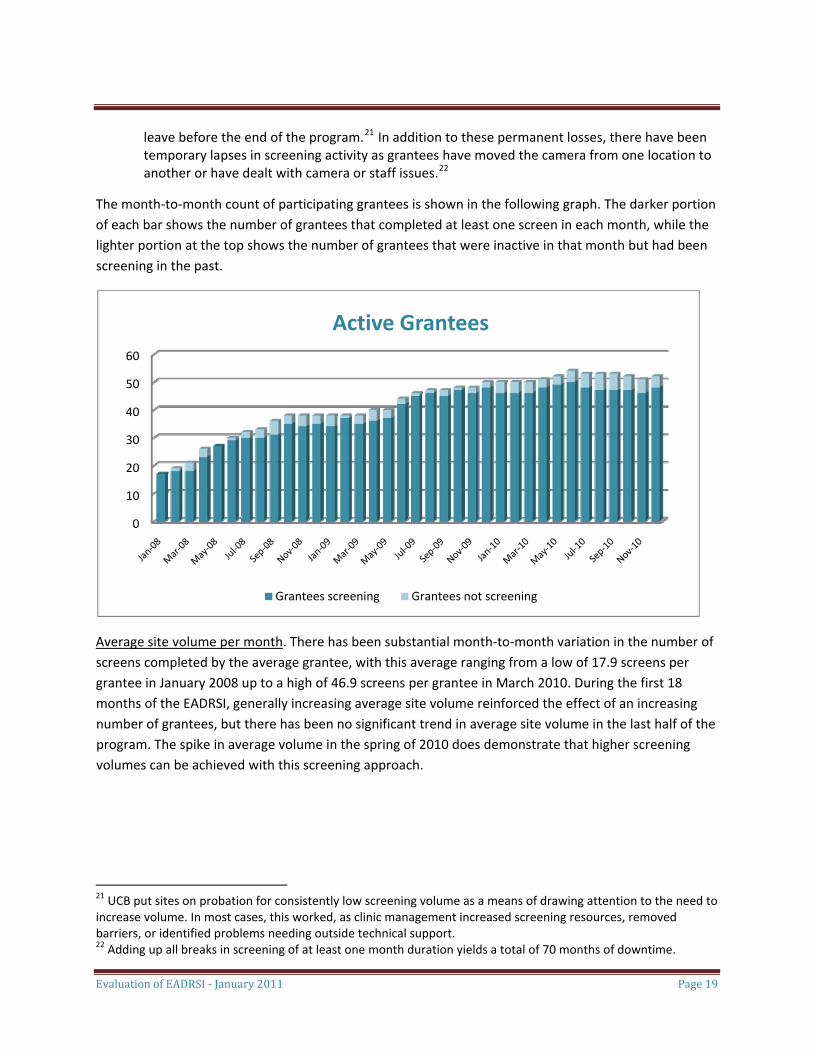
The month‐to‐month count of participating grantees is shown in the following graph. The darker portion of each bar shows the number of grantees that completed at least one screen in each month, while the lighter portion at the top shows the number of grantees that were inactive in that month but had been screening in the past.
0
10
20
30
40
50
60
Active Grantees
Grantees screening Grantees not screening
Average site volume per month. There has been substantial month‐to‐month variation in the number of screens completed by the average grantee, with this average ranging from a low of 17.9 screens per grantee in January 2008 up to a high of 46.9 screens per grantee in March 2010. During the first 18 months of the EADRSI, generally increasing average site volume reinforced the effect of an increasing number of grantees, but there has been no significant trend in average site volume in the last half of the program. The spike in average volume in the spring of 2010 does demonstrate that higher screening volumes can be achieved with this screening approach.
21 UCB put sites on probation for consistently low screening volume as a means of drawing attention to the need to increase volume. In most cases, this worked, as clinic management increased screening resources, removed barriers, or identified problems needing outside technical support. 22 Adding up all breaks in screening of at least one month duration yields a total of 70 months of downtime.
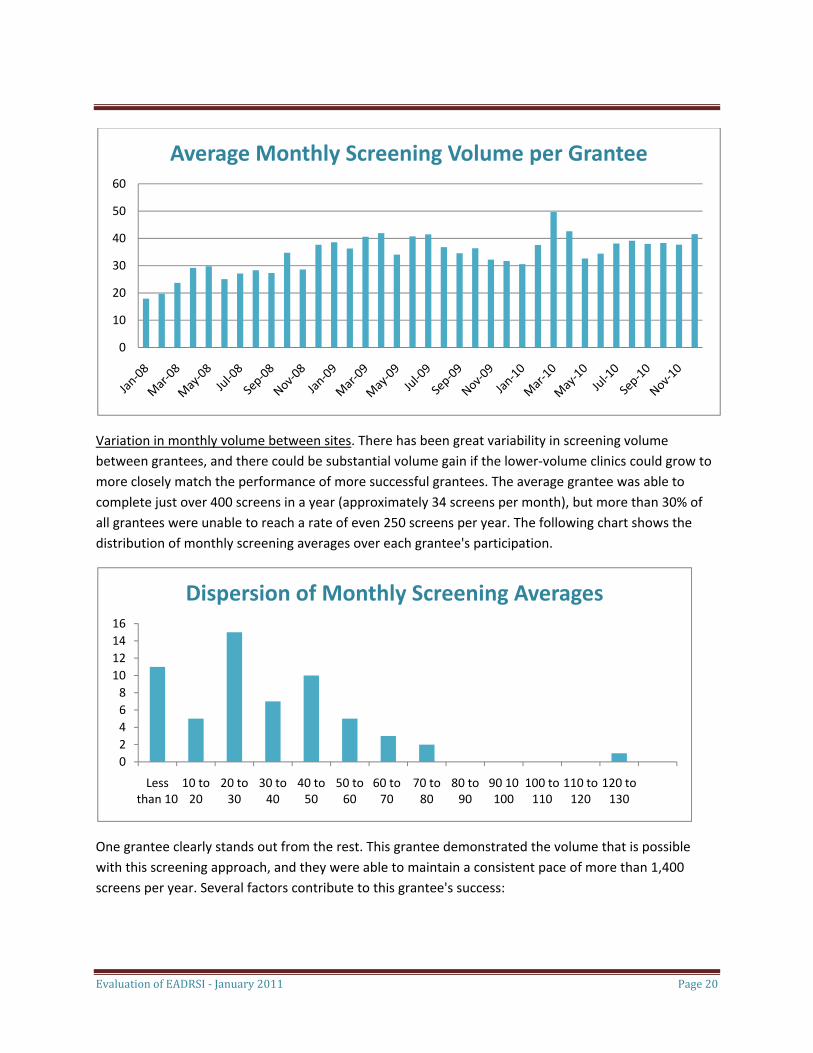
Average Monthly Screening Volume per Grantee
0
10
20
30
40
50
60
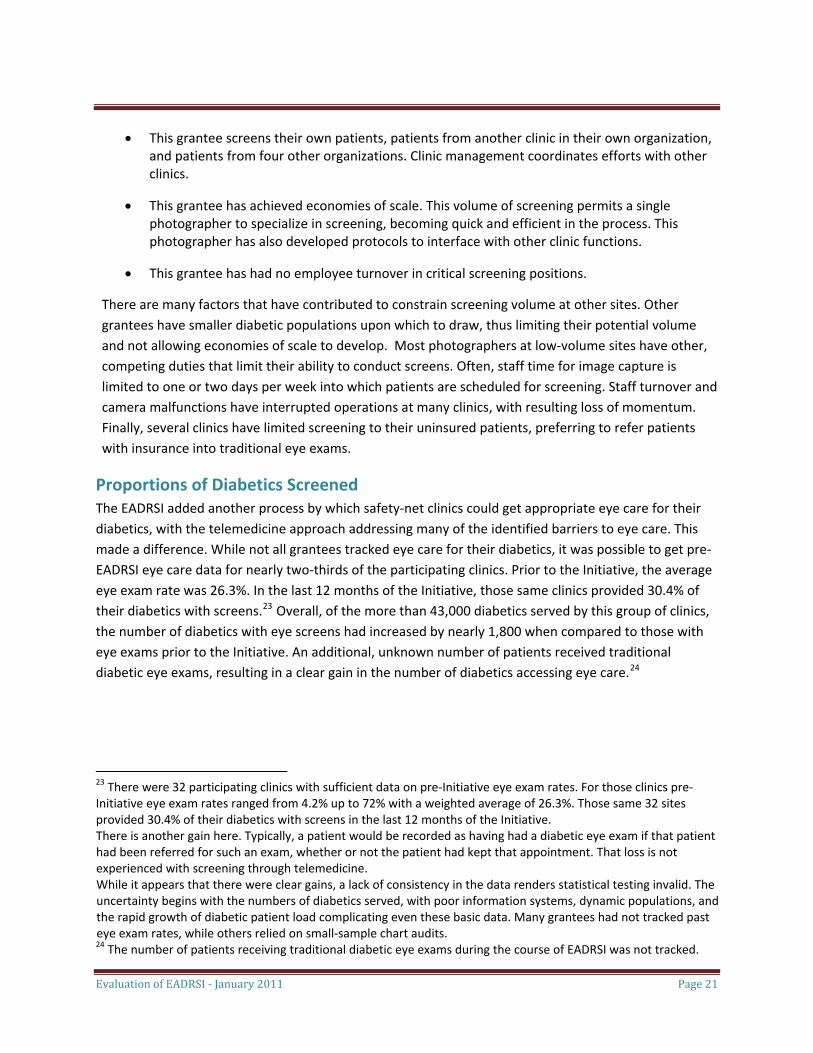
Variation in monthly volume between sites. There has been great variability in screening volume between grantees, and there could be substantial volume gain if the lower‐volume clinics could grow to more closely match the performance of more successful grantees. The average grantee was able to complete just over 400 screens in a year (approximately 34 screens per month), but more than 30% of all grantees were unable to reach a rate of even 250 screens per year. The following chart shows the distribution of monthly screening averages over each grantee's participation.
02468
10121416
Less 10 to 20 to 30 to 40 to 50 to 60 to 70 to 80 to 90 10 100 to 110 to 120 to
Dispersion of Monthly Screening Averages
than 10 20 30 40 50 60 70 80 90 100 110 120 130
One grantee clearly stands out from the rest. This grantee demonstrated the volume that is possible with this screening approach, and they were able to maintain a consistent pace of more than 1,400 screens per year. Several factors contribute to this grantee's success:
Evaluation of EADRSI ‐ January 2011 Page 20
Evaluation of EADRSI ‐ January 2011 Page 21
• This grantee screens their own patients, patients from another clinic in their own organization, and patients from four other organizations. Clinic management coordinates efforts with other clinics.
• This grantee has achieved economies of scale. This volume of screening permits a single photographer to specialize in screening, becoming quick and efficient in the process. This photographer has also developed protocols to interface with other clinic functions.
• This grantee has had no employee turnover in critical screening positions.
There are many factors that have contributed to constrain screening volume at other sites. Other grantees have smaller diabetic populations upon which to draw, thus limiting their potential volume and not allowing economies of scale to develop. Most photographers at low‐volume sites have other, competing duties that limit their ability to conduct screens. Often, staff time for image capture is limited to one or two days per week into which patients are scheduled for screening. Staff turnover and camera malfunctions have interrupted operations at many clinics, with resulting loss of momentum. Finally, several clinics have limited screening to their uninsured patients, preferring to refer patients with insurance into traditional eye exams.
Proportions of Diabetics Screened The EADRSI added another process by which safety‐net clinics could get appropriate eye care for their diabetics, with the telemedicine approach addressing many of the identified barriers to eye care. This made a difference. While not all grantees tracked eye care for their diabetics, it was possible to get pre‐EADRSI eye care data for nearly two‐thirds of the participating clinics. Prior to the Initiative, the average eye exam rate was 26.3%. In the last 12 months of the Initiative, those same clinics provided 30.4% of their diabetics with screens.23 Overall, of the more than 43,000 diabetics served by this group of clinics, the number of diabetics with eye screens had increased by nearly 1,800 when compared to those with eye exams prior to the Initiative. An additional, unknown number of patients received traditional diabetic eye exams, resulting in a clear gain in the number of diabetics accessing eye care.24
23 There were 32 participating clinics with sufficient data on pre‐Initiative eye exam rates. For those clinics pre‐Initiative eye exam rates ranged from 4.2% up to 72% with a weighted average of 26.3%. Those same 32 sites provided 30.4% of their diabetics with screens in the last 12 months of the Initiative. There is another gain here. Typically, a patient would be recorded as having had a diabetic eye exam if that patient had been referred for such an exam, whether or not the patient had kept that appointment. That loss is not experienced with screening through telemedicine. While it appears that there were clear gains, a lack of consistency in the data renders statistical testing invalid. The uncertainty begins with the numbers of diabetics served, with poor information systems, dynamic populations, and the rapid growth of diabetic patient load complicating even these basic data. Many grantees had not tracked past eye exam rates, while others relied on small‐sample chart audits. 24 The number of patients receiving traditional diabetic eye exams during the course of EADRSI was not tracked.
Evaluation of EADRSI ‐ January 2011 Page 22
Intent to Continue Screening All project champions interviewed at the end of the EADRSI expressed their intent to continue screening, citing benefits to patients from improved access to eye care. Many grantees were quite emphatic in their assessment of the value of the program. However, as the EADRSI draws to a close, one individual grantee is ceasing screening operations25, another may be bringing the reads in house, and another group of grantees is joining a new teleophthalmology program.26
In addition to improving patient access to diabetic eye care, respondents noted other, less tangible benefits from the program:
• The organization developed a greater awareness of the number of people who had been missing eye care. Several grantees developed new processes for identifying diabetic patients in need of eye care, including diabetic check sheets in charts and registers. The attention this drew was credited with encouraging providers' referrals for both screens and traditional eye exams, and may have played a role in building diabetic disease management programs.
• Screening reduces the level of worry and uncertainty for patients. Especially for patients who had not been able to access traditional diabetic eye care, the ability to be screened conveniently at the clinic reduced patient worry about missing recommended diabetic care.
• Screening was easier than getting patients into traditional diabetic eye exams. This was reported by clinics in Los Angeles County. The process of referring patients into traditional eye exams provided by the County absorbed more time and resources than simply conducting the screen. The screening process allowed clinics to concentrate their referral efforts on those patients found to have eye pathology.
• Participation in screening energized staff. Several grantees reported that team spirit had developed through the program, with Medical Assistants feeling like part of the team and taking special pride in being part of this effort. Disease management efforts were increased at some sites, with efforts to track diabetic services, schedule patients into necessary care and monitor their results, and to more thoroughly track follow‐up success. Although this energy was not present in all programs, many did report these gains.
When asked, 100% of the remaining respondents in end‐of‐program interviews indicated that they intended to continue, with some being especially enthusiastic. This estimate may be overly rosy, since end‐of‐program interviews were not conducted with the nine grantees that had already left the EADRSI, or with the two that were in the process of leaving. Champions could also be expected to be positive about their programs.
25 This grantee has struggled with generating sufficient screening volume. There were placed on probation and given the alternative of paying for a minimum of 30 reads per month, purchasing their own camera, or terminating the screening. They chose the latter alternative. 26 Charles Drew University received an NIH grant to implement a teleophthalmology program in Los Angeles. Participating clinics get free reads by joining that program.
Evaluation of EADRSI ‐ January 2011 Page 23
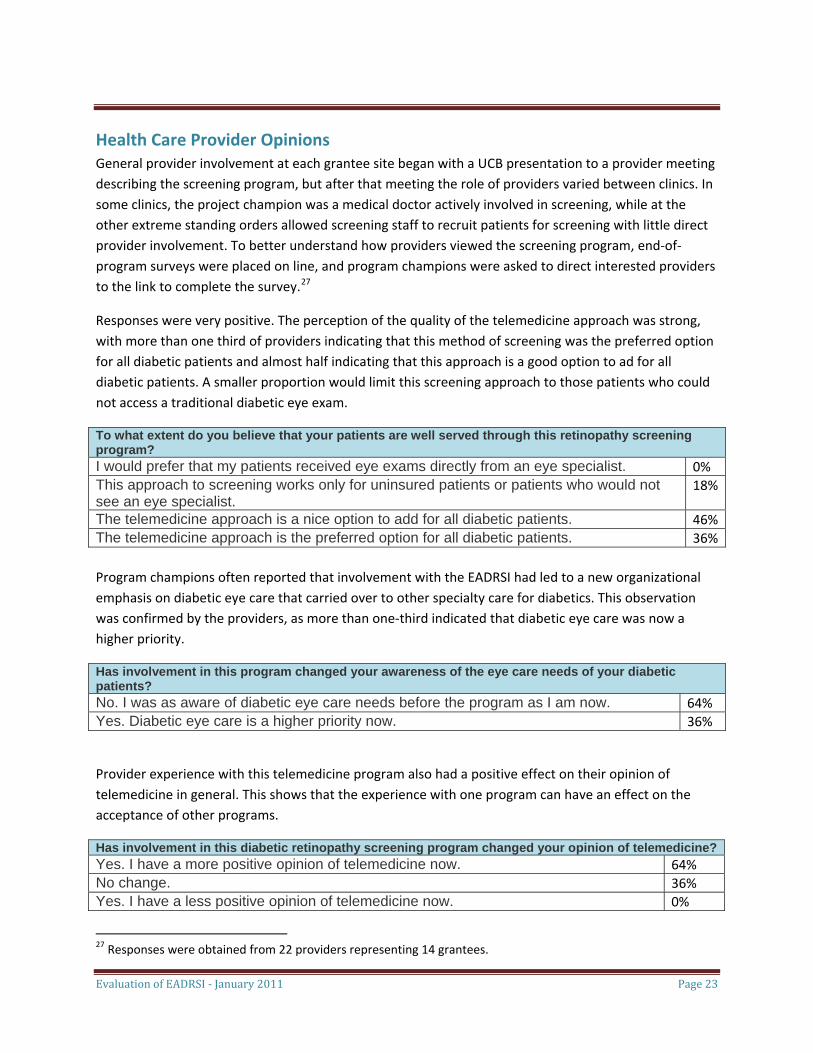
Health Care Provider Opinions General provider involvement at each grantee site began with a UCB presentation to a provider meeting describing the screening program, but after that meeting the role of providers varied between clinics. In some clinics, the project champion was a medical doctor actively involved in screening, while at the other extreme standing orders allowed screening staff to recruit patients for screening with little direct provider involvement. To better understand how providers viewed the screening program, end‐of‐program surveys were placed on line, and program champions were asked to direct interested providers to the link to complete the survey.27
Responses were very positive. The perception of the quality of the telemedicine approach was strong, with more than one third of providers indicating that this method of screening was the preferred option for all diabetic patients and almost half indicating that this approach is a good option to ad for all diabetic patients. A smaller proportion would limit this screening approach to those patients who could not access a traditional diabetic eye exam.
To what extent do you believe that your patients are well served through this retinopathy screening program? I would prefer that my patients received eye exams directly from an eye specialist. 0% This approach to screening works only for uninsured patients or patients who would not see an eye specialist.
18%
The telemedicine approach is a nice option to add for all diabetic patients. 46%The telemedicine approach is the preferred option for all diabetic patients. 36% Program champions often reported that involvement with the EADRSI had led to a new organizational emphasis on diabetic eye care that carried over to other specialty care for diabetics. This observation was confirmed by the providers, as more than one‐third indicated that diabetic eye care was now a higher priority.
Has involvement in this program changed your awareness of the eye care needs of your diabetic patients? No. I was as aware of diabetic eye care needs before the program as I am now. 64% Yes. Diabetic eye care is a higher priority now. 36%
Provider experience with this telemedicine program also had a positive effect on their opinion of telemedicine in general. This shows that the experience with one program can have an effect on the acceptance of other programs.
Has involvement in this diabetic retinopathy screening program changed your opinion of telemedicine?Yes. I have a more positive opinion of telemedicine now. 64% No change. 36% Yes. I have a less positive opinion of telemedicine now. 0%
27 Responses were obtained from 22 providers representing 14 grantees.
Evaluation of EADRSI ‐ January 2011 Page 24
Improved communication between providers and specialists had been an informal goal of the screening program, but the only change in communication noted by providers was the reduction in referrals of patients without identified retinopathy. It was thought that specialists preferred seeing patients with disease and that this screening was important in areas in which there were few specialists willing to treat safety‐net patients. There was also one comment that providers "have no feedback or contact with specialists." Clearly, EADRSI has done little to build collaboration between primary care providers and eye specialists.
Patient Results
Characteristics of Patients Screened The EADRSI was deployed to help address the eye care needs of diabetic patients served through California's safety‐net clinic system. Although there were regional and local differences in some characteristics of the patient base, the EADRSI was reaching patients who stood to benefit greatly from this program. Their average age was just over 53 years, with the oldest person screened being 101 years old.28 Females accounted for nearly 60% of all screens, and most (77%) of the patients screened were identified as Latin American, with smaller proportions identified as Caucasian (8%) or Asian (7 %).29
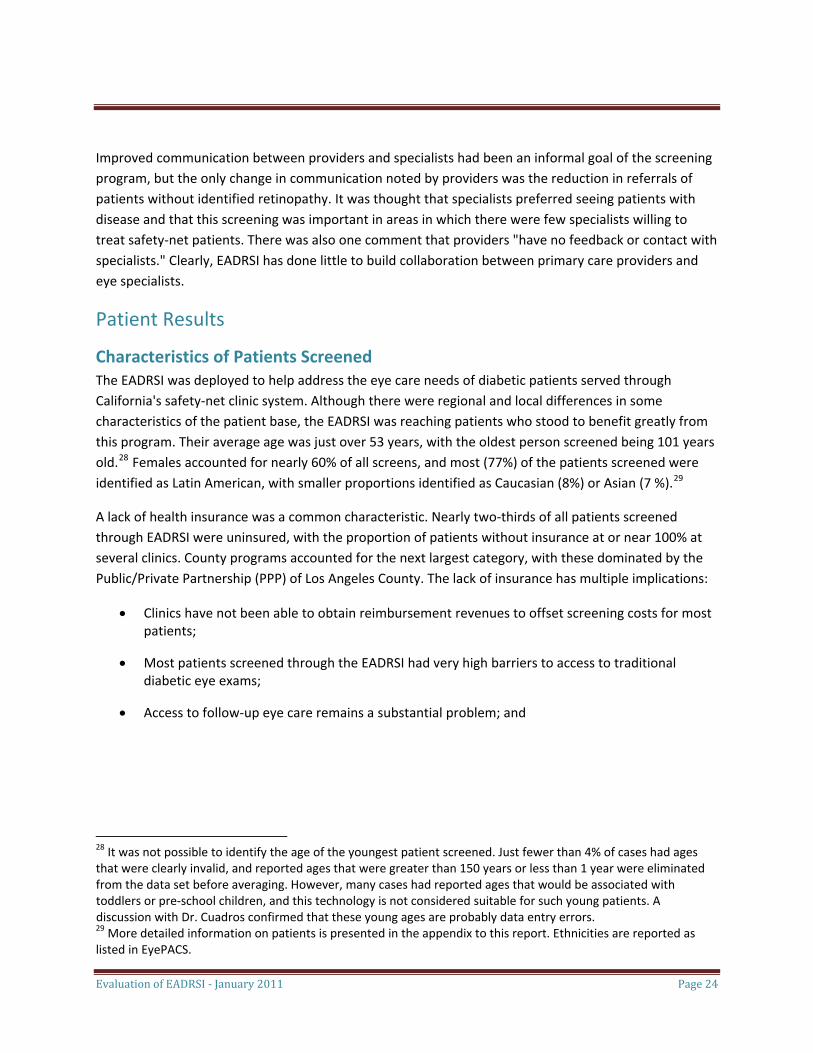
A lack of health insurance was a common characteristic. Nearly two‐thirds of all patients screened through EADRSI were uninsured, with the proportion of patients without insurance at or near 100% at several clinics. County programs accounted for the next largest category, with these dominated by the Public/Private Partnership (PPP) of Los Angeles County. The lack of insurance has multiple implications:
• Clinics have not been able to obtain reimbursement revenues to offset screening costs for most patients;
• Most patients screened through the EADRSI had very high barriers to access to traditional diabetic eye exams;
• Access to follow‐up eye care remains a substantial problem; and
28 It was not possible to identify the age of the youngest patient screened. Just fewer than 4% of cases had ages that were clearly invalid, and reported ages that were greater than 150 years or less than 1 year were eliminated from the data set before averaging. However, many cases had reported ages that would be associated with toddlers or pre‐school children, and this technology is not considered suitable for such young patients. A discussion with Dr. Cuadros confirmed that these young ages are probably data entry errors. 29 More detailed information on patients is presented in the appendix to this report. Ethnicities are reported as listed in EyePACS.
Evaluation of EADRSI ‐ January 2011 Page 25
• Many clinics were emphasizing screening through telemedicine to their uninsured patients while referring patients with public insurance to eye specialists for traditional diabetic eye examinations.30
Uninsured66%
Medi‐Cal5%
Medi‐Medi4%
MediCare3%
Private3% County
16%
Other Payer3%
Medical Coverage for EADRSI Patients
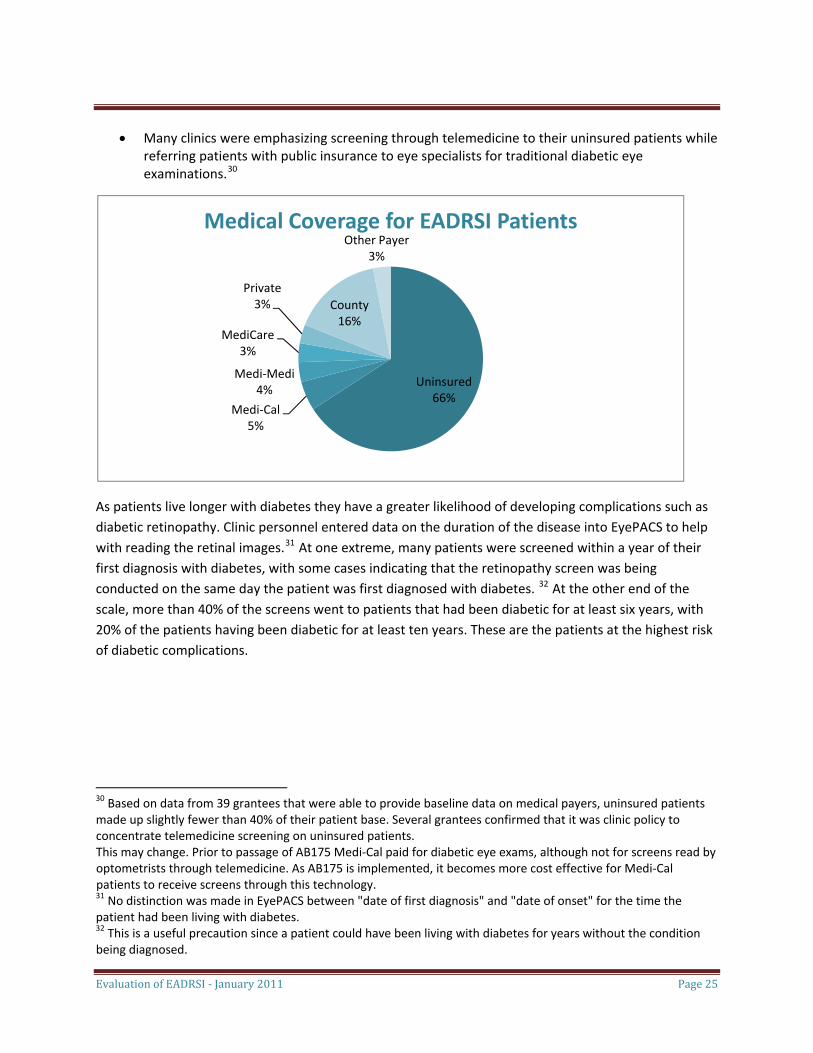
As patients live longer with diabetes they have a greater likelihood of developing complications such as diabetic retinopathy. Clinic personnel entered data on the duration of the disease into EyePACS to help with reading the retinal images.31 At one extreme, many patients were screened within a year of their first diagnosis with diabetes, with some cases indicating that the retinopathy screen was being conducted on the same day the patient was first diagnosed with diabetes. 32 At the other end of the scale, more than 40% of the screens went to patients that had been diabetic for at least six years, with 20% of the patients having been diabetic for at least ten years. These are the patients at the highest risk of diabetic complications.
30 Based on data from 39 grantees that were able to provide baseline data on medical payers, uninsured patients made up slightly fewer than 40% of their patient base. Several grantees confirmed that it was clinic policy to concentrate telemedicine screening on uninsured patients. This may change. Prior to passage of AB175 Medi‐Cal paid for diabetic eye exams, although not for screens read by optometrists through telemedicine. As AB175 is implemented, it becomes more cost effective for Medi‐Cal patients to receive screens through this technology. 31 No distinction was made in EyePACS between "date of first diagnosis" and "date of onset" for the time the patient had been living with diabetes. 32 This is a useful precaution since a patient could have been living with diabetes for years without the condition being diagnosed.
19.4%
9.7%8.1%
6.7%8.8%
23.5%
10.8%
5.4%3.8% 3.8%
0.0%
5.0%
10.0%
15.0%
20.0%
25.0%
1 year or less
2 years 3 years 4 years 5 years 6‐10 years 11‐15 years
16‐20 years
More than 20 years
Not diabetic
Duration of Diabetes
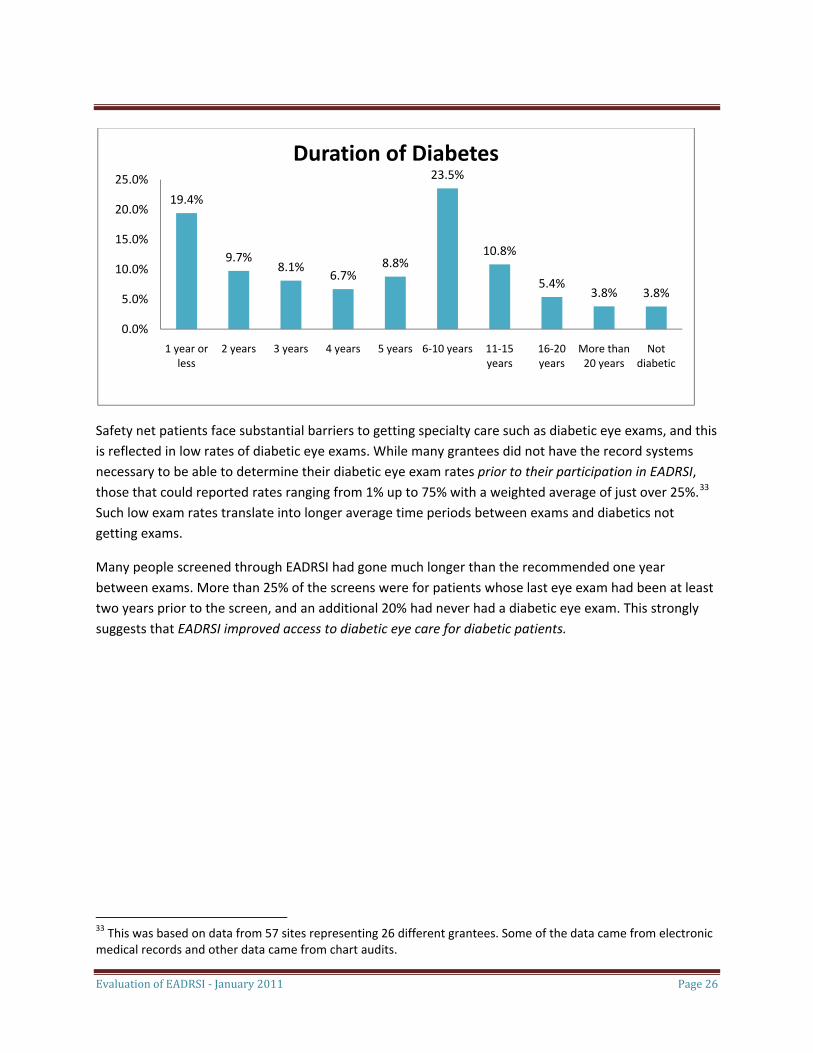
Safety net patients face substantial barriers to getting specialty care such as diabetic eye exams, and this is reflected in low rates of diabetic eye exams. While many grantees did not have the record systems necessary to be able to determine their diabetic eye exam rates prior to their participation in EADRSI, those that could reported rates ranging from 1% up to 75% with a weighted average of just over 25%.33 Such low exam rates translate into longer average time periods between exams and diabetics not getting exams.
Many people screened through EADRSI had gone much longer than the recommended one year between exams. More than 25% of the screens were for patients whose last eye exam had been at least two years prior to the screen, and an additional 20% had never had a diabetic eye exam. This strongly suggests that EADRSI improved access to diabetic eye care for diabetic patients.
Evaluation of EADRSI ‐ January 2011 Page 26
33 This was based on data from 57 sites representing 26 different grantees. Some of the data came from electronic medical records and other data came from chart audits.
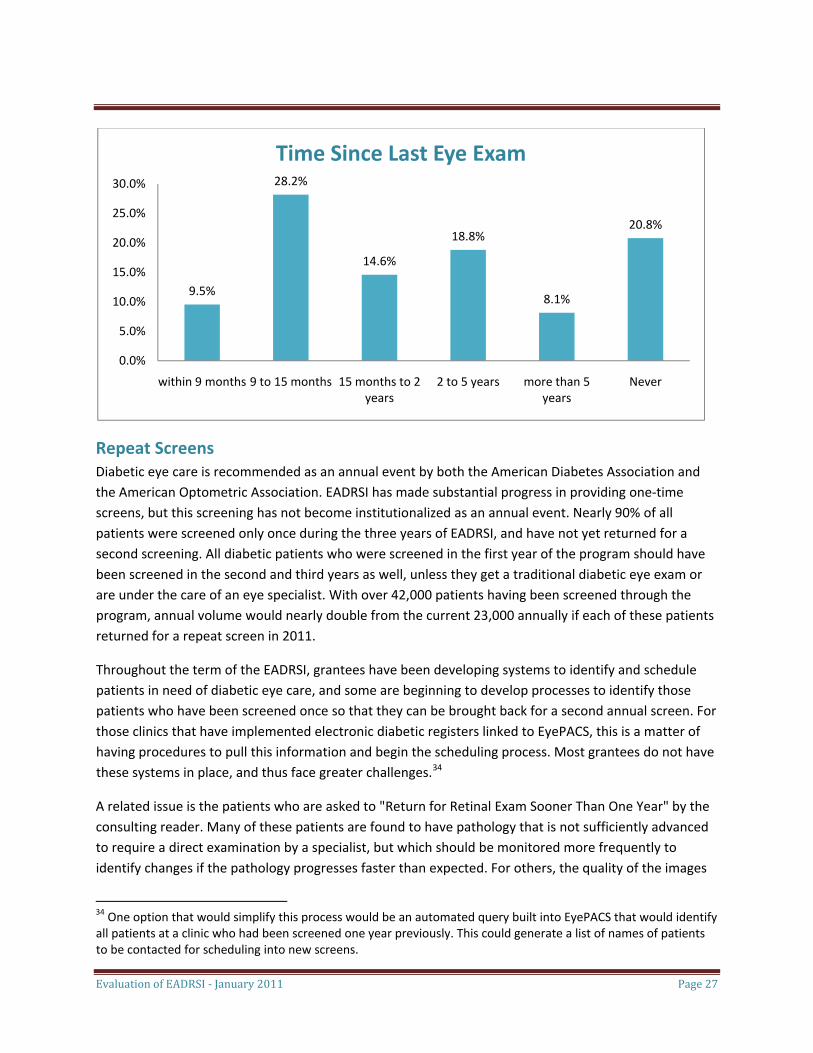
9.5%
28.2%
14.6%
18.8%
8.1%
20.8%
0.0%
5.0%
10.0%
15.0%
20.0%
25.0%
30.0%
within 9 months 9 to 15 months 15 months to 2 years
2 to 5 years more than 5 years
Never
Time Since Last Eye Exam
Repeat Screens Diabetic eye care is recommended as an annual event by both the American Diabetes Association and the American Optometric Association. EADRSI has made substantial progress in providing one‐time screens, but this screening has not become institutionalized as an annual event. Nearly 90% of all patients were screened only once during the three years of EADRSI, and have not yet returned for a second screening. All diabetic patients who were screened in the first year of the program should have been screened in the second and third years as well, unless they get a traditional diabetic eye exam or are under the care of an eye specialist. With over 42,000 patients having been screened through the program, annual volume would nearly double from the current 23,000 annually if each of these patients returned for a repeat screen in 2011.
Throughout the term of the EADRSI, grantees have been developing systems to identify and schedule patients in need of diabetic eye care, and some are beginning to develop processes to identify those patients who have been screened once so that they can be brought back for a second annual screen. For those clinics that have implemented electronic diabetic registers linked to EyePACS, this is a matter of having procedures to pull this information and begin the scheduling process. Most grantees do not have these systems in place, and thus face greater challenges.34
A related issue is the patients who are asked to "Return for Retinal Exam Sooner Than One Year" by the consulting reader. Many of these patients are found to have pathology that is not sufficiently advanced to require a direct examination by a specialist, but which should be monitored more frequently to identify changes if the pathology progresses faster than expected. For others, the quality of the images
Evaluation of EADRSI ‐ January 2011 Page 27
34 One option that would simplify this process would be an automated query built into EyePACS that would identify all patients at a clinic who had been screened one year previously. This could generate a list of names of patients to be contacted for scheduling into new screens.
Evaluation of EADRSI ‐ January 2011 Page 28
was sufficient to rule out immediately threatening pathology, but not sufficient to rule out pathology that could be developing.35
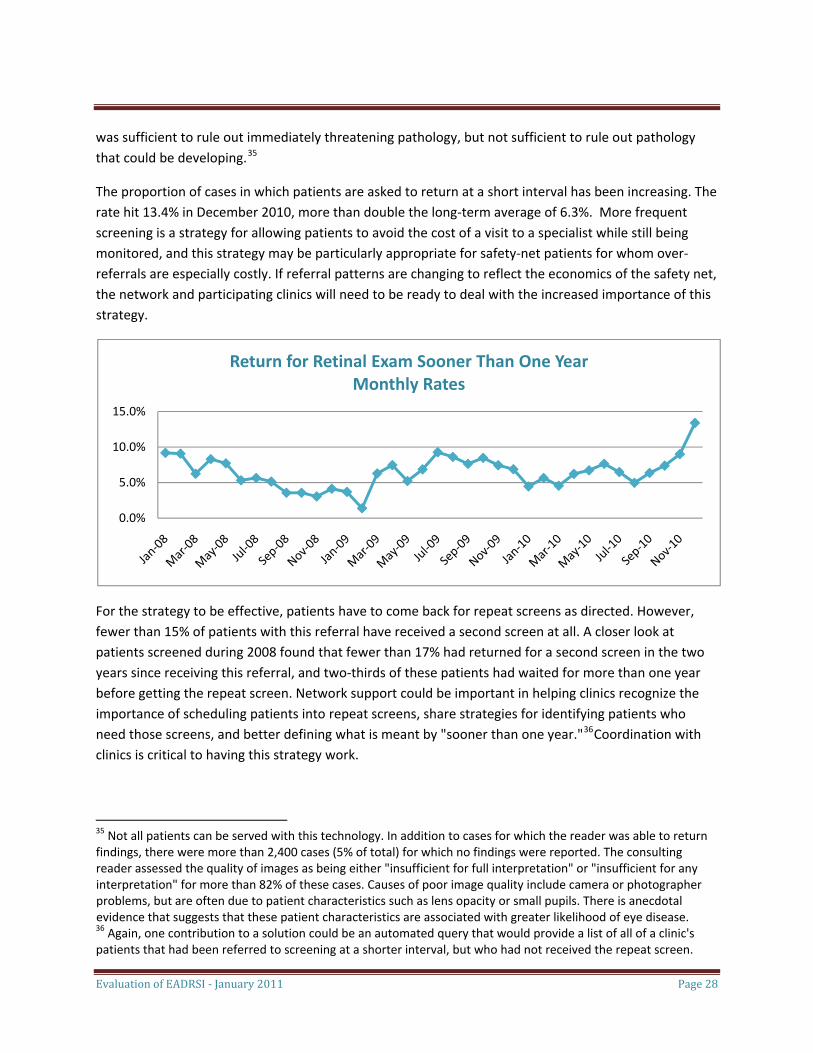
The proportion of cases in which patients are asked to return at a short interval has been increasing. The rate hit 13.4% in December 2010, more than double the long‐term average of 6.3%. More frequent screening is a strategy for allowing patients to avoid the cost of a visit to a specialist while still being monitored, and this strategy may be particularly appropriate for safety‐net patients for whom over‐referrals are especially costly. If referral patterns are changing to reflect the economics of the safety net, the network and participating clinics will need to be ready to deal with the increased importance of this strategy.
0.0%
5.0%
10.0%
15.0%
Return for Retinal Exam Sooner Than One YearMonthly Rates
For the strategy to be effective, patients have to come back for repeat screens as directed. However, fewer than 15% of patients with this referral have received a second screen at all. A closer look at patients screened during 2008 found that fewer than 17% had returned for a second screen in the two years since receiving this referral, and two‐thirds of these patients had waited for more than one year before getting the repeat screen. Network support could be important in helping clinics recognize the importance of scheduling patients into repeat screens, share strategies for identifying patients who need those screens, and better defining what is meant by "sooner than one year."36Coordination with clinics is critical to having this strategy work.
35 Not all patients can be served with this technology. In addition to cases for which the reader was able to return findings, there were more than 2,400 cases (5% of total) for which no findings were reported. The consulting reader assessed the quality of images as being either "insufficient for full interpretation" or "insufficient for any interpretation" for more than 82% of these cases. Causes of poor image quality include camera or photographer problems, but are often due to patient characteristics such as lens opacity or small pupils. There is anecdotal evidence that suggests that these patient characteristics are associated with greater likelihood of eye disease. 36 Again, one contribution to a solution could be an automated query that would provide a list of all of a clinic's patients that had been referred to screening at a shorter interval, but who had not received the repeat screen.
Evaluation of EADRSI ‐ January 2011 Page 29
Pathologies Discovered Screening through the EADRSI was designed to detect different levels of diabetic retinopathy, but other pathologies also were detected and reported to the grantee through the same processes.37 Nearly 20,000 screening patients (39%) were found to have some pathology, with more than 4,600 found to have advanced cases of diabetic retinopathy. Many patients (7%) had more than one pathology detected through the screening process, with some patients having as many as three different pathologies found in a single screen. In all, nearly 25,000 occurrences of pathology have been identified, with nearly 20,000 of these being diabetic retinopathies.
Diabetic retinopathies were organized into a five‐part taxonomy ranging from early manifestations of the disease (mild non‐proliferative diabetic retinopathy) through advanced levels that could be considered to be immediately vision‐threatening (defined in this Initiative as severe non‐proliferative diabetic retinopathy, proliferative diabetic retinopathy, and clinically significant macular edema.) All other pathologies were placed into a single category of "other."38
Most patients (61%) were found to have no pathology. Pathology findings are shown in the graph below. In cases in which multiple pathologies were found for a single case, only the most advanced pathology was counted for this graph. For more than 2,500 patients, that finding was clinically significant macular edema, with another 942 cases of proliferative diabetic retinopathy and 928 cases of severe non‐proliferative diabetic retinopathy.39
37 There was a wide variety of "other" pathology detected, including suspicion of glaucoma, cataracts, and macular degeneration among others. The evaluation did not consider the additional benefit derived from any treatment patients may have had for these "other" pathologies, but to the extent that these other pathologies were successfully treated, there are other benefits of the EADRSI. 38 More data on pathologies is reported in the appendices. 39 Studies have found rates of vision‐threatening diabetic retinopathy ranging from 4% to over 14%. Some of the variation in findings is due to differences in populations, while other differences may result from differences in how "vision threatening" is determined. The population served by EADRSI is predominately Hispanic/Latino, uninsured and with a poor record of diabetic eye care. As such, higher prevalence of diabetic retinopathy could be expected.
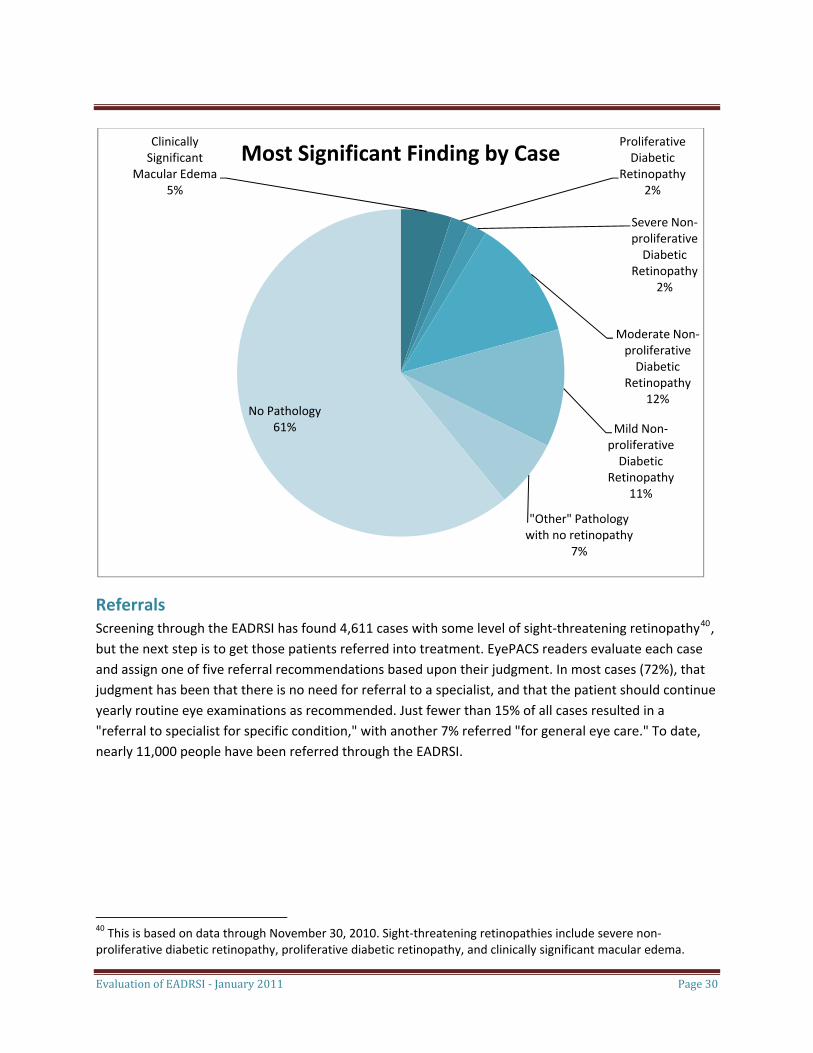
Clinically Significant
Macular Edema5%
Proliferative Diabetic
Retinopathy2%
Severe Non‐proliferative Diabetic
Retinopathy2%
Moderate Non‐proliferative Diabetic
Retinopathy12%
Mild Non‐proliferative Diabetic
Retinopathy11%
"Other" Pathology with no retinopathy
7%
No Pathology61%
Most Significant Finding by Case
Referrals Screening through the EADRSI has found 4,611 cases with some level of sight‐threatening retinopathy40, but the next step is to get those patients referred into treatment. EyePACS readers evaluate each case and assign one of five referral recommendations based upon their judgment. In most cases (72%), that judgment has been that there is no need for referral to a specialist, and that the patient should continue yearly routine eye examinations as recommended. Just fewer than 15% of all cases resulted in a "referral to specialist for specific condition," with another 7% referred "for general eye care." To date, nearly 11,000 people have been referred through the EADRSI.
Evaluation of EADRSI ‐ January 2011 Page 30
40 This is based on data through November 30, 2010. Sight‐threatening retinopathies include severe non‐proliferative diabetic retinopathy, proliferative diabetic retinopathy, and clinically significant macular edema.

Continue Yearly Routine Eye Examinations
72%
Refer Elsewhere (explain in notes)
0%
Refer for General Eye Care
7%
Refer to Specialist for Specific Condition
15%
Return for Retinal Exam Sooner Than One Year
6%
Referrals Through EyePACS
There has been substantial variability in referral rates between sites41, between readers, and over time, although this variability has been reduced as the program has matured. In October 2009 UCB acted to increase the consistency of the readers in the UCB network, and to reduce the proportion of false positives.42 Following this action, overall referral rates have been much more stable and have fluctuated in a range below the average for the first 20 months of the Initiative.43 Even though all readers had been certified by UCB before they began consulting within the network, it may be that periodic re‐calibration is necessary in any screening program if findings are to be independent of the reader.
Evaluation of EADRSI ‐ January 2011 Page 31
41 Over the last 12 months of the Initiative, referral rates ranged from a low of 3.3% at one clinic to a high of 21.1% at another clinic. It should be noted that not all grantees use readers who are part of the UCB network of readers. 42 Any screening program will produce both false positives and false negatives, and the program has to strike the proper balance between these. UCB personnel have indicated that the cost of false positives is particularly high in the safety net. Patients without pathology who are sent to follow‐up care present an unnecessary burden on very scarce follow‐up care resources, and safety‐net patients have fewer resources to pay for unnecessary follow‐up care. 43 All analysis in this evaluation that depends on referral rates uses data from the period after a readers' meeting in October 2009. UCB held this meeting to standardize referral practices among readers and to decrease the rate at which patients were referred to specialists. The decrease in referral rates reflects the economics of the safety net, in which over‐referrals are especially costly.
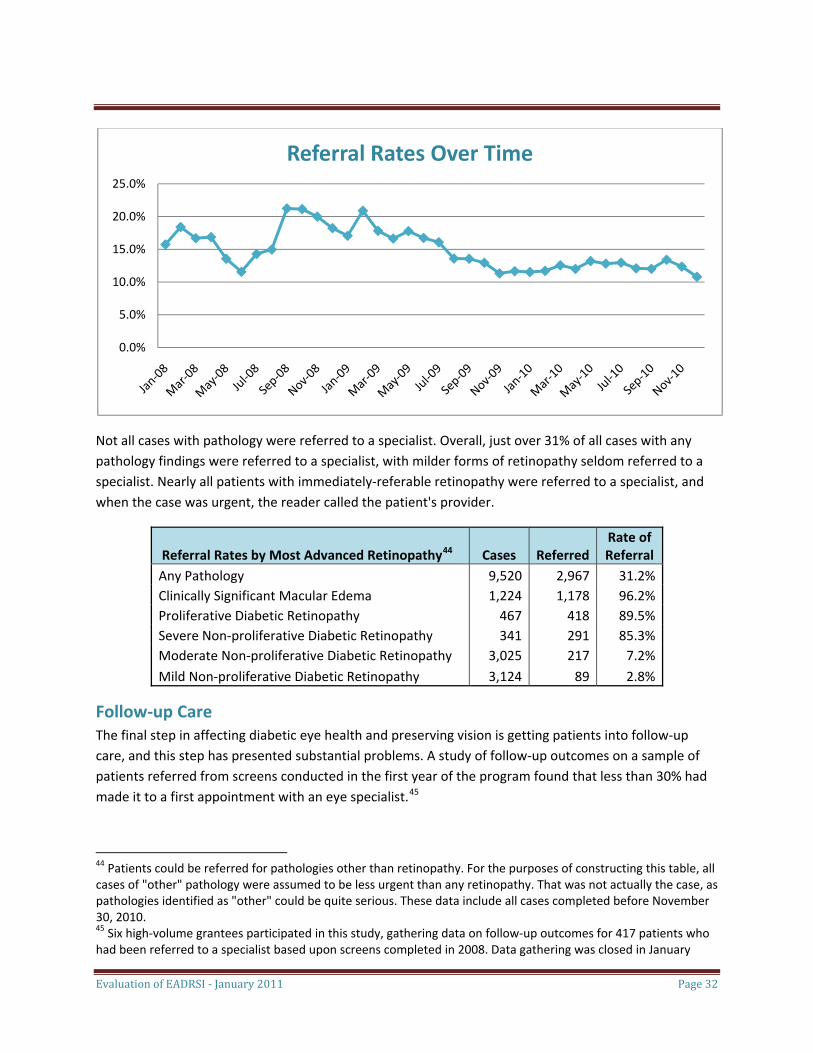
Referral Rates Over Time
0.0%
5.0%
10.0%
15.0%
20.0%
25.0%
Not all cases with pathology were referred to a specialist. Overall, just over 31% of all cases with any pathology findings were referred to a specialist, with milder forms of retinopathy seldom referred to a specialist. Nearly all patients with immediately‐referable retinopathy were referred to a specialist, and when the case was urgent, the reader called the patient's provider.
Referral Rates by Most Advanced Retinopathy44 Cases Referred Rate of Referral
Any Pathology 9,520 2,967 31.2%Clinically Significant Macular Edema 1,224 1,178 96.2%Proliferative Diabetic Retinopathy 467 418 89.5%Severe Non‐proliferative Diabetic Retinopathy 341 291 85.3%Moderate Non‐proliferative Diabetic Retinopathy 3,025 217 7.2%Mild Non‐proliferative Diabetic Retinopathy 3,124 89 2.8%
Follow‐up Care The final step in affecting diabetic eye health and preserving vision is getting patients into follow‐up care, and this step has presented substantial problems. A study of follow‐up outcomes on a sample of patients referred from screens conducted in the first year of the program found that less than 30% had made it to a first appointment with an eye specialist.45
44 Patients could be referred for pathologies other than retinopathy. For the purposes of constructing this table, all cases of "other" pathology were assumed to be less urgent than any retinopathy. That was not actually the case, as pathologies identified as "other" could be quite serious. These data include all cases completed before November 30, 2010.
Evaluation of EADRSI ‐ January 2011 Page 32
45 Six high‐volume grantees participated in this study, gathering data on follow‐up outcomes for 417 patients who had been referred to a specialist based upon screens completed in 2008. Data gathering was closed in January
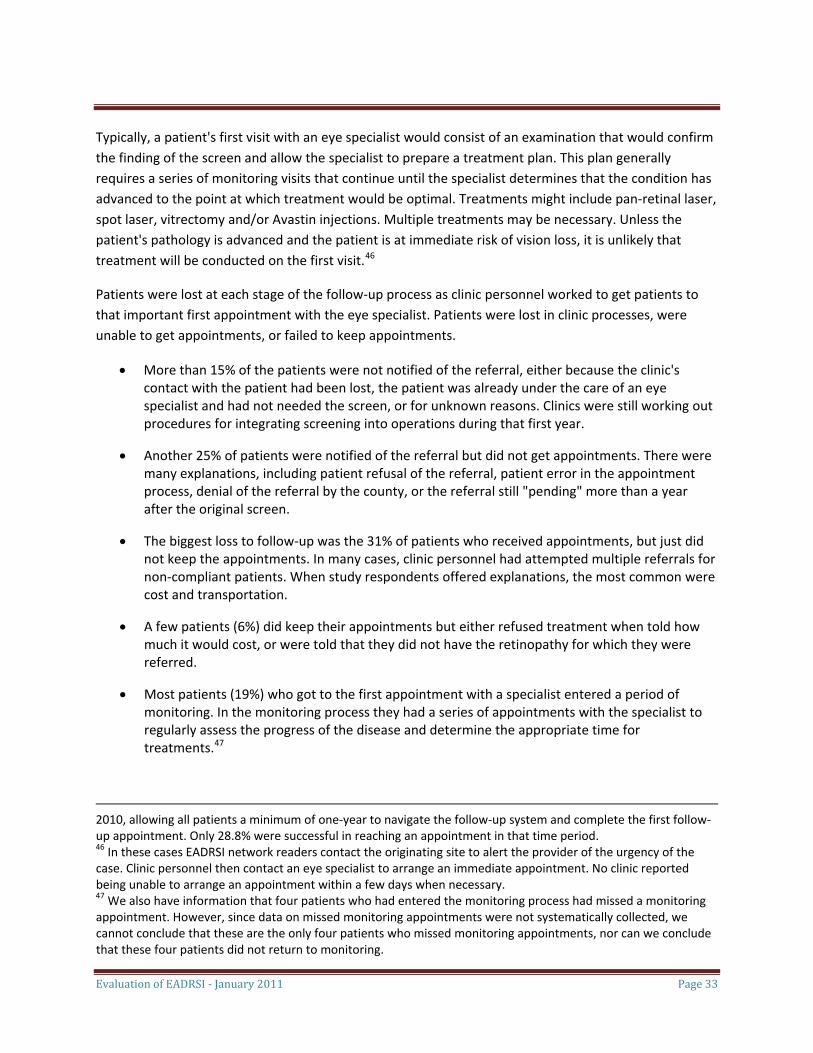
Evaluation of EADRSI ‐ January 2011 Page 33
Typically, a patient's first visit with an eye specialist would consist of an examination that would confirm the finding of the screen and allow the specialist to prepare a treatment plan. This plan generally requires a series of monitoring visits that continue until the specialist determines that the condition has advanced to the point at which treatment would be optimal. Treatments might include pan‐retinal laser, spot laser, vitrectomy and/or Avastin injections. Multiple treatments may be necessary. Unless the patient's pathology is advanced and the patient is at immediate risk of vision loss, it is unlikely that treatment will be conducted on the first visit.46
Patients were lost at each stage of the follow‐up process as clinic personnel worked to get patients to that important first appointment with the eye specialist. Patients were lost in clinic processes, were unable to get appointments, or failed to keep appointments.
• More than 15% of the patients were not notified of the referral, either because the clinic's contact with the patient had been lost, the patient was already under the care of an eye specialist and had not needed the screen, or for unknown reasons. Clinics were still working out procedures for integrating screening into operations during that first year.
• Another 25% of patients were notified of the referral but did not get appointments. There were many explanations, including patient refusal of the referral, patient error in the appointment process, denial of the referral by the county, or the referral still "pending" more than a year after the original screen.
• The biggest loss to follow‐up was the 31% of patients who received appointments, but just did not keep the appointments. In many cases, clinic personnel had attempted multiple referrals for non‐compliant patients. When study respondents offered explanations, the most common were cost and transportation.
• A few patients (6%) did keep their appointments but either refused treatment when told how much it would cost, or were told that they did not have the retinopathy for which they were referred.
• Most patients (19%) who got to the first appointment with a specialist entered a period of monitoring. In the monitoring process they had a series of appointments with the specialist to regularly assess the progress of the disease and determine the appropriate time for treatments.47
2010, allowing all patients a minimum of one‐year to navigate the follow‐up system and complete the first follow‐up appointment. Only 28.8% were successful in reaching an appointment in that time period. 46 In these cases EADRSI network readers contact the originating site to alert the provider of the urgency of the case. Clinic personnel then contact an eye specialist to arrange an immediate appointment. No clinic reported being unable to arrange an appointment within a few days when necessary. 47 We also have information that four patients who had entered the monitoring process had missed a monitoring appointment. However, since data on missed monitoring appointments were not systematically collected, we cannot conclude that these are the only four patients who missed monitoring appointments, nor can we conclude that these four patients did not return to monitoring.
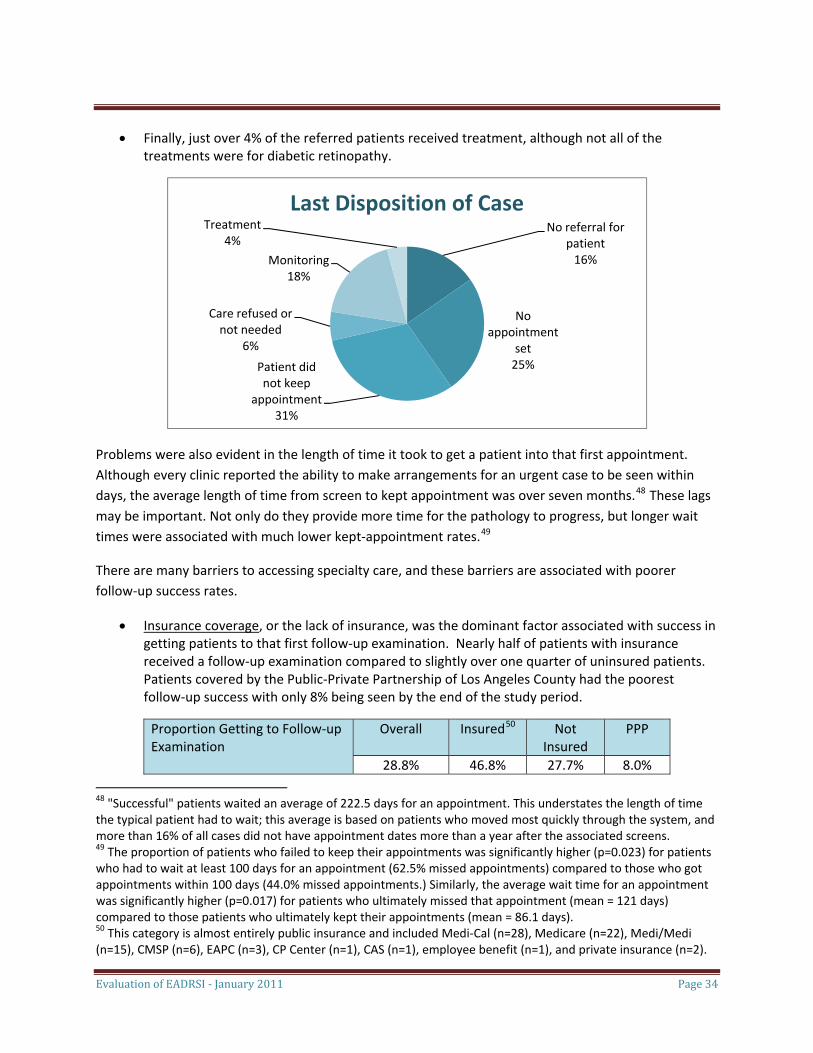
Evaluation of EADRSI ‐ January 2011 Page 34
• Finally, just over 4% of the referred patients received treatment, although not all of the treatments were for diabetic retinopathy.
No referral for patient16%
No appointment
set25%Patient did
not keep appointment
Care refused or not needed
6%
Monitoring18%
Treatment4%
Last Disposition of Case
31%
Problems were also evident in the length of time it took to get a patient into that first appointment. Although every clinic reported the ability to make arrangements for an urgent case to be seen within days, the average length of time from screen to kept appointment was over seven months.48 These lags may be important. Not only do they provide more time for the pathology to progress, but longer wait times were associated with much lower kept‐appointment rates.49
There are many barriers to accessing specialty care, and these barriers are associated with poorer follow‐up success rates.
• Insurance coverage, or the lack of insurance, was the dominant factor associated with success in getting patients to that first follow‐up examination. Nearly half of patients with insurance received a follow‐up examination compared to slightly over one quarter of uninsured patients. Patients covered by the Public‐Private Partnership of Los Angeles County had the poorest follow‐up success with only 8% being seen by the end of the study period.
Proportion Getting to Follow‐up Examination
Overall Insured50 Not Insured
PPP
28.8% 46.8% 27.7% 8.0%
48 "Successful" patients waited an average of 222.5 days for an appointment. This understates the length of time the typical patient had to wait; this average is based on patients who moved most quickly through the system, and more than 16% of all cases did not have appointment dates more than a year after the associated screens. 49 The proportion of patients who failed to keep their appointments was significantly higher (p=0.023) for patients who had to wait at least 100 days for an appointment (62.5% missed appointments) compared to those who got appointments within 100 days (44.0% missed appointments.) Similarly, the average wait time for an appointment was significantly higher (p=0.017) for patients who ultimately missed that appointment (mean = 121 days) compared to those patients who ultimately kept their appointments (mean = 86.1 days). 50 This category is almost entirely public insurance and included Medi‐Cal (n=28), Medicare (n=22), Medi/Medi (n=15), CMSP (n=6), EAPC (n=3), CP Center (n=1), CAS (n=1), employee benefit (n=1), and private insurance (n=2).
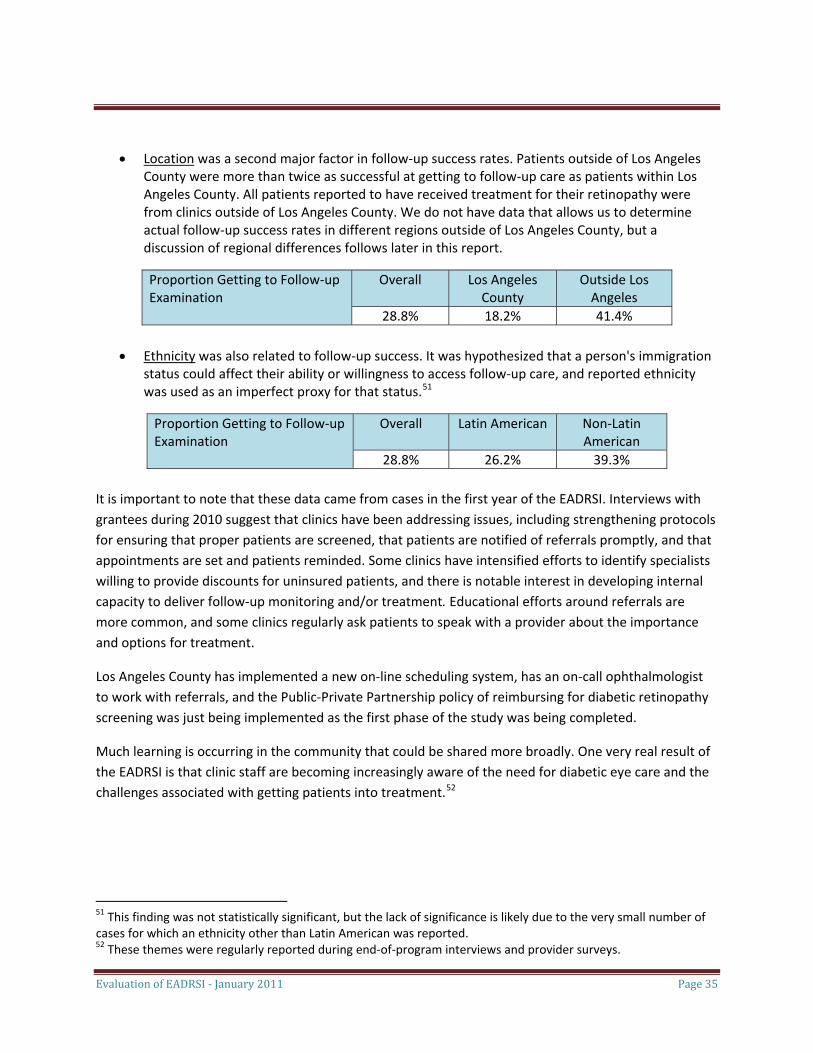
Evaluation of EADRSI ‐ January 2011 Page 35
• Location was a second major factor in follow‐up success rates. Patients outside of Los Angeles County were more than twice as successful at getting to follow‐up care as patients within Los Angeles County. All patients reported to have received treatment for their retinopathy were from clinics outside of Los Angeles County. We do not have data that allows us to determine actual follow‐up success rates in different regions outside of Los Angeles County, but a discussion of regional differences follows later in this report.
Proportion Getting to Follow‐up Examination
Overall Los Angeles County
Outside Los Angeles
28.8% 18.2% 41.4%
• Ethnicity was also related to follow‐up success. It was hypothesized that a person's immigration status could affect their ability or willingness to access follow‐up care, and reported ethnicity was used as an imperfect proxy for that status.51
Proportion Getting to Follow‐up Examination
Overall Latin American Non‐Latin American
28.8% 26.2% 39.3% It is important to note that these data came from cases in the first year of the EADRSI. Interviews with grantees during 2010 suggest that clinics have been addressing issues, including strengthening protocols for ensuring that proper patients are screened, that patients are notified of referrals promptly, and that appointments are set and patients reminded. Some clinics have intensified efforts to identify specialists willing to provide discounts for uninsured patients, and there is notable interest in developing internal capacity to deliver follow‐up monitoring and/or treatment. Educational efforts around referrals are more common, and some clinics regularly ask patients to speak with a provider about the importance and options for treatment.
Los Angeles County has implemented a new on‐line scheduling system, has an on‐call ophthalmologist to work with referrals, and the Public‐Private Partnership policy of reimbursing for diabetic retinopathy screening was just being implemented as the first phase of the study was being completed.
Much learning is occurring in the community that could be shared more broadly. One very real result of the EADRSI is that clinic staff are becoming increasingly aware of the need for diabetic eye care and the challenges associated with getting patients into treatment.52
51 This finding was not statistically significant, but the lack of significance is likely due to the very small number of cases for which an ethnicity other than Latin American was reported. 52 These themes were regularly reported during end‐of‐program interviews and provider surveys.
Evaluation of EADRSI ‐ January 2011 Page 36
Costs and Benefits Results From an economic standpoint, the objectives of the EADRSI were to drive telemedicine screening for diabetic retinopathy to scale and to develop a screening network and infrastructure that would be sustainable without subsidy. Such sustainability requires that all participants in the screening network have the means and intent to continue participation. This section of the report summarizes economic analyses completed from the perspectives of patients, grantees, the state, and the EADRSI network as a whole. Overall, this screening program clearly benefits both patients and state, but the network and participating clinics are struggling with the costs.
The EADRSI was designed to address patient barriers to necessary diabetic eye care, and it did this through reductions in cost and the patient's need to travel, set a separate appointment, and go to an unfamiliar place for care. Still, barriers remain, especially for patients without health insurance. Grantees have approached the remaining barriers in a variety of ways, and since the program serves primarily uninsured patients, grantees have generally been absorbing the additional costs although some costs are passed on to patients. The network itself is being redesigned to operate more leanly, and in limited situations, to pass costs back to clinics. In the bigger picture, even with most of the benefit lost as patients do not access necessary follow‐up care, the state benefits from this program. The state did recently approve funding for MediCal reimbursements for screening such as EADRSI, but additional support would have ample return on investment.
Costs and benefits for clinics Each clinic successfully participating in the EADRSI was able to improve service to its diabetic patients by providing convenient access to screening for diabetic retinopathy, but they incurred costs in doing so. For safety net clinics in the current economic environment, any new cost obligations have to be carefully considered and measured against the benefit they may yield. Two EADRSI grantees have reported that they withdrew from the program because the costs were too high to absorb.53
For the most part, there have been no reimbursements that will help the grantees cover these costs, although there were two important developments during the course of the EADRSI that resulted in additional resources being made available. The Public ‐ Private Partnership of Los Angeles County (PPP) provides funds to participating PPP clinics to help meet the health care needs of uninsured and underinsured residents of Los Angeles County. In the spring of 2008 PPP initiated a policy allowing clinics to bill for their share of PPP funds based on retinopathy screening. A second source of reimbursement became available in November 2010 as the passage of AB175 will allow reimbursements for screening for patients covered by Medi‐Cal Fee‐for‐Service when those cases are read by optometrists. The effect on screening through EADRSI has yet to be determined. Historically, Medi‐Cal has accounted for medical coverage for just over 5% of all individuals screened through EADRSI.
53 Del Norte Clinics withdrew two sites from the program in the spring of 2008 citing an inability to cover costs. The ARCH withdrew a coalition of seven clinics later in 2008.
Evaluation of EADRSI ‐ January 2011 Page 37
Thus, economic analysis from the perspective of the clinics participating in the screening program centers on the costs they incur in delivering this service. For the purpose of this analysis these costs can be divided into three categories based on cost behavior:
• Variable costs of screening. This would include staff time for data entry, image capture, and any patient education delivered during the screening session. Read fees are included here as well.
• Normal administrative overhead costs. These varied widely between grantees, but could include the scheduling of staff, recruitment and appointment setting for patients, quality control and oversight, and referral management.
• Program start up costs. Again, these varied widely between grantees, and could include training and staffing, site preparation, recruitment of specialists, and development of protocols for screening activities from patient recruitment through referral management.
Each of these three cost categories is described in more detail below, but one very significant finding is that there was a great deal of variability in clinic approaches to screening, and thus there is no standard level of cost associated with screening that applies to all clinics.
Variable costs of screening The variable costs of screening were the easiest to assess. The minimum total variable costs are estimated as being just over $22 per screen for a typical grantee. Thus, a grantee that completed the target of 1,000 screens in a year would incur at least $22,000 in read fees and photographer time.
• The largest component is the read fee paid to the consultant to read the images and return findings. Most grantees have reads done by consultants in the UCB network and pay $15 for each completed case. Ten grantees have used excess capacity of in‐house optometrists to read cases,54 and two other grantees have contracted with local ophthalmologists to conduct reads. In these cases the reasoning is that this maintains good relationships that will help get follow‐up care for patients who need it.
• Staff time used in the capture of images is the second incremental cost of screening. Most grantees assigned medical assistants to capture images. Work schedules had to be adjusted so that staff had time to capture images and enter patient data while still conducting their regular duties. A time study used direct observations by UCB field staff to assess the time necessary to complete each case, and found that, on average, each case required 21.1 minutes from set up, through data entry and image capture, and ending with upload and clean up of the space.55
54 This would include Riverside‐San Bernardino County Indian Health, Clinica Msr. Oscar Romero, Queenscare, La Clinica de la Raza, Clinica del Valle de Salinas, Clinicas del Camino Real, San Mateo County, Livingston Clinic, Willow Clinic, and Daly City Clinic. As the Initiative ends, changes are occurring. There is some pressure to use readers from the UCB network, and Livingston has switched to UCB and is now passing much of the read fees on to patients. UC Irvine is in the process of shifting from UCB readers to using their own ophthalmologists to read their cases. 55 UCB field staff observed five experienced photographers at five different, and successful, clinics as they went through the screening process and noted their times as part of a time study designed by the evaluation. Each of
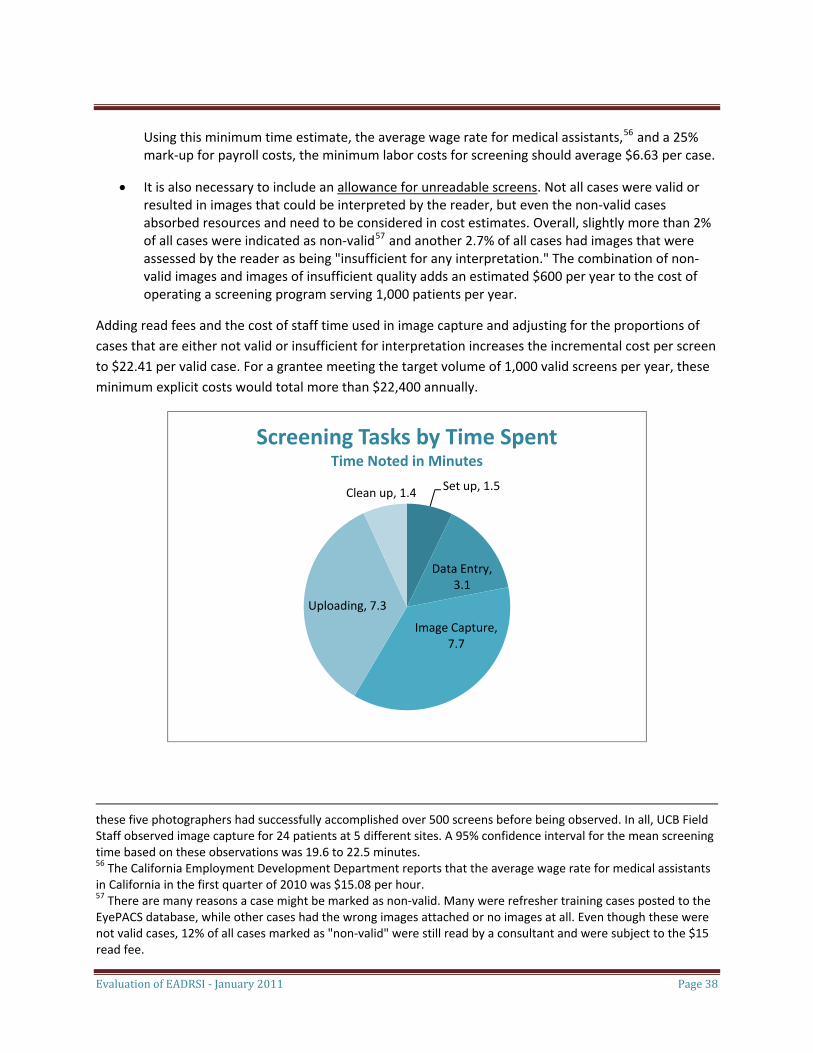
Evaluation of EADRSI ‐ January 2011 Page 38
Using this minimum time estimate, the average wage rate for medical assistants,56 and a 25% mark‐up for payroll costs, the minimum labor costs for screening should average $6.63 per case.
• It is also necessary to include an allowance for unreadable screens. Not all cases were valid or resulted in images that could be interpreted by the reader, but even the non‐valid cases absorbed resources and need to be considered in cost estimates. Overall, slightly more than 2% of all cases were indicated as non‐valid57 and another 2.7% of all cases had images that were assessed by the reader as being "insufficient for any interpretation." The combination of non‐valid images and images of insufficient quality adds an estimated $600 per year to the cost of operating a screening program serving 1,000 patients per year.
Adding read fees and the cost of staff time used in image capture and adjusting for the proportions of cases that are either not valid or insufficient for interpretation increases the incremental cost per screen to $22.41 per valid case. For a grantee meeting the target volume of 1,000 valid screens per year, these minimum explicit costs would total more than $22,400 annually.
Set up, 1.5
Data Entry, 3.1
Image Capture, 7.7
Uploading, 7.3
Clean up, 1.4
Screening Tasks by Time SpentTime Noted in Minutes
these five photographers had successfully accomplished over 500 screens before being observed. In all, UCB Field Staff observed image capture for 24 patients at 5 different sites. A 95% confidence interval for the mean screening time based on these observations was 19.6 to 22.5 minutes. 56 The California Employment Development Department reports that the average wage rate for medical assistants in California in the first quarter of 2010 was $15.08 per hour. 57 There are many reasons a case might be marked as non‐valid. Many were refresher training cases posted to the EyePACS database, while other cases had the wrong images attached or no images at all. Even though these were not valid cases, 12% of all cases marked as "non‐valid" were still read by a consultant and were subject to the $15 read fee.
Evaluation of EADRSI ‐ January 2011 Page 39
This variable cost estimate is conservative. It represents a theoretical minimum, with the data based on experienced photographers efficiently conducting only the necessary functions of image capture. No allowance is included for missed appointments, pupil dilation, or less efficiency based on a relative lack of experience. This estimate also does not include the diabetic education activities reported to be a regular component of the screening process by some grantees. Finally, some grantees faced higher costs due to resource constraints: two grantees reported not having a permanent room for the camera and needing to relocate it for each screen, while another grantee reported upload times exceeding one hour due to competition for bandwidth.
Normal Administrative Overhead Costs End‐of‐program interviews showed that there really is no "normal" administrative overhead, and that each grantee had their own unique approach to administration. There was a core set of administrative activities including program oversight and information flow, but most clinics found that their screening programs were more effective when they invested greater effort. These efforts came at many stages of the program, and could include more aggressive patient outreach and scheduling58, disease management and patient education coordinated with screening findings59, and increasingly involved activities designed to develop options for referrals and to track referral success. 60 Additional administrative time could be spent on patient billing and seeking reimbursements when available.61 Administrative processes are continuing to evolve.
Grantees were prompted to identify the time spent on various administrative tasks, and the variability in their estimates reflected the lack of a standard approach to screening administration.62 Multiple personnel could be involved in these administrative activities, with providers and Medical Directors often taking the lead on the most involved aspects. Some clinics held monthly coordination meetings involving all project personnel. A 10% FTE was a lower‐bound estimate for administrative costs for
58 Grantees were expected to screen patients during a regular encounter with the provider directing the patient into screening during the same visit. This would avoid any need for setting a new appointment, but nearly all grantees found it necessary to implement screening days. While this improved the ability to schedule photographers, it also required running each patient through a separate appointment setting process. 59 One approach to dealing with the low rate at which patients accessed follow‐up care was to require another appointment for patients to be told of their need for follow‐up. Their provider would discuss the pathology and treatment options, and often show retinal images to the patients. 60 Grantees are increasingly investing administrative efforts in getting patients into follow‐up care. These activities are discussed in greater detail later in this report. 61 The passage of AB175 will bring much needed clinic revenue into the screening process, but it will also generate more billing paperwork. 62 Clinics were not asked to track administrative activities that could be assigned to this program. Exploring these costs through the interview process typically started with a low estimate, and as the interview progressed, additional administrative activities were identified and quantified. At the end, respondents agreed that the time estimates were reasonable, but higher than they had expected.
Evaluation of EADRSI ‐ January 2011 Page 40
successful programs that invested a minimum into administrative activities, with some grantees reporting more than 25% FTE on a sustained basis.63
The scale of screening did seem to make a difference in administration. Some of the lowest volume screening operations could be handled by the photographer with little oversight. Even high‐volume operations could be handled by the photographer, but only when the photographer had substantial blocks of time to devote to screening and the associated activities. More typically, higher‐volume operations would be administered as an element of disease management or as a medical service. Few organizations had photographers that could coordinate all aspects of screening from patient recruitment through scheduling for follow‐up care.
Grantee estimates of normal administrative costs varied substantially.64 The minimum estimated administrative load was about 4 hours per week, and this would equate to an estimated $12,900 per year.65 Many grantees invested in a greater variety and/or intensity of normal administrative activities and thus had higher administrative costs, but this represents a typical cost level for relatively straight‐forward administration.
Program Start‐up Costs Additional administrative activity was needed to prepare for screening implementation and through the early screening period in order to get screening established. While it took nearly six months on average to launch a program, most of this time involved little to no program activity. Typically, implementation activities were reported to have lasted two to four months in addition to the normal administrative activity. Estimates of the amount of time invested during the start‐up period varied widely, but typically were expressed as "twice the normal amount of time."66 These activities generally included:
• Initial photographer training and certification. The initial UCB training visit was scheduled for a full day and involved two to four photographers with support staff involved for a portion of the training. Each photographer then completed a minimum of ten screens on volunteer subjects to be certified.
63 The 10% FTE estimate was also a modal value. 64 Patient recruitment to screening could be as simple as a provider directing a patient down the hall, or it could involve searching through patient records to identify diabetic patients who need their eyes checked and arranging special appointments. Some grantees integrated patients into a disease management program as part of the screening process. Many grantees had linked EyePACS with an electronic health record system such as i2i that facilitated easy information flow, but other grantees reported having to convert information into written records before moving it into or out of EyePACS. At some sites, providers nurtured relationships with local specialists to facilitate referral success. Finally, patients who were referred into follow‐up care required additional staff time to be notified of the referral, and grantees undertook a variety of activities to help ensure that the patient got the necessary follow‐up care. 65 This estimate is based on the hourly mean wage of $49.51 for Medical and Health Services Managers as reported by the California Employment Development Division for the first quarter of 2010. Payroll costs were added at 25%. 66 Using the same estimation procedure, this would equate to approximately $6,500 for start‐up costs. Many grantees exceeded this minimum.
Evaluation of EADRSI ‐ January 2011 Page 41
• Planning meetings. Screening may require the coordinated action of photographers, providers, scheduling and reimbursement clerks, case managers and referral staff. It may require new protocols for patient recruitment, information flows, and referral management. The independent development of these activities was followed by identifying appropriate staff and training them in the new duties. These activities absorbed most of the additional administrative time.
• Adapting space for screening. Screening requires a small room with Internet access and the ability to be kept dark. Minor adaptation is all that is generally needed, although some grantees have had to do more work to develop a proper room for screening. Space is at a premium for many safety‐net clinics, and some continue to deal with space issues.67
• Recruitment of specialists. Most grantees did not go undertake this activity, but several did report canvassing local eye specialists to identify best prices for follow‐up care, and making arrangements for referrals.68
In most cases, these implementation activities were not limited to the initial launch period, with new administrative activities associated with new challenges in the program. Many grantees are now putting additional efforts into managing referrals and bringing patients back for repeat screens. Most have changed their initial patient recruitment strategies. Others have linked EyePACS to EHRs, often as part of EHR adoption. Movement of the camera to a new site has generally involved repeating many of the start‐up activities. Grantees are continuing to invest in making their programs more efficient and effective.
Total Clinic Costs Annual clinic volume ranged from 10 screens up to more than 1,400 screens. Administrative activities varied widely, with some grantees investing more than twice the time invested by others. A few grantees were investing substantial effort into addressing problems such as a lack of access to follow‐up care. Just as there are no standard clinic procedures for screening, there is no simple cost figure that applies to all clinics. However, a clinic that screened 1,000 patients annually, incurred 10% FTE in normal annual administrative costs, and invested 20% FTE for three months of start‐up activities would have invested nearly $42,000 in the first year of the program.
Most grantees asked existing staff to absorb additional duties, both as photographers and as program managers. While this does have the effect of limiting the out‐of‐pocket dollar expenses of running the screening program, it also served to constrain screening volume. Grantees conducting screens during the primary care visit generally reported challenges around photographers balancing multiple demands
67 Two grantees report having the camera on a rolling cart and needing to look for an empty exam room when a screen was scheduled. At another clinic, the camera has been located in an office used by two staff members, and scheduling screening requires additional coordination. 68 Most grantees that recruited specialists early in the program have continued to work with those specialists to maintain good relationships. Thus, these clinics invested more in setting up the screening program, and continue to invest more in ongoing activity.
Evaluation of EADRSI ‐ January 2011 Page 42
on their time. Grantees using screening days generally limited screens to one or two days per week. Program managers with multiple special projects and other demands on their time were more likely to assign lower priority to screening, with many successful programs run by managers with time to dedicate to screening.69
Costs and benefits for patients Screening for diabetic retinopathy has been shown to be one of the most cost‐effective preventive health measures. Once detected, the progress of diabetic retinopathy can generally be arrested with a high degree of success at relatively low cost. If not detected or treated however, the result can be irreversible loss of vision.
The potential benefit should be clear from the perspective of the patient: vision contributes strongly to quality of life and the ability to earn a living. However, long experience with screening for diabetic retinopathy has shown that many patients do not get the recommended screens,70 and a study of follow‐up outcomes has shown that most patients do not access follow‐up care even when they have been informed that they have vision‐threatening pathology.71
Grantees reported several explanations for patients failing to access the proper follow‐up care once they have been diagnosed with retinopathy. The barriers should be familiar to anyone who has worked with the safety net. EADRSI was designed to reduce barriers to the initial detection of pathology, and many clinics have implemented their own efforts to address the barriers. Some of the identified barriers include:
• Diabetic retinopathy generally shows no obvious symptoms until vision is lost. Without obvious evidence of the pathology patients may delay care. Offering screening during the primary care visit catches diabetic patients before the impact of provider recommendation is lost. Many grantees reported that they were achieving improved follow‐up care results by bringing the patient into the clinic to receive their referral, and using this as an opportunity to show the patients their own retinal images and discuss treatment options. Unfortunately, the long wait times for some follow‐up appointments were associated with lower kept‐appointment rates as the effect of motivational efforts appear to have declined over time.72
69 Phase One of the EADRSI had delayed launches as several grantees were simultaneously implementing EHRs and assigned higher priority to those EHRs. Other grantees with implementation delays reported being overwhelmed with other special projects. This effect seems to have been stronger at smaller organizations with fewer resources to devote to special projects. 70 On average, just over 26% of the diabetic patients served by EADRSI grantees were receiving eye care prior to the screening program. 71 Over 70% of a sample of EADRSI cases referred for immediately‐referable retinopathy had still not resulted in the patient being seen by a specialist more than one year after the screen. More than 52% of the patients with appointments for follow‐up care failed to keep those appointments. 72 The study of follow‐up outcomes found that the missed‐appointment rate was 44.0% for patients who had appointments within 100 days of the screen, but 62.5% for patients who had appointments more than 100 days after their screen.
Evaluation of EADRSI ‐ January 2011 Page 43
• The costs of screening, monitoring, and treatment make a difference. This is especially a factor as patients access follow‐up care,73 but fewer safety‐net patients are screened when even a small co‐pay is charged. Respondents report that patients have refused treatment due to costs, and that patients refuse referrals due to cost.74
• Standard barriers to access still apply for follow‐up care. The use of telemedicine for screening is a powerful tool to overcome barriers to the initial detection of pathology, but patients still face barriers to accessing follow‐up care. Discounts for monitoring and treatment exist, but even discounted fees present a substantial barrier for safety‐net patients. Transportation also represents a barrier, especially for patients who have to travel hours for discounted care.
Fees charged to patients Most patients screened through EADRSI (66 %) were uninsured, and little to no reimbursement was available to help grantees cover screening costs.75 Many grantees passed the cost of unreimbursed screening on to patients by charging a small fee for screening. These fees did represent a barrier to access, and some patients were reported to refuse the screen when asked to pay. When a screening fee was in place, these fees ranged from $10 to $25, with fees waived when necessary.
The extent of the effect of these fees on patient demand for screens can be estimated by using data from two sites that used grant funding to cover screening costs, with periods of grant funding alternating with patient charges. In each case, the grantee was able to deliver screens at no charge to patients for several months, charged a $15 fee for nine months when the grant lapsed, and then waived the fees again when grant funding resumed. Screening volume decreased by 40% at each site when patients were charged the fees.76 Demand is sensitive to price.
Average Daily Screening Volume Clinic A Clinic BWithout Fee 1.83 0.64 With Fee 1.11 0.38 Percent Reduction with Fee 39.3% 40.2%
Overall, the EADRSI has been successful in reducing the cost of diabetic eye exams dramatically, but even these reduced costs present a barrier to access in the safety net. Medi‐Cal reimbursements will
73 The study of follow‐up outcomes found that 50.1% of insured patients who were notified of their referral received and kept a follow‐up appointment. For patients who were uninsured or covered by the PPP of Los Angeles County the equivalent rate was only 27.1%. 74 There are limited options for uninsured patients. There are county facilities in some locations, and some organizations that provide free or discounted treatment, but patients generally have to travel long distances. One grantee reported providing up to 50% of the cost of treatment out of their own budget in extreme cases. 75 The next largest category of coverage was county programs dominated by the Public‐Private Partnership of Los Angeles County, but also including smaller proportions of cases covered by CMSP or other county indigent programs. Medical coverage data is based upon entries provided by grantees between March 6, 2009 and August 18, 2009. During this time there were 10,095 screens uploaded, and medical coverage was listed for 6,950 (69%) cases. 76 More in depth analysis is presented in an appendix.
Evaluation of EADRSI ‐ January 2011 Page 44
help, but screening for most patients served by the program will still not be covered. The costs of follow‐up care present even more of a barrier to patients.
Costs and benefits for society The cost effectiveness from a social or state perspective of screening for diabetic retinopathy has been well documented, with studies repeatedly concluding that this approach to screening results in great savings. 77 In addition to the benefit realized by individual patients who complete the process, we have solid evidence that the state itself gains from screening and the resulting reduction in vision loss. In early 2009, CHCF commissioned a study of the benefits that would accrue to the state from the preservation of vision that could be expected from EADRSI activities.78 This study used a Markov model and data from the first 15 months of screening to find that the present value of the expected benefit to the state was in excess of $2,500 per screen over the lifetime of the patient!79 The case was made for more support for this approach to vision preservation strictly on an economic basis, although ideally that support should cover not just screening, but also should cover treatment: follow‐up care has to be completed for the state to benefit.
These findings have been updated based upon new data. The sample size has increased from 5,864 cases to over 50,000 cases. Prevalences found for different retinopathies have changed since the Blue Sky study was completed, at least partially in response to UCB working with readers to further refine protocols in October 2009. There were two immediate outcomes of this meeting: overall referral rates dropped significantly in recognition of the burden of false positives in the safety‐net system, and intra‐reader variation decreased substantially. These data are partitioned into these time periods to reflect that watershed meeting. Prevalence figures in the latter period were used to estimate savings in this evaluation with the belief that these data more accurately represent the actual disease burden in this population. More significantly however, the study of follow‐up outcomes has found that fewer than 30% of referred cases actually got to the first follow‐up appointment. The other 70% of referred cases did not receive the benefit of sight preservation.
Combining these changes and using the original Markov model developed by Newman, we find that the expected benefit has fallen to a more modest $768 per patient screened, or more than $39 million to
77 Many studies have found similar savings from diabetic retinopathy screening programs using telemedicine. See for example (Matz, Falk, Gottinger, & Kieselbach, 1996), (Lairson, Pugh, Kapadia, Lorimor, Jacobson, & Velez, 1992), (Lairson, Pugh, Kapadia, Lorimor, Jacobson, & Velez, Cost‐Effectiveness of Alternative Methods for Retinopathy Screening, 1992), (Javitt & Aiello, 1996), (Javitt, Cost Savings Associated with Detection and Treatment of Diabetic Eye Disease, 1995), and more are reviewed in (National Center for Chronic Disease Prevention and Health Promotion, 2005). 78 The purpose of the report was to better inform the debate over AB175. This bill was passed, and it expanded the definition of store and forward telemedicine to include optometrists in addition to ophthalmologists. The study was done by Matthew Newman of Blue Sky Consulting. 79 (Newman, 2009)The mean benefit was found to be $2,568. When the per‐screen benefit is multiplied by the number of screens completed, the total present value of benefits to the state is in excess of $128 million.
Evaluation of EADRSI ‐ January 2011 Page 45
date even when most of the benefit is lost to follow‐up.80 For most patients, the benefit is lost while screening costs are still incurred, but the benefit of preserving sight for those accessing follow‐up care is more than sufficient to offset the relatively small costs of screening people who will not access the necessary care. The benefit still exceeds the cost of a screen by a factor of 30, so even with more than 70% of the benefit lost to lack of follow‐up care, it is still very much in the interest of the state to support a screening program.
Comparing the estimated net benefit of the screening program with 100% access to follow‐up care with the estimated net benefit with the less than 30% access actually found gives us an estimate for the loss due to the lack of follow‐up care. If 100% of all referred patients were able to access the follow‐up care necessary to preserve their vision and arrest retinopathy, the per‐screen benefit to the state would increase by over $2,000 as more of the benefit was realized. For screens completed to date, this works out to nearly $103 million that will need to be spent by the state over the lifetime of the patients who were screened through EADRSI, but who were not able to access necessary follow‐up care. Any action that increases access to specialty care for these safety‐net patients is likely to have a strong return to the state.
The methodology behind the Blue Sky study was purposely, and appropriately, conservative. While patients were referred to specialists for pathologies other than diabetic retinopathy, benefits considered in the study were limited to those achieved through addressing and treating diabetic retinopathies.81 EADRSI grantees regularly related anecdotes of patients whose diabetic self‐management improved following screening, but the resulting savings are difficult to measure and were not included in the study.82 Savings to the state were limited to avoided costs associated with Medi‐Cal, SSP, IHSS, CAPI, and blindness rehabilitation provided through the Department of Rehabilitation. The study also did not include savings to other levels of government or to programs providing paratransit services, library services, guide dogs or nursing home care. It did not consider benefits to individuals (preserved vision, earning power, and quality of life), benefits to the general economy (preserved productivity and taxes paid), or personal medical costs avoided.
80 Isn't this a great return on the CHCF investment! The same Markov model was used with changes in the prevalence of pathology to reflect changes that had emerged since the Blue Sky study was done. The kept appointment rate found in the 2009/10 Follow‐up Study was then used to estimate the realized benefit. The 28.5% of cases getting to follow‐up care were assumed to get the full net benefit from the Markov model. The other 71.5% of cases were assumed to get the same net "benefit" that Newman estimated for the "no screening" option with the cost of screening added to their costs: in other words, the state would pay for the screen, but would not avoid future costs because the patients would not have the benefit of treatment. No other parameters were changed. 81 In the last year of EADRSI 7.6% of all patients were found to have pathologies other than diabetic retinopathy. Typically, these referrals were for conditions such as suspicion of glaucoma, macular degeneration, optic nerve fibrosis, macular edema, vein occlusions, and many other pathologies. 82 Many grantees showed patients their fundus images as part of the referral process. Seeing photographs of lesions on their own retinas seems to have been a powerful tool to get patients to understand the damage that uncontrolled diabetes was doing to their bodies. Typically the result was improved compliance with referrals to specialists, but there were anecdotes of patients who made dramatic improvements in their diabetic management.
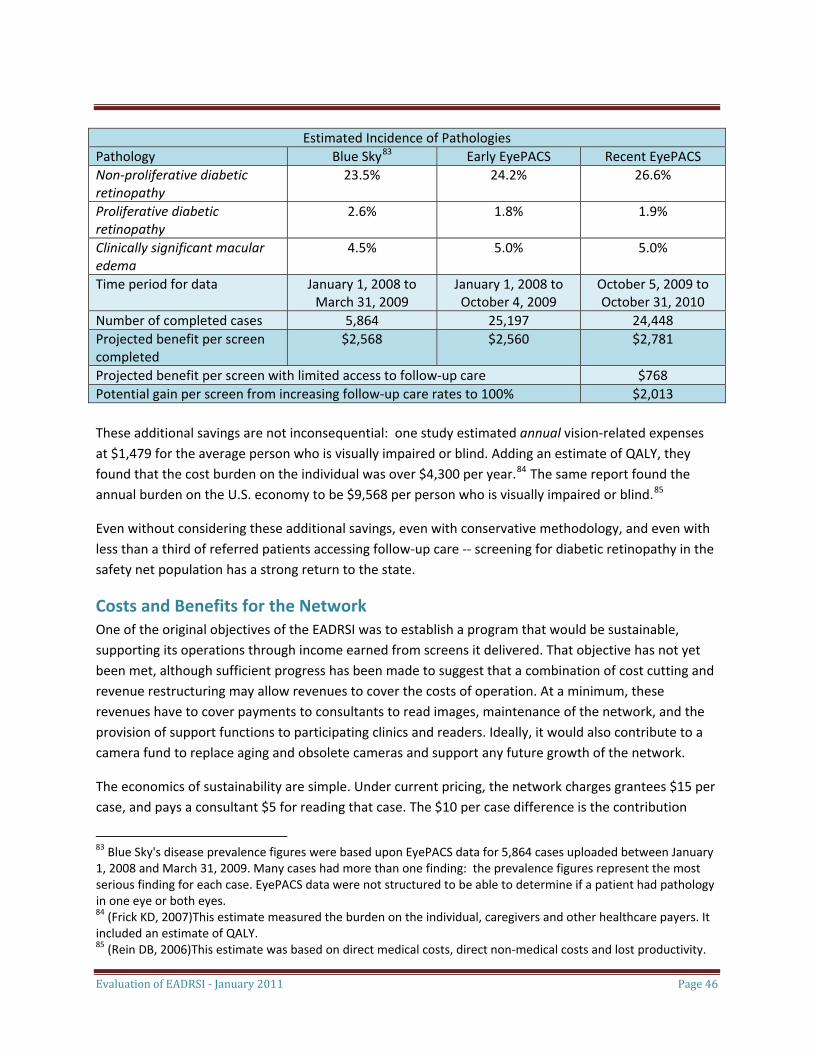
Evaluation of EADRSI ‐ January 2011 Page 46
Estimated Incidence of Pathologies Pathology Blue Sky83 Early EyePACS Recent EyePACS Non‐proliferative diabetic retinopathy
23.5% 24.2% 26.6%
Proliferative diabetic retinopathy
2.6% 1.8% 1.9%
Clinically significant macular edema
4.5% 5.0% 5.0%
Time period for data January 1, 2008 to March 31, 2009
January 1, 2008 to October 4, 2009
October 5, 2009 to October 31, 2010
Number of completed cases 5,864 25,197 24,448 Projected benefit per screen completed
$2,568 $2,560 $2,781
Projected benefit per screen with limited access to follow‐up care $768 Potential gain per screen from increasing follow‐up care rates to 100% $2,013 These additional savings are not inconsequential: one study estimated annual vision‐related expenses at $1,479 for the average person who is visually impaired or blind. Adding an estimate of QALY, they found that the cost burden on the individual was over $4,300 per year.84 The same report found the annual burden on the U.S. economy to be $9,568 per person who is visually impaired or blind.85
Even without considering these additional savings, even with conservative methodology, and even with less than a third of referred patients accessing follow‐up care ‐‐ screening for diabetic retinopathy in the safety net population has a strong return to the state.
Costs and Benefits for the Network One of the original objectives of the EADRSI was to establish a program that would be sustainable, supporting its operations through income earned from screens it delivered. That objective has not yet been met, although sufficient progress has been made to suggest that a combination of cost cutting and revenue restructuring may allow revenues to cover the costs of operation. At a minimum, these revenues have to cover payments to consultants to read images, maintenance of the network, and the provision of support functions to participating clinics and readers. Ideally, it would also contribute to a camera fund to replace aging and obsolete cameras and support any future growth of the network.
The economics of sustainability are simple. Under current pricing, the network charges grantees $15 per case, and pays a consultant $5 for reading that case. The $10 per case difference is the contribution
83 Blue Sky's disease prevalence figures were based upon EyePACS data for 5,864 cases uploaded between January 1, 2008 and March 31, 2009. Many cases had more than one finding: the prevalence figures represent the most serious finding for each case. EyePACS data were not structured to be able to determine if a patient had pathology in one eye or both eyes. 84 (Frick KD, 2007)This estimate measured the burden on the individual, caregivers and other healthcare payers. It included an estimate of QALY. 85 (Rein DB, 2006)This estimate was based on direct medical costs, direct non‐medical costs and lost productivity.
Evaluation of EADRSI ‐ January 2011 Page 47
toward covering costs. Given the fixed costs and camera fund contributions budgeted during the term of the EADRSI, cost/volume/profit analysis has shown that approximately 60,000 screens per year are needed to cover the network's administrative costs, while slightly more than 23,000 screens were completed in the last 12 months of the EADRSI.86 Further complicating the situation, just over 14,000 of these screens were read by consultants within the network.
Three steps currently are being implemented in an attempt to drive the program to sustainability.
• Bring more reads into the UCB network. In one vision, EyePACS would serve as infrastructure for markets for screening, with clinics and consultants free to contract in mutually beneficial arrangements relatively free of bureaucracy. Clinics could use their own staff to read cases87, could contract with local eye specialists to maintain good relationships that could ease problems with referring to follow‐up care, or could shop for lower read fees. Over the course of the EADRSI more than one‐third of all cases were being read by consultants outside of the network. The network has received no contribution from these cases, yet has provided support to all clinics.
Recognizing the lost contribution, UCB is now requiring that all clinics use readers in the network in order to receive free support and the free use of the network's cameras, and title to fundus cameras is being used as a lever to bring reads into the UCB network.88 To the extent that this effort is successful at bringing all reads into the network, it could increase the network's revenue by more than 50%.89 This is unlikely, since many grantees using out‐of‐network readers own their cameras and have their own staff reading images.
86 In 2009 CHCF sponsored the development of a business plan for the network. Developed by MaryKate Scott, the plan used cost/volume/profit analysis and data on the Initiative's administrative costs to calculate a break‐even volume of approximately 60,000 screens per year. EADRSI has completed just over 51,000 over three years, with many of these screens read outside of the network. 87 UCB has provided training and certification for readers. 88 As the EADRSI is drawing to a close, the original program contracts are ending and decisions are being made about each grantee continuing with screening activities. Most significantly, title to the camera is being determined on a case‐by‐case basis. Most grant agreements called for the title to be held by CHCF until the end of the EADRSI, with transfer of title to the grantee dependent on successful participation in the program. The definition of "successful participation" has an element of subjectivity, but is largely based on sustained screening volume. Since only two grantees have hit the original target of 1,000 screens in the last twelve months, most titles are not clear. Less successful grantees are being offered the options of terminating their screening, purchasing the fundus camera, or signing a new MOU stipulating that the camera is provided free‐of‐charge for sites that agree to have cases read by consultants in the UCB network. 89 Currently, 65.6% of reads are cases are completed by readers within the UCB network.
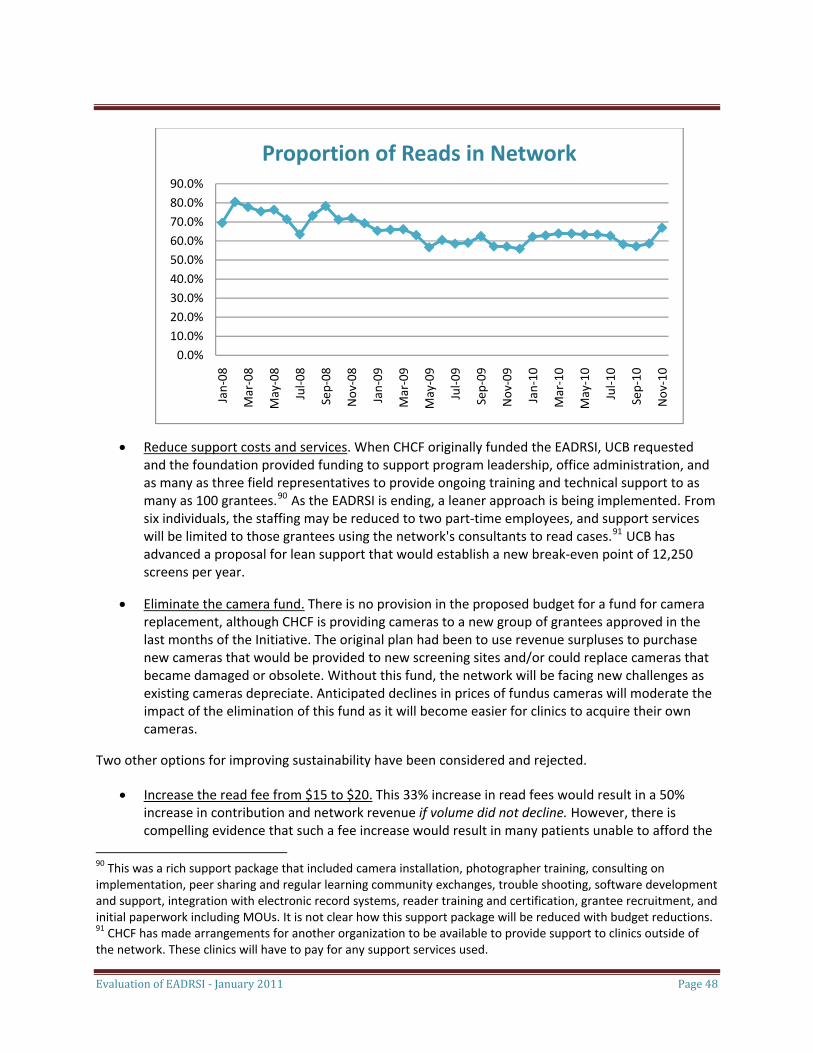
Evaluation of EADRSI ‐ January 2011 Page 48
0.0%10.0%20.0%30.0%40.0%50.0%60.0%70.0%80.0%90.0%
Jan‐08 ‐08
‐08
Jul‐0
8
Sep‐08
Nov
‐08
Jan‐09 ‐09
‐09
Jul‐0
9
Sep‐09
Nov
‐09
Jan‐10 ‐10
‐10
Jul‐1
0
Sep‐10
Nov
‐10
Proportion of Reads in Network
Mar
May
Mar
May
Mar
May
• Reduce support costs and services. When CHCF originally funded the EADRSI, UCB requested and the foundation provided funding to support program leadership, office administration, and as many as three field representatives to provide ongoing training and technical support to as many as 100 grantees.90 As the EADRSI is ending, a leaner approach is being implemented. From six individuals, the staffing may be reduced to two part‐time employees, and support services will be limited to those grantees using the network's consultants to read cases.91 UCB has advanced a proposal for lean support that would establish a new break‐even point of 12,250 screens per year.
• Eliminate the camera fund. There is no provision in the proposed budget for a fund for camera replacement, although CHCF is providing cameras to a new group of grantees approved in the last months of the Initiative. The original plan had been to use revenue surpluses to purchase new cameras that would be provided to new screening sites and/or could replace cameras that became damaged or obsolete. Without this fund, the network will be facing new challenges as existing cameras depreciate. Anticipated declines in prices of fundus cameras will moderate the impact of the elimination of this fund as it will become easier for clinics to acquire their own cameras.
Two other options for improving sustainability have been considered and rejected.
• Increase the read fee from $15 to $20. This 33% increase in read fees would result in a 50% increase in contribution and network revenue if volume did not decline. However, there is compelling evidence that such a fee increase would result in many patients unable to afford the
90 This was a rich support package that included camera installation, photographer training, consulting on implementation, peer sharing and regular learning community exchanges, trouble shooting, software development and support, integration with electronic record systems, reader training and certification, grantee recruitment, and initial paperwork including MOUs. It is not clear how this support package will be reduced with budget reductions. 91 CHCF has made arrangements for another organization to be available to provide support to clinics outside of the network. These clinics will have to pay for any support services used.
Evaluation of EADRSI ‐ January 2011 Page 49
screen.92 The anticipated reduction in screening volume would offset most of the increase in contribution.
• Implement fees for support services. During EADRSI, clinics have received support services as part of their participation, while UCB has borne the costs of those services. An attempt to list a menu of services with fees just large enough to cover costs resulted in the discovery that the total revenue from these services would be a negligible source of income for the network.
A final option to help drive the program to sustainability would be more aggressive building of program volume. Increases in volume could occur through recruiting additional sites, increasing screening volume per site, and/or reducing screening downtime due to technical issues or delayed launches. There are great economies of scale to screening, and strategies for increasing volume are discussed in the Next Steps section of this report.
Lessons Learned For a program to work effectively, the people in the front lines have to care enough about it to make it work. This appears to be the case, shown both in terms of clinic activities designed to optimize the program and overcome challenges, and in terms of responses to end‐of‐program evaluation questions. For the EADRSI, this was assessed through end‐of‐program telephone interviews with program "champions" and with Internet surveys of providers, and with additional information obtained through ad hoc interviews with program personnel during the course of the Initiative.
Program champions remain important. It is an old lesson, but it is clear that an active, engaged and empowered champion at the clinic level is important for screening success. The program champions filled a variety of roles for the grantee. A clinic's screening could be driven by a diabetic case manager, medical director, optometrist, clinic administrator, a dedicated medical assistant or even a small team of individuals. In some cases the champion was also a photographer and so was very familiar with patient contact, while in other cases the champion supervised photographers. Grantees with higher screening volume typically had a champion who was aware of the challenges being faced with the program and who was actively engaged in finding solutions to problems.
There is a great deal of variability in clinic approaches to screening, but the following categories of activities were common to the most successful programs:
• Initial implementation. This could include bringing together photographers, providers, scheduling and referral personnel; developing protocols and procedures for recruiting patients, connecting them with photographers, and routing information; and expediting program paperwork including MOUs and contracts.
92 Analysis is presented in an appendix to this report.
Evaluation of EADRSI ‐ January 2011 Page 50
• Monitoring and refining processes. This could include monitoring screening volume and image quality and taking corrective actions as needed, addressing emerging challenges and opportunities by restructuring, or placing a request for technical support when needed . For example, most grantees shifted from screening patients during a primary care visit to scheduling screening days, and a few have begun working on developing processes to identify patients needing repeat screens.
• Extending the program. Many champions leveraged the screening program into expansions of disease management activities, diabetic education efforts, referral management or relationships with local specialists. For example, several grantees were working on developing internal capacity to provide treatment for retinopathy.
In some of the less successful programs the person identified as the "champion" had no authority over screening operations, and had to rely on cooperation from providers and clinic management to allocate resources or change procedures.93 Other champions felt overwhelmed by a number of special projects being implemented in addition to retinopathy screening.94 Some champions felt that the screening program had been added to their responsibilities without their interest, generally when grant writing was external to operations or the initiating staff had left the organization. It may be helpful if future RFPs asked grantees to identify a program champion and that champion's responsibilities and authority.
Flexibility in scheduling is needed for point‐of‐care screening. At a minimum, screening requires a trained photographer who is able to devote 20 to 30 minutes of uninterrupted time to each patient. UCB recommended that each site have between two and four trained photographers to cover vacation time and provide continuity in case of staff turnover. Many grantees had four trained photographers, although it is difficult to generate the screening volume necessary to keep four photographers well practiced.
Typically, grantees assigned medical assistants to this task. Medical assistants have patient contact skills, frequently are fluent in the languages needed to communicate with patients, and have the background to understand and explain diabetic eye disease. Many grantees also reported that medical assistants were excited to have such a major role in a diabetes management effort.
The challenge with assigning medical assistants to this role is that there are many other demands on their time and they cannot regularly drop other patient duties to conduct a screen. One common solution was to establish screening days on which a medical assistant would be freed from other duties. Patients would be scheduled into those days for a screen, generally without any other medical care
93 For the purposes of these interviews, champions were identified by UCB and through the evaluation's earlier work with clinics. Not all champions responded to request for interviews, while others recruited other members of the screening team to participate in interviews. 94 Several sites were implementing EHRs during the course of the EADRSI. Delays in the launch of some screening operations were attributed to the competition for scarce project management resources.
Evaluation of EADRSI ‐ January 2011 Page 51
provided at that time.95 One clinic was exploring how to schedule diabetics into their primary care visits on screening days so that they could do "point of care" screening while being able to block off screening time for photographers.
An alternative solution employed other personnel to capture images either as primary photographers or as backups in case the medical assistant was not available. The key was that these other personnel would have duties that could be postponed. Examples included case managers, diabetes educators, technicians, or referral clerks. One clinic has their office manager trained to take photos. Another clinic has patients meet with a nurse practitioner for diabetic education during screening visits, and is thus able to bill for an encounter.
Moving the camera is one strategy for reaching more diabetics, but it presents challenges. Sharing one camera between multiple locations is one strategy for increasing the number of diabetic patients that can be screened using a single camera. This strategy is likely to become more important over time if the screening program is going to expand beyond the current pool of organizations with large clinics serving large numbers of diabetics. Several grantees have attempted this, and the results were mixed.
• Day trips. At least four grantees regularly moved the camera to other sites for screening days. The photographer and camera would move together with no down time. None of these grantees reported any challenges with this approach.
• Moving within a clinic system. At least three grantee organizations with multiple sites moved the camera between sites, leaving the camera at each site for a period of two to four months. This was more challenging, since it was not feasible to move the photographer with the camera for this period of time. New photographers had to be trained, and screening had to be worked into staff schedules. Two of the organizations that tried this were put on probation for low volume associated with the moves. The key to success seems to be internal capacity to train photographers.
• Sharing between organizations. Two grantee coalitions formed to share a single camera. Although this approach may be necessary in rural areas, it did not work. One coalition terminated screening before moving the camera, and the other coalition was put on probation twice. Although this coalition was able to screen large numbers of patients once the camera was set up, coordination and training problems led to downtime of multiple months each time the camera was moved.
95 The "screening day" approach does establish a maximum number of screens that can be completed in any period of time. An efficient photographer can screen a patient in 25 minutes, or 19 patients in one eight‐hour day if there are no missed appointments or other efficiency losses. Grantees reported scheduling between two screening days per week to two screening days per month. Grantees also reported missed appointment rates between 10% and 50%.
Evaluation of EADRSI ‐ January 2011 Page 52
• Mobile unit. One grantee had a mobile diabetes unit in operation at the beginning of the EADRSI. This mobile unit had been used for retinopathy screening before, and there were no difficulties associated with using it to bring screening out to remote desert regions through this Initiative although volume fell well short of the grantee average. A second grantee had proposed using a mobile unit for screening, but abandoned this approach before implementation due to concerns about the patient volume that could be screened.
Moving the camera has potential to spread the benefit of screening over a wider geographic area and prevent more blindness. Sharing a single camera between more than one organization also has the potential to make lower total screening costs for smaller organizations, and may be necessary if this screening is to reach rural areas. Realizing these potentials takes work, and requires that a trained photographer accompany the camera, or that there be the capacity to quickly train photographers at the new site.
Technical support is important. Program staff at UCB were the main source of technical support for the program, and this support has been well appreciated by grantees and continues to be requested.96 Information on grantee opinions of technical support needs was gathered in interviews conducted in the first months of 2010. Some of the highlights include:
• Overall satisfaction with support. Grantees' impressions of past and current support efforts covered the range from "difficult to access" to "excellent", with the reported difficulties all in the past. Turnover in UCB field support positions seems to have left some grantee problems unresolved and the reason for lack of resolution unexplained at the time.
• Support for pre‐screening activities. Before images can be captured grantees must bring together appropriate patients, photographers and space. This stage of screening has received little to no support. Clinics have had to develop processes themselves and would appreciate opportunities for sharing best practices. While monthly Learning Community calls were universally praised, they were also seen as too short for active exchange of this depth and breadth.
• Support for direct screening activities. This stage was defined as the activities that take place in the room with the camera, focusing primarily on image capture, working with patients, and the technology. UCB support activities have focused on this stage of the grantees' operations.
• Grantees agreed strongly that the initial photography training had been good preparation for using the camera. There is interest in advanced training, including dealing with patient issues such as small pupils, pigmented retinas, short attention spans, inability to focus, and falling asleep during screening. Covering these topics during initial photographer training would have been too much information at that time, but photographers with some experience could benefit from talking with very experienced photographers.
96 Camera repairs have been provided by a camera distributor under warranty.
Evaluation of EADRSI ‐ January 2011 Page 53
• Several clinics reported technical problems with equipment. Stories ranged from simple problems that were quickly resolved to a cascade of problems presenting sequentially and disrupting screening for long periods of time. There was variation in the degree to which clinics were proactive about finding solutions or asking for assistance.
• Some clinics reported having had refresher training on photography. This was reported by one site as having been very valuable, and by another site as having little value.97 Two sites reported not knowing this was available.
Most grantees have their programs operating well, but appreciate the safety net provided by support. A few grantees expressed a current need for technical support that had not been reported to UCB: this included provider pep talks, additional photographer training, and minor camera issues. When asked for suggestions for improving the program, providers offered suggestions that were consistent with enthusiasm for the program and an interest in improving outcomes for their patients. The most common was a request for "assistance in referrals for abnormal findings in patients without health insurance."
Everything takes longer than expected. Program managers, clinicians, and consulting readers all depend on the timely progress of others. Delays can affect screening volume, provider satisfaction, and patient follow‐up care. Realistic time benchmarks need to be established for efficient operation.
Program launches took an average of nearly six months (176 days) from the approval of a grantee's participation in EADRSI to their first successful screen. Generally the delays were administrative, as contracts and MOUs had to be signed and staff had to be scheduled for training.
The turnaround time between the upload of a screen and the reader returning findings averaged 2.3 days despite a policy of a two‐day maximum turnaround, and a goal of all screens returned within 24 hours. Nearly 12% took more than 5 days, and 191 cases took more than one month to complete. There were 5 cases that took longer than 300 days. It required regular UCB intervention to ensure that cases did not sit unread for too long.98
Image capture required over 21 minutes per patient for experienced photographers, although some grantees reported planning for ten minutes per patient. The difference is substantial, as it would actually require 44 eight‐hour screening days per year to hit the target volume of 1,000 screens, while sites relying on the estimate of ten minutes per screen would budget for 21 screening days per year.
97 The second site received its refresher training during a period of UCB Field Staff turnover. 98 There was a very real question of the authority and responsibility of the network to ensure that cases were completed promptly, especially when the case was being completed as part of an independent contract between a clinic and a consultant who was not part of the network. The network did occasionally communicate a reminder to the reader, and began assigning readers to clean up cases that had sat unread for too long.
Evaluation of EADRSI ‐ January 2011 Page 54
The time between screen and the first kept appointment for follow‐up care was 222.5 days on average. These were the patients who were successful at accessing care, including those with urgent cases. Wait times were longer in Los Angeles County, with an average time between referral and appointment of 105 days in Los Angeles County compared to 40 days outside, and with nearly 33% of all referred cases in Los Angeles County still "pending" more than a year after the screen. Consulting readers need to take these wait times into account when making referrals.
Patients recommended to "return for retinal exam in less than one year" took 387 days on average to return. Nearly 9% of all patients were asked to return for another screen in less than the recommended one‐year interval, but less than 15% of these patients had completed a second screen by the end of the program. There needs to be improvement for this referral option to be effective.
Other lessons and promising practices. Grantees shared additional lessons based upon their experience at addressing challenges they had encountered.
• Outreach to health fairs and other organizations is another strategy for reaching more patients. A grantee has to be able to move the camera efficiently, and follow‐up becomes complicated. This approach has been limited, but has accounted for at least 651 screens. It may also help a clinic develop new markets and recruit additional patients.
• A combination of screening days and point‐of‐care screening seems to work best to schedule screens. Diabetic patients can be referred directly to screening during a regular encounter, but this works only if both a photographer and a screening space are available. Alternatively, the patient could be asked to return for a screening day when space and a photographer are available. While each approach has disadvantages, most grantees report using a combination to take advantage of every screening opportunity.
• Patients can be recruited through direct provider identification or through a disease management approach. The EADRSI was originally designed to have primary care providers identify diabetic patients needing eye care and refer them into screening. A more aggressive approach was implemented by some grantees that assigned diabetic management to an individual or team. Retinopathy screening would be just one element of diabetes care systematically managed through this approach.
• Diabetic registries and diabetic check sheets are important tools in recruiting patients to screening. Many grantees reported upgrading their diabetes management efforts. For some, this meant developing a diabetic check sheet that would be placed in every chart so that the provider was reminded of the need for regular diabetic care. Other grantees implemented or expanded diabetic registers, often becoming able to systematically track services for diabetics for the first time. All reported substantial gains in efficiency and quality of care from these approaches.
Evaluation of EADRSI ‐ January 2011 Page 55
• Regular team meetings can help maintain forward progress. Some grantees held monthly team meetings to address issues of quality, dealing with patients, and coordination of services. These meetings also seemed to have been associated with higher team morale.
• There are economies of scale to screening. Simply put, bigger is better. Administrative and camera costs can be spread over more screens. More practice leads to more efficient photography and patient management. An active program champion is able to build more screening volume, and more volume may also increase the ability of the champion to effect necessary changes.
Recommendations for the Future As the EADRSI draws to a close, further development is necessary to consolidate the gains achieved over the last five years. This report identifies four major areas for this further development, with each representing an extension and refinement of original goals. Two of these areas are associated with developing mechanisms to get more patients into care, and the other two regard strengthening the overall network.
Get more patients into repeat screens.
The EADRSI has emphasized getting diabetic patients into their first screen, relying on clinic efforts to manage patient traffic. Certainly, getting patients into that first screen is important, but a one‐time approach to screening is not sufficient to meet care guidelines. Two different needs for repeat screens are emerging, and several grantees are beginning to recognize the need to develop approaches to get patients scheduled into repeat screens. Without such a dedicated approach to identifying patients needing repeat screening, this has not been happening.
• Current guidelines call for diabetic patients to be screened annually, but nearly 90% of all patients screened through EADRSI have been screened only once in the three years the Initiative has been operating. Some patients will have been referred into follow‐up care and will not need to be screened if they are accessing that care, and clinics will have lost contact with other patients and will not be able to schedule them into screens. EADRSI is getting people screened, but has yet to establish eye care as an annual event.
• Many screens resulted in the reader referring the patient to "return for retinal exam sooner than one year." There were two reasons for such a recommendation: 1) there were signs of pathology that was not sufficiently advanced to justify an appointment with an eye specialist but which did require monitoring, and 2) image quality was sufficiently poor that the reader could
Evaluation of EADRSI ‐ January 2011 Page 56
rule out advanced pathology, but could not rule out less advanced pathology. To date, more than 4,500 cases have had such a recommendation.99
While this approach enables the patient to be tracked without the need to access direct care by an eye specialist, its effectiveness does depend on getting those patients into repeat screens earlier than one year. Unfortunately, fewer than 15% of patients with such a recommendation have had a repeat screen. An analysis of the cases with this recommendation uploaded in 2008 found a slightly better compliance rate (16.8%) but also found that two‐thirds of these cases had an interval of more than one year between the first and second screens and fewer than 6% had returned within one year. On average, the elapsed time between the two screens was 387 days for those patients who did return.
In an ideal system, screening data would be used to identify those patients due for a repeat screen. The screening data exist within EyePACS, but there is no systematic way for these data to be accessed and used at the clinic level short of case‐by‐case analysis. Development and sharing of procedures to identify patients needing repeat screens could improve eye care and boost screening volume.
Build volume to support sustainability and growth.
Proposed cuts in the budget may result in a sustainable network, but even if the administrative and policy changes are successful in allowing lower network costs to be covered by existing revenues, an increase in screening volume would provide funds that could be used to increase technical support, purchase new cameras, or even lower read fees at some point in the future.
Three distinct strategies could be employed to increase screening volume: add more screening sites, increase volume per site, and decrease downtime. Increased screening volume will provide more of the resources necessary to accomplish these strategies.
Additional screening sites.
Recruiting new sites has become more difficult as the pool of grantees with large numbers of diabetics is finite. New strategies allowing smaller clinics to participate are likely to be necessary. Camera sharing and movement of cameras between sites have been tried to varying levels of success, and may become increasingly important if the network is to increase the number of participating sites. The ability to add new sites to the network will be constrained by the ability to generate sufficient surplus to subsidize camera acquisition.
Potential gains: An average screening site has been able to generate just under 400 screens per year. Each site added to the network could be expected to add $6,000 in annual revenue while generating $2,000 in reader costs. At present, there are an additional 12 sites that have been approved over the last six months and are expected to begin screening soon, but recruiting new sites will help the network come closer to sustainability.
99 There is great savings potential. Grantees have reported that the typical fee charged an uninsured patient for a follow‐up examination is $200. Avoiding the need for 4,500 such examinations has saved these patients an estimated $900,000 over the course of the EADRSI.
Evaluation of EADRSI ‐ January 2011 Page 57
Potential approaches: Support for camera sharing may be important to reach smaller clinics, or the target of 1,000 screens per year may need to be adjusted downward as camera prices decline.
Increased screening volume per site. A more effective strategy may be to help each participating clinic increase the numbers of diabetics they screen. Several strategies can be employed; each could be facilitated with network technical support.
• More efficient operations at clinics. Some clinics have sustained high volume, but most have fallen short of initial targets. Clinic volumes have ranged between 10 and 1,434 screens per year. In some cases, a small service population constrains potential volume, but grantees have reported challenges with staffing, scheduling patients, and matching screening times to patient availability. These challenges can be met: some clinics have been able to overcome these challenges to screen effectively 100% of their reported diabetic base.
Potential gains: Bringing low‐volume clinics up to average would increase annual volume by more than 27%. Alternatively, the gain would exceed 30% if each clinic was able to maintain the screening volume achieved in the peak month of March 2010.
Potential approaches: Some efforts to boost volume have been successful. A concentrated effort at technical support preceded the volume spike in the spring of 2010; probation notices sent to low‐volume clinics by UCB have generally been followed by increases in volume; and grantees credit specific technical support interventions by UCB for helping address specific problems. Peer sharing can be an important tool.100 Some promising practices that could be shared more broadly are described in the Lessons Learned section of this report.
• More repeat screens. As noted earlier in the report, nearly 90% of patients have not returned for a second screen, including patients who were referred into screens at a shorter interval. Bringing patients back for repeat screens at appropriate intervals represents a substantial opportunity to increase screening volume while simultaneously providing better eye care to diabetic patients.
Potential gains: Not all patients can be screened a second time since some are lost to the clinic and others go under the care of an eye specialist, but if even half of the patients who should be getting repeat screens actually get those screens, screening volume could increase by more than 40%.
Potential approach: Clinics must develop procedures to identify patients needing repeat screens. This could be facilitated if EyePACS had a simple reporting function to generate lists of patients who had been screened within a particular time period and/or who had been asked to return for screening in less than one year. With such a report, each clinic would still have to identify a lead person to manage this information and arrange for screening. Peer sharing could be important.
100 UCB has led monthly half‐hour Learning Community calls in which grantees have an opportunity to share practices and concerns. Grantees report that these calls have been very valuable, but that there are many topics that cannot be covered adequately in this time period.
Evaluation of EADRSI ‐ January 2011 Page 58
Decreased down time. An additional strategy to increase volume may be to help each participating clinic reduce periods of time in which no screens are completed. This down time has occurred as interruptions in screening, and as delays in the initiation of screening.
• Less interruption in screening. There are many reasons for temporary interruptions ranging from staff vacations and turnover through camera malfunctions and transfers of the camera between different locations. Often, interruptions have been resolved quickly and screening resumed with little break, but there have been a total of 33 separate episodes in which downtime has exceeded one month. This has resulted in 70 clinic months of downtime, or nearly 5% of all screening. The longest interruption has lasted 12 months due to camera problems.
There is little that can be done for many interruptions in screening, but in other cases UCB assistance has been quite effective once delivered. Some grantees have reported not knowing specific forms of assistance were available, or have delayed asking for assistance and allowing interruptions in screening to extend.
Potential gains: If this downtime had not occurred and grantees had continued screening at average volume, the additional volume would have exceeded 2,100 screens or $30,000 in network revenue over three years.
Potential approaches: Regular monitoring of individual clinic volume could be followed with proactive communications and assistance.
• Faster launch of new screening sites. On average, there were 174 days between a grantee's acceptance into EADRSI and their first successful screen.101 Reasons for such delays were reported in some cases: new construction interfered with one launch, repeated camera malfunctions delayed another, and substantial administrative challenges at a couple of other sites bogged down completion of necessary paperwork. However, there seemed to be little urgency with most launches, and this was reflected in extensive periods of UCB and grantees waiting for each other to take the initiative.102
Potential gains: Reduction of the lag in the launch of new screening sites would generate screening volume more quickly, and more screens would be completed all else equal. Accelerating the launch of new sites by three months would have resulted in an estimated increase of nearly 5,600 screens based upon the number of grantees and the average monthly volume. Less tangibly, delays in launch wasted much of the enthusiasm generated by the grant approval, and frequently allowed time for staff turnover that adversely affected screening operation and administrative championship.
101 This mean was calculated without including sites that were already successfully screening at the time that they were approved for inclusion in EADRSI. 102 One grantee approved in July 2010 reported at that time that the space was already set, photography staff assigned, and arrangements were already being made with local eye specialists to treat patients found to have retinopathy. A second grantee approved in July 2010 reported that they could begin screening within days. As of December 2010, neither has been launched. Similar experiences characterized the first phase of grantees.
Evaluation of EADRSI ‐ January 2011 Page 59
Potential approaches: This is a great place for a clinic champion to expedite paperwork and eliminate administrative barriers. A shared sense of urgency and the expectation of quicker launches could reduce launch times substantially.
The original target for EADRSI was 100 clinics each screening a minimum of 1,000 patients. This is well beyond the network's original breakeven volume of 60,000 screens per year, and probably represents an unreasonable target. However, the program can certainly expand beyond the current 23,000 screens per year. The biggest gains are likely to come from helping current screening sites increase their volume by providing necessary repeat screens, but each strategy should be pursued. The effects are multiplicative.
Develop a network structure to be more responsive to changes in the environment. One of the challenges with creating any sustainable venture is that success can attract competition. A competitor using sound business practices and aggressively developing a market can out‐compete an organization, even a non‐profit, that is not similarly efficient and responsive. For long‐run survival, the network will need to build read volume, improve efficiency, and quickly respond to changes in the environment. In short, it will need to be run as a business.
There continue to be changes in the screening and health care environment that affect EADRSI. The network would be stronger if it were to develop the capacity to quickly react to these changes.
• Reimbursements for MediCal. AB175 was passed in October 2009, allowing MediCal Fee‐For‐Service reimbursements for retinopathy screens read by optometrists. Funding was provided beginning November 1, 2010. This represents a tremendous opportunity for the network, opening up a new market with reimbursement rates that exceed the $15 read fee currently charged, and possibly relieving clinics of some of the cost burden of screening. Patients with MediCal coverage have been greatly under‐represented in EADRSI screening: they comprise just over 5% of all screens, but over 30% of the patients served at participating clinics. By simultaneously increasing potential volume and price, implementation of AB175 can improve the outlook for sustainability.
Responding to this change will require researching the new MediCal reimbursement requirements and processes, developing and deploying new consent forms, and likely making changes to EyePACS. Involving clinics will be important, since clinic staff would need to be trained, and new procedures would need to be implemented to reliably ensure that proper information was available for billing. Other safety‐net clinics serving large proportions of MediCal patients may be interested in beginning to screen with this change in the economic environment.
• Retinopathy screening program at Charles Drew University. In the fall of 2009 Charles Drew University was awarded a grant by the National Institutes of Health to develop a retinopathy screening program serving safety‐net clinics in Los Angeles. As part of this program, Drew offered free reads to a small group of clinics that had participated in the EADRSI, and each of those clinics
Evaluation of EADRSI ‐ January 2011 Page 60
switched to Drew's program in the fall of 2010. These clinics had accounted for over 3,200 screens in 2009.103
The Drew program represented challenges and opportunities. UCB did investigate sub‐contracting for reads, and encouraged Drew to continue the use of EyePACS, but the loss of these clinics underscores the willingness of established screening partners to switch readers when offered a better price. There are other possibilities for the network to collaborate with Drew for the benefit of safety net patients: the entrance of Drew into this market could potentially provide a model for integration of screening with follow‐up care, and Drew's resources could allow cooperation in technical support and the development of new protocols.
• Follow‐up care. Better integration of EyePACS with providers of follow‐up care represents an opportunity to improve health outcomes while establishing a stronger competitive position. This integration could include facilitation of information sharing between clinics and independent eye specialists, county health care systems, and university clinics including UC Berkeley.
Narrowly construed, the EADRSI connects screening sites with readers, and provides training and certification to each. Anticipating and responding to threats and opportunities in the environment is not strictly part of the network's responsibility. However, sustainability is.
Get more patients into follow‐up care. Fewer than 30% of the patients who were referred to specialty care for vision threatening retinopathy were able to access that care, and the average lag between screen and the first follow‐up appointment exceeded nine months for those patients who were successful. Once a reader returns findings, the clinic is responsible for pulling those findings off EyePACS, routing the information to appropriate personnel and the patient, and connecting the patient to specialist care if necessary.
Ensuring that referred patients actually accessed that care has not been an area of emphasis for EADRSI support, but more grantees are beginning to address the issue as they have become more aware of the reservoir of pathology within their diabetic populations, and the challenges faced by safety‐net patients in accessing specialty care. There are now many different strategies employed by grantees.
• Discounted treatment arrangements. Since most patients screened through EADRSI are uninsured, the cost of treatment can be a serious barrier to follow‐up care. In some communities, long‐standing working relationships between clinic and specialist have been modified as clinics take on more of a role in detecting pathology and send more patients to specialists for treatment. Discount structures are being renegotiated to apply to follow‐up examinations and treatment. Discounts are not available in all areas, and some are described as nominal.
There are some treatment centers that are important providers of discounted treatment for safety‐net patients. Some are county facilities providing care for indigent residents, and these
103 These cases had not been read within the network, so the loss of these clinics did not represent a reduction in network revenue. However, the loss of these clinics did remove an opportunity to grow network revenue by bringing their reads in the network.
Evaluation of EADRSI ‐ January 2011 Page 61
facilities are generally impacted. Others are open to patients over a larger geographic area. The UC Berkeley Eye Clinic and the Lions' Foundation operate out of the Bay Area, and UC Irvine provides services in the south.
• Recruiting specialists. A few grantees have systematically canvassed the eye specialists in their service area and recruited those specialists that provide the best combination of service and price for safety‐net patients. Maintaining relationships with these specialists is generally seen as critical. The grantees that did this reported good results.
• Bringing patient in for notification of referral. Most referral systems notify the patient via letter or phone call. A few grantees have begun asking patients to return to the clinic to discuss their condition and treatment options with their provider. The patient's own retinal images can be brought out at this time, allowing the patient to see the effect of the pathology.104 This approach adds to clinic costs, but may be reimbursable.
• Enrolling patient in disease management program. Diabetes management programs are in various stages of development among EADRSI grantees. A few grantees reported adding each diabetic found to have retinopathy to their disease management program. This catches the patient at a receptive time, and assigns a disease manager to oversee the process of getting the patient into appropriate follow‐up care. Not all grantees have disease management programs, and some existing disease management programs do not have the capacity to serve all diabetics.
• Conducting the follow‐up exam internally. The patient's first visit to a specialist is an opportunity for the specialist to conduct an exam that would confirm the diagnosis and provide the information necessary to form a treatment plan. Typically, that treatment plan would call for a series of monitoring examinations before any actual treatment began. The cost of that first exam and all subsequent monitoring examinations has been identified as a factor in patient reluctance to access follow‐up care.105
One grantee has worked out an innovative plan to provide the first examination using its own optometrists at much lower cost to patients. Special arrangements were made with local eye specialists to accept these findings, and substantial effort was being made to maintain this special relationship. Patients who were found to not need treatment were returned to screening, and thus saved even more.
• Contacting specialist directly. Some grantees reported having a provider directly contact the eye specialist when making a referral. This personal contact was reported at reducing the lag time between screening and follow‐up care.
• Setting up in‐house treatment capacity. Five grantees have reported being in the planning process of adding internal capacity to conduct laser treatment. The common approach was to
104 There are several anecdotal reports of patients whose diabetic self‐management improved dramatically after they were given the opportunity to see the damage that uncontrolled diabetes could have on their eyes. The damage to small vessels is particularly easy to see in the retinas. 105 Grantees reported that the cost of the follow‐up examination was typically $200, although there were discounts in some communities that might bring the cost down to $170.
Evaluation of EADRSI ‐ January 2011 Page 62
purchase laser equipment and bring in an eye specialist to provide treatment perhaps one day per week. Some treatment facilities were expected to be up and running in the first months of 2011.
Fully realizing the benefits of EADRSI will require improving access to follow‐up care. There may be additional pathways including working with county care facilities to better integrate EyePACS results with their systems including triage, improved scheduling, and elimination of duplicate efforts. Increased sharing of information and promising practices could also help.
Evaluation of EADRSI ‐ January 2011 Page 63
Appendices Appendix One. Evaluation Processes and Resources
Appendix Two. Variables included in EyePACS database.
Appendix Three. Characteristics of patients screened through EADRSI
Appendix Four. Pathologies discovered
Appendix Five. Participating grantees
Appendix Six. Estimated effect of fee increase on screening volume
Evaluation of EADRSI ‐ January 2011 Page 64
Appendix One: Evaluation Processes and Resources CHCF solicited proposals for the evaluation of the EADRSI in the fall of 2007, and selected the proposal submitted by Dennis Rose & Associates (DRA) based in part on that evaluation firm's successful history of evaluating telemedicine projects. DRA designed and carried out the evaluation throughout 2008, but in January 2009, DRA's Principle Investigator for the project, Dr. Robert Quade, assumed sole responsibility for the evaluation operating as Quade & Associates. Continuity in the evaluation was maintained through this transition.
The evaluation was guided by five high‐level evaluation questions identified by CHCF prior to the beginning of EADRSI, and the evaluation was designed to address each.
• How effective is the program in affecting the identified health indicators and outcomes?
• Is the diabetic retinopathy program cost effective?
• What is the impact of diabetic retinopathy screening on operational processes, efficiencies, and quality of care, and to what extent can such a screening program be self‐sustaining?
• What impact, if any, does diabetic retinopathy screening have on primary care provider and specialist satisfaction with this technology?
• What challenges are faced by federally qualified health centers in seeking reimbursement for program services based on current regulations? What progress has been made in developing mechanisms?
Details of the five high‐level questions were worked out with valuable input from UCB and CHCF staff, as well as a range of stakeholders. Question refinement and instrument development also drew on the evaluators' experience with the other telemedicine programs, including the American Indian Diabetic Teleophthalmology Grant Program (2000‐2004) funded by CTEC and involving 17 Tribal Health Clinics. In addition to these five high‐level questions, the evaluation was also asked to conduct ad hoc investigations of grantees' technical support needs (2010) and referral outcomes (2009, 2010.) Pertinent findings from those investigations are summarized in this report as well.
The audience for the evaluation was understood to be 1) individuals and organizations that might be designing or managing similar telemedicine programs, 2) organizations that might be considering participating in similar telemedicine programs, and 3) organizations with a responsibility for setting policies affecting telemedicine.
Information sources
A mixed method approach to the evaluation used both qualitative and quantitative data sources. These sources fell into three major categories:
Evaluation of EADRSI ‐ January 2011 Page 65
• EyePACS database. The process of screening resulted in patient characteristics and limited medical history being uploaded into an online database by grantee personnel.106 These data were combined with data on pathology findings, referrals, and image quality entered by the reader. The EyePACS database was the single major source of data used to develop information for this report. See the appendix for a list and description of variables included in EyePACS.
• Indirect information was obtained through UCB staff including updates on clinic activities, data from photographer time studies, and screening processes. Opportunities to discuss implications and explanations of unusual data with Dr. Jorge Cuadros and Dr. George Bresnick were invaluable.
• Telephone interviews with program personnel at sites were conducted at the beginning and end of the Initiative by the evaluation team, and providers were asked to complete an end‐of‐program survey. Additional interviews were conducted through the program in support of ad hoc studies of technical support needs and the availability of eye specialists. Personnel at a sample of clinics provided valuable data on referral outcomes, and made themselves available to discuss the results. Personnel at several sites were particularly helpful.
Evaluation Challenges
Any evaluation faces challenges, and the evaluation of EADRSI was no exception.
• Reliance on UCB for information. Funding for the evaluation was "lean," with the expectation that UCB Field Staff would serve as the eyes and ears of the evaluation. In the best of circumstances this approach would result in information lags and at least one additional degree of distance between the source and user of the information. In practice, it also added to the work load of a UCB staff already operating under their own lean budget, and provided additional opportunities for lost information.
• Consistency of EyePACS data. EyePACS data were crucial for the evaluation, but the EyePACS database was not designed for evaluation purposes. Necessary modifications to the database included the provision of access to the evaluation team, inclusion of pull‐down menus to standardize data entry, and the addition of data fields for tracking referrals, HIPAA‐compliant patient identifiers, and markers for non‐valid cases. Modifications typically required months to be implemented and frequently generated "regressions" with unintended consequences. Direct access to most of the database was made available to the evaluation in October 2008, with a copy of the EyePACS database developed in late 2009 to avoid the need to make modifications in the working database and to add fields not originally available. Ultimately, there was sufficient time left in the program to generate sufficient sample size for inference, but this did delay development of findings.
EyePACS data also suffered from more common problems such as missing or obviously invalid data. These data were entered by clinic personnel at the point of image capture, and interviews with grantees revealed that complete and accurate data entry depended on a convergence of
106 Patient retinal images were also uploaded, but these images and patients' identifiers were not part of the database available to the evaluation.
Evaluation of EADRSI ‐ January 2011 Page 66
patient, photographer and information that required process management to be complete. Overall, for most data fields the proportion of missing or invalid data was quite manageable, but the proportion of missing data did reach 84% for medical payer. There is no reason to believe that the missing data are systematically different from the existing data, so inferences should be valid.
• Variability in program design. There were over 50 grantees participating in the EADRSI, and each had their own protocols and procedures. Grantees had between one and three cameras, but not all were provided by EADRSI, and different models of cameras were used. A grantee could operate a single screening site or could have multiple sites operated by different health care organizations. UCB provided photographers for some sites, and some sites brought their camera and photographers to health fairs or used a mobile unit to deliver service. This variability made direct comparability between programs difficult, but it also presented opportunities for identifying promising practices.
Greater challenges were presented by changes in the network over the course of the program. A readers' meeting in October 2009 was used to adjust the criteria for referrals. The purpose was to bring the program more into line with the economics of the safety net. False positives and over‐referrals strain limited safety‐net resources, and network readers were brought into line with this environment. Such program management is important, and there was sufficient time left in the program to incorporate the resulting changes in program parameters into estimates of the impact and cost/benefit of the program.
It was also difficult to establish a "unit" of analysis. Each grantee participating in the EADRSI was assigned at least one Site ID, but there was no consistency in these assignments. In a simple screening installation with a single site, a single Site ID could be assigned. Additional Site IDs might or might not be assigned to represent other sites that referred into the screening site. Cameras that were rotated through multiple sites might or might not have a Site ID for each site. Site IDs were sometimes portable and moved with the photographer through different sites, or they might be fixed and be associated with multiple cameras. Organizations sometimes used another site's Site ID for months. This variability limited ability to use EyePACS data to illuminate clinic processes or to correlate them with screening success.
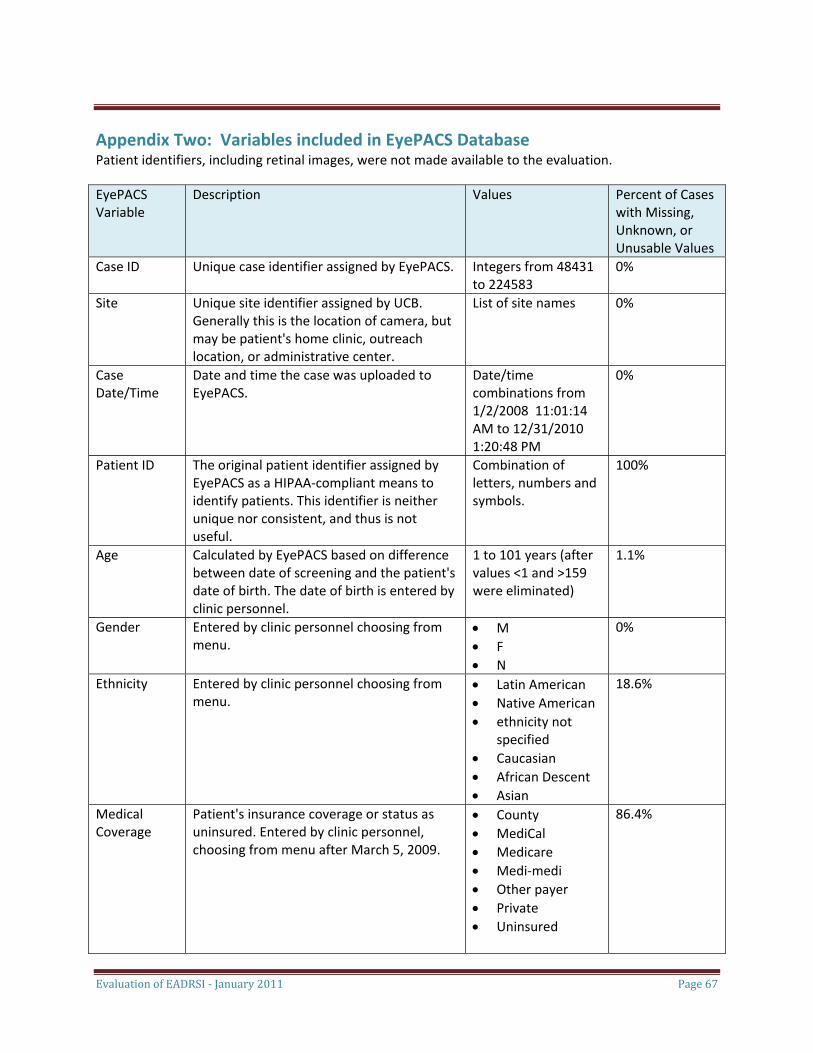
Evaluation of EADRSI ‐ January 2011 Page 67
Appendix Two: Variables included in EyePACS Database Patient identifiers, including retinal images, were not made available to the evaluation.
EyePACS Variable
Description Values Percent of Cases with Missing, Unknown, or Unusable Values
Case ID Unique case identifier assigned by EyePACS. Integers from 48431 to 224583
0%
Site Unique site identifier assigned by UCB. Generally this is the location of camera, but may be patient's home clinic, outreach location, or administrative center.
List of site names 0%
Case Date/Time
Date and time the case was uploaded to EyePACS.
Date/time combinations from 1/2/2008 11:01:14 AM to 12/31/2010 1:20:48 PM
0%
Patient ID The original patient identifier assigned by EyePACS as a HIPAA‐compliant means to identify patients. This identifier is neither unique nor consistent, and thus is not useful.
Combination of letters, numbers and symbols.
100%
Age Calculated by EyePACS based on difference between date of screening and the patient's date of birth. The date of birth is entered by clinic personnel.
1 to 101 years (after values <1 and >159 were eliminated)
1.1%
Gender Entered by clinic personnel choosing from menu.
• M • F • N
0%
Ethnicity Entered by clinic personnel choosing from menu.
• Latin American • Native American • ethnicity not
specified • Caucasian • African Descent • Asian
18.6%
Medical Coverage
Patient's insurance coverage or status as uninsured. Entered by clinic personnel, choosing from menu after March 5, 2009.
• County • MediCal • Medicare • Medi‐medi • Other payer • Private • Uninsured
86.4%
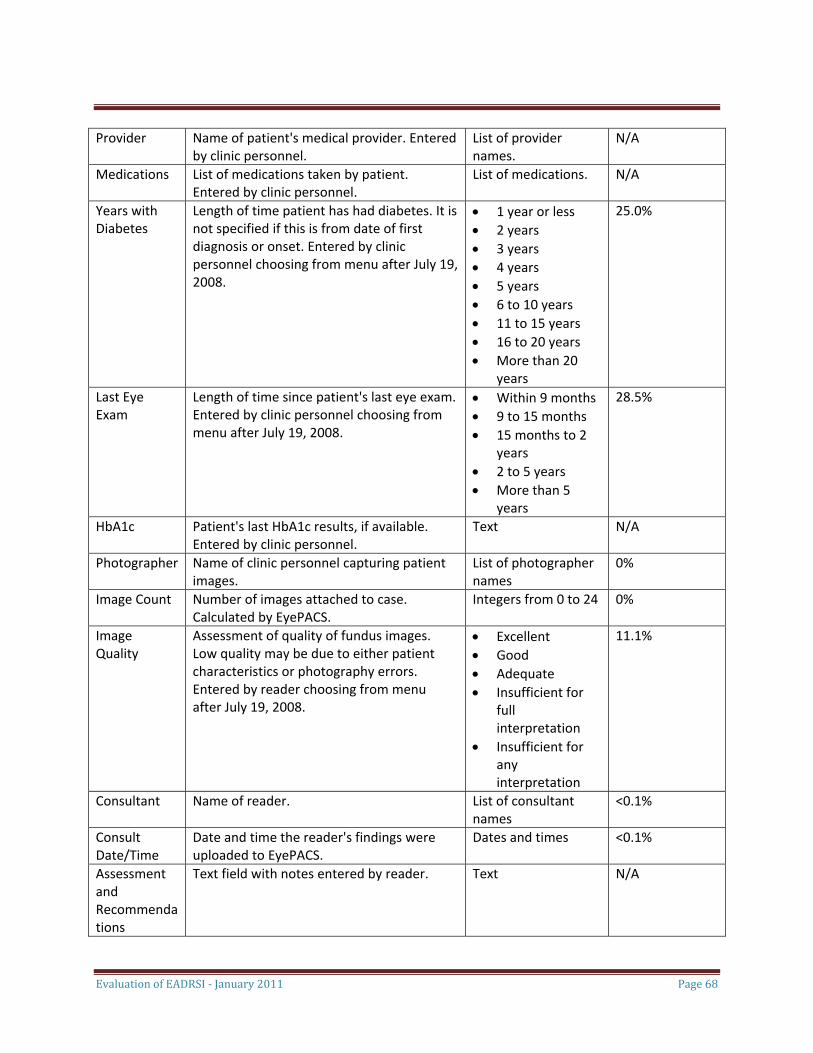
Evaluation of EADRSI ‐ January 2011 Page 68
Provider Name of patient's medical provider. Entered by clinic personnel.
List of provider names.
N/A
Medications List of medications taken by patient. Entered by clinic personnel.
List of medications. N/A
Years with Diabetes
Length of time patient has had diabetes. It is not specified if this is from date of first diagnosis or onset. Entered by clinic personnel choosing from menu after July 19, 2008.
• 1 year or less • 2 years • 3 years • 4 years • 5 years • 6 to 10 years • 11 to 15 years • 16 to 20 years • More than 20
years
25.0%
Last Eye Exam
Length of time since patient's last eye exam. Entered by clinic personnel choosing from menu after July 19, 2008.
• Within 9 months • 9 to 15 months • 15 months to 2
years • 2 to 5 years • More than 5
years
28.5%
HbA1c Patient's last HbA1c results, if available. Entered by clinic personnel.
Text N/A
Photographer Name of clinic personnel capturing patient images.
List of photographer names
0%
Image Count Number of images attached to case. Calculated by EyePACS.
Integers from 0 to 24
0%
Image Quality
Assessment of quality of fundus images. Low quality may be due to either patient characteristics or photography errors. Entered by reader choosing from menu after July 19, 2008.
• Excellent • Good • Adequate • Insufficient for
full interpretation
• Insufficient for any interpretation
11.1%
Consultant Name of reader. List of consultant names
<0.1%
Consult Date/Time
Date and time the reader's findings were uploaded to EyePACS.
Dates and times <0.1%
Assessment and Recommendations
Text field with notes entered by reader. Text N/A
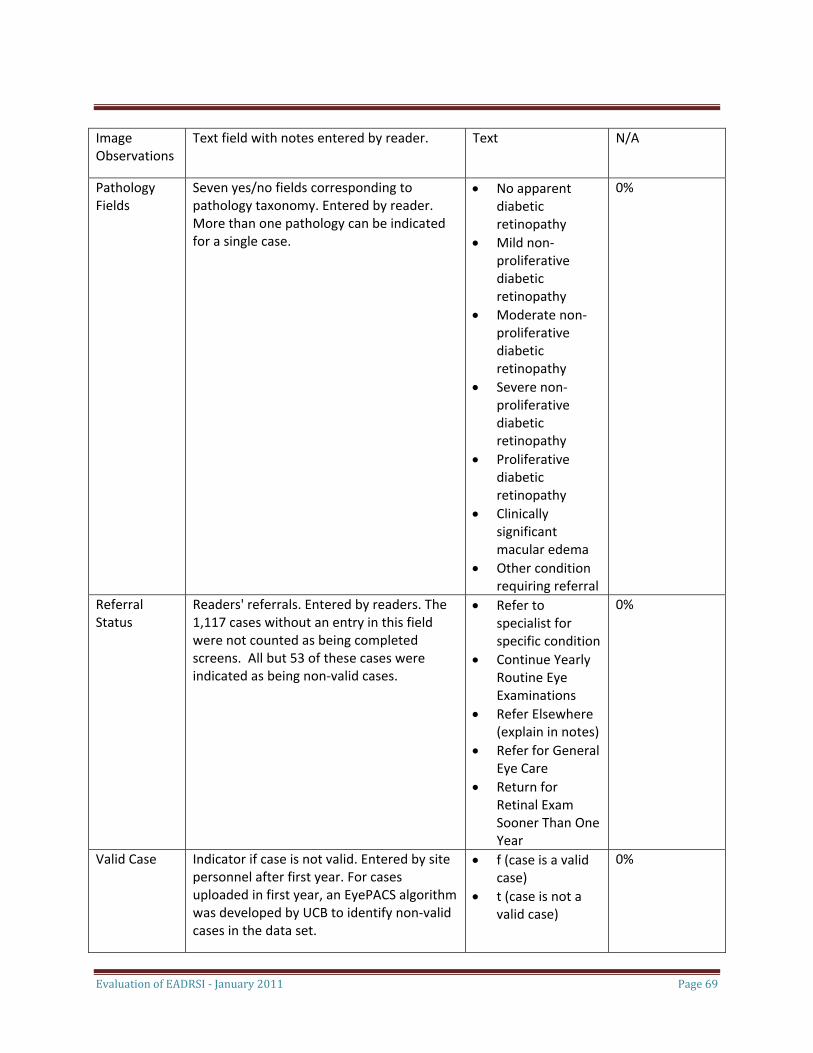
Evaluation of EADRSI ‐ January 2011 Page 69
Image Observations
Text field with notes entered by reader. Text N/A
Pathology Fields
Seven yes/no fields corresponding to pathology taxonomy. Entered by reader. More than one pathology can be indicated for a single case.
• No apparent diabetic retinopathy
• Mild non‐proliferative diabetic retinopathy
• Moderate non‐proliferative diabetic retinopathy
• Severe non‐proliferative diabetic retinopathy
• Proliferative diabetic retinopathy
• Clinically significant macular edema
• Other condition requiring referral
0%
Referral Status
Readers' referrals. Entered by readers. The 1,117 cases without an entry in this field were not counted as being completed screens. All but 53 of these cases were indicated as being non‐valid cases.
• Refer to specialist for specific condition
• Continue Yearly Routine Eye Examinations
• Refer Elsewhere (explain in notes)
• Refer for General Eye Care
• Return for Retinal Exam Sooner Than One Year
0%
Valid Case Indicator if case is not valid. Entered by site personnel after first year. For cases uploaded in first year, an EyePACS algorithm was developed by UCB to identify non‐valid cases in the data set.
• f (case is a valid case)
• t (case is not a valid case)
0%
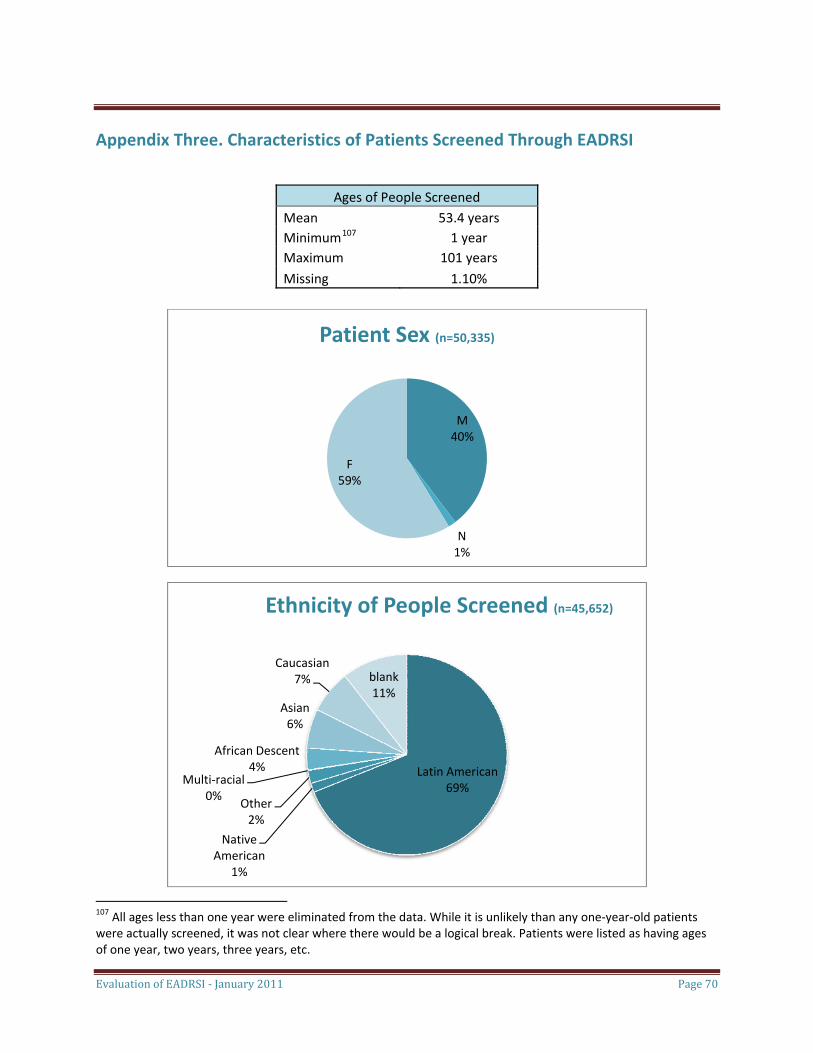
Evaluation of EADRSI ‐ January 2011 Page 70
Appendix Three. Characteristics of Patients Screened Through EADRSI
Ages of People Screened Mean 53.4 years Minimum107 1 year Maximum 101 years
Missing 1.10%
M40%
N
F59%
Patient Sex (n=50,335)
1%
Latin American69%
Native American
Other2%
Multi‐racial0%
African Descent4%
Asian6%
Caucasian7% blank
11%
Ethnicity of People Screened (n=45,652)
1%
107 All ages less than one year were eliminated from the data. While it is unlikely than any one‐year‐old patients were actually screened, it was not clear where there would be a logical break. Patients were listed as having ages of one year, two years, three years, etc.
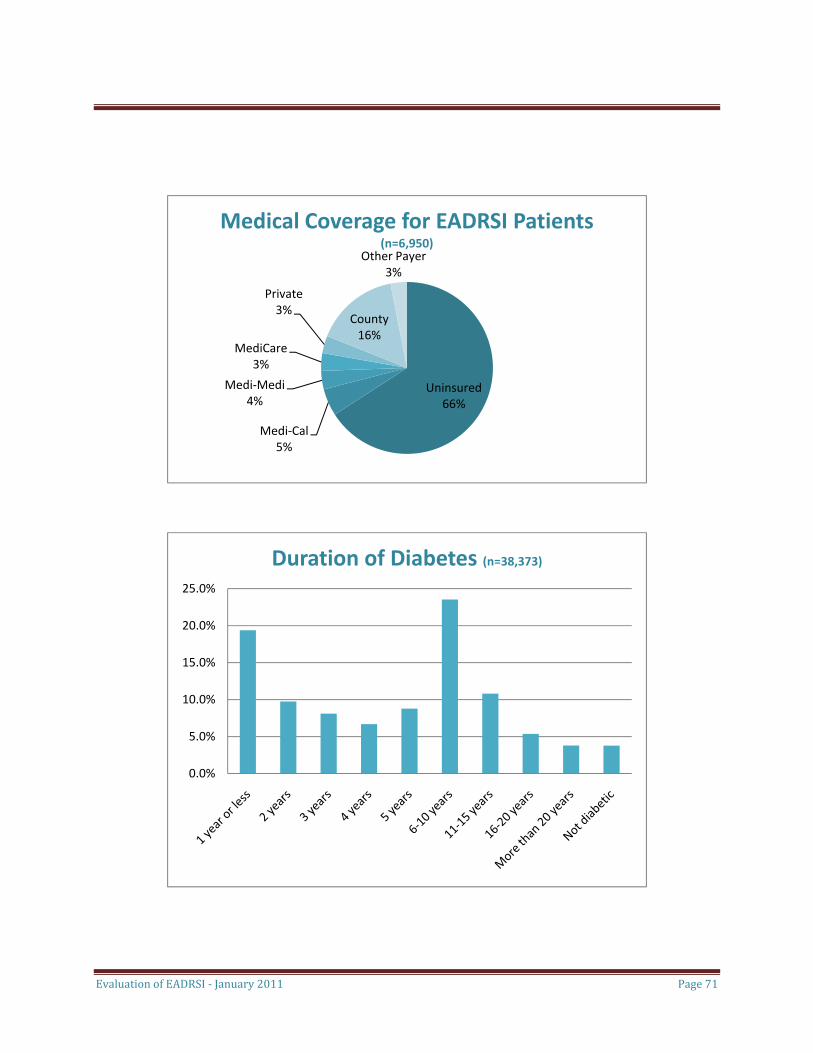
Evaluation of EADRSI ‐ January 2011 Page 71
Uninsured66%
Medi‐Cal5%
Medi‐Medi4%
MediCare3%
Private3%
County16%
Other Payer3%
Medical Coverage for EADRSI Patients (n=6,950)
0.0%
5.0%
10.0%
15.0%
20.0%
25.0%
Duration of Diabetes (n=38,373)
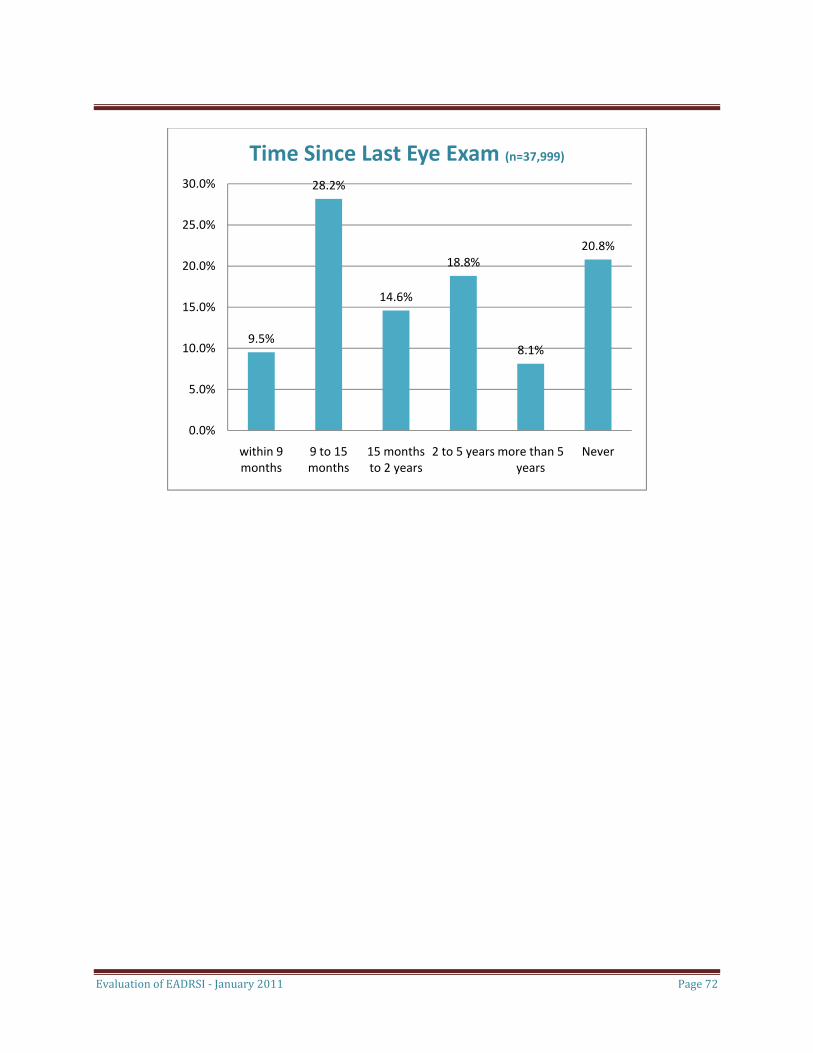
Evaluation of EADRSI ‐ January 2011 Page 72
9.5%
28.2%
14.6%
18.8%
8.1%
20.8%
0.0%
5.0%
10.0%
15.0%
20.0%
25.0%
30.0%
within 9 9 to 15 15 months 2 to 5 years more than 5 Never
Time Since Last Eye Exam (n=37,999)
months months to 2 years years
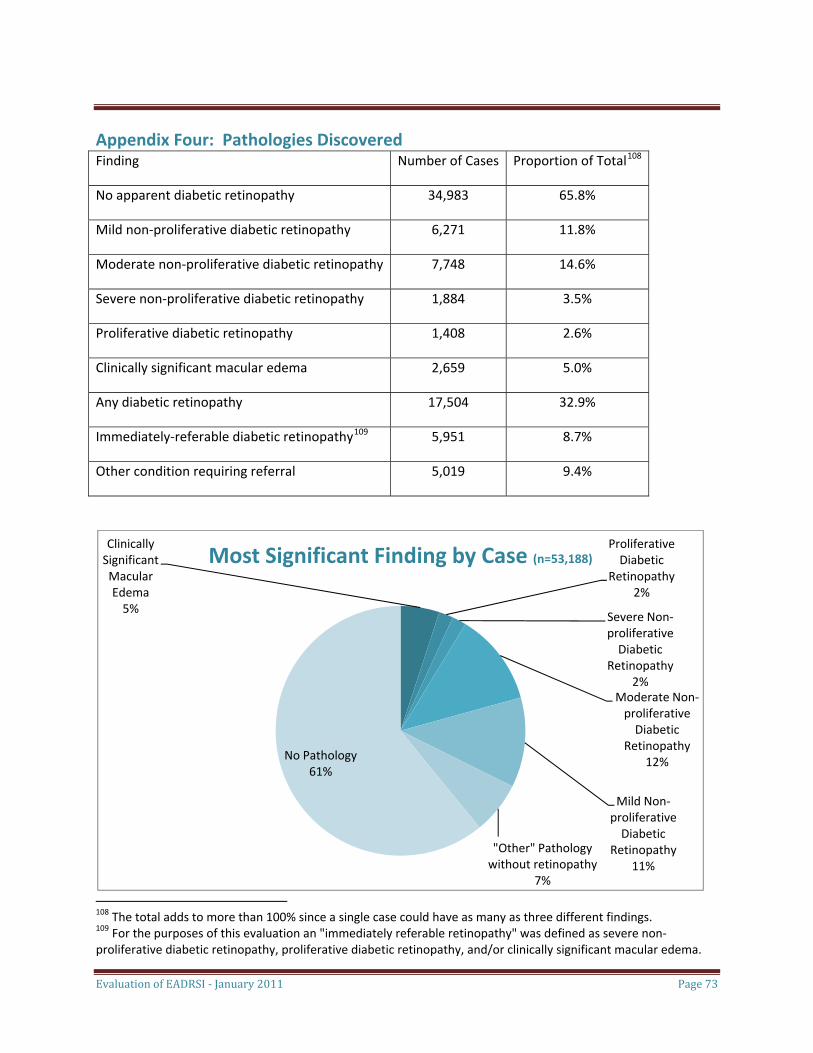
Evaluation of EADRSI ‐ January 2011 Page 73
Appendix Four: Pathologies Discovered Finding Number of Cases Proportion of Total108
No apparent diabetic retinopathy 34,983 65.8%
Mild non‐proliferative diabetic retinopathy 6,271 11.8%
Moderate non‐proliferative diabetic retinopathy 7,748 14.6%
Severe non‐proliferative diabetic retinopathy 1,884 3.5%
Proliferative diabetic retinopathy 1,408 2.6%
Clinically significant macular edema 2,659 5.0%
Any diabetic retinopathy 17,504 32.9%
Immediately‐referable diabetic retinopathy109 5,951 8.7%
Other condition requiring referral 5,019 9.4%
Clinically Significant Macular Edema5%
Proliferative Diabetic
Retinopathy2%
Severe Non‐proliferative Diabetic
Retinopathy2%
Moderate Non‐proliferative Diabetic
Retinopathy12%
Mild Non‐proliferative Diabetic
Retinopathy11%
"Other" Pathology without retinopathy
7%
No Pathology61%
Most Significant Finding by Case (n=53,188)
108 The total adds to more than 100% since a single case could have as many as three different findings. 109 For the purposes of this evaluation an "immediately referable retinopathy" was defined as severe non‐proliferative diabetic retinopathy, proliferative diabetic retinopathy, and/or clinically significant macular edema.
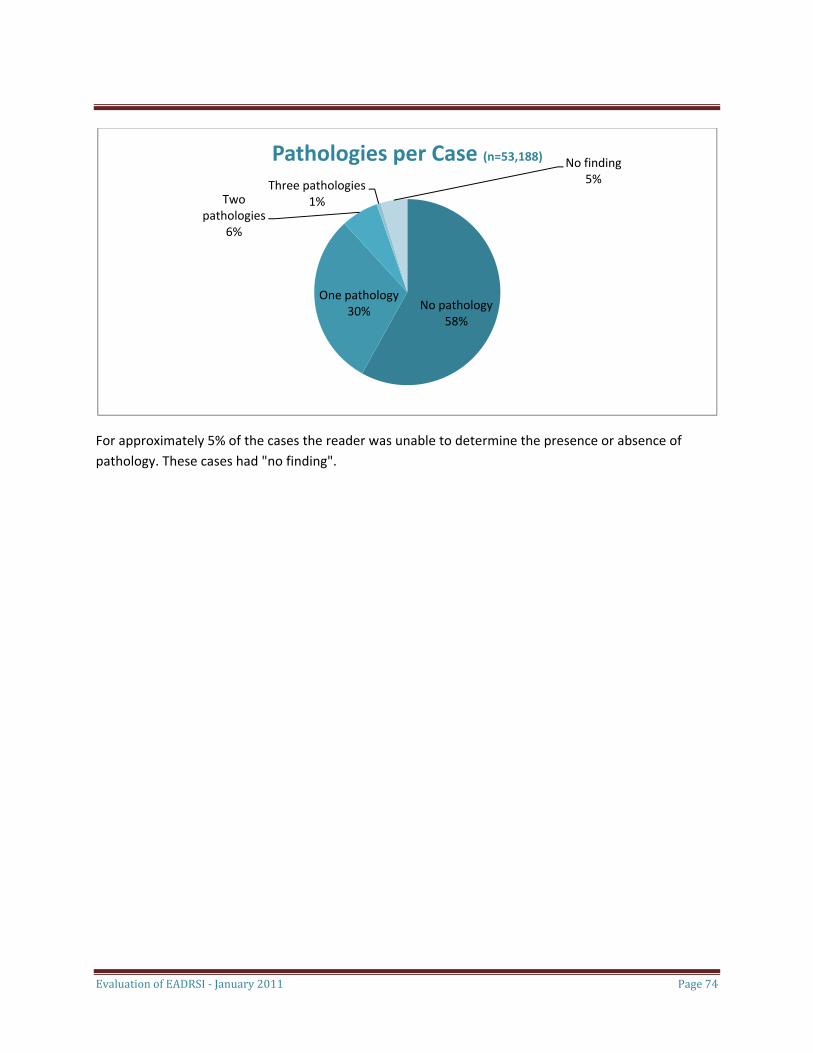
No pathology58%
One pathology30%
Two pathologies
6%
Three pathologies1%
No finding5%
Pathologies per Case (n=53,188)
For approximately 5% of the cases the reader was unable to determine the presence or absence of pathology. These cases had "no finding".
Evaluation of EADRSI ‐ January 2011 Page 74
Evaluation of EADRSI ‐ January 2011 Page 75
Appendix Five: Participating Grantees Grantees were accepted into the EADRSI in three phases.
Phase One
The EADRSI was launched in January 2008 with a first phase of 29 grantees each of which had responded to an RFP released by CHCF in 2007. These grantees represented a diverse cross section of the safety‐net, ranging in location from the southeast corner of the state to the northwest corner, and from a rural community with a population of less than 7,000 people to five grantees operating in Los Angeles County. This phase included one university clinic and one large Tribal Health Program, and three other grants went to coalitions of four to five organizations pooled together to share a single camera. Finally, six of the Phase One grantees previously had participated in the pilot project, and by continuing in the EADRSI were agreeing to participate in the evaluation.110
The Phase One grantees were selected and approved in December 2007. Launch dates varied: twelve of these grantees were screening in January 2008, but each of these had previous screening experience either through the pilot project or with UCB assistance outside of a program. Two Phase One clinics quickly began screening in February, but other launches took longer. Two Phase One grantees did not successfully screen until October 2008, and another grantee did not complete its first screen until April 2009. Delays were generally reported as administrative. Once paperwork was completed, most of the launches were smooth. They began with delivery of the fundus camera, photographer training and certification, and a meeting with providers to explain the process and gain their buy‐in. Grantees reported that they were very pleased with the training and began their screening with a lot of enthusiasm as a result of the launch activities.
Two of the 29 Phase One grantees withdrew from the program almost as soon as they were launched. One new grantee represented a sister clinic of a participant in the pilot project, and both the new clinic and the pilot site stopped screening due to concerns about the ability to fund the screening process in the absence of reimbursements. The other grantee that withdrew was the last of the Phase One grantees to launch, and this grantee may have been exhausted from the administrative difficulties.
Phase Two
Phase Two of the EADRSI began nearly a year later with an additional 13 grantees approved. One of these sites withdrew before getting a camera as they were unable to resolve a contract issue regarding
110 These grantees also received free technical support from UCB as part of their participation in EADRSI, but this support was also provided to pilot sites that did not formally continue. The other seven pilot project sites continued screening after the beginning of EADRSI, although three have stopped screening by the end of the EADRSI. As the EADRSI is an extension of that pilot project, the number of screens completed by all pilot project sites is included in this evaluation's screening volume data.
Evaluation of EADRSI ‐ January 2011 Page 76
liability. All but one of the other twelve grantees was new to screening,111 with the time between approval and the first successful screen ranging between four and sixteen months. The proposals were simpler, with no coalitions sharing a camera or proposals to move the camera between locations.
While this phase included some grantees that were very successful in screening large numbers of diabetic patients, two of the twelve grantees have stopped screening since a successful launch. Each of these grantees had struggled to recruit patients to screening, and had been put on probation by UCB.112 At the other extreme were two organizations with champions who devoted substantial effort to ensuring that screening was successful and well integrated into clinic systems. These two grantees are among the highest volume sites in the EADRSI.
Phase Three
The third phase of the EADRSI relied on an open RFP to add to the number of grantees. Proposals came in slowly at first, but there has been a rush of strong proposals at the end of the term of the Initiative. In all, thirteen new grantees were approved in this phase. As might be expected with an open RFP, there has been less standardization in the applicants and the process.
• Retail Pharmacy. One novel proposal was received and approved from a chain of retail pharmacies serving primarily safety‐net clients. Screenings for retinopathy would be conducted in a clinic associated with the pharmacy, and the findings would be communicated to the patient's primary care provider if one existed. If this project was successful, the expectation was that it would be replicated throughout the network of pharmacies. Unfortunately, the attempt has not succeeded and the camera has been recalled. Challenges with space, staffing and coordination between the pharmacy and the associated clinic were exacerbated by technical problems with the camera.
• Nursing Education. A second novel proposal involved the use of mobile screening by nursing students developing skills at working with the community. Once trained on the use of the camera, the students would work with safety‐net clinics in a three‐county rural area to screen diabetics, with the findings returned to the patient's primary care provider. A faculty member was trained on the fundus camera and EyePACS, with the plan that he would then train a new cadre of students each semester. Unfortunately, this novel project has not succeeded and the camera has been returned. The primary challenge reported was the inability to sustain a volume of screening necessary to justify the camera investment. Thirteen screens were completed before the project was abandoned.
111 One of the Phase Two grantees was a new screening site for an organization that had started as a pilot project. There was organizational experience, but it was still necessary to familiarize staff at the new location with the screening process. That this process took six months is testimony to the challenges associated with moving a camera to a new location. 112 One of the grantees that stopped screening relied on a large number of part‐time, volunteer providers to serve their population. This grantee struggled with making all of their providers aware of the availability of on‐site screening.
Evaluation of EADRSI ‐ January 2011 Page 77
• Trial programs. Three organizations were recruited by UCB through an offer of a trial period. Each received the loan of a fundus camera and training with the understanding that they would go through the proposal process and complete the paperwork if accepted. Two did submit proposals, and one was accepted.
• Pre‐existing program. One health agency was brought into the EADRSI after it had been successfully screening patients for more than nine months using cameras acquired through a federal grant. They had been receiving technical support from UCB prior to joining the EADRSI.
Another nine programs have been accepted with the first approved in July 2010. Two of these programs requested additional cameras and screening capacity for Phase One organizations. Two of these nine programs completed their first screens in December 2010, but the other grantees have not yet launched.
Projects that left the EADRSI
Not all sites that began screening were able to continue. One group of three clinics left to join the Drew University screening network, taking advantage of free reads available to them through that network. Two other grantees representing nine screening sites served by three cameras stopped screening for economic reasons, citing an inability to cover the cost of screening. Another six sites were unable to establish a minimum screening volume, and left the EADRSI generally citing challenges around project administration.
Projects that shared a camera between sites
Sharing a single camera between more than one site was a common strategy for building a diabetic population of sufficient size to meet EADRSI screening volume requirements. The results have been mixed, as some grantees have been able to move the camera with no difficulty and other grantees have experienced major problems. Little technical assistance has been available to grantees to address coordination issues, although UCB has provided photographer training as the camera has moved to new sites.
Several promising practices have emerged. Moving the camera along with a photographer for occasional screening days has been accomplished by several grantees with no disruption in screening. Alternatively, longer rotations in which the camera stays at a site for a period of months have required substantial retraining of staff, and clinic managers are more likely to see demands for space and staff time as burdens. Programs with an active program champion who coordinates the move have also fared better. Involvement of personnel at the new site in advance of the move has also been important in ensuring that screening gets off to a good start at the new location. Clinic systems with optometry departments have also been more successful, with internal support available for the move. Finally, coordination between different organizations has presented severe difficulties, with both coalitions attempting this having been placed on probation for low screening volume.
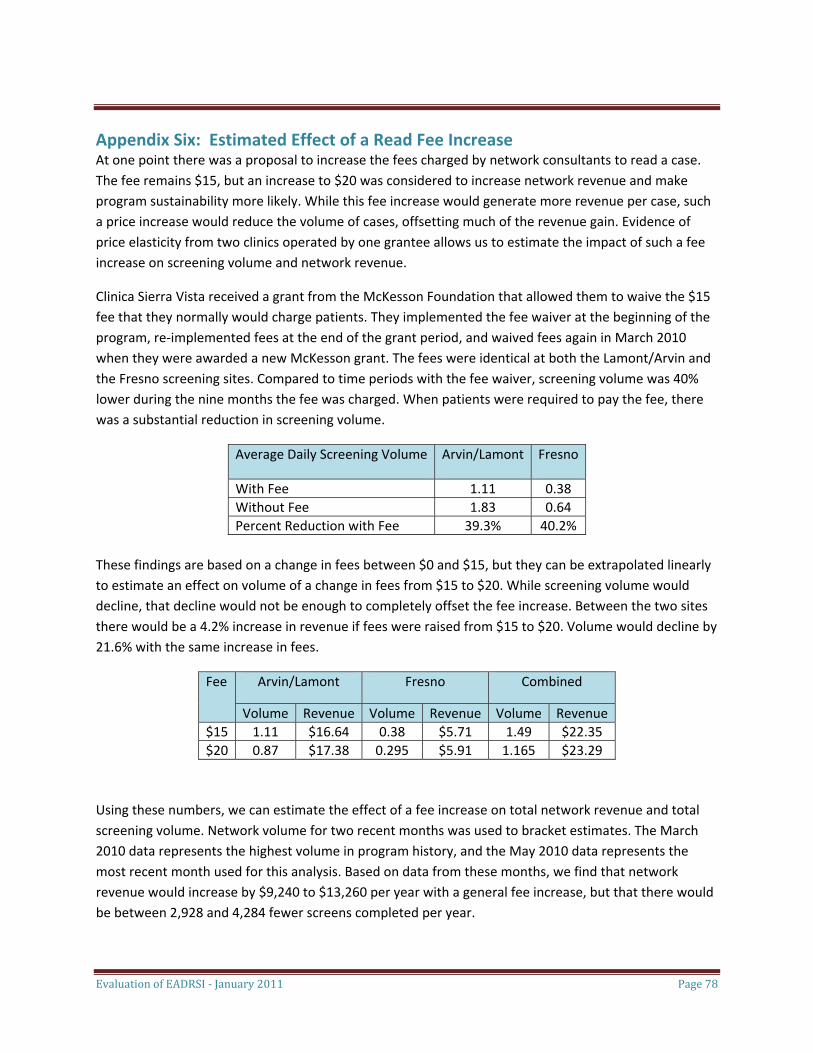
Evaluation of EADRSI ‐ January 2011 Page 78
Appendix Six: Estimated Effect of a Read Fee Increase At one point there was a proposal to increase the fees charged by network consultants to read a case. The fee remains $15, but an increase to $20 was considered to increase network revenue and make program sustainability more likely. While this fee increase would generate more revenue per case, such a price increase would reduce the volume of cases, offsetting much of the revenue gain. Evidence of price elasticity from two clinics operated by one grantee allows us to estimate the impact of such a fee increase on screening volume and network revenue.
Clinica Sierra Vista received a grant from the McKesson Foundation that allowed them to waive the $15 fee that they normally would charge patients. They implemented the fee waiver at the beginning of the program, re‐implemented fees at the end of the grant period, and waived fees again in March 2010 when they were awarded a new McKesson grant. The fees were identical at both the Lamont/Arvin and the Fresno screening sites. Compared to time periods with the fee waiver, screening volume was 40% lower during the nine months the fee was charged. When patients were required to pay the fee, there was a substantial reduction in screening volume.
Average Daily Screening Volume Arvin/Lamont Fresno
With Fee 1.11 0.38 Without Fee 1.83 0.64 Percent Reduction with Fee 39.3% 40.2%
These findings are based on a change in fees between $0 and $15, but they can be extrapolated linearly to estimate an effect on volume of a change in fees from $15 to $20. While screening volume would decline, that decline would not be enough to completely offset the fee increase. Between the two sites there would be a 4.2% increase in revenue if fees were raised from $15 to $20. Volume would decline by 21.6% with the same increase in fees.
Fee Arvin/Lamont Fresno Combined
Volume Revenue Volume Revenue Volume Revenue $15 1.11 $16.64 0.38 $5.71 1.49 $22.35 $20 0.87 $17.38 0.295 $5.91 1.165 $23.29
Using these numbers, we can estimate the effect of a fee increase on total network revenue and total screening volume. Network volume for two recent months was used to bracket estimates. The March 2010 data represents the highest volume in program history, and the May 2010 data represents the most recent month used for this analysis. Based on data from these months, we find that network revenue would increase by $9,240 to $13,260 per year with a general fee increase, but that there would be between 2,928 and 4,284 fewer screens completed per year.
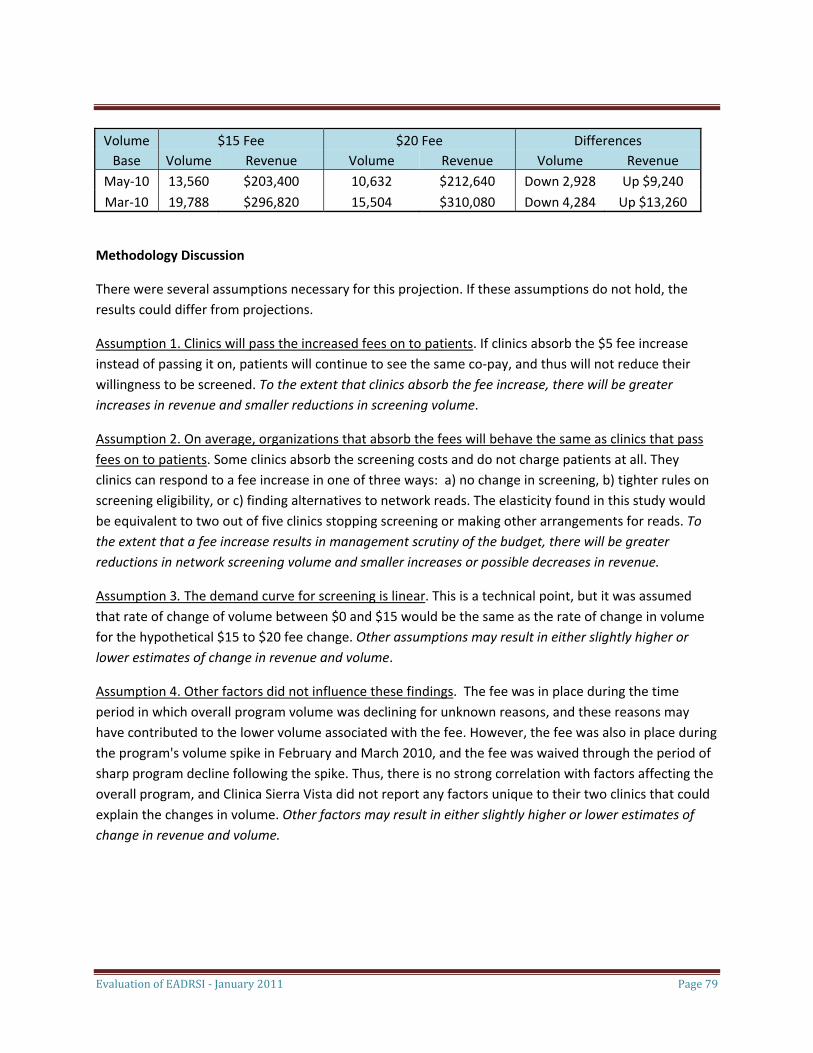
Evaluation of EADRSI ‐ January 2011 Page 79
Volume $15 Fee $20 Fee Differences Base Volume Revenue Volume Revenue Volume Revenue
May‐10 13,560 $203,400 10,632 $212,640 Down 2,928 Up $9,240 Mar‐10 19,788 $296,820 15,504 $310,080 Down 4,284 Up $13,260
Methodology Discussion
There were several assumptions necessary for this projection. If these assumptions do not hold, the results could differ from projections.
Assumption 1. Clinics will pass the increased fees on to patients. If clinics absorb the $5 fee increase instead of passing it on, patients will continue to see the same co‐pay, and thus will not reduce their willingness to be screened. To the extent that clinics absorb the fee increase, there will be greater increases in revenue and smaller reductions in screening volume.
Assumption 2. On average, organizations that absorb the fees will behave the same as clinics that pass fees on to patients. Some clinics absorb the screening costs and do not charge patients at all. They clinics can respond to a fee increase in one of three ways: a) no change in screening, b) tighter rules on screening eligibility, or c) finding alternatives to network reads. The elasticity found in this study would be equivalent to two out of five clinics stopping screening or making other arrangements for reads. To the extent that a fee increase results in management scrutiny of the budget, there will be greater reductions in network screening volume and smaller increases or possible decreases in revenue.
Assumption 3. The demand curve for screening is linear. This is a technical point, but it was assumed that rate of change of volume between $0 and $15 would be the same as the rate of change in volume for the hypothetical $15 to $20 fee change. Other assumptions may result in either slightly higher or lower estimates of change in revenue and volume.
Assumption 4. Other factors did not influence these findings. The fee was in place during the time period in which overall program volume was declining for unknown reasons, and these reasons may have contributed to the lower volume associated with the fee. However, the fee was also in place during the program's volume spike in February and March 2010, and the fee was waived through the period of sharp program decline following the spike. Thus, there is no strong correlation with factors affecting the overall program, and Clinica Sierra Vista did not report any factors unique to their two clinics that could explain the changes in volume. Other factors may result in either slightly higher or lower estimates of change in revenue and volume.


![The Guide - Diabetic Retinopathy - Vision Lossvisionloss.org.au/wp-content/uploads/2016/05/The... · the guide [diabetic retinopathy] What is Diabetic Retinopathy? Diabetic Retinopathy](https://img.pdfslide.us/doc/110x75/5e3ed00bf9c32e41ea6578a8/the-guide-diabetic-retinopathy-vision-the-guide-diabetic-retinopathy-what.jpg)