Embed Size (px)
Citation preview

Evaluation of the Emergency Blanket Supplementary Feeding Programme in five
districts of Northern Kenya
September 2010

Acknowledgements Particular gratitude goes to the very committed field teams of Save the Children UK, Islamic Relief, World Vision, Samaritans Purse, Merlin, Food for the Hungry Kenya, International Rescue Committee and the International Medical Corps for their courage and dedication to implement the blanket feeding programme amidst many challenges and uncertainties. Also to the beneficiary communities in Marsabit, Mandera, Turkana, Samburu and Wajir who contributed to the learning. Thanks to ECHO for supporting new implementation approaches and for availing the financial resources to implement this programme at scale, WFP and UNICEF for their financial and technical support towards this evaluation. Our Gratitude goes to the Ministry of Public Health and sanitation (MOPHS) for providing leadership and a conducive environment for the evaluation. Moragwa Oirere, Save the Children, UK Andrew Hall, University of Westminster, UK Assumpta Ndumi, Save the Children, UK September 2010

Emergency Blanket Supplementary Feeding Programme – Evaluation Report Sep 2010 By Save the Children UK
II
Table of Contents
Acknowledgements ............................................................................................................I
Table of Contents ............................................................................................................. II
Acronyms .........................................................................................................................III
Executive summary......................................................................................................... IV
1. Introduction............................................................................................................... 2 1.1 Context of Nutrition in Arid and Semi Arid Lands Kenya................................. 2
1.2 Rationale ............................................................................................................. 2
1.3 Implementation strategy...................................................................................... 3
1.3.1 Target Groups ............................................................................................. 4
1.3.2 Programme Design...................................................................................... 4
2. Project Monitoring and Impact evaluation ............................................................ 5 2.1 Monitoring and evaluation for performance and process at all sites .................. 5
2.1.1 Methodology............................................................................................... 5
2.1.2 Findings from performance and progress monitoring ................................ 6
2.2 Impact evaluation................................................................................................ 9
2.2.1 Methodology............................................................................................... 9
2.2.2 Findings of the impact evaluation............................................................. 11
2.2.3 Possible reasons for poor data quality ...................................................... 17
2.3 Overall findings from the assessment of the BSFP .......................................... 18
2.3.1 Functioning ............................................................................................... 18
2.3.2 Targeting ................................................................................................... 18
2.3.3 Coverage ................................................................................................... 19
2.3.4 Accessibility.............................................................................................. 20
2.3.5 Acceptability ............................................................................................. 20
2.3.6 Quality....................................................................................................... 20
2.3.7 Integration of the BSFP with existing programmes.................................. 20
3. Conclusion ............................................................................................................... 21
4. Lessons learnt .......................................................................................................... 21
5. Recommendations ................................................................................................... 23
6. Annexes .................................................................................................................... 24

Emergency Blanket Supplementary Feeding Programme – Evaluation Report Sep 2010 By Save the Children UK
III
Acronyms
ASAL Arid and Semi-Arid Lands BSFP Blanket Supplementary Feeding Programme CSB Corn Soya Blend ECHO European Commission on Humanitarian Aid GAM Global Acute Malnutrition GFD General Food Distribution IMAM Integrated Management of Acute Malnutrition MOH Ministry of Health NTF Nutrition Technical Forum (of the Kenyan Government) OTP Outpatient Therapeutic Programme PLW Pregnant and Lactating Women SFP Supplementary Feeding Programme UNICEF United Nations Children’s Fund WATSAN Water and Sanitation WFP World Food Programme WHO World Health Organization

Emergency Blanket Supplementary Feeding Programme – Evaluation Report Sep 2010 By Save the Children UK
IV
Executive summary
To prevent a peak in the incidence of malnutrition during the hunger gap (January – April 2010) a consortium of NGOs in collaboration with WFP implemented a blanket supplementary feeding programme funded by ECHO targeting all pregnant and lactating women and children less than 5 years old in 5 districts in Northern Kenya. The aim of this blanket feeding programme was to protect the nutritional status of the most vulnerable people (children, pregnant and lactating women) during the peak drought period.
Using both qualitative and qualitative methods, this evaluation was aimed at assessing the implementation of the BSFP and generating plausible evidence that would demonstrate that the BSFP achieves its objective. The BSFP was implemented for a period of 4 months from 21
st January to 31
st May 2010. The
target of the blanket feeding programme was an estimated 441,465 children and women in five districts. Each beneficiary was entitled to receive 250 g of corn-soya blend (CSB) and 25g vegetable oil per day to provide approximately 1,225 Kcal. In addition to the distribution of rations a complementary health package was administered. Findings: A significant positive change in the anthropometric status of the young children was observed during the period of implementation. While qualitative data showed that the ration played a role in improving the nutritional status of children, no firm conclusions can be made on the level of attribution. The coverage, functioning and quality of the programme proved to be supportive of the programme’s objectives, however proper planning and stronger coordination at all stages of the programme cycle is imperative for the BSFP to achieve it’s objectives. The BSFP proved to be supportive of other existing health and nutrition interventions. This can further be strengthened by proper and timely planning, monitoring and evaluation. Recommendations: A smaller pilot study should be implemented in one of the districts during the next hunger gap. This will be aimed at accessing the extent to which we can attribute change in nutritional status to the blanket supplementary rations. A cost benefit analysis is also imperative BSFP is a very expensive intervention. BSFP can be implemented during the hunger gap as a way to scale up and strengthen the existing health programmes especially immunization, vitamin A supplementation, IMAM and WATSAN. Given the dearth of information available on blanket supplementary feeding programmes an implementation and evaluation toolkit or manual should be developed in collaboration with the MOPHS to guide future interventions. This will facilitate knowledge and capacity transfer to partners involved in the implementation of BSFP.

Emergency Blanket Supplementary Feeding Programme – Evaluation Report Sep 2010 By Save the Children UK
2
1. Introduction
1.1 Context of Nutrition in Arid and Semi Arid Lands Kenya
The Arid and Semi Arid Lands (ASAL) of Kenya constitute approximately 80% of the land mass and pastoralism serves as the main source of livelihood. The ASAL regions are among the poorest in Kenya, where poor infrastructure, widespread insecurity, frequent droughts and limited livelihood options keep many residents in conditions of poverty and vulnerability. Recurring shocks and insecurity have created pockets of protracted relief operations that raise concerns about dependency on external assistance. Because population densities in the ASAL are low, the government in the past, has paid relatively little attention to the particular challenges that confront residents of the ASAL regions and thus to policies necessary to sustain and improve their livelihoods. The new coalition government in it’s vision 2030 recognizes the need to develop the ASALs if the country is to achieve economic development and the creation of the Ministry of development of Northern Kenya is a step in the right direction to develop policies and strategies geared towards development of these regions.
It is due to this vulnerability in ASAL areas that a number of Donors and NGOs have focused special attention to this area. However, despite the humanitarian efforts including many years of food aid, levels of acute malnutrition have continued to remain high above the 15% emergency thresholds (WHO). During periods of food insecurity such as the drought experienced in 2008/09, the Arid and Semi Arid (ASAL) districts saw very high levels of acute malnutrition >30% (<-2 Z scores and oedema) in some districts. Whilst the high malnutrition rates in the ASAL regions may be due to food insecurity as a result of the weakened livelihoods, the poor health infrastructure, low literacy levels, poor water and sanitation and poor child caring practices all play a significant role in maintaining the high levels of acute malnutrition hence the emergency food aid and therapeutic feeding programmes have not managed to bring these levels down over the years A number of NGOs and development partners have in the recent past been discussing new ways of addressing the chronically high levels of acute malnutrition and especially during the hunger gap period when malnutrition levels peak. The drought experienced in 2008/09 coupled with very high food prices severely affected the ASAL areas hence calling for a more effective response. The European Commission Humanitarian Aid (ECHO) together with partners in the nutrition technical forum (NTF) considered it an opportune time to pilot blanket supplementary feeding programme (BSFP) targeting 5 severely affected districts of Marsabit, Samburu, Turkana, Mandera and Wajir.
1.2 Rationale
The rationale for the Blanket Supplementary Feeding Programme (BSFP) was that it would prevent an increase in the incidence of acute malnutrition during the hunger gap between December 2009 and March 2010. This was based on the premise that: (i) blanket feeding of all children and pregnant and lactating mothers would prevent a deterioration in the nutritional status of those at greatest risk of malnutrition; (ii) blanket supplementary feeding would improve timely detection and referral of the malnourished children, pregnant and lactating women; and (iii) the impact of this programme would provide guidance on strategies and policies to address future chronic food insecurity and the high prevalence of malnutrition. The assumption was that while food aid was being delivered in these districts the Ministry of Health would focus on improving immunization and micronutrient supplementation coverage. ECHO therefore decided to make available € 5,000,000 to the World Food Programme (WFP) who were already delivering food aid and hence had the capacity to procure and deliver huge amounts of supplementary foods to the five target districts. The primary aim of the blanket feeding programme was to sustain the nutritional status of children less five years of age. The
Emergency Blanket Supplementary Feeding Programme – Evaluation Report Sep 2010 By Save the Children UK
3
secondary aims were to minimize the number of children who needed therapeutic or supplementary feeding, to reduce the incidence of infectious diseases, and to prevent deaths.
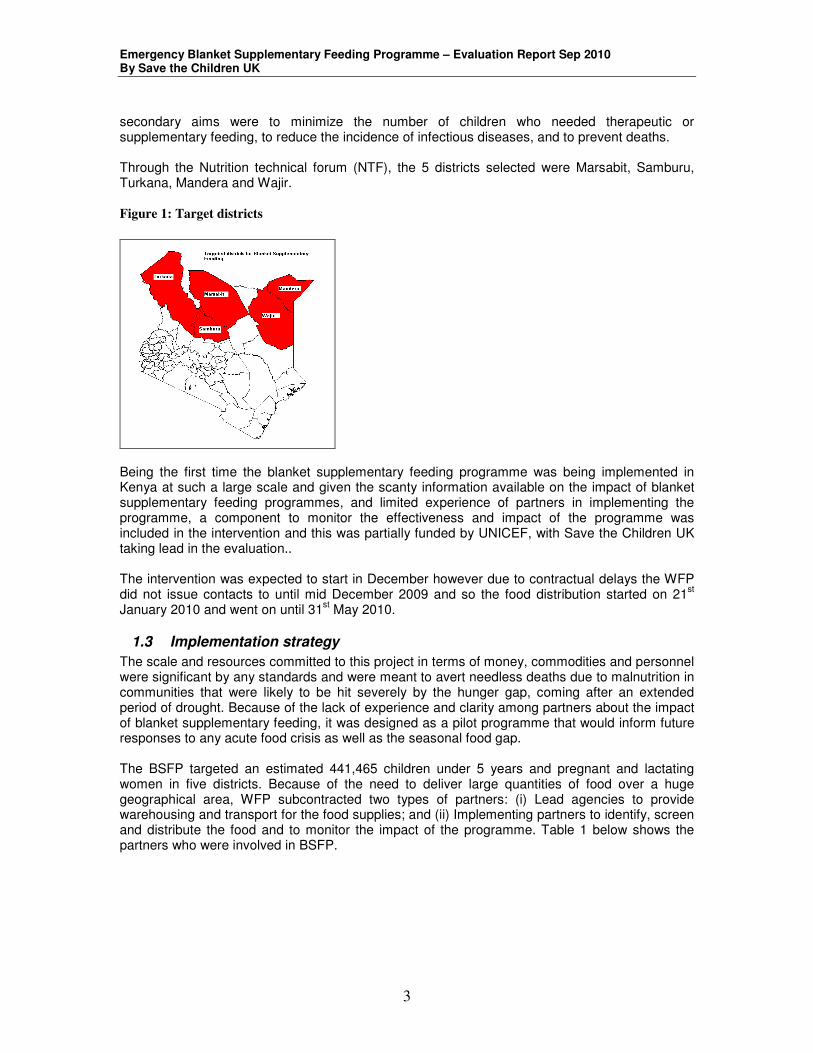
Through the Nutrition technical forum (NTF), the 5 districts selected were Marsabit, Samburu, Turkana, Mandera and Wajir. Figure 1: Target districts
Being the first time the blanket supplementary feeding programme was being implemented in Kenya at such a large scale and given the scanty information available on the impact of blanket supplementary feeding programmes, and limited experience of partners in implementing the programme, a component to monitor the effectiveness and impact of the programme was included in the intervention and this was partially funded by UNICEF, with Save the Children UK taking lead in the evaluation.. The intervention was expected to start in December however due to contractual delays the WFP did not issue contacts to until mid December 2009 and so the food distribution started on 21
st
January 2010 and went on until 31st May 2010.
1.3 Implementation strategy
The scale and resources committed to this project in terms of money, commodities and personnel were significant by any standards and were meant to avert needless deaths due to malnutrition in communities that were likely to be hit severely by the hunger gap, coming after an extended period of drought. Because of the lack of experience and clarity among partners about the impact of blanket supplementary feeding, it was designed as a pilot programme that would inform future responses to any acute food crisis as well as the seasonal food gap. The BSFP targeted an estimated 441,465 children under 5 years and pregnant and lactating women in five districts. Because of the need to deliver large quantities of food over a huge geographical area, WFP subcontracted two types of partners: (i) Lead agencies to provide warehousing and transport for the food supplies; and (ii) Implementing partners to identify, screen and distribute the food and to monitor the impact of the programme. Table 1 below shows the partners who were involved in BSFP.

Emergency Blanket Supplementary Feeding Programme – Evaluation Report Sep 2010 By Save the Children UK
4
Table 1: Lead agencies and specialized agencies working in the arid Districts
District Lead agencies Implementing partners Targeted population
Marsabit Kenya Red Cross Food for the Hungry 40,862
Samburu Rhamati IMC, World Vision 45,058
Turkana Oxfam World Vision, Merlin, Samaritan’s Purse, International Rescue Committee
127,148
Wajir Aldef, WASDA Islamic Relief, Save the Children 142,524
Mandera CoCoop Islamic Relief, Save the Children 85,873
1.3.1 Target Groups
The BSFP targeted:
• All children 6-59 months
• All pregnant women
• Lactating women (with child < 6 months old)
1.3.1.1 Selection criteria for children
Through consensus amongst partners it was agreed that any child <110 cm and >65cm in height was eligible to receive a ration. Internationally 65 -110cm is the agreed height cut-offs denoting children aged 6-59 months. A height stick was used to screen all the children <110cm. In cases where the cutoff (<110cm) was disputed, the health cards or events calendar were used to confirm age of child.
1.3.1.2 Selection criteria for pregnant and lactating women
The selection criteria used for the pregnant women was as follows:
• All the pregnant women with visible pregnancy.
• If pregnancy was not visible, the mother was asked for the antenatal card for confirmation and if she did not have the card, she was referred to the nearest health facility for confirmation.
The selection criterion for the lactating women was:
• Mothers with children < 6 months and who were breastfeeding.
1.3.2 Programme Design The BSFP was implemented for a period of 4 months from January to May 2010. The BSFP was designed to complement the targeted General Food Distribution (GFD), the protection rations, and the targeted therapeutic feeding programmes: the Outpatient Therapeutic Programme (OTP) and the Supplementary Feeding Programme (SFP). Each beneficiary was entitled to 250g per day (7.5kg per month) of CSB and 25g per day of oil (0.75Kg per month). The ration was to provide 1,221 Kcal per day. In addition to the distribution of rations the following services were provided at each distribution site:
a) Screening. All beneficiaries were screened for malnutrition by measuring their mid-upper arm circumference (MUAC) at registration points and children found to be severely or moderately malnourished were referred to health facilities or sites implementing SFP and OTP, in addition to being given a ration under BSFP. Beneficiaries who were found to be sick were also referred for medical care at the nearest heath facility.
b) Health education sessions. The majority of mothers were given health education which included: information on infant and young child feeding; household water and sanitation practices and were shown how to cook the CSB and oil.

Emergency Blanket Supplementary Feeding Programme – Evaluation Report Sep 2010 By Save the Children UK
5
c) Systematic Treatment. Children were given vitamin A and dewormed using mebendazole or were immunized if necessary according to Ministry of Health protocols
The World Food Programme (WFP) was the primary agency responsible for implementing the BSFP programme. Their role included the procurement and transportation of the food commodities to warehouses in the five districts. Once the food was delivered to the warehouses, the lead agencies were then supposed to repackage the food rations into 7.5kg bags of CSB and 1liter bottles of oil to ensure that each beneficiary received their right entitlements. However, due to a number of challenges repackaging of the rations was not done. The food was then delivered to the distribution sites a day prior to the planned day of distribution. Once the food arrived at the distribution sites, the community was responsible for offloading the food from the truck, providing the storage facilities and security for the food. The transporters alongside the village elders were responsible for coordinating the offloading of food. The actual distribution of the food commodities to the beneficiaries was managed by the NGOs or specialised implementing partners (IPs). The implementing partners were responsible for carrying out community mobilisation a week before the distribution date. However due to food delivery delays, community mobilisation at the sites was only done a day or two prior to the distribution.
2. Project Monitoring and Impact evaluation Save the Children UK was commissioned to lead the monitoring and evaluation of the BSFP on behalf of ECHO, UNICEF, WFP and all the implementing partners. The aim of the evaluation was to generate plausible evidence that:
1. The intervention preserved the anthropometric status of vulnerable children and women during the peak hunger period in early 2010;
2. The targeting, coverage, functioning and quality of the programme supported the programme’s objectives;
3. The intervention complemented and supported other nutrition, health and food-security interventions in the same areas.
There were two main aspects to the monitoring and evaluation that were employed: Monitoring and evaluation for performance and process at all sites and Impact evaluation at cohort sites
2.1 Monitoring and evaluation for performance and process at all sites
2.1.1 Methodology
Monitoring and evaluation for performance combined both qualitative and quantitative methods. The quantitative method was based on data collected at all the distribution sites using a tally system. All beneficiaries had their MUAC taken and recorded in the tally sheets. The MUAC data was aggregated to give (i) the total number of beneficiaries reached and (ii) trends in the nutrition status of beneficiaries measured using MUAC at each distribution. The qualitative method involved use of focus group discussions with the beneficiaries and implementing agencies, key informant interviews with the implementing agencies and a programme review at the end of the programme.

Emergency Blanket Supplementary Feeding Programme – Evaluation Report Sep 2010 By Save the Children UK
6
2.1.2 Findings from performance and progress monitoring
2.1.2.1 BSFP achievement:
Good coverage It was proposed that the BSFP would provide a ration to pregnant and lactating women and children less than 5 years old in five districts in Northern Kenya with an estimated total population of 441,465. The BSFP was able to reach and surpass the targeted number of beneficiaries as shown below: Table 2: Number of beneficiaries reached per distribution cycle Distribution cycle No. Of beneficiaries reached
First 350,578
Second 421, 444
Third 481, 574
Fourth 507, 489
Figure 2: The numbers of beneficiaries reached by the blanket supplementary feeding programme in five districts of northern Kenya against the estimated target.
Trends of the Beneficiary Numbers (Jan- May 2010)
0
50,000
100,000
150,000
200,000
District
Num
ber of beneficia
ries reached
during d
itributions
Targets 142,524 85,873 40,862 45,058 127,148
1st cycle 81,815 80,979 35,027 44,506 108,251
2nd cycle 116,356 89,039 41,133 50,168 124,748
3rd cycle 149,678 113,408 42,321 55,768 120,399
4th cycle 161,384 122,355 42,343 54,190 127,217
Wajir Mandera Marsabit Samburu Turkana
Coverage of children by sex Both sexes were well represented with the ratio of the girls and boys reached being 1:1. The proportion of girls reached was slightly higher than the boys reached. Annex 10 gives the number of beneficiaries reached by sex.
Coverage of pregnant and lactating women (PLW) The number of pregnant and lactating women reached increased between the first and fourth distribution from 69,548 to 88,189. Nutritional status Overall, the MUAC data collected from the beneficiaries indicated some improvement in the anthropometric status of the children, pregnant and lactating women in all the districts over the 4 months As shown below. Annex 9 provides detailed MUAC screening data for children less than 5 years in all of the five target districts during the distributions.

Emergency Blanket Supplementary Feeding Programme – Evaluation Report Sep 2010 By Save the Children UK
7
Figure 3: Trends in MUAC status
Trends in MUAC <12.5cm amongst children Under 5 years in
the 5 districts
0.0%
5.0%
10.0%
15.0%
20.0%
25.0%
Mandera Wajir Turkana Samburu Marsabit
Districts
Pro
port
ion o
f childre
n
1st distribution
2nd distribution
3rd distribution
4th distribution
Referral to SFP and OTP Children identified with a MUAC <115mm were referred to a Therapeutic Feeding Programme (TFP) and those with MUAC 115 - <125mm and PLW <210mm to be referred to SFP. This proved to be supportive of the Integrated Management of Acute malnutrition (IMAM). The MUAC data showed that over time the proportion of children needing SFP (MUAC 115-125mm) and TFP (MUAC <115) decreased in all the districts. Figure 4: proportion of children in need of supplementary and therapeutic feeding in the 1st, 2nd,
3rd and 4th distribution
Trends of children who needed supplementary and
therapeutic feeding during the distribution
0.0%
2.0%
4.0%
6.0%
8.0%
10.0%
12.0%
14.0%
1st 2nd 3rd 4th
Round of distribution
Perc
en
tag
e o
f ch
ild
ren
SFP
OTP
Systematic treatment Within the BSFP, mass immunization, Vitamin A supplementation and De-worming for under-fives was included as a complementary and was undertaken by the implementing agencies in partnership with MOH. BSFP proved to be a good way to reach children in the remote areas who do not have access to health care services due to the large distances to health facilities. 87,238 beneficiaries received vitamin A while 7,995 beneficiaries received measles vaccines. The table attached as Annex 3

Emergency Blanket Supplementary Feeding Programme – Evaluation Report Sep 2010 By Save the Children UK
8
provides data on the numbers of children immunized, receiving Vitamin A or de-worming as part of the distribution. Health education Within BSFP, health education and cooking demonstrations were offered to the people who were attending the distributions. This proved to be supportive of other Health and nutrition interventions. The messages that were discussed in the sessions included:
• How to promote good care practices • Importance of breast feeding • Causes and prevention of malnutrition • Importance of immunization • How to promote health and hygiene
2.1.2.2 Key issues for concern that came up during progress monitoring
Food delivery delays: Poor coordination and planning between, lead agencies, transporters and implementing partners led to food delivery delays. Under-estimating and over-estimation of beneficiary figures in some sites: Population figures used for the initial planning were based on 1999 census projections and hence were in some cases inaccurate. Centralized sites: some of the sites were quite centralized hence making it hard for beneficiaries to access the food. Inadequate community mobilization: due to the urgency of the programme, the first BSFP distributions started before the community clearly understood what BSFP was all about. Hence, in some sites there were impatient beneficiaries who made it hard for implementing partners to carry out the distributions while in other sites, beneficiaries totally went out of control and self distributed the food as was the case in Gotade in Wajir East. Long rain season: The long rains came earlier than expected and prevailed, throughout the distributions in most districts. This led to the disruption and delay of distributions in all districts, while some sites totally missed out on a round of distribution due to the impassable roads. Insufficient storage capacity: In Turkana, the distributions started much later and took longer to be finished due to logistical challenges faced by the lead agency; the lead agency in Turkana did not have sufficient capacity to receive both GFD and BSFP at the same time hence GFD was given priority thereby delaying BSFP distributions. Lack of proper transportation and storage facilities: In Samburu and Mandera food was rained on during transportation and was reported to have spoiled on arrival at the distribution site. All the districts reported to have had a challenge with storage facilities during the distribution. Some of the remote distribution sites did not have stores at all and those that had stores, these were too weak and were not build in a way that protected the food from the rain hence risking spoilage. Low number of field workers per site: Some sites had few numbers of field workers serving a large number of beneficiaries hence the field workers were overstretched thereby compromising on quality of services delivered and data collected. This was mainly due to poor planning. No Repackaging of Rations: The lead agencies were responsible for the repackaging of the rations into 7.5 kg bags of CSB and 0.75kg containers of vegetable oil. However, they were not

Emergency Blanket Supplementary Feeding Programme – Evaluation Report Sep 2010 By Save the Children UK
9
able to repackage the food as was proposed as this proved to be practically impossible due to the large tonnage of food received and short time required to repackage and distribute the food. Shortages of vaccines and vitamin A supplements: The availability of vaccines was a major challenge. Most of the districts reported not to have had sufficient vaccines and stocks of Vitamin A.
2.2 Impact evaluation
2.2.1 Methodology
The evaluation involved studying a randomly selected cohort of beneficiary children throughout the programme in an attempt to attribute any change in the nutrition status to the intervention. This cohort study was undertaken in a random selection of sites in the three districts of Mandera, Wajir and Turkana. The design of the programme imposed major limitations on estimating the impact of the ration on children’s anthropometric status. In order to attribute any change in weight gain to the intervention was necessary to know what would have happened without the intervention, in other words to have an untreated control group. For example, as young children are expected to gain some weight over a 4-month period as a result of their normal food intake even if that was diminished by food insecurity, it is necessary to know what that additional weight gain would be so that the effect of the supplementary food could be assessed. Even if the ration only served to sustain children’s body weight during the hunger gap it would be necessary to have an unfed control group to know that no weight gain was achieved because without the ration, children may have lost weight and become more wasted so the ration prevented a deterioration in anthropometric status. The evaluation of a programme for which all potential subjects with the same geographic area are eligible also poses particular problems in separating the impact of the programme from other factors that also influence all subjects at the same time, because the different influences cannot be separated. For example, an unexpected improvement in the food security situation at the same time that the BSFP was being delivered would mean that the impact of the two factors could not be separated. As it is obviously unethical in a potential humanitarian emergency to have an untreated control group or to apply a stepped wedge design whereby the intervention is phased in, other means were applied to try to detect the impact of the programme. Five main ways were identified by which some plausible evidence of the impact of the rations could be detected. First, by comparing data collected during the BSFP on the prevalence of wasting and other anthropometric indices with data collected over the same period in previous years or in general over several preceding years. Second, by comparing new recruits to the programme at the second and third food distributions with children who were enrolled at the first round of food distribution. Their anthropometric status on enrolment may reflect the situation of children in the same locality who have not yet received a ration and they could be compared with the anthropometric status of children who were enrolled at the first food distribution, some 30 days earlier. However these later recruits could be different for some reason, while the numbers of children who are newly enrolled after the first distribution may be too small to provide a sufficient sample size for analysis. Third, by detecting a greater effect on the z-scores of children who have received four rations compared with children who have received 3 or fewer rations because they are late-enrolled or

Emergency Blanket Supplementary Feeding Programme – Evaluation Report Sep 2010 By Save the Children UK
10
did not collect a ration when it was available. This analysis requires data on children measured at two points and needs to control for age, sex and initial z-score, as the response to the ration may be related to the initial degree of malnutrition. Fourth, by detecting a significantly greater effect of the ration on the z-scores of children who are single beneficiaries of the food. This analysis also requires paired data and could be done by comparing single beneficiaries with beneficiaries in households in which there are other, older children who do not get a ration, based on the hypothesis that the food is less likely to be shared in a single child household but will be shared in a multiple child household. Finally, the data would also allow an analysis of factors that are associated with the change in z-score of weight-for-height of children participating in a blanket feeding programme in northern Kenya. For example: the age and sex of the child; prior anthropometric status; prior vaccination status; family size and dependency ratios; diseases experienced over the period of study; and participation in other programmes that provide food, cash or other assistance. This is an analysis of associated factors. These five types of analyses – historical data, new recruit controls, dose response effects, single beneficiaries and associated factors – were put together to provide plausible evidence of the impact of the programme. Critical assumptions
The analyses proposed required that: 1. Individual children would be weighed and measured at least twice, at enrolment and up to 4
months later after receiving between one and four rations of food, so that data on the change in measurements and anthropometric indices could be estimated; this is called paired data.
2. Mothers would bring the same child to collect the ration on each occasion and would give
information when questioned about her child that, to the best of her ability, was accurate and consistent at each occasion.
3. All mothers of cohort children would return with the same child to collect at 5
th, additional,
ration so that the effect of the four BSFP rations could be estimated over a period of four months,
4. The drought would persist throughout the blanket supplementary feeding programme so
that there was no change in household food security that could contribute to an improvement in children’s anthropometric status.
5. Good quality data would be collected and recorded accurately by well-trained field staff who
had sufficient time to interview mothers and measure children carefully. Sampling methods
Twenty-five distribution sites were randomly chosen in each District. The probability of selection was in proportion to the estimated number of children at each site, although this number was calculated from the estimated number of children in the division, divided by the number of sites. A systematic sampling procedure was used to select children to study in each site after the first had been randomly selected. The sampling interval was based on the expected number of children so that a 10% sample could be selected. All children were identified by a unique 9-digit identification (ID) number that was used to link data collected at enrolment with data collected at any distribution site that the mother attended to collect subsequent rations. Mothers whose

Emergency Blanket Supplementary Feeding Programme – Evaluation Report Sep 2010 By Save the Children UK
11
children were enrolled in the cohort were offered a 5th ration, to be collected 30 days after the 4th and final ration given by the programme. This ration was used as an incentive for mothers to bring back children to be weighed and measured after receiving and presumably having consumed four rations. The names of the mother, her child and their village was recorded in a register book so that the mother and child could later be found if they failed to appear to collect the 5th ration and to be weighed and measured. Participation was on the basis of informed consent. Every mother or carer who agreed to participate was interviewed and basic demographic and socio-economic data were collected. The weight, length and mid-upper arm circumference of each child was measured using standard procedures: The mother’s mid upper arm circumference was measured to a precision of 2 mm. The age of each child was either copied from the child’s health card or estimated using a local calendar of events to a precision of one month. Z-scores of anthropometric indices were calculated using a macro for Stata v 11 which applies the WHO reference values. Children with z-scores of height-for-age, weight-for-age, weight-for-height, BMI-for-age and MUAC-for-age of <-2 S.D. below the median were classified as stunted, underweight, wasted, thin, and low MUAC respectively. Each child was given a physical examination and medical information was collected about recently received vitamin A supplements, vaccination, breastfeeding and illnesses. Any mother who brought an eligible child that had not previously been registered for a ration was recruited at the second, third and fourth food distributions for the remainder of the programme. Such children were considered as new recruits to the programme and the same data collected at the first food distribution was collected. At the 5th and final food distribution for cohort subjects only, a short questionnaire was administered to assess food access, food consumption and the satisfaction with the programme. The anthropometric measurements made when the child was enrolled were repeated. Table 2 shows the timing of the anthropometric measurements and the collection of the ration.
Table 3: The plan and timing of anthropometric measurements and rations for the cohort of children
recruited for the evaluation
Interval (days) 30 days 30 days 30 days 30 days
Time (months) 0 1 2 3 4
Anthropometry 1 2 3 4 5
Ration 1st 2nd 3rd 4th 5th
incentive
If any child in the cohort had died during the programme then they could not be brought back to collect the 5th ration and the loss of their paired data from the analysis could bias the results, especially if malnutrition had contributed to the cause of death or the survivors were better nourished. It has been estimated that this survivor bias may have an effect on anthropometric status if the excess death rate is >50/1,000 children (Boerma et al., 1992). Such children were classified as ‘no-show’ and a random sample of an arbitrary 20% were selected to be visited at home to check their status and the reason for not collecting the 5th ration.
2.2.2 Findings of the impact evaluation
The main reason for undertaking the impact evaluation was to demonstrate that the BSFP preserved anthropometric status. Table 1 below shows that there was a positive and significant

Emergency Blanket Supplementary Feeding Programme – Evaluation Report Sep 2010 By Save the Children UK
12
difference observed in the means of all the children’s anthropometric measurements and indices between enrolment and the fourth distribution except for weight-for-age and BMI-for-age. Height-for-age was lower at the 5
th and final distribution whereas the other measurements and indices
were higher. The variations by districts are given in Annex 1-6.
The table below shows that the prevalence of indicators of under nutrition were lower at the 5
th
distribution than the first, all of which were statistically significant.
These results from the cohort children confirmed the data that was collected from all beneficiaries in the five districts which indicated an improvement in MUAC status of the children and a decrease in the proportion of children who needed supplementary and therapeutic feeding as discussed in section 3.1.1. Nutrition survey data from the previous two years were compared with nutrition survey data collected in 2010 during the same time of the year. From the nutrition surveys undertaken in March – June 2010, decrease in the prevalence of wasting (Weight for height <-2SD) were observed especially in Wajir east, Turkana and Marsabit districts. Figure 5 gives the trends in the prevalence of wasting in the arid districts between 2008 and 2010, while the annex 11 gives the comprehensive figures of the prevalence of wasting.

Emergency Blanket Supplementary Feeding Programme – Evaluation Report Sep 2010 By Save the Children UK
13
Figure 5 : Trends in the prevalence of wasting between 2008 and 2010
Prevelence of Wasting in the Arid Districts
0.0%
5.0%
10.0%
15.0%
20.0%
25.0%
30.0%
35.0%Tur
kana
Nor
th W
est
Turka
na E
ast
Turka
na S
outh
Turka
na C
entra
l W
ajir
Sou
th
Waj
ir Eas
tW
ajir
Nor
th
Waj
ir W
est
Man
dera
Wes
t - M
alka
mar
i
Man
dera
Wes
t - T
akab
a
Man
dera
Cen
tral
Man
dera
Eas
t Sam
buru
Mar
sabi
t/Laisa
mis
Districts
Perc
en
tag
e
(weig
ht-
for-
ag
e <
-2 S
.D)
GAM '08 GAM '09 GAM 10
Most (80%) of the 20 focused group groups discussions carried out reported that that the rations played a role in improving the anthropometric status of the children. This was attributed to the fact that the rations ensured that there was a constant supply of food within the household. According to the famine and early warning system network, there was above average rainfall in most areas during the first quarter of 2010 which resulted in substantial improvements in the availability of pasture and water. Most households were able to milk 1-2 litres of milk per cow in a day, which improved food security for the pastoral community. However, this was still significantly below the normal 3-5 litres. The improvement in food security coupled with the blanket supplementary feeding programme are probably both responsible for any decline in the prevalence of indicators of under nutrition in children in the arid districts of northern Kenya in early 2010.
1
Although the results in Table 2 indicate a significant positive difference in the anthropometric status of children in the cohort, no firm conclusions can be drawn about the extent to which the changes can be attributed to the ration.
2.2.2.1 Reasons why no firm conclusions can be drawn
i) The rainfall was greater than expected An assumption was made before the evaluation that the drought would persist throughout the period of the blanket supplementary feeding programme so that the nutritional status of new recruits to the programme at the second and third food distributions would be worse than the children who were enrolled at the first round of food distribution. Figure 6 indicates that the anthropometric status of new recruits was no different to children at the first distribution as the 95% confidence intervals overlap between each data point. This suggests that the anthropometric status of children was not deteriorating over the first two months of the BSFP intervention.
1 Food Security update, May 2010
http://www.fews.net/docs/Publications/Kenya_FSU_May_2010_final.pdf

Emergency Blanket Supplementary Feeding Programme – Evaluation Report Sep 2010 By Save the Children UK
14
Figure 6: The percentage of children classified as wasted, underweight or with a low MUAC-for-age
at the 1st, 2nd or 3rd food distribution
A. Wasted: weight-for-height/length <-2Zscore
0
5
10
15
20
25
30
35
40
45
0 10 20 30 40 50 60
Days
Perc
enta
ge
2nd1st 3rd
B. Underweight: weight-for-age <-2 z-score
0
5
10
15
20
25
30
35
40
45
0 10 20 30 40 50 60
Days
Perc
enta
ge
2nd1st 3rd
C. Low MUAC: MUAC-for-age <-2 Z-scores
0
5
10
15
20
25
30
35
40
45
0 10 20 30 40 50 60
Days
Perc
enta
ge
2nd1st 3rd
Emergency Blanket Supplementary Feeding Programme – Evaluation Report Sep 2010 By Save the Children UK
15
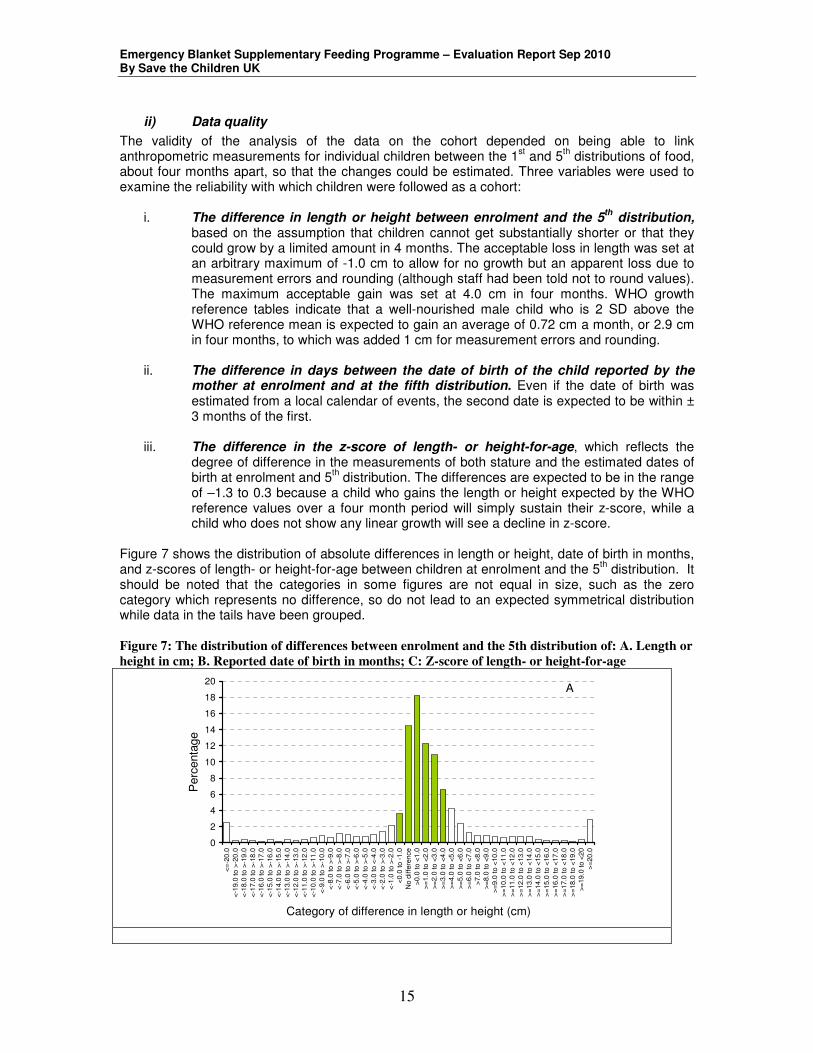
ii) Data quality
The validity of the analysis of the data on the cohort depended on being able to link anthropometric measurements for individual children between the 1
st and 5
th distributions of food,
about four months apart, so that the changes could be estimated. Three variables were used to examine the reliability with which children were followed as a cohort:
i. The difference in length or height between enrolment and the 5th
distribution, based on the assumption that children cannot get substantially shorter or that they could grow by a limited amount in 4 months. The acceptable loss in length was set at an arbitrary maximum of -1.0 cm to allow for no growth but an apparent loss due to measurement errors and rounding (although staff had been told not to round values). The maximum acceptable gain was set at 4.0 cm in four months. WHO growth reference tables indicate that a well-nourished male child who is 2 SD above the WHO reference mean is expected to gain an average of 0.72 cm a month, or 2.9 cm in four months, to which was added 1 cm for measurement errors and rounding.
ii. The difference in days between the date of birth of the child reported by the
mother at enrolment and at the fifth distribution. Even if the date of birth was estimated from a local calendar of events, the second date is expected to be within ± 3 months of the first.
iii. The difference in the z-score of length- or height-for-age, which reflects the
degree of difference in the measurements of both stature and the estimated dates of birth at enrolment and 5
th distribution. The differences are expected to be in the range
of –1.3 to 0.3 because a child who gains the length or height expected by the WHO reference values over a four month period will simply sustain their z-score, while a child who does not show any linear growth will see a decline in z-score.
Figure 7 shows the distribution of absolute differences in length or height, date of birth in months, and z-scores of length- or height-for-age between children at enrolment and the 5
th distribution. It
should be noted that the categories in some figures are not equal in size, such as the zero category which represents no difference, so do not lead to an expected symmetrical distribution while data in the tails have been grouped. Figure 7: The distribution of differences between enrolment and the 5th distribution of: A. Length or
height in cm; B. Reported date of birth in months; C: Z-score of length- or height-for-age
0
2
4
6
8
10
12
14
16
18
20
<=
-20
.0
<-1
9.0
to
>-2
0.0
<-1
8.0
to
>-1
9.0
<-1
7.0
to
>-1
8.0
<-1
6.0
to
>-1
7.0
<-1
5.0
to
>-1
6.0
<-1
4.0
to
>-1
5.0
<-1
3.0
to
>-1
4.0
<-1
2.0
to
>-1
3.0
<-1
1.0
to
>-1
2.0
<-1
0.0
to
>-1
1.0
<
-9.0
to
>-1
0.0
<
-8.0
to >
-9.0
<
-7.0
to >
-8.0
<
-6.0
to >
-7.0
<
-5.0
to >
-6.0
<
-4.0
to >
-5.0
<
-3.0
to <
-4.0
<
-2.0
to >
-3.0
<
-1.0
to >
-2.0
<
0.0
to -
1.0
N
o d
iffe
rence
>
0.0
to <
1.0
>
=1.0
to <
2.0
>
=2.0
to <
3.0
>
=3.0
to <
4.0
>
=4.0
to <
5.0
>
=5.0
to <
6.0
>
=6.0
to <
7.0
>
7.0
to <
8.0
>
=8.0
to <
9.0
>
=9.0
to <
10
.0
>
=10.0
to <
11
.0
>
=11.0
to <
12
.0
>
=12.0
to <
13
.0
>
=13.0
to <
14
.0
>
=14.0
to <
15
.0
>
=15.0
to <
16
.0
>
=16.0
to <
17
.0
>
=17.0
to <
18
.0
>
=18.0
to <
19
.0
>
=19.0
to <
20
>
=20
.0
Category of difference in length or height (cm)
Perc
enta
ge
A

Emergency Blanket Supplementary Feeding Programme – Evaluation Report Sep 2010 By Save the Children UK
16
0
5
10
15
20
25
30
≤
-13
-12-11-10 -9 -8 -7 -6 -5 -4 -3 -2 -1 0 1 2 3 4 5 6 7 8 9 10 11 12 ≥
13
Difference in dates of birth at enrolment and 5th distribution
(months)
Perc
enta
ge
B
0
5
10
15
20
25
30
≤ -
1.5
-1.4
to
>-1
.5
-1.3
to
>-1
.4
-1.2
to
>-1
.3
-1.1
to
>-1
.2
-1.0
to
>-1
.1
-0.9
to
>-1
.0
-0.8
to
>-0
.9
-0.7
to
>-0
.8
-0.6
to
>-0
.7
-0.5
to
>-0
.6
-0.4
to
>-0
.5
-0.3
to
>-0
.4
-0.2
to
>-0
.3
-0.1
to
>-0
.2
<0
.0 t
o >
-0.1
0.0
to
<0.1
0.1
to
<0.2
0.2
to
<0.3
0.3
to
<0.4
0.4
to
<0.5
0.5
to
<0.6
0.6
to
<0.7
0.7
to
<0.8
0.8
to
<0.9
0.9
to
<1.0
0.9
to
<1.0
1.1
to
<1.2
1.2
to
<1.3
1.3
to
<1.4
1.4
to
<1.5
≥ 1
.5
Difference between z-scores of length- or height-for-age
Perc
enta
ge
C
Table 4 shows the percentage of subjects whose values were classified as low, satisfactory or high using the arbitrary ranges described above. When differences in stature and date of birth are combined, only 32% of differences between children at enrolment and the 5
th distribution are
classified as satisfactory. Table 4: The differences in the length, date of birth and z-scores of length- or height-for-age between
subjects at the 5th distribution and enrolment.
Variable Unit N Low Satisfactory High
Difference in length or height
Cm 3,041 10.8 68.6 16.8
Difference between dates of birth
months 3,071 25.5 44.8 29.7
Difference in length or height-for-age
z-scores 2,899 28.9 31.9 39.2

Emergency Blanket Supplementary Feeding Programme – Evaluation Report Sep 2010 By Save the Children UK
17
2.2.3 Possible reasons for poor data quality
3.1.2.1 Recording errors The first source of error is in measurement and recording. Children may have been measured incorrectly; the data may have been written down incorrectly on the form, especially if it was transcribed from a piece of paper to the data form (which was against instructions); the data may have been written in the wrong box; or the data may have been written on the form for a child with a different ID number. There are a number of bits of evidence for such errors. At enrolment 11 children (0.3%) were less than 58.9 cm, the expected length of a six-month old girl who is 3 z-scores below the median. At enrolment 109 children were more than 110 cm in height (3.1%), the upper threshold of height used for admittance to the blanket feeding programme, and included three values >200 cm. The percentages of the same errors at the 5
th distribution were lower: 0.1% and 1.8% (n = 3,069),
suggesting that experience and less pressure to measure children had improved the data quality. But these possible errors are not sufficient to explain the number of probably unpaired observations. 3.1.2.2 Data entry The second source of error is in data entry. Data forms were transported to Nairobi for data entry on lap-top computers. This was not ideal to identify fieldworkers who were consistently making obvious errors, or for accurate data entry. It is also best to enter numerical data in the field, using a keyboard with a numeric keypad. 3.1.2.3 Mothers bringing different children The third source of error is in the dates of birth. The date of birth of each child was recorded at both enrolment and the 5
th distribution. It was the same for only 21.2% of 3,071 children, it was
within ± 3 months for 44.8%, and was different by more than a year for 15.5%. This could have occurred because some mothers brought a different child to collect the ration at the 5
th
distribution, or because the data for a child was written on the form for another child. It is also notable that if a threshold of 110 cm was used as the basis for admission to the feeding centres, only 2.6% of children in the sample were older than 5 years, including outliers that were obviously measurement errors. It would have been expected that as the 110 cm threshold is based on the expected height of a 5-year old child of median height, it could have included stunted children in the feeding programme and study sample who were older than 5 years. For example a boy aged 6 year 9 months who is 2 S.D, below the median height is expected to be 109.9 cm, so would have been eligible for a ration. This suggests either that the partners who were implementing the programme were applying an upper age to limit entry to the programme or mothers, thinking that 5 years was the upper age limit, were understating their child’s age to ensure inclusion. But the most likely explanation is that mothers brought back different children in some instances and in others gave different names for the children who were brought to the distribution sites. As the fieldworkers did not have the data forms from enrolment, they would not have been aware that a different child had been brought to collect the 5
th ration.
3.1.2.4 Errors in age There is evidence to suggest that the mixed entry criteria of age and height led mothers understate the age of some children to ensure their entry to the programme. The fact that there were very few children < 110 cm in the cohort also suggests that this threshold was not being widely applied as there should have been a substantial number of stunted children older than 5 years. These factors probably led to the underestimation of z-scores based on age, such as height-for-age, weight-for-age, BMI-for-age and MUAC-for-age such that these data were unreliable for use to assess the impact of any intervention on such anthropometric indices. This is also suggested by the fact that data on weight-for-height were more consistent between Districts.
Emergency Blanket Supplementary Feeding Programme – Evaluation Report Sep 2010 By Save the Children UK
18
2.3 Overall findings from the assessment of the BSFP
The functioning, targeting, acceptability, accessibility, quality and coverage of BSFP were assessed in with an aim of generating evidence that the programme’s performance is supportive of the overall objective.
2.3.1 Functioning
The implementation strategy was discussed with all partners involved and the roles of each partner were clearly stated. The BSFP had a number of partners involved along the supply chain and the success of the programme relied on each partner playing their roles efficiently and effectively. A high level of coordination was required. Due to the urgency of implementing the BSFP, not all the partners were able to put together the structures needed to support the programme. Also given that the BSFP was being implemented on a such large scale for the first time, it was a learning experience for most of the partners with many of them realizing that some of their implementation plans were poorly designed and thereby having to reorganize during the programme. An example of a case where the partners had to reorganize was the repackaging of the CSB and vegetable oil to make the distribution of individual monthly rations easier. However, due to poor planning and a delayed procurement of the equipment needed, this was not possible. As a result partners resorted to repackaging rations manually on site which, in many instances, increased the workload of staff and introduced concerns about hygiene as beneficiaries had to bring their own containers and package the rations themselves. A role for the community was also stated in the implementation strategy but, due to the urgency of implementation and the little time given to planning, most of the community members did not know their roles by the time the BSFP started hence, the first distribution was challenging because the community was not brought on board in good time. This was observed in some sites whereby the community totally refused to offload food that was for them. Incidences of the community serving themselves the food without following the required procedures were also reported. Coordination was initially not as strong as it should have been which affected the frequency of distribution and disrupted the process of community mobilization. The poor coordination resulted in delays in delivering food, especially during the first distribution. However, this situation improved in subsequent months through District meetings coordinated by WFP.
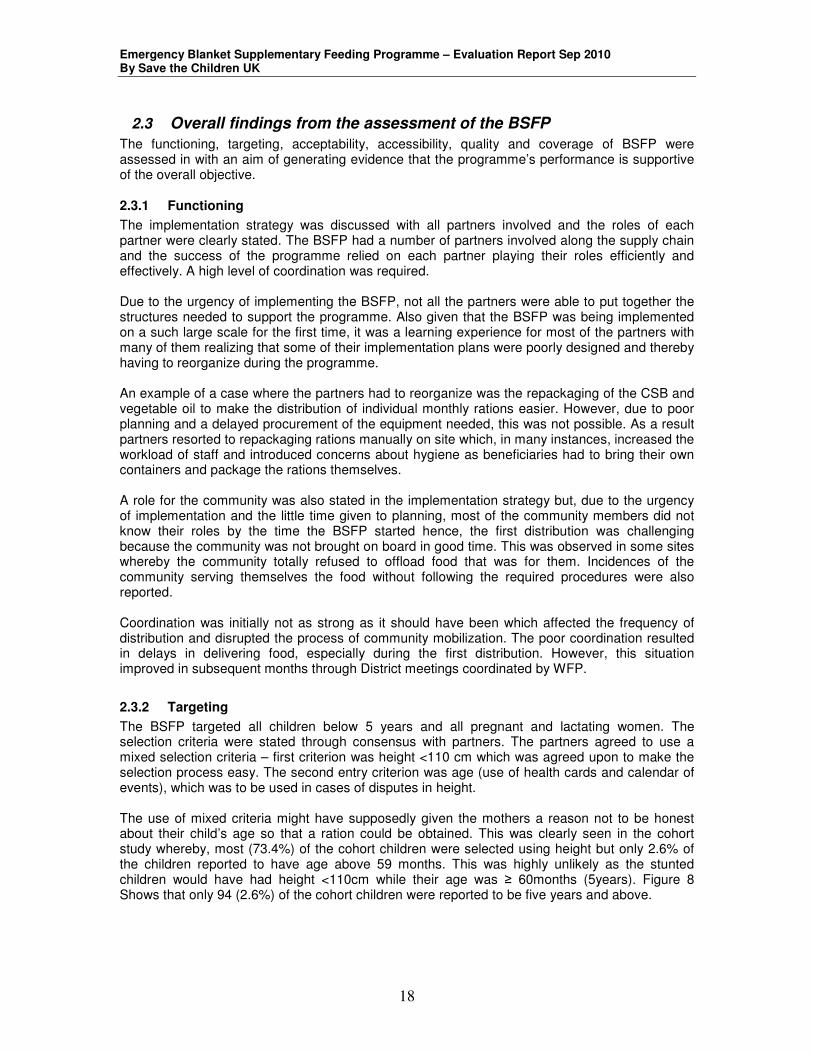
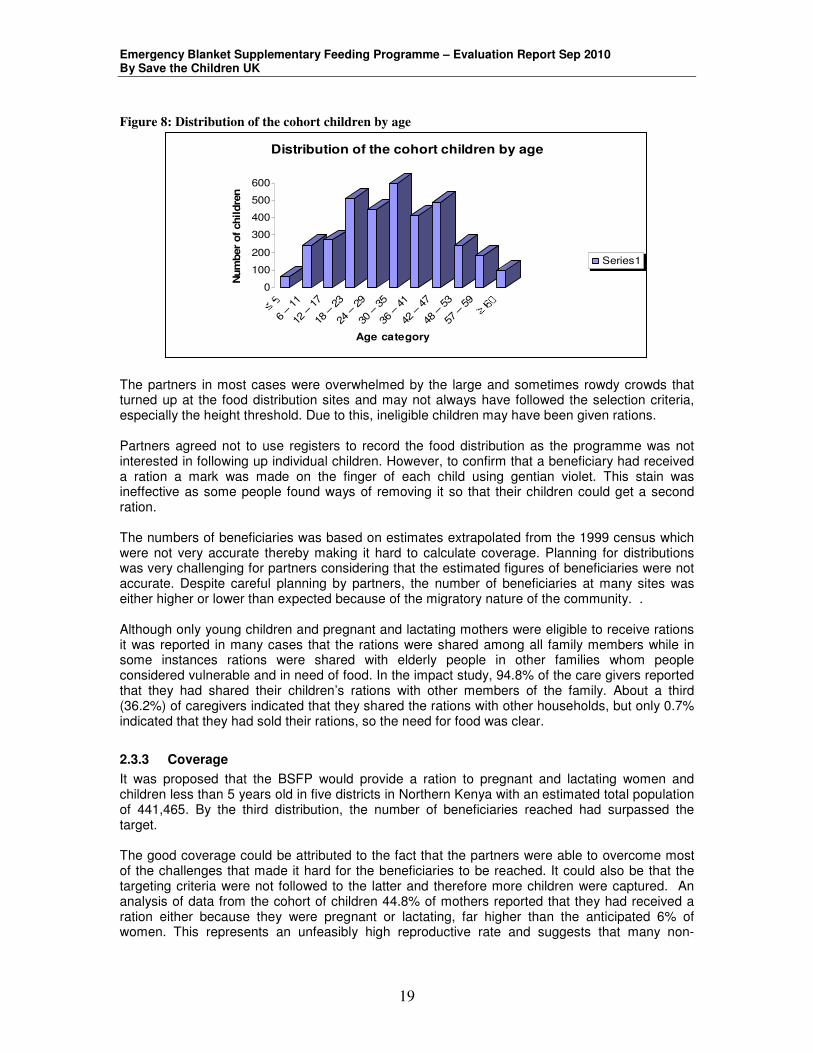
2.3.2 Targeting
The BSFP targeted all children below 5 years and all pregnant and lactating women. The selection criteria were stated through consensus with partners. The partners agreed to use a mixed selection criteria – first criterion was height <110 cm which was agreed upon to make the selection process easy. The second entry criterion was age (use of health cards and calendar of events), which was to be used in cases of disputes in height. The use of mixed criteria might have supposedly given the mothers a reason not to be honest about their child’s age so that a ration could be obtained. This was clearly seen in the cohort study whereby, most (73.4%) of the cohort children were selected using height but only 2.6% of the children reported to have age above 59 months. This was highly unlikely as the stunted children would have had height <110cm while their age was ≥ 60months (5years). Figure 8 Shows that only 94 (2.6%) of the cohort children were reported to be five years and above.
Emergency Blanket Supplementary Feeding Programme – Evaluation Report Sep 2010 By Save the Children UK
19
Figure 8: Distribution of the cohort children by age
0
100
200
300
400
500
600
Num
ber
of
chil
dre
n
6 –
11
12 – 1
7
18 – 2
3
24 – 2
9
30 – 3
5
36 – 4
1
42 – 4
7
48 – 5
3
57 – 5
9
Age category
Distribution of the cohort children by age
Series1
The partners in most cases were overwhelmed by the large and sometimes rowdy crowds that turned up at the food distribution sites and may not always have followed the selection criteria, especially the height threshold. Due to this, ineligible children may have been given rations. Partners agreed not to use registers to record the food distribution as the programme was not interested in following up individual children. However, to confirm that a beneficiary had received a ration a mark was made on the finger of each child using gentian violet. This stain was ineffective as some people found ways of removing it so that their children could get a second ration. The numbers of beneficiaries was based on estimates extrapolated from the 1999 census which were not very accurate thereby making it hard to calculate coverage. Planning for distributions was very challenging for partners considering that the estimated figures of beneficiaries were not accurate. Despite careful planning by partners, the number of beneficiaries at many sites was either higher or lower than expected because of the migratory nature of the community. . Although only young children and pregnant and lactating mothers were eligible to receive rations it was reported in many cases that the rations were shared among all family members while in some instances rations were shared with elderly people in other families whom people considered vulnerable and in need of food. In the impact study, 94.8% of the care givers reported that they had shared their children’s rations with other members of the family. About a third (36.2%) of caregivers indicated that they shared the rations with other households, but only 0.7% indicated that they had sold their rations, so the need for food was clear.
2.3.3 Coverage
It was proposed that the BSFP would provide a ration to pregnant and lactating women and children less than 5 years old in five districts in Northern Kenya with an estimated total population of 441,465. By the third distribution, the number of beneficiaries reached had surpassed the target. The good coverage could be attributed to the fact that the partners were able to overcome most of the challenges that made it hard for the beneficiaries to be reached. It could also be that the targeting criteria were not followed to the latter and therefore more children were captured. An analysis of data from the cohort of children 44.8% of mothers reported that they had received a ration either because they were pregnant or lactating, far higher than the anticipated 6% of women. This represents an unfeasibly high reproductive rate and suggests that many non-

Emergency Blanket Supplementary Feeding Programme – Evaluation Report Sep 2010 By Save the Children UK
20
pregnant and non-lactating women had claimed a ration and the inclusion criteria were not applied by partners.
2.3.4 Accessibility
During the first distribution, most of the partners noted that they had centralized their distribution sites, so beneficiaries had long distances to walk to receive the rations. Centralization of sites coupled with food delays affected attendance at the first food distribution. In subsequent distributions most partners strategically decentralized their sites and increased their number from 521 to 651, which improved accessibility.
2.3.5 Acceptability
Good community mobilization and sensitization ensured that all the communities understood the need for the rations. The BSFP created a good entry point for the organizations that had just started their operations in the districts. This mostly applied for Mandera west and in Wajir North and West.
2.3.6 Quality
Complementary activities The design of BSFP included complementary health and nutrition activities which proved to be supportive of the existing programmes. These activities provided an opportunity to improve vaccination and micronutrient services. More details are given in section 3.3. Food distribution: Each beneficiary was entitled to 7.5 kg of CSB and 0.75 kg of oil each month. However, the scooping method used in the distribution may not have allowed each beneficiary to receive their entitlement as proposed since the food was not prepackaged. Post distribution monitoring In the focus group discussions in Mandera west the community reported that they had received bitter CSB in the third cycle and would not eat it. This was not verified as it was not reported or captured until the distributions were finalized. In this case, inadequate post distribution monitoring might have reduced the effectiveness and efficiency of the intervention.
2.3.7 Integration of the BSFP with existing programmes
The main aim of assessing the integration of BSFP with other existing programmes was to assess whether the BSFP complemented and supported other existing health and nutrition projects. Complementary health and nutrition activities proved to be a good opportunity to improve vaccination and micronutrient services. These complementary activities were aimed at improving the health status of the beneficiaries and thereby improving the efficacy of the rations provided. The complementary activities were as follows: Nutritional screening: All children who came to a distribution site were screened using MUAC measurements. Those who were found to be malnourished were referred to the nearest health facility or feeding programme. This proved to be supportive to IMAM. The major gap in the screening activity was that there were no clear systems to ensure that the beneficiaries referred to the subsequent programmes actually attended and were admitted to the feeding programme. Vitamin A supplements, anthelmintics and immunization:

Emergency Blanket Supplementary Feeding Programme – Evaluation Report Sep 2010 By Save the Children UK
21
Vitamin A supplements, de-worming and vaccines were given during the BSFP. In all five districts 87,238 beneficiaries received vitamin A while 7,995 were vaccinated against measles.
The total coverage of these services fell short of expectations, something that has been attributed to poor coordination within MOH as they did not plan for adequate supplies, hence there were many missed opportunities to improve coverage. The reporting between partners and MOH was poor and in most cases, the MOH did not get reports on the vaccinations or supplements given, hence the information might have not been reflected in the MOH information systems. Health education: Health education and cooking demonstrations were offered to people who attended the food distributions and were aimed at improving hygiene and care practices that may have an impact on malnutrition, as well as demonstrating how to prepare the CSB. Most partners used MOH staff or community health workers to offer health education before the start of the screening process. However, the effectiveness of this is in question given that the turn-out in most sites was very high and beneficiaries were more interested in getting their food than listening to health messages.
3. Conclusion A significant positive change in the anthropometric status of the young children was observed during the period of implementation. This change could either have been due to a change in food security due to higher than expected rainfall or it could have been due to the BSFP.. The coverage, functioning and quality of the programme proved to be supportive of the programme’s objectives, however better coordination at all stages of the programme cycle needs to be considered in the next implementation phase and the targeting needs to improve to ensure that the right beneficiaries get and consume the rations. The BSFP supported other existing health and nutrition interventions. This can further be strengthened by proper and timely planning, monitoring and evaluation.
4. Lessons learnt The blanket supplementary feeding programme was well received by communities in the five districts and, as an intervention, it was appreciated by the local authorities and partners implementing the programme alike. A blanket supplementary feeding programme in the context of chronic food insecurity and a high prevalence malnutrition may not only be used to address food gaps but also as an opportunity to strengthen existing health and nutrition programmes. Functioning of BSFP A high level of coordination is essential both at national and district levels for the successful implementation of a multi-agency programme. Effective, appropriate and clear arrangements for communication between the stakeholders should be arranged and started before any programme begins. Also each partner should fully understand their roles and responsibilities before implementation starts. Sufficient lead time prior to start of the implementation of the BSFP should be given to allow for proper planning and timely communication to all stake holders. Entry criteria The use of mixed criteria might have supposedly given the mothers a reason not to be honest about their child’s age so that a ration could be obtained. This meant that the data on

Emergency Blanket Supplementary Feeding Programme – Evaluation Report Sep 2010 By Save the Children UK
22
anthropometric indices based on age were unreliable. In future it would be better, for the purposes of any evaluation at least, to allow all children <110 cm entry to the programme, whatever their age, so that there is a consistent, easily determined and transparent basis for getting a ration that promotes honesty. This should be widely advertised so that mothers know. The implication is that the needs of any evaluation should be considered by the programme when it is being designed, not just traditional and arbitrary practice, and that if this is not done the consequences for the quality of data from any attempt to assess the impact of a blanket feeding programme should be appreciated by programme administrators. Targeting Both the quantitative and qualitative data indicate that food was mostly shared within households and was not used solely to feed the child beneficiary. This indicates that it would be better to target the whole household with children less than 5 years rather than just young children ie a blanket feeding programme. BSFP complementary activities The BSFP complementary activities proved to be very supportive of the existing programmes. The BSFP could be used as a way to strengthen existing programmes. However, proper planning, coordination, monitoring and evaluation are imperative. There should be a greater linkage between the BSFP monitoring systems and existing data collection systems. This will ensure that the contribution of the BSFP to support existing programmes is captured and reported comprehensively. Timing The BSFP was aimed at preserving the nutritional status of children during the hunger gap. However, the rains came earlier than expected and hence the hunger gap might not have been as severe as expected. The timing of the intervention is thus crucial to ensure that it is most effective. Impact evaluation It will never be possible to obtain data to prove that a blanket feeding programme is effective without having untreated controls, something that is not feasible in a humanitarian crisis. Nevertheless it should be possible to collect good data to provide several strands of plausible evidence of an impact, assuming that there is no major change in food security at the same time as the programme. To obtain high quality data several things are necessary. Data should be collected by monitoring and evaluation teams who are separate from programme implementers and ideally from an independent agency. The evaluators should be adequately trained in research methods. As there was strong evidence that many children at the fifth distribution were not the same as the children who were enrolled, which may be a particular problem in pastoral communities, Personal Digital Assistants (PDAs) with finger-print readers could be used to confirm children’s identity at each encounter. This would also serve to minimise data recording and entry errors by providing range checks. It would also be useful to have periodic nutrition surveys, in times of adequate food security as well as when it is poor, to help understand the degree of fluctuation in anthropometric and nutritional status throughout the seasons in the arid lands of Kenya. Such data may be available, but they are not easily accessible or reported. A central coordinating unit to standardise survey methods and aggregate data on nutrition and health could serve such a purpose.

Emergency Blanket Supplementary Feeding Programme – Evaluation Report Sep 2010 By Save the Children UK
23
5. Recommendations A smaller pilot study should be implemented in one of the districts during the next hunger gap. This will be aimed at accessing the extent to which we can attribute change in nutritional status to the blanket supplementary rations. A cost benefit analysis is also imperative as BSFP is an expensive intervention. BSFP can be implemented during the hunger gap as a way to scale up and strengthen the existing health programmes especially immunization, vitamin A supplementation, IMAM and WATSAN. Given the dearth of information available on blanket supplementary feeding programmes an implementation and evaluation toolkit or manual should be developed in collaboration with the MOPHS to guide future interventions. This will facilitate knowledge and capacity transfer to partners involved in the implementation of future BSFP.
Emergency Blanket Supplementary Feeding Programme – Evaluation Report Sep 2010 By Save the Children UK
24
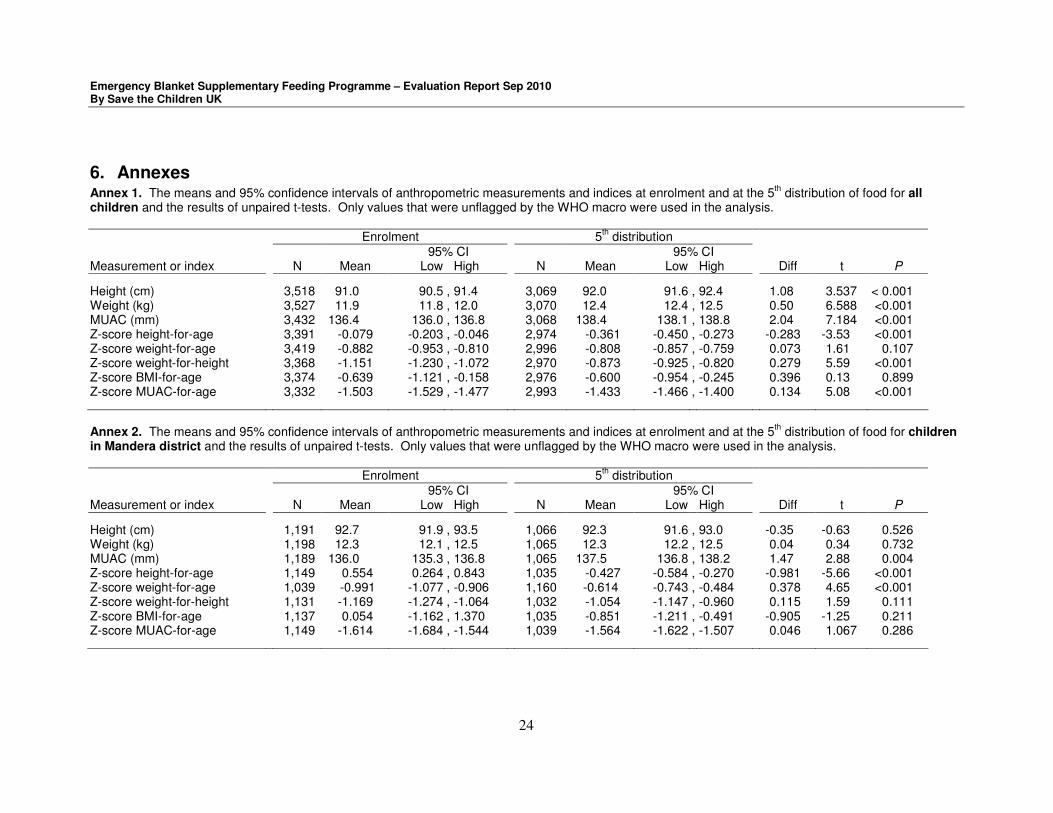
6. Annexes Annex 1. The means and 95% confidence intervals of anthropometric measurements and indices at enrolment and at the 5
th distribution of food for all
children and the results of unpaired t-tests. Only values that were unflagged by the WHO macro were used in the analysis.
Enrolment 5th distribution
95% CI 95% CI Measurement or index N Mean Low High N Mean Low High Diff t P
Height (cm) 3,518 91.0 90.5 , 91.4 3,069 92.0 91.6 , 92.4 1.08 3.537 < 0.001 Weight (kg) 3,527 11.9 11.8 , 12.0 3,070 12.4 12.4 , 12.5 0.50 6.588 <0.001 MUAC (mm) 3,432 136.4 136.0 , 136.8 3,068 138.4 138.1 , 138.8 2.04 7.184 <0.001 Z-score height-for-age 3,391 -0.079 -0.203 , -0.046 2,974 -0.361 -0.450 , -0.273 -0.283 -3.53 <0.001 Z-score weight-for-age 3,419 -0.882 -0.953 , -0.810 2,996 -0.808 -0.857 , -0.759 0.073 1.61 0.107 Z-score weight-for-height 3,368 -1.151 -1.230 , -1.072 2,970 -0.873 -0.925 , -0.820 0.279 5.59 <0.001 Z-score BMI-for-age 3,374 -0.639 -1.121 , -0.158 2,976 -0.600 -0.954 , -0.245 0.396 0.13 0.899 Z-score MUAC-for-age 3,332 -1.503 -1.529 , -1.477 2,993 -1.433 -1.466 , -1.400 0.134 5.08 <0.001 Annex 2. The means and 95% confidence intervals of anthropometric measurements and indices at enrolment and at the 5
th distribution of food for children
in Mandera district and the results of unpaired t-tests. Only values that were unflagged by the WHO macro were used in the analysis.
Enrolment 5th distribution
95% CI 95% CI Measurement or index N Mean Low High N Mean Low High Diff t P
Height (cm) 1,191 92.7 91.9 , 93.5 1,066 92.3 91.6 , 93.0 -0.35 -0.63 0.526 Weight (kg) 1,198 12.3 12.1 , 12.5 1,065 12.3 12.2 , 12.5 0.04 0.34 0.732 MUAC (mm) 1,189 136.0 135.3 , 136.8 1,065 137.5 136.8 , 138.2 1.47 2.88 0.004 Z-score height-for-age 1,149 0.554 0.264 , 0.843 1,035 -0.427 -0.584 , -0.270 -0.981 -5.66 <0.001 Z-score weight-for-age 1,039 -0.991 -1.077 , -0.906 1,160 -0.614 -0.743 , -0.484 0.378 4.65 <0.001 Z-score weight-for-height 1,131 -1.169 -1.274 , -1.064 1,032 -1.054 -1.147 , -0.960 0.115 1.59 0.111 Z-score BMI-for-age 1,137 0.054 -1.162 , 1.370 1,035 -0.851 -1.211 , -0.491 -0.905 -1.25 0.211 Z-score MUAC-for-age 1,149 -1.614 -1.684 , -1.544 1,039 -1.564 -1.622 , -1.507 0.046 1.067 0.286

Emergency Blanket Supplementary Feeding Programme – Evaluation Report Sep 2010 By Save the Children UK
25
Annex 3. The means and 95% confidence intervals of anthropometric measurements and indices at enrolment and at the 5th distribution of food for children
in Turkana district and the results of unpaired t-tests. Only values that were unflagged by the WHO macro were used in the analysis.
Enrolment 5th distribution
95% CI 95% CI Measurement or index N Mean Low High N Mean Low High Diff t P
Height (cm) 732 87.7 86.7 , 88.6 631 90.7 89.9 , 91.6 3.088 4.787 <0.001 Weight (kg) 733 11.4 11.2 , 11.6 631 12.3 12.1 , 12.5 0.8737 6.256 <0.001 MUAC (mm) 649 136.8 135.6 , 138.0 632 140.9 140.1 , 141.7 4.100 5.653 <0.001 Z-score height-for-age 699 -0.565 -0.769 , -0.362 611 -0.026 -0.212 , 0.160 0.539 3.801 <0.001 Z-score weight-for-age 614 -0.557 -0.663 , -0.451 707 -0.981 -1.101 -0.861 -0.424 -5.126 <0.001 Z-score weight-for-height 700 -0.974 -0.854 , -0.664 613 -0.759 -0.854 , -0.664 0.215 2.902 0.004 Z-score BMI-for-age 700 -0.541 -1.372 , 0.289 614 -0.763 -0.868 , -0.658 -0.222 -0.488 0.626 Z-score MUAC-for-age 626 -1.442 -1.554 , -1.330 615 -1.099 -1.173 , -1.025 0.343 5.0102 <0.001 Annex 4. The means and 95% confidence intervals of anthropometric measurements and indices at enrolment and at the 5
th distribution of food for children
in Wajir district and the results of unpaired t-tests. Only values that were unflagged by the WHO macro were used in the analysis.
Enrolment 5th distribution
95% CI 95% CI Measurement or index N Mean Low High N Mean Low High Diff t P
Height (cm) 1,595 91.2 90.6 , 91.8 1372 92.4 91.7 , 93.0 1.224 2.784 0.005 Weight (kg) 1,596 11.9 11.7 , 12.1 1374 12.6 12.5 , 12.7 0.670 5.654 <0.001 MUAC (mm) 1,594 136.5 136.0 , 137.0 1371 138.1 137.6 , 138.6 1.538 4.124 <0.001 Z-score height-for-age 1,543 -0.329 -0.468 , -0.190 1328 -0.465 -0.595 , -0.335 -0.136 -1.383 0.167 Z-score weight-for-age 1,343 -0.781 -0.853 , -0.710 1552 -1.037 -1.148 , -0.925 -0.255 -3.655 <0.001 Z-score weight-for-height 1,537 -1.220 -1.366 , -1.072 1325 -0.784 -0.867 , -0.702 0.435 4.859 <0.001 Z-score BMI-for-age 1537 -1.197 -1.360 , -1.034 1327 -0.328 -1.070 , 0.415 0.869 2.395 0.017 Z-score MUAC-for-age 1557 -1.581 -1.629 , -1.534 1339 -1.484 -1.530 , -1.437 0.098 2.860 0.004 ,

Emergency Blanket Supplementary Feeding Programme – Evaluation Report Sep 2010 By Save the Children UK
26
Annex 5. The percentage of all children classified as undernourished by five different indices with 95% CI between enrolment and the 5th distribution and the
results of unpaired tests of statistical significance
Enrolment 5th distribution
95% CI 95% CI N % Low High N % Low High Diff z P
Stunted 3,484 23.0 21.6 , 24.4 3,484 19.3 18.0 , 20.6 -3.62 -3.69 <0.001 Underweight 3,524 22.5 21.1 , 23.8 3,524 14.0 12.9 , 15.2 -8.45 -9.19 <0.001 Wasted 3,494 26.6 25.1 , 28.0 3,484 15.6 14.4 , 16.8 -10.99 -11.26 <0.001 Thin 3,492 29.4 27.8 , 30.9 3,492 16.9 15.6 , 18.1 -12.46 -12.34 <0.001 Low MUAC 3,512 30.4 28.9 , 31.9 3,152 22.9 21.5 , 24.3 22.9 -7.10 <0.001 Annex 6. The percentage of children in Mandera District classified as undernourished by five different indices with 95% CI between enrolment and the 5
th
distribution and the results of unpaired tests of statistical significance
Enrolment 5th distribution
95% CI 95% CI N % Low High N % Low High Diff z P
Stunted 1,187 18.9 16.6 , 21.1 1187 21.2 18.9 , 23.6 2.36 1.44 0.151 Underweight 1,199 18.3 21.6 , 24.4 1,199 17.3 18.0 , 20.7 -0.01 -0.64 0.521 Wasted 1,188 28.0 25.5 , 30.6 1,188 20.4 18.1 , 22.7 -7.66 -4.36 <0.001 Thin 1,187 33.4 30.8 , 36.1 1,187 21.1 18.7 , 23.4 -0.12 -6.78 <0.001 Low MUAC 1,197 31.6 28.9 , 34.2 1,197 24.9 22.4 , 27.3 -6.6 -3.63 <0.001

Emergency Blanket Supplementary Feeding Programme – Evaluation Report Sep 2010 By Save the Children UK
27
Annex 7. The percentage of children in Turkana district classified as undernourished by five different indices with 95% CI between enrolment and the 5th
distribution and the results of unpaired tests of statistical significance Enrolment 5
th distribution
95% CI 95% CI N % Low High N % Low High Diff z P
Stunted 727 27.9 24.7 , 31.2 727 16.2 13.6 , 18.9 -11.69 -5.37 <0.001 Underweight 740 24.3 21.2 , 27.4 740 10.4 8.2 , 12.6 -0.14 -7.07 <0.001 Wasted 736 17.5 14.8 , 20.3 736 8.4 6.4 , 10.4 -0.09 -5.20 <0.001 Thin 736 18.8 15.9 , 21.6 736 9.9 7.8 , 12.1 -8.83 -4.83 <0.001 Low MUAC 724 22.4 19.3 , 25.4 724 13.7 11.2 , 16.2 -8.70 -4.31 <0.001 Annex 8. The percentage of children in Wajir District classified as undernourished by five different indices with 95% CI between enrolment and the 5
th
distribution and the results of unpaired tests of statistical significance
Enrolment 5th distribution
95% CI 95% CI N % Low High N % Low High Diff z P
Stunted 1,570 23.8 21.7 , 25.9 1,570 19.4 17.4 , 21.3 -4.35 -2.99 0.003 Underweight 1,585 24.8 22.7 , 26.9 1,585 13.2 11.6 , 14.9 -0.12 -8.28 <0.001 Wasted 1,570 29.7 27.5 , 32.0 1,570 15.4 13.6 , 17.1 -14.39 -9.65 <0.001 Thin 1,569 31.2 28.9 , 33.5 1,569 17.0 15.2 , 18.9 -14.21 -9.30 <0.001 Low MUAC 1,591 33.1 30.8 , 35.4 1,591 25.6 23.4 , 27.7 -7.5 -4.67 <0.001

Emergency Blanket Supplementary Feeding Programme – Evaluation Report Sep 2010 By Save the Children UK
28
Annex 9: Children MUAC screening data for the 5 targeted districts
Mandera
1st cycle 2nd cycle 3rd cycle 4th cycle
Nutritional status MUAC criteria N % N % N % N %
Severe malnutrition <115mm 675 1.0% 280 0.4% 231 0.3% 148 0.2%
Moderate ≥115mm - <125mm 4,851 7.3% 2,509 3.5% 1,800 1.9% 1,976 2.0%
At Risk ≥125- < 135mm 27,221 41.7% 30,948 42.8% 40,451 43.2% 43,487 43.6%
Well Nourished ≥135mm 33,363 50.0% 38,521 53.3% 51,066 54.6% 54,509 54.2%
Total 66,110 100.0% 72,258 100.0% 93,548 100.0% 99,664 100.0%
Wajir
1st cycle 2nd cycle 3rd cycle 4th cycle
Nutritional status MUAC criteria N % N % N % N %
Severe malnutrition <115mm 413 0.6% 696 0.7% 628 0.5% 477 0.4%
Moderate ≥115mm - <125mm 6,130 9.4% 330 3.5% 3,079 2.5% 2,758 2.1%
At Risk ≥125- < 135mm 23,253 36.0% 39,257 41.1% 51,126 41.8% 54,041 41.8%
Well Nourished ≥135mm 35,697 55.0% 52,246 54.7% 67,540 55.2% 72,069 55.7%
Total 65,493 100.0% 95,529 100.0% 122,373 100.0% 129,345 100.0%
Samburu
1st cycle 2nd cycle 3rd cycle 4th cycle
Nutritional status MUAC criteria N % N % N % N %
Severe malnutrition <115mm 1453 3.8% 971 2.2% 648 1.4% 672 1.4%
Moderate ≥115mm - <125mm 5,599 14.7% 5,245 11.9% 3,904 8.1% 3,998 8.5%
At Risk ≥125- < 135mm 11,756 30.8% 14,894 33.8% 17,223 35.8% 16,849 36.0%
Well Nourished ≥135mm 19,363 50.7% 22,947 52.8% 26,360 54.7% 25,316 54.1%
Total 38,171 100.0% 44,057 100.0% 48,135 100.0% 46,835 100.0%
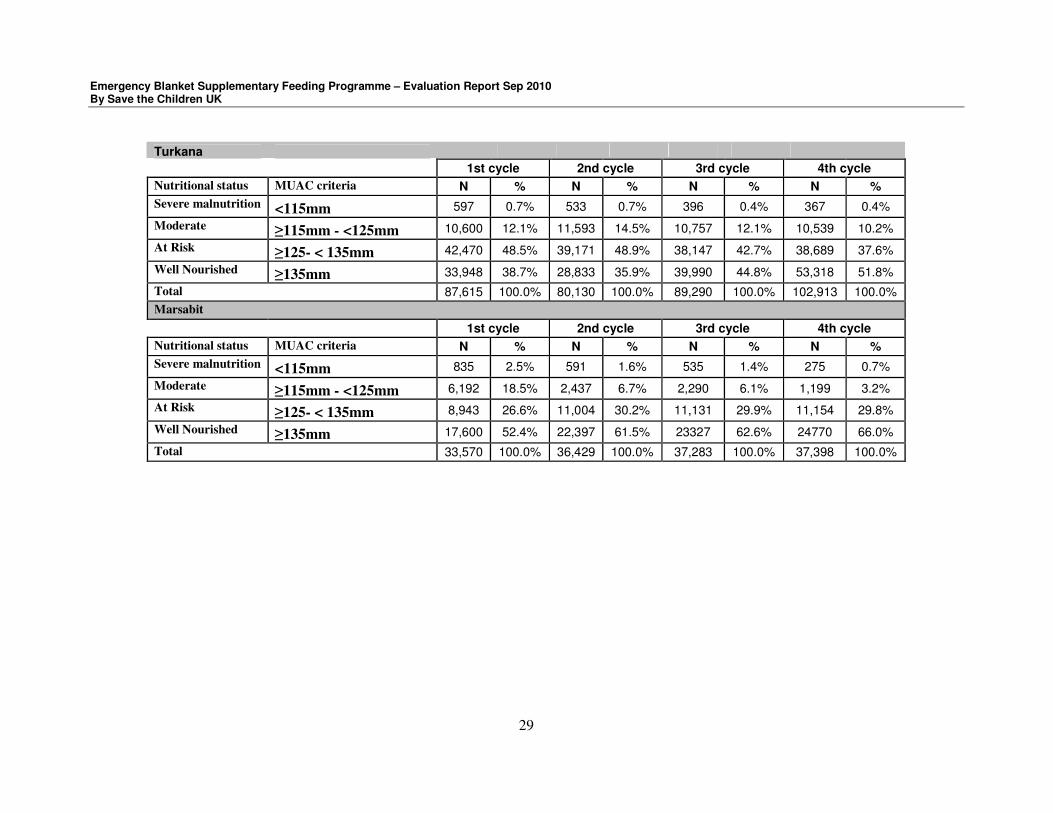
Emergency Blanket Supplementary Feeding Programme – Evaluation Report Sep 2010 By Save the Children UK
29
Turkana
1st cycle 2nd cycle 3rd cycle 4th cycle
Nutritional status MUAC criteria N % N % N % N %
Severe malnutrition <115mm 597 0.7% 533 0.7% 396 0.4% 367 0.4%
Moderate ≥115mm - <125mm 10,600 12.1% 11,593 14.5% 10,757 12.1% 10,539 10.2%
At Risk ≥125- < 135mm 42,470 48.5% 39,171 48.9% 38,147 42.7% 38,689 37.6%
Well Nourished ≥135mm 33,948 38.7% 28,833 35.9% 39,990 44.8% 53,318 51.8%
Total 87,615 100.0% 80,130 100.0% 89,290 100.0% 102,913 100.0%
Marsabit
1st cycle 2nd cycle 3rd cycle 4th cycle
Nutritional status MUAC criteria N % N % N % N %
Severe malnutrition <115mm 835 2.5% 591 1.6% 535 1.4% 275 0.7%
Moderate ≥115mm - <125mm 6,192 18.5% 2,437 6.7% 2,290 6.1% 1,199 3.2%
At Risk ≥125- < 135mm 8,943 26.6% 11,004 30.2% 11,131 29.9% 11,154 29.8%
Well Nourished ≥135mm 17,600 52.4% 22,397 61.5% 23327 62.6% 24770 66.0%
Total 33,570 100.0% 36,429 100.0% 37,283 100.0% 37,398 100.0%

Emergency Blanket Supplementary Feeding Programme – Evaluation Report Sep 2010 By Save the Children UK
30
Annex 10: Number of beneficiaries reached during the distributions
Number of Beneficiaries
children <5yrs District Lead Agency
Implementing partners
No. Of FDPs
Female Male Total PLW Totals
CYCLE 1
Turkana OXFAM WVI 77 14,454 23,986 38,440 16,340 54,780
Turkana OXFAM SP 21 4,024 4,335 8,359 2,495 10,854
Turkana OXFAM Merlin 48 12,493 11,328 23,821 7,186 31,007
Turkana OXFAM IRC 12 4,550 4,660 9,210 2,400 11,610
Marsabit KRC FH 54 13,741 14,885 28,626 6,401 35,027
Samburu Ramati WVI 39 10,093 9,940 20,033 2,853 22,886
Samburu Ramati IMC 45 9,356 9,076 18,432 3,188 21,620
Wajir ALDEF SCUK 66 18,862 18,390 37,252 6,851 44,103
Wajir ALDEF IRK 51 15,903 15,288 31,191 6,521 37,712
Mandera COCOP SCUK 52 17,312 17,164 34,476 8,291 42,767
Mandera COCOP IRK 56 15,508 15,682 31,190 7,022 38,212
Total 521 136,296 144,734 281,030 69,548 350,578
CYCLE 2
Turkana OXFAM WVI 88 24,120 25,990 50,110 10,853 60,963
Turkana OXFAM SP 23 5,072 5,286 10,358 3,254 13,612
Turkana OXFAM Merlin 48 15,416 13,941 29,357 8,366 37,723
Turkana OXFAM IRC 12 4,765 4,892 9,657 2,793 12,450
Marsabit KRC FH 93 17,099 18,068 35,167 5,966 41,133
Samburu Ramati WVI 40 11,404 11,226 22,630 2,533 25,163
Samburu Ramati IMC 52 10,650 10,491 21,141 3,864 25,005
Wajir ALDEF SCUK 63 24,132 22,993 47,125 8,300 55,425
Wajir ALDEF IRK 51 24,800 23,694 48,494 12,437 60,931
Mandera COCOP SCUK 109 18,525 17,086 35,611 8,904 44,515
Mandera COCOP IRK 56 18,953 17,107 36,060 8,464 44,524
Total 635 174,936 170,774 345,710 75,734 421,444
CYCLE 3
Turkana OXFAM WVI 88 23,070 23,694 46,764 8,354 55,118
Turkana OXFAM SP 23 5,332 5,024 10,356 3,044 13,400
Turkana OXFAM Merlin 48 16,059 14,311 30,370 8,081 38,451
Turkana OXFAM IRC 15 5,020 5,390 10,410 3,020 13,430
Marsabit KRC FH 93 18,404 18,808 37,212 5,109 42,321
Samburu Ramati WVI 40 12,568 12,862 25,430 2,524 27,954
Samburu Ramati IMC 52 11,678 11,494 23,172 4,642 27,814
Wajir ALDEF SCUK 69 32,161 31,164 63,325 12,617 75,942
Wajir ALDEF IRK 51 30,619 28,592 59,211 14,525 73,736
Mandera COCOP SCUK 108 27,439 23,798 51,237 10,165 61,402
Mandera COCOP IRK 56 22,138 20,604 42,742 9,264 52,006
Total 643 204,488 195,741 400,229 81,345 481,574
CYCLE 4
Turkana OXFAM WVI 88 22,626 24,827 47,453 8,448 55,901
Turkana OXFAM SP 23 5,846 6,206 12,052 3,595 15,647

Emergency Blanket Supplementary Feeding Programme – Evaluation Report Sep 2010 By Save the Children UK
31
Turkana OXFAM Merlin 48 17,136 15,433 32,569 8,980 41,549
Turkana OXFAM IRC 15 5,167 5,613 10,780 3,340 14,120
Marsabit KRC FH 93 18,411 18,819 37,230 5,113 42,343
Samburu Ramati WVI 40 12,661 12,858 25,519 2,421 27,940
Samburu Ramati IMC 52 11,262 10,540 21,802 4,448 26,250
Wajir ALDEF SCUK 69 36,565 34,324 70,889 16,768 87,657
Wajir ALDEF IRK 51 31,384 28,821 60,205 13,522 73,727
Mandera COCOP SCUK 116 30,969 26,409 57,378 11,932 69,310
Mandera COCOP IRK 56 21,998 21,425 43,423 9,622 53,045
Total 651 214,025 205,275 419,300 88,189 507,489

Emergency Blanket Supplementary Feeding Programme – Evaluation Report Sep 2010 By Save the Children UK
32
Annex 11. Prevalence of wasting (Weight for age <-2 Z score) in the smaller
divisions of the 5 arid Districts
District
2008 Wasting
(<-2 Z Score)
2009 Wasting
(<-2 Z Score)
2010 Wasting
(<-2 Z Score)
Turkana North West 18.2% (15.9-20.7% C.I)
>20.0%
14.7% (11.7 –18.4% C.I)
Turkana East 24.8% (22.2-27.6% C.I)
>20.0% 17.1% (14.1–20.5% C.I)
Turkana South 17.9% (15.7-20.4% C.I)
>20.0% 12.4% (9.7 –15.7% C.I)
Turkana Central 28.9% (26.3-31.7% C.I)
>20.0% 16.3% (13.0 –20.1% C.I)
Wajir South 13.4% (18.4-24.0% C.I)
19.1% (16.1-22.5% C.I)
23.2% (19.1-27.8% C.I)
Wajir East 13.4% (18.4-24.0% C.I)
25.3% (21.3-29.8% C.I)
19.8% (14.7-20.1% C.I)
Wajir North 21.2% (11.2-15.7% C.I)
21.0% (16.5-25.6% C.I)
15.7% (15.8-24.5% C.I)
Wajir West 21.2% (11.2-15.7% C.I)
23.1% (18.7-27.6% C.I)
15.7% (12.3-19.8% C.I)
Mandera West-Malkamari 21.6% (17.8-25.3% C.I)
26.2% (21.5-30.8% C.I)
28.5% (23.7-33.7% C.I)
Mandera West-Takaba 20.3% (15.6-25.0% CI)
32.3% (28.2-36.4% C.I)
Mandera Central 24.3% (19.6-28.4% C.I)
30.9% (26.9-35.3% C.I)
23.6% (23.1 -29.4% C.I)
Mandera East 27.9% (24-31.8% C.I)
19.8% (16.2-23.4% C.I)
Samburu 14.7% (12.4-17% C.I)
22.2% (18.8-25.1% C.I)
Marsabit/Laisamis 16.0% (13.6-18.4% CI)
20.0% (17.5-22.8% C.I)
13.4% (10.3-17.1% C.I)