Embed Size (px)
Citation preview
Evaluation of Post-Wildfire Debris Flow Mitigation Methods and Development of Decision-Support Tools
Final Report to the Joint Fire Science Program JFSP Contract 03-1-4-14 USGS Contract 04CRGR0001 Principal Investigators: Paul Santi, Colorado School of Mines
Jerry Higgins, Colorado School of Mines
Susan Cannon, U.S. Geological Survey
Jerome DeGraff, U.S.D.A. Forest Service May 31, 2006 Colorado School of Mines United States Geological Survey Joint Fire Science Program
FINAL REPORT
Project Title:
Evaluation of Post-Wildfire Debris Flow Mitigation Methods and Development of Decision-Support Tools
USGS Contract 04CRGR0001 JFSP Contract 03-1-4-14
Principal Investigator(s): Paul Santi1, Jerry Higgins1, Susan Cannon2, and Jerome DeGraff3
Researcher(s): Victor G. deWolfe III1, Nathan C. Soule1, Rebecca Brock1, Joseph E. Gartner2
Affiliations: 1Colorado School of Mines, Dept of Geology and Geological Engineering 2U.S. Geological Survey, Landslide Hazards Program 3U.S.D.A. Forest Service Addresses: 1Golden, CO 80401 2Box 25046, DFC, MS 966, Denver CO 80225 31600 Tollhouse Road, Clovis, CA 93611 Telephone/Facsimile Number(s): 1(303)273-3108 (Santi), 1(303)273-3817 (Higgins), 2(303)273-8604 3(559)297-0706 x4932 E-mail: [email protected], [email protected], [email protected], [email protected] Point of Contact: Paul Santi, Colorado School of Mines, Department of Geology and Geological Engineering, Golden, CO 80401, (303)273-3108, [email protected] Federal Cooperator: Susan Cannon, U.S. Geological Survey, Box 25046, DFC, MS 966, Denver CO 80225, [email protected], (303)273-8604
Table of Contents Executive Summary vi Deliverables viii 1.0 Introduction 1 2.0 Background 3 2.1 Post-fire Debris Flow Processes 3 2.2 Erosion Control Measure Function, Design and Installation 5 2.2.1 Seeding 5 2.2.2 Mulching 5 2.2.3 Log Erosion Barriers 6 2.2.4 Silt Fences 7 2.2.5 Debris Racks 7 2.2.6 Check Dams 8 2.2.7 Debris Basins 11 3.0 Methods 13 3.1 Measurement of Post-fire Debris-Flow Volumes 13
3.2 Graphs of Cumulative Downchannel Eroded Volume 16 3.3 Multi-variate Statistical Model for Debris-Flow Volume 18 3.4 Literature Review, Interviews with Professionals, and Field 19
Observations of Erosion Control Effectiveness 4.0 Results 20 4.1 Volume change with distance down channel 20 4.2 Debris-Flow Volume Data 24 4.3 Multi-variate statistical model for post-fire debris flow volume 25 4.4 Erosion Control Measure Debris Flow Mitigation Effectiveness 27 4.4.1 Seeding 28 4.4.2 Mulching 30 4.4.3 Log Erosion Barriers 33 4.4.4 Silt Fences 35 4.4.5 Debris Racks 36 4.4.6 Check Dams 37 5.0 Rapid and Long-term Support Tools 40 6.0 Conclusions 41 7.0 References 43
i

Appendix A Data Used in Multiple Regression Analyses Appendix B Check Dam Design Appendix C Rapid Response Decision Support Tool for Debris-Flow Mitigation Appendix D Long-Term Response Decision Support Tool for Debris-Flow Mitigation Appendix E List of Publications and Presentations
ii
List of Figures Figure 1 Schematic diagram showing formation of rill network 4 Figure 2 LEB placement pattern 6 Figure 3 Photograph of a debris rack holding retaining debris above a road 8
and the spillway of Lemon Dam (FWCD, 2003) Figure 4 Plan and oblique views of a series of check dams or consolidation dams 9 on a debris fan Figure 5 Schematic of typical debris-flow countermeasures 9 Figure 6 Excavated pit and berm style check dams in Farmington, Utah 10 Figure 7 Debris torrent in the Lienz/Tyrol district of Austria showing A) an 11 eroded debris channel after a debris flow event in 1882 and B) the same reach about 100 years later after mitigation Figure 8 Typical components of a debris basin 12 Figure 9 Locations of wildfires where debris-flow erosion was measured 14 Figure 10 Timeline of measured debris-flow events and treatment applications 15 Figure 11 Cartoon of slope-o-scope method 16 Figure 12 Cumulative volume vs. distance curve for Basin M, Silverwood, CA 17 Figure 13 Distribution of calculated average channel yield rates 20 Figure 14 Photograph of deeply incised channel reach in Devore Canyon 21 Figure 15 Percent of material contributed to debris flows from hillslope rilling 21 Figure 16 Percent of material contributed to debris flows from side channels 22 Figure 17 Graph of cumulative volume with distance downchannel for Elkhorn 23 Canyon, Missionary Ridge Fire, Colorado Figure 18 Graph showing channel gradients measured in Elkhorn Canyon, 24 Missionary Ridge Fire, Colorado
iii
Figure 19 Histograms showing A) values of debris flow volume used in the 25 development of the volume model, and B) the areas of basins included in the database Figure 20 Comparison of debris-flow volume estimates from the literature to 26 predictions of model Figure 21 Relationship between measured and predicted volumes for treated basins 27 Figure 22 Photograph showing vegetative cover by August, 2003, approximately 13 30
months after the fire, in Basin MR-61 at Lemon Dam due in part to hand- spread seeding at a rate of 60-75 lbs/acre Figure 23 Condition of hand-spread and crimped mulch at Lemon Dam. 31 Figure 24 Photograph illustrating the clumping character of heli-mulch 32 Figure 25 Aerial photograph of Buckley Draw near Provo, UT showing the 33
pattern of helicopter-spread mulch over much of the basin Figure 26 Photograph of LEBs installed on burned slopes at Lemon Dam 35 Figure 27 Photograph of a failed channel silt fence installation 36 Figure 28 Check dam full of mud and debris in Basin MR-61 38 Figure 29 Failed log-barrier checks dams in Dominguez Canyon, southern CA 38 Figure B1 Components of a check dam B-1 Figure B2 Schematic design of a log crib check dam B-3 Figure B3 Schematic of typical debris-flow countermeasures B-4 Figure B4 Scour levels of a debris-flow B-5 Figure B5 Influence of check dams on a passing debris-flow mass B-5 Figure B6 Flow chart outlining process of positioning of log crib check dams B-6 Figure B7 Factors influencing the spacing of check dams B-7 Figure B8 Effect of an apron at the toe of a check dam B-8
iv

List of Tables Table 1 Slope gradient vs. LEB stem spacing suggestions 7 Table 2 Analysis of Variance Table from stepwise multiple regression analysis 26 Table 3 Summary of application data for erosion and sediment control treatments 29 implemented at Lemon Dam Table 4 Comparison of concentrations of erosion control treatments for the 29 protection of Lemon Dam to standard Forest Service practice
v
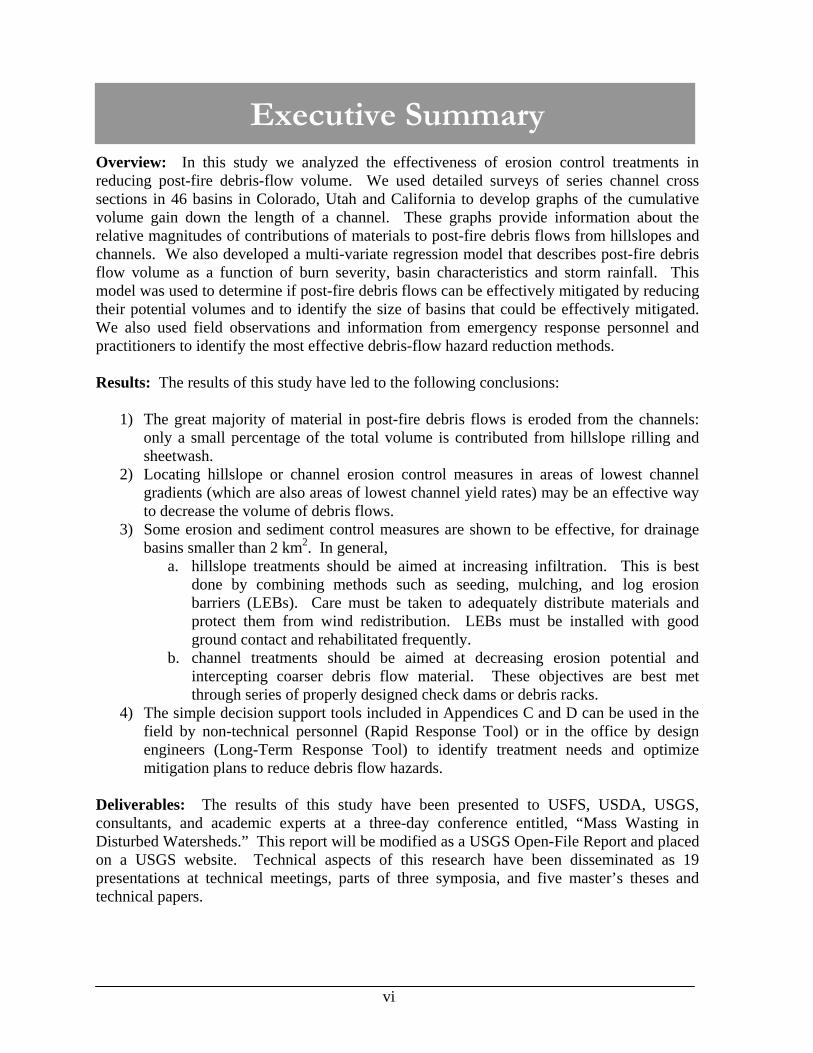
Executive Summary Overview: In this study we analyzed the effectiveness of erosion control treatments in reducing post-fire debris-flow volume. We used detailed surveys of series channel cross sections in 46 basins in Colorado, Utah and California to develop graphs of the cumulative volume gain down the length of a channel. These graphs provide information about the relative magnitudes of contributions of materials to post-fire debris flows from hillslopes and channels. We also developed a multi-variate regression model that describes post-fire debris flow volume as a function of burn severity, basin characteristics and storm rainfall. This model was used to determine if post-fire debris flows can be effectively mitigated by reducing their potential volumes and to identify the size of basins that could be effectively mitigated. We also used field observations and information from emergency response personnel and practitioners to identify the most effective debris-flow hazard reduction methods. Results: The results of this study have led to the following conclusions:
1) The great majority of material in post-fire debris flows is eroded from the channels: only a small percentage of the total volume is contributed from hillslope rilling and sheetwash.
2) Locating hillslope or channel erosion control measures in areas of lowest channel gradients (which are also areas of lowest channel yield rates) may be an effective way to decrease the volume of debris flows.
3) Some erosion and sediment control measures are shown to be effective, for drainage basins smaller than 2 km2. In general,
a. hillslope treatments should be aimed at increasing infiltration. This is best done by combining methods such as seeding, mulching, and log erosion barriers (LEBs). Care must be taken to adequately distribute materials and protect them from wind redistribution. LEBs must be installed with good ground contact and rehabilitated frequently.
b. channel treatments should be aimed at decreasing erosion potential and intercepting coarser debris flow material. These objectives are best met through series of properly designed check dams or debris racks.
4) The simple decision support tools included in Appendices C and D can be used in the field by non-technical personnel (Rapid Response Tool) or in the office by design engineers (Long-Term Response Tool) to identify treatment needs and optimize mitigation plans to reduce debris flow hazards.
Deliverables: The results of this study have been presented to USFS, USDA, USGS, consultants, and academic experts at a three-day conference entitled, “Mass Wasting in Disturbed Watersheds.” This report will be modified as a USGS Open-File Report and placed on a USGS website. Technical aspects of this research have been disseminated as 19 presentations at technical meetings, parts of three symposia, and five master’s theses and technical papers.
vi

Lessons Learned: 1) Most debris flow material comes from channel erosion and not hillslope erosion.
Therefore, mitigation should focus on reducing runoff and increasing infiltration of water on hillslopes and preventing growth of debris flows within the channels.
2) Most failures of debris flow mitigation programs were due to inadequate concentrations of applied methods, improper design or installation of mitigation features, or insufficient maintenance and rehabilitation of mitigation elements.
3) Debris flow hazards can be mitigated, but the program may require solutions that are beyond the scope of most current post-fire rehabilitation approaches. These solutions are either highly engineered and costly structures (check dams, debris racks or debris basins) or efforts that combine many different features on a very concentrated scale over a small (<2 km2) area. In addition, budgeting for the post-event removal of material from check dams, debris racks, debris basins, and hillslope LEBs is critical.
vii

Deliverables
Proposed Accomplished / Status
Annual progress reports Annual progress reports completed
Oral report at JFSP workshop
Presentation given at 2005 JFSP PI meeting in San Diego, CA: “Evaluation of Post-Wildfire Debris Flow Mitigation Methods and Development of Decision Support Tools”
Project report at completion of project Attached
Rapid and long-term response decision tools Attached as Appendices C and D
White paper to be posted on a USGS web-site A USGS Open-File Report is currently in review and will be posted upon completion
Two half-day workshops
P.I. Cannon gave a keynote presentation and P.I.s Cannon and Santi gave poster discussions at the AEG/GSA Shlemon Specialty Conference in Durango, CO May 2-5 “Mass Wasting in Disturbed Watersheds.” There is no Region V/VII BAER team training this year, so we are working to attend and present at the Joint Geotechnical and Geology meeting in October. We are also in discussion to attend and present at the Region IV Implementation Team Leaders’ meeting in June.
New items (not initially proposed) being pursued, partly attributable to JFSP funding
• Expanding work to evaluate sources of material for debris flows in burned areas
• Expanding work into evaluation of debris volume thresholds and how they might cause significant changes in scour (yield) rates
• Expanding work into measurement and prediction of debris flow velocity, viscosity, and yield strength
• Expanding work into design of mitigation structures and prediction of debris runout, runup, and boulder impact forces
viii
1.0 Introduction The production of debris flows can be one of the most hazardous consequences of wildfires in the urban/wildland interface. Debris flows can occur with little warning, are capable of transporting large material over relatively gentle gradients, and may develop momentum and impact forces that cause considerable destruction to structures at risk. Although considerable resources are expended to mitigate the potential for these destructive events after fires, little is known about what mitigation approaches are most effective, and under what conditions varying approaches may be appropriate. The purpose of this study is to evaluate the effectiveness of existing approaches used to mitigate the hazards posed by post-wildfire debris flows, and to provide guidelines for the selection of appropriate designs based on parameters easily defined after wildfires. The effectiveness of erosion control treatments in burned areas has been evaluated in the past by a number of workers (e.g., Miles, 2005; Robichaud et al., 2000; Beyers et al., 1998; Wohlgemuth et al., 1998, 1999, 2001); this work has been primarily at plot or hillslope scales, and often on fairly gentle gradients. The generation of debris flows from recently burned basins, however, involves runoff and erosion processes acting throughout an entire basin and often on steep slopes (Cannon and Gartner, 2005; McDonald and Giraud, 2002; Wells, 1987). The shift from plot- or hillslope to basin-scale erosion and sediment control is important to consider when attempting to prevent erosion from burned basins subject to debris-flow processes. For this reason, this study will focus on basin-scale processes. Erosion control techniques used to mitigate potential debris-flow activity generally aim toward minimizing the amount of material transported from hillslopes and channels. The most frequently employed hillslope erosion control techniques include log erosion barriers (LEBs), straw mulching and seeding. Silt fences, debris racks, debris dams, and debris basins have also been used as channel treatments. In this study, we evaluate the effectiveness of each of these treatment methods by evaluating their ability to reduce the volume of debris flows that can issue from recently burned basins. In this report, much of which is summarized from deWolfe (2006), we first provide a discussion of the post-fire process that lead to the generation of debris flows and a review of the design, function and recommended installation of the treatments evaluated. We then describe the methods used to measure and characterize post-fire debris-flow volumes and to assess the effectiveness of different erosion control methods in reducing these volumes. We present measures of the volumes of material contributed to post-fire debris flows generated from 46 basins located in California, Colorado and Utah, and graphs of the cumulative eroded volume with distance down the channel network. The graphs provide information about the scale of contributions of material to post-fire debris flows from different sources within a basin, and indicate potential approaches for mitigation. The volume data, coupled with information on basin characteristics and debris-flow triggering rainfall conditions, is used to develop a multiple regression model that can be used to predict potential debris-flow volumes as a function of burn severity, basin morphology, material properties and triggering storm rainfall. This model is used to compare predicted debris-flow volumes from treated basins with those from untreated basins to determine if the volumes of material can be
1

2
significantly decreased by post-fire mitigation, and to identify the sizes of recently burned basins that can be effectively treated to mitigate debris-flow activity. And last, we use these analyses and a review of the currently available technical literature on erosion-control methods and their effectiveness, supplemented by our own field observations of implemented erosion control approaches and those of practitioners, to identify those erosion control measures that will be most effective in mitigating post-fire debris flow hazards. Based on these analyses, a set of tools that can be used for decision-support for assessing appropriate treatments in burned watersheds.
2.0 Background
2.1 Post-fire Debris Flow Processes
Debris flow is defined as the rapid flow of saturated material consisting of more than 20% gravel and coarse material through a steep channel or over steep hillslopes (Cruden and Varnes, 1996; Hungr, 2005). Debris flows occur in response to the input of water, via heavy precipitation or rapid snowmelt, into an adequate supply of soil or sediment. Increased pore pressures and associated decreases in strength result in failure. Material then flows down a channel or over hillslopes under the influence of gravity. Debris flows can initiate either through failure of a discrete landslide, or by entrainment of sediment by runoff. Landslides mobilize into debris flows if there is sufficient water content to allow the material to flow after the initial failure. Runoff-triggered debris flows occur much more frequently in recently burned areas than do landslide-triggered flows (Cannon and Gartner, 2005; Cannon, 2001). Decreases in storage and infiltration rates that accompany a wildfire due to consumption of the rainfall- intercepting canopy and of soil-mantling litter and duff, intensive drying of the soil, generation of vegetative ash, and the enhancement or formation of water-repellent soils and/or surface sealing of soil pores by wood ash can result in significantly increased runoff and movement of soil (e.g., Shakesby and Doerr, 2005; Wondzell and King, 2003; Martin and Moody, 2001; Doerr et al., 2000; Spittler, 1995). Smooth and continuous runoff paths following wildfires can allow for rapid and pervasive overland flow (Meyer, 2002; Cannon et al., 2001), and combustion of soil-binding organic material promotes dry ravel of noncohesive soils and channel loading (Swanston, 1991; Wells 1987). Increased runoff can also erode significant volumes of material from channels, either by bank failure or channel bed erosion (Moody and Martin, 2001; Wondzell and King, 2003). The result of rainfall on burned basins is often the transport and deposition of large volumes of sediment, both within and down-channel from the burned area. Under these conditions, debris flows frequently initiate through a process of bulking of surface runoff with material eroded from hillslopes and channels. Material can be contributed to post-fire debris flows through the processes of dry ravel, sheetwash, rilling, and gully and channel bed erosion. Dry ravel is the process of rapid, downhill movement of individual regolith and organic particles solely under the influence of gravity, and without the effect of water (Swanson, 1981). This process occurs in response to drying of the soil and combustion of soil-binding organisms, and has been observed occurring both during and after the passage of the fire. This process adds ash and fine soil materials to channels (Wells, 1987). Sheetwash is a process where rainfall runoff travels over a hillslope as a planar sheet, and can entrain material, including wood ash from the fire, organic litter, and soil. Rilling is also common in burned watersheds, and forms when surface runoff concentrates on a hillslope. Runoff in rills can remove soil material between 2 and ~12 inches depth within A and B soil horizons. In burned areas, Wells (1987) shows a method of rill formation due to a hydrophobic soil layer that inhibits the infiltration of water, leading to increased runoff of fine material and water into channels via rills. Rills are common in severely burned areas where slope inclinations range up to ~25-40º (56 – 89%)
3
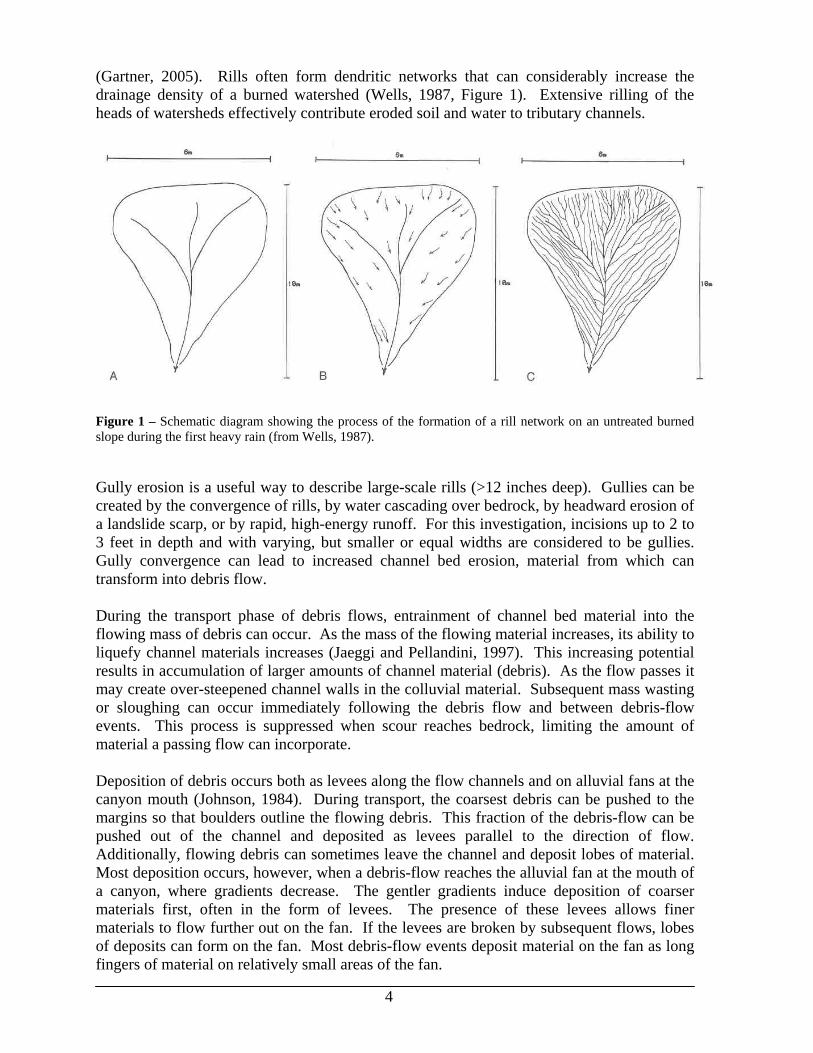
(Gartner, 2005). Rills often form dendritic networks that can considerably increase the drainage density of a burned watershed (Wells, 1987, Figure 1). Extensive rilling of the heads of watersheds effectively contribute eroded soil and water to tributary channels.
Figure 1 – Schematic diagram showing the process of the formation of a rill network on an untreated burned slope during the first heavy rain (from Wells, 1987).
Gully erosion is a useful way to describe large-scale rills (>12 inches deep). Gullies can be created by the convergence of rills, by water cascading over bedrock, by headward erosion of a landslide scarp, or by rapid, high-energy runoff. For this investigation, incisions up to 2 to 3 feet in depth and with varying, but smaller or equal widths are considered to be gullies. Gully convergence can lead to increased channel bed erosion, material from which can transform into debris flow. During the transport phase of debris flows, entrainment of channel bed material into the flowing mass of debris can occur. As the mass of the flowing material increases, its ability to liquefy channel materials increases (Jaeggi and Pellandini, 1997). This increasing potential results in accumulation of larger amounts of channel material (debris). As the flow passes it may create over-steepened channel walls in the colluvial material. Subsequent mass wasting or sloughing can occur immediately following the debris flow and between debris-flow events. This process is suppressed when scour reaches bedrock, limiting the amount of material a passing flow can incorporate. Deposition of debris occurs both as levees along the flow channels and on alluvial fans at the canyon mouth (Johnson, 1984). During transport, the coarsest debris can be pushed to the margins so that boulders outline the flowing debris. This fraction of the debris-flow can be pushed out of the channel and deposited as levees parallel to the direction of flow. Additionally, flowing debris can sometimes leave the channel and deposit lobes of material. Most deposition occurs, however, when a debris-flow reaches the alluvial fan at the mouth of a canyon, where gradients decrease. The gentler gradients induce deposition of coarser materials first, often in the form of levees. The presence of these levees allows finer materials to flow further out on the fan. If the levees are broken by subsequent flows, lobes of deposits can form on the fan. Most debris-flow events deposit material on the fan as long fingers of material on relatively small areas of the fan.
4
Debris flows following wildfire are often triggered by the first heavy rainstorm on a burned area (Cannon and Gartner, 2005). Rainstorms on burned areas do not need to be especially large to produce debris flows: debris flows are frequently generated in response to storms with less than five-year recurrence intervals (e.g. Cannon et al., 2003a; Gartner et al., 2005; Parrett, 1987). The first debris flow generated by a burned basin is usually the largest, while subsequent debris flows are generally smaller in magnitude and over time become hyperconcentrated flows or sediment-laden floods as material is removed from the channels (Cannon et al., 2003a,b). The increased probability of debris flows following wildfire usually lasts for two to three years (Cannon and Gartner, 2005). After this point, the basins are sufficiently eroded and revegetated so that debris flows are not produced in response to normally occurring rainfall events.
2.2 Erosion Control Measure Function, Design and Installation
Here we provide information on the function, design and recommended installation for hillslope applications of seeding, mulching and log erosion barriers (LEBs), and channel applications of silt fences, debris racks, check dams, and debris basins.
2.2.1 Seeding
Seeding is frequently employed as short-term (1-3 year) erosion control method to introduce relatively fast growing plants into a burned area so that a vegetative cover can be re-established as quickly as possible. Target areas are erodible soils that have been severely burned, or severely burned areas where all ground cover is lost (Miles, 2005). The seeds are intended to begin germinating after a fire is extinguished, so that after the first growing season or two a living vegetative cover is established, the roots of which will bind and stabilize soil material (Miles, 2005). The vegetative cover will also help to reduce raindrop impact and increase infiltration (Miles, 2005). Seeding is usually accomplished as aerial seeding over large burned areas (via plane or helicopter), as hand seeding over small sensitive areas, or as hydro-seeding where road-access is available (Miles, 2005). The target application rate is 40 lbs per acre (WWE, 2005; BAER, 2002a,b). The type of seed used is site specific, but in general native species are preferred because they can germinate more easily in their natural environment. Slopes with inclinations greater than about 37º (75%) are considered too steep for re-vegetation (Chelan County P.U.D, 2001).
2.2.2 Mulching
Mulching is an erosion control method that seeks to provide a suitable ground cover immediately after a fire is extinguished (Miles, 2005). Areas targeted by mulching include highly erodible soils that have been severely burned to a degree that all ground cover is lost (Miles, 2005). The purposes of mulching are to reduce impact of raindrops, to hold topsoil in place, to disperse overland flow, and to provide space for reestablishment of vegetation (Miles, 2005). Mulching is thus intended to provide both immediate and short-term (<1 year) erosion control. Mulch is often applied with seeding so that rapid reestablishment of vegetation is facilitated. Mulch is intended to consist of noxious weed-free straw, or less commonly, woodchip mulch. It can be applied aerially from a helicopter over large areas or
5
by hand over smaller areas. It is recommended that the mulch cover at least 40-50% of the ground and be evenly spread. The most effective installation effort for small sensitive areas is hand mulching because 100% of the ground can be covered (Miles, 2005). In addition, mulch can be crimped into the soil in order to keep it in contact with the ground (Ey, P.C., 2004).
2.2.3 Log Erosion Barriers (LEBs)
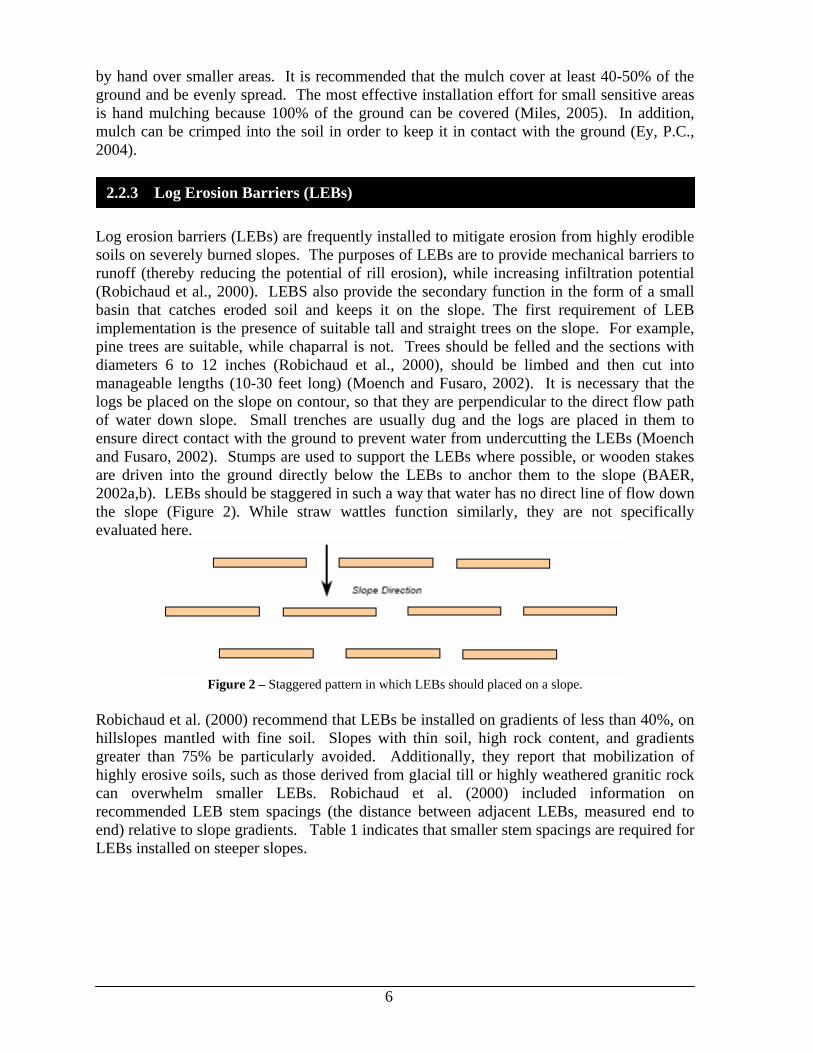
Log erosion barriers (LEBs) are frequently installed to mitigate erosion from highly erodible soils on severely burned slopes. The purposes of LEBs are to provide mechanical barriers to runoff (thereby reducing the potential of rill erosion), while increasing infiltration potential (Robichaud et al., 2000). LEBS also provide the secondary function in the form of a small basin that catches eroded soil and keeps it on the slope. The first requirement of LEB implementation is the presence of suitable tall and straight trees on the slope. For example, pine trees are suitable, while chaparral is not. Trees should be felled and the sections with diameters 6 to 12 inches (Robichaud et al., 2000), should be limbed and then cut into manageable lengths (10-30 feet long) (Moench and Fusaro, 2002). It is necessary that the logs be placed on the slope on contour, so that they are perpendicular to the direct flow path of water down slope. Small trenches are usually dug and the logs are placed in them to ensure direct contact with the ground to prevent water from undercutting the LEBs (Moench and Fusaro, 2002). Stumps are used to support the LEBs where possible, or wooden stakes are driven into the ground directly below the LEBs to anchor them to the slope (BAER, 2002a,b). LEBs should be staggered in such a way that water has no direct line of flow down the slope (Figure 2). While straw wattles function similarly, they are not specifically evaluated here.
Figure 2 – Staggered pattern in which LEBs should placed on a slope.
Robichaud et al. (2000) recommend that LEBs be installed on gradients of less than 40%, on hillslopes mantled with fine soil. Slopes with thin soil, high rock content, and gradients greater than 75% be particularly avoided. Additionally, they report that mobilization of highly erosive soils, such as those derived from glacial till or highly weathered granitic rock can overwhelm smaller LEBs. Robichaud et al. (2000) included information on recommended LEB stem spacings (the distance between adjacent LEBs, measured end to end) relative to slope gradients. Table 1 indicates that smaller stem spacings are required for LEBs installed on steeper slopes.
6
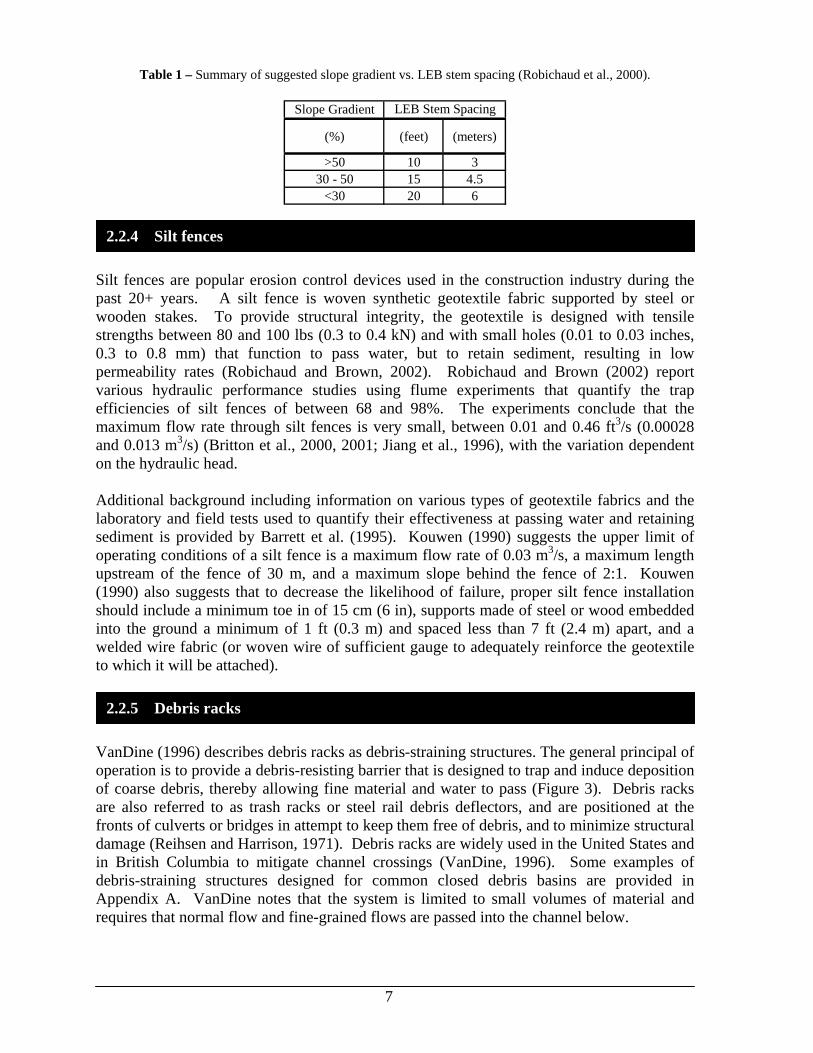
Table 1 – Summary of suggested slope gradient vs. LEB stem spacing (Robichaud et al., 2000).
Slope Gradient
(%) (feet) (meters)
>50 10 330 - 50 15 4.5
<30 20 6
LEB Stem Spacing
2.2.4 Silt fences
Silt fences are popular erosion control devices used in the construction industry during the past 20+ years. A silt fence is woven synthetic geotextile fabric supported by steel or wooden stakes. To provide structural integrity, the geotextile is designed with tensile strengths between 80 and 100 lbs (0.3 to 0.4 kN) and with small holes (0.01 to 0.03 inches, 0.3 to 0.8 mm) that function to pass water, but to retain sediment, resulting in low permeability rates (Robichaud and Brown, 2002). Robichaud and Brown (2002) report various hydraulic performance studies using flume experiments that quantify the trap efficiencies of silt fences of between 68 and 98%. The experiments conclude that the maximum flow rate through silt fences is very small, between 0.01 and 0.46 ft3/s (0.00028 and 0.013 m3/s) (Britton et al., 2000, 2001; Jiang et al., 1996), with the variation dependent on the hydraulic head. Additional background including information on various types of geotextile fabrics and the laboratory and field tests used to quantify their effectiveness at passing water and retaining sediment is provided by Barrett et al. (1995). Kouwen (1990) suggests the upper limit of operating conditions of a silt fence is a maximum flow rate of 0.03 m3/s, a maximum length upstream of the fence of 30 m, and a maximum slope behind the fence of 2:1. Kouwen (1990) also suggests that to decrease the likelihood of failure, proper silt fence installation should include a minimum toe in of 15 cm (6 in), supports made of steel or wood embedded into the ground a minimum of 1 ft (0.3 m) and spaced less than 7 ft (2.4 m) apart, and a welded wire fabric (or woven wire of sufficient gauge to adequately reinforce the geotextile to which it will be attached).
2.2.5 Debris racks
VanDine (1996) describes debris racks as debris-straining structures. The general principal of operation is to provide a debris-resisting barrier that is designed to trap and induce deposition of coarse debris, thereby allowing fine material and water to pass (Figure 3). Debris racks are also referred to as trash racks or steel rail debris deflectors, and are positioned at the fronts of culverts or bridges in attempt to keep them free of debris, and to minimize structural damage (Reihsen and Harrison, 1971). Debris racks are widely used in the United States and in British Columbia to mitigate channel crossings (VanDine, 1996). Some examples of debris-straining structures designed for common closed debris basins are provided in Appendix A. VanDine notes that the system is limited to small volumes of material and requires that normal flow and fine-grained flows are passed into the channel below.
7
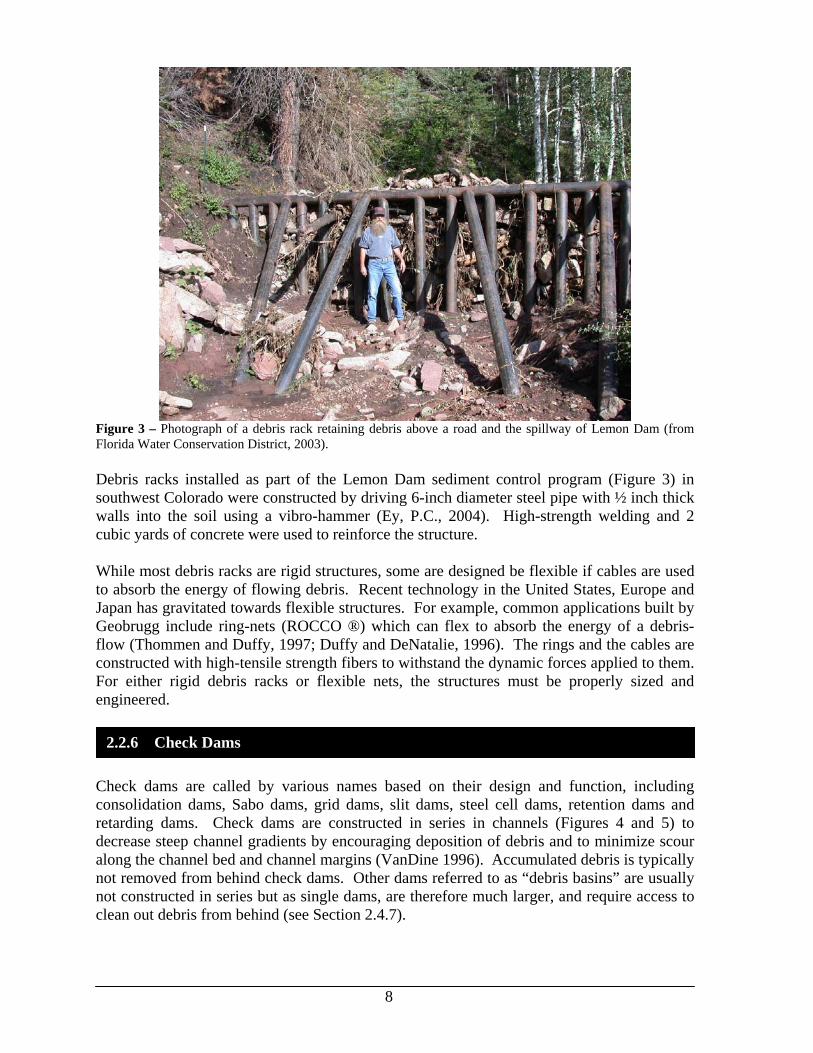
Figure 3 – Photograph of a debris rack retaining debris above a road and the spillway of Lemon Dam (from Florida Water Conservation District, 2003). Debris racks installed as part of the Lemon Dam sediment control program (Figure 3) in southwest Colorado were constructed by driving 6-inch diameter steel pipe with ½ inch thick walls into the soil using a vibro-hammer (Ey, P.C., 2004). High-strength welding and 2 cubic yards of concrete were used to reinforce the structure. While most debris racks are rigid structures, some are designed be flexible if cables are used to absorb the energy of flowing debris. Recent technology in the United States, Europe and Japan has gravitated towards flexible structures. For example, common applications built by Geobrugg include ring-nets (ROCCO ®) which can flex to absorb the energy of a debris-flow (Thommen and Duffy, 1997; Duffy and DeNatalie, 1996). The rings and the cables are constructed with high-tensile strength fibers to withstand the dynamic forces applied to them. For either rigid debris racks or flexible nets, the structures must be properly sized and engineered.
2.2.6 Check Dams
Check dams are called by various names based on their design and function, including consolidation dams, Sabo dams, grid dams, slit dams, steel cell dams, retention dams and retarding dams. Check dams are constructed in series in channels (Figures 4 and 5) to decrease steep channel gradients by encouraging deposition of debris and to minimize scour along the channel bed and channel margins (VanDine 1996). Accumulated debris is typically not removed from behind check dams. Other dams referred to as “debris basins” are usually not constructed in series but as single dams, are therefore much larger, and require access to clean out debris from behind (see Section 2.4.7).
8
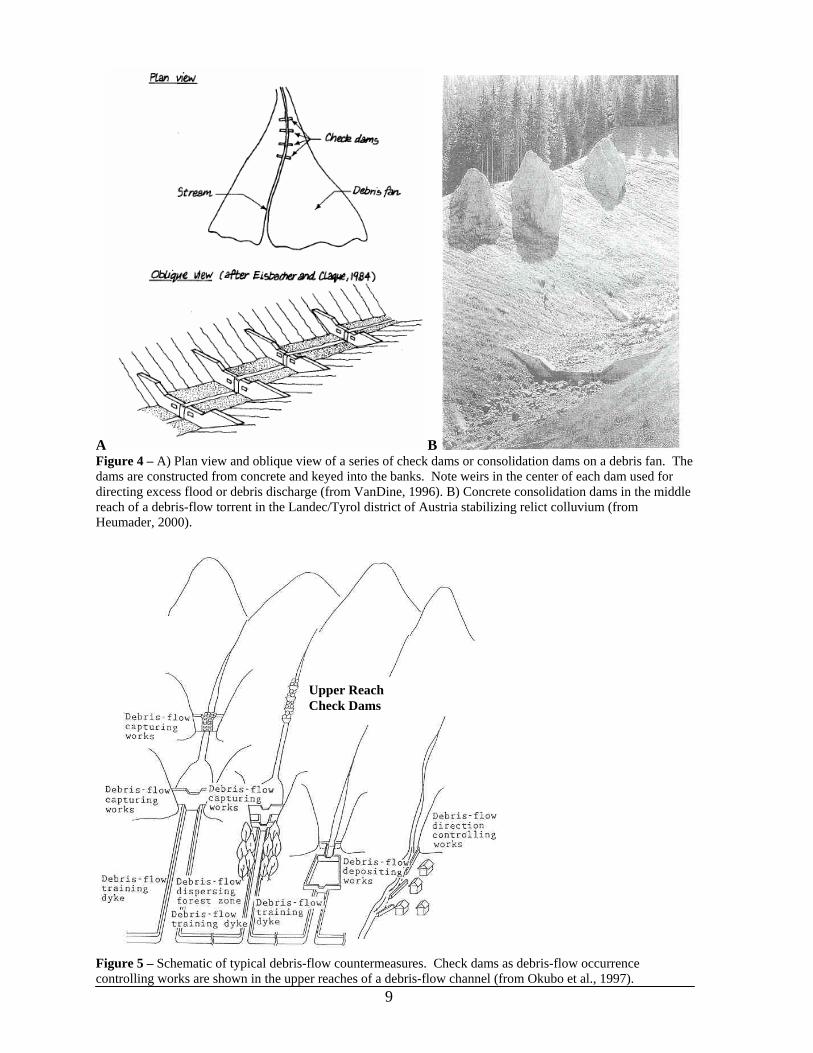
A B Figure 4 – A) Plan view and oblique view of a series of check dams or consolidation dams on a debris fan. The dams are constructed from concrete and keyed into the banks. Note weirs in the center of each dam used for directing excess flood or debris discharge (from VanDine, 1996). B) Concrete consolidation dams in the middle reach of a debris-flow torrent in the Landec/Tyrol district of Austria stabilizing relict colluvium (from Heumader, 2000).
Upper Reach Check Dams
9
Figure 5 – Schematic of typical debris-flow countermeasures. Check dams as debris-flow occurrence controlling works are shown in the upper reaches of a debris-flow channel (from Okubo et al., 1997).
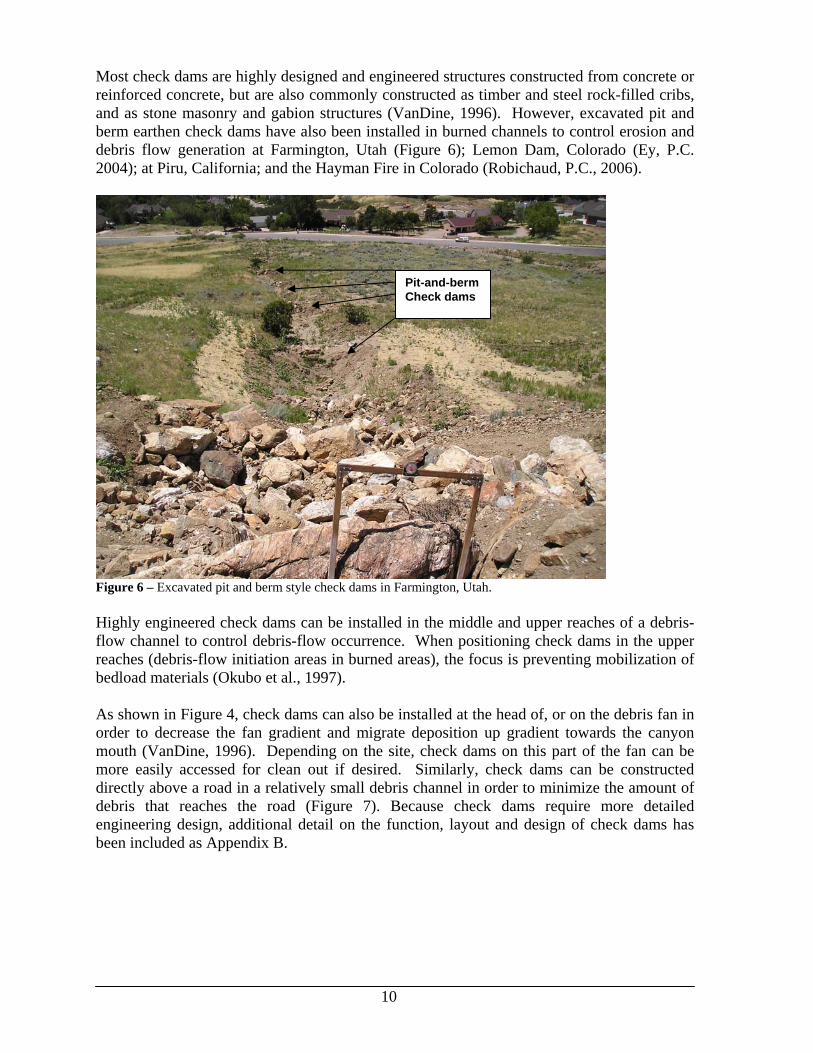
Most check dams are highly designed and engineered structures constructed from concrete or reinforced concrete, but are also commonly constructed as timber and steel rock-filled cribs, and as stone masonry and gabion structures (VanDine, 1996). However, excavated pit and berm earthen check dams have also been installed in burned channels to control erosion and debris flow generation at Farmington, Utah (Figure 6); Lemon Dam, Colorado (Ey, P.C. 2004); at Piru, California; and the Hayman Fire in Colorado (Robichaud, P.C., 2006).
Pit-and-berm Check dams
Figure 6 – Excavated pit and berm style check dams in Farmington, Utah. Highly engineered check dams can be installed in the middle and upper reaches of a debris-flow channel to control debris-flow occurrence. When positioning check dams in the upper reaches (debris-flow initiation areas in burned areas), the focus is preventing mobilization of bedload materials (Okubo et al., 1997).
As shown in Figure 4, check dams can also be installed at the head of, or on the debris fan in order to decrease the fan gradient and migrate deposition up gradient towards the canyon mouth (VanDine, 1996). Depending on the site, check dams on this part of the fan can be more easily accessed for clean out if desired. Similarly, check dams can be constructed directly above a road in a relatively small debris channel in order to minimize the amount of debris that reaches the road (Figure 7). Because check dams require more detailed engineering design, additional detail on the function, layout and design of check dams has been included as Appendix B.
10

A B Figure 7 – Photographs of a debris torrent in the Lienz/Tyrol district of Austria showing A) eroded debris channel after a debris-flow event in 1882 and B) the same reach about 100 years later. The series of check dams have stabilized the channel and protected the road below. Also notice the reforestation of the slopes (from Heumader, 2000).
2.2.7 Debris Basins
Debris basins were not specifically studied for this project. However, debris basins are a widely used method for mitigating debris-flow hazards, so a brief description of their characteristics and design parameters is given here. Debris basins are designed to retain the coarse material that may be produced by a single debris-flow event (USACE, 2004). Sediment that is captured in the basin after a debris flow must be removed to restore the storage capacity for a subsequent event (USACE, 2004). VanDine (1996) notes that
[t]his form of debris flow control is generally considered to be the most sophisticated and generally the most costly. Design considerations include: design magnitude or volume of a debris flow, size and gradation of the coarse-grained debris (pertinent to designing the straining structure), potential runout distance, impact forces, run-up, and probable storage angle. Properly located, designed, and constructed, a debris barrier and storage basin, with an appropriate form of debris-straining structure incorporated into the barrier, is probably the most positive form of debris flow control. As well, this form of control structure is best suited to a larger debris fan with a relatively low gradient. The geometry and morphology of the debris fan can be used to optimize design and minimize construction costs.
Figure 8 shows a schematic representation of the basic components of a debris basin. These structures require large amounts of space and often many of the design parameters must be estimated, making correct sizing of the basins a challenge.
11
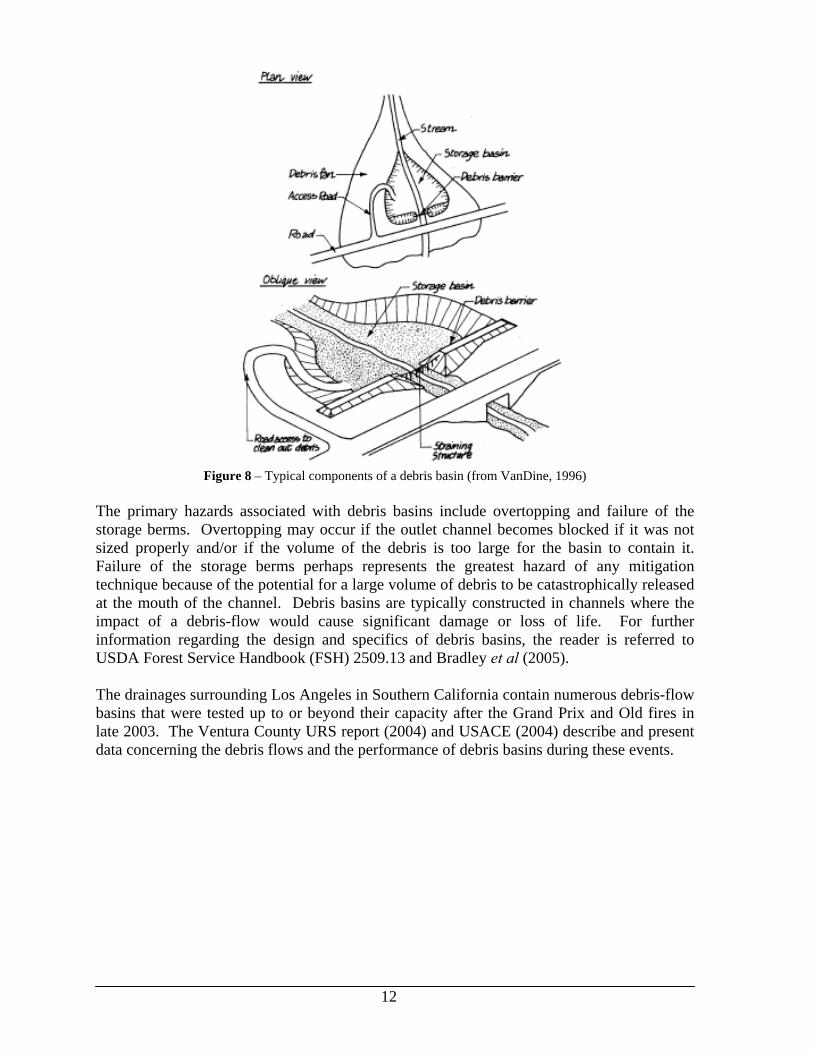
Figure 8 – Typical components of a debris basin (from VanDine, 1996)
The primary hazards associated with debris basins include overtopping and failure of the storage berms. Overtopping may occur if the outlet channel becomes blocked if it was not sized properly and/or if the volume of the debris is too large for the basin to contain it. Failure of the storage berms perhaps represents the greatest hazard of any mitigation technique because of the potential for a large volume of debris to be catastrophically released at the mouth of the channel. Debris basins are typically constructed in channels where the impact of a debris-flow would cause significant damage or loss of life. For further information regarding the design and specifics of debris basins, the reader is referred to USDA Forest Service Handbook (FSH) 2509.13 and Bradley et al (2005). The drainages surrounding Los Angeles in Southern California contain numerous debris-flow basins that were tested up to or beyond their capacity after the Grand Prix and Old fires in late 2003. The Ventura County URS report (2004) and USACE (2004) describe and present data concerning the debris flows and the performance of debris basins during these events.
12
3.0 Methods
3.1 Measurement of Post-fire Debris-Flow Volumes
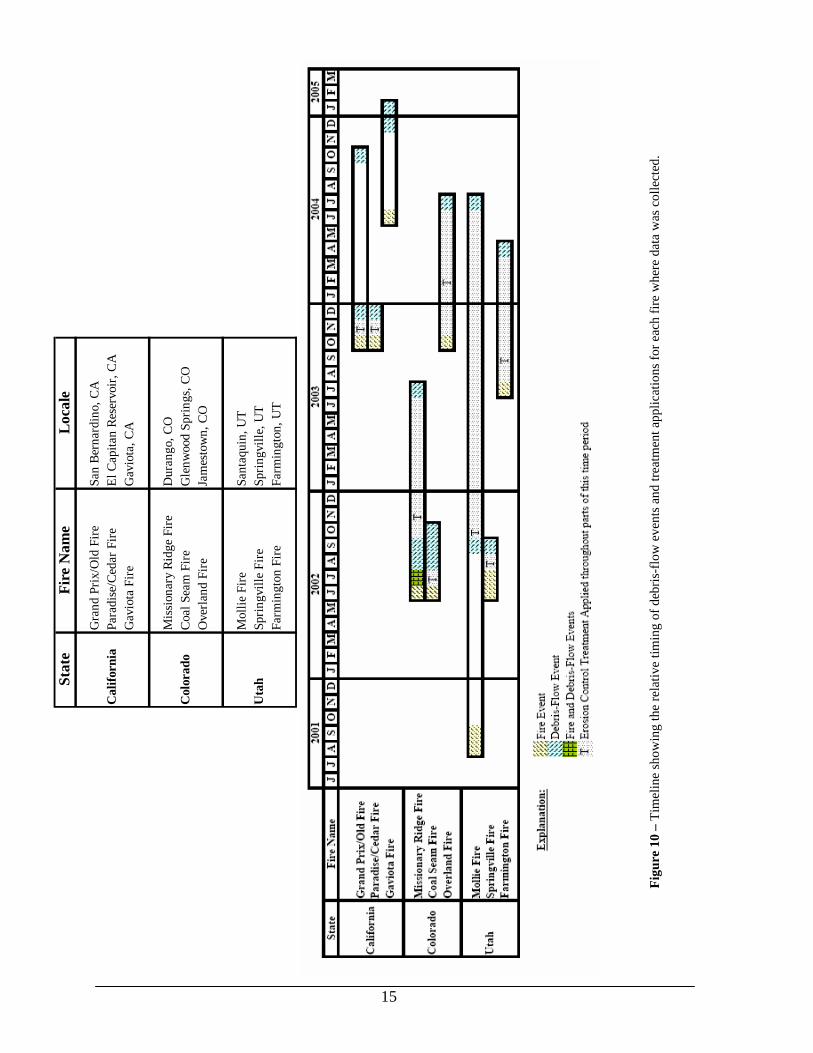
Debris-flow volume can accumulate from contributions of material eroded from hillslopes by rilling or sheetwash, from incision into material stored in the channel or failure of incised stream banks. Hungr et al. (1984) defined the “channel yield rate” as a measure of the amount of material that is eroded for a given length of debris channel in a drainage basin (in m3/m or yd3/yd). Here we adopt the concept of the channel yield rate as the method for characterizing the volume of material entrained in a debris flow. The volume of material in debris flows can also be characterized by measurements of the area inundated by a flow and by deposit thickness (Giraud, 2005). For this study, however, we found this not to be a practical approach. In many cases debris-flow deposits that impacted roads, bridges or structures were removed soon after an event. In addition, we observed that material is frequently deposited into higher order streams during an event, is flushed downstream, and would thus not be included in a volume measurement. An additional drawback is that deposits were frequently deposited as a complex series of elongate lobes, or fingers, crossing the fan, and not as a single unit of material, making mapping and measurement extremely difficult. A last complexity is the difficulty in identifying the location of the original ground surface in order to measure deposit depth. This is often not possible for more than a few locations on an alluvial fan, and deposit thickness can vary considerably over short distances. For these reasons, we chose to characterize volume using measures of the amount of material scoured from channel. 3.2 Erosion Control Methods To measure post-fire debris flow volumes, drainage basins were identified where debris flows were known to have occurred following recent fires. The basins were selected for study based on size, accessibility, and treatment characteristics. Small basins (0.5 – 2 km2) were desirable because they would be useful in building the database, but basins up to 5 km2 were later targeted in order to expand the scope of the database. Basins were also targeted if they had been treated with erosion control measures, and yet still experienced debris flows. Debris-flow volume data was collected during 2004 and 2005 from 46 drainage basins in nine burn areas in California, Colorado and Utah (Figure 9) (deWolfe, 2006). For each fire, debris-flow and treatments are shown in relative chronologic order in Figure 10. 13
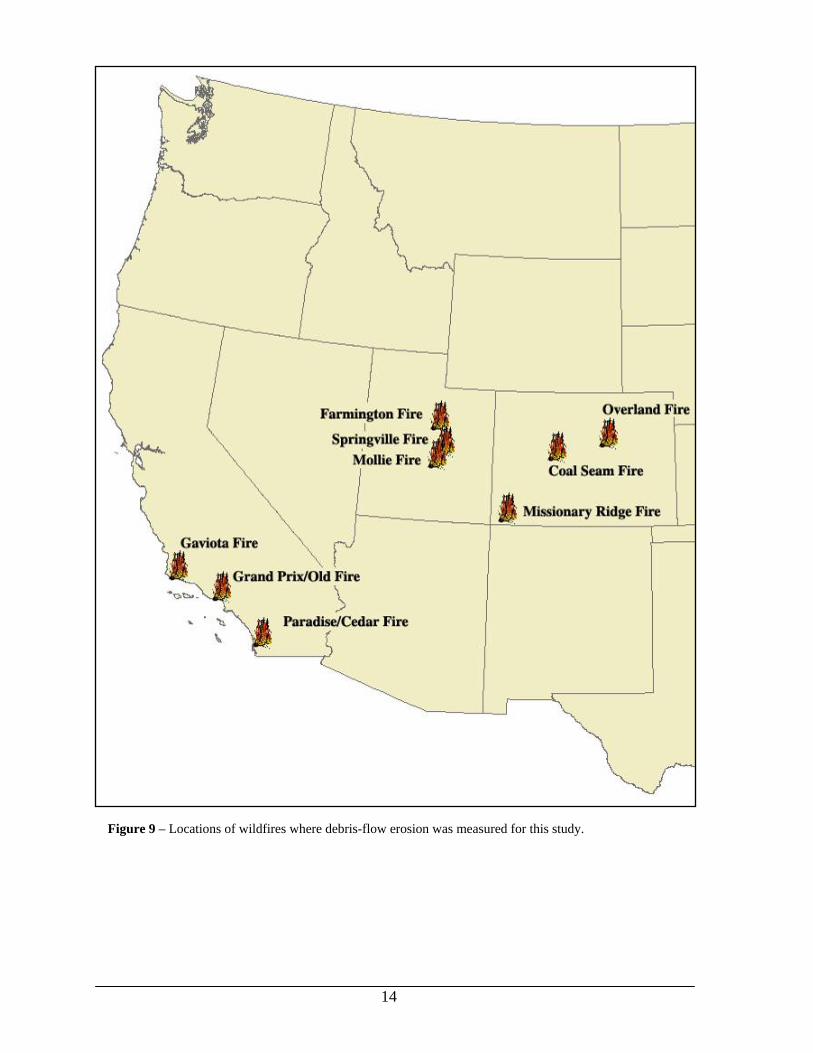
Figure 9 – Locations of wildfires where debris-flow erosion was measured for this study.
14
Figu
re 1
0 –
Tim
elin
e sh
owin
g th
e re
lativ
e tim
ing
of d
ebris
-flo
w e
vent
s and
trea
tmen
t app
licat
ions
for e
ach
fire
whe
re d
ata
was
col
lect
ed.
Stat
eFi
re N
ame
Loc
ale
Gra
nd P
rix/O
ld F
ireSa
n Be
rnar
dino
, CA
Para
dise
/Ced
ar F
ireEl
Cap
itan
Rese
rvoi
r, C
AG
avio
ta F
ireG
avio
ta, C
A
Mis
sion
ary
Ridg
e Fi
reD
uran
go, C
OC
oal S
eam
Fire
Gle
nwoo
d Sp
rings
, CO
Ove
rland
Fire
Jam
esto
wn,
CO
Mol
lie F
ireSa
ntaq
uin,
UT
Sprin
gvill
e Fi
reSp
ringv
ille,
UT
Farm
ingt
on F
ireFa
rmin
gton
, UT
Uta
h
Cal
iforn
ia
Col
orad
o
15
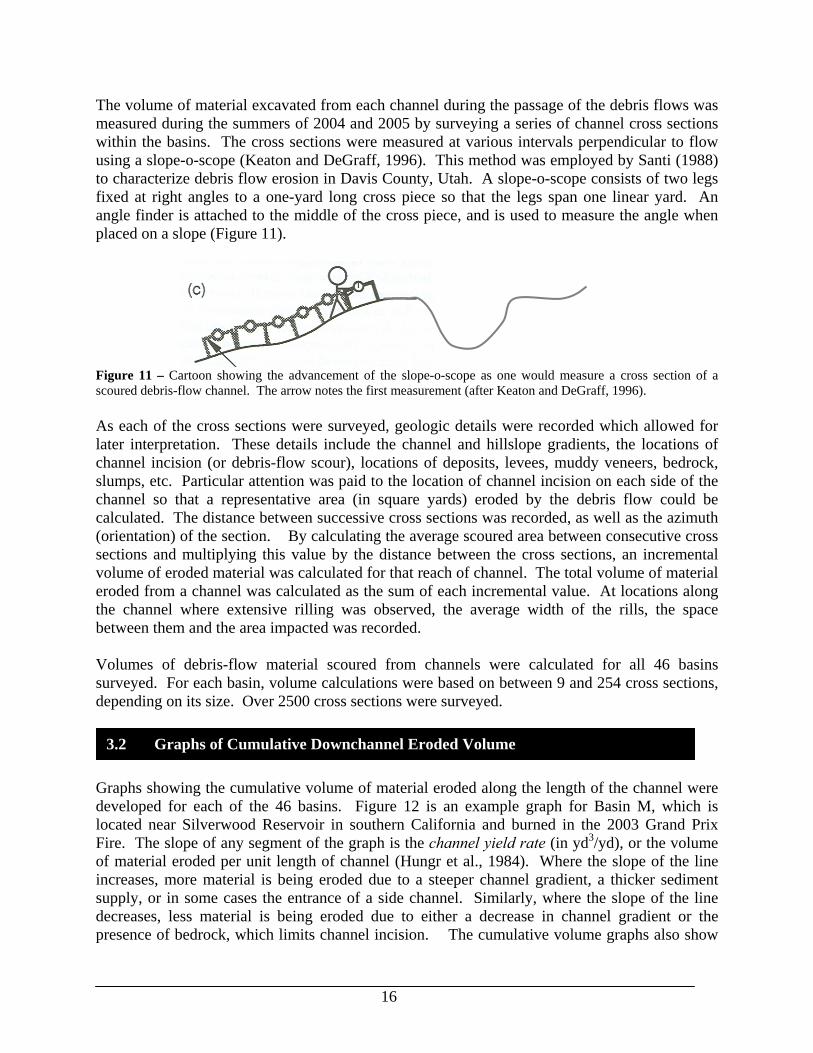
The volume of material excavated from each channel during the passage of the debris flows was measured during the summers of 2004 and 2005 by surveying a series of channel cross sections within the basins. The cross sections were measured at various intervals perpendicular to flow using a slope-o-scope (Keaton and DeGraff, 1996). This method was employed by Santi (1988) to characterize debris flow erosion in Davis County, Utah. A slope-o-scope consists of two legs fixed at right angles to a one-yard long cross piece so that the legs span one linear yard. An angle finder is attached to the middle of the cross piece, and is used to measure the angle when placed on a slope (Figure 11).
Figure 11 – Cartoon showing the advancement of the slope-o-scope as one would measure a cross section of a scoured debris-flow channel. The arrow notes the first measurement (after Keaton and DeGraff, 1996). As each of the cross sections were surveyed, geologic details were recorded which allowed for later interpretation. These details include the channel and hillslope gradients, the locations of channel incision (or debris-flow scour), locations of deposits, levees, muddy veneers, bedrock, slumps, etc. Particular attention was paid to the location of channel incision on each side of the channel so that a representative area (in square yards) eroded by the debris flow could be calculated. The distance between successive cross sections was recorded, as well as the azimuth (orientation) of the section. By calculating the average scoured area between consecutive cross sections and multiplying this value by the distance between the cross sections, an incremental volume of eroded material was calculated for that reach of channel. The total volume of material eroded from a channel was calculated as the sum of each incremental value. At locations along the channel where extensive rilling was observed, the average width of the rills, the space between them and the area impacted was recorded. Volumes of debris-flow material scoured from channels were calculated for all 46 basins surveyed. For each basin, volume calculations were based on between 9 and 254 cross sections, depending on its size. Over 2500 cross sections were surveyed.
3.2 Graphs of Cumulative Downchannel Eroded Volume
Graphs showing the cumulative volume of material eroded along the length of the channel were developed for each of the 46 basins. Figure 12 is an example graph for Basin M, which is located near Silverwood Reservoir in southern California and burned in the 2003 Grand Prix Fire. The slope of any segment of the graph is the channel yield rate (in yd3/yd), or the volume of material eroded per unit length of channel (Hungr et al., 1984). Where the slope of the line increases, more material is being eroded due to a steeper channel gradient, a thicker sediment supply, or in some cases the entrance of a side channel. Similarly, where the slope of the line decreases, less material is being eroded due to either a decrease in channel gradient or the presence of bedrock, which limits channel incision. The cumulative volume graphs also show
16
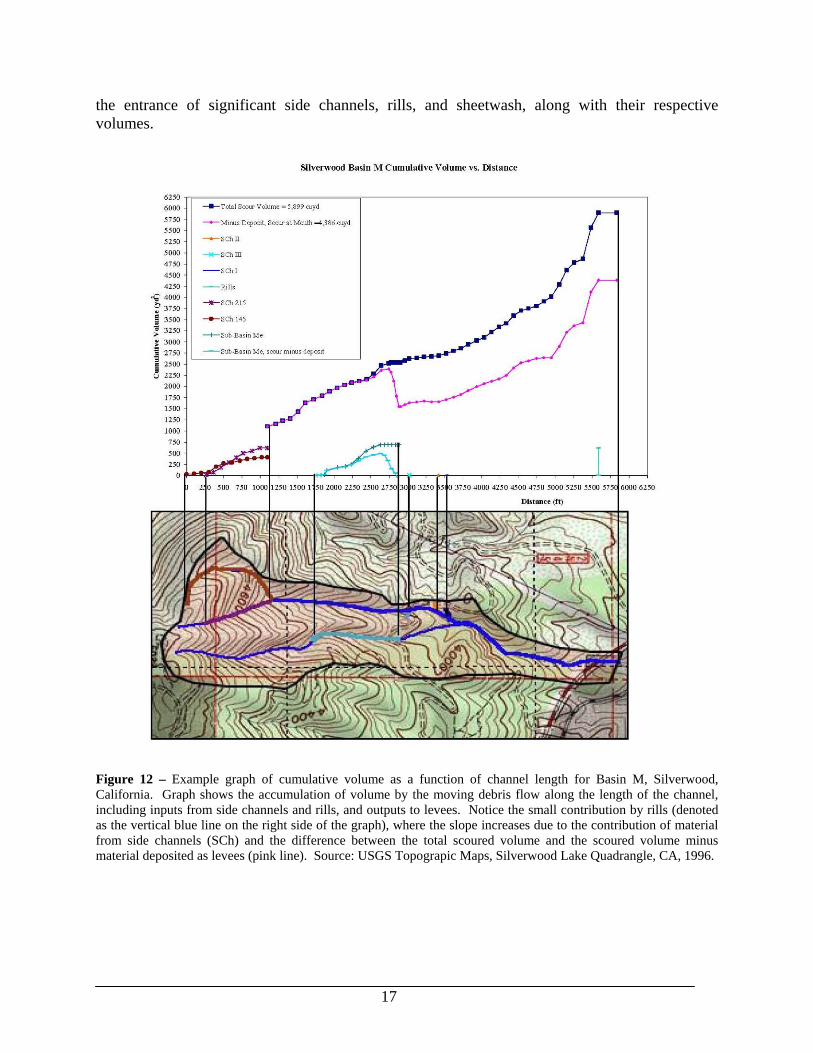
the entrance of significant side channels, rills, and sheetwash, along with their respective volumes.
Figure 12 – Example graph of cumulative volume as a function of channel length for Basin M, Silverwood, California. Graph shows the accumulation of volume by the moving debris flow along the length of the channel, including inputs from side channels and rills, and outputs to levees. Notice the small contribution by rills (denoted as the vertical blue line on the right side of the graph), where the slope increases due to the contribution of material from side channels (SCh) and the difference between the total scoured volume and the scoured volume minus material deposited as levees (pink line). Source: USGS Topograpic Maps, Silverwood Lake Quadrangle, CA, 1996.
17
3.3 Multi-variate Statistical Model for Debris-flow Volume
In addition to the volume measurements, data on basin morphology, triggering storm rainfall and material properties were compiled for each basin to be used in the development of a predictive model for post-fire debris-flow volume (Gartner, 2005). These data are in Appendix A as Tables A-1 through A-5. For each basin, different measures of basin gradient and channel network were calculated from either 10 or 30 meter DEMs, depending on availability. These include the average basin gradient; the area of the basin with slopes greater or equal to 30 percent; the area of the basin with slopes greater or equal to 50 percent; the relief ratio (the length of the longest stream channel extended to the drainage divide divided by the change in elevation of the basin); basin ruggedness (the change in basin elevation divided by the square root of the basin area (Melton, 1965); the drainage density (the total length of streams in a basin divided by the square root of the basin area; and the bifurcation ratio (the ratio of streams of any order to the number of streams of the next highest order.
Maps of burn severity were used to quantify the basin area burned at moderate severity; the basin area burned at high severity; the basin area burned at a combination of high and moderate severities; and the basin area burned at high, moderate, and low severities. Maps of burn severity for each fire were provided by the USGS EROS Data Center and USDA Forest Service BAER team reports. Material properties were characterized using grain-size distributions from field samples of burned soil. For a representative grain-size distributions for each basin, Gartner (2005) identified the median; the mean; the sorting; and the skewness, following procedures described in Inman (1952). The characteristics of storms that affected the basins of interest were obtained from tipping bucket rain gages located within two kilometers of each basin. For each storm, Gartner (2005) compiled the total storm rainfall; the storm duration; the average storm rainfall intensity; the peak 10-minute rainfall; the peak 15- minute rainfall; the peak 30-minute rainfall; and the peak 60-minute rainfall. A series of statistical analyses were used to identify those factors that most strongly affect the volume of debris-flow material that might pass a basin outlet, and to build the most robust regression model possible. As a first step, histograms of each of the independent variables were examined to verify a normal distribution of the data, and to identify outlying data points. Square root and natural log transforms were applied to the non-normally distributed variables, particularly the measurements of volume. Next, a correlation analysis was used to identify which of the independent variables most strongly relates to volume. This variable was then used as the independent variable in an initial model to explain a significant portion of the variability of the debris-flow volume data. ANOVA and t-tests were used to indicate if 95% confidence in the coefficient of the variable exists. Variables are then added in a step-wise fashion to the model and were retained if the addition of the variable improved the R2 of the model by more than 0.05, and if confidence in the coefficients of the variable exceeded 95%, as determined by F- and t-statistics. Variables were
18
removed if the addition of another variable caused the ANOVA and t-statistics to fall below 95% confidence. For a model to be accepted, adherence to the assumptions of linearity, constant variance, and normally distributed residuals (Helsel and Hirsch, 2002) were tested. This method of individually adding and subtracting variables yields a model that best predicts debris-flow volume as a function of the fewest variables possible (Draper and Smith, 1981). Finally, the model was verified by comparing predicted with actual volumes from a dataset of 21 debris-flow events reported in the literature, and not included in the regression analyses.
3.4 Literature Review and Field Observations of Erosion Control Effectiveness in Reducing Debris Flow Volume
We use a review of published literature to compile known information about the effectiveness of post-fire erosion control measures. In addition, observations regarding the effectiveness of erosion control treatments were made in burned drainage basins throughout 2004 and 2005, and information on erosion control effectiveness was provided during discussion with personnel with the Florida Water Conservancy District (FWCD), the USDA Forest Service, and state geological surveys of Colorado, California and Utah.
19
4.0 Results
In this section we analyze the data collected and discuss the implications of applying erosion control treatments for the purpose of debris-flow mitigation on the basin scale. We first present an analysis of the cumulative volume graphs, and describe what these graphs indicate about post-fire debris-flow processes that are relevant to treatment options. We then describe the multi-variate regression model that can be used to estimate post-fire debris flow volume and the implications of this model for assessing erosion control treatment effectiveness. Finally, we present field observations and information from emergency response personnel and practitioners on the effectiveness of erosion control practices to identify the most effective debris-flow hazard reduction methods.
4.1 Volume Change with Distance Down Channel
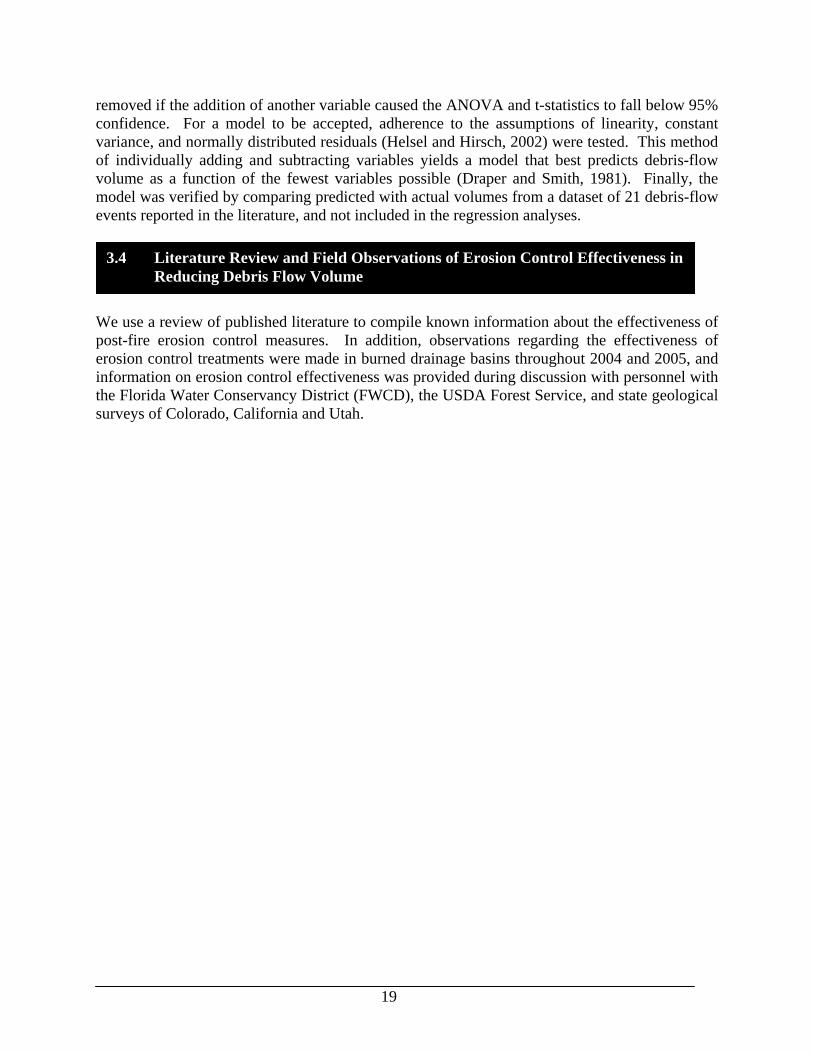
All 46 surveyed debris-flow channels showed significant scour and erosion, with average yield rates ranging from 0.4 to 12 cubic yards of material produced for every yard of channel length, with an overall average of 3.0 yd3/yd (Figure 13). Yield rates for short channel reaches (up to several hundred yards) ranged as high as 26.7 yd3/yd (Figure 14)
Overall Yield Rate
02468
1012
0 1 2 3 4 5 6 7 8 9 10 11 12
Rate (yd3/yd)
Freq
uenc
y
Figure 13. Distribution of calculated average channel yield rates. Mean = 0.36 yd3/yd; maximum = 11.88 yd3/yd; mean = 2.96 yd3/yd ; median = 2.23 yd3/yd.
20
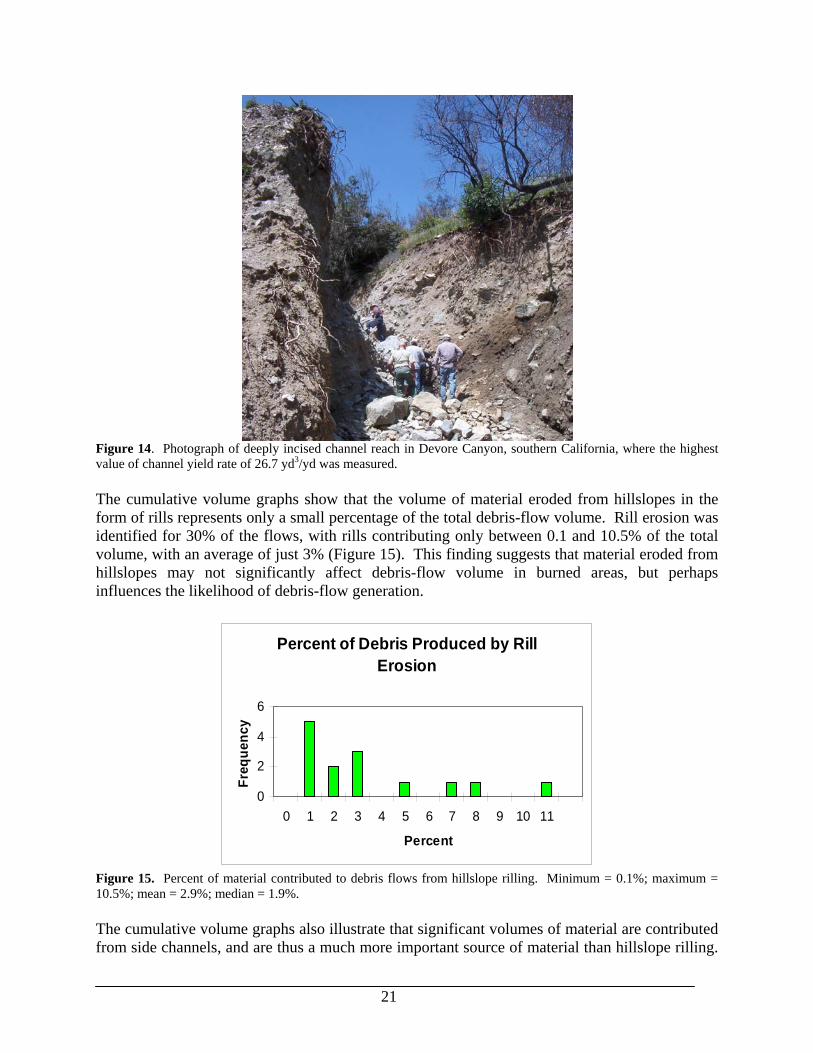
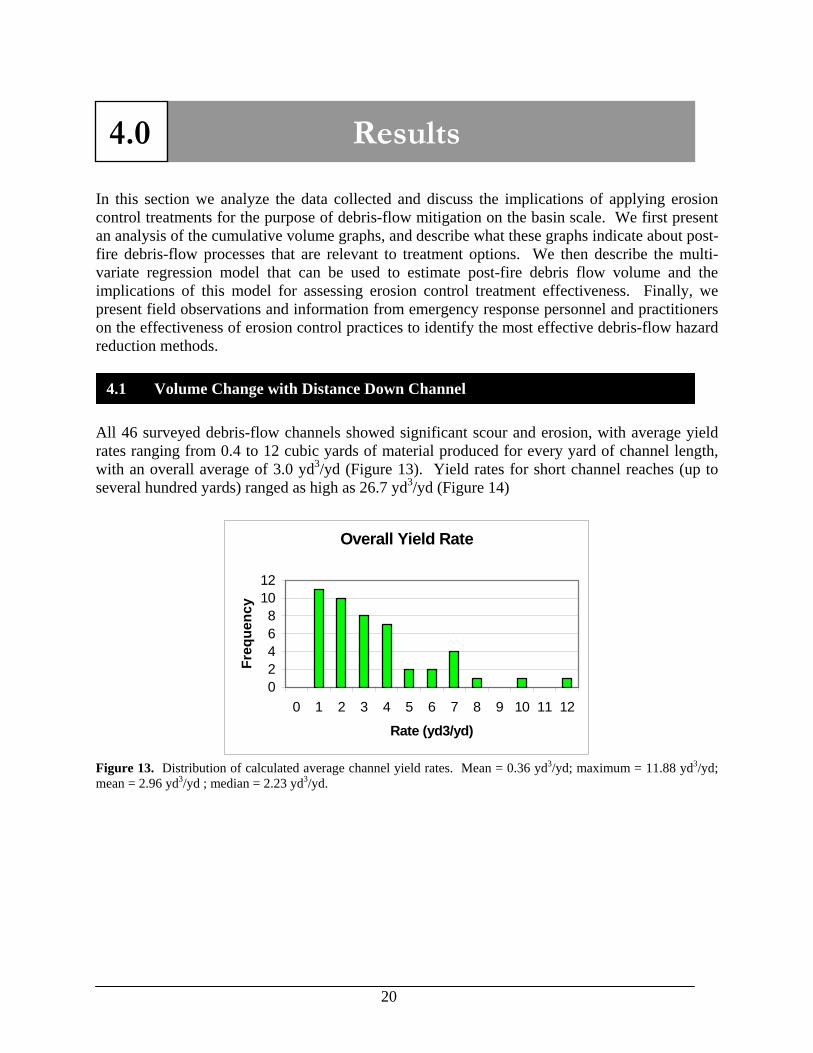
Figure 14. Photograph of deeply incised channel reach in Devore Canyon, southern California, where the highest value of channel yield rate of 26.7 yd3/yd was measured. The cumulative volume graphs show that the volume of material eroded from hillslopes in the form of rills represents only a small percentage of the total debris-flow volume. Rill erosion was identified for 30% of the flows, with rills contributing only between 0.1 and 10.5% of the total volume, with an average of just 3% (Figure 15). This finding suggests that material eroded from hillslopes may not significantly affect debris-flow volume in burned areas, but perhaps influences the likelihood of debris-flow generation.
Percent of Debris Produced by Rill Erosion
0
2
4
6
0 1 2 3 4 5 6 7 8 9 10 11
Percent
Freq
uenc
y
Figure 15. Percent of material contributed to debris flows from hillslope rilling. Minimum = 0.1%; maximum = 10.5%; mean = 2.9%; median = 1.9%. The cumulative volume graphs also illustrate that significant volumes of material are contributed from side channels, and are thus a much more important source of material than hillslope rilling.
21
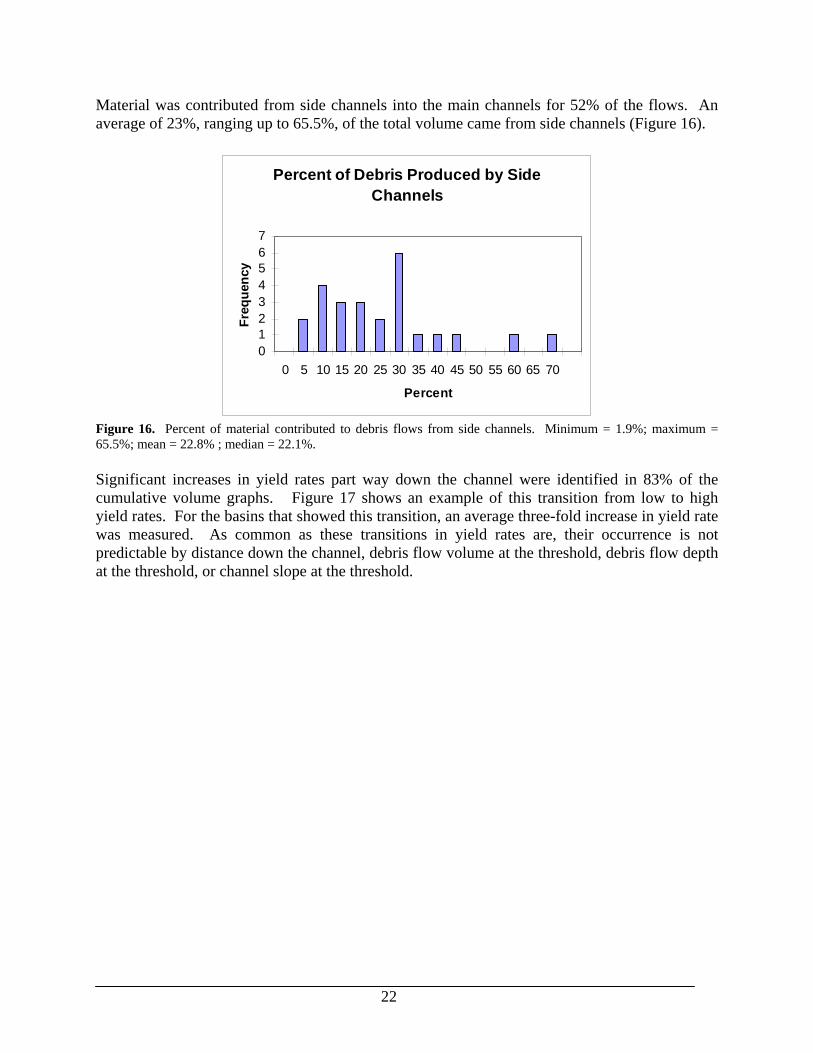
Material was contributed from side channels into the main channels for 52% of the flows. An average of 23%, ranging up to 65.5%, of the total volume came from side channels (Figure 16).
Percent of Debris Produced by Side Channels
01234567
0 5 10 15 20 25 30 35 40 45 50 55 60 65 70
Percent
Freq
uenc
y
Figure 16. Percent of material contributed to debris flows from side channels. Minimum = 1.9%; maximum = 65.5%; mean = 22.8% ; median = 22.1%. Significant increases in yield rates part way down the channel were identified in 83% of the cumulative volume graphs. Figure 17 shows an example of this transition from low to high yield rates. For the basins that showed this transition, an average three-fold increase in yield rate was measured. As common as these transitions in yield rates are, their occurrence is not predictable by distance down the channel, debris flow volume at the threshold, debris flow depth at the threshold, or channel slope at the threshold.
22
Elkhorn Canyon Channel Length vs. Cumulative Volume
0
1000
2000
3000
4000
5000
6000
7000
8000
0 100 200 300 400 500 600 700 800 900 1000 1100 1200 1300 1400 1500 1600 1700 1800
Distance Down Channel (yards)
Cum
ulat
ive
Vol
ume
(yd3 )
Main Channel = 7185 cy
Main Channel minus deposit = 5774 cy
Yield rate= 11.0 y3/yd
Yield rate= 1.8 y3/yd
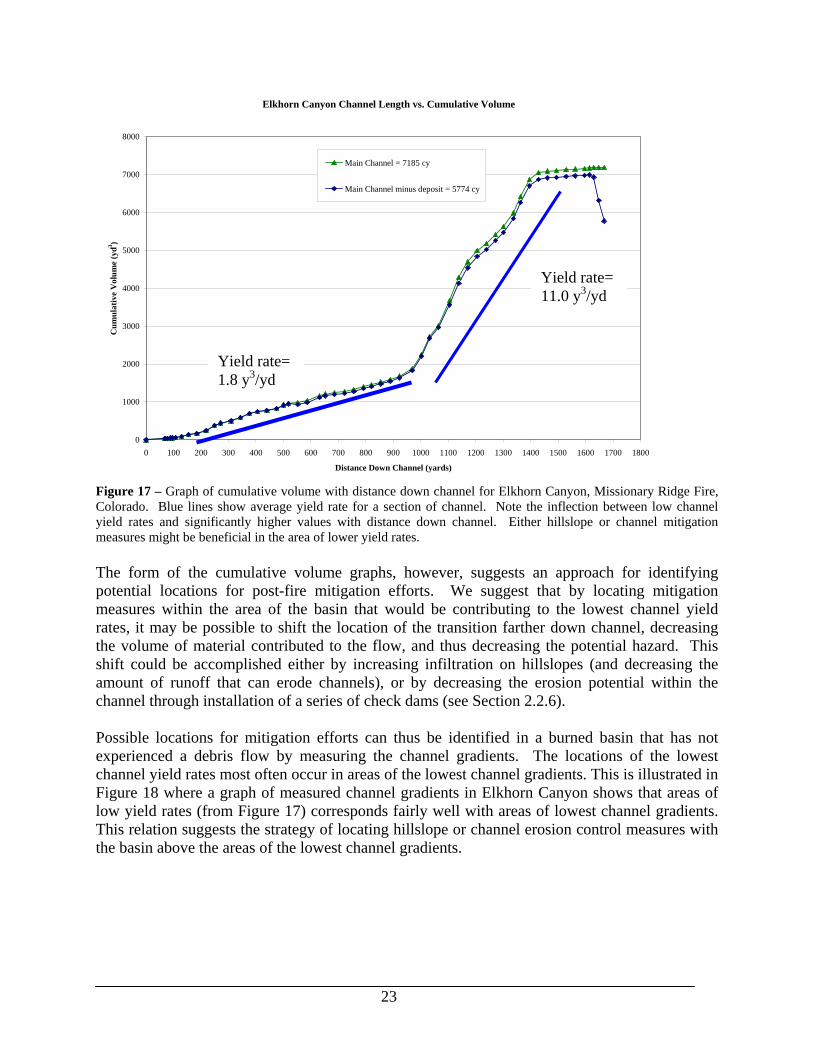
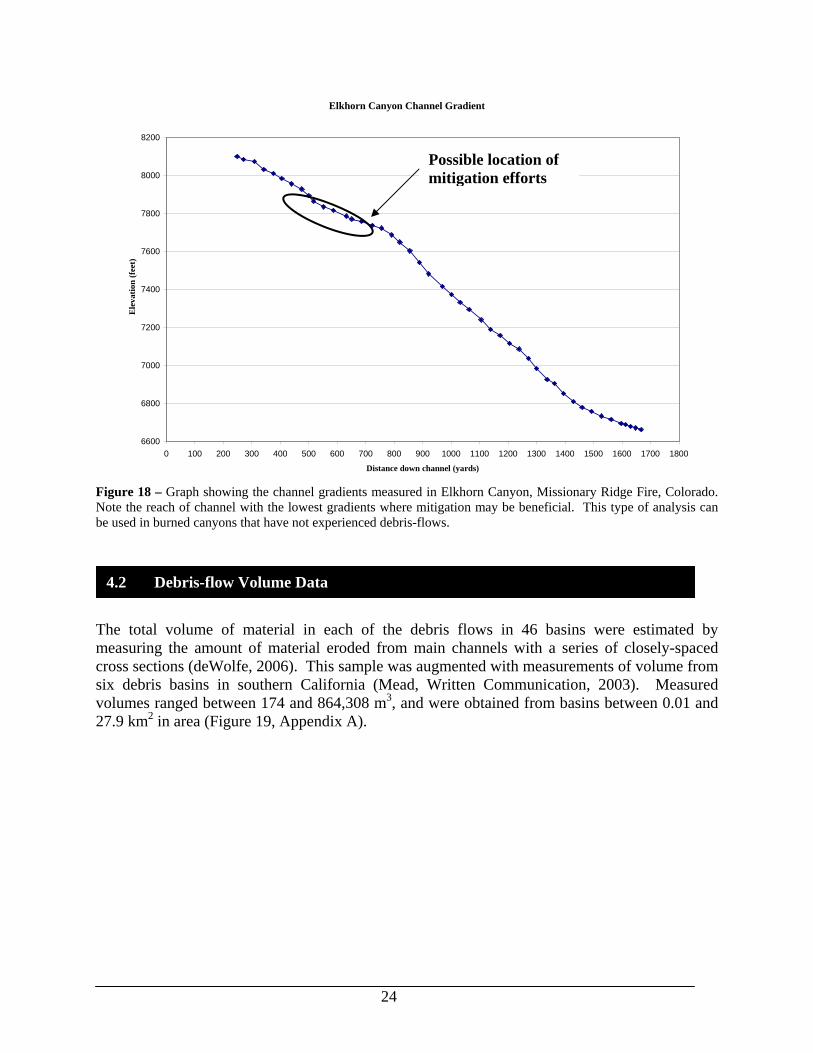
Figure 17 – Graph of cumulative volume with distance down channel for Elkhorn Canyon, Missionary Ridge Fire, Colorado. Blue lines show average yield rate for a section of channel. Note the inflection between low channel yield rates and significantly higher values with distance down channel. Either hillslope or channel mitigation measures might be beneficial in the area of lower yield rates. The form of the cumulative volume graphs, however, suggests an approach for identifying potential locations for post-fire mitigation efforts. We suggest that by locating mitigation measures within the area of the basin that would be contributing to the lowest channel yield rates, it may be possible to shift the location of the transition farther down channel, decreasing the volume of material contributed to the flow, and thus decreasing the potential hazard. This shift could be accomplished either by increasing infiltration on hillslopes (and decreasing the amount of runoff that can erode channels), or by decreasing the erosion potential within the channel through installation of a series of check dams (see Section 2.2.6). Possible locations for mitigation efforts can thus be identified in a burned basin that has not experienced a debris flow by measuring the channel gradients. The locations of the lowest channel yield rates most often occur in areas of the lowest channel gradients. This is illustrated in Figure 18 where a graph of measured channel gradients in Elkhorn Canyon shows that areas of low yield rates (from Figure 17) corresponds fairly well with areas of lowest channel gradients. This relation suggests the strategy of locating hillslope or channel erosion control measures with the basin above the areas of the lowest channel gradients.
23
Elkhorn Canyon Channel Gradient
6600
6800
7000
7200
7400
7600
7800
8000
8200
0 100 200 300 400 500 600 700 800 900 1000 1100 1200 1300 1400 1500 1600 1700 1800
Distance down channel (yards)
Ele
vatio
n (f
eet)
Possible location of mitigation efforts
Figure 18 – Graph showing the channel gradients measured in Elkhorn Canyon, Missionary Ridge Fire, Colorado. Note the reach of channel with the lowest gradients where mitigation may be beneficial. This type of analysis can be used in burned canyons that have not experienced debris-flows.
5.2 Debris-Flow Volume Data
4.2 Debris-flow Volume Data
The total volume of material in each of the debris flows in 46 basins were estimated by measuring the amount of material eroded from main channels with a series of closely-spaced cross sections (deWolfe, 2006). This sample was augmented with measurements of volume from six debris basins in southern California (Mead, Written Communication, 2003). Measured volumes ranged between 174 and 864,308 m3, and were obtained from basins between 0.01 and 27.9 km2 in area (Figure 19, Appendix A).
24
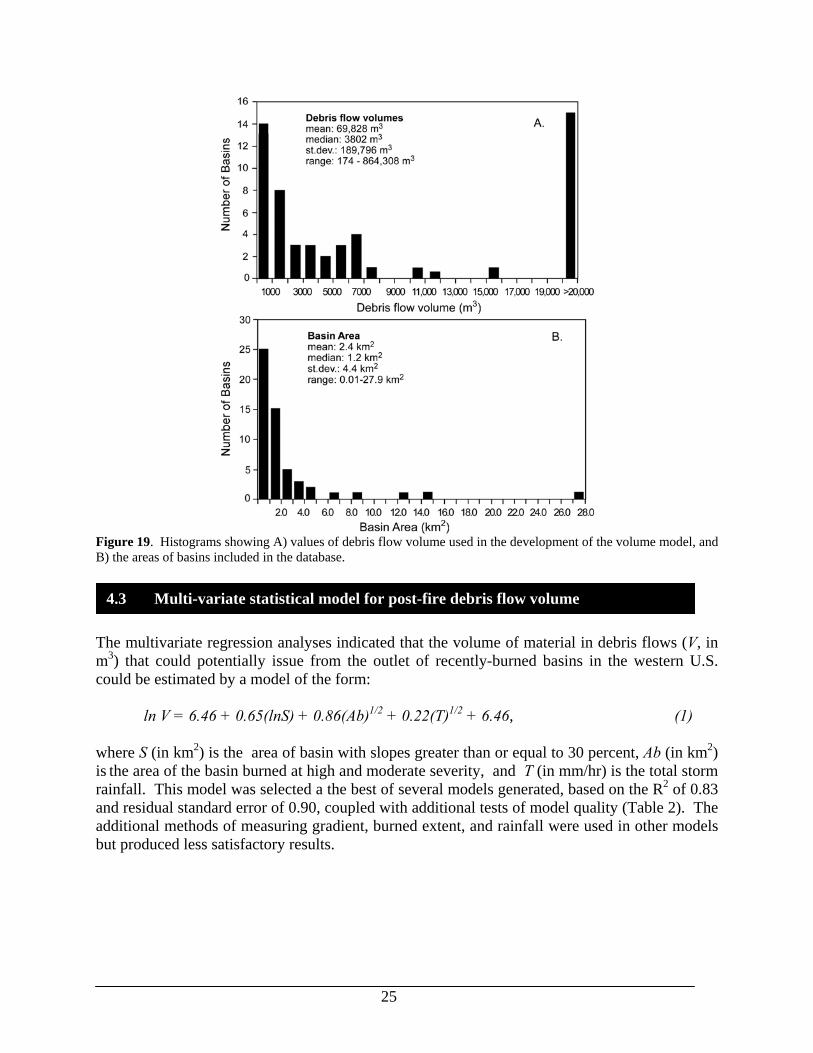
Figure 19. Histograms showing A) values of debris flow volume used in the development of the volume model, and B) the areas of basins included in the database.
4.3 Multi-variate statistical model for post-fire debris flow volume
The multivariate regression analyses indicated that the volume of material in debris flows (V, in m3) that could potentially issue from the outlet of recently-burned basins in the western U.S. could be estimated by a model of the form:
ln V = 6.46 + 0.65(lnS) + 0.86(Ab)1/2 + 0.22(T)1/2 + 6.46, (1)
where S (in km2) is the area of basin with slopes greater than or equal to 30 percent, Ab (in km2) is the area of the basin burned at high and moderate severity, and T (in mm/hr) is the total storm rainfall. This model was selected a the best of several models generated, based on the R2 of 0.83 and residual standard error of 0.90, coupled with additional tests of model quality (Table 2). The additional methods of measuring gradient, burned extent, and rainfall were used in other models but produced less satisfactory results.
25
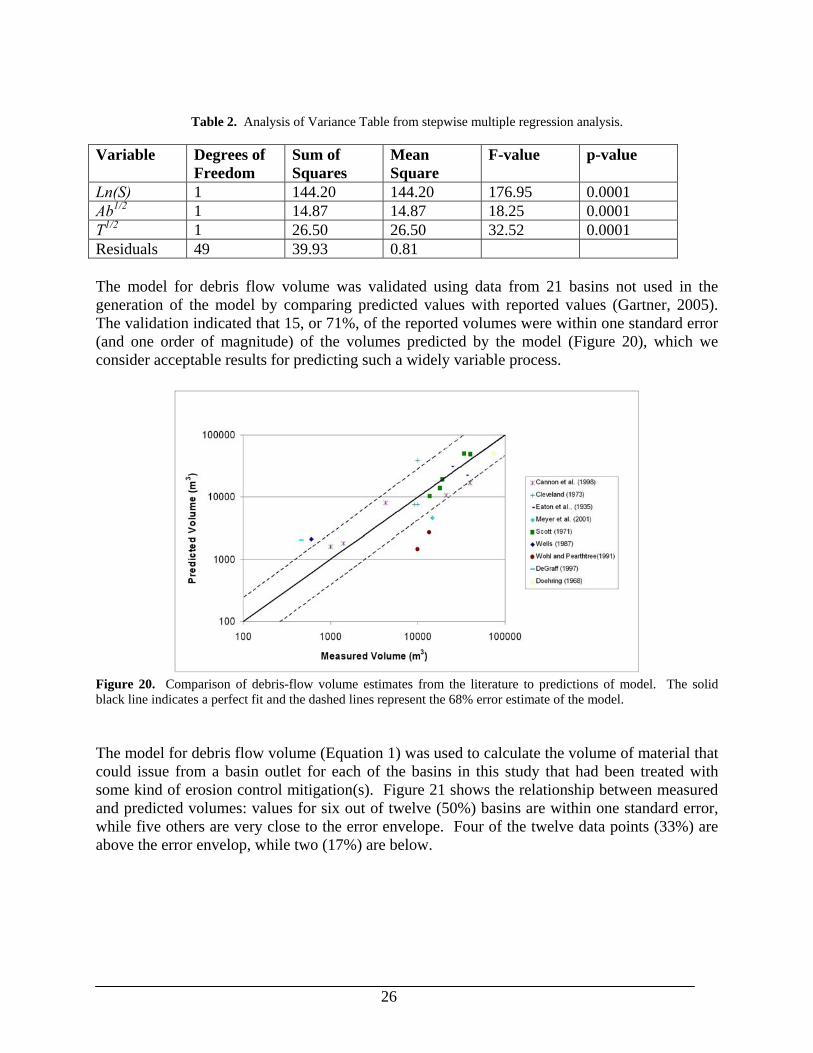
Table 2. Analysis of Variance Table from stepwise multiple regression analysis.
Variable Degrees of
Freedom Sum of Squares
Mean Square
F-value p-value
Ln(S) 1 144.20 144.20 176.95 0.0001 Ab1/2 1 14.87 14.87 18.25 0.0001 T1/2 1 26.50 26.50 32.52 0.0001 Residuals 49 39.93 0.81 The model for debris flow volume was validated using data from 21 basins not used in the generation of the model by comparing predicted values with reported values (Gartner, 2005). The validation indicated that 15, or 71%, of the reported volumes were within one standard error (and one order of magnitude) of the volumes predicted by the model (Figure 20), which we consider acceptable results for predicting such a widely variable process.
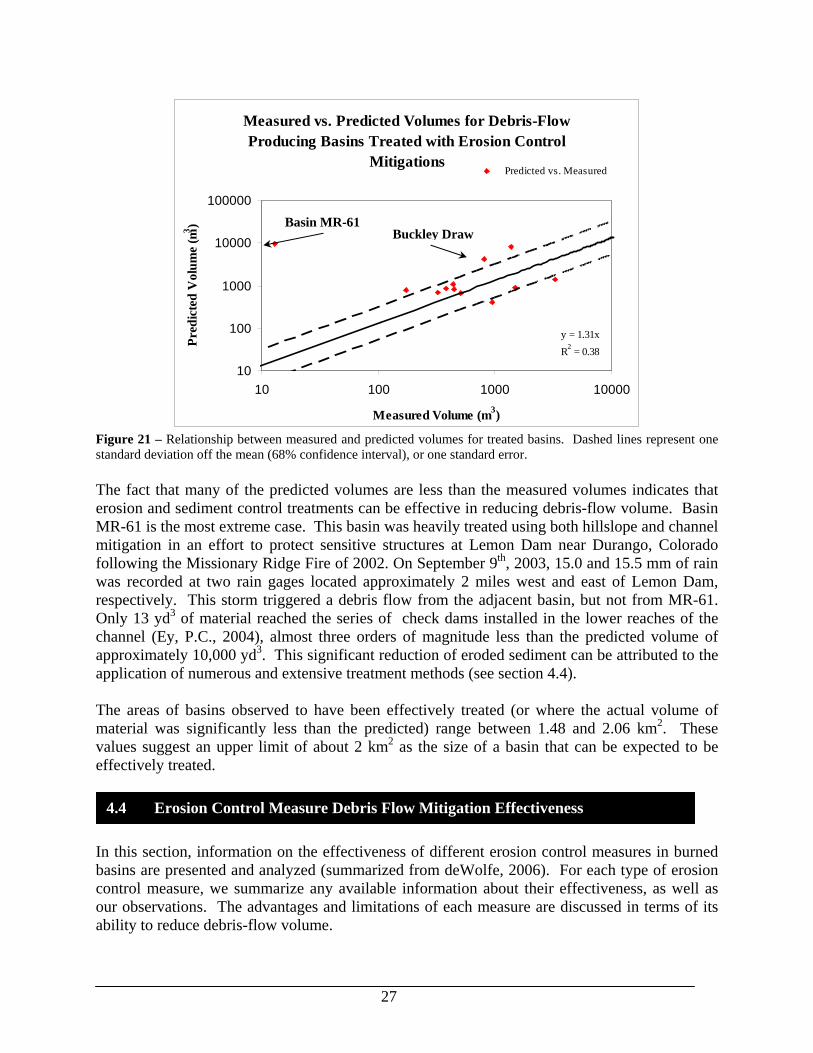
Figure 20. Comparison of debris-flow volume estimates from the literature to predictions of model. The solid black line indicates a perfect fit and the dashed lines represent the 68% error estimate of the model. The model for debris flow volume (Equation 1) was used to calculate the volume of material that could issue from a basin outlet for each of the basins in this study that had been treated with some kind of erosion control mitigation(s). Figure 21 shows the relationship between measured and predicted volumes: values for six out of twelve (50%) basins are within one standard error, while five others are very close to the error envelope. Four of the twelve data points (33%) are above the error envelop, while two (17%) are below.
26
Measured vs. Predicted Volumes for Debris-Flow Producing Basins Treated with Erosion Control
Mitigations
y = 1.31xR2 = 0.38
10
100
1000
10000
100000
10 100 1000 10000
Measured Volume (m3)
Pred
icte
d V
olum
e (m
3 )
Predicted vs. Measured
Basin MR-61Buckley Draw
Figure 21 – Relationship between measured and predicted volumes for treated basins. Dashed lines represent one standard deviation off the mean (68% confidence interval), or one standard error. The fact that many of the predicted volumes are less than the measured volumes indicates that erosion and sediment control treatments can be effective in reducing debris-flow volume. Basin MR-61 is the most extreme case. This basin was heavily treated using both hillslope and channel mitigation in an effort to protect sensitive structures at Lemon Dam near Durango, Colorado following the Missionary Ridge Fire of 2002. On September 9th, 2003, 15.0 and 15.5 mm of rain was recorded at two rain gages located approximately 2 miles west and east of Lemon Dam, respectively. This storm triggered a debris flow from the adjacent basin, but not from MR-61. Only 13 yd3 of material reached the series of check dams installed in the lower reaches of the channel (Ey, P.C., 2004), almost three orders of magnitude less than the predicted volume of approximately 10,000 yd3. This significant reduction of eroded sediment can be attributed to the application of numerous and extensive treatment methods (see section 4.4). The areas of basins observed to have been effectively treated (or where the actual volume of material was significantly less than the predicted) range between 1.48 and 2.06 km2. These values suggest an upper limit of about 2 km2 as the size of a basin that can be expected to be effectively treated.
4.4 Erosion Control Measure Debris Flow Mitigation Effectiveness
In this section, information on the effectiveness of different erosion control measures in burned basins are presented and analyzed (summarized from deWolfe, 2006). For each type of erosion control measure, we summarize any available information about their effectiveness, as well as our observations. The advantages and limitations of each measure are discussed in terms of its ability to reduce debris-flow volume.
27
4.4.1 Seeding
Plot-scale evaluations of the effectiveness of seeding to promote the development of vegetative cover or reduce erosion in chaparral environments have produced inconclusive results. Gautier (1983) measured a 31% reduction in erosion on seeded plots compared to unseeded plots in a chaparral forest near San Diego, CA. However, near San Luis Obispo, CA, Taskey et al. (1989) found no significant difference in erosion of seeded chaparral slopes versus unseeded ones. Vegetative cover (Beyers et al., 1998) and hillslope erosion (Wohlgemuth et al., 1998) were studied on four hot prescribed fires on mixed chaparral forests in southern California. For each site, vegetative cover was higher on the treated slopes, but measured erosion rates showed no significant difference. After the first post-fire year, three sites experienced less sediment detachment from seeded plots than from unseeded ones, but the erosion rates were similar to pre-burn rates (Wohlgemuth et al., 1998). In comparisons of the response of areas burned by wildfire and prescribed fire, Wohlgemuth et al. (1998) and Beyers et al. (1998) found that although the wildfire site experienced 10 times the amount of erosion than the prescribed burn sites (Wohlgemuth et al., 1999), the vegetation response was similar. No significant increase in cover (Beyers et al., 1998) or reduction in erosion rates (Wohlgemuth et al., 1998) on seeded plots was measured. Evaluations of seeding effectiveness in burned conifer forests are also inconclusive. Although Miles et al. (1989) rated aerial seeding effectiveness as moderate for the South Fork Trinity River fires in northern California, Amaranthus (1989) found that 75 to 90% of erosion occurred before annual ryegrass seeds established a vegetative cover on a treated slope in southern Oregon. A paired watershed study in the northern Sierra Nevada in California found no significant difference of vegetative cover or erosion for seeded versus unseeded plots after two years following the fire (Roby, 1989). Geier-Hayes (1997) did not measure erosion, but found no significant difference in vegetative cover between seeded and unseeded plots during five post-fire years. In addition, a comprehensive compilation of studies quantifying the effectiveness of seeding as an erosion control treatment by Beyers (2004) found that less than half showed reduced erosion from seeded slopes, thus presenting mixed results. Of the USDA Forest Service reports reviewed by Beyers (2004), three sought to quantify erosion from chaparral sites, and, though no statistical analysis was performed, only one concluded that erosion was reduced due to seeding (Robichaud et al., 2000). Four of seven reports attempting to quantify vegetative cover found that it was greater on seeded plots compared to unseeded plots (Beyers, 2004). For conifer sites, two of four reports measured less erosion from seeded plots than from unseeded plots, but no statistical analysis support the results. Three of four reports found greater vegetative cover on seeded plots (Beyers, 2004). However, Dean (2001) found that erosion from plots treated with a combination of seed, mulch and LEBs produced 77% less sediment during the first post-fire year and 96% less during the second year.
28
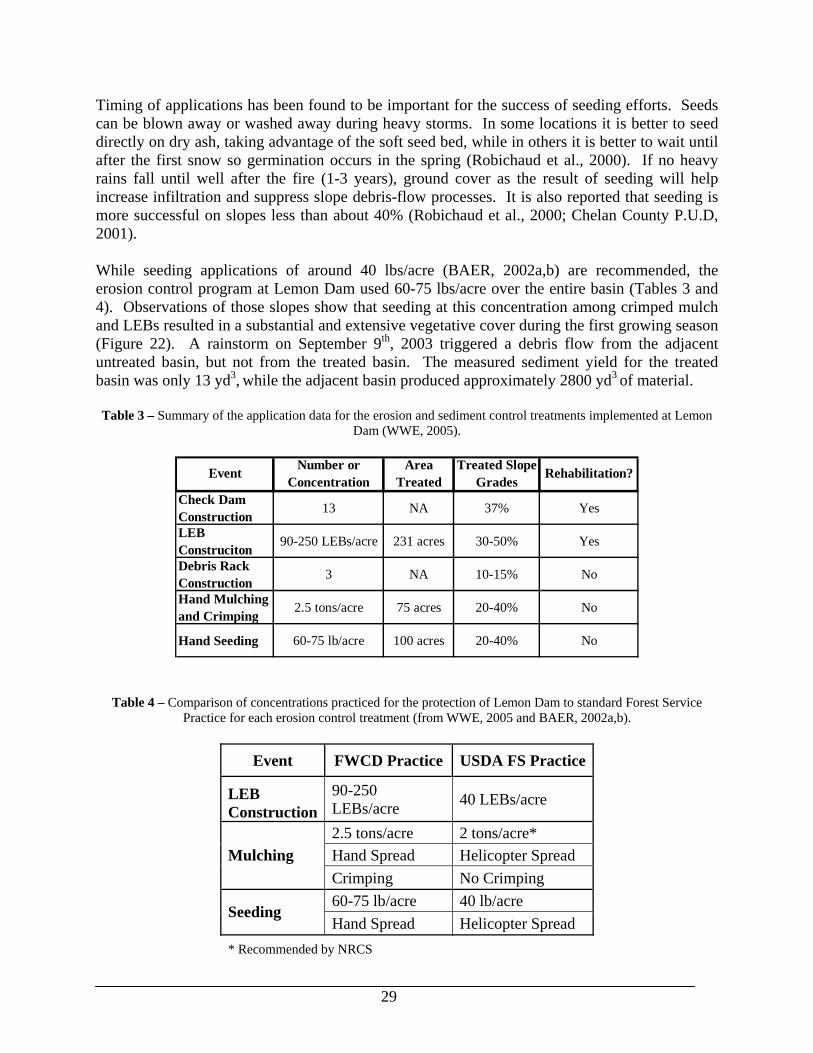
Timing of applications has been found to be important for the success of seeding efforts. Seeds can be blown away or washed away during heavy storms. In some locations it is better to seed directly on dry ash, taking advantage of the soft seed bed, while in others it is better to wait until after the first snow so germination occurs in the spring (Robichaud et al., 2000). If no heavy rains fall until well after the fire (1-3 years), ground cover as the result of seeding will help increase infiltration and suppress slope debris-flow processes. It is also reported that seeding is more successful on slopes less than about 40% (Robichaud et al., 2000; Chelan County P.U.D, 2001). While seeding applications of around 40 lbs/acre (BAER, 2002a,b) are recommended, the erosion control program at Lemon Dam used 60-75 lbs/acre over the entire basin (Tables 3 and 4). Observations of those slopes show that seeding at this concentration among crimped mulch and LEBs resulted in a substantial and extensive vegetative cover during the first growing season (Figure 22). A rainstorm on September 9th, 2003 triggered a debris flow from the adjacent untreated basin, but not from the treated basin. The measured sediment yield for the treated basin was only 13 yd3, while the adjacent basin produced approximately 2800 yd3 of material. Table 3 – Summary of the application data for the erosion and sediment control treatments implemented at Lemon
Dam (WWE, 2005).
Check Dam Construction
13 NA 37% Yes
LEB Construciton
90-250 LEBs/acre 231 acres 30-50% Yes
Debris Rack Construction
3 NA 10-15% No
Hand Mulching and Crimping
2.5 tons/acre 75 acres 20-40% No
Hand Seeding 60-75 lb/acre 100 acres 20-40% No
Event Number or Concentration
Area Treated
Rehabilitation?Treated Slope Grades
Table 4 – Comparison of concentrations practiced for the protection of Lemon Dam to standard Forest Service
Practice for each erosion control treatment (from WWE, 2005 and BAER, 2002a,b).
Event FWCD Practice USDA FS Practice
LEB Construction
90-250 LEBs/acre 40 LEBs/acre
2.5 tons/acre 2 tons/acre* Hand Spread Helicopter Spread Mulching Crimping No Crimping 60-75 lb/acre 40 lb/acre
Seeding Hand Spread Helicopter Spread
* Recommended by NRCS
29
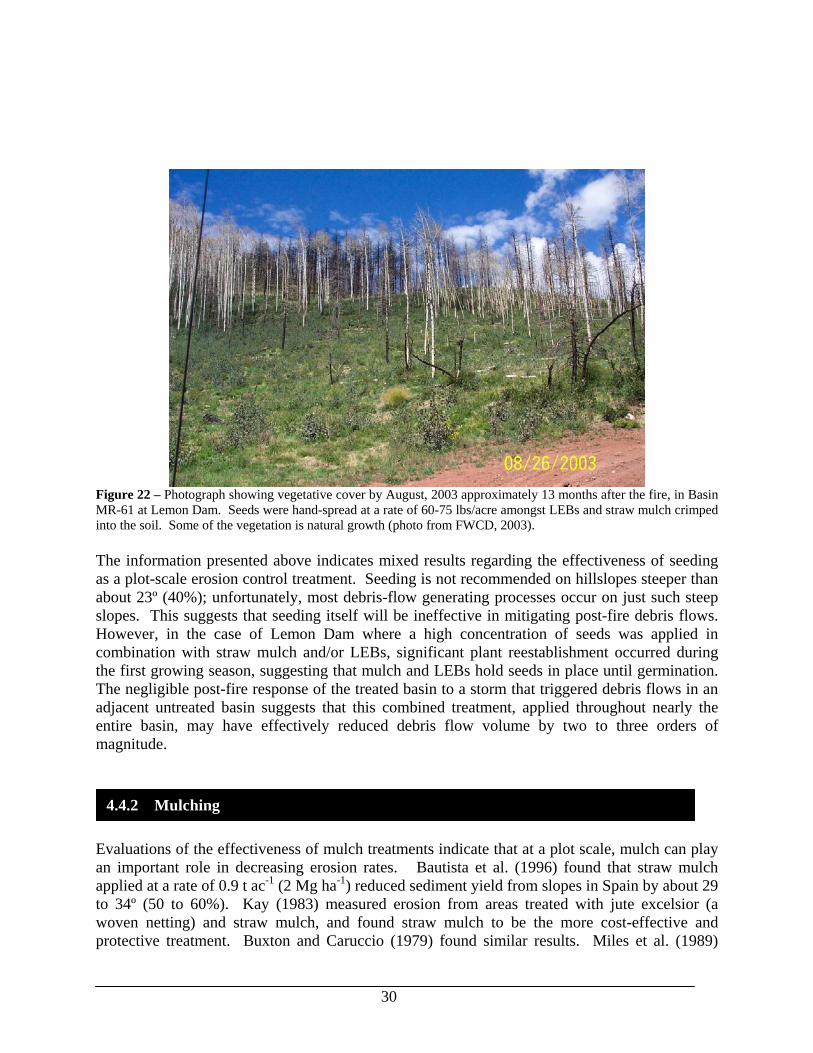
Figure 22 – Photograph showing vegetative cover by August, 2003 approximately 13 months after the fire, in Basin MR-61 at Lemon Dam. Seeds were hand-spread at a rate of 60-75 lbs/acre amongst LEBs and straw mulch crimped into the soil. Some of the vegetation is natural growth (photo from FWCD, 2003). The information presented above indicates mixed results regarding the effectiveness of seeding as a plot-scale erosion control treatment. Seeding is not recommended on hillslopes steeper than about 23º (40%); unfortunately, most debris-flow generating processes occur on just such steep slopes. This suggests that seeding itself will be ineffective in mitigating post-fire debris flows. However, in the case of Lemon Dam where a high concentration of seeds was applied in combination with straw mulch and/or LEBs, significant plant reestablishment occurred during the first growing season, suggesting that mulch and LEBs hold seeds in place until germination. The negligible post-fire response of the treated basin to a storm that triggered debris flows in an adjacent untreated basin suggests that this combined treatment, applied throughout nearly the entire basin, may have effectively reduced debris flow volume by two to three orders of magnitude.
4.4.2 Mulching
Evaluations of the effectiveness of mulch treatments indicate that at a plot scale, mulch can play an important role in decreasing erosion rates. Bautista et al. (1996) found that straw mulch applied at a rate of 0.9 t ac-1 (2 Mg ha-1) reduced sediment yield from slopes in Spain by about 29 to 34º (50 to 60%). Kay (1983) measured erosion from areas treated with jute excelsior (a woven netting) and straw mulch, and found straw mulch to be the more cost-effective and protective treatment. Buxton and Caruccio (1979) found similar results. Miles et al. (1989)
30
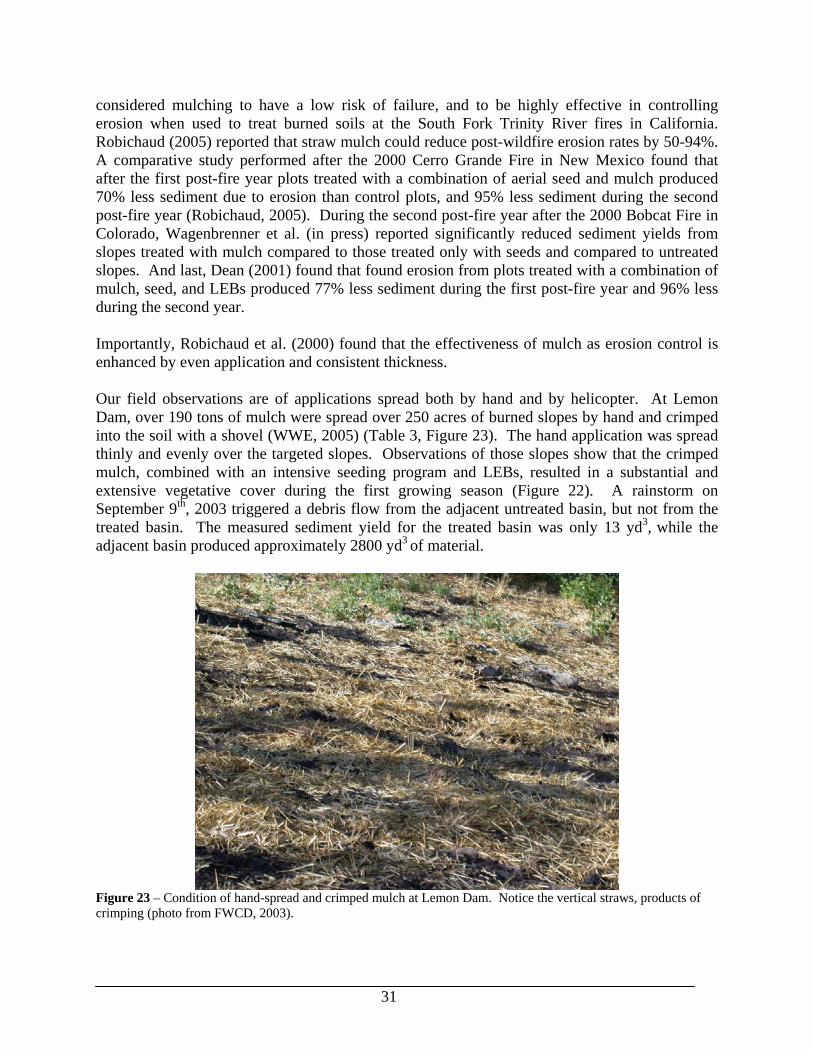
considered mulching to have a low risk of failure, and to be highly effective in controlling erosion when used to treat burned soils at the South Fork Trinity River fires in California. Robichaud (2005) reported that straw mulch could reduce post-wildfire erosion rates by 50-94%. A comparative study performed after the 2000 Cerro Grande Fire in New Mexico found that after the first post-fire year plots treated with a combination of aerial seed and mulch produced 70% less sediment due to erosion than control plots, and 95% less sediment during the second post-fire year (Robichaud, 2005). During the second post-fire year after the 2000 Bobcat Fire in Colorado, Wagenbrenner et al. (in press) reported significantly reduced sediment yields from slopes treated with mulch compared to those treated only with seeds and compared to untreated slopes. And last, Dean (2001) found that found erosion from plots treated with a combination of mulch, seed, and LEBs produced 77% less sediment during the first post-fire year and 96% less during the second year. Importantly, Robichaud et al. (2000) found that the effectiveness of mulch as erosion control is enhanced by even application and consistent thickness. Our field observations are of applications spread both by hand and by helicopter. At Lemon Dam, over 190 tons of mulch were spread over 250 acres of burned slopes by hand and crimped into the soil with a shovel (WWE, 2005) (Table 3, Figure 23). The hand application was spread thinly and evenly over the targeted slopes. Observations of those slopes show that the crimped mulch, combined with an intensive seeding program and LEBs, resulted in a substantial and extensive vegetative cover during the first growing season (Figure 22). A rainstorm on September 9th, 2003 triggered a debris flow from the adjacent untreated basin, but not from the treated basin. The measured sediment yield for the treated basin was only 13 yd3, while the adjacent basin produced approximately 2800 yd3 of material.
Figure 23 – Condition of hand-spread and crimped mulch at Lemon Dam. Notice the vertical straws, products of crimping (photo from FWCD, 2003).
31
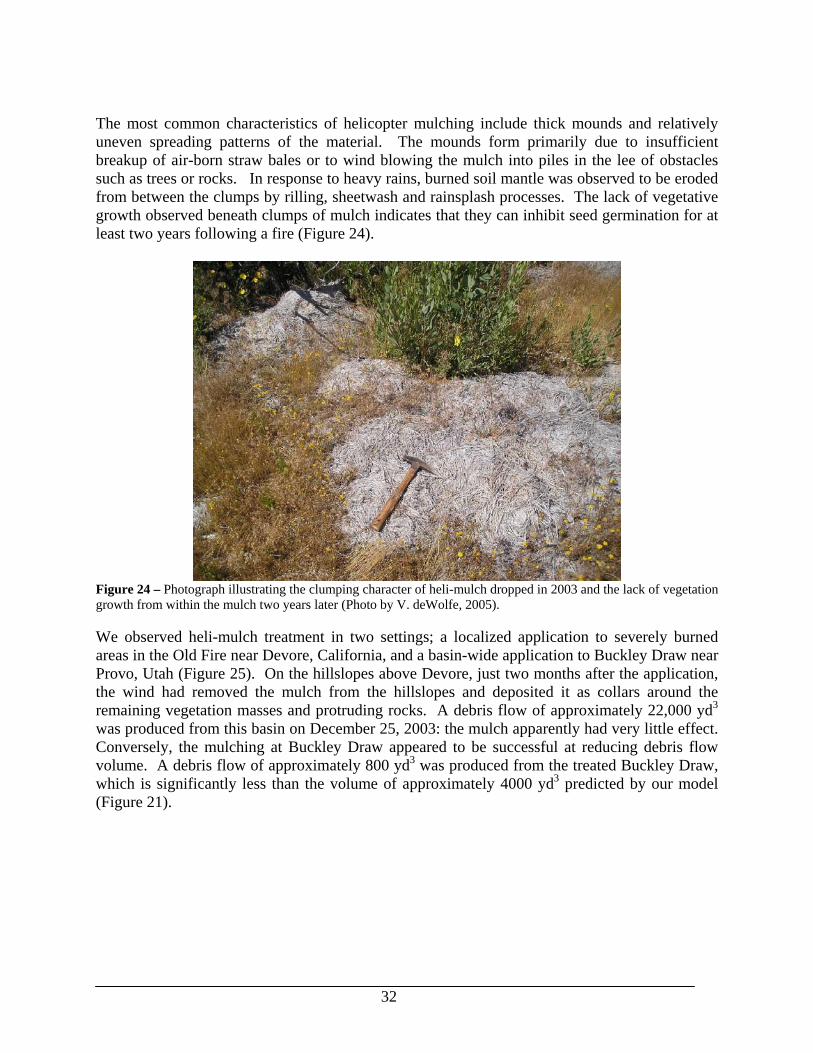
The most common characteristics of helicopter mulching include thick mounds and relatively uneven spreading patterns of the material. The mounds form primarily due to insufficient breakup of air-born straw bales or to wind blowing the mulch into piles in the lee of obstacles such as trees or rocks. In response to heavy rains, burned soil mantle was observed to be eroded from between the clumps by rilling, sheetwash and rainsplash processes. The lack of vegetative growth observed beneath clumps of mulch indicates that they can inhibit seed germination for at least two years following a fire (Figure 24).
Figure 24 – Photograph illustrating the clumping character of heli-mulch dropped in 2003 and the lack of vegetation growth from within the mulch two years later (Photo by V. deWolfe, 2005). We observed heli-mulch treatment in two settings; a localized application to severely burned areas in the Old Fire near Devore, California, and a basin-wide application to Buckley Draw near Provo, Utah (Figure 25). On the hillslopes above Devore, just two months after the application, the wind had removed the mulch from the hillslopes and deposited it as collars around the remaining vegetation masses and protruding rocks. A debris flow of approximately 22,000 yd3 was produced from this basin on December 25, 2003: the mulch apparently had very little effect. Conversely, the mulching at Buckley Draw appeared to be successful at reducing debris flow volume. A debris flow of approximately 800 yd3 was produced from the treated Buckley Draw, which is significantly less than the volume of approximately 4000 yd3 predicted by our model (Figure 21).
32
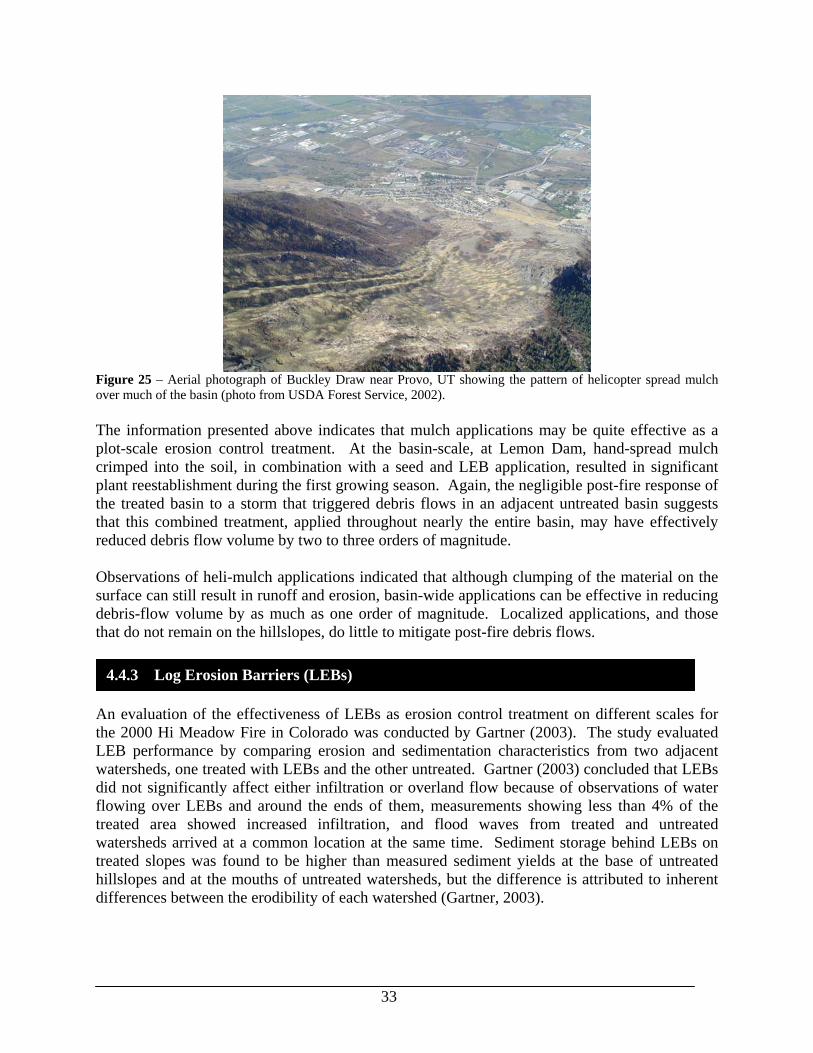
Figure 25 – Aerial photograph of Buckley Draw near Provo, UT showing the pattern of helicopter spread mulch over much of the basin (photo from USDA Forest Service, 2002). The information presented above indicates that mulch applications may be quite effective as a plot-scale erosion control treatment. At the basin-scale, at Lemon Dam, hand-spread mulch crimped into the soil, in combination with a seed and LEB application, resulted in significant plant reestablishment during the first growing season. Again, the negligible post-fire response of the treated basin to a storm that triggered debris flows in an adjacent untreated basin suggests that this combined treatment, applied throughout nearly the entire basin, may have effectively reduced debris flow volume by two to three orders of magnitude. Observations of heli-mulch applications indicated that although clumping of the material on the surface can still result in runoff and erosion, basin-wide applications can be effective in reducing debris-flow volume by as much as one order of magnitude. Localized applications, and those that do not remain on the hillslopes, do little to mitigate post-fire debris flows.
4.4.3 Log Erosion Barriers (LEBs)
An evaluation of the effectiveness of LEBs as erosion control treatment on different scales for the 2000 Hi Meadow Fire in Colorado was conducted by Gartner (2003). The study evaluated LEB performance by comparing erosion and sedimentation characteristics from two adjacent watersheds, one treated with LEBs and the other untreated. Gartner (2003) concluded that LEBs did not significantly affect either infiltration or overland flow because of observations of water flowing over LEBs and around the ends of them, measurements showing less than 4% of the treated area showed increased infiltration, and flood waves from treated and untreated watersheds arrived at a common location at the same time. Sediment storage behind LEBs on treated slopes was found to be higher than measured sediment yields at the base of untreated hillslopes and at the mouths of untreated watersheds, but the difference is attributed to inherent differences between the erodibility of each watershed (Gartner, 2003).
33
A similar study by Wohlgemuth et al. (2001) in southern California after a fire in 1999 found that 157 LEBs stored a total of only 4 m3 of sediment after the first post-fire year, and 9 m3 of sediment after the second post-fire year. Sediment yield data from the first post-fire year showed that the treated basin yielded 14 times more sediment than the untreated basin, while data from the second post-fire year showed that the sediment yield from the untreated basin was 18 times higher that from the treated basin (Wohlgemuth et al., 2001). The conclusion was that the two basins had too many inherent differences to adequately evaluate the effectiveness of LEBs. On a more positive note, a study by Dean (2001) found that erosion from plots treated with a combination of LEBs, mulch, and seed produced 77% less sediment during the first post-fire year and 96% less during the second year. LEBs have also been evaluated for their effectiveness relative to rainfall events of varying intensities (Robichaud, 2005). Robichaud (2005) found that LEBs are more effective during low to moderate intensity rainfall events, and that their effectiveness decreases sharply with high intensity events and when the basins become filled with sediment. Of six catchments studied, three showed about a 50% decrease in erosion from catchments treated with LEBs while three others showed similar erosion amounts from treated and untreated catchments (Robichaud, 2005). He also reported reduction in erosion rates from LEB-treated hillslopes during the first post-fire year between about 20 and 50% in areas that experience moderate- to high-intensity rainfall. For any rainfall event the erosion reduction is not likely to be greater than 70%. Robichaud et al. (2000) recommend that LEBs installations avoid hillslopes with thin soils, high rock content, and gradients greater than 75%. Additionally, they report that mobilization of highly erosive soils, such as those derived from glacial till or highly weathered granitic rock can overwhelm smaller LEBs. At Lemon Dam, 231 acres of a severely burned basin above the dam’s spillway and intake structures were treated with concentrations between 90 and 250 LEBs/acre (Table 3, Figure 26). This is over two to six times the normal concentration of about 40 LEBs/acre (Table 4). The LEBs were installed on hillslopes that were also treated with straw mulch crimped into the soil and seed (Table 3), were carefully placed along contour, and exhibited ground contact along their entire lengths. The LEBs were emptied of soil each time they were filled following rainstorms (Ey, P.C., 2004), and the removed material was packed along the front of the LEB. Observations of the treated hillslopes show that the LEBs, combined with the seeding and mulch treatments, resulted in a substantial and extensive vegetative cover during the first growing season (Figure 22). Again, the negligible post-fire response of the treated basin to a storm that triggered debris flows in an adjacent untreated basin suggests that this combined treatment, applied throughout nearly the entire basin, may have effectively reduced debris flow volume by two to three orders of magnitude.
34
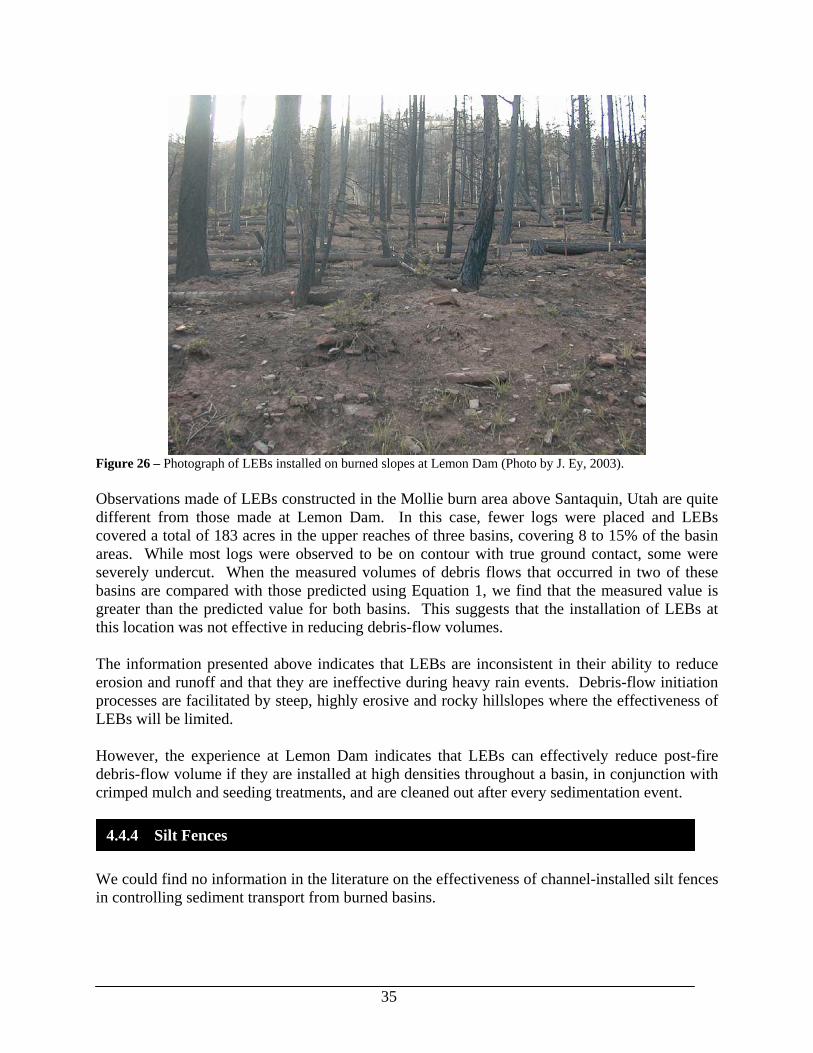
Figure 26 – Photograph of LEBs installed on burned slopes at Lemon Dam (Photo by J. Ey, 2003). Observations made of LEBs constructed in the Mollie burn area above Santaquin, Utah are quite different from those made at Lemon Dam. In this case, fewer logs were placed and LEBs covered a total of 183 acres in the upper reaches of three basins, covering 8 to 15% of the basin areas. While most logs were observed to be on contour with true ground contact, some were severely undercut. When the measured volumes of debris flows that occurred in two of these basins are compared with those predicted using Equation 1, we find that the measured value is greater than the predicted value for both basins. This suggests that the installation of LEBs at this location was not effective in reducing debris-flow volumes. The information presented above indicates that LEBs are inconsistent in their ability to reduce erosion and runoff and that they are ineffective during heavy rain events. Debris-flow initiation processes are facilitated by steep, highly erosive and rocky hillslopes where the effectiveness of LEBs will be limited. However, the experience at Lemon Dam indicates that LEBs can effectively reduce post-fire debris-flow volume if they are installed at high densities throughout a basin, in conjunction with crimped mulch and seeding treatments, and are cleaned out after every sedimentation event.
4.4.4 Silt Fences
We could find no information in the literature on the effectiveness of channel-installed silt fences in controlling sediment transport from burned basins.
35

Following the Farmington Fire of July 2003, a series of silt fences were constructed across a potential debris-flow channel above a neighborhood that could be impacted by post-fire debris-flow activity. On July 17th, 2004, a debris flow occurred in that drainage, allowing first-hand observation of the effectiveness of the silt fences during a site visit the following week. Most of the silt fences were destroyed in the axis of the channel, and any stored material continued through the channel. Some deposition was observed in places behind the relatively intact parts of the fences (Figure 27). Debris reached the neighborhood below, but sandbags prevented all but a small amount from entering houses.
Figure 27 – Photograph of a failed channel silt fence installation (photo by V. deWolfe, 2004). These fences failed because they trapped both the coarse bouldery material and water-laden silty and sandy matrix of the passing debris flow. The entire weight of the debris flow was applied against the relatively low-strength silt fence. More effective mitigation methods capture coarse sediment and allow the fine sediment and water to pass through (see Debris Racks in the following section). We would conclude that channel installations of silt fences are effective only against very small events consisting primarily of fine sediment and water.
4.4.5 Debris Racks
We could find no information in the literature on the effectiveness of debris racks in controlling sediment transport from burned basins. We are aware of installations following the Cerro Grande Fire in Los Alamos, New Mexico, but were not able to locate any published information on their effectiveness.
36
However, five debris racks were constructed in the Lemon Dam sediment control program between October and December 2002. Two of the racks were located in a channel that produced a debris flow. On July 31st, 2003 the rack located farthest up the channel caught approximately 130 m3 (170 yd3) of a debris flow with a total volume of about 445 m3 (586 yd3). The design of this debris rack allowed the fine material to continue on down channel, where part of it was held back at the second rack. Only muddy water was passed on to the Florida River. This information suggests that debris rack installations can be effective in reducing the volume of a passing debris flow if they are adequately designed for the size of the event that actually occurs.
4.4.6 Check Dams
We could find no information in the literature on the effectiveness of channel check dams in controlling sediment transport specifically from burned basins, although a significant amount of information about the function and design for unburned settings does exists (see Section 2.4.6 and Appendix B.) We had two opportunities to observe the use of check dams in controlling post-fire erosion and sedimentation – one in the debris-flow prone watershed referred to previously as Basin MR-61 adjacent to Lemon Dam in southwestern Colorado, and the other in Dominguez Canyon near the town of Piru in southern California. Basin MR-61 was not only treated with hand-spread and crimped mulching, seeding, and LEBs, but thirteen earthen check dams were constructed on 6 to 10% gradients within the main channel. At least some of the dams had logs keyed into the channel banks in their cores (Ey, P.C., 2006). The dams had a spillway notch cut into the crest (WWE, 2005). In response to a storm on September 9th, 2003 (14 months after the fire), the check dams were filled with a total of 13 yd3 of ash and mud (Figure 28). In contrast, failure of log-barrier check dam installations in Dominguez Canyon following the 2003 Piru Fire in southern California resulted in significant degradation of riparian zone health and exacerbation of sedimentation problems in the canyon. No other mitigation works had been installed in this basin. Thirty-five log check dams were constructed in two separate installations in sub-basins with channel gradients of 10 to 12%. The dams were constructed of 6 to 18 inch (15 to 45 cm) diameter logs keyed 1-2 feet (0.3 -0.7 m) into each bank and were 3-4 ft tall (1-1.3 m) and 6 to 45 ft long (2-14 m) (Hubbert, 2005), and blanketed with a geotextile fabric. Spillways were not constructed in the dams, many of which failed by both undercutting and side cuts into channel banks (Figure 29). Robichaud (P.C. 2006) also reported repeated failure of earthen check dams installed in the Hayman Fire in Colorado.
37

September 9th, 2003
Figure 28 – A check dam full of mud and debris constructed in the upper reaches of Basin MR-61 above Lemon Dam (photo from FWCD, 2003).
Figure 29 - Failed log-barrier checks dams in Dominguez Canyon, southern California. Based on the available information, it is difficult to assess the effectiveness of the check dams alone in basin MR-61. It is possible that without the check dams to decrease gradients and store sediment, water moving through the channel would have scoured and entrained material along its entire length, creating a debris flow. However, it is equally possible that the combined hillslope
38
treatments of crimped mulch, seeding and LEBs in reducing runoff was sufficient to inhibit the generation of debris flows in the channel. The relatively small volume of 13 yd3 caught by the check dams indicates this possibility. However, check dams are routinely used for debris-flow mitigation in many different unburned settings (see Section 2.2.6), indicating that if they are adequately constructed, they can effectively reduce debris-flow volume and energy. The failure of the check dams in Dominguez Canyon and the Hayman Fire, however, highlights the need for adequate engineering design for post-fire runoff events. Effective check dam installations require extensive and careful engineering design, and can difficult and labor intensive to build (see Appendix B). Failure can result from improper engineering design of the dam, such as a lack of spillway, insufficient keying into the bank(s), undersized for the volume of material, or construction with materials of insufficient strength. Pit and berm check dams, like those illustrated in figure 29, are particularly prone to failure (Robichaud, P.C., 2006). At failure, the debris flow will incorporate the materials stored behind the dams into the flow, thus increasing its volume and erosive potential. If one check dam fails, it is likely that the resulting debris flow will gain sufficient energy and volume to damage the remaining check dams in the series. In the event of the failure of multiple check dams, downstream hazards will be exacerbated by a higher energy debris flow. A well-known example of multiple check dam failure occurred in the Aras catchment near the town of Biescas in the central Pyrenees (White et al., 1998). Failure of the engineered gabion dams resulted in the addition of 68,000m3 of material to an already disastrous event, and resulted in the deaths of 87 people.
39

5.0 Rapid and Long-Term Support Tools
Included at the end of this report as Appendices C and D are decision support tools for treating burned watersheds prone to debris flows, based on the findings presented in the body of the report. Appendix C provides short-term (<1-2 years) recommendations while Appendix D provides initial guidelines for long-term hazard reduction typically involving methods requiring professional engineering. Each tool is intended to assist responsible parties in identifying which erosion control measures might be most effective in terms of reducing the potential volume of post-wildfire debris-flows. They are not intended to replace the need for field assessments and detailed analysis that should be undertaken before implementing any site-specific erosion control program. Both the rapid and long-term decision support tools include as step 1 charts for estimating the predicted debris-flow volume a basin may produce based on Equation 1. Each of the input parameters is given in graph form for ease of calculation. Step 2 requires a risk analysis to determine the extent and aggressiveness of the treatment program. Four basic risk categories are given: critical, moderate, low, and negligible. Due the complexity and site specific nature of risk analyses, the process of performing the detailed risk analysis is left up to the user. The short term decision support tool (Appendix C) includes step 3 in which treatment recommendations are provided based on the risk level determined from step 2. Finally, the flow-chart will assist in identifying pros, cons, areas of applicability, and limitations of the various treatment methods discussed in the report. The long-term decision support tool (Appendix D) is the same as the short-term tool except the flow-chart is replaced with engineering considerations required for the implementation of larger and more permanent protection structures. The pros and cons of each structure are presented to assist in determining which structures may be most appropriate for the given conditions.
40
6.0 Conclusions In this study we analyzed the effectiveness of erosion control treatments in reducing post-fire debris-flow volume. We used detailed surveys of series channel cross sections in 46 basins in Colorado, Utah and California to develop graphs of the cumulative volume gain down the length of a channel. These graphs provide information about the relative magnitudes of contributions of materials to post-fire debris flows from hillslopes and channels. We also developed a multi-variate regression model that describes post-fire debris flow volume as a function of burn severity, basin characteristics and storm rainfall. This model was used to determine if post-fire debris flows can be effectively mitigated by reducing their potential volumes and to identify the size of basins that could be effectively mitigated. We also used field observations and information from emergency response personnel and practitioners to identify the most effective debris-flow hazard reduction methods. Specific conclusions are as follows:
• Graphs of cumulative volume gain with distance down channel show that the great majority of the material in post-fire debris flows is eroded from the channels: only between 0.1 and 10.3 % of the total volume is contributed from hillslope rilling and sheetwash.
• The cumulative volume with distance graphs also indicate that locating mitigation
measures within the area of the basin that contributes to the lowest channel yield rates may be an effective way to decrease the volume of material contributed to the flow. The locations of the lowest channel yield rates most often occur in areas of the lowest channel gradients, suggesting the strategy of locating hillslope or channel erosion control measures with the basin above these areas.
• The fact that many of the debris-flow volumes predicted by the regression model are less
than the volumes of material measured from treated basins indicates that some combinations of erosion and sediment control treatments can be effective in reducing debris-flow volume. Basins smaller than about 2 km2 in area can be expected to be effectively treated.
• Our information suggests that a decrease in potential debris-flow volume can be
accomplished either by 1) increasing infiltration on hillslopes (and decreasing the amount of runoff that can erode channels) using combined treatments of seeding, mulching and LEBs installed extensively throughout a basin, 2) decreasing the erosion potential within the channel through installation of a series of check dams, or 3) both.
• Seeding and LEB installations alone were found to be ineffective in mitigating post-fire
debris flows. However, a combined treatment of seeding, mulching and LEBs applied throughout nearly the entire basin may effectively reduce debris-flow volume by as much as three orders of magnitude.
41

• Helicopter applications of mulch throughout a basin can be effective in reducing debris-flow volume by as much as one order of magnitude. Localized applications of mulch, and those that do not remain on the hillslopes, do little to mitigate post-fire debris flows.
• LEB effectiveness is increased by installation with good ground contact to prevent
undercutting and periodic removal of trapped sediment to maintain a catchment volume for runoff water and sediment.
• Channel installations of silt fences are effective only against very small events consisting
primarily of fine sediment and water.
• Debris rack installations can be effective in reducing the volume of a passing debris flow if they are adequately designed for the size of the event that actually occurs.
• Effective check dam installations require extensive and careful engineering design, they
can be difficult and labor intensive to build, and failure of an installation can exacerbate potential debris-flow hazards. Failure can result from a lack of spillway, insufficient keying into bank(s), and from an undersized design.
• These conclusions are summarized in the Rapid and Long-Term Response Decision
Support Tools included in Appendices C and D, respectively.
42
7.0 References
Amaranthus, M.P., 1989, Effect of grass seeding and fertilizing on surface erosion in two
intensely burned sites in southwest Oregon, Pages 148-149 in N.H. Berg, technical coordinator, Proceedings of the symposium on fire and watershed management, General technical report PSW-GTR-109, U.S. Department of Agriculture Forest Service, Pacific Southwest Forest and Range Experiment Station, Berkeley, California.
BAER (Burned Area Emergency Response) Team, June 2002. Coal Seam Fire: Burned Area
Emergency Stabilization and Rehabilitation Plan: USDA Forest Service, Bureau of Land Management, U.S. Geological Survey, 250 p.
BAER (Burned Area Emergency Response) Team, July 2002. Missionary Ridge Complex,
Durango, Colorado June – July 2002: Burned Area Emergency Stabilization and Rehabilitation Plan: USDA Forest Service, Bureau of Land Management, U.S. Geological Survey, 251 p.
Barrett, M.E., Kearney, J.E, McCoy, T.G., and Malina, J.F., Jr., 1995, An Evaluation of the Use
and Effectiveness of Temporary Sediment Controls, CRWR Online Report 95-6, Available at http://www.ce.utexas.edu/centers/crwr/reports/online.html.
Bautista, S., Bellot, J., and Vallejo, V.R., 1996, Mulching treatment for postfire soil conservation
in a semiarid ecosystem, arid Soil Research and Rehabilitation, 10, 235-242. Beyers, J.L., 2004, Postfire Seeding for Erosion Control: Effectiveness and Impacts on Native
Plant Communities, USDA Forest Service, Conservation Biology Volume 18 No. 4 pp. 947-956. Found at: http://fire.r9.fws.gov/ifcc/Esr/Library/Library.htm . Accessed on 10/24/2005.
Beyers, J.L., Wakeman, C.D., Wohlgemuth, P.M., and Conard, S.G., 1998, Effects of postfire
grass seeding on native vegetation in southern California chaparral, Pages 52-64 in Proceedings, 19th annual forest vegetation management conference: wildfire rehabilitation, Forest Vegetation Management Conference, Redding, California.
Bradley, J.B., Richards, D.L., and Bahner, C.D., 2005, Debris Control Structures – Evaluation
and Countermeasures, Hydraulic Engineering Circular 9, Third Edition, Report No. FHWA-IF-04-016 HEC-9.
Britton, Sherry L.; Robinson, Kerry M.; Barfield, Billy J.; Kadavy, K. C. 2000. Silt fence
performance testing. Presented at: Annual meeting of the American Society of Agricultural Engineers; 2000 July. Paper 002162. St. Joseph, MI: American Society of Agricultural Engineers. 11 p.
43
Britton, Sherry L.; Robinson, Kerry M.; Barfield, Billy J. 2001. Modeling the effectiveness of
silt fence. In: Proceedings: Seventh Federal Interagency Sedimentation Conference; 2001 March 25-29; Reno, NV. Vol. 2. U.S. Department of Agriculture, Natural Resources Conservation Service: V/75–82.
Buxton, H., and Caruccio, F.T., 1979, Evaluation of Selective Erosion Control Techniques,
Piedmont Region of S.E. United States, Municipal Environmental Research Laboratory Office of Research and Development U.S. Environmental Protection Agency, Cincinnati, OH, EPA-600/2-79-124, 107 p.
Cannon, S.H., 2001, Debris-flow generation from recently burned watersheds: Environmental & Engineering Geoscience, v. 7, no. 4, p. 321-341.
Cannon, S.H. and Gartner, J.E., 2005, Wildfire-related debris flow from a hazards perspective: Chapter 15 in: Hungr, O. and Jacob, M. eds., Debris-Flow Hazards and Related Phenomena, Springer-Praxis Books in Geophysical Sciences, p. 321-344
Cannon, S.H., Gartner, J.E., Holland-Sears, A., Thurston, B.M., and Gleason, J.A., 2003, Debris-flow response of basins burned by the 2002 Coal Seam and Missionary Ridge fires, Colorado, in Boyer, D.D., Santi, P.M., and Rogers, W.P., eds., Engineering geology in Colorado—Contributions, Trends, and Case Histories: AEG Special Publication 15, Colorado Geological Survey Special Publication 55, 31 pp., on CD-ROM.
Cannon, S.H., Gartner, J.E., Parrett, C., and Parise, M., 2003, Wildfire-related debris flow generation through episodic progressive sediment bulking processes, western U.S.A., in Rickenmann, D. and Chen, C.L., eds., Debris-Flow Hazards Mitigation - Mechanics, Prediction, and Assessment, Proceedings of the Third International Conference on Debris-Flow Hazards Mitigation, Davos, Switzerland, 10-12 September 2003: A.A. Balkema, Rotterdam, p. 71-82.
Cannon, S.H., Gartner J.E., Rupert, M.G., Michael, J.A., Djokic, D., Sreedhar, S., 2003, Emergency assessment of debris-flow hazards from basins burned by the Grand Prix and Old Fires of 2003, southern California: U.S. Geological Survey Open-File Report 03-475.
Cannon, S.H., Kirkham, R.M., and Parise, Mario, 2001, Wildfire-related debris-flow initiation processes, Storm King Mountain, Colorado: Geomorphology, v. 39, no. 3-4, pp 171-188.
Chatwin, S.C., D.E. Howes, J.W. Schwab, and D.N. Swanston. 1994. A guide for management of landslide-prone terrain in the Pacific Northwest. 2nd ed. B.C. Ministry of Forestry., Victoria, B.C. Land Management, Handbook 18. 220 p. Found at: http://www.for.gov.bc.ca/hfd/pubs/Docs/Lmh/LMH-09.pdf . Accessed on 2/12/2005.
Cruden, D.M., and Varnes, D.J., 1996, Landslide types and processes,. in: A.K. Turner and R.L.
Schuster, eds., Landslides Investigation and Mitigation Special Report 247,
44
Transportation Research Board, U.S. National Research Council, Washington D.C., pp. 36-75.
Dean, A.E., 2001, Evaluating effectiveness of watershed conservation treatments applied after
the Cerro Grande Fire, Los Alamos, New Mexico, MS thesis, University of Arizona, Tucson.
deWolfe, V.G., 2006, “An Evaluation of Erosion Control Methods After Wildfire in Debris-Flow
Prone Areas,” unpublished M.S. thesis, Colorado School of Mines, Golden, CO, 183 p. Doerr, S. H., Shakesby, R. A. and Walsh, R. P. D., 2000, Soil water repellency – its causes,
characteristics and hydro-geomorphological significance: Earth-Science Reviews, vol. 51, pp. 33-65.
Draper, N.R., and Smith, H., 1981, Applied regression analysis, second edition: John Wiley and
Sons, New York, 709 p. Duffy, J.D. and DeNatale, J.D., 1996, Debris Flow Mitigation Using Flexible Barriers,
Proceedings of the 47th Annual Highway Geology Symposium, 243-252 pp. Eisbacher, G.H. and J.J. Clague. 1984. Destructive mass movements in high mountains: hazard
and management. Geological Survey of Canada. Paper 84-16. 230 p. Ey, J., 2004, Personal Communication: Florida Water Conservancy District, Lemon Dam,
Missionary Ridge Fire, Southwest Colorado. Gartner, J.D., 2003, Erosion after wildfire: the effectiveness of log erosion barriers, University of
Colorado M.S. Thesis. Gartner, J.E., 2005, Relations Between Debris-flow Volumes Generated from Recently Burned
Basins and Basin Morphology, Triggering Storm Rainfall and Material Properties, University of Colorado M.S. Thesis.
Gartner, J.E., Cannon, S.H, Bigio, E.R., Davis, N.K., Parrett, C., Pierce, K.L., Rupert, M.R.,
Thurston, B.L., Trebish, M.J., Garcia, S.P., and Rea, A.H., 2005, Compilation of Data relating to the erosive response of 606 recently burned basins on the Western U.S., U.S. Gelogical Survey Open-File Report, 05-1218.
Gautier, C.R., 1983, Sedimentation in burned watersheds: is emergency revegetation justified?
Water Resources Bulletin 19:793-802. Giraud, R.E., 2005, Guidelines for the Geologic Evaluation of Debris-Flow Hazards on Alluvial
Fans in Utah, Utah Geological Survey Miscellaneous Publication 05-6, 16 p. Geier-Hayes, K., 1997, The impact of post-fire seeded grasses on native vegetative communities
in central Idaho, Pages 19-26 J.M. Greenlee, editor, Proceedings: first conference on fire
45
effects on rare and endangered species and habitats, International Association of Wildland Fire, Fairfield, Washington.
Government of Japan. 1984. Basics f planning the measures against debris flows and planning
countermeasure facilities against debris flow. Ministry of Construction. 39p. Heierli, W. and A. Merk. 1985. Barriers for erosion control of mountain torrents. In Proceedings
of the International Symposium on Erosion, debris flow and disaster prevention, Tsukuba, Japan, pp. 375-380.
Helsel, D.R., and Hirsch, R.M., 2002, Statistical methods in water resources, Studies in
Environmental Science 49: Elsevier, Amsterdam, 489 p. Heumader, J., 2000, Technical debris-flow countermeasures in Austria – A review, in
Wieczorek, G.F. and Naeser, N.D., Debris-Flow Hazards Mitigation: Mechanics, Prediction, and Assessment Proceedings of Second International Conference on Debris-Flow Hazards Mitigation, Taipei, Taiwan August 16-18, 2000, A.A. Balkema, Brookfield, VT, pp. 553-564.
Hungr, O. Classification and terminology, Chapter 2 in M. Jakob and O. Hungr, eds, Debris-flow
hazards and related phenomena: Praxis. Springer Berlin Heidelberg, p. 9-23.
Hungr, O., Morgan, G.C., and Kellerhals, R. (1984). “Quantitative analysis of debris torrent hazards for design of remedial measures”, Canadian Geotechnical Journal, Vol. 21, pp. 663-677.
Inman, D.L., 1952, Measures for describing the size distribution of sediments: Journal of
Sedimentary Petrology, v. 22, p. 125-145. Jaeggi, M.N.R., and Pellandini, S., 1997, Torrent Check Dams as a Control Measure for Debris
Flows, in Armani, A. and Michiue, M. eds., Recent Developments on Debris Flows, Lecture Notes in Earth Sciences Volume 64: Springer-Verlag, New York, NY, pp. 186-207.
Jiang, Naiqian; Hirschi, Michael C.; Cooke, Richard A. C.; Mitchell, J. Kent. 1996. Equation for
flow through filter fabric. Presented at: Annual meeting of the American Society of Agricultural Engineers; 1996 July. Paper 962098. St. Joseph, MI: American Society of Agricultural Engineers. 14 p.
Johnson, A.R., with contributions from Rodine, J.R., 1984, Debris Flow; in Brunsden, D., Prior,
D.B., eds., Slope Instability: John Wiley and Sons Ltd. Kay B.L., 1983, Straw as an erosion control mulch. Agronomy Progress Report No. 140, Davis,
CA: University of California Agricultural Experiment Station, 11p.
46

Keaton, J.R. and DeGraff, J.V. (1996) Surface Observation and Geologic Mapping, in Turner, A.K., and Schuster, R.L. (eds.) Landslides, Investigation and Mitigation, Transportation Research Board Special Report 247, National Academy Press, Washington D.C, pg.194.
Kouwen, N., 1990, “Silt Fences to Control Sediment Movement on Construction Sites, MAT-90-
03,” The Research and Development Branch Ontario Ministry of Transportation. Leys, E. and G. Hagen. 1971. Design of gravity dams against water pressure and earth pressure.
Imst Regional Construction Office, Torrent and Avalanche Control, Austria. 39 p. (in German).
Martin, D. A. and Moody, J .A., 2001, Comparison of soil infiltration rates in burned and
unburned mountainous watersheds: Hydrological Processes, vol. 15, pp. 2893-2903. McDonald, G.N., Giraud, R.E., 2002, Fire-related debris flows east of Santaquin and Spring
Lake, Utah County, Utah: Utah Geological Survey Technical Report 02-09, 15p. Mead, P., 2003, Written communication. Melton, M.A., 1965, The geomorphic and paleoclimatic significance of alluvial deposits in
southern Arizona: Journal of Geology, v. 73, p. 1-38. Meyer, G. A., 2002, Fire in western conifer forests – geomorphic and ecologic processes and
climatic drivers: Geological Society of America Abstracts with Programs vol. 34, p. 46. Miles, S.R. Listing of BAER Treatments: cost, risk, effectiveness, production rates and
applications, Burned Area Emergency Response Lesson, available at http://www.fs.fed.us/r5/baer/4g.html, accessed on 2/10/2005.
Miles, S. R.; Haskins, D.M.; Ranken, D.W., 1989. Emergency burn rehabilitation; cost, risk, and
effectiveness. In: Berg, N.H., tech. Coord. Proceedings of the symposium on fire and watershed management, October 26-28, 1988, Sacramento, California. Gen. Tech. Rep. PSW-109. Berkeley, CA: U.S. Department of Agriculture, Forest Service
Moody, J. A. and Martin, D. A., 2001, Initial hydrologic and geomorphic response following a
wildfire in the Colorado Front Range: Earth Surface Processes and Landforms, vol. 26, pp. 1049-1070.
Moench, R. and Fusaro, J., 2002, Soil Erosion Control after Wildfire, Colorado State University
Cooperative Extension, no. 6.308, Found at: http://www.ext.colostate.edu/PUBS/NATRES/06308.html. Accessed on 2/10/2005.
Okubo, S., Ikeya, H., Ishikawa, Y., and Yamada, T., 1997, Development of New Methods for
Countermeasures against Debris Flows, in Armani, A. and Michiue, M. eds., Recent Developments on Debris Flows, Lecture Notes in Earth Sciences Volume 64: Springer-Verlag, New York, NY, pp. 166-185.
47
Parrett, C., 1987, Fire-related debris flows in the Beaver Creek drainage, Lewis and Clark
County, Montana:. U.S. Geological Survey Water-Supply Paper 2330, pp. 57-67. Public Utility District No.1 of Chelan County, 2001, Erosion Control Techniques and Permitting,
Lake Chelan Hydroelectric Project: FERC Project No. 637, P.U.D, Chelan County Power, Wenatchee, Washington (revised draft).
Reihsen, G. and Harrison, L.J., 1971, HEC 9 Debris Control Structures, Federal Highway
Administration, Hydraulics Branch, Available at: http://www.bossintl.com/products/dpdf/files/ftp/dir/01383/pdf/hec09.pdf.
Robichaud, P.R., 2006, Personal Communication.
Robichaud, P.R., 2005, Measurement f post-fire hilllslope erosion to evaluate and model rehabilitation treatment effectiveness and recovery, International Journal of Wildland Fire: 14, pp. 475-485.
Robichaud, P.R. and Brown, R.E., 2002, Silt fences: An economical technique for measuring hillslope soil erosion, U.S. Department of Agriculture, Forest Service, Rocky Mountain Research Station, General Technical Report RMRS-GTR-94, Fort Collins, CO.
Robichaud, P.R., 2000, Fire and erosion: evaluating the effectiveness of a post-fire rehabilitation treatment, contour-felled logs, In ‘Proceedings of the watershed management and operations management conference’. Flug, M., Frevert, D., and Watkins, Jr., D.W. eds., American Society of Civil Engineers, Reston, VA.
Robichaud, P. R.; Beyers, J. L.; Neary, D. G. 2000. Evaluating the Effectiveness of Postfire Rehabilitation Treatments General Technical Report RMRS-GTR-63. Fort Collins: U.S. Department of Agriculture, Forest Service, Rocky Mountain Research Station. 85 p. Found at: http://www.fs.fed.us/rm/pubs/rmrs_gtr63.pdf Accessed on 10/14/2005.
Roby, K.B., 1989, Watershed response and recovery from the Will Fire: ten years of observation, Pages 131-136 in N.H. Berg, technical coordinator, Proceedings of the symposium on fire and watershed management, General technical report PSW-GTR-109, U.S. Department of Agriculture Forest Service, Pacific Southwest Forest and Range Experiment Station, Berkeley, California.
Santi, P.M., 1988, the kinematics of debris flow transport down a canyon, College Station, TX, M.S. Thesis, 85 p.
Shakesby, R. A., Doerr, S. H. and Walsh, R. P. D., 2000, The erosional impact of soil hydrophobicity – current problems and future research directions: Journal of Hydrolog , vol. 231-232, pp. 178-191.
48
Spittler, T. E., 1995, Fire and the debris flow potential of winter storms, In: Keeley, J. E., and Scott, T. (eds), Brushfires in California Wildlands: Ecology and Resource Management. International Association of Wildland Fire, Fairfield WA, p. 113- 120.
Swanson, F. J., 1981, Fire and geomorphic processes, In: Mooney, H. A., Bonniksen, T. H.,
Christensen, N. L., Lotan, J. E.,and Reiners, W. A. (eds), Fire Regimes and Ecosystem Properties: USDA Forest Service General Technical Report WO-26. pp. 401-420.
Swanston, D. N., 1975, Slope stability problems associated with timber harvesting in
mountainous regions of the western United States: USDA Forest Service General Technical Report PNW-21, 14 pp.
Switzerland, Eidgenossisches Amt fur Strassen-und Flussbau. 1973. Dimensionierung von
Wildbachsperren aus Beton und Stahlbeton. Bern. Unpublished, 121 p. (in German). Sun, H.W., and Lam, T.T.M, 2004, “Use of standardized debris-resisting barriers for mitigation
of natural terrain landslide hazards”, Special Project Report SPR 9/2004, Landslip Preventive Measures Division 1: Government of Hong Kong.
Taskey, R.D., Curtis, C.L., and Stone, J., 1989, Wildfire, ryegrass seeding, and watershed
rehabilitation, Pages 149-161 in N.H. Berg, technical coordinator, Proceedings of the symposium on fire and watershed management, General technical report PSW-GTR-109, U.S. Department of Agriculture Forest Service, Pacific Southwest Forest and Range Experiment Station, Berkeley, California.
Thommen, R.A. and Duffy, J.D., 1997, Testing and application of flexible wire rope netting
barriers to retain mud and debris flow, Geobrugg Technical Bulletin #10. Thurber Consultants Ltd. 1984. Debris torrents, a review of mitigative measures. Report to B.C.
Ministry of Transportation and Highways, Victoria, B.C. U.S. Army Corps of Engineers, 2004, Analyses of the debris and sedimentation impacts at
selected debris basins associated with the wildfires of 2003 and the December 25, 2003 storm, Hydrology and Hydraulics Section, U.S. Army Corps of Engineers, Los Angeles District, after action report DRAFT, 45p, 25p.
URS, 2004, Flood Mitigation Plan for Ventura, California, prepared for Ventura County
Watershed Protection District. VanDine, D.F. (1985). “Debris flows and debris torrents in the southern Canadian Cordillera”,
Canadian Geotechnical Journal, Vol. 22, pp. 44-68. VanDine, D.F. 1996. Debris Flow Control Structures for Forest Engineering: British Columbia
Ministry of Forests Research Program, Victoria, B.C., Working Paper 08/1996 (available at www.for.gov.bc.ca/hfd/pubs/Docs/Wp/Wp22.htm accessed on 2/8/2005.), 68p.
49
50
VanDine, D.F., et al., 1997, Channelized Debris Flow Mitigative Structures in British Columbia, Canada, in Chen, C.I. ed., Debris-Flow Hazards Mitigation: Mechanics, Prediction, and Assessment Proceedings of First International Conference: American Society of Civil Engineers, New York, NY, pp. 606-615.
Wagenbrenner, J.W., MacDonald, L.H., and Rough, D. (in press) Effectiveness of three post-fire
rehabilitation treatments in the Colorado Front Range, Hydrological Processes. Wells, W.D., 1987, The effects of fire on the generation of debris flows in southern California, in
Costa, J.E. and Wieczorek, G.G., eds., Debris Flow/ Avalanches: Process, Recognition, and Mitigation, Reviews in Engineering Geology Volume VII: Geological Society of America, Boulder, CO, pp. 105-114.
White, S., Garcia-Ruiz, J.M., Marti, C., Valero, B., Errea, M.P., and Gomez-Villar, A., 1998.
The 1996 Biescas campsite disaster in the Central Spanish Pyrenees, and its temporal and spatial contenxt: Hydrological Processes, v. 11, no. 14, pp. 1797-1812.
Whittaker, J.G., Schaelchli, U., and Jaeggi, M.N.R., 1985, Design problems with torrent check
dams in Switzerland, in Proceedings of the International Symposium: Erosion, debris flow and disaster prevention, Tsukuba, Japan, pp. 387-394
Wohlgemuth, P.M., Beyers, J.L., Wakeman, C.D., and Conard, S.G., 1998, Effects of fire and
grass seeding on soil erosion in southern California chaparral, Pages 41-51 in Proceedings, 19th annual forest vegetation management conference: wildfire rehabilitation, Forest Vegetation Management Conference, Redding, California.
Wohlgemuth, P.M., Beyers, J.L., and Conard, S.G., 1999, Postfire hillslope erosion in southern
California chaparral: a case study of prescribed fire as a sediment management tool, Pages 269-276 in A. Gonzalez-Caban and P.N. Omi, technical coordinators, Proceedings of a symposium on fire economics, planning, and policy: bottom lines, General technical report PSW-GTR-173, U.S. Department of Agriculture Forest Service, Pacific Southwest Research Station, Albany, California.
Wohlgemuth, P.M., Hubbert, K.R, and Robichaud, P.R., 2001, The effects of log erosion barriers
on post-fire hydrologic response and sediment yield in small forested watersheds, southern California, Hydrological Processes Vol. 15 pp. 3053-3066.
Wondzell. S. M. and King, J. G., 2003, Post-fire erosional processes in the Pacific Northwest and
Rocky Mountain Regions: Forest Ecology and Management, vol. 178, pp.75-87. WWE, (Wright Water Engineers) Inc. 2005. Florida Watershed Post-Fire Rehabilitation
Project, Section 319 Grant Report. Wright Water Engineers, Inc., Durango, CO, unpublished report.

A-1
Appendix A: Data used for multiple regression analyses (Gartner, 2005)
Table A-1 – Study sites and estimate debris-flow volumes (Gartner, 2005)

A-2
Table A-2 – Basin morphology characteristics (Garnter, 2005)

A-3
Table A-3 – Burn severity characteristics (Garnter, 2005)

A-4
Table A-4 – Rock type and burned soil grain size distribution (Garnter, 2005)

A-5
Table A-5 – Debris-flow triggering rainfall characteristics (Gartner, 2005)
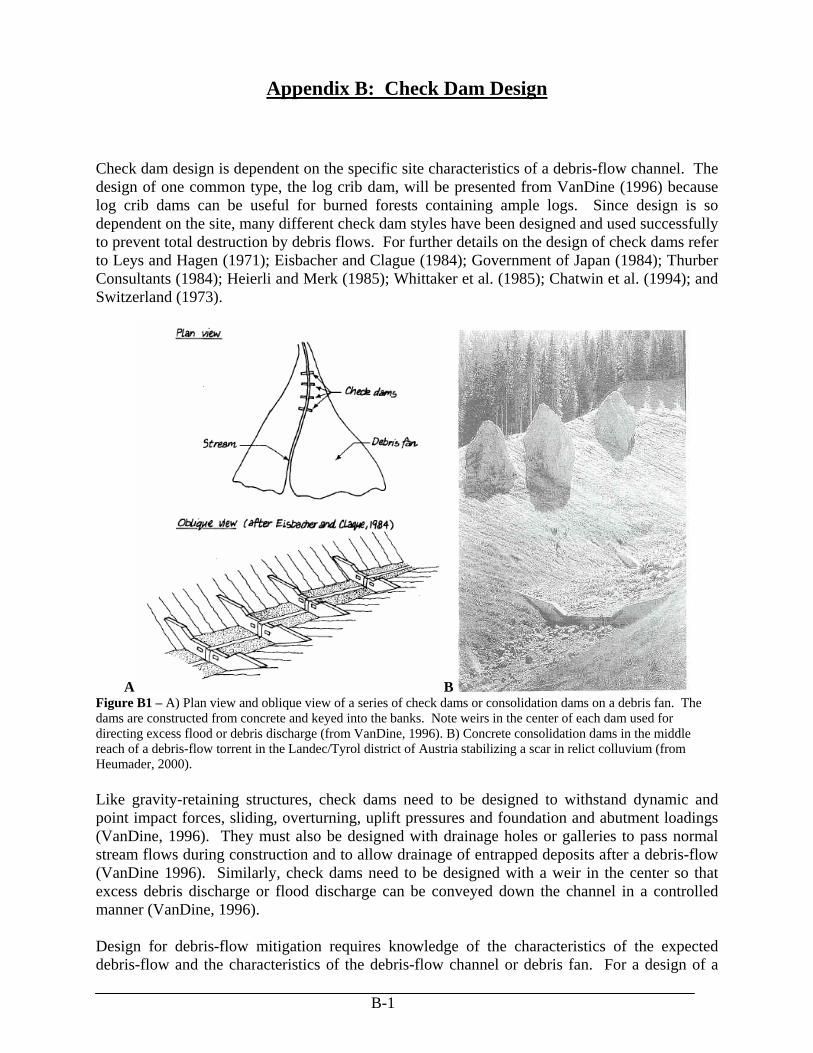
Appendix B: Check Dam Design
Check dam design is dependent on the specific site characteristics of a debris-flow channel. The design of one common type, the log crib dam, will be presented from VanDine (1996) because log crib dams can be useful for burned forests containing ample logs. Since design is so dependent on the site, many different check dam styles have been designed and used successfully to prevent total destruction by debris flows. For further details on the design of check dams refer to Leys and Hagen (1971); Eisbacher and Clague (1984); Government of Japan (1984); Thurber Consultants (1984); Heierli and Merk (1985); Whittaker et al. (1985); Chatwin et al. (1994); and Switzerland (1973).
A B Figure B1 – A) Plan view and oblique view of a series of check dams or consolidation dams on a debris fan. The dams are constructed from concrete and keyed into the banks. Note weirs in the center of each dam used for directing excess flood or debris discharge (from VanDine, 1996). B) Concrete consolidation dams in the middle reach of a debris-flow torrent in the Landec/Tyrol district of Austria stabilizing a scar in relict colluvium (from Heumader, 2000). Like gravity-retaining structures, check dams need to be designed to withstand dynamic and point impact forces, sliding, overturning, uplift pressures and foundation and abutment loadings (VanDine, 1996). They must also be designed with drainage holes or galleries to pass normal stream flows during construction and to allow drainage of entrapped deposits after a debris-flow (VanDine 1996). Similarly, check dams need to be designed with a weir in the center so that excess debris discharge or flood discharge can be conveyed down the channel in a controlled manner (VanDine, 1996).
Design for debris-flow mitigation requires knowledge of the characteristics of the expected debris-flow and the characteristics of the debris-flow channel or debris fan. For a design of a
B-1

series of check dams in particular, the following debris-flow parameters should be known or estimated (VanDine, 1997):
frequency of occurrence volume maximum discharge and flow depth likely flow path potential impact forces potential runout distance potential runup and superelevation probable storage angle
Similarly, characteristics of the debris channel and debris fan that must be considered in check dam design are (VanDine, 1997):
channel gradient channel geometry sidewall materials bedload materials debris fan size fan gradient fan geometry fan morphology location of other structures
VanDine (1996) presents a conceptual design of a series of log crib check dams (Figure B2) used near the distal end of a debris fan on a tributary to Bonanza Creek in the Rennell Sound area of Graham Island in the Queen Charlotte Islands, Canada. The objective of these check dams is to artificially reduce the fan gradient and therefore encourage deposition of material higher up on the fan. Any trapped debris is not expected to be removed. Important design details are that the log cribs are 10 to 12 meters long, 3 meters wide and 2.5 meters high. The cribs are keyed into the bank about 2 meters on each side. Large boulders are used to fill the crib and are also placed on the downstream side of the dam to prevent scour. The logs on top of the dam are positioned so that a weir forms in the middle, which helps to direct excess discharge towards the middle of the channel, thereby minimizing erosion of the banks.
B-2
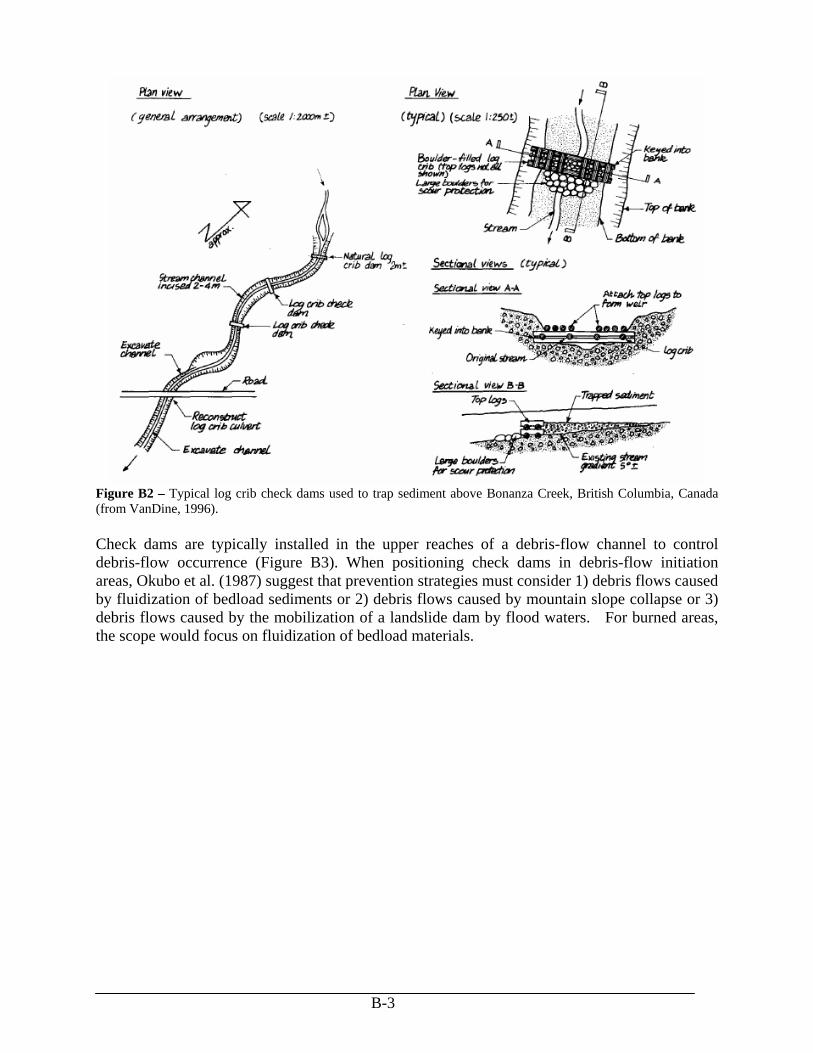
Figure B2 – Typical log crib check dams used to trap sediment above Bonanza Creek, British Columbia, Canada (from VanDine, 1996). Check dams are typically installed in the upper reaches of a debris-flow channel to control debris-flow occurrence (Figure B3). When positioning check dams in debris-flow initiation areas, Okubo et al. (1987) suggest that prevention strategies must consider 1) debris flows caused by fluidization of bedload sediments or 2) debris flows caused by mountain slope collapse or 3) debris flows caused by the mobilization of a landslide dam by flood waters. For burned areas, the scope would focus on fluidization of bedload materials.
B-3
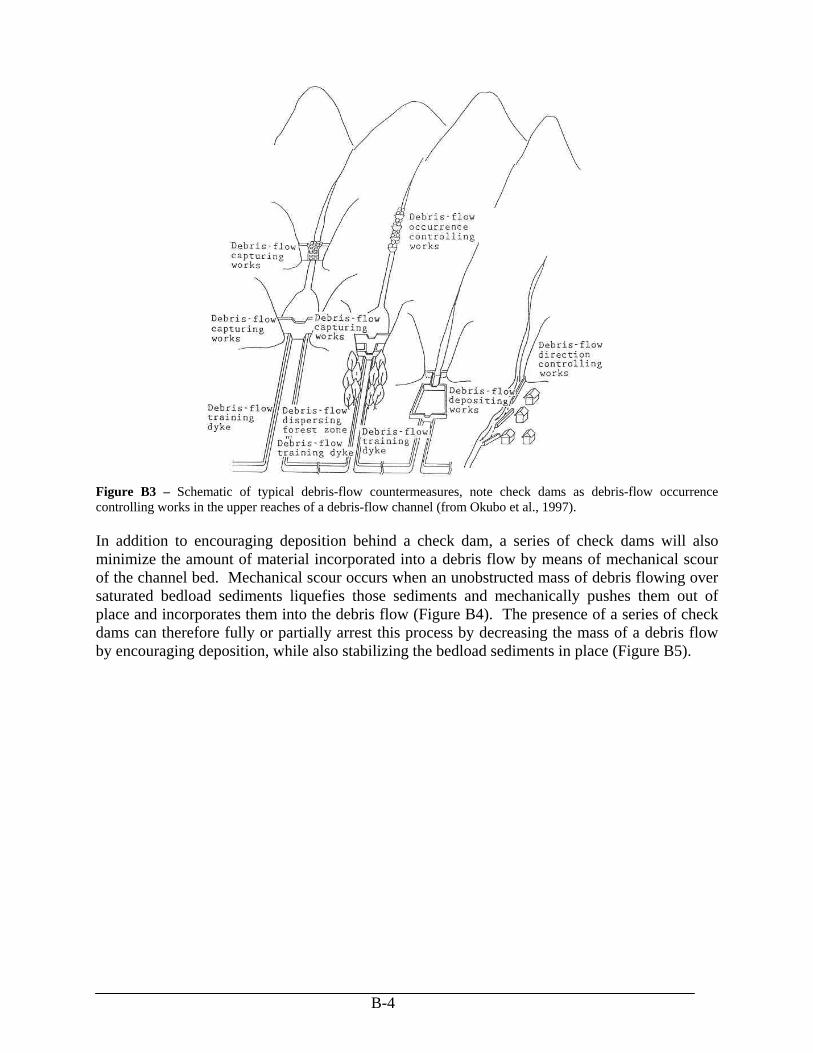
Figure B3 – Schematic of typical debris-flow countermeasures, note check dams as debris-flow occurrence controlling works in the upper reaches of a debris-flow channel (from Okubo et al., 1997). In addition to encouraging deposition behind a check dam, a series of check dams will also minimize the amount of material incorporated into a debris flow by means of mechanical scour of the channel bed. Mechanical scour occurs when an unobstructed mass of debris flowing over saturated bedload sediments liquefies those sediments and mechanically pushes them out of place and incorporates them into the debris flow (Figure B4). The presence of a series of check dams can therefore fully or partially arrest this process by decreasing the mass of a debris flow by encouraging deposition, while also stabilizing the bedload sediments in place (Figure B5).
B-4
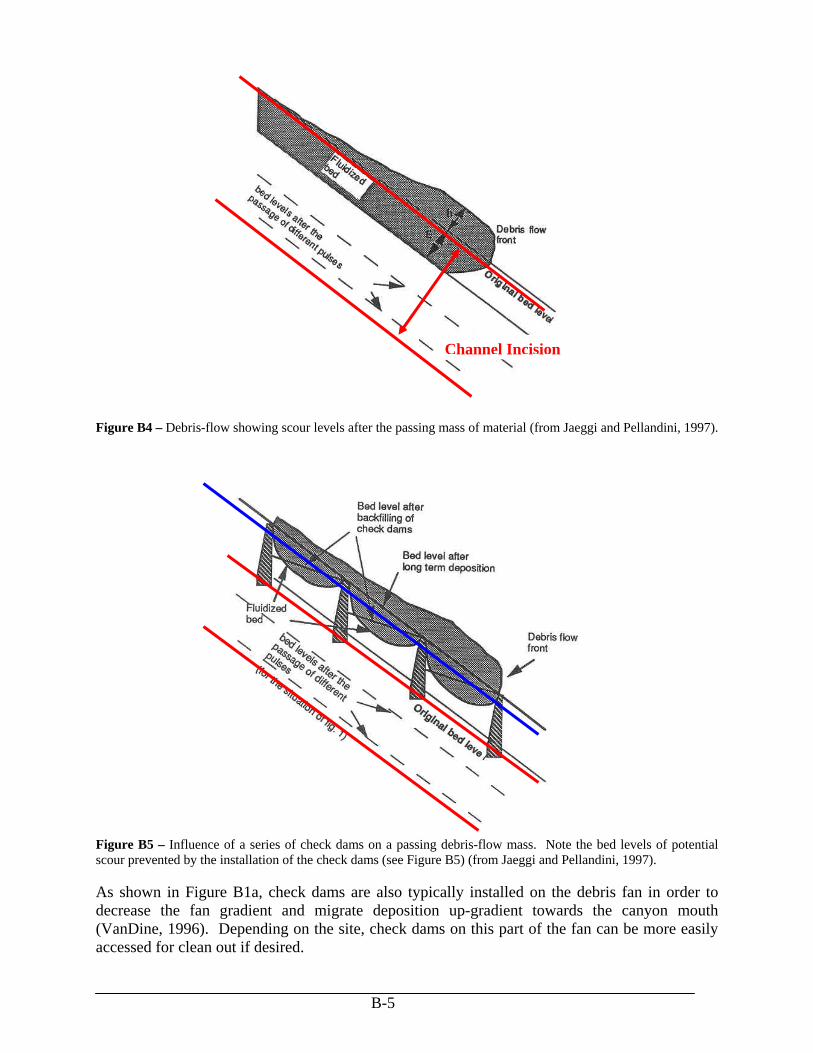
Channel Incision
Figure B4 – Debris-flow showing scour levels after the passing mass of material (from Jaeggi and Pellandini, 1997).
Figure B5 – Influence of a series of check dams on a passing debris-flow mass. Note the bed levels of potential scour prevented by the installation of the check dams (see Figure B5) (from Jaeggi and Pellandini, 1997). As shown in Figure B1a, check dams are also typically installed on the debris fan in order to decrease the fan gradient and migrate deposition up-gradient towards the canyon mouth (VanDine, 1996). Depending on the site, check dams on this part of the fan can be more easily accessed for clean out if desired.
B-5
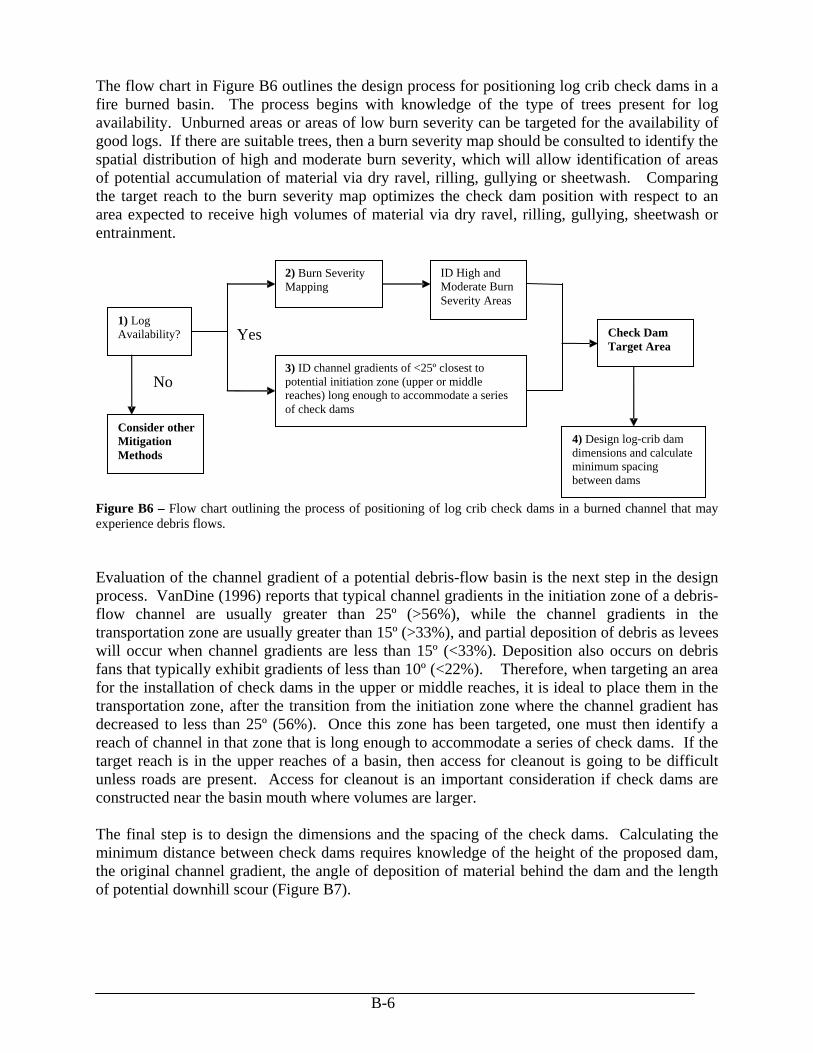
The flow chart in Figure B6 outlines the design process for positioning log crib check dams in a fire burned basin. The process begins with knowledge of the type of trees present for log availability. Unburned areas or areas of low burn severity can be targeted for the availability of good logs. If there are suitable trees, then a burn severity map should be consulted to identify the spatial distribution of high and moderate burn severity, which will allow identification of areas of potential accumulation of material via dry ravel, rilling, gullying or sheetwash. Comparing the target reach to the burn severity map optimizes the check dam position with respect to an area expected to receive high volumes of material via dry ravel, rilling, gullying, sheetwash or entrainment.
3) ID channel gradients of <25º closest topotential initiation zone (upper or middlereaches) long enough to accommodate a seriesof check dams
2 ) Burn SeverityMapping
1) Log Availability?
ID High and Moderate BurnSeverity Areas
Check Dam Target Area
4) Design log-crib dam dimensions and calculate minimum spacing between dams
Yes
No
Consider other Mitigation Methods
Figure B6 – Flow chart outlining the process of positioning of log crib check dams in a burned channel that may experience debris flows. Evaluation of the channel gradient of a potential debris-flow basin is the next step in the design process. VanDine (1996) reports that typical channel gradients in the initiation zone of a debris-flow channel are usually greater than 25º (>56%), while the channel gradients in the transportation zone are usually greater than 15º (>33%), and partial deposition of debris as levees will occur when channel gradients are less than 15º (<33%). Deposition also occurs on debris fans that typically exhibit gradients of less than 10º (<22%). Therefore, when targeting an area for the installation of check dams in the upper or middle reaches, it is ideal to place them in the transportation zone, after the transition from the initiation zone where the channel gradient has decreased to less than 25º (56%). Once this zone has been targeted, one must then identify a reach of channel in that zone that is long enough to accommodate a series of check dams. If the target reach is in the upper reaches of a basin, then access for cleanout is going to be difficult unless roads are present. Access for cleanout is an important consideration if check dams are constructed near the basin mouth where volumes are larger. The final step is to design the dimensions and the spacing of the check dams. Calculating the minimum distance between check dams requires knowledge of the height of the proposed dam, the original channel gradient, the angle of deposition of material behind the dam and the length of potential downhill scour (Figure B7).
B-6
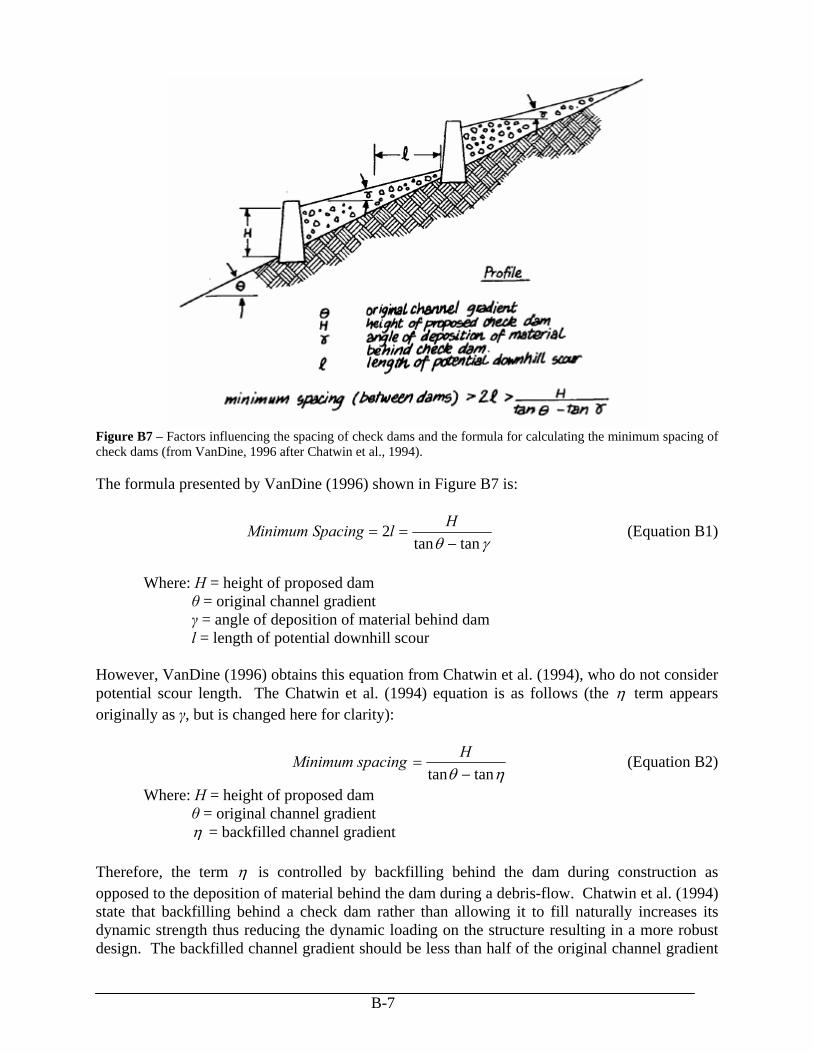
Figure B7 – Factors influencing the spacing of check dams and the formula for calculating the minimum spacing of check dams (from VanDine, 1996 after Chatwin et al., 1994). The formula presented by VanDine (1996) shown in Figure B7 is:
γθ tantan2
−==
HlSpacingMinimum (Equation B1)
Where: H = height of proposed dam θ = original channel gradient γ = angle of deposition of material behind dam l = length of potential downhill scour However, VanDine (1996) obtains this equation from Chatwin et al. (1994), who do not consider potential scour length. The Chatwin et al. (1994) equation is as follows (the η term appears originally as γ, but is changed here for clarity):
Minimum spacing ηθ tantan −
=H (Equation B2)
Where: H = height of proposed dam θ = original channel gradient η = backfilled channel gradient Therefore, the term η is controlled by backfilling behind the dam during construction as opposed to the deposition of material behind the dam during a debris-flow. Chatwin et al. (1994) state that backfilling behind a check dam rather than allowing it to fill naturally increases its dynamic strength thus reducing the dynamic loading on the structure resulting in a more robust design. The backfilled channel gradient should be less than half of the original channel gradient
B-7

(Chatwin et al., 1994). While backfilling will reduce the capacity of a check dam to catch debris, its structural integrity is enhanced, which decreases the probability and risk of failure while also discouraging debris-flow scour and entrainment. In short, the goal of reducing debris-flow volume is more achievable if check dams do not fail, and entrainment by debris-flow scour is suppressed; as opposed to having slightly more space to catch flowing debris behind a series of check dams. It was recognized by Jaeggi and Pellandini (1997) that scour down-gradient from a check dam is an important problem to be addressed. They suggest that installing aprons at the toe of check dams (Figure B8) may divert flow and prevent scour. However stresses on the aprons are high, so if they are made of loose boulder material, which is common because it is often present in debris channels, then scour and entrainment may still form at very high flows (Jaeggi and Pellandini, 1997).
Figure B8 – Effect of an apron at the toe of a check dam in a series of check dams with narrow spacing. The apron helps to minimize or prevent scour at the toe of a check dam. In narrowly spaced dams, the space between the dams becomes a stilling basin (from Jaeggi and Pellandini, 1997).
As a result, the following modification to Equation B2 should be used when determining the spacing between check dams:
Minimum spacingηθ tantan
2−
==Hl (Equation B3)
Where: H = height of proposed dam θ = original channel gradient η = backfilled channel gradient l = length of potential downhill scour VanDine (1996) cites the most common causes of check dam failure to be impact on the “wings” of the structure; abrasion of the structure, scouring beneath the front face, outflanking of the abutments, and inadequate spillway capacity.
B-8

Appendix C:
Rapid Response Decision Support Tool for Debris-Flow Mitigation

Appendix D:
Long-Term Response Decision Support Tool for Debris-Flow Mitigation
Appendix E:
Publications and Presentations
Presentations
Cannon, S.H., Gartner, J.E., Rupert, M.G., and Michael, J.A., “A Method for the Rapid Assessment of the Probability and Volume of Post-Wildfire Debris Flows from Recently Burned Basins in the Inter-Mountain West, U.S.A.,” Shlemon Specialty Conference, Durango, CO, May 3-5, 2006.
deWolfe, V.G., Santi, P.M. Ey, J. and Gartner, J.E., 2005, “Arrest of a Debris Flow at Lemon
Dam, La Plata County, Colorado Using Erosion Control Mitigation,” Geological Society of America Annual Meeting Abstracts with Programs.
deWolfe, V.G. and Santi, P.M., 2005, “An Evaluation of Erosion Control Methods After
Wildfire in Debris Flow Prone Areas,” Association of Engineering Geologists 48th Annual Meeting Program with Abstracts, Las Vegas, NV.
Gartner, J.E., Cannon, S.H., Santi, P.M., and deWolfe, V.G., 2006, “Models to Predict Wildfire
Related Debris-Flow Volumes,” Shlemon Specialty Conference, Durango, CO, May 3-5, 2006.
Gartner, J.E., Cannon, S.H., Santi, P.M. and deWolfe, V.G., 2005, “Relations Between Debris-
Flow Volumes Generated from Recently Burned Basins and Basin Morphology, Triggering Storm Rainfall and Material Properties,” Geological Society of America Annual Meeting Abstracts with Programs.
Lemmerman, A.K. and Santi, P.M., 2005, “An Assessment of the Accuracy and Repeatability of
Debris Flow Velocity Calculations,” Geological Society of America Annual Meeting Abstracts with Programs.
Lemmerman, A.K., Santi, P.M., and Prochaska, A.K., 2005, “Critical Debris Flow Analysis
Parameters – Velocity,” Geological Society of America Rocky Mountain Section Meeting, Grand Junction, CO.
Prochaska, A.B., Santi, P.M., Higgins, J.D., and Cannon, S.H, 2006, “Debris-Flow Runout
Estimations Using Topographic Parameters,” Shlemon Specialty Conference, Durango, CO, May 3-5, 2006.
Prochaska, A. and Santi, P.M., 2005, “Sensitivity and Appropriateness of Debris Flow Runup
and Superelevation Equations,” Geological Society of America Annual Meeting Abstracts with Programs.
E-1

Prochaska, A. and Santi, P.M., 2005, “Criteria for the Selection of Appropriate Debris Flow Runout Equations,” Association of Engineering Geologists 48th Annual Meeting Program with Abstracts, Las Vegas, NV.
Santi, P.M., deWolfe, V.G., Higgins, J.D., Cannon, S.H., and Gartner, J.E., 2006, “Sources of
Debris Flow Material in Burned Areas,” Shlemon Specialty Conference, Durango, CO, May 3-5, 2006.
Santi, P.M., 2005, “Evaluation of Post-Wildfire Debris Flow Mitigation Methods and
Development of Decision Support Tools,” Joint Fire Science Program Annual Meeting. Santi, P.M. and deWolfe, V.G., 2005, “A Model for Sediment Accumulation and Debris Flow
Production in Burned Areas,” Geological Society of America Annual Meeting Abstracts with Programs.
Santi, P.M. and deWolfe, V.G., 2005, “Comparisons of Debris Flow Volume Measurements and
Predictions,” Association of Engineering Geologists 48th Annual Meeting Program with Abstracts, Las Vegas, NV.
Santi, P.M., deWolfe, V.G., and Higgins, J.D., 2005, “Debris Flows – Basic Morphologies and
Processes,” Geological Society of America Rocky Mountain Section Meeting, Grand Junction, CO.
Santi, P.M., 2004, “Designing Debris Flow Channels and Deflection Berms,” Association of
Engineering Geologists 47th Annual Meeting Program with Abstracts, Dearborn, MI. Santi, P.M., deWolfe, V.G., Higgins, J.D., Cannon, S.H., and Gartner, J.E., 2006, Sources of
debris flow material in bunred areas: Association of Engineering Geology Shlemon Conference on Mass Wasting from Disturbed Watersheds, Durango, Colorado, May 3-5, 2006.
Soule, N.C., Santi, P.M., and Prochaska, A.K., 2005, “Critical Debris Flow Analysis Parameters
– Yield Strength and Viscosity,” Geological Society of America Rocky Mountain Section Meeting, Grand Junction, CO.
Soule, N. and Santi, P.M., 2005, “The Influence of Water Content and Coarse Grained Fraction
on the Rheological Parameters of Debris Flow Deposits,” Association of Engineering Geologists 48th Annual Meeting Program with Abstracts, Las Vegas, NV.
E-2
Symposia
Noe, D., and Santi, P.M., 2005, Symposium “Mudslide Mania – Characteristics and Geologic Investigations of Debris Flows and Alluvial Fans in the Rocky Mountain Region,” Geological Society of America Rocky Mountain Section Meeting, Grand Junction, CO.
Coe, J. and Cannon, S., 2005, “Debris Flows Initiated by Runoff and Erosion: Processes,
Recognition, and Hazard Implications,” Geological Society of America Annual Meeting, Salt Lake City, UT.
Shlemon Specialty Conference, 2006, “Mass Wasting in Disturbed Watersheds,” Association of
Environmental and Engineering Geologists, Durango, CO.
Publications
Cannon, S.H., Santi, P.M., Soule, N., deWolfe, V.G., Gartner, J.E., and Higgins, J.D., in review, Evaluation of Post-Wildfire Debris Flow Mitigation Methods and Development of Decision-Support Tools, USGS Open-File Report (# to be assigned), (website URL to be assigned).
deWolfe, V.G., Santi, P.M., Gartner. J.E., Cannon, S.H., and Ey, J., in preparation, “Arrest of
debris-flow processes at Lemon Dam, La Plata County, Colorado, using erosion and sediment control mitigation,” Geomorphology Journal.
deWolfe, V.G., 2006, “An Evaluation of Erosion Control Methods After Wildfire in Debris-Flow
Prone Areas,” unpublished M.S. thesis, Colorado School of Mines, Golden, CO, 183 p. Gartner, J.E., 2005, “Relations Between Wildfire Related Debris-Flow Volumes and Basin
Morphology, Burn Severity, Material Properties and Triggering Storm Rainfall,” unpublished M.A. thesis, University of Colorado, Boulder, CO, 73 p.
Santi, P.M., deWolfe, V.G., Higgins, J.D., Cannon, S.H., and Gartner, J.E., in preparation,
“Sources of Debris Flow Material in Burned Areas,” Geomorphology Journal. Santi, P.M., deWolfe, V.G., Higgins, J.D., Cannon, S.H., and Gartner, J.E., in preparation,
“Effectiveness of Debris Flow Mitigation Methods in Burned Areas,” Proceedings of the First North American Landslides Conference, Vail, CO, 2007.
E-3