Embed Size (px)
Citation preview

District of Columbia Department of Energy and Environment
Evaluation of the District of Columbia Sustainable Energy Utility FY2016 Annual Evaluation Report for the Performance Benchmarks (Final Draft)
June 28, 2017

ii
Evaluation of the DCSEU Performance Benchmarks—FY2016 Annual Evaluation Report (Final Draft). June 28, 2017
6410 Enterprise Lane, Suite 300 | Madison, WI 53719 Tel 608.316.3700 | Fax 608.661.5181
tetratech.com
Copyright © 2017 Tetra Tech, Inc. All Rights Reserved.

iii
Evaluation of the DCSEU Performance Benchmarks—FY2016 Annual Evaluation Report (Final Draft). June 28, 2017
TABLE OF CONTENTS
1.0 EXECUTIVE SUMMARY ................................................................................................................. X
1.1 Key Findings and Recommendations ......................................................................................... xi
1.1.1 Performance Benchmark Assessment Results .................................................................. xi
1.1.2 Discussion and Recommendations .................................................................................. xiv
2.0 REDUCE PER-CAPITA ENERGY CONSUMPTION IN THE DISTRICT OF COLUMBIA (CAEA §201(D)(1)) ............................................................................................................................................ 1
2.1 Description ................................................................................................................................. 1
2.2 General Approach and Historical Realization Rates ................................................................... 2
2.3 Verified Results .......................................................................................................................... 5
2.4 Performance Benchmark Assessment ....................................................................................... 5
2.4.1 Summary ........................................................................................................................... 6
2.4.2 Assessment ....................................................................................................................... 6
2.5 Energy Savings Acquisition Cost Comparisons .......................................................................... 6
2.5.1 Electricity Acquisition Cost, Excluding Renewable Energy................................................. 7
2.5.2 Natural Gas Acquisition Cost, Excluding Renewable Energy ........................................... 10
2.6 Conclusion ............................................................................................................................... 11
3.0 INCREASE RENEWABLE ENERGY GENERATING CAPACITY IN THE DISTRICT OF COLUMBIA (CAEA §201(D)(2)) .......................................................................................................... 13
3.1 Description ............................................................................................................................... 13
3.2 Verified Results ........................................................................................................................ 13
3.3 Evaluation and Verification Approach ....................................................................................... 13
3.4 Performance Benchmark Assessment ..................................................................................... 14
3.4.1 Background ..................................................................................................................... 14
3.4.2 Assessment ..................................................................................................................... 15
3.4.3 Conclusion ...................................................................................................................... 16
4.0 REDUCE GROWTH OF PEAK DEMAND IN THE DISTRICT OF COLUMBIA (CAEA §201(D)(3)) ............................................................................................................................................................ 17
4.1 Description ............................................................................................................................... 17
4.2 Verified Results and Approach ................................................................................................. 17
4.3 Performance Benchmark Assessment ..................................................................................... 18
4.3.1 Background and Assessment .......................................................................................... 18
4.3.2 Assessment ..................................................................................................................... 18
4.3.3 Conclusion ...................................................................................................................... 18

iv
Evaluation of the DCSEU Performance Benchmarks—FY2016 Annual Evaluation Report (Final Draft). June 28, 2017
5.0 IMPROVE THE ENERGY EFFICIENCY OF LOW-INCOME HOUSING IN THE DISTRICT OF COLUMBIA (CAEA §201(D)(4)) .......................................................................................................... 19
5.1 Description ............................................................................................................................... 19
5.2 Verified Results ........................................................................................................................ 19
5.3 Verified Results and Approach ................................................................................................. 20
5.4 Performance Benchmark Assessment ..................................................................................... 21
5.4.1 Background ..................................................................................................................... 21
5.4.2 Assessment Results ........................................................................................................ 21
5.4.3 Conclusion ...................................................................................................................... 22
6.0 REDUCE THE GROWTH OF ENERGY DEMAND OF THE DISTRICT OF COLUMBIA’S LARGEST ENERGY USERS (CAEA § 201(D)(5)) .............................................................................. 23
6.1 Description ............................................................................................................................... 23
6.2 Verified Results and Approach ................................................................................................. 23
6.2.1 Detailed Results .............................................................................................................. 24
6.2.2 Conclusion ...................................................................................................................... 24
7.0 INCREASE THE NUMBER OF GREEN-COLLAR JOBS IN THE DISTRICT OF COLUMBIA (CAEA § 201 (D)(6)) ............................................................................................................................ 25
7.1 Description ............................................................................................................................... 25
7.2 Verified Results and Approach ................................................................................................. 25
7.3 Performance Benchmark Assessment ..................................................................................... 27
7.3.1 Background ..................................................................................................................... 27
7.3.2 Assessment Result .......................................................................................................... 27
7.3.3 Conclusion ...................................................................................................................... 27
8.0 COST-EFFECTIVENESS ASSESSMENT ..................................................................................... 28
8.1 Verified Results ........................................................................................................................ 28
8.2 Societal Cost Test Analysis ...................................................................................................... 28
8.3 Societal Cost Test Model, Assumptions, and Adders ............................................................... 30
8.3.1 Societal Cost Test Assumptions ...................................................................................... 31
8.3.2 Environmental Adders Used in the DCSEU Societal Cost Test ....................................... 35
8.3.3 Other Adders Used in the DCSEU Societal Cost Test ..................................................... 36
8.3.4 Conclusion ...................................................................................................................... 36

v
Evaluation of the DCSEU Performance Benchmarks—FY2016 Annual Evaluation Report (Final Draft). June 28, 2017
LIST OF TABLES
Table 1-1. FY2016 Performance Benchmarks ....................................................................................... xi
Table 1-2. FY2016 DCSEU Performance Benchmarks Verification Summary ..................................... xiii
Table 2-1. DCSEU Historical Realization Rates ..................................................................................... 2
Table 2-2. Historical Realization Rates for DCSEU Tracks PY2013–PY2015 ........................................ 4
Table 2-3. FY2016 Per Capita Energy Consumption Results Summary ................................................. 5
Table 2-4. Energy Savings Benchmark Evaluation Results .................................................................... 6
Table 2-5. DCSEU, Pennsylvania, and Maryland Expenditures and MWh Savings Comparison ............ 9
Table 2-6. Portfolio Level Acquisition Costs FY2012 through FY2016 for DCSEU and the Region ........ 9
Table 2-7. Portfolio Level DCSEU Acquisition Costs per MMBtu for FY2012–FY2016 ......................... 10
Table 3-1. FY2016 Renewable Energy Generation Capacity Cost Results Summary .......................... 13
Table 3-2. Verified Renewable Energy Initiatives Total Acquisition Cost per kWh ................................ 15
Table 3-3. Verified Non-Administrative Renewable Energy Initiatives Acquisition Cost per kWh .......... 16
Table 4-1. Peak Demand Reduction Results Summary—FY2016........................................................ 17
Table 5-1. Low-Income Housing Results Summary—FY2016 .............................................................. 20
Table 5-2. Low-Income Spend—Actual vs. Adjusted ........................................................................... 21
Table 6-1. District Largest Energy Users Verification Summary—FY2016 ........................................... 24
Table 6-2. Summary of Large User Projects—FY2016 ........................................................................ 24
Table 7-1. Green-Collar Jobs Summary—FY2016 ............................................................................... 26
Table 8-1. Societal Cost Test Comparison ........................................................................................... 30
Table 8-2. Benefits and Costs Included in the DCSEU SCT................................................................. 31
Table 8-3. Societal Cost Test Benefits Assumptions and Sources ....................................................... 31
Table 8-4. Electric Energy Cost in 2015 Dollars ($/kWh) ...................................................................... 33
Table 8-5. Electric Power Cost in 2015 Dollars .................................................................................... 33
Table 8-6. Natural Gas Cost in 2015 Dollars ........................................................................................ 33
Table 8-7. Other Fuels Costs in 2015 Dollars ($/MMBtu) ..................................................................... 34
Table 8-8. Fossil Fuel Externality Values FY2016 in 2016 Dollars ....................................................... 35

vi
Evaluation of the DCSEU Performance Benchmarks—FY2016 Annual Evaluation Report (Final Draft). June 28, 2017
LIST OF FIGURES
Figure 2-1. Total Electric Savings Acquisition Costs: FY2012–FY2016 Verified and FY2017 Budget at Generator Level ..................................................................................................................................... 8
Figure 2-2. Total Gas Saving Acquisition Costs: FY2012–FY2016 Actual and FY2017 Budget ........... 11
APPENDICES
APPENDIX A: APPENDIX A DCSEU QUALITY ASSURANCE AND ON-SITE M&V COORDINATION PILOT (PILOT) ........................................................................................................ 37

vii
Evaluation of the DCSEU Performance Benchmarks—FY2016 Annual Evaluation Report (Final Draft). June 28, 2017
ACKNOWLEDGEMENTS
This evaluation effort was performed by Tetra Tech, with Leidos, and Baumann Consulting assisting with the on-site verification performed during Fiscal Year 2016, under the leadership of Tetra Tech.
This effort was supported by the provision of project data in the form of Knowledge Information Transfer Tool data extracts, review of historical evaluation results, the DCSEU Technical Reference Manual, and memos, staff discussions, and responses to other requests for data and information by DOEE, DCSEU, and VEIC Evaluation, Measurement, and Verification Services group.
The evaluation team thanks DOEE, DCSEU, and VEIC teams for their timely and thorough responses to all data requests and follow-up questions. In particular, we thank Robert Stephenson, VEIC EM&V Services Group, for his support and responses to the many questions from the evaluation team as we conducted our impact evaluation activities.
The table below displays the role of each lead evaluation team member and report content contributor.
Evaluation Firm Staff Lead Role
Tetra Tech Richard Hasselman Project manager
Kendra Scott Historical realization rate analysis
Lisa Stefanik Low-income performance benchmark lead
Dan Belknap Retail products, cost-effectiveness, and data management lead
Denise Rouleau Renewable energy, acquisition cost, and green jobs lead
Baumann Consulting Jonathan Lemmond Impact evaluation—on-site verification lead

viii
Evaluation of the DCSEU Performance Benchmarks—FY2016 Annual Evaluation Report (Final Draft). June 28, 2017
ACRONYMS/ABBREVIATIONS
General Abbreviations and Acronyms
Acronyms/Abbreviations Definition
ACEEE American Council for an Energy-Efficient Economy
AESC Avoided Energy Supply Component
AMI Area median income
Btu British thermal unit
CA SPM California Standard Practice Manual
CAEA Clean and Affordable Energy Act of 2008
DCSEU District of Columbia Sustainable Energy Utility
DDOE District Department of the Environment
DOEE Department of Energy and Environment
EISA Energy Independence and Security Act of 2007
EM&V Evaluation, measurement, and verification
FERC Federal Energy Regulatory Commission
FHLB Federal Home Loan Bank
FTE Full time equivalent
FY Fiscal year
KITT Knowledge Information Transfer Tool
kW Kilowatt
kWh Kilowatt hour
LI Low-income
LIMF Low-income Multifamily
MW Megawatt
M&V Measurement and verification
Mcf 1,000 cubic feet
MF Multifamily
MMBtu 1 million Btu
NTG Net-to-gross
PJM Pennsylvania New Jersey Maryland
PV Photovoltaic
QA Quality Assurance
REDF Renewable Energy Development Fund
SAPP Solar Advantage Plus Program
ix
Evaluation of the DCSEU Performance Benchmarks—FY2016 Annual Evaluation Report (Final Draft). June 28, 2017
Acronyms/Abbreviations Definition
SCT Societal cost test
SETF Sustainable Energy Trust Fund
SREC Solar renewable energy certificate
TRM Technical reference manual
VEIC Vermont Energy Investment Corporation
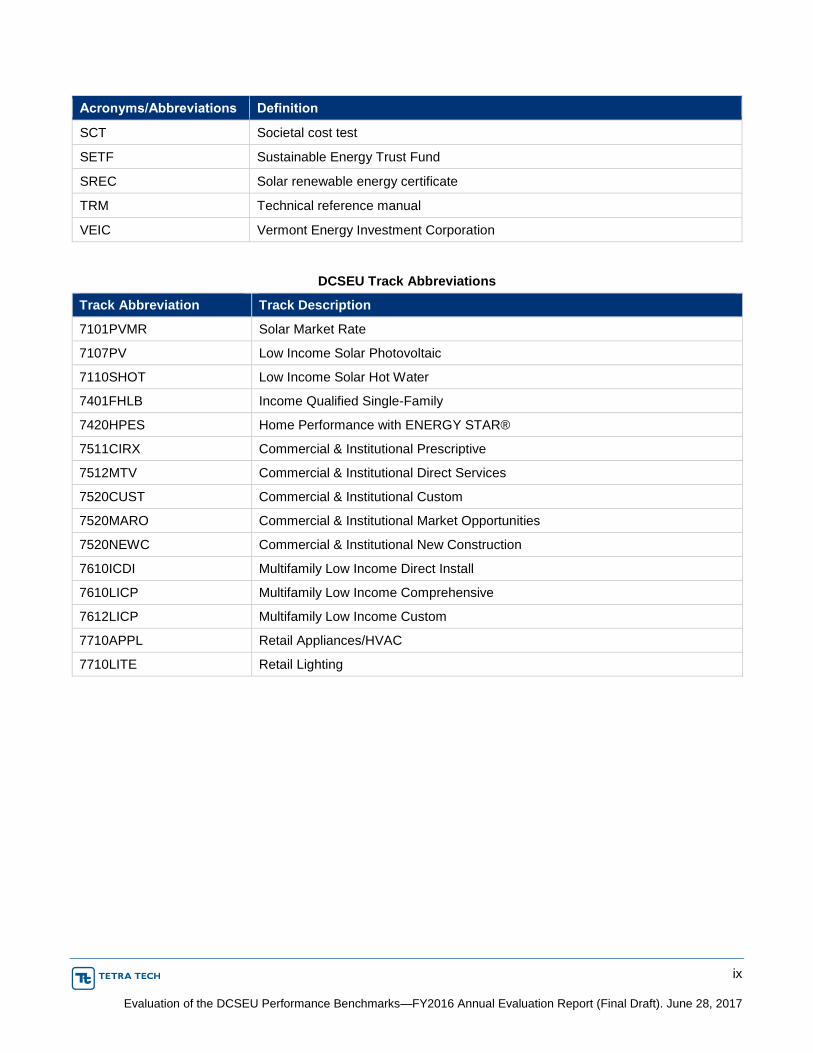
DCSEU Track Abbreviations
Track Abbreviation Track Description
7101PVMR Solar Market Rate
7107PV Low Income Solar Photovoltaic
7110SHOT Low Income Solar Hot Water
7401FHLB Income Qualified Single-Family
7420HPES Home Performance with ENERGY STAR®
7511CIRX Commercial & Institutional Prescriptive
7512MTV Commercial & Institutional Direct Services
7520CUST Commercial & Institutional Custom
7520MARO Commercial & Institutional Market Opportunities
7520NEWC Commercial & Institutional New Construction
7610ICDI Multifamily Low Income Direct Install
7610LICP Multifamily Low Income Comprehensive
7612LICP Multifamily Low Income Custom
7710APPL Retail Appliances/HVAC
7710LITE Retail Lighting

x
Evaluation of the DCSEU Performance Benchmarks—FY2016 Annual Evaluation Report (Final Draft). June 28, 2017
1.0 EXECUTIVE SUMMARY
The District of Columbia Department of Energy and Environment (DOEE) contracted with Tetra Tech to provide evaluation, measurement, and verification (EM&V) of the portfolio of energy efficiency and renewable energy programs, or initiatives, offered in the District of Columbia (DC), along with six performance benchmarks associated with these initiatives. The initiatives are implemented through the DC Sustainable Energy Utility (DCSEU) partnership.
The Clean and Affordable Energy Act of 2008 (CAEA) requires the Mayor, through DOEE, to contract with a private entity to conduct sustainable energy programs on behalf of the District of Columbia. The CAEA authorizes the creation of a Sustainable Energy Utility (SEU) and designates the SEU to be the one-stop resource for energy efficiency and renewable energy services for District residents and businesses.
The DCSEU is led by the Sustainable Energy Partnership and under contract to DOEE. The Sustainable Energy Partnership includes the following organizations:1
Vermont Energy Investment Corporation (VEIC)—Partnership Lead
George L. Nichols & Associates
Groundswell
Institute for Market Transformation
Nextility
PEER Consultants.
The SEU Advisory Board provides monitoring of the DCSEU and advice to DOEE and the Council of the District of Columbia according to the Bylaws of the Sustainable Energy Utility Advisory Board (“Board”) adopted pursuant to Section 204(b) of the Clean and Affordable Energy Act (“Act”)2, Article 1, Section 1.2.
“In accordance with the Clean and Affordable Energy Act of 2008, D.C. Official Code § 8-1774.03, the Board shall: (a) Provide advice, comments, and recommendations to the Department of Energy and Environment (“DOEE”) and Council of the District of Columbia (“Council”) regarding the procurement and administration of the Sustainable Energy Utility (hereinafter referred to as the “SEU”) contract described in sections 201 and 202 of the Act; (b) Advise DOEE on the performance of the SEU under the SEU contract; and, (c) Monitor the performance of the SEU under the SEU contract. Section 203(a) of the Act.”
The DCSEU began implementing energy efficiency and renewable energy programs in fiscal year 2011.
Sections two through seven of this report summarize the EM&V of the six benchmarks (four performance benchmarks and two tracking benchmarks) included within DOEE’s contract with the DCSEU for fiscal year (FY) 2016. The benchmarks are listed in Table 1-1. Section eight provides a FY2016 portfolio and track-level cost-effectiveness analysis. In addition, Appendix A describes evaluation activity that took place in the spring and summer of 2016 to test the potential for dynamic 1 DC Sustainable Energy Utility 2015 Annual Report, page 36. 2 SEU Advisory Board Bylaws, http://green.dc.gov/page/seu-advisory-board-bylaws.

xi
Evaluation of the DCSEU Performance Benchmarks—FY2016 Annual Evaluation Report (Final Draft). June 28, 2017
sampling and site visits to enhance the evaluation’s use of site verification while also reducing participant burdens.
Table 1-1. FY2016 Performance Benchmarks
Item Benchmark
1a Reduced per-capita energy consumption—electricity
1b Reduced per-capita energy consumption—gas
2 Increase renewable energy generation capacity
3* Reduce growth in peak demand*
4 Improve energy efficiency in low-income housing
5* Reduce growth in energy demand of largest users*
6 Increase number of green-collar jobs
* Tracking metric only.
The FY2016 performance benchmark evaluation approach differs from that of prior years. In prior years, the Tetra Tech team conducted a detailed impact evaluation of each year’s portfolio, developing energy and demand savings realization rates. These realization rates were directly used to inform the performance benchmark results. For FY2016, the last year of the implementer’s contract, DOEE elected to forgo the impact evaluation and redirect funds to DCSEU program implementation. As the portfolio and its approach has been relatively consistent since FY2012, the evaluation of the performance benchmarks leverages the rich dataset of past evaluation results.
DOEE determined that the performance benchmarks related to energy and demand savings would be informed by the lowest historical portfolio realization rates determined by the FY2013 through FY2015 evaluation and be applied to the FY2016 gross tracked savings. This conservative approach avoids overstating performance benchmark results.
As additional information and perspective on the portfolio level result, Tetra Tech has provided the historical track-level realization rates, applying them at the track level, with two exceptions. Tetra Tech conducted an evaluation of the retail product tracks (appliances and upstream lighting) using the DCSEU technical reference manual (TRM). Although not used for directly evaluating the performance benchmarks, the evaluation of these tracks are used in the presentation of the track-level performance information.
1.1 KEY FINDINGS AND RECOMMENDATIONS
In FY2016, the DCSEU continued to make progress on performance benchmark achievement, with all six of the benchmarks achieved at either the highest level or exceeding the minimum threshold. The DCSEU exceeded the minimum performance targets for the electric and natural gas energy savings benchmark for the third time (FY2014 was the first year this occurred).
1.1.1 Performance Benchmark Assessment Results
The results of the evaluation team’s verification of the six performance benchmarks are summarized below and detailed in Table 1-2. Two of the benchmarks are treated as “tracking” benchmarks per the FY2016 DCSEU contract. These are Benchmark 3: Reduce the growth in peak demand (kW) and Benchmark 5: Reduce growth in energy demand of largest users. The benchmarks are differentiated

xii
Evaluation of the DCSEU Performance Benchmarks—FY2016 Annual Evaluation Report (Final Draft). June 28, 2017
between those used to score the DCSEU’s incentivized compensation and those used for purposes of only tracking performance.
Compensated Performance Benchmark Targets Achieved or Exceeded
Benchmark 1a. Reduce per-capita energy consumption—electricity (MWh). The DCSEU achieved 145 percent of the minimum performance benchmark threshold and achieved 72 percent of the maximum performance target for this benchmark.
Benchmark 1b. Reduce per-capita energy consumption—natural gas (Mcf). The DCSEU achieved 164 percent of the minimum performance benchmark threshold and achieved 37 percent of the maximum performance target for this benchmark.
Benchmark 2. Increase renewable energy generating capacity: cost per kWh reduction from prior year (percentage). The DCSEU renewable energy cost per kWh decreased by 18 percent over FY2015 costs, meeting its 10 percent reduction performance benchmark target but falling slightly short of meeting the maximum performance benchmark target of 20 percent.
Benchmark 4. Improve energy efficiency in low-income housing: 30 percent spend ($).The DCSEU exceeded its minimum performance target, achieving 147 percent of the minimum target, and nearly met the maximum target, achieving 98 percent the maximum performance target.
Benchmark 6. Increase number of green-collar jobs: green-job hours directly worked by District residents (FTE). The DCSEU reached 119 percent of the maximum performance target for this benchmark.
Tracking Performance Benchmark Targets Achieved or Exceeded
Benchmark 3. Reduce growth in peak demand (kW). Tetra Tech verified 8,917 kW.
Benchmark 5. Reduce growth in energy demand of largest users: number of projects completed with a square footage > 200,000. Tetra Tech verified 132 unique sites over 200,000 square feet with FY2016 projects.

xiii
Evaluation of the DCSEU Performance Benchmarks—FY2016 Annual Evaluation Report (Final Draft). June 28, 2017
Table 1-2. FY2016 DCSEU Performance Benchmarks Verification Summary
Benchmark Number Description Metric Unit
Benchmark Minimum
Benchmark Maximum
FY2016 Reported
FY2016 Verified
Minimum Performance
Target Achieved
Maximum Performance
Target Achieved
Compensated Performance Benchmarks
1a Reduce per-capita consumption — Electricity
MWh 51,845 103,690 79,796 74,983 Yes (145%) No (72%)
1b Reduce per-capita consumption — Natural gas
Mcf 61,521 273,428 106,193 100,900 Yes (164%) No (37%)
2 Increase renewable energy generating capacity
Cost / kWh 10% 20% 18% 18% Yes (180%) No (90%)
4 Improve energy efficiency in low-income housing
Percent of annual budget $3,520,000 $5,280,000 $5,243,647 $5,187,757 Yes (147%) No (98%)
6 Increase number of green collar jobs
Green job FTE's directly worked by DC residents, earning at least a Living Wage
53 88 88 104.5 Yes (197%) Yes (119%)
Additional Tracking Performance Benchmarks
3 Reduce growth in peak demand
kW N/A N/A 9,695 8,917 N/A N/A
5 Reduce growth in energy demand of largest users
# of projects completed with > 200,000 sq. ft.
N/A N/A 94 132 N/A N/A

xiv
Evaluation of the DCSEU Performance Benchmarks—FY2016 Annual Evaluation Report (Final Draft). June 28, 2017
1.1.2 Discussion and Recommendations
From the assessment of the DCSEU’s FY2016 performance benchmarks, Tetra Tech identified several themes, based partly on the trends from FY2013 through FY2016, and partly on the results of FY2016 itself.
1.1.2.1 Cost-Effectiveness
Program cost-effectiveness is one area for further research or monitoring. While the DCSEU portfolio remains highly cost effective, FY2016 saw a decrease in cost-effectiveness from PY2015. Despite the drop, total verified savings in FY2016 increased by approximately 40 percent for kWh and 12 percent for natural gas. The DCSEU continued to deliver a cost-effective portfolio, with a cost-benefit ratio of 2.70 for the fully-loaded cost scenario under the Societal Benefit Test.3 However, in future years, with less “low-hanging fruit” and changes to baselines (particularly lighting), DOEE and DCSEU should continue to monitor the trends. Changes to program tracks and the contributing energy saving measures can be expected to affect cost-effectiveness from year to year. With a maturing portfolio and shifts in the market, the portfolio may also need to adapt in order to maintain cost-effectiveness. That said, the DCSEU has shown a record of meeting many performance targets that other energy efficiency programs do not. Green jobs, renewable energy, and low-income spending requirements are not often part of energy efficiency portfolios. That DCSEU has met these benchmarks while maintaining a highly cost-effective portfolio and showing acquisition costs similar to other portfolios suggests that they can continue to do so into the future.
1.1.2.2 Acquisition Costs
Starting in FY2012, DCSEU was able to drive down electricity and natural gas savings acquisition costs for two consecutive years of implementation. In FY2015, that trend shifted to an increase in acquisition costs for both MMBtu and MWh. For electricity, the increase in FY2015 was in line with data from other neighboring states. National studies suggest that more mature programs experience a rise in acquisition costs. However, in FY2016, the acquisition costs for electricity savings declined again, though continued to increase for natural gas. The return to electricity acquisition cost declines may have been driven by a more comprehensive set of program offerings started in FY2015, that are now bearing fruit. Natural gas acquisition cost increases may be reflecting the challenge that low natural gas prices have on driving energy efficiency investments in natural gas savings, requiring greater program effort to achieve the savings levels. Both trends are worth tracking over time, with a potential need to rebalance benchmarks or cost expectations should the trends continue.
1.1.2.3 Renewable Energy
In FY2016 (and prior years), the low-income renewables and market-rate renewable tracks utilized year-on-year cost reduction as the performance metric. Solar thermal and solar Photovoltaic (PV) technologies have differing cost trends in the market, with solar PV continuing cost declines for both hard costs (equipment) and soft costs (marketing, permitting, and labor). While the solar PV and solar thermal market costs are largely outside of the DCSEU’s control, other components of the initiative’s expenditures (e.g., administrative costs and incentives) or program efforts to reduce market costs, may
3 Includes the cost of the third-party independent evaluation as well as the effect of the realization rates
determined through the evaluation effort and estimated free-ridership and spillover (net-to-gross estimates).
xv
Evaluation of the DCSEU Performance Benchmarks—FY2016 Annual Evaluation Report (Final Draft). June 28, 2017
offer further opportunity to reduce acquisition costs depending on the market and the customers’ receptivity. To facilitate understanding the source of cost reductions and differentiate between solar hot water and solar PV technology, Tetra Tech recommends tracking both costs and savings for solar PV and solar thermal technologies separately, though continuing to combine the end-results in an overall performance benchmark metric.
1.1.2.4 Conclusion
Due to the reduced level of effort for evaluating the FY2016 portfolio, the assessment of performance benchmarks did not lead to additional specific recommendations. The use of historical realization rates is reasonable for the time period at the end of a major contract cycle. However, it limits the ability of the evaluation to offer additional input that differs from past years. The central conclusion is that even with using the lowest historical portfolio realization rates, the DCSEU continues to perform and meet the benchmark goals for energy savings. For all the other benchmarks, the evaluation followed a similar approach as in past years, with the DCSEU continuing to meet the District’s goals for the program.
1
Evaluation of the DCSEU Performance Benchmarks—FY2016 Annual Evaluation Report (Final Draft). June 28, 2017
2.0 REDUCE PER-CAPITA ENERGY CONSUMPTION IN THE DISTRICT OF COLUMBIA (CAEA §201(D)(1))
2.1 DESCRIPTION
The DCSEU is charged with reducing energy consumption in the District of Columbia for both electricity and natural gas. For FY2016, the maximum performance target was set as an annual reduction equivalent to 0.85 percent of the weather-normalized total 2009 electricity and natural gas use. The minimum performance target was set as 50 percent of the maximum performance target for electricity savings, and 22.5 percent of the maximum performance target for natural gas savings. Per DCSEU contract, modification seven4, the implementer must achieve the minimum target for both electricity and natural gas to be eligible for an incentive payment:
“Beginning in option year 3 of the SEU contract, the Contractor shall develop and implement renewable energy and energy efficiency programs for electricity and natural gas users that directly lead to an annual reduction equivalent to 0.85% of the weather-normalized total electricity consumption in the District for 2009 and an annual reduction equivalent to 0.85% of the weather-normalized natural gas consumption in the District for 2009.5
If the SEU implements energy efficiency programs that cause customers to switch how equipment or and application is powered (i.e., from electricity to natural gas or from natural gas to electricity), any increase in the kWh or therms as a result of the switch would be counted as ‘negative savings’ towards the relevant benchmark. For example, if an energy efficiency program causes a consumer to replace an electric heat pump with a natural gas furnace, then the increase in the consumption of therms as a result of the switch to using natural gas for space heating would be counted as negative savings toward the therm savings benchmark while the reduction in kWh from the no longer using electricity for space heating would be counted as ‘positive savings’ toward the kWh savings benchmark. Similarly, if an energy efficiency program causes a consumer to replace natural gas furnace with a heat pump, then the increase in the consumption of kWh as a result of the switch to electricity for space heating would be counted as negative savings toward the kWh savings benchmark while the reduction in therms from no longer using natural gas for space heating would be counted as positive savings toward the therms savings benchmark.
For any SEU energy efficiency program that causes customers to switch how equipment or an application is powered (i.e., from electricity to natural gas or from natural gas to electricity), kWh and therms savings shall be converted to BTUs, in accordance with the total fuel cycle methodology used by the U.S. Department Environmental Information Agency data for the District of Columbia, for the purpose of calculating the Societal Benefit Test.
The SEU shall use gross verified natural gas savings as the claimed savings towards the annual reduction in weather-normalized total natural gas consumption in the District for 2009. Energy and demand savings measure the amount of energy and demand saved as a result of the SEU
4 Contract Number DDOE-2010-SEU-0001, Amendment /Modification No. M07. 5 For FY2014, the electricity and natural gas savings targets were adjusted from 1.0 percent to 0.85 percent of the
weather-normalized total electricity consumption in the District for 2009 and an annual reduction equivalent to 0.85 percent of the weather-normalized natural gas consumption in the District for 2009.

2
Evaluation of the DCSEU Performance Benchmarks—FY2016 Annual Evaluation Report (Final Draft). June 28, 2017
programs without the inclusion of the facility heating and cooling interactive effects whether they are gas or electric.”
While a contract modification was not officially executed, a policy change was authorized by DOEE and implemented by DCSEU in FY2015 specific to how the interactive effects would be accounted for in reported savings. The policy change was detailed in two memos by VEIC dated June 12, 2015, and January 7, 2016. The change moved from excluding all interactive effects from the reported energy savings to including like-fuel interactive effects and continuing to exclude cross-fuel interactive effects.
2.2 GENERAL APPROACH AND HISTORICAL REALIZATION RATES
For FY2016, the realization rates used to develop the performance benchmark results were determined by utilizing the lowest portfolio-level historical evaluation results from FY2013 through FY2015. A realization rate is the proportion of evaluated savings relative to the tracking system savings. The FY2013 through FY2015 evaluations calculated realization rates by sampling projects and end-uses at a track level, and developing verified savings for the sample and a subsequent realization rate. The track-level realization rate is then applied to the total set of track-level savings. The verified track level savings are then summed to arrive at portfolio-level savings and a subsequent portfolio-level realization rate.
Tracking and calculation differences between claimed and verified results are common. The realization rates for the DCSEU have historically been in a narrow range, which means the DCSEU’s claimed energy savings have been a close match to evaluated energy savings. Tetra Tech utilized the historical DCSEU portfolio-level realization rates of the prior three years’ impact evaluations to assess the electricity and natural gas savings driven by the installation of energy efficiency measures. For both electricity and natural gas, the lowest historical realization rate for each was used to adjust the reported savings. Table 2-1 presents the historical and lowest portfolio level realization rates. The peak demand (kW) realization rate, not related to the kWh and Mcf benchmarks, is included for comprehensiveness.
Table 2-1. DCSEU Historical Realization Rates
Metric FY2013 FY2014 FY2015 Lowest
kWh 1.04 0.98 0.94 0.94
kW 1.07 0.92 1.19 0.92
MMBtu 1.00 1.00 1.08 1.00
The approach to using the lowest past realization rate is inherently conservative and reflects a practical alternative to not conducting an impact evaluation for FY2016. The approach implies that the past results are a reflection of the FY2016 results—a reasonable assumption for a single program year that operated similarly to the historical portfolio. These realization rates were then applied to the savings that Tetra Tech verified through the Knowledge Information Transfer Tool (KITT) reported savings. Minor differences between the DCSEU and Tetra Tech do exist between the tracked savings and aggregate results. As the aggregate results are based on individual projects being summed together, Tetra Tech assumes that the minor differences are the result of accumulated rounding differences. Regardless, Tetra Tech applied the realization rates to the FY2016 savings identified by Tetra Tech and did not use the aggregate results reported by the DCSEU.

3
Evaluation of the DCSEU Performance Benchmarks—FY2016 Annual Evaluation Report (Final Draft). June 28, 2017
The DCSEU’s performance benchmarks for reported and verified electric savings (kWh) and demand reduction (kW) results are adjusted for line losses (8 percent and 6 percent, respectively) to express savings as net at the electric generator rather than at the customer meter.6
Electricity savings, net at generator = 1.08 * kWhKITT/verified
Demand savings, net at generator = 1.06 * kWKITT/verified
In addition, the energy savings and demand for the low-income renewable energy measures are increased by an additional 15 percent to account for assumed spillover.7 For the low-income solar tracks (7107PV and 7110SHOT) and solar projects recorded in other low-income energy efficiency tracks, the project savings are multiplied by the line loss factor and an additional 1.15 to arrive at final renewable energy savings, net at the generator.
Solar electric savings at generator = 1.08 * 1.15 * kWhKITT/verified
Solar demand savings at generator = 1.06 * 1.15 * kWKITT/verified
The gas savings results are converted from MMBtu as reported in KITT to Mcf according to the following equation:
1 Mcf = 1.025 * MMBtu
This equation is in error, with MMBtu savings being converted to Mcf savings by the following equation, which the Tetra Tech team used for evaluating the Mcf performance benchmark:
1 Mcf = MMBtu / 1.0258
The equation error identified by Tetra Tech only affects the conversion of MMBtu savings to Mcf savings for the performance benchmark calculation. The equation error does not affect the realization rate of gross energy savings calculations, acquisition cost analysis, or cost-effectiveness calculations as those results are based on equations that rely on the underlying MMBtu savings, not Mcf.
6 DCSEU provided Tetra Tech with the line loss factors, which have been consistent since at least the FY2013
evaluation. The source was reported to Tetra Tech as being developed in a PEPCO study. The values are within a general industry range and have not been independently reviewed or verified. The line loss assumptions used by the DCSEU are different from the assumption used by the District for purposes of its own energy and climate inventories. The District utilizes the Environmental Protection Agency’s eGrid data per greenhouse gas report protocols, which reference an assumed line loss of 4.97 percent for the Eastern interconnection region.
7 Reference DCSEU memorandum to DDOE and Tetra Tech, Screening assumptions for the DCSEU solar renewable energy program portfolio, dated January 7, 2015.
8 The conversion factor 1.025 describes the heat content of a volume of natural gas. The U.S. Energy Information Administration (EIA) publishes annual conversion factors which vary from year to year, while individual utilities may or may not publish their own data. For example, in 2016, the EIA indicated that the average heat content of natural gas was 1.032 MMBTU per Mcf, while in 2017 it was 1.037 MMBTU per Mcf (https://www.eia.gov/tools/faqs/faq.cfm?id=45&t=8). Columbia Gas of Pennsylvania presents the heat content as “approximately” 1,020 BTU per cf (http://help.columbiagaspa.com/app/answers/detail/a_id/296/related/1/session/L2F2LzEvdGltZS8xNDk4NDkwMTIyL3NpZC9YbUMzQzVtbg%3D%3D), while a general industry energy conversion directory utilizes 1.025 (the inverse of 0.9756; see: https://business.directenergy.com/understanding-energy/energy-tools/conversion-factors). The heat content of a volume of natural gas varies due to the mix of additional hydrocarbons (e.g., ethane, propane, butane) that can be present in varying quantities. 1.025 is a general average conversion factor used for purposes of the DCSEU energy calculations.
4
Evaluation of the DCSEU Performance Benchmarks—FY2016 Annual Evaluation Report (Final Draft). June 28, 2017
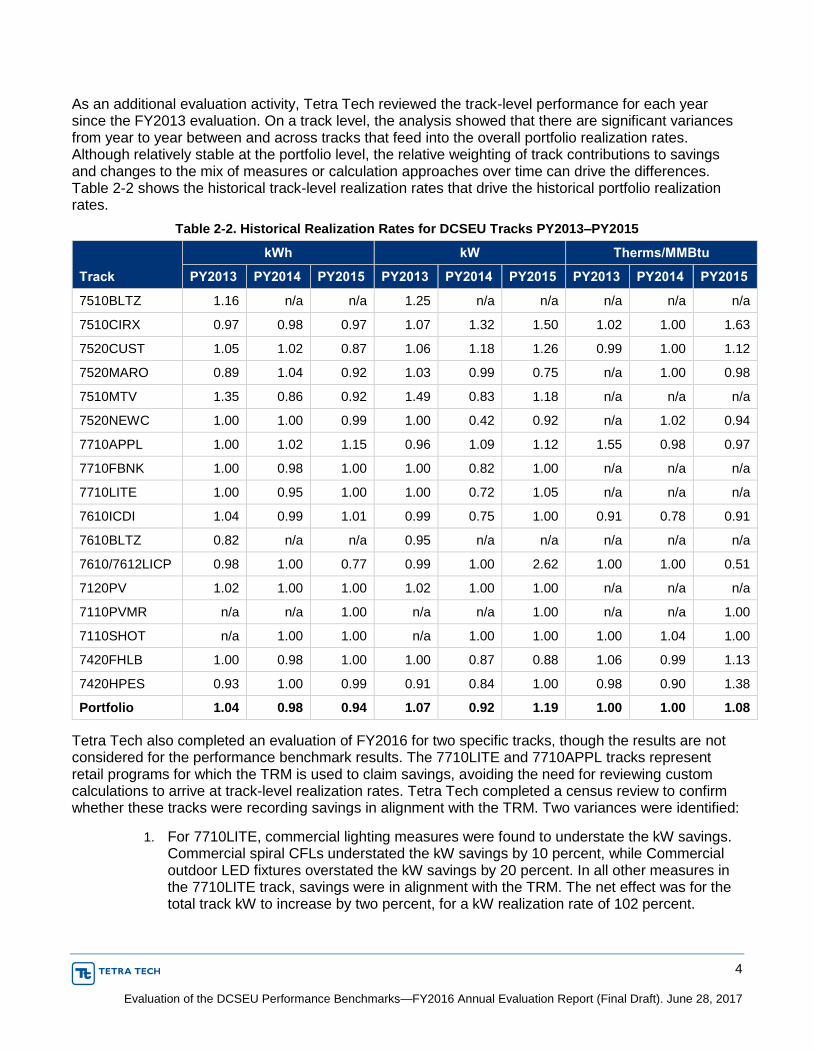
As an additional evaluation activity, Tetra Tech reviewed the track-level performance for each year since the FY2013 evaluation. On a track level, the analysis showed that there are significant variances from year to year between and across tracks that feed into the overall portfolio realization rates. Although relatively stable at the portfolio level, the relative weighting of track contributions to savings and changes to the mix of measures or calculation approaches over time can drive the differences. Table 2-2 shows the historical track-level realization rates that drive the historical portfolio realization rates.
Table 2-2. Historical Realization Rates for DCSEU Tracks PY2013–PY2015
Track
kWh kW Therms/MMBtu
PY2013 PY2014 PY2015 PY2013 PY2014 PY2015 PY2013 PY2014 PY2015
7510BLTZ 1.16 n/a n/a 1.25 n/a n/a n/a n/a n/a
7510CIRX 0.97 0.98 0.97 1.07 1.32 1.50 1.02 1.00 1.63
7520CUST 1.05 1.02 0.87 1.06 1.18 1.26 0.99 1.00 1.12
7520MARO 0.89 1.04 0.92 1.03 0.99 0.75 n/a 1.00 0.98
7510MTV 1.35 0.86 0.92 1.49 0.83 1.18 n/a n/a n/a
7520NEWC 1.00 1.00 0.99 1.00 0.42 0.92 n/a 1.02 0.94
7710APPL 1.00 1.02 1.15 0.96 1.09 1.12 1.55 0.98 0.97
7710FBNK 1.00 0.98 1.00 1.00 0.82 1.00 n/a n/a n/a
7710LITE 1.00 0.95 1.00 1.00 0.72 1.05 n/a n/a n/a
7610ICDI 1.04 0.99 1.01 0.99 0.75 1.00 0.91 0.78 0.91
7610BLTZ 0.82 n/a n/a 0.95 n/a n/a n/a n/a n/a
7610/7612LICP 0.98 1.00 0.77 0.99 1.00 2.62 1.00 1.00 0.51
7120PV 1.02 1.00 1.00 1.02 1.00 1.00 n/a n/a n/a
7110PVMR n/a n/a 1.00 n/a n/a 1.00 n/a n/a 1.00
7110SHOT n/a 1.00 1.00 n/a 1.00 1.00 1.00 1.04 1.00
7420FHLB 1.00 0.98 1.00 1.00 0.87 0.88 1.06 0.99 1.13
7420HPES 0.93 1.00 0.99 0.91 0.84 1.00 0.98 0.90 1.38
Portfolio 1.04 0.98 0.94 1.07 0.92 1.19 1.00 1.00 1.08
Tetra Tech also completed an evaluation of FY2016 for two specific tracks, though the results are not considered for the performance benchmark results. The 7710LITE and 7710APPL tracks represent retail programs for which the TRM is used to claim savings, avoiding the need for reviewing custom calculations to arrive at track-level realization rates. Tetra Tech completed a census review to confirm whether these tracks were recording savings in alignment with the TRM. Two variances were identified:
1. For 7710LITE, commercial lighting measures were found to understate the kW savings. Commercial spiral CFLs understated the kW savings by 10 percent, while Commercial outdoor LED fixtures overstated the kW savings by 20 percent. In all other measures in the 7710LITE track, savings were in alignment with the TRM. The net effect was for the total track kW to increase by two percent, for a kW realization rate of 102 percent.

5
Evaluation of the DCSEU Performance Benchmarks—FY2016 Annual Evaluation Report (Final Draft). June 28, 2017
2. For 7710APPL, Tetra Tech found that the claimed kWh savings for heat pumps were significantly overstated. The reason was a typographical error in the underlying savings calculation used to populate the KITT database. Realization rates for the ductless mini-split and traditional air-source heat pumps were three percent and five percent, respectively. The net effect was a track-level kWh realization rate of 14 percent. This track contributed just 1.6 percent of the overall portfolio’s electricity savings, so the effect of this on the portfolio would be minimal.
While the findings from the analysis of the 7710LITE and 7710APPL tracks were shared with DOEE and DCSEU, the results were not used to develop the performance benchmark results for kWh or kW (the kW benchmark result is described in Section 4 of this report). As the historical track-level analysis shows, a track can show significant variance from year to year, with the collective variance being dampened at the portfolio level. As such, in keeping with the approach to using the lowest historical portfolio realization rate as the basis for performance benchmark analysis, Tetra Tech does not recommend incorporating the specific findings for any given track, including the analysis of the 7710LITE and 7710APPL tracks for FY2016.
2.3 VERIFIED RESULTS
The DCSEU achieved the minimum performance targets for both the electric and natural gas performance benchmarks for FY2016, but the maximum performance target has not yet been achieved for either energy metric. This is the third year in which the DCSEU portfolio has achieved both the electric and natural gas minimum targets.
Table 2-3. FY2016 Per Capita Energy Consumption Results Summary9
Metric
Minimum Performance
Target
Maximum Performance
Target FY2016
Reported FY2016 Verified
Minimum Performance Target Achieved
Maximum Performance Target Achieved
Electricity (MWh)
51,845 103,690 79,796 74,983 Yes (145%) No (72%)
Natural gas (Mcf)10
61,521 273,428 106,193 100,900 Yes (164%) No (37%)
2.4 PERFORMANCE BENCHMARK ASSESSMENT
The evaluation team’s verified results of the KITT reported electric savings and natural gas savings for the overall portfolio are presented in Table 2-4.
9 Gas and electric verified savings exclude cross-fuel lighting interactive effects. The electric data are reported at
the generator level. 10 FY2016 gas reported and verified numbers of 106,193 Mcf and 106,900 Mcf, respectively, were converted from
MMBtu to Mcf metric using a factor of 1.025.

6
Evaluation of the DCSEU Performance Benchmarks—FY2016 Annual Evaluation Report (Final Draft). June 28, 2017
2.4.1 Summary
In its fifth full year of portfolio implementation,11 the DCSEU was able to achieve the minimum performance targets for both electric and natural gas savings benchmarks. Starting in FY2014, the electricity and natural gas savings targets were adjusted from 1.0 percent to 0.85 percent of the 2009 weather-normalized total electricity consumption and an annual reduction equivalent to 0.85 percent of the 2009 weather-normalized natural gas consumption in the District.
2.4.2 Assessment
Tetra Tech based the assessment of the energy consumption reduction benchmark by multiplying the lowest historical portfolio-level realization rates for electricity and natural gas savings to the gross savings identified in the DCSEU project tracking system, with adjustments made as described in section 2.5. The results are presented in Table 2-4 below.
Table 2-4. Energy Savings Benchmark Evaluation Results
Metric FY2016
Reported
FY2016 Tracked Savings
Applied Realization
Rate FY2016 Verified
Minimum Performance Target Achieved
Maximum Performance Target Achieved
Electricity (MWh) 79,796 79,769 0.94 74,983 Yes (145%) No (72%)
Natural gas (Mcf) 106,193 100,900 1.0 100,900 Yes (164%) No (37%)
In both cases, despite utilizing the lowest historical realization rate, both electricity and natural gas energy savings benchmarks were achieved, exceeding their minimum targets. However, in both cases, the maximum target was not reached. In the case of natural gas, a further adjustment was made due to differences in the approach of converting MMBtu, the basis for natural gas energy savings, to Mcf, a volumetric measure of gas. Hence, the tracked and verified savings are adjusted. An explanation of the calculation is described above.
2.5 ENERGY SAVINGS ACQUISITION COST COMPARISONS
The energy savings acquisition cost discussion is intended to provide DOEE with analysis to inform future budget and target setting. Additionally, acquisition costs can be a useful way to compare the overall cost of operating an energy efficiency program relative to the savings being developed through the program. Although energy efficiency programs differ between jurisdictions in terms of their policy goals or requirements, delivery methods, budgets and geographic scope, comparing programs can serve as a benchmark to understand the relative costs of achieving energy savings. In the case of the DCSEU, when comparing acquisition costs to other similar programs, DCSEU’s underlying policy goals and contractual requirements are generally more expansive than in other jurisdictions. For example, the Green Jobs performance benchmark is not typical, nor is the level of focus on the low-income segment. These policy goals are noteworthy given that the DCSEU contractual obligations will likely increase the cost of acquiring energy efficiency resources for the District, though they provide additional benefits to the District.
Below we detail the electricity and natural gas acquisition costs experienced by the DCSEU in FY2016, noting trends from past years. In the analysis below, acquisition costs for the DCSEU do not include
11 The DCSEU offered quick start programs in FY2011.

7
Evaluation of the DCSEU Performance Benchmarks—FY2016 Annual Evaluation Report (Final Draft). June 28, 2017
renewable energy. The purpose of the renewable energy exclusion is to help remove the effect of renewable energy costs from the DCSEU’s result to make comparisons specific to energy efficiency between the other jurisdictions which do not incorporate renewable energy into their demand side management portfolios.
2.5.1 Electricity Acquisition Cost, Excluding Renewable Energy
The DCSEU FY2016’s acquisition cost was $167 per verified first-year MWh.12 This is a reduction of 30 percent from the FY2015 acquisition cost of $237 per MWh. The acquisition cost reduction was due to the DCSEU’s FY2016 electric spending remaining relatively flat while the MWh savings increased by 42 percent.
The FY2016 decrease followed a one year increase in acquisition costs in FY2015 that had been preceded by three consecutive years of declining MWh acquisition costs. As noted in the FY2015 performance benchmark report, if DCSEU’s FY2016 acquisitions costs had stayed roughly the same as the FY2015 acquisition costs ($232), DCSEU could feasibly have met the minimum performance benchmark target in FY2016 but it would have fallen far short of meeting the maximum performance target without a larger budget. The 30 percent reduction in the FY2016 acquisition cost is likely a contributor to the DCSEU substantially exceeding its minimum performance benchmark for electricity savings. Understanding the reasons for this downturn in acquisition costs more fully would help to provide better insight into how sustainable the FY2016 MWh acquisition cost is likely to be.
Figure 2-1 illustrates the DCSEU annual expenditures compared to the savings achieved in FY2012 through FY2016, and includes a forecast of FY2017 acquisition costs.13 As shown, acquisition costs per MWh declined from FY2012 through FY2014 year over year, moved upwards in FY2015 and declined again in FY2016.14
12 Based on verified savings adjusted for line losses and excluding renewable energy tracks. 13 The FY2017 budget excludes third-party evaluation costs. 14 Based on reported nonrenewable electric savings adjusted for line losses.

8
Evaluation of the DCSEU Performance Benchmarks—FY2016 Annual Evaluation Report (Final Draft). June 28, 2017
Figure 2-1. Total Electric Savings Acquisition Costs: FY2012–FY2016 Verified and FY2017 Budget at Generator Level15
The FY2017 acquisition cost projections are calculated using the estimated FY2017 budgeted electric expenditures (net of renewables) as provided by DCSEU.16 The FY2017 MWh performance benchmark targets of 60,878 MWh (minimum) and 86,473 MWh (maximum), as presented by DCSEU, were used in this analysis. The FY2017 analysis results determined that DCSEU could meet its minimum performance benchmark target with an acquisition cost of $223 per MWh, suggesting that there is flexibility in program costs that will allow the DCSEU to meet its minimum benchmark target, even if its current acquisition costs were to rise. It would, however, take a six percent reduction in the acquisition cost—from $167 down to $157 per MWh—to meet the FY2017 maximum performance target at current budgetary levels. Alternately, it would take an electricity program budget of $14.5 million, a 6.7 percent budget increase, to achieve the maximum performance benchmark at FY2016 acquisition costs.
Tetra Tech gathered information from Pennsylvania and Maryland to serve as comparisons to the DCSEU acquisition costs, shown below in Table 2-5. The Pennsylvania utilities and the Maryland utilities were both in their seventh year of program implementation in 2016 while DCSEU was in its fifth year of program implementation. While the analysis shows general trends, absolute dollar comparisons incorporate potential differences in policy goals, program designs, and delivery mechanisms. While Maryland utilities do not appear to have stated goals beyond the MWh or MW reduction, the Maryland Public Service Commission must consider the following factors before approving a program: the program’s cost-effectiveness, impact on rates of each ratepayer class, impacts on jobs, and impact on the environment.17 Pennsylvania utilities have low-income and govenerment/nonprofit and institutional goals.18 It is worth noting that DCSEU has different goals than those in the neighboring states that could impact the aggregate acquisition costs, such as the Green Jobs benchmark. Additionally, DCSEU’s annual budget/expenditures are significantly lower then Pennsylvania and Maryland’s budget/expenditures as illustrated Table 2-5 and should also be taken into consideration, since the fixed costs of operating a program are spread across a smaller amount of savings.
15 Expenditures are from the Gas Electric Split files provided by DCSEU from FY2012–FY2016. The expenditures
included in the acquisition cost calculation exclude spending on renewable energy initiatives. Savings are verified MWh/MMBtu as reported in the portfolio evaluation reports.
16 The FY2017 estimated overall electric budget provided by DCSEU was $14,063,334, or 80 percent of the DCSEU’s total budget. The estimated renewable energy budget of $600,000 was assumed to also be 80 percent electric expenditures ($480,000). The assumed electric budget for renewable energy was subtracted from the total electric budget, resulting in $13,583,334 to be spent on electric energy efficiency.
17 http://www.psc.state.md.us/wp-content/uploads/2016-EmPOWER-Maryland-Energy-Efficiency-Act-Standard-Report.pdf, pg 6.
18 http://www.puc.pa.gov/Electric/pdf/Act129/Act129-SWE_PhaseII_FinalAR.pdf.

9
Evaluation of the DCSEU Performance Benchmarks—FY2016 Annual Evaluation Report (Final Draft). June 28, 2017
Table 2-5 illustrates the scale of electric energy efficiency expenditures (excluding renewables) between the DCSEU, and the aggregate of Pennsylvania’s and Maryland’s utilities. Each of these two states exhibit spending levels over 20 times that of the DCSEU.
Table 2-5. DCSEU, Pennsylvania, and Maryland Expenditures and MWh Savings Comparison
Fiscal Year
DCSEU Pennsylvania Maryland
Expenditures
MWh Savings Achieved
Expenditures
MWh Savings
Achieved
Expenditures
MWh Savings
Achieved
FY2013 $11,701,339 52,059 Unavailable Unavailable $219,376,117 809,975
FY2014 $11,469,646 58,961 $167,054,044 943,662 $319,512,893 852,494
FY2015 $12,486,289 52,685 $200,781,000 1,022,680 $276,756,557 1,219,533
FY2016 $12,446,213 74,728 $228,450,000 1,397,876.85 Unavailable Unavailable
DCSEU electric budget and savings is net renewables and gas.
In comparing the electric energy savings acquisition costs for the DCSEU, Pennsylvania, and Maryland, DCSEU exhibits similar ranges, as shown in Table 2-5. While all three jurisdictions operate cost effective programs, DCSEU and Pennsylvania have shown lower acquisition costs than Maryland.
Table 2-6. Portfolio Level Acquisition Costs FY2012 through FY2016 for DCSEU and the Region
Fiscal Year DCSEU Acquisition
Cost $/MWh
Pennsylvania Acquisition Cost
$/MWh
Maryland Acquisition Cost
$/MWh
FY2012 $549 - -
FY2013 $228 - $271
FY2014 $195 $177 $375
FY2015 $237 $196 $227
FY2016 $167 $163 Unavailable
The DCSEU’s FY2016 electricity savings acquisition cost of $167 per MWh are comparable to Pennsylvania. DOEE may want to update and compare the Maryland acquisition costs when the updated EmPOWER program data becomes available. At this time, the DCSEU acquisition cost appear reasonable given that the DCSEU programs are less mature (by two years) than in Pennsylvania or Maryland, and also have additional goals described by the benchmarks in this report.
For comparison purposes, ACEEE has published several reports that provide context to the DCSEU electricity savings acquisition costs. A 2012 American Council for an Energy-Efficient Economy (ACEEE) report titled, An Empirical Model for Predicting Electric Energy Efficiency Resource Acquisition Costs in North America: Analysis and Application19, provides analysis regarding savings over time and suggests that acquisition costs should decline over the first five to six years of implementation as savings targets increase, and then begin to rise as acquisition costs increase with portfolio maturity. A 2014 ACEEE report, The Best Value for America’s Energy Dollar: A National
19 An Empirical Model for Predicting Electric Energy Efficiency Resource Acquisition Costs in North America:
Analysis and Application, John Plunkett, Theodore Love, and Francis Wyatt, Green Energy Economics Group, Inc., Summer 2012. http://www.aceee.org/files/proceedings/2012/data/papers/0193-000170.pdf.
10
Evaluation of the DCSEU Performance Benchmarks—FY2016 Annual Evaluation Report (Final Draft). June 28, 2017
Review of the Cost of Utility Energy Efficiency Programs20, provides a summary of four-year averages (2009–2012) for dollars per MWh ranging from $130 to $420 with an average of $230 per MWh. ACEEE’s most recent published data is for the 2015 State Spending and Savings Table, which shows a national average of $237 per MWh.21 DCSEU and PA in FY2016 are well below average and Maryland is at the average for FY2015. Further research may be warranted to understand the trend we are seeing in Maryland, Pennsylvania, and the District of Columbia where there is a spike in the acquisitions costs followed by a reduction.
2.5.2 Natural Gas Acquisition Cost, Excluding Renewable Energy
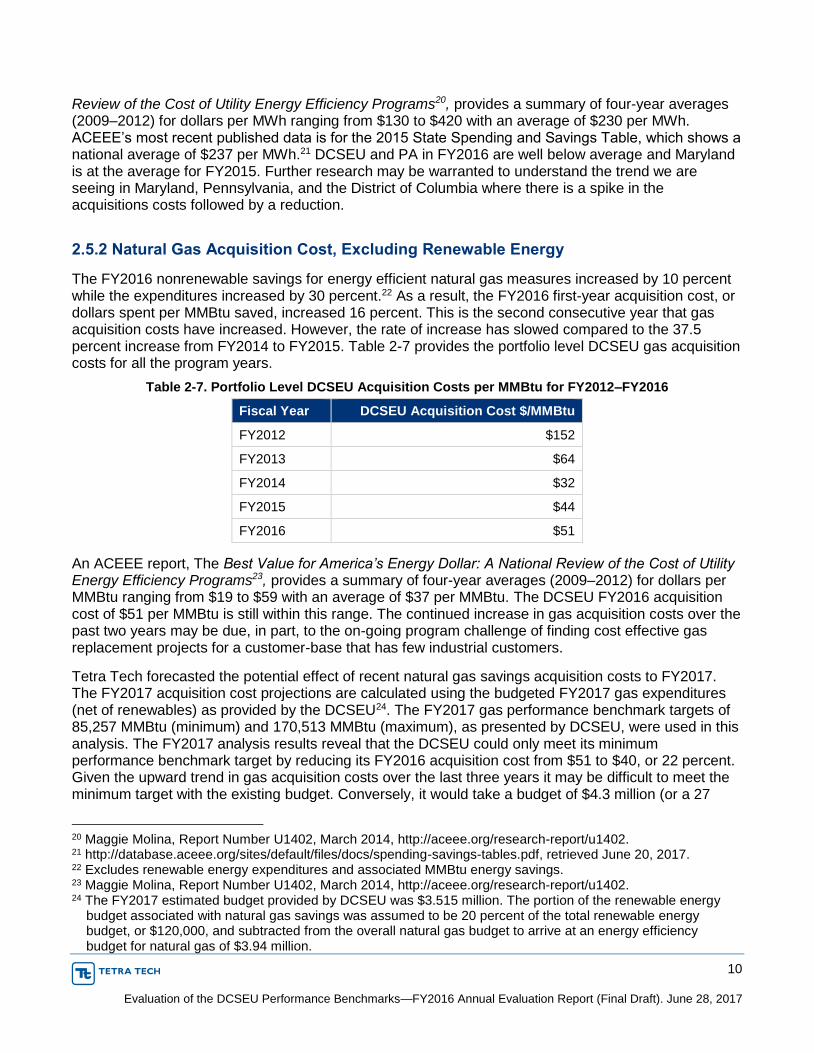
The FY2016 nonrenewable savings for energy efficient natural gas measures increased by 10 percent while the expenditures increased by 30 percent.22 As a result, the FY2016 first-year acquisition cost, or dollars spent per MMBtu saved, increased 16 percent. This is the second consecutive year that gas acquisition costs have increased. However, the rate of increase has slowed compared to the 37.5 percent increase from FY2014 to FY2015. Table 2-7 provides the portfolio level DCSEU gas acquisition costs for all the program years.
Table 2-7. Portfolio Level DCSEU Acquisition Costs per MMBtu for FY2012–FY2016
Fiscal Year DCSEU Acquisition Cost $/MMBtu
FY2012 $152
FY2013 $64
FY2014 $32
FY2015 $44
FY2016 $51
An ACEEE report, The Best Value for America’s Energy Dollar: A National Review of the Cost of Utility Energy Efficiency Programs23, provides a summary of four-year averages (2009–2012) for dollars per MMBtu ranging from $19 to $59 with an average of $37 per MMBtu. The DCSEU FY2016 acquisition cost of $51 per MMBtu is still within this range. The continued increase in gas acquisition costs over the past two years may be due, in part, to the on-going program challenge of finding cost effective gas replacement projects for a customer-base that has few industrial customers.
Tetra Tech forecasted the potential effect of recent natural gas savings acquisition costs to FY2017. The FY2017 acquisition cost projections are calculated using the budgeted FY2017 gas expenditures (net of renewables) as provided by the DCSEU24. The FY2017 gas performance benchmark targets of 85,257 MMBtu (minimum) and 170,513 MMBtu (maximum), as presented by DCSEU, were used in this analysis. The FY2017 analysis results reveal that the DCSEU could only meet its minimum performance benchmark target by reducing its FY2016 acquisition cost from $51 to $40, or 22 percent. Given the upward trend in gas acquisition costs over the last three years it may be difficult to meet the minimum target with the existing budget. Conversely, it would take a budget of $4.3 million (or a 27
20 Maggie Molina, Report Number U1402, March 2014, http://aceee.org/research-report/u1402. 21 http://database.aceee.org/sites/default/files/docs/spending-savings-tables.pdf, retrieved June 20, 2017. 22 Excludes renewable energy expenditures and associated MMBtu energy savings. 23 Maggie Molina, Report Number U1402, March 2014, http://aceee.org/research-report/u1402. 24 The FY2017 estimated budget provided by DCSEU was $3.515 million. The portion of the renewable energy
budget associated with natural gas savings was assumed to be 20 percent of the total renewable energy budget, or $120,000, and subtracted from the overall natural gas budget to arrive at an energy efficiency budget for natural gas of $3.94 million.

11
Evaluation of the DCSEU Performance Benchmarks—FY2016 Annual Evaluation Report (Final Draft). June 28, 2017
percent increase) to meet the minimum gas target with the current $51 acquisition cost, and it would take a 61 percent reduction in the acquisition cost—down to $20 per MMBtu—to meet the FY2017 maximum performance target at current budgetary levels. Alternatively, it would take a gas program budget of $8.7 million, a 257 percent increase, to achieve the maximum performance benchmark at FY2016 acquisition costs. The minimum benchmark goal will require a significant reduction in acquisition costs, which may not be achievable based on past results. Given the historical trends and the magnitude of the cost reduction or budget increase, the maximum benchmark goal may not be achievable. Figure 2-2 shows the historical DCSEU spending on natural gas energy efficiency and the implication for FY2017 benchmark targets.
Figure 2-2. Total Gas Saving Acquisition Costs: FY2012–FY2016 Actual and FY2017 Budget 25
2.6 CONCLUSION
From FY2012 through FY2014, DCSEU drove down acquisition costs for three consecutive years of implementation. In FY2015, that trend shifted to an increase in acquisition costs for both gas (MMBtu) and electricity (MWh). In FY2016, acquisition costs decreased fairly significantly for electric savings but increased for gas savings. The reduction in the electric acquisition costs will help towards meeting FY2017 maximum targets and are in line with data from other neighboring states showing similar reduction trends. This reduction could also be due, in part, to developing savings from more comprehensive program offerings, longer-term projects being completed, or leveraging efficiencies learned through years of working to meet competing performance benchmark targets. The increase in gas acquisition costs, while in line with other programs in the industry, will make it more difficult to achieve future energy performance benchmarks.
The FY2017 budget estimates show that the minimum performance benchmark for electricity can be met with the existing acquisition costs with some flexibility if costs were to rise. The minimum performance benchmark for gas, however, would require DCSEU to reduce acquisition costs by 22 percent or to receive a 27 percent increase in the budget to make that goal reachable. To achieve the
25 Expenditures are from the “DCSEU FY’16 Gas Electric Split_corrected.xlsx” file provided by DCSEU. These
expenditures exclude spending on renewable energy initiatives. Savings are verified MWh/MMBtu as reported in the portfolio evaluation reports. The FY2016 budget was provided by DOEE and verified by DCSEU. DCSEU provided the FY2016 renewable budget.

12
Evaluation of the DCSEU Performance Benchmarks—FY2016 Annual Evaluation Report (Final Draft). June 28, 2017
electric maximum performance benchmark, the electric acquisition cost would have to be reduced by six percent or to receive a seven percent increase in budget. While there are some challenges to becoming more cost effective in the coming years, this goal may still be within reach. The gas savings maximum benchmark, however, appears to be out of reach with the current budget as it would take a significant reduction in the gas acquisition costs (61 percent) to meet the maximum goal.

13
Evaluation of the DCSEU Performance Benchmarks—FY2016 Annual Evaluation Report (Final Draft). June 28, 2017
3.0 INCREASE RENEWABLE ENERGY GENERATING CAPACITY IN THE DISTRICT OF COLUMBIA (CAEA §201(D)(2))
3.1 DESCRIPTION
The DCSEU contract provides a performance benchmark for the increase of renewable energy generating capacity in the District of Columbia that is described as follows:
“The Contractor shall design and implement a cost-effective renewable energy program(s) for installations of renewable energy within the borders of the District. Beginning in Year 3 of the SEU contract, the Contractor shall receive 50% of the compensation at risk allocated for this benchmark for a 10% decrease in $/kWh of the first year of energy production of renewable energy installations incentivized by the renewable energy program(s), compared to the $/kWh for the previous year (energy production from non-electricity producing renewable energy calculations shall be converted to kWh). For every 5% decrease in $/kWh beyond the initial 10% reduction, the Contractor shall receive an additional 25% of the incentive allocated to this benchmark.” 26
Beginning in option year two, (contract modification MO5), a penalty scheme was also put in place if the DCSEU fails to achieve an 8 percent (50 percent penalty) and a 4 percent (100 percent penalty) decrease in the cost of installation (expressed in $/kWh) by the programs compared to the cost for the previous year.
3.2 VERIFIED RESULTS
DCSEU achieved its minimum performance benchmark target, as there was an 18 percent cost reduction in renewable energy installations in FY2016 compared to the cost in FY2015. DCSEU did not, however, meet the maximum performance target of 20 percent cost reduction.
Table 3-1. FY2016 Renewable Energy Generation Capacity Cost Results Summary
Metric
Minimum Performance
Target
Maximum Performance
Target FY2016
Reported FY2016 Verified
Minimum Performance Target Achieved
Maximum Performance Target Achieved
Cost per kWh reduction from FY2015
10% 20% 18% cost reduction27
18% cost reduction
Yes (180%) No (90%)
3.3 EVALUATION AND VERIFICATION APPROACH
In FY2016, as in recent years, the DCSEU offered two renewable energy measures—photovoltaic (PV) panels and solar thermal hot water systems. In FY2016, DCSEU installed 33 renewable energy projects through the Sustainable Energy Trust Fund (SETF) and an additional 129 renewable energy projects28 through the Renewable Energy Development Fund (REDF). For the performance benchmark
26 Contract Number DDOE-2010-SEU-0001, Attachment J.1, page 56. 27 Per FY2016 Annual Report—77 percent reduction in price per kWh, page 37. 28 Per 2016 Annual Report, page 13.
14
Evaluation of the DCSEU Performance Benchmarks—FY2016 Annual Evaluation Report (Final Draft). June 28, 2017
analysis in FY2016, only SETF projects were considered for purposes of verifying DCSEU performance.29 The 33 solar projects that counted towards DCSEU’s performance benchmark are designated by their respective track as follows: 28 income-qualified PV projects (track 7107PV), one solar thermal hot water system project (track 7110SHOT), and four market rate solar projects that included both PV and solar thermal hot water systems (track 7101PVMR). Under the 7101PVMR track, three of the four projects were for solar thermal hot water systems.
To verify the progress made towards meeting this performance benchmark, the evaluation team developed FY2016 acquisition costs for all SETF renewable energy initiatives by dividing the total renewable initiative expenditures by the kWh savings. The resulting acquisition cost was compared to the FY2015 acquisition cost to determine the percent change. The initiative costs were obtained from the financial summary files provided by the DCSEU entitled “DCSEU FY16 Gas Electric Split-FINAL” for FY2016 and the “DCSEU FY’15 Gas Electric Split corrected” document for FY2015. These files provided the administrative costs overall and the direct spend costs per track as defined by the DCSEU. The administrative costs were allocated to the track based on the percent direct spend of each track. The total track costs were derived by adding the direct spend to the allocated administrative cost. For the evaluation of this benchmark, the evaluation team used the total cost of SETF renewable energy projects (administrative cost allocation plus the direct spend).
Next, the verified gas savings values for the solar hot water measures were converted from MMBtu to kWh per the following conversion:
1 MMBtu = 293.3 kWh30
After totaling the two measures’ kWh savings and total costs, the renewable acquisition cost per kWh was calculated as:
Renewable acquisition costs per kWh = Total renewable cost / renewable kWh
3.4 PERFORMANCE BENCHMARK ASSESSMENT
3.4.1 Background
In FY2012, the DCSEU was tasked with delivering a cost-effective renewable program within the District. The DCSEU offered the Solar PV initiative, a solar photovoltaic rooftop offering that targeted income-qualified District homeowners. Beginning in FY2013, the DCSEU offered an additional measure, solar thermal hot water systems, and that measure continued to be offered within DCSEU’s renewable energy portfolio in FY2016. The solar thermal track (7110SHOT) is designed to replace existing inefficient hot water heating systems and targets solar domestic hot water systems in income-qualified multifamily buildings and commercial and institutional facilities with high hot water demand. In FY2015, DCSEU and DOEE worked together to put the Solar Advantage Plus Program (SAPP) in
29 In its 2016 Annual Report, DCSEU reported a total of 158 solar PV installations for income-qualified
homeowners. This represents the total number of projects funded by both SETF (29 installations) and REDF dollars (129 installations). DCSEU received the SETF funding for the 29 installations and accordingly accounted for those project savings. DCSEU also funded four additional market rate solar installations which were not accounted for in the annual report to total 33 projects funded under SETF, the number being reported and assessed for the renewable performance benchmark. While DCSEU facilitated the installation of the 129 REDF projects, all project work including DCSEU staff time was supported by the REDF dollars and were not included in the cost analysis of SETF projects.
30 1 kilowatt hour = 3,412 Btu, or 1 Btu = 0.0002933, and 1 MMBtu = 0.0002933 kWh * 1,000,000 = 293.3 kWh; source: http://www.eia.gov/energyexplained/index.cfm?page=about_btu, accessed on April 1, 2016.

15
Evaluation of the DCSEU Performance Benchmarks—FY2016 Annual Evaluation Report (Final Draft). June 28, 2017
place in the District. This initiative ultimately claimed 137 low-income installations by September 30, 2015.31 In FY2015, the DCSEU also added the 7101PVMR track that provided both the renewable energy technologies to market rate customers. A track specific review of the individual renewable energy technologies could not be conducted for each initiative in FY2015 because: (1) program costs (expenditures) for renewable tracks 7107PV and 7101PVMR were comingled, and (2) the PVMR track also included both gas (Solar Thermal) and electric (PV) project types. In FY2016, DCSEU separated costs for the low-income PV (7107PV) and market-rate PV (7101PVMR) tracks, though the PVMR track still contains both gas and electric technologies. The FY2016 acquisition cost analysis continues to combine the total renewable energy costs across all the SETF funded renewable tracks.
3.4.2 Assessment
Only SETF funded projects are included in the performance benchmark assessment, excluding REDF funded projects. In FY2016, the total kWh savings and total costs went down significantly, with costs decreasing by 68 percent and savings decreasing by 61 percent. However, the cost per kWh also dropped, demonstrating ongoing cost decreases for both administrative costs and technology costs.
The change from FY2015 to FY2016 was calculated both with and without administrative costs, described in Table 3-2 and Table 3-3, below.
Table 3-2. Verified Renewable Energy Initiatives Total Acquisition Cost per kWh
Fiscal Year kWh Expenditures Acquisition Cost
201532 1,620,455 $2,174,475 $1.34
201633 628,739 $694,431 $1.10
Change FY2015 to FY2016 -61% -68% -18%
31 Per 2016 Annual Report, page 12. 32 Source for expenditures: file provide by DCSEU titled, ”DCSEU FY15’ Gas Electric Split _corrected”, cells K2
plus K3. Source for kWh savings is “Table 1-4 DCSEU FY2015 Energy Efficiency and Renewable Energy Portfolio Gross Verified Savings, Meter Level (including all interactive effects)” from the “DOEE EM&V of Energy Efficiency and Renewable Energy Programs in the District of Columbia, FY2015 Annual Evaluation Report, Volume I (Final Draft) April, 15, 2016 (August 29, 2016 Revised)”, page 1-5. Gas savings (MMBtu’s) were converted to kWh savings.
33 Source for expenditures: file provide by DCSEU titled,” DCSEU FY’16 Gas Electric Split-FINAL”, cells K2 + K3 + K4. Source for kWh savings: file provided by DCSEU entitled “Savings Summary from Database” cells K2 + K3 + K4. Gas savings MMBtu’s were obtained from cells G2 + G3 + G4 and converted to kWh savings. A realization rate of 1.0 was applied to arrive at the final savings numbers.

16
Evaluation of the DCSEU Performance Benchmarks—FY2016 Annual Evaluation Report (Final Draft). June 28, 2017
Table 3-3. Verified Non-Administrative Renewable Energy Initiatives Acquisition Cost per kWh
Fiscal Year kWh Expenditures Acquisition Cost
201534 1,620,455 $1,405,276 $0.87
201635 628,739 $490,985 $0.78
Change FY2015 to FY2016 -61% -65% -10%
3.4.3 Conclusion
DCSEU reduced per kWh acquisition costs for renewable energy by 18 percent. This result exceeds the minimum performance goal of 10 percent, although it does not quite reach the maximum performance goal of 20 percent. Non-administrative costs dropped by 10 percent, suggesting that the aggregate 18 percent cost reduction was driven, in part, by increased administrative efficiency.
While the solar PV and solar thermal technology installation costs are largely outside of the DCSEU’s control, other components of the initiative’s expenditures (e.g., administrative costs and incentives) may offer further opportunity to reduce acquisition costs depending on the market and the customers’ receptivity. For future tracking, Tetra Tech recommends tracking costs and savings separately by technology and track. Regardless of the structure of future renewable energy performance benchmarks, understanding the cost drivers and sources of cost reductions may assist DCSEU with achieving its renewable energy savings targets as cost effectively as possible.
34 Source for expenditures: file provide by DCSEU titled, ”DCSEU FY15’ Gas Electric Split _corrected”, cells I2
plus I3. Source for kWh savings is “Table 1-4 DCSEU FY2015 Energy Efficiency and Renewable Energy Portfolio Gross Verified Savings, Meter Level (including all interactive effects)” from the “DOEE EM&V of Energy Efficiency and Renewable Energy Programs in the District of Columbia, FY2015 Annual Evaluation Report, Volume I (Final Draft) April, 15, 2016 (August 29, 2016 Revised)”, page 1-5. Gas savings (MMBtu’s) were converted to kWh savings.
35 Source for expenses: file provide by DCSEU titled, ”DCSEU FY’16 Gas Electric Split-FINAL”, cells I2 + I3 + I4. Source for kWh savings: file provided by DCSEU entitled “Savings Summary from Database” cells K2 + K3 + K4. Gas savings MMBtu’s were obtain from cells G2 + G3 + G4 and converted to kWh savings. A realization rate of 1.0 was applied to arrive at the final savings numbers.

17
Evaluation of the DCSEU Performance Benchmarks—FY2016 Annual Evaluation Report (Final Draft). June 28, 2017
4.0 REDUCE GROWTH OF PEAK DEMAND IN THE DISTRICT OF COLUMBIA (CAEA §201(D)(3))
4.1 DESCRIPTION
The DCSEU contract provides a performance benchmark for the growth reduction of peak demand (MW) in the District of Columbia that is described as follows:
“The SEU is not required to undertake any programs aimed exclusively at reducing the growth of peak demand. However, the SEU is required to estimate, using protocols developed by Pennsylvania New Jersey Maryland (PJM) for evaluating the capacity effects of energy efficiency projects for base residual auction, the impact on peak demand of its energy efficiency programs. The forecast increase in electric demand in the District between July 2010 and July 2011 is 40.8 MW.” 36
Beginning in the FY2016 contract period, this benchmark ceased being a performance benchmark, but was retained for DCSEU as a tracking metric. Contract modification M15, dated May 18, 2016, documents this change.
4.2 VERIFIED RESULTS AND APPROACH
DCSEU reported 9,695 kW of peak demand reduction for FY2016. Tetra Tech verified the peak demand reduction at 8,917 kW.
Table 4-1. Peak Demand Reduction Results Summary—FY2016
Metric Reported (kW)37 Verified (kW)38
Reduce growth in peak demand (kW)
9,695 8,917
Tetra Tech’s verified results for the overall portfolio are presented in the table above. These results reflect a realization rate estimate of 0.92 for kW. The 0.92 realization rate reflects the use of the lowest historical portfolio-level realization rate experienced by the DCSEU from the FY2013 through FY2015 evaluations as described in Section 2 of this report. The realization rate was applied to the total gross savings confirmed by Tetra Tech from its review and summation of kW savings. Tetra Tech’s kW total gross reported savings is 3 kW less than that reported by the DCSEU. The realization rate was applied to Tetra Tech’s summation of kW savings in the KITT database, not the DCSEU’s reported result. This means that the evaluation team estimates that the verified portfolio electric demand reduction result is 8,917 kW, or 92 percent of the DCSEU final dataset (KITT) demand reduction of 9,692 kW.
36 Contract Number DDOE-2010-SEU-0001, Amendment/Modification No. M07. 37 End of year reporting of net savings by the DCSEU. 38 FY2015 Verified kW is utilizing generator-level kW ex-post savings.
18
Evaluation of the DCSEU Performance Benchmarks—FY2016 Annual Evaluation Report (Final Draft). June 28, 2017
4.3 PERFORMANCE BENCHMARK ASSESSMENT
4.3.1 Background and Assessment
The DCSEU is not required to implement demand reduction specific programs and relies on the associated demand reduction component of the electric energy reduction initiatives to contribute to this target. The benchmark is now a tracking metric and no longer a gauge of the DCSEU’s performance.
4.3.2 Assessment
Similar to FY2015, Tetra Tech is not aware of any DCSEU-specific initiatives that have the specific intent of reducing demand savings. The reported savings result from the installation of electricity savings measures which lead to associated reductions in kW. Demand reduction remains a metric for electricity saving measures and is part of the TRM and custom measure savings calculations.
Electricity savings lead to demand reductions that the DCSEU can market to the PJM Capacity Market. Doing so generates revenues that are reinvested back into the into DCSEU’s initiatives and activities. Tetra Tech did not investigate the use of the PJM Capacity Market for the FY2016 evaluation.
4.3.3 Conclusion
Tetra Tech confirms that DCSEU exceeded their minimum peak demand reduction target in FY2016. Evaluated peak demand reductions were approximately 12 percent higher than in FY2015 despite the use of the lowest historical realization rate from FY2013 through FY2015 evaluations.
19
Evaluation of the DCSEU Performance Benchmarks—FY2016 Annual Evaluation Report (Final Draft). June 28, 2017
5.0 IMPROVE THE ENERGY EFFICIENCY OF LOW-INCOME HOUSING IN THE DISTRICT OF COLUMBIA (CAEA §201(D)(4))
5.1 DESCRIPTION
The DCSEU contract provides a performance benchmark to improve the energy efficiency of low–income housing that is described as follows:
“On an annual basis, a minimum of 30 percent of the SETF funds expended by the SEU shall be dedicated to improving the energy efficiency and renewable energy generating capacity of low-income housing, shelters, clinics, or other buildings serving low-income residents of low-income housing in all eight wards of the District. Programmatic, administrative, evaluation, and other expenses of the SEU for all of its programs shall be included in the denominator (the SEU’s total expenditures) but not the numerator (the amount spent on low-income programs).”39
“Low-Income Households are defined as households with incomes that are at or below the greater of either 200% of Federal Poverty Level or 60% of Area Median Income (AMI). For buildings with more than 200 units, services to low-income multifamily housing shall include projects in which at least 50% of units are at or below this income threshold; for buildings with fewer than 200 units, services shall include projects in which at least 66% of units are at or below this income threshold. The threshold is based on: (1) existing tenant incomes, or (2) established contracts with feral or municipal agencies or departments, or (3) established and documented rent levels that are at or below 30% of that level (that is, affordable to a household at or below the income threshold, with housing expenses being no more than 30% of income).”40
For FY2016, the qualification of buildings serving low-income District residents was expanded to include shelters, clinics, or other buildings serving low-income residents, defined as:
“Low-Income Clinics mean clinics or other health facilities that are designated as a Federally Qualified Health Center (FQHC) in the District of Columbia. Shelter means a building or organization that provides temporary residence for those suffering from homelessness or domestic violence.”41
5.2 VERIFIED RESULTS
As seen in Table 5-1, the evaluation team’s verified low-income spending level confirms that DCSEU’s low-income spend for FY2016 exceeded its minimum performance target for this benchmark. DCSEU achieved 98 percent of its maximum benchmark performance target.
39 DCSEU Contract, page 57 and Contract Modification M15, page 3 of 4. 40 Contract modification M003, page 2. 41 Contract modification M15, page 1 of 4.

20
Evaluation of the DCSEU Performance Benchmarks—FY2016 Annual Evaluation Report (Final Draft). June 28, 2017
Table 5-1. Low-Income Housing Results Summary—FY2016
Metric
Minimum Performance
Target
Maximum Performance
Target Reported Verified
Minimum Performance
Target Achieved
Maximum Performance
Target Achieved
Improve energy efficiency and renewable energy generating capacity in low-income housing: (30% spend ($))
$3,520,000 $5,280,000 $5,243,647 $5,187,757 Yes (147%) No (98%)
5.3 VERIFIED RESULTS AND APPROACH
The evaluation team reviewed the program tracking database and summary financial information to document the reported track level spending on low-income projects. The data were reviewed to verify that the DCSEU met or exceeded the performance target for the low-income performance benchmark of at least 30 percent of their monetary spend going towards low-income qualified projects. For FY2016, there were six tracks that included low-income projects (four low-income tracks, and two renewables tracks). These tracks are:
Low Income Multifamily Comprehensive (7612LICP)
Low Income Multifamily Direct Install (7610ICDI)
Low Income Custom Projects(7610LICP)
Income Qualified Home Performance (7401FHLB)
LIMF Solar Hot Water (7110SHOT)
Solar Photovoltaic (7107PV).
The evaluation team reviewed track-level low-income spending by examining a summary-level financial document provided by DCSEU (“DCSEU FY16 Gas Electric Split_FINAL.xls”). This document summarizes project spending for each track including program costs, administrative costs, and incentive dollars. With this document, the evaluation team verified the total dollars spent towards low-income by examining where funds were allocated among low-income program tracks.
Tetra Tech then conducted a review of all low-income projects tracked in the program tracking database for FY2016. By reviewing the program tracking data, we were able to generally assess that projects appear to be accurately classified as low-income projects, as defined by DOEE.
Tetra Tech reviewed the low-income verification process of DCSEU. For this process, DCSEU provided a memo42 which sets out the procedures DCSEU follows to verify the status. Documents listed in this memo that are used to verify low-income status include “a Multifamily covenant, a Medicaid letter, a Multifamily Rent Roll, a LI Service Application, or a building appearing on the Federally Qualified Health Center list in the District of Columbia.” The evaluation team reviewed the program tracking data and attempted to identify program participants that also appeared on the Federally Qualified Health Center list. The evaluation team did not identify any FY2016 projects from facilities on this list.
42 Memorandum from DCSEU to Tetra Tech, May 5, 2017.

21
Evaluation of the DCSEU Performance Benchmarks—FY2016 Annual Evaluation Report (Final Draft). June 28, 2017
5.4 PERFORMANCE BENCHMARK ASSESSMENT
5.4.1 Background
This benchmark has not changed over the contracting period’s inception; however, the eligibility of initiatives that count toward this benchmark has changed. For example, in prior evaluation years, the spending analysis included all low-income nonrenewable-specific initiatives plus the Solar Hot Water (7110SHOT) initiative but did not include the Solar PV spending. Prior to FY2016, low-income Solar PV spending was specific to energy efficiency measures rather than renewable generation, with solar hot water being treated as an efficiency improvement for purposes of the benchmark. Improving both energy efficiency and renewable energy capacity of low-income residents became officially part of the low-income contract benchmark in FY2016 and now includes Solar Photovoltaic (7107PV) initiative costs.
5.4.2 Assessment Results
Table 5-2 provides a summary list of low-income spending by tracks actively serving the low-income DCSEU customer base in FY2015 and FY2016 and track level spending adjustment recommendations of low-income dollars spent towards this benchmark for each of these years. In previous evaluation years, the Tetra Tech team has made these spending adjustment recommendations based on reviewing a robust sample of available project files and verifying documentation of low-income participant eligibility for these tracks. For the FY2016 evaluation, no project-level documents were sampled to verify the income-eligibility requirements. As a result, the evaluation team utilized the FY2015 analysis to inform an adjustment of the reported FY2016 low-income spending.
In FY2015, the evaluation team recommended minor spend adjustments to the Income Qualified Home Performance (7401FHLB) and Solar Photovoltaic (7107PV) tracks based on its desk reviews and the verification of income-qualification documentation. The FY2015 results recommended an adjustment to the 7401FHLB and 7107PV tracks. For these two tracks, the evaluation team applied the FY2015 proportional adjustments to the reported FY2016 spending levels. The details of the team’s recommendations and calculations are found below.
Table 5-2. Low-Income Spend—Actual vs. Adjusted FY201543 and FY2016 Performance Benchmark Results
Track Track Description
FY2015 Reported
Direct Spend
FY2015 Adjustment
Rate
FY2016 Reported
Direct Spend44
FY2016 Adjusted
Spend
7612LICP LIMF Comprehensive
$711,996 100% $940,957 $940,957
7610ICDI, 7610LICP
LIMF Direct Install $2,339,358 100% $3,582,560 $3,582,560
43 All FY2015 data in Table 5-2 is sourced from “FY2015 Annual Evaluation Report for the Performance
Benchmarks (Final Draft)”, June 21, 2016. 44 FY16 Reported Low-Income Expenditures by track are from the “DCSEU FY’16 Gas Electric Split_FINAL.xlsx”
file provided by DCSEU.

22
Evaluation of the DCSEU Performance Benchmarks—FY2016 Annual Evaluation Report (Final Draft). June 28, 2017
Track Track Description
FY2015 Reported
Direct Spend
FY2015 Adjustment
Rate
FY2016 Reported
Direct Spend44
FY2016 Adjusted
Spend
7710FBNK Efficient Products: Food Bank Lighting
$188,508 100% NA45 NA
7401FHLB Income Qualified Home Performance
$410,887 85.7% $183,065 $156,923
7110SHOT LIMF Solar Hot Water
$281,403 100% $21,9076 $21,907
7107PV Solar Photovoltaic $1,637,483 96.7% $502,046 $485,410
Total $5,569,636 $5,230,535 $5,187,757
5.4.3 Conclusion
DCSEU well exceeded its minimum target for this benchmark but did not exceed its maximum performance benchmark. Both the reported and evaluated spending levels showed the maximum performance benchmark not being reached, regardless of the evaluation team’s spending level adjustments.
45 This year’s analysis did not include 7710FBNK as there were no projects identified for this track in the DCSEU
tracking database.

23
Evaluation of the DCSEU Performance Benchmarks—FY2016 Annual Evaluation Report (Final Draft). June 28, 2017
6.0 REDUCE THE GROWTH OF ENERGY DEMAND OF THE DISTRICT OF COLUMBIA’S LARGEST ENERGY USERS (CAEA § 201(D)(5))
6.1 DESCRIPTION
The DCSEU contract provides a performance benchmark to reduce the growth of energy demand of the District’s largest energy users that is described as follows:
“Beginning in option year 3 of the SEU contract, the contractor shall design and implement energy efficiency program(s) that provide technical and financial assistance that result in at least 50 completed energy efficiency projects. Large energy users are defined as organizations or individuals that own a business, government, or residential building with more than 200,000 square feet of gross floor area or own a campus of buildings in a contiguous geographical area that share building systems or at least one common energy meter without separate metering, or sub-metering, such that their energy use cannot be individually tracked. Gross floor area include infrastructure that contain heated and unheated space that is connected to a qualified building. Energy efficiency or renewable energy measures must be installed in a qualified building or an infrastructure connected to a qualified building in order to qualify as a large energy user project. A completed large energy user project is one in which there is a signed customer agreement and completed and verified energy savings.” 46
Beginning in the FY2016 contract period, this benchmark ceased being a performance benchmark, but was retained for DCSEU as a tracking metric. Contract modification M15, dated May 18, 2016, documents this change.
6.2 VERIFIED RESULTS AND APPROACH
The evaluation team reviewed the DCSEU database of FY2016 tracked measures and projects. The database includes a field that identifies the square footage of the building in which a project’s measure is installed. From this total, the number of unique site IDs was calculated. Unique site IDs reflect a unique street address.
For FY2016, a total of 772 measures were recorded in the tracking database for buildings with 200,000 square feet or more. These 772 measures represented 99,454 individual installations of energy efficient equipment. The 772 measures were installed at a total of 132 unique sites (addresses).
46 Contract Number DDOE-2010-SEU-0001, Amendment of Solicitation / Modification of Contract No. M07.
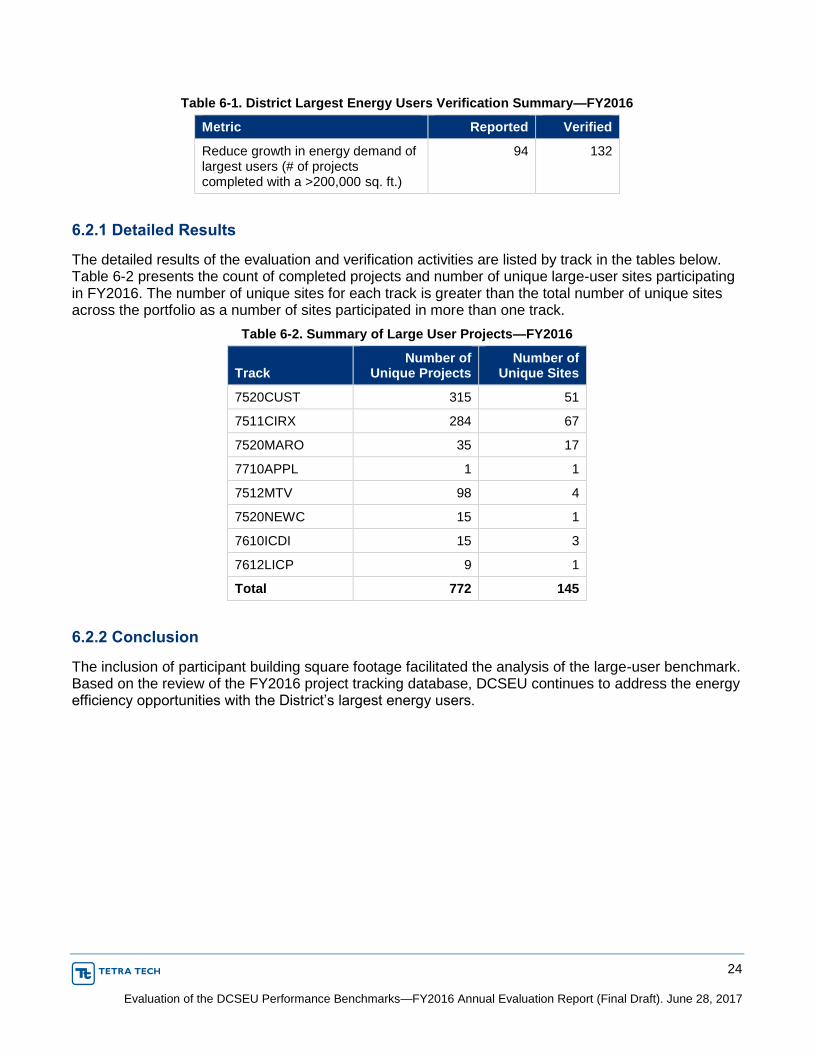
24
Evaluation of the DCSEU Performance Benchmarks—FY2016 Annual Evaluation Report (Final Draft). June 28, 2017
Table 6-1. District Largest Energy Users Verification Summary—FY2016
Metric Reported Verified
Reduce growth in energy demand of largest users (# of projects completed with a >200,000 sq. ft.)
94 132
6.2.1 Detailed Results
The detailed results of the evaluation and verification activities are listed by track in the tables below. Table 6-2 presents the count of completed projects and number of unique large-user sites participating in FY2016. The number of unique sites for each track is greater than the total number of unique sites across the portfolio as a number of sites participated in more than one track.
Table 6-2. Summary of Large User Projects—FY2016
Track Number of
Unique Projects Number of
Unique Sites
7520CUST 315 51
7511CIRX 284 67
7520MARO 35 17
7710APPL 1 1
7512MTV 98 4
7520NEWC 15 1
7610ICDI 15 3
7612LICP 9 1
Total 772 145
6.2.2 Conclusion
The inclusion of participant building square footage facilitated the analysis of the large-user benchmark. Based on the review of the FY2016 project tracking database, DCSEU continues to address the energy efficiency opportunities with the District’s largest energy users.

25
Evaluation of the DCSEU Performance Benchmarks—FY2016 Annual Evaluation Report (Final Draft). June 28, 2017
7.0 INCREASE THE NUMBER OF GREEN-COLLAR JOBS IN THE DISTRICT OF COLUMBIA (CAEA § 201 (D)(6))
7.1 DESCRIPTION
The Green-Collar Jobs contract performance benchmark target calls for DCSEU to create a specific number of Green Jobs annually. The target and the metric for measuring the target is described in the FY2015 contract modification as follows:
“The SEU shall ensure that…at least 88 green jobs [are created] in Year 4. The following criteria will be used in the calculations of what constitutes a green job for the purposes of this benchmark:
A green job or green-collar job is 1 Full Time Equivalent (FTE) job held by a District resident who is paid at least a living wage47 or a factor of $200,000 of SEU direct cash incentives to end-use customers and/or manufacturers. No distinction is required for new versus retained jobs.
1 FTE = 1,950 work-hours and is applied to hours reported by the SEU and its subcontractors.
SEU direct cash incentives to end-use customers and for upstream/midstream cash incentives to manufacturers to buy down the cost of energy efficiency measures will be used to estimate the number of green jobs created through DCSEU incentive programs.
Only direct jobs are to be used in the green jobs calculation. Indirect (primarily suppliers to SEU contractors or subcontractors) and induced jobs (derived from a multiplier effect) are not counted.”48, 49
“The Contractor shall receive 60% of the compensation at risk allocated for this benchmark in Table 1 for creating 60% of the number of green jobs.”50
The calculation (88 green jobs * 0.60) results in a minimum target of 53 green jobs for FY2015. No additional contract changes were made in FY2016 to the green jobs performance benchmark.
7.2 VERIFIED RESULTS AND APPROACH
Table 7-1 highlights the FY2016 Green Jobs Benchmarks, and the verified results against those initiative goals. The FY2016 verified green jobs total of 104.5 jobs exceeds the Maximum Performance Target of 88 for the Green Jobs Performance Benchmark. This total was arrived at by combining the 62 DOEE-verified FTE green jobs (that earned a living wage) and 42.5 green job equivalents based on
47 The Living Wage Act of 2006 is Title I of the “Way to Work Amendment Act of 2006”, D.C. Law 16-118 (D.C.
Official Code §2-220.01 to .11), which became effective June 8, 2006. See the following cite for details: http://www.does.dc.gov/does/cwp/view,a,1233,q,636800,doesNav,%7C32064%7C.asp.
48 For a more complete definition of indirect and induced jobs, see Executive Office of the President, Council of Economic Advisors, Estimates of Job Creation from the American Recovery and Reinvestment Act of 2009, May 2009, p. 6.
49 Contract Number DDOE-2010-SEU-0001, Amendment /Modification No. M07. 50 Contract Number DDOE-2010-SEU-0001, Amendment /Modification No. M07.

26
Evaluation of the DCSEU Performance Benchmarks—FY2016 Annual Evaluation Report (Final Draft). June 28, 2017
direct cash incentives (1 FTE for every $200,000 of DCSEU direct cash incentives to end-use customers or manufacturers).51
Table 7-1. Green-Collar Jobs Summary—FY2016
Metric
Minimum Performance
Benchmark
Maximum Performance
Benchmark Reported*
Total Verified
Green Job FTEs &
Equivalents
DOEE Verified
Green Job
FTEs**
Direct Cash
Incentive Jobs***
Minimum Benchmark Achieved
Maximum Performance Benchmark Achieved
Increase the number of green-collar jobs (FTE or equivalent)
53 88 88 104.50 62 42.50 Yes (197%)
Yes (119%)
Evaluation of this benchmark in FY2016 involved two distinct approaches. First, DOEE conducted a detailed audit and review of the DCSEU reporting for this benchmark. DOEE appraised the DCSEU payroll hours and DCSEU subcontractor payroll hours for FY2016, and arrived at total of 91,137.75 DCSEU applicable hours and a total of 29,768 subcontractor applicable hours which totaled 120,905.75 hours for jobs held by a District resident who was paid at least a living wage. This number was then converted to FTE using the conversion factor of 1,950 work-hours to 1 FTE. This year, DOEE verified that DCSEU provided 62 green jobs for which a District resident was paid a living wage. Second, the Tetra Tech evaluation team used the total of: a) DCSEU direct cash incentives to end-use customers, and b) upstream and/or midstream cash incentives to buy down the cost of energy efficiency measures in FY2016 to calculate an estimated number of additional green jobs created through program activity this program year. In FY2016, DCSEU provided incentives totaling $8,495,152. These incentives were converted into Green Job Equivalents using the following calculation:
Total end-use and manufacturer incentives / $200,000 = FY2016 Calculated Green Jobs Equivalent
$8,495,152 / $200,000 = 42.5 calculated green jobs equivalents
51 Source: FY2016 incentives paid amount of $8,495,152 was obtained from the file provided by the DCSEU
entitled ”DCSEU FY16’ Gas Electric Split.”

27
Evaluation of the DCSEU Performance Benchmarks—FY2016 Annual Evaluation Report (Final Draft). June 28, 2017
7.3 PERFORMANCE BENCHMARK ASSESSMENT
7.3.1 Background
This benchmark exists to measure jobs directly created for District residents resulting from the DCSEU’s implementation of the DCSEU energy efficiency and renewable energy portfolio. This includes jobs held with the DCSEU and those resulting from others in the District performing work directly associated with the DCSEU portfolio. It excludes indirect jobs—those jobs created in support of direct jobs such as suppliers of energy efficiency equipment—and induced jobs, which are those created due to the economic impact of hired workers spending incomes within the District.
The Performance Benchmark was modified in FY2014 to allow for the inclusion of estimated green job creation based on the “Total dollar amount of DCSEU cash incentives to end-use customers and for upstream/midstream cash incentives to manufacturers to buy down the cost of energy efficient measures.”52 This additional FTE equivalent was included to account for how incentive payments to District customers, contractors, and manufacturers also contribute to green jobs in the District.
7.3.2 Assessment Result
For FY2016, Tetra Tech verified 104.5 Green Jobs. The result reflects a slight decrease in the number of green jobs verified for FY2015 (112). The number of direct jobs dropped from 71 to 62 between FY2015 and FY2016, while the incentive-created jobs increased by one. Regardless, the DCSEU exceeded the maximum performance benchmark target.
7.3.3 Conclusion
The DCSEU continues to drive Green Jobs in the District. Depending on program delivery approaches —emphasizing direct program technical assistance or incentives the DCSEU will have flexibility in how it meets the Green Jobs performance benchmark.
52 Contract Number DDOE-2010-SEU-0001, Amendment /Modification No. M07, Article 1.3.6.1.11.

28
Evaluation of the DCSEU Performance Benchmarks—FY2016 Annual Evaluation Report (Final Draft). June 28, 2017
8.0 COST-EFFECTIVENESS ASSESSMENT
Tetra Tech conducted a cost-benefit analysis for 11 energy efficiency initiatives sponsored by the DCSEU. The evaluation team performed a Societal Cost Test (SCT) for each initiative and compared the results to the SCT results provided by the DCSEU. Tetra Tech also developed three additional SCT scenarios that incorporate evaluation costs, energy savings realization rates, and program attribution.
The DCSEU provided Tetra Tech with their track and portfolio level cost-effectiveness test results for FY2016. The program level results include expenses and savings estimates that were accounted for in the DCSEU KITT database tracking system plus direct costs as tracked in the Deltek system.53 The portfolio level results also include administrative and support costs that were not directly allocated to programs.
8.1 VERIFIED RESULTS
The total SCT results for the portfolio range from 3.48 to 2.70, which means that the DCSEU continued to operate its initiatives in a very cost effective manner in FY2016. The 2.70 figure represents the fully-loaded assessment which includes the cost of the third-party independent evaluation, the effect of the realization rates determined through the evaluation effort, and estimated free-ridership and spillover (NTG estimates). For every dollar spent, the District realized anywhere from a $3.48 to $2.70 return on its investment.
The variances between the DCSEU’s benefit cost model and the evaluation team’s model were minimal, especially at the portfolio level with all initiative administrative costs and third party evaluator costs included. Some variability between cost-benefit models is expected, as exact calculation methods may differ slightly. The evaluation team notes no significant differences between the cost-benefit ratios calculated in the evaluation model versus the DCSEU model.
On a track level, the Income Qualified Home Performance initiative and the Home Performance with ENERGY STAR® initiative are the only two initiatives that were not cost effective and have not been since the first evaluation in FY2012. The evaluation team recognizes that these initiatives serve a purpose and a market that would not otherwise be served and requires an extra level of support by DCSEU staff. We recommend, however, that a review of each initiative’s structure, measure selection, program costs, and program approach be conducted to better understand why these initiatives have not been cost effective. Researching other utilities or jurisdictions that provide such programs cost effectively could be an area to explore in future evaluations.
The evaluation team has no outstanding issues or recommendations regarding the DCSEU cost-effectiveness evaluation procedure.
8.2 SOCIETAL COST TEST ANALYSIS
The evaluation team reviewed four scenarios to compare cost-effectiveness results. The analysis first compares the DCSEU’s cost-effectiveness results to the Tetra Tech model results (Scenario 1). The analysis then further applies—in a stepwise fashion—other adjustments to see how each impacts the
53 KITT tracks information on the people, projects, measures, and associated savings for DCSEU. It is the system
of record for tracking energy savings and cost-effectiveness screening data. Deltek tracks financial information such as time, expenses, and financial accounting.

29
Evaluation of the DCSEU Performance Benchmarks—FY2016 Annual Evaluation Report (Final Draft). June 28, 2017
cost-effectiveness results. From the base cost-effectiveness results (Scenario 1), the third-party evaluation costs are added (Scenario 2), then realization rates are applied (Scenario 3), and then net-to-gross (NTG) factors are applied (Scenario 4). Some caution is warranted at interpreting Scenario 3 and Scenario 4 and comparing the results to past evaluations. For FY2016, these two scenarios rely on the lowest historical realization rates for electricity, electric demand, and natural gas savings. Those lowest historical realization rates did not all happen in the same year, suggesting that a portfolio analysis that uses lowest realization rates may understate the true cost-effectiveness of FY2016’s portfolio. Following is a description of each scenario and the summary of results. Note that the impacts of each scenario are cumulative; i.e., Scenario 4 includes the impacts of all the previous scenarios. In addition, Scenarios 1–4 are all based upon the Tetra Tech benefit-cost model. The results across all four scenarios are detailed in Table 8-1.
Scenario 1—Comparison of DCSEU vs. Tetra Tech Cost-Effectiveness Results
This scenario compares the results of the DCSEU cost-effectiveness test versus the results determined using the evaluation team’s cost-benefit model. While there are differences between the DCSEU’s benefit-cost modeling result (4.02) and Tetra Tech’s (3.77), the differences are not significant. The specific calculator tools and an accumulation of minor rounding or tabulation differences are the likely factors for the difference. Tetra Tech did tabulate slightly lower tracked savings than the DCSEU, which may also be a contributing factor. Regardless of the differences, the resulting benefit-cost ratios are similar and point to the same conclusion—that the DCSEU portfolio is highly cost-effective.
Scenario 2—Inclusion of Evaluation Costs
The third-party evaluation (Tetra Tech evaluation team) costs for the DCSEU FY2016 (Contract Year FY2016) totaled $84,740 that was not included in either the evaluation team or DCSEU cost-benefit model results in Scenario 1. In Scenario 2, that evaluation expense amount is added to the cost side of the analysis and is allocated to specific programs based upon direct expense program allocations in the DCSEU cost-benefit model. Adding this third-party evaluation expense decreases the overall portfolio cost-benefit ratio to 3.47.
Scenario 3—Inclusion of Realization Rates
The evaluation team utilized the lowest historical portfolio realization rates kWh, kW, and MMBtu savings based on past impact evaluation efforts. These are shown in Table 2-2 and are applied to the kWh, kW, and MMBtu savings in the cost-benefit model for Scenario 2. The overall impact of incorporating realization rates decreases the cost-benefit ratio of the total portfolio to 3.32.
Scenario 4—Inclusion of Net-to-Gross Ratio
The FY2014 NTG ratios were applied to the FY2016 evaluated kWh, kW, and MMBtu savings for each initiative track in the cost-benefit model for Scenario 3. The NTG ratios were developed during the FY2014 evaluation. The overall impact of incorporating NTG decreases the cost-benefit ratio of the total portfolio to 2.70. In this analysis, measure costs due to free ridership had not been subtracted from the program costs, resulting in a conservative cost-benefit ratio for this scenario.
The results of these comparisons and scenarios are presented in Table 8-1.

30
Evaluation of the DCSEU Performance Benchmarks—FY2016 Annual Evaluation Report (Final Draft). June 28, 2017
Table 8-1. Societal Cost Test Comparison
Initiative DCSEU
(original)
Scenario 1 Compared to
DCSEU Model
Scenario 2 + Evaluation
Cost Scenario 3 +
RR Scenario 4 +
NTG
7101 Market Rate Renewables
2.03 1.74 1.73 1.69 1.69
7107 Income Qualified Solar PV
1.76 1.84 1.83 1.72 1.72
7110 Income Qualified Solar Hot Water
5.55 6.40 6.39 6.39 6.39
7401 Income Qualified Single Family
0.80 0.79 0.79 0.77 0.73
7420 Home Performance with ENERGY STAR
1.00 0.88 0.88 0.86 0.77
7511 Business Energy Rebates
6.49 6.33 6.32 6.00 5.64
7512 Commercial Direct Services
5.13 4.67 4.66 4.39 4.07
7520 Commercial Custom 3.45 3.16 3.16 3.03 2.19
7610 Multifamily Direct Install and Comprehensive
2.22 2.04 2.04 1.97 1.97
7612 Multifamily Custom 4.09 3.48 3.48 3.31 3.31
7710 Retail Efficient Products
5.31 5.25 5.25 4.99 4.45
Program Total 4.02 3.77 3.77 3.60 2.93
Portfolio Including Support & Administration
3.71 3.48 3.47 3.32 2.70
8.3 SOCIETAL COST TEST MODEL, ASSUMPTIONS, AND ADDERS
The Societal Cost Test (SCT) measures the net direct economic impact to the utility service territory, state, or region, plus indirect benefits such as environmental benefits and direct non-energy related customer benefits. Below is a brief description of the benefits and costs included by DCSEU (and hence the evaluation team) to determine the SCT results for this analysis.

31
Evaluation of the DCSEU Performance Benchmarks—FY2016 Annual Evaluation Report (Final Draft). June 28, 2017
Table 8-2. Benefits and Costs Included in the DCSEU SCT
Benefits Costs
Avoided Energy Costs
Avoided Capacity Costs
Avoided Transmission & Distribution Costs
Avoided Fossil Fuel Costs
Avoided Water Costs
Risk Adder (Percent of Electric and Fossil Fuel Avoided cost)
Non-Energy Benefits Adder (Percent of Electric and Fossil Fuel Avoided Costs)
Avoided Environmental Externality Costs for Electric and Fossil Fuels ($/kWh and $/MMBtu)
Program Administrator Costs
Energy Efficiency Measure Cost—Financial Incentives
Energy Efficiency Measure Cost—Participant Contribution
Costs of Increased Energy Consumption
Evaluation Costs (Scenarios 2-4)
8.3.1 Societal Cost Test Assumptions
The following table presents the SCT cost-benefit assumptions and sources used by DCSEU for FY2016.
Table 8-3. Societal Cost Test Benefits Assumptions and Sources
Screening Assumption Value (monetary values in 2015$)* Source
Future Inflation Rate 2.121% Based on past 10 years of consumer price index data, calculated October 2015.
Water Avoided Cost $10.65/CCF (100 cubic feet) State of Vermont screening tool, established by the Department of Public Service as $.01 per gallon in 2000.
Real Discount Rate 2.039% 10-year treasury rate posted in the Wall Street Journal on the first business day of October 2015 (as specified in the DCSEU contract).
Line Losses 8% (energy)
6% (demand)
Based on a PEPCO screening tool developed by IFC International, Inc.
Natural Gas Capacity Adder 5% Professional judgment, to capture the costs of capacity and delivery of gas.
Transmission Cost $26.521/kW-year PEPCO’s July 27, 2015 filing of the Federal Energy Regulatory Commission (FERC) formula transmission rate update.
Distribution Cost $231.456/kW-year Calculated, based on PEPCO’s indication that distribution costs are 8.73 times that of transmission costs.
Electric & Fuel Externalities See Table 8-8 See “2015 DC externality values” memo for methodology.

32
Evaluation of the DCSEU Performance Benchmarks—FY2016 Annual Evaluation Report (Final Draft). June 28, 2017
Screening Assumption Value (monetary values in 2015$)* Source
Electric Energy Cost See Table 8-4 Years 2012–2015 and 2020 were drawn from PEPCO’s filed 2012 through 2014 EmPOWER Maryland Energy Efficiency Plan. The missing years were estimated by linear extrapolation up to 2025, at which point the costs were held constant to be conservative.
Electric Power Cost See Table 8-5 Years 2012–2015 and 2020 were drawn from PEPCO’s filed 2012 through 2014 EmPOWER Maryland Energy Efficiency Plan. The missing years were estimated by linear extrapolation up to 2025, at which point the costs were held constant to be conservative.
Natural Gas Cost See Table 8-6 Provided by Washington Gas.
Other Fuels Cost See Table 8-7 “Avoided Energy Supply Costs in New England: 2015 Report” was used as a basis. The average 10-year historical price ratio between the DC and New England retail markets, sourced from the U.S. EIA, was used to adjust values to the DC market.
Risk Adder 10% Specified in the DCSEU contract.
NEB Adder 10% Specified in the DCSEU contract.
Low-Income NEB Renewable Adder
15% See “Screening assumptions for the DCSEU solar renewable energy program portfolio” memo January 7, 2015, for methodology.
Low-Income Spillover Value 1.15 See “Screening assumptions for the DCSEU solar renewable energy program portfolio” memo January 7, 2015, for methodology.
Solar renewable energy certificate (SREC) Price
$479.8454 See “Screening assumptions for the DCSEU solar renewable energy program portfolio” memo January 7, 2015, for methodology.
The tables below presents the avoided supply costs for 2015–2041 (in 2015 dollars) included in the DCSEU screening tool.
54 The societal test screening claims the difference between the Solar Alternative Compliance Payment (SACP;
$500 through 2023) and the value of the SREC. Additional information on the SACP can be found at: http://www.srectrade.com/srec_markets/district_of_columbia

33
Evaluation of the DCSEU Performance Benchmarks—FY2016 Annual Evaluation Report (Final Draft). June 28, 2017
Table 8-4. Electric Energy Cost in 2015 Dollars ($/kWh)
Year Winter Peak Winter Off-
Peak Summer
Peak Summer Off-
Peak
2015 0.0866 0.0669 0.1009 0.0647
2016 0.0891 0.0683 0.1038 0.0668
2017 0.0911 0.0698 0.1063 0.0685
2018 0.0932 0.0714 0.1088 0.0701
2019 0.0953 0.0729 0.1113 0.0717
2020 0.0973 0.0745 0.1138 0.0733
2021 0.0994 0.0760 0.1163 0.0749
2022 0.1014 0.0775 0.1187 0.0765
2023 0.1035 0.0791 0.1212 0.0782
2024 0.1056 0.0806 0.1237 0.0798
2025–2041 0.1076 0.0822 0.1262 0.0814
Table 8-5. Electric Power Cost in 2015 Dollars
Year $/kW-yr.
2015 66.66
2016 72.53
2017 78.46
2018 84.38
2019 90.30
2020 97.73
2021 98.28
2022 102.16
2023 106.04
2024 109.91
2025–2041 113.79
Table 8-6. Natural Gas Cost in 2015 Dollars
Year $/MMBtu Year $/MMBtu
2015 9.74 2029 15.77
2016 9.90 2030 16.59
2017 10.10 2031 17.45
2018 10.35 2032 18.36

34
Evaluation of the DCSEU Performance Benchmarks—FY2016 Annual Evaluation Report (Final Draft). June 28, 2017
Year $/MMBtu Year $/MMBtu
2019 10.62 2033 19.31
2020 10.90 2034 20.33
2021 11.25 2035 21.39
2022 11.49 2036 22.52
2023 11.68 2037 23.70
2024 12.28 2038 24.96
2025 12.90 2039 26.28
2026 13.57 2040 27.67
2027 14.26 2041 29.15
2028 15.00 2042 30.71
Table 8-7. Other Fuels Costs in 2015 Dollars ($/MMBtu)
Year Commercial
Distillate Residential
Distillate Propane Kerosene
2015 13.81 17.61 14.50 13.63
2016 14.61 18.55 15.72 13.86
2017 15.90 20.09 17.62 15.16
2018 16.93 21.35 18.90 16.15
2019 17.33 21.79 19.09 16.56
2020 17.69 22.21 19.23 16.90
2021 18.07 22.65 19.45 17.26
2022 18.47 23.10 19.63 17.67
2023 18.79 23.50 19.75 17.95
2024 19.10 23.91 19.92 18.23
2025 19.42 24.28 20.10 18.55
2026 19.68 24.56 20.26 18.80
2027 20.01 24.95 20.41 19.11
2028 20.21 25.21 20.54 19.30
2029 20.48 25.53 20.69 19.55
2030 20.70 25.78 20.82 19.78
2031 20.99 26.11 20.97 20.04
2032 21.27 26.46 21.11 20.32
2033 21.57 26.80 21.25 20.59
2034 21.86 27.16 21.40 20.87
2035 22.15 27.51 21.54 21.16
2036 22.46 27.87 21.69 21.45

35
Evaluation of the DCSEU Performance Benchmarks—FY2016 Annual Evaluation Report (Final Draft). June 28, 2017
Year Commercial
Distillate Residential
Distillate Propane Kerosene
2037 22.77 28.24 21.84 21.74
2038 23.09 28.60 21.98 22.04
2039 23.40 28.97 22.14 22.34
2040 23.72 29.35 22.29 22.64
2041 24.05 29.74 22.44 22.95
2042 24.37 30.13 22.59 23.26
8.3.2 Environmental Adders Used in the DCSEU Societal Cost Test
For FY2016, the District of Columbia estimated the value of environmental adders by calculating the externality avoided costs based on reduced CO2 emissions. Below are excerpts from the DCSEU 2015 District Externality Values memo that specify the values and sources for fossil fuel and electricity for the evaluation period.55
Fossil Fuel Externalities
All of the fossil fuel externality values are based on the $100/ton CO2. The Avoided Energy Supply Component (AESC) 2013 Report mentioned above provided the values for natural gas and residential, commercial and industrial distillate (fuel oil). The commercial and industrial distillate externality values were combined into one value based on 2010 Energy Information Administration (EIA) data, which indicated 99.8% commercial versus 0.2% industrial distillate consumption. These values were inflated to 2015 dollars using a 2.39% inflation assumption.
The externality values for propane and kerosene were not provided in the AESC 2013 Report. These were calculated using the $100/ton CO2 and EIA emission factors of 63.07 kg CO2/MMBtu and 72.31 kg CO2/MMBtu for propane and kerosene, respectively.
The following table shows the externality values for fossil fuels used in FY2016.
Table 8-8. Fossil Fuel Externality Values FY2016 in 2016 Dollars
Natural Gas
Residential Distillate
Commercial Distillate Propane Kerosene
$/MMBtu $6.28 $8.76 $8.76 $7.42 $9.24
Electric Externalities56
The electric externalities are also based on $100 per short ton of CO2. Calculating the marginal electric externality value also required the marginal type of generation mix, the heat rate for each generation type, and the CO2 emissions rates by fuel type.
Combining all of the above factors together produces a weighted average electric externality for CO2 emissions of $ 0.062/kWh in 2013 dollars. Inflating by 2.39% (the FY2014 Future Inflation Rate) annual and inflating, the resultant by 2.38% (the FY2016 Future Inflation Rate) gives an electric externality value of $0.0713/kWh in 2015 dollars.
55 October 10, 2014 Memo from VEIC to Tetra Tech regarding 2015 DC Externality Values. 56 Ibid.

36
Evaluation of the DCSEU Performance Benchmarks—FY2016 Annual Evaluation Report (Final Draft). June 28, 2017
The above electric externality value assumes that none of the costs for CO2 abatement are internalized in the PEPCO electric avoided costs used for efficiency cost-effectiveness analysis in DC. If any of the costs are internalized, then that amount internalized for each particular year should be subtracted from the $0.0713/kWh externality value calculated above.
8.3.3 Other Adders Used in the DCSEU Societal Cost Test
In addition to environmental externality adders, DCSEU also includes Risk and Non-Energy Benefits adders in its program cost-effectiveness analysis. Each adder assumes a value of 10 percent. The adders are applied to total energy and capacity avoided costs.
Per the DCSEU contract, the definitions of these adders are as follows:
Risk adder: Recognizes the benefits of energy efficiency and conservation in addressing risk and uncertainty.
Non-energy benefits (NEB) adder: Recognizes the non-energy benefits of energy efficiency including comfort, noise reduction, aesthetics, health and safety, ease of selling/leasing home or building, improved occupant productivity, reduced work absences due to reduced illnesses, ability to stay in home/avoided moves, and macroeconomic benefits.
8.3.4 Conclusion
The total societal cost-benefit results for the portfolio ranges from 3.48 to 2.70, which means that the DCSEU continued to operate its initiatives in a very cost effective manner in FY2016. FY2015 societal cost-benefit results ranged from 5.07 to 4.06. On a track level basis, a review of Income Qualified Home Performance initiative (formerly the Federal Home Loan Bank initiative) and the Home Performance with ENERGY STAR initiative may be warranted to help increase the cost-effectiveness of these initiatives. The evaluation team has no other outstanding issues or recommendations regarding the DCSEU cost-effectiveness evaluation procedure.

37
Evaluation of the DCSEU Performance Benchmarks—FY2016 Annual Evaluation Report (Final Draft). June 28, 2017
APPENDIX A: APPENDIX A DCSEU QUALITY ASSURANCE AND ON-SITE M&V COORDINATION PILOT (PILOT)
In 2016, the DCSEU launched a Quality Assurance (QA) and On-Site M&V Coordination Pilot (Pilot) to test the viability and value of obtaining M&V evaluation results more quickly and to gain M&V access to participant sites that had historically been difficult to schedule. Traditionally, DCSEU’s M&V evaluation activities start soon after the end of the program year (November) and are completed within five months (March). With a fiscal year that starts in October, the M&V results for a fiscal year may not be known for up to a year and a half following the completion of a project. The goal of the pilot was to develop and test how DCSEU and its independent evaluator could coordinate to develop M&V results concurrent with a fiscal year and facilitate the program making changes to project savings or methodology before the end of a fiscal year and much sooner than the end of the evaluation period.
The Pilot began in April and concluded in August 2016. The Pilot team consisted of the District of Columbia Department of Energy and Environment (DOEE) which oversees DCSEU, the evaluation team (Tetra Tech, Leidos, and Baumann Consulting), and the DCSEU implementer, Vermont Energy Investment Corporation (VEIC). The objectives of the Pilot were to:
Provide feedback to the program implementers and staff sooner
Allow the evaluation team improved access to customer sites where otherwise the customer may refuse access at year-end due to additional time commitment or difficulty coordinating
Obtain an early start on evaluation activities and significantly reduce the number of on-site verification visits needed after the end of a fiscal year, while meeting the sampling requirements
Reduce customer fatigue and time spent on project verification.
In addition to the program and evaluation benefits, concurrent evaluation also has the potential to improve the experience of customers interacting with the DCSEU and its independent evaluator. Most customers do not distinguish between the quality assurance conducted by the program implementer and the M&V conducted by the evaluator. All participants recognize is that different people come back to them with similar questions, spaced out by a number of months, and in some cases up to 18 months after the installation of the energy conservation measure. Some of the more complex and custom installations can be time intensive, taking anywhere from multiple hours to conduct a QA review on the installed projects. Once a participant has invested this amount of time to complete the initial QA review, the M&V site visit can be perceived as an additional burden that had not been anticipated by the participant. This burden can cause program participants to refuse to engage with the independent evaluation, or lead to dissatisfaction with the DCSEU. DOEE staff members have heard these frustrations from building owners and managers in the District regarding this process, with the issue raising a concern that the additional evaluator site visit creates the potential for a customer to choose not to work with the DCSEU on subsequent potential energy efficiency projects.
Evaluation site visits that occur in the distant future after a project has been completed can also affect the quality and responsiveness of program participants. For example, property management firms have high staff turnover. When evaluators visit the location, potentially over a year after the project has been completed, the staff members involved with the project may no longer be present. For custom projects, this can lead to quality issues associated with baseline definitions or simply the recall of all the work that had been completed under for the project, reducing the quality of installation verification. In particular, the multifamily sector employees are busy building managers, with the need to inspect individual residential units, magnifying the challenge.

38
Evaluation of the DCSEU Performance Benchmarks—FY2016 Annual Evaluation Report (Final Draft). June 28, 2017
Finally, with an evaluation period lasting from approximately November through March, the number of site visits that need to be completed within the time-span can create bottleneck issues. The evaluation schedule can be affected, the ability to find a mutually acceptable schedule with a willing property owner is affected, and/or weather-related and holiday challenges can create challenges. As the M&V activities are a stepwise process, the M&V on-site review followed by incorporating the results into a desk audit, any delays experienced by site visits tightens the work schedule of the evaluation and risks sampling validity. Conducting on-site M&V visits throughout the program year would lower the number of on-site M&V visits that would need to be conducted at year end to meet the sampling requirement.
A.1 PILOT APPROACH
The Pilot team worked together to develop and implement a protocol to coordinate the evaluation team’s independent third-party M&V activities with DCSEU’s QA verification visits for 23 customer projects and provide fast feedback to DCSEU. Projects targeted for fast feedback were those with larger energy savings, greater complexity and risk in the savings estimates, and those in the multifamily market sector that historically were difficult to schedule M&V site visits. The Pilot focused on the Commercial Prescriptive Equipment Replacement, Commercial Custom, and Low Income Multifamily program tracks. The project files and the M&V feedback were reviewed immediately following the site visits to generate project-specific evaluation findings to program staff within a month of the project’s closing. While not a full engineering review, the project review allowed for identifying site specific issues that would influence savings calculations.
At the start of the Pilot, an implementation protocol for coordinating the on-site visits was put in place. The lead contacts for each organization were established and included a designated lead from Tetra Tech (Pilot lead), Baumann Consulting (M&V on-site visit lead), and DCSEU (QA coordination lead). The Pilot coordination process is outlined below.
1. DCSEU provided a list of custom, prescriptive, and multifamily projects scheduled to close over the period of the Pilot.
2. The evaluation team identified projects from the list that met the sampling savings thresholds or criteria and then notified DCSEU which projects were sampled and should receive a coordinated on-site visit.
3. DCSEU provided project files to the evaluation team for review that contained the most up-to-date savings calculations and detailed listing of the work that was done.
4. The EM&V team desk auditors reviewed the files and provided Baumann with a verification form that detailed the equipment installed and other pertinent information that required validation at the on-site visit.
5. DCSEU coordinated with Baumann to verify availability and to schedule the on-site visit with the customer, DCSEU, and Baumann. DCSEU sent a calendar invitation to all parties with the customer visit details and contact information.
6. The coordinated on-site visit occurred where both the implementer’s QA inspector and the evaluation M&V staff inspected the project and the assumption data.
7. The evaluation team’s on-site M&V findings were documented in a report and provided to the evaluation team’s desk auditor for review.
8. The M&V desk auditor conducted a high-level review of the findings and provided feedback to DCSEU.

39
Evaluation of the DCSEU Performance Benchmarks—FY2016 Annual Evaluation Report (Final Draft). June 28, 2017
9. The results and recommendations were discussed with the Pilot team in follow-up conference calls.
A.2 RESULTS
At the conclusion of the Pilot period, fast feedback findings were provided for 23 projects. Low-income multifamily projects were included as they became available, without regard to meeting any savings criteria other than having participated in the FY2016 initiatives.
Table A-1. Completed Pilot Projects by Track
Program track
Criteria
Projects That Met
Criteria
Projects Randomly
Sampled
Total
Commercial Prescriptive Equipment Replacement
100 MWh/4,500
MMBtu
4 9 13
Retrofit Commercial Custom 600 MWh/4,500
MMBtu
1 6 7
Low Income Multifamily Custom Projects & Low Income Multifamily Comprehensive
N/A N/A 3 3
Total 5 18 23
A.3 CONCLUSION
The Pilot team considers the pilot a success in that it met the proposed objectives of quicker evaluation feedback, reduced customer fatigue, allowed for better site access, and provided a head start on activities; however, lessons learned through the process could lead to greater impacts in the future.
The evaluation team found they had increased access to building staff who were more likely to be knowledgeable, helpful, answer questions, and quickly provide access to the project locations when accompanied by the DCSEU QA staff than they did when conducting on-site visits on their own at the end of the year. During previous years of M&V, customers often complained that the QA staff had already visited the project, and that the time spent dealing with both teams was cutting into their business or other duties, and/or that the financial incentive provided for the project was not worth the hassle. These complaints markedly decreased during the Pilot. The evaluation team also found the discussions with DCSEU staff were valuable to understanding the project. Furthermore, the evaluation team had access to sites, particularly low-income multifamily facilities, for which it had been difficult or impossible in the past to schedule on-site M&V visits at year-end. While the teams operated independently, the coordinated approach fostered teamwork between the evaluation team staff and the DCSEU implementation staff on the inspections.
From the implementation team’s perspective, feedback from the EM&V team was received while projects were still in the processing stage, which allowed for adjustments to the savings methodology or assumptions to be made as appropriate. DCSEU also leveraged the EM&V team’s feedback on the projects reviewed through the pilot to make adjustments on other projects in the programs, with the goal of alleviating systemic errors in documentation and process. As noted by the evaluation team, conducting site visits in tandem also led to greater collaboration between the EM&V team and DCSEU program staff, involving the implementation staff in the evaluation process in a much more direct way.

40
Evaluation of the DCSEU Performance Benchmarks—FY2016 Annual Evaluation Report (Final Draft). June 28, 2017
Their past exposure to evaluation results often came in the form of high level overviews and recommendations, and their direct involvement with the EM&V team gave them greater ownership of the evaluation process to spur ongoing improvement.
Throughout the Pilot planning and implementation, the evaluation team and the implementation team worked closely together to identify and address issues as they arose and to adjust the process as needed. In terms of improving the Pilot efforts and ensuring this new approach to evaluation provides greater value to both the EM&V and program implementation teams, there are several lessons learned that should be incorporated into future efforts that will help standardize the process and make it more efficient. These opportunities include:
Streamlining the Processes: Developing the site-visit criteria at the start of a program year would enable DCSEU and the evaluation team to know which projects were likely to trigger a site visit. Additionally, early notification of when projects are nearing completion would improve coordination. Reducing the number of DCSEU and evaluation team members involved with site visit coordination would also improve communications and allow for improved scheduling coordination.
Communication and Project Tracking: Coordination is essential for a concurrent effort to succeed. Evaluator access to project documentation and tracking information is essential for developing an M&V plan for a given site. Additionally, a culture of concurrent evaluation will need to be developed to ensure that DCSEU staff members are comfortable working closely with evaluation team staff, with DCSEU staff not feeling that their specific work is being judged and evaluation team staff not probing on subjects outside the goal of the M&V site visit. Developing and maintaining lines of communication is essential for the value of concurrent M&V activities to have successful outcomes.
Maximizing the Value of the Site Visit: The pilot effort found instances in which the equipment being reviewed for M&V had not been fully installed. Coordination to ensure that scheduled visits are conducted on truly completed projects will help manage costs and ensure that the value of concurrent M&V is achieved.
Documenting Project Changes: With the presentation of fast-feedback, DCSEU should document whether and in what way they changed a project’s savings results. Additionally, the evaluation team will need to communicate how results would be used for the portfolio recommendation so that DCSEU can take appropriate action. In some cases, they might be used to adjust project savings; while in other cases, they may be used to inform longer-term TRM adjustments. For adjusting project savings, DCSEU may elect to make the change or not, with the final evaluation results for a sampled site needing to be evaluated based on what action DCSEU chose to make to the project or across multiple projects, not all of which may had received a site visit.
A.4 SUMMARY
The Pilot team believes that the Pilot achieved its objectives and that it recognized the intended benefits outlined in the Pilot’s purpose. The Pilot was informative and a number of issues—particularly process issues—were resolved during the effort that can make this fast feedback approach more effective in the future. Furthermore, the DCSEU staff and the EM&V staff improved collaboration over the course of the Pilot. DOEE plans to continue evolving the fast feedback approach in FY2017, keeping in mind the lessons learned and future considerations highlighted above, in order to refine the efficiency of the process and to better understand the impacts that continuous improvement has on end-of-year realization rates.