Embed Size (px)
Citation preview
WHO/SDE/WSH/04.04 English only
Evaluation of the Costs and Benefits of Water and Sanitation Improvements at the Global
Level
Guy Hutton and
Laurence Haller
Water, Sanitation and Health Protection of the Human Environment
World Health Organization Geneva
2004
Evaluation of the Costs and Benefits of Water and Sanitation Improvements at the Global Level
World Health Organization 2004
The illustration of the cover page is extracted from Rescue Mission: Planet Earth,
© Peace Child International 1994; used by permission
Requests for permission to reproduce or translate WHO publications – whether for sale or for noncommercial distribution – should be addressed to Publications, at the above address (fax: +41 22 791 4806; email: [email protected]). The designations employed and the presentation of the material in this publication do not imply the expression of any opinion whatsoever on the part of the World Health Organization concerning the legal status of any country, territory, city or area or of its authorities, or concerning the delimitation of its frontiers or boundaries. The mention of specific companies or of certain manufacturers’ products does not imply that they are endorsed or recommended by the World Health Organization in preference to others of a similar nature that are not mentioned. Errors and omissions excepted, the names of proprietary products are distinguished by initial capital letters. The World Health Organization does not warrant that the information contained in this publication is complete and correct and shall not be liable for any damages incurred as a result of its use. The named authors alone are responsible for the views expressed in this publication
3
Summary The aim of this study was to estimate the economic costs and benefits of a range of selected interventions to improve water and sanitation services, with results presented for 17 WHO sub-regions and at the global level. Interventions evaluated include (1) improvements required to meet the millennium development goals (MDG) for water supply (by halving by 2015 the proportion of those without access to safe drinking water), (2) meet the water MDG plus halving by 2015 the proportion of those without access to adequate sanitation, (3)increasing access to improved water and sanitation for everyone, (4) providing disinfection at point-of-use over and above increasing access to improved water supply and sanitation (5) providing regulated piped water supply in house and sewage connection with partial sewerage for everyone. Predicted reductions in the incidence of diarrhoeal disease were calculated for each intervention based on the expected population receiving these interventions. The costs of the interventions included the full investment and annual running costs. The benefits of the interventions included time savings associated with better access to water and sanitation facilities, the gain in productive time due to less time spent ill, health sector and patients costs saved due to less treatment of diarrhoeal diseases, and the value of prevented deaths. The results show that all water and sanitation improvements were found to be cost-beneficial, and this applied to all world regions. In developing regions, the return on a US$1 investment was in the range US$5 to US$28 for intervention 1, remaining at similar levels for interventions 2, 3 and 4. The main contributor to benefits was the saving of time associated with better access to water supply and sanitation services. When different cost and benefit assumptions were used, the cost-benefit ratios changed considerably, but even under pessimistic scenarios the potential economic benefits generally outweighed the costs. Due to uncertainties in many of the data inputs, it is recommended to conduct detailed country case studies as a follow-up to this global analysis.
4
About the authors Guy Hutton is a health economist at the Swiss Tropical Institute, Socinstrasse 57, 4002 Basel, Switzerland - [email protected] Laurence Haller is an Associate Professional Officer in the Water, Sanitation and Health Unit of the Department of Protection of the Human Environment in the World Health Organization, 1211 Geneva 27, Switzerland - [email protected] Acknowledgements The authors would like to thank Tessa Tan-Torres and David Evans (EIP/FER) and Christopher Murray, former Executive Director EIP, World Health Organization, Geneva. Jamie Bartram, Robert Bos, Jose Hueb and Annette Prüss-Üstün of the Department for the Protection of the Human Environment (PHE), World Health Organization, Geneva, also provided valuable inputs into this paper.
5
Contents Page Introduction 7 Methods 9 Interventions 9 Geographical focus 11 Cost measurement 11 Health benefits 14 Non-health benefits 16 Results 23 Presentation of results 23 Numbers of people reached 23 Predicted health impact 24 Intervention costs 25 Treatment costs saved due to less cases of infectious diarrhoea 27 Days gained from less illness 29 Convenience time savings 31 Economic value of all benefits combined 34 Cost-benefit ratios 35 Sensitivity analysis 37 Discussion 39 Interpretation of main findings 39 Omission of variables 39 Financing considerations 40 References 43 Appendix 45
6
List of Tables in the main text Table 1: Water and sanitation coverage by region Table 2: Definition of ‘improved’ water supply and sanitation Table 3: Selected exposure scenarios Table 4: Initial investment cost per capita Table 5. Assumptions used in estimating annualized and recurrent costs Table 6. Annual costs for improvements on a per-person-reached basis Table 7: Relative risks with lower/upper uncertainty estimates for different scenarios Table 8: Distribution of the population in exposure scenarios, 2000 Table 9: Economic benefits arising from water and sanitation improvements Table 10: Calculation methodology, data sources and values for economic benefits Table 11: Number of people receiving improvements Table 12: Annual number of diarrhoeal cases avoided Table 13: Total annual cost of interventions Table 14: Annual cost per person receiving interventions Table 15: Annual health sector treatment costs saved Table 16: Annual patient treatment costs saved Table 17: Productive days gained due to less diarrhoeal illness Table 18: School attendance days gained due to less diarrhoeal illness Table 19: Healthy baby/infant days gained due to less diarrhoeal illness Table 20: Value of (adult) productive days gained due to less diarrhoeal illness Table 21: Annual time gain due to more convenient water supply and sanitation Table 22: Annual value of time savings Table 23: Value of avoided deaths per capita (based on predicted future earnings) Table 24: Total economic benefits of interventions Table 25: Cost-benefit ratios – all costs and all benefits included Table 26: Cost-benefit ratios under high cost and low benefit assumptions List of Figures Figure 1: Population reached by achieving the combined water and sanitation Millennium Development Goals, by world sub-region Figure 2: Distribution of diarrhoeal cases avoided if the combined water and sanitation Millennium Development Goals are achieved, by world sub-region Figure 3: Share of global costs of reaching combined water and sanitation Millennium Development Goals, by world sub-region Figure 4: Days of illness avoided due to meeting water and sanitation MDGs Figure 5: Value of time savings due to more convenient water supply and sanitation for the five interventions, in selected world sub-regions Figure 6: Distribution (%) of global economic benefits from improved water and sanitation (Intervention 2), by developing world sub-region Figure 7: Distribution of economic benefits by type of benefit in AFR-D Figure 8: Distribution of economic benefits by type of benefit in WPR-B1 Figure 9: Range on mean cost-benefit ratio for Intervention 2 under different assumptions for selected sub-regions (line drawn at CBR = 1)
7
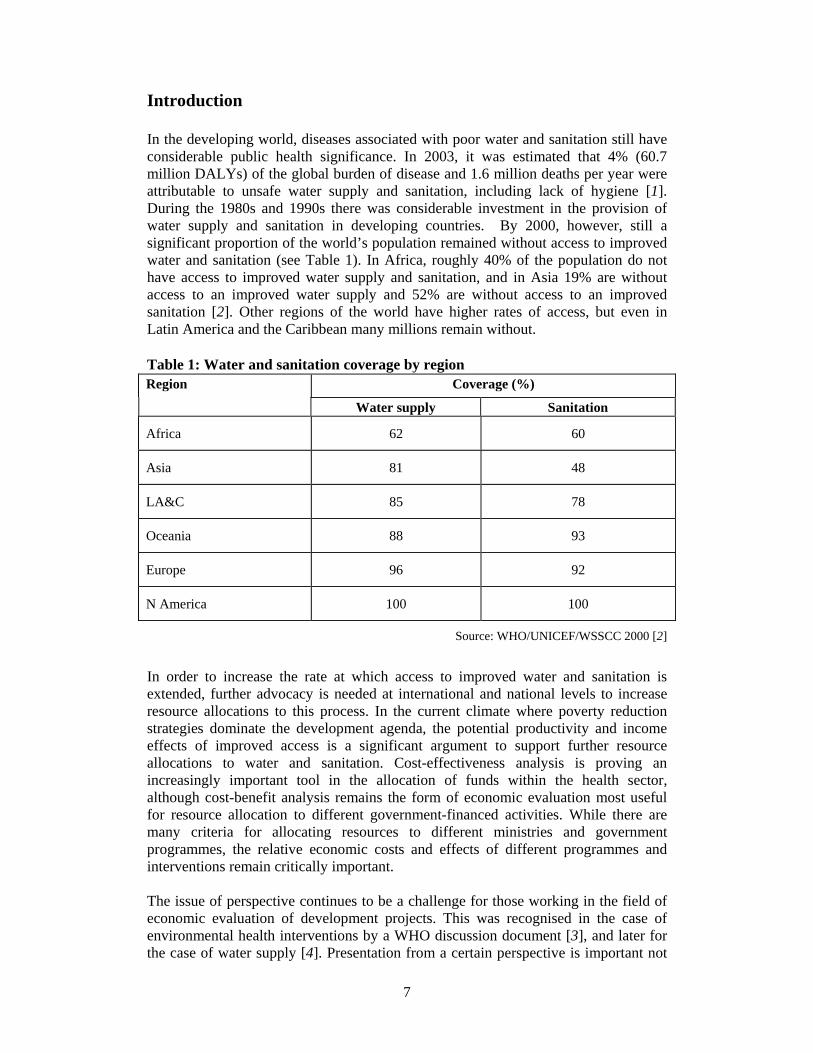
Introduction In the developing world, diseases associated with poor water and sanitation still have considerable public health significance. In 2003, it was estimated that 4% (60.7 million DALYs) of the global burden of disease and 1.6 million deaths per year were attributable to unsafe water supply and sanitation, including lack of hygiene [1]. During the 1980s and 1990s there was considerable investment in the provision of water supply and sanitation in developing countries. By 2000, however, still a significant proportion of the world’s population remained without access to improved water and sanitation (see Table 1). In Africa, roughly 40% of the population do not have access to improved water supply and sanitation, and in Asia 19% are without access to an improved water supply and 52% are without access to an improved sanitation [2]. Other regions of the world have higher rates of access, but even in Latin America and the Caribbean many millions remain without. Table 1: Water and sanitation coverage by region Region Coverage (%)
Water supply Sanitation
Africa 62 60
Asia 81 48
LA&C 85 78
Oceania 88 93
Europe 96 92
N America 100 100
Source: WHO/UNICEF/WSSCC 2000 [2] In order to increase the rate at which access to improved water and sanitation is extended, further advocacy is needed at international and national levels to increase resource allocations to this process. In the current climate where poverty reduction strategies dominate the development agenda, the potential productivity and income effects of improved access is a significant argument to support further resource allocations to water and sanitation. Cost-effectiveness analysis is proving an increasingly important tool in the allocation of funds within the health sector, although cost-benefit analysis remains the form of economic evaluation most useful for resource allocation to different government-financed activities. While there are many criteria for allocating resources to different ministries and government programmes, the relative economic costs and effects of different programmes and interventions remain critically important. The issue of perspective continues to be a challenge for those working in the field of economic evaluation of development projects. This was recognised in the case of environmental health interventions by a WHO discussion document [3], and later for the case of water supply [4]. Presentation from a certain perspective is important not
8
only from the point of view of financing, but knowing who benefits also helps in advocating interventions that target certain groups or entities, such as the poor, or perhaps private industry. In the case of improving access to water and sanitation, there are several considerations if the analysis is undertaken from the societal perspective:
• In terms of financing interventions, it is important to make a clear distinction between the public and private sectors or spheres. Should water and sanitation be provided at zero or subsidised cost by the government, or should the beneficiary pay the full cost? Are there other agencies that are able to bear some of the cost, such as non-governmental organisations or the private sector?
• In terms of who receives the benefit, a similar public-private distinction should
be made with a further desegregation by benefiting government ministry on the one hand (health, agriculture, trade, infrastructure, finance, etc.) and private sector beneficiary on the other (industry, agriculture, household).
Therefore, economic evaluation including cost-benefit analysis should not only aim to provide information on economic efficiency, but also provide other policy-relevant information on who benefits and, therefore, who may be willing to contribute to the financing of interventions.
9
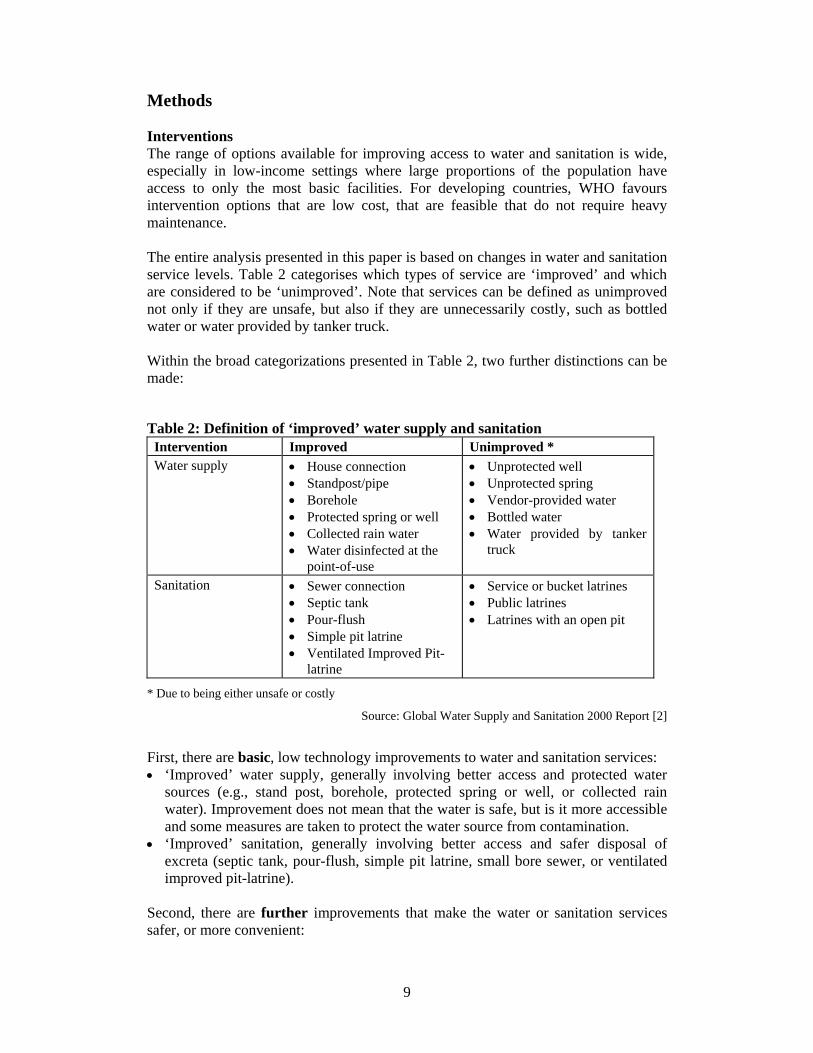
Methods Interventions The range of options available for improving access to water and sanitation is wide, especially in low-income settings where large proportions of the population have access to only the most basic facilities. For developing countries, WHO favours intervention options that are low cost, that are feasible that do not require heavy maintenance. The entire analysis presented in this paper is based on changes in water and sanitation service levels. Table 2 categorises which types of service are ‘improved’ and which are considered to be ‘unimproved’. Note that services can be defined as unimproved not only if they are unsafe, but also if they are unnecessarily costly, such as bottled water or water provided by tanker truck. Within the broad categorizations presented in Table 2, two further distinctions can be made: Table 2: Definition of ‘improved’ water supply and sanitation
Intervention Improved Unimproved * Water supply • House connection
• Standpost/pipe • Borehole • Protected spring or well • Collected rain water • Water disinfected at the
point-of-use
• Unprotected well • Unprotected spring • Vendor-provided water • Bottled water • Water provided by tanker
truck
Sanitation • Sewer connection • Septic tank • Pour-flush • Simple pit latrine • Ventilated Improved Pit-
latrine
• Service or bucket latrines • Public latrines • Latrines with an open pit
* Due to being either unsafe or costly
Source: Global Water Supply and Sanitation 2000 Report [2]
First, there are basic, low technology improvements to water and sanitation services: • ‘Improved’ water supply, generally involving better access and protected water
sources (e.g., stand post, borehole, protected spring or well, or collected rain water). Improvement does not mean that the water is safe, but is it more accessible and some measures are taken to protect the water source from contamination.
• ‘Improved’ sanitation, generally involving better access and safer disposal of excreta (septic tank, pour-flush, simple pit latrine, small bore sewer, or ventilated improved pit-latrine).
Second, there are further improvements that make the water or sanitation services safer, or more convenient:
10
• Water disinfection at the point of use. In the present analysis, the use of chlorine is examined.
• Personal hygiene education. Finally, there are high technology improvements such as • Regulated water supply through a household connection, providing water that is
safe for drinking. • Household connection to the sewerage system, and at least partial treatment of the
sewage.
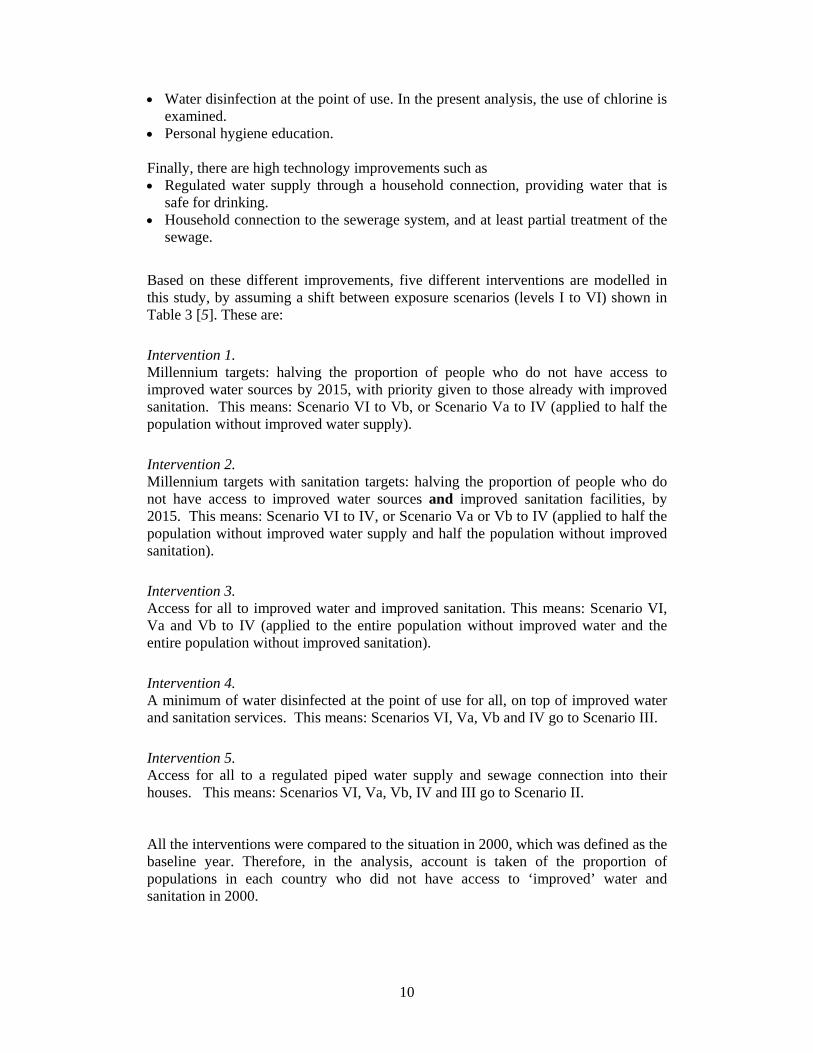
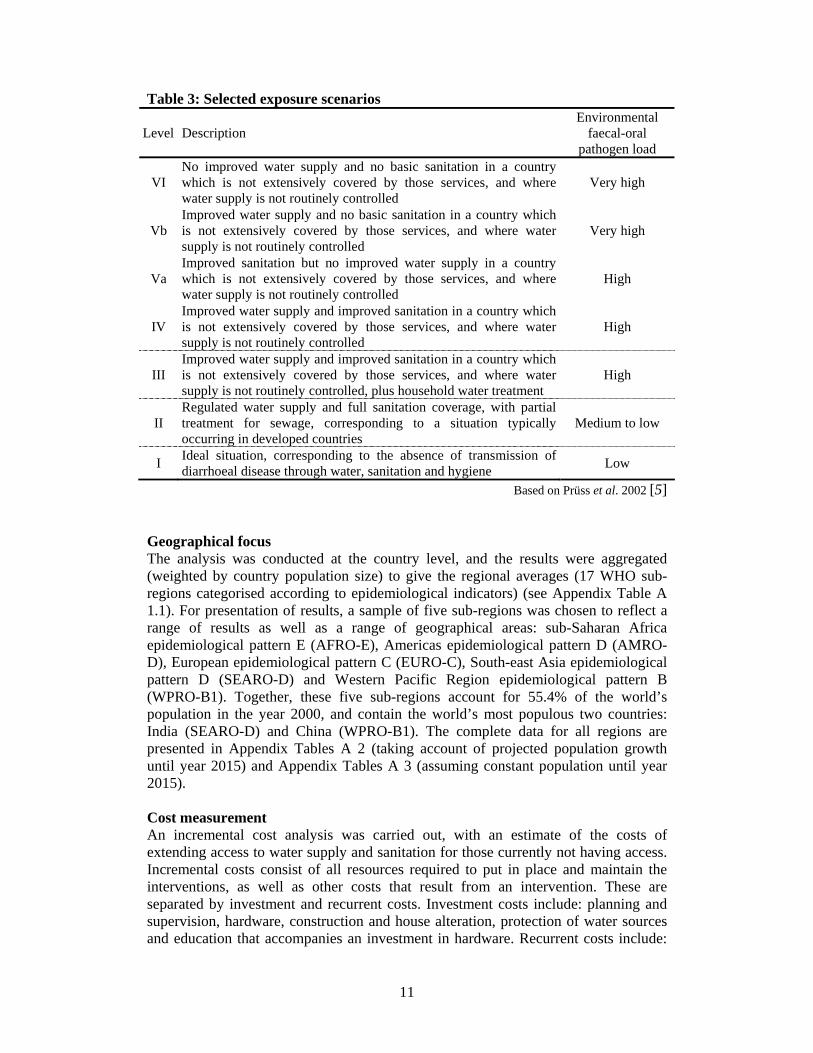
Based on these different improvements, five different interventions are modelled in this study, by assuming a shift between exposure scenarios (levels I to VI) shown in Table 3 [5]. These are: Intervention 1. Millennium targets: halving the proportion of people who do not have access to improved water sources by 2015, with priority given to those already with improved sanitation. This means: Scenario VI to Vb, or Scenario Va to IV (applied to half the population without improved water supply). Intervention 2. Millennium targets with sanitation targets: halving the proportion of people who do not have access to improved water sources and improved sanitation facilities, by 2015. This means: Scenario VI to IV, or Scenario Va or Vb to IV (applied to half the population without improved water supply and half the population without improved sanitation). Intervention 3. Access for all to improved water and improved sanitation. This means: Scenario VI, Va and Vb to IV (applied to the entire population without improved water and the entire population without improved sanitation). Intervention 4. A minimum of water disinfected at the point of use for all, on top of improved water and sanitation services. This means: Scenarios VI, Va, Vb and IV go to Scenario III. Intervention 5. Access for all to a regulated piped water supply and sewage connection into their houses. This means: Scenarios VI, Va, Vb, IV and III go to Scenario II. All the interventions were compared to the situation in 2000, which was defined as the baseline year. Therefore, in the analysis, account is taken of the proportion of populations in each country who did not have access to ‘improved’ water and sanitation in 2000.
11
Table 3: Selected exposure scenarios
Level Description Environmental
faecal-oral pathogen load
VI No improved water supply and no basic sanitation in a country which is not extensively covered by those services, and where water supply is not routinely controlled
Very high
Vb Improved water supply and no basic sanitation in a country which is not extensively covered by those services, and where water supply is not routinely controlled
Very high
Va Improved sanitation but no improved water supply in a country which is not extensively covered by those services, and where water supply is not routinely controlled
High
IV Improved water supply and improved sanitation in a country which is not extensively covered by those services, and where water supply is not routinely controlled
High
III Improved water supply and improved sanitation in a country which is not extensively covered by those services, and where water supply is not routinely controlled, plus household water treatment
High
II Regulated water supply and full sanitation coverage, with partial treatment for sewage, corresponding to a situation typically occurring in developed countries
Medium to low
I Ideal situation, corresponding to the absence of transmission of diarrhoeal disease through water, sanitation and hygiene Low
Based on Prüss et al. 2002 [5] Geographical focus The analysis was conducted at the country level, and the results were aggregated (weighted by country population size) to give the regional averages (17 WHO sub-regions categorised according to epidemiological indicators) (see Appendix Table A 1.1). For presentation of results, a sample of five sub-regions was chosen to reflect a range of results as well as a range of geographical areas: sub-Saharan Africa epidemiological pattern E (AFRO-E), Americas epidemiological pattern D (AMRO-D), European epidemiological pattern C (EURO-C), South-east Asia epidemiological pattern D (SEARO-D) and Western Pacific Region epidemiological pattern B (WPRO-B1). Together, these five sub-regions account for 55.4% of the world’s population in the year 2000, and contain the world’s most populous two countries: India (SEARO-D) and China (WPRO-B1). The complete data for all regions are presented in Appendix Tables A 2 (taking account of projected population growth until year 2015) and Appendix Tables A 3 (assuming constant population until year 2015). Cost measurement An incremental cost analysis was carried out, with an estimate of the costs of extending access to water supply and sanitation for those currently not having access. Incremental costs consist of all resources required to put in place and maintain the interventions, as well as other costs that result from an intervention. These are separated by investment and recurrent costs. Investment costs include: planning and supervision, hardware, construction and house alteration, protection of water sources and education that accompanies an investment in hardware. Recurrent costs include:
12
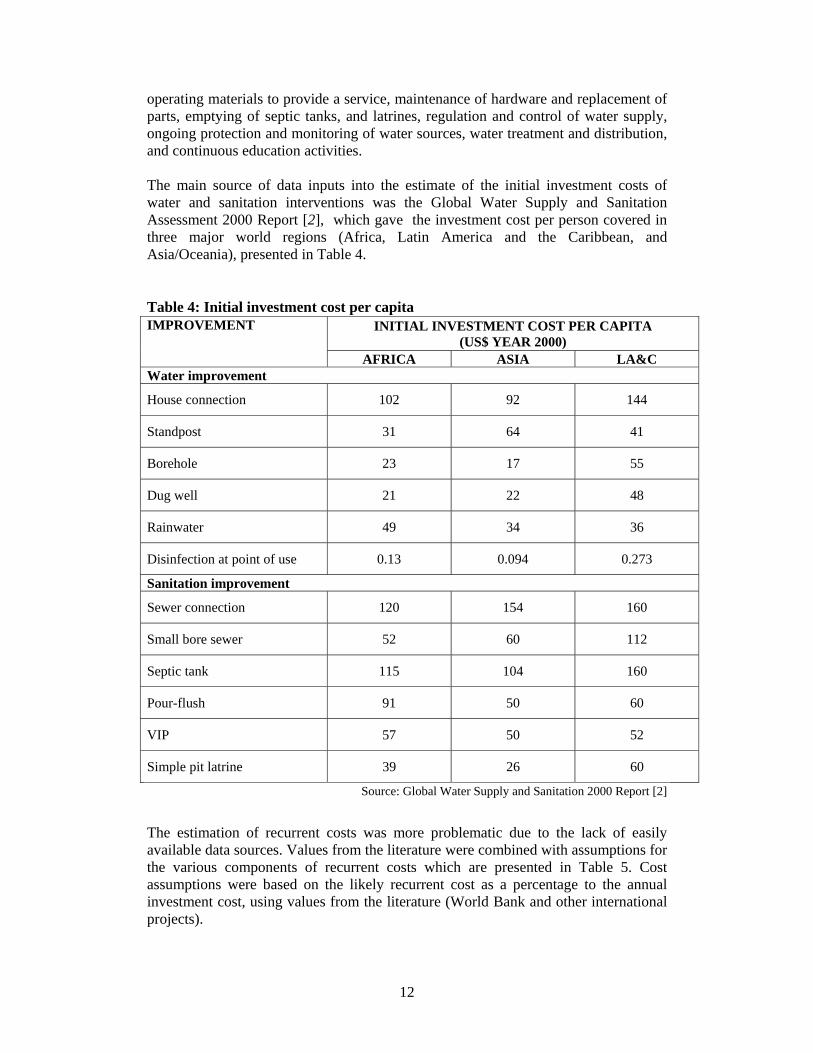
operating materials to provide a service, maintenance of hardware and replacement of parts, emptying of septic tanks, and latrines, regulation and control of water supply, ongoing protection and monitoring of water sources, water treatment and distribution, and continuous education activities. The main source of data inputs into the estimate of the initial investment costs of water and sanitation interventions was the Global Water Supply and Sanitation Assessment 2000 Report [2], which gave the investment cost per person covered in three major world regions (Africa, Latin America and the Caribbean, and Asia/Oceania), presented in Table 4. Table 4: Initial investment cost per capita
INITIAL INVESTMENT COST PER CAPITA (US$ YEAR 2000)
IMPROVEMENT
AFRICA ASIA LA&C Water improvement
House connection 102 92 144
Standpost 31 64 41
Borehole 23 17 55
Dug well 21 22 48
Rainwater 49 34 36
Disinfection at point of use 0.13 0.094 0.273
Sanitation improvement
Sewer connection 120 154 160
Small bore sewer 52 60 112
Septic tank 115 104 160
Pour-flush 91 50 60
VIP 57 50 52
Simple pit latrine 39 26 60
Source: Global Water Supply and Sanitation 2000 Report [2]
The estimation of recurrent costs was more problematic due to the lack of easily available data sources. Values from the literature were combined with assumptions for the various components of recurrent costs which are presented in Table 5. Cost assumptions were based on the likely recurrent cost as a percentage to the annual investment cost, using values from the literature (World Bank and other international projects).
13
Table 5. Assumptions used in estimating annualized and recurrent costs IMPROVEMENT Length of life
In years (+ range)
Operation, Maintenance,
Surveillance as % annual cost (+ range)
Education as % annual
cost (+ range)
Water source protection as
% annual cost (+ range)
Water improvement
Household connection 40 (30-50) 30 (30-30) - 10 (5-15)
Standpost 20 (10-30) 5 (0-10) - 10 (5-15)
Borehole 20 (10-30) 5 (0-10) - 5 (0-10)
Dug well 20 (10-30) 5 (0-10) - 5 (0-10)
Rainwater 20 (10-30) 10 (5-15) - 0
Sanitation improvement Sewer connection 40 (30-50) 30 (15-45) 5 (0-10) -
Septic tank 30 (20-40) 10 (0-10) *** 5 (0-10) -
VIP 20 (10-30) 5 (0-10) 5 (0-10) -
Simple pit latrine 20 (10-30) 5 (0-10) 5 (0-10) -
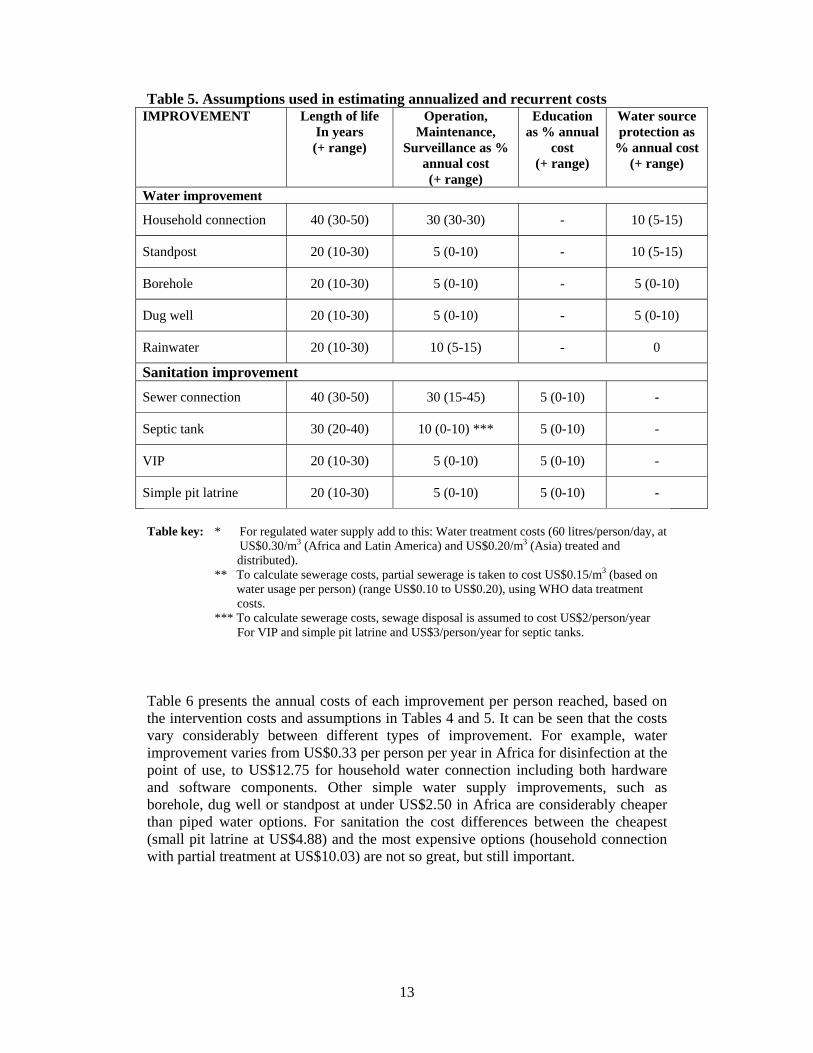
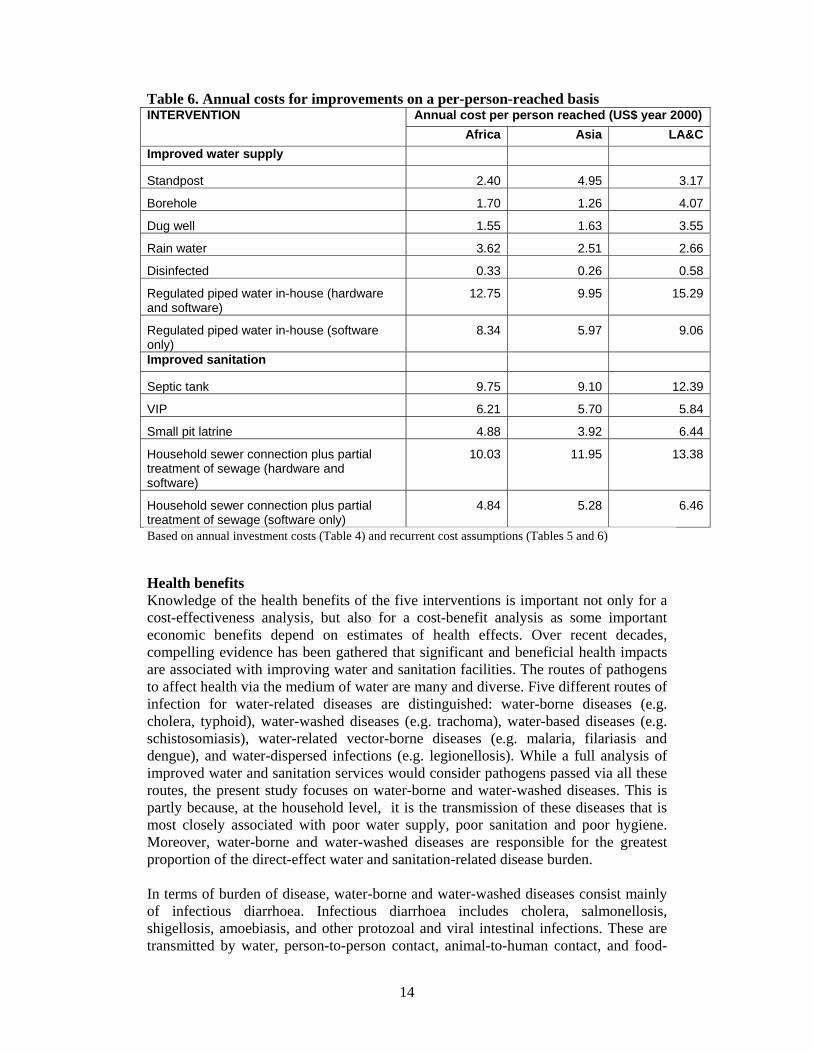
Table key: * For regulated water supply add to this: Water treatment costs (60 litres/person/day, at US$0.30/m3 (Africa and Latin America) and US$0.20/m3 (Asia) treated and distributed). ** To calculate sewerage costs, partial sewerage is taken to cost US$0.15/m3 (based on water usage per person) (range US$0.10 to US$0.20), using WHO data treatment costs. *** To calculate sewerage costs, sewage disposal is assumed to cost US$2/person/year For VIP and simple pit latrine and US$3/person/year for septic tanks. Table 6 presents the annual costs of each improvement per person reached, based on the intervention costs and assumptions in Tables 4 and 5. It can be seen that the costs vary considerably between different types of improvement. For example, water improvement varies from US$0.33 per person per year in Africa for disinfection at the point of use, to US$12.75 for household water connection including both hardware and software components. Other simple water supply improvements, such as borehole, dug well or standpost at under US$2.50 in Africa are considerably cheaper than piped water options. For sanitation the cost differences between the cheapest (small pit latrine at US$4.88) and the most expensive options (household connection with partial treatment at US$10.03) are not so great, but still important.
14
Table 6. Annual costs for improvements on a per-person-reached basis Annual cost per person reached (US$ year 2000) INTERVENTION
Africa Asia LA&CImproved water supply
Standpost 2.40 4.95 3.17
Borehole 1.70 1.26 4.07
Dug well 1.55 1.63 3.55
Rain water 3.62 2.51 2.66
Disinfected 0.33 0.26 0.58
Regulated piped water in-house (hardware and software)
12.75 9.95 15.29
Regulated piped water in-house (software only)
8.34 5.97 9.06
Improved sanitation
Septic tank 9.75 9.10 12.39
VIP 6.21 5.70 5.84
Small pit latrine 4.88 3.92 6.44
Household sewer connection plus partial treatment of sewage (hardware and software)
10.03 11.95 13.38
Household sewer connection plus partial treatment of sewage (software only)
4.84 5.28 6.46
Based on annual investment costs (Table 4) and recurrent cost assumptions (Tables 5 and 6) Health benefits Knowledge of the health benefits of the five interventions is important not only for a cost-effectiveness analysis, but also for a cost-benefit analysis as some important economic benefits depend on estimates of health effects. Over recent decades, compelling evidence has been gathered that significant and beneficial health impacts are associated with improving water and sanitation facilities. The routes of pathogens to affect health via the medium of water are many and diverse. Five different routes of infection for water-related diseases are distinguished: water-borne diseases (e.g. cholera, typhoid), water-washed diseases (e.g. trachoma), water-based diseases (e.g. schistosomiasis), water-related vector-borne diseases (e.g. malaria, filariasis and dengue), and water-dispersed infections (e.g. legionellosis). While a full analysis of improved water and sanitation services would consider pathogens passed via all these routes, the present study focuses on water-borne and water-washed diseases. This is partly because, at the household level, it is the transmission of these diseases that is most closely associated with poor water supply, poor sanitation and poor hygiene. Moreover, water-borne and water-washed diseases are responsible for the greatest proportion of the direct-effect water and sanitation-related disease burden. In terms of burden of disease, water-borne and water-washed diseases consist mainly of infectious diarrhoea. Infectious diarrhoea includes cholera, salmonellosis, shigellosis, amoebiasis, and other protozoal and viral intestinal infections. These are transmitted by water, person-to-person contact, animal-to-human contact, and food-
15
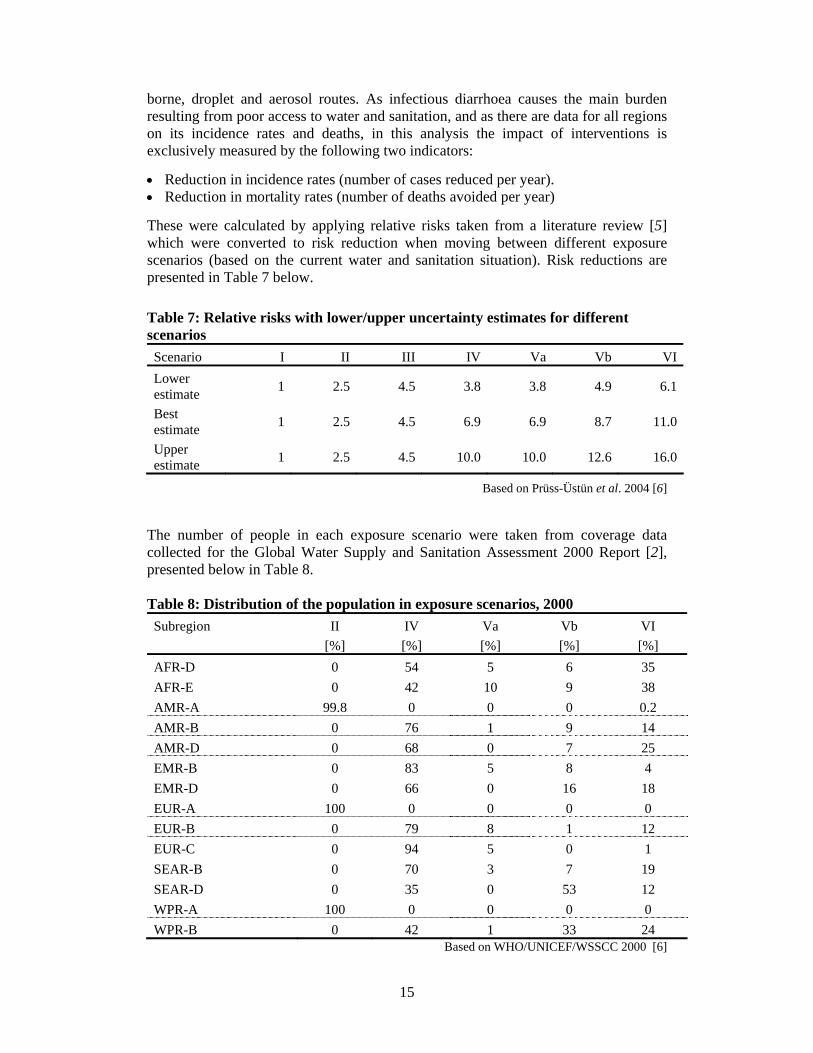
borne, droplet and aerosol routes. As infectious diarrhoea causes the main burden resulting from poor access to water and sanitation, and as there are data for all regions on its incidence rates and deaths, in this analysis the impact of interventions is exclusively measured by the following two indicators: • Reduction in incidence rates (number of cases reduced per year). • Reduction in mortality rates (number of deaths avoided per year) These were calculated by applying relative risks taken from a literature review [5] which were converted to risk reduction when moving between different exposure scenarios (based on the current water and sanitation situation). Risk reductions are presented in Table 7 below. Table 7: Relative risks with lower/upper uncertainty estimates for different scenarios Scenario I II III IV Va Vb VILower estimate 1 2.5 4.5 3.8 3.8 4.9 6.1
Best estimate 1 2.5 4.5 6.9 6.9 8.7 11.0
Upper estimate 1 2.5 4.5 10.0 10.0 12.6 16.0
Based on Prüss-Üstün et al. 2004 [6]
The number of people in each exposure scenario were taken from coverage data collected for the Global Water Supply and Sanitation Assessment 2000 Report [2], presented below in Table 8. Table 8: Distribution of the population in exposure scenarios, 2000 Subregion
II [%]
IV [%]
Va [%]
Vb [%]
VI [%]
AFR-D 0 54 5 6 35 AFR-E 0 42 10 9 38 AMR-A 99.8 0 0 0 0.2 AMR-B 0 76 1 9 14 AMR-D 0 68 0 7 25 EMR-B 0 83 5 8 4 EMR-D 0 66 0 16 18 EUR-A 100 0 0 0 0 EUR-B 0 79 8 1 12 EUR-C 0 94 5 0 1 SEAR-B 0 70 3 7 19 SEAR-D 0 35 0 53 12 WPR-A 100 0 0 0 0 WPR-B 0 42 1 33 24
Based on WHO/UNICEF/WSSCC 2000 [6]
16
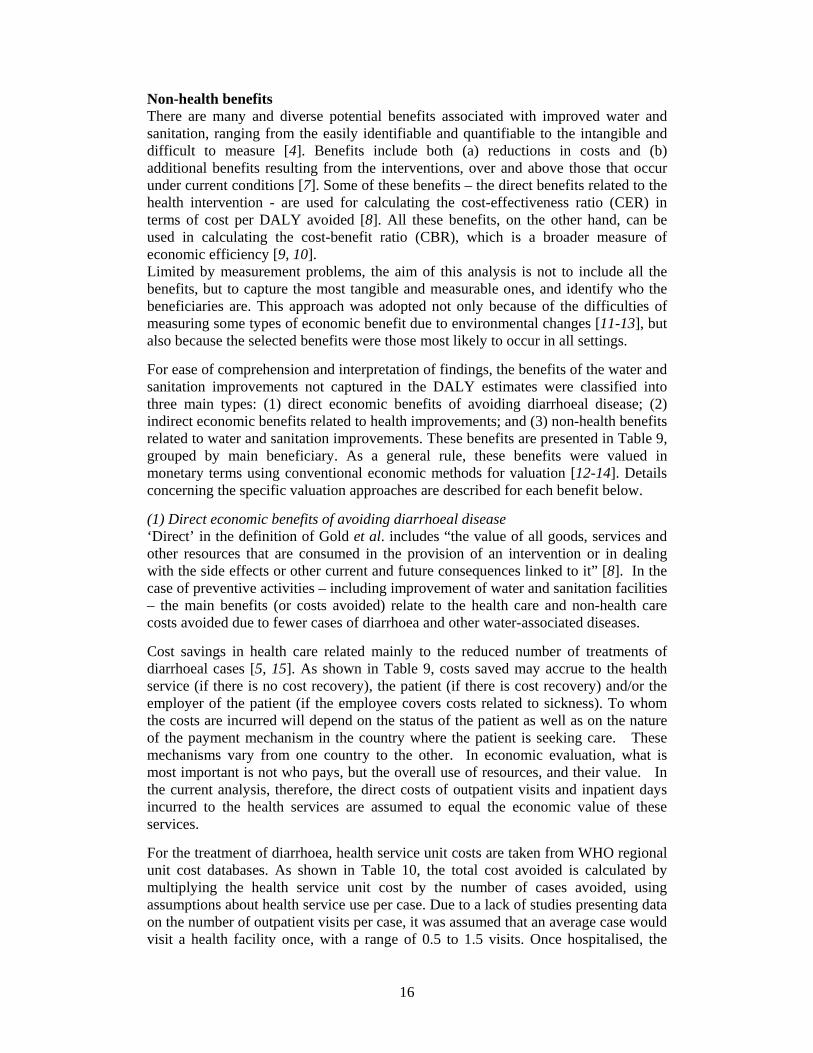
Non-health benefits There are many and diverse potential benefits associated with improved water and sanitation, ranging from the easily identifiable and quantifiable to the intangible and difficult to measure [4]. Benefits include both (a) reductions in costs and (b) additional benefits resulting from the interventions, over and above those that occur under current conditions [7]. Some of these benefits – the direct benefits related to the health intervention - are used for calculating the cost-effectiveness ratio (CER) in terms of cost per DALY avoided [8]. All these benefits, on the other hand, can be used in calculating the cost-benefit ratio (CBR), which is a broader measure of economic efficiency [9, 10]. Limited by measurement problems, the aim of this analysis is not to include all the benefits, but to capture the most tangible and measurable ones, and identify who the beneficiaries are. This approach was adopted not only because of the difficulties of measuring some types of economic benefit due to environmental changes [11-13], but also because the selected benefits were those most likely to occur in all settings. For ease of comprehension and interpretation of findings, the benefits of the water and sanitation improvements not captured in the DALY estimates were classified into three main types: (1) direct economic benefits of avoiding diarrhoeal disease; (2) indirect economic benefits related to health improvements; and (3) non-health benefits related to water and sanitation improvements. These benefits are presented in Table 9, grouped by main beneficiary. As a general rule, these benefits were valued in monetary terms using conventional economic methods for valuation [12-14]. Details concerning the specific valuation approaches are described for each benefit below. (1) Direct economic benefits of avoiding diarrhoeal disease ‘Direct’ in the definition of Gold et al. includes “the value of all goods, services and other resources that are consumed in the provision of an intervention or in dealing with the side effects or other current and future consequences linked to it” [8]. In the case of preventive activities – including improvement of water and sanitation facilities – the main benefits (or costs avoided) relate to the health care and non-health care costs avoided due to fewer cases of diarrhoea and other water-associated diseases. Cost savings in health care related mainly to the reduced number of treatments of diarrhoeal cases [5, 15]. As shown in Table 9, costs saved may accrue to the health service (if there is no cost recovery), the patient (if there is cost recovery) and/or the employer of the patient (if the employee covers costs related to sickness). To whom the costs are incurred will depend on the status of the patient as well as on the nature of the payment mechanism in the country where the patient is seeking care. These mechanisms vary from one country to the other. In economic evaluation, what is most important is not who pays, but the overall use of resources, and their value. In the current analysis, therefore, the direct costs of outpatient visits and inpatient days incurred to the health services are assumed to equal the economic value of these services. For the treatment of diarrhoea, health service unit costs are taken from WHO regional unit cost databases. As shown in Table 10, the total cost avoided is calculated by multiplying the health service unit cost by the number of cases avoided, using assumptions about health service use per case. Due to a lack of studies presenting data on the number of outpatient visits per case, it was assumed that an average case would visit a health facility once, with a range of 0.5 to 1.5 visits. Once hospitalised, the
17
average length of stay was assumed to equal 5 days (range 3 to 7). In the base case 8.2% of cases were assumed to be hospitalised (data collected by WHO) with a range of 5% to 10% of patients hospitalised. The rest were assumed to be ambulatory. For the sensitivity analysis the base case unit costs were multiplied by 0.75 and 1.25 for the low and high treatment cost savings, respectively. The unit costs included the full health care cost (consultation, medication, overheads, etc.). These data give a mean cost varying between US$10 and US$23 per case of diarrhoea treated, depending on which of the 14 sub-regions is considered. Table 9: Economic benefits arising from water and sanitation improvements BENEFICIARY Direct economic
benefits of avoiding diarrhoeal disease
Indirect economic benefits related to
health improvement
Non-health benefits related to water and
sanitation improvement Health sector Less expenditure on
treatment of diarrhoeal disease
Value of less health workers falling sick with diarrhoea
More efficiently managed water resources and effects on vector bionomics
Patients Less expenditure on treatment of diarrhoeal disease and less related costs
Less expenditure on transport in seeking treatment
Less time lost due to treatment seeking
Value of avoided days lost at work or at school
Value of avoided time lost of parent/ caretaker of sick children
Value of loss of death avoided
More efficiently managed water resources and effects on vector bionomics
Consumers Time savings related to water collection or accessing sanitary facilities
Labour-saving devices in household
Switch away from more expensive water sources
Property value rise Leisure activities and
non-use value Agricultural
and industrial
sectors
Less expenditure on treatment of employees with diarrhoeal disease
Less impact on productivity of ill-health of workers
Benefits to agriculture and industry of improved water supply, more efficient management of water resources – time-saving or income-generating technologies and land use changes
Direct costs of a non-health care nature are mainly those incurred to the patient, and are usually related to one or more visits to the health facility, such as transport costs, other expenses associated with a visit (e.g. food and drinks) and opportunity costs (e.g. time that could have been spent more productively). The most tangible patient cost included in the analysis refers to transport, although there is a lack of data on
18
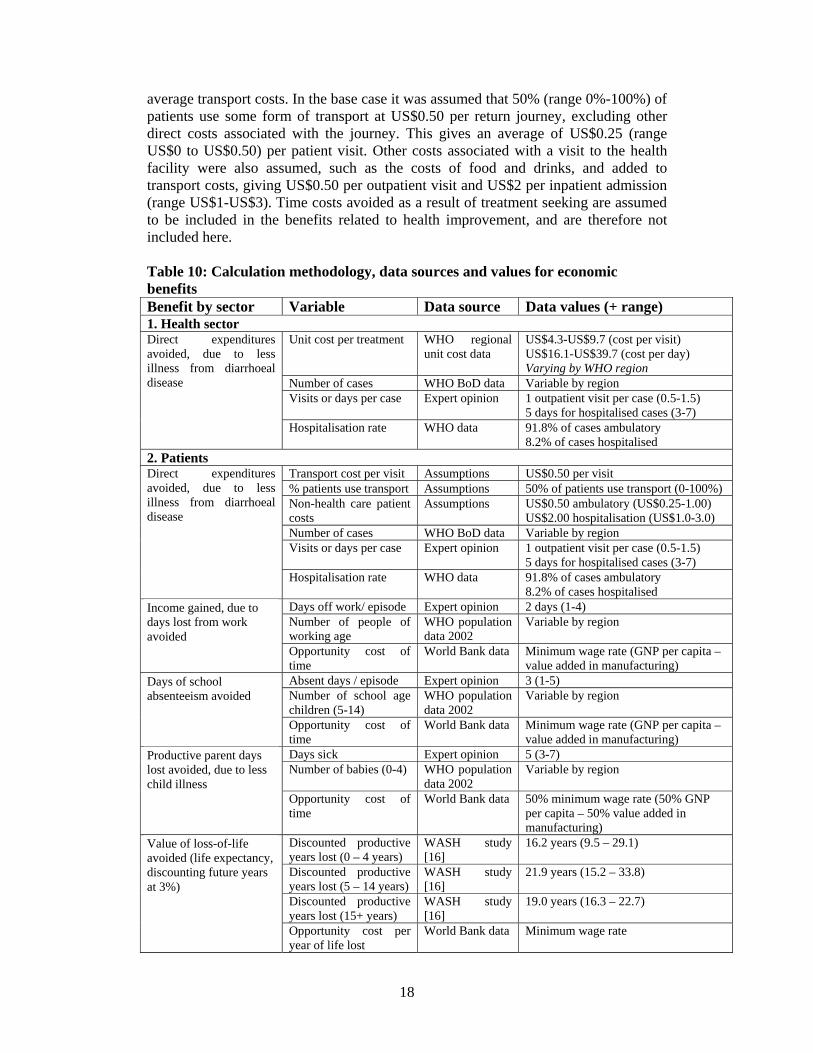
average transport costs. In the base case it was assumed that 50% (range 0%-100%) of patients use some form of transport at US$0.50 per return journey, excluding other direct costs associated with the journey. This gives an average of US$0.25 (range US$0 to US$0.50) per patient visit. Other costs associated with a visit to the health facility were also assumed, such as the costs of food and drinks, and added to transport costs, giving US$0.50 per outpatient visit and US$2 per inpatient admission (range US$1-US$3). Time costs avoided as a result of treatment seeking are assumed to be included in the benefits related to health improvement, and are therefore not included here. Table 10: Calculation methodology, data sources and values for economic benefits Benefit by sector Variable Data source Data values (+ range) 1. Health sector
Unit cost per treatment WHO regional unit cost data
US$4.3-US$9.7 (cost per visit) US$16.1-US$39.7 (cost per day) Varying by WHO region
Number of cases WHO BoD data Variable by region Visits or days per case Expert opinion 1 outpatient visit per case (0.5-1.5)
5 days for hospitalised cases (3-7)
Direct expenditures avoided, due to less illness from diarrhoeal disease
Hospitalisation rate WHO data 91.8% of cases ambulatory 8.2% of cases hospitalised
2. Patients Transport cost per visit Assumptions US$0.50 per visit % patients use transport Assumptions 50% of patients use transport (0-100%) Non-health care patient costs
Assumptions US$0.50 ambulatory (US$0.25-1.00) US$2.00 hospitalisation (US$1.0-3.0)
Number of cases WHO BoD data Variable by region Visits or days per case Expert opinion 1 outpatient visit per case (0.5-1.5)
5 days for hospitalised cases (3-7)
Direct expenditures avoided, due to less illness from diarrhoeal disease
Hospitalisation rate WHO data 91.8% of cases ambulatory 8.2% of cases hospitalised
Days off work/ episode Expert opinion 2 days (1-4) Number of people of working age
WHO population data 2002
Variable by region Income gained, due to days lost from work avoided
Opportunity cost of time
World Bank data Minimum wage rate (GNP per capita – value added in manufacturing)
Absent days / episode Expert opinion 3 (1-5) Number of school age children (5-14)
WHO population data 2002
Variable by region Days of school absenteeism avoided
Opportunity cost of time
World Bank data Minimum wage rate (GNP per capita – value added in manufacturing)
Days sick Expert opinion 5 (3-7) Number of babies (0-4) WHO population
data 2002 Variable by region
Productive parent days lost avoided, due to less child illness
Opportunity cost of time
World Bank data 50% minimum wage rate (50% GNP per capita – 50% value added in manufacturing)
Discounted productive years lost (0 – 4 years)
WASH study [16]
16.2 years (9.5 – 29.1)
Discounted productive years lost (5 – 14 years)
WASH study [16]
21.9 years (15.2 – 33.8)
Discounted productive years lost (15+ years)
WASH study [16]
19.0 years (16.3 – 22.7)
Value of loss-of-life avoided (life expectancy, discounting future years at 3%)
Opportunity cost per year of life lost
World Bank data Minimum wage rate
19
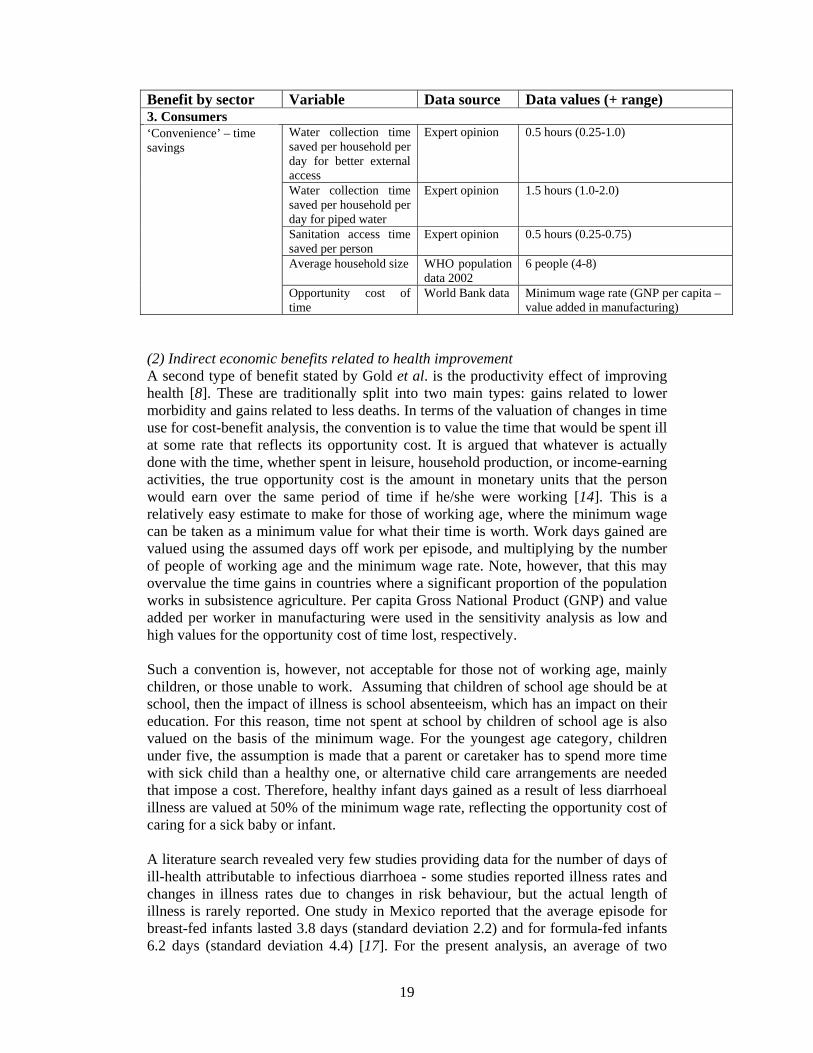
Benefit by sector Variable Data source Data values (+ range) 3. Consumers
Water collection time saved per household per day for better external access
Expert opinion 0.5 hours (0.25-1.0)
Water collection time saved per household per day for piped water
Expert opinion 1.5 hours (1.0-2.0)
Sanitation access time saved per person
Expert opinion 0.5 hours (0.25-0.75)
Average household size WHO population data 2002
6 people (4-8)
‘Convenience’ – time savings
Opportunity cost of time
World Bank data Minimum wage rate (GNP per capita – value added in manufacturing)
(2) Indirect economic benefits related to health improvement A second type of benefit stated by Gold et al. is the productivity effect of improving health [8]. These are traditionally split into two main types: gains related to lower morbidity and gains related to less deaths. In terms of the valuation of changes in time use for cost-benefit analysis, the convention is to value the time that would be spent ill at some rate that reflects its opportunity cost. It is argued that whatever is actually done with the time, whether spent in leisure, household production, or income-earning activities, the true opportunity cost is the amount in monetary units that the person would earn over the same period of time if he/she were working [14]. This is a relatively easy estimate to make for those of working age, where the minimum wage can be taken as a minimum value for what their time is worth. Work days gained are valued using the assumed days off work per episode, and multiplying by the number of people of working age and the minimum wage rate. Note, however, that this may overvalue the time gains in countries where a significant proportion of the population works in subsistence agriculture. Per capita Gross National Product (GNP) and value added per worker in manufacturing were used in the sensitivity analysis as low and high values for the opportunity cost of time lost, respectively. Such a convention is, however, not acceptable for those not of working age, mainly children, or those unable to work. Assuming that children of school age should be at school, then the impact of illness is school absenteeism, which has an impact on their education. For this reason, time not spent at school by children of school age is also valued on the basis of the minimum wage. For the youngest age category, children under five, the assumption is made that a parent or caretaker has to spend more time with sick child than a healthy one, or alternative child care arrangements are needed that impose a cost. Therefore, healthy infant days gained as a result of less diarrhoeal illness are valued at 50% of the minimum wage rate, reflecting the opportunity cost of caring for a sick baby or infant. A literature search revealed very few studies providing data for the number of days of ill-health attributable to infectious diarrhoea - some studies reported illness rates and changes in illness rates due to changes in risk behaviour, but the actual length of illness is rarely reported. One study in Mexico reported that the average episode for breast-fed infants lasted 3.8 days (standard deviation 2.2) and for formula-fed infants 6.2 days (standard deviation 4.4) [17]. For the present analysis, an average of two
20
working days lost were assumed per case (range: one to four days) for those of working age, while for those of school age three days of school attendance lost were assumed (range: one to five days). The duration of illness for babies and infants was assumed to be five days (range: three to seven days). While it is clear that the impact of a case of diarrhoea will vary from one individual to another (depending on the severity of infection, resistance of the individual and other determinants), in the absence of adequate data a sub-group analysis is not feasible. Therefore, all cases are valued according to a global average cost. Table 9 also shows other possible economic benefits related to health improvement. An implication for the health system is that there will be less health workers ill from diarrhoea, thus reducing disruption of the health service caused by staff absence. Similarly, the reduction of productive days lost due to less ill-health in the workforce will be an important benefit to agriculture and companies/industry. However, in order to avoid double counting of these benefits (patient benefits of working days lost avoided and companies' benefits of productivity lost avoided) they are excluded from this part of the analysis. In terms of diarrhoea associated deaths avoided following the introduction of improved water and sanitation, the expected number is predicted from the health impact model (number of cases avoided times case fatality rate, both of which vary by world region). The convention in traditional cost-benefit analysis is to value these deaths avoided at the discounted income stream of the individual whose death is avoided. If the death avoided was that of a child, then the discounted income stream is calculated from the age at which the person becomes productive. To estimate mortality costs the number of productive years ahead of the individual who would have died also needs to be valued, and depends on the age of the person whose life is saved, and therefore the life expectancy. Using assumptions from a previous cost-of-illness study, assumptions about length of productive life were: 40 years for the age group 0-4; 43 years for the age group 5-14; 25 years for the age group 15-59; and no years for the age group over 60 years [16]. Future benefits were discounted at 3% per year (range: 1% - 5%) and the minimum wage was used to reflect the opportunity cost. For those not yet in the workforce (those in the 0-4 and 5-15 age brackets) the current value for the future income stream was further discounted to take account of the time period before they become income earners. (3) Non-health benefits related to water and sanitation improvement Due to problems in measurement and quantification/valuation, and also because of substantial variability between settings, many non-health benefits of the interventions were not included in the present analysis [8]. For completeness sake, however, a brief overview of their nature is presented below. Beyond any argument, one of the major benefits of water and sanitation improvements is the time saving associated with better access. Time savings occur due to, for example, the relocation of a well or borehole to a site closer to user communities, the installation of piped water supply to households, closer access to latrines and shorter waiting times at public latrines. These time savings translate into either increased production, improved education levels or more leisure time. The value of convenience time savings is estimated by assuming a daily time saving per individual for water and sanitation facilities separately, and multiplying these by the
21
minimum wage rate for each sub-region. Different time saving assumptions are made based on whether the source is in the house (household connection) or in the community. In this global analysis estimates of time savings per household could not take into account the different methods of delivery of interventions and the mix of rural/urban locations in different countries and regions, due to the dearth of data on time uses in the literature. Even within single settings, considerable variations in access have been found. For example, a study from Kenya showed that journeys to a local well in a small town averaged between 10 and 30 minutes (median around 15 minutes); and journeys to a kiosk between 3 and 13 minutes (median around 10 minutes) [18]. In Vietnam, the World Bank reported the average daily household water collection time to be 36 minutes [19]. However, to collect enough water for the entire household would require more than one visit, thus requiring closer to one hour or more per household per day. Given the large variation in water availability, it is recognised that savings could vary from a few minutes a day to several hours. For example, a study from Nigeria anecdotally reported that in the dry seasons average journey time to the local springs was 4-7 hours for some rural communities, which does not include waiting time at the spring [20]. Given these wide variations quoted in the literature, as well as the expected enormous differences between settings in the developing world in water availability (current and future), this analysis made general assumptions about time savings following water improvements. It was assumed that, on average, a household gaining access to improved water supply will save 30 minutes per day (range: 15 to 60 minutes) and households receiving piped water 90 minutes per day (range: 60 to 120 minutes). These assumptions give 30.4 and 91.25 hours saved per individual per year, for improved access and piped water, respectively, assuming six members per household (range: eight members for low cost assumption and four members for high cost assumption). For improved sanitation, no data were found in the literature for an estimate of time saved per day due to less distant sanitation facilities and less waiting time. Therefore, after consultation with sanitation experts, an assumption was made of 30 minutes saved per person per day, from improvements along the above lines. This assumption gives 182.5 hours per person per year saved. Time savings for all age categories are valued at the minimum wage, with GNP per capita used as the low value, and value added per worker in manufacturing as the high value. Studies by Whittington in Africa showed that households valued their time spent collecting water at around the average wage rate for unskilled labour [18]. The other benefits tabulated in the final column of Table 9 were not included in the cost-benefit analysis. These benefits relate mainly to improved water supply and they are described briefly below, with a justification for leaving them out.
• Indirect effects on vector-borne disease transmission resulting from water and sanitation improvements depend on many local factors and are therefore globally not predictable.
• Costs avoided due to reduced reliance on expensive water sources /such as
vendors) or on unsafe water purification methods, due to increased availability of cheaper water and phasing out hazardous methods of water purification such as boiling. These gains are excluded for economic reasons. For example, from the societal point of view, water purchases from vendors are a transfer payment and do not represent an economic loss or gain compared to the use of other sources.
22
• In areas with improved water and sanitation, property value is likely to increase [11]. Such an increase is, however, indirect and difficult to evaluate without databases from different regions, and if entire areas receive the improvements the market may not be able to support price increases. Moreover, property value increases represent a transfer of resources and not a gain to society per se.
• There are also leisure activities (e.g. boating, fishing), aesthetics and non-use
values associated with improvements in water and sanitation. Non-use is divided into option value (the possibility that the person may want to use it in the future), existence value (the person values the fact that the environmental good exists, irrespective of use), and bequest value (the person wants future generations to enjoy it). However, these are difficult to value, and there are very few data available on these benefits [12, 13, 21].
• Improved water supply also leads to economic benefits related to options for
labour-saving devices and increased water access, due to changes in location of water sources and increases in water quantity available. These include benefits within the home (e.g. time savings of buying a washing machine, or the home production and small business possibilities), as well as in agriculture or private industry. Agricultural benefits may mean a change in land use (e.g. due to reclaimed land), loss of land (if a reservoir is created), or the option to chose different crops due to increased water availability. However, there are huge variations as well as uncertainties associated with these benefits and costs, especially in a global analysis, and therefore they are left out in this study.
23
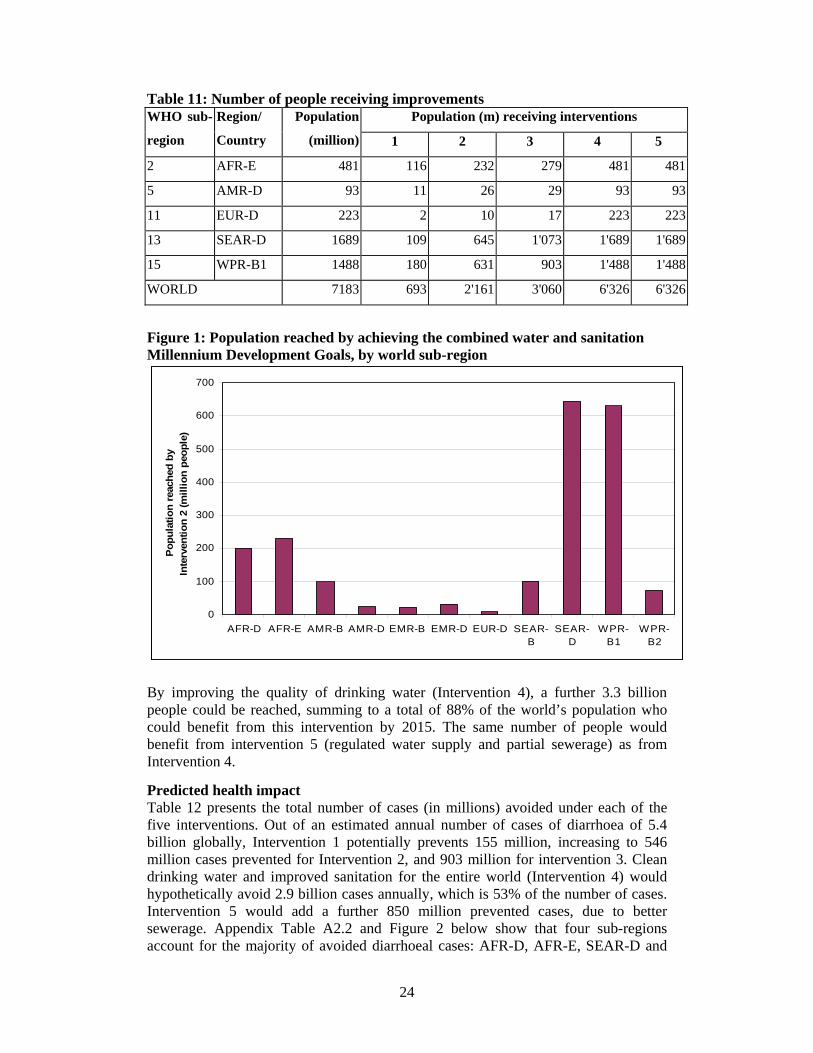
Results Presentation of results This analysis generated a huge quantity of data. Selected results are presented for the five interventions and for the five selected WHO sub-regions discussed above, and include (a) the number of people receiving water and sanitation improvements from each intervention, (b) the number of cases of diarrhoea prevented per year, (c) the intervention costs, (d) the potential benefits resulting from the interventions, and (e) finally the cost-benefit ratios. Cost-benefit ratios are presented for all costs and benefits together, followed by costs and selected benefits. All costs are presented in US$ in the year 2000. Costs and benefits are presented assuming that all the interventions are implemented within a one-year period (the year 2000), hence requiring the annualisation of investment costs using a standard formula (see Table 5 for length of life assumptions) [7]. All results are presented under two assumptions about population growth, first at projected population figures for 2015, and second assuming no population growth from 2000 until 2015. The sensitivity analysis presented reflects the high cost assumptions and low benefit assumptions, to give the most conservative cost-benefit ratios. The ranges used are shown in brackets when presenting the mean values in the text above and Table 9. In brief, the calculation of the total societal economic benefit is the sum of: (1) Health sector benefit due to avoided illness (2) Patient expenses avoided due to avoided illness (3) Value of deaths avoided (4) Value of time savings due to access to water and sanitation (5) Value of productive days gained of those with avoided illness (6) Value of days of school attendance gained of those with avoided illness (7) Value of child days gained of those with avoided illness Numbers of people reached Table 11 presents the number of people receiving improvements by selected WHO sub-regions (AFRO-E, AMRO-D, EURO-D, SEARO-D and WPRO-B1). Appendix Table A2.1 shows the results for all WHO sub-regions. Overall, 693 million people would receive improvements in water supply if the MDG target for water was reached. This corresponds to 9.6% of the world’s population by the year 2015. If the sanitation targets were also met (intervention 2), an additional 20.6% - about 1.5 billion people - of the world’s population would receive an improvement. Figure 1 shows that the majority of this population is from SEAR-D, WPR-B1, AFR-D and AFR-E. In bringing improved water and sanitation to all those currently without improved water or sanitation, 42.6% of the world’s population would be reached. For many of the least developed sub-regions, at least half of the population is reached by Intervention 3. At a global level, 3 billion people could benefit from improving water supply and sanitation that are currently without improved services. About two thirds of this population are in two sub-regions: SEAR-D and WPR-B1.
24
Table 11: Number of people receiving improvements Population (m) receiving interventions WHO sub-
region
Region/
Country
Population
(million) 1 2 3 4 5
2 AFR-E 481 116 232 279 481 481
5 AMR-D 93 11 26 29 93 93
11 EUR-D 223 2 10 17 223 223
13 SEAR-D 1689 109 645 1'073 1'689 1'689
15 WPR-B1 1488 180 631 903 1'488 1'488
WORLD 7183 693 2'161 3'060 6'326 6'326 Figure 1: Population reached by achieving the combined water and sanitation Millennium Development Goals, by world sub-region
0
100
200
300
400
500
600
700
AFR-D AFR-E AMR-B AMR-D EMR-B EMR-D EUR-D SEAR-B
SEAR-D
WPR-B1
WPR-B2
Pop
ulat
ion
reac
hed
by
Inte
rven
tion
2 (m
illio
n pe
ople
)
By improving the quality of drinking water (Intervention 4), a further 3.3 billion people could be reached, summing to a total of 88% of the world’s population who could benefit from this intervention by 2015. The same number of people would benefit from intervention 5 (regulated water supply and partial sewerage) as from Intervention 4.
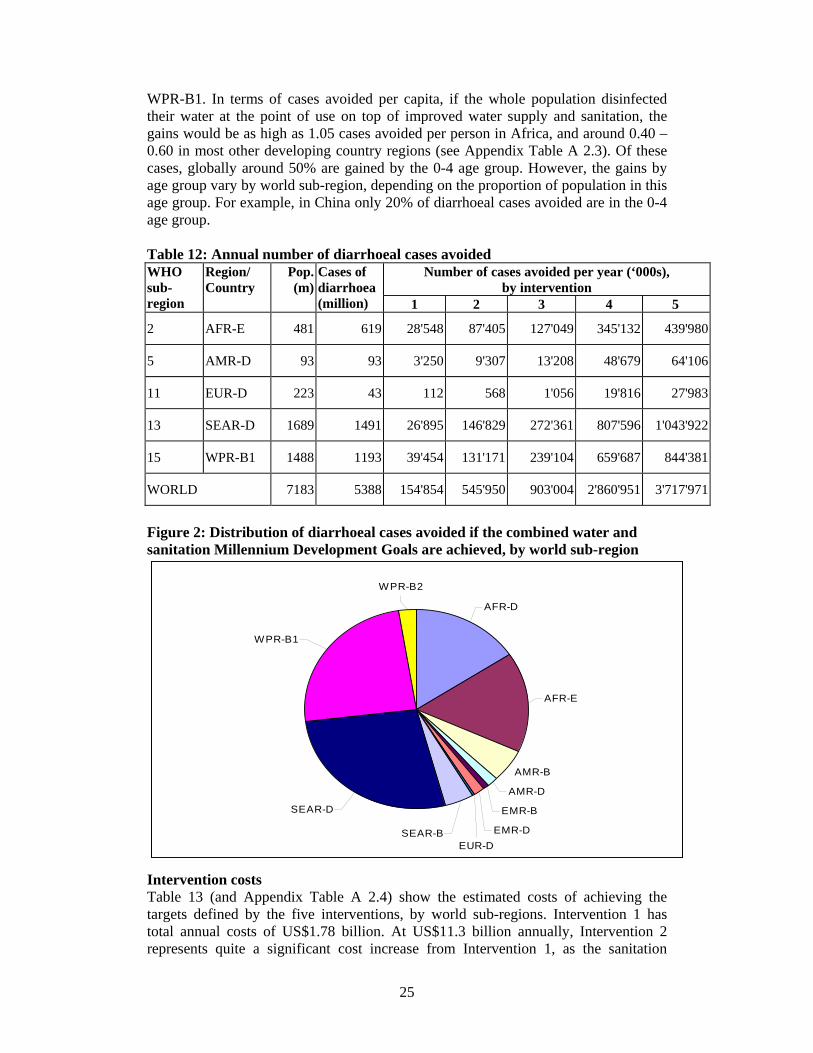
Predicted health impact Table 12 presents the total number of cases (in millions) avoided under each of the five interventions. Out of an estimated annual number of cases of diarrhoea of 5.4 billion globally, Intervention 1 potentially prevents 155 million, increasing to 546 million cases prevented for Intervention 2, and 903 million for intervention 3. Clean drinking water and improved sanitation for the entire world (Intervention 4) would hypothetically avoid 2.9 billion cases annually, which is 53% of the number of cases. Intervention 5 would add a further 850 million prevented cases, due to better sewerage. Appendix Table A2.2 and Figure 2 below show that four sub-regions account for the majority of avoided diarrhoeal cases: AFR-D, AFR-E, SEAR-D and
25
WPR-B1. In terms of cases avoided per capita, if the whole population disinfected their water at the point of use on top of improved water supply and sanitation, the gains would be as high as 1.05 cases avoided per person in Africa, and around 0.40 – 0.60 in most other developing country regions (see Appendix Table A 2.3). Of these cases, globally around 50% are gained by the 0-4 age group. However, the gains by age group vary by world sub-region, depending on the proportion of population in this age group. For example, in China only 20% of diarrhoeal cases avoided are in the 0-4 age group. Table 12: Annual number of diarrhoeal cases avoided
Number of cases avoided per year (‘000s), by intervention
WHO sub- region
Region/ Country
Pop. (m)
Cases of diarrhoea(million) 1 2 3 4 5
2 AFR-E 481 619 28'548 87'405 127'049 345'132 439'980
5 AMR-D 93 93 3'250 9'307 13'208 48'679 64'106
11 EUR-D 223 43 112 568 1'056 19'816 27'983
13 SEAR-D 1689 1491 26'895 146'829 272'361 807'596 1'043'922
15 WPR-B1 1488 1193 39'454 131'171 239'104 659'687 844'381
WORLD 7183 5388 154'854 545'950 903'004 2'860'951 3'717'971
Figure 2: Distribution of diarrhoeal cases avoided if the combined water and sanitation Millennium Development Goals are achieved, by world sub-region
AMR-B
AMR-D
EMR-B
EMR-D
SEAR-D
WPR-B1
WPR-B2
AFR-D
AFR-E
EUR-DSEAR-B
Intervention costs Table 13 (and Appendix Table A 2.4) show the estimated costs of achieving the targets defined by the five interventions, by world sub-regions. Intervention 1 has total annual costs of US$1.78 billion. At US$11.3 billion annually, Intervention 2 represents quite a significant cost increase from Intervention 1, as the sanitation
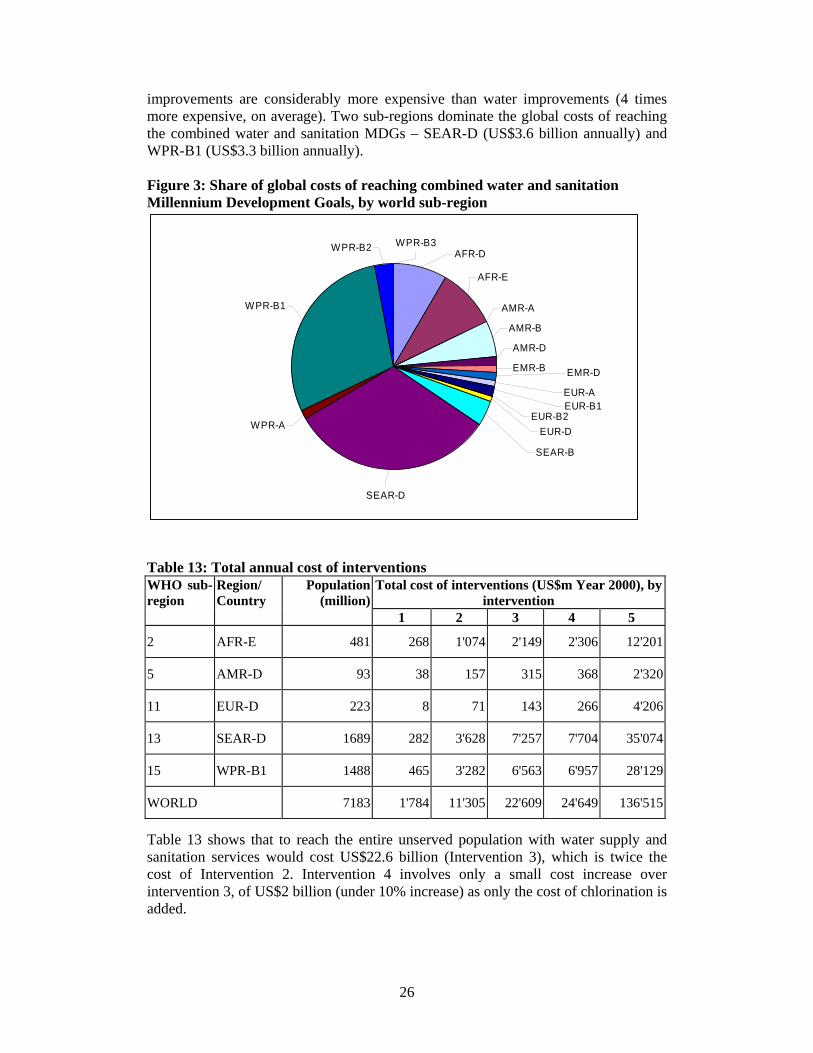
26
improvements are considerably more expensive than water improvements (4 times more expensive, on average). Two sub-regions dominate the global costs of reaching the combined water and sanitation MDGs – SEAR-D (US$3.6 billion annually) and WPR-B1 (US$3.3 billion annually). Figure 3: Share of global costs of reaching combined water and sanitation Millennium Development Goals, by world sub-region
AMR-A
AMR-B
AMR-D
EMR-B
SEAR-D
WPR-B1
WPR-A
WPR-B2 WPR-B3
SEAR-B
EUR-A
EMR-D
AFR-E
AFR-D
EUR-DEUR-B2
EUR-B1
Table 13: Total annual cost of interventions Total cost of interventions (US$m Year 2000), by
intervention WHO sub- region
Region/ Country
Population (million)
1 2 3 4 5
2 AFR-E 481 268 1'074 2'149 2'306 12'201
5 AMR-D 93 38 157 315 368 2'320
11 EUR-D 223 8 71 143 266 4'206
13 SEAR-D 1689 282 3'628 7'257 7'704 35'074
15 WPR-B1 1488 465 3'282 6'563 6'957 28'129
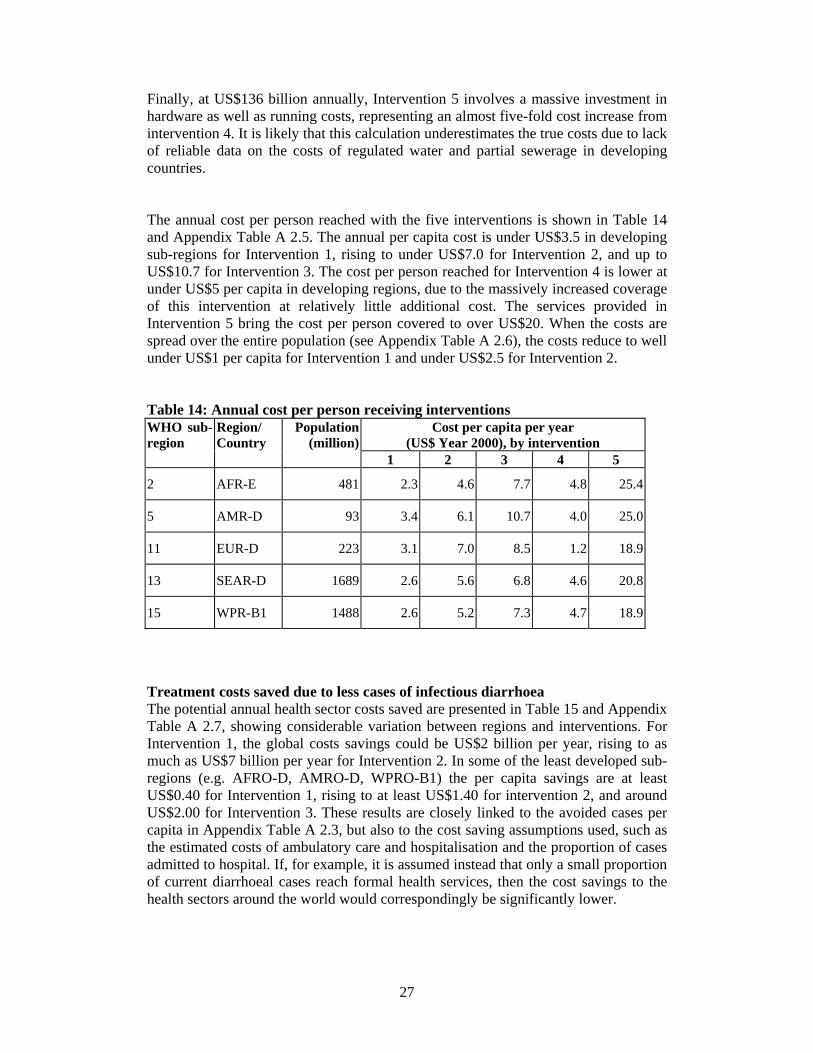
WORLD 7183 1'784 11'305 22'609 24'649 136'515 Table 13 shows that to reach the entire unserved population with water supply and sanitation services would cost US$22.6 billion (Intervention 3), which is twice the cost of Intervention 2. Intervention 4 involves only a small cost increase over intervention 3, of US$2 billion (under 10% increase) as only the cost of chlorination is added.
27
Finally, at US$136 billion annually, Intervention 5 involves a massive investment in hardware as well as running costs, representing an almost five-fold cost increase from intervention 4. It is likely that this calculation underestimates the true costs due to lack of reliable data on the costs of regulated water and partial sewerage in developing countries. The annual cost per person reached with the five interventions is shown in Table 14 and Appendix Table A 2.5. The annual per capita cost is under US$3.5 in developing sub-regions for Intervention 1, rising to under US$7.0 for Intervention 2, and up to US$10.7 for Intervention 3. The cost per person reached for Intervention 4 is lower at under US$5 per capita in developing regions, due to the massively increased coverage of this intervention at relatively little additional cost. The services provided in Intervention 5 bring the cost per person covered to over US$20. When the costs are spread over the entire population (see Appendix Table A 2.6), the costs reduce to well under US$1 per capita for Intervention 1 and under US$2.5 for Intervention 2.
Table 14: Annual cost per person receiving interventions Cost per capita per year
(US$ Year 2000), by intervention WHO sub- region
Region/ Country
Population (million)
1 2 3 4 5
2 AFR-E 481 2.3 4.6 7.7 4.8 25.4
5 AMR-D 93 3.4 6.1 10.7 4.0 25.0
11 EUR-D 223 3.1 7.0 8.5 1.2 18.9
13 SEAR-D 1689 2.6 5.6 6.8 4.6 20.8
15 WPR-B1 1488 2.6 5.2 7.3 4.7 18.9
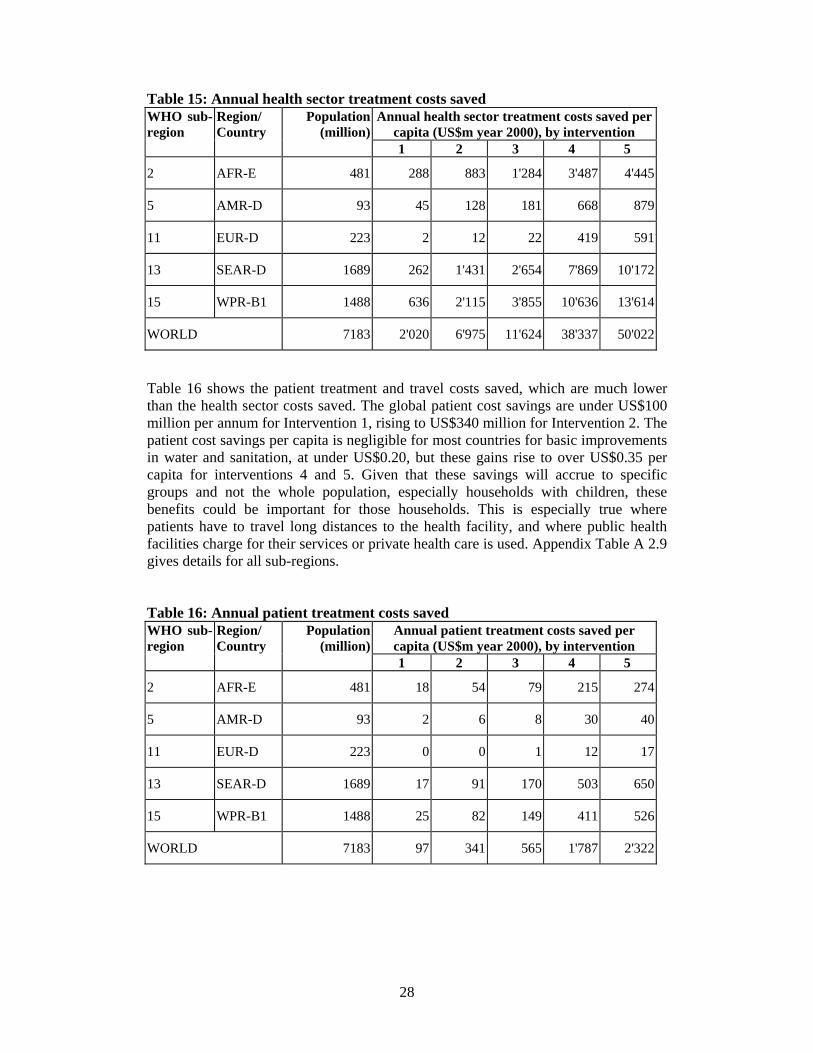
Treatment costs saved due to less cases of infectious diarrhoea The potential annual health sector costs saved are presented in Table 15 and Appendix Table A 2.7, showing considerable variation between regions and interventions. For Intervention 1, the global costs savings could be US$2 billion per year, rising to as much as US$7 billion per year for Intervention 2. In some of the least developed sub-regions (e.g. AFRO-D, AMRO-D, WPRO-B1) the per capita savings are at least US$0.40 for Intervention 1, rising to at least US$1.40 for intervention 2, and around US$2.00 for Intervention 3. These results are closely linked to the avoided cases per capita in Appendix Table A 2.3, but also to the cost saving assumptions used, such as the estimated costs of ambulatory care and hospitalisation and the proportion of cases admitted to hospital. If, for example, it is assumed instead that only a small proportion of current diarrhoeal cases reach formal health services, then the cost savings to the health sectors around the world would correspondingly be significantly lower.
28
Table 15: Annual health sector treatment costs saved Annual health sector treatment costs saved per
capita (US$m year 2000), by intervention WHO sub- region
Region/ Country
Population (million)
1 2 3 4 5
2 AFR-E 481 288 883 1'284 3'487 4'445
5 AMR-D 93 45 128 181 668 879
11 EUR-D 223 2 12 22 419 591
13 SEAR-D 1689 262 1'431 2'654 7'869 10'172
15 WPR-B1 1488 636 2'115 3'855 10'636 13'614
WORLD 7183 2'020 6'975 11'624 38'337 50'022
Table 16 shows the patient treatment and travel costs saved, which are much lower than the health sector costs saved. The global patient cost savings are under US$100 million per annum for Intervention 1, rising to US$340 million for Intervention 2. The patient cost savings per capita is negligible for most countries for basic improvements in water and sanitation, at under US$0.20, but these gains rise to over US$0.35 per capita for interventions 4 and 5. Given that these savings will accrue to specific groups and not the whole population, especially households with children, these benefits could be important for those households. This is especially true where patients have to travel long distances to the health facility, and where public health facilities charge for their services or private health care is used. Appendix Table A 2.9 gives details for all sub-regions. Table 16: Annual patient treatment costs saved
Annual patient treatment costs saved per capita (US$m year 2000), by intervention
WHO sub- region
Region/ Country
Population (million)
1 2 3 4 5
2 AFR-E 481 18 54 79 215 274
5 AMR-D 93 2 6 8 30 40
11 EUR-D 223 0 0 1 12 17
13 SEAR-D 1689 17 91 170 503 650
15 WPR-B1 1488 25 82 149 411 526
WORLD 7183 97 341 565 1'787 2'322
29
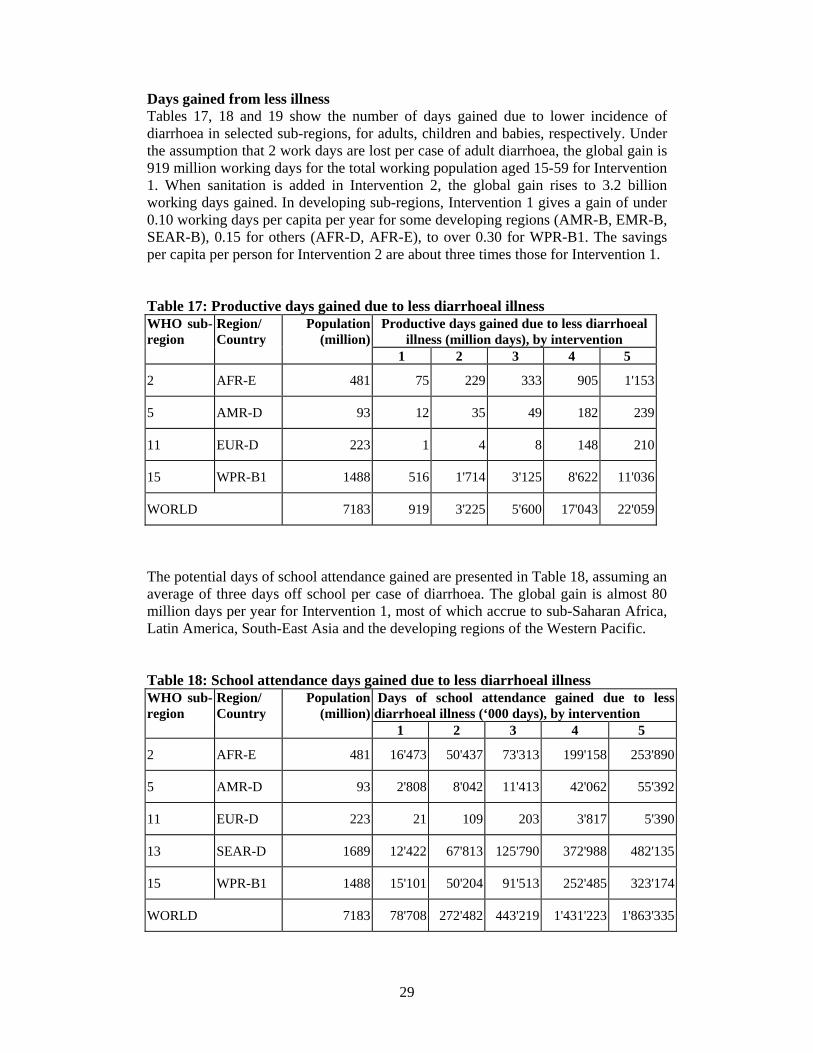
Days gained from less illness Tables 17, 18 and 19 show the number of days gained due to lower incidence of diarrhoea in selected sub-regions, for adults, children and babies, respectively. Under the assumption that 2 work days are lost per case of adult diarrhoea, the global gain is 919 million working days for the total working population aged 15-59 for Intervention 1. When sanitation is added in Intervention 2, the global gain rises to 3.2 billion working days gained. In developing sub-regions, Intervention 1 gives a gain of under 0.10 working days per capita per year for some developing regions (AMR-B, EMR-B, SEAR-B), 0.15 for others (AFR-D, AFR-E), to over 0.30 for WPR-B1. The savings per capita per person for Intervention 2 are about three times those for Intervention 1. Table 17: Productive days gained due to less diarrhoeal illness
Productive days gained due to less diarrhoeal illness (million days), by intervention
WHO sub- region
Region/ Country
Population (million)
1 2 3 4 5
2 AFR-E 481 75 229 333 905 1'153
5 AMR-D 93 12 35 49 182 239
11 EUR-D 223 1 4 8 148 210
15 WPR-B1 1488 516 1'714 3'125 8'622 11'036
WORLD 7183 919 3'225 5'600 17'043 22'059
The potential days of school attendance gained are presented in Table 18, assuming an average of three days off school per case of diarrhoea. The global gain is almost 80 million days per year for Intervention 1, most of which accrue to sub-Saharan Africa, Latin America, South-East Asia and the developing regions of the Western Pacific. Table 18: School attendance days gained due to less diarrhoeal illness
Days of school attendance gained due to less diarrhoeal illness (‘000 days), by intervention
WHO sub- region
Region/ Country
Population (million)
1 2 3 4 5
2 AFR-E 481 16'473 50'437 73'313 199'158 253'890
5 AMR-D 93 2'808 8'042 11'413 42'062 55'392
11 EUR-D 223 21 109 203 3'817 5'390
13 SEAR-D 1689 12'422 67'813 125'790 372'988 482'135
15 WPR-B1 1488 15'101 50'204 91'513 252'485 323'174
WORLD 7183 78'708 272'482 443'219 1'431'223 1'863'335
30
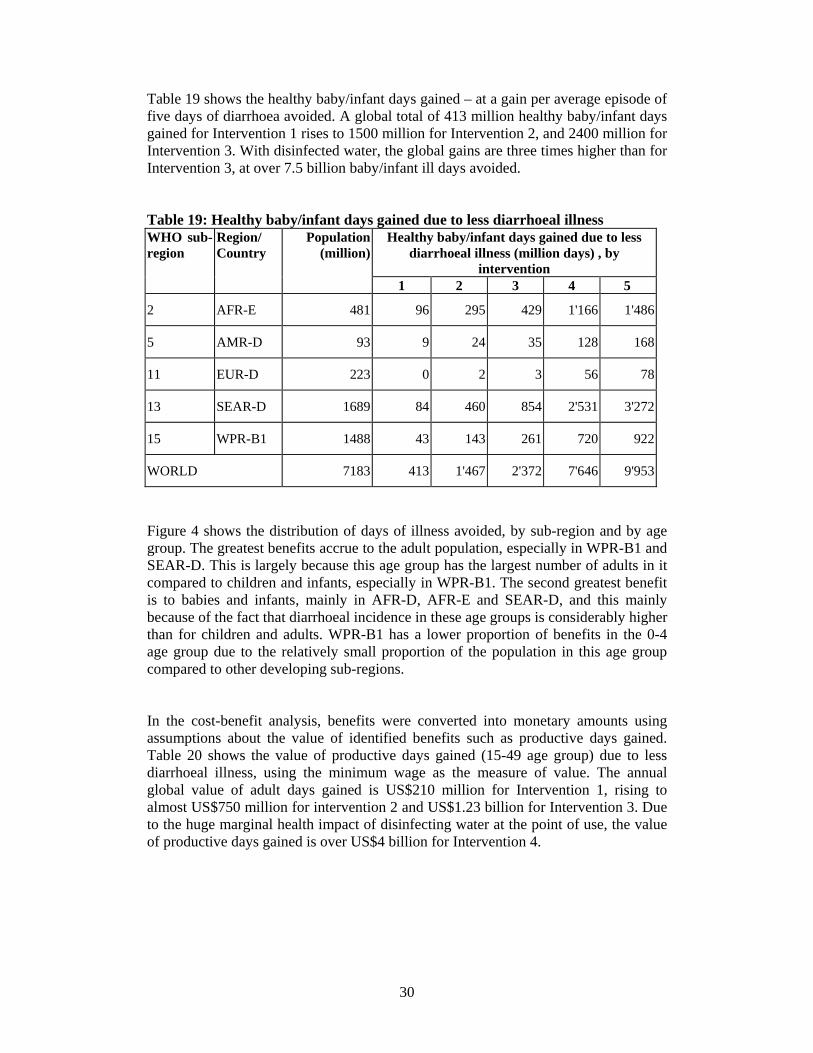
Table 19 shows the healthy baby/infant days gained – at a gain per average episode of five days of diarrhoea avoided. A global total of 413 million healthy baby/infant days gained for Intervention 1 rises to 1500 million for Intervention 2, and 2400 million for Intervention 3. With disinfected water, the global gains are three times higher than for Intervention 3, at over 7.5 billion baby/infant ill days avoided. Table 19: Healthy baby/infant days gained due to less diarrhoeal illness
Healthy baby/infant days gained due to less diarrhoeal illness (million days) , by
intervention
WHO sub- region
Region/ Country
Population (million)
1 2 3 4 5
2 AFR-E 481 96 295 429 1'166 1'486
5 AMR-D 93 9 24 35 128 168
11 EUR-D 223 0 2 3 56 78
13 SEAR-D 1689 84 460 854 2'531 3'272
15 WPR-B1 1488 43 143 261 720 922
WORLD 7183 413 1'467 2'372 7'646 9'953
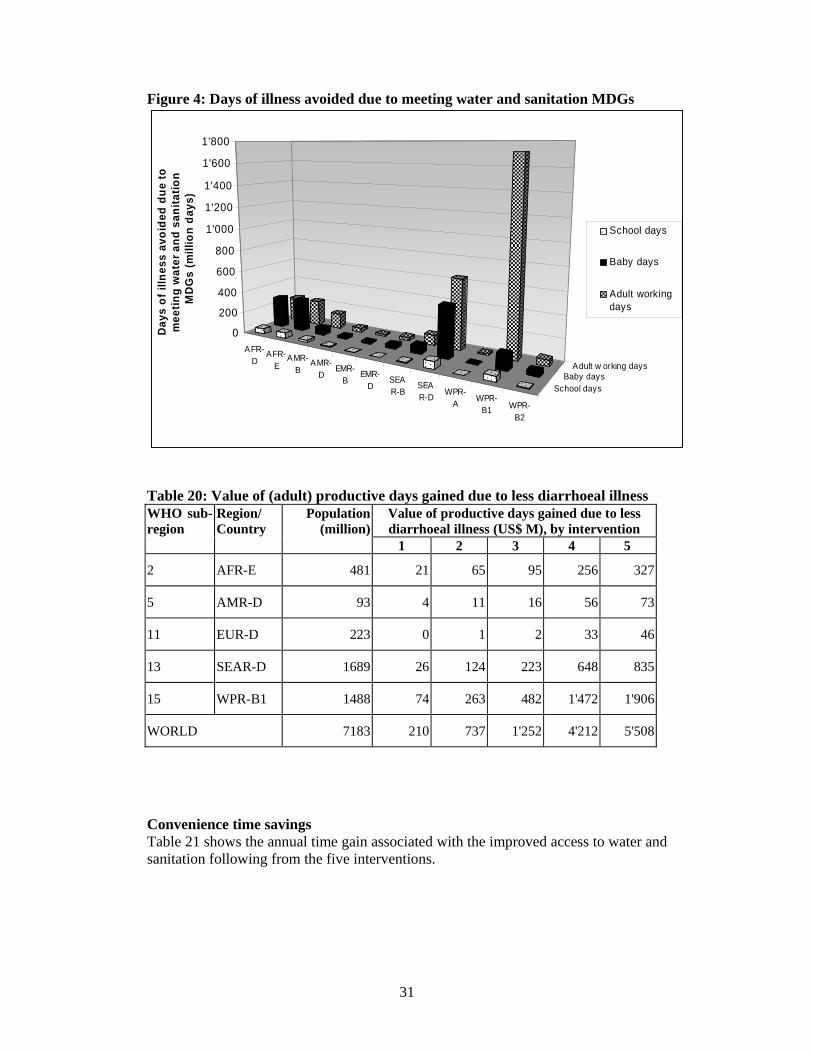
Figure 4 shows the distribution of days of illness avoided, by sub-region and by age group. The greatest benefits accrue to the adult population, especially in WPR-B1 and SEAR-D. This is largely because this age group has the largest number of adults in it compared to children and infants, especially in WPR-B1. The second greatest benefit is to babies and infants, mainly in AFR-D, AFR-E and SEAR-D, and this mainly because of the fact that diarrhoeal incidence in these age groups is considerably higher than for children and adults. WPR-B1 has a lower proportion of benefits in the 0-4 age group due to the relatively small proportion of the population in this age group compared to other developing sub-regions. In the cost-benefit analysis, benefits were converted into monetary amounts using assumptions about the value of identified benefits such as productive days gained. Table 20 shows the value of productive days gained (15-49 age group) due to less diarrhoeal illness, using the minimum wage as the measure of value. The annual global value of adult days gained is US$210 million for Intervention 1, rising to almost US$750 million for intervention 2 and US$1.23 billion for Intervention 3. Due to the huge marginal health impact of disinfecting water at the point of use, the value of productive days gained is over US$4 billion for Intervention 4.
31
Figure 4: Days of illness avoided due to meeting water and sanitation MDGs
AFR-D
AFR-E
AMR-B
AMR-D
EMR-B
EMR-D
SEAR-B
SEAR-D WPR-
A WPR-B1 WPR-
B2
School daysBaby days
Adult w orking days
0
200
400
600
800
1'000
1'200
1'400
1'600
1'800
Day
s of
illn
ess
avoi
ded
due
to
mee
ting
wat
er a
nd s
anita
tion
MD
Gs
(mill
ion
days
)
School days
Baby days
Adult workingdays
Table 20: Value of (adult) productive days gained due to less diarrhoeal illness Value of productive days gained due to less diarrhoeal illness (US$ M), by intervention
WHO sub- region
Region/ Country
Population (million)
1 2 3 4 5
2 AFR-E 481 21 65 95 256 327
5 AMR-D 93 4 11 16 56 73
11 EUR-D 223 0 1 2 33 46
13 SEAR-D 1689 26 124 223 648 835
15 WPR-B1 1488 74 263 482 1'472 1'906
WORLD 7183 210 737 1'252 4'212 5'508
Convenience time savings Table 21 shows the annual time gain associated with the improved access to water and sanitation following from the five interventions.
32
Table 21: Annual time gain due to more convenient water supply and sanitation Annual time gain (million hours saved),
by intervention WHO sub- region
Region/ Country
Population (million)
1 2 3 4 5
2 AFR-E 481 4'925 26'034 52'202 52'202 106'603
5 AMR-D 93 483 2'553 6'261 6'261 14'042
11 EUR-D 223 104 550 3'040 3'040 12'916
13 SEAR-D 1689 4'640 24'525 205'016 205'016 292'445
15 WPR-B1 1488 7'661 40'491 180'047 180'047 160'003
WORLD 7183 29'522 156'045 594'695 594'695 992'634
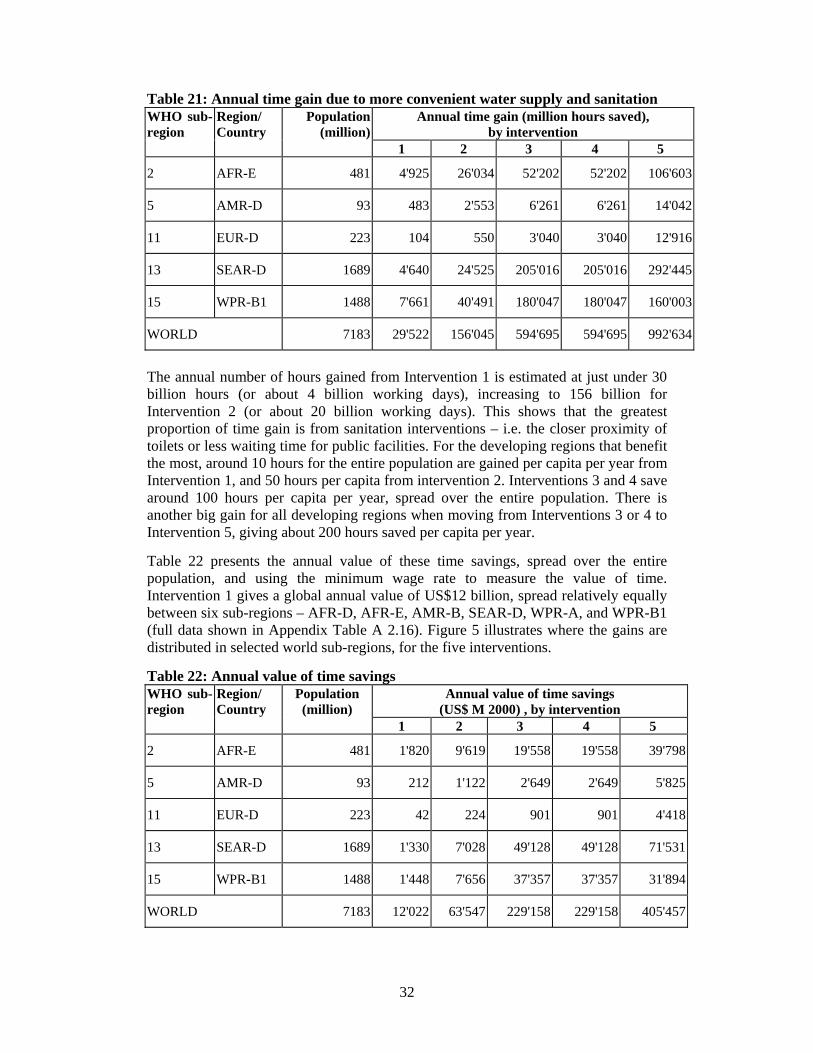
The annual number of hours gained from Intervention 1 is estimated at just under 30 billion hours (or about 4 billion working days), increasing to 156 billion for Intervention 2 (or about 20 billion working days). This shows that the greatest proportion of time gain is from sanitation interventions – i.e. the closer proximity of toilets or less waiting time for public facilities. For the developing regions that benefit the most, around 10 hours for the entire population are gained per capita per year from Intervention 1, and 50 hours per capita from intervention 2. Interventions 3 and 4 save around 100 hours per capita per year, spread over the entire population. There is another big gain for all developing regions when moving from Interventions 3 or 4 to Intervention 5, giving about 200 hours saved per capita per year. Table 22 presents the annual value of these time savings, spread over the entire population, and using the minimum wage rate to measure the value of time. Intervention 1 gives a global annual value of US$12 billion, spread relatively equally between six sub-regions – AFR-D, AFR-E, AMR-B, SEAR-D, WPR-A, and WPR-B1 (full data shown in Appendix Table A 2.16). Figure 5 illustrates where the gains are distributed in selected world sub-regions, for the five interventions.
Table 22: Annual value of time savings Annual value of time savings
(US$ M 2000) , by intervention WHO sub- region
Region/ Country
Population (million)
1 2 3 4 5
2 AFR-E 481 1'820 9'619 19'558 19'558 39'798
5 AMR-D 93 212 1'122 2'649 2'649 5'825
11 EUR-D 223 42 224 901 901 4'418
13 SEAR-D 1689 1'330 7'028 49'128 49'128 71'531
15 WPR-B1 1488 1'448 7'656 37'357 37'357 31'894
WORLD 7183 12'022 63'547 229'158 229'158 405'457
33
Figure 5: Value of time savings due to more convenient water supply and sanitation for the five interventions, in selected world sub-regions
AFR
-D
AFR
-E
AMR
-B
EMR
-B
EMR
-D
EUR
-A
EUR
-B1
EUR
-D
SEAR
-B
SEAR
-D
WPR
-A
WPR
-B1
WPR
-B2
Int 1Int 2
Int 3Int 4
Int 5
0
10'000
20'000
30'000
40'000
50'000
60'000
70'000
80'000
Valu
e of
tim
e sa
ving
s du
e to
m
ore
conv
enie
nt w
ater
sup
ply
&
sani
tatio
n (U
S$ m
illio
n) Int 1
Int 2
Int 3
Int 4
Int 5
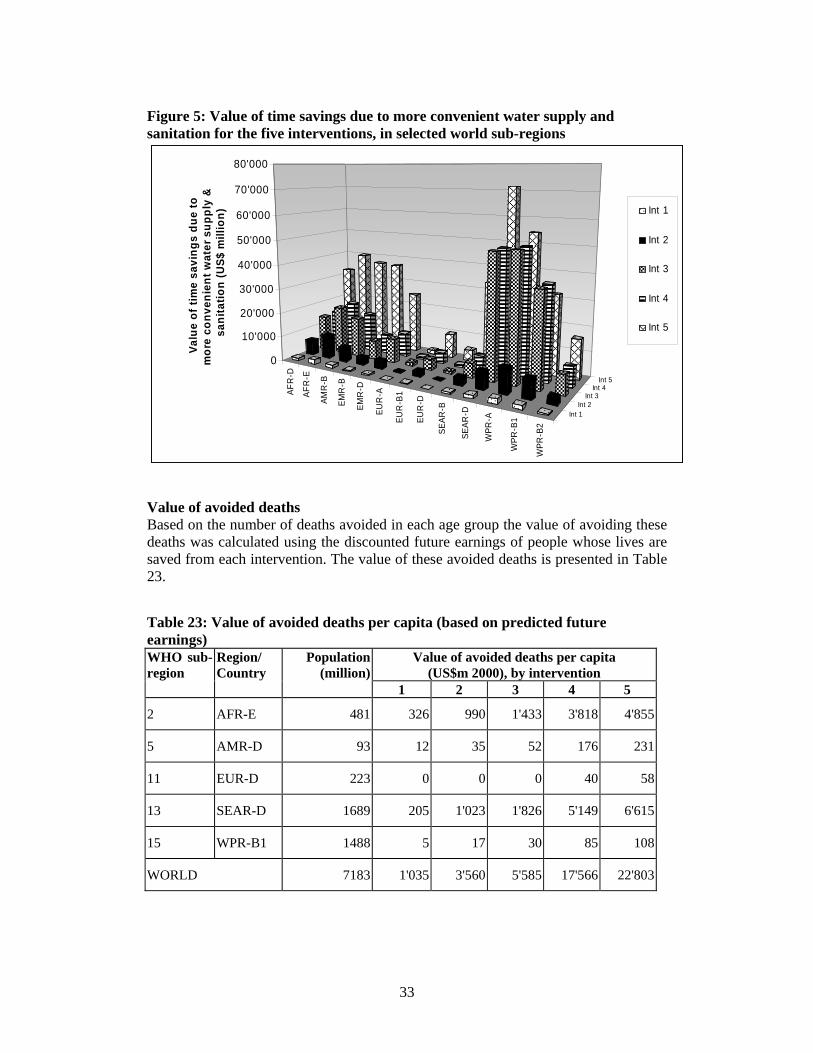
Value of avoided deaths Based on the number of deaths avoided in each age group the value of avoiding these deaths was calculated using the discounted future earnings of people whose lives are saved from each intervention. The value of these avoided deaths is presented in Table 23. Table 23: Value of avoided deaths per capita (based on predicted future earnings)
Value of avoided deaths per capita (US$m 2000), by intervention
WHO sub- region
Region/ Country
Population (million)
1 2 3 4 5
2 AFR-E 481 326 990 1'433 3'818 4'855
5 AMR-D 93 12 35 52 176 231
11 EUR-D 223 0 0 0 40 58
13 SEAR-D 1689 205 1'023 1'826 5'149 6'615
15 WPR-B1 1488 5 17 30 85 108
WORLD 7183 1'035 3'560 5'585 17'566 22'803
34
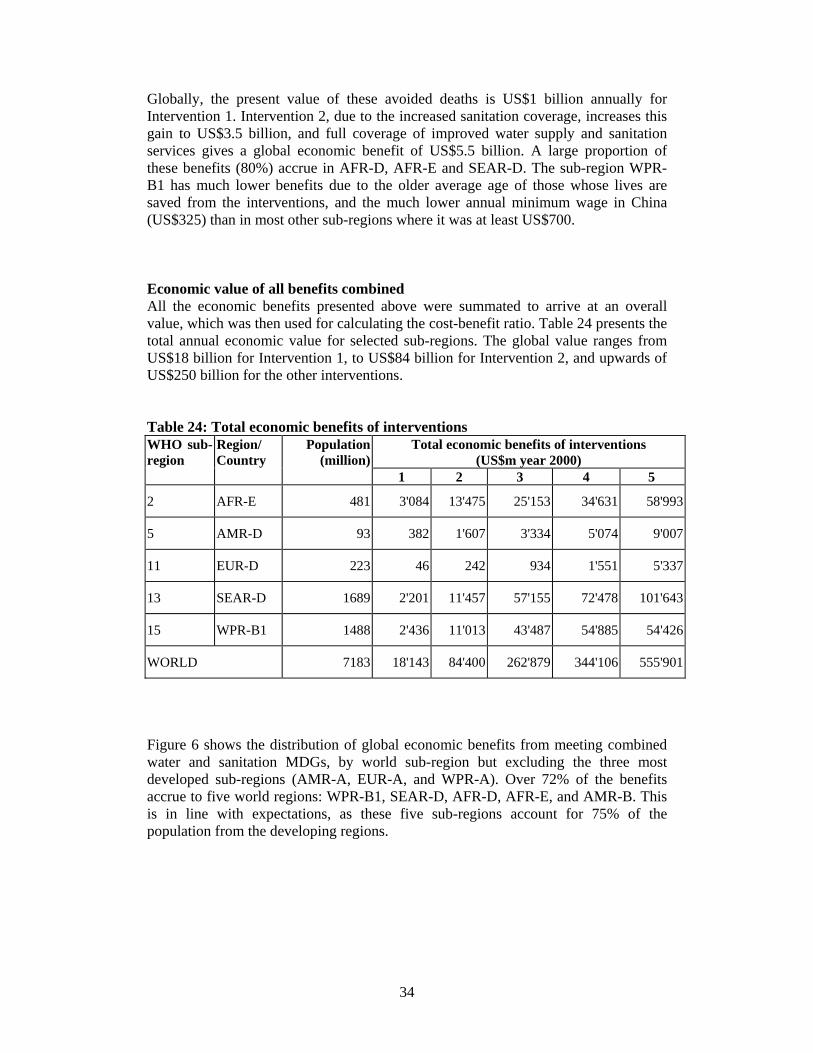
Globally, the present value of these avoided deaths is US$1 billion annually for Intervention 1. Intervention 2, due to the increased sanitation coverage, increases this gain to US$3.5 billion, and full coverage of improved water supply and sanitation services gives a global economic benefit of US$5.5 billion. A large proportion of these benefits (80%) accrue in AFR-D, AFR-E and SEAR-D. The sub-region WPR-B1 has much lower benefits due to the older average age of those whose lives are saved from the interventions, and the much lower annual minimum wage in China (US$325) than in most other sub-regions where it was at least US$700. Economic value of all benefits combined All the economic benefits presented above were summated to arrive at an overall value, which was then used for calculating the cost-benefit ratio. Table 24 presents the total annual economic value for selected sub-regions. The global value ranges from US$18 billion for Intervention 1, to US$84 billion for Intervention 2, and upwards of US$250 billion for the other interventions. Table 24: Total economic benefits of interventions
Total economic benefits of interventions (US$m year 2000)
WHO sub- region
Region/ Country
Population (million)
1 2 3 4 5
2 AFR-E 481 3'084 13'475 25'153 34'631 58'993
5 AMR-D 93 382 1'607 3'334 5'074 9'007
11 EUR-D 223 46 242 934 1'551 5'337
13 SEAR-D 1689 2'201 11'457 57'155 72'478 101'643
15 WPR-B1 1488 2'436 11'013 43'487 54'885 54'426
WORLD 7183 18'143 84'400 262'879 344'106 555'901
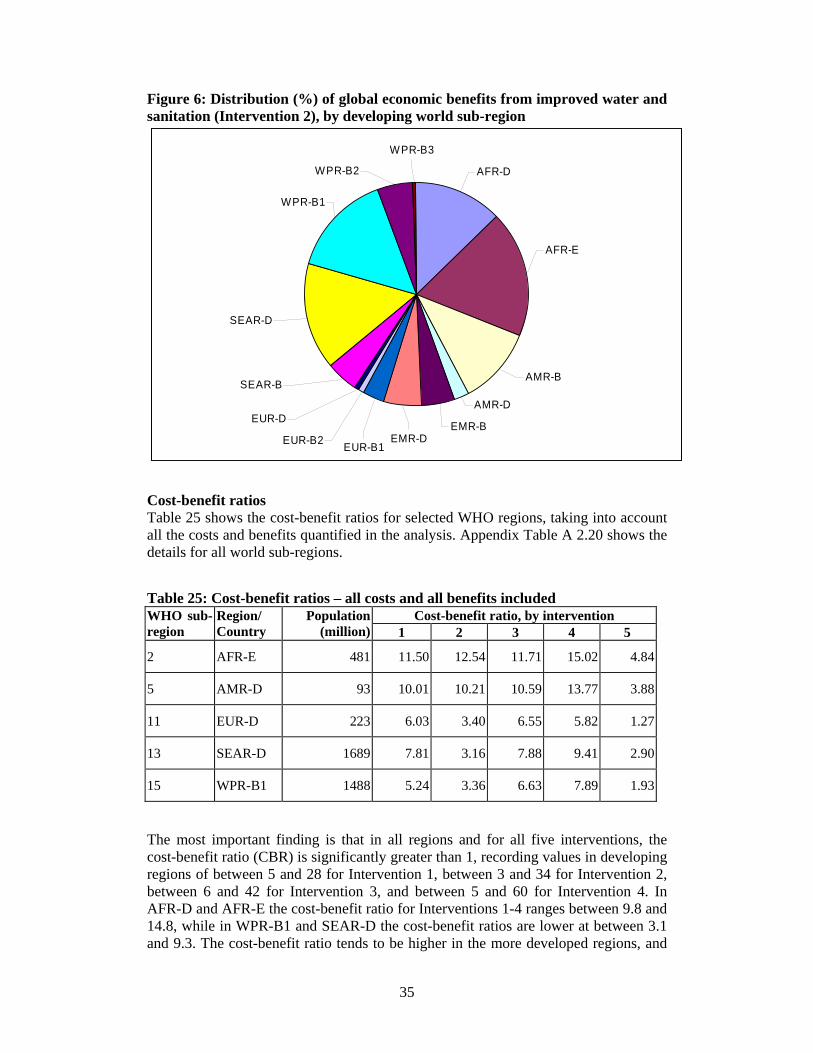
Figure 6 shows the distribution of global economic benefits from meeting combined water and sanitation MDGs, by world sub-region but excluding the three most developed sub-regions (AMR-A, EUR-A, and WPR-A). Over 72% of the benefits accrue to five world regions: WPR-B1, SEAR-D, AFR-D, AFR-E, and AMR-B. This is in line with expectations, as these five sub-regions account for 75% of the population from the developing regions.
35
Figure 6: Distribution (%) of global economic benefits from improved water and sanitation (Intervention 2), by developing world sub-region
AMR-D
EMR-B
WPR-B3
WPR-B2 AFR-D
AFR-E
AMR-B
EMR-DEUR-B1EUR-B2
EUR-D
SEAR-B
SEAR-D
WPR-B1
Cost-benefit ratios Table 25 shows the cost-benefit ratios for selected WHO regions, taking into account all the costs and benefits quantified in the analysis. Appendix Table A 2.20 shows the details for all world sub-regions. Table 25: Cost-benefit ratios – all costs and all benefits included
Cost-benefit ratio, by intervention WHO sub- region
Region/ Country
Population (million) 1 2 3 4 5
2 AFR-E 481 11.50 12.54 11.71 15.02 4.84
5 AMR-D 93 10.01 10.21 10.59 13.77 3.88
11 EUR-D 223 6.03 3.40 6.55 5.82 1.27
13 SEAR-D 1689 7.81 3.16 7.88 9.41 2.90
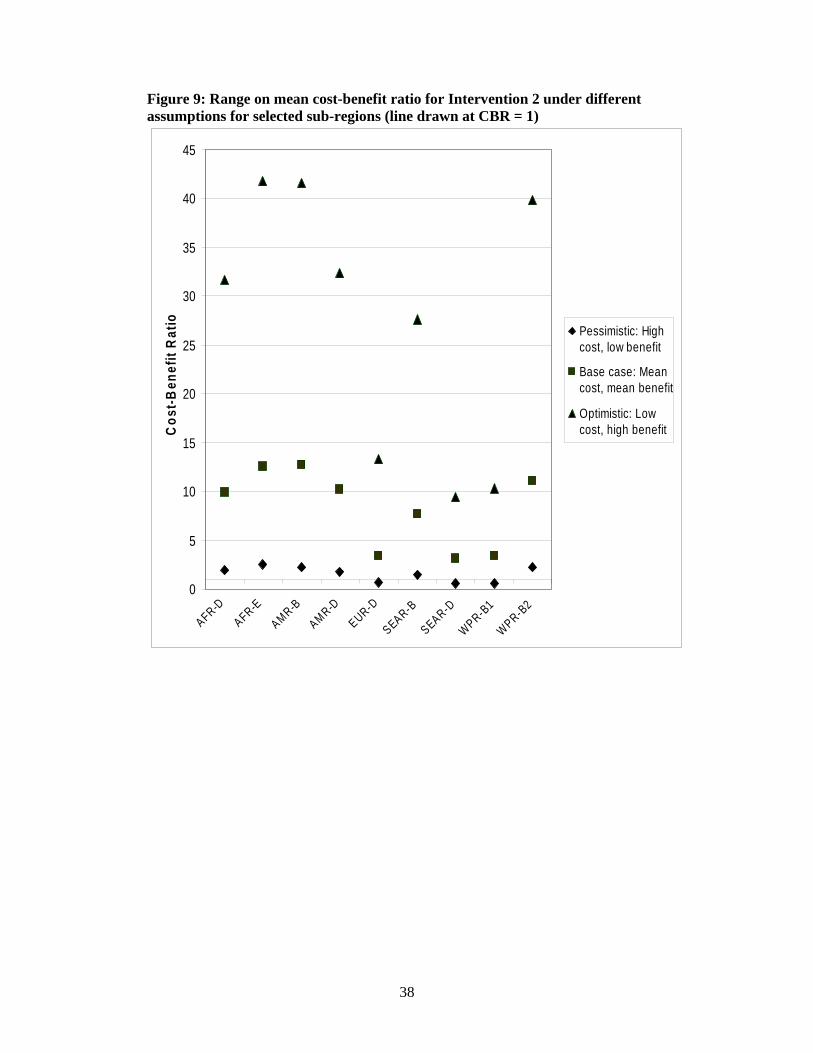
15 WPR-B1 1488 5.24 3.36 6.63 7.89 1.93 The most important finding is that in all regions and for all five interventions, the cost-benefit ratio (CBR) is significantly greater than 1, recording values in developing regions of between 5 and 28 for Intervention 1, between 3 and 34 for Intervention 2, between 6 and 42 for Intervention 3, and between 5 and 60 for Intervention 4. In AFR-D and AFR-E the cost-benefit ratio for Interventions 1-4 ranges between 9.8 and 14.8, while in WPR-B1 and SEAR-D the cost-benefit ratios are lower at between 3.1 and 9.3. The cost-benefit ratio tends to be higher in the more developed regions, and
36
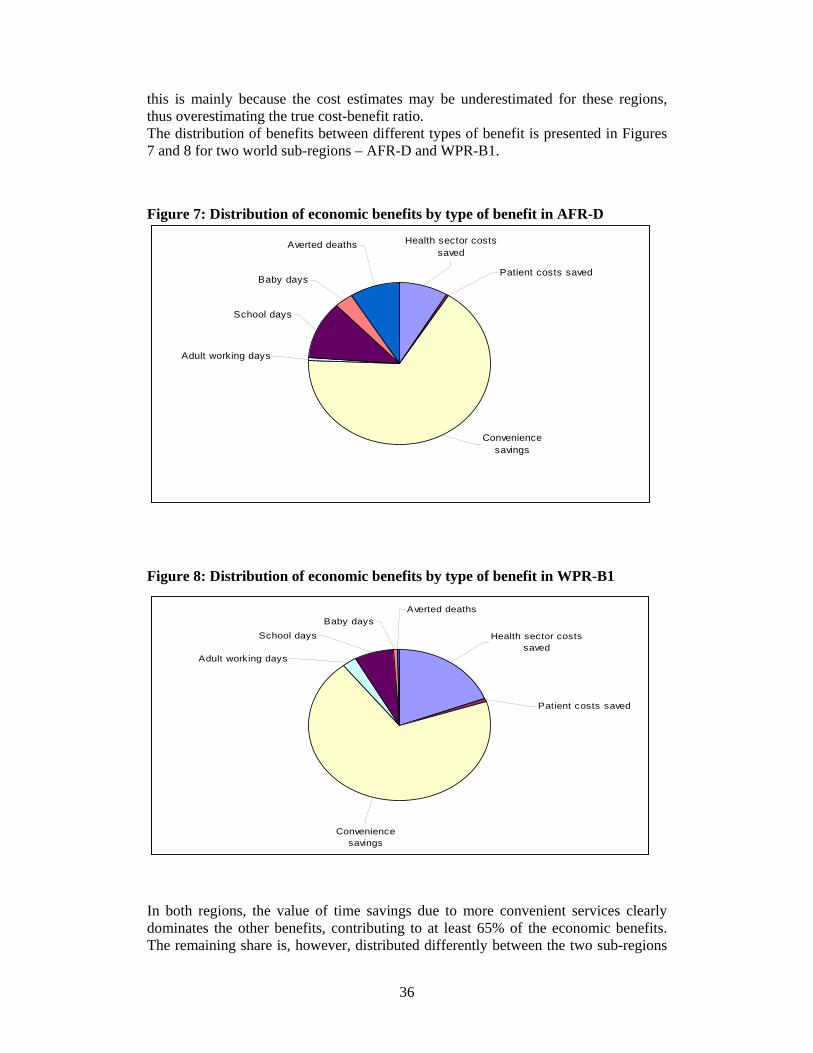
this is mainly because the cost estimates may be underestimated for these regions, thus overestimating the true cost-benefit ratio. The distribution of benefits between different types of benefit is presented in Figures 7 and 8 for two world sub-regions – AFR-D and WPR-B1.
Figure 7: Distribution of economic benefits by type of benefit in AFR-D
Adult working days
School days
Baby days
Averted deaths Health sector costs saved
Patient costs saved
Convenience savings
Figure 8: Distribution of economic benefits by type of benefit in WPR-B1
Convenience savings
Patient costs saved
Health sector costs saved
Averted deathsBaby days
School days
Adult working days
In both regions, the value of time savings due to more convenient services clearly dominates the other benefits, contributing to at least 65% of the economic benefits. The remaining share is, however, distributed differently between the two sub-regions
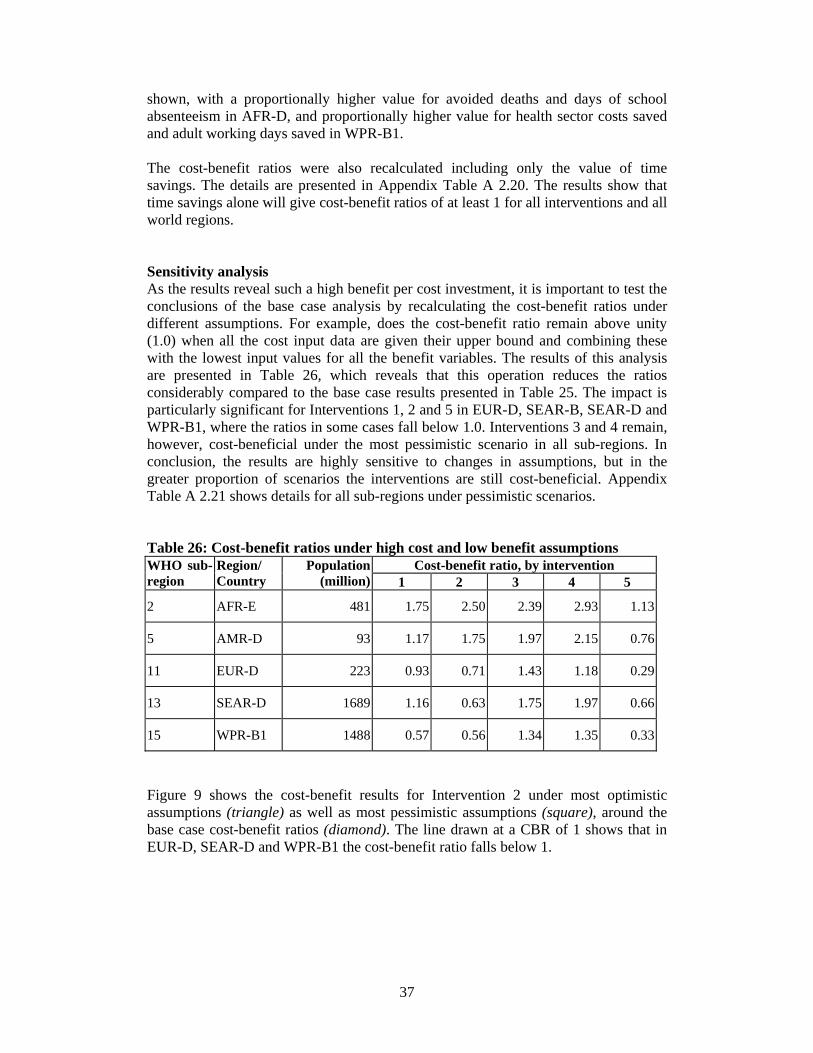
37
shown, with a proportionally higher value for avoided deaths and days of school absenteeism in AFR-D, and proportionally higher value for health sector costs saved and adult working days saved in WPR-B1. The cost-benefit ratios were also recalculated including only the value of time savings. The details are presented in Appendix Table A 2.20. The results show that time savings alone will give cost-benefit ratios of at least 1 for all interventions and all world regions. Sensitivity analysis As the results reveal such a high benefit per cost investment, it is important to test the conclusions of the base case analysis by recalculating the cost-benefit ratios under different assumptions. For example, does the cost-benefit ratio remain above unity (1.0) when all the cost input data are given their upper bound and combining these with the lowest input values for all the benefit variables. The results of this analysis are presented in Table 26, which reveals that this operation reduces the ratios considerably compared to the base case results presented in Table 25. The impact is particularly significant for Interventions 1, 2 and 5 in EUR-D, SEAR-B, SEAR-D and WPR-B1, where the ratios in some cases fall below 1.0. Interventions 3 and 4 remain, however, cost-beneficial under the most pessimistic scenario in all sub-regions. In conclusion, the results are highly sensitive to changes in assumptions, but in the greater proportion of scenarios the interventions are still cost-beneficial. Appendix Table A 2.21 shows details for all sub-regions under pessimistic scenarios. Table 26: Cost-benefit ratios under high cost and low benefit assumptions
Cost-benefit ratio, by intervention WHO sub- region
Region/ Country
Population (million) 1 2 3 4 5
2 AFR-E 481 1.75 2.50 2.39 2.93 1.13
5 AMR-D 93 1.17 1.75 1.97 2.15 0.76
11 EUR-D 223 0.93 0.71 1.43 1.18 0.29
13 SEAR-D 1689 1.16 0.63 1.75 1.97 0.66
15 WPR-B1 1488 0.57 0.56 1.34 1.35 0.33
Figure 9 shows the cost-benefit results for Intervention 2 under most optimistic assumptions (triangle) as well as most pessimistic assumptions (square), around the base case cost-benefit ratios (diamond). The line drawn at a CBR of 1 shows that in EUR-D, SEAR-D and WPR-B1 the cost-benefit ratio falls below 1.
38
Figure 9: Range on mean cost-benefit ratio for Intervention 2 under different assumptions for selected sub-regions (line drawn at CBR = 1)
0
5
10
15
20
25
30
35
40
45
AFR-DAFR-E
AMR-BAMR-D
EUR-D
SEAR-B
SEAR-D
WPR-B1
WPR-B2
Cos
t-Ben
efit
Rat
io
Pessimistic: Highcost, low benefit
Base case: Meancost, mean benefit
Optimistic: Lowcost, high benefit
39
Discussion Interpretation of main findings The cost-benefit ratio of water and sanitation interventions is high when all benefits are included, standing at around between US$5 and US$11 economic benefit per US$1 invested for most developing world sub-regions and for most interventions. In some cases the ratio is significantly higher than this, and in some cases it is lower. It may even fall below 1 for some regions when pessimistic assumptions are used for data inputs (i.e. high cost and low benefit assumptions). The main contributor to the cost of the interventions was found to be the investment cost for the low technology interventions. The main contributor to the overall economic benefits was the time saving associated with more convenient access to water supply and sanitation. In interpreting the impressive cost-benefit ratios presented in this study, an important caveat needs to be taken into account. On the cost side, the costs are very tangible, requiring financial and time input upfront for the interventions to be put in place. On the benefit side, however, many of the benefits are not highly tangible, in that the benefits do not bring immediate money ‘in the hand’. The benefits involve possible money savings from less health service use, accruing to both the health sector and the patient. The reduced number of days spent ill can lead to direct economic benefits, such as more time spent on income earning activities, or to other benefits such as more leisure time or more time spent at school, which do not have immediate economic implications. On the other hand, the benefits related to time savings due to less time spent collecting water or accessing sanitation services can also be argued to be valuable to household members, as it increases their time spent in productive activities. Therefore, while this analysis attempted to make realistic assumptions about the economic value of these potential savings, it is recognised that the real economic benefits accruing to the population may not be financial in nature, nor will they be immediate. Also, the real benefits depend on a number of factors related to the individual or household, such as what activities are done instead when time is saved or illness avoided, and what health seeking behaviour does he/she engage in. Furthermore, the assumptions about the value of time may overestimate the actual economic value, due to the presence of unemployment, underemployment or seasonal labour, which all determine the income earned when more time is available for work. In some cases the changes in time uses will lead to income gains, but data from micro-economic studies to support the assumptions used in this study are limited. Omission of variables The omission of health impacts other than diarrhoeal disease will underestimate the cost-benefit ratios presented in this study. Also, some potential economic and non-economic benefits were left out of the analysis, as presented in Table 9. These benefits were left out for various reasons: (a) lack of research studies presenting the likely range of benefits per project or per person, (b) lack of valuation methods for estimating the monetary equivalent value of some benefits, such as, for example, the aesthetic value of a reservoir, and (c) some benefits were likely to be small in relation to others. On the other hand, some potential negative impacts of changes to water and sanitation technologies were also omitted, thus leading to the underestimate of cost. For example, a partial improvement such as a household sewer connection may mean
40
discharge of sewage into an open sewer, providing a habitat for vectors to breed, and the possibility of re-infection. Clearly all these omitted benefits and costs should be included for a comprehensive analysis, and a more accurate cost-benefit ratio, and future cost-benefit analyses should try and quantify their effects. Financing considerations While cost-benefit analysis can be carried out to identify clearly all the beneficiaries and the (potential) financers of development projects, the analysis does not provide answers to the question of who should pay. This represents a particular challenge to economic evaluation when health care interventions have non-health sector costs and benefits, as the objective of the health ministry – “to maximise health with a given budget” – may come into conflict with other societal objectives, including the maximisation of non-health related welfare. For this reason, the societal perspective is very rarely represented in a comprehensive way in the economic evaluation of health care programmes. If all costs and benefits are included in a cost-benefit analysis, then a full analysis can be made of financing options. While this study did not include all the benefits, the most widespread benefits were included, which were generally the benefits where country and regional averages could be estimated. For example, benefits accruing to agriculture and industry are very setting-specific, and even estimating economic gains by country would be a challenging task. One of the problems associated with identifying beneficiaries in order to identify those willing to pay for the costs is that the main beneficiaries (patients and consumers) do not always understand the full benefits until well after the investment. Also, most costs are incurred in the first year of the intervention, while benefits accrue over time. These factors together lead to a type of market failure, and implies that many private consumers cannot be expected to finance the initial investment costs up-front. On the other hand, water supply improvements may in fact involve a lower annual cost than the current options, if water trucks, water vendors or bottled water are used. This means that certain groups could be convinced that a household water connection could be cheaper in the long-term, and therefore persuade them to finance water supply improvements privately. With respect to the question whether the health sector would be interested in financing the interventions, it is clear from this analysis that in most regions and for most interventions there is little incentive for the health sector to make significant contributions to the costs, as the real savings to the sector are small in comparison to the annual intervention costs. Compared to the potential cost savings reported in this study, it is unlikely that the health sector will ever be able to recover these costs, as only a small proportion are marginal costs directly related to the treatment cost of the diarrhoeal episode. Most costs, such as personnel and infrastructure, are fixed costs that do not change with patient throughput in the short-term. On the other hand, the reduced burden to the health system due to less patients presenting with diarrhoea will free up capacity in the health system to treat other patients. The implication of these arguments is that there should exist a variety of financing mechanisms for meeting the costs of water and sanitation improvements, depending on the income and asset base of the target populations, the availability of credit, the economic benefits perceived by the various stakeholders, the budget freedom of government ministries, and the presence of NGOs to promote and finance water and
41
sanitation improvements. One finding is clear though: the health sector, with the meagre budget it has at its disposal in most developing countries, cannot and should not be expected to fund water and sanitation improvements. On the other hand, it can play a key role in providing the ‘software’ (education for behaviour change) alongside ‘hardware’ interventions, involving both technical and limited financial contributions, and it can provide a strengthened knowledge base to repeat at the national level the type of analysis presented in this publication from a global perspective.

42
43
References 1. World Health Organization, World Health Report. 2003, Geneva. 2. World Health Organization, United Nations Children's Fund, and Water
Supply and Sanitation Collaborative Council, Global Water Supply and Sanitation Assessment 2000 Report. 2000.
3. Hutton, G., Considerations in evaluating the cost-effectiveness of environmental health interventions. 2000, Sustainable Development and Healthy Environments Cluster, World Health Organization. WHO/SDE/WSH/00.10.
4. Hutton, G. Economic evaluation and priority setting in water and sanitation interventions, in Water Quality: Guidelines, Standards and Health. Risk assessment and management for water-related infectious disease, L. Fewtrell and Bartram, J., Editors. 2001.
5. Prüss, A., Kay, D., Fewtrell, L., and Bartram, J. Estimating the global burden of disease from water, sanitation, and hygiene at the global level. Environmental Health Perspectives, 2002. 110(5): p. 537-542.
6. Prüss-Üstün, A., Kay, D., Fewtrell, L., and Bartram, J. Unsafe water, sanitation and hygiene,, in Comparative Quantification of Health Risks: Global and Regional Burden of Disease due to Selected Major Risk Factors, M. Ezzati, et al., Editors. 2004.
7. Drummond, M.F., O'Brien, B., Stoddart, G.L., and Torrance, G.W. Methods for the economic evaluation of health care programmes. Second ed. 1997: Oxford University Press.
8. Gold, M.R., Siegel, J.E., Russell, L.B., and Weinstein, M.C. Cost-effectiveness in health and medicine. 1996: Oxford University Press.
9. Sugden, R. and Williams, A. Principles of practical cost-benefit analysis. 1978: Oxford University Press.
10. Layard, R. and Glaister, S. Recent developments in cost-benefit analysis. 1994: Cambridge University Press.
11. North, J. and Griffin, C. Water source as a housing characteristic: Hedonic property valuation and willingness to pay for water. Water Resources Research, 1993. 29(7): p. 1923-1929.
12. Hanley, N. and Spash, C.L. Cost-benefit analysis and the environment. 1993, Cheltenham, UK: Edward Elgar.
13. Field, B.C. Environmental economics. 1997: McGraw-Hill. 14. Curry, S. and Weiss, J. Project analysis in developing countries. 1993:
MacMillan. 15. Murray, C. and Lopez, A. The Global Burden of Disease. 2000: World Health
Organization, Harvard University. 16. Suarez, R. and Bradford, B., The economic impact of the cholera epidemic in
Peru: an application of the cost-if-illness methodology. 1993, Water and Sanitation for Health Project; WASH Field Report No. 415.
17. Lopez-Alarcon, M., Villalpando, S., and Fajardo, A. Breast-feeding lowers the frequency and duration of acute respiratory infection and diarrhoea in infants under six months of age. Journal of Nutrition, 1997. 127: p. 436-443.
18. Whittington, D., Mu, X., and Roche, R. Calculating the value of time spent collecting water: Some estimates for Ukunda, Kenya. World Development, 1990. 1990(18): p. 2.
44
19. World Bank, Project appraisal document on a proposed loan to the Socialist Republic of Vietnam for the Ho Chi Minh City environmental sanitation project. 2001: Urban Development Sector Unit, Vietnam Country Department of the World Bank.
20. Whittington, D., Lauria, D.T., and Mu, X. A study of water vending and willingness to pay for water in Onitsha, Nigeria. World Development, 1991. 19(2/3): p. 179-198.
21. Georgiou, S., Langford, I., Bateman, I., and Turner, R.K. Determinants of individuals' willingness to pay for reduction in environmental health risks: A case study of bathing water quality. CSERGE Working Paper, 1996. GEC 96-14.
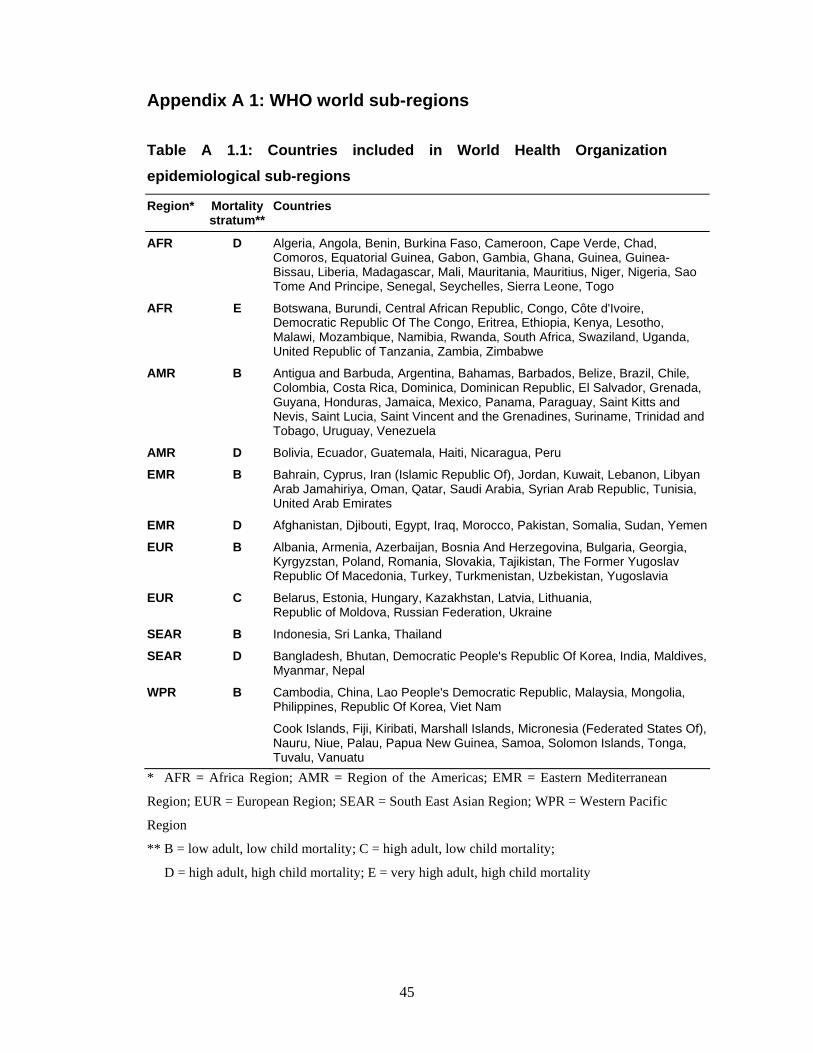
45
Appendix A 1: WHO world sub-regions Table A 1.1: Countries included in World Health Organization epidemiological sub-regions
Region* Mortality stratum**
Countries
AFR D Algeria, Angola, Benin, Burkina Faso, Cameroon, Cape Verde, Chad, Comoros, Equatorial Guinea, Gabon, Gambia, Ghana, Guinea, Guinea-Bissau, Liberia, Madagascar, Mali, Mauritania, Mauritius, Niger, Nigeria, Sao Tome And Principe, Senegal, Seychelles, Sierra Leone, Togo
AFR E Botswana, Burundi, Central African Republic, Congo, Côte d'Ivoire, Democratic Republic Of The Congo, Eritrea, Ethiopia, Kenya, Lesotho, Malawi, Mozambique, Namibia, Rwanda, South Africa, Swaziland, Uganda, United Republic of Tanzania, Zambia, Zimbabwe
AMR B Antigua and Barbuda, Argentina, Bahamas, Barbados, Belize, Brazil, Chile, Colombia, Costa Rica, Dominica, Dominican Republic, El Salvador, Grenada, Guyana, Honduras, Jamaica, Mexico, Panama, Paraguay, Saint Kitts and Nevis, Saint Lucia, Saint Vincent and the Grenadines, Suriname, Trinidad and Tobago, Uruguay, Venezuela
AMR D Bolivia, Ecuador, Guatemala, Haiti, Nicaragua, Peru
EMR B Bahrain, Cyprus, Iran (Islamic Republic Of), Jordan, Kuwait, Lebanon, Libyan Arab Jamahiriya, Oman, Qatar, Saudi Arabia, Syrian Arab Republic, Tunisia, United Arab Emirates
EMR D Afghanistan, Djibouti, Egypt, Iraq, Morocco, Pakistan, Somalia, Sudan, Yemen
EUR B Albania, Armenia, Azerbaijan, Bosnia And Herzegovina, Bulgaria, Georgia, Kyrgyzstan, Poland, Romania, Slovakia, Tajikistan, The Former Yugoslav Republic Of Macedonia, Turkey, Turkmenistan, Uzbekistan, Yugoslavia
EUR C Belarus, Estonia, Hungary, Kazakhstan, Latvia, Lithuania, Republic of Moldova, Russian Federation, Ukraine
SEAR B Indonesia, Sri Lanka, Thailand
SEAR D Bangladesh, Bhutan, Democratic People's Republic Of Korea, India, Maldives, Myanmar, Nepal
WPR B Cambodia, China, Lao People's Democratic Republic, Malaysia, Mongolia, Philippines, Republic Of Korea, Viet Nam
Cook Islands, Fiji, Kiribati, Marshall Islands, Micronesia (Federated States Of), Nauru, Niue, Palau, Papua New Guinea, Samoa, Solomon Islands, Tonga, Tuvalu, Vanuatu
* AFR = Africa Region; AMR = Region of the Americas; EMR = Eastern Mediterranean
Region; EUR = European Region; SEAR = South East Asian Region; WPR = Western Pacific
Region
** B = low adult, low child mortality; C = high adult, low child mortality;
D = high adult, high child mortality; E = very high adult, high child mortality
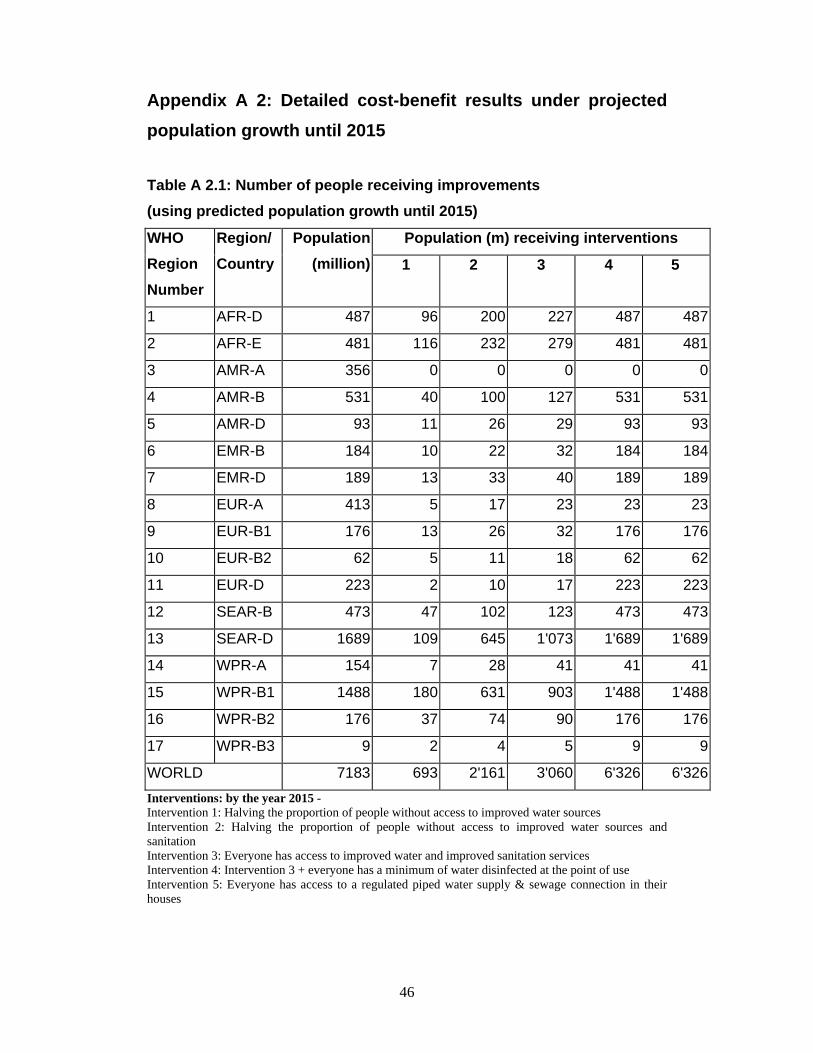
46
Appendix A 2: Detailed cost-benefit results under projected population growth until 2015 Table A 2.1: Number of people receiving improvements (using predicted population growth until 2015)
Population (m) receiving interventions WHO Region Number
Region/ Country
Population (million) 1 2 3 4 5
1 AFR-D 487 96 200 227 487 487
2 AFR-E 481 116 232 279 481 481
3 AMR-A 356 0 0 0 0 0
4 AMR-B 531 40 100 127 531 531
5 AMR-D 93 11 26 29 93 93
6 EMR-B 184 10 22 32 184 184
7 EMR-D 189 13 33 40 189 189
8 EUR-A 413 5 17 23 23 23
9 EUR-B1 176 13 26 32 176 176
10 EUR-B2 62 5 11 18 62 62
11 EUR-D 223 2 10 17 223 223
12 SEAR-B 473 47 102 123 473 473
13 SEAR-D 1689 109 645 1'073 1'689 1'689
14 WPR-A 154 7 28 41 41 41
15 WPR-B1 1488 180 631 903 1'488 1'488
16 WPR-B2 176 37 74 90 176 176
17 WPR-B3 9 2 4 5 9 9
WORLD 7183 693 2'161 3'060 6'326 6'326Interventions: by the year 2015 - Intervention 1: Halving the proportion of people without access to improved water sources Intervention 2: Halving the proportion of people without access to improved water sources and sanitation Intervention 3: Everyone has access to improved water and improved sanitation services Intervention 4: Intervention 3 + everyone has a minimum of water disinfected at the point of use Intervention 5: Everyone has access to a regulated piped water supply & sewage connection in their houses
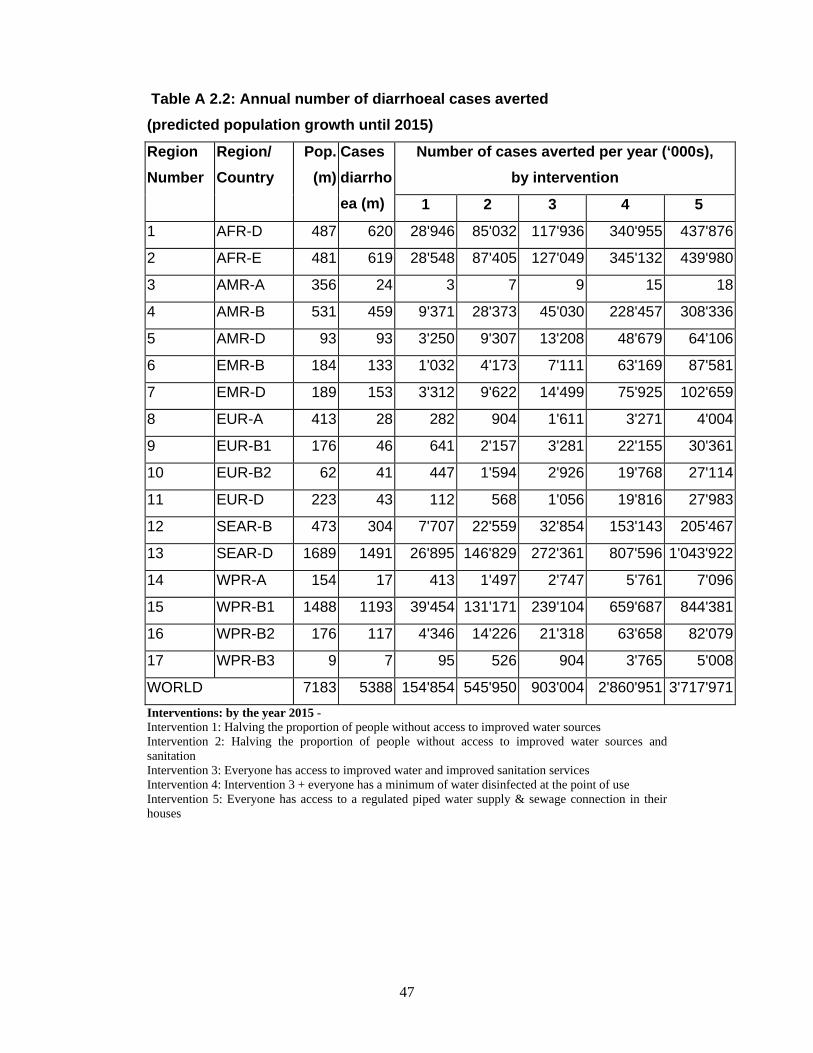
47
Table A 2.2: Annual number of diarrhoeal cases averted (predicted population growth until 2015)
Number of cases averted per year (‘000s), by intervention
Region Number
Region/ Country
Pop. (m)
Cases diarrhoea (m) 1 2 3 4 5
1 AFR-D 487 620 28'946 85'032 117'936 340'955 437'876
2 AFR-E 481 619 28'548 87'405 127'049 345'132 439'980
3 AMR-A 356 24 3 7 9 15 18
4 AMR-B 531 459 9'371 28'373 45'030 228'457 308'336
5 AMR-D 93 93 3'250 9'307 13'208 48'679 64'106
6 EMR-B 184 133 1'032 4'173 7'111 63'169 87'581
7 EMR-D 189 153 3'312 9'622 14'499 75'925 102'659
8 EUR-A 413 28 282 904 1'611 3'271 4'004
9 EUR-B1 176 46 641 2'157 3'281 22'155 30'361
10 EUR-B2 62 41 447 1'594 2'926 19'768 27'114
11 EUR-D 223 43 112 568 1'056 19'816 27'983
12 SEAR-B 473 304 7'707 22'559 32'854 153'143 205'467
13 SEAR-D 1689 1491 26'895 146'829 272'361 807'596 1'043'922
14 WPR-A 154 17 413 1'497 2'747 5'761 7'096
15 WPR-B1 1488 1193 39'454 131'171 239'104 659'687 844'381
16 WPR-B2 176 117 4'346 14'226 21'318 63'658 82'079
17 WPR-B3 9 7 95 526 904 3'765 5'008
WORLD 7183 5388 154'854 545'950 903'004 2'860'951 3'717'971Interventions: by the year 2015 - Intervention 1: Halving the proportion of people without access to improved water sources Intervention 2: Halving the proportion of people without access to improved water sources and sanitation Intervention 3: Everyone has access to improved water and improved sanitation services Intervention 4: Intervention 3 + everyone has a minimum of water disinfected at the point of use Intervention 5: Everyone has access to a regulated piped water supply & sewage connection in their houses
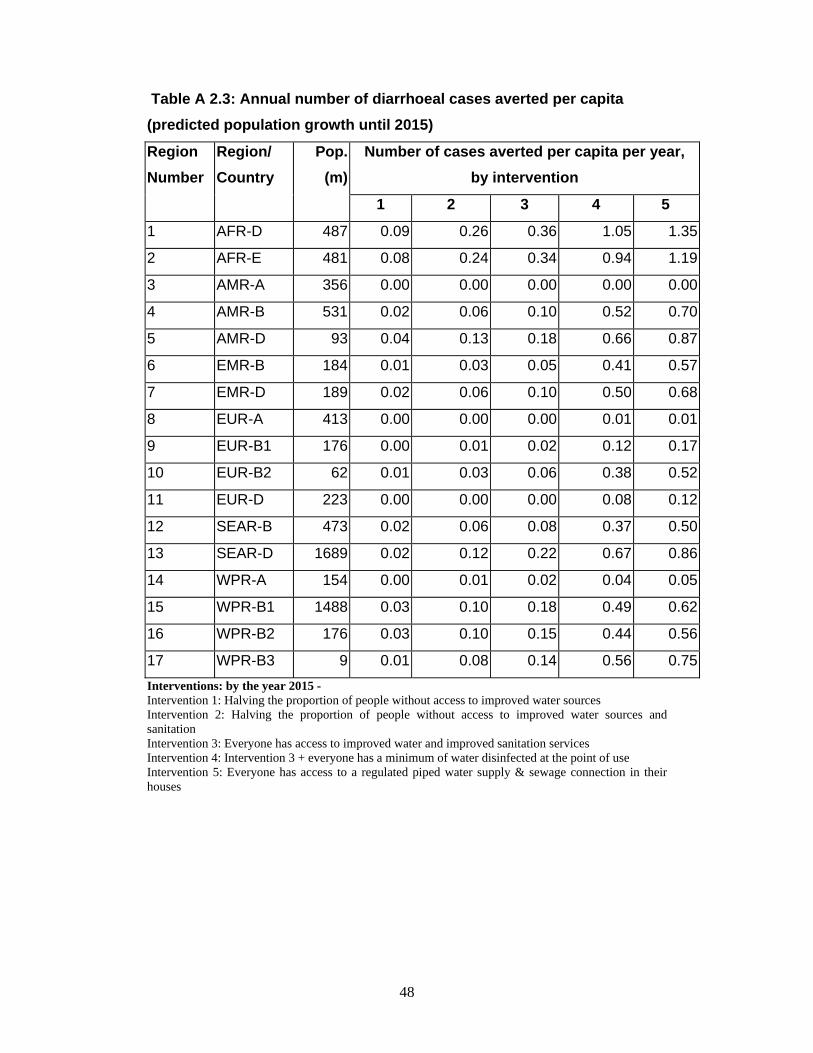
48
Table A 2.3: Annual number of diarrhoeal cases averted per capita (predicted population growth until 2015)
Number of cases averted per capita per year, by intervention
Region Number
Region/ Country
Pop. (m)
1 2 3 4 5
1 AFR-D 487 0.09 0.26 0.36 1.05 1.35
2 AFR-E 481 0.08 0.24 0.34 0.94 1.19
3 AMR-A 356 0.00 0.00 0.00 0.00 0.00
4 AMR-B 531 0.02 0.06 0.10 0.52 0.70
5 AMR-D 93 0.04 0.13 0.18 0.66 0.87
6 EMR-B 184 0.01 0.03 0.05 0.41 0.57
7 EMR-D 189 0.02 0.06 0.10 0.50 0.68
8 EUR-A 413 0.00 0.00 0.00 0.01 0.01
9 EUR-B1 176 0.00 0.01 0.02 0.12 0.17
10 EUR-B2 62 0.01 0.03 0.06 0.38 0.52
11 EUR-D 223 0.00 0.00 0.00 0.08 0.12
12 SEAR-B 473 0.02 0.06 0.08 0.37 0.50
13 SEAR-D 1689 0.02 0.12 0.22 0.67 0.86
14 WPR-A 154 0.00 0.01 0.02 0.04 0.05
15 WPR-B1 1488 0.03 0.10 0.18 0.49 0.62
16 WPR-B2 176 0.03 0.10 0.15 0.44 0.56
17 WPR-B3 9 0.01 0.08 0.14 0.56 0.75Interventions: by the year 2015 - Intervention 1: Halving the proportion of people without access to improved water sources Intervention 2: Halving the proportion of people without access to improved water sources and sanitation Intervention 3: Everyone has access to improved water and improved sanitation services Intervention 4: Intervention 3 + everyone has a minimum of water disinfected at the point of use Intervention 5: Everyone has access to a regulated piped water supply & sewage connection in their houses
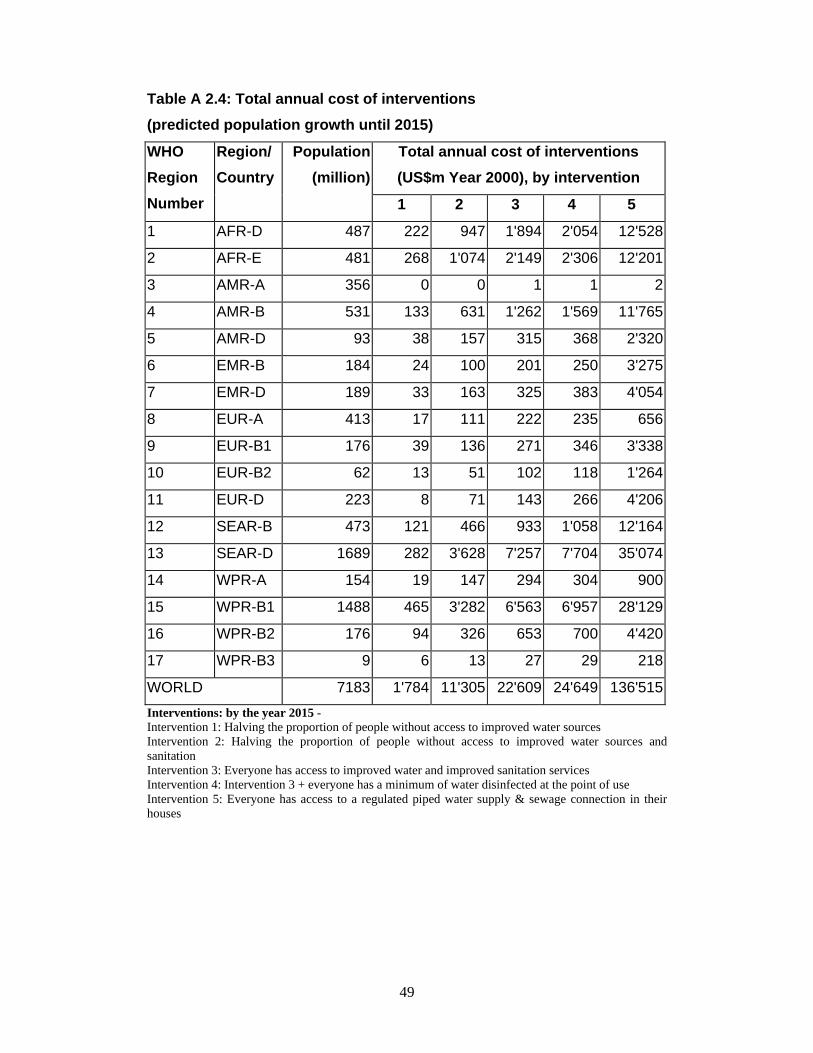
49
Table A 2.4: Total annual cost of interventions (predicted population growth until 2015)
Total annual cost of interventions (US$m Year 2000), by intervention
WHO Region Number
Region/ Country
Population (million)
1 2 3 4 5
1 AFR-D 487 222 947 1'894 2'054 12'528
2 AFR-E 481 268 1'074 2'149 2'306 12'201
3 AMR-A 356 0 0 1 1 2
4 AMR-B 531 133 631 1'262 1'569 11'765
5 AMR-D 93 38 157 315 368 2'320
6 EMR-B 184 24 100 201 250 3'275
7 EMR-D 189 33 163 325 383 4'054
8 EUR-A 413 17 111 222 235 656
9 EUR-B1 176 39 136 271 346 3'338
10 EUR-B2 62 13 51 102 118 1'264
11 EUR-D 223 8 71 143 266 4'206
12 SEAR-B 473 121 466 933 1'058 12'164
13 SEAR-D 1689 282 3'628 7'257 7'704 35'074
14 WPR-A 154 19 147 294 304 900
15 WPR-B1 1488 465 3'282 6'563 6'957 28'129
16 WPR-B2 176 94 326 653 700 4'420
17 WPR-B3 9 6 13 27 29 218
WORLD 7183 1'784 11'305 22'609 24'649 136'515Interventions: by the year 2015 - Intervention 1: Halving the proportion of people without access to improved water sources Intervention 2: Halving the proportion of people without access to improved water sources and sanitation Intervention 3: Everyone has access to improved water and improved sanitation services Intervention 4: Intervention 3 + everyone has a minimum of water disinfected at the point of use Intervention 5: Everyone has access to a regulated piped water supply & sewage connection in their houses
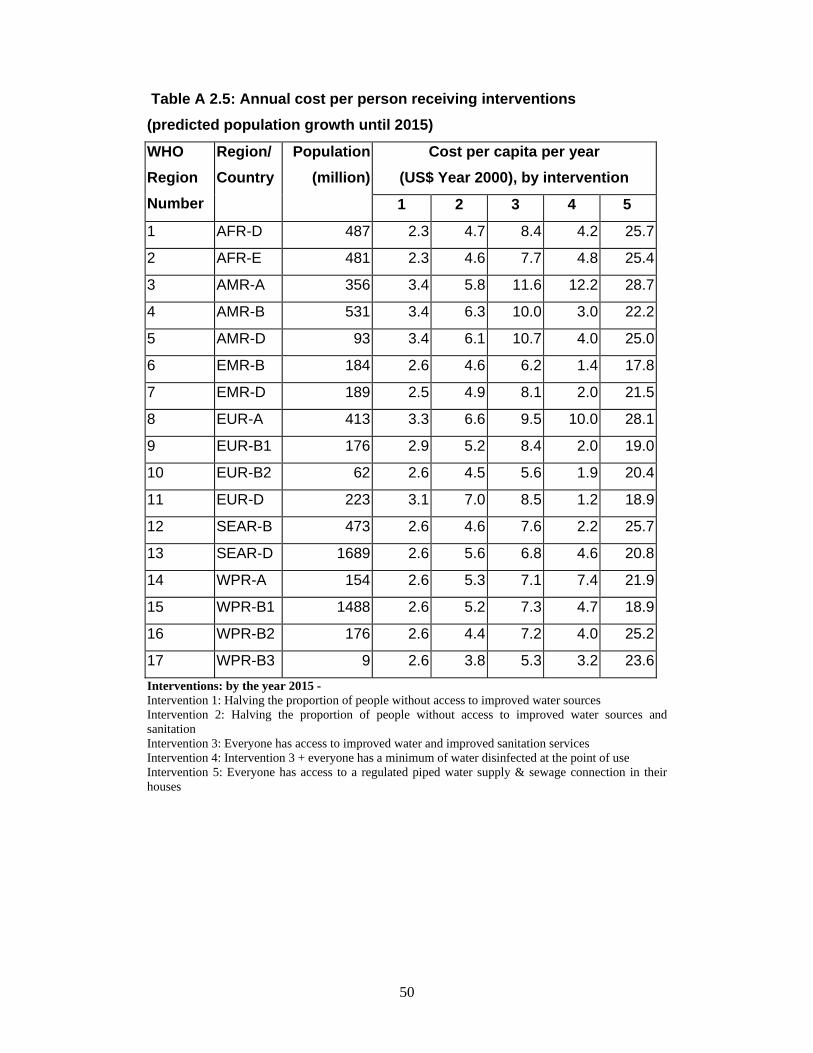
50
Table A 2.5: Annual cost per person receiving interventions (predicted population growth until 2015)
Cost per capita per year (US$ Year 2000), by intervention
WHO Region Number
Region/ Country
Population (million)
1 2 3 4 5
1 AFR-D 487 2.3 4.7 8.4 4.2 25.7
2 AFR-E 481 2.3 4.6 7.7 4.8 25.4
3 AMR-A 356 3.4 5.8 11.6 12.2 28.7
4 AMR-B 531 3.4 6.3 10.0 3.0 22.2
5 AMR-D 93 3.4 6.1 10.7 4.0 25.0
6 EMR-B 184 2.6 4.6 6.2 1.4 17.8
7 EMR-D 189 2.5 4.9 8.1 2.0 21.5
8 EUR-A 413 3.3 6.6 9.5 10.0 28.1
9 EUR-B1 176 2.9 5.2 8.4 2.0 19.0
10 EUR-B2 62 2.6 4.5 5.6 1.9 20.4
11 EUR-D 223 3.1 7.0 8.5 1.2 18.9
12 SEAR-B 473 2.6 4.6 7.6 2.2 25.7
13 SEAR-D 1689 2.6 5.6 6.8 4.6 20.8
14 WPR-A 154 2.6 5.3 7.1 7.4 21.9
15 WPR-B1 1488 2.6 5.2 7.3 4.7 18.9
16 WPR-B2 176 2.6 4.4 7.2 4.0 25.2
17 WPR-B3 9 2.6 3.8 5.3 3.2 23.6Interventions: by the year 2015 - Intervention 1: Halving the proportion of people without access to improved water sources Intervention 2: Halving the proportion of people without access to improved water sources and sanitation Intervention 3: Everyone has access to improved water and improved sanitation services Intervention 4: Intervention 3 + everyone has a minimum of water disinfected at the point of use Intervention 5: Everyone has access to a regulated piped water supply & sewage connection in their houses
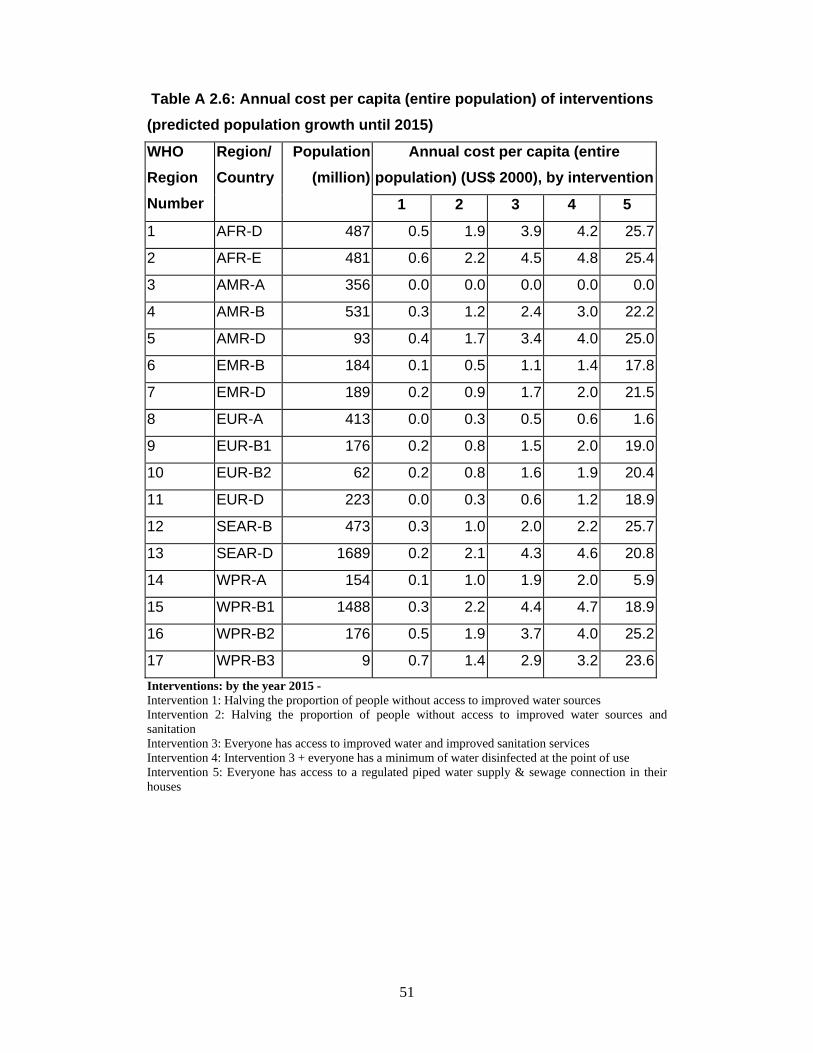
51
Table A 2.6: Annual cost per capita (entire population) of interventions (predicted population growth until 2015)
Annual cost per capita (entire population) (US$ 2000), by intervention
WHO Region Number
Region/ Country
Population (million)
1 2 3 4 5
1 AFR-D 487 0.5 1.9 3.9 4.2 25.7
2 AFR-E 481 0.6 2.2 4.5 4.8 25.4
3 AMR-A 356 0.0 0.0 0.0 0.0 0.0
4 AMR-B 531 0.3 1.2 2.4 3.0 22.2
5 AMR-D 93 0.4 1.7 3.4 4.0 25.0
6 EMR-B 184 0.1 0.5 1.1 1.4 17.8
7 EMR-D 189 0.2 0.9 1.7 2.0 21.5
8 EUR-A 413 0.0 0.3 0.5 0.6 1.6
9 EUR-B1 176 0.2 0.8 1.5 2.0 19.0
10 EUR-B2 62 0.2 0.8 1.6 1.9 20.4
11 EUR-D 223 0.0 0.3 0.6 1.2 18.9
12 SEAR-B 473 0.3 1.0 2.0 2.2 25.7
13 SEAR-D 1689 0.2 2.1 4.3 4.6 20.8
14 WPR-A 154 0.1 1.0 1.9 2.0 5.9
15 WPR-B1 1488 0.3 2.2 4.4 4.7 18.9
16 WPR-B2 176 0.5 1.9 3.7 4.0 25.2
17 WPR-B3 9 0.7 1.4 2.9 3.2 23.6Interventions: by the year 2015 - Intervention 1: Halving the proportion of people without access to improved water sources Intervention 2: Halving the proportion of people without access to improved water sources and sanitation Intervention 3: Everyone has access to improved water and improved sanitation services Intervention 4: Intervention 3 + everyone has a minimum of water disinfected at the point of use Intervention 5: Everyone has access to a regulated piped water supply & sewage connection in their houses
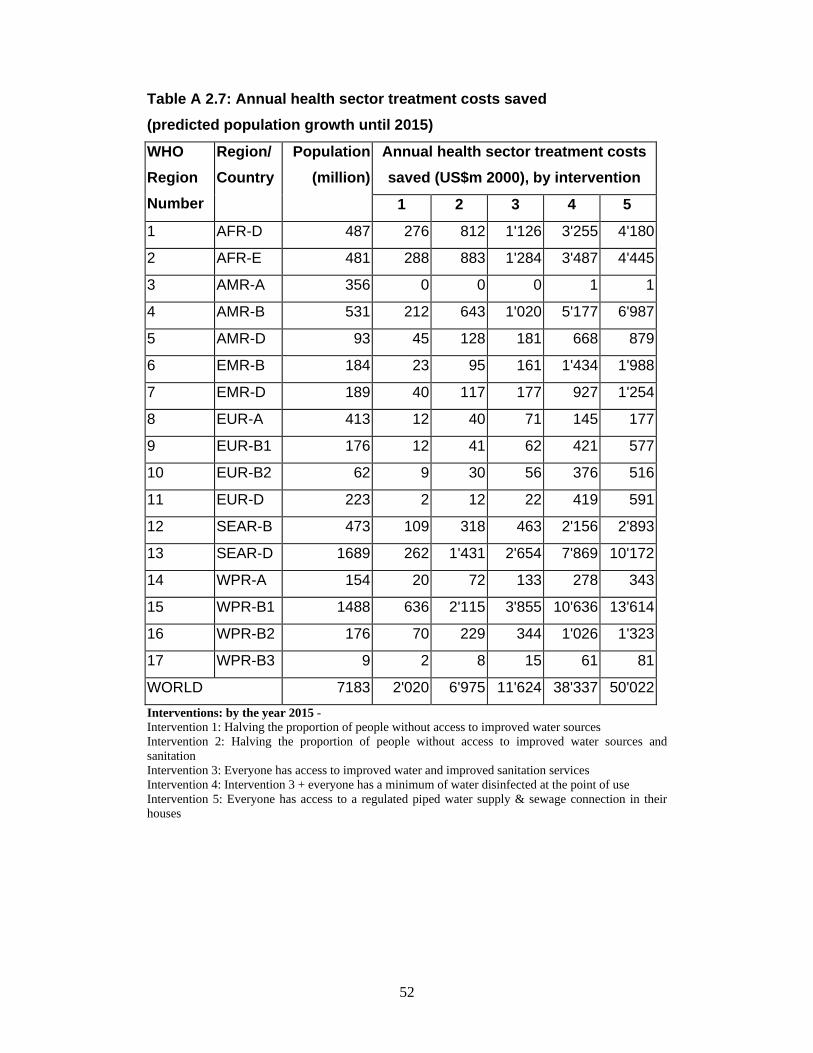
52
Table A 2.7: Annual health sector treatment costs saved (predicted population growth until 2015)
Annual health sector treatment costs saved (US$m 2000), by intervention
WHO Region Number
Region/ Country
Population (million)
1 2 3 4 5
1 AFR-D 487 276 812 1'126 3'255 4'180
2 AFR-E 481 288 883 1'284 3'487 4'445
3 AMR-A 356 0 0 0 1 1
4 AMR-B 531 212 643 1'020 5'177 6'987
5 AMR-D 93 45 128 181 668 879
6 EMR-B 184 23 95 161 1'434 1'988
7 EMR-D 189 40 117 177 927 1'254
8 EUR-A 413 12 40 71 145 177
9 EUR-B1 176 12 41 62 421 577
10 EUR-B2 62 9 30 56 376 516
11 EUR-D 223 2 12 22 419 591
12 SEAR-B 473 109 318 463 2'156 2'893
13 SEAR-D 1689 262 1'431 2'654 7'869 10'172
14 WPR-A 154 20 72 133 278 343
15 WPR-B1 1488 636 2'115 3'855 10'636 13'614
16 WPR-B2 176 70 229 344 1'026 1'323
17 WPR-B3 9 2 8 15 61 81
WORLD 7183 2'020 6'975 11'624 38'337 50'022Interventions: by the year 2015 - Intervention 1: Halving the proportion of people without access to improved water sources Intervention 2: Halving the proportion of people without access to improved water sources and sanitation Intervention 3: Everyone has access to improved water and improved sanitation services Intervention 4: Intervention 3 + everyone has a minimum of water disinfected at the point of use Intervention 5: Everyone has access to a regulated piped water supply & sewage connection in their houses
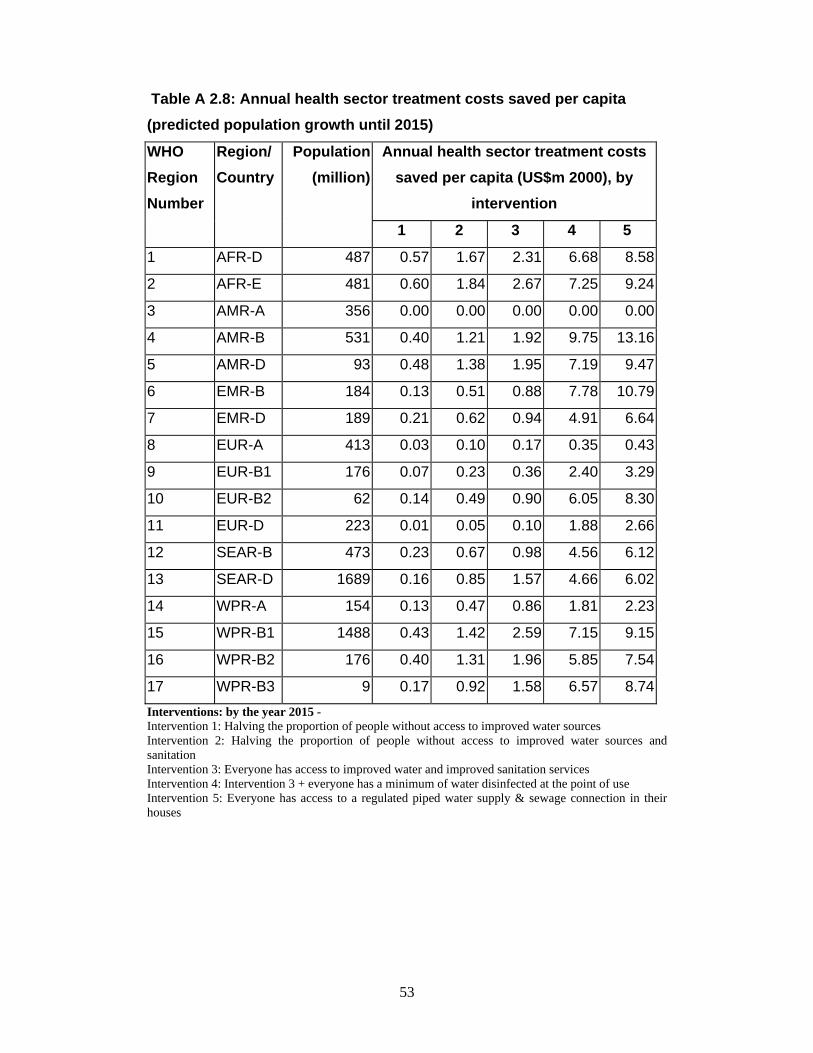
53
Table A 2.8: Annual health sector treatment costs saved per capita (predicted population growth until 2015)
Annual health sector treatment costs saved per capita (US$m 2000), by
intervention
WHO Region Number
Region/ Country
Population (million)
1 2 3 4 5
1 AFR-D 487 0.57 1.67 2.31 6.68 8.58
2 AFR-E 481 0.60 1.84 2.67 7.25 9.24
3 AMR-A 356 0.00 0.00 0.00 0.00 0.00
4 AMR-B 531 0.40 1.21 1.92 9.75 13.16
5 AMR-D 93 0.48 1.38 1.95 7.19 9.47
6 EMR-B 184 0.13 0.51 0.88 7.78 10.79
7 EMR-D 189 0.21 0.62 0.94 4.91 6.64
8 EUR-A 413 0.03 0.10 0.17 0.35 0.43
9 EUR-B1 176 0.07 0.23 0.36 2.40 3.29
10 EUR-B2 62 0.14 0.49 0.90 6.05 8.30
11 EUR-D 223 0.01 0.05 0.10 1.88 2.66
12 SEAR-B 473 0.23 0.67 0.98 4.56 6.12
13 SEAR-D 1689 0.16 0.85 1.57 4.66 6.02
14 WPR-A 154 0.13 0.47 0.86 1.81 2.23
15 WPR-B1 1488 0.43 1.42 2.59 7.15 9.15
16 WPR-B2 176 0.40 1.31 1.96 5.85 7.54
17 WPR-B3 9 0.17 0.92 1.58 6.57 8.74Interventions: by the year 2015 - Intervention 1: Halving the proportion of people without access to improved water sources Intervention 2: Halving the proportion of people without access to improved water sources and sanitation Intervention 3: Everyone has access to improved water and improved sanitation services Intervention 4: Intervention 3 + everyone has a minimum of water disinfected at the point of use Intervention 5: Everyone has access to a regulated piped water supply & sewage connection in their houses
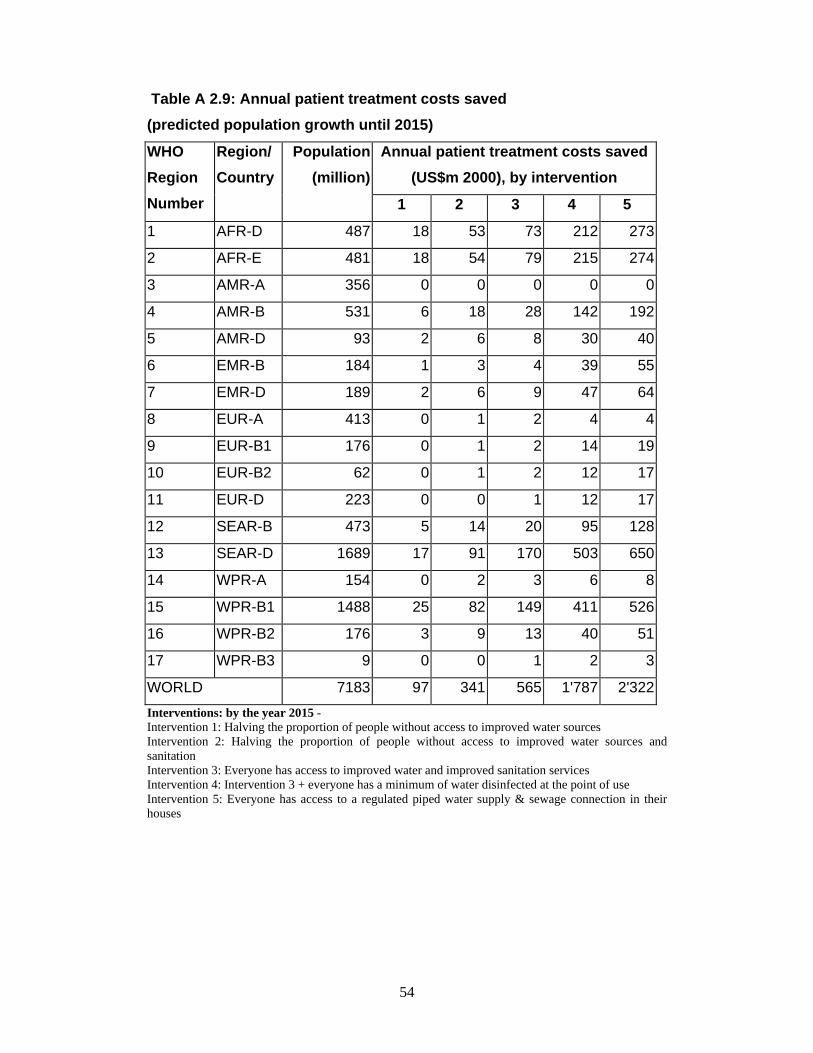
54
Table A 2.9: Annual patient treatment costs saved (predicted population growth until 2015)
Annual patient treatment costs saved (US$m 2000), by intervention
WHO Region Number
Region/ Country
Population (million)
1 2 3 4 5
1 AFR-D 487 18 53 73 212 273
2 AFR-E 481 18 54 79 215 274
3 AMR-A 356 0 0 0 0 0
4 AMR-B 531 6 18 28 142 192
5 AMR-D 93 2 6 8 30 40
6 EMR-B 184 1 3 4 39 55
7 EMR-D 189 2 6 9 47 64
8 EUR-A 413 0 1 2 4 4
9 EUR-B1 176 0 1 2 14 19
10 EUR-B2 62 0 1 2 12 17
11 EUR-D 223 0 0 1 12 17
12 SEAR-B 473 5 14 20 95 128
13 SEAR-D 1689 17 91 170 503 650
14 WPR-A 154 0 2 3 6 8
15 WPR-B1 1488 25 82 149 411 526
16 WPR-B2 176 3 9 13 40 51
17 WPR-B3 9 0 0 1 2 3
WORLD 7183 97 341 565 1'787 2'322Interventions: by the year 2015 - Intervention 1: Halving the proportion of people without access to improved water sources Intervention 2: Halving the proportion of people without access to improved water sources and sanitation Intervention 3: Everyone has access to improved water and improved sanitation services Intervention 4: Intervention 3 + everyone has a minimum of water disinfected at the point of use Intervention 5: Everyone has access to a regulated piped water supply & sewage connection in their houses
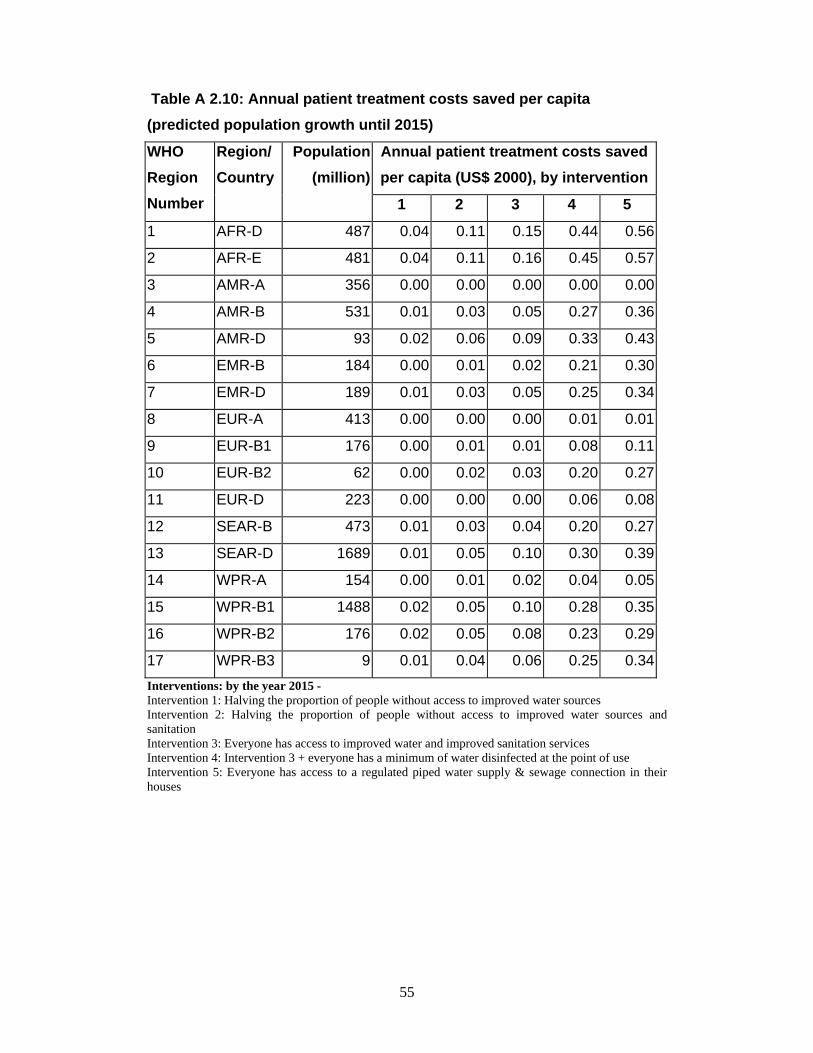
55
Table A 2.10: Annual patient treatment costs saved per capita (predicted population growth until 2015)
Annual patient treatment costs saved per capita (US$ 2000), by intervention
WHO Region Number
Region/ Country
Population (million)
1 2 3 4 5
1 AFR-D 487 0.04 0.11 0.15 0.44 0.56
2 AFR-E 481 0.04 0.11 0.16 0.45 0.57
3 AMR-A 356 0.00 0.00 0.00 0.00 0.00
4 AMR-B 531 0.01 0.03 0.05 0.27 0.36
5 AMR-D 93 0.02 0.06 0.09 0.33 0.43
6 EMR-B 184 0.00 0.01 0.02 0.21 0.30
7 EMR-D 189 0.01 0.03 0.05 0.25 0.34
8 EUR-A 413 0.00 0.00 0.00 0.01 0.01
9 EUR-B1 176 0.00 0.01 0.01 0.08 0.11
10 EUR-B2 62 0.00 0.02 0.03 0.20 0.27
11 EUR-D 223 0.00 0.00 0.00 0.06 0.08
12 SEAR-B 473 0.01 0.03 0.04 0.20 0.27
13 SEAR-D 1689 0.01 0.05 0.10 0.30 0.39
14 WPR-A 154 0.00 0.01 0.02 0.04 0.05
15 WPR-B1 1488 0.02 0.05 0.10 0.28 0.35
16 WPR-B2 176 0.02 0.05 0.08 0.23 0.29
17 WPR-B3 9 0.01 0.04 0.06 0.25 0.34Interventions: by the year 2015 - Intervention 1: Halving the proportion of people without access to improved water sources Intervention 2: Halving the proportion of people without access to improved water sources and sanitation Intervention 3: Everyone has access to improved water and improved sanitation services Intervention 4: Intervention 3 + everyone has a minimum of water disinfected at the point of use Intervention 5: Everyone has access to a regulated piped water supply & sewage connection in their houses
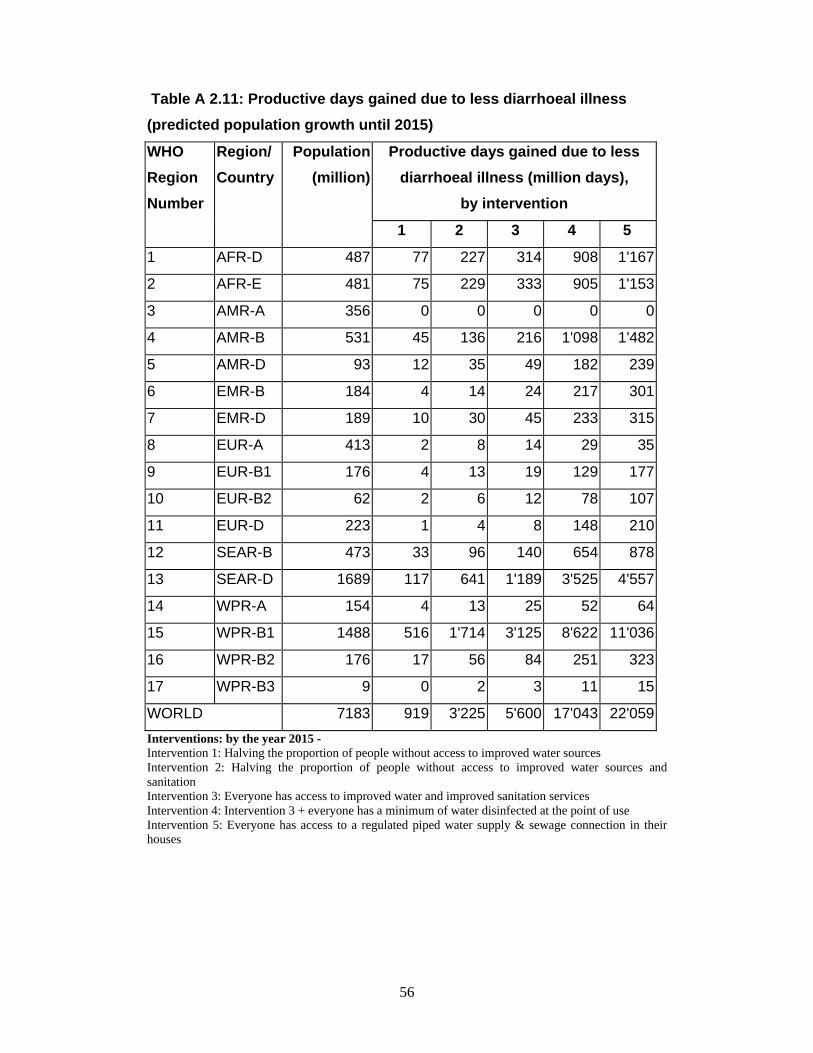
56
Table A 2.11: Productive days gained due to less diarrhoeal illness
(predicted population growth until 2015)
Productive days gained due to less diarrhoeal illness (million days),
by intervention
WHO Region Number
Region/ Country
Population (million)
1 2 3 4 5
1 AFR-D 487 77 227 314 908 1'167
2 AFR-E 481 75 229 333 905 1'153
3 AMR-A 356 0 0 0 0 0
4 AMR-B 531 45 136 216 1'098 1'482
5 AMR-D 93 12 35 49 182 239
6 EMR-B 184 4 14 24 217 301
7 EMR-D 189 10 30 45 233 315
8 EUR-A 413 2 8 14 29 35
9 EUR-B1 176 4 13 19 129 177
10 EUR-B2 62 2 6 12 78 107
11 EUR-D 223 1 4 8 148 210
12 SEAR-B 473 33 96 140 654 878
13 SEAR-D 1689 117 641 1'189 3'525 4'557
14 WPR-A 154 4 13 25 52 64
15 WPR-B1 1488 516 1'714 3'125 8'622 11'036
16 WPR-B2 176 17 56 84 251 323
17 WPR-B3 9 0 2 3 11 15
WORLD 7183 919 3'225 5'600 17'043 22'059Interventions: by the year 2015 - Intervention 1: Halving the proportion of people without access to improved water sources Intervention 2: Halving the proportion of people without access to improved water sources and sanitation Intervention 3: Everyone has access to improved water and improved sanitation services Intervention 4: Intervention 3 + everyone has a minimum of water disinfected at the point of use Intervention 5: Everyone has access to a regulated piped water supply & sewage connection in their houses
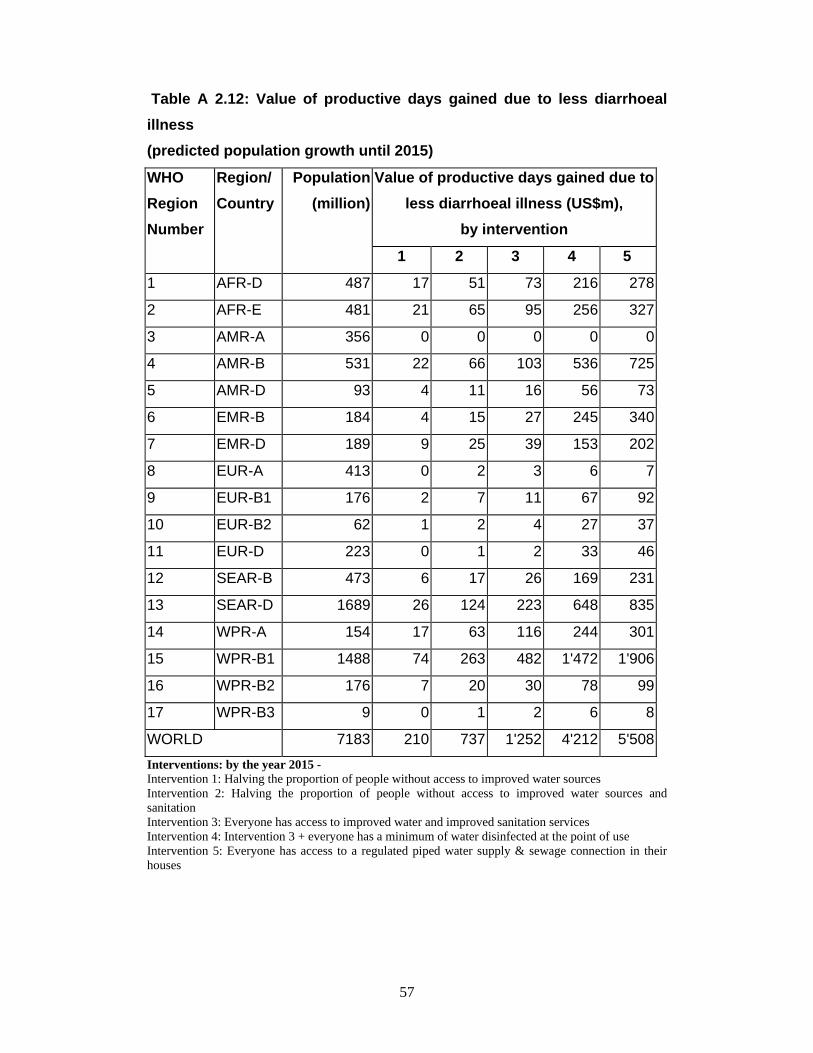
57
Table A 2.12: Value of productive days gained due to less diarrhoeal illness (predicted population growth until 2015)
Value of productive days gained due to less diarrhoeal illness (US$m),
by intervention
WHO Region Number
Region/ Country
Population (million)
1 2 3 4 5
1 AFR-D 487 17 51 73 216 278
2 AFR-E 481 21 65 95 256 327
3 AMR-A 356 0 0 0 0 0
4 AMR-B 531 22 66 103 536 725
5 AMR-D 93 4 11 16 56 73
6 EMR-B 184 4 15 27 245 340
7 EMR-D 189 9 25 39 153 202
8 EUR-A 413 0 2 3 6 7
9 EUR-B1 176 2 7 11 67 92
10 EUR-B2 62 1 2 4 27 37
11 EUR-D 223 0 1 2 33 46
12 SEAR-B 473 6 17 26 169 231
13 SEAR-D 1689 26 124 223 648 835
14 WPR-A 154 17 63 116 244 301
15 WPR-B1 1488 74 263 482 1'472 1'906
16 WPR-B2 176 7 20 30 78 99
17 WPR-B3 9 0 1 2 6 8
WORLD 7183 210 737 1'252 4'212 5'508Interventions: by the year 2015 - Intervention 1: Halving the proportion of people without access to improved water sources Intervention 2: Halving the proportion of people without access to improved water sources and sanitation Intervention 3: Everyone has access to improved water and improved sanitation services Intervention 4: Intervention 3 + everyone has a minimum of water disinfected at the point of use Intervention 5: Everyone has access to a regulated piped water supply & sewage connection in their houses
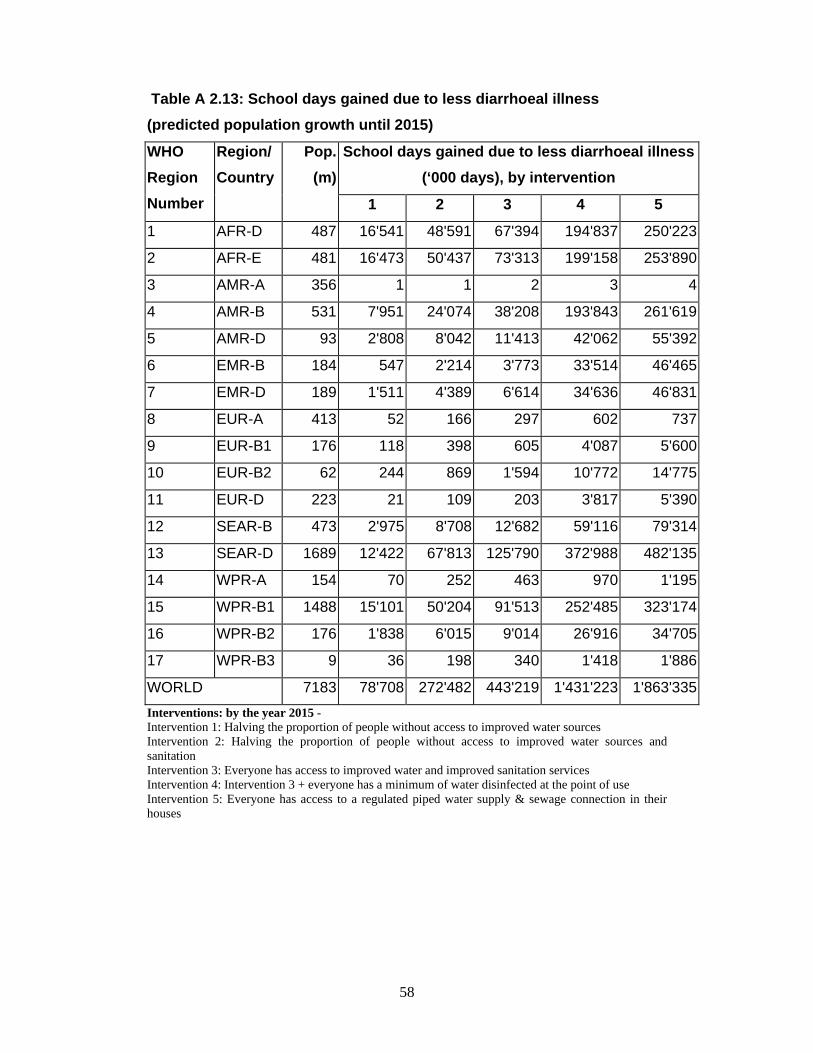
58
Table A 2.13: School days gained due to less diarrhoeal illness (predicted population growth until 2015)
School days gained due to less diarrhoeal illness (‘000 days), by intervention
WHO Region Number
Region/ Country
Pop.(m)
1 2 3 4 5
1 AFR-D 487 16'541 48'591 67'394 194'837 250'223
2 AFR-E 481 16'473 50'437 73'313 199'158 253'890
3 AMR-A 356 1 1 2 3 4
4 AMR-B 531 7'951 24'074 38'208 193'843 261'619
5 AMR-D 93 2'808 8'042 11'413 42'062 55'392
6 EMR-B 184 547 2'214 3'773 33'514 46'465
7 EMR-D 189 1'511 4'389 6'614 34'636 46'831
8 EUR-A 413 52 166 297 602 737
9 EUR-B1 176 118 398 605 4'087 5'600
10 EUR-B2 62 244 869 1'594 10'772 14'775
11 EUR-D 223 21 109 203 3'817 5'390
12 SEAR-B 473 2'975 8'708 12'682 59'116 79'314
13 SEAR-D 1689 12'422 67'813 125'790 372'988 482'135
14 WPR-A 154 70 252 463 970 1'195
15 WPR-B1 1488 15'101 50'204 91'513 252'485 323'174
16 WPR-B2 176 1'838 6'015 9'014 26'916 34'705
17 WPR-B3 9 36 198 340 1'418 1'886
WORLD 7183 78'708 272'482 443'219 1'431'223 1'863'335Interventions: by the year 2015 - Intervention 1: Halving the proportion of people without access to improved water sources Intervention 2: Halving the proportion of people without access to improved water sources and sanitation Intervention 3: Everyone has access to improved water and improved sanitation services Intervention 4: Intervention 3 + everyone has a minimum of water disinfected at the point of use Intervention 5: Everyone has access to a regulated piped water supply & sewage connection in their houses
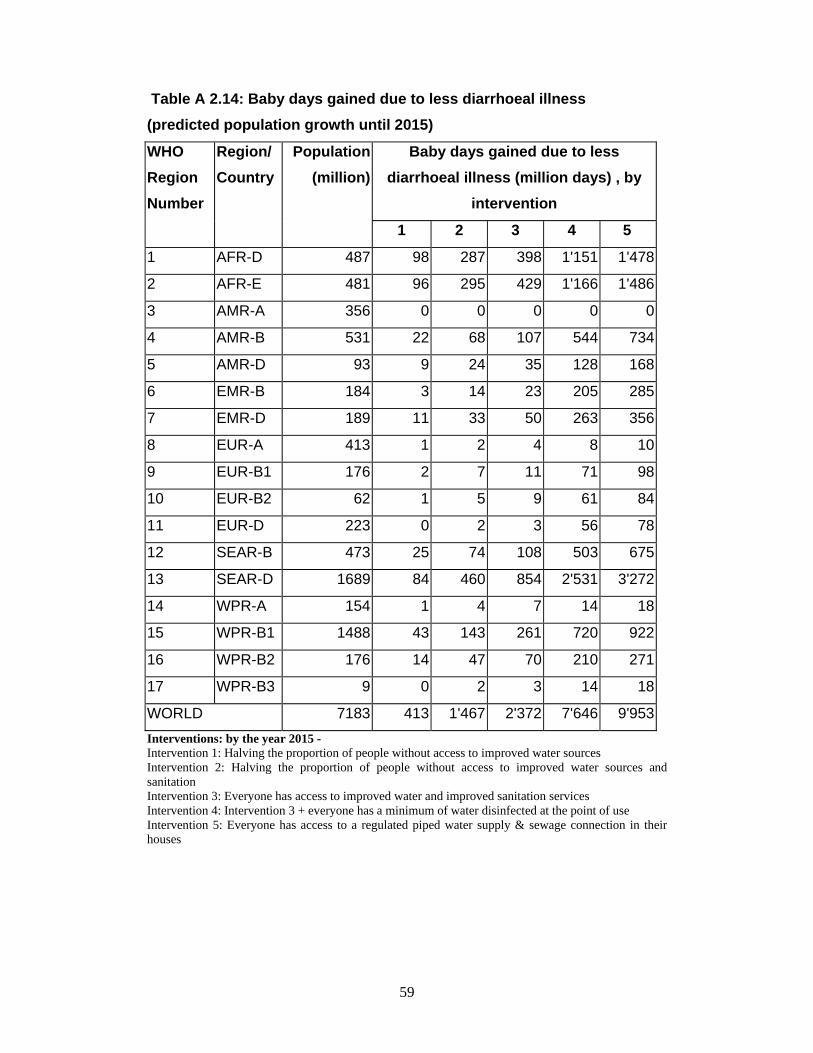
59
Table A 2.14: Baby days gained due to less diarrhoeal illness (predicted population growth until 2015)
Baby days gained due to less diarrhoeal illness (million days) , by
intervention
WHO Region Number
Region/ Country
Population (million)
1 2 3 4 5
1 AFR-D 487 98 287 398 1'151 1'478
2 AFR-E 481 96 295 429 1'166 1'486
3 AMR-A 356 0 0 0 0 0
4 AMR-B 531 22 68 107 544 734
5 AMR-D 93 9 24 35 128 168
6 EMR-B 184 3 14 23 205 285
7 EMR-D 189 11 33 50 263 356
8 EUR-A 413 1 2 4 8 10
9 EUR-B1 176 2 7 11 71 98
10 EUR-B2 62 1 5 9 61 84
11 EUR-D 223 0 2 3 56 78
12 SEAR-B 473 25 74 108 503 675
13 SEAR-D 1689 84 460 854 2'531 3'272
14 WPR-A 154 1 4 7 14 18
15 WPR-B1 1488 43 143 261 720 922
16 WPR-B2 176 14 47 70 210 271
17 WPR-B3 9 0 2 3 14 18
WORLD 7183 413 1'467 2'372 7'646 9'953Interventions: by the year 2015 - Intervention 1: Halving the proportion of people without access to improved water sources Intervention 2: Halving the proportion of people without access to improved water sources and sanitation Intervention 3: Everyone has access to improved water and improved sanitation services Intervention 4: Intervention 3 + everyone has a minimum of water disinfected at the point of use Intervention 5: Everyone has access to a regulated piped water supply & sewage connection in their houses
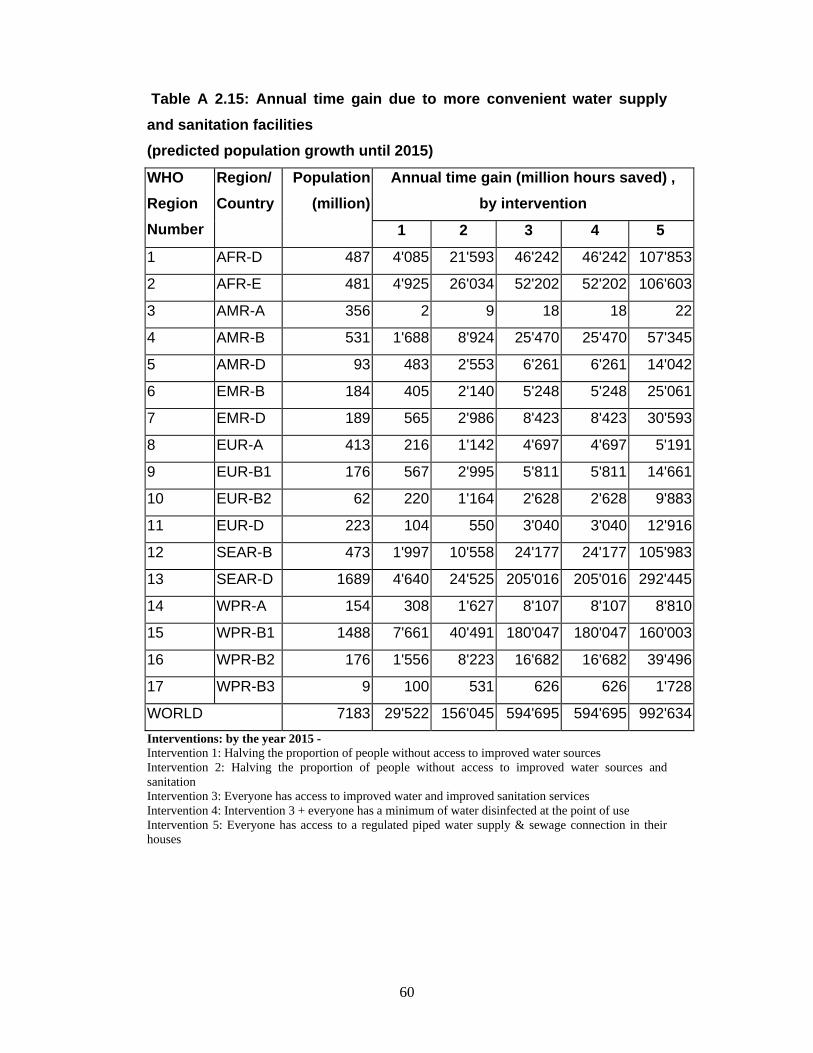
60
Table A 2.15: Annual time gain due to more convenient water supply and sanitation facilities (predicted population growth until 2015)
Annual time gain (million hours saved) , by intervention
WHO Region Number
Region/ Country
Population (million)
1 2 3 4 5
1 AFR-D 487 4'085 21'593 46'242 46'242 107'853
2 AFR-E 481 4'925 26'034 52'202 52'202 106'603
3 AMR-A 356 2 9 18 18 22
4 AMR-B 531 1'688 8'924 25'470 25'470 57'345
5 AMR-D 93 483 2'553 6'261 6'261 14'042
6 EMR-B 184 405 2'140 5'248 5'248 25'061
7 EMR-D 189 565 2'986 8'423 8'423 30'593
8 EUR-A 413 216 1'142 4'697 4'697 5'191
9 EUR-B1 176 567 2'995 5'811 5'811 14'661
10 EUR-B2 62 220 1'164 2'628 2'628 9'883
11 EUR-D 223 104 550 3'040 3'040 12'916
12 SEAR-B 473 1'997 10'558 24'177 24'177 105'983
13 SEAR-D 1689 4'640 24'525 205'016 205'016 292'445
14 WPR-A 154 308 1'627 8'107 8'107 8'810
15 WPR-B1 1488 7'661 40'491 180'047 180'047 160'003
16 WPR-B2 176 1'556 8'223 16'682 16'682 39'496
17 WPR-B3 9 100 531 626 626 1'728
WORLD 7183 29'522 156'045 594'695 594'695 992'634Interventions: by the year 2015 - Intervention 1: Halving the proportion of people without access to improved water sources Intervention 2: Halving the proportion of people without access to improved water sources and sanitation Intervention 3: Everyone has access to improved water and improved sanitation services Intervention 4: Intervention 3 + everyone has a minimum of water disinfected at the point of use Intervention 5: Everyone has access to a regulated piped water supply & sewage connection in their houses
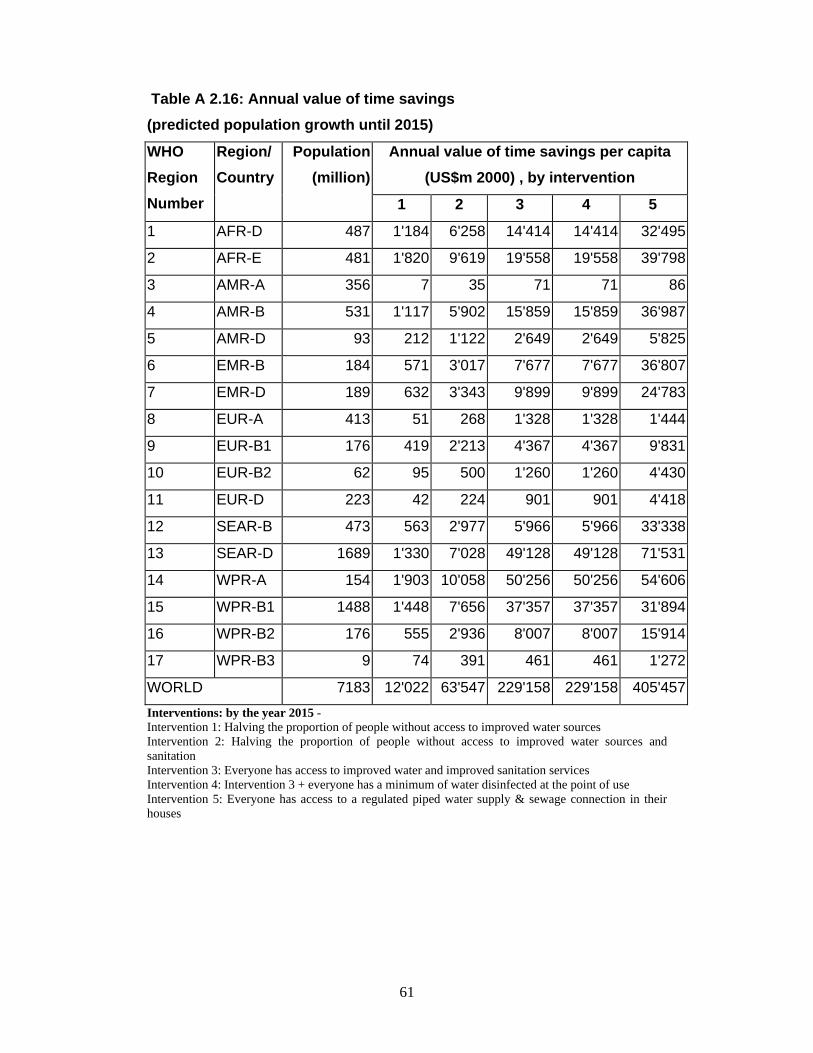
61
Table A 2.16: Annual value of time savings (predicted population growth until 2015)
Annual value of time savings per capita (US$m 2000) , by intervention
WHO Region Number
Region/ Country
Population (million)
1 2 3 4 5
1 AFR-D 487 1'184 6'258 14'414 14'414 32'495
2 AFR-E 481 1'820 9'619 19'558 19'558 39'798
3 AMR-A 356 7 35 71 71 86
4 AMR-B 531 1'117 5'902 15'859 15'859 36'987
5 AMR-D 93 212 1'122 2'649 2'649 5'825
6 EMR-B 184 571 3'017 7'677 7'677 36'807
7 EMR-D 189 632 3'343 9'899 9'899 24'783
8 EUR-A 413 51 268 1'328 1'328 1'444
9 EUR-B1 176 419 2'213 4'367 4'367 9'831
10 EUR-B2 62 95 500 1'260 1'260 4'430
11 EUR-D 223 42 224 901 901 4'418
12 SEAR-B 473 563 2'977 5'966 5'966 33'338
13 SEAR-D 1689 1'330 7'028 49'128 49'128 71'531
14 WPR-A 154 1'903 10'058 50'256 50'256 54'606
15 WPR-B1 1488 1'448 7'656 37'357 37'357 31'894
16 WPR-B2 176 555 2'936 8'007 8'007 15'914
17 WPR-B3 9 74 391 461 461 1'272
WORLD 7183 12'022 63'547 229'158 229'158 405'457Interventions: by the year 2015 - Intervention 1: Halving the proportion of people without access to improved water sources Intervention 2: Halving the proportion of people without access to improved water sources and sanitation Intervention 3: Everyone has access to improved water and improved sanitation services Intervention 4: Intervention 3 + everyone has a minimum of water disinfected at the point of use Intervention 5: Everyone has access to a regulated piped water supply & sewage connection in their houses
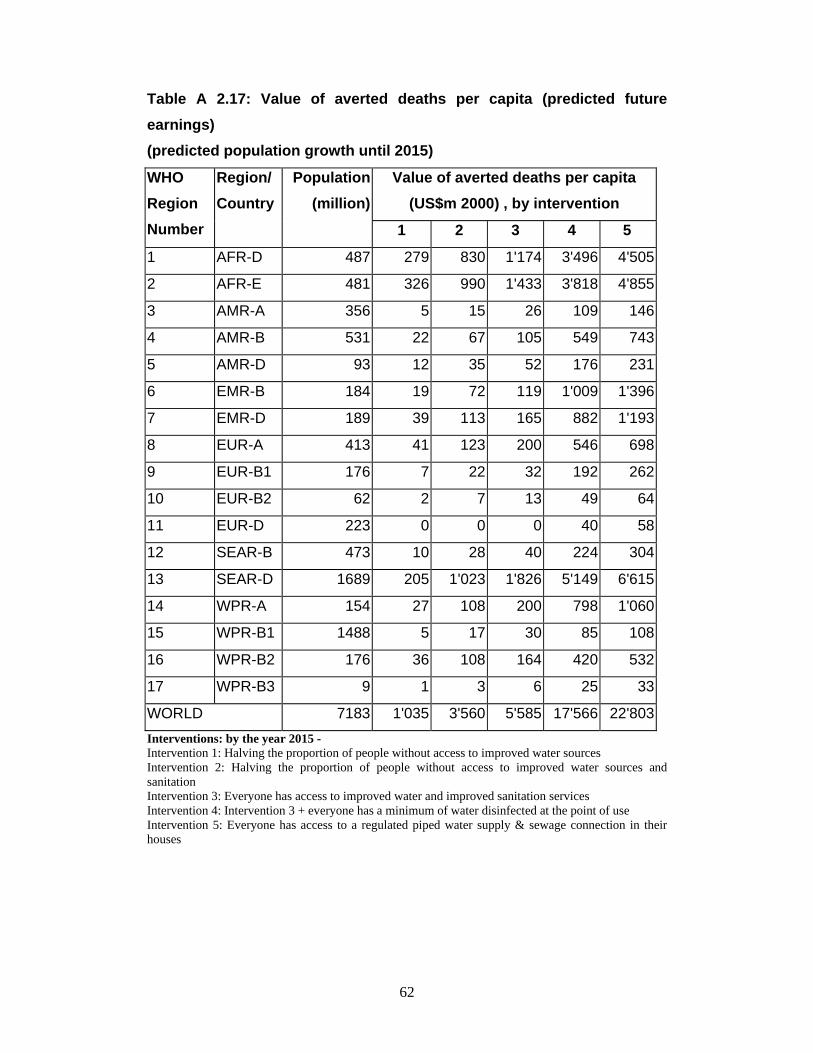
62
Table A 2.17: Value of averted deaths per capita (predicted future earnings) (predicted population growth until 2015)
Value of averted deaths per capita (US$m 2000) , by intervention
WHO Region Number
Region/ Country
Population (million)
1 2 3 4 5
1 AFR-D 487 279 830 1'174 3'496 4'505
2 AFR-E 481 326 990 1'433 3'818 4'855
3 AMR-A 356 5 15 26 109 146
4 AMR-B 531 22 67 105 549 743
5 AMR-D 93 12 35 52 176 231
6 EMR-B 184 19 72 119 1'009 1'396
7 EMR-D 189 39 113 165 882 1'193
8 EUR-A 413 41 123 200 546 698
9 EUR-B1 176 7 22 32 192 262
10 EUR-B2 62 2 7 13 49 64
11 EUR-D 223 0 0 0 40 58
12 SEAR-B 473 10 28 40 224 304
13 SEAR-D 1689 205 1'023 1'826 5'149 6'615
14 WPR-A 154 27 108 200 798 1'060
15 WPR-B1 1488 5 17 30 85 108
16 WPR-B2 176 36 108 164 420 532
17 WPR-B3 9 1 3 6 25 33
WORLD 7183 1'035 3'560 5'585 17'566 22'803Interventions: by the year 2015 - Intervention 1: Halving the proportion of people without access to improved water sources Intervention 2: Halving the proportion of people without access to improved water sources and sanitation Intervention 3: Everyone has access to improved water and improved sanitation services Intervention 4: Intervention 3 + everyone has a minimum of water disinfected at the point of use Intervention 5: Everyone has access to a regulated piped water supply & sewage connection in their houses
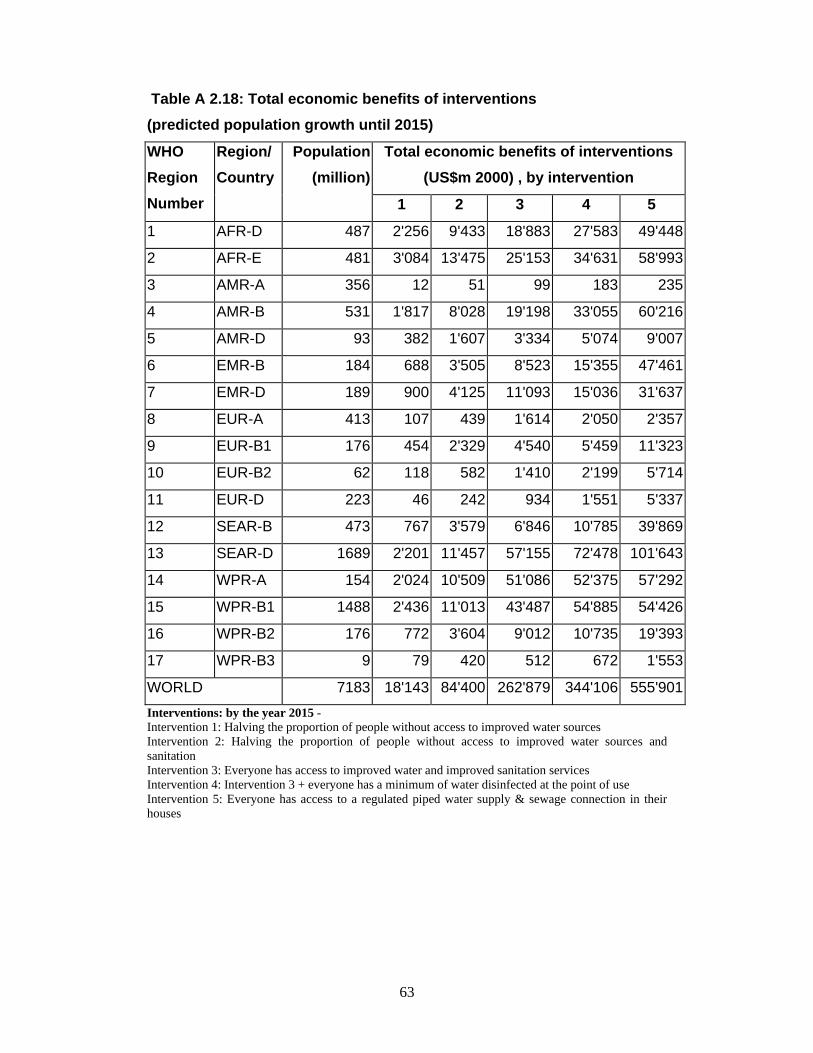
63
Table A 2.18: Total economic benefits of interventions (predicted population growth until 2015)
Total economic benefits of interventions (US$m 2000) , by intervention
WHO Region Number
Region/ Country
Population (million)
1 2 3 4 5
1 AFR-D 487 2'256 9'433 18'883 27'583 49'448
2 AFR-E 481 3'084 13'475 25'153 34'631 58'993
3 AMR-A 356 12 51 99 183 235
4 AMR-B 531 1'817 8'028 19'198 33'055 60'216
5 AMR-D 93 382 1'607 3'334 5'074 9'007
6 EMR-B 184 688 3'505 8'523 15'355 47'461
7 EMR-D 189 900 4'125 11'093 15'036 31'637
8 EUR-A 413 107 439 1'614 2'050 2'357
9 EUR-B1 176 454 2'329 4'540 5'459 11'323
10 EUR-B2 62 118 582 1'410 2'199 5'714
11 EUR-D 223 46 242 934 1'551 5'337
12 SEAR-B 473 767 3'579 6'846 10'785 39'869
13 SEAR-D 1689 2'201 11'457 57'155 72'478 101'643
14 WPR-A 154 2'024 10'509 51'086 52'375 57'292
15 WPR-B1 1488 2'436 11'013 43'487 54'885 54'426
16 WPR-B2 176 772 3'604 9'012 10'735 19'393
17 WPR-B3 9 79 420 512 672 1'553
WORLD 7183 18'143 84'400 262'879 344'106 555'901Interventions: by the year 2015 - Intervention 1: Halving the proportion of people without access to improved water sources Intervention 2: Halving the proportion of people without access to improved water sources and sanitation Intervention 3: Everyone has access to improved water and improved sanitation services Intervention 4: Intervention 3 + everyone has a minimum of water disinfected at the point of use Intervention 5: Everyone has access to a regulated piped water supply & sewage connection in their houses
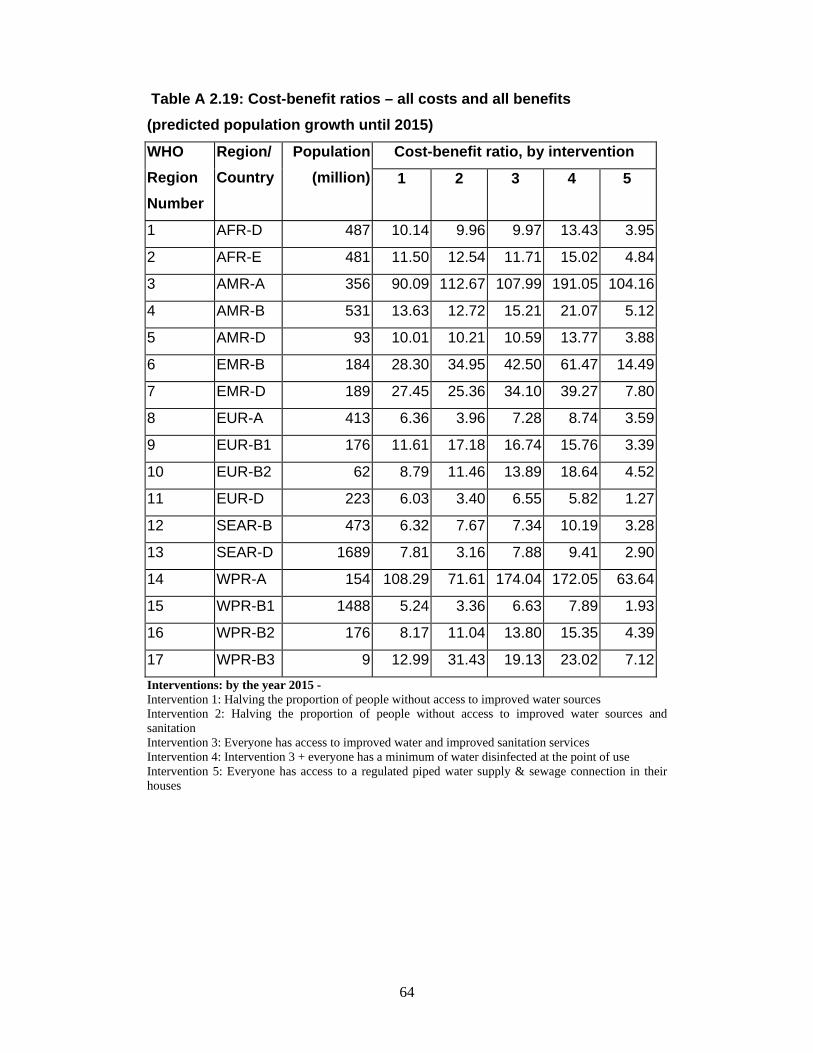
64
Table A 2.19: Cost-benefit ratios – all costs and all benefits (predicted population growth until 2015)
Cost-benefit ratio, by intervention WHO Region Number
Region/ Country
Population (million) 1 2 3 4 5
1 AFR-D 487 10.14 9.96 9.97 13.43 3.95
2 AFR-E 481 11.50 12.54 11.71 15.02 4.84
3 AMR-A 356 90.09 112.67 107.99 191.05 104.16
4 AMR-B 531 13.63 12.72 15.21 21.07 5.12
5 AMR-D 93 10.01 10.21 10.59 13.77 3.88
6 EMR-B 184 28.30 34.95 42.50 61.47 14.49
7 EMR-D 189 27.45 25.36 34.10 39.27 7.80
8 EUR-A 413 6.36 3.96 7.28 8.74 3.59
9 EUR-B1 176 11.61 17.18 16.74 15.76 3.39
10 EUR-B2 62 8.79 11.46 13.89 18.64 4.52
11 EUR-D 223 6.03 3.40 6.55 5.82 1.27
12 SEAR-B 473 6.32 7.67 7.34 10.19 3.28
13 SEAR-D 1689 7.81 3.16 7.88 9.41 2.90
14 WPR-A 154 108.29 71.61 174.04 172.05 63.64
15 WPR-B1 1488 5.24 3.36 6.63 7.89 1.93
16 WPR-B2 176 8.17 11.04 13.80 15.35 4.39
17 WPR-B3 9 12.99 31.43 19.13 23.02 7.12Interventions: by the year 2015 - Intervention 1: Halving the proportion of people without access to improved water sources Intervention 2: Halving the proportion of people without access to improved water sources and sanitation Intervention 3: Everyone has access to improved water and improved sanitation services Intervention 4: Intervention 3 + everyone has a minimum of water disinfected at the point of use Intervention 5: Everyone has access to a regulated piped water supply & sewage connection in their houses

65
Table A 2.20: Cost-benefit ratios – all costs, time saving benefits only (predicted population growth until 2015)
Cost-benefit ratio, by intervention WHO Region Number
Region/ Country
Population (million) 1 2 3 4 5
1 AFR-D 487 5.32 6.61 7.61 7.02 2.59
2 AFR-E 481 6.79 8.95 9.10 8.48 3.26
3 AMR-A 356 50.63 77.65 77.65 73.96 38.16
4 AMR-B 531 8.38 9.35 12.57 10.11 3.14
5 AMR-D 93 5.56 7.12 8.41 7.19 2.51
6 EMR-B 184 23.48 30.09 38.28 30.73 11.24
7 EMR-D 189 19.28 20.55 30.44 25.85 6.11
8 EUR-A 413 3.02 2.42 5.99 5.66 2.20
9 EUR-B1 176 10.71 16.32 16.10 12.61 2.95
10 EUR-B2 62 7.07 9.84 12.40 10.68 3.51
11 EUR-D 223 5.54 3.14 6.32 3.38 1.05
12 SEAR-B 473 4.64 6.38 6.40 5.64 2.74
13 SEAR-D 1689 4.72 1.94 6.77 6.38 2.04
14 WPR-A 154 101.80 68.53 171.21 165.09 60.66
15 WPR-B1 1488 3.11 2.33 5.69 5.37 1.13
16 WPR-B2 176 5.88 8.99 12.26 11.45 3.60
17 WPR-B3 9 12.12 29.22 17.23 15.78 5.83Interventions: by the year 2015 - Intervention 1: Halving the proportion of people without access to improved water sources Intervention 2: Halving the proportion of people without access to improved water sources and sanitation Intervention 3: Everyone has access to improved water and improved sanitation services Intervention 4: Intervention 3 + everyone has a minimum of water disinfected at the point of use Intervention 5: Everyone has access to a regulated piped water supply & sewage connection in their houses
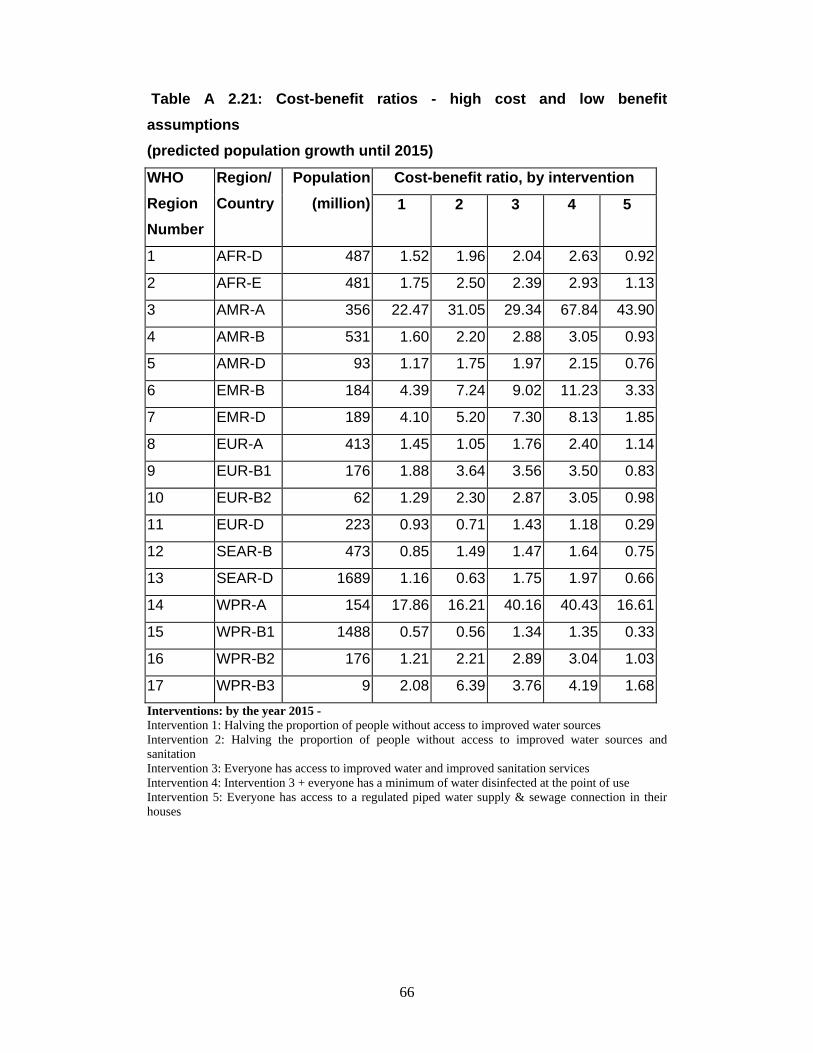
66
Table A 2.21: Cost-benefit ratios - high cost and low benefit assumptions (predicted population growth until 2015)
Cost-benefit ratio, by intervention WHO Region Number
Region/ Country
Population (million) 1 2 3 4 5
1 AFR-D 487 1.52 1.96 2.04 2.63 0.92
2 AFR-E 481 1.75 2.50 2.39 2.93 1.13
3 AMR-A 356 22.47 31.05 29.34 67.84 43.90
4 AMR-B 531 1.60 2.20 2.88 3.05 0.93
5 AMR-D 93 1.17 1.75 1.97 2.15 0.76
6 EMR-B 184 4.39 7.24 9.02 11.23 3.33
7 EMR-D 189 4.10 5.20 7.30 8.13 1.85
8 EUR-A 413 1.45 1.05 1.76 2.40 1.14
9 EUR-B1 176 1.88 3.64 3.56 3.50 0.83
10 EUR-B2 62 1.29 2.30 2.87 3.05 0.98
11 EUR-D 223 0.93 0.71 1.43 1.18 0.29
12 SEAR-B 473 0.85 1.49 1.47 1.64 0.75
13 SEAR-D 1689 1.16 0.63 1.75 1.97 0.66
14 WPR-A 154 17.86 16.21 40.16 40.43 16.61
15 WPR-B1 1488 0.57 0.56 1.34 1.35 0.33
16 WPR-B2 176 1.21 2.21 2.89 3.04 1.03
17 WPR-B3 9 2.08 6.39 3.76 4.19 1.68Interventions: by the year 2015 - Intervention 1: Halving the proportion of people without access to improved water sources Intervention 2: Halving the proportion of people without access to improved water sources and sanitation Intervention 3: Everyone has access to improved water and improved sanitation services Intervention 4: Intervention 3 + everyone has a minimum of water disinfected at the point of use Intervention 5: Everyone has access to a regulated piped water supply & sewage connection in their houses
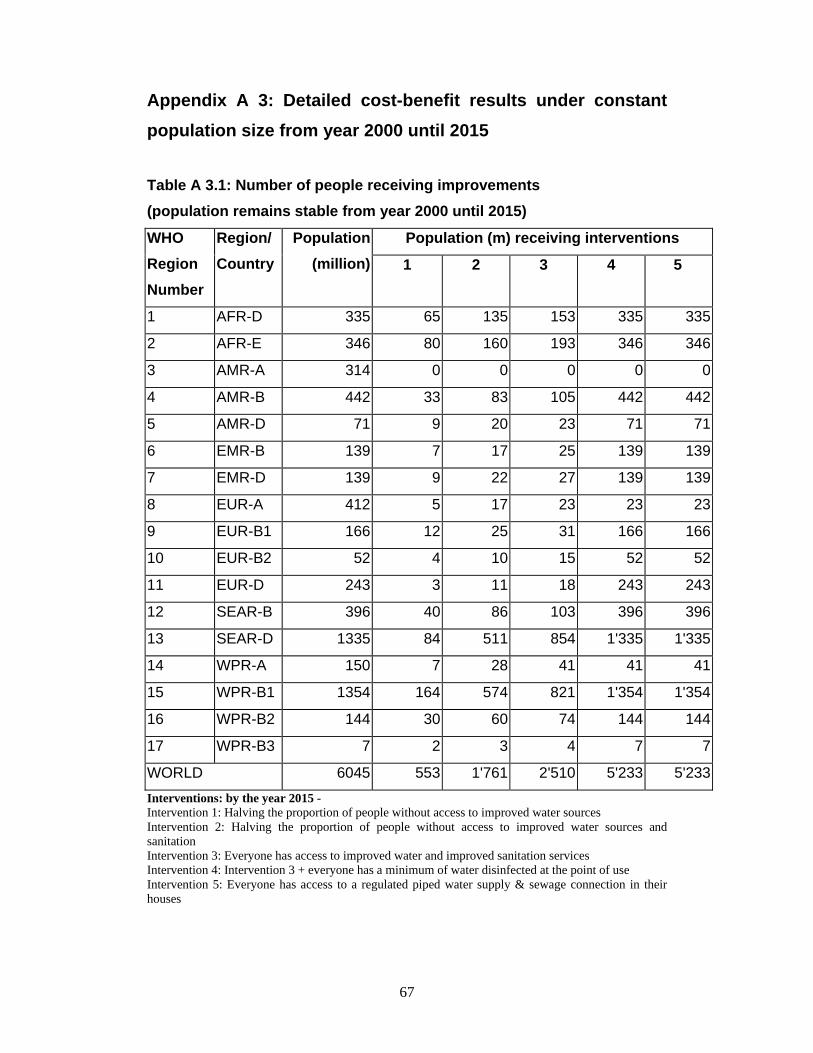
67
Appendix A 3: Detailed cost-benefit results under constant population size from year 2000 until 2015 Table A 3.1: Number of people receiving improvements (population remains stable from year 2000 until 2015)
Population (m) receiving interventions WHO Region Number
Region/ Country
Population (million) 1 2 3 4 5
1 AFR-D 335 65 135 153 335 335
2 AFR-E 346 80 160 193 346 346
3 AMR-A 314 0 0 0 0 0
4 AMR-B 442 33 83 105 442 442
5 AMR-D 71 9 20 23 71 71
6 EMR-B 139 7 17 25 139 139
7 EMR-D 139 9 22 27 139 139
8 EUR-A 412 5 17 23 23 23
9 EUR-B1 166 12 25 31 166 166
10 EUR-B2 52 4 10 15 52 52
11 EUR-D 243 3 11 18 243 243
12 SEAR-B 396 40 86 103 396 396
13 SEAR-D 1335 84 511 854 1'335 1'335
14 WPR-A 150 7 28 41 41 41
15 WPR-B1 1354 164 574 821 1'354 1'354
16 WPR-B2 144 30 60 74 144 144
17 WPR-B3 7 2 3 4 7 7
WORLD 6045 553 1'761 2'510 5'233 5'233Interventions: by the year 2015 - Intervention 1: Halving the proportion of people without access to improved water sources Intervention 2: Halving the proportion of people without access to improved water sources and sanitation Intervention 3: Everyone has access to improved water and improved sanitation services Intervention 4: Intervention 3 + everyone has a minimum of water disinfected at the point of use Intervention 5: Everyone has access to a regulated piped water supply & sewage connection in their houses
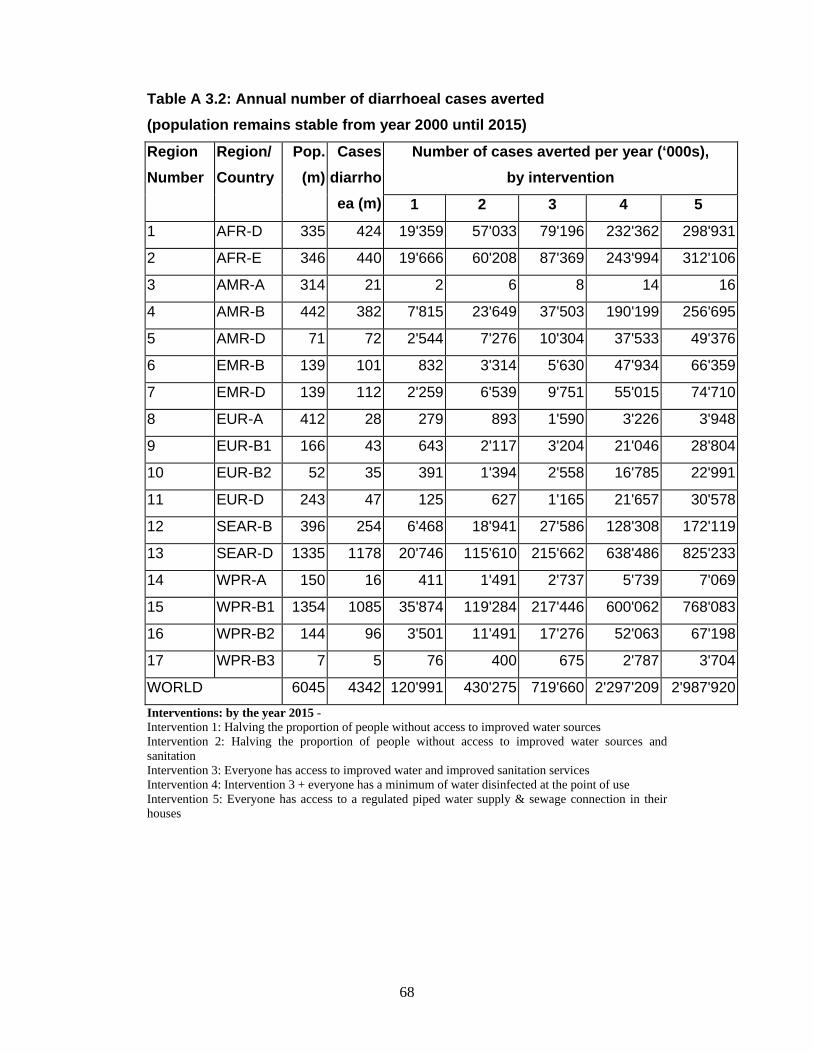
68
Table A 3.2: Annual number of diarrhoeal cases averted (population remains stable from year 2000 until 2015)
Number of cases averted per year (‘000s), by intervention
Region Number
Region/ Country
Pop. (m)
Cases diarrhoea (m) 1 2 3 4 5
1 AFR-D 335 424 19'359 57'033 79'196 232'362 298'931
2 AFR-E 346 440 19'666 60'208 87'369 243'994 312'106
3 AMR-A 314 21 2 6 8 14 16
4 AMR-B 442 382 7'815 23'649 37'503 190'199 256'695
5 AMR-D 71 72 2'544 7'276 10'304 37'533 49'376
6 EMR-B 139 101 832 3'314 5'630 47'934 66'359
7 EMR-D 139 112 2'259 6'539 9'751 55'015 74'710
8 EUR-A 412 28 279 893 1'590 3'226 3'948
9 EUR-B1 166 43 643 2'117 3'204 21'046 28'804
10 EUR-B2 52 35 391 1'394 2'558 16'785 22'991
11 EUR-D 243 47 125 627 1'165 21'657 30'578
12 SEAR-B 396 254 6'468 18'941 27'586 128'308 172'119
13 SEAR-D 1335 1178 20'746 115'610 215'662 638'486 825'233
14 WPR-A 150 16 411 1'491 2'737 5'739 7'069
15 WPR-B1 1354 1085 35'874 119'284 217'446 600'062 768'083
16 WPR-B2 144 96 3'501 11'491 17'276 52'063 67'198
17 WPR-B3 7 5 76 400 675 2'787 3'704
WORLD 6045 4342 120'991 430'275 719'660 2'297'209 2'987'920Interventions: by the year 2015 - Intervention 1: Halving the proportion of people without access to improved water sources Intervention 2: Halving the proportion of people without access to improved water sources and sanitation Intervention 3: Everyone has access to improved water and improved sanitation services Intervention 4: Intervention 3 + everyone has a minimum of water disinfected at the point of use Intervention 5: Everyone has access to a regulated piped water supply & sewage connection in their houses
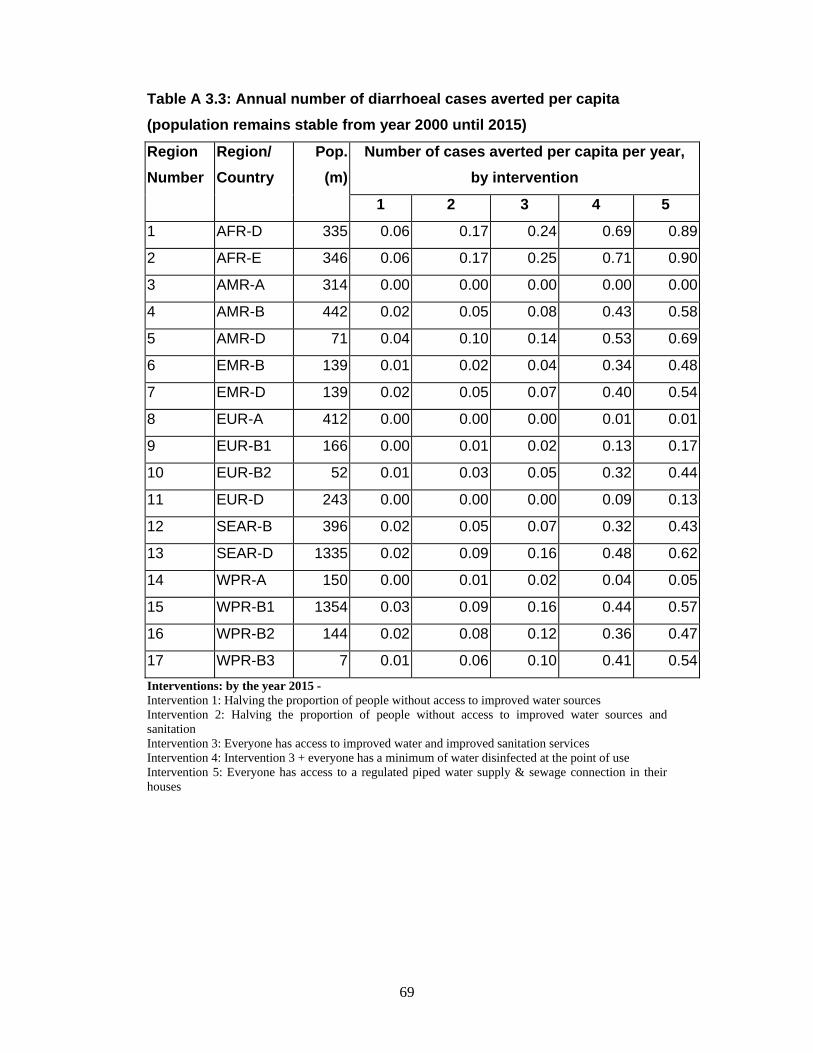
69
Table A 3.3: Annual number of diarrhoeal cases averted per capita (population remains stable from year 2000 until 2015)
Number of cases averted per capita per year, by intervention
Region Number
Region/ Country
Pop. (m)
1 2 3 4 5
1 AFR-D 335 0.06 0.17 0.24 0.69 0.89
2 AFR-E 346 0.06 0.17 0.25 0.71 0.90
3 AMR-A 314 0.00 0.00 0.00 0.00 0.00
4 AMR-B 442 0.02 0.05 0.08 0.43 0.58
5 AMR-D 71 0.04 0.10 0.14 0.53 0.69
6 EMR-B 139 0.01 0.02 0.04 0.34 0.48
7 EMR-D 139 0.02 0.05 0.07 0.40 0.54
8 EUR-A 412 0.00 0.00 0.00 0.01 0.01
9 EUR-B1 166 0.00 0.01 0.02 0.13 0.17
10 EUR-B2 52 0.01 0.03 0.05 0.32 0.44
11 EUR-D 243 0.00 0.00 0.00 0.09 0.13
12 SEAR-B 396 0.02 0.05 0.07 0.32 0.43
13 SEAR-D 1335 0.02 0.09 0.16 0.48 0.62
14 WPR-A 150 0.00 0.01 0.02 0.04 0.05
15 WPR-B1 1354 0.03 0.09 0.16 0.44 0.57
16 WPR-B2 144 0.02 0.08 0.12 0.36 0.47
17 WPR-B3 7 0.01 0.06 0.10 0.41 0.54Interventions: by the year 2015 - Intervention 1: Halving the proportion of people without access to improved water sources Intervention 2: Halving the proportion of people without access to improved water sources and sanitation Intervention 3: Everyone has access to improved water and improved sanitation services Intervention 4: Intervention 3 + everyone has a minimum of water disinfected at the point of use Intervention 5: Everyone has access to a regulated piped water supply & sewage connection in their houses
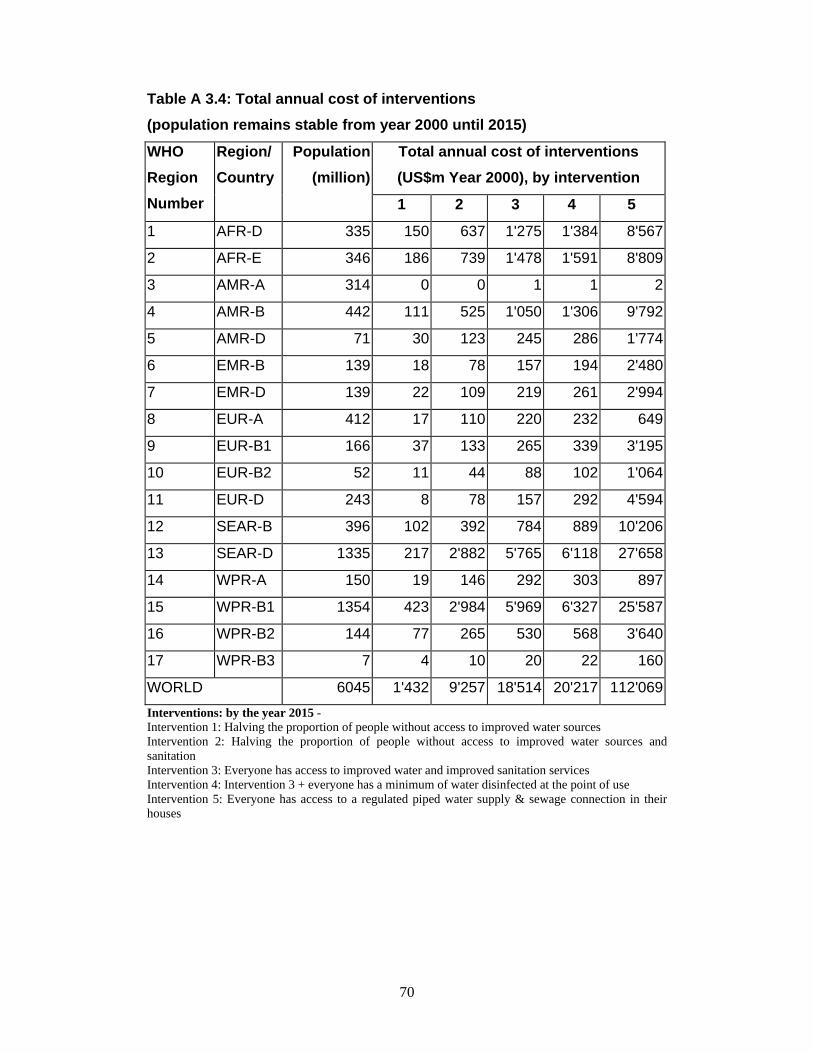
70
Table A 3.4: Total annual cost of interventions (population remains stable from year 2000 until 2015)
Total annual cost of interventions (US$m Year 2000), by intervention
WHO Region Number
Region/ Country
Population (million)
1 2 3 4 5
1 AFR-D 335 150 637 1'275 1'384 8'567
2 AFR-E 346 186 739 1'478 1'591 8'809
3 AMR-A 314 0 0 1 1 2
4 AMR-B 442 111 525 1'050 1'306 9'792
5 AMR-D 71 30 123 245 286 1'774
6 EMR-B 139 18 78 157 194 2'480
7 EMR-D 139 22 109 219 261 2'994
8 EUR-A 412 17 110 220 232 649
9 EUR-B1 166 37 133 265 339 3'195
10 EUR-B2 52 11 44 88 102 1'064
11 EUR-D 243 8 78 157 292 4'594
12 SEAR-B 396 102 392 784 889 10'206
13 SEAR-D 1335 217 2'882 5'765 6'118 27'658
14 WPR-A 150 19 146 292 303 897
15 WPR-B1 1354 423 2'984 5'969 6'327 25'587
16 WPR-B2 144 77 265 530 568 3'640
17 WPR-B3 7 4 10 20 22 160
WORLD 6045 1'432 9'257 18'514 20'217 112'069Interventions: by the year 2015 - Intervention 1: Halving the proportion of people without access to improved water sources Intervention 2: Halving the proportion of people without access to improved water sources and sanitation Intervention 3: Everyone has access to improved water and improved sanitation services Intervention 4: Intervention 3 + everyone has a minimum of water disinfected at the point of use Intervention 5: Everyone has access to a regulated piped water supply & sewage connection in their houses
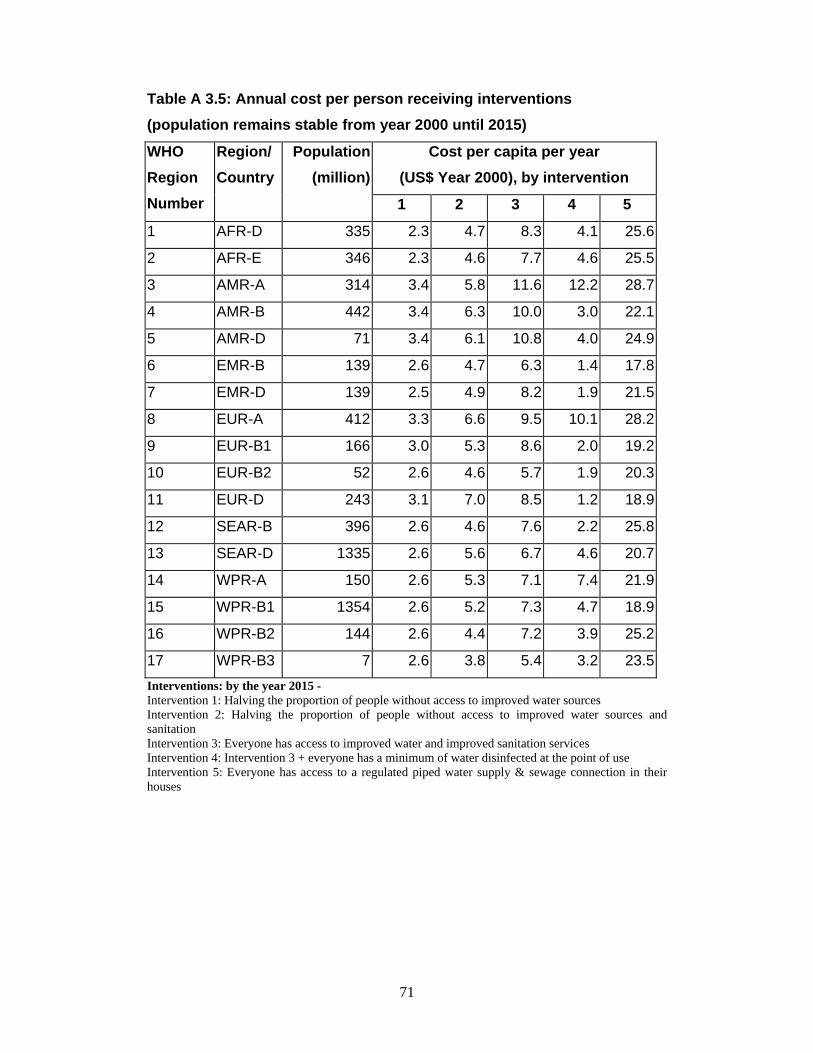
71
Table A 3.5: Annual cost per person receiving interventions (population remains stable from year 2000 until 2015)
Cost per capita per year (US$ Year 2000), by intervention
WHO Region Number
Region/ Country
Population (million)
1 2 3 4 5
1 AFR-D 335 2.3 4.7 8.3 4.1 25.6
2 AFR-E 346 2.3 4.6 7.7 4.6 25.5
3 AMR-A 314 3.4 5.8 11.6 12.2 28.7
4 AMR-B 442 3.4 6.3 10.0 3.0 22.1
5 AMR-D 71 3.4 6.1 10.8 4.0 24.9
6 EMR-B 139 2.6 4.7 6.3 1.4 17.8
7 EMR-D 139 2.5 4.9 8.2 1.9 21.5
8 EUR-A 412 3.3 6.6 9.5 10.1 28.2
9 EUR-B1 166 3.0 5.3 8.6 2.0 19.2
10 EUR-B2 52 2.6 4.6 5.7 1.9 20.3
11 EUR-D 243 3.1 7.0 8.5 1.2 18.9
12 SEAR-B 396 2.6 4.6 7.6 2.2 25.8
13 SEAR-D 1335 2.6 5.6 6.7 4.6 20.7
14 WPR-A 150 2.6 5.3 7.1 7.4 21.9
15 WPR-B1 1354 2.6 5.2 7.3 4.7 18.9
16 WPR-B2 144 2.6 4.4 7.2 3.9 25.2
17 WPR-B3 7 2.6 3.8 5.4 3.2 23.5Interventions: by the year 2015 - Intervention 1: Halving the proportion of people without access to improved water sources Intervention 2: Halving the proportion of people without access to improved water sources and sanitation Intervention 3: Everyone has access to improved water and improved sanitation services Intervention 4: Intervention 3 + everyone has a minimum of water disinfected at the point of use Intervention 5: Everyone has access to a regulated piped water supply & sewage connection in their houses
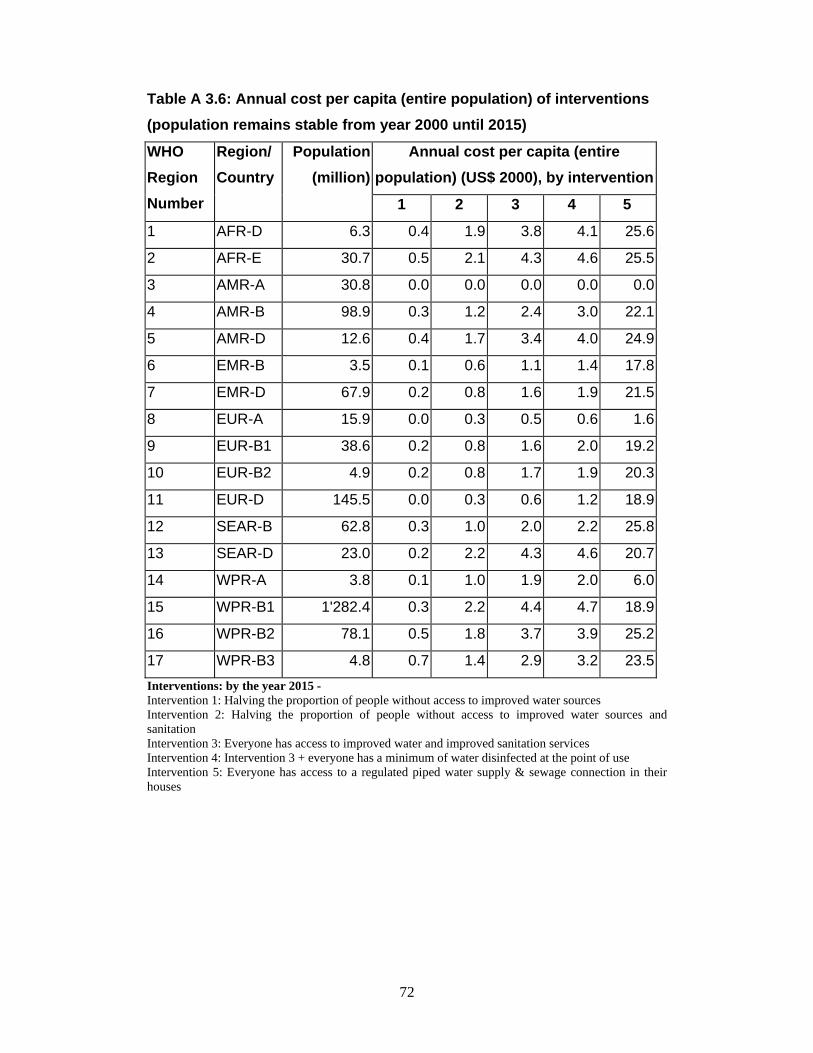
72
Table A 3.6: Annual cost per capita (entire population) of interventions (population remains stable from year 2000 until 2015)
Annual cost per capita (entire population) (US$ 2000), by intervention
WHO Region Number
Region/ Country
Population (million)
1 2 3 4 5
1 AFR-D 6.3 0.4 1.9 3.8 4.1 25.6
2 AFR-E 30.7 0.5 2.1 4.3 4.6 25.5
3 AMR-A 30.8 0.0 0.0 0.0 0.0 0.0
4 AMR-B 98.9 0.3 1.2 2.4 3.0 22.1
5 AMR-D 12.6 0.4 1.7 3.4 4.0 24.9
6 EMR-B 3.5 0.1 0.6 1.1 1.4 17.8
7 EMR-D 67.9 0.2 0.8 1.6 1.9 21.5
8 EUR-A 15.9 0.0 0.3 0.5 0.6 1.6
9 EUR-B1 38.6 0.2 0.8 1.6 2.0 19.2
10 EUR-B2 4.9 0.2 0.8 1.7 1.9 20.3
11 EUR-D 145.5 0.0 0.3 0.6 1.2 18.9
12 SEAR-B 62.8 0.3 1.0 2.0 2.2 25.8
13 SEAR-D 23.0 0.2 2.2 4.3 4.6 20.7
14 WPR-A 3.8 0.1 1.0 1.9 2.0 6.0
15 WPR-B1 1'282.4 0.3 2.2 4.4 4.7 18.9
16 WPR-B2 78.1 0.5 1.8 3.7 3.9 25.2
17 WPR-B3 4.8 0.7 1.4 2.9 3.2 23.5Interventions: by the year 2015 - Intervention 1: Halving the proportion of people without access to improved water sources Intervention 2: Halving the proportion of people without access to improved water sources and sanitation Intervention 3: Everyone has access to improved water and improved sanitation services Intervention 4: Intervention 3 + everyone has a minimum of water disinfected at the point of use Intervention 5: Everyone has access to a regulated piped water supply & sewage connection in their houses
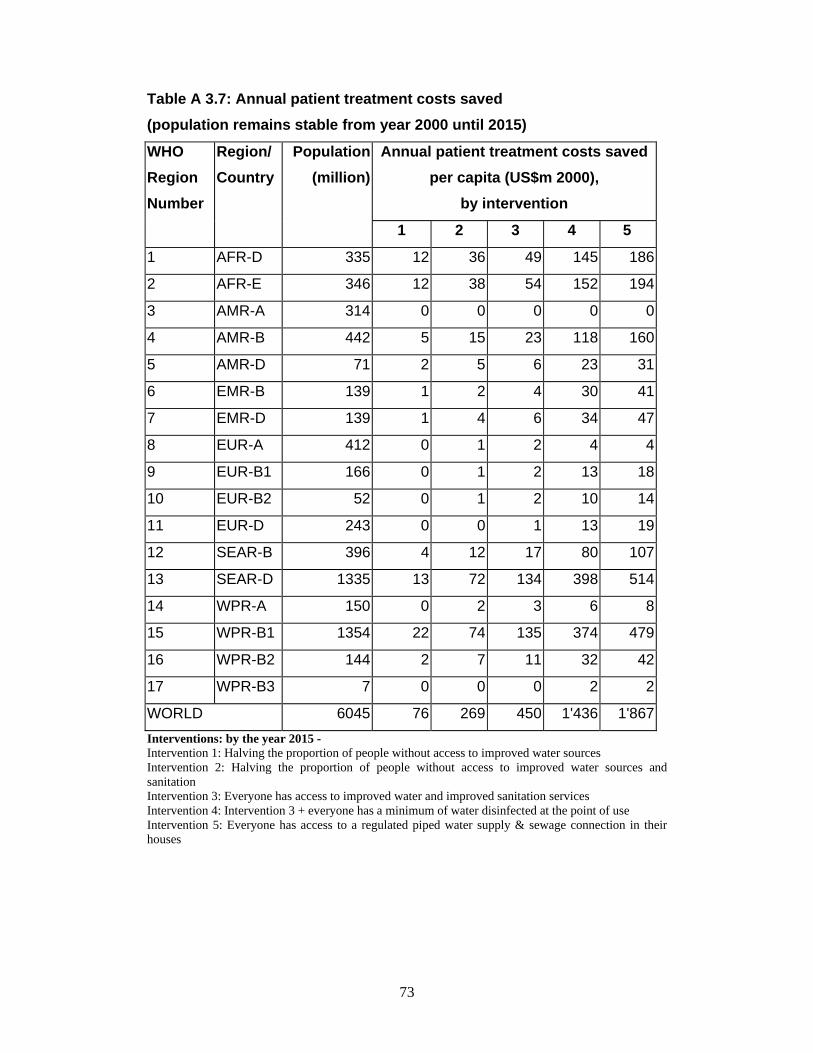
73
Table A 3.7: Annual patient treatment costs saved (population remains stable from year 2000 until 2015)
Annual patient treatment costs saved per capita (US$m 2000),
by intervention
WHO Region Number
Region/ Country
Population (million)
1 2 3 4 5
1 AFR-D 335 12 36 49 145 186
2 AFR-E 346 12 38 54 152 194
3 AMR-A 314 0 0 0 0 0
4 AMR-B 442 5 15 23 118 160
5 AMR-D 71 2 5 6 23 31
6 EMR-B 139 1 2 4 30 41
7 EMR-D 139 1 4 6 34 47
8 EUR-A 412 0 1 2 4 4
9 EUR-B1 166 0 1 2 13 18
10 EUR-B2 52 0 1 2 10 14
11 EUR-D 243 0 0 1 13 19
12 SEAR-B 396 4 12 17 80 107
13 SEAR-D 1335 13 72 134 398 514
14 WPR-A 150 0 2 3 6 8
15 WPR-B1 1354 22 74 135 374 479
16 WPR-B2 144 2 7 11 32 42
17 WPR-B3 7 0 0 0 2 2
WORLD 6045 76 269 450 1'436 1'867Interventions: by the year 2015 - Intervention 1: Halving the proportion of people without access to improved water sources Intervention 2: Halving the proportion of people without access to improved water sources and sanitation Intervention 3: Everyone has access to improved water and improved sanitation services Intervention 4: Intervention 3 + everyone has a minimum of water disinfected at the point of use Intervention 5: Everyone has access to a regulated piped water supply & sewage connection in their houses
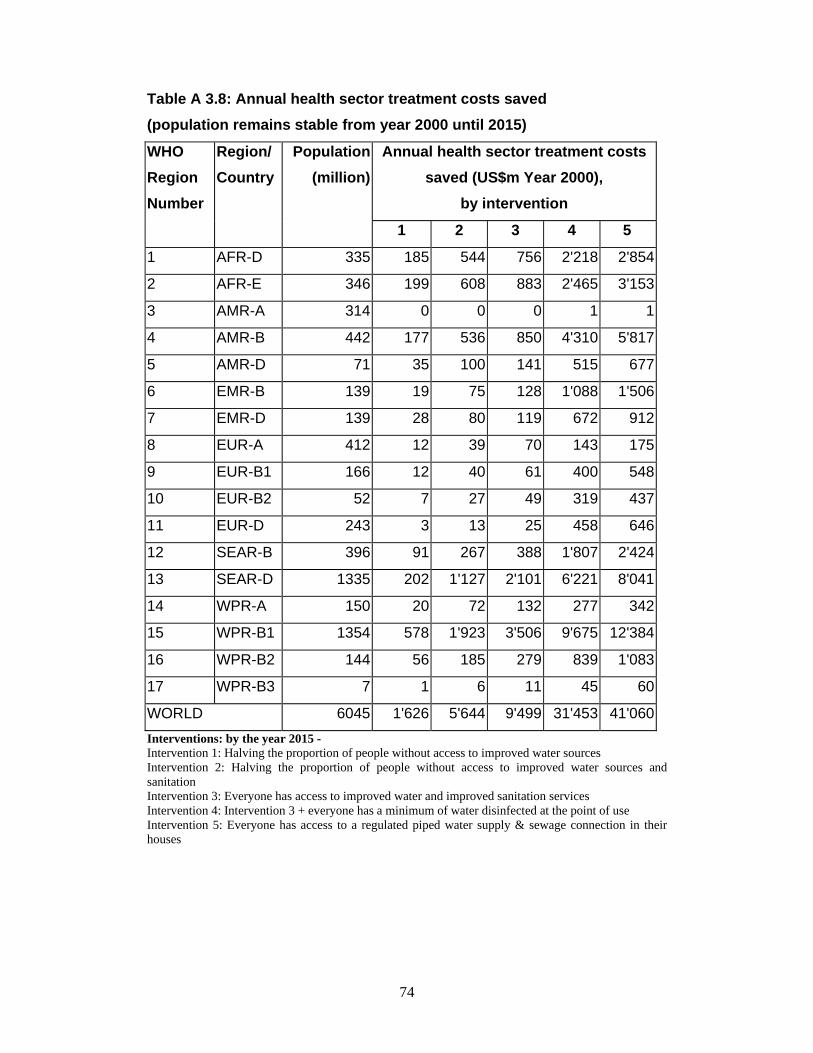
74
Table A 3.8: Annual health sector treatment costs saved (population remains stable from year 2000 until 2015)
Annual health sector treatment costs saved (US$m Year 2000),
by intervention
WHO Region Number
Region/ Country
Population (million)
1 2 3 4 5
1 AFR-D 335 185 544 756 2'218 2'854
2 AFR-E 346 199 608 883 2'465 3'153
3 AMR-A 314 0 0 0 1 1
4 AMR-B 442 177 536 850 4'310 5'817
5 AMR-D 71 35 100 141 515 677
6 EMR-B 139 19 75 128 1'088 1'506
7 EMR-D 139 28 80 119 672 912
8 EUR-A 412 12 39 70 143 175
9 EUR-B1 166 12 40 61 400 548
10 EUR-B2 52 7 27 49 319 437
11 EUR-D 243 3 13 25 458 646
12 SEAR-B 396 91 267 388 1'807 2'424
13 SEAR-D 1335 202 1'127 2'101 6'221 8'041
14 WPR-A 150 20 72 132 277 342
15 WPR-B1 1354 578 1'923 3'506 9'675 12'384
16 WPR-B2 144 56 185 279 839 1'083
17 WPR-B3 7 1 6 11 45 60
WORLD 6045 1'626 5'644 9'499 31'453 41'060Interventions: by the year 2015 - Intervention 1: Halving the proportion of people without access to improved water sources Intervention 2: Halving the proportion of people without access to improved water sources and sanitation Intervention 3: Everyone has access to improved water and improved sanitation services Intervention 4: Intervention 3 + everyone has a minimum of water disinfected at the point of use Intervention 5: Everyone has access to a regulated piped water supply & sewage connection in their houses
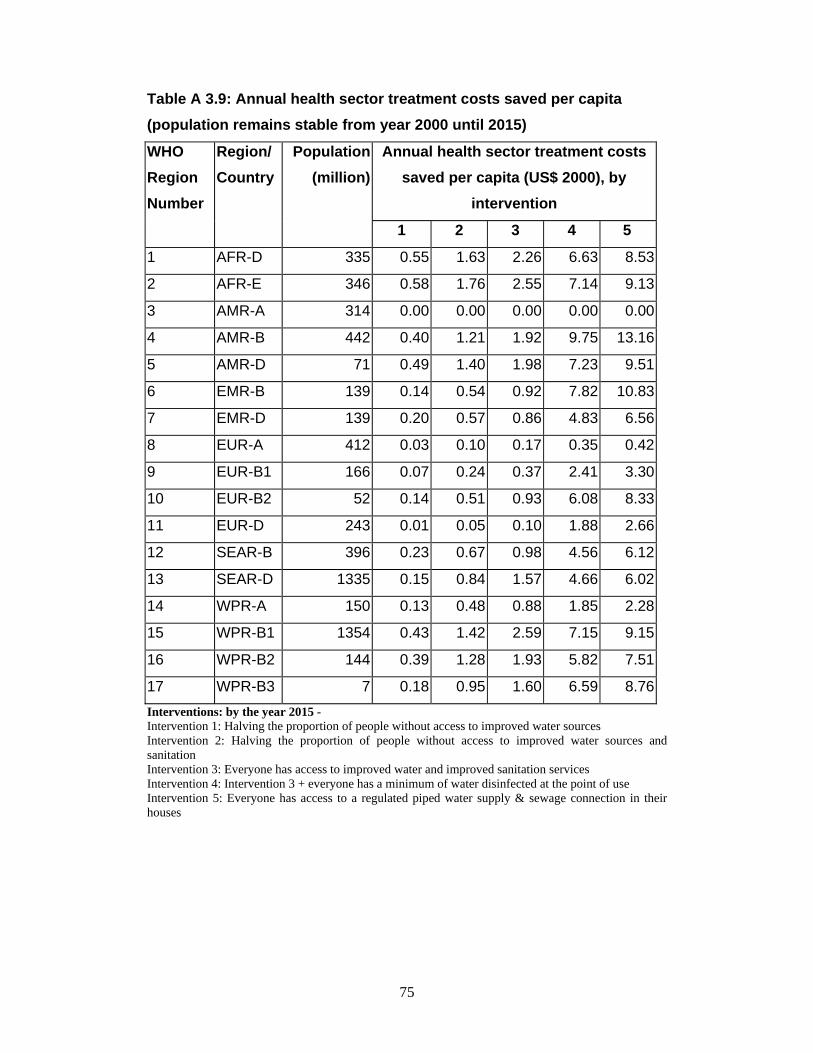
75
Table A 3.9: Annual health sector treatment costs saved per capita (population remains stable from year 2000 until 2015)
Annual health sector treatment costs saved per capita (US$ 2000), by
intervention
WHO Region Number
Region/ Country
Population (million)
1 2 3 4 5
1 AFR-D 335 0.55 1.63 2.26 6.63 8.53
2 AFR-E 346 0.58 1.76 2.55 7.14 9.13
3 AMR-A 314 0.00 0.00 0.00 0.00 0.00
4 AMR-B 442 0.40 1.21 1.92 9.75 13.16
5 AMR-D 71 0.49 1.40 1.98 7.23 9.51
6 EMR-B 139 0.14 0.54 0.92 7.82 10.83
7 EMR-D 139 0.20 0.57 0.86 4.83 6.56
8 EUR-A 412 0.03 0.10 0.17 0.35 0.42
9 EUR-B1 166 0.07 0.24 0.37 2.41 3.30
10 EUR-B2 52 0.14 0.51 0.93 6.08 8.33
11 EUR-D 243 0.01 0.05 0.10 1.88 2.66
12 SEAR-B 396 0.23 0.67 0.98 4.56 6.12
13 SEAR-D 1335 0.15 0.84 1.57 4.66 6.02
14 WPR-A 150 0.13 0.48 0.88 1.85 2.28
15 WPR-B1 1354 0.43 1.42 2.59 7.15 9.15
16 WPR-B2 144 0.39 1.28 1.93 5.82 7.51
17 WPR-B3 7 0.18 0.95 1.60 6.59 8.76Interventions: by the year 2015 - Intervention 1: Halving the proportion of people without access to improved water sources Intervention 2: Halving the proportion of people without access to improved water sources and sanitation Intervention 3: Everyone has access to improved water and improved sanitation services Intervention 4: Intervention 3 + everyone has a minimum of water disinfected at the point of use Intervention 5: Everyone has access to a regulated piped water supply & sewage connection in their houses
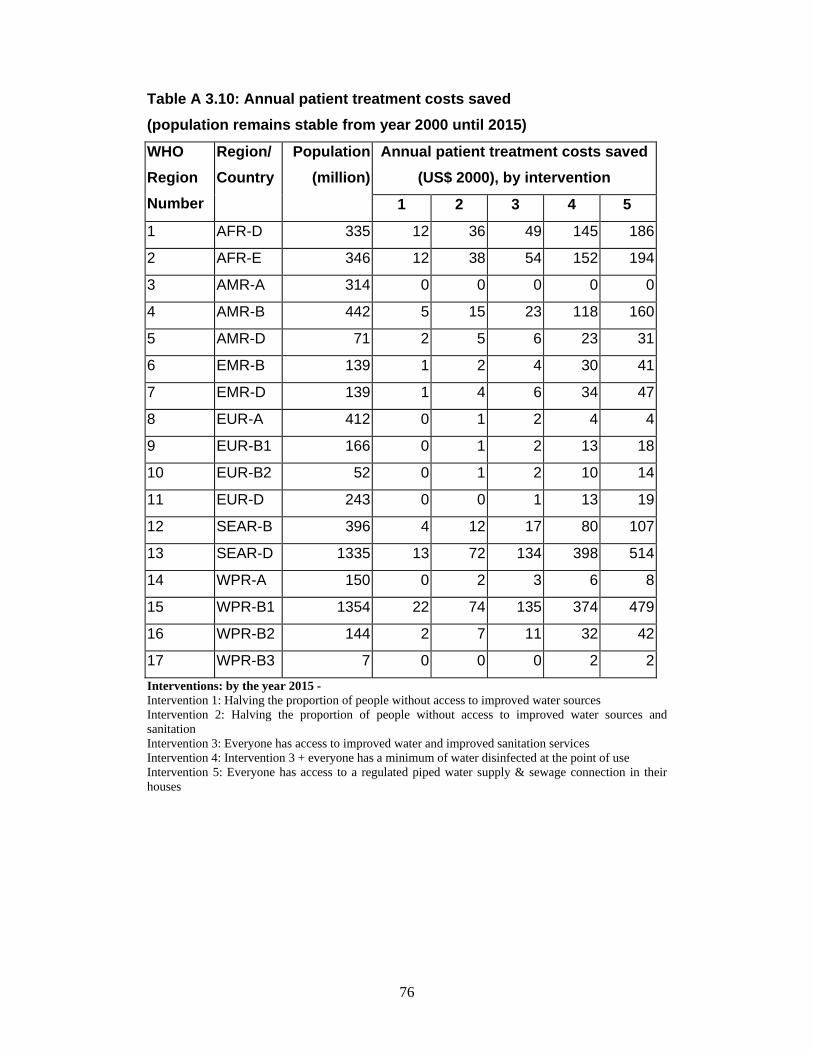
76
Table A 3.10: Annual patient treatment costs saved (population remains stable from year 2000 until 2015)
Annual patient treatment costs saved (US$ 2000), by intervention
WHO Region Number
Region/ Country
Population (million)
1 2 3 4 5
1 AFR-D 335 12 36 49 145 186
2 AFR-E 346 12 38 54 152 194
3 AMR-A 314 0 0 0 0 0
4 AMR-B 442 5 15 23 118 160
5 AMR-D 71 2 5 6 23 31
6 EMR-B 139 1 2 4 30 41
7 EMR-D 139 1 4 6 34 47
8 EUR-A 412 0 1 2 4 4
9 EUR-B1 166 0 1 2 13 18
10 EUR-B2 52 0 1 2 10 14
11 EUR-D 243 0 0 1 13 19
12 SEAR-B 396 4 12 17 80 107
13 SEAR-D 1335 13 72 134 398 514
14 WPR-A 150 0 2 3 6 8
15 WPR-B1 1354 22 74 135 374 479
16 WPR-B2 144 2 7 11 32 42
17 WPR-B3 7 0 0 0 2 2Interventions: by the year 2015 - Intervention 1: Halving the proportion of people without access to improved water sources Intervention 2: Halving the proportion of people without access to improved water sources and sanitation Intervention 3: Everyone has access to improved water and improved sanitation services Intervention 4: Intervention 3 + everyone has a minimum of water disinfected at the point of use Intervention 5: Everyone has access to a regulated piped water supply & sewage connection in their houses
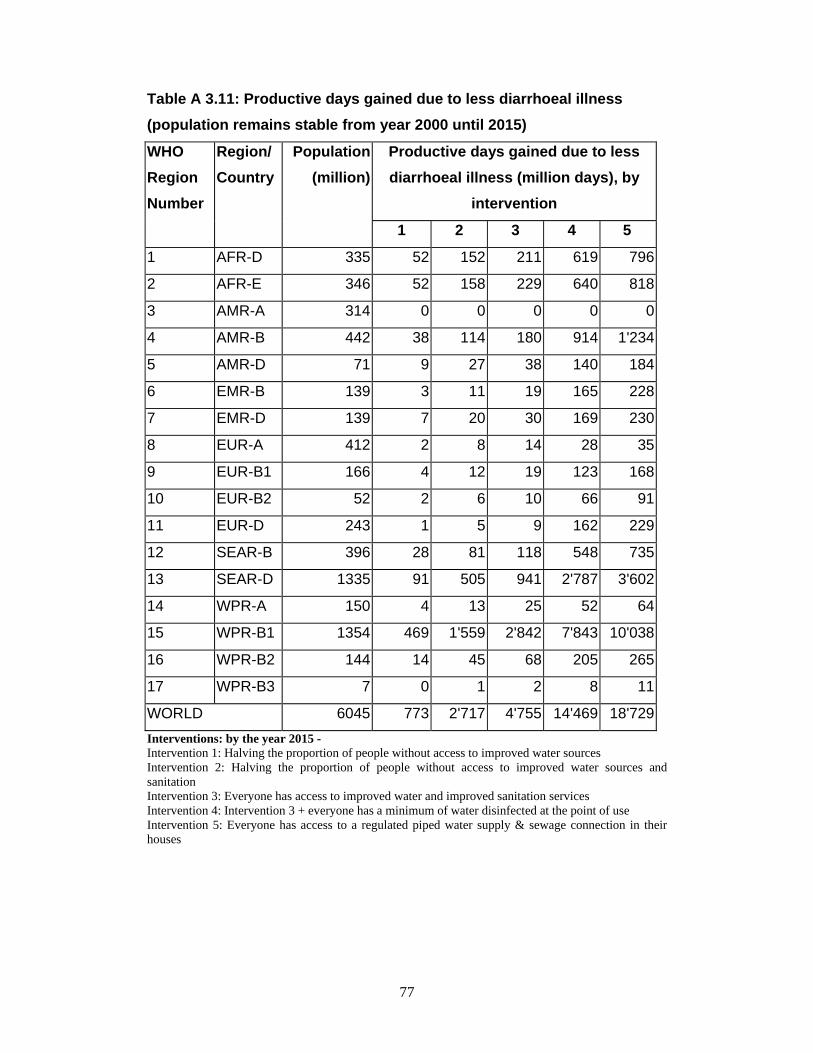
77
Table A 3.11: Productive days gained due to less diarrhoeal illness (population remains stable from year 2000 until 2015)
Productive days gained due to less diarrhoeal illness (million days), by
intervention
WHO Region Number
Region/ Country
Population (million)
1 2 3 4 5
1 AFR-D 335 52 152 211 619 796
2 AFR-E 346 52 158 229 640 818
3 AMR-A 314 0 0 0 0 0
4 AMR-B 442 38 114 180 914 1'234
5 AMR-D 71 9 27 38 140 184
6 EMR-B 139 3 11 19 165 228
7 EMR-D 139 7 20 30 169 230
8 EUR-A 412 2 8 14 28 35
9 EUR-B1 166 4 12 19 123 168
10 EUR-B2 52 2 6 10 66 91
11 EUR-D 243 1 5 9 162 229
12 SEAR-B 396 28 81 118 548 735
13 SEAR-D 1335 91 505 941 2'787 3'602
14 WPR-A 150 4 13 25 52 64
15 WPR-B1 1354 469 1'559 2'842 7'843 10'038
16 WPR-B2 144 14 45 68 205 265
17 WPR-B3 7 0 1 2 8 11
WORLD 6045 773 2'717 4'755 14'469 18'729Interventions: by the year 2015 - Intervention 1: Halving the proportion of people without access to improved water sources Intervention 2: Halving the proportion of people without access to improved water sources and sanitation Intervention 3: Everyone has access to improved water and improved sanitation services Intervention 4: Intervention 3 + everyone has a minimum of water disinfected at the point of use Intervention 5: Everyone has access to a regulated piped water supply & sewage connection in their houses
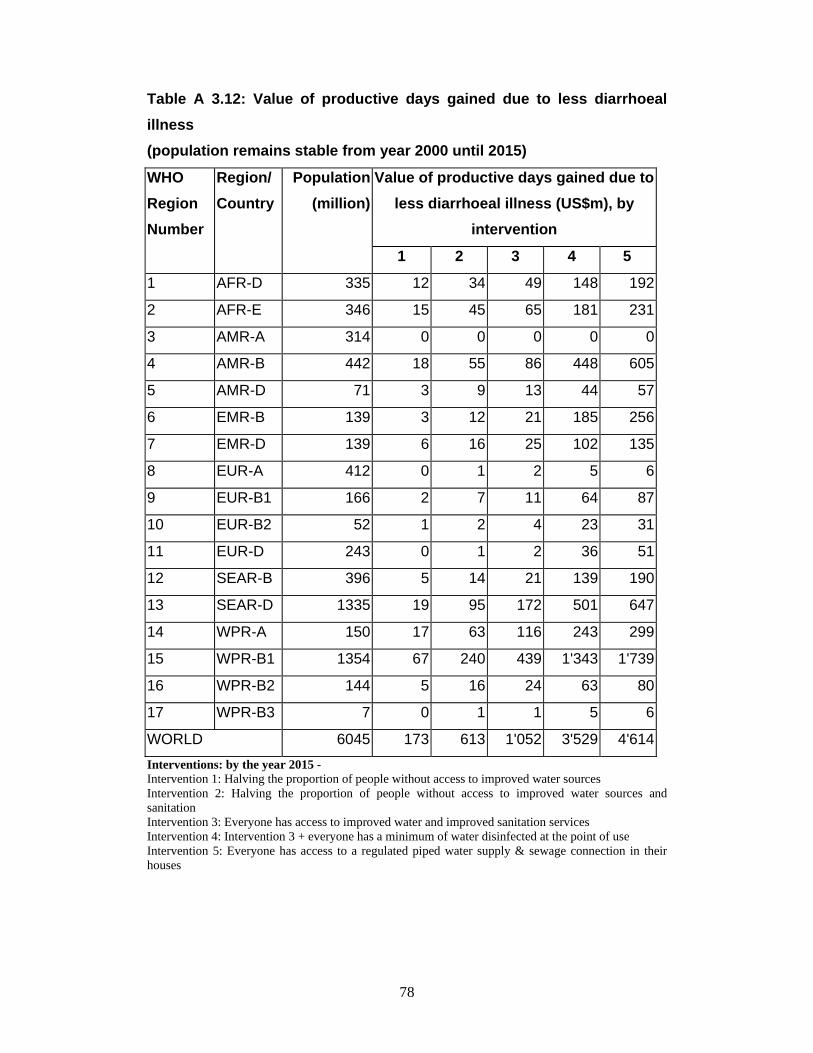
78
Table A 3.12: Value of productive days gained due to less diarrhoeal illness (population remains stable from year 2000 until 2015)
Value of productive days gained due to less diarrhoeal illness (US$m), by
intervention
WHO Region Number
Region/ Country
Population (million)
1 2 3 4 5
1 AFR-D 335 12 34 49 148 192
2 AFR-E 346 15 45 65 181 231
3 AMR-A 314 0 0 0 0 0
4 AMR-B 442 18 55 86 448 605
5 AMR-D 71 3 9 13 44 57
6 EMR-B 139 3 12 21 185 256
7 EMR-D 139 6 16 25 102 135
8 EUR-A 412 0 1 2 5 6
9 EUR-B1 166 2 7 11 64 87
10 EUR-B2 52 1 2 4 23 31
11 EUR-D 243 0 1 2 36 51
12 SEAR-B 396 5 14 21 139 190
13 SEAR-D 1335 19 95 172 501 647
14 WPR-A 150 17 63 116 243 299
15 WPR-B1 1354 67 240 439 1'343 1'739
16 WPR-B2 144 5 16 24 63 80
17 WPR-B3 7 0 1 1 5 6
WORLD 6045 173 613 1'052 3'529 4'614Interventions: by the year 2015 - Intervention 1: Halving the proportion of people without access to improved water sources Intervention 2: Halving the proportion of people without access to improved water sources and sanitation Intervention 3: Everyone has access to improved water and improved sanitation services Intervention 4: Intervention 3 + everyone has a minimum of water disinfected at the point of use Intervention 5: Everyone has access to a regulated piped water supply & sewage connection in their houses
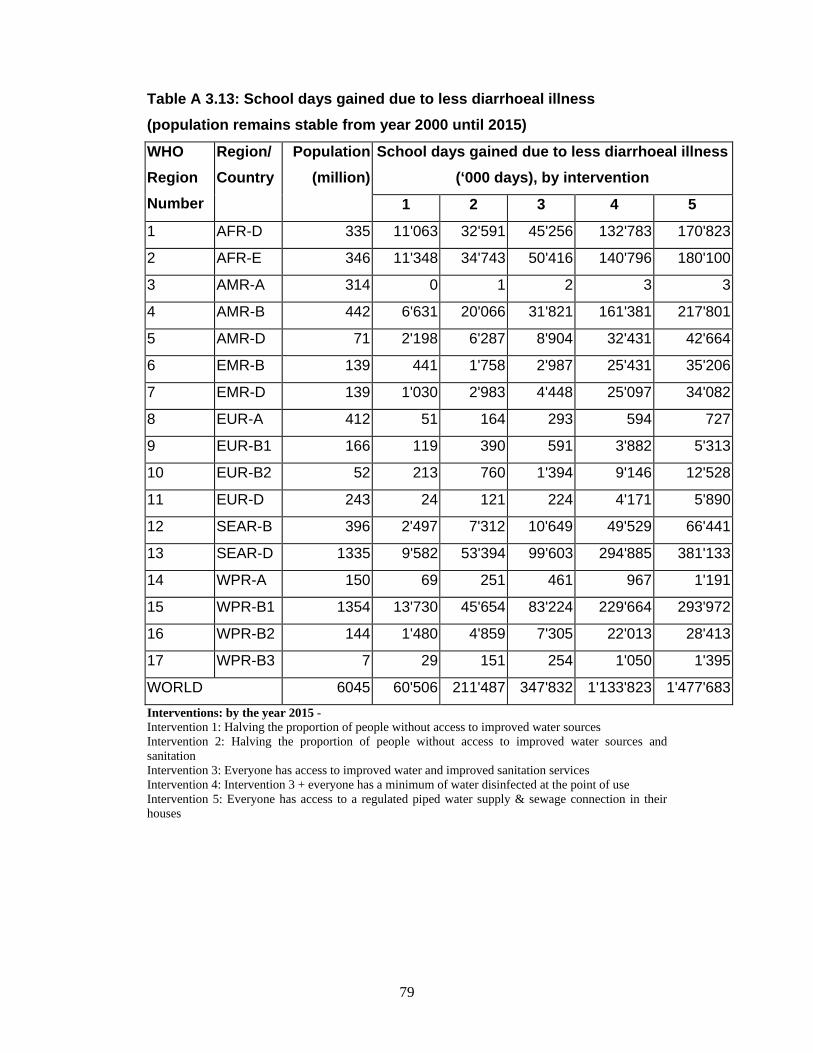
79
Table A 3.13: School days gained due to less diarrhoeal illness (population remains stable from year 2000 until 2015)
School days gained due to less diarrhoeal illness (‘000 days), by intervention
WHO Region Number
Region/ Country
Population (million)
1 2 3 4 5
1 AFR-D 335 11'063 32'591 45'256 132'783 170'823
2 AFR-E 346 11'348 34'743 50'416 140'796 180'100
3 AMR-A 314 0 1 2 3 3
4 AMR-B 442 6'631 20'066 31'821 161'381 217'801
5 AMR-D 71 2'198 6'287 8'904 32'431 42'664
6 EMR-B 139 441 1'758 2'987 25'431 35'206
7 EMR-D 139 1'030 2'983 4'448 25'097 34'082
8 EUR-A 412 51 164 293 594 727
9 EUR-B1 166 119 390 591 3'882 5'313
10 EUR-B2 52 213 760 1'394 9'146 12'528
11 EUR-D 243 24 121 224 4'171 5'890
12 SEAR-B 396 2'497 7'312 10'649 49'529 66'441
13 SEAR-D 1335 9'582 53'394 99'603 294'885 381'133
14 WPR-A 150 69 251 461 967 1'191
15 WPR-B1 1354 13'730 45'654 83'224 229'664 293'972
16 WPR-B2 144 1'480 4'859 7'305 22'013 28'413
17 WPR-B3 7 29 151 254 1'050 1'395
WORLD 6045 60'506 211'487 347'832 1'133'823 1'477'683Interventions: by the year 2015 - Intervention 1: Halving the proportion of people without access to improved water sources Intervention 2: Halving the proportion of people without access to improved water sources and sanitation Intervention 3: Everyone has access to improved water and improved sanitation services Intervention 4: Intervention 3 + everyone has a minimum of water disinfected at the point of use Intervention 5: Everyone has access to a regulated piped water supply & sewage connection in their houses
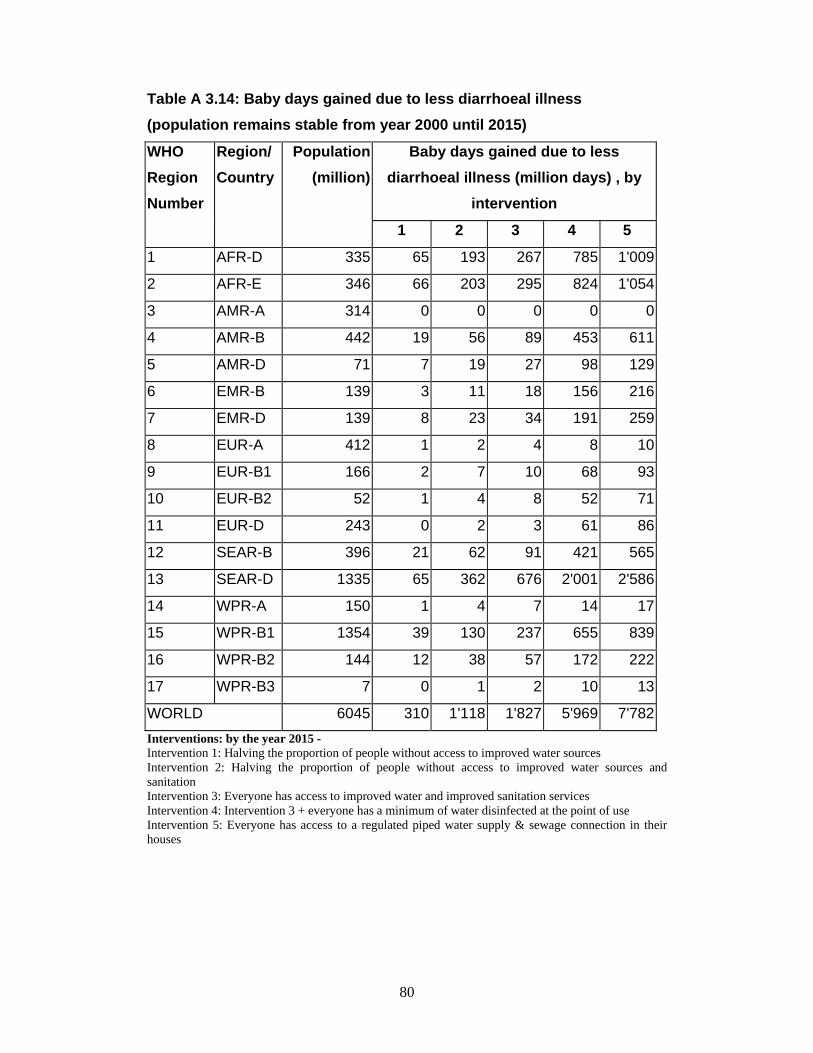
80
Table A 3.14: Baby days gained due to less diarrhoeal illness (population remains stable from year 2000 until 2015)
Baby days gained due to less diarrhoeal illness (million days) , by
intervention
WHO Region Number
Region/ Country
Population (million)
1 2 3 4 5
1 AFR-D 335 65 193 267 785 1'009
2 AFR-E 346 66 203 295 824 1'054
3 AMR-A 314 0 0 0 0 0
4 AMR-B 442 19 56 89 453 611
5 AMR-D 71 7 19 27 98 129
6 EMR-B 139 3 11 18 156 216
7 EMR-D 139 8 23 34 191 259
8 EUR-A 412 1 2 4 8 10
9 EUR-B1 166 2 7 10 68 93
10 EUR-B2 52 1 4 8 52 71
11 EUR-D 243 0 2 3 61 86
12 SEAR-B 396 21 62 91 421 565
13 SEAR-D 1335 65 362 676 2'001 2'586
14 WPR-A 150 1 4 7 14 17
15 WPR-B1 1354 39 130 237 655 839
16 WPR-B2 144 12 38 57 172 222
17 WPR-B3 7 0 1 2 10 13
WORLD 6045 310 1'118 1'827 5'969 7'782Interventions: by the year 2015 - Intervention 1: Halving the proportion of people without access to improved water sources Intervention 2: Halving the proportion of people without access to improved water sources and sanitation Intervention 3: Everyone has access to improved water and improved sanitation services Intervention 4: Intervention 3 + everyone has a minimum of water disinfected at the point of use Intervention 5: Everyone has access to a regulated piped water supply & sewage connection in their houses
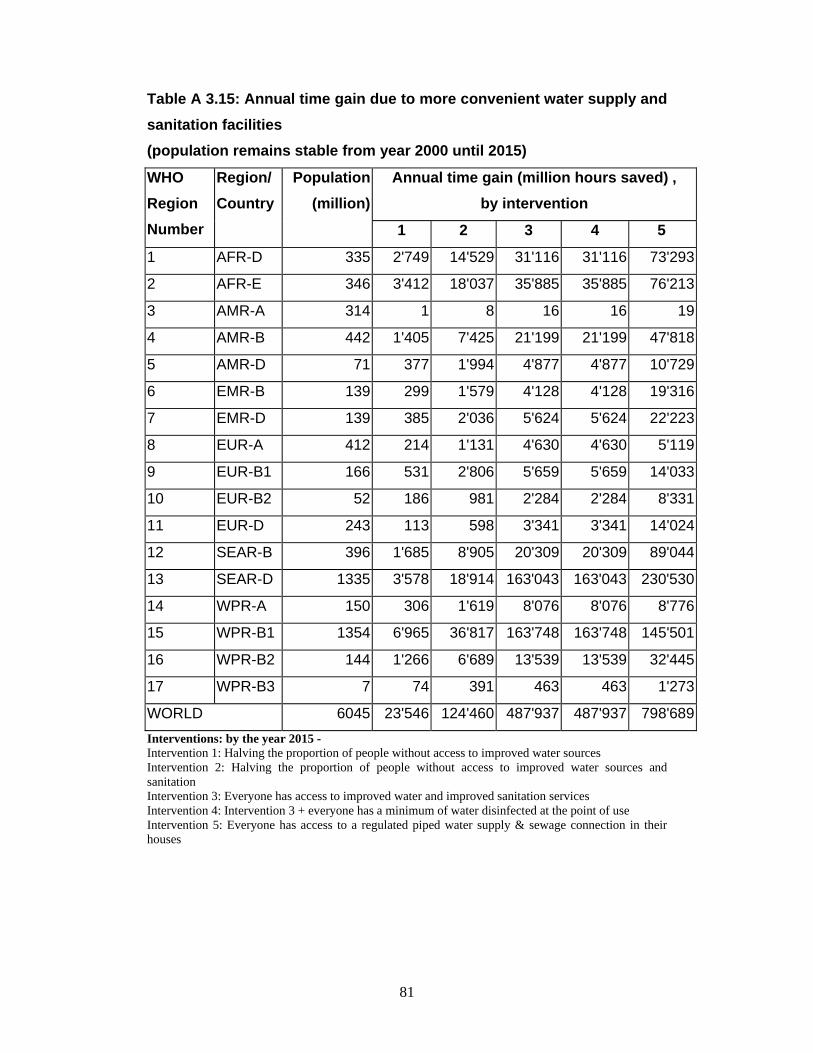
81
Table A 3.15: Annual time gain due to more convenient water supply and sanitation facilities (population remains stable from year 2000 until 2015)
Annual time gain (million hours saved) , by intervention
WHO Region Number
Region/ Country
Population (million)
1 2 3 4 5
1 AFR-D 335 2'749 14'529 31'116 31'116 73'293
2 AFR-E 346 3'412 18'037 35'885 35'885 76'213
3 AMR-A 314 1 8 16 16 19
4 AMR-B 442 1'405 7'425 21'199 21'199 47'818
5 AMR-D 71 377 1'994 4'877 4'877 10'729
6 EMR-B 139 299 1'579 4'128 4'128 19'316
7 EMR-D 139 385 2'036 5'624 5'624 22'223
8 EUR-A 412 214 1'131 4'630 4'630 5'119
9 EUR-B1 166 531 2'806 5'659 5'659 14'033
10 EUR-B2 52 186 981 2'284 2'284 8'331
11 EUR-D 243 113 598 3'341 3'341 14'024
12 SEAR-B 396 1'685 8'905 20'309 20'309 89'044
13 SEAR-D 1335 3'578 18'914 163'043 163'043 230'530
14 WPR-A 150 306 1'619 8'076 8'076 8'776
15 WPR-B1 1354 6'965 36'817 163'748 163'748 145'501
16 WPR-B2 144 1'266 6'689 13'539 13'539 32'445
17 WPR-B3 7 74 391 463 463 1'273
WORLD 6045 23'546 124'460 487'937 487'937 798'689Interventions: by the year 2015 - Intervention 1: Halving the proportion of people without access to improved water sources Intervention 2: Halving the proportion of people without access to improved water sources and sanitation Intervention 3: Everyone has access to improved water and improved sanitation services Intervention 4: Intervention 3 + everyone has a minimum of water disinfected at the point of use Intervention 5: Everyone has access to a regulated piped water supply & sewage connection in their houses
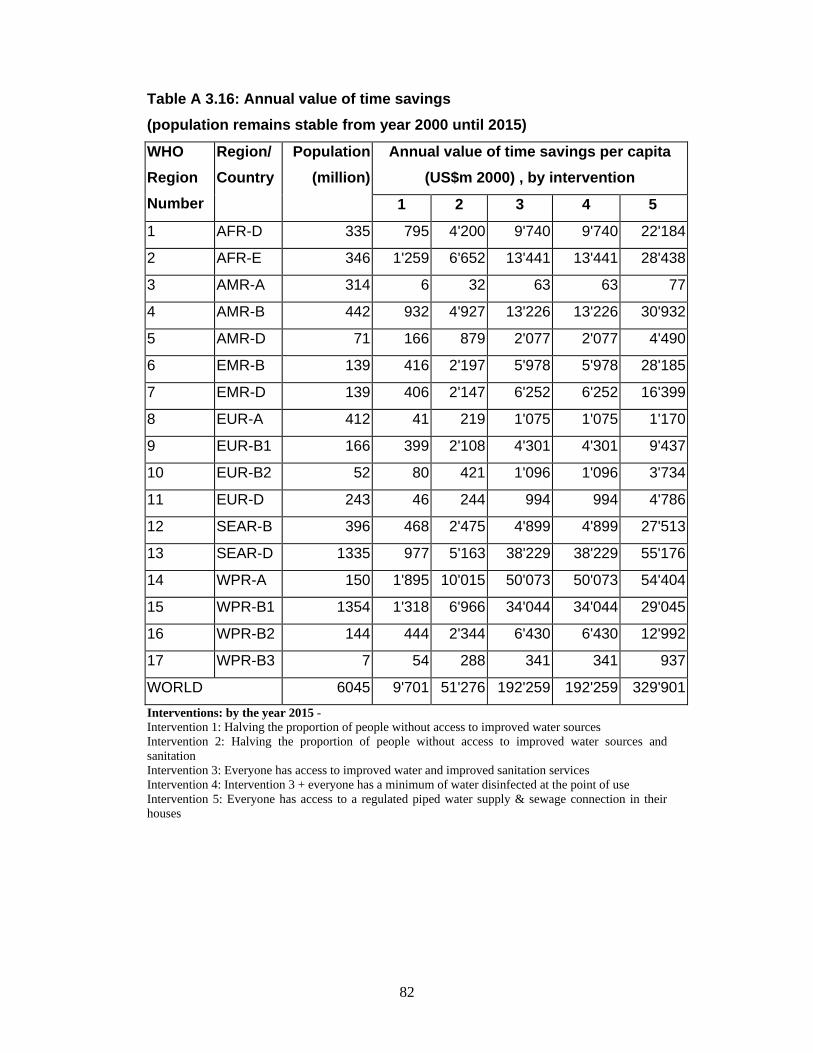
82
Table A 3.16: Annual value of time savings (population remains stable from year 2000 until 2015)
Annual value of time savings per capita (US$m 2000) , by intervention
WHO Region Number
Region/ Country
Population (million)
1 2 3 4 5
1 AFR-D 335 795 4'200 9'740 9'740 22'184
2 AFR-E 346 1'259 6'652 13'441 13'441 28'438
3 AMR-A 314 6 32 63 63 77
4 AMR-B 442 932 4'927 13'226 13'226 30'932
5 AMR-D 71 166 879 2'077 2'077 4'490
6 EMR-B 139 416 2'197 5'978 5'978 28'185
7 EMR-D 139 406 2'147 6'252 6'252 16'399
8 EUR-A 412 41 219 1'075 1'075 1'170
9 EUR-B1 166 399 2'108 4'301 4'301 9'437
10 EUR-B2 52 80 421 1'096 1'096 3'734
11 EUR-D 243 46 244 994 994 4'786
12 SEAR-B 396 468 2'475 4'899 4'899 27'513
13 SEAR-D 1335 977 5'163 38'229 38'229 55'176
14 WPR-A 150 1'895 10'015 50'073 50'073 54'404
15 WPR-B1 1354 1'318 6'966 34'044 34'044 29'045
16 WPR-B2 144 444 2'344 6'430 6'430 12'992
17 WPR-B3 7 54 288 341 341 937
WORLD 6045 9'701 51'276 192'259 192'259 329'901Interventions: by the year 2015 - Intervention 1: Halving the proportion of people without access to improved water sources Intervention 2: Halving the proportion of people without access to improved water sources and sanitation Intervention 3: Everyone has access to improved water and improved sanitation services Intervention 4: Intervention 3 + everyone has a minimum of water disinfected at the point of use Intervention 5: Everyone has access to a regulated piped water supply & sewage connection in their houses
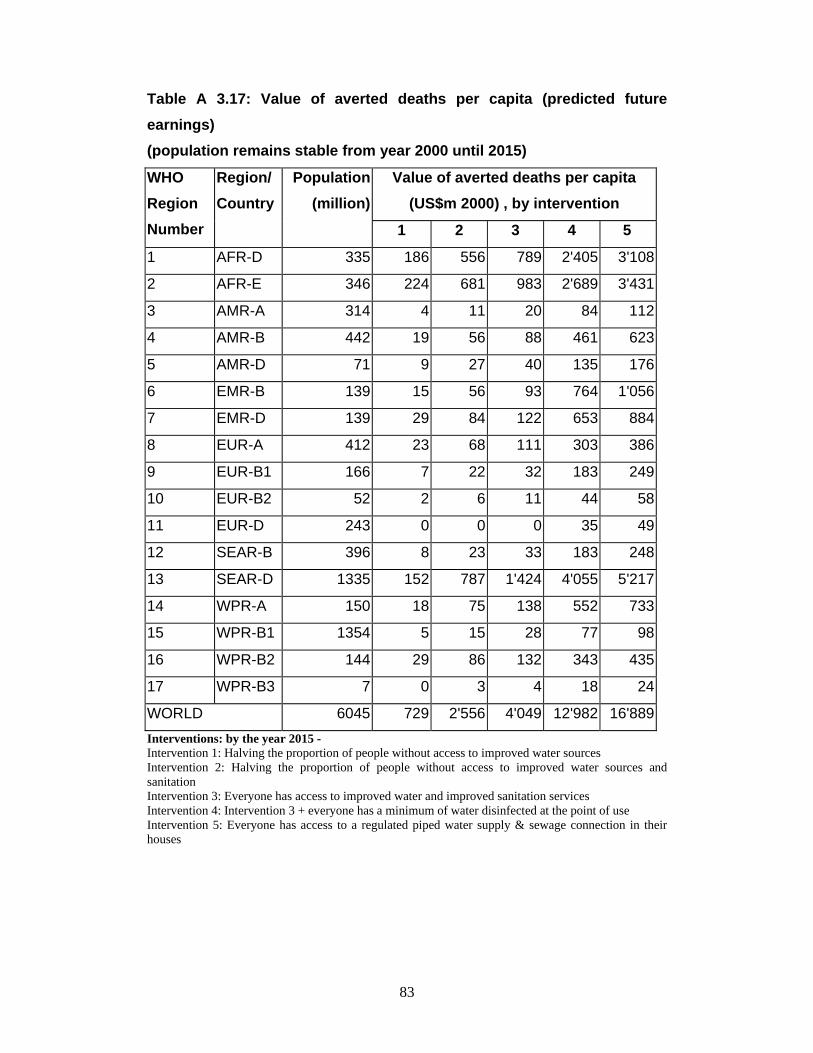
83
Table A 3.17: Value of averted deaths per capita (predicted future earnings) (population remains stable from year 2000 until 2015)
Value of averted deaths per capita (US$m 2000) , by intervention
WHO Region Number
Region/ Country
Population (million)
1 2 3 4 5
1 AFR-D 335 186 556 789 2'405 3'108
2 AFR-E 346 224 681 983 2'689 3'431
3 AMR-A 314 4 11 20 84 112
4 AMR-B 442 19 56 88 461 623
5 AMR-D 71 9 27 40 135 176
6 EMR-B 139 15 56 93 764 1'056
7 EMR-D 139 29 84 122 653 884
8 EUR-A 412 23 68 111 303 386
9 EUR-B1 166 7 22 32 183 249
10 EUR-B2 52 2 6 11 44 58
11 EUR-D 243 0 0 0 35 49
12 SEAR-B 396 8 23 33 183 248
13 SEAR-D 1335 152 787 1'424 4'055 5'217
14 WPR-A 150 18 75 138 552 733
15 WPR-B1 1354 5 15 28 77 98
16 WPR-B2 144 29 86 132 343 435
17 WPR-B3 7 0 3 4 18 24
WORLD 6045 729 2'556 4'049 12'982 16'889Interventions: by the year 2015 - Intervention 1: Halving the proportion of people without access to improved water sources Intervention 2: Halving the proportion of people without access to improved water sources and sanitation Intervention 3: Everyone has access to improved water and improved sanitation services Intervention 4: Intervention 3 + everyone has a minimum of water disinfected at the point of use Intervention 5: Everyone has access to a regulated piped water supply & sewage connection in their houses
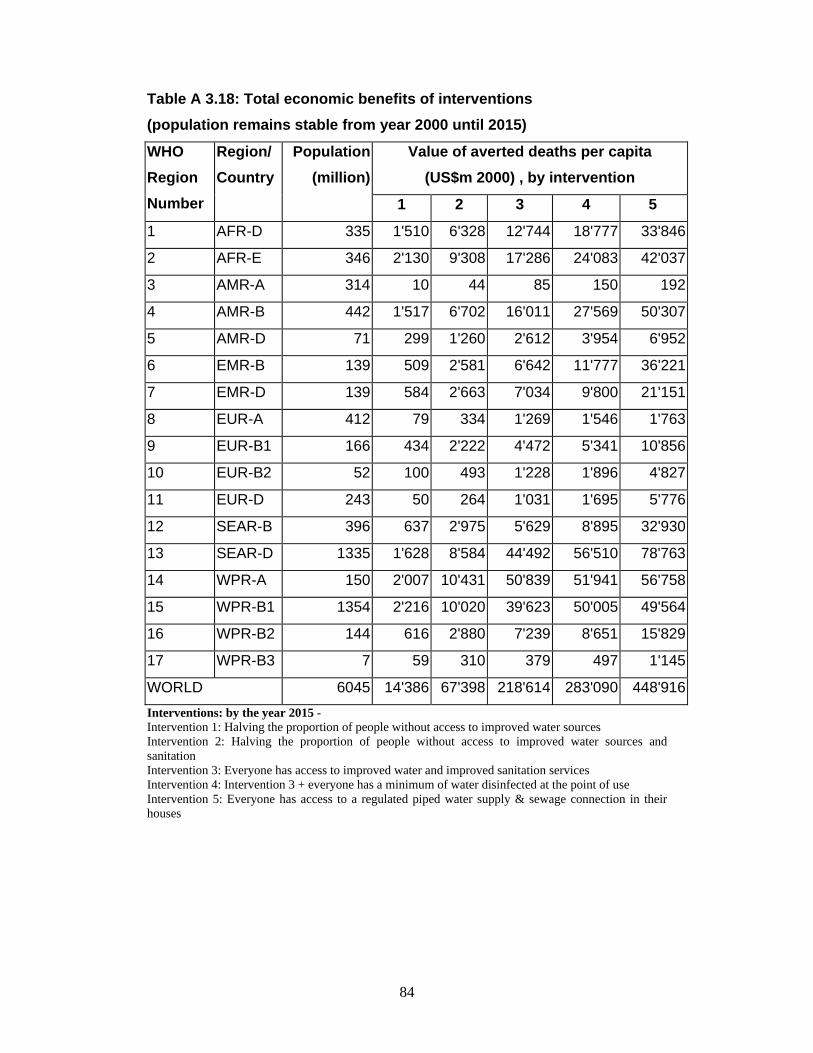
84
Table A 3.18: Total economic benefits of interventions (population remains stable from year 2000 until 2015)
Value of averted deaths per capita (US$m 2000) , by intervention
WHO Region Number
Region/ Country
Population (million)
1 2 3 4 5
1 AFR-D 335 1'510 6'328 12'744 18'777 33'846
2 AFR-E 346 2'130 9'308 17'286 24'083 42'037
3 AMR-A 314 10 44 85 150 192
4 AMR-B 442 1'517 6'702 16'011 27'569 50'307
5 AMR-D 71 299 1'260 2'612 3'954 6'952
6 EMR-B 139 509 2'581 6'642 11'777 36'221
7 EMR-D 139 584 2'663 7'034 9'800 21'151
8 EUR-A 412 79 334 1'269 1'546 1'763
9 EUR-B1 166 434 2'222 4'472 5'341 10'856
10 EUR-B2 52 100 493 1'228 1'896 4'827
11 EUR-D 243 50 264 1'031 1'695 5'776
12 SEAR-B 396 637 2'975 5'629 8'895 32'930
13 SEAR-D 1335 1'628 8'584 44'492 56'510 78'763
14 WPR-A 150 2'007 10'431 50'839 51'941 56'758
15 WPR-B1 1354 2'216 10'020 39'623 50'005 49'564
16 WPR-B2 144 616 2'880 7'239 8'651 15'829
17 WPR-B3 7 59 310 379 497 1'145
WORLD 6045 14'386 67'398 218'614 283'090 448'916Interventions: by the year 2015 - Intervention 1: Halving the proportion of people without access to improved water sources Intervention 2: Halving the proportion of people without access to improved water sources and sanitation Intervention 3: Everyone has access to improved water and improved sanitation services Intervention 4: Intervention 3 + everyone has a minimum of water disinfected at the point of use Intervention 5: Everyone has access to a regulated piped water supply & sewage connection in their houses
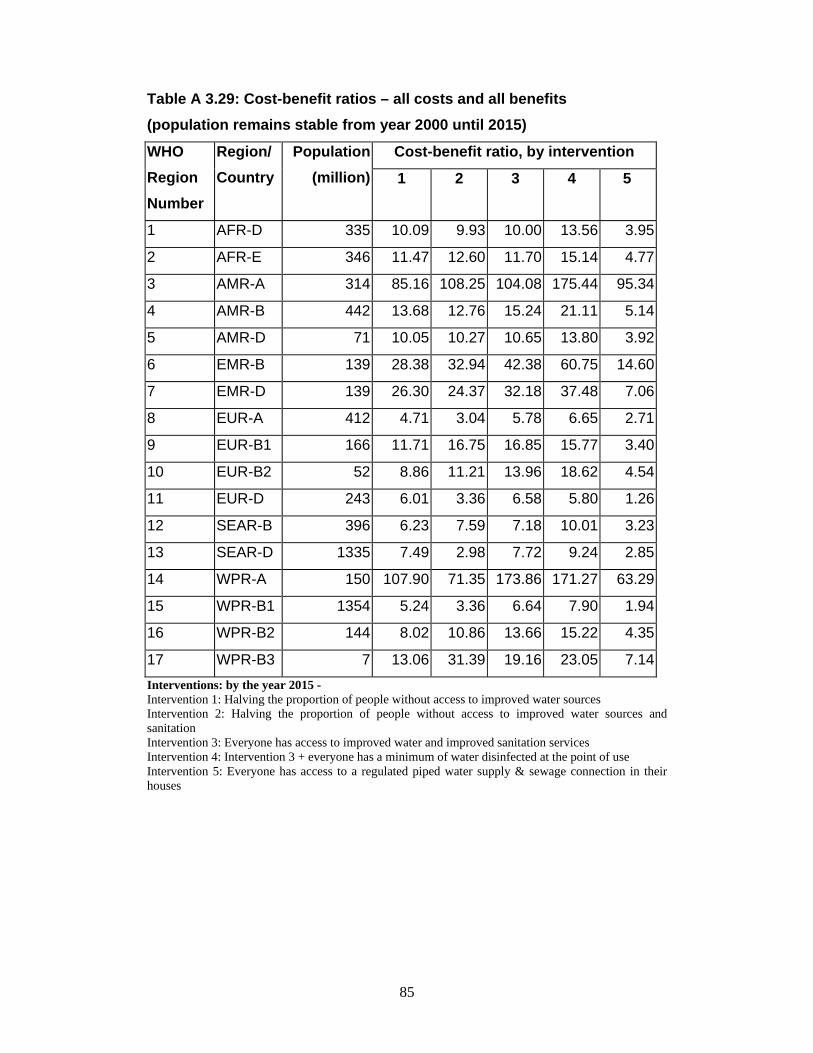
85
Table A 3.29: Cost-benefit ratios – all costs and all benefits (population remains stable from year 2000 until 2015)
Cost-benefit ratio, by intervention WHO Region Number
Region/ Country
Population (million) 1 2 3 4 5
1 AFR-D 335 10.09 9.93 10.00 13.56 3.95
2 AFR-E 346 11.47 12.60 11.70 15.14 4.77
3 AMR-A 314 85.16 108.25 104.08 175.44 95.34
4 AMR-B 442 13.68 12.76 15.24 21.11 5.14
5 AMR-D 71 10.05 10.27 10.65 13.80 3.92
6 EMR-B 139 28.38 32.94 42.38 60.75 14.60
7 EMR-D 139 26.30 24.37 32.18 37.48 7.06
8 EUR-A 412 4.71 3.04 5.78 6.65 2.71
9 EUR-B1 166 11.71 16.75 16.85 15.77 3.40
10 EUR-B2 52 8.86 11.21 13.96 18.62 4.54
11 EUR-D 243 6.01 3.36 6.58 5.80 1.26
12 SEAR-B 396 6.23 7.59 7.18 10.01 3.23
13 SEAR-D 1335 7.49 2.98 7.72 9.24 2.85
14 WPR-A 150 107.90 71.35 173.86 171.27 63.29
15 WPR-B1 1354 5.24 3.36 6.64 7.90 1.94
16 WPR-B2 144 8.02 10.86 13.66 15.22 4.35
17 WPR-B3 7 13.06 31.39 19.16 23.05 7.14Interventions: by the year 2015 - Intervention 1: Halving the proportion of people without access to improved water sources Intervention 2: Halving the proportion of people without access to improved water sources and sanitation Intervention 3: Everyone has access to improved water and improved sanitation services Intervention 4: Intervention 3 + everyone has a minimum of water disinfected at the point of use Intervention 5: Everyone has access to a regulated piped water supply & sewage connection in their houses
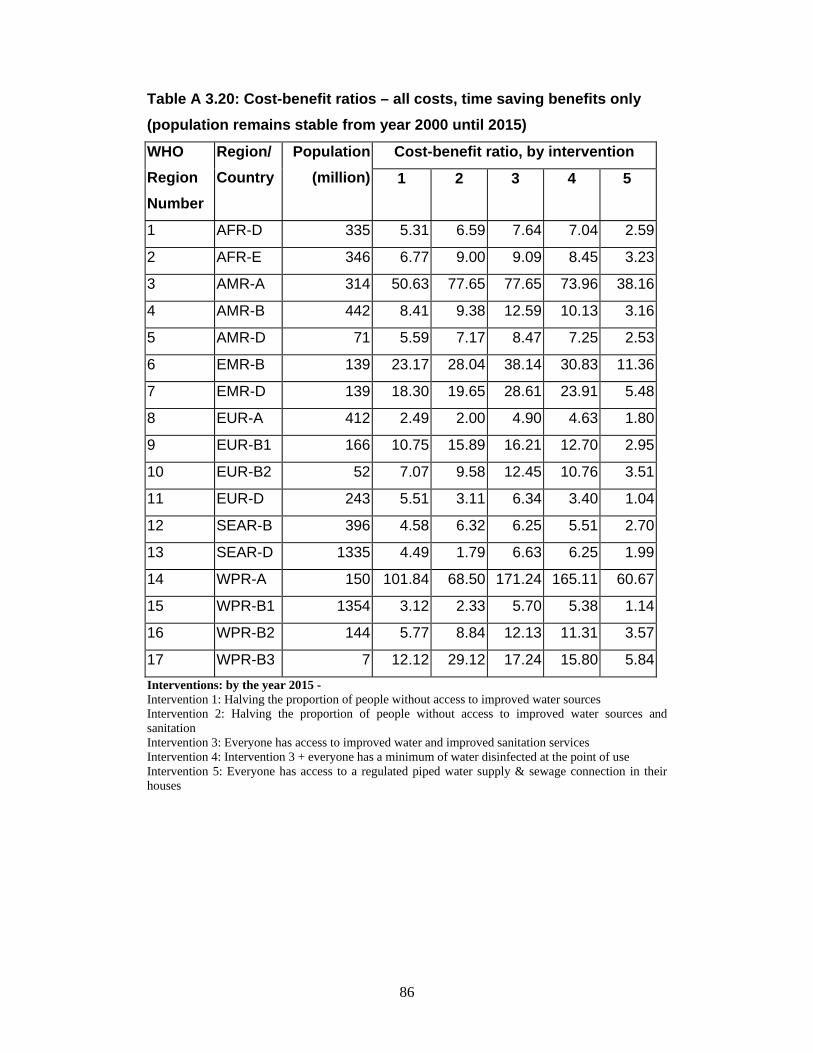
86
Table A 3.20: Cost-benefit ratios – all costs, time saving benefits only (population remains stable from year 2000 until 2015)
Cost-benefit ratio, by intervention WHO Region Number
Region/ Country
Population (million) 1 2 3 4 5
1 AFR-D 335 5.31 6.59 7.64 7.04 2.59
2 AFR-E 346 6.77 9.00 9.09 8.45 3.23
3 AMR-A 314 50.63 77.65 77.65 73.96 38.16
4 AMR-B 442 8.41 9.38 12.59 10.13 3.16
5 AMR-D 71 5.59 7.17 8.47 7.25 2.53
6 EMR-B 139 23.17 28.04 38.14 30.83 11.36
7 EMR-D 139 18.30 19.65 28.61 23.91 5.48
8 EUR-A 412 2.49 2.00 4.90 4.63 1.80
9 EUR-B1 166 10.75 15.89 16.21 12.70 2.95
10 EUR-B2 52 7.07 9.58 12.45 10.76 3.51
11 EUR-D 243 5.51 3.11 6.34 3.40 1.04
12 SEAR-B 396 4.58 6.32 6.25 5.51 2.70
13 SEAR-D 1335 4.49 1.79 6.63 6.25 1.99
14 WPR-A 150 101.84 68.50 171.24 165.11 60.67
15 WPR-B1 1354 3.12 2.33 5.70 5.38 1.14
16 WPR-B2 144 5.77 8.84 12.13 11.31 3.57
17 WPR-B3 7 12.12 29.12 17.24 15.80 5.84Interventions: by the year 2015 - Intervention 1: Halving the proportion of people without access to improved water sources Intervention 2: Halving the proportion of people without access to improved water sources and sanitation Intervention 3: Everyone has access to improved water and improved sanitation services Intervention 4: Intervention 3 + everyone has a minimum of water disinfected at the point of use Intervention 5: Everyone has access to a regulated piped water supply & sewage connection in their houses
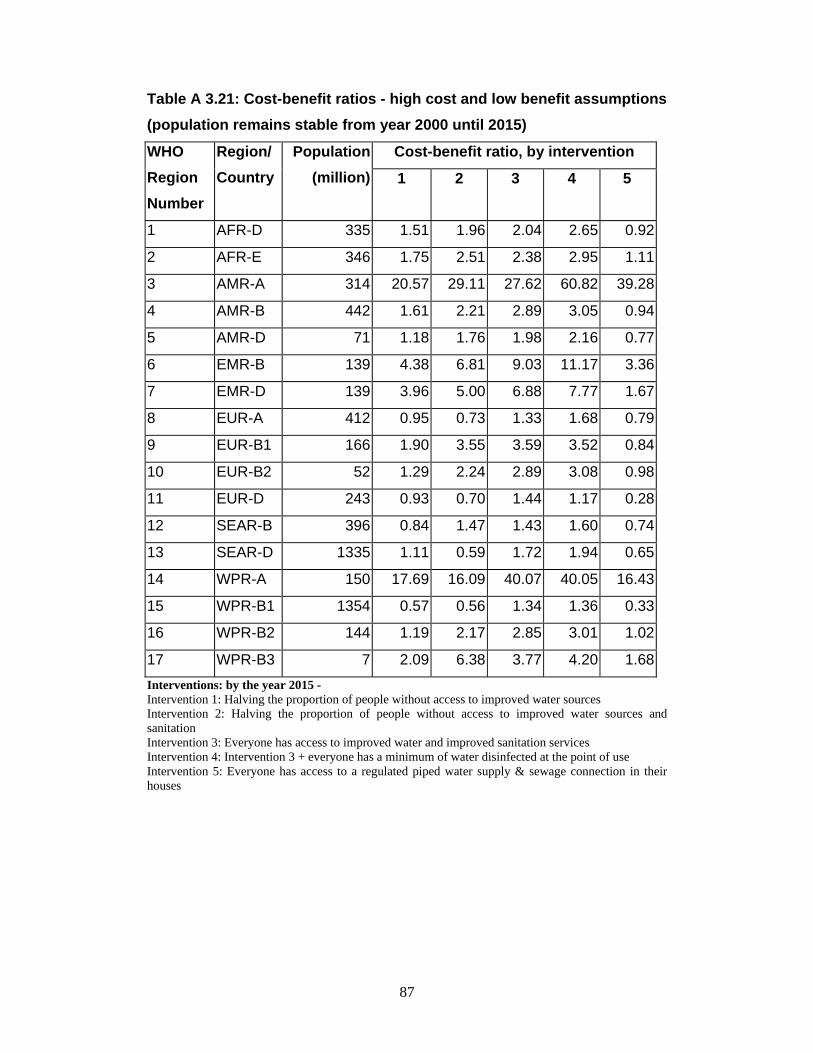
87
Table A 3.21: Cost-benefit ratios - high cost and low benefit assumptions (population remains stable from year 2000 until 2015)
Cost-benefit ratio, by intervention WHO Region Number
Region/ Country
Population (million) 1 2 3 4 5
1 AFR-D 335 1.51 1.96 2.04 2.65 0.92
2 AFR-E 346 1.75 2.51 2.38 2.95 1.11
3 AMR-A 314 20.57 29.11 27.62 60.82 39.28
4 AMR-B 442 1.61 2.21 2.89 3.05 0.94
5 AMR-D 71 1.18 1.76 1.98 2.16 0.77
6 EMR-B 139 4.38 6.81 9.03 11.17 3.36
7 EMR-D 139 3.96 5.00 6.88 7.77 1.67
8 EUR-A 412 0.95 0.73 1.33 1.68 0.79
9 EUR-B1 166 1.90 3.55 3.59 3.52 0.84
10 EUR-B2 52 1.29 2.24 2.89 3.08 0.98
11 EUR-D 243 0.93 0.70 1.44 1.17 0.28
12 SEAR-B 396 0.84 1.47 1.43 1.60 0.74
13 SEAR-D 1335 1.11 0.59 1.72 1.94 0.65
14 WPR-A 150 17.69 16.09 40.07 40.05 16.43
15 WPR-B1 1354 0.57 0.56 1.34 1.36 0.33
16 WPR-B2 144 1.19 2.17 2.85 3.01 1.02
17 WPR-B3 7 2.09 6.38 3.77 4.20 1.68Interventions: by the year 2015 - Intervention 1: Halving the proportion of people without access to improved water sources Intervention 2: Halving the proportion of people without access to improved water sources and sanitation Intervention 3: Everyone has access to improved water and improved sanitation services Intervention 4: Intervention 3 + everyone has a minimum of water disinfected at the point of use Intervention 5: Everyone has access to a regulated piped water supply & sewage connection in their houses