Embed Size (px)
Citation preview
Analytical Biochemistry 392 (2009) 37–44
Contents lists available at ScienceDirect
Analytical Biochemistry
journal homepage: www.elsevier .com/locate /yabio
Evaluation of the copper(II) reduction assay using bathocuproinedisulfonic aciddisodium salt for the total antioxidant capacity assessment: The CUPRAC–BCS assay
Carlos Campos *, Rodrigo Guzmán, Encarnación López-Fernández, Ángela CasadoDepartment of Cellular and Molecular Physiopathology, Center for Biological Research, Spanish National Research Council, E-28040 Madrid, Spain
a r t i c l e i n f o
Article history:Received 20 February 2009Available online 21 May 2009
Keywords:CUPRAC–BCS assayTotal antioxidant capacityBathocuproinedisulfonic acid disodium saltTEAC assayFRAP assayDPPH assay
0003-2697/$ - see front matter � 2009 Elsevier Inc. Adoi:10.1016/j.ab.2009.05.024
* Corresponding author. Fax: +34 91 536 04 32.E-mail address: [email protected] (C. Campos).
1 Abbreviations used: ROS, reactive oxygen species; TTEAC, trolox equivalent antioxidant capacity; FRAP, ferORAC, the oxygen radical absorbance capacity; TRpotential; BC, bathocuproine; BCS, bathocuproinedisulneocuproine; Cu, copper; ET, electron transfer; AOP or PCUPRAC, cupric ion reducing antioxidant capacityrylhydrazyl; trolox, 6-hydroxy-2,5,7,8-tetramethylchroreduced glutathione; BHA, 2(3)-t-butyl-4-hydroxyanismin (fraction V); NAC, N-acetyl-L-cysteine; TPTZ, 2,4,6-t2,20-azino-bis(3-ethylbenzothiazoline-6-sulfonic acid (ddihydroxy-1,3-benzenedisulfonic acid disodium salt;acetic acid dihydrate disodium salt; PBS, phosphate-deviation; ANOVA, analysis of variance; LOD, limitquantitation.
a b s t r a c t
There is heightened interest in determining antioxidant status of individuals in experimental and clinicalstudies investigating progression of diseases or diverse aspects of oxidative stress, among others. The aimof this study was to evaluate the copper(II) reduction assay with bathocuproinedisulfonic acid disodiumsalt as chelating agent (the CUPRAC–BCS assay) for the total antioxidant capacity (TAC) assessment inhuman plasma and urine. Samples from 20 individuals were determined with four spectrophotometricassays—CUPRAC–BCS, ferric reducing ability of plasma (FRAP), trolox equivalent antioxidant capacity(TEAC), and 1,1-diphenyl-2-picrylhydrazyl assay (DPPH)—to compare these methods. CUPRAC–BCS wassignificantly correlated with FRAP and TEAC for plasma and urine samples (r > 0.5, P < 0.05 for all) andwith DPPH for urine samples (r = 0.925, P < 0.001) but not with DPPH for plasma samples (r = 0.366,P = 0.112). However, the four methods do not agree given that lines of equality and regression werenot matched up. The imprecision of the method is less than 6%, the detection limit is 41.8 lmol troloxequivalents/L, it is linear up to 2 mM trolox, and ethylenediaminetetraacetic acid dihydrate disodium salt(EDTA) binds to Cu(II), avoiding the formation of Cu(I)–BCS complex. This study shows that CUPRAC–BCSis a simple, fast, inexpensive, and suitable method for TAC assessment in human urine and heparinizedplasma samples.
� 2009 Elsevier Inc. All rights reserved.
It is well known that oxidative stress is involved in the patho-genesis and development of many human diseases such as cardio-vascular pathologies, cancer, arteriosclerosis, and other diseasesrelated to aging. Oxidative stress is caused by an excessive bio-availability of reactive oxygen species (ROS)1 that cause cell dam-age. Because organisms have mechanisms for preventing andrepairing damages caused by ROS, which comprise a variety of anti-
ll rights reserved.
AC, total antioxidant capacity;ric reducing ability of plasma;AP, total radical absorptionfonic acid disodium salt; NC,AO, antioxidant power assay;
; DPPH, 1,1-diphenyl-2-pic-mane-2-carboxylic acid; GSH,ole; BSA, bovine serum albu-ri(2-pyridyl)-s-triazine; ABTS,iammonium salt); Tiron, 4,5-EDTA, ethylenediaminetetra-
buffered saline; SD, standardof detection; LOQ, limit of
oxidants, there is heightened interest in determining their antioxi-dants levels and the way in which they are related to pathologicalstates.
In biological terms, it is accepted that an antioxidant could beconsidered as any molecule that can retard or prevent the actionof oxidants [1]. Because of the difficulty in measuring concentra-tions of individual antioxidants, total antioxidant capacity (TAC)determination can be achieved by simple in vitro methodologies.Moreover, possible interactions among different antioxidantsin vivo could also make the measurement of any individual antiox-idant less representative of the overall antioxidant status. There-fore, TAC, which is defined as a measure of the amount (inmoles) of a given free radical scavenged by the nonenzymatic anti-oxidants present in an aqueous solution [2], may give more biolog-ically relevant information than that obtained from measuringeach antioxidant separately. Thus, TAC is a useful parameter to as-sess the antioxidant status of an organism as well as to controlantioxidant supplementation or to demonstrate the efficacy of adietary intervention.
Many analytical methods have been developed to determineTAC in a wide range of matrices such as biological fluids, food, bev-erages, and plant extracts, and several outstanding reviews about
38 Evaluation of the CUPRAC–BCS assay / C. Campos et al. / Anal. Biochem. 392 (2009) 37–44
them have been discussed [2–8]. The trolox equivalent antioxidantcapacity (TEAC), the ferric reducing ability of plasma (FRAP), theoxygen radical absorbance capacity (ORAC), and the total radicalabsorption potential (TRAP) assays are some of the most com-monly used for TAC determination of biological fluids. Not all ofthe methods measure the same antioxidants equally, and compar-isons between results do not always agree. Therefore, nowadaysthere is no single widely acceptable specific method for biologicalsamples. Although some comparative studies have been conductedduring recent years [9–15], these investigations did not include thecopper(II) reduction assay applied to plasma or urine samples.
There are several assays for TAC assessment based on cupric ionreduction that differ in the chelating agent used: bathocuproine(BC), bathocuproinedisulfonic acid disodium salt (BCS), and neo-cuproine (NC). These chelators form stable complexes with mono-valent copper (Cu) that have a typical absorption at 450–490 nm.In these assays, the complex is formed when, in a solution contain-ing Cu(II) and one of these chelators, the nonenzymatic antioxi-dants present in a sample reduce Cu(II) to Cu(I). Then, as insimilar electron transfer (ET) reaction-based assays, the antioxi-dant capacity is assumed to be equal to the reducing capacity[4]. Although the use of NC has already been studied for TAC deter-mination in biological samples [16] and comparative studies can befound in the literature [17,18], the Cu(II) reduction assay using BCand BCS was patented [19], and nowadays it is commercialized asan ‘‘antioxidant power assay” (abbreviated as AOP or PAO). How-ever, this name is very general and could be applied to any TAC as-say. Apak and coworkers [16] used CUPRAC (cupric ion reducingantioxidant capacity) to refer to the Cu(II) reducing assay usingNC as chelator. Therefore, we established CUPRAC–BCS to namethe method for TAC assessment in which BCS is used as chelatingagent. Although the CUPRAC–BCS assay presents a wider range ofadvantages than do other methodologies for TAC assessment ofplasma and urine samples, this method has not been well studied,it has not been compared with other TAC assays, and not muchinformation is provided by the manufacturer.
The aim of this study was to evaluate the CUPRAC–BCS assay,based on the commercial AOP kit, for TAC assessment of humanplasma and urine samples. This method was compared with threeother in vitro antioxidant capacity assays based on ET reactionswidely applied and frequently used—FRAP, TEAC, and DPPH (1,1-diphenyl-2-picrylhydrazyl) assays—to assess its use as an applica-ble methodology for TAC determination.
Materials and methods
Chemicals
Trolox (6-hydroxy-2,5,7,8-tetramethylchromane-2-carboxylicacid), reduced glutathione (GSH), gallic acid, 2(3)-t-butyl-4-hydroxyanisole (BHA), bovine serum albumin (fraction V) (BSA),N-acetyl-L-cysteine (NAC), bilirubin, DPPH, and methanol werepurchased from Sigma–Aldrich (Steinheim, Germany). Uric acid,BCS, Cu(II) sulfate anhydrous, 2,4,6-tri(2-pyridyl)-s-triazine (TPTZ),potassium persulfate, and 2,20-azino-bis(3-ethylbenzothiazoline-6-sulfonic acid (diammonium salt) (ABTS) were obtained fromFluka (Buchs, Switzerland). Ascorbic acid, ethanol, disodiumhydrogen phosphate dihydrate, potassium dihydrogen phosphate,and sodium acetate trihydrate were obtained from Merck(Darmstadt, Germany). Tiron (4,5-dihydroxy-1,3-benzenedisulfon-ic acid disodium salt) and iron(III) chloride anhydrous wereobtained from Riedel-de-Haën (Seelze, Germany). Ethylenedia-minetetraacetic acid dihydrate disodium salt (EDTA) was obtainedfrom Probus (Barcelona, Spain). Ultrapure water was obtained by aMilli-RO water system (Millipore, Bedford, MA, USA).
Apparatus
Spectrophotometric measurements of FRAP, TEAC, and DPPHwere performed with a UVmini-1240 Shimadzu spectrophotome-ter (Shimadzu, Tokyo, Japan). For the CUPRAC–BCS assay, a micro-plate reader with a 490-nm filter was used (Bio-Tek ELx808,Bio-Tek Instruments, Winooski, VT, USA). Absorption spectra weremeasured with a Cary 4000 spectrophotometer (Varian, Palo Alto,CA, USA). A Crison GLP21 pH meter (Crison Instruments, Barcelona,Spain) was used for pH adjustments. Reagents were heated in awater bath (Kowell FB-3-V-B).
Preparation of standards
Trolox, uric acid, GSH, bilirubin, ascorbic acid, tiron, gallic acid,NAC, BHA, and albumin were used for antioxidant studies. Stan-dard stock solutions (2 mM) were prepared for all antioxidants.Trolox was dissolved in phosphate-buffered saline (PBS). Uric acidwas prepared in ultrapure water and dissolved with 1 M NaOH.BHA was dissolved in ethanol. Bilirubin was dissolved in 0.1 MNaOH. The rest of the antioxidants were prepared in ultrapurewater. Standards were frozen in 1 ml aliquots at �80 �C untilanalysis.
Plasma and urine sample collection and preparation
Blood from 20 healthy subjects (9 males and 11 females, meanage = 50.5 ± 14.0 years, range = 26–76) was collected into tubescontaining heparin. Plasma was obtained by withdrawing superna-tants of centrifuged blood at 1200g for 10 min. Collected plasmawas immediately stored at �80 �C until analysis. Urine sampleswere also taken from 20 healthy subjects (6 males and 14 females,mean age = 36.9 ± 20.9 years, range = 14–82), and aliquots werefrozen at �20 �C until analysis.
Informed consent was obtained from the participants. The studywas approved by the ethics committee of the Spanish National Re-search Council.
CUPRAC–BCS assay
The CUPRAC–BCS assay was based on the commercial AOPmethod of Da Cruz (U.S. patent 6,613,577) [19]. For the photomet-ric assay, F16 MaxiSorp microplates (Nunc, Roskilde, Denmark) of350 ll/well and a microplate reader were used. Thus, 200 ll ofeach sample diluted 1:40 with 0.25 mM BCS in 10 mM phosphatebuffer (pH 7.4) was put into each well in duplicate and a first readat 490 nm was taken. After the addition of 50 ll of 0.5 mM CuSO4
(Cu(II) solution prepared in water), the reaction mixture was incu-bated 3 min at room temperature. The reaction was stopped by theaddition of 50 ll of 0.01 M EDTA, and a second read at 490 nm wastaken. The difference between the two readings was used in thecalculations. Distilled water was used instead of sample or stan-dard for blanks. Results were compared with a standard curve ob-tained with trolox and are expressed in mmol trolox equivalents/L.
FRAP assay
The FRAP assay was performed essentially as described by Ben-zie and Strain [20]. In brief, 30 ll of sample or standard was addedto 900 ll of the freshly prepared FRAP reagent (10 volumes of300 mM acetate buffer [pH 3.6], 1 volume of 10 mM TPTZ [pre-pared in 40 mM HCl], and 1 volume of 20 mM FeCl3) prewarmedto 37 �C. The reaction mixture was incubated 5 min at 37 �C, andabsorbance was read at 593 nm. Results are expressed in mmoltrolox equivalents/L.
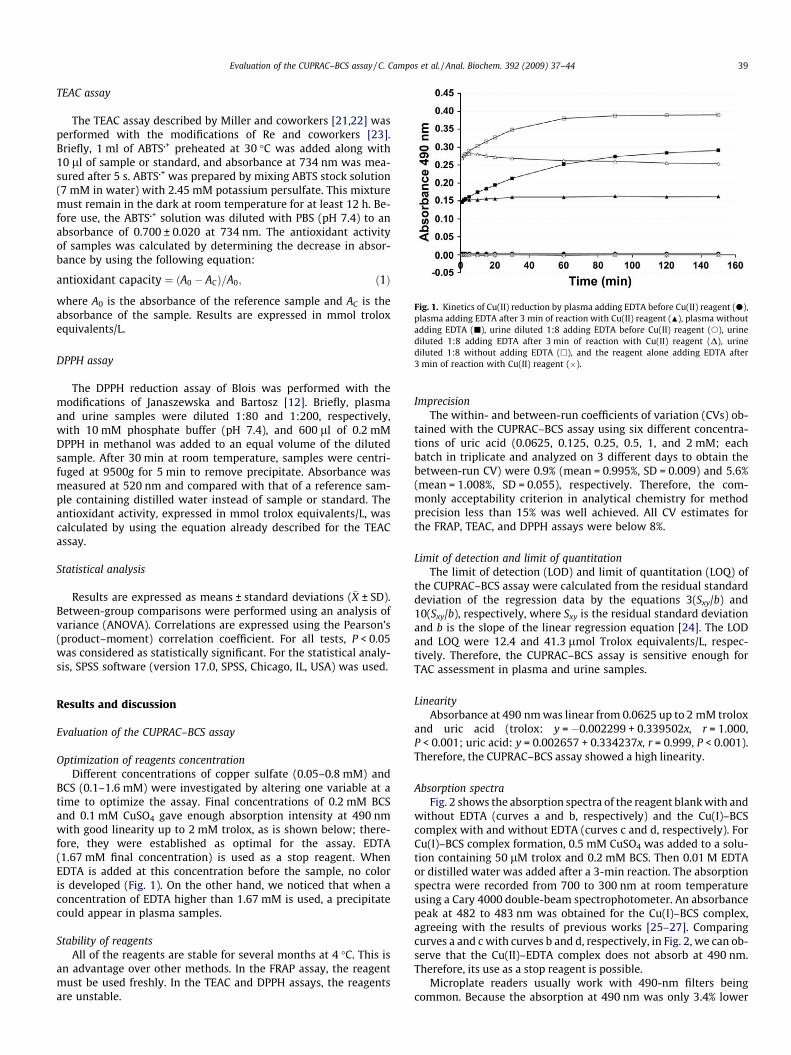
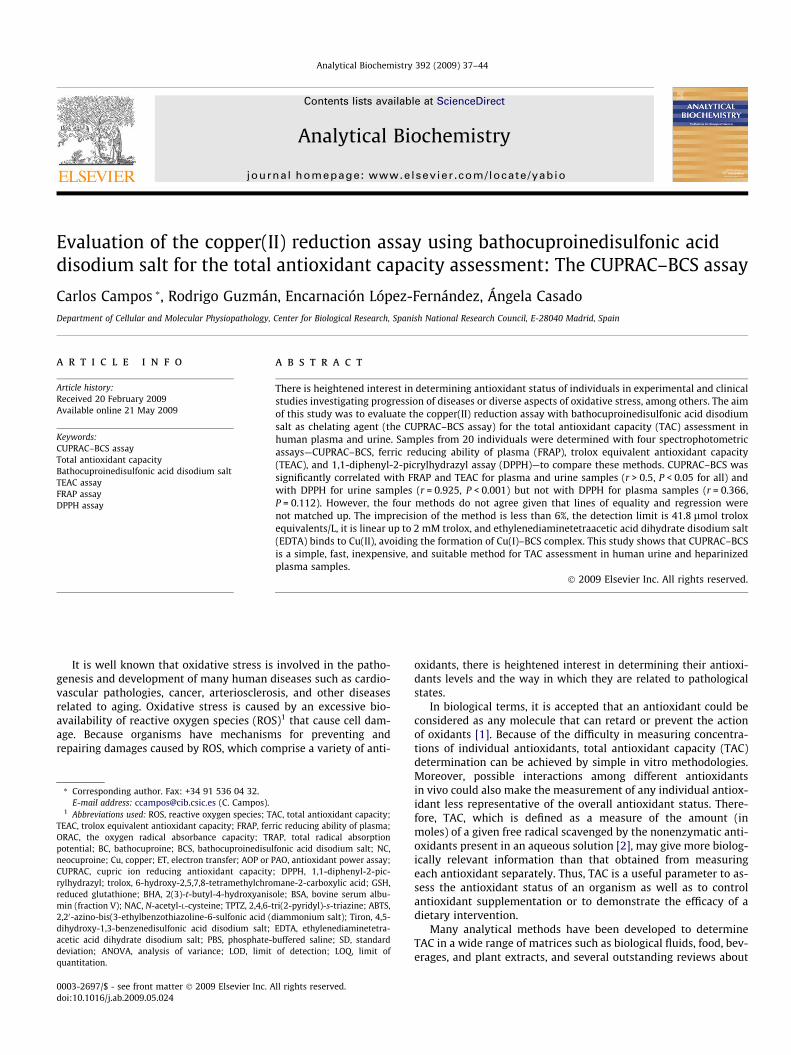
Fig. 1. Kinetics of Cu(II) reduction by plasma adding EDTA before Cu(II) reagent (d),plasma adding EDTA after 3 min of reaction with Cu(II) reagent (N), plasma withoutadding EDTA (j), urine diluted 1:8 adding EDTA before Cu(II) reagent (s), urinediluted 1:8 adding EDTA after 3 min of reaction with Cu(II) reagent (D), urinediluted 1:8 without adding EDTA (h), and the reagent alone adding EDTA after3 min of reaction with Cu(II) reagent (�).
Evaluation of the CUPRAC–BCS assay / C. Campos et al. / Anal. Biochem. 392 (2009) 37–44 39
TEAC assay
The TEAC assay described by Miller and coworkers [21,22] wasperformed with the modifications of Re and coworkers [23].Briefly, 1 ml of ABTS�+ preheated at 30 �C was added along with10 ll of sample or standard, and absorbance at 734 nm was mea-sured after 5 s. ABTS�+ was prepared by mixing ABTS stock solution(7 mM in water) with 2.45 mM potassium persulfate. This mixturemust remain in the dark at room temperature for at least 12 h. Be-fore use, the ABTS�+ solution was diluted with PBS (pH 7.4) to anabsorbance of 0.700 ± 0.020 at 734 nm. The antioxidant activityof samples was calculated by determining the decrease in absor-bance by using the following equation:
antioxidant capacity ¼ ðA0 � ACÞ=A0; ð1Þ
where A0 is the absorbance of the reference sample and AC is theabsorbance of the sample. Results are expressed in mmol troloxequivalents/L.
DPPH assay
The DPPH reduction assay of Blois was performed with themodifications of Janaszewska and Bartosz [12]. Briefly, plasmaand urine samples were diluted 1:80 and 1:200, respectively,with 10 mM phosphate buffer (pH 7.4), and 600 ll of 0.2 mMDPPH in methanol was added to an equal volume of the dilutedsample. After 30 min at room temperature, samples were centri-fuged at 9500g for 5 min to remove precipitate. Absorbance wasmeasured at 520 nm and compared with that of a reference sam-ple containing distilled water instead of sample or standard. Theantioxidant activity, expressed in mmol trolox equivalents/L, wascalculated by using the equation already described for the TEACassay.
Statistical analysis
Results are expressed as means ± standard deviations (�X ± SD).Between-group comparisons were performed using an analysis ofvariance (ANOVA). Correlations are expressed using the Pearson’s(product–moment) correlation coefficient. For all tests, P < 0.05was considered as statistically significant. For the statistical analy-sis, SPSS software (version 17.0, SPSS, Chicago, IL, USA) was used.
Results and discussion
Evaluation of the CUPRAC–BCS assay
Optimization of reagents concentrationDifferent concentrations of copper sulfate (0.05–0.8 mM) and
BCS (0.1–1.6 mM) were investigated by altering one variable at atime to optimize the assay. Final concentrations of 0.2 mM BCSand 0.1 mM CuSO4 gave enough absorption intensity at 490 nmwith good linearity up to 2 mM trolox, as is shown below; there-fore, they were established as optimal for the assay. EDTA(1.67 mM final concentration) is used as a stop reagent. WhenEDTA is added at this concentration before the sample, no coloris developed (Fig. 1). On the other hand, we noticed that when aconcentration of EDTA higher than 1.67 mM is used, a precipitatecould appear in plasma samples.
Stability of reagentsAll of the reagents are stable for several months at 4 �C. This is
an advantage over other methods. In the FRAP assay, the reagentmust be used freshly. In the TEAC and DPPH assays, the reagentsare unstable.
ImprecisionThe within- and between-run coefficients of variation (CVs) ob-
tained with the CUPRAC–BCS assay using six different concentra-tions of uric acid (0.0625, 0.125, 0.25, 0.5, 1, and 2 mM; eachbatch in triplicate and analyzed on 3 different days to obtain thebetween-run CV) were 0.9% (mean = 0.995%, SD = 0.009) and 5.6%(mean = 1.008%, SD = 0.055), respectively. Therefore, the com-monly acceptability criterion in analytical chemistry for methodprecision less than 15% was well achieved. All CV estimates forthe FRAP, TEAC, and DPPH assays were below 8%.
Limit of detection and limit of quantitationThe limit of detection (LOD) and limit of quantitation (LOQ) of
the CUPRAC–BCS assay were calculated from the residual standarddeviation of the regression data by the equations 3(Sxy/b) and10(Sxy/b), respectively, where Sxy is the residual standard deviationand b is the slope of the linear regression equation [24]. The LODand LOQ were 12.4 and 41.3 lmol Trolox equivalents/L, respec-tively. Therefore, the CUPRAC–BCS assay is sensitive enough forTAC assessment in plasma and urine samples.
LinearityAbsorbance at 490 nm was linear from 0.0625 up to 2 mM trolox
and uric acid (trolox: y = �0.002299 + 0.339502x, r = 1.000,P < 0.001; uric acid: y = 0.002657 + 0.334237x, r = 0.999, P < 0.001).Therefore, the CUPRAC–BCS assay showed a high linearity.
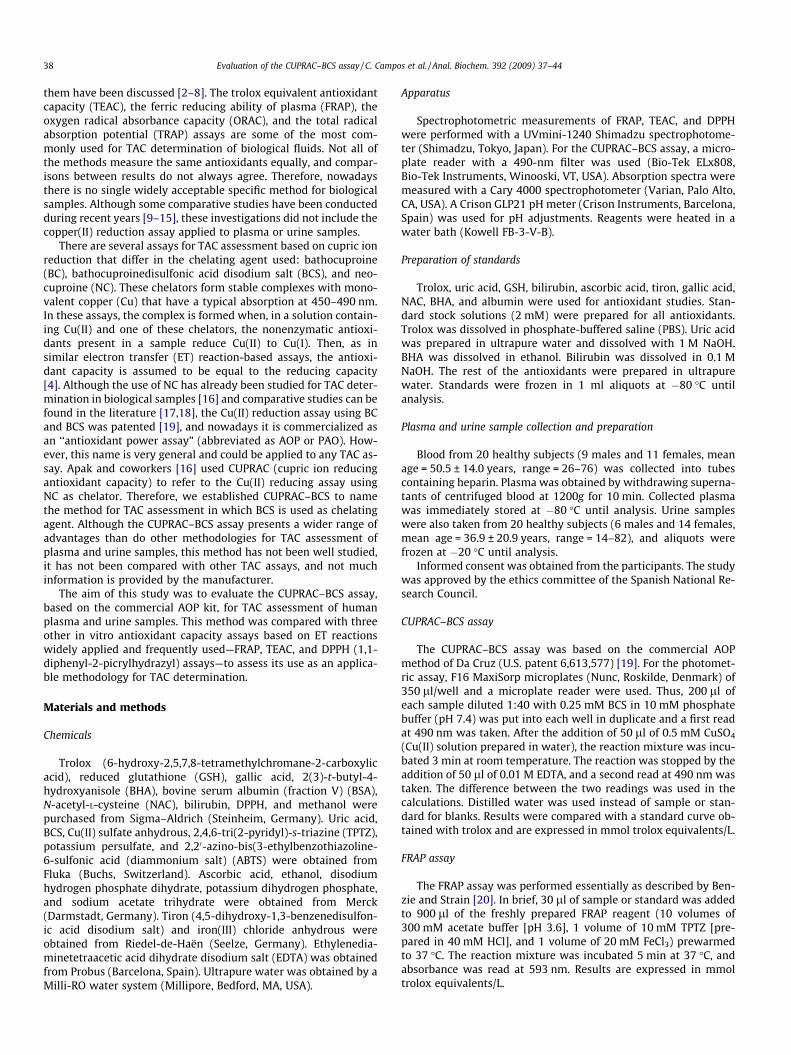
Absorption spectraFig. 2 shows the absorption spectra of the reagent blank with and
without EDTA (curves a and b, respectively) and the Cu(I)–BCScomplex with and without EDTA (curves c and d, respectively). ForCu(I)–BCS complex formation, 0.5 mM CuSO4 was added to a solu-tion containing 50 lM trolox and 0.2 mM BCS. Then 0.01 M EDTAor distilled water was added after a 3-min reaction. The absorptionspectra were recorded from 700 to 300 nm at room temperatureusing a Cary 4000 double-beam spectrophotometer. An absorbancepeak at 482 to 483 nm was obtained for the Cu(I)–BCS complex,agreeing with the results of previous works [25–27]. Comparingcurves a and c with curves b and d, respectively, in Fig. 2, we can ob-serve that the Cu(II)–EDTA complex does not absorb at 490 nm.Therefore, its use as a stop reagent is possible.
Microplate readers usually work with 490-nm filters beingcommon. Because the absorption at 490 nm was only 3.4% lower
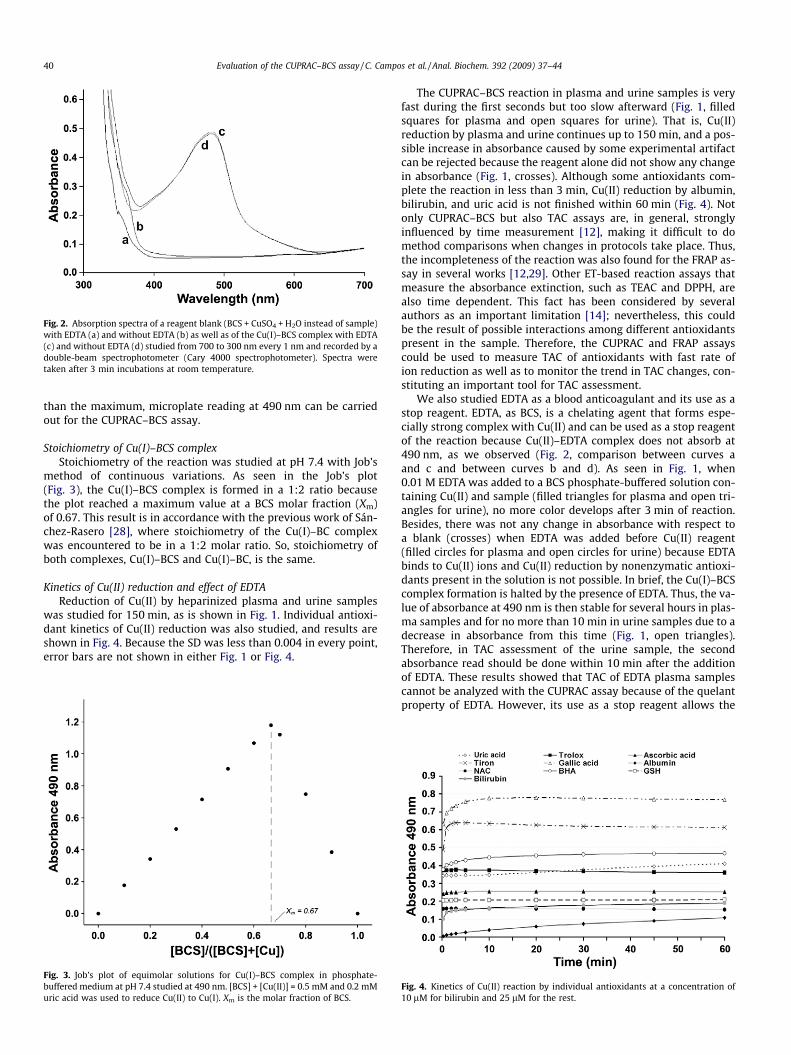
Fig. 2. Absorption spectra of a reagent blank (BCS + CuSO4 + H2O instead of sample)with EDTA (a) and without EDTA (b) as well as of the Cu(I)–BCS complex with EDTA(c) and without EDTA (d) studied from 700 to 300 nm every 1 nm and recorded by adouble-beam spectrophotometer (Cary 4000 spectrophotometer). Spectra weretaken after 3 min incubations at room temperature.
40 Evaluation of the CUPRAC–BCS assay / C. Campos et al. / Anal. Biochem. 392 (2009) 37–44
than the maximum, microplate reading at 490 nm can be carriedout for the CUPRAC–BCS assay.
Stoichiometry of Cu(I)–BCS complexStoichiometry of the reaction was studied at pH 7.4 with Job’s
method of continuous variations. As seen in the Job’s plot(Fig. 3), the Cu(I)–BCS complex is formed in a 1:2 ratio becausethe plot reached a maximum value at a BCS molar fraction (Xm)of 0.67. This result is in accordance with the previous work of Sán-chez-Rasero [28], where stoichiometry of the Cu(I)–BC complexwas encountered to be in a 1:2 molar ratio. So, stoichiometry ofboth complexes, Cu(I)–BCS and Cu(I)–BC, is the same.
Kinetics of Cu(II) reduction and effect of EDTAReduction of Cu(II) by heparinized plasma and urine samples
was studied for 150 min, as is shown in Fig. 1. Individual antioxi-dant kinetics of Cu(II) reduction was also studied, and results areshown in Fig. 4. Because the SD was less than 0.004 in every point,error bars are not shown in either Fig. 1 or Fig. 4.
Fig. 3. Job’s plot of equimolar solutions for Cu(I)–BCS complex in phosphate-buffered medium at pH 7.4 studied at 490 nm. [BCS] + [Cu(II)] = 0.5 mM and 0.2 mMuric acid was used to reduce Cu(II) to Cu(I). Xm is the molar fraction of BCS.
The CUPRAC–BCS reaction in plasma and urine samples is veryfast during the first seconds but too slow afterward (Fig. 1, filledsquares for plasma and open squares for urine). That is, Cu(II)reduction by plasma and urine continues up to 150 min, and a pos-sible increase in absorbance caused by some experimental artifactcan be rejected because the reagent alone did not show any changein absorbance (Fig. 1, crosses). Although some antioxidants com-plete the reaction in less than 3 min, Cu(II) reduction by albumin,bilirubin, and uric acid is not finished within 60 min (Fig. 4). Notonly CUPRAC–BCS but also TAC assays are, in general, stronglyinfluenced by time measurement [12], making it difficult to domethod comparisons when changes in protocols take place. Thus,the incompleteness of the reaction was also found for the FRAP as-say in several works [12,29]. Other ET-based reaction assays thatmeasure the absorbance extinction, such as TEAC and DPPH, arealso time dependent. This fact has been considered by severalauthors as an important limitation [14]; nevertheless, this couldbe the result of possible interactions among different antioxidantspresent in the sample. Therefore, the CUPRAC and FRAP assayscould be used to measure TAC of antioxidants with fast rate ofion reduction as well as to monitor the trend in TAC changes, con-stituting an important tool for TAC assessment.
We also studied EDTA as a blood anticoagulant and its use as astop reagent. EDTA, as BCS, is a chelating agent that forms espe-cially strong complex with Cu(II) and can be used as a stop reagentof the reaction because Cu(II)–EDTA complex does not absorb at490 nm, as we observed (Fig. 2, comparison between curves aand c and between curves b and d). As seen in Fig. 1, when0.01 M EDTA was added to a BCS phosphate-buffered solution con-taining Cu(II) and sample (filled triangles for plasma and open tri-angles for urine), no more color develops after 3 min of reaction.Besides, there was not any change in absorbance with respect toa blank (crosses) when EDTA was added before Cu(II) reagent(filled circles for plasma and open circles for urine) because EDTAbinds to Cu(II) ions and Cu(II) reduction by nonenzymatic antioxi-dants present in the solution is not possible. In brief, the Cu(I)–BCScomplex formation is halted by the presence of EDTA. Thus, the va-lue of absorbance at 490 nm is then stable for several hours in plas-ma samples and for no more than 10 min in urine samples due to adecrease in absorbance from this time (Fig. 1, open triangles).Therefore, in TAC assessment of the urine sample, the secondabsorbance read should be done within 10 min after the additionof EDTA. These results showed that TAC of EDTA plasma samplescannot be analyzed with the CUPRAC assay because of the quelantproperty of EDTA. However, its use as a stop reagent allows the
Fig. 4. Kinetics of Cu(II) reaction by individual antioxidants at a concentration of10 lM for bilirubin and 25 lM for the rest.
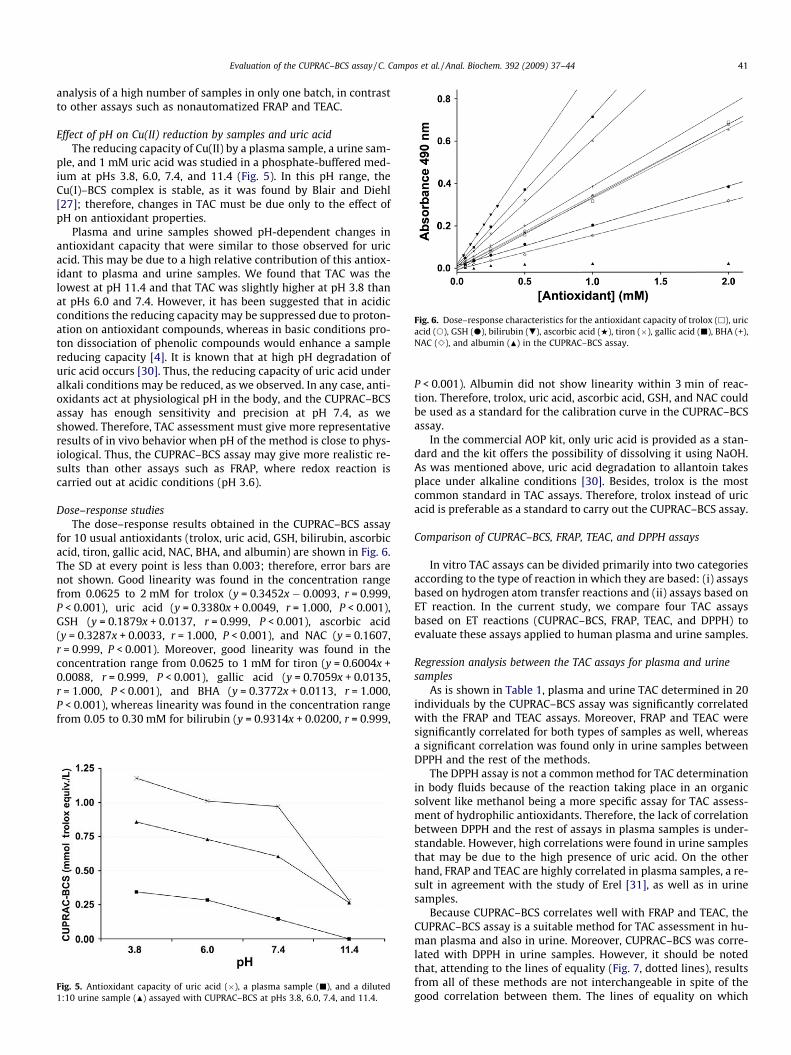
Fig. 6. Dose–response characteristics for the antioxidant capacity of trolox (h), uricacid (s), GSH (d), bilirubin (.), ascorbic acid (w), tiron (�), gallic acid (j), BHA (+),NAC (e), and albumin (N) in the CUPRAC–BCS assay.
Evaluation of the CUPRAC–BCS assay / C. Campos et al. / Anal. Biochem. 392 (2009) 37–44 41
analysis of a high number of samples in only one batch, in contrastto other assays such as nonautomatized FRAP and TEAC.
Effect of pH on Cu(II) reduction by samples and uric acidThe reducing capacity of Cu(II) by a plasma sample, a urine sam-
ple, and 1 mM uric acid was studied in a phosphate-buffered med-ium at pHs 3.8, 6.0, 7.4, and 11.4 (Fig. 5). In this pH range, theCu(I)–BCS complex is stable, as it was found by Blair and Diehl[27]; therefore, changes in TAC must be due only to the effect ofpH on antioxidant properties.
Plasma and urine samples showed pH-dependent changes inantioxidant capacity that were similar to those observed for uricacid. This may be due to a high relative contribution of this antiox-idant to plasma and urine samples. We found that TAC was thelowest at pH 11.4 and that TAC was slightly higher at pH 3.8 thanat pHs 6.0 and 7.4. However, it has been suggested that in acidicconditions the reducing capacity may be suppressed due to proton-ation on antioxidant compounds, whereas in basic conditions pro-ton dissociation of phenolic compounds would enhance a samplereducing capacity [4]. It is known that at high pH degradation ofuric acid occurs [30]. Thus, the reducing capacity of uric acid underalkali conditions may be reduced, as we observed. In any case, anti-oxidants act at physiological pH in the body, and the CUPRAC–BCSassay has enough sensitivity and precision at pH 7.4, as weshowed. Therefore, TAC assessment must give more representativeresults of in vivo behavior when pH of the method is close to phys-iological. Thus, the CUPRAC–BCS assay may give more realistic re-sults than other assays such as FRAP, where redox reaction iscarried out at acidic conditions (pH 3.6).
Dose–response studiesThe dose–response results obtained in the CUPRAC–BCS assay
for 10 usual antioxidants (trolox, uric acid, GSH, bilirubin, ascorbicacid, tiron, gallic acid, NAC, BHA, and albumin) are shown in Fig. 6.The SD at every point is less than 0.003; therefore, error bars arenot shown. Good linearity was found in the concentration rangefrom 0.0625 to 2 mM for trolox (y = 0.3452x � 0.0093, r = 0.999,P < 0.001), uric acid (y = 0.3380x + 0.0049, r = 1.000, P < 0.001),GSH (y = 0.1879x + 0.0137, r = 0.999, P < 0.001), ascorbic acid(y = 0.3287x + 0.0033, r = 1.000, P < 0.001), and NAC (y = 0.1607,r = 0.999, P < 0.001). Moreover, good linearity was found in theconcentration range from 0.0625 to 1 mM for tiron (y = 0.6004x +0.0088, r = 0.999, P < 0.001), gallic acid (y = 0.7059x + 0.0135,r = 1.000, P < 0.001), and BHA (y = 0.3772x + 0.0113, r = 1.000,P < 0.001), whereas linearity was found in the concentration rangefrom 0.05 to 0.30 mM for bilirubin (y = 0.9314x + 0.0200, r = 0.999,
Fig. 5. Antioxidant capacity of uric acid (�), a plasma sample (j), and a diluted1:10 urine sample (N) assayed with CUPRAC–BCS at pHs 3.8, 6.0, 7.4, and 11.4.
P < 0.001). Albumin did not show linearity within 3 min of reac-tion. Therefore, trolox, uric acid, ascorbic acid, GSH, and NAC couldbe used as a standard for the calibration curve in the CUPRAC–BCSassay.
In the commercial AOP kit, only uric acid is provided as a stan-dard and the kit offers the possibility of dissolving it using NaOH.As was mentioned above, uric acid degradation to allantoin takesplace under alkaline conditions [30]. Besides, trolox is the mostcommon standard in TAC assays. Therefore, trolox instead of uricacid is preferable as a standard to carry out the CUPRAC–BCS assay.
Comparison of CUPRAC–BCS, FRAP, TEAC, and DPPH assays
In vitro TAC assays can be divided primarily into two categoriesaccording to the type of reaction in which they are based: (i) assaysbased on hydrogen atom transfer reactions and (ii) assays based onET reaction. In the current study, we compare four TAC assaysbased on ET reactions (CUPRAC–BCS, FRAP, TEAC, and DPPH) toevaluate these assays applied to human plasma and urine samples.
Regression analysis between the TAC assays for plasma and urinesamples
As is shown in Table 1, plasma and urine TAC determined in 20individuals by the CUPRAC–BCS assay was significantly correlatedwith the FRAP and TEAC assays. Moreover, FRAP and TEAC weresignificantly correlated for both types of samples as well, whereasa significant correlation was found only in urine samples betweenDPPH and the rest of the methods.
The DPPH assay is not a common method for TAC determinationin body fluids because of the reaction taking place in an organicsolvent like methanol being a more specific assay for TAC assess-ment of hydrophilic antioxidants. Therefore, the lack of correlationbetween DPPH and the rest of assays in plasma samples is under-standable. However, high correlations were found in urine samplesthat may be due to the high presence of uric acid. On the otherhand, FRAP and TEAC are highly correlated in plasma samples, a re-sult in agreement with the study of Erel [31], as well as in urinesamples.
Because CUPRAC–BCS correlates well with FRAP and TEAC, theCUPRAC–BCS assay is a suitable method for TAC assessment in hu-man plasma and also in urine. Moreover, CUPRAC–BCS was corre-lated with DPPH in urine samples. However, it should be notedthat, attending to the lines of equality (Fig. 7, dotted lines), resultsfrom all of these methods are not interchangeable in spite of thegood correlation between them. The lines of equality on which
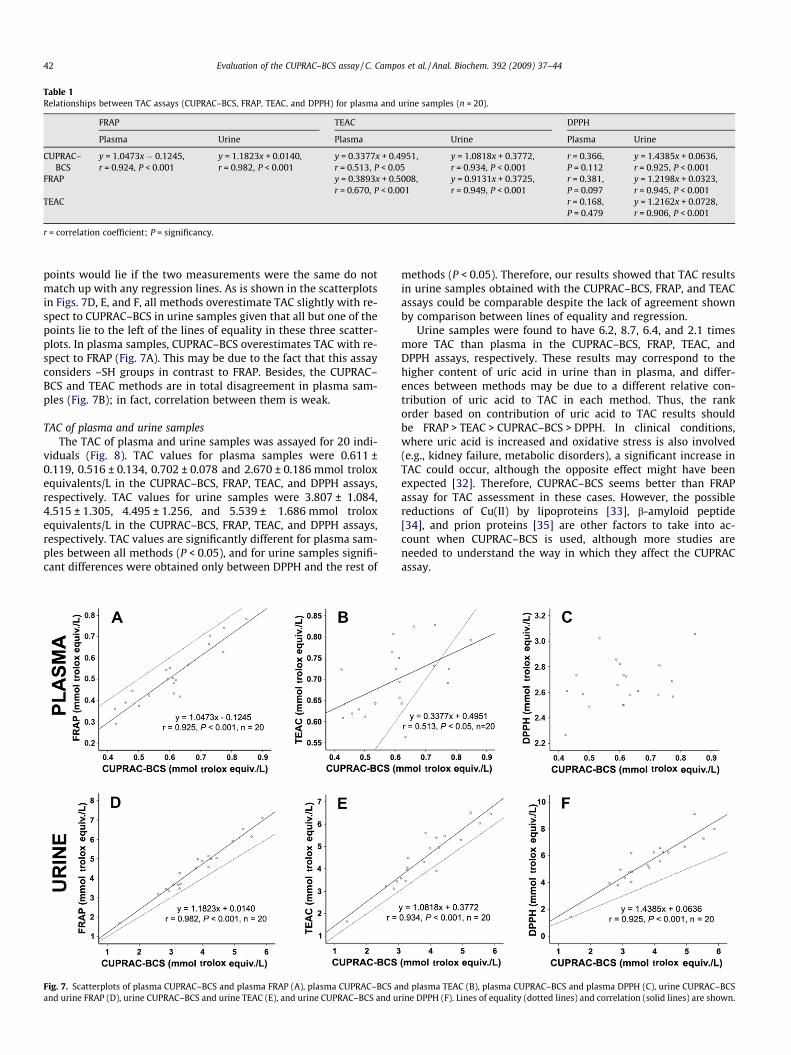
Table 1Relationships between TAC assays (CUPRAC–BCS, FRAP, TEAC, and DPPH) for plasma and urine samples (n = 20).
FRAP TEAC DPPH
Plasma Urine Plasma Urine Plasma Urine
CUPRAC–BCS
y = 1.0473x � 0.1245,r = 0.924, P < 0.001
y = 1.1823x + 0.0140,r = 0.982, P < 0.001
y = 0.3377x + 0.4951,r = 0.513, P < 0.05
y = 1.0818x + 0.3772,r = 0.934, P < 0.001
r = 0.366,P = 0.112
y = 1.4385x + 0.0636,r = 0.925, P < 0.001
FRAP y = 0.3893x + 0.5008,r = 0.670, P < 0.001
y = 0.9131x + 0.3725,r = 0.949, P < 0.001
r = 0.381,P = 0.097
y = 1.2198x + 0.0323,r = 0.945, P < 0.001
TEAC r = 0.168,P = 0.479
y = 1.2162x + 0.0728,r = 0.906, P < 0.001
r = correlation coefficient; P = significancy.
42 Evaluation of the CUPRAC–BCS assay / C. Campos et al. / Anal. Biochem. 392 (2009) 37–44
points would lie if the two measurements were the same do notmatch up with any regression lines. As is shown in the scatterplotsin Figs. 7D, E, and F, all methods overestimate TAC slightly with re-spect to CUPRAC–BCS in urine samples given that all but one of thepoints lie to the left of the lines of equality in these three scatter-plots. In plasma samples, CUPRAC–BCS overestimates TAC with re-spect to FRAP (Fig. 7A). This may be due to the fact that this assayconsiders –SH groups in contrast to FRAP. Besides, the CUPRAC–BCS and TEAC methods are in total disagreement in plasma sam-ples (Fig. 7B); in fact, correlation between them is weak.
TAC of plasma and urine samplesThe TAC of plasma and urine samples was assayed for 20 indi-
viduals (Fig. 8). TAC values for plasma samples were 0.611 ±0.119, 0.516 ± 0.134, 0.702 ± 0.078 and 2.670 ± 0.186 mmol troloxequivalents/L in the CUPRAC–BCS, FRAP, TEAC, and DPPH assays,respectively. TAC values for urine samples were 3.807 ± 1.084,4.515 ± 1.305, 4.495 ± 1.256, and 5.539 ± 1.686 mmol troloxequivalents/L in the CUPRAC–BCS, FRAP, TEAC, and DPPH assays,respectively. TAC values are significantly different for plasma sam-ples between all methods (P < 0.05), and for urine samples signifi-cant differences were obtained only between DPPH and the rest of
Fig. 7. Scatterplots of plasma CUPRAC–BCS and plasma FRAP (A), plasma CUPRAC–BCS aand urine FRAP (D), urine CUPRAC–BCS and urine TEAC (E), and urine CUPRAC–BCS and u
methods (P < 0.05). Therefore, our results showed that TAC resultsin urine samples obtained with the CUPRAC–BCS, FRAP, and TEACassays could be comparable despite the lack of agreement shownby comparison between lines of equality and regression.
Urine samples were found to have 6.2, 8.7, 6.4, and 2.1 timesmore TAC than plasma in the CUPRAC–BCS, FRAP, TEAC, andDPPH assays, respectively. These results may correspond to thehigher content of uric acid in urine than in plasma, and differ-ences between methods may be due to a different relative con-tribution of uric acid to TAC in each method. Thus, the rankorder based on contribution of uric acid to TAC results shouldbe FRAP > TEAC > CUPRAC–BCS > DPPH. In clinical conditions,where uric acid is increased and oxidative stress is also involved(e.g., kidney failure, metabolic disorders), a significant increase inTAC could occur, although the opposite effect might have beenexpected [32]. Therefore, CUPRAC–BCS seems better than FRAPassay for TAC assessment in these cases. However, the possiblereductions of Cu(II) by lipoproteins [33], b-amyloid peptide[34], and prion proteins [35] are other factors to take into ac-count when CUPRAC–BCS is used, although more studies areneeded to understand the way in which they affect the CUPRACassay.
nd plasma TEAC (B), plasma CUPRAC–BCS and plasma DPPH (C), urine CUPRAC–BCSrine DPPH (F). Lines of equality (dotted lines) and correlation (solid lines) are shown.
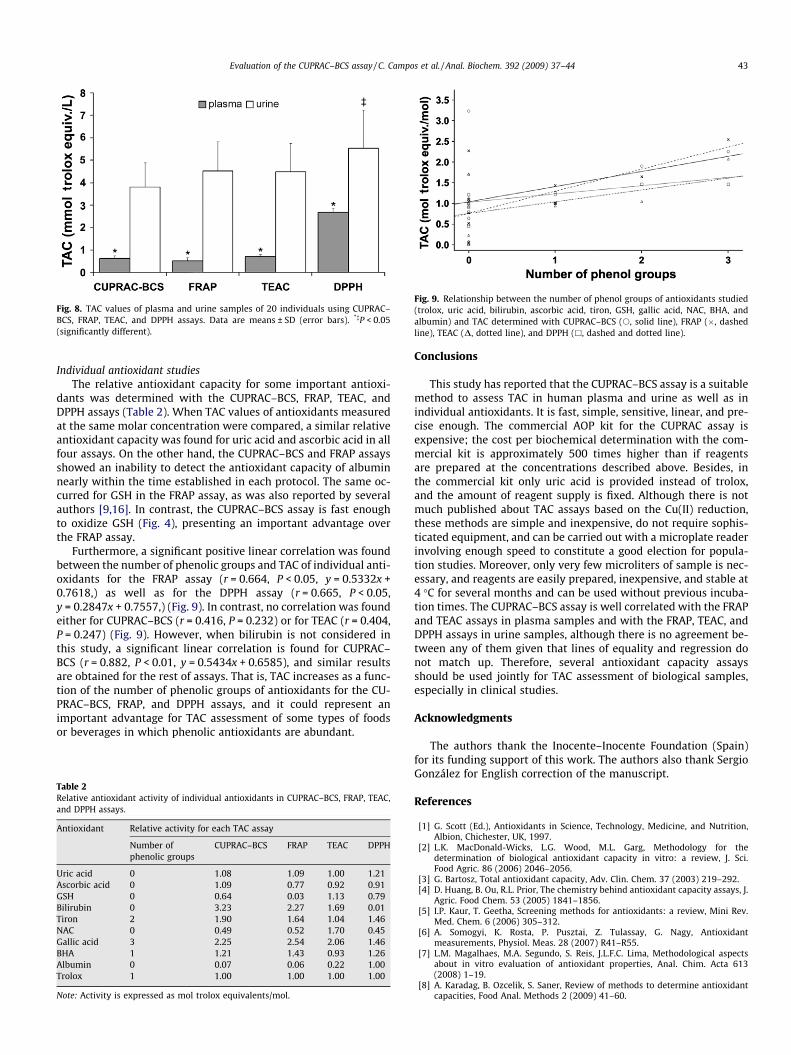
Fig. 8. TAC values of plasma and urine samples of 20 individuals using CUPRAC–BCS, FRAP, TEAC, and DPPH assays. Data are means ± SD (error bars). *�P < 0.05(significantly different).
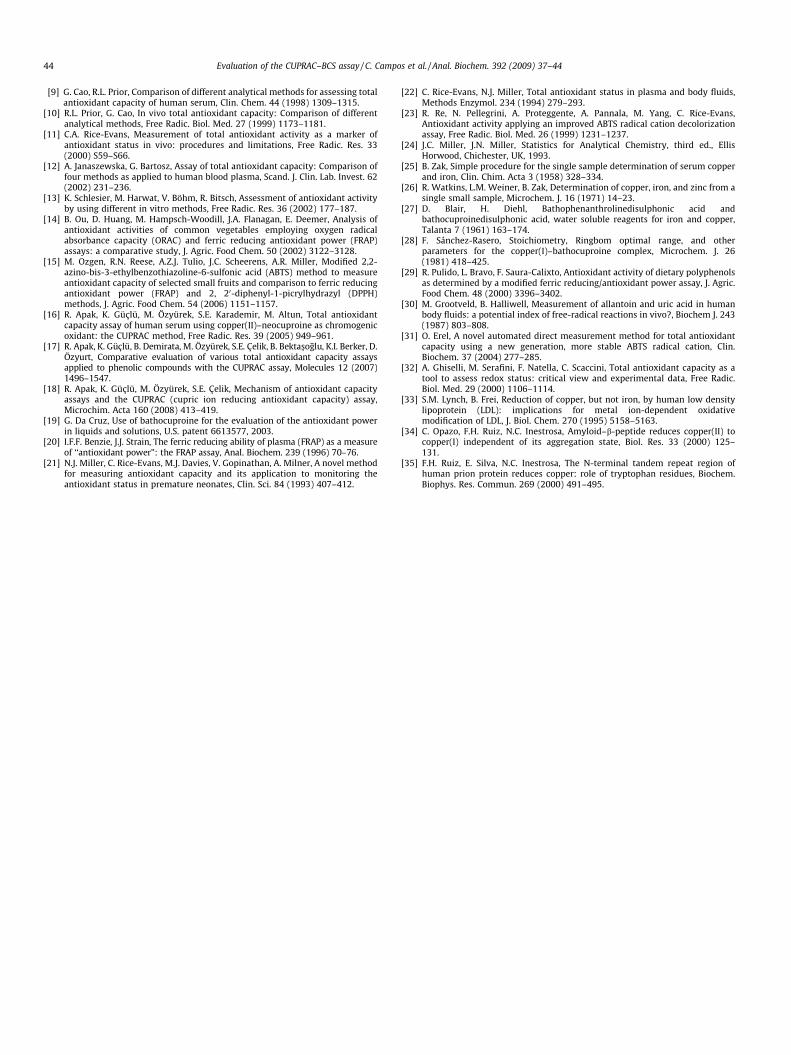
Fig. 9. Relationship between the number of phenol groups of antioxidants studied(trolox, uric acid, bilirubin, ascorbic acid, tiron, GSH, gallic acid, NAC, BHA, andalbumin) and TAC determined with CUPRAC–BCS (s, solid line), FRAP (�, dashedline), TEAC (D, dotted line), and DPPH (h, dashed and dotted line).
Evaluation of the CUPRAC–BCS assay / C. Campos et al. / Anal. Biochem. 392 (2009) 37–44 43
Individual antioxidant studiesThe relative antioxidant capacity for some important antioxi-
dants was determined with the CUPRAC–BCS, FRAP, TEAC, andDPPH assays (Table 2). When TAC values of antioxidants measuredat the same molar concentration were compared, a similar relativeantioxidant capacity was found for uric acid and ascorbic acid in allfour assays. On the other hand, the CUPRAC–BCS and FRAP assaysshowed an inability to detect the antioxidant capacity of albuminnearly within the time established in each protocol. The same oc-curred for GSH in the FRAP assay, as was also reported by severalauthors [9,16]. In contrast, the CUPRAC–BCS assay is fast enoughto oxidize GSH (Fig. 4), presenting an important advantage overthe FRAP assay.
Furthermore, a significant positive linear correlation was foundbetween the number of phenolic groups and TAC of individual anti-oxidants for the FRAP assay (r = 0.664, P < 0.05, y = 0.5332x +0.7618,) as well as for the DPPH assay (r = 0.665, P < 0.05,y = 0.2847x + 0.7557,) (Fig. 9). In contrast, no correlation was foundeither for CUPRAC–BCS (r = 0.416, P = 0.232) or for TEAC (r = 0.404,P = 0.247) (Fig. 9). However, when bilirubin is not considered inthis study, a significant linear correlation is found for CUPRAC–BCS (r = 0.882, P < 0.01, y = 0.5434x + 0.6585), and similar resultsare obtained for the rest of assays. That is, TAC increases as a func-tion of the number of phenolic groups of antioxidants for the CU-PRAC–BCS, FRAP, and DPPH assays, and it could represent animportant advantage for TAC assessment of some types of foodsor beverages in which phenolic antioxidants are abundant.
Table 2Relative antioxidant activity of individual antioxidants in CUPRAC–BCS, FRAP, TEAC,and DPPH assays.
Antioxidant Relative activity for each TAC assay
Number ofphenolic groups
CUPRAC–BCS FRAP TEAC DPPH
Uric acid 0 1.08 1.09 1.00 1.21Ascorbic acid 0 1.09 0.77 0.92 0.91GSH 0 0.64 0.03 1.13 0.79Bilirubin 0 3.23 2.27 1.69 0.01Tiron 2 1.90 1.64 1.04 1.46NAC 0 0.49 0.52 1.70 0.45Gallic acid 3 2.25 2.54 2.06 1.46BHA 1 1.21 1.43 0.93 1.26Albumin 0 0.07 0.06 0.22 1.00Trolox 1 1.00 1.00 1.00 1.00
Note: Activity is expressed as mol trolox equivalents/mol.
Conclusions
This study has reported that the CUPRAC–BCS assay is a suitablemethod to assess TAC in human plasma and urine as well as inindividual antioxidants. It is fast, simple, sensitive, linear, and pre-cise enough. The commercial AOP kit for the CUPRAC assay isexpensive; the cost per biochemical determination with the com-mercial kit is approximately 500 times higher than if reagentsare prepared at the concentrations described above. Besides, inthe commercial kit only uric acid is provided instead of trolox,and the amount of reagent supply is fixed. Although there is notmuch published about TAC assays based on the Cu(II) reduction,these methods are simple and inexpensive, do not require sophis-ticated equipment, and can be carried out with a microplate readerinvolving enough speed to constitute a good election for popula-tion studies. Moreover, only very few microliters of sample is nec-essary, and reagents are easily prepared, inexpensive, and stable at4 �C for several months and can be used without previous incuba-tion times. The CUPRAC–BCS assay is well correlated with the FRAPand TEAC assays in plasma samples and with the FRAP, TEAC, andDPPH assays in urine samples, although there is no agreement be-tween any of them given that lines of equality and regression donot match up. Therefore, several antioxidant capacity assaysshould be used jointly for TAC assessment of biological samples,especially in clinical studies.
Acknowledgments
The authors thank the Inocente–Inocente Foundation (Spain)for its funding support of this work. The authors also thank SergioGonzález for English correction of the manuscript.
References
[1] G. Scott (Ed.), Antioxidants in Science, Technology, Medicine, and Nutrition,Albion, Chichester, UK, 1997.
[2] L.K. MacDonald-Wicks, L.G. Wood, M.L. Garg, Methodology for thedetermination of biological antioxidant capacity in vitro: a review, J. Sci.Food Agric. 86 (2006) 2046–2056.
[3] G. Bartosz, Total antioxidant capacity, Adv. Clin. Chem. 37 (2003) 219–292.[4] D. Huang, B. Ou, R.L. Prior, The chemistry behind antioxidant capacity assays, J.
Agric. Food Chem. 53 (2005) 1841–1856.[5] I.P. Kaur, T. Geetha, Screening methods for antioxidants: a review, Mini Rev.
Med. Chem. 6 (2006) 305–312.[6] A. Somogyi, K. Rosta, P. Pusztai, Z. Tulassay, G. Nagy, Antioxidant
measurements, Physiol. Meas. 28 (2007) R41–R55.[7] L.M. Magalhaes, M.A. Segundo, S. Reis, J.L.F.C. Lima, Methodological aspects
about in vitro evaluation of antioxidant properties, Anal. Chim. Acta 613(2008) 1–19.
[8] A. Karadag, B. Ozcelik, S. Saner, Review of methods to determine antioxidantcapacities, Food Anal. Methods 2 (2009) 41–60.
44 Evaluation of the CUPRAC–BCS assay / C. Campos et al. / Anal. Biochem. 392 (2009) 37–44
[9] G. Cao, R.L. Prior, Comparison of different analytical methods for assessing totalantioxidant capacity of human serum, Clin. Chem. 44 (1998) 1309–1315.
[10] R.L. Prior, G. Cao, In vivo total antioxidant capacity: Comparison of differentanalytical methods, Free Radic. Biol. Med. 27 (1999) 1173–1181.
[11] C.A. Rice-Evans, Measurement of total antioxidant activity as a marker ofantioxidant status in vivo: procedures and limitations, Free Radic. Res. 33(2000) S59–S66.
[12] A. Janaszewska, G. Bartosz, Assay of total antioxidant capacity: Comparison offour methods as applied to human blood plasma, Scand. J. Clin. Lab. Invest. 62(2002) 231–236.
[13] K. Schlesier, M. Harwat, V. Böhm, R. Bitsch, Assessment of antioxidant activityby using different in vitro methods, Free Radic. Res. 36 (2002) 177–187.
[14] B. Ou, D. Huang, M. Hampsch-Woodill, J.A. Flanagan, E. Deemer, Analysis ofantioxidant activities of common vegetables employing oxygen radicalabsorbance capacity (ORAC) and ferric reducing antioxidant power (FRAP)assays: a comparative study, J. Agric. Food Chem. 50 (2002) 3122–3128.
[15] M. Ozgen, R.N. Reese, A.Z.J. Tulio, J.C. Scheerens, A.R. Miller, Modified 2,2-azino-bis-3-ethylbenzothiazoline-6-sulfonic acid (ABTS) method to measureantioxidant capacity of selected small fruits and comparison to ferric reducingantioxidant power (FRAP) and 2, 20-diphenyl-1-picrylhydrazyl (DPPH)methods, J. Agric. Food Chem. 54 (2006) 1151–1157.
[16] R. Apak, K. Güçlü, M. Özyürek, S.E. Karademir, M. Altun, Total antioxidantcapacity assay of human serum using copper(II)–neocuproine as chromogenicoxidant: the CUPRAC method, Free Radic. Res. 39 (2005) 949–961.
[17] R. Apak, K. Güçlü, B. Demirata, M. Özyürek, S.E. Çelik, B. Bektas�oglu, K.I. Berker, D.Özyurt, Comparative evaluation of various total antioxidant capacity assaysapplied to phenolic compounds with the CUPRAC assay, Molecules 12 (2007)1496–1547.
[18] R. Apak, K. Güçlü, M. Özyürek, S.E. Çelik, Mechanism of antioxidant capacityassays and the CUPRAC (cupric ion reducing antioxidant capacity) assay,Microchim. Acta 160 (2008) 413–419.
[19] G. Da Cruz, Use of bathocuproine for the evaluation of the antioxidant powerin liquids and solutions, U.S. patent 6613577, 2003.
[20] I.F.F. Benzie, J.J. Strain, The ferric reducing ability of plasma (FRAP) as a measureof ‘‘antioxidant power”: the FRAP assay, Anal. Biochem. 239 (1996) 70–76.
[21] N.J. Miller, C. Rice-Evans, M.J. Davies, V. Gopinathan, A. Milner, A novel methodfor measuring antioxidant capacity and its application to monitoring theantioxidant status in premature neonates, Clin. Sci. 84 (1993) 407–412.
[22] C. Rice-Evans, N.J. Miller, Total antioxidant status in plasma and body fluids,Methods Enzymol. 234 (1994) 279–293.
[23] R. Re, N. Pellegrini, A. Proteggente, A. Pannala, M. Yang, C. Rice-Evans,Antioxidant activity applying an improved ABTS radical cation decolorizationassay, Free Radic. Biol. Med. 26 (1999) 1231–1237.
[24] J.C. Miller, J.N. Miller, Statistics for Analytical Chemistry, third ed., EllisHorwood, Chichester, UK, 1993.
[25] B. Zak, Simple procedure for the single sample determination of serum copperand iron, Clin. Chim. Acta 3 (1958) 328–334.
[26] R. Watkins, L.M. Weiner, B. Zak, Determination of copper, iron, and zinc from asingle small sample, Microchem. J. 16 (1971) 14–23.
[27] D. Blair, H. Diehl, Bathophenanthrolinedisulphonic acid andbathocuproinedisulphonic acid, water soluble reagents for iron and copper,Talanta 7 (1961) 163–174.
[28] F. Sánchez-Rasero, Stoichiometry, Ringbom optimal range, and otherparameters for the copper(I)–bathocuproine complex, Microchem. J. 26(1981) 418–425.
[29] R. Pulido, L. Bravo, F. Saura-Calixto, Antioxidant activity of dietary polyphenolsas determined by a modified ferric reducing/antioxidant power assay, J. Agric.Food Chem. 48 (2000) 3396–3402.
[30] M. Grootveld, B. Halliwell, Measurement of allantoin and uric acid in humanbody fluids: a potential index of free-radical reactions in vivo?, Biochem J. 243(1987) 803–808.
[31] O. Erel, A novel automated direct measurement method for total antioxidantcapacity using a new generation, more stable ABTS radical cation, Clin.Biochem. 37 (2004) 277–285.
[32] A. Ghiselli, M. Serafini, F. Natella, C. Scaccini, Total antioxidant capacity as atool to assess redox status: critical view and experimental data, Free Radic.Biol. Med. 29 (2000) 1106–1114.
[33] S.M. Lynch, B. Frei, Reduction of copper, but not iron, by human low densitylipoprotein (LDL): implications for metal ion-dependent oxidativemodification of LDL, J. Biol. Chem. 270 (1995) 5158–5163.
[34] C. Opazo, F.H. Ruiz, N.C. Inestrosa, Amyloid–b-peptide reduces copper(II) tocopper(I) independent of its aggregation state, Biol. Res. 33 (2000) 125–131.
[35] F.H. Ruiz, E. Silva, N.C. Inestrosa, The N-terminal tandem repeat region ofhuman prion protein reduces copper: role of tryptophan residues, Biochem.Biophys. Res. Commun. 269 (2000) 491–495.