Embed Size (px)
Citation preview

, , , TP 77-7
Evaluation of the ComputationIt of Wave Direction with
0Three-Gage Arrays
by
Dinorah C. Esteva
TECHNICAL PAPER NO. 77-7JULY 1977
Approved for public release;
distribution unlimited
_U.S. ARMY, CORPS OF ENGINEERS
;-COASTAL ENGINEERINGRESEARCH CENTER D D C
Kingman Building
Fort Belvoir, Va. 22060 SEP 14 1377
Li'L i%£TB

Reprint or republication of any of this material shall give appropriatecredit-to the U.S. Army Coastal Engineering Research Center.
Limited free distribution within the United States of single copies ofthis publication has been made by this Center. Additional copies areavailable from:
National Technical Information ServiceATTN: Operations Division5285 Port Royal RoadSpringfield, Virginia 22151
Contents of this report are not to be used for advertising,publication, or promotional purposes. Citation of trade names does notconstitute an official endorsement or approval of the use of suchcommercial products.
The findings in this report are not to be construed as an officialDepartment of the Army position unless so designated b% otherauthorized documents.

UNCI.ASSLI 11 1HSECURITY CLASSIFICATION OF THIS PAGE (When Dae Entered)
REPOT DCUMNTATON AGEREAD INSTRUCTIONSREPOT DCUMNTATON AGEBEFORE COMPLETING FORM
1. REPORT NUMBER ----- ~ OVT ACCESSION No. 3-,ECIPIENT'S CATALOG NUMBER
4.. TIT LE&&S-1111~ 6) 5.PO REP RTAI G2D COVEREDK EVALUATION OF THlE COMPU'\TION OF WAVE DIRECTION /1Technical Paper,Wivu TI i EE-GG,T ARRAYS -.- *- I-
- ------------- - 6. PERFORMING ORG. REPORT NUMBER
_.AU"THOR(.) S. CONTRACT OR GRANT NUMBER(.)
/ ior~ C./Esteva
9. PERFORMING ORGANIZATION NAME AND ADDRESS I0. PROGRAM ELEMENT PROJECT, TASK
Depatmen ofthe rmyAREA & WORK UNIT NUMBERS
Coastal Engineering Research Center (CERRE-CO) A31462Kingman Building, Fort Belvoir, Virginia 22060 ______________
1 1. CONTROLLING OFFICE NAME AND ADDRESS 12. R!EPORT DATE
Department of the Army Juit 677Coastal Engineering Research Center 13. NUMBER OF PAGES
Kingman Building, Fort Belvoir, Virginia 22060 1234 MONITORING AGENCY NAME & ADDRESS(if different from Controlling Office) IS. SECURITY CLASS. (of this report)
UNC LASSIFI 1ED
15S. OECLASSI FICATION/ DOWNGRADINGSCHEDULE
16. DISTRIBUTION STATEMENT (of tisl Report) 7 ,-
Approved for public release, distrihbution unlimited. . .-
f7. DISTRIBUTION STATEMENT (o1 file abe tract onferedh, 51Sock 20, It d.Ifeae,,t fr.om Report)
LUS L
18. SUPPLEMENTARY NOTES
19. KEY WORDS (Coninu~e on~ reverse side if necessay and identify by block number)
Pt. Mugu, California Wave measurementThiree-gage arrays Wave trainWave direction Waves
20. AvSTRACT CCOtie on ~reeo afib ff md Id~Iefy by block numbe)A description of the col ection and analyses of data obtained with an
array of five pressure sensors near Pt. Mugu, California, is presented. The10 three-gage arrays possible with five gages are used to compare redundantvalues of the direction of wave propagation. The dependence of directionaldetermination on array orientation relative to incident wave direction andwavelength at the array site is shown by calculations based on simulatednarrow-banded wave trains, Directional results from the field study indicate
(continued)
WD OA w7 1473 EDITION OF INOV 65IS OBSOLETE UNCLASSIFIED
SECUPIYV CLASSIFICATION OF THIS PAGE (When Do#. Entlered)
- x/1
SECURITY CLASSIFICATION OF THIS PAGE(Wben Date Entered)
the maximum accuracy of wave direction determinations with a three-gape array
is on the order ofj*2O0 . This level of accuracy may be expected only for
narrow-banded wave trains with periods longer than a lower limit determined
at each location by array dimensions and water depth. The field study also
indicates narrow-banded wave trains are frequent at this coastal location.
A CC FSSi
NTIS
2 UNCLASSIFIED
SECURITY CLASSIFICATION OF THIS PAGE('17-. Data Emted)
'-%Z
PREFACE
This report is published to provide guidance to coastal engineers inplanning wave data collection in coastal waters for climatology purposes,including wave direction. The popularity of three-gage arrays for pro-posed wave direction measuring systems makes it necessary to evaluatethe capabilities and the limitations of these arrays. The availabilityof the CERC five-gage array at Pt. Mugu, California, provided a uniqueopportunity for evaluating the performance of wave recording systems andthe directional capabilities of three-gage arrays. The work was carriedout under the wave measurement and analyses program of the U.S. ArmyCoastal Engineering Research Center (CERC).
This report was prepared by Dr. Dinorah C. Esteva under the super-vision of Dr. D. Lee Harris, Chief, Coastal Oceanography Branch, ResearchDivision. The author acknowledges the valuable insight and comments pro-vided by Dr. D. Lee Harris and Mr. R. P. Savage, Chief, Research Division,CERC.
Comments on this publication are invited.
Approved for publication in accordance with Public Law 166, 79thCongress, approved 31 July 1945, as supplemented by Public Law 172,88th Congress, approved 7 November 1963.
//JOHN HI. COUSINSY Colonel, Corps of Engineers
Commander and Director

CONTENTS
PageCONVERSION FACTORS, U.S. CUSTOMARY TO METRIC (SI) . . .. 6
I INTRODUCTION ............. .................... 171. The System. .. ................. ... 102. Data Collection ......... ................... 14
II FIELD DATA ANALYSIS ......... ................... 141. Computation of Wave Direction .... ............ 182. Simulated Data Analysis .... ............... .... 203. Identification of Wave Trains from the High-
Resolution Spectrum. ...... ................ ... 284. Spectra and Direction of Wave Propagation for
Field Data ....... ..................... .... 28S. Conclusions ....... ..................... .... 31
LITERATURE CITED. . . .. . . ..................... .... 32
APPENDIXA DERIVATION OF TH1E EXPRESSION FOR WAVE DIRECTION ..... 35
B COMPUTER OUTPUT FOR CROSS-SPECTRA COMPUTATIONS ...... ... 36
C FOURIER COEFFICIENTS FOR A MIXTURE OF THRiE SINUSOIDS 48
D SPECTRA PLOTS AND COMPUTER OUTPUT FOR SIM1U',ATI-DOBSERVATIONS ......... ....................... . 54
E HIGII-RESOLUTION SPECTRA FOR FIELD WAVE DATA ....... .. 79
TABLESI Percent of observations where the largest departure of the
standard deviations from the mean in the observations wasas indicated (871 observations in 1970) .... ............ ... 16
2 Directional results with 0.01 hertz resolution for two
observations .......... ......................... ... 21
3 Characteristics of simulated wave trains .... ............ ... 24
4 Computational results at closest spectral frequencies forsimulated wave trains .......... ..................... 26
5 Directional results of high-resolution spectral computationsfor 8-second wave ......... ....................... . 27
6 Average spread in computed directions for 280 wave trainsidentified in the high-resoluti "i spectra of 44 field waveobservations .......... ......................... ... 30
4
- C..
CONTENTS-- Continued
FI GURESPage
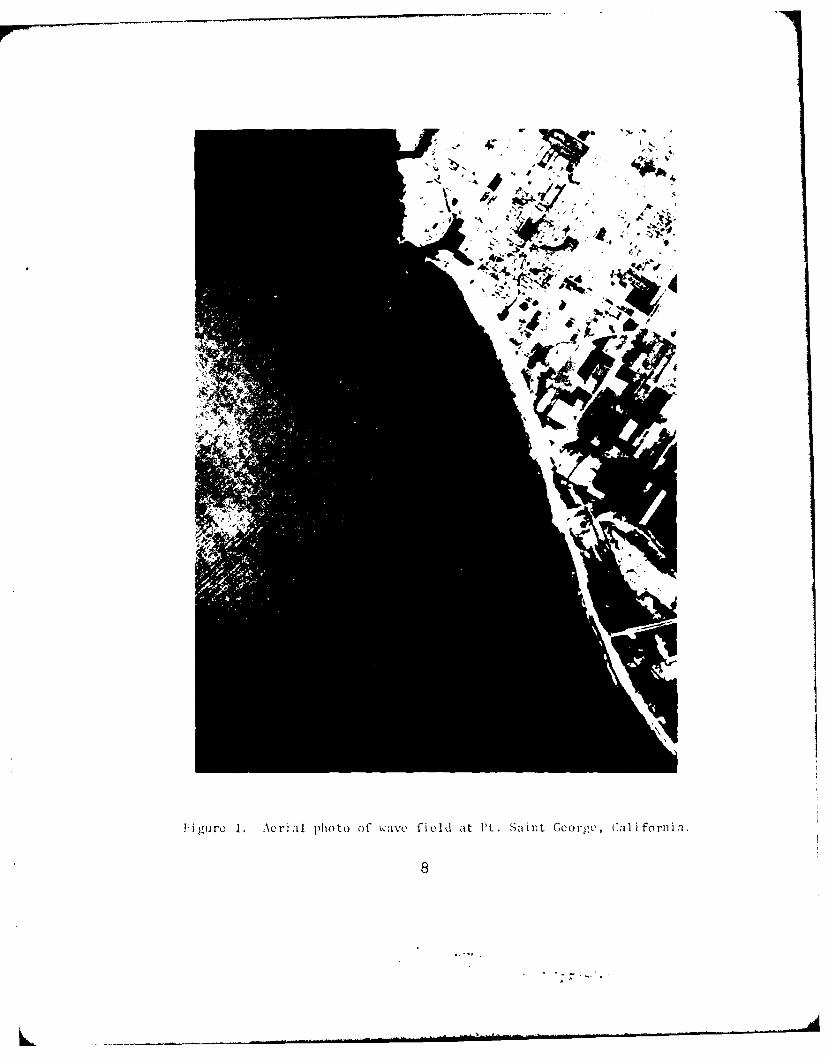
1 Aerial photo of wave field at Pt. Saint George, California. . 8
2 Radar scan of wave field at Nauset, Massachusetts ... ....... 9
3 Five-gage array dimensions and geometry .... ............ . I. 11
4 Location of the five-gage array ...... ................ ... 12
5 Schematics of transducer assembly ..... ............... ... 13
6 Tripod mounting for pressure sensors ....... .............. 15
7 Summarized pressure and surface spectra .... ............ ... 17
8 Long-crested wave propagating in direction aA .. ......... ... 19
5,°•. €
o , "

CONVERSION FACTORS, U.S. CUSTOMARY TO METRIC (SI)UNITS OF MEASUREMENT
U.S. customary units of measurement used in this report can be convertedto metric (SI) units as follows:
Multiply by To obtain
inches 25.4 millimeters2.54 centimeters
square inches 6.452 square centimeterscubic inches 16.39 cubic centimeters
feet 30.39 centimeters0.3048 meters
square feet 0.0929 square meterscubic feet 0.0283 cubic meters
yards 0.9144 meterssquare yards 0.836 square meterscubic yards 0.7646 cubic meters
miles 1.6093 kilometers
square miles 259.0 hectares
knots 1.8532 kilometers per hour
acres 0.4047 hectares
foot-pounds 1.3558 newton meters
millibars 1.0197 10 - 3 kilograms per square centimeter
ounces 28.35 grams
pounds 453.6 grams0.4536 kilograms
ton, long 1.0160 metric tons
ton, short 0.9072 metric tons
degrees (angle) 0.1745 radians
Fahrenheit degrees 5/9 Celsius degrees or Kelvins1
T-'o ob tain Celsius (C) temperature readings from Fahrenheit (F) readings,use formula: C = (5/9) (F -32).
To obtain Kelvin (K) readings, use formula: K = (5/9) (F -32) + 273.15.
6
................ .... - ,-,

EVALUATION OF THE COMPUTATION OF WAVE DIRECTION WITH THREE-GAGE ARRAYS
byDinorah C. Esteva
I. INTRODUCTION
Wave direction is an important parameter in the solution of manycoastal engineering problems. A knowledge of wave direction is essen-tial for (a) estimating the direction and magnitude of sediment trans-port by waves, (b) using refraction calculations to infer wave conditionsat one site from measurements made elsewhere, and (c) verifying theoriesof wave generation.
Visual observations of wave directions have been collected by ship-board observers for over a century. About 20 years ago the Beach Ero-sion Board (BEB), predecessor to the Coastal Engineering Research Center(CERC), engaged the assistance of U.S. Coast Guard installations in thecoliection of visual observations of breaker direction from shore. How-ever, objective determinations of wave direction are desirable withoutbeing restricted to location, time of day, or visibility condition. Thecapability to do so involves the use of wave measuring instruments.Panicker (1971, 1974) presents extensive reviews of reports dealing withthe determination of wave direction from instrument records with partic-ular ei.iphasis on those involving sea-surface elevation or pressure records.
In March 1970, CERC installed an array of wave gages at Pt. Mugu,California. Records from the array were to be used to compare redundantvalues of wave direction and to estimate the level of accuracy of thecomputations. The available procedures for determining wave directionfrom an array involved assumptions that had not been thoroughly estab-lished. Thus, the records from the array would also be used in a syste-matic examination of these assumptions, and of the reliability of wavegages.
This study discusses the array performance and the information gainedabout wave direction. Redundant values of directions were obtained fromthe 10 three-gage arrays possible with five gages. The mathematical modelused assumes that the sea surface is the result of the superposition ofa small number of narrow-banded wave trains consisting of long-crestedwaves traveling in well-defined directions. It was also assumed thatonly one wave train is present with a particular period. The firstassumption is supported by the energy spectra computed at CERC (Thompson,1974), by aerial photos of the sea surface (Fig. 1), and by radar imagesof the wave field (Fig. 2). Many published reports include photos similarto that in Figure 1; e.g., McClenan and Harris (1975). Fujinawa (1974,1975) conjectured that narrow directional spread might be responsiblefor the incomplete recovery of the true directional spectrum from fieldrecords in his computations using high directional resolution.
Average values of wave direction for bands of constant frequencywidth were computed from cross-spectra between gage pairs. Direction
7
• - - .' -, .
4b 4
41P4
Fi gure 1. Acri al photo of wav field at Pt. Saint George~, Cal iforni a.

Figure 2. Radar scan of wave field at Nausct, Mlassachusetts.
97

estimates for all bands 0.01l heri wide between approximately 30 ain! 3second were ohtained for the 10 erays. The results dis pl ced discrep-ancies of the order of 200 for those hands with central peri od- above 10seconds and of 180' for those with shorter central periods. It had beenexpected that the array would yield direction to better than 200 and forperiods between 25 and 7 seconds.
To isolate problems associated with the cal-ulations, the propagationof narrow-banded wave trains across the array was simulated in a computer.Tle computatonal model was applied to the simulated observations usingthe maximum f7,quency resolution available from spectral computationsbased on 20-minute records. It was found that the directional resultsobtained with this model are highly dependent on the spectral width,both in frequency and direction, of the wave train involved and on therelationship between iavelength at the site and gage separations. Theassigned directions were recovered within 10 for 16-second waves when thefrequencies of the spectral components in the wave train differed by 0.1'0.3hertz or more, and the directionus were spread within a 5' arc. This fre-quency separation results in a minimum difference in periods of 0.7 secondfor waves with periods near 16 seconds.
Application of the same analyses to field wave pressure records withstandard deviations above 0.61 meter (2 feet) resulted in an average dis-crepancy of 200 among computed directions for narrow-banded wave trainswith periods longer than 10 seconds. Larger discrepancies resulted forshorter periods. Thus, accuracies no better than 200 can be expected forwave directions resulting from three-gage arrays.
1. The System.
A minimum of three gages is required for a unique determination ofwave direction by most proposed models. Since these models make a fewassumptions about the nature of ocean waves which have not been estab-l ished, some redundance was thought to be necessary which would requirea minimum of four gages. However, it was agreed that a five-gage arraywould increase the probability of redundance in the ocean environment.An array was. designed at CERC by Leon E. Boroman , statistic
wails o:, sa;)hatical leave from the onigers tv of Caliyornia, k ,i t,when t noe experient ns .eing planned. 1 investigated the trs -0
reolig power of , everal array gc, metries and concluded that the p:it-ternl shown in F:igure -) ,ould he the most suitable for the conditions tohe expected at Pt. Nlui:ii (Btort.man iind P':iicker, 1970) .
Flhe array t,:is installed off Pt. Mugu, approximately 80.47 kilometer,(50 miles) north %(st of 1.0s Angeloes /Fig. 1), ill abtout: 9. I'l meOtoers 30
feet) of water, ). 70 meter (2.5 feet) from the bottom. T'hc gages in thi.arry ire pressure transducers developed mostly at CRC (Williams, 1nO)
The heart of the system is a Fai rchi Id ressutre transducer which is pott.dins ide a 2-inch Plexi g la1 tubc (Ii g. 5) (Peacock, 1974). A plastic tllubefilled with s ilicone oil transmits the pressure from the seawater to thepressure transducer. 'lhc silicone o il i s separated from sawanter by
10

CC)
F i. F Ii e- oage airray' dimens ions and geomletry-.

0 101 0
00
OD -
0
a, LL a
0 <
a.L
o 1
cnl
00
12

V)
0
oc
00C
P,~~~
-_I -wl
LL 0a,
wC
0.
13
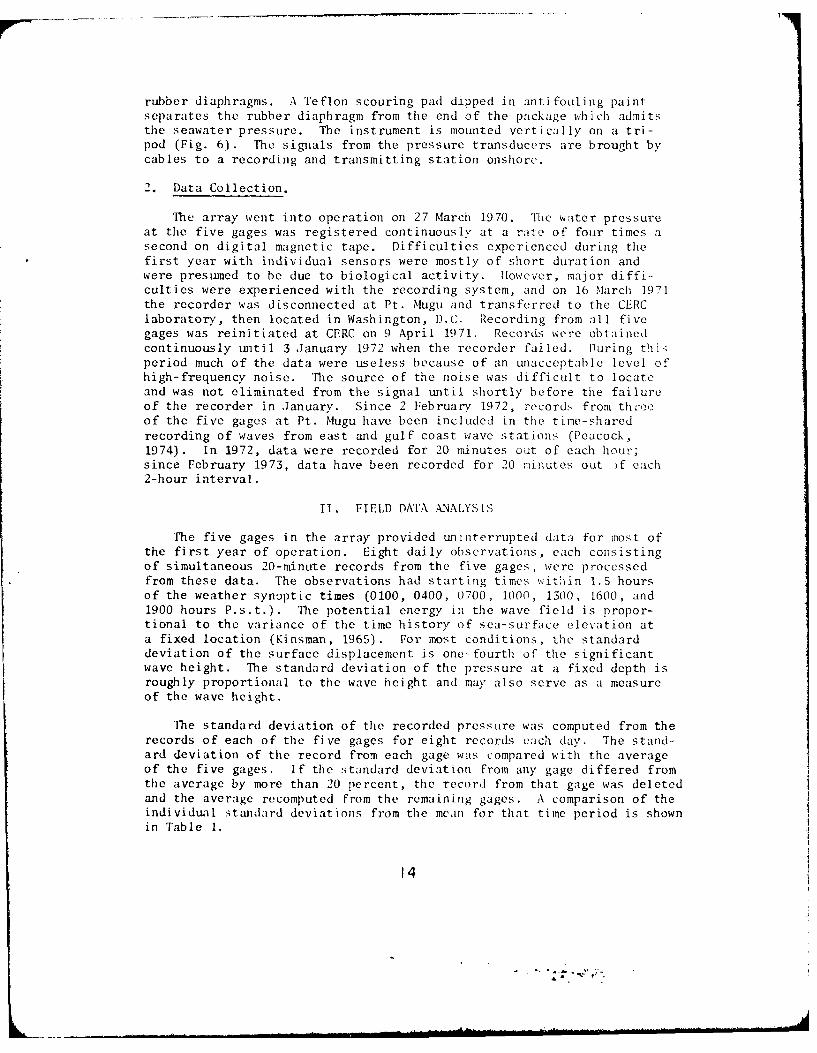
rubber diaphragms. A Teflon scouring pad dipped in anti fotling paintseparates the rubber diaphragm from the end of the package which admitsthe seawater pressure. The instrument is mounted vertically on a tri-pod (Fig. 6). The signals from the pressure transducers are brought bycables to a recording and transmitting station onshore.
2. Data Collection.
The array went into operation on 27 March 1970. The water pressureat the five gages was registered continuously at a raite of four times asecond on digital magnetic tape. Difficulties experienced during thefirst year with individual sensors were mostly of short duration andwere presumed to be due to biological activity. However, major diffi-culties were experienced with the recording system, and on 16 March 1971the recorder was disconnected at Pt. Mugu and transferred to the CERClaboratory, then located in Washington, D.C. Recording from all fivegages was reinitiated at CERC on 9 April 1971. Records were obtainedcontinuously until 3 January 1972 when the recorder failed. During thisperiod much of the data were useless because of an unacceptable level ofhigh-frequency noise. The source of the noise was difficult to locateand was not eliminated from the signal until shortly before the failureof the recorder in January. Since 2 February 1972, records from threeof the five gages at Pt. Mugu have been included in the time-sharedrecording of waves from east and gulf coast wave stations (Peacock,1974). In 1972, data were recorded for 20 minutes out of each hour;since February 1973, data have been recorded for 20 minutes out )f each2-hour interval.
11. FIELD DATA ANALYSIS
The five gages in the array provided uninterrupted data for most ofthe first year of operation. Eight daily observations, each consistingof simultaneous 20-minute records from the five gages, were processedfrom these data. The observations had starting times within 1.5 hoursof the weather synoptic times (0100, 0400, 0700, 1000, 1300, 1600, and1900 hours P.s.t.). The potential energy in the wave field is propor-tional to the variance of the time history of sea-surface elevation ata fixed location (Kinsman, 1965). For most conditions, the standarddeviation of the surface displacement is one-fourth of the significantwave height. The standard deviation of the pressure at a fixed depth isroughly proportional to the wave height and may also serve as a measureof the wave height.
The standard deviation of the recorded pressure was computed from therecords of each of the five gages for eight records each day. The stand-ard deviation of the record from each gage was compared with the averageof the five gages. If the standard deviation from any gage differed fromthe average by more than 20 percent, the record from that gage was deletedand the average recomputed from the remaining gages. A comparison of theindividual standard deviations from the mean for that time period is shownin Table 1.
14

C
C
C..)
If Va~1
'-4LI~
15

'Fable 1. Percent of observations where the largestdeparture of the standard deviations fromthe mean in the observations was as indi-cated (871 observations in 1970).
Deviation from mean (pct) Percent of Observations
< 2 41
3 to 10 52
11 to 20 1
> 20 6
This comparison indicates the system operated consistently. Thefield wave records used for wave direction computation (discussed later)were chosen from the observations in Table 1, for which the standarddeviations from all gages differed by 3 percent or less from their meanand for which the average significant wave height (uncompensated forattenuation with depth) was above 0.61 meter.
Fourier analysis provides a reliable procedure for obtaining theperiods of the most important waves. A Fourier analysis of sea-surfaceelevation (or pressure) with time results in the distribution of energywith frequency, usually referred to as the energy spectrum. The cnergyspectrum for the record from gage 5 in each of the eight daily observa-tions was computed using the Fast Fourier Transform algorithm developedby Cooley and Tukey (1967). The first 1,024 seconds of the 20-minuterecord was used in this computation. Gage 5 was chosen because of agood history of performance.
Fast Fourier Transform computations yield the contribution to thevariance at each of a set of frequencies which are harmonics of a funda-mental given by the inverse of the record duration, T. In this study,'he frequencies of these harmonics are referred to as spectral freauencies,md the corresponding periods, given by their inverse, as spectral periods.'he energy content between 32 seconds and 3 seconds was used to normalize:he spectrum. The lower limit on period was estimated from the thickness)f the water column above the pressure sensors. A summarized spectrumFig. 7) was formed by combining the energy content in 11 adjacent spec-ral periods. The band width in the summarized spectrum was slightlyarger than 10- 2 hertz (0.0107 hertz). The energy appearing at eachpectral period in the pressure spectrum was compensated for attenuationith depth by using the classical hydrodynamic pressure correction:
F(kh) = cosh khcosh kAz (1)
here k is the wave number, h the water depth, and Az the verticalistance of sensor from bottom. This resulted in a surface or compensated
16

30.0 10.0 5.0 4.5 (S)
35
30 Pressure Spectrum
Surface Spectrum
25
~3 20
a- 15
10'
5I
0
F ig r 7. /um r z d p e s r 111S T'C
I / 17

spectrum. Surface root-mean-square (rns) values were obtained from thecompensated energy at each spectral period.
Since 1972, four simultaneous 20-minute records from each of the
three gages included in the time-sha red recording sequence :1re procc-' ed
daily. More records are processed during special studies. The records
processed from gages 1, 2, and 5 of the Pt. Mugu ,rray stuart about 010),0700, 1300, and 1900 hours (P.s.t.). The significant wave height, thedistribution function, the first five moments of the distribution, and
the pressure spectra are computed for these records in a study of wave
record variability. These records are not analyzed for wave direction.
1. Computation of Wave Direction.
For a long-crested sinusoidal wave with frequency :,,, propagating
in direction mt (Fig. 8), the phase difference between locations I and
2 with coordinates (xl,yl) and (x?,y 2 ) respectively, is given by:
D12 = krl[(x1 - x 2 ) coS ct + (Y - Y 2 ) Sin ] , (2)
where k = 27/L; is the wave number associated with frequency o7,
and L~, is the wavelength. The subscript is used to indicate thepossible presence of different wave trains with different frequenciesand directions.
The addition of the wave profile, n 3 , at a third noncolinear loca-
tion allows solving for the sine and cosine of a. Thus, a unique solu-
tion for the wave direction is obtained from the following equation when
the signs of numerator and denominator are considered. (see App. A.):
X = tan- 1 R l - 3 (YI- Y3) '1 2] /D (3)
where $13 is the phase difference between the third and first locations,
and D is a function of gage separation.
Phase differences between locations for each different wave periodare the only unknowns in the right-hand side of equation (3). Estimates
of a representative phase difference between gage pairs for bands of
constant frequency width are easily computed from cross-spectra of thewave (pressure) records. These spectra give, for each band, average
values of the covariance of the wave records along two perpendicular
directions.
Substitution of these representative values of phase difference into
equation (3) affords an expedient and economic means of obtaining esti-
mates of a "representative" wave direction for each of the spectral
bands, provided the results are of engineering use. The agreement among
18

Figure S. Long-crested wave propagating in direction tl
19
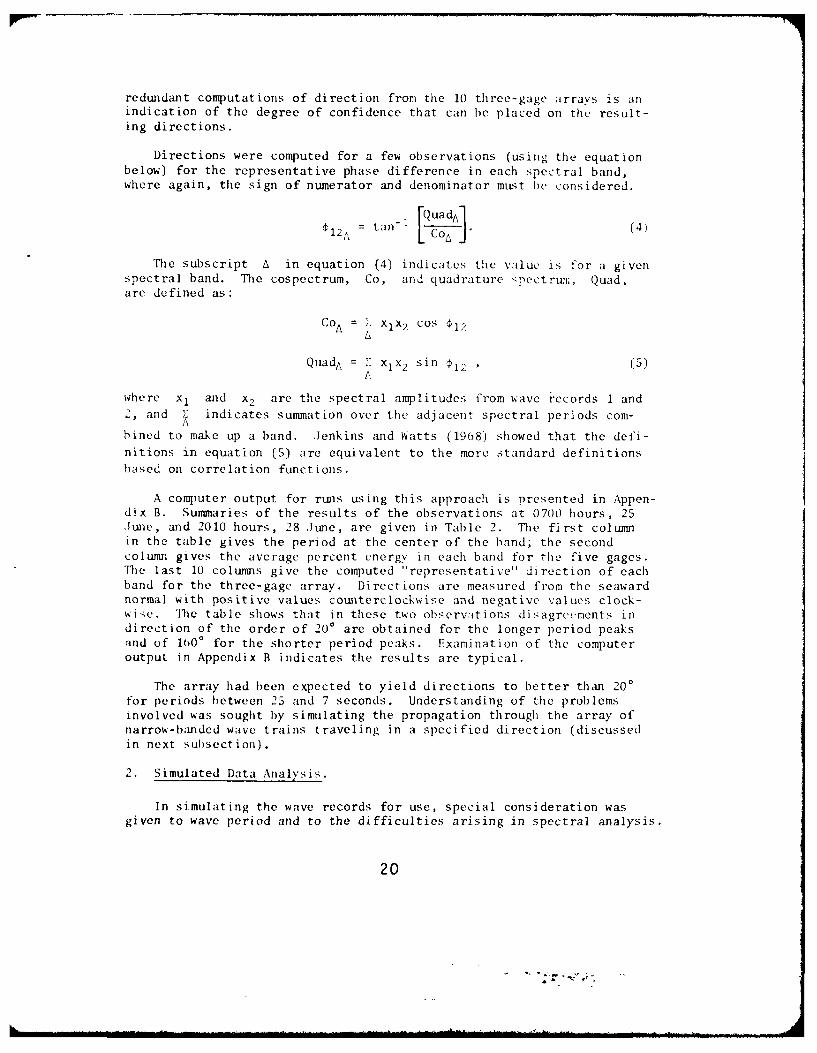
redundant computations of direction from the 10 three-gage arrays is anindication of the degree of confidence that can be placed on the result-ing directions.
Directions were computed for a few observations (using the equationbelow) for the representative phase difference in each spectral band,where again, the sign of numerator and denominator must be considered.
12A= tan-I QuadA] (4)L j"
The subscript A in equation (4) indicates the value is for a givenspectral band. The cospectrum, Co, and quadrature spectrum, Quad,are defined as:
CoA = . Xlx2 cos l2A
QtLad = X XlX2 sin '12 (5)A
where x, and x2 are the spectral amplitudes from wave records 1 and2, and I indicates summation over the adjacent spectral periods com-
Ahined to make up a band. Jenkins and Watts (1968) showed that the defi-
nitions in equation (S) are equivalent to the more standard definitionsbased on correlation functions.
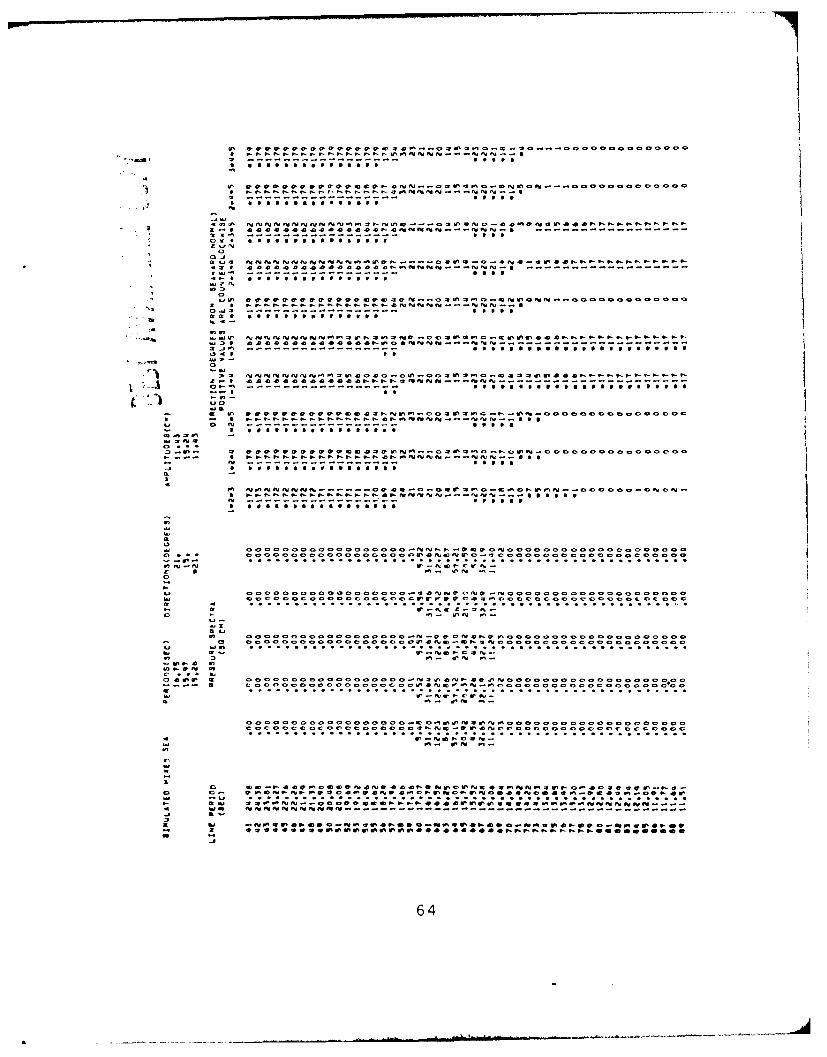
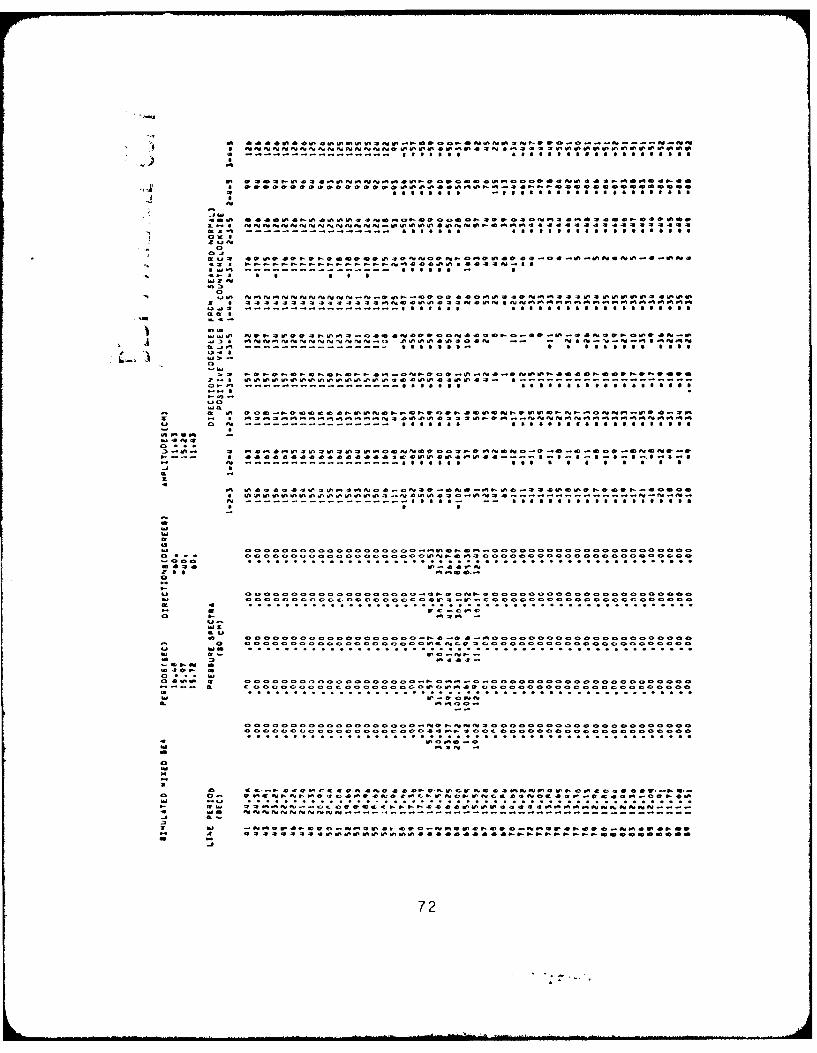
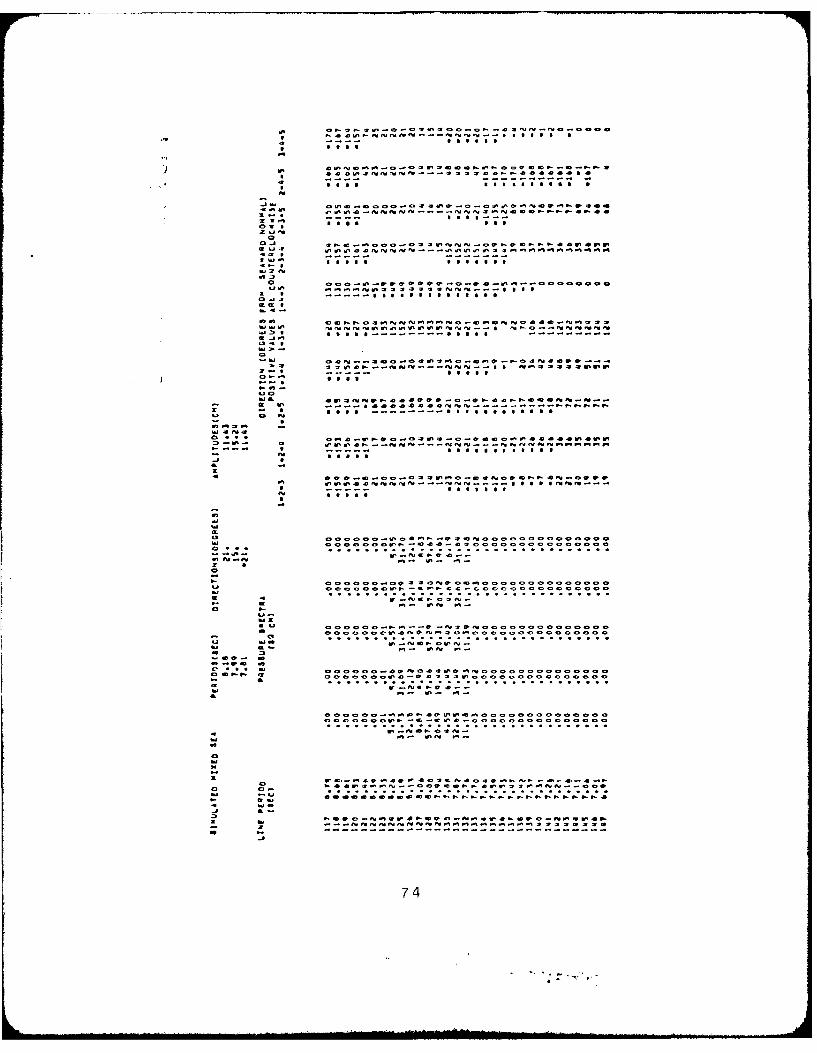
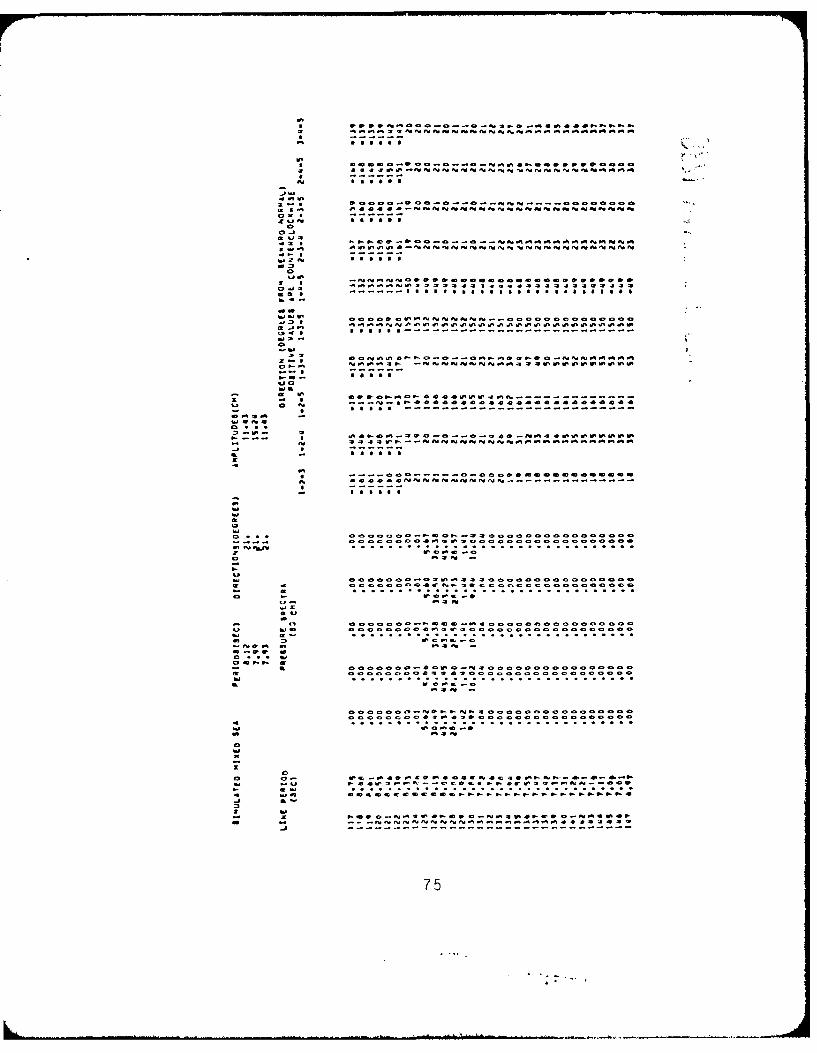
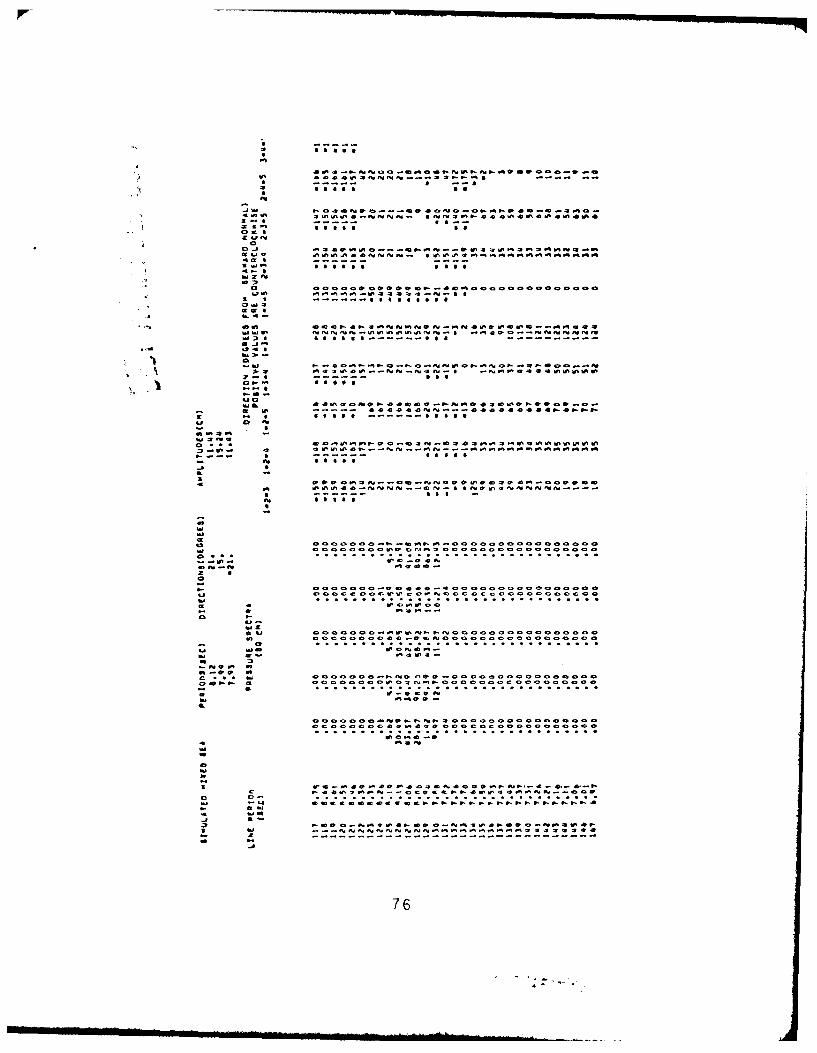
A computer output for runs using this approach is presented in Appen-dix B. Summaries of the results of the observations at 0700 hours, 25June, and 2010 hours, 28 June, are given in Table 2. The first columnin the table gives the period at the center of the band; the secondcolumn gives the average percent energy in each band for the five gages.Tle last 10 columns give the computed "representative" direction of eachband for the three-gage array. Directions are measured from the seawardnormal with positive values counterclockwise and negative values clock-wise. The table shows that in these two observations disagreements indirection of the order of 200 are obtained for the longer period peaksand of 100 for the shorter period peaks. Examination of the computeroutput in Appendix B indicates the results are typical.
The array had been expected to yield directions to better than 200for periods between 25 and 7 seconds. Understanding of the problemsinvolved was sought by simulating the propagation through the array ofnarrow-banded wave trains traveling in a specified direction (discussedin next subsection).
2. Simulated Data Analysis.
In simulating the wave records for use, special consideration wasgiven to wave period and to the difficulties arising in spectral analysis.
20

Table 2. Directional results with 0.01 hertz resolution for two obscrvations.
Period at Avg. pct ____________ Three-gage arrays
center of g 13-11--51--band 1-2-3 1-2-4 1-2-5 1-3-4 1-3-5 1-4-5 2-3-4 2-3-5 245 3-4-5
25 J Une 1970 at 0700 hr
5.99 2.32 173 44 156 50 -42 - 46 -145 --131 147 -39
6.40 0.46 173 32 157 -44 -44 --44 147 -135 153 -30
0.87 0.56 -64 -23 45 33 43 39 --149 - 136 166 -18
7.42 1.08 167 56 150 -35 --50 -42 - 150 24 46 -20
8.00 0.75 133 33 162 3 155 49 8 -5 0
8.83 1.51 -20 -12 -9 -19 - 18 0 5 2 -1 0
9.75 2.01 2 3 2 5 1 13 10 12 16 18
10.89 4.04 5 4 4 4 -2 16 -- 1 2 8 11
12.34 9.13 21 19 16 16 7 27 14 14 20 21
14.22 27.19 33 30 26 29 16 40 31 28 32 34
10.79 42.92 29 25 22 21 10 33 20 25 27 28
2o.48 1.23 --1 -1 0 0 -8 31 26 25 27 28
26.26 0.24 74 119 121 117 131 120 178 144 109 135
28 June 1970 at 2010 hr
5.99 7.44 169 52 136 -38 -31 --28 -148 -136 -155 -23
6.40 10.85 --47 -38 -33 --40 -34 --33 -148 -- 138 -157 -25
6.87 16.56 - 40 -34 29 --36 --30 --27 -151 - 22 46 --21
7.42 9.75 40 --33 --29 35 -30 -27 -152 -20 48 -20
8.0 19.61 40 -33 29 -36 --30 27 - 152 --22 49 -21
8.83 7.65 37 - 29 -24 -32 -27 -20 -18 -15 -14 -14
9.75 0.96 -- 16 --15 -12 -- 16 -16 --2 --3 -3 -4 0
10.89 1.10 0 0 0 1 -7 25 -3 8 21 24
12.34 2.34 23 13 11 5 -4 26 14 14 14 14
14.22 4.46 12 12 10 12 4 24 8 10 16 18
16.79 1.61 19 14 12 9 0 28 15 15 21 21
20.48 1.00 108 46 40 25 2 52 40 49 43 34
26.26 0.70 -91 -89 -75 -89 -67 -95 -92 -66 -56 -72
21
9t C -
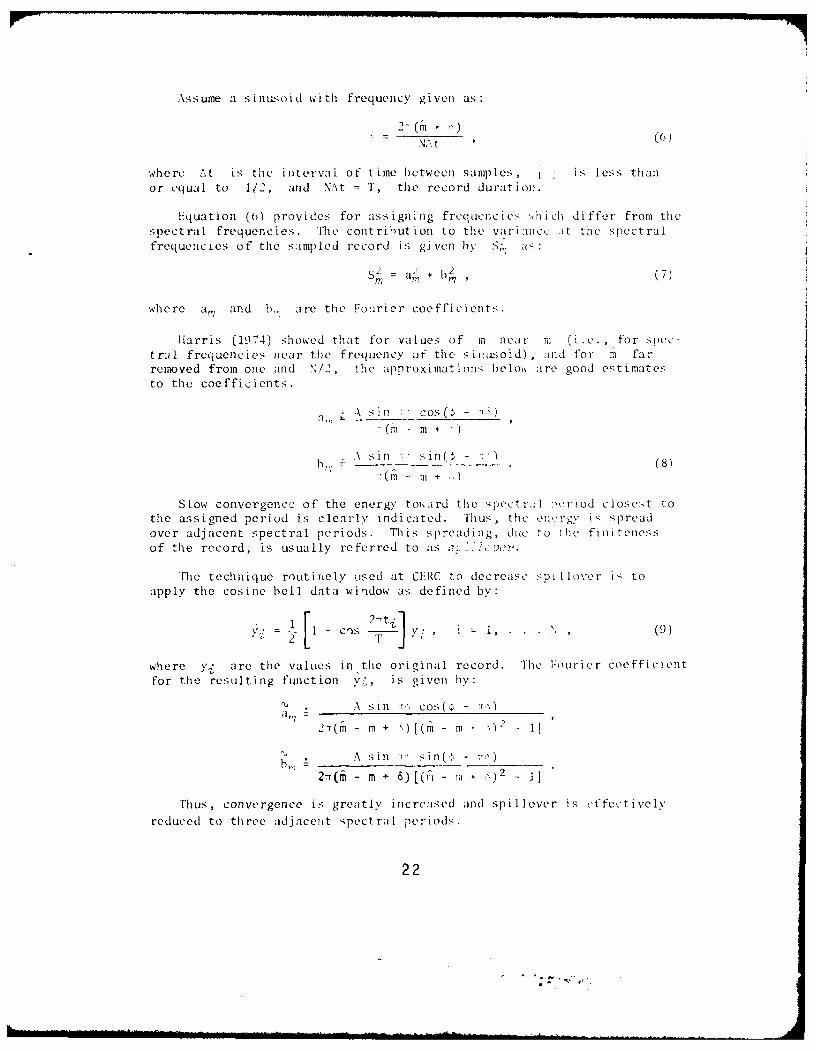
As sume a s inuLs o id w ith f req ue ncy g ivenl as:
NA t ()
where A t is the interval of t ine between samples, isless thanor equal1 to 112, a-nd NA t = , the record durat ion.
Equation (0) provides for ass igning fre(uenC liCS s i ch di ffer' from theSpectral frequencies. Thie contribution to the vairiaii1c(2 it the spectralfrequencies of the sampled record is given be 'S" as
M= a2 , 1) 2(7
where a. and b, are the Fourier Coefficients.
Harris (1974) showed that for values, of m nca r I; ( i .o , for spec-tral frequencies near the frequency of the s iiiusoid) i nd for inl fa r
removed from one and N1/2 , the approximat i ons below,% are good estimates,to the coefficients;.
*A sin Cos('- -T
\Sinll sill(t - T 8
-(a - in +
Slow convergencc of the energy toi~ard the -;poctrail :,orjod closes.-t tothe assigned period is clearly indi cated. Thus , the enorgy iz spreadover adj acent spectral periods. Tb is spreading, due, to *he finiitenessof the record, is usually referred to as
Trhe technique routiniely used at CFRC to decrease spilIlover is toapply the cosine hell data window as defined by:
CO c -is , t~ , i =I, .. N ,(9)
where yj are the values in the original record. The I-ourier coefficientfor the resu~ltinlg functio yjI -*, is given by :
A sin 11 T cos(
2 -T (m - m + (m~r - InII- I
A sinll sin(:.-2- Ii-m +&) m n+j I],
Thus, convergence is greatly increajsed aind spil lover is effect ively
reduced to three :idj aceiit spectral periods.
22

*Ipplie cd to tile s i mul ate d records
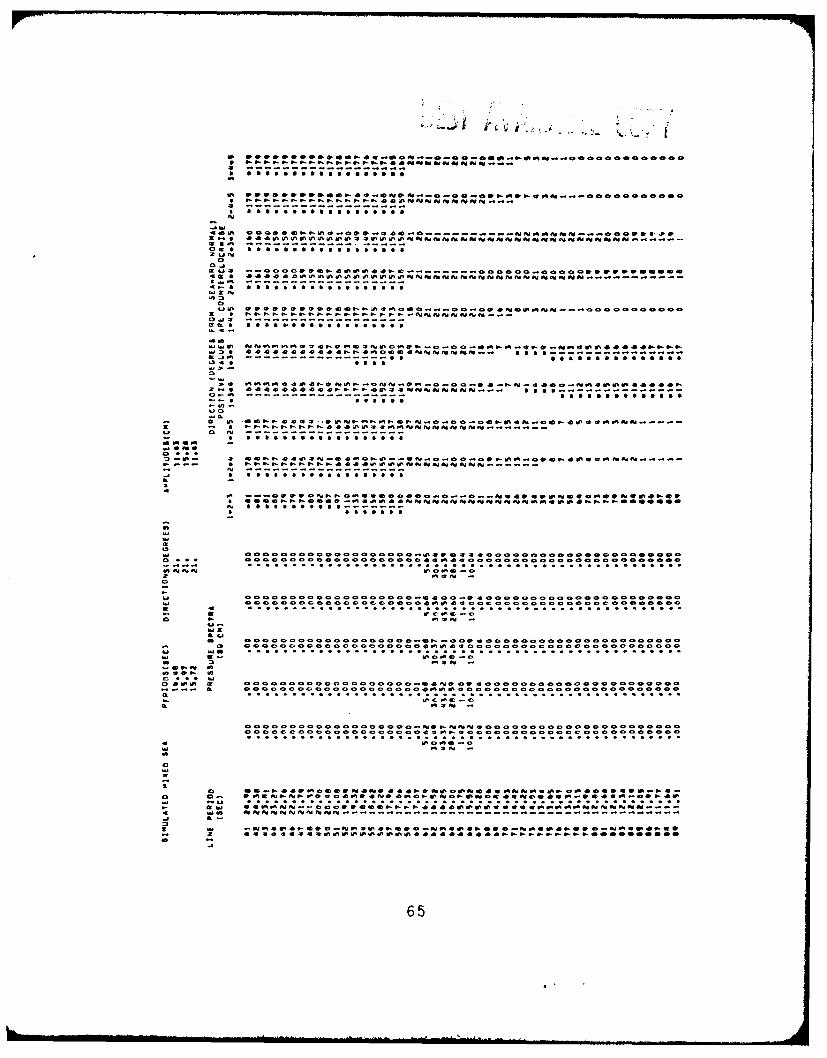
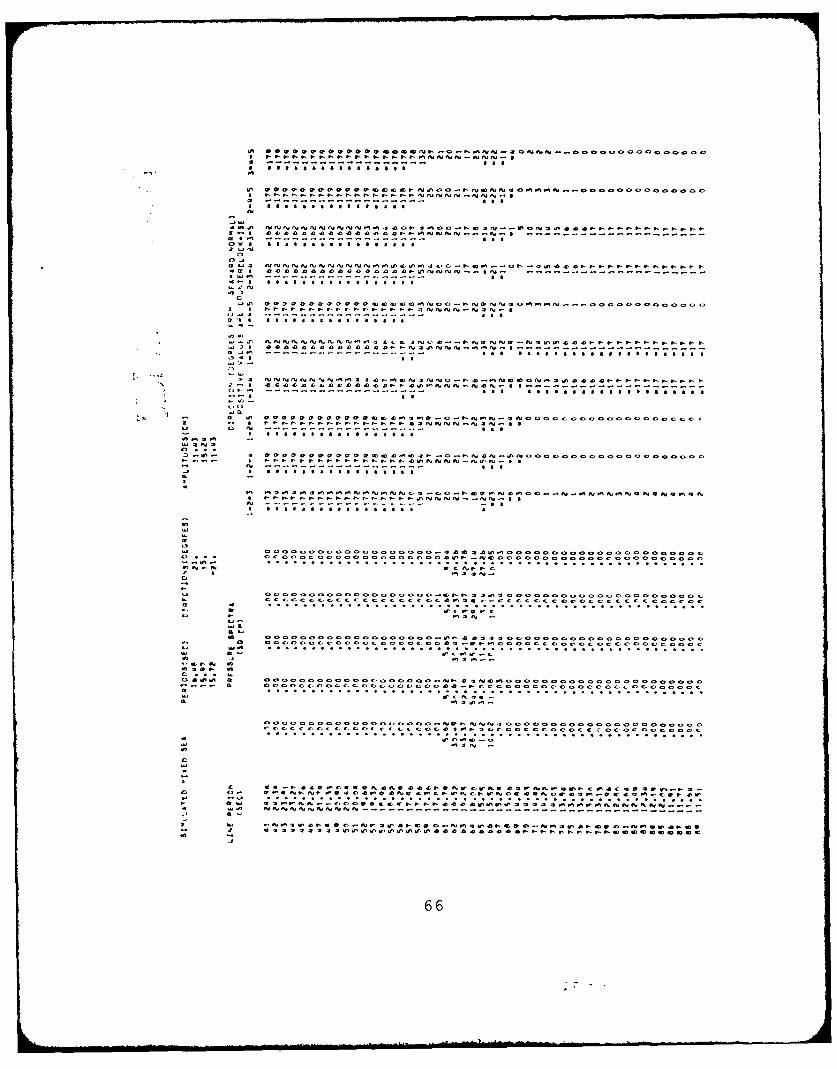
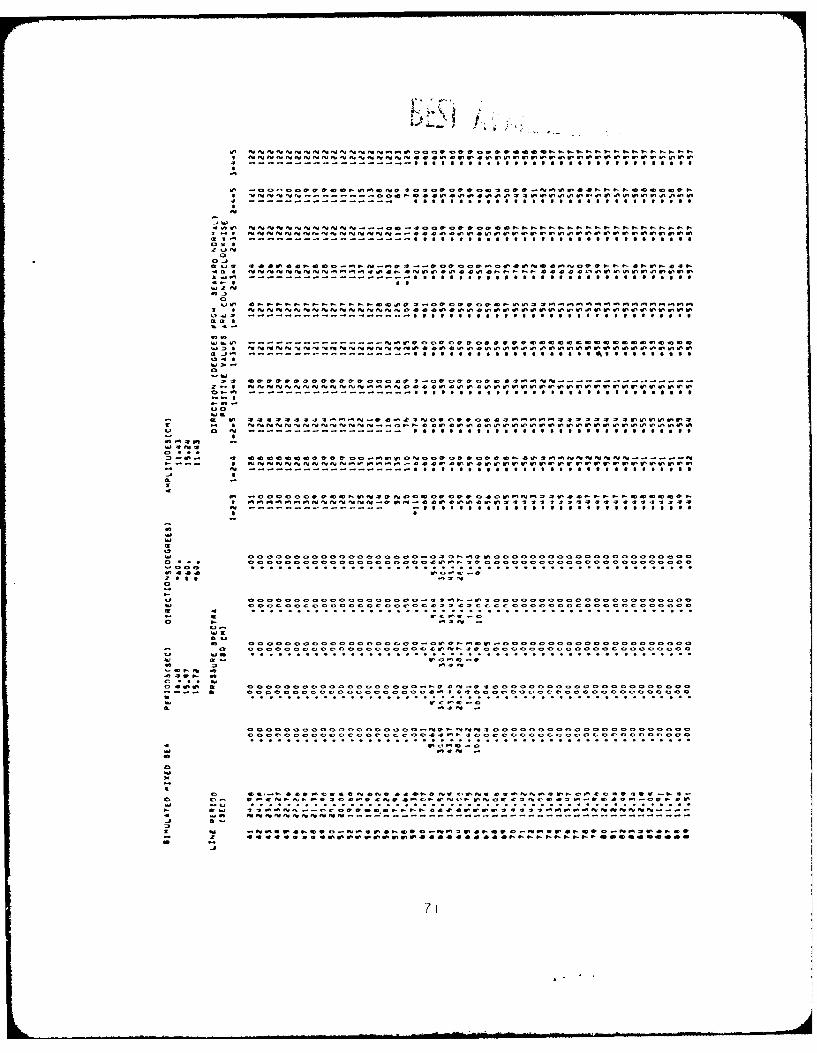
tiierefuroe, it is!s sutl fic lent to consi der wajve trains consisting of thrceesl uusoi d.s tiIth Ilea i-by periods sprcad over at most six adi icent spe:ctra il1wriods in oeneral, thle periods of waves inl the ocean will di ffer- fromthle spectla.] pt'ri ods . Thus, the sinusoids; in' each simulated observaltionWere speci fi catl i'Assigned periods di ffering slig ht ly from the spectralperiods by u-se of oqiat ion (o) . Cen t ral I eriods of abhout 8 and lb secondswvere chosenl to Si mUlate 8- and lb-seconmd s1st'1 Is. Swel I's twith periods iiith is ranlge .I Vc oseved onl thle west Coast.
:ichi , iAlated wavec record consisted of vAues of, thle wave, profileCit tie t '.e I'locat ions comp)utedj at 0. 2'-StcCOPLd ine fl or 17.A7
fiP tte '4seconds) to sI mul aite, thle .,anll ing ra miad record] dora-ioIl Cu 'liri 1%, uscJ at _T!1W for f el d Lji ai
* iI r o Js! i%( re :i 5 i gid spec fi c &l reel ions and zero init ialhsjit tilc o r 'ii )1coni a e and 5rep rojigated ;tC ross the a rray
as 'rii I'S', 11;, J1cpth oat 0.14 metecr's .. *\t'e ni Ix C Shows that thle12 t ii'.iI ran's torm gi I es thI e correcT phaises for thItree sinuisoi ds
co2Y-. e el p rex' Aed tiii' Si 111150id tl C' are 21'eld lt' saedi re init,' i A'Tlel AImp I jtkius , and tile freq lieny Hvd ffe ren c1e of ecwh Comn-
~,i 'ii rs t pett i 1 ret~enc I i is f'uuntxdi f-
r~, k 4 t I c: o the f irs t ci oht Si m, 1; h t, r V: t 101 oi 11 , J
I n: ~m1Ini , di 2 t f I 2 rom th e no rml' th, 0 Is' I ;lie v, the mazx I
nIur~ pcss Si di I Cct .ril thaIt wa ves lwI th ;1 I i- ks' Md a' r i I\y 1 ii Ixrc ithis 3e1 'th of' tiw .!!rax .hIi re' Ion O'KI th ii, 1 \. liii froi theiIol'ili~il isi'Chinsi. fori thle fir~st foiir 5 Thm1lA(l( .t~~n~ Sline ~Ic%Ith an1 S-st-ond period jilmiac apnroaci tlit .();stl inie ;it thc :irr~i\' -tc from"I much iw'ide r arc , di rect I ons upl to Ol' N. JI)ii 00' S. twi- isti for thedirctions of the fifUth to (:i (Ith is i mu Ii t ' t 1211 I us
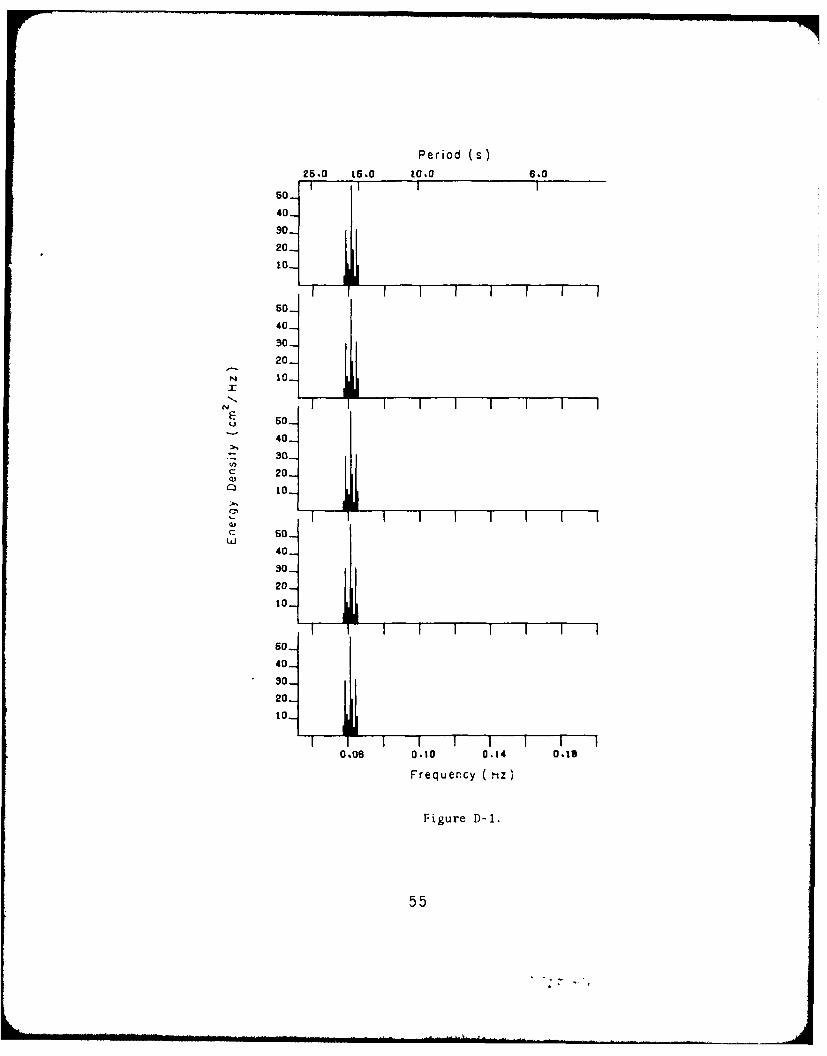
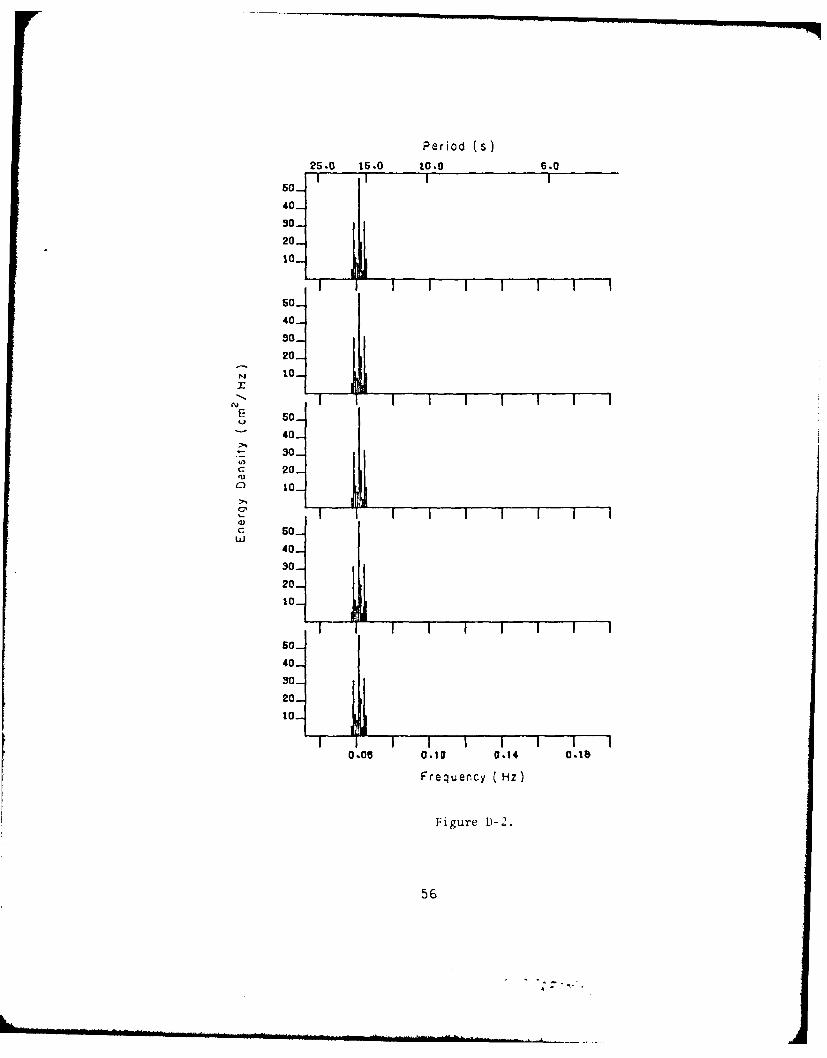
The~~,Ih iopie >)''!C :i 0 h' ~ ' 11 (-,, ~dOhservat io012> arie shown
in Appendi x ID (Fi gs. D)- I to l)-1 i Inh thes;e fi glircs the \'ari 2incc of therecord, pI-oport iona Il to thle ei-rs,' , I, ecw spect r'ml pe.r! 0t i-; ri otte 1versus aI Iinear fre{imt'ncv y m No groil , i- f hei variance at adjacentspectral Perciotds has beenl made . Thiese un greoied >pe'ct i'a are refterr-ed toas 'in z:rciz .o For~i ~ s pect ra comprIT tt(_I from I ()24 -second reco rds ,this high resolutic. is approximate]y )' .()() hertz.
TIhe procgram u.sed to compute theCse > pt'ct ra, i.s thet sa;me p rogram usedi atC(1 'RC for the analysis of field data. ManlY spec:tra of' field data computedw ith this program anti summarizedI by group ing 11 aidj icout spectral perinodsare given by Thiomps;on (1974).
[he effect o, spilIlover iii the spect rum i 5 shown ini thet fi gures ofAppendi x D. Fach spect rum resiulted from comb in iii i onl1) three sinulsoi ds;however, en~ergy coit ribut ions appear at fromt five'i to ine aijacemit spec-tr;II period,..
23

Tabie 3. Characteristics of siMnulItCd wavC trains.
Wavc Pe:riod Amplitude Directioun
train (s) (cm) L1 16.75 11.43 21 S.
15.97 15.24 21 S.
15.25 1 1.43 21 S.
16.75 1 1.43 21 S.
15.97 15.24 15 S.
15.25 11,43 21 N.
3 16.48 11.43 21 S.
15.97 15.24 21 S.
15.72 1 1.43 21 S.
4 16.48 11.43 21 S.
15.97 15.24 15S.
15.72 11.43 21 N.
5 8,18 1 1.43 00 N.
7.99 15.24 0) N.
7.80 11.43 (0 N.
6 8.18 11.43 60 N.
7.99 1 -.24 4o N.
7.80 1.43 00 S.
7 8.1 1 11.43 0 N.
7.99 1 5.24 60 N.
7.93 11.43 60 N.
8 8.11 11.43 60 N.
7.99 15.24 40 N.
7.93 1 1 .43 L 60 S.
Appruxinatc value.
24

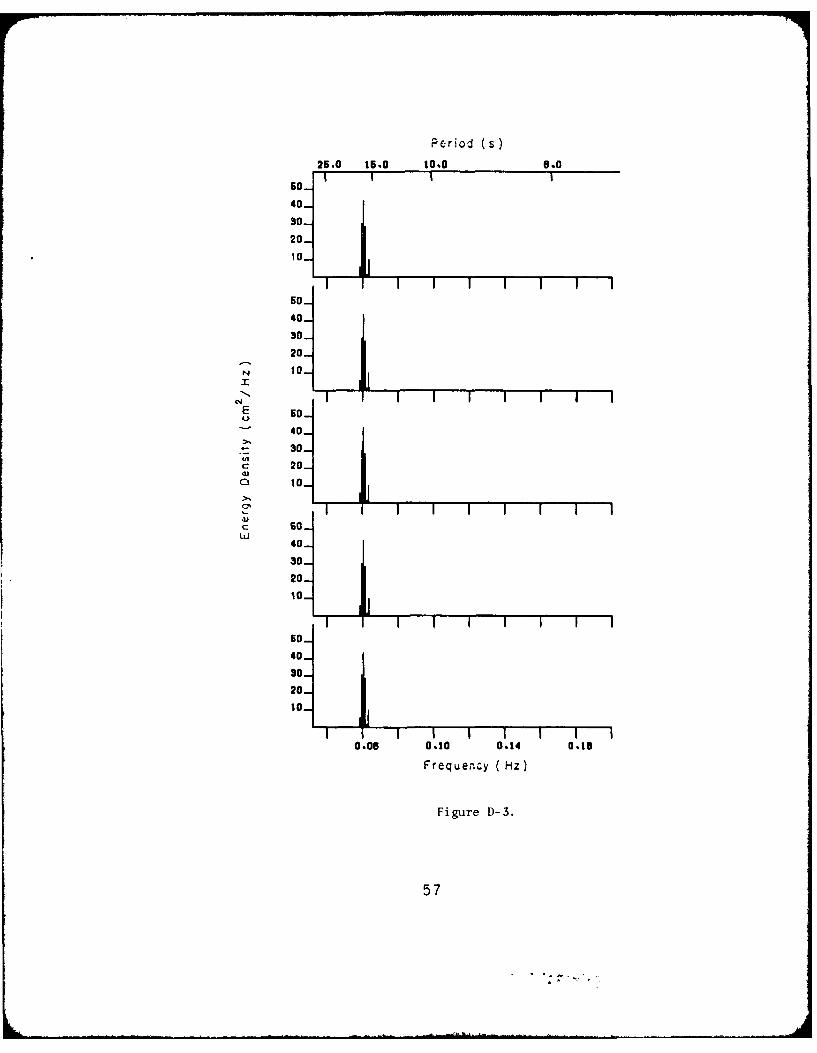
The periods assilled to the s inusoids giving rise to simulated obser-vations 1, 2, 5, and 6, differed by exactly three spectral periods (seeTable 3). The spectra for these four observations (Figs. I)-I, D-2, 0-5and t)-) exhibit three maxima separated by two minima. Tfhe energy atthese two minima may be interpreted as due to spillover since no sinu-soids were combined with the corresponding periods.
The hi gh-resol iut ion spectra from field wave observations are dis-cussed later; however, the use of the minima in these spectra to esti-mate spillover and noise is discussed here. The average energy at theminima between 25 and 7 seconds; in the high-resolution spectra of thefield observations was used as a measure of spillover and noise. Onlyspectral periods displaying an energy content at least twice this 'back-ground" energy were interpreted as possibly arising from physical wavecomponents in the wave field.
The average directions resulting from the 1 three-gage arrays aregiven in Tab le 4 (1ast colum). Only results of computations at thespectral periods closest to the assigned periOIs are shown. The tableshows that for wave trains 1, 2, and 3 the computed directions for the10 arrays agree with the input directions to within 10.
The directional results for wave train 4 are correct only for spec-tral period 62. The main difference between this train and wave train 2is the narrower spectral width. Wave train 2 gave the correct directionsfor all spectral periods; wave train 4 did not.
For simulated wave trains S to 8, the average directions seem meuning-less. To determine whether these poor results were due to a programingdeficiency, another eight sets of simulated records were generated, inter-changing periods and directions. The computer output for tie simulatedobservations is in Appendix I). This appendix and Table 5 should bereferenced in the following discussion of additional simulated wavetrains.
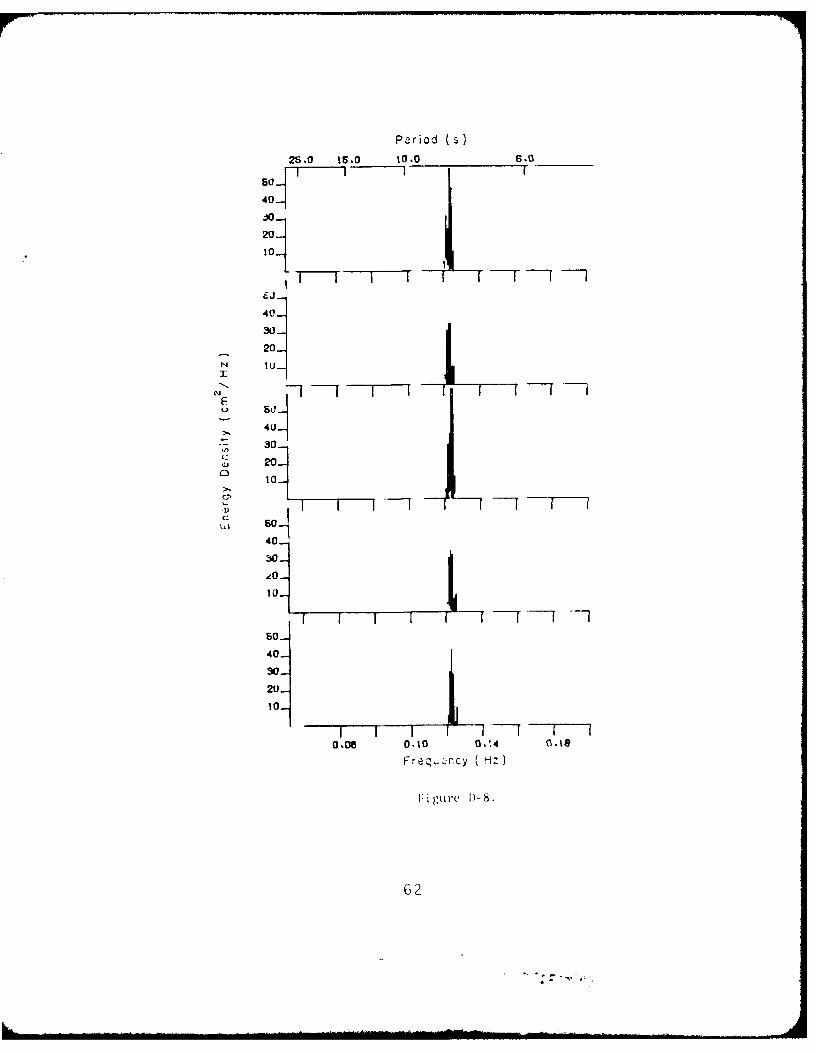
The directional results for the sinusoids with periods clusteredaround 10 seconds were of the samne quality regardless of the assigneddirection. However, the directional results for the S-second sinusoidsindicate that the capability to sense the correct direction for theseshorter waves depends on the orientation of the three-gage array rela-tive to the direction of propagation of the incoming wave. The result-ing directions, which differed by less than 87' from the assigned direc-tions, are given in Table 5. The top of each column in the table showsthe shape and orientation of the array. These results are not surprisingsince the effective gage separation for the different gage pairs varieswith orientation relative to direction of wave propagation. Fable 5
also shows that the more nearly equilateral arrays have wider directiondiscernability. The design considerationc for the array indicated aneffectiveness for wave periods between 25 and .;econds (Borgman andPanicker, 1970).
25

Table 4. Conputational results at closest spectral frc 1 ucicies for itelkr d wave trais.
Wave Closest Spectral Amplitudc l)ircction
traim s p,- tral period
(1/1024 liz) (s) (cm)
1 61 16.79 5.62 20 S.
64 16.00 7.55 20S.
67 15.28 5.70 20 S.
2 61 16.79 5.62 21 S.
64 16.00 7.55 15 S.
67 15.28 5.70 20 N.
3 62 16.52 5.52 20 S.
64 16.00 5.35 20 S.
65 15.75 1.19 20 S.
4 62 16.52 5.52 21 S.
64 16.00 5.35 25 S.
65 15.75 1.19 36 N.
5 125 8.19 5.62 142 N.
128 8.00 7.55 142 N.
131 7.82 5.70 142 N.
6 125 8.19 5.62 142 N.
128 8.00 7.55 78 N.
131 7.82 5.70 162 S.
7 126 8.13 5.52 142 N.
128 8.00 5.35 142 N.
129 7.94 1.19 142 N.
8 126 8.13 5.52 142 N.
128 8.00 7.14 76 N.
129 7.94 5.83 172 S.
26

r A 1 .
z z7
c-i ~ z z z- -i~1
-r Ci T a
- 7 27

'he cons sttunt i,d uxact recovery of assigned directions achievedfor the s imulated l-record wave trains is in part due to the use ofthe high conput itional resolution avaiIabIe in a large computer. Useof less ex:act data as available from recording instruments is expectedto result in a less cons iStellt and accurate recovery of the true direc-tion. Simulated observations I to 4 wore reron truncating the computedprofi le valuies to three digits as is commonly avai lable from recordingsvstems. The effect of this truncation is estimated to have introducedan error of the order of 10. 127 centimeter (0.05 inch) in the inst anta-neous values of tile profiles. No appreciable differences in computeddirections resulted hy this trmncation.
3. Identification of Vave Trains from the Itigh-Resolution Spectrum.
;\ wave train in the real ocean is conceivably made up of several wavecomponents with nearby periods propagating in approximately the same direc-tion. Simplistic idealizations of such w,'ave trains are exemplified bysimulated observations 1, 3, 5, and 7. For wave trains I and 3, thelong-crested wave model gave the correct direction of w-ave propagationfor all it) combinations (within .5), not only at those spectral periodsclosest to the periods of the sinusoids combined, but at several adjacentones on either side of these periods (see App. 1), Figs. It-1 and )-3). Atsome of these adjacent spectral periods, tile conti ibution to the energywas several times the background level and nearly the same at the fivegage locations. Thus, it can be assumed that a wave train in the oceanwill give rise to a number of adjacent spectral periods in the high-resolution energy spectrum with energy content several times the back-ground level. This background level can be estimated by inspection ofthe minima in the energy spectrum, as discussed previously. \ criterionfor what energy level will be considered "high-energy content" can beset, and groups of adjacent spectral periods in the spectrum with high-energy content identified. These groups may each be assumed to arisefrom the presence of a wave train in the field with a mean wave periodwithin the range of spectral periods in the group (a wave packet). Thenumber of adjacent spectral periods in each group %%ill be used as ameasure of the width of the energy peak in the spectrum anod indicatesthe spread in periods of the wave train. The spread in computed direc-tions at adjacent spectral periods in a group is an indication of thedegree of directional organization in the wave train. Large spread indirectional results may indicate the possibility that crossing wavetrains with nearly the same period are present. As results for simulatedwave train 4 indicate, the long-crested model based on the assumption ofa single wave train at each frequency is not suitable for a determinationof wave direction in such cases. Multiple wave trains at a single fre-quency may result from refraction around a shoal or island or from reflec-tion by a vertical wall.
4. Spectra and Direction of Wave Propagation for Field Data.
The energy and direction of wave propagation at each spectral periodwere computed for 44 field observations where the average umcompensated
28
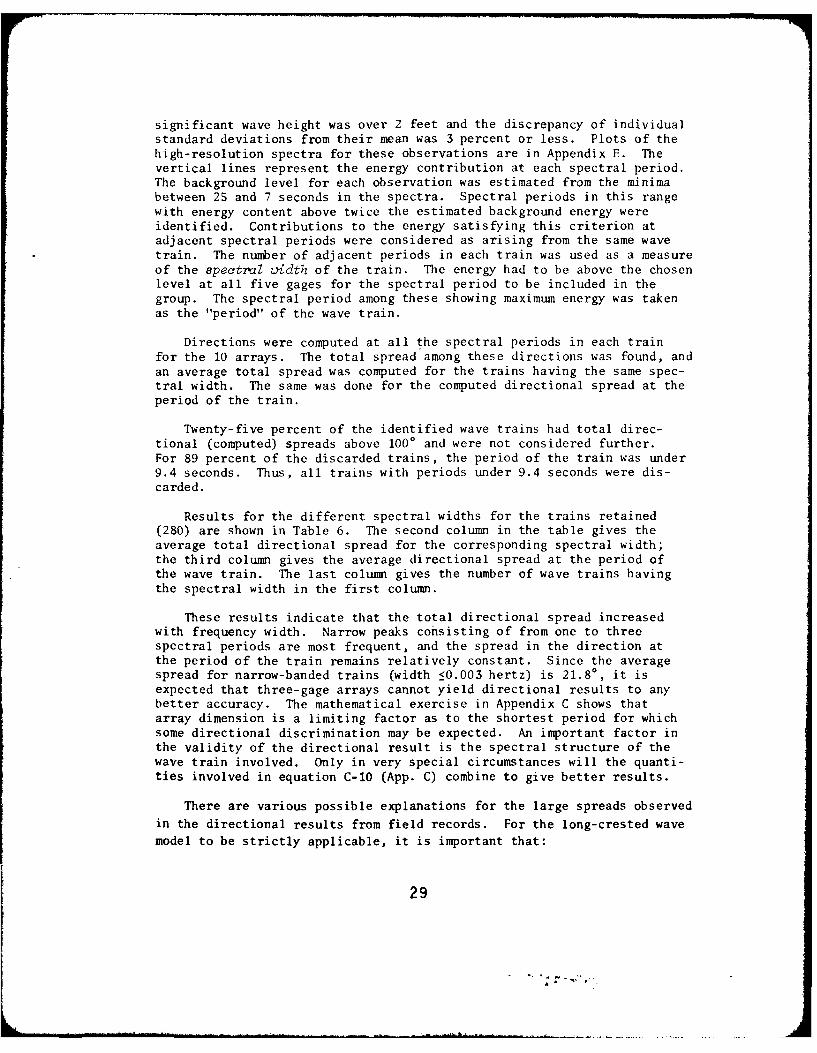
significant wave height was over 2 feet and the discrepancy of individualstandard deviations from their mean was 3 percent or less. Plots of thehigh-resolution spectra for these observations are in Appendix E. Thevertical lines represent the energy contribution at each spectral period.The background level for each observation was estimated from the minimabetween 25 and 7 seconds in the spectra. Spectral periods in this rangewith energy content above twice the estimated background energy wereidentified. Contributions to the energy satisfying this criterion atadjacent spectral periods were considered as arising from the same wavetrain. The number of adjacent periods in each train was used as a measureof the spectral width of the train. The energy had to be above the chosenlevel at all five gages for the spectral period to be included in thegroup. The spectral period among these showing maximum energy was takenas the "period" of the wave train.
Directions were computed at all the spectral periods in each trainfor the 10 arrays. The total spread among these directions was found, andan average total spread was computed for the trains having the same spec-tral width. The same was done for the computed directional spread at theperiod of the train.
Twenty-five percent of the identified wave trains had total direc-tional (computed) spreads above 1000 and were not considered further.For 89 percent of the discarded trains, the period of the train was under9.4 seconds. Thus, all trains with periods under 9.4 seconds were dis-carded.
Results for the different spectral widths for the trains retained(280) are shown in Table 6. The second column in the table gives theaverage total directional spread for the corresponding spectral width;the third column gives the average directional spread at the period ofthe wave train. The last column gives the number of wave trains havingthe spectral width in the first column.
These results indicate that the total directional spread increasedwith frequency width. Narrow peaks cohsisting of from one to threespectral periods are most frequent, and the spread in the direction atthe period of the train remains relatively constant. Since the averagespread for narrow-banded trains (width <0.003 hertz) is 21.80, it isexpected that three-gage arrays cannot yield directional results to anybetter accuracy. The mathematical exercise in Appendix C shows thatarray dimension is a limiting factor as to the shortest period for whichsome directional discrimination may be expected. An important factor inthe validity of the directional result is the spectral structure of thewave train involved. Only in very special circumstances will the quanti-ties involved in equation C-10 (App. C) combine to give better results.
There are various possible explanations for the large spreads observed
in the directional results from field records. For the long-crested wave
model to be strictly applicable, it is important that:
29
* ~ C!
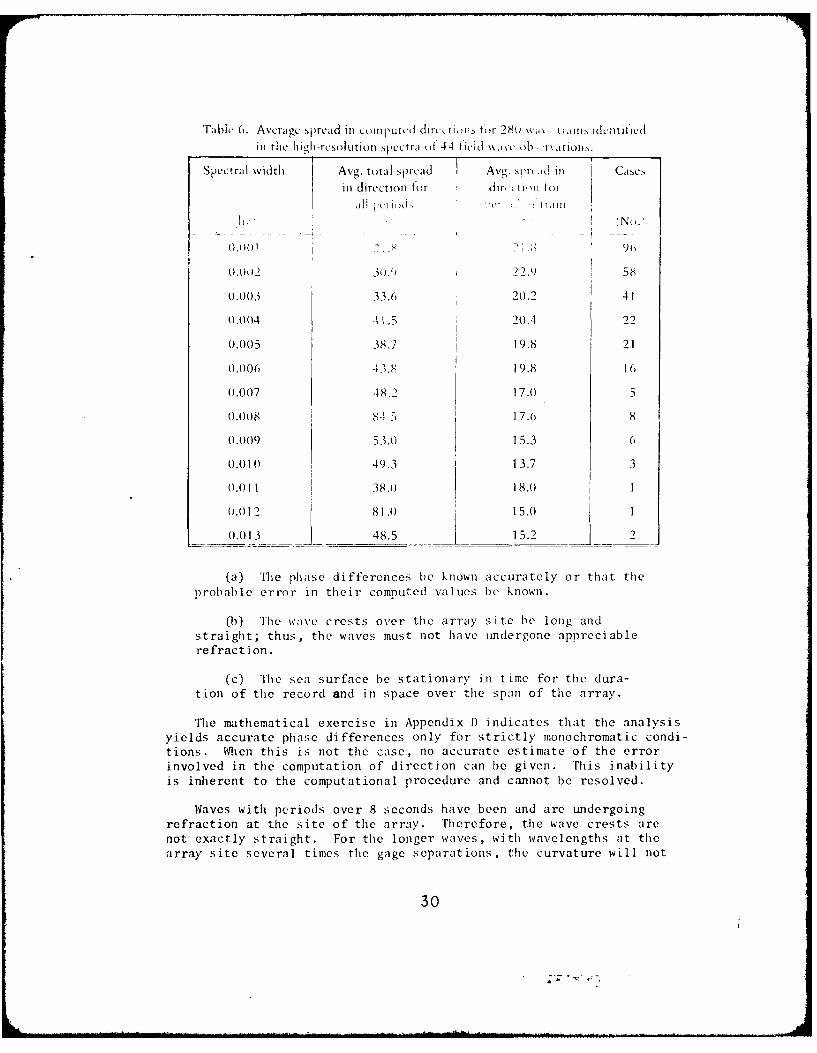
Table 6. Average spread in cMLIputcd dirc tihuis t,,r 28() wa% U t I S ideIttificd
in the high-resolLItion spectra of 44 field \,iVc 'ob, Ikatiols.
Spectral width Avg. totua spcad i Avg. sprk id in 1 Casesin direction tor dir, tI, i t)oI
a ll tcI , ' ,: , i i ah: : + '(N.,
(.(H ti .'. - A 9(1
0.002 3).1 22. 58
0.003 33.6 20.2 41
0.004 41 .5 20.4 22
0.005 38.7 19.8 21
0.006 43.8 19.8 16
0.007 48.2 17.0 5
0.008 84 5 1 7.6 8
0.009 53.0 1 5.3 0
0.010 49.3 13.7 3
0.011 38.0 18.0 1
0.012 81.0 15.0 1
0.013 48.5 15.2
(a) Rhe phase differences be known accurately or that the
probable error in their computed values be known.
()) The wave crests over the array site be long andstraight; thus, the waves must not have undergone appreciablerefraction.
(c) '"lie sea surface be stationary in time for the dura-tion of the record and in space over the span of the array.
The mathematical exercise in Appendix D indicates that the analysisyields accurate phase differences only for strictly monochromatic condi-tions. When this is not the case, no accurate estimate of the errorinvolved in the computation of direction can be given. This inabilityis inherent to the computational procedure and cannot be resolved.
Waves with periods over 8 seconds have been and are undergoingrefraction at the site of the array. Therefore, the wave crests arenot exactly straight. For the longer waves, with wavelengths at thearray site several times the gage separations, the curvature will not
30

introduce much error. This will not be the case for the shorter wavesand orientation of the array becomes important.
Because of refraction, the curvature of a wave train changes, perhapsonly slightly, while propagating over the array. This change will intro-duce differences in the direction at each gage and differences in thedirection sensed by different gage pairs, causing undetermined additionalerrors in the computation of direction. To determine the magnitude ofthese errors, two additional sets of simulated wave records were gene-rated. The periods of the sinusoids combined were those for simulatedobservation 3; the directions assigned were spread within a 10° arc forthe first set and 20' for the second. The last two computer outputs inAppendix [) show that spreads of tile order of 160 and 320, respectively,resulted in computed directions.
A stationary condition in time is usually assumed when developingwave directional models. Indications are that this is not strictlyapplicable at all times.
Th e three factors discussed above are sufficient to account for the
inaccuracies encountered in the computations.
5. Conclusions.
The results of directional computations, for both simulated and fieldwave data records, indicate three-gage arrays have some capabilities todetermine wave direction under certain conditions. These capabilitiesdepend on :
(a) The dimension of the array and the water depth at thesite which place a lower limit on tile wave period for whichpossibly accurate directions may be computed.
(b) The orientation of the array for the shorter periods.
(c) The nature of the wave field; directional results forwave trains with a narrow frequency distribution or where thecomputed directions differ little at the adjacent spectralperiods might be meaningful.
For wave trains with narrow frequency and directional width, andperiod above 10 seconds, the three-gage arrays at Pt. Mugu yield direc-tions to an estimated accuracy of 200.
At the Pt. Mugu site, 16-second waves may approach the coastline atangles of 220 or less from the normal. The directional information pro-vided by the array adds little to this and seems hardly cost effective.
31
LI TERATUIRE CITEDii
BOR(MIA' .I., and I1'NI CKiR , N. N., "'Design St udy for A Suggested WaveGage Array off Point Mugui, California,"' Te chni cal Report IIFL 1-14,U~n ivers ity of Cal iforni a, Hlydraul ic Engileerinig Laboratory, Berkeley,Cal if. , Jan. 1970.
COOl)LEY ,J, and TU[I KY , 1. W., 'The Fast Fourier Trans formi,1 insz~ti tute3 ~r? vi . ~ce 'oztc1) Kzcu''~ *,Vol . 4, No. 1, Jan.
1907, PP. 63-7().
FPU.11INAW\, -1. , ''Measurement of )i rec t ion aI Spe ct rum of Wind Waves Ujsinogan A\rray of Wave Detectors,"'' ) lou;". . , " - -12OVO,2 ~ U2 '1-C "a
zsVol1. 30, No. 1 , Febh. 1) 1 ppl. 10-22.
FIIN'I NA\, Y . , ''Measuremcnt of Di re toanal Spect rum of VWind Waves Usinga \rravN of Wave I)etectorl , Par-t 11I--Field Observations,' to~or.(2 0"4
* vi, Vol. 31, No. 1, Feb. 1975, pp.25-42.
II\RRlIS, ). I., ''Fin ite Spectruim An alIvses o f Wave Reco rds ,'')'j>
Sept. 1974, Ip. 107- 12..
JENKINS, G.MI. , and WATTIS , D).6. , netaAu~a : T!1 2:;c z reIfolden-Day, San Franci sco, Cal if. ,1968.
KINSMN, B. , il.7 .>i''a Prentice-Hall, Eng I ewood Cliffs, N.J. , 1965.
McCI:ENAN ., C .M. , and HIARR IS, ). L. , ''The Use of Aerial Photography in theStudy of Wave Characteristics in the Coastal Zone," TM-4S, UJ.S. Army,C;orp~s of Engineers, Coastal Fng incering Research C'enter, Fort Belvoi r,Va., Jan. 1975.
NMcCLY NAN, C .1. , ''Simpl ifi ed Method of Eistimat ing Refract ion and Shoal ingE'ffects on ocean waves," Tm-sO, U.S. Army, Corps of Engineers, CoastalEngineering Research Center, Fort Belvoir, Va., Nov. 1975.
PANICKER, N.N., "Determination of Directional Spectra of Ocean Wavesfrom Gage Arrays," Technical Report IIEL 1-18, University of California,Hydraulic Engineering Laboratory, Berkeley, Calif., Aug. 1971.
PANIKER, N.N., "Review of Techniques for Wave Spectra," Proceedi.n,70 0~t~w~r,~o-, yr,7posium n 0 Oezn WaVC M!S48rCMont cwd An?23-,S7S,
Sept. 1974, pp. 669-688. 3
PEACOCK, IIG,"CERC Field Wave Gaging Program." Proceedings of the!nternational 17ymposium on Ocean Wave Measurement and Analysis,Sept. 1974, pp. 170-185.
THOMPSON, E.F., "Results from the CERC Wave Measurement Program,"Pro ceedings of the International S7ymposiwin on Ocean Wave M4easuremntand Analysis, Sept. 1974, pp. 836-855.
WILLIAMS, L.C., "CERC Wave Gages," TM-30, U.S. Army, Corps of Engineers,Coastal Engineering Research Center, Washington, D.C., Dec. 1969.
33
k.
APPENDIX A
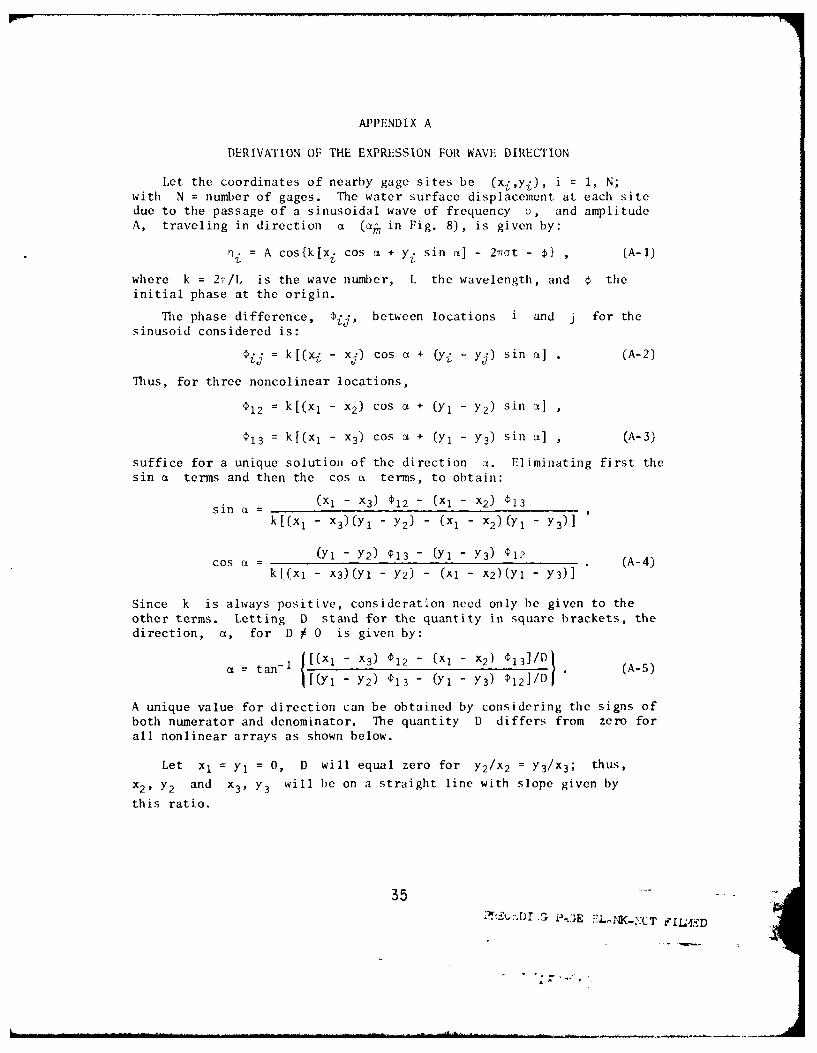
DERIVATION OF THE EXPRESSION FOR WAVE DIRECTION
Let the coordinates of nearby gage sites be (xi,yi), i = 1, N;with N = number of gages. The water surface displacement at each sitedue to the passage of a sinusoidal wave of frequency c, and amplitudeA, traveling in direction a (am in Fig. 8), is given by:
n i = A cos{k[xi cos a + yi sin a] - 2vat - } , (A-1)
where k = 271/L is the wave number, L the wavelength, and 0 theinitial phase at the origin.
The phase difference, Dij , between locations i and j for thesinusoid considered is:
i= k[(xi - xj) cos a + (i - yj) sin a] (A-2)
Thus, for three noncolinear locations,
P12 = k[(x 1 - x2) cos a + (YI - Y2 ) sin a]
P13 = k[(xl - x 3 ) cos a + (Y1 - Y3 ) sin a] , (A-3)
suffice for a unique solution of the direction ci. Eliminating first thesin a terms and then the cos a terms, to obtain:
sin (I= (XI - x3) P12 - (x1 - x2 ) I13
k[(x 1 - x 3 )(y 1 - y 2 ) - (x1 - x2)(y 1 - y 3 ) ]
(Y1 - Y2 ) 13 - (Y1 - Y3 ) P12cos a =-A4k[(xl - x3)(Yl - Y2) - (X1 - x2)(Yl - Y3)]
Since k is always positive, consideration need only be given to theother terms. Letting D stand for the quantity in square brackets, thedirection, a, for D j 0 is given by:
CL = tan- 1 [(Xl- x 3 ) D12 - (XI - X2 ) 1 3 ]/D(
t (yI - y 2 ) P13 - (y1 - y 3 ) l2]/D1 (A-5)
A unique value for direction can be obtained by considering the signs ofboth numerator and denominator. The quantity D differs from zero forall nonlinear arrays as shown below.
Let x, = Y, = 0, D will equal zero for y 2 /x 2 = y 3/x3 ; thus,
x2 , Y2 and x 3 , Y3 will be on a straight line with slope given by
this ratio.
35i :2 , ,D r ..' , , ;F3 7 1 -, NK - C T F L L 4'Ei D
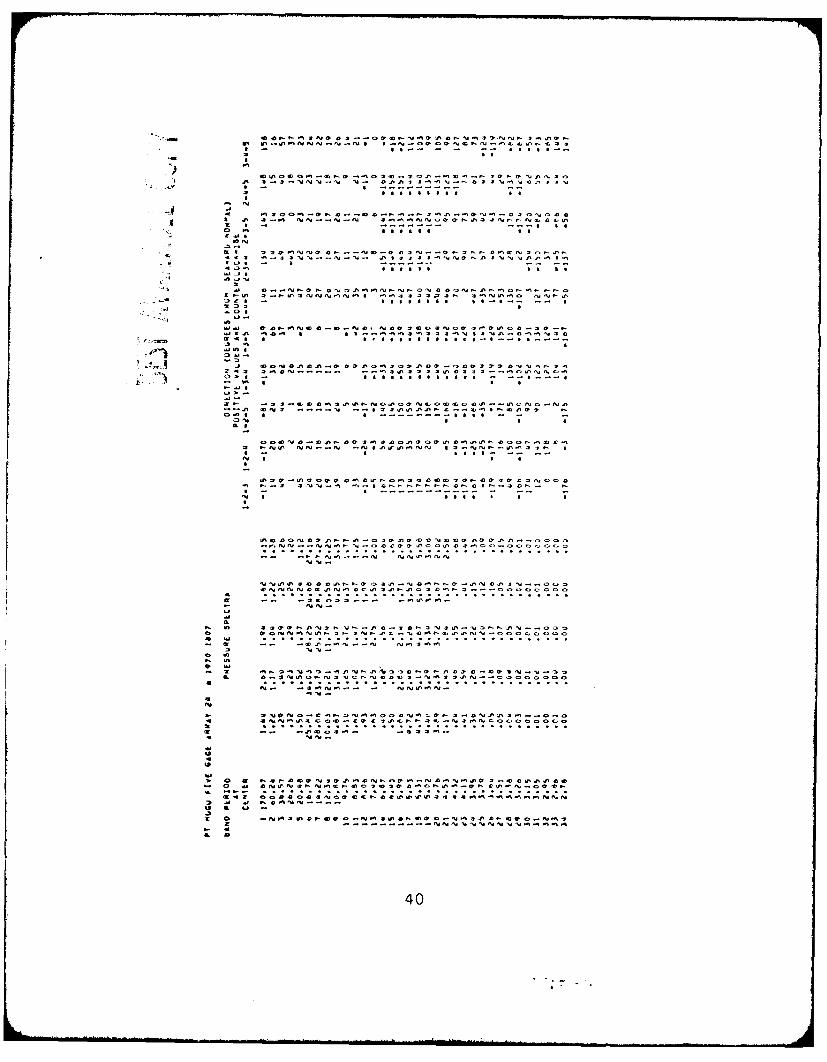
APPENDIX B
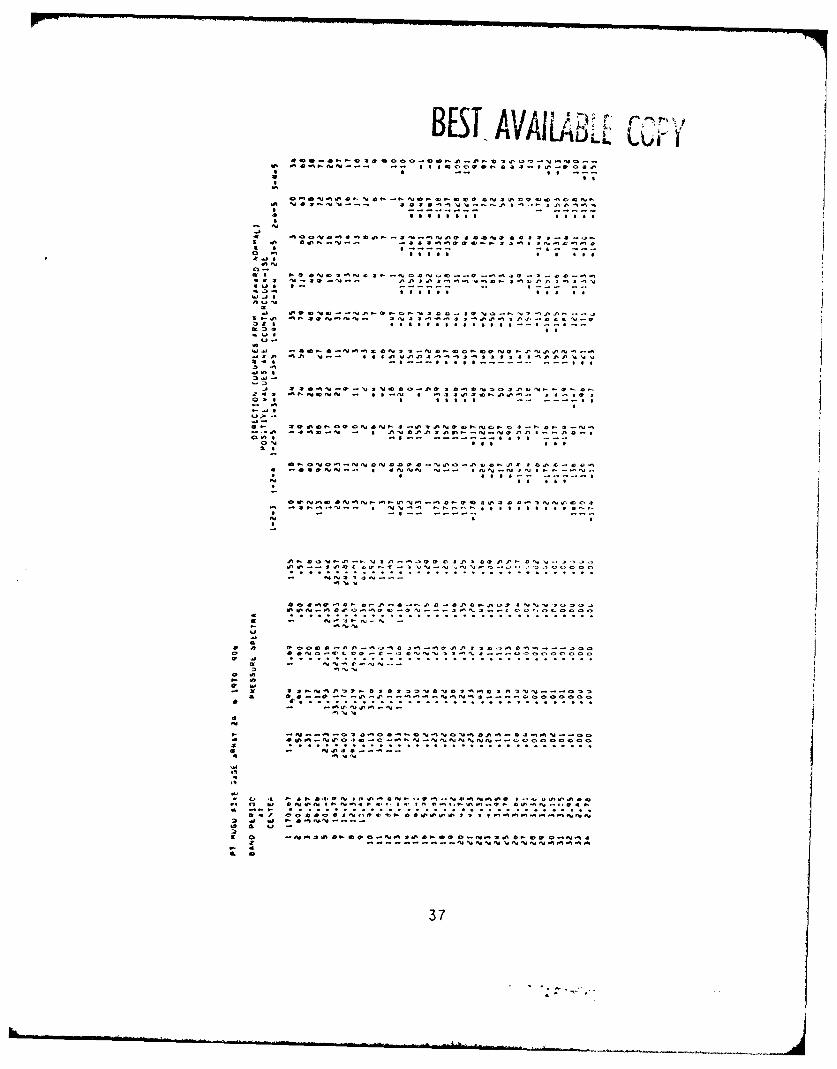
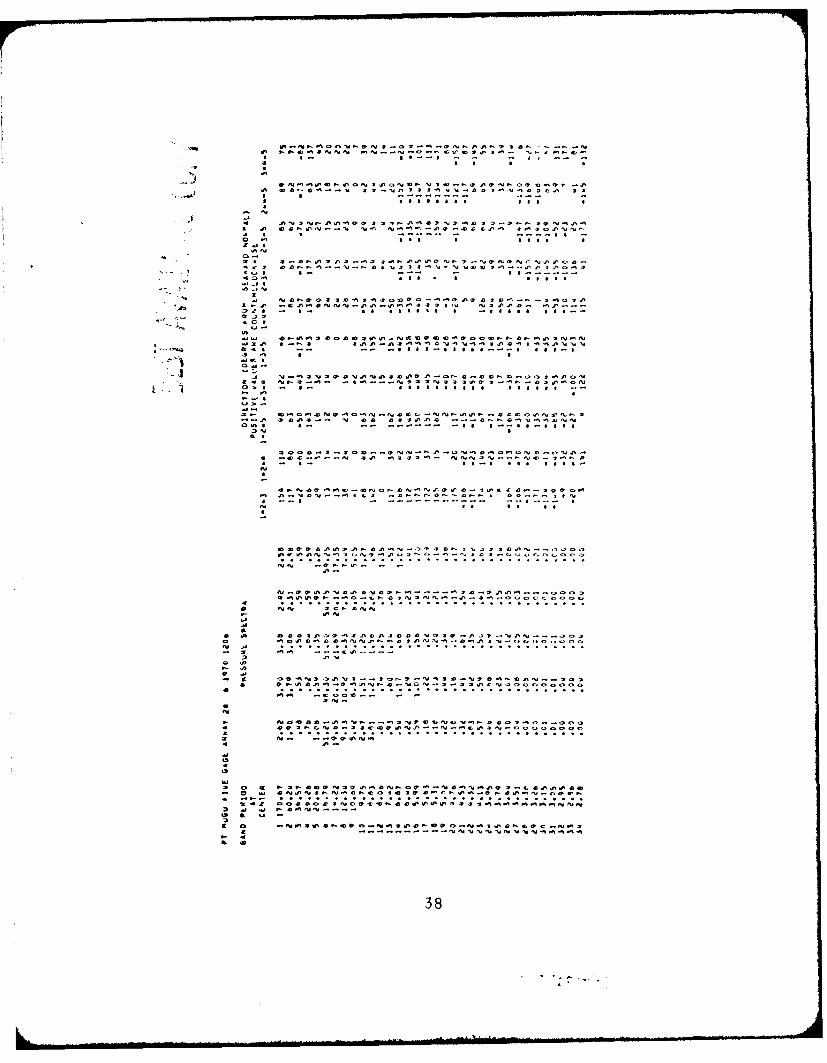
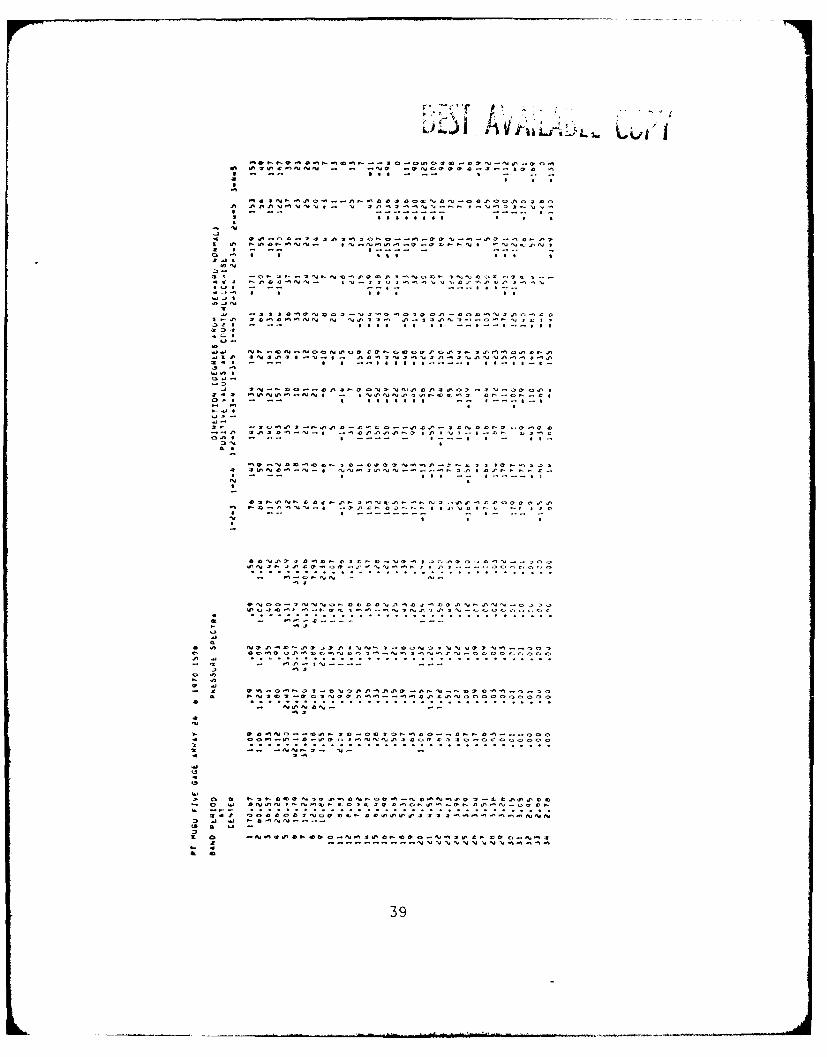
COMPUTER OUTPUT FOR CROSS-SPECTRA COMPUTATIONS
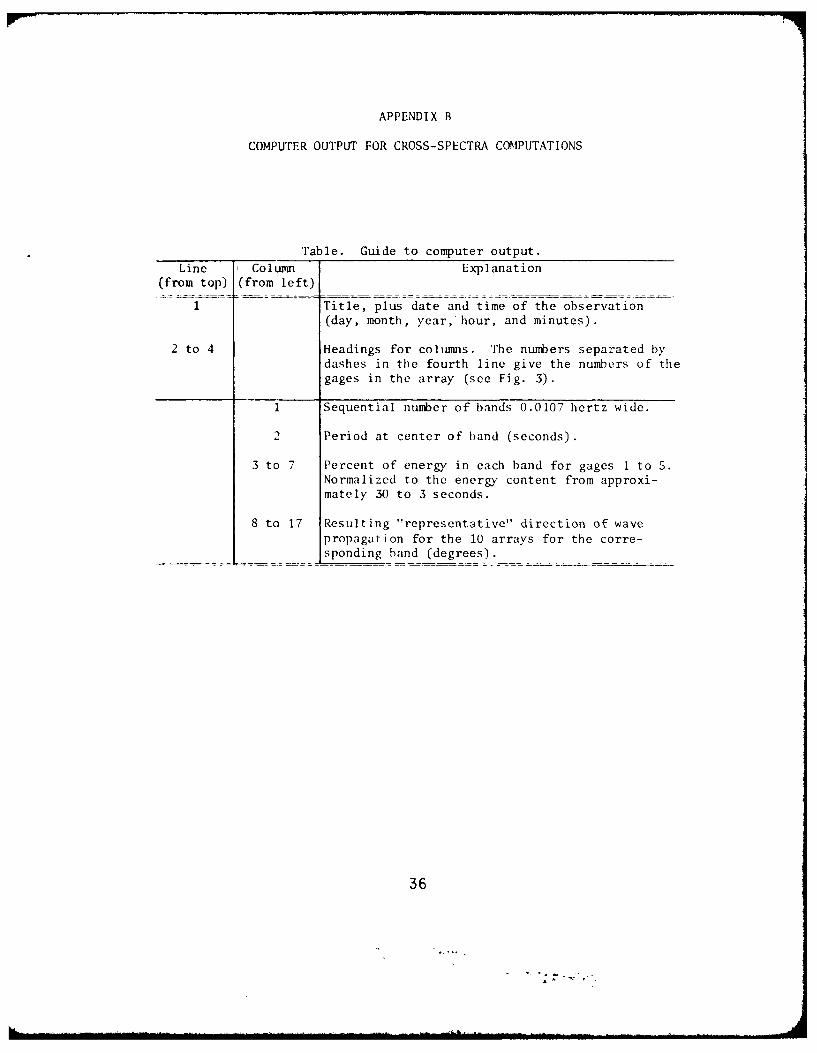
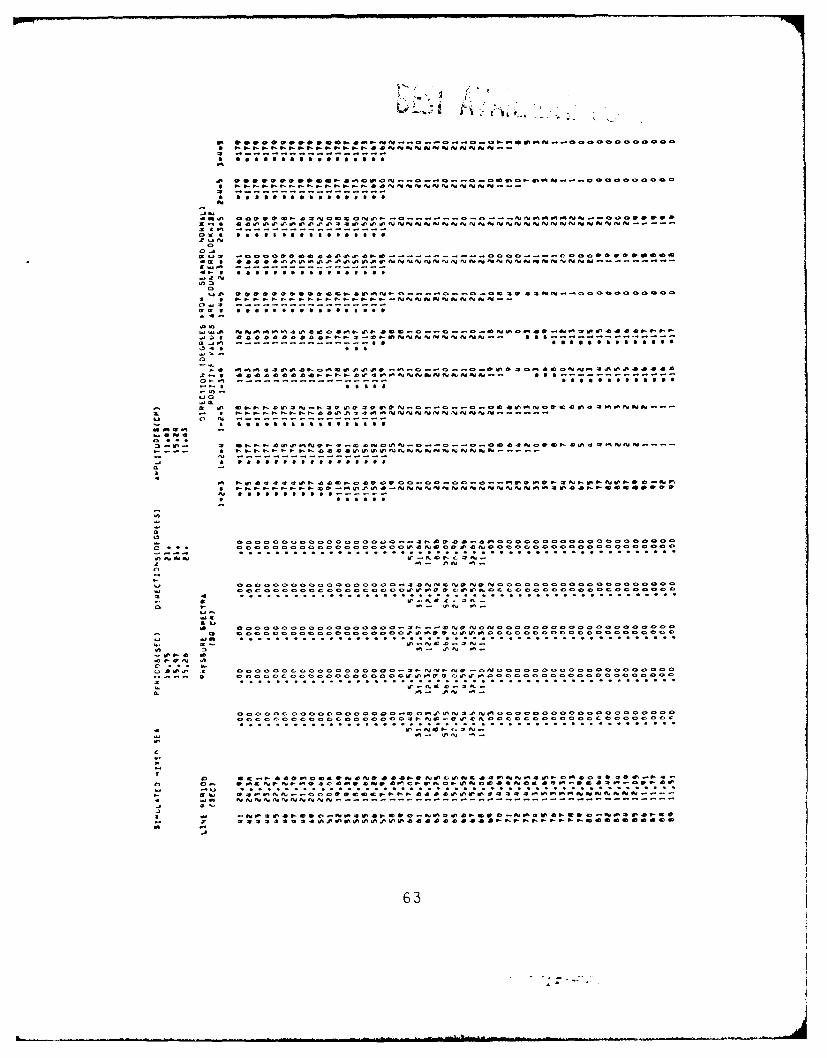
Table. Guide to computer output.
Line Column Explanation(from top) (from left)
1 Title, plus date and time of the observation(day, month, year, hour, and minutes).
2 to 4 Headings for columns. The numbers separated bydashes in the fourth line give the numbers of thegages in the array (see Fig. 3).
1 Sequential number of bands 0.0107 hertz wide.
2 Period at center of band (seconds).
3 to 7 Percent of energy in each band for gages 1 to 5.Normalized to the energy content from approxi-mately 30 to 3 seconds.
8 to 17 Resulting "representative" direction of wavepropagation for the 10 arrays for the corre-sponding band (degrees).
36
BESLIAVAILA LL ~~>
C, - --* .. . .. C.. . -C"°° L..- - oo °. -, - C, a ..-
I .1 0 0e..eV-.. -4 2 % 0 . 2 0 3..0i. e
o a. a... a * I a
0 -. e
0-
06 P0 * %2,0 4-O fa e... -04....C0.i'
40 e - G - S u S 0 U . ~ '%, L~
I -U ii-4f. ~ -. ad44 00 sI - PJ- 0C sJ
0 s a
- i
a o . -- o-oo° o04 o. o o o ° ° o-00 0 %o o.o. .- J,% 000..
a.? Si 3 i ° .. ° S°a aS " iJi 4 00.d °° *° 44 4 " S "" °° Aid " "d
O -o .a ao~ o a.. a.., o. o -o - o-.-
- -3a
U 0- . ,..
C C CC -C . - - CA -
*A-/i I.ro,. P ' i | | 10- e 0 * !* 0e e e-..
S ' ::,rla C - - -- I l l-- C -o r *C C**e• -2. -
akJ *t- 'S o .,o o . ro o t. o. o ooe,-o ooo o oS o A
... ,-, C C
SC. JC...o. o - o•o . 55 S' o S oo5 o 03 .. e 0*,% oA
0CC C.*CCC 8CC CC * CCC
*0
0- C0 W0 S.As~ 0 AJ ~ i *%~ O CCA38C -
' '* s o 0'Oi0 - A A V
OV_ 5 - - - - - - - C C CC S
. . . .. -'
IL.)i i i O j I.i i i
$ 0% *V 4%- n - - e .rU'.... 9
€ * . ..-5..a -...- • -
* S - I i - .. . *
a $N-.AAa-.. °. ...... 0 oc s o.. o . . o . , . s
* -. - - - . . .- . . -.... ---... o .
4 .°.... 44%S.° °O.... °° .599°o.-s .... 9 O°.°.
o -'. a ° ° . ° ° o . ., . o... . .o S. ° I
St . 0 ' . S O N O4 @ 4 4 1 N t - 0
40 0fl0I NA.. * -5 Ui %O~'39SI
Ci c , t - 'eSC-, 0 0.- V 0 ,'J% i e0A O P I I.. N J-V N AIS I I %\.. I 4 i40I
*l ,, -i iia -I I
.. .a.. a , .. . . . . . ,
4 - )SO0 .-. C i OV O
o -- . - . _ . - . .....a ... .... ....
2 . *.. .
OS4O

iJi~l ~ ~ V
~,* uIYFI&Li 'A.. Lu~*oCU..c..oceoooCo*--.n. a.-.o0N0a..o.-t-~
0 *SU'NN.... 9 .. C* COO I P.~* rInO 0* -- ....- ~ - - I. --
* S I
* - InC NOCO ~U'0 C - - S -No - CO C 9 C -CC 00~ .1' C1* ON.'0..%I.'%N -. liSA ii iVN%~t-AS. A~flns~.** --- - S -* ... *..a. a Ia S
-J0 *0900U'CWNNU'00d.0OC-CI~.I9 U'J*cn.nO-,K US SSCNS NN NI..bflIJ..0...CC.-g.0
o -. S * * S
Ci C..,CCCO...0 ... 0U'C 090.0*S, NOC 3 0NC S 009-%ICN095 05.. NO.5 ... iS * *5 J~.'*O'VC.00S S iStiSdA
S S S S S S S
a 009 0...SO.-0.'09N9 00 * 20.0*9 a~%Cd%9 ~~C-N--. -,£9-A ~ ii~IS3S APi 0.0*55 S~0t-CdIioCr9:1Z* ----. S.. SS.SSIIS S -StC20 *5 S
I*J*I 05U.C000N..CU'01
0 NOn...'%..-,.- InOC 009 N0.~..aid. N-0-%I-.... * -d.d.i0 2 0d.i SOS S., *-i 5'%Sd.d....a.. s*-- .-... SSS.S,.cS -.- *S*...-.*
a .fl S
5 S-.~.O0-.900d.WOd.Oi0Ci00C9ONCt-OSN0..t-C'J590 IJNO NN - OOiU'50050.,ILU'NI-r-SOONN0>S ---- S *SS*.*SSSI ~c--..Sc~
0 5 S S
S.. .. 0u4-.0N00iN9N0U'O000~N9CU'0CU'0S*CUt~C 0.. Sd. *iN NN-. S SASAd. op-OAt-* t-8055 SOd.flea. --- -a. -
1fl09...d.OW ON.SONid...U'U'0009.-U- iO..d.0..9 .... IU.SNIIS. .. OU*NOOO... *..0500
000000N
* ---- . S S -I.. S S
C 9 00 ... 9. U' NO 0 9- 90 I'S S C 9999- 9 U' CU' 09, N 00 U' 00IS I..d.d.. * N.AL'.J NO C O9-t-9-t-t-t-t-~*t-~...c0.-S~
* --- S -N S *I * S
300 SN C 0 450 S.. U' AC ~5 .1% C A 9- U' - 00 45a C P. N - - 9 00 0 0InS. 0*U'U'CAU'9C ... 0905 S AG 59.3* .~J..O0C000000
.. 0t-9 C -N NN -
SISJNS.09 0 0d.ON 500i9000.Gi i000000S.-0-.InC9 00 N O09-U'0N 000000000
* .OS.@ON. - .0SN -
0 C S.-d.CCS..S.-9 CU' 09-0 0d. C.'SOU'OOCfl000000C.I'SO9CNU'0d. 59-0*08900 0455 I'.L..000000000
* 00CSNc N......2 iN
* kI- 9, iCiSb.05000CS..CCA.10A9-09-0 *9-51....00000
* 99-N109 .. NU'..S.-0In090..IS iON.....000000000
VIn90-.N - NN.....SN
InN
O 0099- 0J*U'..0t.1500d.00 0t-C..9-S.-C-.S.. O'SS..-.000000 *t-In..NCS..CNOOOU'C.U'OS.-Ni OUSN...0000000QC0
C .N9CS0 0*50
Si
as
0 0 C 9-2t-00N09U'00Nt-091..N05N0509 0 ... C0VaInt*0- 0 Wi *NU'NO9-N.C9-000C000009-U'.*5..et-SU'N...oCOa
COZ e00So0sNo9CC9-0InCInU's0wooo.So..s.q...Nvahn~2 a a 9-SON-Si ft 5.1 -29, 0 0dOqIIn09-C9o..Si00In0S..C.o..NOSU'09.0e ONU 3
-NNNNNNNN*5~AOC C
41

.. nv aocaC .- CP.ICNs~q~ Cl cf.Oo
* 1 A I A44dIIII
Il I 4U Sl j.4 4 0a Sfl l 7-
- a a0 -5 -lJ0 -3'5 .%4t. i00 % 0' 0 V. .C N*e **''4%U**U N .,S*41 S 0 1 -. S J~la
-, a .,al .
10 C.Ni o • o • . N • •. •l j,4a4 .- o' %. o .. % J*.. . . -l. °. ..
.Z --... . a.. . ...- - .....a. ga - -- .. *....
l~. aa-. .1 5 ,'-4 lJ~-- t I 0 0 e o 50.d
.11 fbllJddA ' .J' 40 0 ,llaS'', -o...aa a .. a a--. -- ~
CIII, 2
*00 4V-d 0V- -. 5-0 3% t 4 0a ?t- .%r.a O .
4 i~P.. -- 04 4 4 J % 0 0 C C ,0

BEST AVILAYE m?,vI • I I II
, * c i S
• - * V .. 0 ..-. . _: . .. .- ......%" -. 4 3 3 ' 3' 4 3 0.....
£ 1 I330-A. NV 11 II I S iil3'3I ii 0I!I il *I ii ll-. £!
2 5 - .. . . -. ...-..--.. . .. . . .
2343

-S.* Asfl l llooS N' *A ,' *' .lll .r
VS K- IIIIIIII.NN O OC -S~l~t.C0fJ
.. . -7 S - 9.. . .. . --, 7
*) 9 l l l l~
* .. . . . . .V~ .. . . .. a .. . . . o .. . .e .. c .. .. . . .
* U . .. .. --.. .. : ...Nd V '* N V bb 9J 0 S 4V.b...5 .....
o- -- . .99 ,9

* -ssas -~NN..a a.69 # 0 8 .6a a
*. oa ms a
2111 S tn -a -
em" 0 Stat
2Vt s C'%.N..Ut tf~l .,t J% NvP .5N .fl . .
#W - a -U, - a- --
a 21 0 0 f Mo 0&1
o4

*....° .... .. ...... .
0: 0 1 9 ---- O. s-- s-
Cb a .u
ok
S..1 - - - --- - -
£ U% -. W e 03 . . .. "N -et.'.eOO.oK- rt.tt.tKttd S
oZ tt 9 ;;7S
4 1 1 1 1 1 1llt III . I
-0 N
046
ItIt.1 V t5 I** . .I
It°
.... . . I , ... I ll * I IN i I I I lf...r 0 0 . C0.. . - ..
on.Orl 0 w S '
10 0 5~--^
*J 40KNO K- KO03-O OV KeO S N.C46ttl

BEST Ii ii~ L~ L i ~
"*Z SZ lz lo*
I s --------
696 1s "
tv0 0 a~a ~ . 0 3A-fJ2- te-%%4-%
tt 3 O.. *N..--. %.f4 4 S4* 4.4 . A% .. 5.J'f
v4 .. m
02
Z00
3 3 41 * * 8 * S * * * 4* 0 -II0 1 v a t ^ f
10 41
-47

APPENDIX C
FOURIER COEFFICIENTS FOR A MIXTURE OF TH1REE SINUSOIDS
The Fourier Transform of the function:
f(t) : A cos(at - €) (C-i)
with
ol -T~ +a (C-2)NAt2
where 1 < m << N, computed from N values of f(t) evaluated atequal increments of t; At is given by the set of coefficients (Harris,1974):
2A sin T6 cos(7T6 - ) 1l1am = N [tan[i - m + 6)/Nj tan[r( + m + 6)/NJ
bm= 2A sin 76sin(76 - 6) [ 1 6)N'N tan[(i - m + 6)/N] tan[T(m + m + 6)/N
N (C-3)m = 1, 2,
Harris shows that for values of m near m, and for far removed
from 1 and N/2,
. A sin T6 cos(¢ - T6)
T - m + 6 )
bm A sin Tr6 sin( - TT6) m=N C47T(i - m + 6) 2 ,2. . . C 4
are good approximations to the coefficients in equation (C-3). Equation
(C-4) shows that convergence is slow.
For the special case 6 = 0, substitution into equations (C-3) or(C-4) gives:
am =bm =O, md ,
and
am = bm = indeterminate for m m
48

Use of L' Hospital Rule in equation (C-3) when 6 - 0, shows that:
am = A cos , bm = A sin , m = m (C-5)
Application of the cosine bell data window,
f(nAt) = L - cos Nj] f(nAt) , n = 1, N , (C-6)
is equivalent to replacing the original sinusoid f(nAt) with the sumof three sinusoids (Harris, 1974), where
A(n~t) = cos [2 + 6)n
27T (;- + .) n ]2(m+ 1 + ) (_7
- cos I N - cos N (C-7)
For 6 0, and in view of equation (C-5), the Fourier Transform of thismodified function will be given by:
a, = -in A Co = 1 sinA Asin
and
A Aa= cos , b; = -, sin q
with am = bm = 0 for all other values of m. Thus, energy appears atthree adjacent m values.
Harris (1974) shows that after application of the cosine bell datawindow, the approximate values of the coefficients are given by:
A sin 76 cos( - 76)
2 ( - m + 6)[( - m + 6)2 - 1]
A sin 76 sin(O - n6) m (C-8)2 - m + 6)[( - m + 6)2 - I] m L 2 (C-8)
Thus, convergence increases rapidly, and values of the coefficients for(i - m) - 3 may be disregarded.
Equations (C-3), (C-4), and (C-8) imply that
tan(4 - TinS) -""I (C-9)bm
49
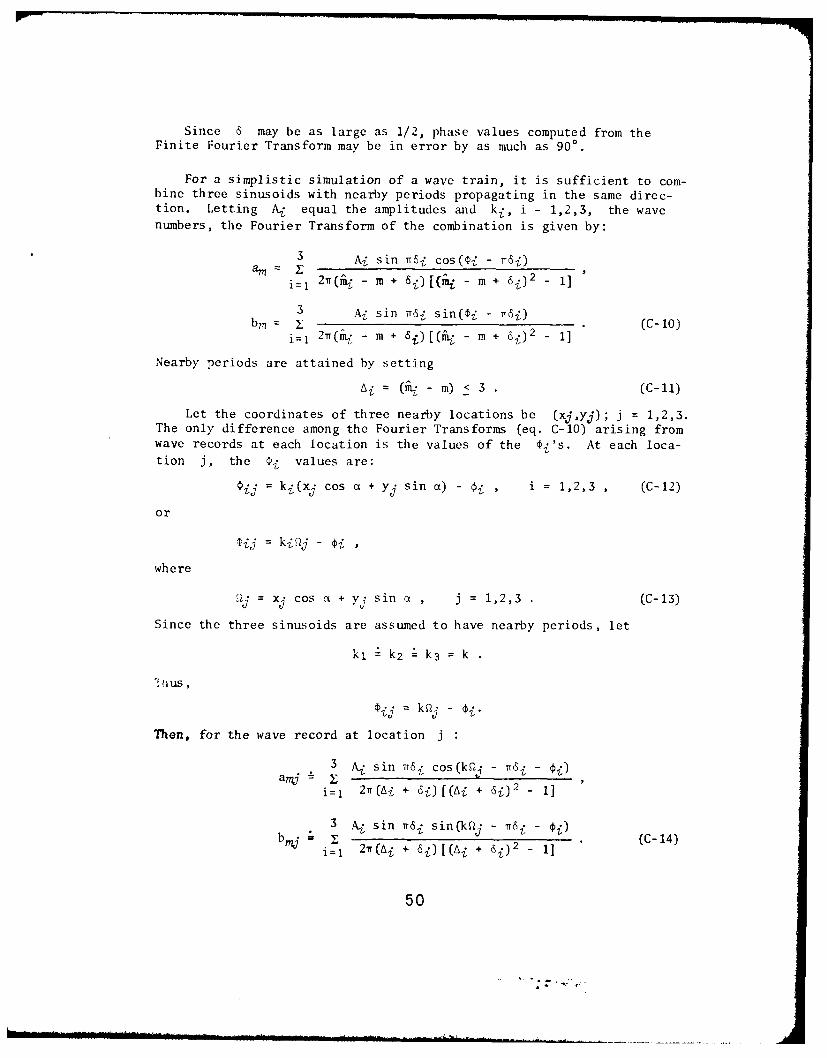
Since 6 may be as large as 1/2, phase values computed from theFinite Fourier Transform may be in error by as much as 90* .
For a simplistic simulation of a wave train, it is sufficient to com-bine three sinusoids with nearby periods propagating in the same direc-tion. Letting Ai equal the amplitudes and ki, i - 1,2,3, the wavenumbers, the Fourier Transform of the combination is given by:
3 Ai sin ni cos(cPj - 76j)am= _Yi=l 2n( - m + 6 j)[(mj - m + 6i)2 - 1]
3 Ai sin 7T6i sin(ti - T6j)bm = I (C-10)
i=I 21(T - m + 6i)[( - m + 6i)2 - 1]
Nearby periods are attained by setting
Ai = (k - m) < 3. (C-11)
Let the coordinates of three nearby locations be (xj,yj); j = 1,2,3.The only difference among the Fourier Transforms (eq. C-10) arising fromwave records at each location is the values of the ji's. At each loca-
tion j, the c@i values are:
Oij = ki(xj cos a + yj sin a) - , i = 1,2,3 , (C-12)
or
, ij = ki~j - i,
where
Q = xj cos a + yj sin a , j = 1,2,3 . (C-13)
Since the three sinusoids are assumed to have nearby periods, let
kl k2 "k3 = k.
'hus,
ij %k - ij "
Then, for the wave record at location j
ape 3 Ai sin 7T6i cos(kj - n6 i - q'i)
i=l 2r(Ai + 6j)[(Ai + 6i) 2 - 1]
3 Ai sin r6i sin(k~j r i - i)brij 1 (C- 14)ijl 2w(Ai + 61)[(Ai + 6i)2 - 1]
50
- ... ..... ..... - ,.,,

Let:
[I =+ )lA + - ] I= 1,2,3 ( -
The c.xpanded express ion for ar,, T a fte r col lect ing te rins if n.) k~and s in k-,, is :k
Al sinl cos( j +[1)
A2Cosos
A 3 i~ 11 -1 C o s ( ; 3 + 3) I
\sin -- j sin(: 1 ++ si k
;Iill (.
and s iirni larly for 1~
A, sin "1Cos( +
A. 11 C1S1
+
12]
For ~ ~ ~ ~ ~ ~ \ svr arwbaddwv rin , 1os 3 + tl eqa )i C 5
unpredictable~ terll ar}nrdcdiltecpesosfrtecefcet
- cs K~ lxisij 51 sn~
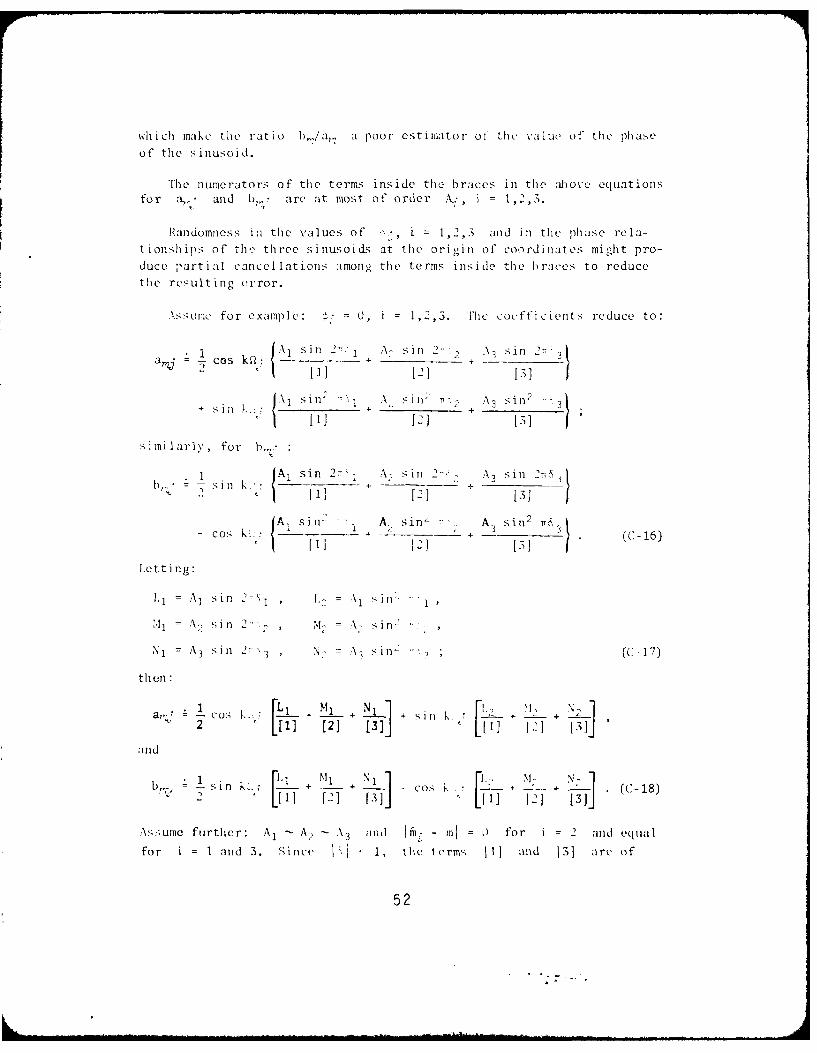
w'hich make the ratio 1) zal' a poor estimator of tile value of the phase
of the sinusoid.
lhe numerators of the terms inside the braces in the above equationsfor a, and h< are at most of order A,-, i = 1,2,3.
Randomness in the values of , i = 1,2,-3 and in the phase rela-tionships of the three sinusoids at the origin of coordinates might pro-duce partial cancellations among the terms inside the braces to reduce
the resulting error.
.ssune for example: = , i = 1,2,3. The coefficients reduce to:
\A1 sill 21 :A- sin 2- A sin 2-IC - os k l3 | + + - 3
\1 Sil i : . 3 s'ill/ -'
+ sin- 1 + +*\ sin' ' +
i mi I arly, for b, -
_ i k A 1 sin 27V A, sill 2 , A, sil 76 }b,;r : i'] k l [1l ] [ 2]
Co JAI sin 1 + A_ sin A3 sin 3(-16)1o k: [11 [2J 1-+(C 6
Letting:
L1 = A, sin 2- 1 , I : " sin- ,
N1 = A3 sin 2-',' M - \ si l 17)
then :
co +. - + + sin k L + _ -
2 [1 [2 1 [3] ]
and
= -si L~ N1 in K ., - Nrm I+1 .b 1,_ sin K.,', I + + Cos k + .- (-18)
As;ume further: A1 - A, \3 and ii - in = for i = 2 and equal
for i 1 and 3. Since I, tile terms i11 and [3] are of
52

approximately the same magnitude but of opposite signs. Thus, termsinvolving the products [1] [2] and [21 .3] tend to cancel. Letting
= 3 6
1)7,i sin k.' , ! sin 27 - 2 cos k.2 sin2 7
a,,, cos k2; sin 2in6 + 2 sin kQj sin 2 76
Using the trigonometric identities for the double arc, this expressionreduces to:
- tan (ks - ) (C-19)
Phase differences between locations will be approximately correct.
53

APPEN[DIX 1)
SPECTRA PLOTS AND) COMPUTER OUTPUT FOR SIMULATED OBSERVATIONS
Fi gures )-i to l)-8 show high-resolution spectrapressure gages 1 to 5 at Pt. Mugu, California.
54
Period (s)
26.0 t6.0 tO.0 6.0II i I
50_
40_
30_
20_
10-
401
30-
20_
N 10__ _ _ _ _ _ _ _ _ _ _
60
40_
30_
20-
LAJ
,- I I I I I
40_
40_20_to-
60_
40_
20_
0.06 0.10 0.14 0.1
Frequency ( hz)
Figure D-1.
55
Period (s
25.0 15.0 10.0 6.0
so-40-
so0
20-
40-
20
50-
20
6) 10
LiJ40-
30-20IIito .4 i
so-ur.c (z
Fiur0-2
so56
Period Cs)25.0 15.0 10.0 6 0
40-
so-
20
10
40-
30-20
N 10
40-
- 30-
1j 20
40.]
30-
20]10~~
40-so-2010
Figure D-3.
57

Period (s)
26.0 16.0 10.0 8.0I
20-
so_
40-
80-
20-
C 60-
40-
20-
40-
20
0 .1 ,40
77 'Frequency Hz~
58

Period (s)
25.0 15.0 10.0 5.0
so040-
30-
2010
so-40-
30-
20-
Is
U 40-
-~20-
'- 50-4)-
30-
2010
40-
20
00 1. 0 8 0 1. 1 0 1. 1 4 1 0 1. 1 6
Frequency ( HZ)
Figure D-S.
59

Period s)25.0 15.0 10.0 6.0
40-
20-
t0
40-
-. 20
X 10
>. 40-
'' 20 -
tLaJ 50-
40-
30-20-
40-
20
10
.6 0.10 0.14 0.18
Frequercy 1, Hz
Figure D1-6.
60

Period (s)
25.0 15.0 10.0 6.0
40-
30-
20-
40-
30-
20-
N to-I I ~
U so-_ _ _ __ _ _ _ _ _ __ _ _ _ _ _
40-
30-U,c 20-
40.0
Frc3acy( z
2iur0D7
to,
Period (s
25.0 15.0 10.0 6.0 ____
so40
20-
1T--T T- -T f
404303
20-
30-20-
10-
so
40-
30-
20
101710 I Freq. rcy ( Hz)
Fiprc D- 8.
6 2
10 0 000.0a 0.. .. oofl It0 nowM.W.,m aO00O0O
10 ............... **A AS NJ SJ~ d N
t t*. V I-7t ...A . .IWI A N NA . .-
o9t .... * S *..... ...
99 ... Ng
It 1-1:tt
* LS 00 00C ... GI...... ------ 000000 ---eCa SS SS S*AA OAA OA~.ONINN AJSNN'WNtN=
9- 90:.
OW- 10 % zz Sn tt:t**t !SlnS f
4 Nf nA
L~' 09 90 00 7- W S N O 00 *S Ad 00063O 0
* epic•.-- -..- I NN V N~l
ploo-
- - S-...
ft'-- - - - - - - - - - *-
* 00
o 0 0 0 0 0 0 0 0 40•-.S ' i0~olU 0 N .0 O 0 O O 0 0
*Mfft- - NN..
412~77777 077 004-00444 077ONNW
-~ ~ ~ t * ... s. s Ie m es w s
olo ee ooto efte
tc .%% . .I I . I loll I-A ...... 0 ....... ........ ' '- ............... .
. ................. 45 -N 00- U'... ....... N...............00
.................. . " " . .
: ....................4~ ° O N 0-0 ..... -0. . ... ................
-* "--.....1-1- -1..........0N~ .. .. -"UNN . . .. .. .. .. .S00
n ... .. . * . . .... .. . .
mmm ---- - - -- - - - -- - - -- - - -
61 000 00 00 00 00 00:*m N :0 N0 00 00 00a0 00a0
hAco ~ o co o ~ o ~ c ocrr O C4~fOO CO O OC COO64 C
. .B. . . . .. . . .. .
* **m.*..........S
.o... . .SSS. . .. .. S
aSa ..
4~* S B S BS S* SB * S SLiZ X
M-0- 2O w ~t w- fea Att .g- 0
1 a8
Lis..% N, 444C .,6 5
...... ... .......... ..... ..... .. . . ..... ........ ..... . . . . . . . .. . .. .. . .
... o ooo00 OOO
* ... .. ...... ....
4aJ1 a.......... ',-.,4 a.. a -- N. ill ltll Oll al OCe l a-0..aee
Itibie eleolleOOOSO--eenallall
0a ama
0 mbIIaa *a
AJ* L 0$ Oo WCOWOO ao ONO Co~fa0..0 Coooooo o
uu, ..J oN N oN * * * * o~f.fl g -. o .c 0.. ..a NoNN - o .. , * * * * .. . . . .o-C Ct o
- a°o° * o . .. . * . .o. a .. a. m .... oa m .. mo.a a
* % C 4V U .. " %....
- a
* *aa a .... m ...

_ _ ............................ ,
- I....................
-- -- -- -- -- -- - 1 ................ .........
.ooo. ...oo ..oo ..oo . o . ooo.. . oo. . .. . . . .. . . . .;o o
.. o .. ........ . . . .. . ..oo .. . . . .. ... .. .. .. .. .... . o.o . o
... ... . ...
[" . ...........t.......................:.:....::
S------------------------- --------..
a7

* ....... ............... ......... ' . . ............
. ............ . ...... 000. . . . .0 0. . . * *
-- . . . . . . . . . . . . . . . . . . . . . ..-. . . . . . . . . . . . . . . . . .. . . . . . . . .
.. .. .. .. .. .. .. .. .. .. :7:7::2 ...............z;* ,_
... . ... ... .... ... ... .... ... .. . ....... ....... .
- ;........ . .0 . . .
- - - -0 0 0..0. ..
68

. ....... J ...... j
... .... . ......... ...
. . ... . .. . ... . -.. ... . . .. .... .. .. .
o o . ... ... . ......... . . . . . ...... . .. . . . .- - - - - - - - - - -- - *-
................... .. ...... , ............ ..... °
. .. . . .. . . . . . . . , . .. ............. ...
........................ . ............ ......
0 o o.....~o ~ a
. . . . .
S-C.-~~~ ~~~ X tOSbS tde err.S % .N...re
69

. .1 . . . . .
o~o .. ....................... . . . . . ........... o
S ... ........ . ........ ... o
-a -0000o o o o o - - - - -
7 0. . .......... . .
-- - - - -- - - - -- -- -- - - -- -- . . .. .... . .. .. . ..o. . . . o o o o oo
7t9
- ~ ~ ~ ~ ~ ~ ~ ~ ~ ~ ~~~~~H - -I -nt - ----- I--- ........
2 '~****
Wi N~NNif%0O0hl 04300 ifeeeO.-.-0* NNN.surw'.aa.%. flifl,%JNNNN * C *sierr *rrrrrvrrrrrrrrrrrrru.rrr
0 -oonoo0rifee.~r.4efhe *o.o~oeiffe.aeif-.WOOCC.--.-.-eceocW..* r.r.,,...,v ocoere. Cr Cr0 *WiWi 4 *rrriflWirr?0 V.rSr~,nrr* - ... *......*...*....** .**.**..**
4.vg~ NNNNN NtiiNNNfU~..~..0C -*000000000 C~-b---~ 1-b-I - * N#NNNN..%E%.u%.,.,.N.V...-.C C 445400 *rrrrmfrhrrrJrrrr r.,rrrifrVw%415***S** 555 *SB 5555B ** B B SB BS*B**B
0o ~j* 4 4 *CrCC,-OCo-o.-,s-,o *....oO ooo.ioOCONOC.a0
00-1-1-Cb-r-c4-
44 B NNNNNNNN445C1- SfhWSS",CU'C 045 *-e.~-1- 1- 4C400045WiW'USiflOOnrrrt S*BB*BB B*S B *I*BSSB* B ** *B B**B* *B-- S S BLiz N
0saW' Cl-I.- -y--B-.- WeirD *-oOoeQoOe.--ur4* ~I'iP~
* B NBJNNNeNNNNNNSNNNOCC COCWSSCOSrrrS.rrrrr.rrrrrr#rrrrrOil B *BS*IS*S B BSBBI*B*BSB S B **SBS**B
- r*oo*co.*o*o* .. eeeeecceeeeeerceeesl~ a NrSN... ,V,4,VibNrWNBVNr,4VVWW C COCOWiCWWiBiWi4iir 45rrsrrrr rssrrmnrrss B'
- *SS.......BB...S.S.*~BeBSeB..,S
44 ee**..00000*.oooC* 4O004000CC4ni.'iAd -* - . N.WNNNN~uES.N u'hr-Sr,,.o C C £0 4 u'rr'rusrrrrrrrrrW~rrrwsrrr01- -. CB*S*S** * ***B*B*S **B*BBSSB**SBB
B~5 0
- a r 4.44444, 4BNo.CBt4~ao40.eoeC,%rtv,*4444*44rU5rUr0*r - a NNg.%.N-,.NNr,.,%.Nrvrv rs~.-.o-.- C £0 cow, eru.rrs.u.rrrwrrrr 4.0454' w,.trW'S5.) 0 ***B*B**B**BS********SB*B**B*BS- Sn4,4n -'.3 4 N 4
~-r- 4 eeeeeeeoe.000-..rroNooeo. if0000l-CWS4.N#NN'N N1- -~ B NNBNNSJNNNNNB.,r I~~i - C C Cr COO ororrrrrrrr rrrrrrrrrrrr- OBSB ****BB******S*BB.IBS**SS*S*S
I
VS -0000000000-rN4OSJOoeOc000 o.orSAa,4 *OCC--e--B-CeeoeOP-* %NNN'NNN-.0 14 C'CW'W) Cr05 * * 444 4*4*44 * 444444 * * *N------------II SI Bess S**B*. BB **.B*B**BB*BSB* B
Li 0000000000000000000-0401--0r0000000000000000000000o . . OOOoooceoe000000000000B.-40 00000000000000000000000
y~ CCC 00'* C -@75*5 4 N
CD 000000000000000000-4 4%l-..04 000000000000000000000OOOC.00C0000000000B'00C44 *440CC 0000000000000C000000
* 0 C I.'C~0o r4rS -
5S OoooooooOoOooOaooco-0S'OB--.ifrooOaOoOooOoOOOOoooOoaO- 0 OOOOOOoOOOOOOOOOOOOOCtNB 40 00000000000000000000000
Li if... 0014e.-e
0SWB- I~C hio Cuss, a eoooooooOOoOooOooOO--0 CO-i. 4000000000000000000000- * 00QO0O000C~O000O000O0 CS 44 000c.00c.OC'000000000000000
oOeoooooOfoeoacoccoC 44Bb-S000 OOOOOOOOC,000000000000
a
K0 *t~B.CC.0C.tO.CNifCCCe0l-V=,VN.CS%,N04r1-O.B*0fW4e0~~B4~
C 0-. *c&Cesoer.eaoeo.rN..r.,oe*,Nc-ifC4-OeCnb-o94Li .. 4J1- ifLi SCoftnceOefhlhlb-.b-b-CtCWOO4C4S4SNNSNNN4 On 'NN'4NiBNNNB
a-* hi *C1-fhl0aII4tCb-~0W 0-N%.r..-e. C.-BB,*OCBW* o..ffl.S4rCB-eo
- * We CC.. aif .rrrrrrrrCCCCC.CC.Cb-1-b-1-b-1-1-1-B-1-**00000
-4
71
_ _ a.. ... aaa maa... . ..aaa
ll l e - --- g es $,.4
A ----- O ------- ea~i' %se 0fstfa*-t0 0 0 0 0 0 0
]m w
III lsI I VI U ft
- - - - -- -- - - - - - - -I ~ l l l ll l l
ob
efa" -~~. -aaaaama-aa
00
s-a"mi *.r..ea. .. . . .. . .. ......sa e a c a a ~ n r . .... ~o........ 222
T T-ae a t O a* g 1.
72
in!0
a;r N l b lllv t a r-0 C ~ s 4 0 m 4 r rr a 4 raf

- .....UU' * . 0 0 . 0 0 0 . . . o - w . 0 0 05 oJ , 4 , U
3 -
• fo Bio
o -
* iil0 0 00 . 00 . 1 'l4V
* -,-- oo ~ o o
0hi ° o°° ... e. . s..uo°°oo*°*°°*°°°
OW °
II .. I .. .. l I M ... -- I .3 --U' SI
* ......
eeocs.s~~
-W
Cf lolli
0 -:~r ~ -~r i 0 ~ e. e:
I-C . IIII- IIII*ii
a
7 oCe., WVo e ~ e l o ~ o e e
a
04 ..- . .. .. . :C: ... .. - 0. . . .. .. ... ....
*Le eoefl * *poe**o lo oe
-i 7 IVl i l ~ l l l o l l l i
VI74
* o W. oooe0 . A 3.03 * a S p
,
',
* - 0o o o . 0 0 0 0
o i
* oooo oooo
33 oSo P 0oo ooo
* - rw d, Jb O - N i' U V W ANo oA N 'Wo. o .
* S S S oSoo © o oo
- 75
0
Ir or-
asSo
I..A
. .- . .. ..
a
Wa0P ft -
K ~ ~ ~ ~ ~ ~ ~ t 'aa.ssSa*ni. . SJ .Vf. ...0lf
'SC Sp
S~fl *5** 076

o~t Oftii
cc. tooo c W e..o ~ eti.o o o
©oNo o -- o Co
OoUo 4 fu oo ~ o o o
o44 .-. n&oC: ....... A......
........................ ....
o Oo .1wC*
77
-. a. o
-i ..- OS -via~ie..C.~CO4 NN-- O00. .... .. . . . b . ... n f- -l }i S ,.' . . .I iI i" . - . . . . rmn
C~4 * U~g.

04 40 00 . Ui.0 0 ' N- 00 0
U' e0.-r- 40 fJ.
4 **
coB Jr 0N of-p 4 V . % .. O 0
U'e • 4oe% )
* S*eSS
..... ila.0$'4 .. 0.i'44 4%0 rti....00
* oo 44-4 . .........- oJNoo
l~ S
I .-

A PII N 1) 1 X 1:
III GilIISOIATY ION SPECTRA FOR FILD WAVE D)ATA
Figures E-1 to F-44 show high-resolution spectra forpressure gages 1 to 5 at Pt. Mugu, California. Dateand Sigli ficant wave hcight are indicated for eachf igure.
79

Period (s)
25.0 15.0 10.0 6.0 ___
so- (64)40-
3 -
20-
A oLj
(67)40-
30-____
E so- (65)40 J
20-
00
Lj (59140-
30-
20-
504 (74)40-
30-
20-to-i0.06 0.10 0.14 0.18
Frequencw I :-z
Figure E- 1. Signi fi cant wave hig iht 9)3.6 cent imeters, (3. 1 feet)10 April 1970, 2206 hours.
80

25.0 15.0 10.t3 6.0
so - I
40-
30-
20-
50-
40-
30-
20-H
10
40-
20-
10
40-
3 0-
20
104 A
40-
30-
20-
0.06 0.10 0.14 0.18
Fr-,cuency H( H)
Figure FI-2. f ifiCAnt w Ix'o oi glt S4. 3 cont i ncters 2. 8 footl2[0 Apii 1970), 09 28 hiour..
81

Period (s
25.0 15.0 10.0 6.0
so-
40.]
30-20- 1I
504
204
40-
30-C 20-
to--
C 502
40-
30-
504
30-
0.06 0.10 0.14 0.18
Frequency (Hz )I
Inr I , S i gii fi C '11t W~ v e he Cigt 8, I! cetim"e tr 2. fet)\pr ~ 1 o I I I- hur
82

Period ( s)
26.0 15.0 10.0 6.0Ii I I
40_
20-
10
40-30-
jai - Ji
I I I iL MI L a
E 5040
30-
20-
10-
50-
S 20-
1 l 1 , 02 n l L
40830-_
10-_
0,08 0.10 0,14 0,18
Frequency ( Hz )
Iiire 1F-,1. Significant wave height 10.5.3 centimleter-s (3-.5 feet),
21 April 1970), 00)28 hotirs.
83

Period (s)
26.0 t6.0 10.0 6.0
60_
40_
30_
20_
60 "
40_
30.
20-
N
to-
E 60-
40-
30-
20-
10CL
LU 40_
30_
20-
50-40-
30
20-10 L I" I l ''I
IJ I0.08 0-10 0.14 0.18
Frequency (Hz)
Figure E-5. Significant wave height 95.2 Centimeters (3. 1 feet),
21 April 19-170, 0229 hours.
84
Period (s)
26.0 15.0 10.0 6.0T T I 160_
40_
30_
20-
10_
50-
40_
3020_
CYE 60-
40_
30_
C 20_
o 10_
C,7
uJ 40.
30_
20_
604
40-
30-
20-
0.08 0.10 0.14 0.18
Frequency ( Hz )
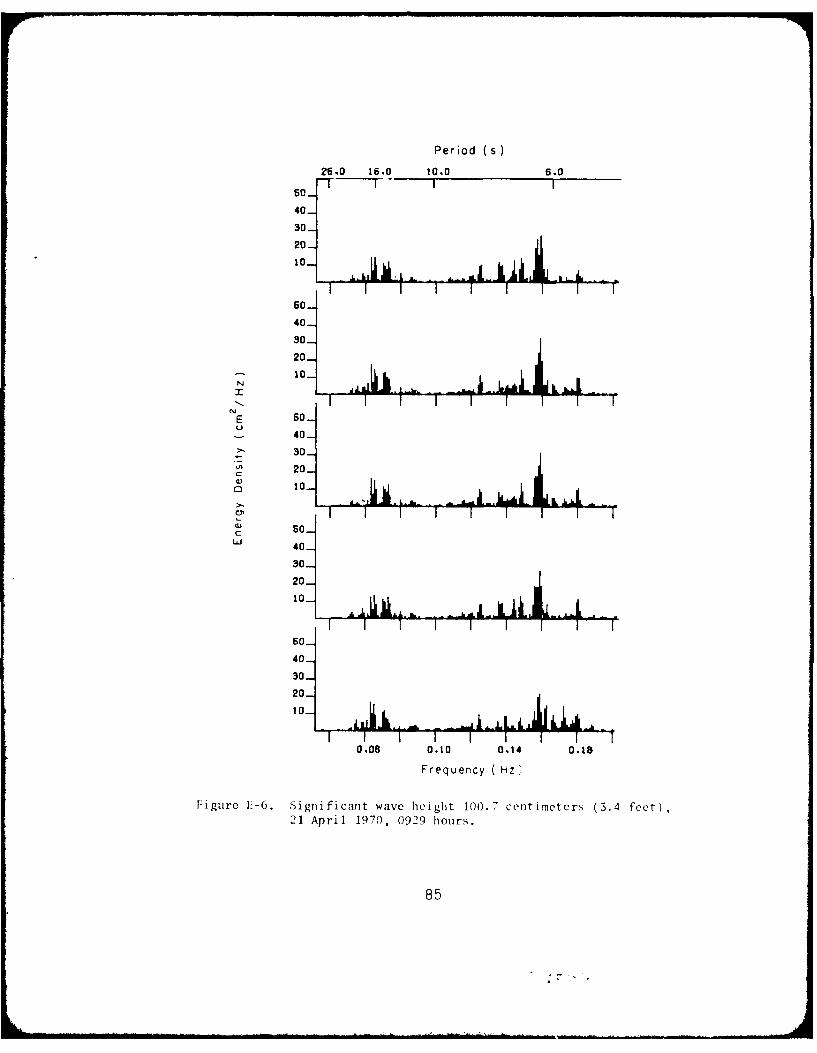
Figure L-6. Significamt wave height 100.7 centimeters (3.4 feet)21 April 1970, 0929 hours.
85

Period (s)
25.0 16.0 10.0 6.0
404
s-
20-
50-
30-20-
E
40-
30-
C 20-1
20-
30-
60-
40-
so020
to
0.06 0.10 0.14 0.18'req,ency Hz
Figuire F-7. Sigiificanlt wave height 94.- centimetcr. 3,.1 feet)21 April 1970, 1229 hours.
86

Period (s
25,0 15.0 10.0 5.0I I I
50_
40-
20-
40_
30_
20-
C. ii
E 0
40-
30_
c 20_
40
2O-
so-
40_
so-
20_
to_
o.06 0.0 0.14 0.18Frequency ( iz)
Figure E-8. Significallt wave height 113.8 centimeters (3.7 feet),21 April 1970, 1829 hours.
87

Period ( s)
25.0 15.0 10.0 8.0
10_to-
30_
20_to-
I" I1 A I 1 I
50-
40-
50_
20-
to-S 10.-I- ...L AII
E so-
40" so-
20_
' ~ I '1-I 'I I II"40_
30-
20-to_
403O-
2O-
to-
0.08 0.10 0.14 0.18
Frequency ( Hz)
FLigure F-9. Significant wave height 85.1 centimeters (2.8 feet),21 April 1970, 2129 hours.
88

Period (s)
25.0 15.0 10.0 6.01I I
60_
40-
30-
20_
60-
40-
30-
20_I- O_
40
20-
c
jI Id Iso-
tAJ
40_
30 J20-
101
40-j
30-
20-
1060 1 0 1 t
Frequency ( Hz)
Figure E> 10. Signi ficant wave height 109.3 centimeters (3.6) feet),10 June 10970, 1421 h1ours.
89

Period Cs)
25.0 15.0 10.0 6.0s ! I I
so
30_
20 _
30
20
N
E 54.0
30_
20
Ld
4.0
30
20
Ic 06 3i 0 1714 o,11
Freque ncy ( Hz
Figure -I. Significant wave height 117.9 ce nt Limcte (3.s t-,,, t1n .June 1)70, 17.31 hours
90
Period (s)
25.0 16.0 1.0 6.0
50_1
40_
30_
20_
so-H40_
30_
20_ LLN to
E
40-
30_
20_C3 10 _ ii I idi a.. n lflhr hu l
40
30
to-
so_
40-30 _F20_
0.06 0.1l 0.1i 0.1b
Frequency (Hz)
Figure F-1.'. Sigl nificant wave height 11.5. 1 centimeters (3.7 feet),11) ,1une 1 l71 ), 2014 I hours.
91
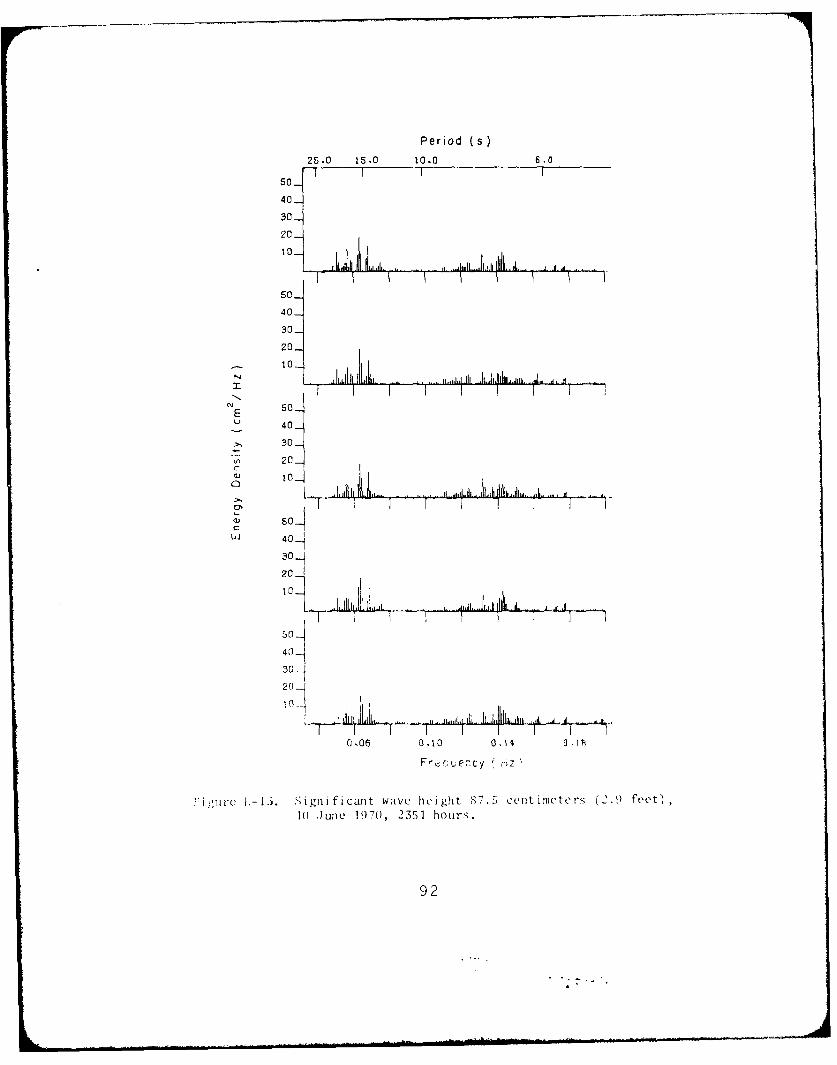
Period ( s)
25.0 15.0 10.0 6.0
50_
40-
30_
20_
50_
40_
30-
20 HIILI II I . ,,j ] .1 , h II i 1
E 50_
u 40
30_
20_;20
C!
C I I r I ! J ] - "
w solcUJ 40_j
20-
0106 0.1O 0.14 0.
Fre.aje-cy i"F , r , ir-7 .. , ,.
tr I i-3. ign i fi c at wavec height 8'. 5 ceitimeters (2.9 feet)101 June 197(), 2351 hours.
92

Period 5s
25.0 15.0 10.0 6.0
40-
30-
20 - j
so_40-
30-
20 ..
40-30I-20-to-l
50-
Ui 40 -
30-
20-
0.06 0.10 0.14 0 .1I6
Frequency H
Figure F- 14. Signi f icnt. wave lii (,,it '93.3S cent imeters (3. 1 feet'11 JUjje 19)71), 0.3(01 hiours.
93

Period (s)
25.0 15.0 10,0 6.0S I T
50
40_
30_
20_
,D , II ..II . . .... ii ii i
40
40- 30
20
to-
1 0
40-
30-
20-
1 0 -I 1 d Ii --I
I] i l .130-
0.06 0,10 0,14 0,18
FI: rIL- 1 . Si gnit i cant wave he ight ,81.0( cent imetervs (2. ? feet,11 June 1971h, (1( 31 hours.
94
20-
Fi .- c q ,id;-

Period (s)
2S .0 15 .0 100 6.0
so-
40-
lI...d -AAA- I~I.J~[ I
50
II,
9 5
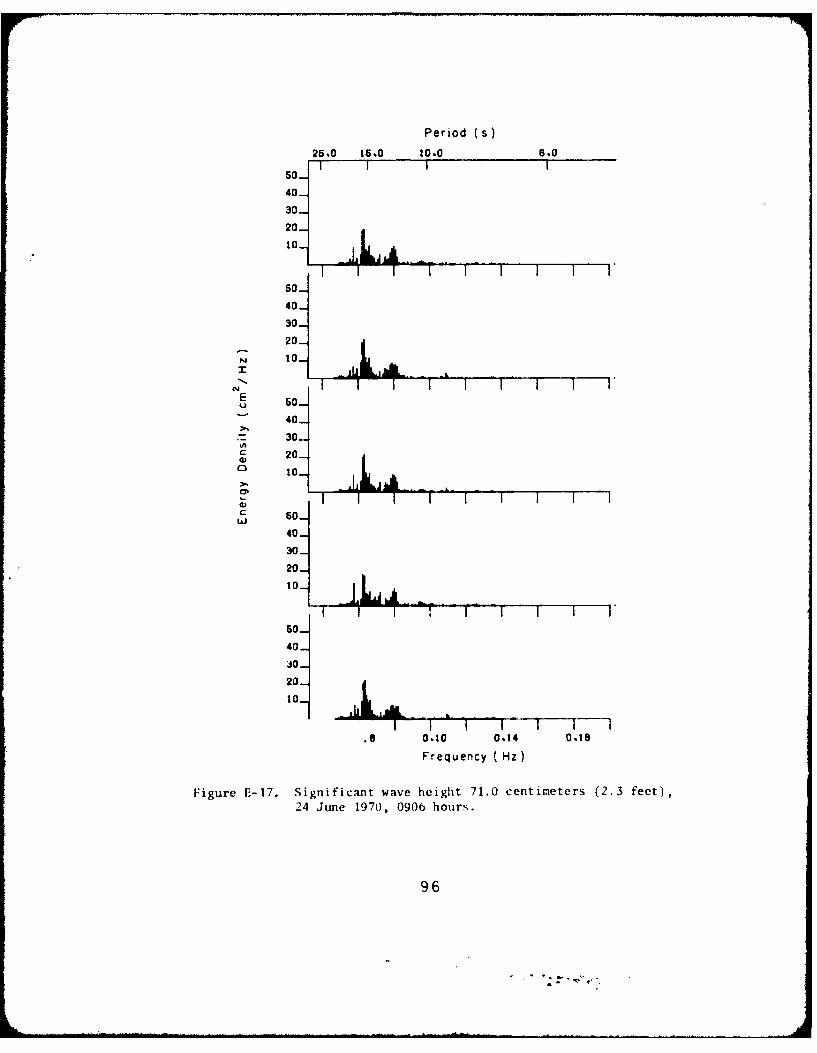
Period s)
25.0 15.0 t0O 6.0I I II
50-
40-
30-
20-to-
I I I I I I
50-
40_
30_
20
N to
NE so-
404
S 30_20_
to-
I- I I I I ILA 50--
40-
30-
20
to L
50-
40_
20]
0_
Frequency (HZ)
Figure E-17. Significant wave height 71.0 centimeters (2.3 feet),
24 June 1970, 0906 hours.
96
.• ,• ,'t

Period (s)
26.0 16.0 10.0 6.0
50_
40_
30-
20_
10
s0-
40_
30_
20-N 10-
Eu 50_
40_
-- 30-C 20-
40_
30-
20
50_
40_
30_
20_
0.00 0.10 0.14 0 Os
Frequ~ency ( Hz
Figure F-18. Significant wave height 69.3 centimeters (2.3 feet),24 ,June 1970, 1206 hours.
97
.' t*L

Period (s)
26.0 15.0 10.0 6.0S40 1 I I I
40
30_
20
50_
40-
30-20
No to
F 11 ,40
30-20_
0.
40.
30_
20-
10_so-40-
30-20-
to __ ~
0.06 0.10 0.14 0.18F'eque-cy (hz)
:i.,oire E-19. Significuit wave heiglit 79.5 centimeters (2.6 feet),24 June 1970, 150,, hours.
az

Perioa (s)
260 15.0 10.0 6.0
so60j40_
30_
20_
to-
40-
301
20
10
E soU
40
20
o 10 1 I .L
Lii 40-1O
JO2011
60-4
40-
20A
0.06 0.10 0.14 0.18Freq.; .:y ( .K:z
F igire V:-20. Significant wave height 72.5 centimeters (2.4 feet),24 June 1970, 1807 hours.
99
I

Period (s)
25.0 15.0 10.0 6.0
40-30-20to
so-40-
30 L10-
40-
30so20-
40-so-
2010
0.60.1
Figure E3-21. Significant wave height 70.1 centimeters (2.3 feet),25 .June 1970, 0007 hours.
1 00
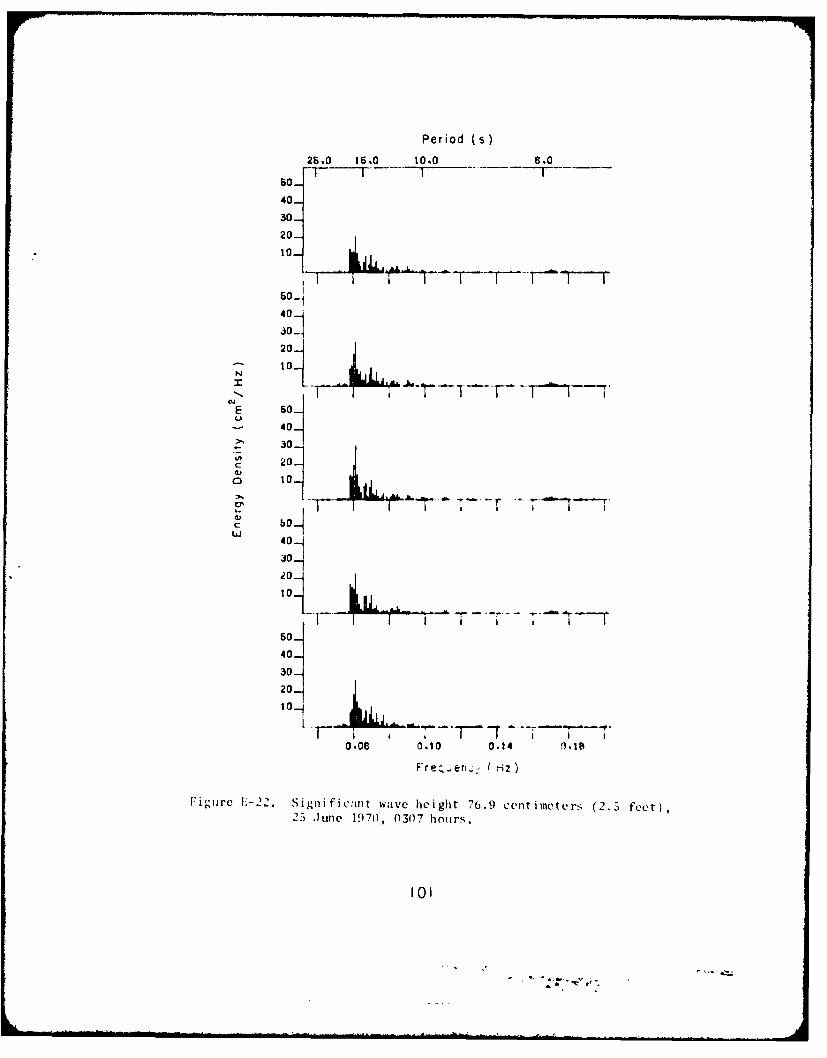
Period (s)
26.0 15.0 10.0 6.0
60-
40-
30-
20-
50-I
40--
30-
20-1" 0 --
E 50-
30_
40
c 20_
0 104L
50-
40-
30-
20 1101
0.06 0.10 0.14 9 ,18
F r e ; ,. ,e n :.:, H z )
Figurc - 22. Significant wave height 76.9 centimeters (2.5 feet,25 June 1970, 0307 hours.
101

Period (s)
26.0 15.0 10.0 6.0I I II
60_
40-
30-
20
50_
40-
30-
20-
N to
E
u 60
40
30
4) 20-10_
CO
40-30-20
to
I I -/ I I I~~
50140-
30-20-
0.06 0.10 0.14 0.19Frequency , Hz)
1-igure Ui-23. Signific;mt wave hei ght 66.7 centimeters (2.2 feet),25 June 1970, 1808 hours.
102
Ca J

Period (s)
25.0 15.0 to.o 6.0s I ! iI
40-
to-50-
40-
30-
20to
E
S 50_
40j30-
20-
4) 1 -
C
CUi 50_
40_30_20_
t0to-
60_
40_
30_
20_
0.06 0.10 0.14 0.18
rquerncy ( F.z
Viure E-24. Significant wave height 70.3 centimeters tz.3 feet),25 June 1970, 2103 hours.
103

Period (s)
26.0 15.0 10.0 8.0
S650_
40_
30_
20
10
50_
40-
30_
20
10
5o-
> 40_
"- 30_
20_to-
L 60-
40-
30-20
10
40-
30.
20
10
0.06 0.10 014 0,18
Frecyuency (Hz)
lFigure E-25. Significant wave height 61.2 centimeters (2.0 feet),26 June 1970, 1758 hours.
104
. -, . v'. . *-'" ;.

Period (s)
25.0 15.0 10.0 6.0I I I50_
40-
30_
20-
10 I~aso-
40-
30-
20-
10-
E 50_- 40-
30-
20-
10_
30_
.0 0I10 04,.126_o Tun l97, 235 hors
50-
40_
20-
11 O.10 0,14 0.t8
Frequency (Hz )
Figure E-26. Significant wave" height 79).7 centimeter-s (2.6 feet),20 hmle 1970), 2358 hours.
105
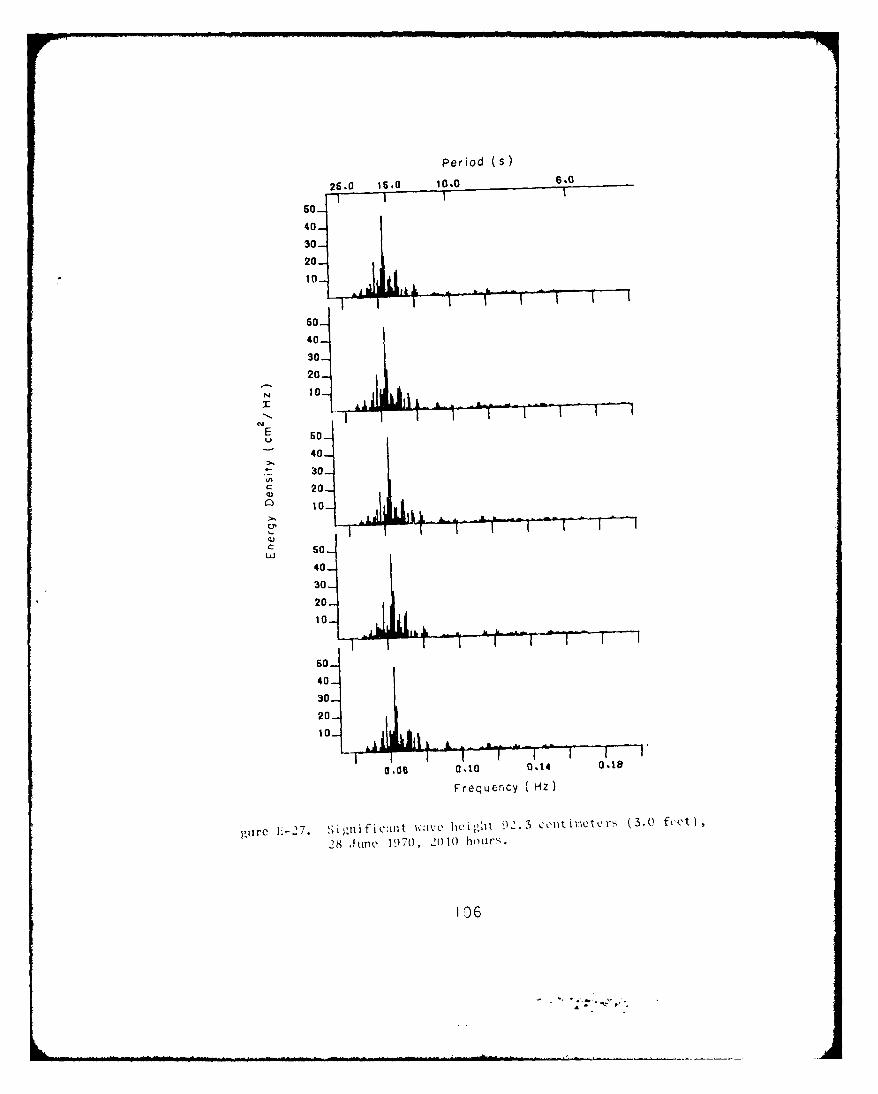
period (S)
25.0 15.0 10.0 6.0
so0
40-
30-
20-
10
40
4010
SO.u. ,

P e r; od si
25.0 15.0 10.0 6.0
60-
40-
30-
20-
40-
30-
20-to-
2 50-40-
30-
20-to
so-0
30-
50-
30-
20
100

Period (s
25.0 15.0 10.0l 6.0
40-30-20-
so-~
40-30-20
10-
40-
30-
20-
.0
2008

Period (s)
25.0 I5.0 10.0 6.0I I I
50_
40_
30-
20_
to-
50
40_
30-
20.N
I 10dtO_..iJI...
EU
- 50-
40-
C 30_
toI
C
LL 5 0 _40_
30_
20_
to
40_30_
20_
0.08 0lto 0.14 0.11
Frequency ( Hz)
Fi ,u: IE-30. Significant wave height 04.0 centimeters (2.1 feet),1 November 197(, 1607 hours.
109

Periol (s)
25.0 6.0 10.0 6.0
40-
30_
20
40
30_
20_
E 50U
40.
so-0
C 20
o 10
40-
30
20
s0-
40-
so-
20-to-_
0.06 0.10 0.14 0.1
Frequency ( Hz)
Figure E-31. Significant wave height 80.9 centimeters (2.7 feet),
16 November 1970, 1907 hours.
110

Period (s)
25.0 15.0 1O.0 6.0SI I IIISO
40-so-
20_
so -
40_30_-
20_
E s0_0
- 40_
S 30-
C 20
o 10
50£.T..kI~ ~~-
40_
20-
|0- -. I TILL-+Ll "I k 1 ,,,
0160.0 014 0140N
so-20-
0.06 0.10 0.14 0,11
Frequency ( Hz )
Figure E-32. Significant wave height 63.0 centimeters (2.1 feet),17 November 1970, 0407 hours.

Period (s)
25.-0 15.0 14.0 0.0
40-
20
50-40-
30-- 20 I
to hi
,~ 40-a) 30-
C
* 0-
40-
20-
40-
0.06 0.10 0.14 81Frequency ( HZ)
Figure E-33. Significant wave height 74.6 centimeters (2.4 feet),16 December 1970, 1700 hours.
112

Period (s)25.0 15.0 10.0 6.0I I I I
s0_
40_
so
20
10_
S I I I I I I I
60_
40_
30_
20_
N" 10_
-S-
E so-U
40_
c 20
10_
,.''I I i i K I I
so4O-
20: to
40-
so-20-10-
0.06 0.10 0.14 0.18
Frequency ( Hz)
Figure E-34. Significant wave height 95.3 centimeters (3.1 feet),16 December 1970, 2000 hours.
113
- .- -_ .... , ,

Period (s)
26.0 11.0 10.0 6.0I I II
10-
40-
30-
20
N 10I __ _ __ _
o 0-
40-
30-
20-
100i E tr i i I i T
0' 8a11k
40_
30-
20
10
40-
30-
20_
3N.
20_
0.0' 0.10 0.14 0.18
Frequency (Hz)
Figure E-3S. Significant wave height 85.3 centimeters (2.8 feet),16 December 1970, 2300 hours.
114
..-. V ';

Period (s)
26.0 15.0 10.0 6.050_
40-
30-
20-10_ 1III~ '~~~
60
40-
30_
20Ni 10
E60_
40-30-
C
o 20-
10-
Q1)
20I Jhf. c 1 *~' I
50_
40-
30_
20-
10 0 0.10 01
60-
40-
30-
20-
0,00 0.10 0.14 0.16
Frequency (:-z)
Figure E-36. Significant wave height 90.9 centimeters (3.0 feet),17 December 1970, 0200 hours.
115
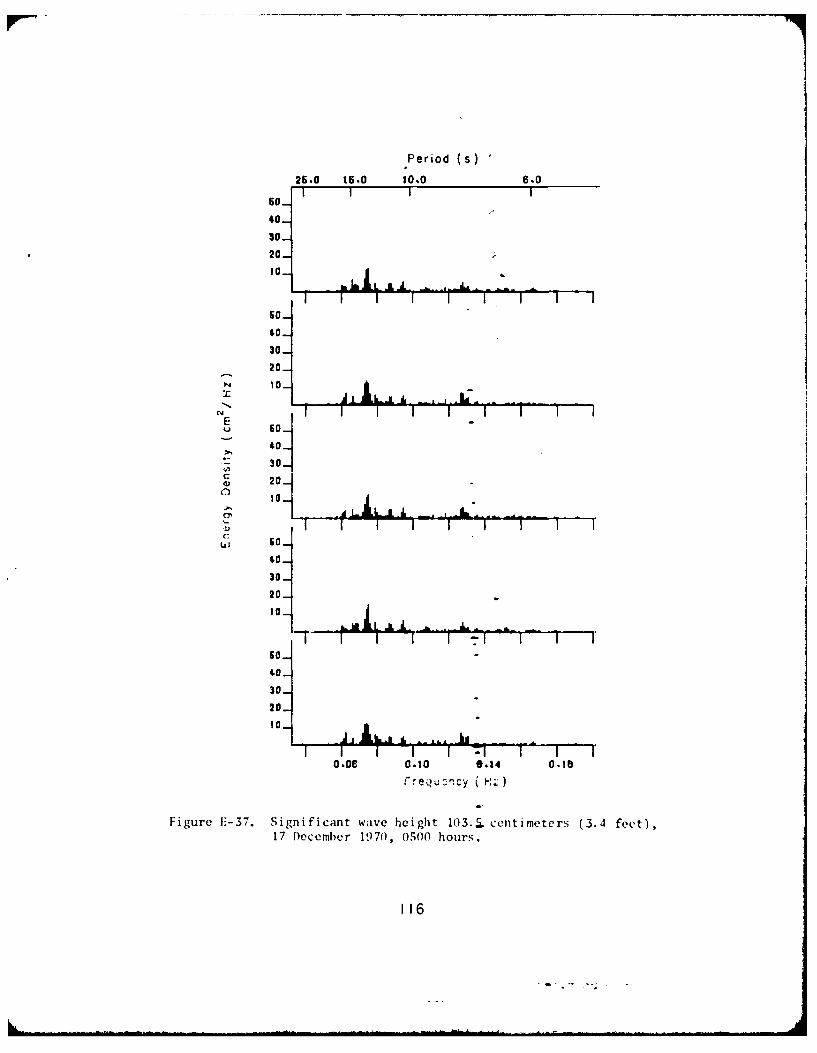
Period (s)
25.0 16.0 10.0 6.0I I II
60_
40_
30_
20-
10
40-30-
20-
N 10
"E.,,, 0€0 I I I I . Iiw. i I
t lkt L: 020
30
20-10-
I 60-40_30_
20-
10 1
50-40-
30-20-
10-
OOe 0.10 0.14 0,1tf."equ.nncy z ,';
Figure E-37. Significant wave height 103.1 centimeters (3.4 feet),17 December 1970, 0500 hours,.
116
-- . ... . . .... .. . .. . . II ]lII . . . .. i+ -
..... .. . .. ... . . I li .+ O .. . ....... iNo...

Period (s)
26.0 1 .0 10.0 6.0i I I
60_
40-
30-
20-
to-
so-40-
30-
20-- tO- . Ij
"- I I i I -i-~ I'
E 50_U
- 40_
30
C: 20.
4,.
60_
20-
40_
30_
20
10
0.06 0.10 0.14 0.18FrequYncy (Hz)
Figure E-38. Significant wave height 120.7 centimeters (4.0 feet),
17 December 1970, 0800 hours.

Period (s
25.0 16.0 10.0 6.0 ___
so0
40-
30-
20
10
60-
40-
30-
20-
40-
- 30-
c 20-o 10-
00-
40-
30-
20-
20
40
0.06 0.10 0.14 0.18requency ( Hz)
Figu-re- E-39. Si,,wjir 4 ic;jint wae iight 97.4 centimeters (3.2 feet),17 rlecombe r 1970, 10,14 hours.

Period (s)
25.0 t5.0 10.0 6.0I I II
50-
40-
30_
20-
10-
40-
30-
20
I I I I " I I I IN
E so-40_
30-
- 20-
I I I T I J..i . .. . .1cu
50-LLI
40_
30-20-
to-
50_
40_
30-
20
tOt
I I I I I I0.06 0.10 0.14 0.19
Fi gure b-)10. Significant wave height 93.4 centimeters (3.1 feet),
17 December 1970, 13,14 hours.
119
~i

Period (s)25.0 15.0 10.0 6.0
50_
40_
30-
20_
to k IL I I
50-
40.
30-
20_lo-lE 5_u
40_
30-
200 to
C: 60-L&i
40-
30-
20-
10-
40-
30-
20-
10_Io " I JI IL I , i - I
.6 0.10 0.14 0.18
Frequency ( HZ)
Figure L-41. Significant wave height 91.2 centimeters (3.0 feet),17 December 1970, 1644 hours.
120
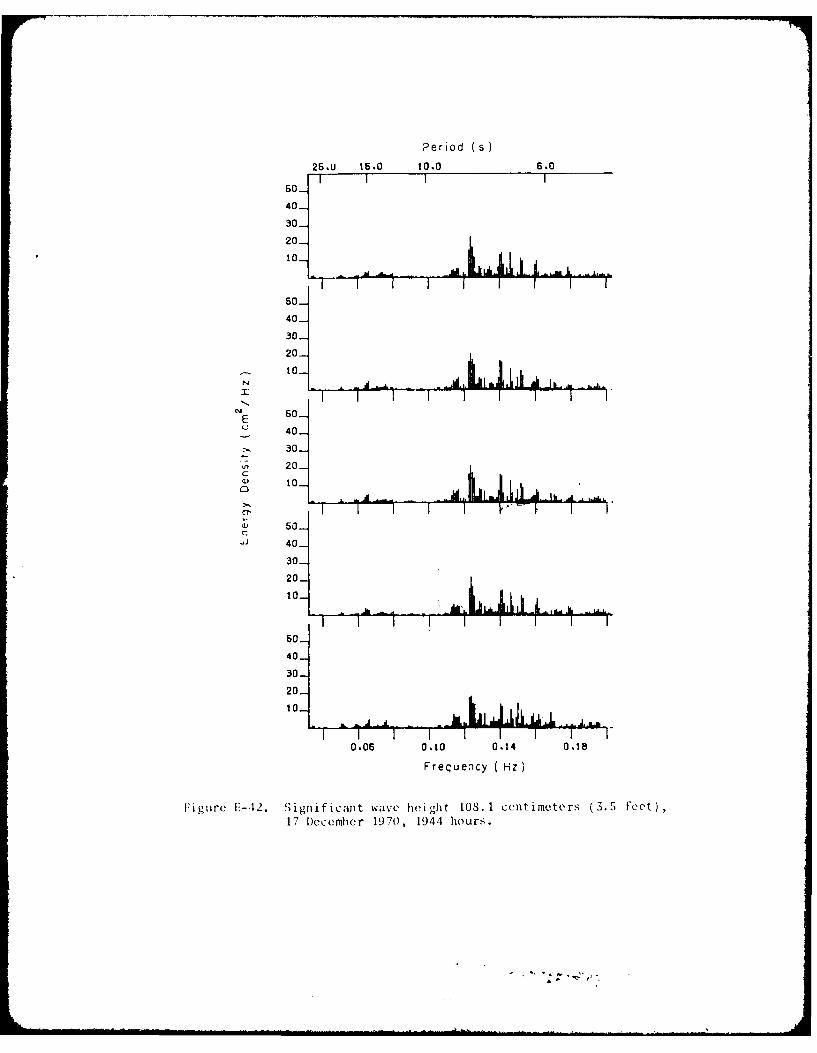
Period (s)
25.U 15.0 10.0 6.0I III
50_
40-
30-
20.....
10
-l I 1 150_
40-
30_
20-
10-1N Al .
E 0 _
40]
30-
0 20-C
10-
60-
40_
30_
20-
10-
I kt1JrI I I .
so-
40_
30-
20_
0.05 OtO 0.14 0.18
Frequency (Hz)
Figure I-42. ';ignificaut wave height OS. 1 centimeters (3.5 feet),17 December 1970, 1944 hours.
M " " *-EL,-
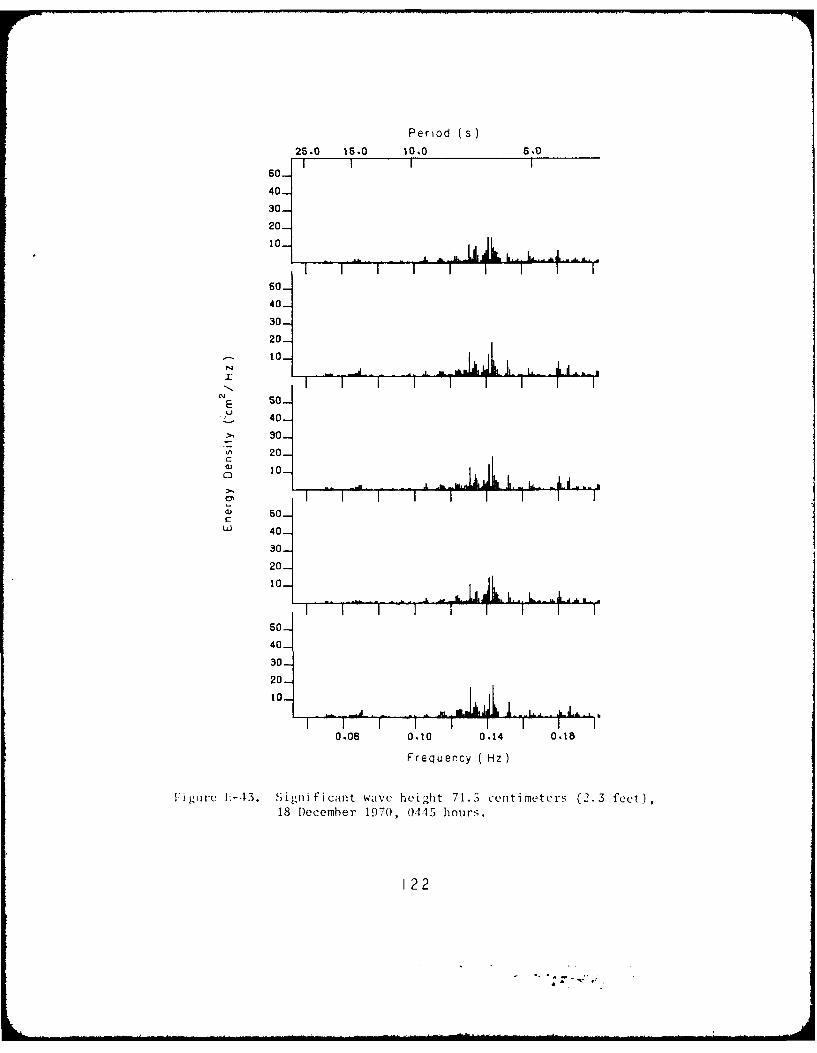
Period (s)
25.0 15.0 10.0 6,0I I II
50-
40-
30-
20-
40-
I - I T I 1 l I I
50-
40-30-
N 2 -
SI I I I I 1 I I4 50 -
20-
a0 10_
40l
30-
20_
50-
40_
30_20-
I I I IV I0.06 0,10 0.14 0,IS
Frequency ( Hz)
Figire I1-43. SiLgnificant wavc height 71.5 centimeters (2.3 feet),18 December 1970, 0445 hours.
122
-d. AL~

Period Cs)
26.0 15.0 10.0 6.0I III
6 0 _
40_
30_
20-10- 11 L Ji-Ii
Ali I&JL a~LiJd~~1 I I II I I I
50_
40_
30_
20-to_il , L
N 1
E 60_40_
30_
c 20_10_ -~L i
! I I I I I I i i.1)c 50-
40_
30-
20-10_ idL
I I 1 I I I I I I50_
40_30_
20_
o I I I I - I I -
0.06 OtO Ot4 Ot8
Frequency ( HZ)
Figure E-44. Significant wave height 66.9 centimeters (2.2 feet),18 December 1970, 0745 hours.
123

41 c e-.4.
>1. to m1.~ 41 1U
-I v~0 if 414 w .4
lo 1- l ,b W 4-. L.4 ~ 'A ( Ceto $*~ ~ 4, 1 o.'. ~ 4 0~. to 41 to.44~ I).4 ..-4 ~ , 4,4 0 4 1 -
03~~-.~ 0 w ..4'S ' 44
C:4' 004. 04 -41r to (LIO~4 4
t.0
w x ~ 4 01 44i w0 i ( S4. o00 9 04 J 4 IV 'U 0 'A
:1 s; Is. 1~4 0 IV Q0rM .44 0cw .0 0 V 1 M .. * . 0 fo r ts. 5 m .4.00~0 4 ~ 4 4
C~~$ 0i.-jo 0 - ~ . ' 1 0 so-oA U, 4*-.- 0o .- 0 U 0~4 1 1
.4 ujYA- (I4 4-A'U aO M Ia,14 41,- c 0444 0- E0 44. -0
01p~ 4 fi04w 0 0 MA 444 040 "1 41 -.
*U. *.,A (Is 0 v0.f r_.. 420 (U 11. 0CLj W- 1:. *. -4 0 .0
0'-4 IsC. .444 m1 w wm 0444 4-0. .Jd 0 0 .0w r-10'4 ' 41'. A44 u 00 44 1 . 1C4Q1 0
V14N4 Q). V 4-~04' C c4J04''1 -- ~W. 0 .. 0 0 J -'0
..-.. t-4 014 L; wi. ri P44 0. -.0 diu w .44'-4- *.-Ou1'. C '01 4 4. *.0 J
.41 10. -41 .41 104 44 **0 40. 444 .414 04,41.4141 -4'04'0 4.4 .4 4-4441 -- W4-04-0.-4 ~.A
V)0 %) 00 S 1.44 'v W _ga) .> C:0. 4 en> 9 e 4 0 6-V M C
&~ 1) 0 4(st-r >- W $.CC0 03 m >
W4 .0 41 w u- H 0 ,
41to w1401 4 -14. 41 :1 0.4 A 4 4cc
444Is 04 cm414.41 4 rdI 4 4.414-.4 v4W-t41 C tn >1 toI 4 " 4
410~d '4 00 4141410 0 be 1 0 'a444U C 41.3~1 x (1. u c 44M 0 >. )t C. V
- r w- 0CJ 4 4' a4 %w .0 r. I 0 W-0.4*J 41) 044~444 11 ^41 to 0444 4 w v
* 41 0144 41~1 * 0 o14 ' o mX4 to m'4~~~. . 0 440
U.C 0 "14 0.(*4 4- 40 > >- 0 .. 4 4 " 0> -4 0 > 644-- v -
40 0 1. 0 ''- C0 . OU 4 0
, *i z4.0 14414 . 414 44141z4 0. 4 >.4 E* 0S 41 11- 0>'4
1.~~~~~ m 0-A44~01 -j4
I. "0~4 .~1 " 044 4 0441.' tA U to
::0 CL
0 000 ...4 4 04 &E 00.QC Q44-C1O0"- GOK..OW~ 0 CL
0 .-44~~ ul-0V01.'
u44 u414 .9 ' 440 V.~- 4t4 40 L.4.g
.10041 .w s.to 04 *A4 W l 0 :1,440 u U . ~ .
U 04.0 w r
C ,4 u0 .. X.