Embed Size (px)
Citation preview
©FUNPEC-RP www.funpecrp.com.brGenetics and Molecular Research 13 (1): 2048-2059 (2014)
Evaluation of the biodegradability of petroleum in microcosm systems by using mangrove sediments from Camamu Bay, Bahia, Brazil
A.C.F. Santos, R.P. Rezende, M. Brendel, S.S. Souza, A.C.S. Gonçalves and J.C.T. Dias
Departamento de Ciências Biológicas, Universidade Estadual de Santa Cruz, Salobrinho, Ilhéus, BA, Brasil
Corresponding author: R.P. RezendeE-mail: [email protected]
Genet. Mol. Res. 13 (1): 2048-2059 (2014)Received March 26, 2013Accepted November 13, 2013Published March 24, 2014DOI http://dx.doi.org/10.4238/2014.March.24.9
ABSTRACT. We investigated the biodegradability of oil in mangrove sediment from Camamu Bay and measured its effect on the bacterial community. Microcosms of mangrove sediment were contaminated with 0.1, 0.5, 1, 2, and 5% (w/v) oil, and the microbial activity was compared to that in uncontaminated sediment. The evolution of CO2 and gas chromatography showed the mineralization of oil compounds, which could reach 100%. Bacterial diversity was determined by polymerase chain reaction using a set of primers for the V3 and V6-V8 regions of 16S rDNA. The band profile obtained by denaturing gradient gel electrophoresis of the amplicons that were obtained for the V3 region showed a negative correlation between band number and oil concentration, whereas that of the V6-V8 region showed a positive correlation between band numbers and oil concentration. The latter also gave similar results for microcosms that were contaminated with 2 and 5% oil. These results demonstrate the mangrove sediment’s capacity to recover from oil contamination (in
2049
©FUNPEC-RP www.funpecrp.com.brGenetics and Molecular Research 13 (1): 2048-2059 (2014)
Biodegradability of petroleum in microcosm using mangrove
vitro) and suggest that native mangrove microorganisms contain enzymes necessary for the catabolism of oil.
Key words: CO2; Denaturing gradient gel electrophoresis; 16S rDNA; V3 region; V6-V8 region
INTRODUCTION
Increasing consumption of fossil fuels led to the depletion of resources of Brazilian onshore wells and to external dependence, and it prompted offshore oil exploration, which led to the discovery of vast offshore oil basins (Lucchesi, 1998). Currently, about 90% of Brazilian oil production stems from offshore sources (Petrobras, 2012). Oil emanations on the outskirts of Camamu Bay have been known for some time, but an increased interest in its oil potential occurred only recently (El Paso, 2005; Albaigés et al., 2006).
Soil and sediment contamination with petroleum hydrocarbons can affect the com-munity’s structure and functional diversity of resident bacteria and thus may have a major eco-logical impact (Kathiresan and Bingham, 2001; dos Santos et al., 2012). Mangroves (MGs), because of their location, are especially subject to impacts by offshore oil production activities that include exploration, production, refining, and transportation (Burns et al., 1993; 2000; Seabra, 2001; Li et al., 2007).
The respiration-caused release of CO2 is the main parameter to measure the microbial activity of soil and has been applied in environmental impact assessments (Alef and Nannip-ieri, 1995; Machulla, 2003; Varma and Oelmüller, 2007; dos Santos et al., 2012; Silva et al., 2012). The amount of CO2 released indicates mineralization (Moreira and Siqueira, 2006). The controls made with CO2 emissions do not guarantee universal results, and each result must be analyzed according to the type, texture, and soil/sediment structure. These variables can affect the microbial populations because they affect aeration, water infiltration, pollutant retention, and mobility of resident microorganisms (Margesin and Schinner, 2005). The degrading gra-dient gel electrophoresis (DGGE) technique is widely used in environmental impact studies because it allows the visualization of changes in microbial community structure as a function of environmental change (Muyzer and Smalla, 1998). Molecular biology techniques in conjunc-tion with other biological and physico-chemical parameters demonstrate that microorganisms are closely related to essential functions that maintain the ecosystem balance (Dworkin et al., 2006). Thus, knowledge of the structural diversity of microbial communities has become an in-creasingly important issue for scientists, especially in polluted ecosystems (Singh et al., 2009).
We investigated oil biodegradability and the impact of contamination by petroleum on the bacterial community of MG sediment of the Camamu Bay in in vitro experiments for the first time. Chromatographic analysis and CO2 evolution suggest the mineralization of petroleum. Our analyses using DGGE amplicons of the V3 and V6-V8 regions of 16S rDNA show a richness of bands, and the antagonistic correlations for the two sets of oligos point to the importance of this study.
MATERIAL AND METHODS
Study area and collection of samples
The study area was located in the MGs of Camamu Bay, in southern Bahia. The rep-
2050
©FUNPEC-RP www.funpecrp.com.brGenetics and Molecular Research 13 (1): 2048-2059 (2014)
A.C.F. Santos et al.
resentativeness of the study area was established by choosing five collection points based on sediment characteristics and vegetation cover (site I, 13°93'94.8''S, 39°06'89.4''W; site II, 13°93'53.1''S, 39°5'7.4''W; site III, 13°92'31.5''S, 39°5'32''W; site IV, 13°90'71.5''S, 39°4' 96.7''W; and site V, 13°89'46.7''S, 39°3'88''W). The geographical coordinates of each sampling point were recorded using a global positioning system unit (model Garmin). Each collec-tion point, in turn, was represented by five randomly collected sub-samples. Sediment was collected in February 2011 during low tide to avoid the proximity of vegetation and to pre-vent major effects of rhizospheric microbial communities. At each collection point, a 2-kg sediment sample was obtained from a depth of 1-10 cm with the aid of a sterilized gardening shovel. Samples were packaged in hermetically sealed sterile plastic bags, cooled on ice, and rushed to the laboratory where they were processed. The concentration of organic matter from composite samples was 62.22 g/kg, and the soil was classified as sand soil. From the samples, 150 g was removed for analysis of microbial respiration, 3 g for DNA extraction, and 600 g for the microcosm experiments. Samples for molecular analysis were placed in 1.5-mL Eppendorf microtubes and stored at -80°C.
Microcosms
Microcosm tests were conducted as previously described by dos Santos et al. (2012). Twenty-two days after petroleum contamination, aliquots of 25 and 3 g were removed for gas chromatographic analysis and DNA extraction, respectively. The statistical significance of the data was evaluated by analysis of variance; the means were then compared by the Tukey test.
Gas chromatographic analysis of oil degradation
Uncontaminated and petroleum-contaminated sediment samples [0.1, 0.5, 1, 2, and 5% (w/v)] were removed from the microcosms on days 0 and 22 for degradation analysis. Oil compounds were extracted from 2.5 g soil with 10 mL solvent (hexane, Merck Germany) in a separate flask. The resulting suspensions were sonicated (Unique USC1600) for 30 min, and the supernatant was removed. The extraction procedure was repeated three times. The three supernatants were combined, and the solvent was removed by rotary evaporation (RV06-ML IKA® Werke), leaving the oil residue. Five microliters oil extract was collected and redis-solved in 495 µL hexane. Chromatographic analyses were performed on a Shimadzu gas chro-matograph using an RTX-5 column (Restek, 30 m, 0.25 mm; 0.30-µm film) and hydrogen as the carrier gas. One microliter each sample was injected. The temperature of the injector and detector was 240 and 300°C, respectively. The programmed column temperature was as follows: 45°C for 1 min, heating speed of 25°C/min to 140°C, heating speed of 10°C/min to 290°C, and hold at 290°C for 10 min. The percentage of degradation of the compounds was calculated as the difference between the peak areas of the samples from the initial experimen-tal time and final time samples, where the peak area of the sample at the initial time was used as the 100% point of reference.
Sediment DNA extraction, polymerase chain reaction (PCR), and DGGE analysis
Total DNA was extracted from sediment samples using the PowerSoil DNA Isola-
2051
©FUNPEC-RP www.funpecrp.com.brGenetics and Molecular Research 13 (1): 2048-2059 (2014)
Biodegradability of petroleum in microcosm using mangrove
tion Kit (MoBio) following manufacturer instructions. The DNA was subjected to electro-phoresis on 1% (w/v) agarose gels and quantified in a Genequant spectrophotometer (GE Healthcare).
A fragment of the V3 region of the bacterial 16S rDNA gene was amplified using primers F385 (5'-GCACTCCTACGGGAGGCAGCAG-3') and R518 (5'-ATTACCGCGGCTGCTGG-3') (Lane, 1991; Muyzer et al., 1993). A fragment of the V6-V8 region of the bacte-rial 16S rDNA was amplified using primers F984 (5'-AACGCGAACCTTAC-3') and R1378 (5'-CGGTGTGTACAAGGCCCGGGAACG-3') (Heuer et al., 1997). Forward primers con-tained a 40-bp GC-clamp (5'-CGCCCGCCGCGCGCGGCGGGCGGGGCGGGGGCACGGGGGG-3') attached to the 5' end (Muyzer et al., 1993). All PCRs used a mix containing 1X Taq buffer, 3 mM MgCl2, 0.2 mM dNTPs, 0.2 μM of each primer, 10 ng DNA, and 0.02 U/μL Taq Platinum® DNA Polymerase (Invitrogen). Amplification was performed in an auto-mated thermal cycler (Mastercycler personal, Eppendorf). The amplification program for the fragment of the V3 region of 16S rDNA was as follows: 5 min at 95°C, 1 min at 94°C, 1 min at 55°C, 1 min at 72°C, and a final extension step for 10 min at 72°C. The amplification program for the fragment of the V6-V8 region of 16S rDNA was as follows: 4 min at 94°C, 1 min at 94°C, 1 min at 60°C, 1 min at 72°C, and a final extension step for 20 min at 72°C. The amplified rDNA gene sequences were analyzed on a 6% polyacrylamide gel (w/v) (37.5:1 acrylamide:bis-acrylamide) composed of a denaturing gradient of 35-70% (for the V3 region) and 45-70% (for the V6-V8 region). The gels were run in 0.5X TAE buffer (20 mM Tris ac-etate, pH 7.4, 10 mM sodium acetate, 0.5 mM ethylenediaminetetraacetic acid disodium) with a constant voltage of 70 V for 16 h at 60°C (16S). The mutation detection system (MAXFILL, BioAgency, USA) was used for the DGGE analysis. The bands were visualized by staining with silver nitrate. Each band was considered to be an operational taxonomic unit. The DGGE profile was analyzed from a matrix of the presence and absence of bands to calculate the simi-larity values among samples. The band profile of the DGGE was used to establish a similarity matrix. Multivariate analyses of principal component analysis (PCA) and hierarchical cluster-ing, were performed using the Past software (Hammer et al., 2001), and the correlation was calculated based on the Dice algorithm. Venn diagrams were elaborated manually to check the intersections of the bands found in gels.
RESULTS AND DISCUSSION
Evolution of CO2 and chromatography
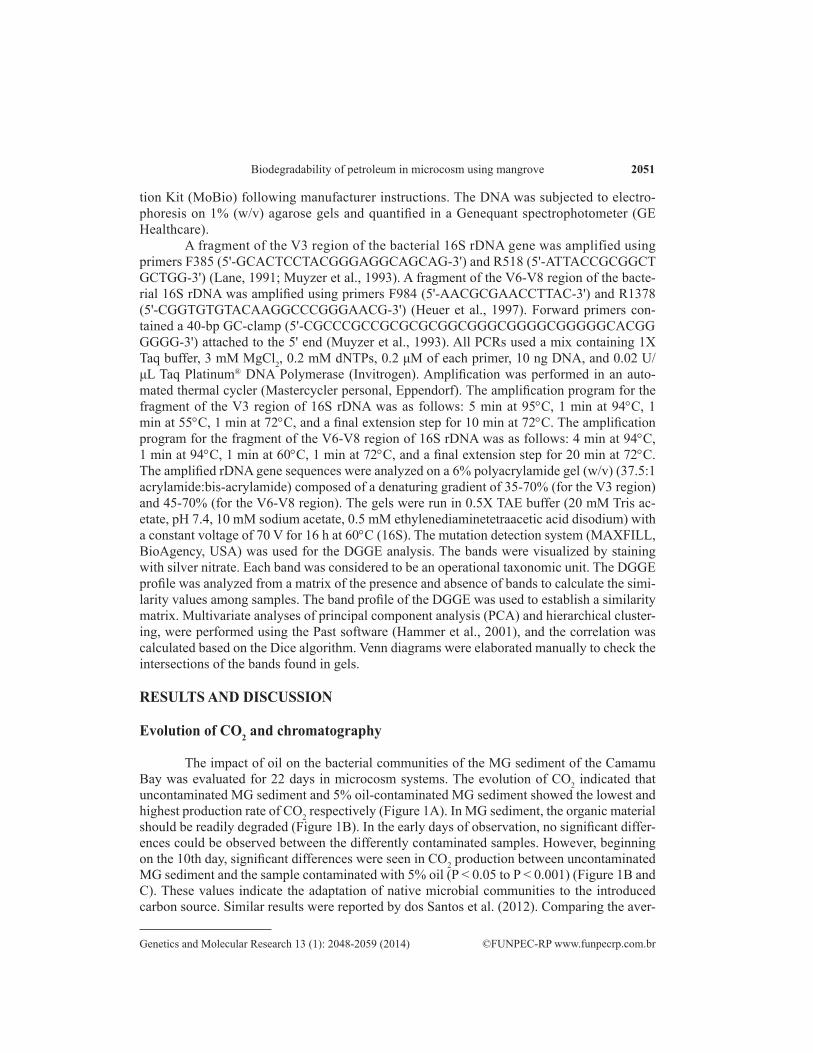
The impact of oil on the bacterial communities of the MG sediment of the Camamu Bay was evaluated for 22 days in microcosm systems. The evolution of CO2 indicated that uncontaminated MG sediment and 5% oil-contaminated MG sediment showed the lowest and highest production rate of CO2 respectively (Figure 1A). In MG sediment, the organic material should be readily degraded (Figure 1B). In the early days of observation, no significant differ-ences could be observed between the differently contaminated samples. However, beginning on the 10th day, significant differences were seen in CO2 production between uncontaminated MG sediment and the sample contaminated with 5% oil (P < 0.05 to P < 0.001) (Figure 1B and C). These values indicate the adaptation of native microbial communities to the introduced carbon source. Similar results were reported by dos Santos et al. (2012). Comparing the aver-
2052
©FUNPEC-RP www.funpecrp.com.brGenetics and Molecular Research 13 (1): 2048-2059 (2014)
A.C.F. Santos et al.
age rate of respiration between the first and last day of the experiment, it is evident that the oil contamination affects microbial activity in the sediment (Figure 1D). Significant differences in respiration were observed when comparing the treatment in relation to time (P < 0.0001). Our results show that microorganisms from oil-contaminated sediment samples could metabolize the compounds of the oil and could be specialized in degradation (Atlas and Bartha, 1992; Korda et al., 1997; Islam and Weil, 2000; Karlen et al., 2001; dos Santos et al., 2012).
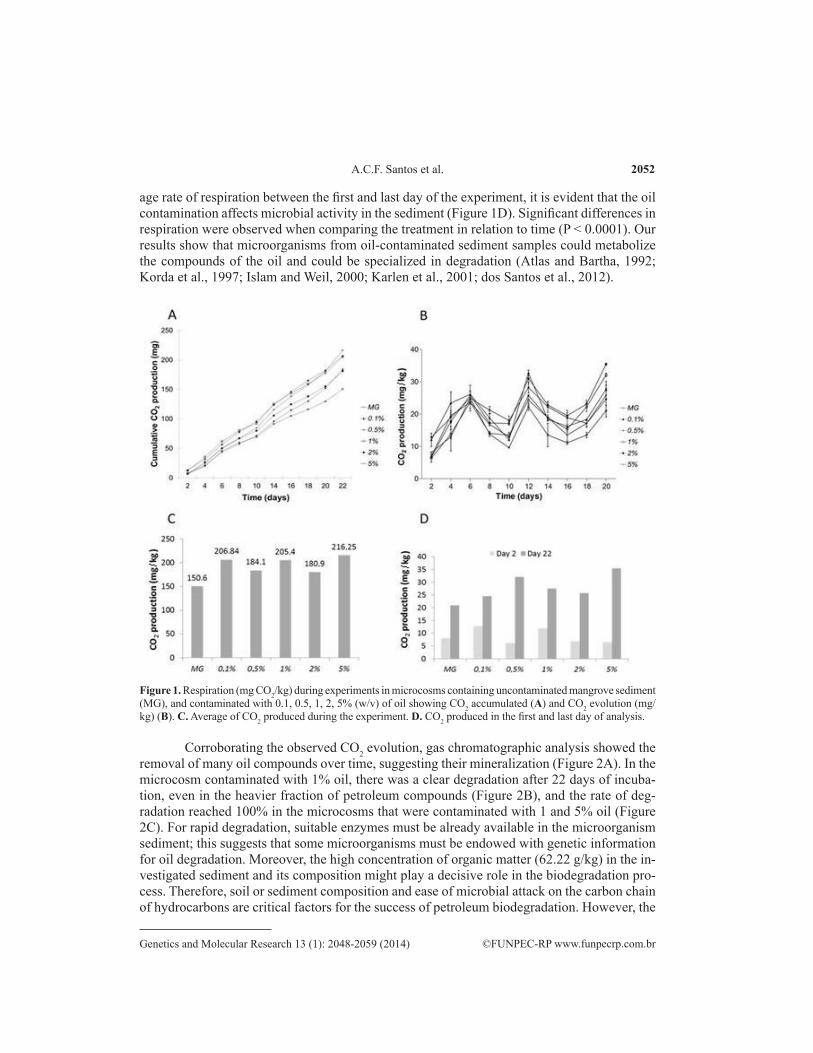
Corroborating the observed CO2 evolution, gas chromatographic analysis showed the removal of many oil compounds over time, suggesting their mineralization (Figure 2A). In the microcosm contaminated with 1% oil, there was a clear degradation after 22 days of incuba-tion, even in the heavier fraction of petroleum compounds (Figure 2B), and the rate of deg-radation reached 100% in the microcosms that were contaminated with 1 and 5% oil (Figure 2C). For rapid degradation, suitable enzymes must be already available in the microorganism sediment; this suggests that some microorganisms must be endowed with genetic information for oil degradation. Moreover, the high concentration of organic matter (62.22 g/kg) in the in-vestigated sediment and its composition might play a decisive role in the biodegradation pro-cess. Therefore, soil or sediment composition and ease of microbial attack on the carbon chain of hydrocarbons are critical factors for the success of petroleum biodegradation. However, the
Figure 1. Respiration (mg CO2/kg) during experiments in microcosms containing uncontaminated mangrove sediment (MG), and contaminated with 0.1, 0.5, 1, 2, 5% (w/v) of oil showing CO2 accumulated (A) and CO2 evolution (mg/kg) (B). C. Average of CO2 produced during the experiment. D. CO2 produced in the first and last day of analysis.
2053
©FUNPEC-RP www.funpecrp.com.brGenetics and Molecular Research 13 (1): 2048-2059 (2014)
Biodegradability of petroleum in microcosm using mangrove
impact of the oil on the microbial community in natura should be assessed, keeping in mind that our results are based on in vitro assays (Margesin and Schinner, 2005).
Analysis of DGGE generated band profiles
The impact of different oil concentrations on bacterial populations from the MG sedi-ment of Camamu Bay was evaluated by DGGE using primers for the V3 and V6-V8 regions of 16S rDNA. To perform this study, limitations related to DNA extraction from oil-contami-nated soils must be overcome (Maciel et al., 2009). After several unsuccessful attempts using protocols described by Amorim et al. (2008) and Maciel et al. (2009), DNA was extracted from sediment using the Power Soil Kit (Mobio). The DNA concentration (522 μg/mL) and quality were sufficient for PCR because all samples showed amplification with both sets of primers. The PCR products that were amplified with primers of the V3 region of the 16S rDNA generated fragments of 210 base pairs (bp), and the products of the V6-V8 region were 390 bp. Primer choice was based on the applicability of the same primers in studies on eubacteria. Primers that amplify the V3 region are used in analysis of bacteria residing in soils, sediments, and aquatic environments, and they are widely applied in studies of Enterobacteriaceae. This peculiarity is not observed with the pair of primers that amplify the V6-V8 region, which are applied in studies of soil bacterial communities (Maciel et al., 2009).
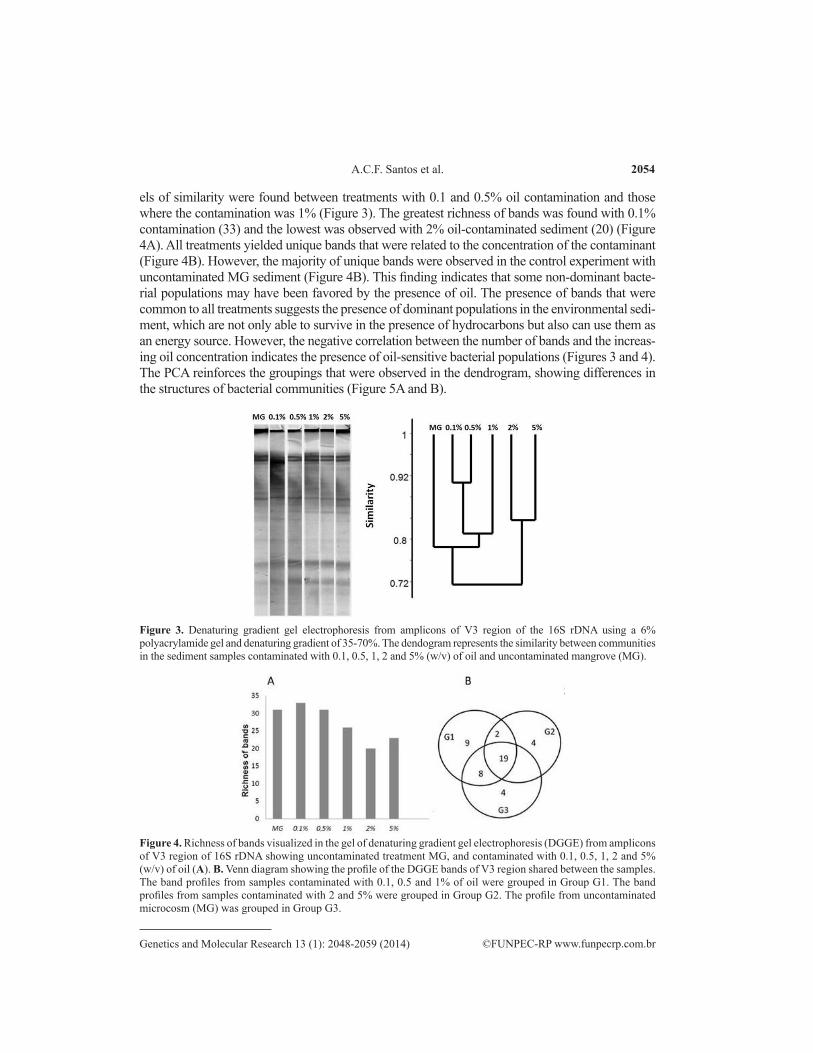
DGGE of DNA amplified with primers for the V3 region allowed the detection of 46 bands in different positions and 19 bands observed in all treatments (Figure 3). The highest lev-
Figure 2. Chromatogram of 1% of oil-contaminated microcosm at onset of the experiment (A) and after 22 days of incubation (B). C. Degradation (%) of total oil in the microcosms contaminated with 0.1, 0.5, 1, 2, and 5% after 22 days.
2054
©FUNPEC-RP www.funpecrp.com.brGenetics and Molecular Research 13 (1): 2048-2059 (2014)
A.C.F. Santos et al.
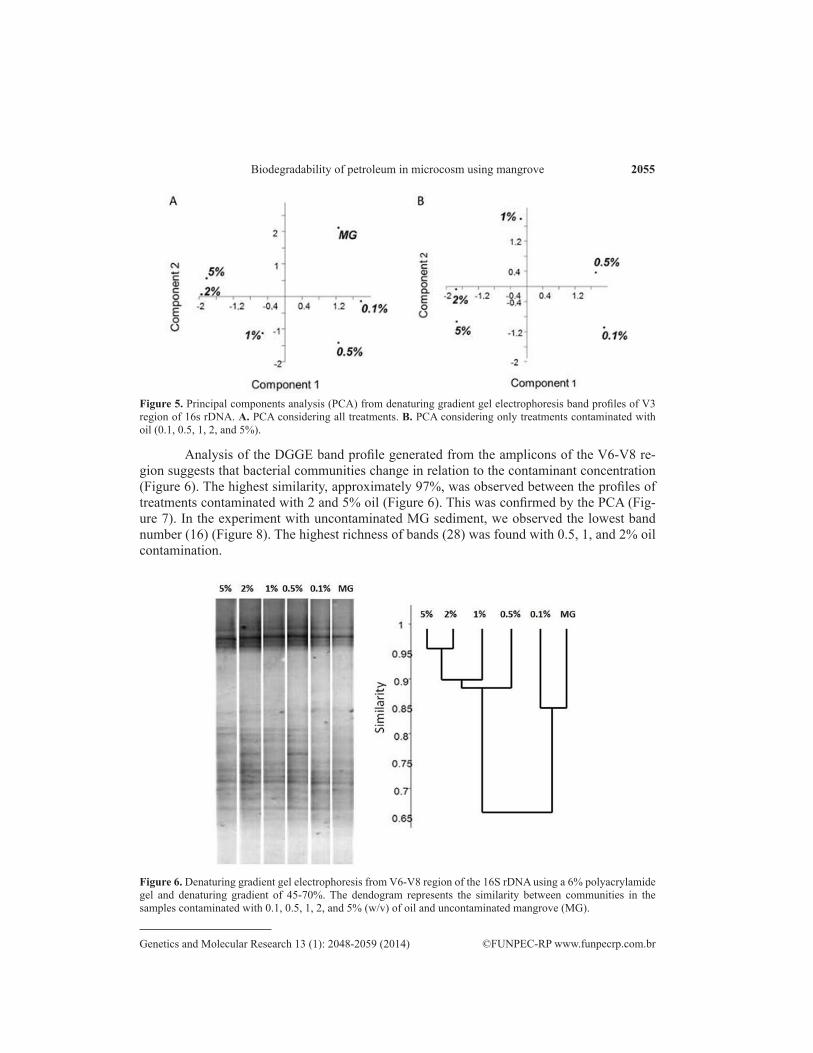
els of similarity were found between treatments with 0.1 and 0.5% oil contamination and those where the contamination was 1% (Figure 3). The greatest richness of bands was found with 0.1% contamination (33) and the lowest was observed with 2% oil-contaminated sediment (20) (Figure 4A). All treatments yielded unique bands that were related to the concentration of the contaminant (Figure 4B). However, the majority of unique bands were observed in the control experiment with uncontaminated MG sediment (Figure 4B). This finding indicates that some non-dominant bacte-rial populations may have been favored by the presence of oil. The presence of bands that were common to all treatments suggests the presence of dominant populations in the environmental sedi-ment, which are not only able to survive in the presence of hydrocarbons but also can use them as an energy source. However, the negative correlation between the number of bands and the increas-ing oil concentration indicates the presence of oil-sensitive bacterial populations (Figures 3 and 4). The PCA reinforces the groupings that were observed in the dendrogram, showing differences in the structures of bacterial communities (Figure 5A and B).
Figure 3. Denaturing gradient gel electrophoresis from amplicons of V3 region of the 16S rDNA using a 6% polyacrylamide gel and denaturing gradient of 35-70%. The dendogram represents the similarity between communities in the sediment samples contaminated with 0.1, 0.5, 1, 2 and 5% (w/v) of oil and uncontaminated mangrove (MG).
Figure 4. Richness of bands visualized in the gel of denaturing gradient gel electrophoresis (DGGE) from amplicons of V3 region of 16S rDNA showing uncontaminated treatment MG, and contaminated with 0.1, 0.5, 1, 2 and 5% (w/v) of oil (A). B. Venn diagram showing the profile of the DGGE bands of V3 region shared between the samples. The band profiles from samples contaminated with 0.1, 0.5 and 1% of oil were grouped in Group G1. The band profiles from samples contaminated with 2 and 5% were grouped in Group G2. The profile from uncontaminated microcosm (MG) was grouped in Group G3.
2055
©FUNPEC-RP www.funpecrp.com.brGenetics and Molecular Research 13 (1): 2048-2059 (2014)
Biodegradability of petroleum in microcosm using mangrove
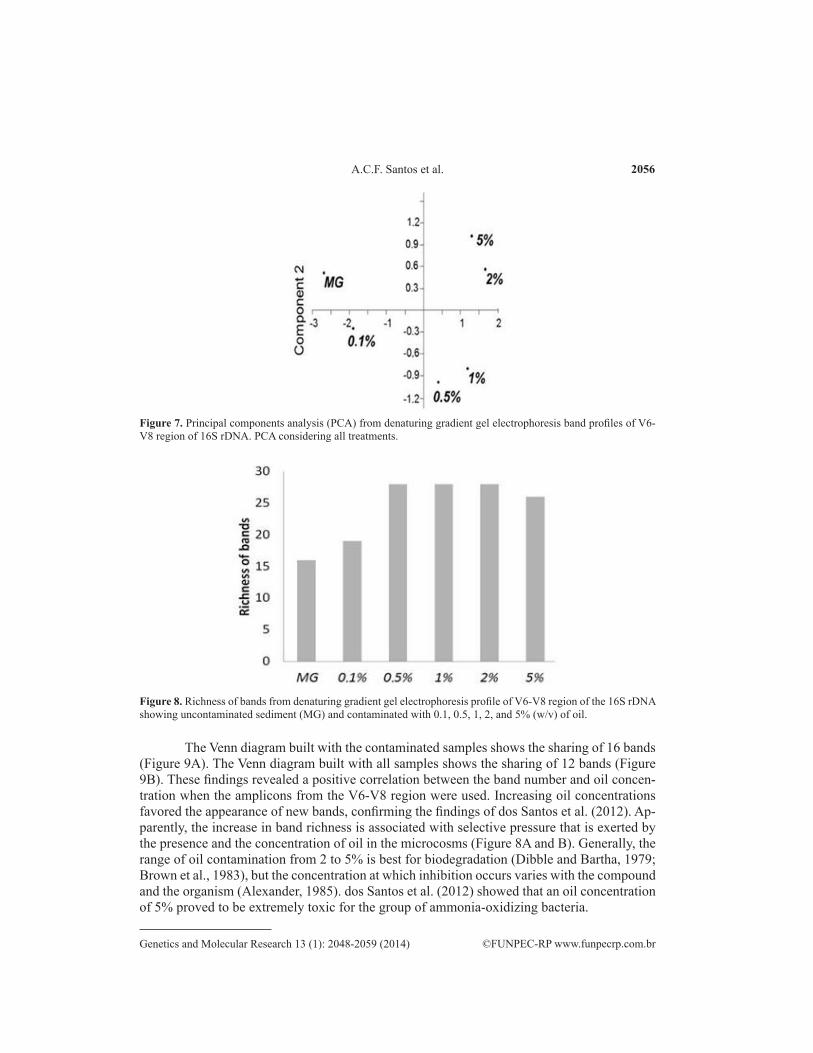
Analysis of the DGGE band profile generated from the amplicons of the V6-V8 re-gion suggests that bacterial communities change in relation to the contaminant concentration (Figure 6). The highest similarity, approximately 97%, was observed between the profiles of treatments contaminated with 2 and 5% oil (Figure 6). This was confirmed by the PCA (Fig-ure 7). In the experiment with uncontaminated MG sediment, we observed the lowest band number (16) (Figure 8). The highest richness of bands (28) was found with 0.5, 1, and 2% oil contamination.
Figure 6. Denaturing gradient gel electrophoresis from V6-V8 region of the 16S rDNA using a 6% polyacrylamide gel and denaturing gradient of 45-70%. The dendogram represents the similarity between communities in the samples contaminated with 0.1, 0.5, 1, 2, and 5% (w/v) of oil and uncontaminated mangrove (MG).
Figure 5. Principal components analysis (PCA) from denaturing gradient gel electrophoresis band profiles of V3 region of 16s rDNA. A. PCA considering all treatments. B. PCA considering only treatments contaminated with oil (0.1, 0.5, 1, 2, and 5%).
2056
©FUNPEC-RP www.funpecrp.com.brGenetics and Molecular Research 13 (1): 2048-2059 (2014)
A.C.F. Santos et al.
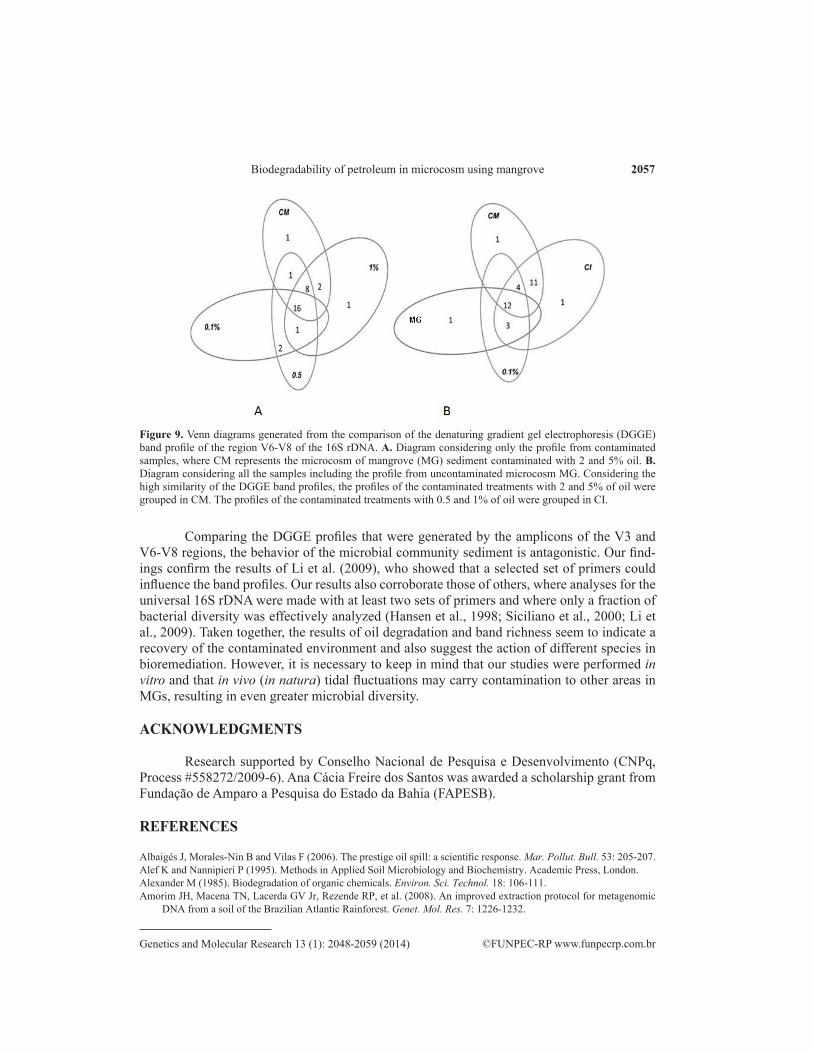
The Venn diagram built with the contaminated samples shows the sharing of 16 bands (Figure 9A). The Venn diagram built with all samples shows the sharing of 12 bands (Figure 9B). These findings revealed a positive correlation between the band number and oil concen-tration when the amplicons from the V6-V8 region were used. Increasing oil concentrations favored the appearance of new bands, confirming the findings of dos Santos et al. (2012). Ap-parently, the increase in band richness is associated with selective pressure that is exerted by the presence and the concentration of oil in the microcosms (Figure 8A and B). Generally, the range of oil contamination from 2 to 5% is best for biodegradation (Dibble and Bartha, 1979; Brown et al., 1983), but the concentration at which inhibition occurs varies with the compound and the organism (Alexander, 1985). dos Santos et al. (2012) showed that an oil concentration of 5% proved to be extremely toxic for the group of ammonia-oxidizing bacteria.
Figure 8. Richness of bands from denaturing gradient gel electrophoresis profile of V6-V8 region of the 16S rDNA showing uncontaminated sediment (MG) and contaminated with 0.1, 0.5, 1, 2, and 5% (w/v) of oil.
Figure 7. Principal components analysis (PCA) from denaturing gradient gel electrophoresis band profiles of V6-V8 region of 16S rDNA. PCA considering all treatments.
2057
©FUNPEC-RP www.funpecrp.com.brGenetics and Molecular Research 13 (1): 2048-2059 (2014)
Biodegradability of petroleum in microcosm using mangrove
Comparing the DGGE profiles that were generated by the amplicons of the V3 and V6-V8 regions, the behavior of the microbial community sediment is antagonistic. Our find-ings confirm the results of Li et al. (2009), who showed that a selected set of primers could influence the band profiles. Our results also corroborate those of others, where analyses for the universal 16S rDNA were made with at least two sets of primers and where only a fraction of bacterial diversity was effectively analyzed (Hansen et al., 1998; Siciliano et al., 2000; Li et al., 2009). Taken together, the results of oil degradation and band richness seem to indicate a recovery of the contaminated environment and also suggest the action of different species in bioremediation. However, it is necessary to keep in mind that our studies were performed in vitro and that in vivo (in natura) tidal fluctuations may carry contamination to other areas in MGs, resulting in even greater microbial diversity.
ACKNOWLEDGMENTS
Research supported by Conselho Nacional de Pesquisa e Desenvolvimento (CNPq, Process #558272/2009-6). Ana Cácia Freire dos Santos was awarded a scholarship grant from Fundação de Amparo a Pesquisa do Estado da Bahia (FAPESB).
REFERENCES
Albaigés J, Morales-Nin B and Vilas F (2006). The prestige oil spill: a scientific response. Mar. Pollut. Bull. 53: 205-207.Alef K and Nannipieri P (1995). Methods in Applied Soil Microbiology and Biochemistry. Academic Press, London.Alexander M (1985). Biodegradation of organic chemicals. Environ. Sci. Technol. 18: 106-111.Amorim JH, Macena TN, Lacerda GV Jr, Rezende RP, et al. (2008). An improved extraction protocol for metagenomic
DNA from a soil of the Brazilian Atlantic Rainforest. Genet. Mol. Res. 7: 1226-1232.
Figure 9. Venn diagrams generated from the comparison of the denaturing gradient gel electrophoresis (DGGE) band profile of the region V6-V8 of the 16S rDNA. A. Diagram considering only the profile from contaminated samples, where CM represents the microcosm of mangrove (MG) sediment contaminated with 2 and 5% oil. B. Diagram considering all the samples including the profile from uncontaminated microcosm MG. Considering the high similarity of the DGGE band profiles, the profiles of the contaminated treatments with 2 and 5% of oil were grouped in CM. The profiles of the contaminated treatments with 0.5 and 1% of oil were grouped in CI.
2058
©FUNPEC-RP www.funpecrp.com.brGenetics and Molecular Research 13 (1): 2048-2059 (2014)
A.C.F. Santos et al.
Atlas RM and Bartha R (1992). Hydrocarbon biodegradation and oil spill bioremediation. Adv. Microb. Ecol. 12: 287-338.Brown KW, Donnelly KC and Deuel LE, Jr. (1983). Effects of mineral nutrients, sludge application rate, and application
frequency on biodegradation of two oily sludges. Microb. Ecol. 9: 363-373.Burns KA, Garrity SD and Levings SC (1993). How many years until mangrove ecosystems recover from catastrophic
oil-spills. Mar. Pollut. Bull. 26: 239-248.Burns KA, Codi S and Duke NC (2000). Gladstone, Australia field studies: weathering and degradation of hydrocarbons
in oiled mangrove and salt marsh sediments with and without the application of an experimental bioremediation protocol. Mar. Pollut. Bull. 41: 402.
Dibble JT and Bartha R (1979). Effect of environmental parameters on the biodegradation of oil sludge. Appl. Environ. Microbiol. 37: 729-739.
dos Santos AC, Marques EL, Gross E, Souza SS, et al. (2012). Detection by denaturing gradient gel electrophoresis of ammonia-oxidizing bacteria in microcosms of crude oil-contaminated mangrove sediments. Genet. Mol. Res. 11: 190-201.
Dworkin M, Falkow S, Rosenberg E and Schleifer KH (2006). The Prokaryotes: A Handbook on the Biology of Bacteria: Ccophysiology and Biochemistry. 3rd edn. Springer, New York.
El Paso (2005). Relatório de Controle Ambiental. Bloco BMCAL4. Available at [http://www.bmcal4.com.br/]. Accessed March 9, 2012.
Hammer O, Harper DAT and Ryan PD (2001). PAST: paleontological statistics software package for education and data analysis. Palaeontol. Electronica 4: 1-9.
Hansen MC, Tolker-Nielsen T, Givskov M and Molin S (1998). Biased 16S rDNA PCR amplification caused by interference from DNA flanking the template region. FEMS Microbiol. Ecol. 26: 141-149.
Heuer H, Krsek M, Baker P, Smalla K, et al. (1997). Analysis of actinomycete communities by specific amplification of genes encoding 16S rRNA and gel-electrophoretic separation in denaturing gradients. Appl. Environ. Microbiol. 63: 3233-3241.
Islam KR and Weil RR (2000). Soil quality indicator properties in mid-atlantic soils as influenced by conservation management. J. Soil Water Conserv. 55: 69-78.
Karlen DL, Andrews SS and Doran JW (2001). Soil quality: current concepts and applications. Adv. Agron. 74: 1-40.Kathiresan K and Bingham BL (2001). Biology of mangroves and mangrove Ecosystems. Adv. Mar. Biol. 40: 81-251.Korda A, Santas P, Tenente A and Santas R (1997). Petroleum hydrocarbon bioremediation: sampling and analytical
techniques, in situ treatments and commercial microorganisms currently used. Appl. Microbiol. Biotechnol. 48: 677-686.Lane DJ (1991). 16S/23S rRNA Sequencing. In: Nucleic acid Techniques in Bacterial Systematics (Stackebrandt E and
Goodfellow M, eds.). John Wiley & Sons, New York, 115-175.Li H, Zhao Q, Boufadel MC and Venosa AD (2007). A universal nutrient application strategy for the bioremediation of
oil-polluted beaches. Mar. Pollut. Bull. 54: 1146-1161.Li H, Zhang Y, Li DS, Xu H, et al. (2009). Comparisons of different hypervariable regions of rrs genes for fingerprinting
of microbial communities in paddy soils. Soil Biol. Biochem. 41: 954-968.Lucchesi CF (1998). Petróleo. Estudos Avançados 12: 17-40.Machulla G (2003). Soil microbial indicators and their environmental significance. J. Soil Sediment. 3: 229.Maciel BM, Santos AC, Dias JC, Vidal RO, et al. (2009). Simple DNA extraction protocol for a 16S rDNA study of
bacterial diversity in tropical landfarm soil used for bioremediation of oil waste. Genet. Mol. Res. 8: 375-388.Margesin R and Schinner F (2005). Manual of Soil Analysis: Monitoring and Assessing Soil Biorremediation. In: Soil
Biology (Varma A, ed.). Springer, Berlin.Moreira FMS and Siqueira JO (2006). Microbiologia e Bioquímica do Solo. 2nd edn. UFLA, Lavras, 729.Muyzer G, de Waal EC and Uitterlinden AG (1993). Profiling of complex microbial populations by denaturing gradient
gel electrophoresis analysis of polymerase chain reaction-amplified genes coding for 16S rRNA. Appl. Environ. Microbiol. 59: 695-700.
Muyzer G and Smalla K (1998). Application of denaturing gradient gel electrophoresis (DGGE) and temperature gradient gel electrophoresis (TGGE) in microbial ecology. Antonie Van Leeuwenhoek 73: 127-141.
Petrobras (2012). Operational Highlights: Monthly Crude oil and Natural gas Production-Brazil and Abroad. Available at [http://www.petrobras.com.br/]. Accessed March 9, 2012.
Seabra PN (2001). Uso de Biorremediação em Áreas Impactadas pela Indústria de Petróleo. In: Biodegradação (Melo IS, ed.). Embrapa Meio Ambiente, Jaguariúna, 41-49.
Siciliano SD, Gong P, Sunahara GI and Greer CW (2000). Assessment of 2,4,6-trinitrotoluene toxicity in field soils by pollution-induced community tolerance, denaturing gradient gel electrophoresis, and seed germination assay. Environ. Toxicol. Chem. 19: 2154-2160.
2059
©FUNPEC-RP www.funpecrp.com.brGenetics and Molecular Research 13 (1): 2048-2059 (2014)
Biodegradability of petroleum in microcosm using mangrove
Silva GS, Marques ELS, Dias JCT, Lobo IP, et al. (2012). Biodegradability of soy biodiesel in microcosm experiments using soil from the Atlantic Rain Forest. Appl. Soil Ecol. 55: 27-35.
Singh A, Kuhad RC and Ward OP (2009). Advances in Applied Bioremediation. In: Soil Biology (Varma A, ed.). Springer-Verlag, Berlin, 361.
Varma A and Oelmüller R (2007). Advanced Techniques in Soil Microbiology. In: Soil Biology (Varma A and Oelmüller R, eds.). Springer-Verlag, Berlin, 418.