Embed Size (px)
Citation preview

Evaluation of the accuracy of the dark
frame subtraction method in CCD image
processing
Martin P. LévesqueMario Lelièvre DRDC Valcartier
Defence R&D Canada – ValcartierTechnical Note
DRDC Valcartier TN 2007-343December 2007


Evaluation of the accuracy of the dark frame subtraction method in CCD image processing
Martin P. Lévesque Mario Lelièvre DRDC Valcartier
Defence R&D Canada – Valcartier Technical Note DRDC Valcartier TN 2007-343 December 2007

Author
Martin P. Lévesque
Approved by
Jean-Marc Garneau
Section head
© Her Majesty the Queen as represented by the Minister of National Defence, 2007
© Sa majesté la reine, représentée par le ministre de la Défense nationale, 2007

DRDC Valcartier TN 2007-343 i
Abstract This document evaluates the reliability of the dark-frame subtraction method for the detection of very dim targets in astronomical images. This method is frequently used for removing the image background gradient (a thermal artefact) in CCD images. This report demonstrates that this method may not be suitable for the detection of objects with very low signal-to-noise ratio. The analysis of two series of 500 dark frames, acquired at two different CCD temperatures, showed that dark frames are not reproducible with enough accuracy. The subtraction of two dark frames, assumed to be acquired at the same temperature, always leaves a residual background comparable or superior to the noise level. It is suspected that the temperature recorded into the image header is the cryo-cooler temperature and not directly the CCD temperature. The temperature oscillates and there is always a small temperature difference between the CCD ship and the cryo-cooler.
However, it was found that the image mean intensity is tightly linked to the background gradient amplitude in each dark frame. The subtraction of dark frames with equal mean intensity, instead of equal recorded temperature, gives good results. Unfortunately, it is not obvious to evaluate the mean background intensity when the image contains signals, while the CCD temperature is always available in the image header. In the case where very faint objects have to be detected, the simple dark frame subtraction method should be replaced by more reliable algorithms (but generally longer to compute) able to separate the signal from the image background.
Résumé
Ce document évalue la fiabilité de la méthode de soustraction de ‘dark frame’ pour la détection de cibles faibles dans les images astronomiques. Cette méthode est fréquemment utilisée pour enlever le gradient de l’arrière-plan (un artéfact thermal) dans les images CCD. Cette note technique démontre que cette méthode peut ne pas convenir pour la détection d’objets avec des rapports signal-bruit très bas.
L’analyse de deux séries de 500 ‘dark frames’ acquises à deux températures différentes, montre que les ‘dark frames’ ne sont pas reproductibles avec assez de précision. La soustraction de deux ‘dark frames’ présumés acquis à la même température, laisse toujours un résidu d’arrière-plan comparable ou supérieur au niveau de bruit. On soupçonne que la température enregistrée dans l’en-tête de l’image est la température du refroidisseur et non directement la température du CCD. La température oscille et il y a toujours une petite différence de température entre le circuit du CCD et le refroidisseur.
Cependant, on a trouvé que l’intensité moyenne de l’image est très liée à l’amplitude du gradient de l’arrière-plan dans chaque ‘dark frame’. La soustraction de ‘dark frames’ ayant des intensités moyennes égales, au lieu des températures enregistrées égales, donne de bon résultats. Malheureusement, il n’est pas évident d’évaluer l’intensité moyenne de l’arrière-

ii DRDC Valcartier TN 2007-343
plan quand l’image contient du signal alors que la température est toujours disponible dans l’en-tête de l’image. Dans le cas où des objets très faibles doivent être détectés, la méthode simple de soustraction de ‘dark frames’ devrait être remplacée par des algorithmes plus fiables (mais généralement plus longs à calculer) capables de séparer le signal de l’arrière-plan de l’image.

DRDC Valcartier TN 2007-343 iii
Table of contents
Astract / Résumé.......................................................................................................................... i
Table of contents ....................................................................................................................... iii
List of figures ............................................................................................................................ iv
List of tables .............................................................................................................................. iv
1. Introduction ................................................................................................................... 1 1.1 Cause of the dark signal ................................................................................... 1 1.2 Removal of dark signal using dark frame subtraction method ......................... 1
2. Images acquired for dark signal analysis....................................................................... 3
3. Image background gradient caused by the dark signal .................................................. 4
4. Influence of the temperature on the dark signal ............................................................ 6 4.1 Relation between the dark-frame mean-intensity and CCD temperature ......... 6 4.2 Relation between the dark frame noise level and CCD temperature................ 7
5. Gradient variations for dark fames supposedly acquired at the same temperature........ 8
6. Correlation between the recorded temperature and the dark frame mean intensity .... 11
7. Conclusion................................................................................................................... 14
8. References: .................................................................................................................. 16

iv DRDC Valcartier TN 2007-343
List of figures
Figure 1. The Apogee AP8P CCD cameras.............................................................................. 3
Figure 2. Typical dark frame acquired with a CCD camera. ...................................................... 4
Figure 3. Residual image resulting from the subtraction of two pairs of dark frames acquired at the same temperature....................................................................................................... 5
Figure 4 – Mean intensity of dark frame versus the CCD temperature...................................... 6
Figure 5. Standard deviation measured in a dark image versus the CCD temperature. ............. 7
Figure 6. Residual gradient resulting from the subtraction of two images at two temperatures that are: A) similar or B) different by 0.3C. We can see that there is no significant trend in gradient when comparing both set. ................................................................................. 9
Figure 7. Image residues resulting from the subtraction of two images of same mean intensity10
Figure 8 – Relation between the noise standard deviation and the mean frame intensity. ....... 10
Figure 9. CCD temperature and mean image intensity in relation with time. .......................... 11
Figure 10- Profiles of dark-frame subtraction residues obtained with pairs of images with corrected temperature. The correction consists in associating an image with the temperature read in another image acquired 70 s later...................................................... 12
List of tables
Table 1. CCD specifications..................................................................................................... 3

DRDC Valcartier TN 2007-343 1
1. Introduction
To detect faint satellite streaks in astronomical images, it is important that the dark signal is correctly removed. References 1 and 2 showed that it is possible to detect streaks as faint as SNR = 0.5 (Signal-to Noise Ratio). To achieve such a sensitivity, the image background (caused by the dark signal) must be removed and the background residue must be fainter than the faintest detectable streak, i.e., fainter than �n/2 (the noise standard deviation). This report verifies if the dark frame subtraction method has this required accuracy.
1.1 Cause of the dark signal
Charged Coupled Devices (CCD) are the imaging sensors that appear in nearly every type of digital camera on the today market. CCDs consist of pixel arrays built on silicon semiconductors. The photons striking the pixels are detected by photoelectric effect. It is expected that every created photoelectron results only from the observed light source. However, even with a CCD shutter closed and with perfectly dark conditions, some electrons are still accumulated on the CCD. Those electrons are created by thermal activity inside the CCD and their creation rate is directly linked to the sensor temperature. Those thermal electrons (dark signal) are undesirable and corrupt the acquired signal. Their creation is minimized by cooling the CCD to very low temperatures but unfortunately this effect is never completely cancelled.
1.2 Removal of dark signal using dark frame subtraction method
Each CCD has its own dark signal signature that is present on every acquired image (bias, dark frame, light frame). By cooling the CCD to a very low temperature (down to -30 C), the dark signal is attenuated but not completely cancelled. Image processing is then required to remove dark signature from each raw image. The method usually used consists of acquiring dark frames that are subsequently subtracted from each image. This permits keeping only relevant information related to the observed target.
During an acquisition session, an ideal dark frame is obtained by acquiring and averaging several dark frames. This ideal dark frame has a reduced noise signature and is, in theory, acquired with the same conditions (temperature and moisture) as the observation images. This averaged dark frame will be subtracted from every raw image. This approach for reducing dark signal produces very nice astronomical images. It is suitable for many applications which do not require very accurate photometry results. However, the technique is not necessarily sufficiently accurate for detecting and analyzing very low signal-to-noise ratio objects.

2 DRDC Valcartier TN 2007-343
This report studies the relevance of using dark frame subtraction to remove the dark signal in CCD images. It begins with the description of the observation system and the CCD camera used to acquire dark frame data. Next, it describes the physical characteristics of the images used for studying dark frames. Results are first analyzed by studying how the dark signal is related to the CCD temperature. Then the reproducibility of dark frame, taken at exactly the same temperature, is verified. Also, the parameters of the spatial gradient (such as the mean signal, noise and gradient amplitude) are inspected to see how they vary with temperature. This will allow determining the degree of confidence of the dark frame subtraction method. From this analysis, recommendations concerning the relevance of using dark frames for image processing are presented.
This work was performed between December 2006 and April 2007 under the project 15ee03: ‘Small telescope for Surveillance of Space’.

DRDC Valcartier TN 2007-343 3
2. Images acquired for dark signal analysis
The acquisition system uses an AP8P back-illuminated CCD camera (primary CCD) manufactured by Apogee Inc. to acquire dark frames (Figure 1). The 1024x1024-pixels CCD has a chip size of 24.6 x 24.6 millimetres square and a quantum efficiency of 85% near the R band (red band). The cooling mechanism of the CCD chip is based on Pelletier-effect cryo-cooler. The chip itself may be cooled to temperature as low as -35 C. Main physical characteristics of the Apogee CCD camera are summarized in Table 1.
Figure 1. The Apogee AP8P CCD cameras
Table 1. CCD specifications
CCD camera Apogee AP8p
Array dimension (mm2) 24.6 x 24.6
Number of pixels 1024 x 1024
Pixel sizes (μ2) 24 x 24
Read noise (e- rms) 15
Gain (e-/count) 4.5 Dark signal at T = -40 C (é/sec)
1
Dark frames were acquired for two different CCD temperatures. One set has been observed at TCCD = -20C and the other at TCCD = -30C. In both cases, 500 individual successive expositions were acquired. Each individual exposure time was 5 seconds and the downloading time was 35 seconds. The total elapsing time was then 40 seconds between exposures. During this time, the CCD temperature fluctuated slightly (± 1C), while the cooling system attempted to maintain the set temperature. The assumed CCD temperature for a given exposure was then recorded in the corresponding image header.
The following section tries to establish the relation between the sensor temperature, the mean intensity and the noise level of the dark signal. Also, the reproducibility of dark frames acquired at the same temperature is inspected.
1024
pix
els
1024 pixels

4 DRDC Valcartier TN 2007-343
3. Image background gradient caused by the dark signal
Each dark frame acquired with a CCD camera shows an intensity pattern which is not perfectly uniform. It is typical to observe an intensity gradient along CCD rows and/or columns. The exact gradient pattern is specific for each camera and a specific camera always has the same gradient pattern. However, even with a given camera, the amplitude of the gradient varies with the temperature and is not perfectly reproducible. Figure 2 shows an example of such a background gradient.
Figure 2. Typical dark frame acquired with a CCD camera.
The dark frame subtraction method consists of acquiring two images, with and without signal (dark frame), and subtracting the dark frame from the signal image. Both images must be acquired with exactly the same conditions of exposure time and CCD temperature. Ideally, this should cancel an image background such as the one shown in Fig. 2. To evaluate the accuracy of this assumption, two dark frames acquired at the same assumed CCD temperature (as indicated in the image headers) were subtracted. Ideally, there should remain nothing other than the noise. In each studied case, the temperature difference between the two frames was supposed to be lower than 0.1C. Figure 3 shows two examples of residual image resulting from such a subtraction. Figure 3A results from the subtraction of two dark frames observed at T = -30C while Figure 3B results from dark frames acquired at T = -20C.
Figure 3 shows that an intensity gradient still subsists in the residual image, no matter what the CCD temperature is. One possibility is that the temperature as indicated in
Gradient = 600 counts at -30C, 7000 counts at -12C

DRDC Valcartier TN 2007-343 5
the image header is not sufficiently accurate. For example, two images thought to be at the same temperature might in fact differ by as much as 0.1C, or even more. Sometimes, the residue is almost null. Most of the times it is several times greater that the noise level. This makes us believe that the temperature indicated in the image header might be inaccurate.
Figure 3. Residual image resulting from the subtraction of two pairs of dark frames acquired at the same temperature.
Gradient = 100 counts
Gradient = 40 counts
T = -30 C T = -20 C
A B
Position of vertical profiles extracted for Figs, 6,7 and 10
6 DRDC Valcartier TN 2007-343
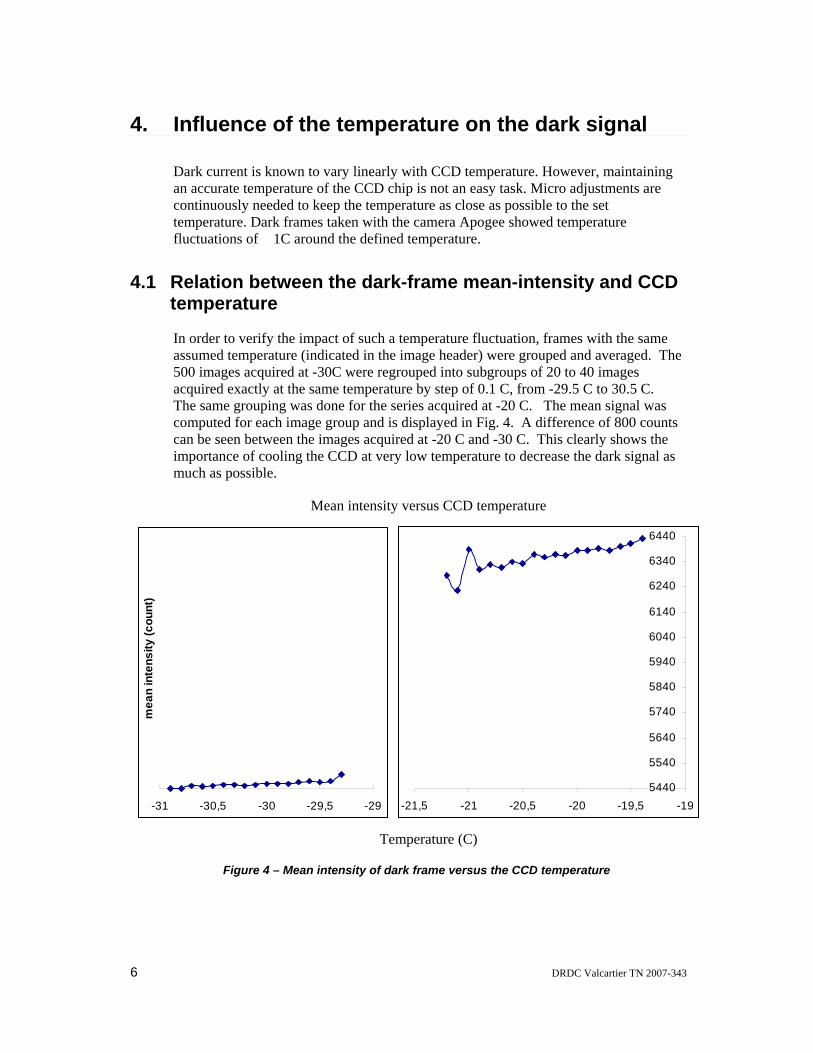
4. Influence of the temperature on the dark signal
Dark current is known to vary linearly with CCD temperature. However, maintaining an accurate temperature of the CCD chip is not an easy task. Micro adjustments are continuously needed to keep the temperature as close as possible to the set temperature. Dark frames taken with the camera Apogee showed temperature fluctuations of �1C around the defined temperature.
4.1 Relation between the dark-frame mean-intensity and CCD temperature
In order to verify the impact of such a temperature fluctuation, frames with the same assumed temperature (indicated in the image header) were grouped and averaged. The 500 images acquired at -30C were regrouped into subgroups of 20 to 40 images acquired exactly at the same temperature by step of 0.1 C, from -29.5 C to 30.5 C. The same grouping was done for the series acquired at -20 C. The mean signal was computed for each image group and is displayed in Fig. 4. A difference of 800 counts can be seen between the images acquired at -20 C and -30 C. This clearly shows the importance of cooling the CCD at very low temperature to decrease the dark signal as much as possible.
Mean intensity versus CCD temperature
-31 -30,5 -30 -29,5 -29
mea
n in
tens
ity (c
ount
)
5440
5540
5640
5740
5840
5940
6040
6140
6240
6340
6440
-21,5 -21 -20,5 -20 -19,5 -19
Temperature (C)
Figure 4 – Mean intensity of dark frame versus the CCD temperature

DRDC Valcartier TN 2007-343 7
4.2 Relation between the dark frame noise level and CCD temperature
The variation of the noise level was also verified in relation with the CCD temperature. The standard deviations of each individual dark frame were grouped by temperature categories (by step of 0.1 C) and averaged. Results are shown if Figure 5. This clearly demonstrates that noise increases with CCD temperature. Again, this result shows the importance of cooling the CCD to reduce noise in the dark frame image. But the most important observation is the match between Figures 4 and 5. Noise level and mean background intensity are directly related.
Standard deviation versus CCD temperature
Temperature (C)
Figure 5. Standard deviation measured in a dark image versus the CCD temperature.
-31 -30,5 -30 -29,5 -29
Stan
dard
dev
iatio
n (c
ount
s)
10
12
14
16
18
20
22
24
26
-21,5 -21 -20,5 -20 -19,5 -19

8 DRDC Valcartier TN 2007-343
5. Gradient variations for dark fames supposedly acquired at the same temperature
The residue of dark frame subtraction was systematically analysed. Two groups of dark frame residues were selected. The first group was the result of subtraction of dark frame with (supposedly) identical CCD temperatures. For the second group, a reported temperature difference of 0.3C was used to select the pairs of dark frames. In principle, a difference of 0C should produce fewer residues than a difference of 0.3C. This is absolutely not the case. Figure 6 shows that there are similar residue distributions for both image groups. Definitively, the temperature recorded into the image header is not a good parameter to predict the gradient amplitude. Nevertheless, this gradient amplitude is definitively a function of the CCD temperature. It is believed that recorded temperature is wrong.
In an attempt to understand and characterize the problem, the dark frames were paired using another criterion. First, higher CCD temperatures produce higher gradient values. Second, the mean gradient values were calculated for every dark frame image, this is an available parameter. Then, dark frames of equal average (average over the entire image) were grouped together. The results of subtraction of dark frame images with similar average are shown in Fig. 7.
The residues shown in this figure are very low. This proves that dark frames with same mean intensity have identical profiles. Also, one can conclude that these dark frames were acquired with the same true (but unknown) temperature.
The dependence between the mean intensity, the gradient amplitude, and the noise level, should be a monotone function that increases with the noise temperature. Because it appears that the recorded temperature is not accurate, let us assume that the mean intensity alone (in the absence of signal) is proportional to the true temperature. Figure 8 show the relation between the gradient amplitude, the noise level, and the mean intensity.

DRDC Valcartier TN 2007-343 9
-10
0
10
20
30
40
50
0 100 200 300 400 500 600 700 800 900 1000
Line index (pixel)
mea
n in
tens
ity (c
ount
)
Vertical profiles of residual gradient resulting of dark frame subtraction Image pairs have supposedly the same temperature
CCD temperature = -30Cnoise standard deviation = 11 counts
Displayed profiles are the result of the averaging of 1024 vertical profiles (image clomns).
A
-10
0
10
20
30
40
50
0 100 200 300 400 500 600 700 800 900 1000
Line index (pixel)
mea
n in
tens
ity (c
ount
)
Vertical profiles of residual gradient resulting of dark frame subtraction Image pairs have supposedly a temperature difference of 0.3C
CCD temperature = -30Cnoise standard deviation = 11 counts
Displayed profiles are the result of the averaging of 1024 vertical profiles (image clomns).
B
Figure 6. Residual gradient resulting from the subtraction of two images at two temperatures
that are: A) similar or B) different by 0.3C. We can see that there is no significant trend in gradient when comparing both set.

10 DRDC Valcartier TN 2007-343
-10
0
10
20
30
40
50
0 100 200 300 400 500 600 700 800 900 1000
Line index (pixel)
mea
n in
tens
ity (c
ount
)
Vertical profiles of residual gradient of dark frame subtraction for image pairs with the same mean intensity
CCD temperature = -30Cnoise standard deviation = 11 counts
Displayed profiles are the result of the averaging of 1024 vertical profiles (image clomns).
Figure 7. Image residues resulting from the subtraction of two images of same mean intensity
Noise standard deviation in function of the mean intensity
10
12
14
16
18
20
22
24
5400 5900 6400mean intensity (count)
stan
dard
dev
iatio
n (c
ount
)
-30C
-20C
Figure 8 – Relation between the noise standard deviation and the mean frame intensity.

DRDC Valcartier TN 2007-343 11
6. Correlation between the recorded temperature and the dark frame mean intensity
With the previous results, it is presumed that the noise level and the dark frame average intensity are linearly dependent on the temperature although the temperature displayed in the image header is inaccurate. Figure 9 shows a graphic where both recorded temperature and calculated average signal intensity are displayed as a function of time (or frame number). This indicates clearly that both curves are highly correlated. A shift of nearly 100 seconds between the two curves is observed. This graph shows a 1000-seconds sequence. This correlation was observed over the 500 dark frame acquisition period which was about 4 hours. Definitively, the temperature recorded in the image header does not correctly characterize the real temperature of the CCD chip.
-30.8
-30.7
-30.6
-30.5
-30.4
-30.3
-30.2
-30.1
-30.0
-29.9
-29.8
-29.7
-29.6
-29.52000 2100 2200 2300 2400 2500 2600 2700 2800 2900 3000
Time (s)
CC
D te
mpe
ratu
re (C
)
5420
5430
5440
5450
5460
5470
5480
5490
5500
5510
Mea
n in
tens
ity (A
DU
)
CCD temperature
mean CCD Temperature
CCD temperature standarddeviationmean intensity
averaged mean image intensity
Figure 9. CCD temperature and mean image intensity in relation with time.
The phase shift between the two curves displayed in Figure 9 is puzzling. One could expect that the temperature increases and thereafter that the mean image intensity increases. This would indicate a delay in the heat conduction between the cryo-cooler and the CCD ship. But it is the contrary that occurs. The mean intensity increases before the temperature increases. This strange effect can have only two possible explanations. First, the thermocouple (or any other kind of thermal sensor) is not placed correctly in the camera. The propagation of the heat wave (temperature oscillation) affects the CCD chip before it reaches the thermal sensor. Second, this can be a software issue. When saving the image, the computer may write into the file

12 DRDC Valcartier TN 2007-343
header a temperature measurement which is already several seconds old. The 100 s delay is probably a combination of these two effects.
This measured delay suggests another experiment. If an old temperature measurement is recorded into the image header, why not trying to replace it with the temperature read in the second following image, which is acquired 70s later and almost corresponds to the time of acquisition of the current frame. With this temperature substitution, image pairs are formed with similar substitute temperature and the dark frames are subtracted. Profiles of residues are displayed in Fig. 10. This graph shows a strong improvement comparatively to Fig. 6 where there is no temperature correction. However, it is not as good as Fig. 8 where the image matching based on similar intensity is more accurate. This indicates that the 70 s delay correction is a good correction permitting the grouping of dark image sharing similar characteristics. The acquisition of this substitute temperature was done closer in time to the acquisition of the dark frame. But the temporal coincidence of the measurements (image and temperature) is not yet perfect.
-10
0
10
20
30
40
50
0 100 200 300 400 500 600 700 800 900 1000
Line index (pixel)
mea
n in
tens
ity (c
ount
)
Vertical profiles of residual gradient of dark frame subtraction for 10 pairs of images with corrected temperatures
CCD temperature = -30Cnoise standard deviation = 11 counts
Displayed profiles are the result of the averaging of the 1024 vertical profiles (image clomns).
Figure 10- Profiles of dark-frame subtraction residues obtained with pairs of images with
corrected temperature. The correction consists in associating an image with the temperature read in another image acquired 70 s later.
In summary, the method of background removal by dark frame subtraction is very tricky. It is very sensitive to CCD temperature variations, temperature measurement accuracy and requires a very good synchronization between the CCD image acquisition and CCD temperature measurement. Most of the time, this method leaves a background residue that is greater than the noise level. This is not good for dim target detection algorithms.

DRDC Valcartier TN 2007-343 13
The more sophisticated background removal algorithms of refs 1 and 3 can produce an image with residual background less than a fifth of the noise standard deviation (sigma). In the best case, Fig. 7 shows the dark frame method is almost comparable in performance. However, Figs. 6 and 10 show that most of the time such performances are not achieved. To conclude, if CPU resources are available, algorithms of refs 1 and 3 do a better job. If CPU resources are not really available (e.g. for a satellite which has very limited resources), then the dark frame method can be acceptable at the condition the CCD camera is correctly designed, which is not the case for several commercial design.
14 DRDC Valcartier TN 2007-343
7. Conclusion
The previous measurement and analysis allows concluding:
1. Each acquired dark frame shows a background gradient pattern. Although the general shape of the gradient is similar from frame to frame for a specific sensor, the gradient for a given temperature is ‘apparently’ not reproducible. Residual gradient are always observed when two dark frames, with ‘apparently’ equivalent-temperature, are subtracted (accuracy of 0.1 C).
2. However, experiments showed that it is the image headers that did not record the temperature correctly. When dark frames are acquired at exactly with the same temperature (with an accuracy better than or equal to 0.1C) their subtraction produces an image with a small residual background. However, this residual background is still greater than the noise level. The background-removal processing methods of Refs. 1 and 3 still produce better result than the dark frame subtraction method.
3. The real temperature indicator can be retrieved by calculating the mean dark frame intensity value. Dark frames with similar mean intensity have almost identical gradient profiles. Also, images with equivalent mean intensity also have equivalent noise levels.
4. The correlation between the plot of the recorded temperature and the mean frame intensity shows that there is a delay about 100s between the CCD real temperature and its recording. This is a sign of an inappropriate hardware and software design, at least for the analysed camera.
5. For most of the application an accuracy of 0.5 C is sufficient. However, for applications such as the detection of dim targets close to the noise level, an accuracy of 0.1 C is required to correctly match the dark frames.
6. The effect of the propagation of the temperature wave (temperature variation in time and in space) is critical. It can cause a mismatch between the real CCD temperature and the reading of the temperature sensor. Therefore, the temperature sensor must be as close as possible to the CCD chip. Also, the electronic circuits and the operating software must read the CCD temperature exactly at the time of image acquisition. A delay is not tolerable.
These conclusions lead to the following recommendations;
1. If CPU resources are available, the software methods developed in refs. 1 and 3 to estimate and remove the background gradient are more accurate than the dark frame subtraction method.
2. If these CPU resources are not available, the dark frame method may be an acceptable substitute as long as the CCD temperature is known with an accuracy

DRDC Valcartier TN 2007-343 15
of 0.1 C or better. For critical camera design, this involves special attention to the design of the temperature sensor. Ideally, this sensor must be located as close as possible of the CCD chip. A better design would consist of several sensors placed on each side and behind the CCD chip. Also, the temperature behaviour could be modeled and the real CCD temperature could be predicted/estimated from a temporal sequence reading.

16 DRDC Valcartier TN 2007-343
8. References:
1. Lévesque M. P., Buteau S., 2005. Image Processing Technique for Automatic Detection of Satellite Streaks. DRDC Valcartier 2005 TR-386. Defence R&D Canada – Valcartier.
2. Lévesque M. P., Lelievre M., 2006. Improvements of satellite-streak detection by the use of false alarm rejection algorithms. DRDC Valcartier TR 2006-587. Defence R&D Canada – Valcartier.
3. Lévesque M. P., Lelievre M., 2007. Evaluation of the iterative method for image background removal in astronomical images. DRDC Valcartier TN 2007-xxx. Defence R&D Canada – Valcartier.

DRDC Valcartier TN 2007-343 17
Distribution list
INTERNAL DRDC Valcartier TN 2007-343
1- Director General
3- Document Library
1- M. P. Lévesque (author)
1- Hd/SOp
1- S. Buteau

18 DRDC Valcartier TN 2007-343
EXTERNAL DRDC Valcartier TN 2007-343
1- DRDKIM (PDF file)
1- DRDC
1- DRDC Ottawa
1- DRDC Atlantic
1- DRDC Suffield
1- DRDC Toronto
1- M. Lelièvre (post-doc student, co-author) 1114 Boul. Des Chutes Québec, Qc, G1E 2G4
4- DRDC Ottawa attn : A. Spaans, B. Wallace, R. Scott, Capt. D. Bedard.
2- Royal Military College of Canada, Kingston, Dept Physics, P.O. Box 17000 Stn Forces Kingston, Ontario, K7K 7B4 Canada attn: Dr. T. J. Racey, Dr. B. Bennett,
2- Director Project Delivery Operational Information Systems / Surveillance of Space Project (SofSP) MGen George R. Pearkes Bldg 101 Colonel By Drive, Ottawa, ON, Canada, K1A 0K2 attn: G. Rumbold, D. Simmelink.

DRDC Valcartier TN 2007-343 19
DOCUMENT CONTROL DATA Unclassified
1. ORIGINATOR (The name and address of the organization preparing the document.
Defence R&D Valcartier, 2459 BoulPie XI North, Québec, QC, G3J 1X5
2. SECURITY CLASSIFICATION (Overall security classification of the document including special warning terms if applicable.)
UNCLASSIFIED
3. TITLE (The complete document title as indicated on the title page. Its classification should be indicated by the appropriate abbreviation (S, C or U) in parentheses after the title.) Evaluation of the accuracy of the dark frame subtraction method in CCD image processing
4. AUTHORS (last name, followed by initials – ranks, titles, etc. not to be used) Lévesque, M. P.; Lelièvre, M.
5. DATE OF PUBLICATION (Month and year of publication of document.) December 2007
6a. NO. OF PAGES (Total containing information, including Annexes, Appendices, etc.)
18
6b. NO. OF REFS (Total cited in document.)
3
7. DESCRIPTIVE NOTES (The category of the document, e.g. technical report, technical note or memorandum. If appropriate, enter the type of report, e.g. interim, progress, summary, annual or final. Give the inclusive dates when a specific reporting period is covered.) DRDC Valcartier Technical Note
8. SPONSORING ACTIVITY (The name of the department project office or laboratory sponsoring the research and development – include address.) Defence R&D Valcartier, 2459 BoulPie XI North, Québec, QC, G3J 1X5
9a. PROJECT OR GRANT NO. (If appropriate, the applicable research and development project or grant number under which the document was written. Please specify whether project or grant.)
WBE 15ee03
9b. CONTRACT NO. (If appropriate, the applicable number under which the document was written.)
10a. ORIGINATOR'S DOCUMENT NUMBER (The official document number by which the document is identified by the originating activity. This number must be unique to this document.) DRDC TN 2007-343]
10b. OTHER DOCUMENT NO(s). (Any other numbers which may be assigned this document either by the originator or by the sponsor.) n/a
11. DOCUMENT AVAILABILITY (Any limitations on further dissemination of the document, other than those imposed by security classification.) Unlimited distribution
12. DOCUMENT ANNOUNCEMENT (Any limitation to the bibliographic announcement of this document. This will normally correspond to the Document Availability (11). However, where further distribution (beyond the audience specified in (11) is possible, a wider announcement audience may be selected.)) Unlimited

20 DRDC Valcartier TN 2007-343
13. ABSTRACT (A brief and factual summary of the document. It may also appear elsewhere in the body of the document itself. It is highly desirable that the abstract of classified documents be unclassified. Each paragraph of the abstract shall begin with an indication of the security classification of the information in the paragraph (unless the document itself is unclassified) represented as (S), (C), (R), or (U). It is not necessary to include here abstracts in both official languages unless the text is bilingual.) This document evaluates the reliability of the dark-frame subtraction method for the detection of very dim targets in astronomical images. This method is frequently used for removing the image background gradient (a thermal artefact) in CCD images. This report demonstrates that this method may not be suitable for the detection of objects with very low signal-to-noise ratio. The analysis of two series of 500 dark frames, acquired at two different CCD temperatures, showed that dark frames are not reproducible with enough accuracy. The subtraction of two dark frames, assumed to be acquired at the same temperature, always leaves a residual background comparable or superior to the noise level. It is suspected that the temperature recorded into the image header is the cryo-cooler temperature and not directly the CCD temperature. The temperature oscillates and there is always a small temperature difference between the CCD ship and the cryo-cooler. However, it was found that the image mean intensity is tightly linked to the background gradient amplitude in each dark frame. The subtraction of dark frames with equal mean intensity, instead of equal recorded temperature, gives good results. Unfortunately, it is not obvious to evaluate the mean background intensity when the image contains signals, while the CCD temperature is always available in the image header. In the case where very faint objects have to be detected, the simple dark frame subtraction method should be replaced by more reliable algorithms (but generally longer to compute) able to separate the signal from the image background.
Ce document évalue la fiabilité de la méthode de soustraction de ‘dark frame’ pour la détection de cibles faibles dans les images astronomiques. Cette méthode est fréquemment utilisée pour enlever le gradient de l’arrière-plan (un artéfact thermal) dans les images CCD. Cette note technique démontre que cette méthode peut ne pas convenir pour la détection d’objets avec des rapports signal-bruit très bas. L’analyse de deux séries de 500 ‘dark frames’ acquises à deux températures différentes, montre que les ‘dark frames’ ne sont pas reproductibles avec assez de précision. La soustraction de deux ‘dark frames’ présumés acquis à la même température, laisse toujours un résidu d’arrière-plan comparable ou supérieur au niveau de bruit. On soupçonne que la température enregistrée dans l’en-tête de l’image est la température du refroidisseur et non directement la température du CCD. La température oscille et il y a toujours une petite différence de température entre le circuit du CCD et le refroidisseur. Cependant, on a trouvé que l’intensité moyenne de l’image est très liée à l’amplitude du gradient de l’arrière-plan dans chaque ‘dark frame’. La soustraction de ‘dark frames’ ayant des intensités moyennes égales, au lieu des températures enregistrées égales, donne de bon résultats. Malheureusement, il n’est pas évident d’évaluer l’intensité moyenne de l’arrière-plan quand l’image contient du signal alors que la température est toujours disponible dans l’en-tête de l’image. Dans le cas où des objets très faibles doivent être détectés, la méthode simple de soustraction de ‘dark frames’ devrait être remplacée par des algorithmes plus fiables (mais généralement plus longs à calculer) capables de séparer le signal de l’arrière-plan de l’image.
14. KEYWORDS, DESCRIPTORS or IDENTIFIERS (Technically meaningful terms or short phrases that characterize a document and could be helpful in cataloguing the document. They should be selected so that no security classification is required. Identifiers, such as equipment model designation, trade name, military project code name, geographic location may also be included. If possible keywords should be selected from a published thesaurus, e.g. Thesaurus of Engineering and Scientific Terms (TEST) and that thesaurus identified. If it is not possible to select indexing terms which are Unclassified, the classification of each should be indicated as with the title.) Astronomical image, CCD, Dark frame, image background, Image processing, Satellite streak detection.


Canada’s Leader in Defenceand National Security
Science and Technology
Chef de file au Canada en matièrede science et de technologie pourla défense et la sécurité nationale
WWW.drdc-rddc.gc.ca
Defence R&D Canada R & D pour la défense Canada