Embed Size (px)
Citation preview
Evaluation of the 2004-2005 Partnership for Energy Affordability in Multi-Family Housing Program
Program #1211-04 FINAL REPORT
The California Public Utilities Commission San Francisco, California Pacific Gas & Electric Company San Francisco, California ICF International San Francisco, California
October 5, 2006
Prepared by:
KEMA, Inc. 492 9th Street, Suite 220 Oakland, California 94607 Tel: (510) 891-0446 Fax: (510) 891-0440
For additional information, please contact: Ms. Tami Rasmussen, Senior Economic Analyst KEMA, Inc. Tel: (510) 891-0446 Email: [email protected]
Table of Contents
Partnership for Energy Affordability in Multi-Family Housing October 5, 2006
i
1. Executive Summary ...........................................................................................................................1-1 1.1 Program Overview...................................................................................................................1-1 1.2 Program Goals and Accomplishments.....................................................................................1-2
1.2.1 Energy and Peak Demand Reduction Goals ...............................................................1-2 1.2.2 Non-Energy Savings Goals.........................................................................................1-6
1.3 Evaluation Objectives and Approach ......................................................................................1-6 1.4 Process Evaluation Results ......................................................................................................1-8
1.4.1 Program Administration and Coordination.................................................................1-8 1.4.2 Program Outreach.......................................................................................................1-8 1.4.3 Program Design ..........................................................................................................1-9 1.4.4 Participant Satisfaction .............................................................................................1-10 1.4.5 Conclusions and Recommendations .........................................................................1-11
1.5 Impact Evaluation Results .....................................................................................................1-13 1.5.1 Net-to-Gross Analysis ..............................................................................................1-15 1.5.2 Savings Associated with First Year of Installed Measure Operation .......................1-16 1.5.3 Lifetime Savings.......................................................................................................1-18 1.5.4 Cost-Effectiveness ....................................................................................................1-19
2. Introduction........................................................................................................................................2-1 2.1 Background..............................................................................................................................2-1 2.2 Program Overview...................................................................................................................2-1
2.2.1 Overview of Program and Partner Organizations.......................................................2-1 2.2.2 Program Objectives ....................................................................................................2-2 2.2.3 Program Services ........................................................................................................2-3 2.2.4 Program Changes........................................................................................................2-4
2.3 Market Barriers........................................................................................................................2-5 2.4 Program Goals and Accomplishments.....................................................................................2-7
2.4.1 Energy and Peak Demand Reduction Goals ...............................................................2-7 2.4.2 Non-Energy Savings Goals.......................................................................................2-10
2.5 Evaluation Objectives and Approach ....................................................................................2-11 2.6 Organization of Report ..........................................................................................................2-12
3. Process Evaluation .............................................................................................................................3-1 3.1 Methodology............................................................................................................................3-1
3.1.1 Non-Rebate Participant Qualitative Interviews ..........................................................3-1 3.1.2 Program Staff Qualitative Interviews .........................................................................3-4
3.2 Findings ...................................................................................................................................3-5 3.2.1 Program Administration and Coordination.................................................................3-6 3.2.2 Program Outreach.......................................................................................................3-7 3.2.3 Program Design ..........................................................................................................3-8 3.2.4 Participant Satisfaction .............................................................................................3-18
3.3 Conclusions ...........................................................................................................................3-19 4. Impact Evaluation ..............................................................................................................................4-1
Table of Contents
Partnership for Energy Affordability in Multi-Family Housing October 5, 2006
ii
4.1 Overview .................................................................................................................................4-1 4.2 Methodology............................................................................................................................4-4 4.3 Gross Savings Survey Results .................................................................................................4-5
4.3.1 CFLs ...........................................................................................................................4-5 4.3.2 T8s ..............................................................................................................................4-7 4.3.3 Other Lighting ............................................................................................................4-8 4.3.3 Programmable Thermostats ........................................................................................4-9 4.3.4 Boilers.......................................................................................................................4-10 4.3.5 Boiler Controls .........................................................................................................4-10
4.4 Effective Useful Life (EUL)..................................................................................................4-11 4.5 Net-to-Gross Analysis ...........................................................................................................4-12 4.6 Gross and Net Savings Results ..............................................................................................4-12
4.6.1 CFLs .........................................................................................................................4-13 4.6.2 T8s ............................................................................................................................4-14 4.6.3 Other Lighting ..........................................................................................................4-15 4.6.4 Programmable Thermostats ......................................................................................4-16 4.6.5 High-Efficiency Boilers............................................................................................4-17 4.6.6 EDC Boiler Controls ................................................................................................4-18 4.6.7 Thermostatic Boiler Controls ...................................................................................4-19 4.6.8 Summary...................................................................................................................4-20
4.7 Cost-Effectiveness .................................................................................................................4-23 5. Appendix A: Interview Guides ..........................................................................................................5-1
5.1 Freeridership Interview Guide.................................................................................................5-2 5.2 Programmable Thermostat Survey ..........................................................................................5-4 5.3 Program Staff Interview Guide..............................................................................................5-17 5.4 Program Participant Interview Guide ....................................................................................5-20
6. Appendix B: Interim Evaluation Report ...........................................................................................6-1 7. Appendix C: Impact Evaluation Methodology .................................................................................7-1
7.1 Onsite Survey Sample Design .................................................................................................7-1 7.1.1 Sample Frame .............................................................................................................7-1 7.1.2 Sample Design............................................................................................................7-2 7.1.3 Sample Allocation ......................................................................................................7-2
7.2 Site Visit Protocol....................................................................................................................7-4 7.2.1 Tenant spaces..............................................................................................................7-4 7.2.2 Common areas ............................................................................................................7-5
7.3 Analysis Methods ....................................................................................................................7-6 7.3.1 CFLs ...........................................................................................................................7-6 7.3.2 T8s ..............................................................................................................................7-7 7.3.3 Other lighting..............................................................................................................7-8 7.3.4 Programmable thermostats .........................................................................................7-8 7.3.5 Boiler measures ..........................................................................................................7-8
Table of Contents
Partnership for Energy Affordability in Multi-Family Housing October 5, 2006
iii
7.3.6 Demand Savings .........................................................................................................7-9 7.4 Extrapolation to Population ...................................................................................................7-10 7.5 Net to Gross Analysis ............................................................................................................7-10
7.5.1 Overview ..................................................................................................................7-10 7.5.2 Methodology.............................................................................................................7-11
Table of Contents
Partnership for Energy Affordability in Multi-Family Housing October 5, 2006
iv
List of Exhibits:
Table 1-1 Net Energy Savings Goals Associated with First Year of Installed Measure Operation, by Measure Category......................................................................................................................1-3
Table 1-2 Program Reported Net Accomplishments Associated with First Year of Installed Measure Operation, by Measure Category...............................................................................................1-4
Table 1-3 Program Reported Net Accomplishments Associated with First Year of Installed Measure Operation as a Percentage of Net Savings Goals, by Measure Category .................................1-5
Table 1-4 Lifetime Net Goals, Reported Accomplishments, and Cost-Effectiveness Tests, 2004-2005 ..1-5 Table 1-5 Partnership Non-Energy Savings Goals, 2004-2005 .................................................................1-6 Table 1-6 Partnership Evaluation Study Approach....................................................................................1-7 Table 1-7 Net-to-Gross Ratios by Measure Category..............................................................................1-15 Table 1-8 Net-to-Gross Ratios Including Participant Spillover by Measure Category............................1-16 Table 1-9 Net and Gross Program Electricity Savings Associated with First Year of Installed Measure
Operation (kWh)......................................................................................................................1-17 Table 1-10 Net and Gross Program Peak Demand Savings Associated with First Year of Installed
Measure Operation (kW) .........................................................................................................1-17 Table 1-11 Net and Gross Program Natural Gas Savings Associated with First Year of Installed
Measure Operation (Therms)...................................................................................................1-18 Table 1-12 Program Savings....................................................................................................................1-19 Table 1-13 Total Resource Cost...............................................................................................................1-20 Table 1-14 Participant Test ......................................................................................................................1-20 Table 2-1 Partnership Partners and Responsibilities, 2004-2005 ..............................................................2-2 Table 2-2 Changes to Partnership Offerings, 2002-2003 to 2004-2005 ....................................................2-5 Table 2-3 Net Energy Savings Goals Associated with First Year of Installed Measure Operation, by
Measure Category......................................................................................................................2-8 Table 2-4 Program Reported Net Accomplishments Associated with First Year of Installed Measure
Operation, by Measure Category...............................................................................................2-9 Table 2-6 Lifetime Net Goals, Reported Net Accomplishments, and Cost-Effectiveness Tests,
2004-2005................................................................................................................................2-10 Table 2-7 Partnership Non-Energy Savings Goals, 2004-2005 ...............................................................2-11 Table 2-8 Partnership Evaluation Study Approach..................................................................................2-12 Table 3-1 Participant Survey Sample Frame .............................................................................................3-2 Table 3-2 Non-Rebate Participant Survey Target Completes....................................................................3-2 Table 3-3 Completed Non-Rebate Participant Interviews by Program Service.........................................3-3 Table 3-4 Program Service Participations by Survey Respondent ............................................................3-4 Table 3-5 Program Staff Interviews...........................................................................................................3-5 Table 3-6 Changes to Partnership Offerings, 2002-2003 to 2004-2005 ....................................................3-9 Table 3-7 Survey Respondent Participations and Energy Efficiency Activities......................................3-14 Table 3-8 Partnership Training Workshops, 2004-2005..........................................................................3-15 Table 4-1 Program Savings........................................................................................................................4-2
Table of Contents
Partnership for Energy Affordability in Multi-Family Housing October 5, 2006
v
Table 4-2 Net Energy Savings Goals Associated with First Year of Installed Measure Operation and Program Accomplishments by Measure Category ....................................................................4-3
Table 4-3 Reported Net Program Energy Savings Accomplishments (Ex Ante) Associated with First Year of Installed Measure Operation as a Percentage of Goals by Measure Category ......................4-4
Table 4-4 Distribution of Verified CFLs by Room Type ..........................................................................4-6 Table 4-5 Delta Watts of Verified CFLs by Measure Description ............................................................4-6 Table 4-6 Delta Watts of Verified T8s by Measure Description ...............................................................4-8 Table 4-7 Net-to-Gross Ratios by Measure Category..............................................................................4-12 Table 4-8 CFL Gross Savings (First Year of Installed Measure Operation) ...........................................4-13 Table 4-9 CFL Net Savings (First Year of Installed Measure Operation) ...............................................4-14 Table 4-10 T8 Gross Savings (First Year of Installed Measure Operation) ............................................4-14 Table 4-11 T8 Net Savings (First Year of Installed Measure Operation)................................................4-15 Table 4-12 Other Lighting Gross Savings (First Year of Installed Measure Operation) .........................4-15 Table 4-13 Other Lighting Net Savings (First Year of Installed Measure Operation) ............................4-16 Table 4-14 Programmable Thermostat Gross Savings (First Year of Installed Measure Operation) ......4-16 Table 4-15 Programmable Thermostat Net Savings (First Year of Installed Measure Operation)..........4-17 Table 4-16 High-Efficiency Boiler Gross Savings (First Year of Installed Measure Operation) ............4-17 Table 4-17 High-Efficiency Boiler Net Savings (First Year of Installed Measure Operation) ...............4-18 Table 4-18 EDC Boiler Control Gross Savings (First Year of Installed Measure Operation).................4-18 Table 4-19 EDC Boiler Control Gross Net Savings (First Year of Installed Measure Operation) ..........4-19 Table 4-20 Thermostatic Boiler Control Gross Savings (First Year of Installed Measure Operation)....4-19 Table 4-21 Thermostatic Boiler Control Net Savings (First Year of Installed Measure Operation) .......4-20 Table 4-22 Program Net and Gross Energy Savings (kWh) Associated with First Year of Installed
Measure Operation ..................................................................................................................4-20 Table 4-23 Program Net and Gross Demand Savings (kW) Associated with First Year of Installed
Measure Operation ..................................................................................................................4-21 Table 4-24 Program Natural Gas Savings (Therms) Associated with First Year of Installed Measure
Operation .................................................................................................................................4-21 Table 4-25 Program Savings....................................................................................................................4-22 Table 4-26 Total Resource Cost...............................................................................................................4-23 Table 4-27 Participant Test ......................................................................................................................4-23 Table 7-1 Program Reported Net Savings Accomplishments....................................................................7-1 Table 7-2 2005 Onsite Survey Sample Design ..........................................................................................7-2 Table 7-3 Total and Percentage of Program-Reported Savings Included in Onsite Sample .....................7-3 Table 7-4 Total and Percentage of Program-Reported Savings Included in Onsite Sample .....................7-3 Table 7-5 Installation Verification Protocol ..............................................................................................7-4 Table 7-6 CFL Hours of Use Per Day by Room Type...............................................................................7-6 Table 7-7 Net-to-Gross Ratios by Measure Category..............................................................................7-10 Table 7-8 Net-to-Gross Ratios Including Participant Spillover by Measure Category............................7-11 Table 7-9 Possible Permutations for Property/Measure Combination NTG Ratios Excluding Participant
Spillover...................................................................................................................................7-14
Table of Contents
Partnership for Energy Affordability in Multi-Family Housing October 5, 2006
vi
Table 7-10 Calculations for Lighting NTG Ratio ....................................................................................7-15 Table 7-11 Calculations for Programmable Thermostat NTG Ratio .......................................................7-15 Table 7-12 Calculations for High-Efficiency Boiler NTG Ratio.............................................................7-16 Table 7-13 Calculations for Boiler Control NTG Ratio...........................................................................7-16 Table 7-14 Ratio of Savings Associated with Non-Rebated Improvements to Rebated Improvements .7-17 Table 7-15 Net-to-Gross Ratios by Measure Category............................................................................7-18
Partnership for Energy Affordability in Multi-Family Housing October 5, 2006
1-1
1. Executive Summary This document is the executive summary for the report on KEMA’s evaluation of the 2004-2005 Partnership for Energy Affordability in Multi-Family Housing (“the Partnership” or “the program”). Designed and implemented by ICF Associates, Inc. (“ICF”), the 2004-2005 program is the continuation of a third-party energy-efficiency program selected by the California Public Utilities Commission (“the Commission”) for the 2002-2003 funding cycle. KEMA, Inc. conducted an evaluation of the 2002-2003 program and released a final report in June, 2004.1
The 2004-2005 program projected net savings of 473 kW; 2,129,711 kWh; and 237,562 therms associated with the first year of installed measure operation. The evaluation confirmed net savings of 84.4 kW; 685,134 kWh; and 30,141 therms associated with the first year of installed measure operation (27 percent of projected net demand savings, 45 percent of projected net energy savings, and 39 percent of projected net natural gas savings). The program had lifetime net savings goals of 31,867,994 kWh, 473 kW, and 3,478,953 therms, and the evaluation confirmed lifetime net electric savings of 8.7 MWh, net demand savings of 84 kW, and lifetime net gas savings of approximately 465,000 therms.
1.1 Program Overview
The Partnership provided technical and financial assistance through a variety of mechanisms to owners, managers, and maintenance staff of affordable2 multi-family housing organizations in the San Francisco Bay Area and vicinities within the Central Valley. The Partnership involved service providers within the disciplines of affordable housing and energy efficiency to leverage the market insights and credibility provided by these organizations to deliver energy efficiency and related services to the target market. ICF directed the program and involved several partners, including: the Bay Area Local Initiatives Support Corporation (LISC); the California Coalition for Rural Housing (CCRH); Generating Renewable Ideas for Development (GRID) Alternatives; kW Engineering; Non-Profit Housing Association of Northern California (NPH); and Strategic Energy Innovations (SEI).
The 2004-2005 program’s specific objectives remained the same as during 2002-2003, but its focus shifted away from providing referrals to other energy-efficiency programs toward providing its own incentives and achieving energy savings. The program’s objectives were as follows:
1. Reduce energy consumption and peak demand in multi-family affordable housing to reduce energy costs. Through facility audits, rebates, no-interest loans, and training, the program supported investment in energy efficiency measures and operations and maintenance (O&M) practices to achieve lasting energy savings.
2. Enhance the overall equity of the CPUC program portfolio by ensuring that affordable multi-family properties have efficient access to technical funding resources. Through the
1 KEMA, Inc., 2004. “Evaluation of the Partnership for Energy Affordability in Multifamily Housing: Final Report.” Prepared for ICF Consulting. June 23, 2004. 2 “Affordable” is defined as low-income households with incomes of between 50 and 80 percent of median family income (MFI). Publicly- and privately-supported multi-family (5 or more units) properties in PG&E’s service territory with master-metered or tenant-metered units and/or common areas are eligible to participate in the program.
Partnership for Energy Affordability in Multi-Family Housing October 5, 2006
1-2
services described above, the Partnership sought to enable affordable multi-family properties to use the cost savings achieved through energy efficiency for other essential needs.
3. Build the foundation for sustainable energy savings by strengthening the affordable housing technical assistance infrastructure. Through its training and engineering services, the Partnership assisted affordable housing providers in building an infrastructure capable of supporting energy efficiency after the program ends.
The program attempted to accomplish its objectives through a portfolio of technical, financial, and training services as well as through referrals to other energy-efficiency programs.
1.2 Program Goals and Accomplishments
According to the 2004-2005 Program Implementation Plan3, the Partnership had two distinct sets of goals: the first consisted of quantifiable energy and peak reduction goals, and the second was related to supporting the affordable multi-family housing community in its broader efforts to improve energy efficiency and lower utility costs. The program’s savings goals were revised as part of a change order submitted to the Commission in June 2005 and approved in November 2005.
1.2.1 Energy and Peak Demand Reduction Goals
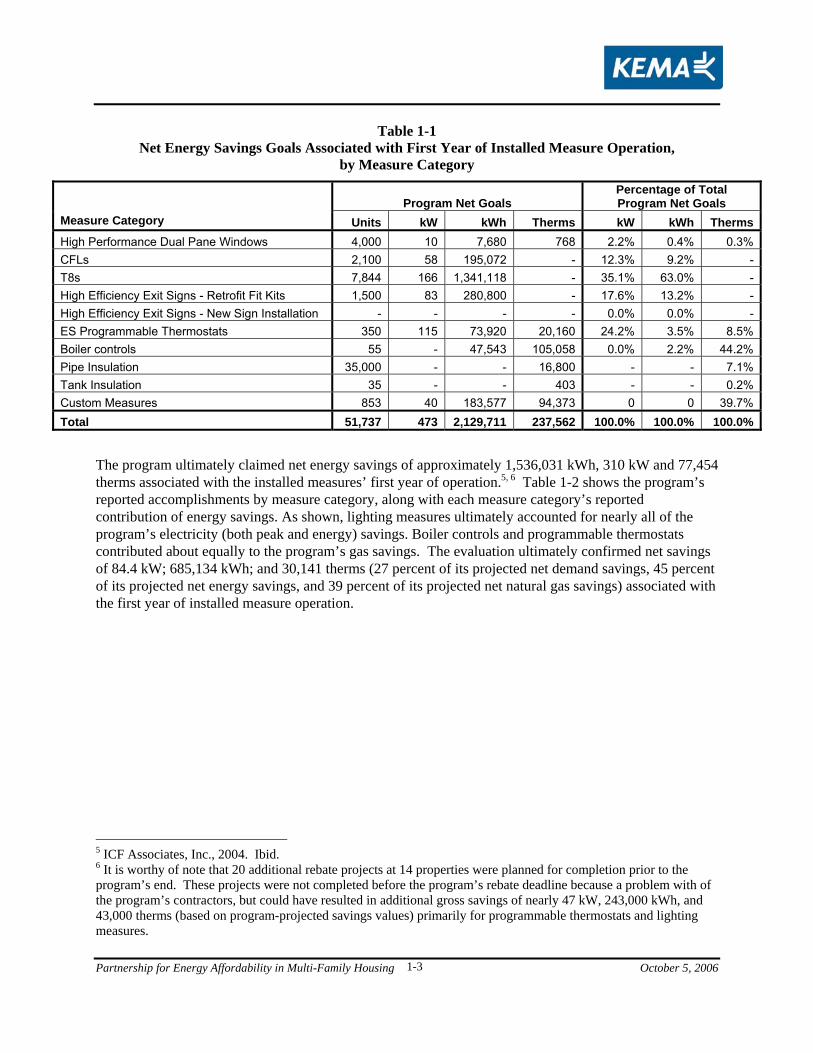
The Partnership set energy savings and unit goals for the installation of energy-efficiency measures. Through providing rebates to qualifying properties, the program intended to achieve 2.1 MWh, 473 kW, and 238,000 therms in net savings associated with the installed measures’ first year of operation.4 Table 1-1 shows the program’s net savings goals by measure category, along with each measure category’s expected contribution to total net savings for the first year of installed measure operation. As shown, the program planned on meeting its energy savings goals through a combination of prescriptive and custom measures – including CFLs, T8s, HVAC equipment, boiler controls and other custom measures.
3 ICF Associates, Inc., 2004. “PY 2004–2005 The Partnership for Energy Affordability in Multi-Family Housing (Energy Action): PG&E Utility Service Territory.” Submitted to California Public Utilities Commission as Program Implementation Plan (PIP) on January 2, 2004. 4 Based on Attachment A-3 to the program’s second change order submission (Table 2, “ProjectedEEActivities”) and on the per-unit assumptions provided in Tables 5 and 6 in the Program Implementation Plan.
Partnership for Energy Affordability in Multi-Family Housing October 5, 2006
1-3
Table 1-1 Net Energy Savings Goals Associated with First Year of Installed Measure Operation,
by Measure Category
Program Net Goals Percentage of Total Program Net Goals
Measure Category Units kW kWh Therms kW kWh ThermsHigh Performance Dual Pane Windows 4,000 10 7,680 768 2.2% 0.4% 0.3%CFLs 2,100 58 195,072 - 12.3% 9.2% - T8s 7,844 166 1,341,118 - 35.1% 63.0% - High Efficiency Exit Signs - Retrofit Fit Kits 1,500 83 280,800 - 17.6% 13.2% - High Efficiency Exit Signs - New Sign Installation - - - - 0.0% 0.0% - ES Programmable Thermostats 350 115 73,920 20,160 24.2% 3.5% 8.5%Boiler controls 55 - 47,543 105,058 0.0% 2.2% 44.2%Pipe Insulation 35,000 - - 16,800 - - 7.1%Tank Insulation 35 - - 403 - - 0.2%Custom Measures 853 40 183,577 94,373 0 0 39.7%Total 51,737 473 2,129,711 237,562 100.0% 100.0% 100.0%
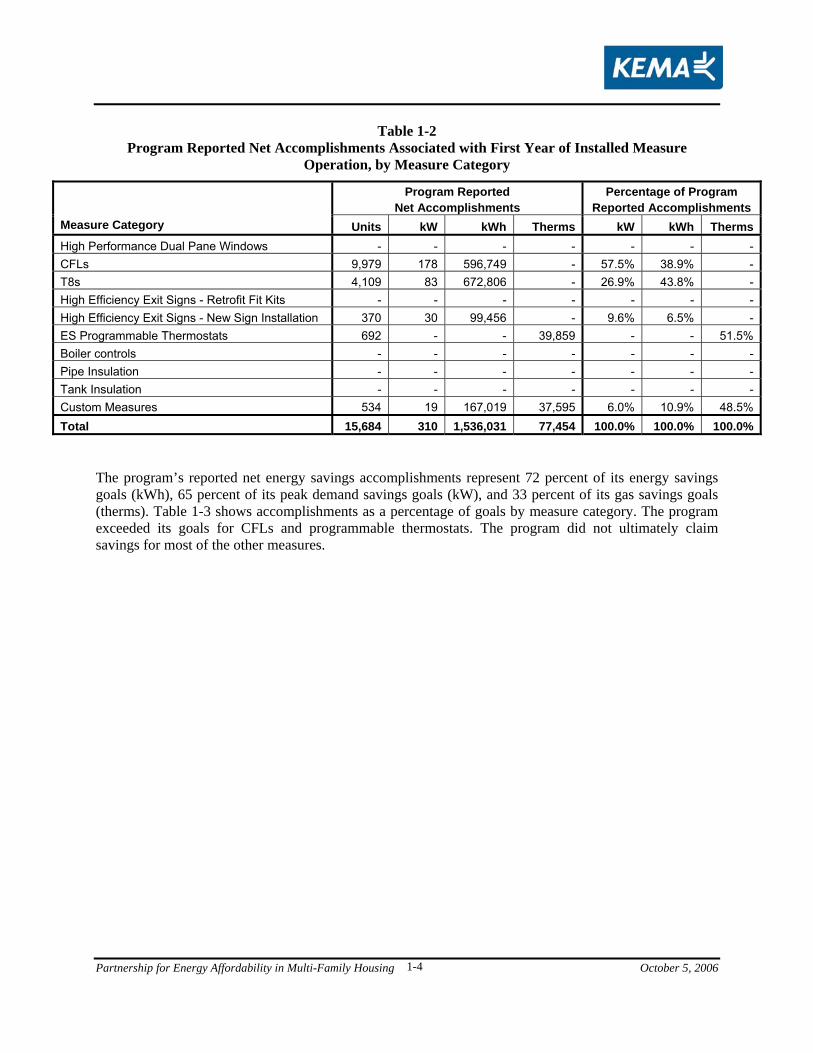
The program ultimately claimed net energy savings of approximately 1,536,031 kWh, 310 kW and 77,454 therms associated with the installed measures’ first year of operation.5, 6 Table 1-2 shows the program’s reported accomplishments by measure category, along with each measure category’s reported contribution of energy savings. As shown, lighting measures ultimately accounted for nearly all of the program’s electricity (both peak and energy) savings. Boiler controls and programmable thermostats contributed about equally to the program’s gas savings. The evaluation ultimately confirmed net savings of 84.4 kW; 685,134 kWh; and 30,141 therms (27 percent of its projected net demand savings, 45 percent of its projected net energy savings, and 39 percent of its projected net natural gas savings) associated with the first year of installed measure operation.
5 ICF Associates, Inc., 2004. Ibid. 6 It is worthy of note that 20 additional rebate projects at 14 properties were planned for completion prior to the program’s end. These projects were not completed before the program’s rebate deadline because a problem with of the program’s contractors, but could have resulted in additional gross savings of nearly 47 kW, 243,000 kWh, and 43,000 therms (based on program-projected savings values) primarily for programmable thermostats and lighting measures.
Partnership for Energy Affordability in Multi-Family Housing October 5, 2006
1-4
Table 1-2 Program Reported Net Accomplishments Associated with First Year of Installed Measure
Operation, by Measure Category
Program Reported Net Accomplishments
Percentage of Program Reported Accomplishments
Measure Category Units kW kWh Therms kW kWh ThermsHigh Performance Dual Pane Windows - - - - - - -CFLs 9,979 178 596,749 - 57.5% 38.9% -T8s 4,109 83 672,806 - 26.9% 43.8% -High Efficiency Exit Signs - Retrofit Fit Kits - - - - - - -High Efficiency Exit Signs - New Sign Installation 370 30 99,456 - 9.6% 6.5% -ES Programmable Thermostats 692 - - 39,859 - - 51.5%Boiler controls - - - - - - -Pipe Insulation - - - - - - -Tank Insulation - - - - - - -Custom Measures 534 19 167,019 37,595 6.0% 10.9% 48.5%Total 15,684 310 1,536,031 77,454 100.0% 100.0% 100.0%
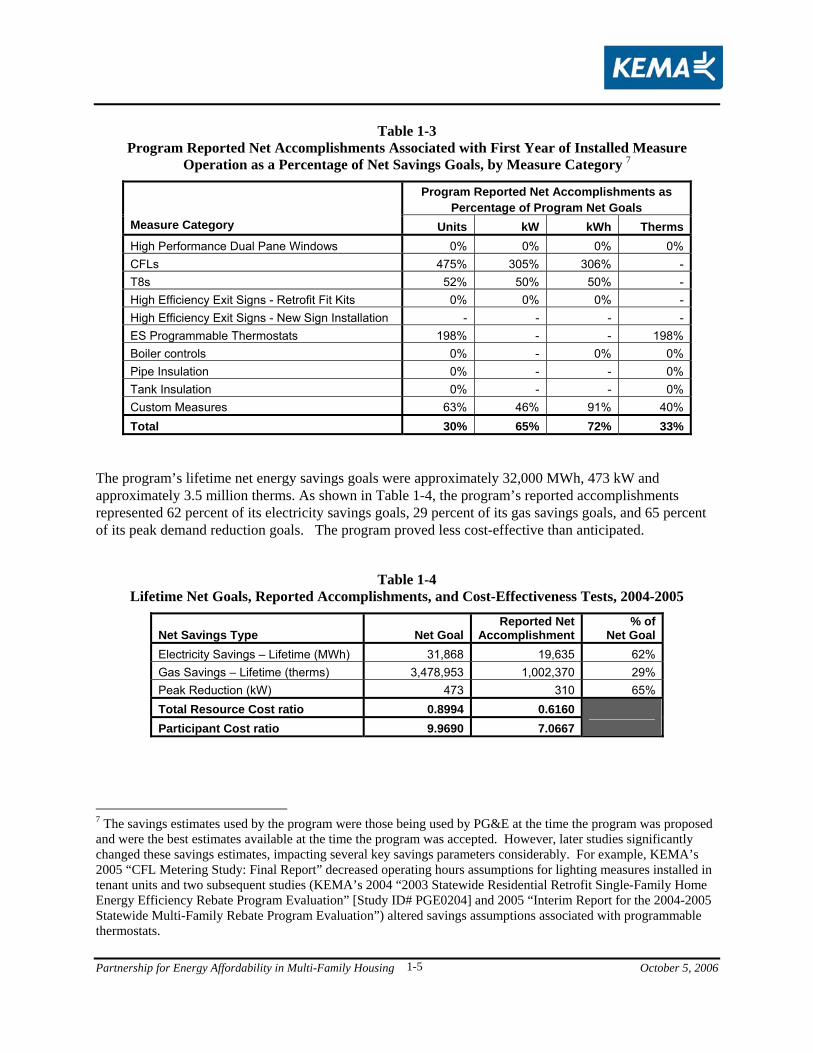
The program’s reported net energy savings accomplishments represent 72 percent of its energy savings goals (kWh), 65 percent of its peak demand savings goals (kW), and 33 percent of its gas savings goals (therms). Table 1-3 shows accomplishments as a percentage of goals by measure category. The program exceeded its goals for CFLs and programmable thermostats. The program did not ultimately claim savings for most of the other measures.
Partnership for Energy Affordability in Multi-Family Housing October 5, 2006
1-5
Table 1-3 Program Reported Net Accomplishments Associated with First Year of Installed Measure
Operation as a Percentage of Net Savings Goals, by Measure Category 7
Program Reported Net Accomplishments as Percentage of Program Net Goals
Measure Category Units kW kWh ThermsHigh Performance Dual Pane Windows 0% 0% 0% 0%CFLs 475% 305% 306% -T8s 52% 50% 50% -High Efficiency Exit Signs - Retrofit Fit Kits 0% 0% 0% -High Efficiency Exit Signs - New Sign Installation - - - -ES Programmable Thermostats 198% - - 198%Boiler controls 0% - 0% 0%Pipe Insulation 0% - - 0%Tank Insulation 0% - - 0%Custom Measures 63% 46% 91% 40%Total 30% 65% 72% 33%
The program’s lifetime net energy savings goals were approximately 32,000 MWh, 473 kW and approximately 3.5 million therms. As shown in Table 1-4, the program’s reported accomplishments represented 62 percent of its electricity savings goals, 29 percent of its gas savings goals, and 65 percent of its peak demand reduction goals. The program proved less cost-effective than anticipated.
Table 1-4
Lifetime Net Goals, Reported Accomplishments, and Cost-Effectiveness Tests, 2004-2005
Net Savings Type Net GoalReported Net
Accomplishment % of
Net GoalElectricity Savings – Lifetime (MWh) 31,868 19,635 62%Gas Savings – Lifetime (therms) 3,478,953 1,002,370 29%Peak Reduction (kW) 473 310 65%Total Resource Cost ratio 0.8994 0.6160 Participant Cost ratio 9.9690 7.0667
7 The savings estimates used by the program were those being used by PG&E at the time the program was proposed and were the best estimates available at the time the program was accepted. However, later studies significantly changed these savings estimates, impacting several key savings parameters considerably. For example, KEMA’s 2005 “CFL Metering Study: Final Report” decreased operating hours assumptions for lighting measures installed in tenant units and two subsequent studies (KEMA’s 2004 “2003 Statewide Residential Retrofit Single-Family Home Energy Efficiency Rebate Program Evaluation” [Study ID# PGE0204] and 2005 “Interim Report for the 2004-2005 Statewide Multi-Family Rebate Program Evaluation”) altered savings assumptions associated with programmable thermostats.
Partnership for Energy Affordability in Multi-Family Housing October 5, 2006
1-6
1.2.2 Non-Energy Savings Goals
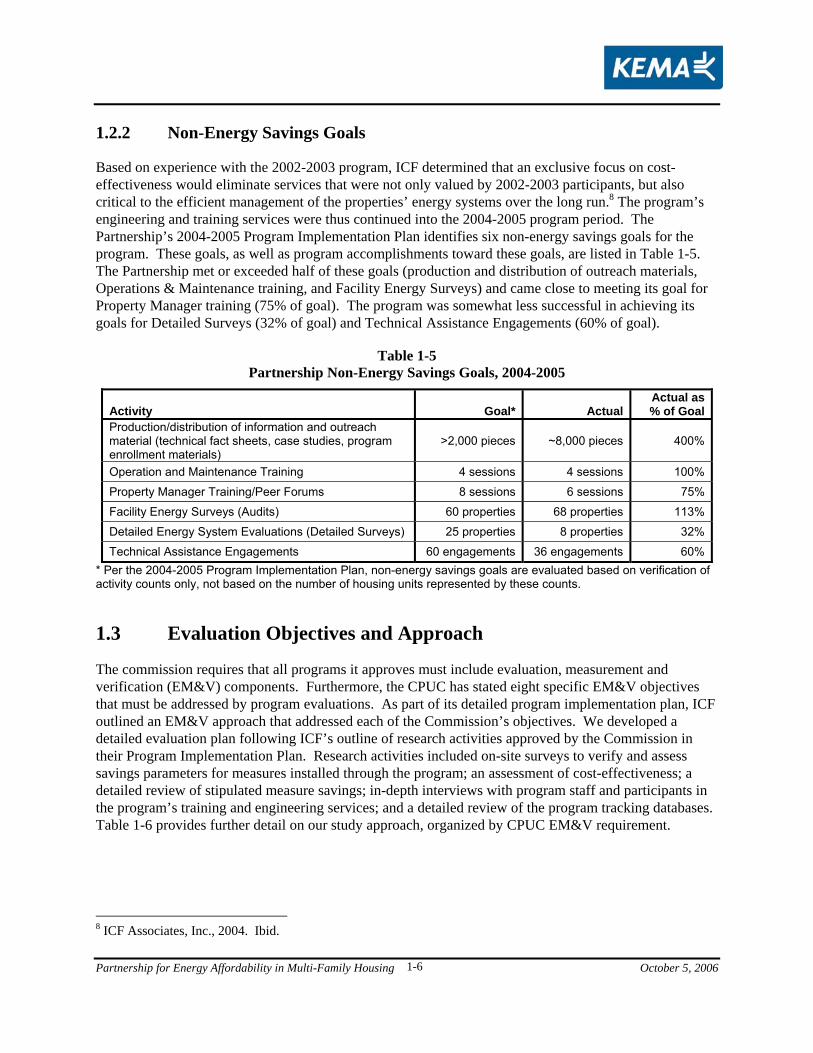
Based on experience with the 2002-2003 program, ICF determined that an exclusive focus on cost-effectiveness would eliminate services that were not only valued by 2002-2003 participants, but also critical to the efficient management of the properties’ energy systems over the long run.8 The program’s engineering and training services were thus continued into the 2004-2005 program period. The Partnership’s 2004-2005 Program Implementation Plan identifies six non-energy savings goals for the program. These goals, as well as program accomplishments toward these goals, are listed in Table 1-5. The Partnership met or exceeded half of these goals (production and distribution of outreach materials, Operations & Maintenance training, and Facility Energy Surveys) and came close to meeting its goal for Property Manager training (75% of goal). The program was somewhat less successful in achieving its goals for Detailed Surveys (32% of goal) and Technical Assistance Engagements (60% of goal).
Table 1-5 Partnership Non-Energy Savings Goals, 2004-2005
Activity Goal* Actual Actual as
% of GoalProduction/distribution of information and outreach material (technical fact sheets, case studies, program enrollment materials)
>2,000 pieces ~8,000 pieces 400%
Operation and Maintenance Training 4 sessions 4 sessions 100%
Property Manager Training/Peer Forums 8 sessions 6 sessions 75%
Facility Energy Surveys (Audits) 60 properties 68 properties 113%
Detailed Energy System Evaluations (Detailed Surveys) 25 properties 8 properties 32%
Technical Assistance Engagements 60 engagements 36 engagements 60%* Per the 2004-2005 Program Implementation Plan, non-energy savings goals are evaluated based on verification of activity counts only, not based on the number of housing units represented by these counts. 1.3 Evaluation Objectives and Approach
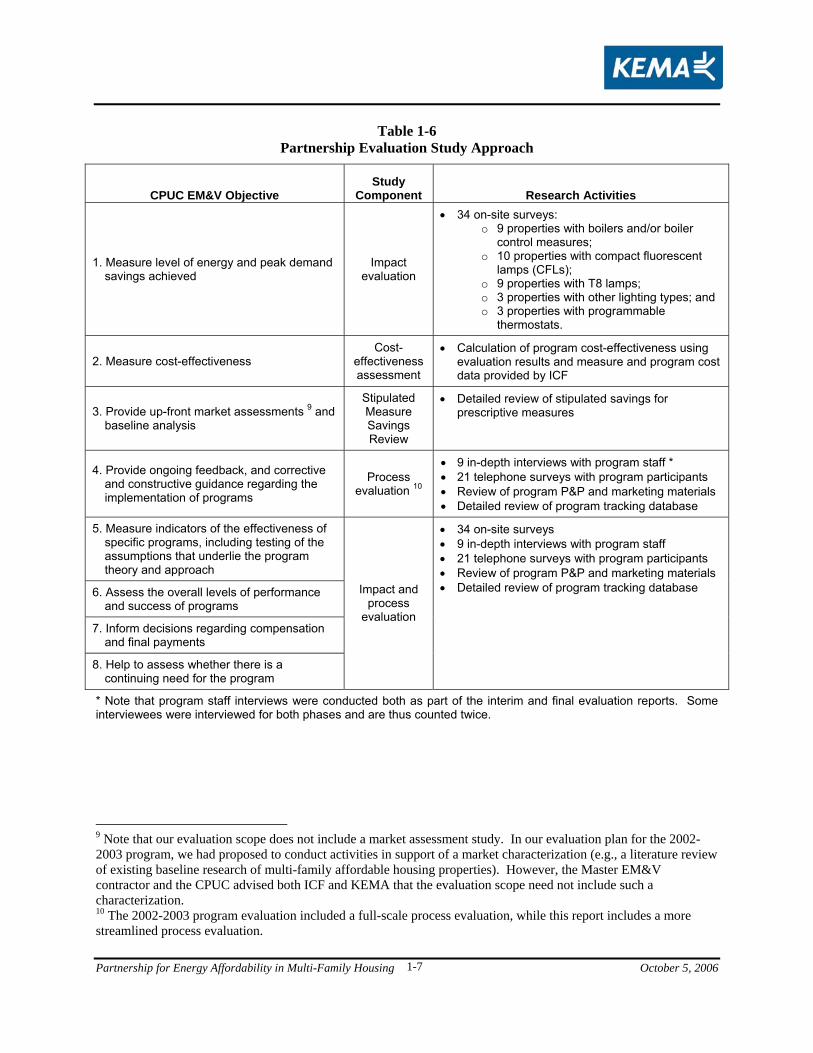
The commission requires that all programs it approves must include evaluation, measurement and verification (EM&V) components. Furthermore, the CPUC has stated eight specific EM&V objectives that must be addressed by program evaluations. As part of its detailed program implementation plan, ICF outlined an EM&V approach that addressed each of the Commission’s objectives. We developed a detailed evaluation plan following ICF’s outline of research activities approved by the Commission in their Program Implementation Plan. Research activities included on-site surveys to verify and assess savings parameters for measures installed through the program; an assessment of cost-effectiveness; a detailed review of stipulated measure savings; in-depth interviews with program staff and participants in the program’s training and engineering services; and a detailed review of the program tracking databases. Table 1-6 provides further detail on our study approach, organized by CPUC EM&V requirement.
8 ICF Associates, Inc., 2004. Ibid.
Partnership for Energy Affordability in Multi-Family Housing October 5, 2006
1-7
Table 1-6 Partnership Evaluation Study Approach
CPUC EM&V Objective Study
Component Research Activities
1. Measure level of energy and peak demand savings achieved
Impact evaluation
• 34 on-site surveys: o 9 properties with boilers and/or boiler
control measures; o 10 properties with compact fluorescent
lamps (CFLs); o 9 properties with T8 lamps; o 3 properties with other lighting types; and o 3 properties with programmable
thermostats.
2. Measure cost-effectiveness Cost-
effectiveness assessment
• Calculation of program cost-effectiveness using evaluation results and measure and program cost data provided by ICF
3. Provide up-front market assessments 9 and baseline analysis
Stipulated Measure Savings Review
• Detailed review of stipulated savings for prescriptive measures
4. Provide ongoing feedback, and corrective and constructive guidance regarding the implementation of programs
Process evaluation 10
• 9 in-depth interviews with program staff * • 21 telephone surveys with program participants • Review of program P&P and marketing materials • Detailed review of program tracking database
5. Measure indicators of the effectiveness of specific programs, including testing of the assumptions that underlie the program theory and approach
6. Assess the overall levels of performance and success of programs
7. Inform decisions regarding compensation and final payments
8. Help to assess whether there is a continuing need for the program
Impact and process
evaluation
• 34 on-site surveys • 9 in-depth interviews with program staff • 21 telephone surveys with program participants • Review of program P&P and marketing materials • Detailed review of program tracking database
* Note that program staff interviews were conducted both as part of the interim and final evaluation reports. Some interviewees were interviewed for both phases and are thus counted twice.
9 Note that our evaluation scope does not include a market assessment study. In our evaluation plan for the 2002-2003 program, we had proposed to conduct activities in support of a market characterization (e.g., a literature review of existing baseline research of multi-family affordable housing properties). However, the Master EM&V contractor and the CPUC advised both ICF and KEMA that the evaluation scope need not include such a characterization. 10 The 2002-2003 program evaluation included a full-scale process evaluation, while this report includes a more streamlined process evaluation.
Partnership for Energy Affordability in Multi-Family Housing October 5, 2006
1-8
1.4 Process Evaluation Results
There were two primary research activities associated with the process evaluation, each providing data to meet one or more of the CPUC EM&V requirements:
1. Qualitative interviews with a sample of 21 program training participants and recipients of engineering services; and
2. Qualitative interviews with key Program/Partner staff.
We also reviewed program materials including marketing and outreach collateral and monthly regulatory reports. These efforts resulted in a set of recommendations for future programs serving the affordable multi-family housing market.
1.4.1 Program Administration and Coordination
Administration. In general, administration of the 2004-2005 program was made more efficient and effective as a result of lessons learned in 2002 and 2003. New partners were added in 2004-2005, and some existing partners’ roles were adjusted to maximize their respective contributions. In general, these changes increased program efficiency and effectiveness.
Coordination. The Partnership continued to coordinate successfully with other California multi-family programs during 2004-2005. Approximately one third of the program participants we interviewed indicated that Partnership staff referred them to other energy-efficiency and renewable energy programs, including LightWash, the statewide Multi-Family Energy Efficiency Rebate Program, and others. The program also encountered some overlap with these other energy-efficiency programs. In some cases, the Partnership performed engineering services and followed up later to find that the properties had obtained incentives through other programs. There were several cases in which this happened after the Partnership already had rebate projects in process (with rebate reservations signed and approved).
1.4.2 Program Outreach
The Partnership incorporated a personalized approach to marketing and recruitment, dedicating a full-time employee (from LISC) to be the Energy Resource Manager (ERM). Consistent with 2002-2003 evaluation findings, program partners indicated that the ERM was beneficial in reaching the target market, due to familiarity with LISC and the ERM’s commitment to hand-holding properties through every step of the program.
This model of outreach proved fairly successful in engaging properties in the program’s engineering and training services. However, this model had less success in selling program rebates. Towards the end of the program, staff engaged two contractors in a direct install arrangement whereby properties could obtain CFLs and programmable thermostats at no cost. Under this arrangement, the contractors were successful in selling the program’s rebates. However, most partners agreed that the ERM’s role was important to establish trust with the property and to introduce them to the educational and engineering services. Moreover, both the ERM and ICF staff served an important role in providing oversight of the contractors. Thus, depending on the focus of future programs serving this target market, some combination of a face of the program from an organization that properties identify with and a stable of pre-screened contractors
Partnership for Energy Affordability in Multi-Family Housing October 5, 2006
1-9
might be the best model to achieve energy savings (i.e., sell rebates) and provide educational and engineering services.
1.4.3 Program Design
Equity versus cost-effectiveness. During the 2002-2003 implementation period, the Partnership was focused on providing information, engineering services, and referrals to affordable multi-family properties and had no direct energy savings goals. For the 2004-2005 program period, ICF added financial incentives to the program and it underwent a major shift in focus from education and services to demonstrable energy savings. Because of the necessary emphasis on achieving energy savings, the program may have had to place less of an emphasis on achieving equity in delivering its services to facilities of all sizes across its entire service area.
The multi-family affordable housing sector is particularly difficult for programs of this nature to serve. For example, reaching a particular property is most often time-consuming and involves repeated contacts to multiple people within the organization. Thus, a program that attempts to focus on achieving equity within this sector (e.g., reaching small or rural properties) will probably struggle to achieve cost-effective energy savings. Conversely, a program that focuses only on cost-effectiveness within this sector might only capture the low-hanging fruit and address only a handful of large properties. Based on the Partnership’s experience, future programs serving this target market should be explicit about the tradeoff between cost-effectiveness and equity and obtain clear direction from program sponsors as to the desired balance.
Regulatory oversight. Given the challenges of serving its target market, this program in particular may have been adversely affected by the administration of regulatory requirements. A lengthy change order approval process lead to extensive delays in making crucial changes to the program. Double-dipping checks (to prevent participation in multiple programs with incentives for the same measures) and multiple verification visits slowed down the rebate process and reduced the willing pool of participants. While these administrative procedures are likely necessary to ensure an appropriate level of oversight, this type of administrative model might not be the most effective way to innovatively and cost-effectively reach new target markets.
Program services. The Partnership offered an array of program services to program participants, including training and engineering services. Training workshops included Energy Action Academy workshops and Operations and Maintenance workshops, both for affordable multi-family housing staff. Engineering services included audits, detailed equipment surveys, and technical assistance. Other program services included financial incentives (rebates), interest-free loans, and procurement services.
Training. ICF and program partners conducted 10 training workshops during the 2004-2005 program period. Partners viewed training as valuable but felt it was difficult to determine whether participants were more likely to make independent energy efficiency improvements or apply for rebates than property representatives who did not participate in training. Interviews with workshop participants, however, revealed a correlation: 7 of 10 training participants we interviewed indicated that at least one change had been made as a result of the
Partnership for Energy Affordability in Multi-Family Housing October 5, 2006
1-10
training workshop.11 Because such a high proportion of attendees reportedly implemented changes in their properties as a result of attending the workshops, training may be a critical pathway for effecting change in the affordable multi-family housing market.
Engineering Services. Program partners viewed the 2004-2005 program’s tailored approach to engineering services as an improvement over the prior implementation period. The Partnership presented a full range of measures in the audit reports in addition to providing recommendations for which the payback period was brief. Inclusion of longer-term recommendations was a benefit to property owners and management staff because of the long budgetary lead-time required by many organizations before making upgrades. Several program participants indicated that while their organizations may not have been able to make upgrades during the program period, they will refer to the audit reports when equipment fails or when replacement becomes a budgetary priority.
No-Interest Loans. Although one affordable housing organization seriously considered applying for a no-interest loan (and may have done so had the program period not expired), program participants did not utilize the program’s interest-free loan component. All program partners and several participants mentioned that many affordable multi-family properties are cash-strapped and have difficulty taking on additional debt. Even for cases in which a project’s monthly energy savings are projected to be higher than monthly loan payments, properties may be unable to take advantage of the interest-free loans because of a disconnect between their energy budget and loan payment pool.
Procurement services. The Partnership intended to leverage reduced prices available for bulk purchases and work with properties and management companies to find vendors willing to offer preferred pricing for common energy-efficiency measures. However, with the exception of some limited action with CFLs, this service never fully developed within the program as there were insufficient orders from participants for most measures. The Partnership’s contractors ultimately accounted for most of the volume of equipment installed by the properties.
1.4.4 Participant Satisfaction
On the whole, participants in the program’s program training and engineering services expressed high satisfaction with their participation in the Partnership. Using a scale of 1 to 5 where 5 means, “very satisfied” and 1 means, “not at all satisfied,” the 21 participants were asked to rank their overall satisfaction with the Partnership. The average rating among these respondents was 4.3, and the vast majority indicated that they had told another colleague or colleagues about the program. All but one participant said they would recommend the program to other property managers or owners at other affordable multi-family properties, and the remaining participant said he would also recommend the Partnership to others if the program made some minor improvements.
To investigate possible drivers of participant satisfaction, we examined average satisfaction ratings for rebate recipients and participants in each program service. Satisfaction was highest among participants who had received detailed surveys, rebates, and/or audits. We also examined a potential link between the 11 “Changes” in this case includes both measures for which the properties received financial incentives through the program and other energy-efficiency improvements for which the properties received no financial incentives through the program.
Partnership for Energy Affordability in Multi-Family Housing October 5, 2006
1-11
survey respondents’ sources of first awareness of the program but found no discernable relationship. However, it is difficult to make conclusive statements regarding the drivers of program satisfaction based on the limited sample (n = 21).
1.4.5 Conclusions and Recommendations
The Partnership struggled to balance equity and cost-effectiveness. Because the Partnership set goals for both energy savings and non-energy savings activities, the program faced challenges in striking an appropriate balance between equity and cost-effectiveness. To achieve equity, program staff would have to spend a great deal of time on recruiting smaller properties, conducting training workshops, spreading incentives across multiple organizations, maximizing measure comprehensiveness at measure installation sites, and so on. To achieve cost-effectiveness, program staff would have to do almost the opposite: recruit larger organizations, allow multiple properties within the same organization to receive incentives, abandon training workshops, and focus on the simplest or most accessible upgrades (e.g., lighting and programmable thermostats). The program struggled to find a balance for most of the implementation period, and had to ultimately shift its focus entirely toward reaching for the program’s energy-savings goals.
Because equity and cost-effectiveness are often competing priorities, the Partnership’s energy-savings goals may have been set too high to allow the program to achieve its goals related to equity. Furthermore, programs serving this market sector may require a policy directive to establish an appropriate balance between equity and cost-effectiveness.
• Recommendation: Because efforts associated with meeting non-energy savings goals provide valuable educational benefits (and may themselves result in energy savings, as described below), non-energy goals are an appropriate component of programs targeting the affordable sector of the multi-family housing market. The Commission should establish policy guidelines to enable these programs to set reasonable energy savings goals alongside their non-energy savings activities.
ICF provided effective program administration that enabled partners to focus on implementation priorities. ICF served as the “back office” of the program’s operations, handling the majority of the program’s administrative and regulatory reporting responsibilities. This design allowed program partners to focus their energies on implementation: this proved to be the most effective use of their time, as many partners were not experienced in working under this regulatory environment.
• Recommendation: Future programs targeting affordable multi-family housing should designate one firm with experience working in the regulatory environment to handle regulatory and administrative responsibilities, thus ensuring that implementation activities are given the highest possible priority by other program partners.
The Partnership included successful non-rebate services that may be critical in effecting long-term change in the affordable multi-family housing market. To be successful in reaching this sector, energy-efficiency programs may need to incorporate education and training services. Although contractors may provide an efficient means for engaging properties in the rebate process, relying solely on a contractor-driven approach limits the educational capacity of a program. Results of the program
Partnership for Energy Affordability in Multi-Family Housing October 5, 2006
1-12
evaluation indicate that educational efforts (such as the Partnership’s training and engineering services) may provide considerable energy-efficiency benefits.
Four out of 5 participants in these services reported that they made energy-saving changes in their facilities (such as equipment upgrades or improved maintenance practices) as a result of their participation in a training workshop, audit, detailed survey, or technical assistance visit.
Because the affordable multi-family housing market is underserved, many participants knew very little about energy efficiency prior to participating – although many participants were aware of other energy-efficiency programs prior to participating in the Partnership, only about one-third of the audit recipients indicated that they had heard of the recommended equipment prior to receiving the audit.
• Recommendation: Education and training may be important tools for effecting long-term change in the affordable multi-family housing market and should thus be included in future programs targeting this market.
Program participants reported high levels of satisfaction with the program and its services. Participants expressed high satisfaction with their participation in the Partnership program. On a scale of 1 to 5 where 5 means, “very satisfied” and 1 means, “not at all satisfied,” the average satisfaction rating across the 21 participants we interviewed was 4.3. Since many of these properties had not received these types of services in the past, these high scores might also reflect the importance of this type of program for this market sector. Likewise, the program’s use of the Energy Resource Manager (who works for a non-profit organization that specifically provides services to this sector) may have bolstered overall satisfaction levels.
It may be difficult for third-party programs targeting previously under-served sectors to simultaneously innovate, achieve equity, and be cost-effective. Having the utility act as a clearinghouse might be a more cost-effective model for getting third-parties to innovate and target under-served markets. Third-party programs such as the Partnership are expected to innovatively target specific markets (that are often-underserved) without overlapping with broad, statewide utility programs. These programs must also adhere to the same regulatory requirements as the utilities (which in practice may be more burdensome for third-party program implementers).
• Recommendation: To ensure accountability while still encouraging innovation, program administrators and implementers should develop mechanisms to allow for flexibility in implementation. For example, program implementers should try where possible to build flexibility into their program designs, such as tying incentive levels to those in the statewide program rather than setting fixed incentive amounts. Likewise, administrators should attempt to streamline the change order approval process to reduce delays in important changes.
A possible approach that would encourage innovation while limiting administrative overhead (and still maintaining appropriate oversight) would be to have the utility act as a clearinghouse for programs serving the multi-family housing market. Under this approach, outreach organizations could contract directly with PG&E and generate leads. PG&E would in turn pass these leads on to their dedicated pool of contractors (such as those that serve the statewide multi-family program). This model would simultaneously decrease administrative costs by streamlining double-dipping checks and improve coordination between entities serving this target
Partnership for Energy Affordability in Multi-Family Housing October 5, 2006
1-13
market by centrally coordinating the agencies that serve a particular sector within the target market.
Selling educational and informational services may require a different outreach approach than selling program rebates for energy efficient equipment. Program partners largely agree that the Energy Resource Manager (ERM) was effective in establishing contact with the properties and introducing them to the broad range of services offered by the program, but may not have provided the most efficient mechanism for closing the deal on rebates.
The program’s addition of no-cost installation contractors eliminated financial barriers for many properties and generated markedly increased participation late during the implementation period. The statewide Multi-Family Energy Efficiency Rebate program has relied on a contractor-driven recruitment approach with considerable success, but has had some issues with installation quality.12 These issues are not uncommon to energy efficiency programs.
• Recommendation: Energy-efficiency program staff should take steps to increase quality and reliability, including contractor oversight (such as was provided by Partnership program staff). Contactors should be held to high standards and excluded from future program installations for noncompliance as in the statewide Multi-Family Energy Efficiency Rebate Program. A combined approach – using contractors to “sell” the rebates, a dedicated resource (such as an Energy Resource Manager) to establish initial contact and introduce the contractors to the property representatives, and other program staff to provide contractor oversight – may prove effective.
1.5 Impact Evaluation Results
A total of 35 on-site surveys were conducted with participants whose properties received rebates through the program in order to meet one or more of the CPUC EM&V requirements. Measure-level sampling approach and results are as follows:
CFLs: The Partnership installed nearly 10,000 CFLs at 31 different properties. We visited 17 properties and inspected 783 compact fluorescent lamps (CFLs) at those properties. The low realization rate for CFL energy savings is attributable to the per unit savings assumptions used by the program. While the savings estimates used by the program were the best available at the time the program was proposed and accepted, later studies significantly changed these savings estimates, impacting several key savings parameters considerably. As outlined in the interim report (see Appendix B), prior to the completion of the California CFL Metering Study, Investor-Owned Utility (IOU) residential programs were assuming hours of operation for CFLs that were too high. The lower realization rate for demand savings is both a reflection of the realization of energy savings and the lower h-factor that the evaluation applied (based on more current data).
12 KEMA, Inc., 2004. “Interim Report for the 2004-2005 Statewide Multi-Family Rebate Program Evaluation.” Prepared for the California Public Utilities Commission; San Diego Gas & Electric Company; Pacific Gas and Electric Company; Southern California Edison; and Southern California Gas Company. September 15, 2005.
Partnership for Energy Affordability in Multi-Family Housing October 5, 2006
1-14
T8s: The Partnership installed more than 4,000 T8s at 38 different multi-family affordable housing properties. We visited 22 properties and inspected 1,540 T8s at those properties. The low realization rate for T8s is due to the program’s claimed per unit savings assumption, which was based on savings claims from PG&E’s 2004-2005 Multi-Family Energy Efficiency Rebate program.13 These estimates were the best available at the time ICF submitted the program proposal.
Other Lighting: The Partnership installed nearly 900 units of “other lighting” in 19 properties, consisting primarily of LED exit signs and exit sign retrofit kits. We visited 11 properties and inspected 297 fixtures and controls at those properties. Realization rates for other lighting are lower than expected due to per unit savings assumptions used by the program, which are based on claimed savings from PG&E’s Multi-Family rebate program. The lower realization rate for demand savings is both a reflection of the realization of energy savings and the lower demand h-factor that the evaluation applied (based on more current data). ICF used the best estimates available at the time their program proposal was submitted.
Programmable Thermostats: The Partnership installed nearly 700 programmable thermostats in 10 properties. We visited 9 properties and inspected 133 programmable thermostats at those properties. The low realization rate for programmable thermostat gas savings is attributable to the fact that few tenants use the programmable features of the thermostat – of the few tenants who are using these features, use of the features is not causing behavioral changes that result in lower energy use. The program’s claimed savings for this measure was based on prior studies that assumed generous savings under theoretical conditions (e.g., high baseline usage; major changes in thermostat set-points) that were not realized by the program. The Statewide Multi-Family rebate program has since removed this measure from its portfolio, but at the time that the Partnership was launched, this measure was relied upon by many programs in California for its high per unit deemed savings.
High-Efficiency Boilers: The Partnership installed a total of three high-efficiency boilers at two different properties. Both properties were visited and the three boilers were inspected; the verification rate was 100 percent.
Boiler Controls: A total of 99 boiler controls were installed through the Partnership at 23 properties. We visited 7 properties and inspected 26 boiler control installations at those properties.14 There were two different types of boiler control measures installed by the program - temperature-controlled recirculation controls (thermostatic controls) and water supply temperature controls (EDC controls). Realization rates for the EDC boiler controls are lower than expected because 2 of the 4 sampled properties did not have the measure operational at the time survey because they had problems with the systems.15
13 The PG&E Multi-Family Energy Efficiency Rebate program revised the h-factor associated with T8 measures program year 2004-2005. While the Partnership applied this revised h-factor (0.000124) for the T8 measures only (and not the other electric measures), we felt that using the most recent h-factor provided the greatest accuracy and have thus used it for all measures in this evaluation. 14 We also contacted two additional properties that had received rebates for EDC controls by telephone. We were able to verify that the controls were operational at both properties. 15 The two sampled properties that did not have the measure operational had switched the units off and unplugged them.
Partnership for Energy Affordability in Multi-Family Housing October 5, 2006
1-15
Other Measures: Although the program established energy savings goals in other measure categories (including windows, insulation, and others), none of these measures were installed through the program. The majority of measure installations through the program were in the lighting (CFL, T8, and other) and programmable thermostats categories.
1.5.1 Net-to-Gross Analysis
1.5.1.1 NTG Ratios
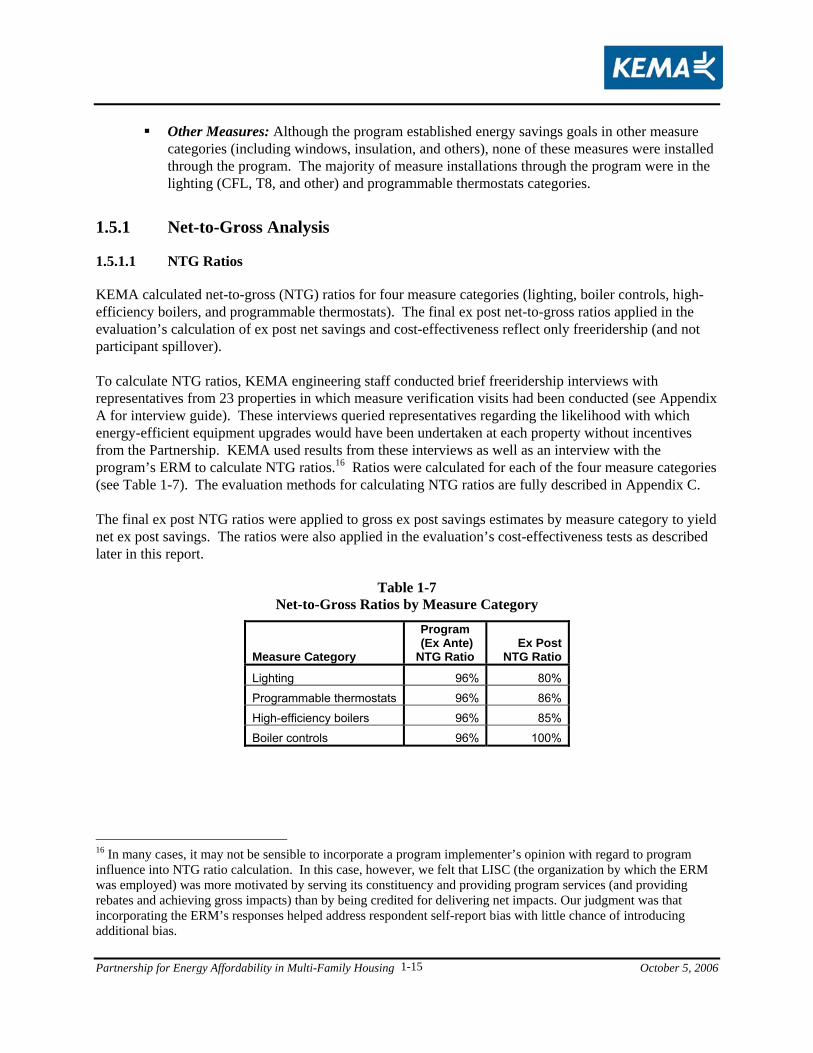
KEMA calculated net-to-gross (NTG) ratios for four measure categories (lighting, boiler controls, high-efficiency boilers, and programmable thermostats). The final ex post net-to-gross ratios applied in the evaluation’s calculation of ex post net savings and cost-effectiveness reflect only freeridership (and not participant spillover). To calculate NTG ratios, KEMA engineering staff conducted brief freeridership interviews with representatives from 23 properties in which measure verification visits had been conducted (see Appendix A for interview guide). These interviews queried representatives regarding the likelihood with which energy-efficient equipment upgrades would have been undertaken at each property without incentives from the Partnership. KEMA used results from these interviews as well as an interview with the program’s ERM to calculate NTG ratios.16 Ratios were calculated for each of the four measure categories (see Table 1-7). The evaluation methods for calculating NTG ratios are fully described in Appendix C. The final ex post NTG ratios were applied to gross ex post savings estimates by measure category to yield net ex post savings. The ratios were also applied in the evaluation’s cost-effectiveness tests as described later in this report.
Table 1-7
Net-to-Gross Ratios by Measure Category
Measure Category
Program (Ex Ante) NTG Ratio
Ex Post NTG Ratio
Lighting 96% 80%
Programmable thermostats 96% 86%
High-efficiency boilers 96% 85%
Boiler controls 96% 100%
16 In many cases, it may not be sensible to incorporate a program implementer’s opinion with regard to program influence into NTG ratio calculation. In this case, however, we felt that LISC (the organization by which the ERM was employed) was more motivated by serving its constituency and providing program services (and providing rebates and achieving gross impacts) than by being credited for delivering net impacts. Our judgment was that incorporating the ERM’s responses helped address respondent self-report bias with little chance of introducing additional bias.
Partnership for Energy Affordability in Multi-Family Housing October 5, 2006
1-16
1.5.1.2 Participant Spillover Rate
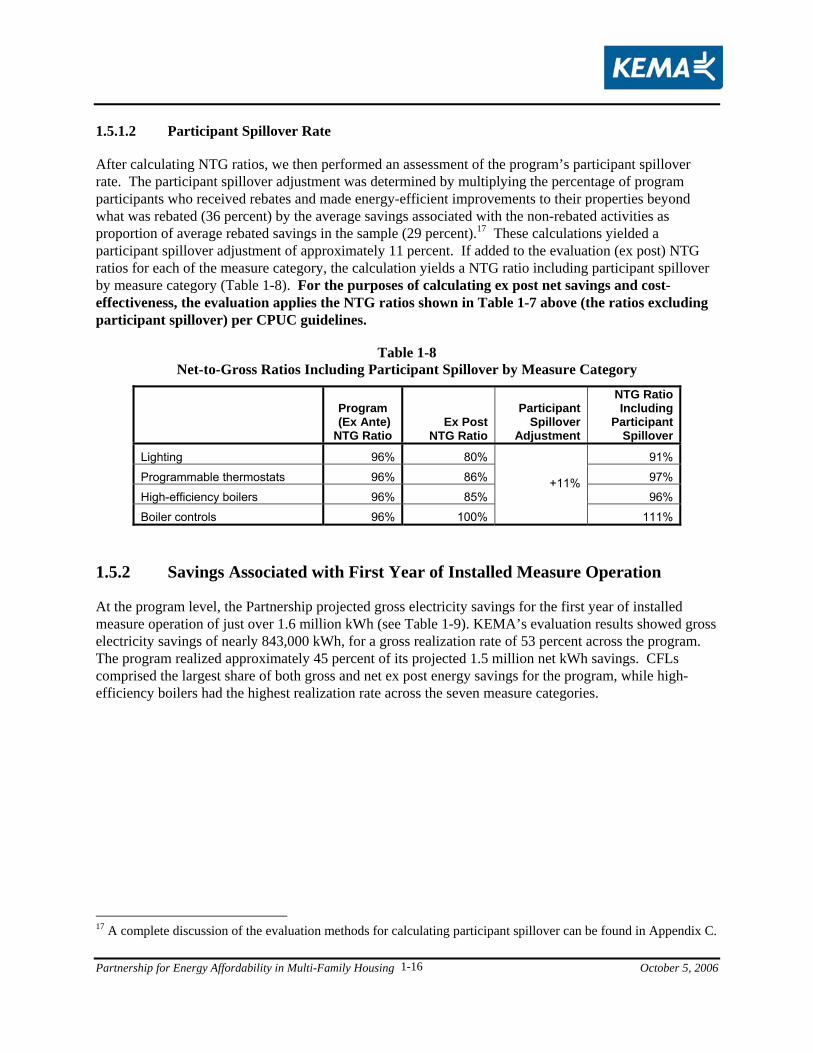
After calculating NTG ratios, we then performed an assessment of the program’s participant spillover rate. The participant spillover adjustment was determined by multiplying the percentage of program participants who received rebates and made energy-efficient improvements to their properties beyond what was rebated (36 percent) by the average savings associated with the non-rebated activities as proportion of average rebated savings in the sample (29 percent).17 These calculations yielded a participant spillover adjustment of approximately 11 percent. If added to the evaluation (ex post) NTG ratios for each of the measure category, the calculation yields a NTG ratio including participant spillover by measure category (Table 1-8). For the purposes of calculating ex post net savings and cost-effectiveness, the evaluation applies the NTG ratios shown in Table 1-7 above (the ratios excluding participant spillover) per CPUC guidelines.
Table 1-8 Net-to-Gross Ratios Including Participant Spillover by Measure Category
Program (Ex Ante) NTG Ratio
Ex Post NTG Ratio
Participant Spillover
Adjustment
NTG Ratio Including
Participant Spillover
Lighting 96% 80% 91%
Programmable thermostats 96% 86% 97%
High-efficiency boilers 96% 85% 96%
Boiler controls 96% 100%
+11%
111%
1.5.2 Savings Associated with First Year of Installed Measure Operation
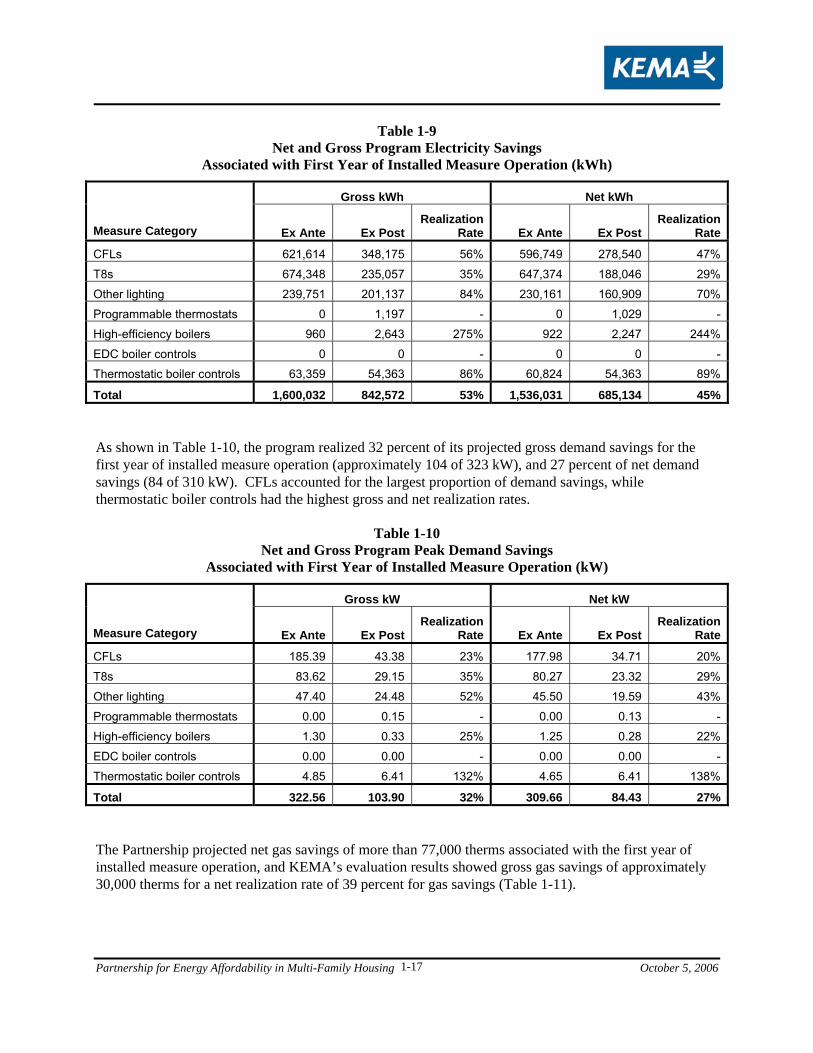
At the program level, the Partnership projected gross electricity savings for the first year of installed measure operation of just over 1.6 million kWh (see Table 1-9). KEMA’s evaluation results showed gross electricity savings of nearly 843,000 kWh, for a gross realization rate of 53 percent across the program. The program realized approximately 45 percent of its projected 1.5 million net kWh savings. CFLs comprised the largest share of both gross and net ex post energy savings for the program, while high-efficiency boilers had the highest realization rate across the seven measure categories.
17 A complete discussion of the evaluation methods for calculating participant spillover can be found in Appendix C.
Partnership for Energy Affordability in Multi-Family Housing October 5, 2006
1-17
Table 1-9 Net and Gross Program Electricity Savings
Associated with First Year of Installed Measure Operation (kWh)
Gross kWh Net kWh
Measure Category Ex Ante Ex Post Realization
Rate Ex Ante Ex Post Realization
Rate
CFLs 621,614 348,175 56% 596,749 278,540 47%
T8s 674,348 235,057 35% 647,374 188,046 29%
Other lighting 239,751 201,137 84% 230,161 160,909 70%
Programmable thermostats 0 1,197 - 0 1,029 -
High-efficiency boilers 960 2,643 275% 922 2,247 244%
EDC boiler controls 0 0 - 0 0 -
Thermostatic boiler controls 63,359 54,363 86% 60,824 54,363 89%
Total 1,600,032 842,572 53% 1,536,031 685,134 45% As shown in Table 1-10, the program realized 32 percent of its projected gross demand savings for the first year of installed measure operation (approximately 104 of 323 kW), and 27 percent of net demand savings (84 of 310 kW). CFLs accounted for the largest proportion of demand savings, while thermostatic boiler controls had the highest gross and net realization rates.
Table 1-10 Net and Gross Program Peak Demand Savings
Associated with First Year of Installed Measure Operation (kW)
Gross kW Net kW
Measure Category Ex Ante Ex Post Realization
Rate Ex Ante Ex Post Realization
Rate
CFLs 185.39 43.38 23% 177.98 34.71 20%
T8s 83.62 29.15 35% 80.27 23.32 29%
Other lighting 47.40 24.48 52% 45.50 19.59 43%
Programmable thermostats 0.00 0.15 - 0.00 0.13 -
High-efficiency boilers 1.30 0.33 25% 1.25 0.28 22%
EDC boiler controls 0.00 0.00 - 0.00 0.00 -
Thermostatic boiler controls 4.85 6.41 132% 4.65 6.41 138%
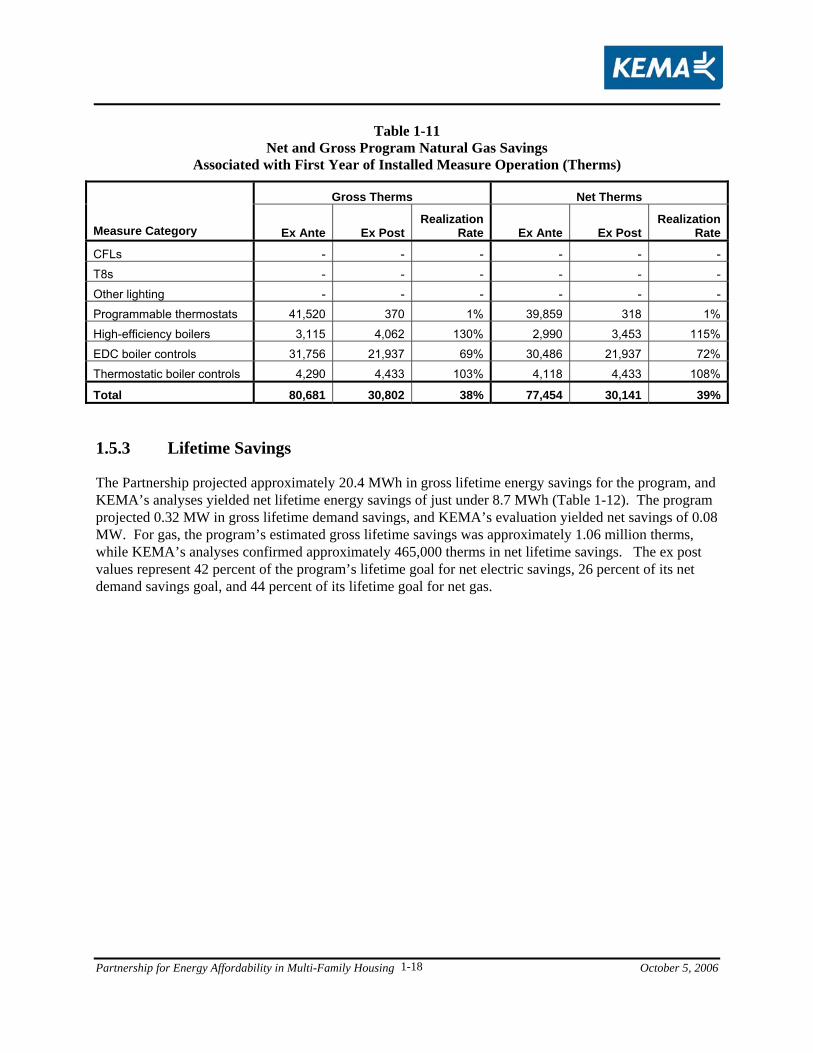
Total 322.56 103.90 32% 309.66 84.43 27% The Partnership projected net gas savings of more than 77,000 therms associated with the first year of installed measure operation, and KEMA’s evaluation results showed gross gas savings of approximately 30,000 therms for a net realization rate of 39 percent for gas savings (Table 1-11).
Partnership for Energy Affordability in Multi-Family Housing October 5, 2006
1-18
Table 1-11 Net and Gross Program Natural Gas Savings
Associated with First Year of Installed Measure Operation (Therms)
Gross Therms Net Therms
Measure Category Ex Ante Ex Post Realization
Rate Ex Ante Ex Post Realization
Rate
CFLs - - - - - -
T8s - - - - - -
Other lighting - - - - - -
Programmable thermostats 41,520 370 1% 39,859 318 1%
High-efficiency boilers 3,115 4,062 130% 2,990 3,453 115%
EDC boiler controls 31,756 21,937 69% 30,486 21,937 72%
Thermostatic boiler controls 4,290 4,433 103% 4,118 4,433 108%
Total 80,681 30,802 38% 77,454 30,141 39% 1.5.3 Lifetime Savings
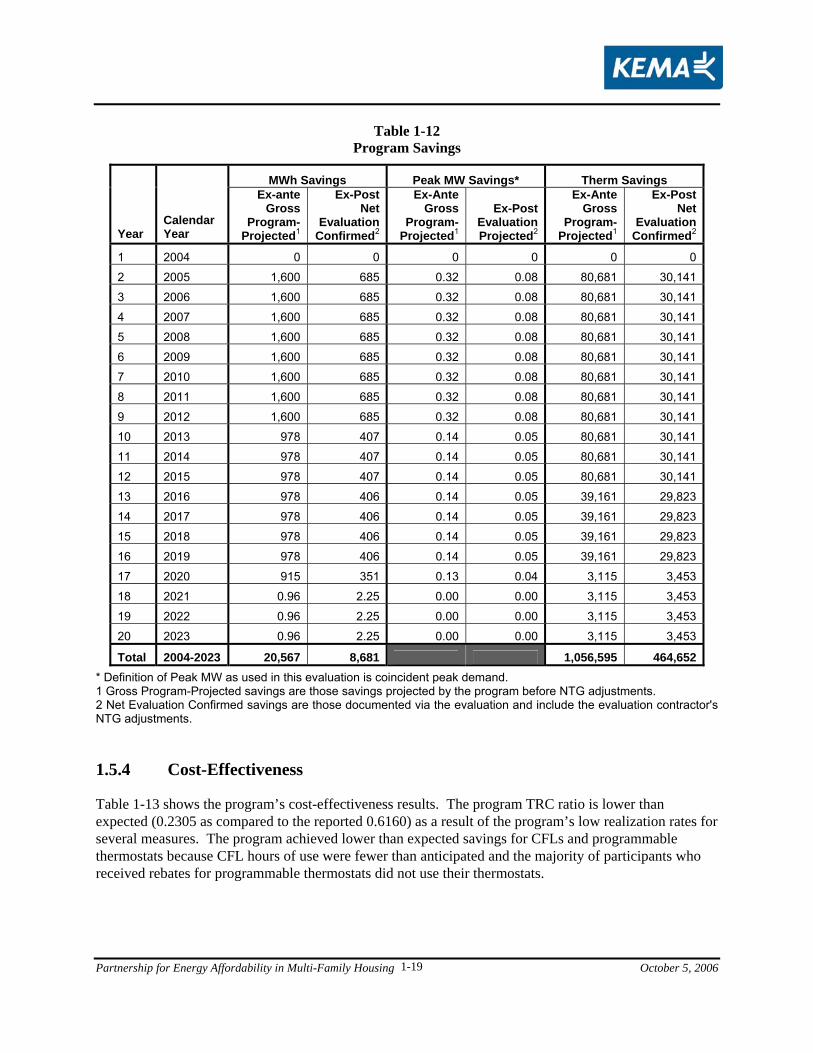
The Partnership projected approximately 20.4 MWh in gross lifetime energy savings for the program, and KEMA’s analyses yielded net lifetime energy savings of just under 8.7 MWh (Table 1-12). The program projected 0.32 MW in gross lifetime demand savings, and KEMA’s evaluation yielded net savings of 0.08 MW. For gas, the program’s estimated gross lifetime savings was approximately 1.06 million therms, while KEMA’s analyses confirmed approximately 465,000 therms in net lifetime savings. The ex post values represent 42 percent of the program’s lifetime goal for net electric savings, 26 percent of its net demand savings goal, and 44 percent of its lifetime goal for net gas.
Partnership for Energy Affordability in Multi-Family Housing October 5, 2006
1-19
Table 1-12 Program Savings
MWh Savings Peak MW Savings* Therm Savings
Year Calendar Year
Ex-ante Gross
Program-Projected1
Ex-Post Net
Evaluation Confirmed2
Ex-Ante Gross
Program-Projected1
Ex-Post Evaluation Projected2
Ex-Ante Gross
Program-Projected1
Ex-Post Net
Evaluation Confirmed2
1 2004 0 0 0 0 0 0
2 2005 1,600 685 0.32 0.08 80,681 30,141
3 2006 1,600 685 0.32 0.08 80,681 30,141
4 2007 1,600 685 0.32 0.08 80,681 30,141
5 2008 1,600 685 0.32 0.08 80,681 30,141
6 2009 1,600 685 0.32 0.08 80,681 30,141
7 2010 1,600 685 0.32 0.08 80,681 30,141
8 2011 1,600 685 0.32 0.08 80,681 30,141
9 2012 1,600 685 0.32 0.08 80,681 30,141
10 2013 978 407 0.14 0.05 80,681 30,141
11 2014 978 407 0.14 0.05 80,681 30,141
12 2015 978 407 0.14 0.05 80,681 30,141
13 2016 978 406 0.14 0.05 39,161 29,823
14 2017 978 406 0.14 0.05 39,161 29,823
15 2018 978 406 0.14 0.05 39,161 29,823
16 2019 978 406 0.14 0.05 39,161 29,823
17 2020 915 351 0.13 0.04 3,115 3,453
18 2021 0.96 2.25 0.00 0.00 3,115 3,453
19 2022 0.96 2.25 0.00 0.00 3,115 3,453
20 2023 0.96 2.25 0.00 0.00 3,115 3,453
Total 2004-2023 20,567 8,681 1,056,595 464,652* Definition of Peak MW as used in this evaluation is coincident peak demand. 1 Gross Program-Projected savings are those savings projected by the program before NTG adjustments. 2 Net Evaluation Confirmed savings are those documented via the evaluation and include the evaluation contractor's NTG adjustments. 1.5.4 Cost-Effectiveness
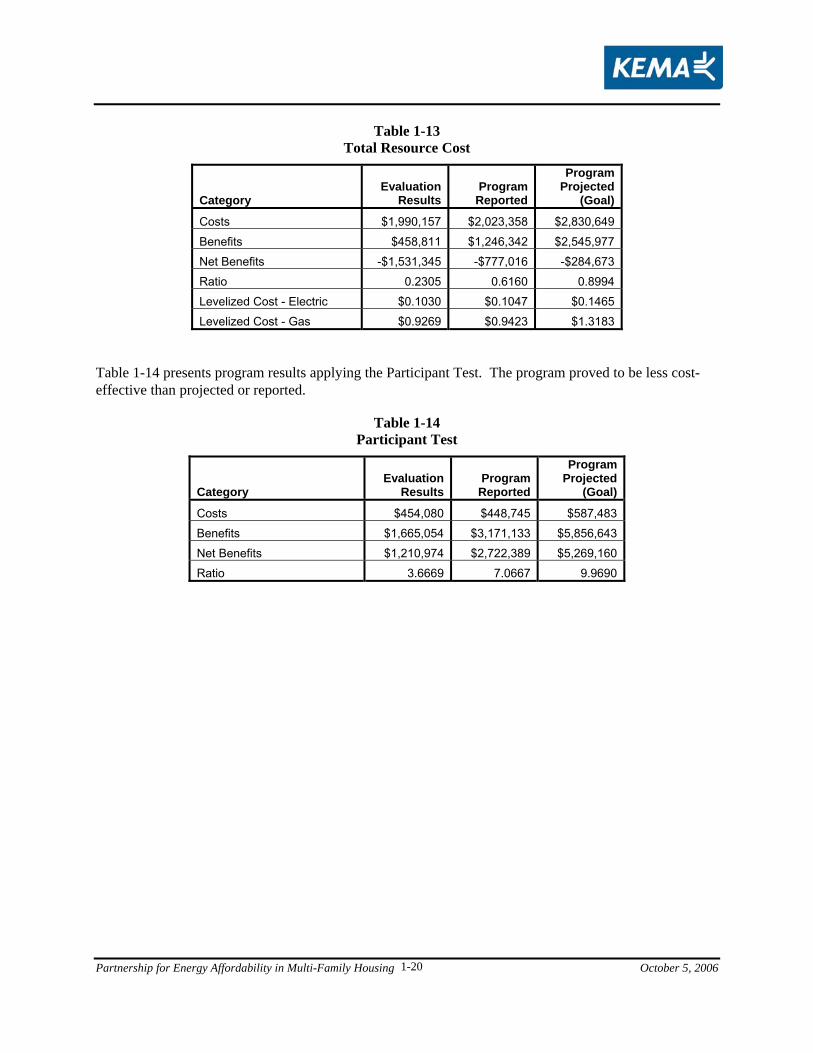
Table 1-13 shows the program’s cost-effectiveness results. The program TRC ratio is lower than expected (0.2305 as compared to the reported 0.6160) as a result of the program’s low realization rates for several measures. The program achieved lower than expected savings for CFLs and programmable thermostats because CFL hours of use were fewer than anticipated and the majority of participants who received rebates for programmable thermostats did not use their thermostats.
Partnership for Energy Affordability in Multi-Family Housing October 5, 2006
1-20
Table 1-13 Total Resource Cost
Category Evaluation
ResultsProgram
Reported
Program Projected
(Goal)
Costs $1,990,157 $2,023,358 $2,830,649
Benefits $458,811 $1,246,342 $2,545,977
Net Benefits -$1,531,345 -$777,016 -$284,673
Ratio 0.2305 0.6160 0.8994
Levelized Cost - Electric $0.1030 $0.1047 $0.1465
Levelized Cost - Gas $0.9269 $0.9423 $1.3183
Table 1-14 presents program results applying the Participant Test. The program proved to be less cost-effective than projected or reported.
Table 1-14 Participant Test
Category Evaluation
ResultsProgram
Reported
Program Projected
(Goal)
Costs $454,080 $448,745 $587,483
Benefits $1,665,054 $3,171,133 $5,856,643
Net Benefits $1,210,974 $2,722,389 $5,269,160
Ratio 3.6669 7.0667 9.9690
Partnership for Energy Affordability in Multi-Family Housing October 5, 2006
2-1
2. Introduction
2.1 Background
This report provides the results of KEMA’s evaluation, monitoring, and verification efforts for the 2004-2005 Partnership for Energy Affordability in Multi-Family Housing (“the Partnership”). Designed and implemented by ICF Associates, Inc. (“ICF”), the 2004-2005 program is the continuation of a third-party energy-efficiency program selected by the California Public Utilities Commission (“the Commission”) for the 2002-2003 funding cycle. KEMA, Inc. conducted an evaluation of the 2002-2003 program and released a final report in June, 2004.18
This section of the report provides an overview of the Partnership, a summary of the barriers that affordable multi-family properties face in implementing energy efficiency upgrades, a review of program goals and accomplishments, and a summary of the evaluation objectives and approach. The section concludes with an overview of the organization of the remainder of this report.
2.2 Program Overview
The 2004-2005 Partnership differed from the 2002-2003 program in that ICF broadened the program’s focus and array of services. ICF also altered the composition of the partnership and the roles of program partners. This section provides a brief overview of the 2004-2005 program design, its goals, and changes from the 2002-2003 program.19
2.2.1 Overview of Program and Partner Organizations
The Partnership provided technical and financial assistance through a variety of mechanisms to owners, managers, and maintenance staff of affordable multi-family housing20 in the San Francisco Bay Area and vicinities within the Central Valley. ICF directed the program and involved several partners, including: the Bay Area Local Initiatives Support Corporation (LISC); the California Coalition for Rural Housing (CCRH); Generating Renewable Ideas for Development (GRID) Alternatives; kW Engineering; Non-Profit Housing of Northern California (NPH); and Strategic Energy Innovations (SEI). The partnership involved service providers within the disciplines of affordable housing and energy efficiency to leverage the market insights and credibility provided by these organizations to deliver energy efficiency and related services to the target market. Table 2-1 provides an overview of program partners and their responsibilities.
18 KEMA, Inc., 2004. “Evaluation of the Partnership for Energy Affordability in Multi-family Housing: Final Report.” Prepared for ICF Consulting. June 23, 2004. 19 The reader is referred to the 2002-2003 program evaluation report (Ibid.) for a complete description of the 2002-2003 program. 20 “Affordable” is defined as low-income households with incomes of between 50 and 80 percent of median family income (MFI). Publicly- and privately-supported multi-family (5 or more units) properties in PG&E’s service territory with master-metered or tenant-metered units and/or common areas are eligible to participate in the program.
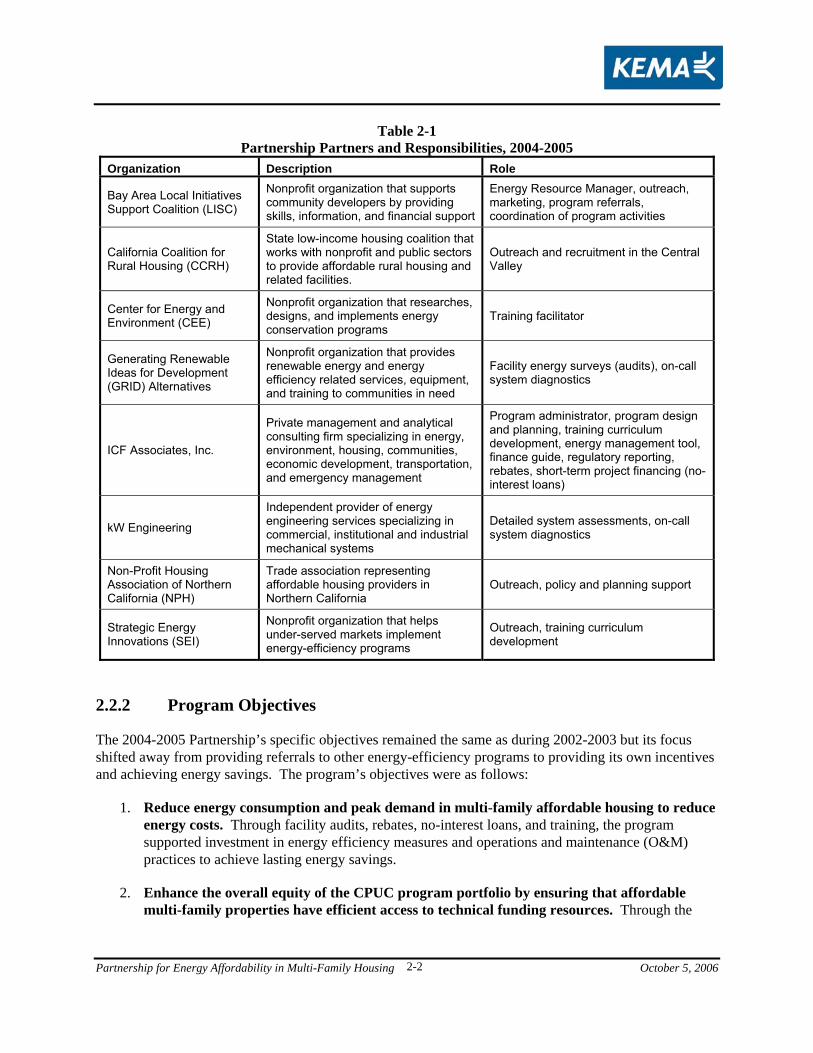
Partnership for Energy Affordability in Multi-Family Housing October 5, 2006
2-2
Table 2-1 Partnership Partners and Responsibilities, 2004-2005
Organization Description Role
Bay Area Local Initiatives Support Coalition (LISC)
Nonprofit organization that supports community developers by providing skills, information, and financial support
Energy Resource Manager, outreach, marketing, program referrals, coordination of program activities
California Coalition for Rural Housing (CCRH)
State low-income housing coalition that works with nonprofit and public sectors to provide affordable rural housing and related facilities.
Outreach and recruitment in the Central Valley
Center for Energy and Environment (CEE)
Nonprofit organization that researches, designs, and implements energy conservation programs
Training facilitator
Generating Renewable Ideas for Development (GRID) Alternatives
Nonprofit organization that provides renewable energy and energy efficiency related services, equipment, and training to communities in need
Facility energy surveys (audits), on-call system diagnostics
ICF Associates, Inc.
Private management and analytical consulting firm specializing in energy, environment, housing, communities, economic development, transportation, and emergency management
Program administrator, program design and planning, training curriculum development, energy management tool, finance guide, regulatory reporting, rebates, short-term project financing (no-interest loans)
kW Engineering
Independent provider of energy engineering services specializing in commercial, institutional and industrial mechanical systems
Detailed system assessments, on-call system diagnostics
Non-Profit Housing Association of Northern California (NPH)
Trade association representing affordable housing providers in Northern California
Outreach, policy and planning support
Strategic Energy Innovations (SEI)
Nonprofit organization that helps under-served markets implement energy-efficiency programs
Outreach, training curriculum development
2.2.2 Program Objectives
The 2004-2005 Partnership’s specific objectives remained the same as during 2002-2003 but its focus shifted away from providing referrals to other energy-efficiency programs to providing its own incentives and achieving energy savings. The program’s objectives were as follows:
1. Reduce energy consumption and peak demand in multi-family affordable housing to reduce energy costs. Through facility audits, rebates, no-interest loans, and training, the program supported investment in energy efficiency measures and operations and maintenance (O&M) practices to achieve lasting energy savings.
2. Enhance the overall equity of the CPUC program portfolio by ensuring that affordable multi-family properties have efficient access to technical funding resources. Through the
Partnership for Energy Affordability in Multi-Family Housing October 5, 2006
2-3
services described above, the Partnership sought to enable affordable multi-family properties to use the cost savings achieved through energy efficiency for other essential needs.
3. Build the foundation for sustainable energy savings by strengthening the affordable housing technical assistance infrastructure. Through its training and engineering services, the Partnership assisted affordable housing providers in building an infrastructure capable of supporting energy efficiency after the program ends.
2.2.3 Program Services
The program attempted to accomplish its objectives through a portfolio of technical, financial, and training services as well as through referrals to other energy-efficiency programs. The Partnership provided the following services during 2004-2005:
Rebates. The Partnership offered both prescriptive and customized rebates for energy-efficient upgrades.
– Prescriptive rebates were available for common energy-efficiency measures.
– Customized rebates were available for cost-effective measures that do not appear on the list of prescriptive measures.
Engineering services. The program provided engineering assistance in three broad formats:
– Facility energy surveys (“Audits”). Properties that received audits also received detailed facility assessment reports cataloging recommended energy efficiency upgrades, associated costs, available incentives, and measure payback periods.
– Detailed system assessments for complex building energy systems (“Detailed Surveys”). These surveys were designed to support requirements for customized rebates through the program and provided a list of recommendations similar to those in a facility assessment report but specific to a particular building system or systems.
– Technical Assistance (“TAs”), on-call diagnostics, and system commissioning services to address specific requests for information or to help diagnose and evaluate specific problems within the property. Through this service the program also provided commissioning assistance and design review for major retrofit projects.
Training. The 2004-2005 program offered two types of training services to the properties:
– Energy Action Academy Training. Energy Action Academy Training was provided to property owners and managers with information on a variety of topics, including energy systems and financing options for energy efficiency projects and solar systems.
– Operations and Maintenance Training. O&M training was offered to building maintenance staff to provide detailed information regarding building operations and maintenance practices, energy consumption problems, and energy efficiency opportunities.
Procurement assistance. Leveraging reduced prices available for bulk purchases, the Partnership worked with properties and management companies to find vendors of common energy efficiency measures and arranged for preferred pricing.
Partnership for Energy Affordability in Multi-Family Housing October 5, 2006
2-4
Zero-interest loans. The Partnership made bridge financing available to properties for upgrades with payback periods of three years or less.
Finance Guide. The Partnership developed a guidebook of programs that provide financial and other assistance to properties for energy-efficiency upgrades.
Energy tracking tools. The Partnership developed a computer program to assist properties in keeping track of energy expenditures and savings.
Referrals. The Partnership also provided referrals to complementary energy-efficiency programs including LightWash, the statewide Multi-family Energy Efficiency Rebate Program, and others.
2.2.4 Program Changes
The program services offered during the 2004-2005 program period included several new services not available in 2002-2003 and modified some existing program services. Changes focused on tailoring program offerings to the needs of the target market and making energy-efficiency upgrades available to a wider range of properties in the affordable multi-family sector. Among the most significant program changes was the 2004-2005 program’s addition of financial incentives rather than referrals to other energy efficiency programs for rebates. Table 2-2 lists the changes to the Partnership’s offerings and provides an overview of the rationale for these changes. While many changes were written into the program’s Implementation Plan for 2004-2005, others were made during the implementation phase as the program responded to the affordable multi-family housing market. The latter are noted in the table.
In addition to the change described in the table above, ICF removed three caps it had established for 2004-2005. The first was a $500 cap within lighting measure categories and the second was a $10,000 total cap for prescriptive measures. Both of these caps were eliminated to enable properties to undertake larger projects and receive incentives for larger proportions of their overall projects. The third cap was a limit on two participating properties per organization, which was also eliminated during the implementation period to broaden the program’s potential participant base.
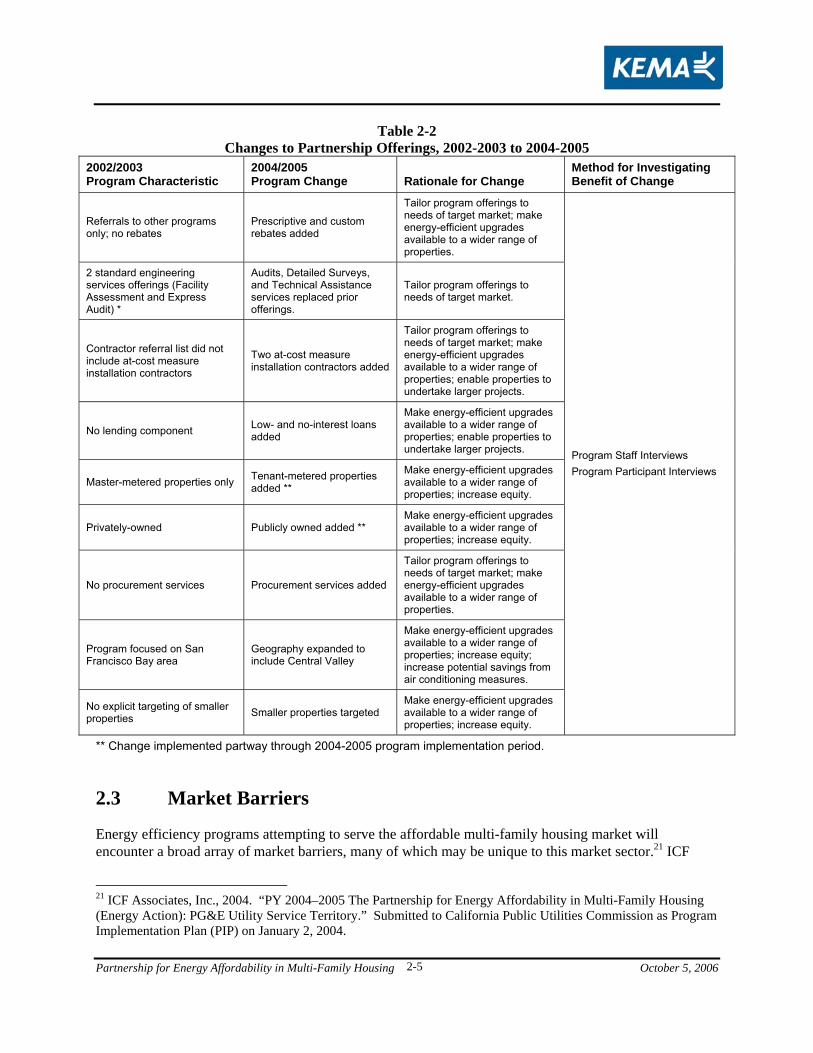
Partnership for Energy Affordability in Multi-Family Housing October 5, 2006
2-5
Table 2-2 Changes to Partnership Offerings, 2002-2003 to 2004-2005
2002/2003 Program Characteristic
2004/2005 Program Change Rationale for Change
Method for Investigating Benefit of Change
Referrals to other programs only; no rebates
Prescriptive and custom rebates added
Tailor program offerings to needs of target market; make energy-efficient upgrades available to a wider range of properties.
2 standard engineering services offerings (Facility Assessment and Express Audit) *
Audits, Detailed Surveys, and Technical Assistance services replaced prior offerings.
Tailor program offerings to needs of target market.
Contractor referral list did not include at-cost measure installation contractors
Two at-cost measure installation contractors added
Tailor program offerings to needs of target market; make energy-efficient upgrades available to a wider range of properties; enable properties to undertake larger projects.
No lending component Low- and no-interest loans added
Make energy-efficient upgrades available to a wider range of properties; enable properties to undertake larger projects.
Master-metered properties only Tenant-metered properties added **
Make energy-efficient upgrades available to a wider range of properties; increase equity.
Privately-owned Publicly owned added ** Make energy-efficient upgrades available to a wider range of properties; increase equity.
No procurement services Procurement services added
Tailor program offerings to needs of target market; make energy-efficient upgrades available to a wider range of properties.
Program focused on San Francisco Bay area
Geography expanded to include Central Valley
Make energy-efficient upgrades available to a wider range of properties; increase equity; increase potential savings from air conditioning measures.
No explicit targeting of smaller properties Smaller properties targeted
Make energy-efficient upgrades available to a wider range of properties; increase equity.
Program Staff Interviews Program Participant Interviews
** Change implemented partway through 2004-2005 program implementation period.
2.3 Market Barriers
Energy efficiency programs attempting to serve the affordable multi-family housing market will encounter a broad array of market barriers, many of which may be unique to this market sector.21 ICF
21 ICF Associates, Inc., 2004. “PY 2004–2005 The Partnership for Energy Affordability in Multi-Family Housing (Energy Action): PG&E Utility Service Territory.” Submitted to California Public Utilities Commission as Program Implementation Plan (PIP) on January 2, 2004.
Partnership for Energy Affordability in Multi-Family Housing October 5, 2006
2-6
identified many barriers in their 2004-2005 Program Implementation Plan, and KEMA identified additional barriers through our evaluation efforts. These barriers include the following:
Limited capital for facility improvements. Lack of funds may be the largest barrier facing affordable multi-family properties.
Inability to take on additional debt. Many properties are unable to obtain approval from Boards of Directors or lending institutions to accrue additional debt, even for necessary improvements. The same may be true even if loan interest rates and measure payback periods are attractive.
Lengthy budgetary cycles. Affordable housing budgets may be set by organizations well before expenses are incurred, often a year or more in advance. These lengthy budgetary cycles make it difficult for organizations to participate in energy-efficiency programs because they may need to wait until a subsequent cycle to budget for any potential upgrades. This is further complicated by the fact that programs may have relatively brief windows for participation.
Regulatory constraints. Affordable housing is a highly regulated market sector in which complex regulations govern rent levels and utility subsidies received by tenants. The subsidies are often based on average area utility costs, so neither landlords nor tenants have an economic incentive to invest in energy efficiency.
Split-incentive issue. In tenant-metered properties, property owners and managers have little economic incentive to invest in energy-saving improvements because the improvements will primarily benefit the tenants. Even if no-cost measures are available, some property owners or managers may still be unwilling (or unable) to undertake the administrative responsibilities associated with such upgrades.
Multiple levels of decision-making. Especially among the larger affordable housing providers, the multi-tiered management structure complicates the task of finding appropriate decision-makers within the organization. Management structures may differ from those commonly encountered in market-rate property management organizations, further complicating implementers’ efforts to reach appropriate contacts.
Multiple (competing) demands on housing staff and staff focus on other priorities. Affordable multi-family housing organizations and properties may be chronically understaffed, and existing staff members may thus be overburdened. It may be difficult for staff members to find time to learn about and participate in energy-efficiency programs in addition to other competing demands for their time.
Unknowledgeable O&M staff and lack of knowledge transfer. Many affordable properties’ operations and maintenance staff members lack the appropriate knowledge for their positions. Appropriately educated staff members may fail to transfer their knowledge to other staff when leaving an organization.
– High staff turnover within this market sector further complicates this issue.
Distrust of utility and third-party programs. The affordable housing market has a level of distrust in utility and third-party programs that may be exacerbated by the complex regulations governing this market sector.
Partnership for Energy Affordability in Multi-Family Housing October 5, 2006
2-7
Contractor reliability. Not unlike the issues with contractors experienced through other programs in other market sectors, affordable properties may have problems with contractor reliability. Contractors serving energy efficiency programs may be more susceptible to reliability issues as they may be operating at lower profit margins and handling larger volumes of work than other contractors.
Difficulty with verification. Especially in tenants’ units, the affordable multi-family housing market poses a unique challenge to verification of installed measures. Regulations restrict access to tenants’ units without their approval and require a time-consuming process for gaining access; this process is especially cumbersome in larger properties.
Sections 3 and 4 of this report discuss the success of the Partnership in overcoming this varied array of obstacles to effectively serve affordable multi-family properties.
2.4 Program Goals and Accomplishments
According to the 2004-2005 Program Implementation Plan,22 the Partnership had two distinct sets of goals: the first consisted of quantifiable energy and peak reduction goals, and the second of goals related to support for the affordable multi-family housing community in its broader efforts to improve energy efficiency and lower utility costs. The program’s savings goals were revised as part of a change order submitted to the Commission in June 2005 and approved in November 2005.
2.4.1 Energy and Peak Demand Reduction Goals
The Partnership set energy savings and unit goals for the installation of energy-efficiency measures. Through providing rebates to qualifying properties, the program intended to intended to achieve 2.1 MWh, 473 kW, and 237,562 therms in savings associated with the installed measures’ first year of operation.23 Table 2-3 shows the program’s net savings goals by measure category, along with each measure category’s expected contribution of energy savings. As shown, the program planned on meeting its energy savings goals through a combination of prescriptive and custom measures – including CFLs, T8s, HVAC equipment, boiler controls and other custom measures.
22 ICF Associates, Inc., 2004. Ibid. 23 Based on per unit assumptions provided in Tables 5 and 6 in the Program Implementation Plan, ICF Associates, Inc., 2004. Ibid.
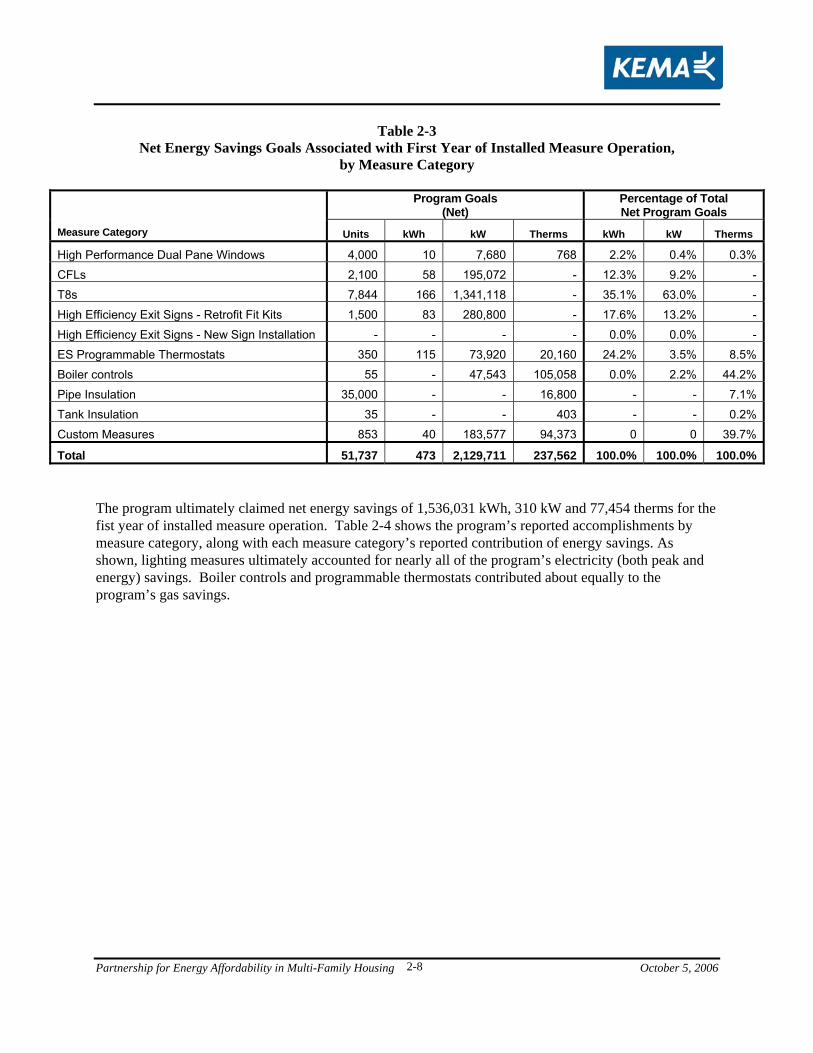
Partnership for Energy Affordability in Multi-Family Housing October 5, 2006
2-8
Table 2-3 Net Energy Savings Goals Associated with First Year of Installed Measure Operation,
by Measure Category
Program Goals (Net)
Percentage of Total Net Program Goals
Measure Category Units kWh kW Therms kWh kW Therms
High Performance Dual Pane Windows 4,000 10 7,680 768 2.2% 0.4% 0.3%
CFLs 2,100 58 195,072 - 12.3% 9.2% -
T8s 7,844 166 1,341,118 - 35.1% 63.0% -
High Efficiency Exit Signs - Retrofit Fit Kits 1,500 83 280,800 - 17.6% 13.2% -
High Efficiency Exit Signs - New Sign Installation - - - - 0.0% 0.0% -
ES Programmable Thermostats 350 115 73,920 20,160 24.2% 3.5% 8.5%
Boiler controls 55 - 47,543 105,058 0.0% 2.2% 44.2%
Pipe Insulation 35,000 - - 16,800 - - 7.1%
Tank Insulation 35 - - 403 - - 0.2%
Custom Measures 853 40 183,577 94,373 0 0 39.7%
Total 51,737 473 2,129,711 237,562 100.0% 100.0% 100.0% The program ultimately claimed net energy savings of 1,536,031 kWh, 310 kW and 77,454 therms for the fist year of installed measure operation. Table 2-4 shows the program’s reported accomplishments by measure category, along with each measure category’s reported contribution of energy savings. As shown, lighting measures ultimately accounted for nearly all of the program’s electricity (both peak and energy) savings. Boiler controls and programmable thermostats contributed about equally to the program’s gas savings.
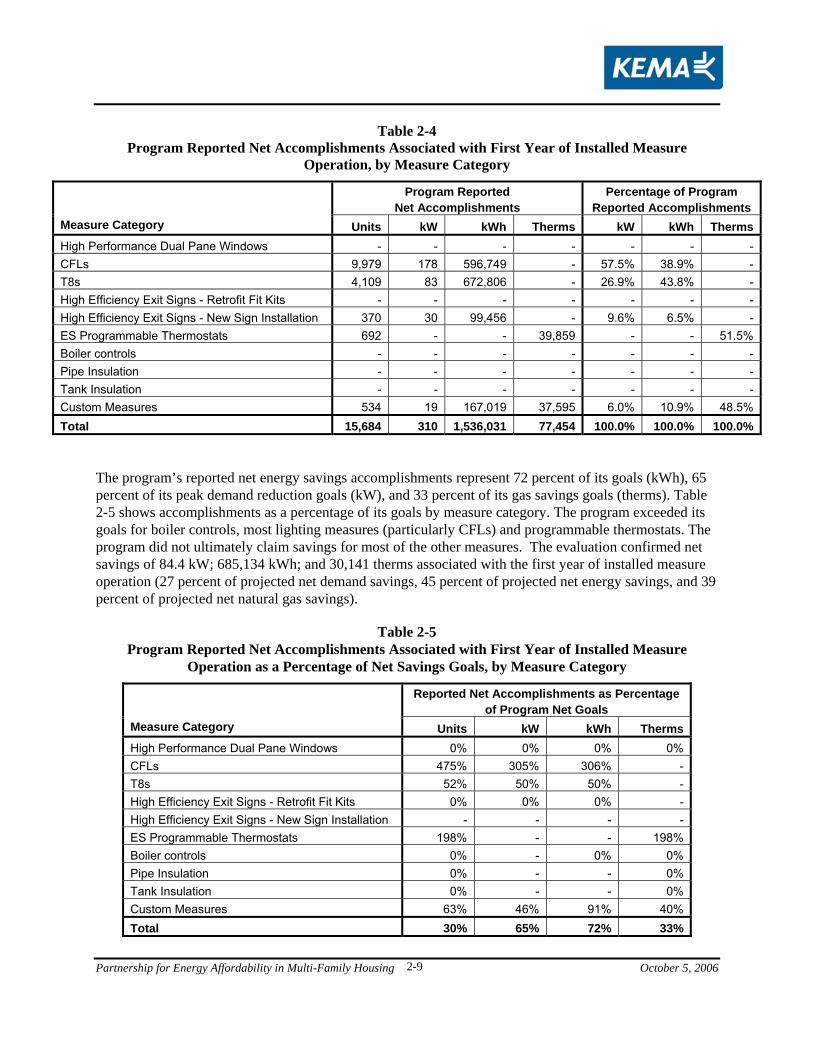
Partnership for Energy Affordability in Multi-Family Housing October 5, 2006
2-9
Table 2-4 Program Reported Net Accomplishments Associated with First Year of Installed Measure
Operation, by Measure Category
Program Reported Net Accomplishments
Percentage of Program Reported Accomplishments
Measure Category Units kW kWh Therms kW kWh ThermsHigh Performance Dual Pane Windows - - - - - - -CFLs 9,979 178 596,749 - 57.5% 38.9% -T8s 4,109 83 672,806 - 26.9% 43.8% -High Efficiency Exit Signs - Retrofit Fit Kits - - - - - - -High Efficiency Exit Signs - New Sign Installation 370 30 99,456 - 9.6% 6.5% -ES Programmable Thermostats 692 - - 39,859 - - 51.5%Boiler controls - - - - - - -Pipe Insulation - - - - - - -Tank Insulation - - - - - - -Custom Measures 534 19 167,019 37,595 6.0% 10.9% 48.5%Total 15,684 310 1,536,031 77,454 100.0% 100.0% 100.0%
The program’s reported net energy savings accomplishments represent 72 percent of its goals (kWh), 65 percent of its peak demand reduction goals (kW), and 33 percent of its gas savings goals (therms). Table 2-5 shows accomplishments as a percentage of its goals by measure category. The program exceeded its goals for boiler controls, most lighting measures (particularly CFLs) and programmable thermostats. The program did not ultimately claim savings for most of the other measures. The evaluation confirmed net savings of 84.4 kW; 685,134 kWh; and 30,141 therms associated with the first year of installed measure operation (27 percent of projected net demand savings, 45 percent of projected net energy savings, and 39 percent of projected net natural gas savings).
Table 2-5 Program Reported Net Accomplishments Associated with First Year of Installed Measure
Operation as a Percentage of Net Savings Goals, by Measure Category
Reported Net Accomplishments as Percentage of Program Net Goals
Measure Category Units kW kWh ThermsHigh Performance Dual Pane Windows 0% 0% 0% 0%CFLs 475% 305% 306% -T8s 52% 50% 50% -High Efficiency Exit Signs - Retrofit Fit Kits 0% 0% 0% -High Efficiency Exit Signs - New Sign Installation - - - -ES Programmable Thermostats 198% - - 198%Boiler controls 0% - 0% 0%Pipe Insulation 0% - - 0%Tank Insulation 0% - - 0%Custom Measures 63% 46% 91% 40%Total 30% 65% 72% 33%
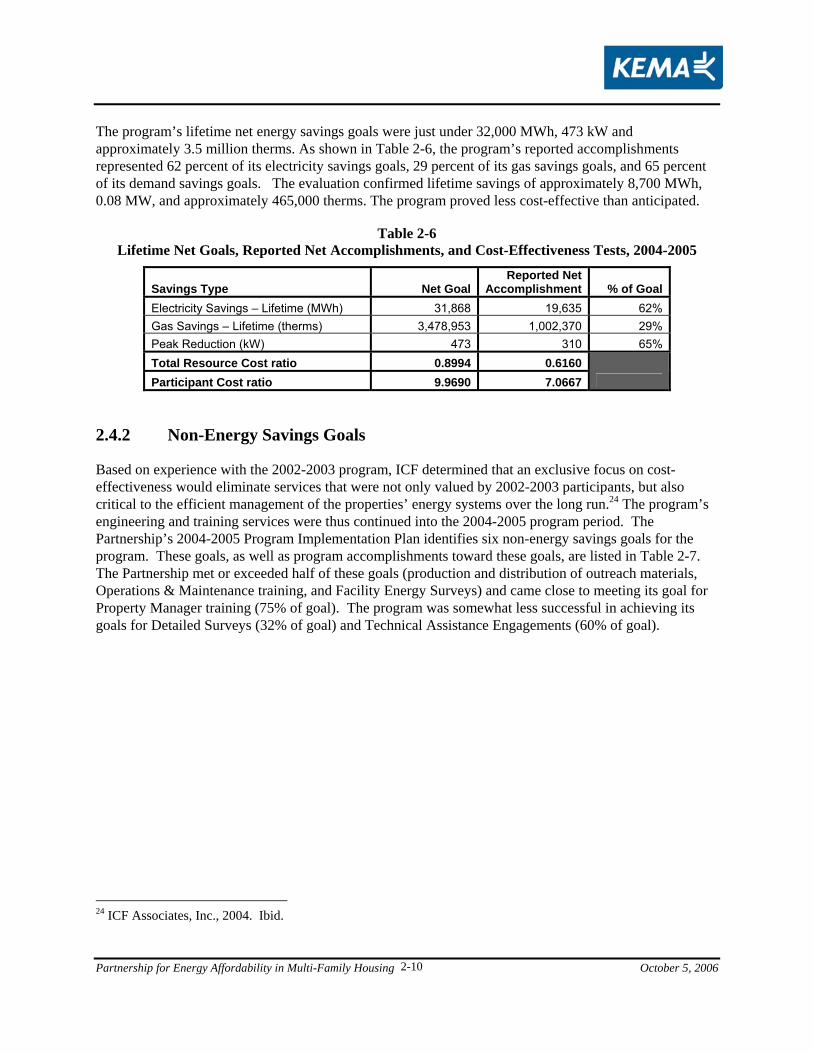
Partnership for Energy Affordability in Multi-Family Housing October 5, 2006
2-10
The program’s lifetime net energy savings goals were just under 32,000 MWh, 473 kW and approximately 3.5 million therms. As shown in Table 2-6, the program’s reported accomplishments represented 62 percent of its electricity savings goals, 29 percent of its gas savings goals, and 65 percent of its demand savings goals. The evaluation confirmed lifetime savings of approximately 8,700 MWh, 0.08 MW, and approximately 465,000 therms. The program proved less cost-effective than anticipated.
Table 2-6 Lifetime Net Goals, Reported Net Accomplishments, and Cost-Effectiveness Tests, 2004-2005
Savings Type Net GoalReported Net
Accomplishment % of GoalElectricity Savings – Lifetime (MWh) 31,868 19,635 62%Gas Savings – Lifetime (therms) 3,478,953 1,002,370 29%Peak Reduction (kW) 473 310 65%Total Resource Cost ratio 0.8994 0.6160 Participant Cost ratio 9.9690 7.0667
2.4.2 Non-Energy Savings Goals
Based on experience with the 2002-2003 program, ICF determined that an exclusive focus on cost-effectiveness would eliminate services that were not only valued by 2002-2003 participants, but also critical to the efficient management of the properties’ energy systems over the long run.24 The program’s engineering and training services were thus continued into the 2004-2005 program period. The Partnership’s 2004-2005 Program Implementation Plan identifies six non-energy savings goals for the program. These goals, as well as program accomplishments toward these goals, are listed in Table 2-7. The Partnership met or exceeded half of these goals (production and distribution of outreach materials, Operations & Maintenance training, and Facility Energy Surveys) and came close to meeting its goal for Property Manager training (75% of goal). The program was somewhat less successful in achieving its goals for Detailed Surveys (32% of goal) and Technical Assistance Engagements (60% of goal).
24 ICF Associates, Inc., 2004. Ibid.
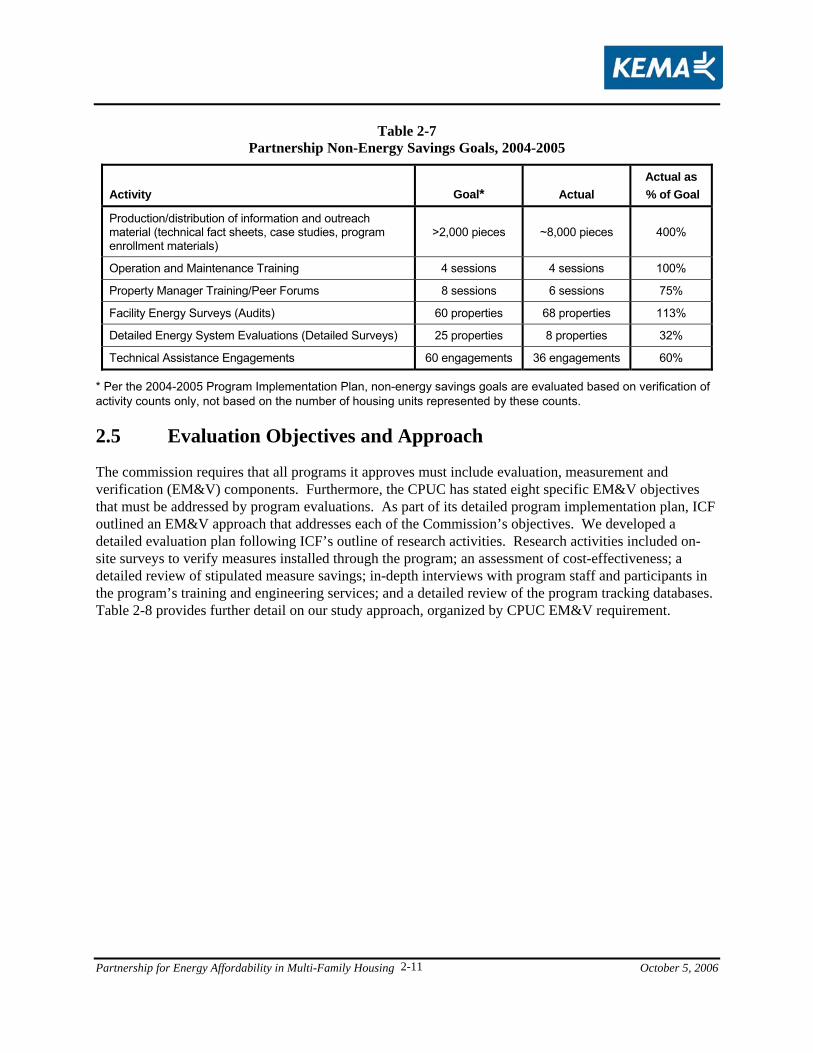
Partnership for Energy Affordability in Multi-Family Housing October 5, 2006
2-11
Table 2-7 Partnership Non-Energy Savings Goals, 2004-2005
Activity Goal* Actual Actual as % of Goal
Production/distribution of information and outreach material (technical fact sheets, case studies, program enrollment materials)
>2,000 pieces ~8,000 pieces 400%
Operation and Maintenance Training 4 sessions 4 sessions 100%
Property Manager Training/Peer Forums 8 sessions 6 sessions 75%
Facility Energy Surveys (Audits) 60 properties 68 properties 113%
Detailed Energy System Evaluations (Detailed Surveys) 25 properties 8 properties 32%
Technical Assistance Engagements 60 engagements 36 engagements 60%
* Per the 2004-2005 Program Implementation Plan, non-energy savings goals are evaluated based on verification of activity counts only, not based on the number of housing units represented by these counts.
2.5 Evaluation Objectives and Approach
The commission requires that all programs it approves must include evaluation, measurement and verification (EM&V) components. Furthermore, the CPUC has stated eight specific EM&V objectives that must be addressed by program evaluations. As part of its detailed program implementation plan, ICF outlined an EM&V approach that addresses each of the Commission’s objectives. We developed a detailed evaluation plan following ICF’s outline of research activities. Research activities included on-site surveys to verify measures installed through the program; an assessment of cost-effectiveness; a detailed review of stipulated measure savings; in-depth interviews with program staff and participants in the program’s training and engineering services; and a detailed review of the program tracking databases. Table 2-8 provides further detail on our study approach, organized by CPUC EM&V requirement.
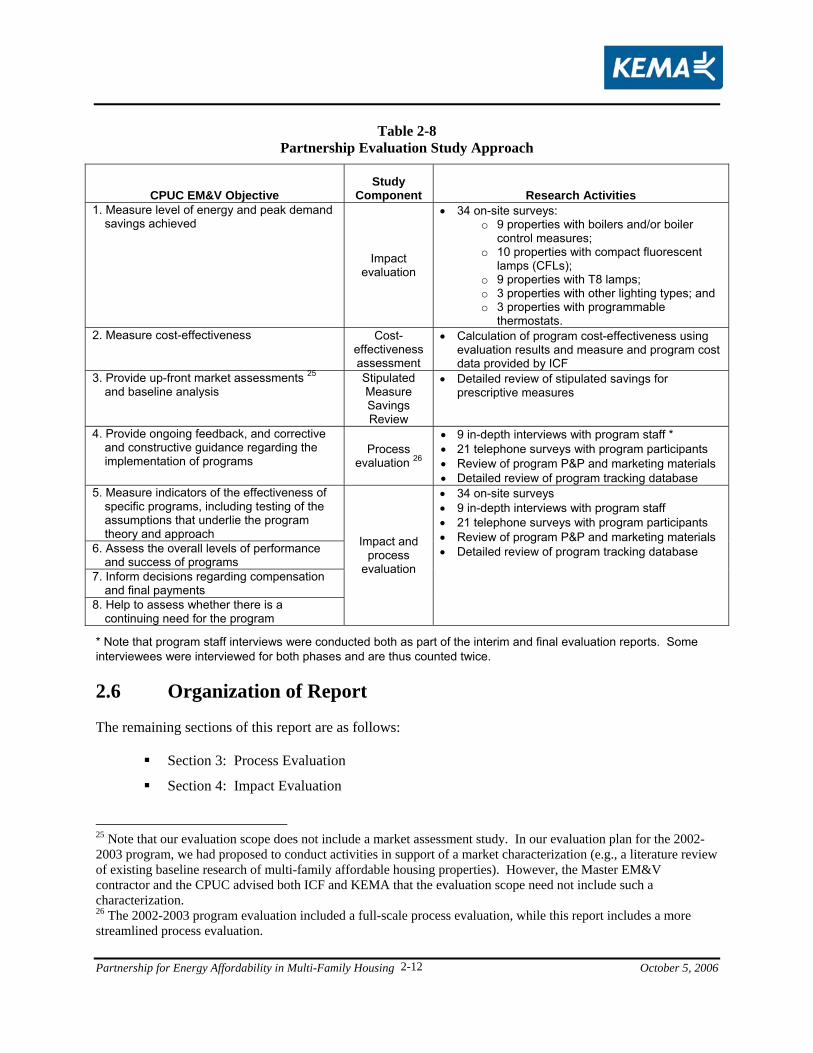
Partnership for Energy Affordability in Multi-Family Housing October 5, 2006
2-12
Table 2-8 Partnership Evaluation Study Approach
CPUC EM&V Objective Study
Component Research Activities 1. Measure level of energy and peak demand
savings achieved
Impact evaluation
• 34 on-site surveys: o 9 properties with boilers and/or boiler
control measures; o 10 properties with compact fluorescent
lamps (CFLs); o 9 properties with T8 lamps; o 3 properties with other lighting types; and o 3 properties with programmable
thermostats. 2. Measure cost-effectiveness Cost-
effectiveness assessment
• Calculation of program cost-effectiveness using evaluation results and measure and program cost data provided by ICF
3. Provide up-front market assessments 25 and baseline analysis
Stipulated Measure Savings Review
• Detailed review of stipulated savings for prescriptive measures
4. Provide ongoing feedback, and corrective and constructive guidance regarding the implementation of programs
Process evaluation 26
• 9 in-depth interviews with program staff * • 21 telephone surveys with program participants • Review of program P&P and marketing materials • Detailed review of program tracking database
5. Measure indicators of the effectiveness of specific programs, including testing of the assumptions that underlie the program theory and approach
6. Assess the overall levels of performance and success of programs
7. Inform decisions regarding compensation and final payments
8. Help to assess whether there is a continuing need for the program
Impact and process
evaluation
• 34 on-site surveys • 9 in-depth interviews with program staff • 21 telephone surveys with program participants • Review of program P&P and marketing materials • Detailed review of program tracking database
* Note that program staff interviews were conducted both as part of the interim and final evaluation reports. Some interviewees were interviewed for both phases and are thus counted twice.
2.6 Organization of Report
The remaining sections of this report are as follows:
Section 3: Process Evaluation
Section 4: Impact Evaluation
25 Note that our evaluation scope does not include a market assessment study. In our evaluation plan for the 2002-2003 program, we had proposed to conduct activities in support of a market characterization (e.g., a literature review of existing baseline research of multi-family affordable housing properties). However, the Master EM&V contractor and the CPUC advised both ICF and KEMA that the evaluation scope need not include such a characterization. 26 The 2002-2003 program evaluation included a full-scale process evaluation, while this report includes a more streamlined process evaluation.
Partnership for Energy Affordability in Multi-Family Housing October 5, 2006
2-13
Section 5: Conclusions
Appendix A: Interview Guides
Appendix B: Interim Evaluation Report
Appendix C: Impact Evaluation Methodology
Partnership for Energy Affordability in Multi-Family Housing October 5, 2006
3-1
3. Process Evaluation
3.1 Methodology
This section describes the methods used to conduct the process evaluation research activities. There were two primary research activities associated with this effort, each providing data to meet one or more of the CPUC EM&V requirements:
1. Qualitative interviews with a sample of program training participants and recipients of engineering services; and
2. Qualitative interviews with key Program/Partner staff.
The methods used to conduct each of these activities are described below. Interview guides can be found in Appendix A.
3.1.1 Non-Rebate Participant Qualitative Interviews
The process evaluation included a survey with a sample of participants in the program’s training and engineering services to determine whether and how the program led to reduced energy consumption among the target audience and to assess their satisfaction with the program.
3.1.1.1 Sample Development
Development of the participant sample required several steps. First, we obtained information on training and engineering services participants from ICF in the form of a Microsoft Excel tracking system including 5 separate worksheets, one for participants in each of the 5 program services (energy audit, detailed survey, technical assistance, Energy Action Academy [EAA] training, and/or Operations and Maintenance [O&M] training). Each spreadsheet included the following information on each individual recipient of one or more program services:
Participant name and phone number;
Property name and address;
Parent company name;
Whether the participant’s organization received a rebate or rebates through the program.
Next, we created a sample frame including all contacts in the database that had participated in at least one of the program’s non-rebate services. To do this, we combined the 5 tracking system spreadsheets into one file including one record per unique program participant (approximately 114 individuals after incomplete records were removed). Each record included indicators of the program services received.
There was a great deal of overlap among participants in each program service. Table 3-1 displays the participant sample frame, denoting the number of “participations” across all participants. For example, one individual who participated in two different program services represents two distinct participations. We stratified the total number of participations by program service to ensure a minimum number of completed surveys for each service.
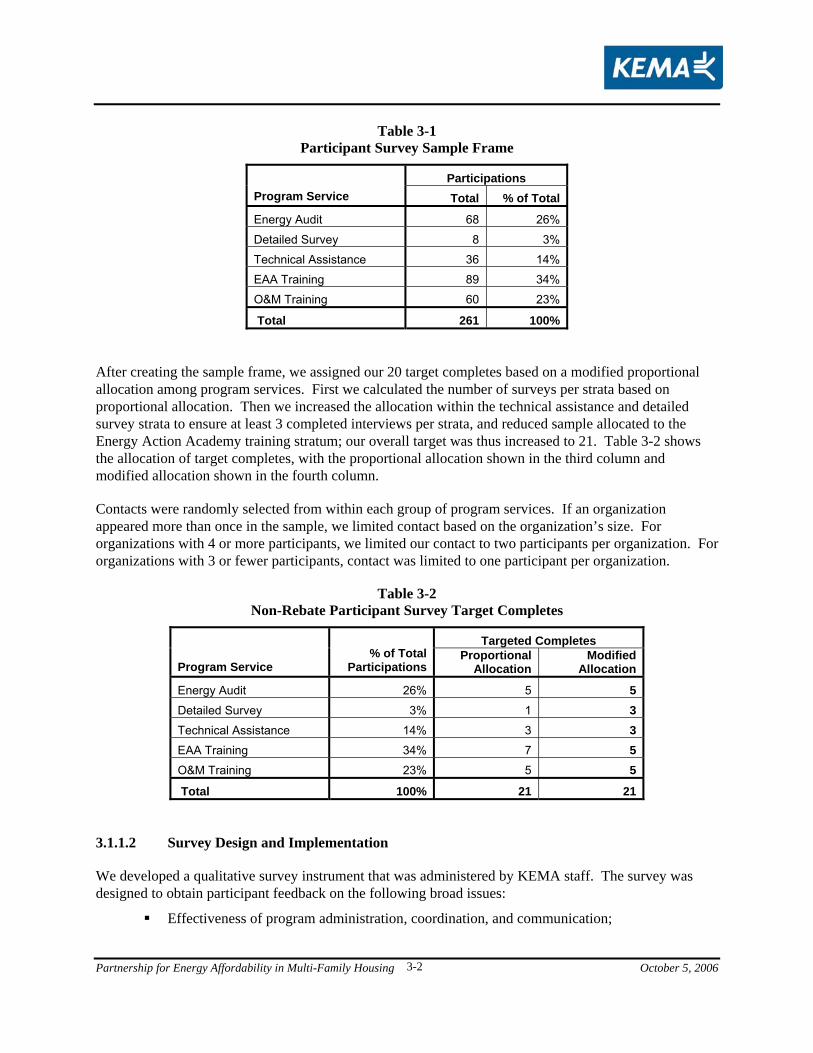
Partnership for Energy Affordability in Multi-Family Housing October 5, 2006
3-2
Table 3-1 Participant Survey Sample Frame
Participations Program Service Total % of Total
Energy Audit 68 26%
Detailed Survey 8 3%
Technical Assistance 36 14%
EAA Training 89 34%
O&M Training 60 23%
Total 261 100%
After creating the sample frame, we assigned our 20 target completes based on a modified proportional allocation among program services. First we calculated the number of surveys per strata based on proportional allocation. Then we increased the allocation within the technical assistance and detailed survey strata to ensure at least 3 completed interviews per strata, and reduced sample allocated to the Energy Action Academy training stratum; our overall target was thus increased to 21. Table 3-2 shows the allocation of target completes, with the proportional allocation shown in the third column and modified allocation shown in the fourth column.
Contacts were randomly selected from within each group of program services. If an organization appeared more than once in the sample, we limited contact based on the organization’s size. For organizations with 4 or more participants, we limited our contact to two participants per organization. For organizations with 3 or fewer participants, contact was limited to one participant per organization.
Table 3-2 Non-Rebate Participant Survey Target Completes
Targeted Completes
Program Service % of Total
ParticipationsProportional
Allocation Modified
Allocation
Energy Audit 26% 5 5 Detailed Survey 3% 1 3 Technical Assistance 14% 3 3 EAA Training 34% 7 5 O&M Training 23% 5 5
Total 100% 21 21 3.1.1.2 Survey Design and Implementation
We developed a qualitative survey instrument that was administered by KEMA staff. The survey was designed to obtain participant feedback on the following broad issues:
Effectiveness of program administration, coordination, and communication;
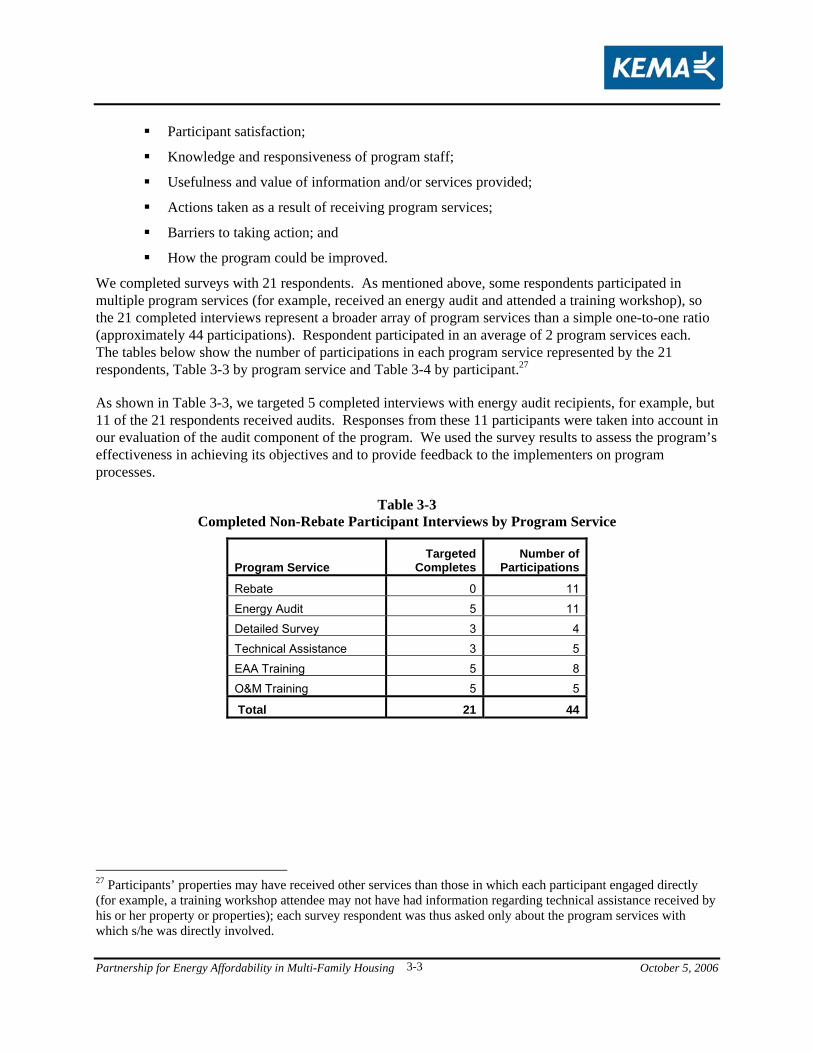
Partnership for Energy Affordability in Multi-Family Housing October 5, 2006
3-3
Participant satisfaction;
Knowledge and responsiveness of program staff;
Usefulness and value of information and/or services provided;
Actions taken as a result of receiving program services;
Barriers to taking action; and
How the program could be improved.
We completed surveys with 21 respondents. As mentioned above, some respondents participated in multiple program services (for example, received an energy audit and attended a training workshop), so the 21 completed interviews represent a broader array of program services than a simple one-to-one ratio (approximately 44 participations). Respondent participated in an average of 2 program services each. The tables below show the number of participations in each program service represented by the 21 respondents, Table 3-3 by program service and Table 3-4 by participant.27
As shown in Table 3-3, we targeted 5 completed interviews with energy audit recipients, for example, but 11 of the 21 respondents received audits. Responses from these 11 participants were taken into account in our evaluation of the audit component of the program. We used the survey results to assess the program’s effectiveness in achieving its objectives and to provide feedback to the implementers on program processes.
Table 3-3 Completed Non-Rebate Participant Interviews by Program Service
Program Service Targeted
CompletesNumber of
Participations
Rebate 0 11
Energy Audit 5 11
Detailed Survey 3 4
Technical Assistance 3 5
EAA Training 5 8
O&M Training 5 5
Total 21 44
27 Participants’ properties may have received other services than those in which each participant engaged directly (for example, a training workshop attendee may not have had information regarding technical assistance received by his or her property or properties); each survey respondent was thus asked only about the program services with which s/he was directly involved.
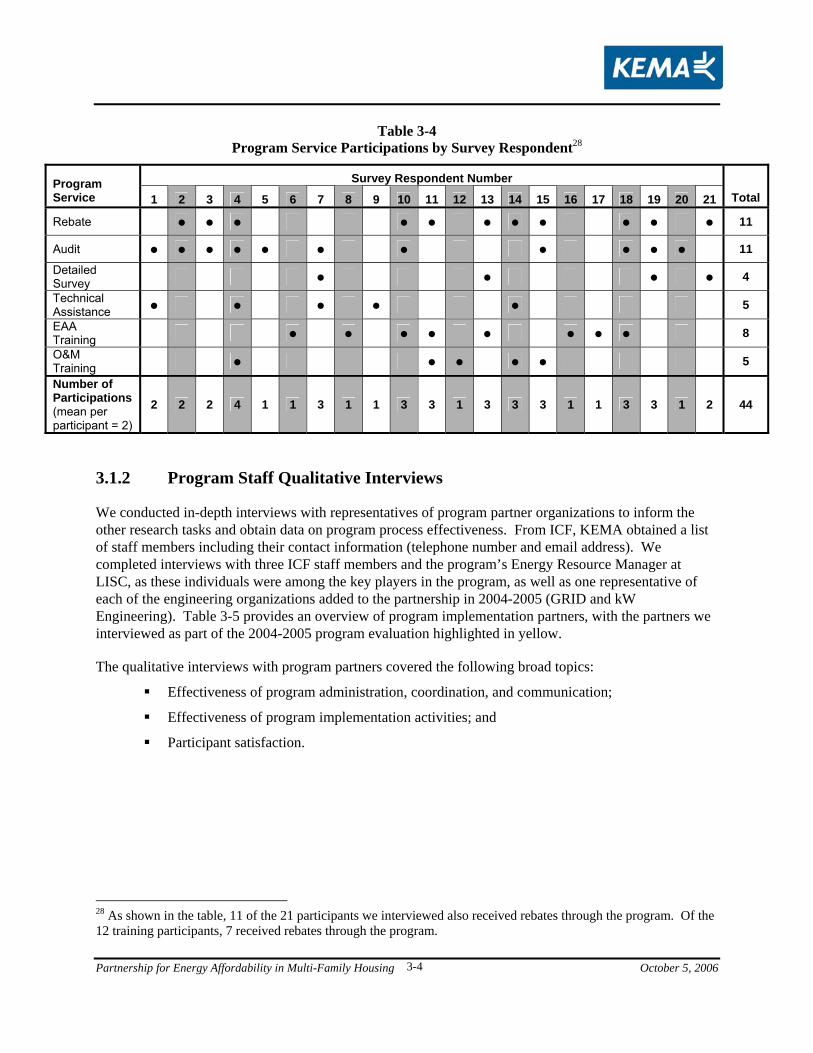
Partnership for Energy Affordability in Multi-Family Housing October 5, 2006
3-4
Table 3-4 Program Service Participations by Survey Respondent28
Survey Respondent Number Program Service 1 2 3 4 5 6 7 8 9 10 11 12 13 14 15 16 17 18 19 20 21 Total
Rebate ● ● ● ● ● ● ● ● ● ● ● 11
Audit ● ● ● ● ● ● ● ● ● ● ● 11
Detailed Survey ● ● ● ● 4
Technical Assistance ● ● ● ● ● 5
EAA Training ● ● ● ● ● ● ● ● 8
O&M Training ● ● ● ● ● 5
Number of Participations (mean per participant = 2)
2 2 2 4 1 1 3 1 1 3 3 1 3 3 3 1 1 3 3 1 2 44
3.1.2 Program Staff Qualitative Interviews
We conducted in-depth interviews with representatives of program partner organizations to inform the other research tasks and obtain data on program process effectiveness. From ICF, KEMA obtained a list of staff members including their contact information (telephone number and email address). We completed interviews with three ICF staff members and the program’s Energy Resource Manager at LISC, as these individuals were among the key players in the program, as well as one representative of each of the engineering organizations added to the partnership in 2004-2005 (GRID and kW Engineering). Table 3-5 provides an overview of program implementation partners, with the partners we interviewed as part of the 2004-2005 program evaluation highlighted in yellow.
The qualitative interviews with program partners covered the following broad topics:
Effectiveness of program administration, coordination, and communication;
Effectiveness of program implementation activities; and
Participant satisfaction.
28 As shown in the table, 11 of the 21 participants we interviewed also received rebates through the program. Of the 12 training participants, 7 received rebates through the program.
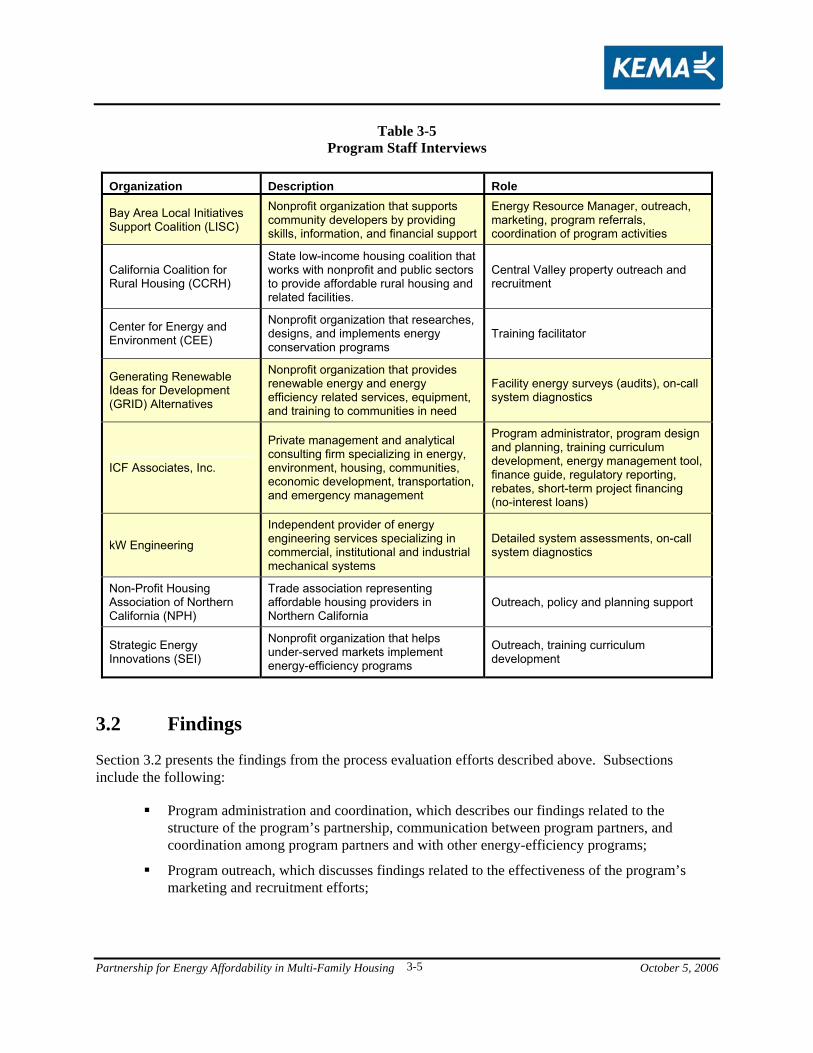
Partnership for Energy Affordability in Multi-Family Housing October 5, 2006
3-5
Table 3-5 Program Staff Interviews
Organization Description Role
Bay Area Local Initiatives Support Coalition (LISC)
Nonprofit organization that supports community developers by providing skills, information, and financial support
Energy Resource Manager, outreach, marketing, program referrals, coordination of program activities
California Coalition for Rural Housing (CCRH)
State low-income housing coalition that works with nonprofit and public sectors to provide affordable rural housing and related facilities.
Central Valley property outreach and recruitment
Center for Energy and Environment (CEE)
Nonprofit organization that researches, designs, and implements energy conservation programs
Training facilitator
Generating Renewable Ideas for Development (GRID) Alternatives
Nonprofit organization that provides renewable energy and energy efficiency related services, equipment, and training to communities in need
Facility energy surveys (audits), on-call system diagnostics
ICF Associates, Inc.
Private management and analytical consulting firm specializing in energy, environment, housing, communities, economic development, transportation, and emergency management
Program administrator, program design and planning, training curriculum development, energy management tool, finance guide, regulatory reporting, rebates, short-term project financing (no-interest loans)
kW Engineering
Independent provider of energy engineering services specializing in commercial, institutional and industrial mechanical systems
Detailed system assessments, on-call system diagnostics
Non-Profit Housing Association of Northern California (NPH)
Trade association representing affordable housing providers in Northern California
Outreach, policy and planning support
Strategic Energy Innovations (SEI)
Nonprofit organization that helps under-served markets implement energy-efficiency programs
Outreach, training curriculum development
3.2 Findings
Section 3.2 presents the findings from the process evaluation efforts described above. Subsections include the following:
Program administration and coordination, which describes our findings related to the structure of the program’s partnership, communication between program partners, and coordination among program partners and with other energy-efficiency programs;
Program outreach, which discusses findings related to the effectiveness of the program’s marketing and recruitment efforts;
Partnership for Energy Affordability in Multi-Family Housing October 5, 2006
3-6
Program design, which includes findings related to the specific services offered by the program and the overall effectiveness of these services in meeting the program’s goals; and
Participant satisfaction, which describes general satisfaction among participants in the Partnership.
3.2.1 Program Administration and Coordination
As described in Section 2, the 2004-2005 program was a continuation of a similar program offered in 2002-2003 (but the 2002-2003 program did not offer rebates). In general, administration of the 2004-2005 program was made more efficient and effective as a result of lessons learned in 2002 and 2003. New partners were added in 2004-2005, and some existing partners’ roles were adjusted to maximize their respective contributions.
Partner communication and coordination. After several years of working together, program partners’ roles gelled and communication and coordination became very efficient and effective on the whole. In particular, partners agreed that the assignment of engineering services was improved from the 2002-2003 to the 2004-2005 program. During the 2002-2003 program, partners reported some communication difficulties with the program’s engineering partner (the Center for Energy and the Environment [CEE]) because of their location (Minnesota).29 CEE’s role was altered in 2004 so that they would no longer perform engineering services for the program, and these responsibilities shifted to two local firms (GRID Alternatives and kW Engineering) in an attempt to improve communication regarding the program’s engineering services. Partners agreed that basing the engineering firms in the local area helped improve communication and coordination of engineering services.
However, there were some lingering coordination issues based on the fact that two firms were dividing up the work. Some partners mentioned that coordination difficulties occasionally arose when each firm provided a different service to the same property. Because of the program’s limited geographic scope and manageable property volume, using only one local engineering firm would likely benefit the program from an administrative perspective.
Coordination with other programs. The Partnership continued to coordinate successfully with other California multi-family programs during 2004-2005. Approximately one third of the program participants we interviewed indicated that Partnership staff referred them to other energy-efficiency and renewable energy programs, including LightWash, the statewide Multi-family Energy Efficiency Rebate Program, and others.
The program encountered some overlap with other energy-efficiency programs, however; staff report that in some cases, the Partnership performed engineering services and followed up later to find that the properties had obtained incentives through other programs. More than four out of five of the participants we interviewed were aware of other energy-efficiency programs before participating in the Partnership, and nearly half of the survey respondents reported that they received rebates for lighting, refrigeration, appliances, or laundry equipment through other programs prior to participating in the Partnership.
29 KEMA, Inc., 2004. “Evaluation of the Partnership for Energy Affordability in Multifamily Housing: Final Report.” Prepared for ICF Consulting. June 23, 2004.
Partnership for Energy Affordability in Multi-Family Housing October 5, 2006
3-7
While the information above may imply that the affordable multi-family property market is well saturated with energy efficiency services, the experiences of the properties that participated in the Partnership may not be representative of affordable multi-family properties in general. Partnership participants may represent a subset of the affordable multi-family housing market for which the administrative and financial commitments required by the program may be a less significant obstacle than for non-participating properties. At least one program partner supported these conclusions.
3.2.2 Program Outreach
The Partnership incorporated a personalized approach to marketing and recruitment. Central to this approach was the program’s Energy Resource Manager (ERM) at the Bay Area Local Initiatives Support Corporation (LISC), who was responsible for managing customer relationships; assisting with scheduling technical services; helping to arrange incentives and financing; and facilitating acquisition and installation of qualified energy efficiency measures.30 Consistent with 2002-2003 evaluation findings, program partners indicated that the ERM was beneficial in reaching the target market. More than one-third of the participants reported that they learned about the program through LISC (more than any other single source cited by respondents).31 This is unsurprising, as the ERM’s role was to establish contact with affordable housing organizations.
The ERM and other program representatives maintained contact with the properties to usher them through the program. While these efforts proved fairly successful in engaging properties in the program’s engineering and training services, they required a great deal of program resources. Some program partners report that this level of “hand-holding”32 was imperative to get most properties to engage with the program, but other program partners indicate that the ERM’s facilitation services had limited success in generating rebates through the program. The ERM’s strengths were in outreach, establishing communications with the properties, and engaging properties in engineering services — not necessarily in “closing the deal” on rebates. If the Partnership targeted resource acquisition exclusively, rather than incorporating education and training, the ERM’s role may be less necessary. Regardless, this experience demonstrates that the administrative expenses required to engage properties in the rebate process may be higher in the affordable multi-family sector than in others.
Program partners report that in many cases, it was the program’s contractors who were able to get properties to commit to rebates and upgrades. As mentioned above, the Multi-family Energy Efficiency Rebate program has relied on contractors to recruit participants in the past and has had a great deal of success with this approach. Perhaps to target the affordable multi-family housing market most efficiently and effectively, programs could rely upon a representative of a trusted non-profit organization (such as the ERM) to conduct initial program outreach and to introduce the contractors, but rely more heavily on contractors to market the program and engage properties in the rebate process.
30 ICF Associates, Inc., 2004. “PY 2004–2005 The Partnership for Energy Affordability in Multi-Family Housing (Energy Action): PG&E Utility Service Territory.” Submitted to California Public Utilities Commission as Program Implementation Plan (PIP) on January 2, 2004. 31 Six of the seventeen respondents who answered the question, “How did you learn about the program and the services offered?” indicated that that they learned about the program through LISC. Four respondents indicated that they heard about the program from their property management firms, 3 through general contact from the program, and the remaining four through distinct sources (e.g., a colleague). 32 Throughout the report, verbatim responses from interview subjects are shown in quotes. These quotations are not cited to individual sources to respondent confidentiality.
Partnership for Energy Affordability in Multi-Family Housing October 5, 2006
3-8
3.2.3 Program Design
As mentioned previously, the major change in the program from 2002-2003 to 2004-2005 was the addition of rebates. Likewise, the program fine-tuned its training and engineering offerings based on the 2002-2003 experience. This section presents findings on the effectiveness of the program design with regard to serving the target sector and achieving program goals. Specifically, we focus on the effectiveness of changes made to program services; the balance between equity and cost-effectiveness within the target sector; balancing the need for regulatory oversight while maintaining efficient implementation; and the value of the program’s services.
3.2.3.1 Changes to program services
Program services were broadened for the 2004-2005 program period, increasing opportunities for energy efficiency savings among affordable multi-family properties. Changes focused on tailoring program offerings to the needs of the target market and making energy-efficiency upgrades available to a wider range of properties in the affordable multi-family sector. Among the most significant program changes was the 2004-2005 program’s addition of financial incentives rather than referrals to other energy efficiency programs for rebates; program partners report that the program’s rebate component was a major asset to the program.
Partners viewed the program’s addition of tenant-metered properties to its 2004-2005 scope as less successful. Program partners have the impression that owners of tenant-metered properties may be less motivated to pursue improvements than owners of master-metered properties; property owners receive no financial benefits as a result of upgrading equipment in tenants’ spaces when tenants pay their own utility bills (also known as the split-incentive issue). In addition, as described below, tenant-metered properties also presented an administrative hurdle for the program because of PG&E’s required checks against double-dipping.
Table 3-6 lists the changes to the Partnership’s offerings and provides an overview of the rationale for these changes. While many changes were written into the program’s Implementation Plan for 2004-2005, others (as noted in the table) were made during the implementation phase as the program responded to the market on an ongoing basis.
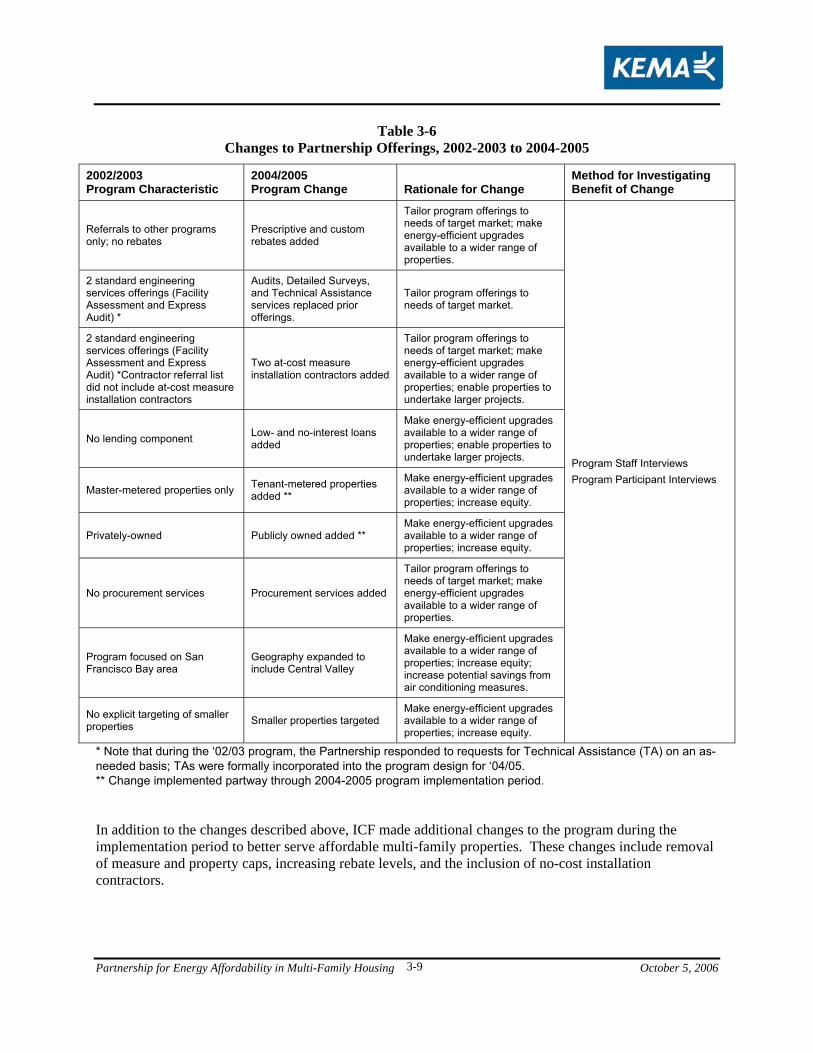
Partnership for Energy Affordability in Multi-Family Housing October 5, 2006
3-9
Table 3-6 Changes to Partnership Offerings, 2002-2003 to 2004-2005
2002/2003 Program Characteristic
2004/2005 Program Change Rationale for Change
Method for Investigating Benefit of Change
Referrals to other programs only; no rebates
Prescriptive and custom rebates added
Tailor program offerings to needs of target market; make energy-efficient upgrades available to a wider range of properties.
2 standard engineering services offerings (Facility Assessment and Express Audit) *
Audits, Detailed Surveys, and Technical Assistance services replaced prior offerings.
Tailor program offerings to needs of target market.
2 standard engineering services offerings (Facility Assessment and Express Audit) *Contractor referral list did not include at-cost measure installation contractors
Two at-cost measure installation contractors added
Tailor program offerings to needs of target market; make energy-efficient upgrades available to a wider range of properties; enable properties to undertake larger projects.
No lending component Low- and no-interest loans added
Make energy-efficient upgrades available to a wider range of properties; enable properties to undertake larger projects.
Master-metered properties only Tenant-metered properties added **
Make energy-efficient upgrades available to a wider range of properties; increase equity.
Privately-owned Publicly owned added ** Make energy-efficient upgrades available to a wider range of properties; increase equity.
No procurement services Procurement services added
Tailor program offerings to needs of target market; make energy-efficient upgrades available to a wider range of properties.
Program focused on San Francisco Bay area
Geography expanded to include Central Valley
Make energy-efficient upgrades available to a wider range of properties; increase equity; increase potential savings from air conditioning measures.
No explicit targeting of smaller properties Smaller properties targeted
Make energy-efficient upgrades available to a wider range of properties; increase equity.
Program Staff Interviews Program Participant Interviews
* Note that during the ‘02/03 program, the Partnership responded to requests for Technical Assistance (TA) on an as-needed basis; TAs were formally incorporated into the program design for ‘04/05. ** Change implemented partway through 2004-2005 program implementation period. In addition to the changes described above, ICF made additional changes to the program during the implementation period to better serve affordable multi-family properties. These changes include removal of measure and property caps, increasing rebate levels, and the inclusion of no-cost installation contractors.
Partnership for Energy Affordability in Multi-Family Housing October 5, 2006
3-10
1. Removal of measure and property caps. ICF initially placed restrictions on rebate eligibility during 2004-2005, including a $500 cap within lighting measure categories; a $10,000 total cap for prescriptive measures; and a maximum of 2 participating properties per organization. The intent of these restrictions was to maximize the number of properties that received rebates through the program, which underscores the initial program focus on achieving equity within the target sector. These caps were ultimately eliminated to allow for larger projects and to expand the potential participant base.
Eliminating the cap on 2 properties per organization may have increased the program’s cost-effectiveness because it had the potential to result in multiple participating properties as the result of concentrated marketing efforts targeted at the property management level. However, allowing participation from multiple properties within larger organizations results in larger organizations receiving a higher proportion of benefits from the program than smaller organizations.
2. Increasing rebate levels. The initial rebates offered by the Partnership were set at levels below those offered by the statewide Multi-family Energy Efficiency Rebate program. Program partners had the impression that some potential participants were “lost” to the statewide program for this reason. ICF thus increased rebate amounts from their initial levels to be consistent with those offered by the statewide program. ICF also increased the rebates for custom measures from the amount necessary to bring a project to a three year payback period up to the amount necessary to bring the project to a six month payback period. This change increased the favorability of undertaking custom projects by making more rebate funds available per project.
3. Inclusion of no-cost installation contractors. Program partners mentioned another midstream program change that potentially made energy efficiency upgrades available to a broader range of properties, specifically the program’s addition of two contractors offering no-cost measure installations. Adding these contractors enabled some properties to undertake improvement projects that would not have been possible otherwise, and for others, long before they would have if they had to pay for the improvements themselves. Program partners indicate that these contractors played a key role in getting properties to undertake energy-efficient upgrades. Indeed, partners indicate that the program’s contractors were, in many cases, responsible for properties’ ultimately proceeding with rebated projects through the program after the ERM or other program staff had made the property aware of the program. The 2004-2005 statewide Multi-family Energy Efficiency Rebate program largely relied on a contractor-driven approach with a high level of success, and energy efficiency programs targeting the affordable sector of the multi-family housing market may benefit from a similar approach.
However, the Partnership experienced some problems with contractor reliability and installation quality. In a handful of instances, contractors began to install lighting measures and failed to return to finish the jobs. The statewide program also experienced some problems with installation quality during the 2004-2005 period.33 For the statewide program’s rebates to provide
33 KEMA, Inc., 2004. “Interim Report for the 2004-2005 Statewide Multi-Family Rebate Program Evaluation.” Prepared for the California Public Utilities Commission; San Diego Gas & Electric Company; Pacific Gas and Electric Company; Southern California Edison; and Southern California Gas Company. September 15, 2005.
Partnership for Energy Affordability in Multi-Family Housing October 5, 2006
3-11
total-cost subsidies for equipment and installation, installation costs must be inexpensive and/or include low-cost measures. The need to minimize costs resulted in lower quality equipment and installations in a number of cases. Similar pressures may have existed for the Partnership’s no-cost installation contractors. In addition, typical direct-install measures may not require highly skilled installers. For this reason, contracting firms that focus on these measures may place a higher emphasis on cost than quality. These measures also have generally low profit margins, so contracting firms may be compelled to hire cheaper, less qualified staff to do the work, resulting in improper installations.
If the Partnership were to rely on a contractor-driven approach similar to that taken by the statewide Multi-family Energy Efficiency Rebate program, a concerted effort would be necessary to mitigate these problems. The statewide program’s 2006-2008 design offers some possible strategies for doing so, including frequent inspections of rebated projects, post-installation customer satisfaction surveys, manuals for property managers/owners that help guide them in selecting contractors, a requirement that contractors provide contact and warranty information for addressing post-installation problems, fast response to customer complaints, a requirement that contractors remedy any negative situations, and the authority to exclude noncompliant contractors from the program. However, it is important to note that while these actions may reduce the prevalence of quality issues, these problems can still arise. The Partnership’s ERM and other administrative or outreach staff could assist in policing contractors on behalf of multi-family property owners and managers. Because this monitoring may prove quite costly, contractors should be pre-screened and held to terms and conditions that ensure quality installations.34, 35
Many program partners perceived these midstream changes as crucial to the program’s recruitment success, however, more than one partner expressed that the multiple program changes may have confused property representatives and possibly caused some distrust in the program. Nonetheless, partners felt the changes were justified because the underlying motivation was to better serve the properties. New programs may take some time to establish themselves and adapt to better fit the markets they serve; this task may be especially difficult for short-term programs like the Partnership.
3.2.3.2 Balancing equity and cost-effectiveness
During the 2002-2003 implementation period, the Partnership was focused on providing information, engineering services, and referrals to affordable multi-family properties and had no direct energy savings goals. For the 2004-2005 program period, ICF added financial incentives to the program and it underwent a major shift in focus from education and services to demonstrable energy savings. Because of the necessary emphasis on achieving energy savings, the program may have had to place less of an emphasis on achieving equity in delivering its services to facilities of all sizes across its entire service area. The program fell short of its goals to aggressively recruit smaller properties in the Bay area and properties of all sizes in the Central Valley, and arguably, to some extent, as a result of the pressure to achieve savings.
The goal of reaching smaller properties presented many challenges, including the following: 34 Recall that the Partnership did not include financial incentives during the 2002-2003 program period. 35 It is worthy of note that 20 additional rebate projects at 14 properties were planned for completion prior to the program’s end; unfortunately, these projects were not completed before the program’s rebate deadline because one of the program’s contractors had a major staffing problem and was unable to complete the work.
Partnership for Energy Affordability in Multi-Family Housing October 5, 2006
3-12
Fewer individuals in the organization, so fewer chances of reaching someone who will “champion” the program’s efforts within the property; and
Program contractors are likely to be less interested in smaller properties because the jobs are likely to be small as well.
Program partners note that because these facilities were small, energy-saving potential was also small — so even if a large number of these facilities had participated, they would still likely account for a small percentage of the program’s total energy savings. According to one partner, “I felt like we were spending more on our field time and calculations [for the smaller properties] where that ended up costing more than the measures would have saved.” However, while it may not be cost-effective to provide services to these smaller facilities, and while potential savings for these may not be substantial, including these properties might be important if equity within the multi-family affordable housing sector is a priority for the program or for the state.
Properties located in the Central Valley proved largely unsuitable for participation in the Partnership for reasons including the following:
Many properties are customers of municipal utilities (e.g., Sacramento Municipal Utility District [SMUD]) and thus not qualified;
Some properties had already undertaken energy-efficient upgrades with assistance from other programs (e.g., a local CFL program in the Fresno area).
Properties had less air conditioning than assumed (meaning that fewer energy efficiency opportunities existed in these properties than assumed); and
Many were smaller properties with limited energy-efficiency potential (as discussed above).
For these reasons, the focus on the Central Valley was, in the words of one program partner, “essentially abandoned” by the program after two major marketing efforts. Another program partner suggested that a coordinated approach to outreach (involving several outreach partners) as in the Bay area model may have increased effectiveness of Central Valley implementation efforts. Regardless, the fact remains that serving properties in areas where IOU territories overlap with municipal utility service areas (such as the Central Valley) may be important for the state’s energy-efficiency programs. However, if considered only from the perspective of cost-effectiveness, the program’s decision to discontinue recruitment among these properties is justified in light of the difficulties described above.
These examples are indicative of the challenge of maintaining cost-effectiveness while taking equity into account. This issue is particularly salient for the multi-family affordable housing sector, which as a whole could be considered hard-to-reach. That is, reaching any of these properties is time-consuming and is associated with substantial market barriers. Thus, a program that attempts to focus on equity within this sector will probably struggle to achieve cost-effective energy savings. Conversely, a program that focuses only on cost-effectiveness within this sector might only capture the “low-hanging fruit” and address only a handful of large organizations. At the beginning of the 2004-2005 program cycle, the Partnership set out with both ambitious energy savings goals and an explicit focus on maintaining equity within the sector. It is probably in the state’s best interest that the program reduced its focus on equity to try to meet its energy savings goals — given that all properties targeted by the program are truly hard-to-reach. Based on the Partnership’s experience, future programs serving this target market should be explicit about the tradeoff between cost-effectiveness and equity and obtain clear direction from program sponsors as to the desired balance.
Partnership for Energy Affordability in Multi-Family Housing October 5, 2006
3-13
3.2.3.3 Regulatory oversight
The Partnership experienced delays in implementation as a result of the way in which regulatory requirements were administered. These delays were related to project change orders, requirements to check for “double-dipping” by participants (participation in multiple programs with incentives for the same measures), and verification of installed equipment. Program staff and partners felt these issues hampered effective implementation of the program and increased its administrative costs.
Preventing double-dipping. Staff viewed the program’s change to allow participation of tenant-metered properties as a positive enhancement. However, all agreed that the approval process for these properties was slow and cumbersome. Meeting PG&E’s requirements to check for double-dipping obliged program staff to obtain account numbers for the tenants’ units (or tenants’ phone numbers), which is a time-consuming process that increases the program’s administrative costs. The double-dipping checks are necessary, however, to prevent situations in which ratepayer funds are used to subsidize the same upgrades more than once.
Double-dipping checks are also required for other PG&E programs that target the affordable housing market, for example, the Low-Income Energy Efficiency (LIEE) program. However, because LIEE has been running for several years, procedures to check against double-dipping have become institutionalized and thus less cumbersome for the program. Because its operation center is housed within PG&E, the process for LIEE is also more streamlined than for external third-party program implementers.
Verification. Verification of installed measures in affordable multi-family properties presents a unique challenge in tenant units. Complex regulations govern access to tenants’ units, with several days’ notice required. Tenants also retain the right to refuse entry into their units even when notice is given. Verification also required program staff to obtain account numbers or telephone numbers for tenants’ units. For these reasons, it proved difficult to verify measure installation.36 Utility programs that target multi-family tenant units (and also specifically low-income tenant units) must also struggle with this issue. It may be that programs like LIEE have been around for so long that they have institutionalized these requirements — whereas a new program like the Partnership that was struggling to get properties to respond was substantially impacted. It may also be that tenants in affordable housing units in particular are more accustomed to hearing about and enforcing regulations such as notice before entry, as compared to tenants of market-based properties that may not be accustomed to such regulations.
Change orders. A third-party program like the Partnership typically has a 2-year implementation period. During this timeframe, program staff learn more about their target market and understandably want to change their program to better serve the market. However, for any desired changes, program administrators are required to submit change orders to the utilities and the Commission. This step allows for accountability in the program design process (similar to the program implementation plan approval process). Changes cannot be implemented until the change orders are approved.
ICF requested two change orders during the 2004-2005 implementation period. The first enabled the Partnership to expand its services to tenant-metered properties and the second increased the rebate amounts to the amounts offered by the statewide Multi-family Energy Efficiency Rebate program,
36 Despite these difficulties, ICF ultimately conducted verification visits for nearly half of the rebated projects (particularly for properties that installed CFLs) because of PG&E verification requirements.
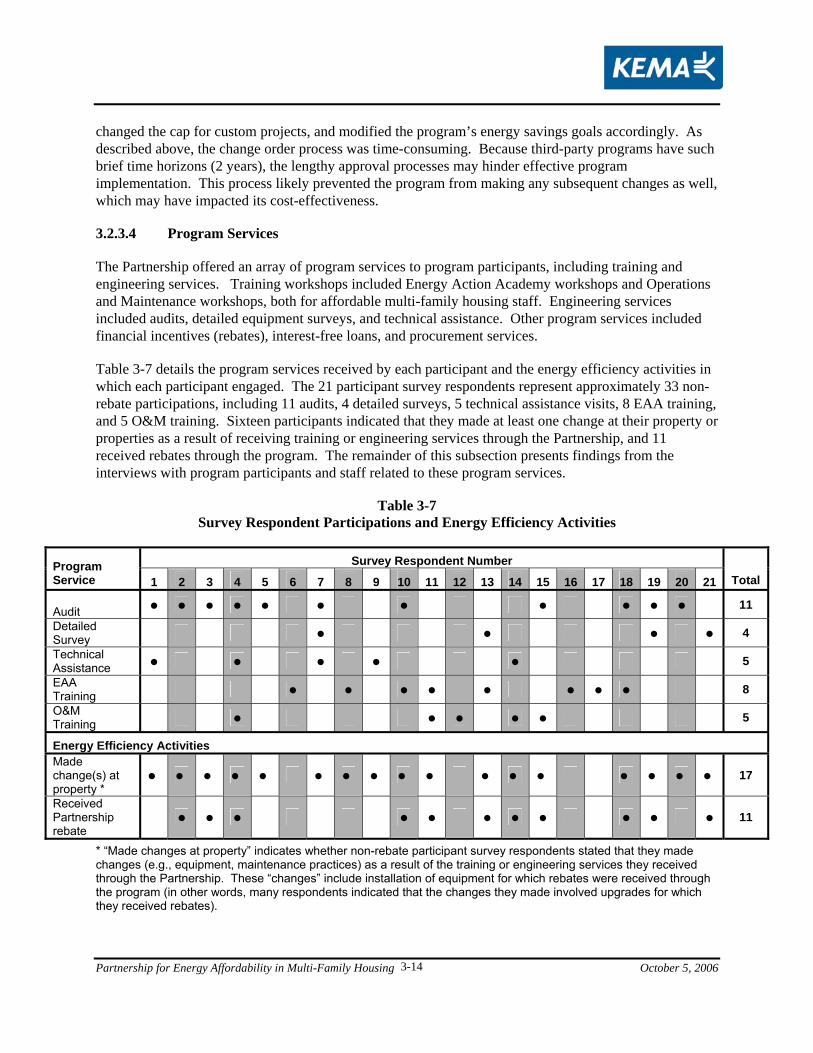
Partnership for Energy Affordability in Multi-Family Housing October 5, 2006
3-14
changed the cap for custom projects, and modified the program’s energy savings goals accordingly. As described above, the change order process was time-consuming. Because third-party programs have such brief time horizons (2 years), the lengthy approval processes may hinder effective program implementation. This process likely prevented the program from making any subsequent changes as well, which may have impacted its cost-effectiveness.
3.2.3.4 Program Services
The Partnership offered an array of program services to program participants, including training and engineering services. Training workshops included Energy Action Academy workshops and Operations and Maintenance workshops, both for affordable multi-family housing staff. Engineering services included audits, detailed equipment surveys, and technical assistance. Other program services included financial incentives (rebates), interest-free loans, and procurement services.
Table 3-7 details the program services received by each participant and the energy efficiency activities in which each participant engaged. The 21 participant survey respondents represent approximately 33 non-rebate participations, including 11 audits, 4 detailed surveys, 5 technical assistance visits, 8 EAA training, and 5 O&M training. Sixteen participants indicated that they made at least one change at their property or properties as a result of receiving training or engineering services through the Partnership, and 11 received rebates through the program. The remainder of this subsection presents findings from the interviews with program participants and staff related to these program services.
Table 3-7 Survey Respondent Participations and Energy Efficiency Activities
Survey Respondent Number Program Service 1 2 3 4 5 6 7 8 9 10 11 12 13 14 15 16 17 18 19 20 21 Total Audit ● ● ● ● ● ● ● ● ● ● ● 11
Detailed Survey ● ● ● ● 4
Technical Assistance ● ● ● ● ● 5
EAA Training ● ● ● ● ● ● ● ● 8
O&M Training ● ● ● ● ● 5
Energy Efficiency Activities Made change(s) at property *
● ● ● ● ● ● ● ● ● ● ● ● ● ● ● ● ● 17
Received Partnership rebate
● ● ● ● ● ● ● ● ● ● ● 11
* “Made changes at property” indicates whether non-rebate participant survey respondents stated that they made changes (e.g., equipment, maintenance practices) as a result of the training or engineering services they received through the Partnership. These “changes” include installation of equipment for which rebates were received through the program (in other words, many respondents indicated that the changes they made involved upgrades for which they received rebates).
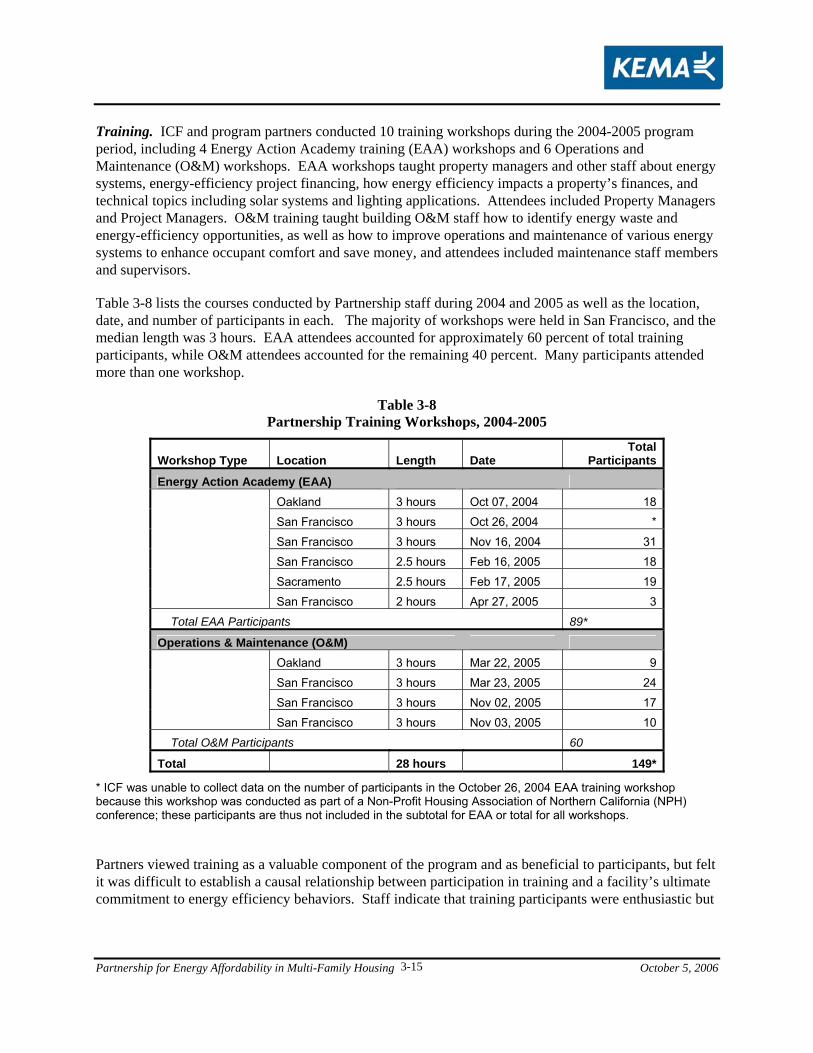
Partnership for Energy Affordability in Multi-Family Housing October 5, 2006
3-15
Training. ICF and program partners conducted 10 training workshops during the 2004-2005 program period, including 4 Energy Action Academy training (EAA) workshops and 6 Operations and Maintenance (O&M) workshops. EAA workshops taught property managers and other staff about energy systems, energy-efficiency project financing, how energy efficiency impacts a property’s finances, and technical topics including solar systems and lighting applications. Attendees included Property Managers and Project Managers. O&M training taught building O&M staff how to identify energy waste and energy-efficiency opportunities, as well as how to improve operations and maintenance of various energy systems to enhance occupant comfort and save money, and attendees included maintenance staff members and supervisors.
Table 3-8 lists the courses conducted by Partnership staff during 2004 and 2005 as well as the location, date, and number of participants in each. The majority of workshops were held in San Francisco, and the median length was 3 hours. EAA attendees accounted for approximately 60 percent of total training participants, while O&M attendees accounted for the remaining 40 percent. Many participants attended more than one workshop.
Table 3-8 Partnership Training Workshops, 2004-2005
Workshop Type Location Length Date Total
Participants
Energy Action Academy (EAA) Oakland 3 hours Oct 07, 2004 18
San Francisco 3 hours Oct 26, 2004 *
San Francisco 3 hours Nov 16, 2004 31
San Francisco 2.5 hours Feb 16, 2005 18
Sacramento 2.5 hours Feb 17, 2005 19 San Francisco 2 hours Apr 27, 2005 3
Total EAA Participants 89*
Operations & Maintenance (O&M) Oakland 3 hours Mar 22, 2005 9
San Francisco 3 hours Mar 23, 2005 24
San Francisco 3 hours Nov 02, 2005 17 San Francisco 3 hours Nov 03, 2005 10
Total O&M Participants 60
Total 28 hours 149*
* ICF was unable to collect data on the number of participants in the October 26, 2004 EAA training workshop because this workshop was conducted as part of a Non-Profit Housing Association of Northern California (NPH) conference; these participants are thus not included in the subtotal for EAA or total for all workshops.
Partners viewed training as a valuable component of the program and as beneficial to participants, but felt it was difficult to establish a causal relationship between participation in training and a facility’s ultimate commitment to energy efficiency behaviors. Staff indicate that training participants were enthusiastic but
Partnership for Energy Affordability in Multi-Family Housing October 5, 2006
3-16
note that it is difficult to tell whether the enthusiasm resulted in rebates or independent energy efficiency improvements in the properties.
Interviews with workshop participants, however, revealed a correlation: of the 12 training participants, 10 were aware of whether or not their organizations used information from the workshops to make changes at their facilities, and 7 of these 10 indicated that at least one change had been made as a result of the training workshop. One of these seven did not receive any rebates for the changes made at his facility, but could not elaborate on the changes beyond stating that his facility implemented some of the upgrades recommended in the training class he attended. The remaining 6 of the 7 training participants who indicated that a change or changes had been made as a result of attending the training workshop stated that their facilities received rebates for all or some of these changes. One of these participants indicated that she learned about boiler rebates at a workshop and took this information back to her property, which later received a rebate through the Partnership for a boiler upgrade. (This participant said the Energy Action Academy workshop was the “best training class” she had ever attended.) Three of the participants who attended training, made changes, and also received rebates indicated that they made changes beyond those rebated by the program, a including boiler tune-up, a pool pump upgrade, a windows upgrade, and a boiler upgrade.37
Two participants had minor issues with the workshops: one with parking for a San Francisco workshop, and another who felt the session would have been better suited for attendees with less experience in the industry than he had. All participants felt that the presenters were very knowledgeable in the subject matter and receptive to questions from participants.
Workshops were discontinued toward the end of the 2004-2005 program period because a lot of administrative time was required to plan and run these events.38 Program staff indicate that the main reason for abandoning the training component was to focus program resources entirely on getting properties into the rebate process and achieving demonstrable energy savings. However, because results from participant interviews indicate that a large proportion of attendees implemented changes in their properties as a result of attending the workshops, training may have provided crucial education for property managers and O&M staff. Training may be a critical pathway for effecting change in the affordable multi-family housing market.
Engineering Services. The 2002-2003 program’s approach to engineering services was seen as excessive and counterproductive in many cases by some program staff. The 2002-2003 program included 2 standard offerings — facility assessments (audits) and express audits — each of which generated a large volume of information for most properties. A more tailored approach was adopted for 2004-2005 in which facility energy surveys (audits), detailed system assessments (detailed surveys), and technical assistance services replaced prior offerings.39
37 The participant spillover component of the net-to-gross (NTG) assessment captures these savings attributable to the program; see Appendix C for details. 38 The last training workshop was conducted in November, 2005, but the program’s implementation period was extended into the first quarter of 2006. 39 Note that Technical Assistance services were available during the 2002-03 implementation period but not formally incorporated into the program until 2004-05.
Partnership for Energy Affordability in Multi-Family Housing October 5, 2006
3-17
Audits included detailed facility assessment reports cataloging recommended energy efficiency upgrades, associated costs, available incentives, and measure payback periods for each participating property.
Detailed surveys were conducted for complex building energy systems and were designed to support requirements for customized rebates. The Partnership provided a list of recommendations to similar to those in a facility assessment report but specific to a particular building system or systems.
Technical Assistance, on-call diagnostics, and system commissioning services were provided to address specific requests for information or to help diagnose and evaluate specific problems within the property. The program also provided commissioning assistance and design review for major retrofit projects as part of its technical assistance services.
Program partners viewed the 2004-2005 program’s tailored approach to engineering services as an improvement, but some noted that further refinements might have been beneficial to the program. The Partnership presented a full range of measures in the audit reports. In addition to providing a set of recommendations limited to those for which the payback period was brief, the Partnership offered properties additional recommendations with longer payback horizons. Some program staff felt that the recommendations could have been “more focused” on the measures with the greatest return or shortest payback period, rather than including recommendations that are “probably good things to do but… ended up cluttering or confusing things” for the properties. However, given the long budgetary cycles for these properties, property owners and management staff may benefit from having a set of longer-term recommendations for new equipment should the need for that equipment arise; indeed, several program participants indicated that while their organizations may not have been able to make upgrades during the program period, they will refer to the audit reports when equipment fails or when replacement becomes a budgetary priority.
A small number of engineering services participants indicated that they’d hoped for even more comprehensive measure recommendations for their facilities. It is clear that the task of finding an appropriate balance between brevity and comprehensiveness is a difficult one; however, the majority of participants were pleased with the level of detail their reports provided, and several indicated that the meetings or telephone calls they had with program partners to discuss the recommendations were “highly beneficial.” Program participants who utilized engineering services report generally high satisfaction with the services they received. All reported that the auditors were “good” or “very good,” and several commented positively on the auditors’ promptness and accessibility as well as on the quality of information provided.
Several participants in the program’s training and engineering services did not receive rebates through the program. At least two of these participants utilized the information provided by the Partnership in support of applications to other programs supporting affordable housing. In one property where the Partnership conducted a detailed survey, property representatives applied for a Community Development Block Grant through HUD; a property representative indicated that the detailed survey report “validated” the property’s grant application, resulting in an award of nearly $120,000 for upgrades to the property’s windows, HVAC, and other equipment.
This same representative indicated that the organization used an audit report from the Partnership in support of a low-interest loan application through the California Housing Finance Agency (CalHFA) for
Partnership for Energy Affordability in Multi-Family Housing October 5, 2006
3-18
another of their properties. 40 According to the representative, the audit report “solidified” their proposal and ultimately resulted in the property’s receiving approval from CalHFA. It is thus apparent that at least some proportion of the Partnership’s participants who did not receive rebates clearly received other demonstrable benefits from their participation. It is also evident that there were at least a small number of cases in which non-rebate participants achieved energy savings through some means other than the Partnership, and that these savings may not have been achieved if the properties had not received engineering services through the Partnership.
Rebates. Although rebates are not the focus of the process evaluation, 11 of the 21 participants we interviewed were involved in the process of working with the Partnership to obtain rebates for upgrades in their facilities. None of the 11 reported any difficulties in obtaining rebates through the program, although one participant indicated that the process was very time-consuming. Three participants mentioned that they had some problems with their contractors. All three of these participants indicated that they worked with their contractors and Partnership staff to resolve these issues to their satisfaction.
Five of the six participants who received engineering services and/or training as well as rebates indicated that they had considered installing the rebated equipment prior to learning that rebates were available, and each one indicated that they could not have afforded to make the improvements without the rebates or that their timing would have been delayed for budgetary reasons. The remaining property representative had not considered installing the equipment prior to learning about the rebates because he was unaware that such upgrades were possible.
No-Interest Loans. Although one affordable housing organization seriously considered applying for a no-interest loan (and may have done so had the program period not expired), program participants did not utilize the program’s interest-free loan component. One program staff member suggested the reason for this may be that directors and financiers for affordable properties are reluctant to assume additional debt, regardless of attractive interest rates or short pay-back periods. All program partners and several participants mentioned that many affordable multi-family properties are cash-strapped and have difficulty taking on additional debt. Even for cases in which a project’s monthly energy savings are projected to be higher than monthly loan payments, properties may be unable to take advantage of the interest-free loans because of a disconnect between their energy budget and loan payment pool. These funds may be tracked separately.
Procurement services. The Partnership intended to leverage reduced prices available for bulk purchases and work with properties and management companies to find vendors willing to offer preferred pricing for common energy-efficiency measures. However, with the exception of some limited action with CFLs, this service never fully developed within the program as there were insufficient orders from participants for most measures. The Partnership’s contractors ultimately accounted for most of the volume of equipment installed by the properties.
3.2.4 Participant Satisfaction
On the whole, participants in the program’s program training and engineering services expressed high satisfaction with their participation in the Partnership. Using a scale of 1 to 5 where 5 means, “very satisfied” and 1 means, “not at all satisfied,” the 21 participants were asked to rank their overall
40 Energy savings resulting from these two specific actions could not be quantified.
Partnership for Energy Affordability in Multi-Family Housing October 5, 2006
3-19
satisfaction with the Partnership. The average rating among these respondents was 4.3, and the vast majority indicated that they had told another colleague or colleagues about the program. All but one participant said they would recommend the program to other property managers or owners at other affordable multi-family properties, and the remaining participant said he would also recommend the Partnership to others if the program made some minor improvements.
To investigate possible drivers of participant satisfaction, we examined average satisfaction ratings for rebate recipients and participants in each program service. Satisfaction was highest among participants who had received detailed surveys, rebates, and/or audits. We also examined a potential link between the survey respondents’ sources of first awareness of the program but found no discernable relationship. However, it is difficult to make conclusive statements regarding the drivers of program satisfaction based on the limited sample (n = 21).
3.3 Conclusions
This section presents conclusions and recommendations resulting from the process evaluation of the Partnership for Energy Affordability in Multi-Family Housing.
The Partnership struggled to balance equity and cost-effectiveness. Because the Partnership set goals for both energy savings and non-energy savings activities, the program faced challenges in striking an appropriate balance between equity and cost-effectiveness. To achieve equity, program staff would have to spend a great deal of time on recruiting smaller properties, conducting training workshops, spreading incentives across multiple organizations, maximizing measure comprehensiveness at measure installation sites, and so on. To achieve cost-effectiveness, program staff would have to do almost the opposite: recruit larger organizations, allow multiple properties within the same organization to receive incentives, abandon training workshops, and focus on the simplest or most accessible upgrades (e.g., lighting and programmable thermostats). The program struggled to find a balance for most of the implementation period, and had to ultimately shift its focus entirely toward reaching for the program’s energy-savings goals.
Because equity and cost-effectiveness are often competing priorities, the Partnership’s energy-savings goals may have been set too high to allow the program to achieve its goals related to equity. Furthermore, programs serving this market sector may require a policy directive to establish an appropriate balance between equity and cost-effectiveness.
• Recommendation: Because efforts associated with meeting non-energy savings goals provide valuable educational benefits (and may themselves result in energy savings, as described below), non-energy goals are an appropriate component of programs targeting the affordable sector of the multi-family housing market. The Commission should establish policy guidelines to enable these programs to set reasonable energy savings goals alongside their non-energy savings activities.
ICF provided effective program administration that enabled partners to focus on implementation priorities. ICF served as the “back office” of the program’s operations, handling the majority of the program’s administrative and regulatory reporting responsibilities. This design allowed program partners
Partnership for Energy Affordability in Multi-Family Housing October 5, 2006
3-20
to focus their energies on implementation: this proved to be the most effective use of their time, as many partners were not experienced in working under this regulatory environment.
• Recommendation: Future programs targeting affordable multi-family housing should designate one firm with experience working in the regulatory environment to handle regulatory and administrative responsibilities, thus ensuring that implementation activities are given the highest possible priority by other program partners.
The Partnership included successful non-rebate services that may be critical in effecting long-term change in the affordable multi-family housing market. To be successful in reaching this sector, energy-efficiency programs may need to incorporate education and training services. Although contractors may provide an efficient means for engaging properties in the rebate process, relying solely on a contractor-driven approach limits the educational capacity of a program. Results of the program evaluation indicate that educational efforts (such as the Partnership’s training and engineering services) may provide considerable energy-efficiency benefits.
Four out of 5 participants in these services reported that they made energy-saving changes in their facilities (such as equipment upgrades or improved maintenance practices) as a result of their participation in a training workshop, audit, detailed survey, or technical assistance visit.
Because the affordable multi-family housing market is underserved, many participants knew very little about energy efficiency prior to participating – although many participants were aware of other energy-efficiency programs prior to participating in the Partnership, only about one-third of the audit recipients indicated that they had heard of the recommended equipment prior to receiving the audit.
• Recommendation: Education and training may be important tools for effecting long-term change in the affordable multi-family housing market and should thus be included in future programs targeting this market.
Program participants reported high levels of satisfaction with the program and its services. Participants expressed high satisfaction with their participation in the Partnership program. On a scale of 1 to 5 where 5 means, “very satisfied” and 1 means, “not at all satisfied,” the average satisfaction rating across the 21 participants we interviewed was 4.3. Since many of these properties had not received these types of services in the past, these high scores might also reflect the importance of this type of program for this market sector. Likewise, the program’s use of the Energy Resource Manager (who works for a non-profit organization that specifically provides services to this sector) may have bolstered overall satisfaction levels.
It may be difficult for third-party programs targeting previously under-served sectors to simultaneously innovate, achieve equity, and be cost-effective. Having the utility act as a clearinghouse might be a more cost-effective model for getting third-parties to innovate and target under-served markets. Third-party programs such as the Partnership are expected to innovatively target specific markets (that are often-underserved) without overlapping with broad, statewide utility programs. These programs must also adhere to the same regulatory requirements as the utilities (which in practice may be more burdensome for third-party program implementers).
Partnership for Energy Affordability in Multi-Family Housing October 5, 2006
3-21
• Recommendation: To ensure accountability while still encouraging innovation, program administrators and implementers should develop mechanisms to allow for flexibility in implementation. For example, program implementers should try where possible to build flexibility into their program designs, such as tying incentive levels to those in the statewide program rather than setting fixed incentive amounts. Likewise, administrators should attempt to streamline the change order approval process to reduce delays in important changes.
A possible approach that would encourage innovation while limiting administrative overhead (and still maintaining appropriate oversight) would be to have the utility act as a clearinghouse for programs serving the multi-family housing market. Under this approach, outreach organizations could contract directly with PG&E and generate leads. PG&E would in turn pass these leads on to their dedicated pool of contractors (such as those that serve the statewide multi-family program). This model would simultaneously decrease administrative costs (by streamlining double-dipping checks) and improve coordination between entities serving this target market (by centrally coordinating the agencies that serve a particular sector within the target market).
Selling educational and informational services may require a different outreach approach than selling program rebates on energy efficient equipment. Program partners largely agree that the Energy Resource Manager (ERM) was effective in establishing contact with the properties and introducing them to the broad range of services offered by the program, but may not have provided the most efficient mechanism for closing the deal on rebates.
The program’s addition of no-cost installation contractors eliminated financial barriers for many properties and generated markedly increased participation late during the implementation period. The statewide Multi-Family Energy Efficiency Rebate program has relied on a contractor-driven recruitment approach with considerable success, but has had some issues with installation quality.41 These issues are not uncommon to energy efficiency programs.
• Recommendation: Energy-efficiency program staff should take steps to increase quality and reliability, including contractor oversight (such as was provided by Partnership program staff). Contactors should be held to high standards and excluded from future program installations for noncompliance as in the statewide Multi-Family Energy Efficiency Rebate Program. A combined approach – using contractors to “sell” the rebates, an Energy Resource Manager to establish initial contact and introduce the contractors to the property representatives, and other program staff to provide contractor oversight – may prove effective.
41 KEMA, Inc., 2004. “Interim Report for the 2004-2005 Statewide Multi-Family Rebate Program Evaluation.” Prepared for the California Public Utilities Commission; San Diego Gas & Electric Company; Pacific Gas and Electric Company; Southern California Edison; and Southern California Gas Company. September 15, 2005.
Program for Energy Affordability in Multifamily Housing October 4, 2006
4-1
4. Impact Evaluation
4.1 Overview
The Partnership set energy savings and unit goals for the installation of energy-efficiency measures in various measure categories. Through providing rebates to qualifying properties, the program intended to save approximately 2.1 MWh, 473 kW, and 238,000 therms over the first year of installed measure operation.42 The program ultimately claimed net annual energy savings of approximately 1,536,031 kWh, 310 kW and 77,454 therms over the first year of installed measure operation. The evaluation confirmed net savings of 685,134 kWh, 84.4 kW, and 30,141 therms over the first year of installed measure operation. The Partnership projected approximately 20.4 MWh in gross lifetime energy savings for the program, and KEMA’s analyses yielded net lifetime energy savings of just under 8.7 MWh (Table 4-1). The program projected 0.32 MW in gross lifetime demand savings, and KEMA’s evaluation yielded net savings of 0.08 MW. For gas, the program’s estimated gross lifetime savings was approximately 1.06 million therms, while KEMA’s analyses confirmed approximately 465,000 therms in net lifetime savings.
42 Based on Attachment A-3 to the program’s second change order submission (Table 2, “ProjectedEEActivities”).
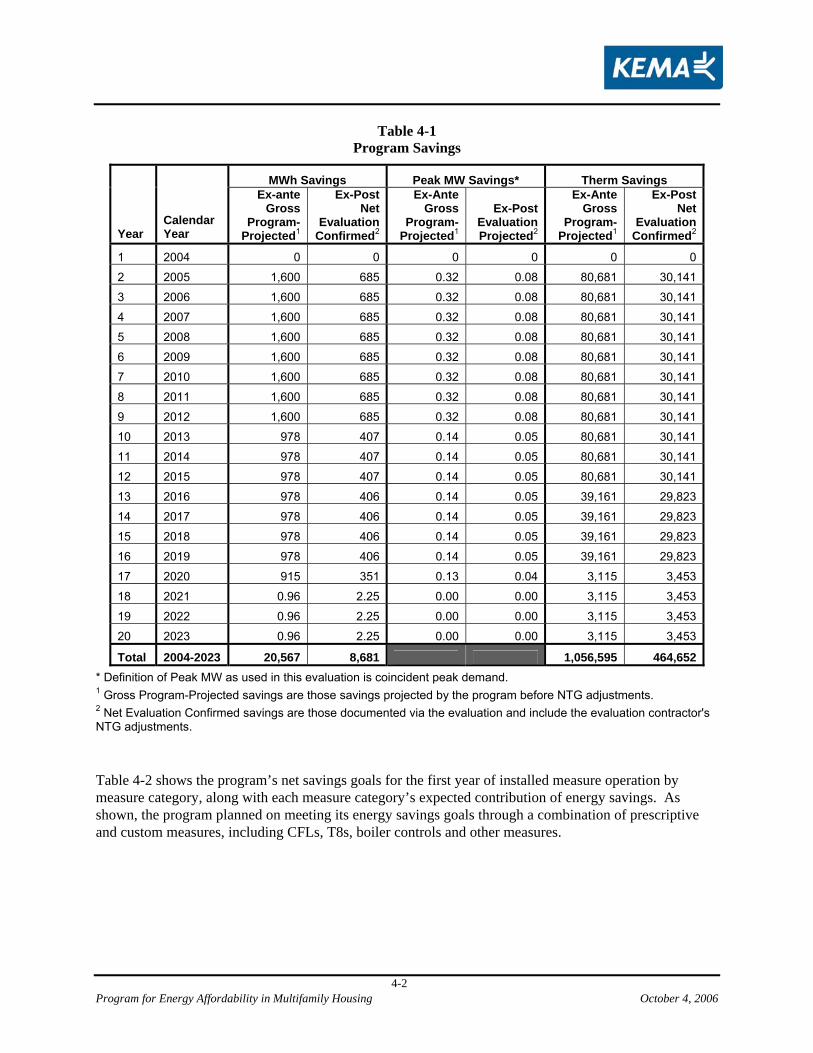
Program for Energy Affordability in Multifamily Housing October 4, 2006
4-2
Table 4-1 Program Savings
MWh Savings Peak MW Savings* Therm Savings
Year Calendar Year
Ex-ante Gross
Program-Projected1
Ex-Post Net
Evaluation Confirmed2
Ex-Ante Gross
Program-Projected1
Ex-Post Evaluation Projected2
Ex-Ante Gross
Program-Projected1
Ex-Post Net
Evaluation Confirmed2
1 2004 0 0 0 0 0 0
2 2005 1,600 685 0.32 0.08 80,681 30,141
3 2006 1,600 685 0.32 0.08 80,681 30,141
4 2007 1,600 685 0.32 0.08 80,681 30,141
5 2008 1,600 685 0.32 0.08 80,681 30,141
6 2009 1,600 685 0.32 0.08 80,681 30,141
7 2010 1,600 685 0.32 0.08 80,681 30,141
8 2011 1,600 685 0.32 0.08 80,681 30,141
9 2012 1,600 685 0.32 0.08 80,681 30,141
10 2013 978 407 0.14 0.05 80,681 30,141
11 2014 978 407 0.14 0.05 80,681 30,141
12 2015 978 407 0.14 0.05 80,681 30,141
13 2016 978 406 0.14 0.05 39,161 29,823
14 2017 978 406 0.14 0.05 39,161 29,823
15 2018 978 406 0.14 0.05 39,161 29,823
16 2019 978 406 0.14 0.05 39,161 29,823
17 2020 915 351 0.13 0.04 3,115 3,453
18 2021 0.96 2.25 0.00 0.00 3,115 3,453
19 2022 0.96 2.25 0.00 0.00 3,115 3,453
20 2023 0.96 2.25 0.00 0.00 3,115 3,453
Total 2004-2023 20,567 8,681 1,056,595 464,652* Definition of Peak MW as used in this evaluation is coincident peak demand. 1 Gross Program-Projected savings are those savings projected by the program before NTG adjustments. 2 Net Evaluation Confirmed savings are those documented via the evaluation and include the evaluation contractor's NTG adjustments. Table 4-2 shows the program’s net savings goals for the first year of installed measure operation by measure category, along with each measure category’s expected contribution of energy savings. As shown, the program planned on meeting its energy savings goals through a combination of prescriptive and custom measures, including CFLs, T8s, boiler controls and other measures.
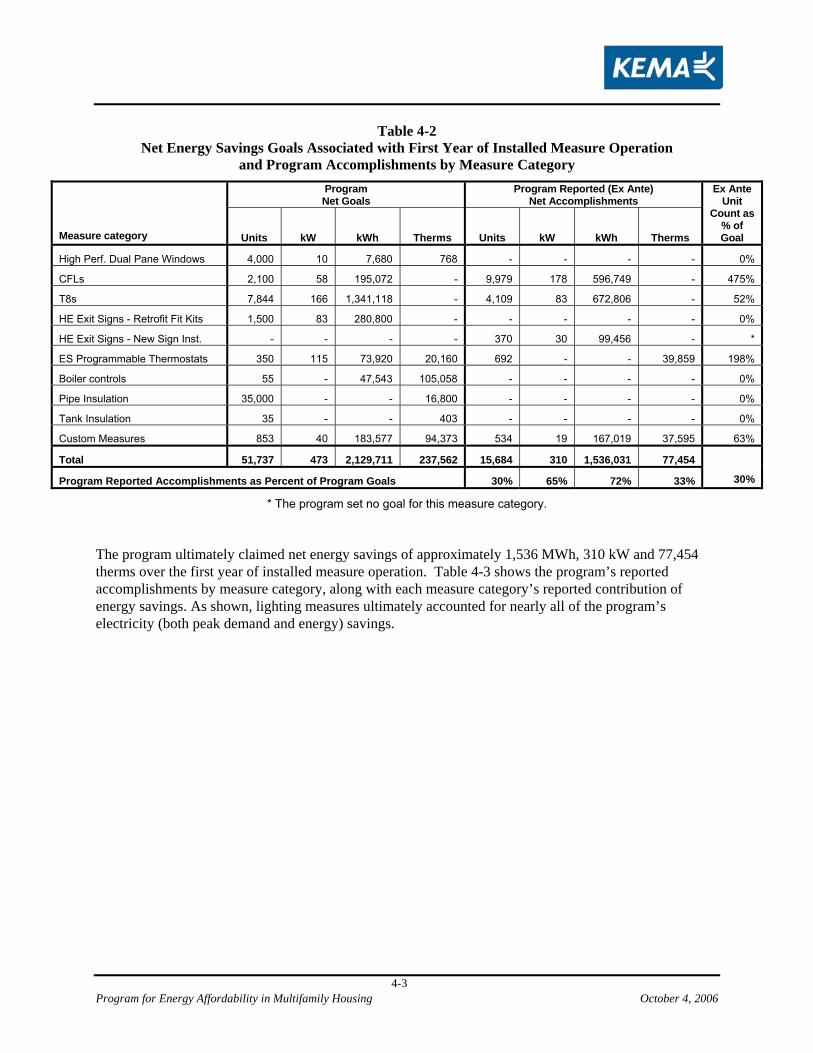
Program for Energy Affordability in Multifamily Housing October 4, 2006
4-3
Table 4-2 Net Energy Savings Goals Associated with First Year of Installed Measure Operation
and Program Accomplishments by Measure Category Program Net Goals
Program Reported (Ex Ante) Net Accomplishments
Measure category Units kW kWh Therms Units kW kWh Therms
Ex Ante Unit
Count as % of Goal
High Perf. Dual Pane Windows 4,000 10 7,680 768 - - - - 0%
CFLs 2,100 58 195,072 - 9,979 178 596,749 - 475%
T8s 7,844 166 1,341,118 - 4,109 83 672,806 - 52%
HE Exit Signs - Retrofit Fit Kits 1,500 83 280,800 - - - - - 0%
HE Exit Signs - New Sign Inst. - - - - 370 30 99,456 - *
ES Programmable Thermostats 350 115 73,920 20,160 692 - - 39,859 198%
Boiler controls 55 - 47,543 105,058 - - - - 0%
Pipe Insulation 35,000 - - 16,800 - - - - 0%
Tank Insulation 35 - - 403 - - - - 0%
Custom Measures 853 40 183,577 94,373 534 19 167,019 37,595 63%
Total 51,737 473 2,129,711 237,562 15,684 310 1,536,031 77,454
Program Reported Accomplishments as Percent of Program Goals 30% 65% 72% 33% 30%
* The program set no goal for this measure category. The program ultimately claimed net energy savings of approximately 1,536 MWh, 310 kW and 77,454 therms over the first year of installed measure operation. Table 4-3 shows the program’s reported accomplishments by measure category, along with each measure category’s reported contribution of energy savings. As shown, lighting measures ultimately accounted for nearly all of the program’s electricity (both peak demand and energy) savings.
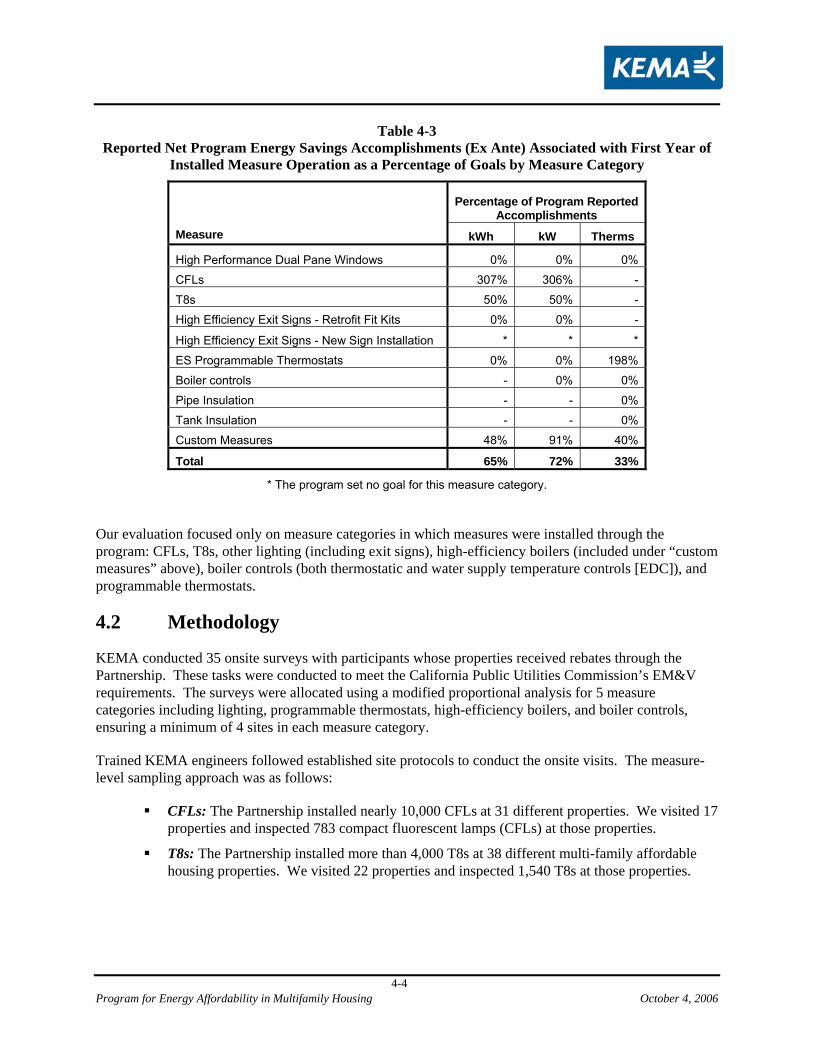
Program for Energy Affordability in Multifamily Housing October 4, 2006
4-4
Table 4-3 Reported Net Program Energy Savings Accomplishments (Ex Ante) Associated with First Year of
Installed Measure Operation as a Percentage of Goals by Measure Category
Percentage of Program Reported Accomplishments
Measure kWh kW Therms
High Performance Dual Pane Windows 0% 0% 0%
CFLs 307% 306% -
T8s 50% 50% -
High Efficiency Exit Signs - Retrofit Fit Kits 0% 0% -
High Efficiency Exit Signs - New Sign Installation * * *
ES Programmable Thermostats 0% 0% 198%
Boiler controls - 0% 0%
Pipe Insulation - - 0%
Tank Insulation - - 0%
Custom Measures 48% 91% 40%
Total 65% 72% 33%
* The program set no goal for this measure category.
Our evaluation focused only on measure categories in which measures were installed through the program: CFLs, T8s, other lighting (including exit signs), high-efficiency boilers (included under “custom measures” above), boiler controls (both thermostatic and water supply temperature controls [EDC]), and programmable thermostats.
4.2 Methodology
KEMA conducted 35 onsite surveys with participants whose properties received rebates through the Partnership. These tasks were conducted to meet the California Public Utilities Commission’s EM&V requirements. The surveys were allocated using a modified proportional analysis for 5 measure categories including lighting, programmable thermostats, high-efficiency boilers, and boiler controls, ensuring a minimum of 4 sites in each measure category.
Trained KEMA engineers followed established site protocols to conduct the onsite visits. The measure-level sampling approach was as follows:
CFLs: The Partnership installed nearly 10,000 CFLs at 31 different properties. We visited 17 properties and inspected 783 compact fluorescent lamps (CFLs) at those properties.
T8s: The Partnership installed more than 4,000 T8s at 38 different multi-family affordable housing properties. We visited 22 properties and inspected 1,540 T8s at those properties.
Program for Energy Affordability in Multifamily Housing October 4, 2006
4-5
Other Lighting: The Partnership installed nearly 900 units of “other lighting” in 19 properties, consisting primarily of LED exit signs and exit sign retrofit kits. We visited 11 properties and inspected 297 fixtures and controls at those properties.
Programmable Thermostats: The Partnership installed nearly 700 programmable thermostats in 10 properties. We visited 9 properties and inspected 133 programmable thermostats at those properties.
High-Efficiency Boilers: The Partnership installed a total of three high-efficiency boilers at two different properties. Both properties were visited and the three boilers were inspected.
Boiler Controls: A total of 99 boiler controls were installed through the Partnership at 23 properties. We visited 7 properties and inspected 26 boiler control installations at those properties. There were two different types of boiler control measures installed by the program - temperature-controlled recirculation controls (thermostatic controls) and water supply temperature controls (EDC controls).
Other Measures: Although the program established energy savings goals in other measure categories (including windows, insulation, and others), none of these measures were installed through the program. The majority of measure installations through the program were in the lighting (CFL, T8, and other) and programmable thermostats categories.
Appendix C describes the impact evaluation research methods in further detail.
4.3 Gross Savings Survey Results
Results from the impact evaluation are discussed below by measure category: CFLs, T8s, other lighting, high-efficiency boilers, boiler controls and programmable thermostats. As noted at the beginning of this section, we do not discuss the other measure categories for which no measures were installed under the program.
4.3.1 CFLs
4.3.1.1 Verification
We visited 17 properties and inspected 783 compact fluorescent lamps (CFLs) at those properties. Overall, we were able to verify 4,556 of the 4,556 sampled CFLs, for a verification rate of 100 percent for the sample.43
4.3.1.2 Per Unit Savings for Verified Measures
The parameters that determine per unit savings (for CFLs that were verified to be installed) include hours of use and delta watts. For hours of use, as mentioned above, we recorded the room where each CFL was installed and applied a look-up value for hours of use. Table 4-4 below shows the distribution of verified
43 The first draft evaluation report indicated a verification rate of 99 percent. After the first draft report was submitted, additional CFLs were installed and verified by PG&E. Under the direction of the PG&E contract manager and the CPUC, we have included these CFLs in our revised verification rate (100 percent).
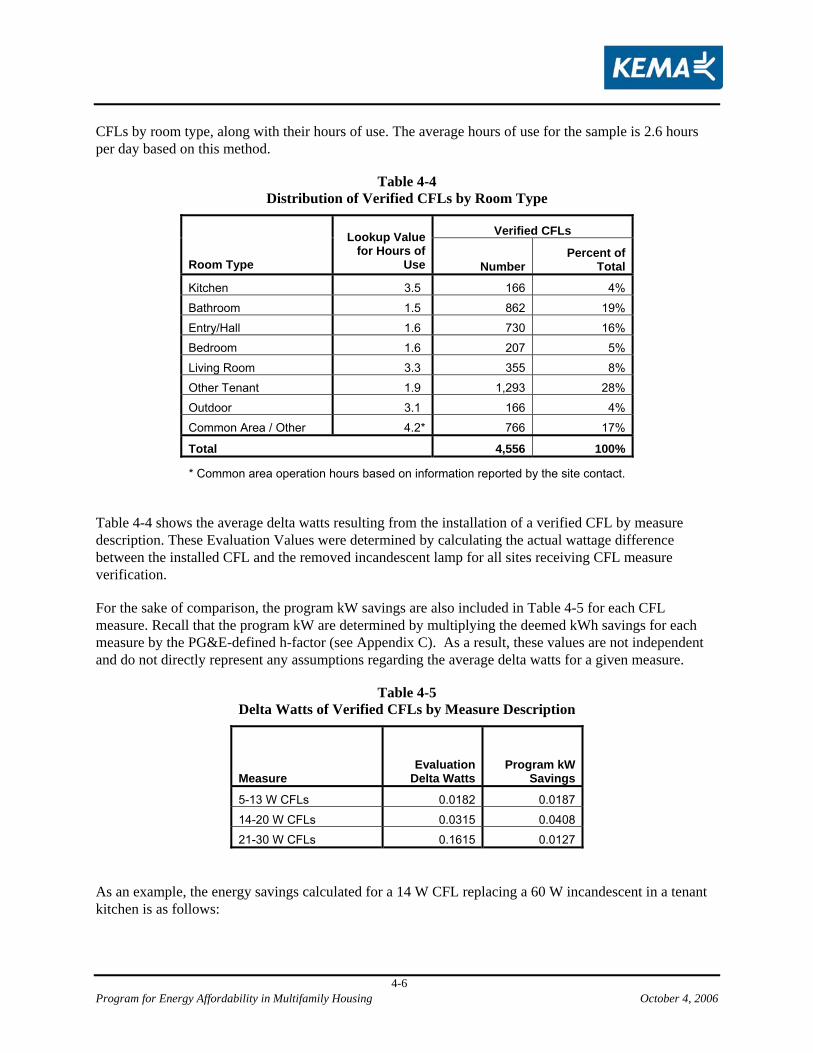
Program for Energy Affordability in Multifamily Housing October 4, 2006
4-6
CFLs by room type, along with their hours of use. The average hours of use for the sample is 2.6 hours per day based on this method.
Table 4-4 Distribution of Verified CFLs by Room Type
Verified CFLs
Room Type
Lookup Value for Hours of
Use Number Percent of
Total
Kitchen 3.5* 166 4%
Bathroom 1.5* 862 19%
Entry/Hall 1.6* 730 16% Bedroom 1.6* 207 5%
Living Room 3.3* 355 8%
Other Tenant 1.9* 1,293 28%
Outdoor 3.1* 166 4%
Common Area / Other 4.2* 766 17%
Total 4,556 100%
* Common area operation hours based on information reported by the site contact.
Table 4-4 shows the average delta watts resulting from the installation of a verified CFL by measure description. These Evaluation Values were determined by calculating the actual wattage difference between the installed CFL and the removed incandescent lamp for all sites receiving CFL measure verification.
For the sake of comparison, the program kW savings are also included in Table 4-5 for each CFL measure. Recall that the program kW are determined by multiplying the deemed kWh savings for each measure by the PG&E-defined h-factor (see Appendix C). As a result, these values are not independent and do not directly represent any assumptions regarding the average delta watts for a given measure.
Table 4-5 Delta Watts of Verified CFLs by Measure Description
Measure Evaluation
Delta WattsProgram kW
Savings
5-13 W CFLs 0.0182 0.0187
14-20 W CFLs 0.0315 0.0408
21-30 W CFLs 0.1615 0.0127 As an example, the energy savings calculated for a 14 W CFL replacing a 60 W incandescent in a tenant kitchen is as follows:
Program for Energy Affordability in Multifamily Housing October 4, 2006
4-7
3.5 * 365 * (60-14) = 58.8 kWh 1,000
The analysis produced an average energy savings per CFL of 38.8 kWh, while the program’s average claimed energy savings was 62.0 kWh. As stated above, the program based their kW savings on the Statewide Multi-Family Energy Efficiency Rebate Program, which relies on a PG&E-defined h-factor to determine kW savings. We replicated this method using the same h-factor and the result per unit was found to be 4.8 W. The program’s average claimed demand savings per fixture was 18.5 W.
4.3.2 T8s
4.3.2.1 Verification
We visited 22 properties and inspected 1,540 T8s at those properties. Overall, we were able to verify 2,643 of the 2,682 sampled T8s, for a verification rate of 99 percent for the sample.
4.3.2.2 Per Unit Savings for Verified Measures
For T8s that were installed and verified, the parameters that determine per unit savings include hours of use and delta watts. For fixtures installed in tenant spaces, we determined hours of use by using the California CFL Metering Study44 based on the room in which the fixtures were installed. For common spaces, the hours of use were based on information from the site contact. The average hours of use for the sample is 7.5 hours per day based on this method.
We used the Standard Performance Contracting lighting table to develop pre- and post-installation wattage estimates by measure description.45 For example, a 4-foot 2-lamp T12 fixture replaced with a 4-foot 2-lamp T8 fixture and electronic ballast will produce an estimated 0.0157 kW demand savings. If such a fixture were installed in a tenant kitchen, the resulting energy savings calculation would be:
3.5 * 365 * 15.7 = 20.1 kWh 1,000
Table 4-5 shows the average delta watts resulting from the installation of a verified T8 by measure description as determined from the Standard Performance Contracting lighting table.
For the sake of comparison, the program kW savings are also included in Table 4-6 for each T8 measure verified. Recall that the program kW are determined by multiplying the deemed kWh savings for each measure by the PG&E-defined h-factor as (see Appendix C). As a result, these values are not independent and do not directly represent any assumptions regarding the average delta watts for a given measure.
44 KEMA, Inc., 2005. Ibid. 45 Alternative Energy Systems Consulting, Inc. , 2000. Ibid.
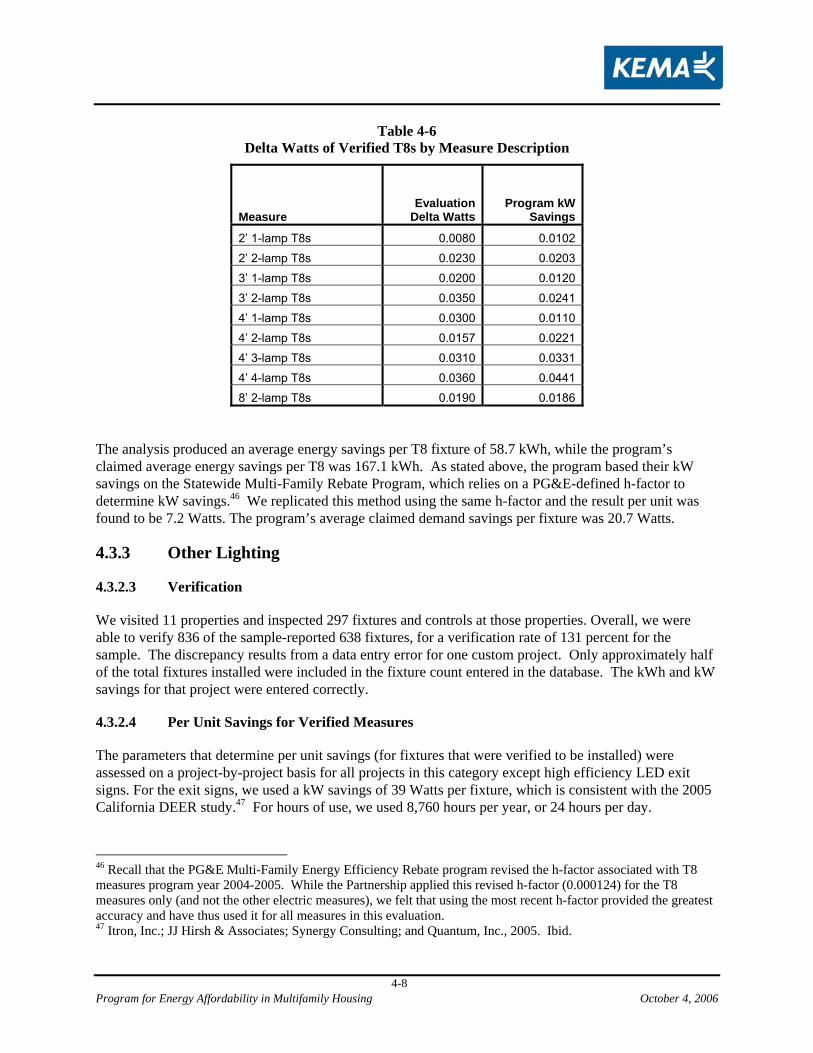
Program for Energy Affordability in Multifamily Housing October 4, 2006
4-8
Table 4-6 Delta Watts of Verified T8s by Measure Description
Measure Evaluation
Delta WattsProgram kW
Savings
2’ 1-lamp T8s 0.0080 0.0102
2’ 2-lamp T8s 0.0230 0.0203
3’ 1-lamp T8s 0.0200 0.0120
3’ 2-lamp T8s 0.0350 0.0241
4’ 1-lamp T8s 0.0300 0.0110
4’ 2-lamp T8s 0.0157 0.0221
4’ 3-lamp T8s 0.0310 0.0331
4’ 4-lamp T8s 0.0360 0.0441
8’ 2-lamp T8s 0.0190 0.0186
The analysis produced an average energy savings per T8 fixture of 58.7 kWh, while the program’s claimed average energy savings per T8 was 167.1 kWh. As stated above, the program based their kW savings on the Statewide Multi-Family Rebate Program, which relies on a PG&E-defined h-factor to determine kW savings.46 We replicated this method using the same h-factor and the result per unit was found to be 7.2 Watts. The program’s average claimed demand savings per fixture was 20.7 Watts.
4.3.3 Other Lighting
4.3.2.3 Verification
We visited 11 properties and inspected 297 fixtures and controls at those properties. Overall, we were able to verify 836 of the sample-reported 638 fixtures, for a verification rate of 131 percent for the sample. The discrepancy results from a data entry error for one custom project. Only approximately half of the total fixtures installed were included in the fixture count entered in the database. The kWh and kW savings for that project were entered correctly.
4.3.2.4 Per Unit Savings for Verified Measures
The parameters that determine per unit savings (for fixtures that were verified to be installed) were assessed on a project-by-project basis for all projects in this category except high efficiency LED exit signs. For the exit signs, we used a kW savings of 39 Watts per fixture, which is consistent with the 2005 California DEER study.47 For hours of use, we used 8,760 hours per year, or 24 hours per day.
46 Recall that the PG&E Multi-Family Energy Efficiency Rebate program revised the h-factor associated with T8 measures program year 2004-2005. While the Partnership applied this revised h-factor (0.000124) for the T8 measures only (and not the other electric measures), we felt that using the most recent h-factor provided the greatest accuracy and have thus used it for all measures in this evaluation. 47 Itron, Inc.; JJ Hirsh & Associates; Synergy Consulting; and Quantum, Inc., 2005. Ibid.
Program for Energy Affordability in Multifamily Housing October 4, 2006
4-9
The per unit savings for verified fixtures in the Other Lighting sample category was 218 kWh per fixture. The program’s average claimed energy savings per fixture was 318 kWh.
As stated above, the program based their kW savings on the Statewide Multi-Family Rebate Program, which relies on a PG&E-defined h-factor to determine kW savings. We replicated this method using the same h-factor and the result per unit was found to be 27 Watts per fixture. The program’s average claimed demand savings per fixture was 62.8 Watts.
4.3.3 Programmable Thermostats
4.3.3.1 Verification
We visited 9 properties and inspected 133 programmable thermostats at those properties. Overall, we were able to verify 133 of the 133 sampled thermostats, for a verification rate of 100 percent for the sample.
4.3.3.2 Per Unit Savings for Verified Measures
The parameters that determine per unit savings (for thermostats that were verified to be installed) were based on a behavioral survey delivered to one tenant for each verified thermostat. The main objective was to determine the behavioral change of the tenant since the installation of the thermostat. Based on literature review of previous studies on thermostat impacts, we anticipated that a significant portion of tenants would not be using the automatic setback and set forward features of the thermostat. Therefore, the onsite data collection attempted to answer the following questions:
Is the thermostat installed?
Was there a programmable thermostat before?
If the programmable features are being utilized, what are the current settings?
Does the occupant override the current thermostat settings?
What was the thermostat behavior prior to installation of the thermostat?
We verified installation and determined the current settings of the thermostat by visual inspection onsite. For each unit in which the thermostats were installed, programmed, and not overridden more than once per week, we interviewed the tenant to determine whether usage patterns had changed since the installation of the new thermostat. A savings proportion was determined based on the tenant responses and applied to the program savings.
The results of the surveys support our initial hypothesis. Of the 133 tenants that received verified thermostats, 92 percent overrode the programming more than once per week. Most of the tenants were unfamiliar with the thermostat operation and therefore, instead of changing the settings to match their comfort levels, they turned the thermostats off and did not use them at all. The remaining 8 percent of tenants that received verified thermostats received the behavioral battery, but only 6 (2.2% of the total) gave responses that resulted in savings as a result of the thermostat installation. The resulting savings were found to average 1.7 kWh, 0.2 Watts, and 0.53 therms per verified thermostat.
Program for Energy Affordability in Multifamily Housing October 4, 2006
4-10
The program only reported natural gas savings for the installed thermostats under the assumption that there were no electric heaters or air conditioning units installed in the buildings that received the thermostat installations. The program reported an average of 60 therms per thermostat.
4.3.4 Boilers
4.3.4.1 Verification
We visited two properties and inspected 3 boilers at those properties. Overall, we were able to verify all three of the boilers for a verification rate of 100 percent. 48 For this measure, the sample and the population coincide.
4.3.4.2 Per Unit Savings for Verified Measures
The parameters that determine per unit savings (for boilers that were verified to be installed) were assessed on a project-by-project basis. One of the two properties that installed a new boiler with program assistance also installed outside air lockout and temperature reset controls. Our inspection verified the installation of two of the three boilers and the new controls, and found that the lockout temperature was set lower than the program had anticipated, resulting in an increase of savings over what the program had reported. The third boiler was installed after KEMA’s verification visits were completed, but installation was verified by both ICF and PG&E so the evaluation includes savings for this boiler. Savings for this unit were calculated as the average of per-unit savings for the other two boilers installed through the program.
We were able to verify gross savings of 0.22 kW, 1,762 kWh, and 2,708 therms for the entire boiler population. The program reported gross savings of 1.3 kW, 960 kWh, and 3,115 therms for the same population.
4.3.5 Boiler Controls
4.3.5.1 Verification
We visited 7 properties and inspected 26 boiler control installations at those properties in two categories. We also successfully reached two additional properties by phone to verify installation of boiler controls at each property. Overall, we were able to verify 26 of the 27 sampled boiler controls, for a verification rate of 96 percent for the sample.
4.3.5.2 Per Unit Savings for Verified Measures
The parameters that determine per unit savings differed for each boiler control category. The program-reported savings for the EDC water supply temperature controls were based on logging done before and after installation of the controls. For those measures, we verified installation only and then applied full credit for savings based on those logging results. For the thermostatic boiler controls, we verified
48 The first draft evaluation report indicated a verification rate of 67 percent. After the first draft report was submitted, an additional boiler was installed and verified by PG&E. Under the direction of the PG&E contract manager and the CPUC, we have included this boiler in our verification rate.
Program for Energy Affordability in Multifamily Housing October 4, 2006
4-11
installation and then logged a sample of hot water pumps to determine the reduction in pump runtime as a result of the installation of the new controls.
Of the two EDC controls properties that we visited, both had disabled their controls as a result of problems or complaints about the system. We then phoned the two other EDC properties to verify that they were using their controls as initially installed and had not disabled their systems, and this proved true for both properties. The resulting realization rate is based on the weighted savings at all 4 properties that installed EDC controls. The natural gas realization rate for the EDC sample is 69 percent of the program-reported 31,756 therms. There were no electric savings for this measure.
We verified installation of 20 of the program-reported 21 thermostatic controls, for a verification rate of 95 percent for the measure category. The program reported a prescribed 49 therms per control based on a thermodynamic analysis of the reduction in hot water system energy resulting in reduced circulation. We analyzed the program calculations, verified that they were reasonable, and applied the same natural gas savings (49 therms per control) for each verified installation. Electricity savings were based on a new, more efficient pump installation and the reduction in pump runtime resulting from reduced hot water circulation. We verified the new pump installation and logged a number of pumps for a minimum of 1 week to determine the reduction in run time. On average, we saw a savings of 686 kWh per control compared to the program estimate of 703 kWh per control.
We used the same parameters to calculate kW as discussed above for the lighting measures. Our method provides automatic assignment of savings, while the program calculated custom kW savings for each project. KEMA’s verified kW savings are 85 Watts per control, while the program’s claimed demand savings were 57 Watts per control.
4.4 Effective Useful Life (EUL)
KEMA examined the effective useful life (EUL) assumptions for all measures in the program’s final reporting workbook (dated April, 2006) and compared program EULs with those specified in Table 4.1 of the California Public Utilities Commission’s Energy Efficiency Policy Manual.49 ICF’s reported EUL values matched those in the Policy Manual for each measure both listed in the Manual and included in the program. For measures that did not appear in the Policy Manual (e.g., outdoor reset boiler controls), KEMA compared these with available estimates from the 2005 DEER study50 or relied upon KEMA engineers to assess the accuracy of the program’s assumptions. Program EULs in these cases were all found to be realistic in comparison with useful life assumptions in relevant literature. All of the EULs reported by ICF were thus used in the impact evaluation analyses. 51
49 California Public Utilities Commission, 2003. Ibid. 50 Itron, Inc.; JJ Hirsh & Associates; Synergy Consulting; and Quantum, Inc., 2005. Ibid. 51 Past EUL studies have been significantly questioned by the IOUs, the Commission, and by the authors of the studies. Many studies were conducted before enough failures occurred in the market to make the assessments useful. An evaluation study of the type comprised by this report is not capable of accurately confirming whether EULs are entirely appropriate, and instead must rely on the existing data (despite its imperfections).
Program for Energy Affordability in Multifamily Housing October 4, 2006
4-12
4.5 Net-to-Gross Analysis
KEMA calculated net-to-gross (NTG) ratios for four measure categories (lighting, boiler controls, high-efficiency boilers, and programmable thermostats. The final ex post net-to-gross ratios by measure category reflect only freeridership (and not participant spillover). To calculate NTG ratios, KEMA engineering staff conducted brief freeridership interviews with representatives from 23 properties in which measure verification visits had been conducted (see Appendix A for interview guide). These interviews queried representatives regarding the likelihood with which they would have proceeded with energy-efficient equipment upgrades in each property without incentives from the Partnership. KEMA used results from these interviews as well as an interview with the program’s ERM to calculate NTG ratios.52 Ratios were calculated for each of the four measure categories (see Table 4-7). The evaluation methods for calculating NTG ratios are fully described in Appendix C. The final ex post NTG ratios were applied to gross ex post savings estimates by measure category to yield net ex post savings. The ratios were also applied in the evaluation’s cost-effectiveness tests as described later in this report.
Table 4-7
Net-to-Gross Ratios by Measure Category
Measure Category
Program (Ex Ante) NTG Ratio
Ex Post NTG Ratio
Lighting 96% 80%
Programmable thermostats 96% 86%
High-efficiency boilers 96% 85%
Boiler controls 96% 100%
4.6 Gross and Net Savings Results
Based on the methods described above, KEMA determined gross and net demand savings (kW), energy savings (kWh), and therm savings across the program’s seven measure categories: CFLs, T8s, other lighting, programmable thermostats, high-efficiency boilers, EDC boiler controls, and thermostatic boiler controls. KEMA’s results (ex post) were compared with program-reported savings (ex ante) to yield gross and net realization rates. These results are reported below by measure category and at the program level.
52 In many cases, it may not be sensible to incorporate a program implementer’s opinion with regard to program influence into NTG ratio calculation. In this case, however, we felt that LISC (the organization by which the ERM was employed) was more motivated by serving its constituency and providing program services (and providing rebates and achieving gross impacts) than by being credited for delivering net impacts. Our judgment was that incorporating the ERM’s responses helped address respondent self-report bias with little chance of introducing additional bias.
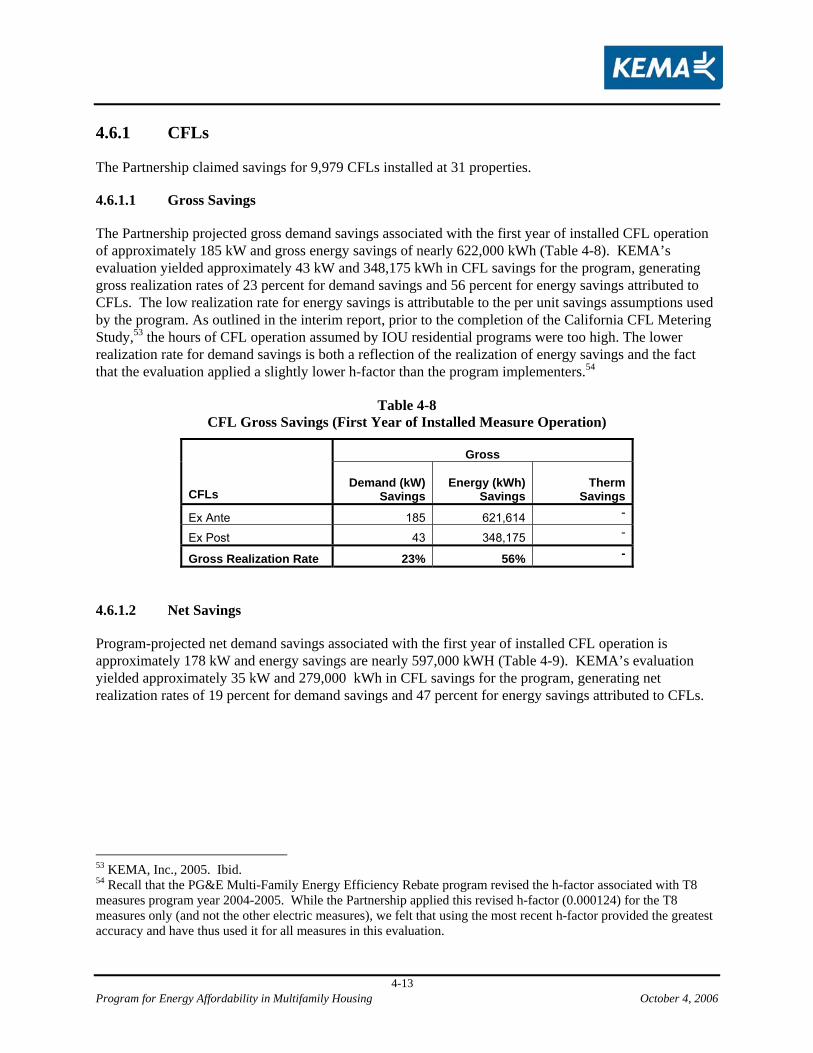
Program for Energy Affordability in Multifamily Housing October 4, 2006
4-13
4.6.1 CFLs
The Partnership claimed savings for 9,979 CFLs installed at 31 properties.
4.6.1.1 Gross Savings
The Partnership projected gross demand savings associated with the first year of installed CFL operation of approximately 185 kW and gross energy savings of nearly 622,000 kWh (Table 4-8). KEMA’s evaluation yielded approximately 43 kW and 348,175 kWh in CFL savings for the program, generating gross realization rates of 23 percent for demand savings and 56 percent for energy savings attributed to CFLs. The low realization rate for energy savings is attributable to the per unit savings assumptions used by the program. As outlined in the interim report, prior to the completion of the California CFL Metering Study,53 the hours of CFL operation assumed by IOU residential programs were too high. The lower realization rate for demand savings is both a reflection of the realization of energy savings and the fact that the evaluation applied a slightly lower h-factor than the program implementers.54
Table 4-8
CFL Gross Savings (First Year of Installed Measure Operation)
Gross
CFLs Demand (kW)
Savings Energy (kWh)
Savings
Therm
Savings
Ex Ante 185 621,614 -
Ex Post 43 348,175 -
Gross Realization Rate 23% 56% -
4.6.1.2 Net Savings
Program-projected net demand savings associated with the first year of installed CFL operation is approximately 178 kW and energy savings are nearly 597,000 kWH (Table 4-9). KEMA’s evaluation yielded approximately 35 kW and 279,000 kWh in CFL savings for the program, generating net realization rates of 19 percent for demand savings and 47 percent for energy savings attributed to CFLs.
53 KEMA, Inc., 2005. Ibid. 54 Recall that the PG&E Multi-Family Energy Efficiency Rebate program revised the h-factor associated with T8 measures program year 2004-2005. While the Partnership applied this revised h-factor (0.000124) for the T8 measures only (and not the other electric measures), we felt that using the most recent h-factor provided the greatest accuracy and have thus used it for all measures in this evaluation.
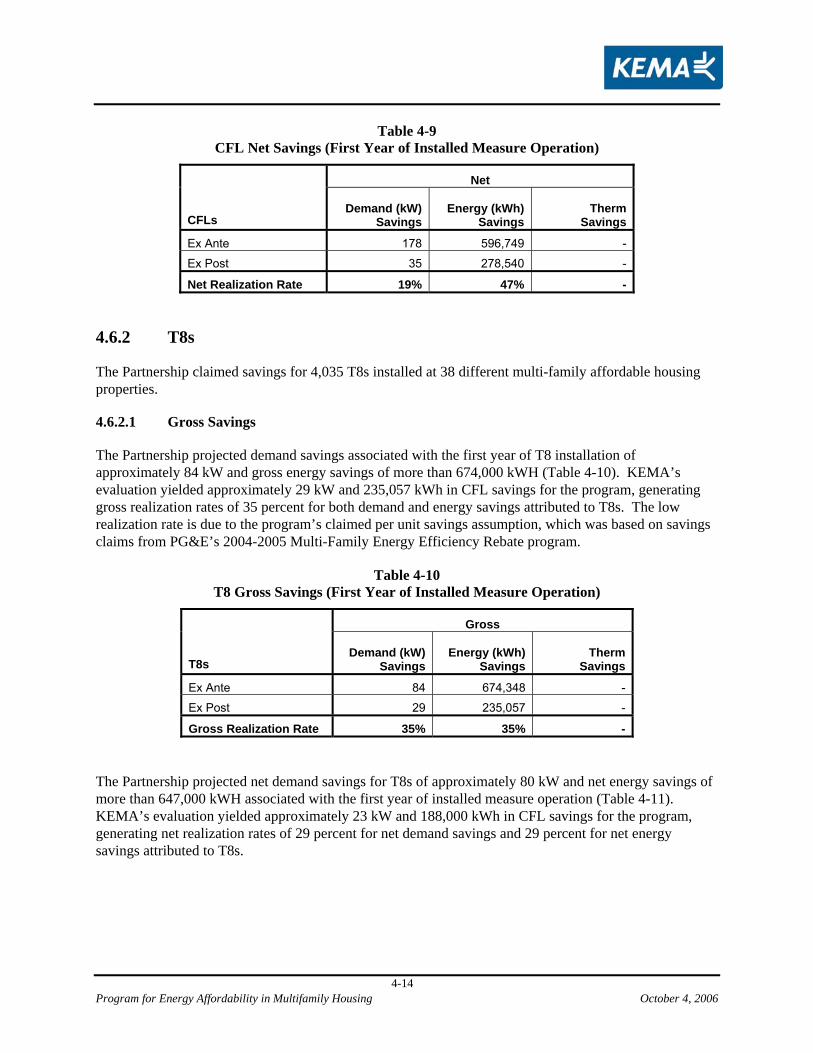
Program for Energy Affordability in Multifamily Housing October 4, 2006
4-14
Table 4-9 CFL Net Savings (First Year of Installed Measure Operation)
Net
CFLs Demand (kW)
Savings Energy (kWh)
Savings
Therm
Savings
Ex Ante 178 596,749 -
Ex Post 35 278,540 -
Net Realization Rate 19% 47% -
4.6.2 T8s
The Partnership claimed savings for 4,035 T8s installed at 38 different multi-family affordable housing properties.
4.6.2.1 Gross Savings
The Partnership projected demand savings associated with the first year of T8 installation of approximately 84 kW and gross energy savings of more than 674,000 kWH (Table 4-10). KEMA’s evaluation yielded approximately 29 kW and 235,057 kWh in CFL savings for the program, generating gross realization rates of 35 percent for both demand and energy savings attributed to T8s. The low realization rate is due to the program’s claimed per unit savings assumption, which was based on savings claims from PG&E’s 2004-2005 Multi-Family Energy Efficiency Rebate program.
Table 4-10
T8 Gross Savings (First Year of Installed Measure Operation)
Gross
T8s Demand (kW)
Savings Energy (kWh)
Savings
Therm
Savings
Ex Ante 84 674,348 -
Ex Post 29 235,057 -
Gross Realization Rate 35% 35% - The Partnership projected net demand savings for T8s of approximately 80 kW and net energy savings of more than 647,000 kWH associated with the first year of installed measure operation (Table 4-11). KEMA’s evaluation yielded approximately 23 kW and 188,000 kWh in CFL savings for the program, generating net realization rates of 29 percent for net demand savings and 29 percent for net energy savings attributed to T8s.
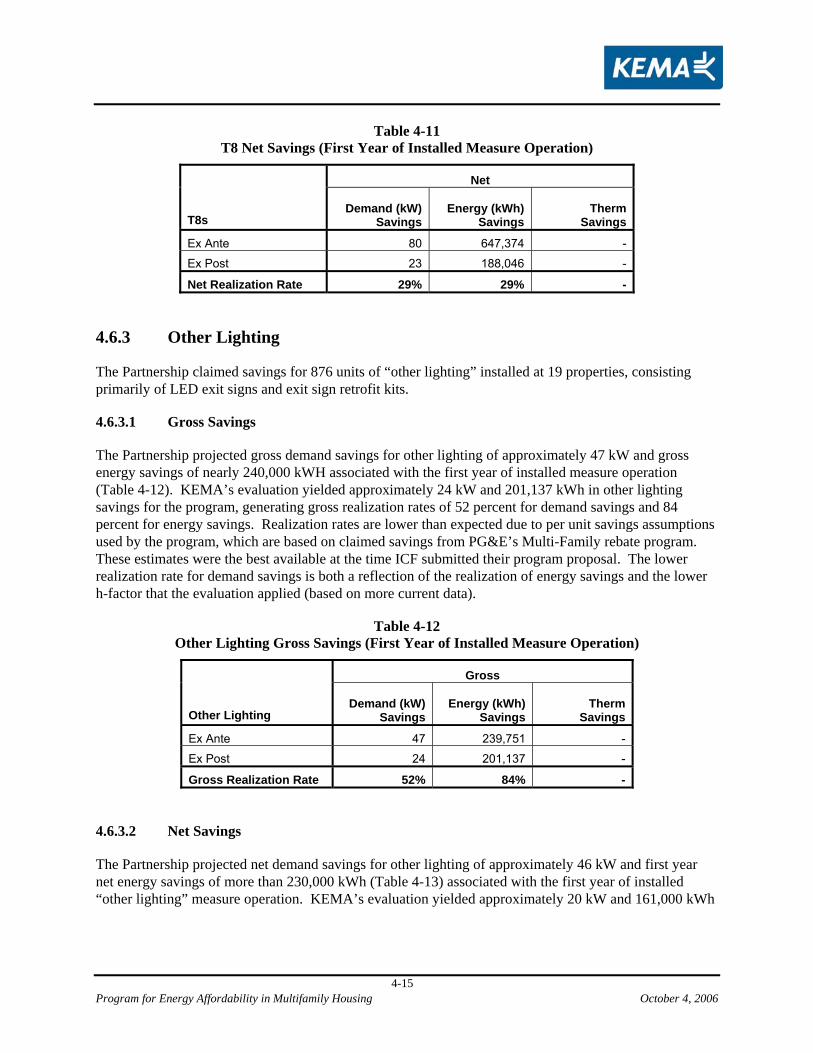
Program for Energy Affordability in Multifamily Housing October 4, 2006
4-15
Table 4-11 T8 Net Savings (First Year of Installed Measure Operation)
Net
T8s Demand (kW)
Savings Energy (kWh)
Savings
Therm
Savings
Ex Ante 80 647,374 -
Ex Post 23 188,046 -
Net Realization Rate 29% 29% -
4.6.3 Other Lighting
The Partnership claimed savings for 876 units of “other lighting” installed at 19 properties, consisting primarily of LED exit signs and exit sign retrofit kits.
4.6.3.1 Gross Savings
The Partnership projected gross demand savings for other lighting of approximately 47 kW and gross energy savings of nearly 240,000 kWH associated with the first year of installed measure operation (Table 4-12). KEMA’s evaluation yielded approximately 24 kW and 201,137 kWh in other lighting savings for the program, generating gross realization rates of 52 percent for demand savings and 84 percent for energy savings. Realization rates are lower than expected due to per unit savings assumptions used by the program, which are based on claimed savings from PG&E’s Multi-Family rebate program. These estimates were the best available at the time ICF submitted their program proposal. The lower realization rate for demand savings is both a reflection of the realization of energy savings and the lower h-factor that the evaluation applied (based on more current data).
Table 4-12 Other Lighting Gross Savings (First Year of Installed Measure Operation)
Gross
Other Lighting Demand (kW)
Savings Energy (kWh)
Savings
Therm
Savings
Ex Ante 47 239,751 -
Ex Post 24 201,137 -
Gross Realization Rate 52% 84% - 4.6.3.2 Net Savings
The Partnership projected net demand savings for other lighting of approximately 46 kW and first year net energy savings of more than 230,000 kWh (Table 4-13) associated with the first year of installed “other lighting” measure operation. KEMA’s evaluation yielded approximately 20 kW and 161,000 kWh
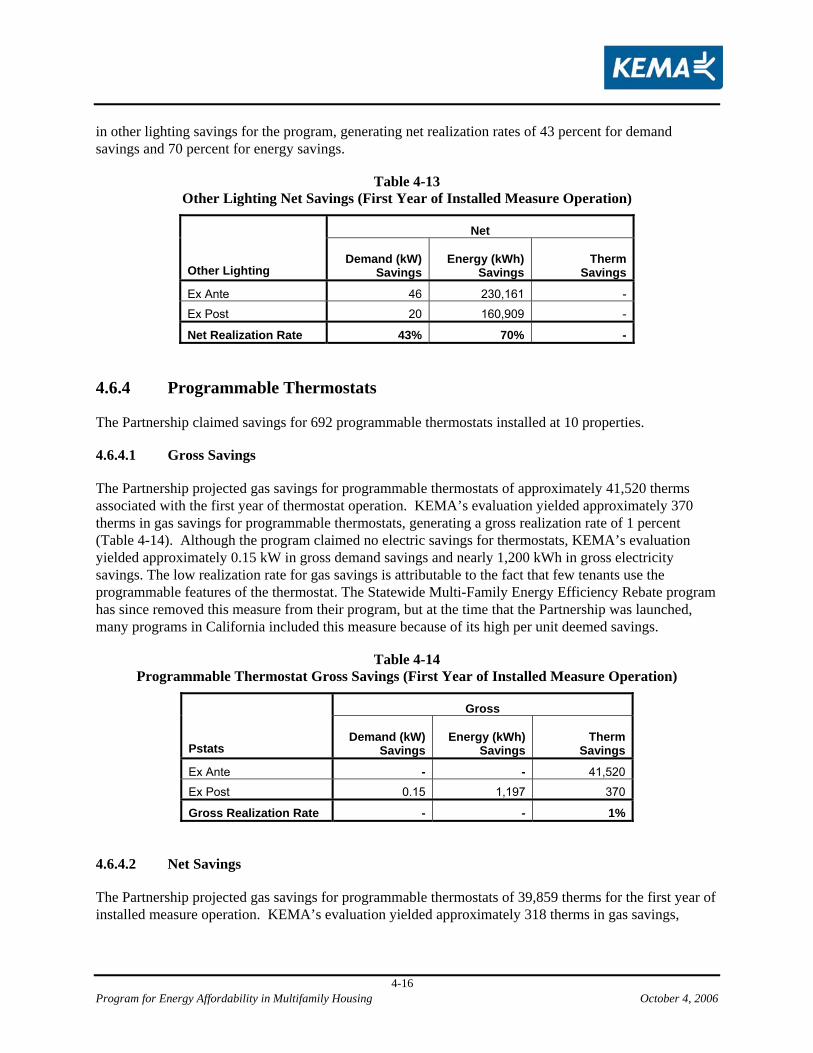
Program for Energy Affordability in Multifamily Housing October 4, 2006
4-16
in other lighting savings for the program, generating net realization rates of 43 percent for demand savings and 70 percent for energy savings.
Table 4-13 Other Lighting Net Savings (First Year of Installed Measure Operation)
Net
Other Lighting Demand (kW)
Savings Energy (kWh)
Savings
Therm
Savings
Ex Ante 46 230,161 -
Ex Post 20 160,909 -
Net Realization Rate 43% 70% -
4.6.4 Programmable Thermostats
The Partnership claimed savings for 692 programmable thermostats installed at 10 properties.
4.6.4.1 Gross Savings
The Partnership projected gas savings for programmable thermostats of approximately 41,520 therms associated with the first year of thermostat operation. KEMA’s evaluation yielded approximately 370 therms in gas savings for programmable thermostats, generating a gross realization rate of 1 percent (Table 4-14). Although the program claimed no electric savings for thermostats, KEMA’s evaluation yielded approximately 0.15 kW in gross demand savings and nearly 1,200 kWh in gross electricity savings. The low realization rate for gas savings is attributable to the fact that few tenants use the programmable features of the thermostat. The Statewide Multi-Family Energy Efficiency Rebate program has since removed this measure from their program, but at the time that the Partnership was launched, many programs in California included this measure because of its high per unit deemed savings.
Table 4-14 Programmable Thermostat Gross Savings (First Year of Installed Measure Operation)
Gross
Pstats Demand (kW)
Savings Energy (kWh)
Savings
Therm
Savings
Ex Ante - - 41,520
Ex Post 0.15 1,197 370
Gross Realization Rate - - 1%
4.6.4.2 Net Savings
The Partnership projected gas savings for programmable thermostats of 39,859 therms for the first year of installed measure operation. KEMA’s evaluation yielded approximately 318 therms in gas savings,
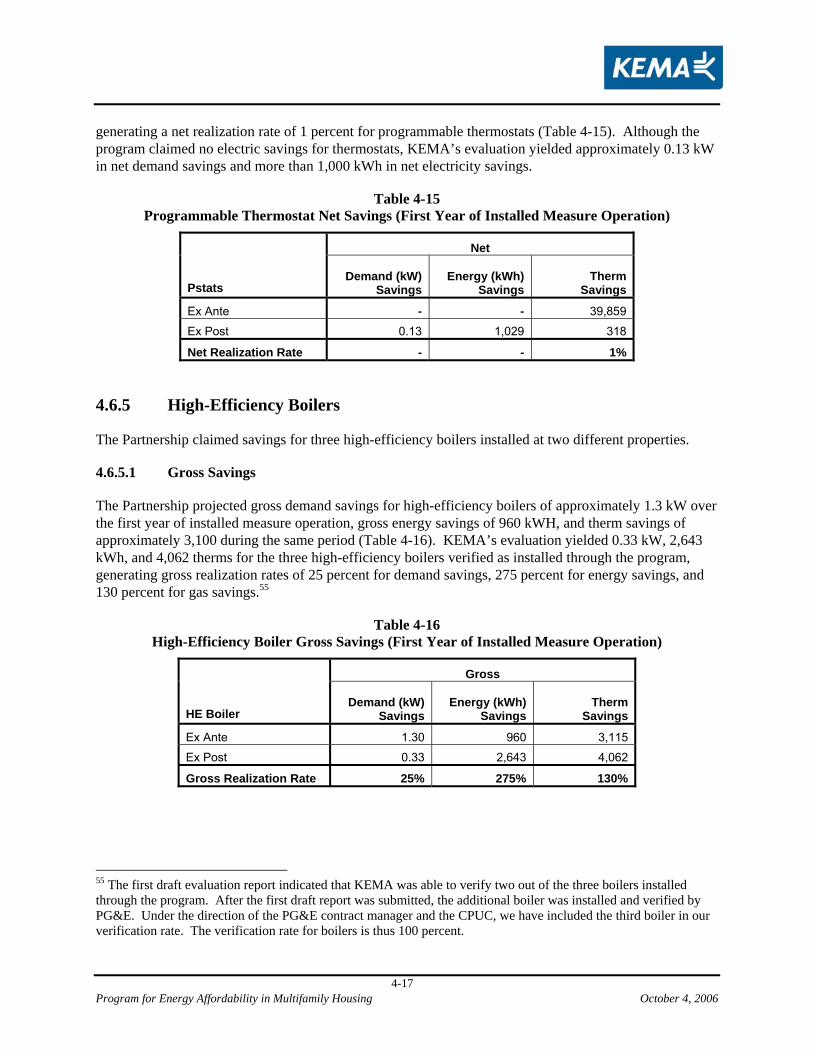
Program for Energy Affordability in Multifamily Housing October 4, 2006
4-17
generating a net realization rate of 1 percent for programmable thermostats (Table 4-15). Although the program claimed no electric savings for thermostats, KEMA’s evaluation yielded approximately 0.13 kW in net demand savings and more than 1,000 kWh in net electricity savings.
Table 4-15 Programmable Thermostat Net Savings (First Year of Installed Measure Operation)
Net
Pstats Demand (kW)
Savings Energy (kWh)
Savings
Therm
Savings
Ex Ante - - 39,859
Ex Post 0.13 1,029 318
Net Realization Rate - - 1%
4.6.5 High-Efficiency Boilers
The Partnership claimed savings for three high-efficiency boilers installed at two different properties.
4.6.5.1 Gross Savings
The Partnership projected gross demand savings for high-efficiency boilers of approximately 1.3 kW over the first year of installed measure operation, gross energy savings of 960 kWH, and therm savings of approximately 3,100 during the same period (Table 4-16). KEMA’s evaluation yielded 0.33 kW, 2,643 kWh, and 4,062 therms for the three high-efficiency boilers verified as installed through the program, generating gross realization rates of 25 percent for demand savings, 275 percent for energy savings, and 130 percent for gas savings.55
Table 4-16 High-Efficiency Boiler Gross Savings (First Year of Installed Measure Operation)
Gross
HE Boiler Demand (kW)
Savings Energy (kWh)
Savings
Therm
Savings
Ex Ante 1.30 960 3,115
Ex Post 0.33 2,643 4,062
Gross Realization Rate 25% 275% 130%
55 The first draft evaluation report indicated that KEMA was able to verify two out of the three boilers installed through the program. After the first draft report was submitted, the additional boiler was installed and verified by PG&E. Under the direction of the PG&E contract manager and the CPUC, we have included the third boiler in our verification rate. The verification rate for boilers is thus 100 percent.
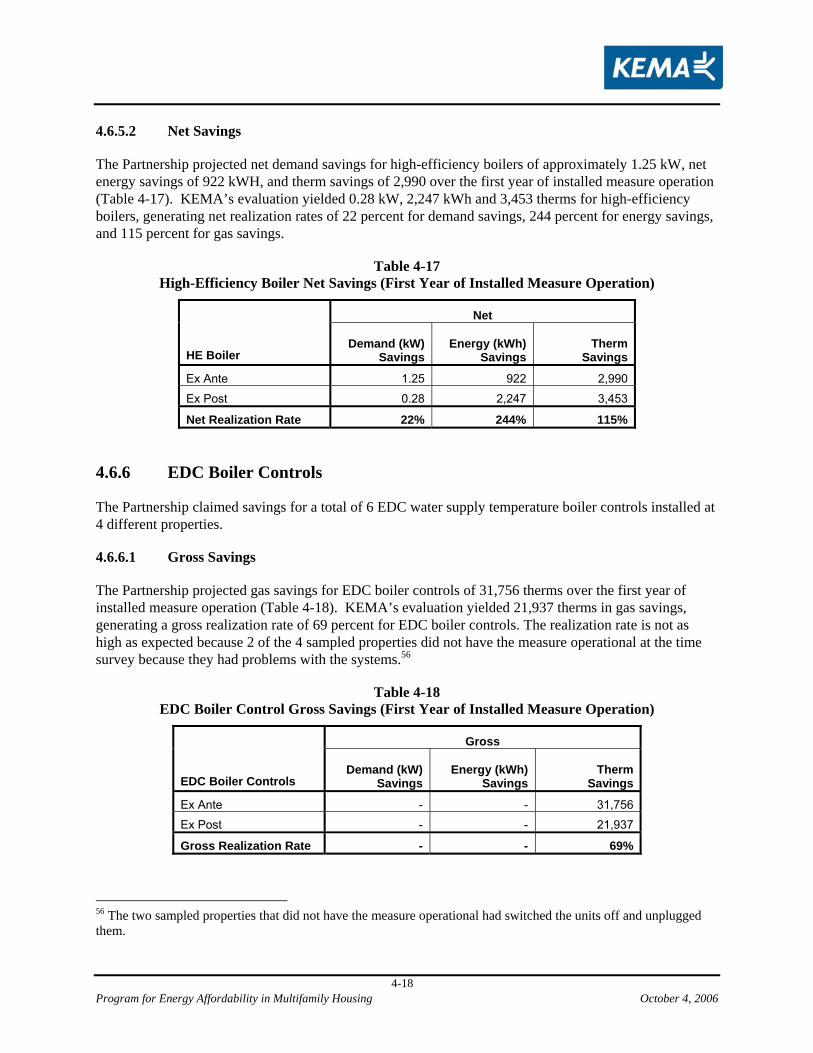
Program for Energy Affordability in Multifamily Housing October 4, 2006
4-18
4.6.5.2 Net Savings
The Partnership projected net demand savings for high-efficiency boilers of approximately 1.25 kW, net energy savings of 922 kWH, and therm savings of 2,990 over the first year of installed measure operation (Table 4-17). KEMA’s evaluation yielded 0.28 kW, 2,247 kWh and 3,453 therms for high-efficiency boilers, generating net realization rates of 22 percent for demand savings, 244 percent for energy savings, and 115 percent for gas savings.
Table 4-17 High-Efficiency Boiler Net Savings (First Year of Installed Measure Operation)
Net
HE Boiler Demand (kW)
Savings Energy (kWh)
Savings
Therm
Savings
Ex Ante 1.25 922 2,990
Ex Post 0.28 2,247 3,453
Net Realization Rate 22% 244% 115%
4.6.6 EDC Boiler Controls
The Partnership claimed savings for a total of 6 EDC water supply temperature boiler controls installed at 4 different properties.
4.6.6.1 Gross Savings
The Partnership projected gas savings for EDC boiler controls of 31,756 therms over the first year of installed measure operation (Table 4-18). KEMA’s evaluation yielded 21,937 therms in gas savings, generating a gross realization rate of 69 percent for EDC boiler controls. The realization rate is not as high as expected because 2 of the 4 sampled properties did not have the measure operational at the time survey because they had problems with the systems.56
Table 4-18 EDC Boiler Control Gross Savings (First Year of Installed Measure Operation)
Gross
EDC Boiler Controls Demand (kW)
Savings Energy (kWh)
Savings
Therm
Savings
Ex Ante - - 31,756
Ex Post - - 21,937
Gross Realization Rate - - 69%
56 The two sampled properties that did not have the measure operational had switched the units off and unplugged them.
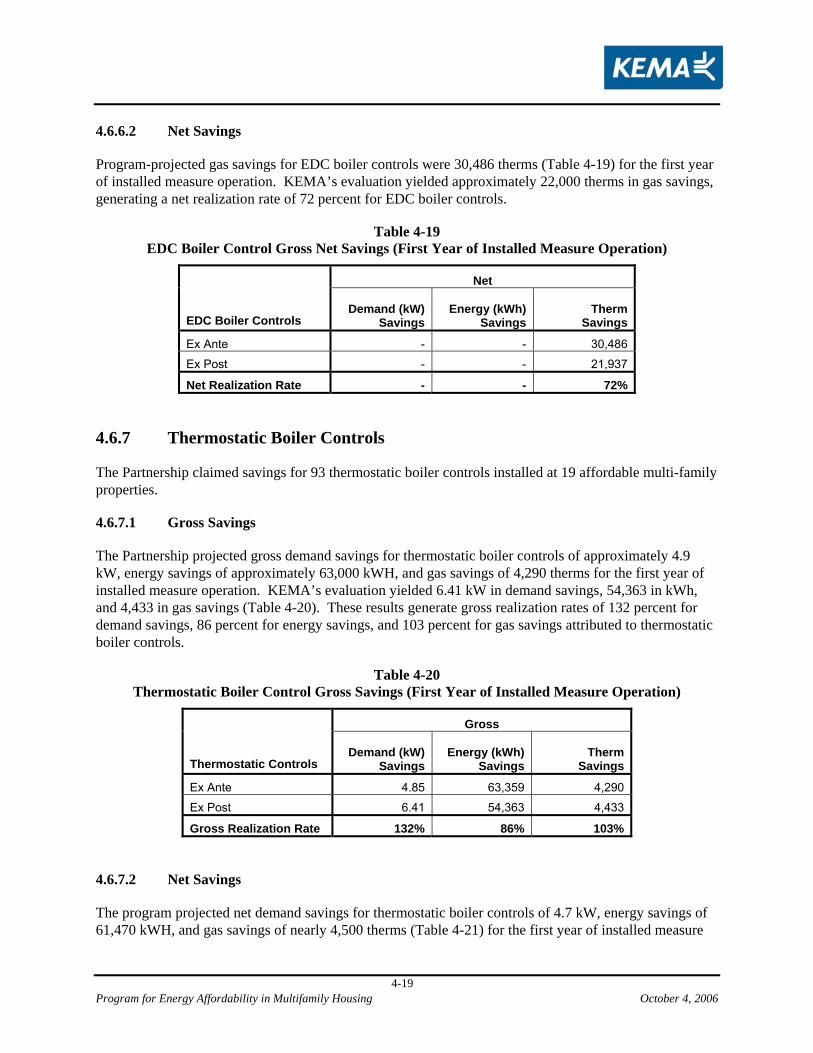
Program for Energy Affordability in Multifamily Housing October 4, 2006
4-19
4.6.6.2 Net Savings
Program-projected gas savings for EDC boiler controls were 30,486 therms (Table 4-19) for the first year of installed measure operation. KEMA’s evaluation yielded approximately 22,000 therms in gas savings, generating a net realization rate of 72 percent for EDC boiler controls.
Table 4-19 EDC Boiler Control Gross Net Savings (First Year of Installed Measure Operation)
Net
EDC Boiler Controls Demand (kW)
Savings Energy (kWh)
Savings
Therm
Savings
Ex Ante - - 30,486
Ex Post - - 21,937
Net Realization Rate - - 72%
4.6.7 Thermostatic Boiler Controls
The Partnership claimed savings for 93 thermostatic boiler controls installed at 19 affordable multi-family properties.
4.6.7.1 Gross Savings
The Partnership projected gross demand savings for thermostatic boiler controls of approximately 4.9 kW, energy savings of approximately 63,000 kWH, and gas savings of 4,290 therms for the first year of installed measure operation. KEMA’s evaluation yielded 6.41 kW in demand savings, 54,363 in kWh, and 4,433 in gas savings (Table 4-20). These results generate gross realization rates of 132 percent for demand savings, 86 percent for energy savings, and 103 percent for gas savings attributed to thermostatic boiler controls.
Table 4-20 Thermostatic Boiler Control Gross Savings (First Year of Installed Measure Operation)
Gross
Thermostatic Controls Demand (kW)
Savings Energy (kWh)
Savings
Therm
Savings
Ex Ante 4.85 63,359 4,290
Ex Post 6.41 54,363 4,433
Gross Realization Rate 132% 86% 103%
4.6.7.2 Net Savings
The program projected net demand savings for thermostatic boiler controls of 4.7 kW, energy savings of 61,470 kWH, and gas savings of nearly 4,500 therms (Table 4-21) for the first year of installed measure
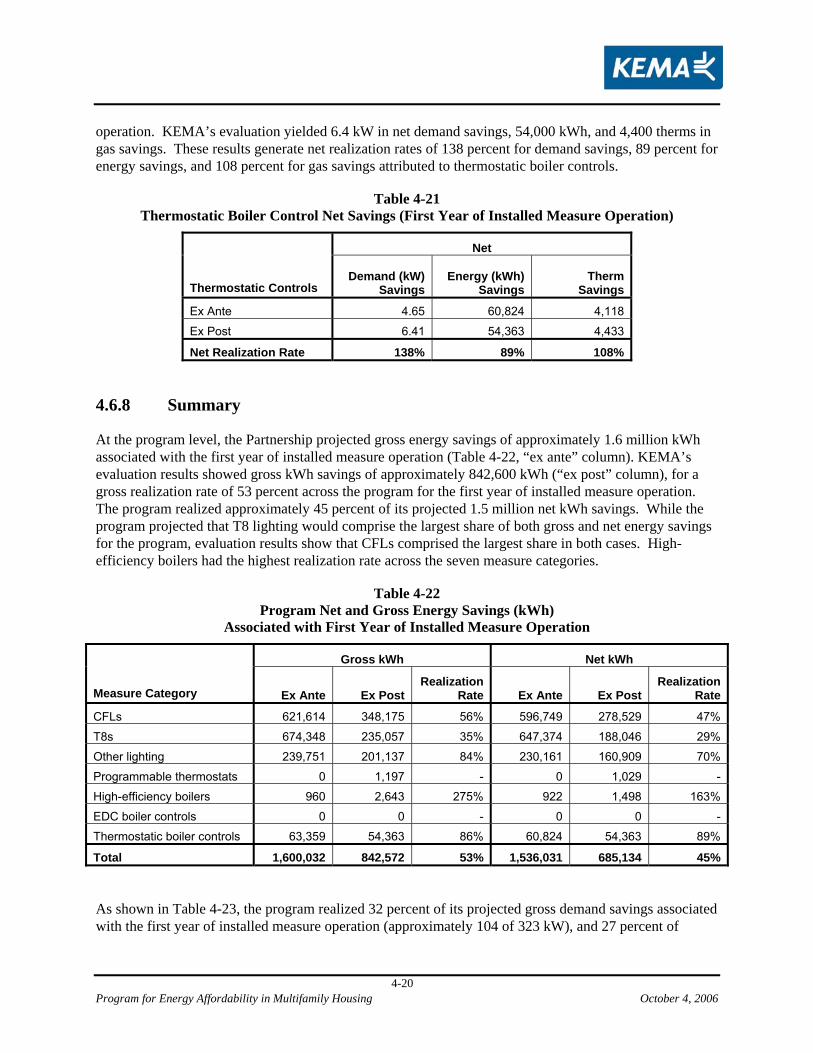
Program for Energy Affordability in Multifamily Housing October 4, 2006
4-20
operation. KEMA’s evaluation yielded 6.4 kW in net demand savings, 54,000 kWh, and 4,400 therms in gas savings. These results generate net realization rates of 138 percent for demand savings, 89 percent for energy savings, and 108 percent for gas savings attributed to thermostatic boiler controls.
Table 4-21 Thermostatic Boiler Control Net Savings (First Year of Installed Measure Operation)
Net
Thermostatic Controls Demand (kW)
Savings Energy (kWh)
Savings
Therm
Savings
Ex Ante 4.65 60,824 4,118
Ex Post 6.41 54,363 4,433
Net Realization Rate 138% 89% 108%
4.6.8 Summary
At the program level, the Partnership projected gross energy savings of approximately 1.6 million kWh associated with the first year of installed measure operation (Table 4-22, “ex ante” column). KEMA’s evaluation results showed gross kWh savings of approximately 842,600 kWh (“ex post” column), for a gross realization rate of 53 percent across the program for the first year of installed measure operation. The program realized approximately 45 percent of its projected 1.5 million net kWh savings. While the program projected that T8 lighting would comprise the largest share of both gross and net energy savings for the program, evaluation results show that CFLs comprised the largest share in both cases. High-efficiency boilers had the highest realization rate across the seven measure categories.
Table 4-22 Program Net and Gross Energy Savings (kWh)
Associated with First Year of Installed Measure Operation
Gross kWh Net kWh
Measure Category Ex Ante Ex Post Realization
Rate Ex Ante Ex Post Realization
Rate
CFLs 621,614 348,175 56% 596,749 278,529 47%
T8s 674,348 235,057 35% 647,374 188,046 29%
Other lighting 239,751 201,137 84% 230,161 160,909 70%
Programmable thermostats 0 1,197 - 0 1,029 -
High-efficiency boilers 960 2,643 275% 922 1,498 163%
EDC boiler controls 0 0 - 0 0 -
Thermostatic boiler controls 63,359 54,363 86% 60,824 54,363 89%
Total 1,600,032 842,572 53% 1,536,031 685,134 45%
As shown in Table 4-23, the program realized 32 percent of its projected gross demand savings associated with the first year of installed measure operation (approximately 104 of 323 kW), and 27 percent of
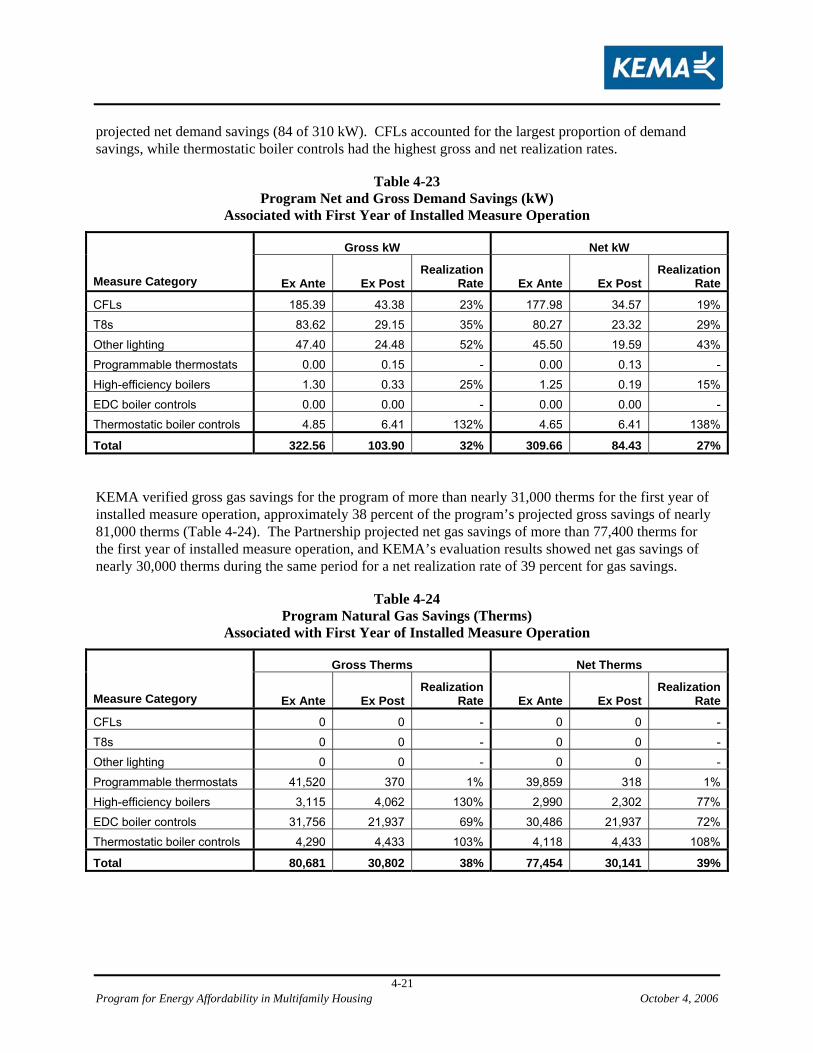
Program for Energy Affordability in Multifamily Housing October 4, 2006
4-21
projected net demand savings (84 of 310 kW). CFLs accounted for the largest proportion of demand savings, while thermostatic boiler controls had the highest gross and net realization rates.
Table 4-23 Program Net and Gross Demand Savings (kW)
Associated with First Year of Installed Measure Operation
Gross kW Net kW
Measure Category Ex Ante Ex Post Realization
Rate Ex Ante Ex Post Realization
Rate
CFLs 185.39 43.38 23% 177.98 34.57 19%
T8s 83.62 29.15 35% 80.27 23.32 29%
Other lighting 47.40 24.48 52% 45.50 19.59 43%
Programmable thermostats 0.00 0.15 - 0.00 0.13 -
High-efficiency boilers 1.30 0.33 25% 1.25 0.19 15%
EDC boiler controls 0.00 0.00 - 0.00 0.00 -
Thermostatic boiler controls 4.85 6.41 132% 4.65 6.41 138%
Total 322.56 103.90 32% 309.66 84.43 27%
KEMA verified gross gas savings for the program of more than nearly 31,000 therms for the first year of installed measure operation, approximately 38 percent of the program’s projected gross savings of nearly 81,000 therms (Table 4-24). The Partnership projected net gas savings of more than 77,400 therms for the first year of installed measure operation, and KEMA’s evaluation results showed net gas savings of nearly 30,000 therms during the same period for a net realization rate of 39 percent for gas savings.
Table 4-24 Program Natural Gas Savings (Therms)
Associated with First Year of Installed Measure Operation
Gross Therms Net Therms
Measure Category Ex Ante Ex Post Realization
Rate Ex Ante Ex Post Realization
Rate
CFLs 0 0 - 0 0 -
T8s 0 0 - 0 0 -
Other lighting 0 0 - 0 0 -
Programmable thermostats 41,520 370 1% 39,859 318 1%
High-efficiency boilers 3,115 4,062 130% 2,990 2,302 77%
EDC boiler controls 31,756 21,937 69% 30,486 21,937 72%Thermostatic boiler controls 4,290 4,433 103% 4,118 4,433 108%
Total 80,681 30,802 38% 77,454 30,141 39%
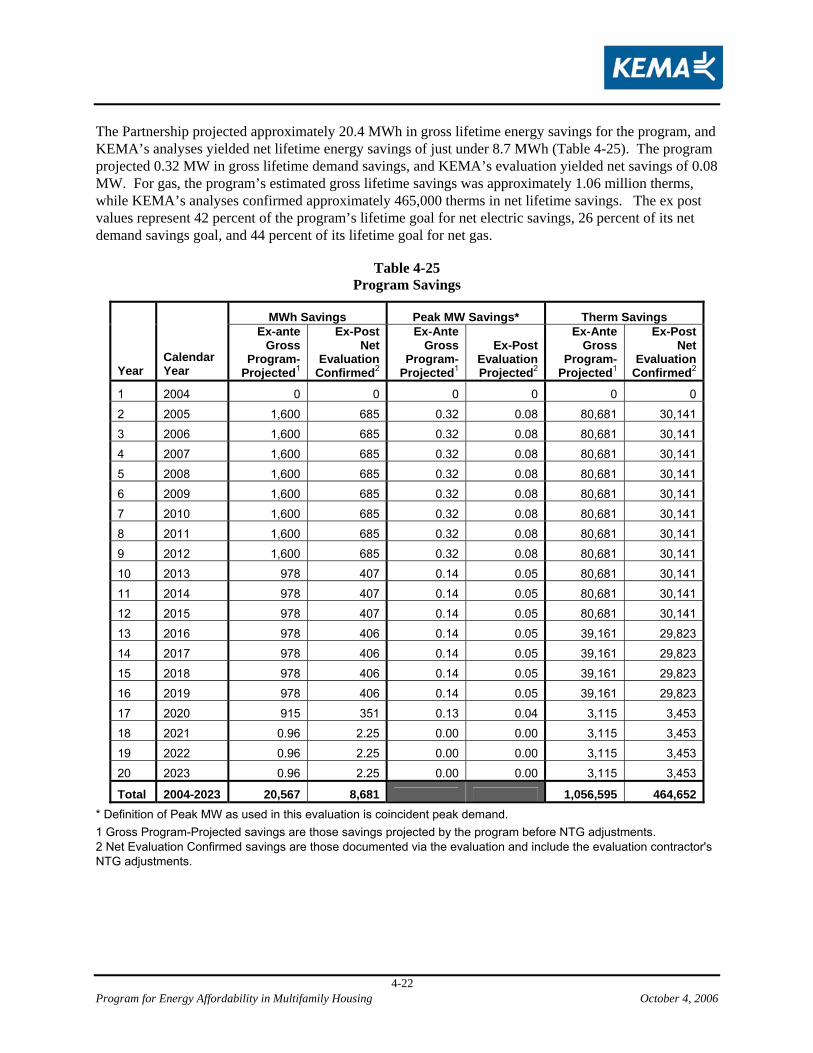
Program for Energy Affordability in Multifamily Housing October 4, 2006
4-22
The Partnership projected approximately 20.4 MWh in gross lifetime energy savings for the program, and KEMA’s analyses yielded net lifetime energy savings of just under 8.7 MWh (Table 4-25). The program projected 0.32 MW in gross lifetime demand savings, and KEMA’s evaluation yielded net savings of 0.08 MW. For gas, the program’s estimated gross lifetime savings was approximately 1.06 million therms, while KEMA’s analyses confirmed approximately 465,000 therms in net lifetime savings. The ex post values represent 42 percent of the program’s lifetime goal for net electric savings, 26 percent of its net demand savings goal, and 44 percent of its lifetime goal for net gas.
Table 4-25 Program Savings
MWh Savings Peak MW Savings* Therm Savings
Year Calendar Year
Ex-ante Gross
Program-Projected1
Ex-Post Net
Evaluation Confirmed2
Ex-Ante Gross
Program-Projected1
Ex-Post Evaluation Projected2
Ex-Ante Gross
Program-Projected1
Ex-Post Net
Evaluation Confirmed2
1 2004 0 0 0 0 0 0
2 2005 1,600 685 0.32 0.08 80,681 30,141
3 2006 1,600 685 0.32 0.08 80,681 30,141
4 2007 1,600 685 0.32 0.08 80,681 30,141
5 2008 1,600 685 0.32 0.08 80,681 30,141
6 2009 1,600 685 0.32 0.08 80,681 30,141
7 2010 1,600 685 0.32 0.08 80,681 30,141
8 2011 1,600 685 0.32 0.08 80,681 30,141
9 2012 1,600 685 0.32 0.08 80,681 30,141
10 2013 978 407 0.14 0.05 80,681 30,141
11 2014 978 407 0.14 0.05 80,681 30,141
12 2015 978 407 0.14 0.05 80,681 30,141
13 2016 978 406 0.14 0.05 39,161 29,823
14 2017 978 406 0.14 0.05 39,161 29,823
15 2018 978 406 0.14 0.05 39,161 29,823
16 2019 978 406 0.14 0.05 39,161 29,823
17 2020 915 351 0.13 0.04 3,115 3,453
18 2021 0.96 2.25 0.00 0.00 3,115 3,453
19 2022 0.96 2.25 0.00 0.00 3,115 3,453
20 2023 0.96 2.25 0.00 0.00 3,115 3,453
Total 2004-2023 20,567 8,681 1,056,595 464,652* Definition of Peak MW as used in this evaluation is coincident peak demand. 1 Gross Program-Projected savings are those savings projected by the program before NTG adjustments. 2 Net Evaluation Confirmed savings are those documented via the evaluation and include the evaluation contractor's NTG adjustments.
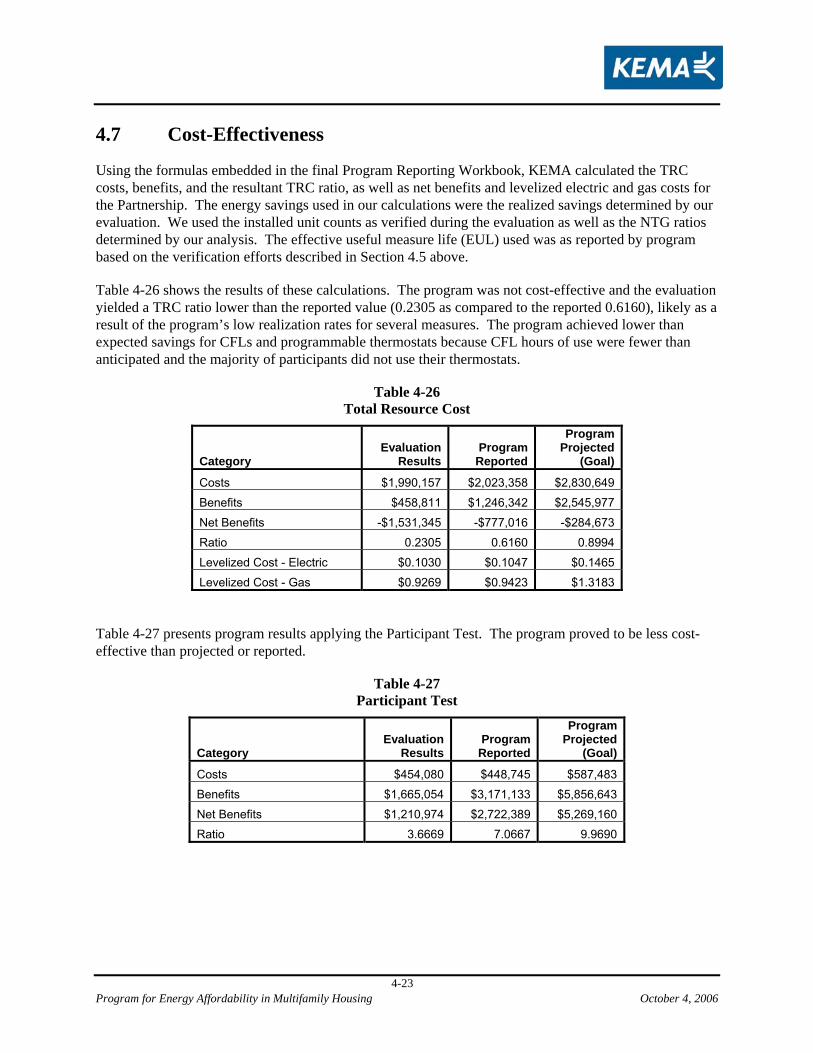
Program for Energy Affordability in Multifamily Housing October 4, 2006
4-23
4.7 Cost-Effectiveness
Using the formulas embedded in the final Program Reporting Workbook, KEMA calculated the TRC costs, benefits, and the resultant TRC ratio, as well as net benefits and levelized electric and gas costs for the Partnership. The energy savings used in our calculations were the realized savings determined by our evaluation. We used the installed unit counts as verified during the evaluation as well as the NTG ratios determined by our analysis. The effective useful measure life (EUL) used was as reported by program based on the verification efforts described in Section 4.5 above.
Table 4-26 shows the results of these calculations. The program was not cost-effective and the evaluation yielded a TRC ratio lower than the reported value (0.2305 as compared to the reported 0.6160), likely as a result of the program’s low realization rates for several measures. The program achieved lower than expected savings for CFLs and programmable thermostats because CFL hours of use were fewer than anticipated and the majority of participants did not use their thermostats.
Table 4-26 Total Resource Cost
Category Evaluation
ResultsProgram
Reported
Program Projected
(Goal)
Costs $1,990,157 $2,023,358 $2,830,649
Benefits $458,811 $1,246,342 $2,545,977
Net Benefits -$1,531,345 -$777,016 -$284,673
Ratio 0.2305 0.6160 0.8994
Levelized Cost - Electric $0.1030 $0.1047 $0.1465
Levelized Cost - Gas $0.9269 $0.9423 $1.3183
Table 4-27 presents program results applying the Participant Test. The program proved to be less cost-effective than projected or reported.
Table 4-27 Participant Test
Category Evaluation
ResultsProgram
Reported
Program Projected
(Goal)
Costs $454,080 $448,745 $587,483
Benefits $1,665,054 $3,171,133 $5,856,643
Net Benefits $1,210,974 $2,722,389 $5,269,160
Ratio 3.6669 7.0667 9.9690
Program for Energy Affordability in Multifamily Housing October 4, 2006
5-1
5. Appendix A Interview Guides
Freeridership Interview Guide Programmable Thermostat Survey Program Staff Interview Guide Program Participant Interview Guide
Program for Energy Affordability in Multifamily Housing October 4, 2006
5-2
5.1 Freeridership Interview Guide
Freeridership Interview Guide for Partnership Participants Q1. If you or your contractor hadn’t received a rebate [or rebates] through Energy Action, how likely would you have been to install <MEASURE TYPE>? Would you say… [READ LIST] Very likely ............................................................................................................. 1 Somewhat likely, or ............................................................................................... 2 Not likely .......................................... [SKIP TO NEXT MEASURE or CLOSE] 3 Don’t know .................................... [SKIP TO NEXT MEASURE or CLOSE] -97 Refused .......................................... [SKIP TO NEXT MEASURE or CLOSE] -98 [IF Q1 = 3 AND RESPONDENT INSTALLED MULTIPLE MEASURE TYPES, ASK, “Would you say the same for the <MEASURE TYPE 2, MEASURE TYPE 3, etc.> you installed?” IF NO, PROCEED THROUGH SURVEY ONCE FOR EACH MEASURE TYPE THEY WOULD HAVE INSTALLED WITHOUT PROGRAM ASSISTANCE.] Q2. Without rebates or installation assistance from the program, how different would the timing have been for the installation of the <MEASURE TYPE>? Would you say… [READ LIST] About the same ..............................................................................[SKIP TO Q4] 1 Sooner, or.......................................................................................[SKIP TO Q4] 2 Later ....................................................................................................................... 3 Don’t know ................................................................................ [SKIP TO Q4] -97 Refused ...................................................................................... [SKIP TO Q4] -98 Q3. About how many months later? [TRY TO GET A NUMBER!] [RECORD NUMBER OF MONTHS] ________ Don’t know .........................................................................................................-97 Refused ...............................................................................................................-98 Q4. How aware were you of <MEASURE TYPE> prior to participating in Energy Action? Would you say… [READ LIST] Aware ......................................................................................................................... 1 Somewhat aware........................................................................................................... 2 Not aware ................................................ [SKIP TO NEXT MEASURE or CLOSE] 3 Don’t know........................................... [SKIP TO NEXT MEASURE or CLOSE] -97 Refused................................................. [SKIP TO NEXT MEASURE or CLOSE] -98 Q5. Prior to participating in Energy Action, had you or your organization ever installed <MEASURE TYPE> in your property [or properties] before? Yes ..................................................... [SKIP TO NEXT MEASURE or CLOSE] 1 No........................................................................................................................... 2 Don’t know .....................................[SKIP TO NEXT MEASURE or CLOSE] -97 Refused ...........................................[SKIP TO NEXT MEASURE or CLOSE] -98
Program for Energy Affordability in Multifamily Housing October 4, 2006
5-3
Q6. Why not? [DO NOT READ LIST; ACCEPT MULTIPLE RESPONSES] Couldn’t afford it ................................................................................................... 1 Could borrow money to purchase it ....................................................................... 2 Wasn’t planned for in the budget cycle ................................................................. 3 Can’t replace equipment before it stops working .................................................. 4 Wasn’t sure the equipment was appropriate .......................................................... 5 Can't find a contractor/don't trust contractors ........................................................ 6 Other reason: _________________________________________ ..................... 99 Don’t know .........................................................................................................-97 Refused ...............................................................................................................-98 CLOSE: Those are all the questions I have for you today. Thank you again for your time.

Program for Energy Affordability in Multifamily Housing October 4, 2006
5-4
5.2 Programmable Thermostat Survey
ICF Associates Partnership for Energy Affordability in Multi-Family Housing
Programmable Thermostat Survey Site Name: Date: Site Address: Staff Initials: Site City: # Units Sampled: Site ID: Survey Instructions: Use the same survey form, one for each site, and record the answers on a corresponding Answer Sheet for later data entry. For buildings with: <5 units: Attempt all 5-20 units: obtain 25% High-rise building: Approach 25%; no more than 20 units Attempt from every other floor Multiple buildings: Approach 25%; no more than 20 units Attempt from every other building, every other floor Does the tenant have a programmable thermostat now? Yes No (reason:____________________________________________) Don’t know (reason:_____________________________________) If #1 = No, Don’t know – terminate survey Record the settings on the thermostat: Table with times, temps, etc. Ask tenant for the settings during the opposite season (heating or cooling)
Program for Energy Affordability in Multifamily Housing October 4, 2006
5-5
Is the programmable thermostat currently programmed? (view tenant’s thermostat) Yes No If #2 = No – terminate survey Is the thermostat programmed with the Energy Star program? Yes No Don’t know Refused Did the tenant have a programmable thermostat before? Yes No Don’t know Refused If #4 = Yes – terminate survey Does the tenant override the thermostat program more than once per week? Yes No Don’t know Refused If #5 = Yes – terminate survey If #3 = Yes – complete Energy Star Behavioral Survey If #3 = No, Don’t know, Refused – complete Non-Energy Star Behavioral Survey
Program for Energy Affordability in Multifamily Housing October 4, 2006
5-6
Energy Star Behavioral Survey H. Heating – D. Daytime settings HD1. Before you got the programmable thermostat, did you use a fairly constant temperature setting during the daytime when you were at home in the winter? Yes No Don’t Know Refused IF HD1 = a. THEN GO TO HD2, ELSE GO TO HD4 HD2. Do you remember the setting? Yes – Record Setting: __________ No Don’t Know Refused IF HD2 = a. THEN GO TO HN1, ELSE GO TO HD3 HD3. Was it set higher or lower than 68 degrees (current setting)? A lot higher A bit higher About the same as it is now A bit lower A lot lower Don’t know Refused IF HD3 = a. or b., CONFIRM: “So your house was warmer than it is now during the winter and the heat ran more often?” IF HD3 = c., CONFIRM: “So your house was about the same temperature then as it is now?” IF HD3 = d. or e., CONFIRM: “So your house was colder than it is now during the winter and the heat ran less often?” IF HD3 WAS ANSWERED, GO TO HN1 HD4. Was your house typically heated the same, less, or more often than it is now? Much less heat CONFIRM: “So it was a lot colder?” A bit less heat CONFIRM: “So it was a little colder?” The same CONFIRM: “So it was no warmer or colder?” A bit more heat CONFIRM: “So it was a little warmer?” A lot more heat CONFIRM: “So it was a lot warmer?” Don’t know Refused

Program for Energy Affordability in Multifamily Housing October 4, 2006
5-7
H. Heating – N. Nighttime settings HN1. Before you got the programmable thermostat, did you use a fairly constant temperature setting (or turn it off) during the night when you went to bed in the winter? Yes No Don’t Know Refused IF HN1 = a. THEN GO TO HN2, ELSE GO TO HN4 HN2. Do you remember the setting? Yes – Record Setting: __________ No Don’t Know Refused IF HN2 = a. THEN GO TO HU1, ELSE GO TO HN3 HN3. Was it set higher than 55 degrees, so the heat was on during the night? A lot higher A bit higher About the same as 55 Don’t know Refused IF HN3 WAS ANSWERED, GO TO HU1 HN4. Did you run the heat during the nighttime always, most of the time, sometimes, or hardly ever? Always Most of the time Sometimes Hardly ever Don’t know Refused HN5. Do you remember what the setting was when you used the heat during the nighttime? Yes – Record Setting: __________ Don’t Don’t Know Refused IF HN5 = a. THEN GO TO HU1, ELSE GO TO HN6 HN6. Was it set higher than 55 degrees, so the heat was on during the night? A lot higher A bit higher
Program for Energy Affordability in Multifamily Housing October 4, 2006
5-8
About the same as 55 Don’t know Refused H. Heating – U. Unoccupied settings HU1. Before you got the programmable thermostat, did you keep your heater on while you were away? Always Most of the time Sometimes Hardly ever Never Don’t know Refused HU2. Now that you have your programmable thermostat, do you keep your heater on while you are away? Always Most of the time Sometimes Hardly ever Never Don’t know Refused C. Cooling – D. Daytime settings CD1. Before you got the programmable thermostat, did you use a fairly constant temperature setting during the daytime when you were at home in the summer? Yes No Don’t Know Refused IF CD1 = a. THEN GO TO CD2, ELSE GO TO CD4 CD2. Do you remember the setting? Yes – Record Setting: __________ No Don’t Know Refused IF CD2 = a. THEN GO TO CN1, ELSE GO TO CD3

Program for Energy Affordability in Multifamily Housing October 4, 2006
5-9
CD3. Was it set higher or lower than 78 degrees (current setting)? A lot higher A bit higher About the same as it is now A bit lower A lot lower Don’t know Refused IF CD3 = a. or b., CONFIRM: “So your house was warmer than it is now during the summer and the air conditioner ran less often?” IF CD3 = c., CONFIRM: “So your house was about the same temperature then as it is now?” IF CD3 = d. or e., CONFIRM: “So your house was colder than it is now during the summer and the air conditioner ran more often?” IF CD3 WAS ANSWERED, GO TO CN1 CD4. Was your house typically cooled the same, less, or more often than it is now? Much less cooling CONFIRM: “So it was a lot warmer?” A bit less cooling CONFIRM: “So it was a little warmer?” The same CONFIRM: “So it was no warmer or cooler?” A bit more cooling CONFIRM: “So it was a little cooler?” A lot more cooling CONFIRM: “So it was a lot colder?” Don’t know Refused C. Cooling – N. Nighttime settings CN1. Before you got the programmable thermostat, did you use a fairly constant temperature setting (or turn it off) during the night when you went to bed in the summer? Yes No Don’t Know Refused IF CN1 = a. THEN GO TO CN2, ELSE GO TO CN4 CN2. Do you remember the setting? Yes – Record Setting: __________ No Don’t Know Refused IF CN2 = a. THEN GO TO CU1, ELSE GO TO CN3

Program for Energy Affordability in Multifamily Housing October 4, 2006
5-10
CN3. Was it set lower than 90 degrees, so the air conditioner was on during the night? A lot lower A bit lower About the same as 90 Don’t know Refused IF CN3 WAS ANSWERED, GO TO CU1 CN4. Did you run the air conditioner during the nighttime always, most of the time, sometimes, or hardly ever? Always Most of the time Sometimes Hardly ever Don’t know Refused CN5. Do you remember what the setting was when you used the air conditioner during the nighttime? Yes – Record Setting: __________ Don’t Don’t Know Refused IF CN5 = a. THEN GO TO CU1, ELSE GO TO CN6 CN6. Was it set lower than 90 degrees, so the air conditioner was on during the night? A lot lower A bit lower About the same as 90 Don’t know Refused C. Cooling – U. Unoccupied settings CU1. Before you got the programmable thermostat, did you keep your air conditioner on while you were away? Always Most of the time Sometimes Hardly ever Never Don’t know Refused
Program for Energy Affordability in Multifamily Housing October 4, 2006
5-11
CU2. Now that you have your programmable thermostat, do you keep your air conditioner on while you are away? Always Most of the time Sometimes Hardly ever Never Don’t know Refused Non-Energy Star Behavioral Survey Who programmed the settings for your thermostat? Tenant Contractor Property manager Other: __________________________ Don’t know Refused H. Heating – D. Daytime settings HD1. Before you got the programmable thermostat, did you use a fairly constant temperature setting during the daytime when you were at home in the winter? Yes No Don’t Know Refused IF HD1 = a. THEN GO TO HD2, ELSE GO TO HD4 HD2. Do you remember the setting? Yes – Record Setting: __________ No Don’t Know Refused IF HD2 = a. THEN GO TO HN1, ELSE GO TO HD3 HD3. Was it set higher or lower than the current setting? A lot higher A bit higher About the same as it is now A bit lower A lot lower Don’t know Refused
Program for Energy Affordability in Multifamily Housing October 4, 2006
5-12
IF HD3 = a. or b., CONFIRM: “So your house was warmer than it is now during the winter and the heat ran more often?” IF HD3 = c., CONFIRM: “So your house was about the same temperature then as it is now?” IF HD3 = d. or e., CONFIRM: “So your house was colder than it is now during the winter and the heat ran less often?” IF HD3 WAS ANSWERED, GO TO HN1 HD4. Was your house typically heated the same, less, or more often than it is now? Much less heat CONFIRM: “So it was a lot colder?” A bit less heat CONFIRM: “So it was a little colder?” The same CONFIRM: “So it was no warmer or colder?” A bit more heat CONFIRM: “So it was a little warmer?” A lot more heat CONFIRM: “So it was a lot warmer?” Don’t know Refused H. Heating – N. Nighttime settings HN1. Before you got the programmable thermostat, did you use a fairly constant temperature setting (or turn it off) during the night when you went to bed in the winter? Yes No Don’t Know Refused IF HN1 = a. THEN GO TO HN2, ELSE GO TO HN4 HN2. Do you remember the setting? Yes – Record Setting: __________ No Don’t Know Refused IF HN2 = a. THEN GO TO HU1, ELSE GO TO HN3 HN3. Was it set higher or lower than the current setting? A lot higher A bit higher About the same as it is now A bit lower A lot lower Don’t know Refused IF HN3 = a. or b., CONFIRM: “So your house was warmer at night than it is now during the winter and the heat ran more often?”
Program for Energy Affordability in Multifamily Housing October 4, 2006
5-13
IF HN3 = c., CONFIRM: “So your house was about the same temperature at night then as it is now?” IF HN3 = d. or e., CONFIRM: “So your house was colder at night than it is now during the winter and the heat ran less often?” IF HN3 WAS ANSWERED, GO TO HU1 HN4. Did you run the heat during the nighttime always, most of the time, sometimes, or hardly ever? Always Most of the time Sometimes Hardly ever Don’t know Refused HN5. Do you remember what the setting was when you used the heat during the nighttime? Yes – Record Setting: __________ No Don’t Know Refused IF HN5 = a. THEN GO TO HU1, ELSE GO TO HN6 HN6. Was it set higher than 55 degrees, so the heat was on during the night? A lot higher A bit higher About the same as 55 Don’t know Refused H. Heating – U. Unoccupied settings HU1. Before you got the programmable thermostat, did you keep your heater on while you were away? Always Most of the time Sometimes Hardly ever Never Don’t know Refused
Program for Energy Affordability in Multifamily Housing October 4, 2006
5-14
HU2. Now that you have your programmable thermostat, do you keep your heater on while you are away? Always Most of the time Sometimes Hardly ever Never Don’t know Refused C. Cooling – D. Daytime settings CD1. Before you got the programmable thermostat, did you use a fairly constant temperature setting during the daytime when you were at home in the summer? Yes No Don’t Know Refused IF CD1 = a. THEN GO TO CD2, ELSE GO TO CD4 CD2. Do you remember the setting? Yes – Record Setting: __________ No Don’t Know Refused IF CD2 = a. THEN GO TO CN1, ELSE GO TO CD3 CD3. Was it set higher or lower than the current setting? A lot higher A bit higher About the same as it is now A bit lower A lot lower Don’t know Refused IF CD3 = a. or b., CONFIRM: “So your house was warmer than it is now during the summer and the air conditioner ran less often?” IF CD3 = c., CONFIRM: “So your house was about the same temperature then as it is now?” IF CD3 = d. or e., CONFIRM: “So your house was colder than it is now during the summer and the air conditioner ran more often?” IF CD3 WAS ANSWERED, GO TO CN1
Program for Energy Affordability in Multifamily Housing October 4, 2006
5-15
CD4. Was your house typically cooled the same, less, or more often than it is now? Much less cooling CONFIRM: “So it was a lot warmer?” A bit less cooling CONFIRM: “So it was a little warmer?” The same CONFIRM: “So it was no warmer or cooler?” A bit more cooling CONFIRM: “So it was a little cooler?” A lot more cooling CONFIRM: “So it was a lot colder?” Don’t know Refused C. Cooling – N. Nighttime settings CN1. Before you got the programmable thermostat, did you use a fairly constant temperature setting (or turn it off) during the night when you went to bed in the summer? Yes No Don’t Know Refused IF CN1 = a. THEN GO TO CN2, ELSE GO TO CN4 CN2. Do you remember the setting? Yes – Record Setting: __________ No Don’t Know Refused IF CN2 = a. THEN GO TO CU1, ELSE GO TO CN3 CN3. Was it set lower than the current setting? A lot lower CONFIRM: “So it was a lot colder?” A bit lower CONFIRM: “So it was a little cooler?” About the same as now CONFIRM: “So it was no warmer or cooler?” A bit higher CONFIRM: “So it was a little warmer?” A lot higher CONFIRM: “So it was a lot warmer?” Don’t know Refused IF CN3 WAS ANSWERED, GO TO CU1 CN4. Did you run the air conditioner during the nighttime always, most of the time, sometimes, or hardly ever? Always Most of the time Sometimes Hardly ever Don’t know Refused
Program for Energy Affordability in Multifamily Housing October 4, 2006
5-16
CN5. Do you remember what the setting was when you used the air conditioner during the nighttime? Yes – Record Setting: __________ Don’t Don’t Know Refused IF CN5 = a. THEN GO TO CU1, ELSE GO TO CN6 CN6. Was it set lower than 90 degrees, so the air conditioner was on during the night? A lot lower A bit lower About the same as 90 Don’t know Refused C. Cooling – U. Unoccupied settings CU1. Before you got the programmable thermostat, did you keep your air conditioner on while you were away? Always Most of the time Sometimes Hardly ever Never Don’t know Refused CU2. Now that you have your programmable thermostat, do you keep your air conditioner on while you are away? Always Most of the time Sometimes Hardly ever Never Don’t know Refused

Program for Energy Affordability in Multifamily Housing October 4, 2006
5-17
5.3 Program Staff Interview Guide
2004-2005 Partnership for Energy Affordability in Multi-Family Housing Evaluation: Phase 2 ICF Program Staff Interview December 21, 2005 Program Accomplishments and Challenges
• Discuss the program’s accomplishments with respect to its objective to capture energy savings identified in the 47 properties recruited in 2003
o What strategies were successful in making progress towards this objective? What challenges arose? What strategies, if any, were developed to overcome these challenges?
• Discuss the program’s accomplishments with respect to its objective to capture energy savings in additional properties in the Central Valley
o What strategies were successful in making progress towards this objective? What challenges arose? What strategies, if any, were developed to overcome these challenges?
• Discuss the program’s accomplishments with respect to its objective to enhance the equity of the State’s energy efficiency portfolio by ensuring the affordable housing community has efficient access to resources
o What strategies were successful in making progress towards this objective? What challenges arose? What strategies, if any, were developed to overcome these challenges?
• Discuss the program’s accomplishments with respect to its objective to strengthen the technical infrastructure for energy efficiency investment in this sector through providing technical training, diagnostic assistance, and peer-to-peer exchange
o What strategies were successful in making progress towards this objective? What challenges arose? What strategies, if any, were developed to overcome these challenges?
• In general, what are the program’s key strengths in serving the targeted sector? What are the program’s key weaknesses (if any)?
Program Processes
• Administration and Partnership Coordination (e.g., Partnership organization and staff, tracking and communications within the Partnership, delegation of roles and assignments within the Partnership): Thinking about the program’s administrative structure, were there any characteristics of that structure that were particularly effective in helping meet the program’s objectives? Were there any characteristics that hindered the program in meeting its objectives?
Program for Energy Affordability in Multifamily Housing October 4, 2006
5-18
• External Coordination (e.g., with other programs and agencies serving the target market): Was the program well coordinated among other programs that target the same market? Did this level of coordination help to meet the program’s objectives? Could coordination between programs be improved? Do programs overlap at all, and if so, does the overlap in services cause confusion? Do gaps exist that could be met by existing (or new) programs?
• Regulatory Oversight (e.g., reporting and accountability to the utility and CPUC): Was there an effective balance between the program’s accountability to ratepayers (via PG&E and the CPUC) and its ability to focus on program implementation to meet its goals? Could any improvements be made to the regulatory reporting function that would improve the program’s ability to cost-effectively serve its target market, while maintaining accountability?
Program Services
• Incentives:
o The 04-05 program design included a tailored incentive structure to help address the unique needs of the affordable MF housing market (e.g., longer reservation period, no cost financing, hands-on customer service and customized rebates). Do you believe that this structure was effective in helping the target market make energy efficient investments?
o Is this structure the best way to meet the needs of the target market? Should other services be added or existing services modified?
o What other barriers (besides those addressed by the tailored incentive structure) exist among the target market to investing in energy efficiency? How might future program services be designed to meet those additional barriers?
• Engineering services (audits, site surveys and on-call diagnostics):
o From 02-03 to 04-05, the program changed its focus to offering more streamlined building surveys because it was assumed that the more detailed assessments were not often needed. Were those assumptions valid for the properties targeted in 04-05?
o What value did audit recipients gain from engineering services?
o Approximately what fraction actually followed audit recommendations? What fraction used program rebates to implement audit recommendations?
o How influential were the engineering services in selling the program’s rebates?
o Do you see the program’s engineering service offerings as a continued useful tool for the target market? Would you suggest any changes to the services? Is it imperative that
Program for Energy Affordability in Multifamily Housing October 4, 2006
5-19
rebates be offered in conjunction with engineering services so that recommendations are followed?
• Training and support services (property manager training, O&M training, procurement assistance):
o The procurement assistance was a new service in 04-05. How was this service received by program participants? Is this service something you think should be part of an energy efficiency program targeting this sector? At what rate did properties actually follow through with orders where they received this type of assistance?
o The program combined the peer forum with the property manager training in 04-05, how was that combined service received?
o What value did training participants gain from attending training?
o Do you have any indication that measures discussed during training were actually implemented?
o How, if at all, did the trainings link to selling program rebates? If they were linked, how successful were the trainings in selling the program’s rebates?
o What types of barriers does the target market face in changing their O&M practices? How successful was the program’s training services in addressing those barriers?
o Do you see the program’s training service offerings as a continued useful tool for the target market? Would you suggest any changes to the services?

Program for Energy Affordability in Multifamily Housing October 4, 2006
5-20
5.4 Program Participant Interview Guide
Evaluation of the Partnership for Energy Affordability in Multi-Family Housing Participant Interview Guide
Organization Name _____________________________________________________ Property Name(s) _____________________________________________________ Contact Name _____________________________________________________ Phone Number (s) _____________________________________________________ Interview Number _____________________________________________________ (newrand)
Program Component
Rebate? (Y/N) Audit
Technical Assistance
(On-Call Diagnostic)
Detailed Survey
Energy Action
Academy Training
O&M Training
Rec’d/Participated in…
Participation Date
Interview Date/Time: _______________________________
Interviewer: _______________________________
Introduction:
Hello, my name is __________________ and I am calling from KEMA. May I speak with (CONTACT NAME)? IF CONTACT IS NOT AVAILABLE, ASK FOR BEST TIME TO CALL BACK.
CALL BACK DATE/TIME: __________________________ We are evaluating the Partnership for Energy Affordability in Multi-Family Housing, also known as “the
Energy Action Program”, and according to our records you participated in this program [describe specific program elements and dates of participation]. We would like to interview you about your experience to get your feedback on its effectiveness and learn about ways in which the program could be improved. Depending on your answers, the interview should take about 30 minutes. All responses you provide will remain strictly confidential.
This study is being conducted on behalf of the program’s sponsors and the California Public Utilities Commission.

Program for Energy Affordability in Multifamily Housing October 4, 2006
5-21
CONTACT NAME IF NEEDED TO VERIFY STUDY: Clare Bressani-Tanko, 415-397-7322 x28 Background:
1. What is your role within your organization? [Are you a property owner, manager, etc.?] 2. How many complexes or buildings do you [or does your organization] own or manage? How many
units in total? 3. Are all of the multi-family properties you own affordable properties? [If not, what percent of the total
is comprised of affordable properties?] 4. Please describe the services you obtained through the Energy Action Program. [Confirm our records.] Marketing/Outreach:
5. How did you learn about program and the services offered? 6. Did you tell any other colleagues about the program? Awareness & Past Activities:
7. When purchasing or replacing energy-using equipment in your property/ies, what sources of information do you use to help you make decisions about what equipment to purchase and install?
8. Prior to participating in Energy Action, had you or your organization made any energy-efficient
improvements at your property/ies without receiving rebates? a. If yes: Can you describe those improvements? b. If no: Why not? [Probe for non-financial barriers. Did the EA program address any of
these concerns/barriers?] 9. Prior to participating in Energy Action, were you aware of rebates for energy-efficient equipment?
a. If yes: Were you aware of rebates specifically targeting affordable multi-family properties?
10. Prior to participating in Energy Action, had you or your organization made any energy-efficient
improvements at your properties with rebate assistance? a. If yes: Which programs? For what types of equipment did you receive rebates? b. If no (but aware): Why not? [Probe for non-financial barriers. Did the EA program
address any of these concerns/barriers?] 11. Since your participation in Energy Action, have you heard about any additional energy-efficiency
programs targeting the affordable multi-family housing market? a. If yes: Did you participate in any of these programs? [If yes: Describe.]
Satisfaction:

Program for Energy Affordability in Multifamily Housing October 4, 2006
5-22
12. Why did you decide to participate in the Energy Action program? [What did you hope to gain from participating?]
13. Were you able to obtain all of the services you wanted from the program? 14. How knowledgeable did you find the program staff (specific to services they received, e.g., trainers,
auditors, etc.)? 15. Was the program staff responsive to your needs? [Probe: Indicate which program staff, e.g., which of
the partners.]In general, how satisfied are you with your participation in the Energy Action program? [Use a scale of 1 to 5 where 5 means “Very Satisfied” and 1 means “Not at all Satisfied.”]
Rebates:
17. Did you obtain any rebates through Energy Action? IF YES:
a. Did you experience any difficulties with trying to obtain rebates? b. How could these services be improved going forward?
IF NO: c. [What factors prevented you from making the suggested upgrades with the rebates
offered through Energy Action? [Probe for non-financial reasons.] d. Could the program have done anything to enable you to move forward with the
upgrades/overcome these barriers/address these concerns? [If yes, explain.] Training participants: [TRAINING TYPE (circle one): EAA or O&M or BOTH]
18. How effective was the training in helping you to better manage your building’s energy usage? [Probe: was most of the information you learned new to you, or more of a reminder of what you already knew?]
19. Did you get the information you expected when you attended the training? [What was missing?
Extra?] 20. Did you make any changes in response to the training? [If yes, explain.] 21. Were there any barriers to making changes? 22. How could the training be improved going forward? [Probe: Was the level of technical information
appropriate/adequate? Was anything missing? Anything unnecessary?] 23. [If received rebates] Did you participate in the training workshop before or after you learned about
the rebates available through Energy Action? [Did you learn about the rebates during the training workshop?]

Program for Energy Affordability in Multifamily Housing October 4, 2006
5-23
Technical assistance:
24. What type of assistance were you looking for? 25. Did you receive adequate assistance? [Did you get the information you needed/expected?] 26. What did you ultimately do with the information you received? [Did you make any changes/apply for
financial assistance?] 27. Were there any barriers to making the recommended changes in your facility? [Probe for non-
financial barriers.] 28. How could the technical assistance service be improved going forward? [Probe: Was the level of
technical information appropriate/adequate? Was anything missing? Anything unnecessary?] Detailed Survey:
29. Did you request a detailed survey, or was the service suggested to you? [By whom? EA staff, etc.?] 30. Did you receive all of the information and services you expected from the detailed survey? [If no,
what was missing?] 31. What did you ultimately do with the information you received? [Did you make any changes/apply for
financial assistance?] 32. Were there any barriers to making the recommended changes in your facility? [Probe for barriers
beyond financial.] 33. How could the detailed surveys be improved going forward? [Probe: Was the level of technical
information appropriate/adequate? Was anything missing? Anything unnecessary?] Audit participants:
34. How useful was the audit and audit report you received? 35. Had you heard about the technologies/measures recommended in the audit report prior to receiving it?
a. If Yes: Why hadn’t you installed those measures before participating in EA? [Probe for barriers beyond financial.]
36. What did you ultimately do with the information you received from the audit? [Did you make any
changes/apply for financial assistance?] 37. Were there barriers to making changes in your facility? [Probe for barriers beyond financial.] 38. How could the audits be improved going forward? [Probe: Was the level of technical information
appropriate/adequate? Was anything missing? Anything unnecessary?]

Program for Energy Affordability in Multifamily Housing October 4, 2006
5-24
Referrals to Other Programs:
39. Did the Energy Action program refer you to any other programs, such as those that offer incentives or rebates for energy-efficient equipment? IF YES:
a. Which ones? b. Did you obtain any rebates or assistance through these other programs? [If yes, which
program and services?] c. How satisfied were you with your experience with the other program(s)? d. Did you experience any difficulties with trying to participate in the program(s)/obtain
rebate(s) through the other program(s)? e. How could the referral services be improved going forward?
Additional Barriers:
40. Do there exist any other barriers to adopting energy efficiency behaviors and measures in your facility? [Probe for barriers beyond financial.]
41. How did the program address these [non-financial] barriers? 42. Were there any barriers the program did not address? [If yes, how might it address these the future?] 43. Are there any changes that Energy Action could make to serve you better? [If yes, elaborate.] Future Activities:
44. [If received rebate(s):] Regarding the equipment you installed with rebates through Energy Action, had you or your organization considered having the equipment installed before learning that rebates were available from Energy Action?
45. If you need to purchase or replace energy-using equipment in your properties in the future, will you
consider energy-efficient equipment? [Even in the absence of rebates?] 46. Would you recommend the program to property managers or owners at other affordable multi-family
properties? [Why/why not?] 47. Do you have any other comments or suggestions regarding the Energy Action program?
Program for Energy Affordability in Multifamily Housing October 4, 2006
6-1
6. Appendix B Interim Evaluation Report
Program for Energy Affordability in Multifamily Housing October 4, 2006
6-2
Memorandum To: Amy McGuire, ICF
Val Jensen, ICF
Date: November 21, 2005
From: Tami Rasmussen, KEMA Inc.
Copy: Kathleen Gaffney, KEMA Inc.
Subject: Interim evaluation results for the Partnership for Energy Affordability in Multi-Family Housing (Energy Action)
The purpose of this memorandum is to provide interim evaluation results for the Partnership for Energy Affordability in Multi-Family Housing (Energy Action Program) being implemented in 2004-2005 by the ICF Associates (ICF) under the auspices of the California Public Utilities Commission (CPUC). Background The 2004-2005 Energy Action Program builds upon the activities accomplished by the 2002-2003 program, which was information-only. The 2004-2005 program offers many of the same services that were part of the 2002-2003 program, but includes a wide array of financial incentives and financing options that have been custom-tailored to the target market. The objectives of the program are to:
• Capture the substantial electricity and natural gas savings identified in energy audits of the 47 properties the program recruited in 2003 and in additional properties in the Bay Area and the Central Valley;
• Enhance the equity of the State’s energy efficiency portfolio by ensuring that the affordable multi-family housing community has efficient access to resources; and
• Continue to strengthen the technical infrastructure for energy efficiency investment in the affordable multi-family housing market through a combination of technical training, diagnostic assistance, and peer-to-peer exchange.
Tables 1 and 2 below show the program’s unit and energy savings goals for 2004-2005. Also shown are the program’s accomplishments through September 2005. Over half the program’s compact fluorescent lamp unit goals have been met, with nearly one-third of energy savings met for this measure. The program has installed between 5 and 10 percent of its expected light fixtures and exit signs. The program has met less than 1 percent of its custom measure unit and energy savings goals, and 0 percent of its water heater, HVAC and window goals.
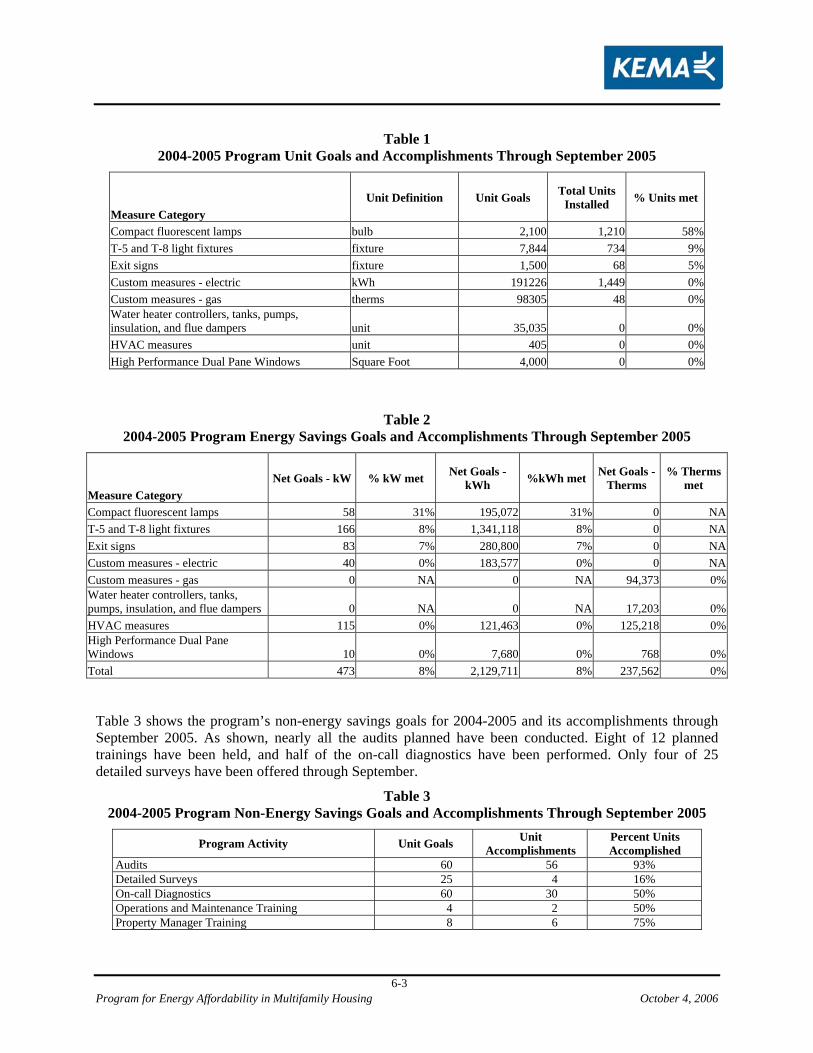
Program for Energy Affordability in Multifamily Housing October 4, 2006
6-3
Table 1 2004-2005 Program Unit Goals and Accomplishments Through September 2005
Measure Category Unit Definition Unit Goals Total Units
Installed % Units met
Compact fluorescent lamps bulb 2,100 1,210 58%T-5 and T-8 light fixtures fixture 7,844 734 9%Exit signs fixture 1,500 68 5%Custom measures - electric kWh 191226 1,449 0%Custom measures - gas therms 98305 48 0%Water heater controllers, tanks, pumps, insulation, and flue dampers unit 35,035 0 0%HVAC measures unit 405 0 0%High Performance Dual Pane Windows Square Foot 4,000 0 0%
Table 2 2004-2005 Program Energy Savings Goals and Accomplishments Through September 2005
Measure Category Net Goals - kW % kW met Net Goals -
kWh %kWh met Net Goals - Therms
% Therms met
Compact fluorescent lamps 58 31% 195,072 31% 0 NAT-5 and T-8 light fixtures 166 8% 1,341,118 8% 0 NAExit signs 83 7% 280,800 7% 0 NACustom measures - electric 40 0% 183,577 0% 0 NACustom measures - gas 0 NA 0 NA 94,373 0%Water heater controllers, tanks, pumps, insulation, and flue dampers 0 NA 0 NA 17,203 0%HVAC measures 115 0% 121,463 0% 125,218 0%High Performance Dual Pane Windows 10 0% 7,680 0% 768 0%Total 473 8% 2,129,711 8% 237,562 0%
Table 3 shows the program’s non-energy savings goals for 2004-2005 and its accomplishments through September 2005. As shown, nearly all the audits planned have been conducted. Eight of 12 planned trainings have been held, and half of the on-call diagnostics have been performed. Only four of 25 detailed surveys have been offered through September.
Table 3 2004-2005 Program Non-Energy Savings Goals and Accomplishments Through September 2005
Program Activity Unit Goals Unit Accomplishments
Percent Units Accomplished
Audits 60 56 93% Detailed Surveys 25 4 16% On-call Diagnostics 60 30 50% Operations and Maintenance Training 4 2 50% Property Manager Training 8 6 75%
Program for Energy Affordability in Multifamily Housing October 4, 2006
6-4
Interim Evaluation Methods The interim evaluation methods included both process and impact evaluation. Process evaluation activities included in-depth interviews with program staff. Impact activities included on-site visits to 2 properties that received rebates from the program. The evaluation research plan called for the interim report to be delivered in early 2005 in order to provide critical feedback to the program. However, by early 2005, very little rebate program activity had occurred.57 As such, the interim research was delayed until late summer in order to have a larger population from which to draw an impact sample. By September 1, 2005, rebates had been paid to 9 properties. At this point, we drew a sample of 4 properties to inspect. Since CFLs and T8s dominated the program savings, we focused on these 2 measures. From these 4 properties, we successfully recruited 2 properties to visit and conduct impact evaluation research. Note that boiler control measures also accounted for a significant amount of claimed program savings. This is a custom measure that ICF has collected some savings data from the vendor and will supplement that with a billing analysis. We analyzed the vendor-supplied calculations and found those to be accurate. We plan to obtain ICF’s billing analysis results and verify them and/or conduct additional analyses to evaluate savings claims for boiler control measures. These results will be provided in the final evaluation report. Process Evaluation Results Interim process evaluation activities consisted of in-depth interviews with both ICF and Bay Area Local Initiatives Support Corporation (LISC) program staff. Rebate recipient interviews had been planned for the interim report, but due to low rebate participation, these interviews have been shifted to the end of the year. (A total of 20 interviews are planned.) Key results from the program staff interviews are provided below. These results will be combined with a second round of program staff interviews and participant surveys to support a more complete process assessment in the final evaluation report.
• Program administration and communication is effective and has improved from 2002-2003. The partners have solidified their roles and as such coordination among the partnership has improved. Non-profit Housing Association of Northern California is somewhat underutilized, as was the case in 2002-2003. It is challenging to engage that particular organization to directly support the program, since they are a policy/advocacy agency. Their efforts might be more effective in advocating on behalf of the program’s target market by contributing to the utility Program Advisory Group (PAG) process. However, it is not appropriate to use program funds for such support.
57 The program’s energy savings claims are associated with its rebates for energy efficient equipment. The program also offers other services such as energy audits and training, however, no energy savings are claimed for these activities. The focus of this evaluation is predominantly on the energy savings portion of the program, per CPUC direction during the evaluation planning phase.
Program for Energy Affordability in Multifamily Housing October 4, 2006
6-5
The Department of Housing and Urban Development (HUD) is not currently a partner, which the program might consider including. HUD approves large capital improvements for public housing projects, and in this role, they could help the program sell energy efficiency capital improvements.
• Program tracking and reporting has improved from 2002-2003. The program has streamlined its tracking and reporting functions. The level of detail required for the monthly regulatory reporting process is still cumbersome, but it has become part of “business as usual”.
• The program has continued to rely on partner relationships to gain access to its target market. The circuit rider, from LISC, also continues to play a key role as the face of the program. To sell the program’s rebates, LISC relied on the 47 properties identified in 2002-2003 as having energy savings opportunities. The program modified its eligibility requirements initially to increase rebate demand (dropped the lighting cap, memorandum of understanding requirement, and allowed private properties). Rebate levels were also adjusted to mirror the levels offered by the Statewide utility program.
• The program added the California Coalition for Rural Housing to attempt to recruit properties in the Central Valley. Ultimately, the target market there was not appropriate for the program due to the housing stock and lack of energy efficiency opportunities (e.g., very minimal master-metered tenant units, many buildings treated already by LIEE, served by SMUD v. PG&E, etc.).
• The program has been successful with selling its audits to properties in the Bay Area. Rebates have been a harder sell. Barriers in addition to first cost (such as lack of time, multiple authorities overseeing budget decisions, long budget cycles, inability to raise rents to cover capital improvements, risk aversion, etc.) have been identified. Indeed, these non-financial barriers were identified in 2003 by program staff and were noted in the prior evaluation. The program has provided intensive “hand-holding” on most of the properties that have received rebates. In many cases, program staff acted as the project manager and reviewed bids and provided a contractor oversight role. (The participant interviews will address the effectiveness of energy efficiency audits, which will be included in the final report. These interviews may also explore in more depth the non-financial barriers to installing energy efficient equipment.)
• The program tailored its Energy Academy services (i.e., operations and maintenance and property manager training events) to attract non-profit multi-family housing decision-makers and was successful in turning out well-attended events. These events are thought to be effective in selling decision-makers on the benefits of energy efficiency. (The participant interviews will address the effectiveness of non-rebate activities, which will be included in the final report.)
Impact Evaluation Results Interim impact evaluation activities consisted of 2 site inspections to properties that were paid lighting rebates through the program. As mentioned above, boiler control site data were also analyzed. CFL Results The savings for CFLs are a function of the verified installation rate, delta wattage (the difference between the pre- and post-installation lamp wattage), and the hours of use.
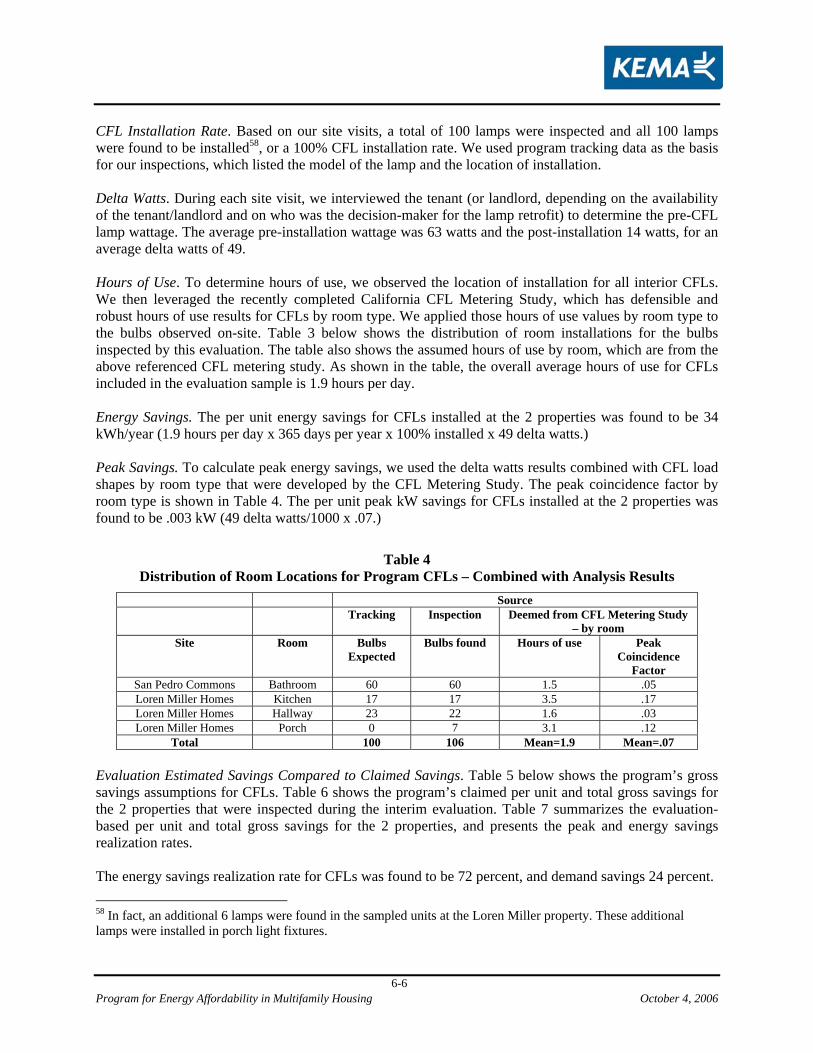
Program for Energy Affordability in Multifamily Housing October 4, 2006
6-6
CFL Installation Rate. Based on our site visits, a total of 100 lamps were inspected and all 100 lamps were found to be installed58, or a 100% CFL installation rate. We used program tracking data as the basis for our inspections, which listed the model of the lamp and the location of installation. Delta Watts. During each site visit, we interviewed the tenant (or landlord, depending on the availability of the tenant/landlord and on who was the decision-maker for the lamp retrofit) to determine the pre-CFL lamp wattage. The average pre-installation wattage was 63 watts and the post-installation 14 watts, for an average delta watts of 49. Hours of Use. To determine hours of use, we observed the location of installation for all interior CFLs. We then leveraged the recently completed California CFL Metering Study, which has defensible and robust hours of use results for CFLs by room type. We applied those hours of use values by room type to the bulbs observed on-site. Table 3 below shows the distribution of room installations for the bulbs inspected by this evaluation. The table also shows the assumed hours of use by room, which are from the above referenced CFL metering study. As shown in the table, the overall average hours of use for CFLs included in the evaluation sample is 1.9 hours per day. Energy Savings. The per unit energy savings for CFLs installed at the 2 properties was found to be 34 kWh/year (1.9 hours per day x 365 days per year x 100% installed x 49 delta watts.) Peak Savings. To calculate peak energy savings, we used the delta watts results combined with CFL load shapes by room type that were developed by the CFL Metering Study. The peak coincidence factor by room type is shown in Table 4. The per unit peak kW savings for CFLs installed at the 2 properties was found to be .003 kW (49 delta watts/1000 x .07.)
Table 4 Distribution of Room Locations for Program CFLs – Combined with Analysis Results
Source Tracking Inspection Deemed from CFL Metering Study
– by room Site Room Bulbs
Expected Bulbs found Hours of use
Peak
Coincidence Factor
San Pedro Commons Bathroom 60 60 1.5 .05 Loren Miller Homes Kitchen 17 17 3.5 .17 Loren Miller Homes Hallway 23 22 1.6 .03 Loren Miller Homes Porch 0 7 3.1 .12
Total 100 106 Mean=1.9 Mean=.07 Evaluation Estimated Savings Compared to Claimed Savings. Table 5 below shows the program’s gross savings assumptions for CFLs. Table 6 shows the program’s claimed per unit and total gross savings for the 2 properties that were inspected during the interim evaluation. Table 7 summarizes the evaluation-based per unit and total gross savings for the 2 properties, and presents the peak and energy savings realization rates. The energy savings realization rate for CFLs was found to be 72 percent, and demand savings 24 percent. 58 In fact, an additional 6 lamps were found in the sampled units at the Loren Miller property. These additional lamps were installed in porch light fixtures.
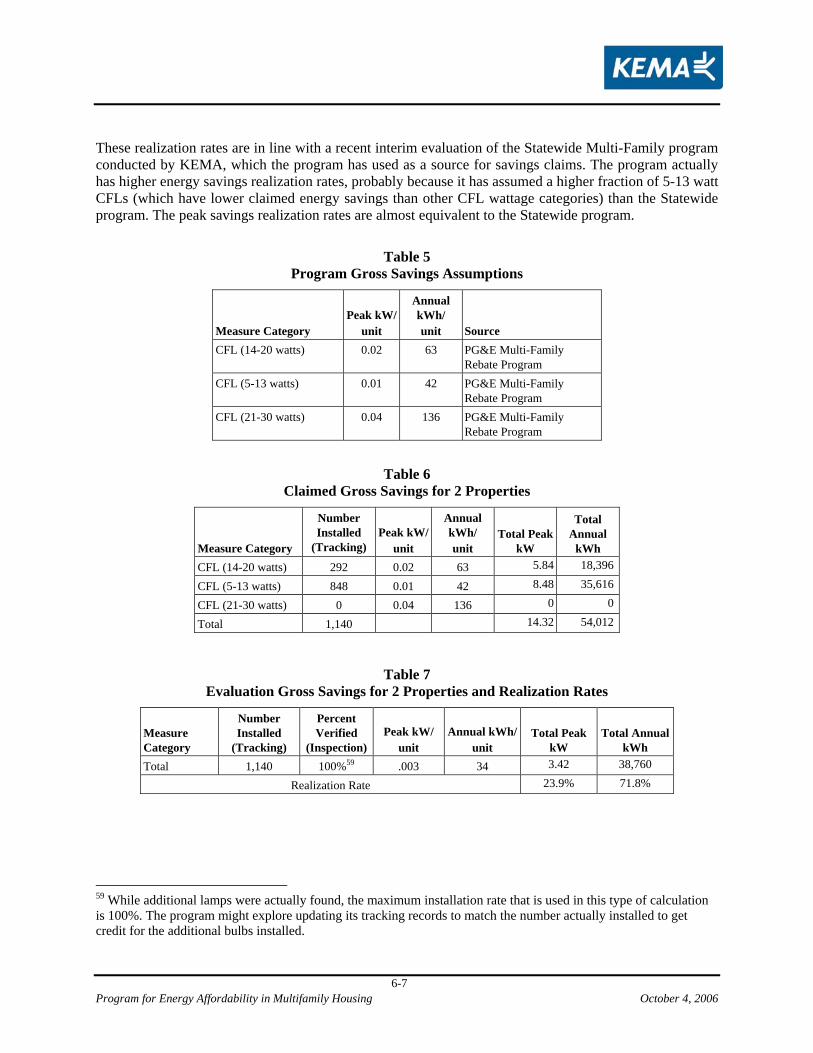
Program for Energy Affordability in Multifamily Housing October 4, 2006
6-7
These realization rates are in line with a recent interim evaluation of the Statewide Multi-Family program conducted by KEMA, which the program has used as a source for savings claims. The program actually has higher energy savings realization rates, probably because it has assumed a higher fraction of 5-13 watt CFLs (which have lower claimed energy savings than other CFL wattage categories) than the Statewide program. The peak savings realization rates are almost equivalent to the Statewide program.
Table 5 Program Gross Savings Assumptions
Measure Category Peak kW/
unit
Annual kWh/ unit Source
CFL (14-20 watts) 0.02 63 PG&E Multi-Family Rebate Program
CFL (5-13 watts) 0.01 42 PG&E Multi-Family Rebate Program
CFL (21-30 watts) 0.04 136 PG&E Multi-Family Rebate Program
Table 6 Claimed Gross Savings for 2 Properties
Measure Category
Number Installed
(Tracking) Peak kW/
unit
Annual kWh/ unit
Total Peak kW
Total Annual
kWh CFL (14-20 watts) 292 0.02 63 5.84 18,396
CFL (5-13 watts) 848 0.01 42 8.48 35,616
CFL (21-30 watts) 0 0.04 136 0 0
Total 1,140 14.32 54,012
Table 7 Evaluation Gross Savings for 2 Properties and Realization Rates
Measure Category
Number Installed
(Tracking)
Percent Verified
(Inspection)Peak kW/
unit Annual kWh/
unit Total Peak
kW Total Annual
kWh Total 1,140 100%59 .003 34 3.42 38,760
Realization Rate 23.9% 71.8%
59 While additional lamps were actually found, the maximum installation rate that is used in this type of calculation is 100%. The program might explore updating its tracking records to match the number actually installed to get credit for the additional bulbs installed.
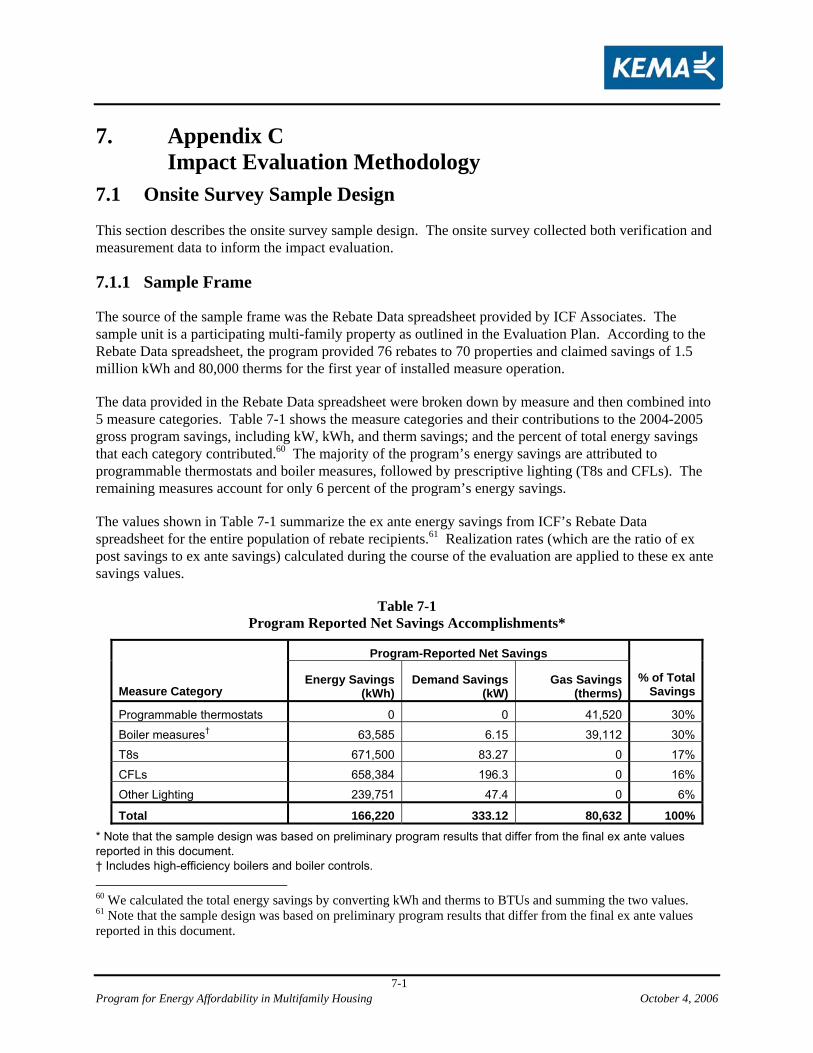
Program for Energy Affordability in Multifamily Housing October 4, 2006
7-1
7. Appendix C Impact Evaluation Methodology
7.1 Onsite Survey Sample Design
This section describes the onsite survey sample design. The onsite survey collected both verification and measurement data to inform the impact evaluation.
7.1.1 Sample Frame
The source of the sample frame was the Rebate Data spreadsheet provided by ICF Associates. The sample unit is a participating multi-family property as outlined in the Evaluation Plan. According to the Rebate Data spreadsheet, the program provided 76 rebates to 70 properties and claimed savings of 1.5 million kWh and 80,000 therms for the first year of installed measure operation.
The data provided in the Rebate Data spreadsheet were broken down by measure and then combined into 5 measure categories. Table 7-1 shows the measure categories and their contributions to the 2004-2005 gross program savings, including kW, kWh, and therm savings; and the percent of total energy savings that each category contributed.60 The majority of the program’s energy savings are attributed to programmable thermostats and boiler measures, followed by prescriptive lighting (T8s and CFLs). The remaining measures account for only 6 percent of the program’s energy savings.
The values shown in Table 7-1 summarize the ex ante energy savings from ICF’s Rebate Data spreadsheet for the entire population of rebate recipients.61 Realization rates (which are the ratio of ex post savings to ex ante savings) calculated during the course of the evaluation are applied to these ex ante savings values.
Table 7-1 Program Reported Net Savings Accomplishments*
Program-Reported Net Savings
Measure Category Energy Savings
(kWh) Demand Savings
(kW) Gas Savings
(therms) % of Total
Savings
Programmable thermostats 0 0 41,520 30%
Boiler measures† 63,585 6.15 39,112 30%
T8s 671,500 83.27 0 17%
CFLs 658,384 196.3 0 16%
Other Lighting 239,751 47.4 0 6%
Total 166,220 333.12 80,632 100%* Note that the sample design was based on preliminary program results that differ from the final ex ante values reported in this document. † Includes high-efficiency boilers and boiler controls. 60 We calculated the total energy savings by converting kWh and therms to BTUs and summing the two values. 61 Note that the sample design was based on preliminary program results that differ from the final ex ante values reported in this document.
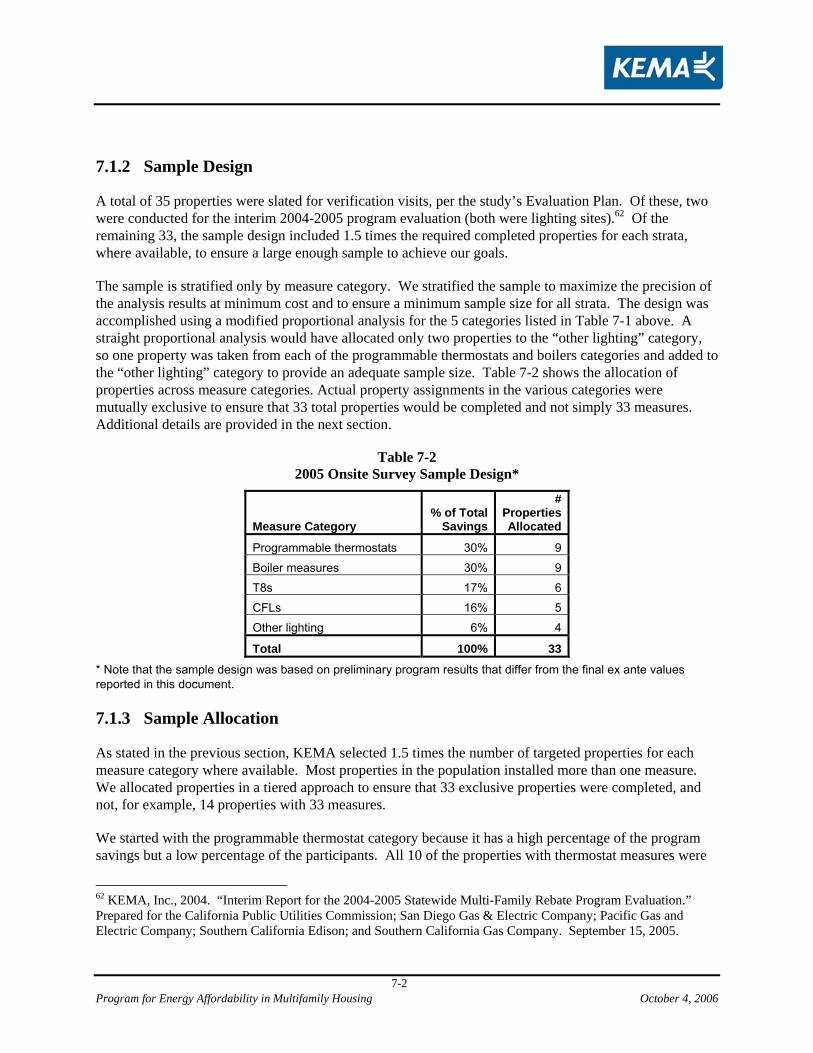
Program for Energy Affordability in Multifamily Housing October 4, 2006
7-2
7.1.2 Sample Design
A total of 35 properties were slated for verification visits, per the study’s Evaluation Plan. Of these, two were conducted for the interim 2004-2005 program evaluation (both were lighting sites).62 Of the remaining 33, the sample design included 1.5 times the required completed properties for each strata, where available, to ensure a large enough sample to achieve our goals.
The sample is stratified only by measure category. We stratified the sample to maximize the precision of the analysis results at minimum cost and to ensure a minimum sample size for all strata. The design was accomplished using a modified proportional analysis for the 5 categories listed in Table 7-1 above. A straight proportional analysis would have allocated only two properties to the “other lighting” category, so one property was taken from each of the programmable thermostats and boilers categories and added to the “other lighting” category to provide an adequate sample size. Table 7-2 shows the allocation of properties across measure categories. Actual property assignments in the various categories were mutually exclusive to ensure that 33 total properties would be completed and not simply 33 measures. Additional details are provided in the next section.
Table 7-2 2005 Onsite Survey Sample Design*
Measure Category % of Total
Savings
# Properties Allocated
Programmable thermostats 30% 9
Boiler measures 30% 9
T8s 17% 6
CFLs 16% 5
Other lighting 6% 4
Total 100% 33
* Note that the sample design was based on preliminary program results that differ from the final ex ante values reported in this document. 7.1.3 Sample Allocation
As stated in the previous section, KEMA selected 1.5 times the number of targeted properties for each measure category where available. Most properties in the population installed more than one measure. We allocated properties in a tiered approach to ensure that 33 exclusive properties were completed, and not, for example, 14 properties with 33 measures.
We started with the programmable thermostat category because it has a high percentage of the program savings but a low percentage of the participants. All 10 of the properties with thermostat measures were
62 KEMA, Inc., 2004. “Interim Report for the 2004-2005 Statewide Multi-Family Rebate Program Evaluation.” Prepared for the California Public Utilities Commission; San Diego Gas & Electric Company; Pacific Gas and Electric Company; Southern California Edison; and Southern California Gas Company. September 15, 2005.
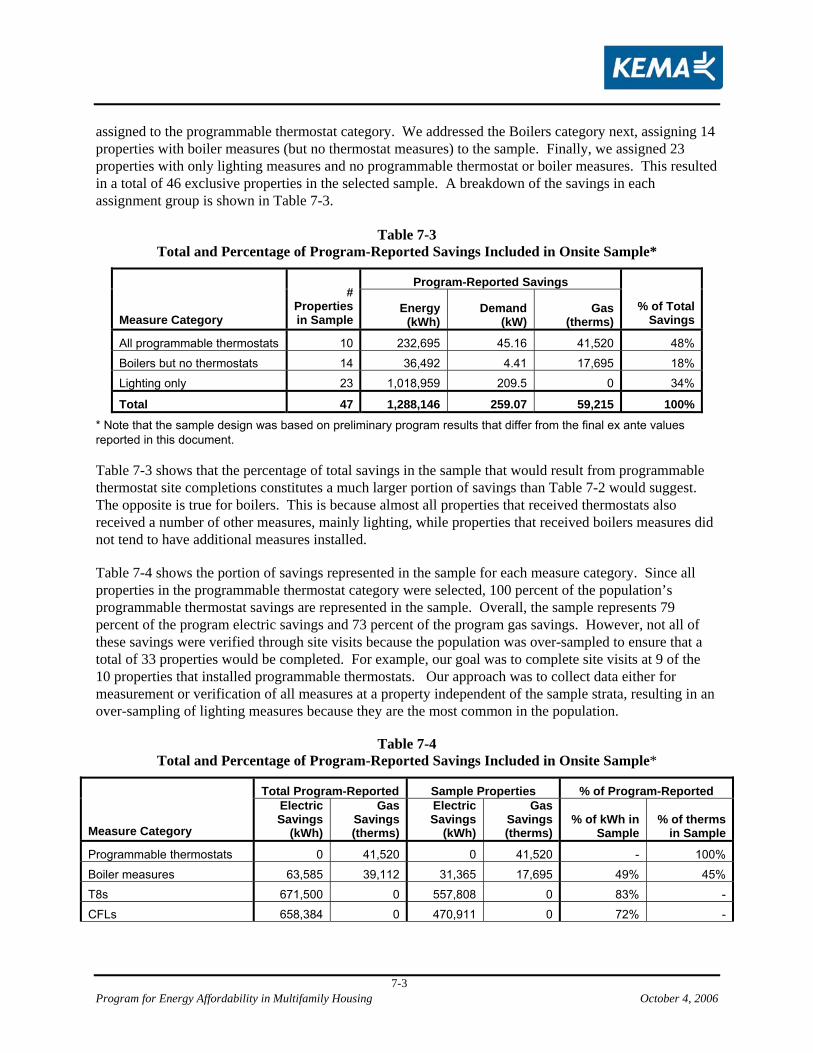
Program for Energy Affordability in Multifamily Housing October 4, 2006
7-3
assigned to the programmable thermostat category. We addressed the Boilers category next, assigning 14 properties with boiler measures (but no thermostat measures) to the sample. Finally, we assigned 23 properties with only lighting measures and no programmable thermostat or boiler measures. This resulted in a total of 46 exclusive properties in the selected sample. A breakdown of the savings in each assignment group is shown in Table 7-3.
Table 7-3 Total and Percentage of Program-Reported Savings Included in Onsite Sample*
Program-Reported Savings
Measure Category
# Properties in Sample
Energy (kWh)
Demand (kW)
Gas (therms)
% of Total Savings
All programmable thermostats 10 232,695 45.16 41,520 48%
Boilers but no thermostats 14 36,492 4.41 17,695 18%
Lighting only 23 1,018,959 209.5 0 34%
Total 47 1,288,146 259.07 59,215 100%
* Note that the sample design was based on preliminary program results that differ from the final ex ante values reported in this document. Table 7-3 shows that the percentage of total savings in the sample that would result from programmable thermostat site completions constitutes a much larger portion of savings than Table 7-2 would suggest. The opposite is true for boilers. This is because almost all properties that received thermostats also received a number of other measures, mainly lighting, while properties that received boilers measures did not tend to have additional measures installed.
Table 7-4 shows the portion of savings represented in the sample for each measure category. Since all properties in the programmable thermostat category were selected, 100 percent of the population’s programmable thermostat savings are represented in the sample. Overall, the sample represents 79 percent of the program electric savings and 73 percent of the program gas savings. However, not all of these savings were verified through site visits because the population was over-sampled to ensure that a total of 33 properties would be completed. For example, our goal was to complete site visits at 9 of the 10 properties that installed programmable thermostats. Our approach was to collect data either for measurement or verification of all measures at a property independent of the sample strata, resulting in an over-sampling of lighting measures because they are the most common in the population.
Table 7-4 Total and Percentage of Program-Reported Savings Included in Onsite Sample*
Total Program-Reported Sample Properties % of Program-Reported
Measure Category
Electric Savings
(kWh)
Gas Savings (therms)
Electric Savings
(kWh)
Gas Savings (therms)
% of kWh in Sample
% of therms in Sample
Programmable thermostats 0 41,520 0 41,520 - 100%
Boiler measures 63,585 39,112 31,365 17,695 49% 45%
T8s 671,500 0 557,808 0 83% -
CFLs 658,384 0 470,911 0 72% -
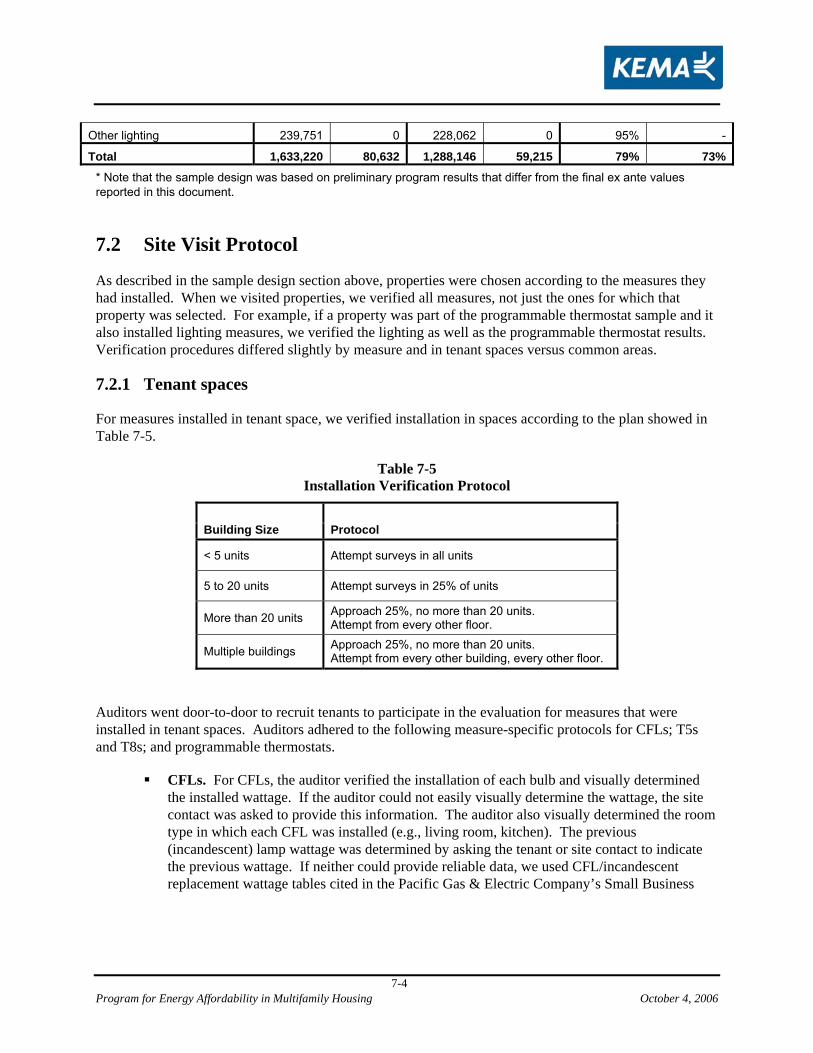
Program for Energy Affordability in Multifamily Housing October 4, 2006
7-4
Other lighting 239,751 0 228,062 0 95% -
Total 1,633,220 80,632 1,288,146 59,215 79% 73%
* Note that the sample design was based on preliminary program results that differ from the final ex ante values reported in this document. 7.2 Site Visit Protocol
As described in the sample design section above, properties were chosen according to the measures they had installed. When we visited properties, we verified all measures, not just the ones for which that property was selected. For example, if a property was part of the programmable thermostat sample and it also installed lighting measures, we verified the lighting as well as the programmable thermostat results. Verification procedures differed slightly by measure and in tenant spaces versus common areas.
7.2.1 Tenant spaces
For measures installed in tenant space, we verified installation in spaces according to the plan showed in Table 7-5.
Table 7-5 Installation Verification Protocol
Building Size Protocol
< 5 units Attempt surveys in all units
5 to 20 units Attempt surveys in 25% of units
More than 20 units Approach 25%, no more than 20 units. Attempt from every other floor.
Multiple buildings Approach 25%, no more than 20 units. Attempt from every other building, every other floor.
Auditors went door-to-door to recruit tenants to participate in the evaluation for measures that were installed in tenant spaces. Auditors adhered to the following measure-specific protocols for CFLs; T5s and T8s; and programmable thermostats.
CFLs. For CFLs, the auditor verified the installation of each bulb and visually determined the installed wattage. If the auditor could not easily visually determine the wattage, the site contact was asked to provide this information. The auditor also visually determined the room type in which each CFL was installed (e.g., living room, kitchen). The previous (incandescent) lamp wattage was determined by asking the tenant or site contact to indicate the previous wattage. If neither could provide reliable data, we used CFL/incandescent replacement wattage tables cited in the Pacific Gas & Electric Company’s Small Business
Program for Energy Affordability in Multifamily Housing October 4, 2006
7-5
Standard Performance Contracting Program (SPC) Program Manual63 to determine the most likely incandescent wattage. The auditor also recorded the control mechanism for the lamp. The same process was repeated for every lamp installed in the tenant space.
T8 and T5 lighting. For T8s and T5s, auditors verified the installation of each fixture and visually determined the length of bulb and number of bulbs installed in the fixture. The auditor asked the site contact what kind of ballast (electronic or magnetic) was installed in the new fixtures. S/he also asked about the lamp length, number of bulbs per fixture, ballast type, and number of fixtures that were replaced. The room location and control mechanism were recorded for each fixture.
Programmable thermostats. For thermostats, the auditor completed a survey with each tenant. The survey asked:
– Is the thermostat currently installed? – Is it programmed? – Did the tenant have a thermostat before the new one was installed? – Does the tenant override the program more than once per week?
Based on the answers to these questions, the survey was either terminated or the tenants were asked to complete a battery of questions meant to determine the change in their HVAC control behavior that resulted from the installation of the thermostat (see the survey in Appendix A for details). Current thermostat settings were recorded for every apartment that received a survey.
7.2.2 Common areas
In common areas, auditors attempted to verify every fixture or unit that was installed at each property. Auditors adhered to the measure-specific protocols for common spaces below.
CFLs. For CFLs, the auditor verified the installation of each bulb and visually determined or asked the site contact about the installed wattage. The previous (incandescent) lamp wattage was determined by asking the site contact. If s/he could not provide reliable data, we used standard CFL/incandescent replacement wattage tables to determine the most likely incandescent wattage.64 Auditor also recorded the control mechanism for the lamp and asked the site contact to identify daily operating hours.
T8 and T5 lighting. For T8s and T5s, auditors verified fixture installation and visually determined the length of bulb and number of bulbs installed in each fixture. The auditor asked the site contact what kind of ballast (electronic or magnetic) was installed in the new fixtures. S/he also asked about the lamp length, number of bulbs per fixture, ballast type, and number of fixtures that were replaced. The control mechanism was recorded for each fixture and the auditor asked the site contact to explain the operating hours for each fixture.
63 Alternative Energy Systems Consulting, Inc. , 2000. “California’s 2000 Small Business Standard Performance Contract Procedures Manual, Revision 2.1.” Prepared for Pacific Gas & Electric Company, San Diego Gas & Electric, and Southern California Edison. September 22, 2000. 64 Alternative Energy Systems Consulting, Inc. , 2000. Ibid.
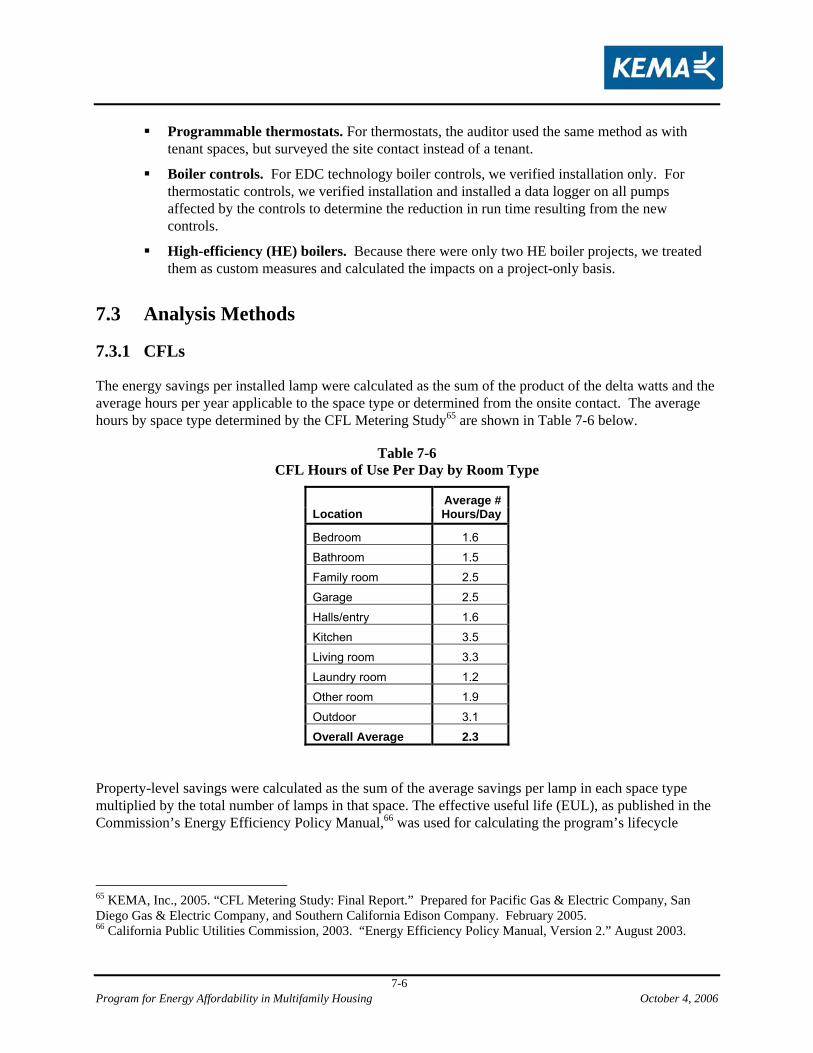
Program for Energy Affordability in Multifamily Housing October 4, 2006
7-6
Programmable thermostats. For thermostats, the auditor used the same method as with tenant spaces, but surveyed the site contact instead of a tenant.
Boiler controls. For EDC technology boiler controls, we verified installation only. For thermostatic controls, we verified installation and installed a data logger on all pumps affected by the controls to determine the reduction in run time resulting from the new controls.
High-efficiency (HE) boilers. Because there were only two HE boiler projects, we treated them as custom measures and calculated the impacts on a project-only basis.
7.3 Analysis Methods
7.3.1 CFLs
The energy savings per installed lamp were calculated as the sum of the product of the delta watts and the average hours per year applicable to the space type or determined from the onsite contact. The average hours by space type determined by the CFL Metering Study65 are shown in Table 7-6 below.
Table 7-6 CFL Hours of Use Per Day by Room Type
Location Average # Hours/Day
Bedroom 1.6
Bathroom 1.5
Family room 2.5
Garage 2.5
Halls/entry 1.6
Kitchen 3.5
Living room 3.3
Laundry room 1.2
Other room 1.9
Outdoor 3.1 Overall Average 2.3
Property-level savings were calculated as the sum of the average savings per lamp in each space type multiplied by the total number of lamps in that space. The effective useful life (EUL), as published in the Commission’s Energy Efficiency Policy Manual,66 was used for calculating the program’s lifecycle
65 KEMA, Inc., 2005. “CFL Metering Study: Final Report.” Prepared for Pacific Gas & Electric Company, San Diego Gas & Electric Company, and Southern California Edison Company. February 2005. 66 California Public Utilities Commission, 2003. “Energy Efficiency Policy Manual, Version 2.” August 2003.
Program for Energy Affordability in Multifamily Housing October 4, 2006
7-7
savings. This approach adheres to Option A of the International Program Monitoring and Verification Protocol (IPMVP).67
We analyzed the CFL savings by measure (5-13W CFL, 14-20W CFL, or 21-30W CFL). Subsequently, we divided the data into two categories: tenant space and common space.
Tenant space. The data recorded at the property for the tenant space was used to determine an installation rate for the tenant space population, which was then used to determine a verified number of bulbs installed. Given the CFL watts recorded or verified on site, the previous watts verified on site, and the operating hours for the location of the lamps (by recorded room location), we were able to calculate the property’s kWh for the tenant space for each measure.
Common areas. Property-level data for common areas was generally population data – we verified all of the bulbs installed in common areas (installed wattage) and asked site contacts to identify previous bulb wattage and operating hours. Given that data, we were able to calculate the kWh for common areas for each measure.
The total property kWh savings for that measure was then the sum of the tenant space kWh and the common area kWh. The same process was repeated for all CFL measures installed at a given property.
7.3.2 T8s
The energy savings per installed T8 fixture were calculated as the sum of the product of the delta watts and the average hours per year applicable to the space type. The hours of use by space type are found in Table 7-6 above.
The property savings were calculated as the sum of the average savings per fixture multiplied by the total number of fixtures. The effective useful life (EUL), as published in the CPUC Energy Efficiency Policy Manual,68 was used for calculating the program’s lifecycle savings. This approach adheres to Option A of the IPMVP.69
We analyzed the T8 savings by measure (e.g., 4-foot 1-lamp T8, 4-foot 2-lamp T8, and so on). We again divided the data into tenant space and common space and adhered to the following protocols:
Tenant space. The data recorded at the property for the tenant space property sample was used to determine an installation rate for the tenant space population, used to determine a verified number of fixtures installed for each measure. The kW savings for each measure were determined using fixture wattages for a standard T8 and standard T12 fixture from the SPC program wattage tables. Given that kW savings and the operating hours for the location of the lamps (by recorded room location), we were able to calculate the property’s kWh in the tenant space for each measure.
67 International Program Monitoring and Verification Protocol Committee, 2005. “International Program Monitoring and Verification Protocol: Concepts and Options for Determining Energy and Water Savings, Volume 1.” March 2002. DOE/GO-102002-1554. 68 California Public Utilities Commission, 2003. Ibid. 69 International Program Monitoring and Verification Protocol Committee, 2005. Ibid.
Program for Energy Affordability in Multifamily Housing October 4, 2006
7-8
Common areas. The data recorded at the property for the common area was generally population data – we verified all of the fixtures installed in the common area and asked site contacts to identify fixture operating hours. Given the standard kW savings for each fixture and the reported operating hours, we calculated kWh for the common area for each measure.
The same process was repeated for all T8 measures installed at a given property. The total property kWh savings for T8s was then the sum of the tenant space kWh and the common area kWh.
7.3.3 Other lighting
“Other lighting” includes LED exit signs, exit sign retrofit kits, custom lighting measures, and fixture de-lamping. For exit signs, we verified the population of installed fixtures at each property. We applied the kW savings found in the 2005 California DEER study70 for this measure, 0.39 kW per fixture, to the verified number of fixtures installed, and multiplied by 8,760 hours per year to obtain total kWh savings.
De-lamping was only done at one property. De-lamping and all other custom lighting measures were treated separately and savings were determined on a property-to-property basis.
7.3.4 Programmable thermostats
For every programmable thermostat reported by the program, KEMA developed savings proportions based on the thermostat installation, use, and answers to a behavioral survey related to programmable thermostats (see Appendix A) at each property. The average savings proportion was calculated for each property and multiplied by the prescriptive value for programmable thermostats (as reported in the program’s final monthly reporting workbook) to produce kWh and therm savings per unit.71 We multiplied the resulting value by the total number of thermostats at that property to determine the property’s total savings for thermostats.
7.3.5 Boiler measures
Site savings for boiler measures were calculated as the sum of the savings per installed measure. The effective useful life (EUL), as published in the CPUC Energy Efficiency Policy Manual, was used for calculating the program’s lifecycle savings. This approach adheres to Options A, B, and C of the IPMVP. Separate protocols were followed for the 3 boiler measures below:
High-efficiency (HE) boilers. The energy savings for boiler replacements were determined based on boiler output capacities and data collected on site. Because only 3 boilers were installed through the Partnership, each was treated like a custom calculation. Savings were based on the calculations submitted by the program and the information gathered on site.
70 Itron, Inc.; JJ Hirsh & Associates; Synergy Consulting; and Quantum, Inc., 2005. “2004-2005 Database for Energy Efficiency Resources (DEER) Update Study: Final Report.” Prepared for Southern California Edison. 71 Our initial plan was to multiply our savings estimates for programmable thermostats by the ex-ante value, but we multiplied by the workbook prescriptive value instead because the program did not give thermostat savings for cooling. ICF felt that most places in which thermostats were installed would not have air conditioning. We assigned thermostat cooling savings where they were applicable (where properties had cooling and the site representatives’ responses to the behavioral survey warranted savings).
Program for Energy Affordability in Multifamily Housing October 4, 2006
7-9
Thermostatic boiler controls. The energy savings for temperature-controlled recirculation controls (thermostatic controls) were calculated by determining the energy use before installation based on motor horsepower, efficiency, and operating hours; minus the energy use after installation based on motor horsepower, efficiency, and the operating hours determined from data collection. We reviewed the program’s calculations for natural gas savings for the installed controls and found the results to be reasonable. Therefore, for every verified installation, we applied 100 percent of the program natural gas savings.
Program kWh and kW savings were determined by assuming reduced operating hours for the circulation pumps. To verify this assumption, we installed data loggers for a period of at least one week on all pumps with controls. The logger information was analyzed to determine the current pump operating hours. The difference between the current operating hours and 24/7 operation was used to calculate the kWh savings. Pump horsepower (kW) was also verified on site.
EDC (Water Supply Temperature) Boiler Controls. The energy savings for water supply temperature controls (EDC controls) were based on an analysis of data provided by ICF from EDC, the vendor that installed the controls.72 The 2 properties that we visited for this measure both had their controls disabled because of problems or complaints. We called the remaining two properties in our sample (out of 4 in the population) to verify installation only. These properties did still have controls installed and operating, so we applied 100 percent of the claimed savings for those two properties.
7.3.6 Demand Savings
Program documentation indicates that the prescriptive savings figures for most measures are based on the savings in the 2002-2003 statewide Multi-Family Energy Efficiency Rebate (MFEER) program, while the savings estimates for T8s were based on the 2004-2005 statewide multi-family program estimates.
The Pacific Gas and Electric Company (PG&E) multi-family program determines prescriptive demand savings (kW) by multiplying the electric savings (kWh) savings by “PG&E’s system on-peak capacity h-factor”. The same savings listed in the Partnership for Energy Affordability in Multi-Family Housing proposal are also in the workbooks used by the program. We calculated the h-factor from the PG&E MFEER program prescriptive savings for program year 2004-2005 and applied the same h-factor (0.000124) to our kWh savings to determine kW savings. The equation is: kW savings = kWh savings * h-factor. Though the Partnership only used this same h-factor (0.000124) for the T8 measures, and not the other electric measures, we felt that using the most recent h-factor provided the greatest accuracy and have thus used it for all measures in this evaluation.
72 Vendor calculations are not independent estimates and thus may not be the best source for energy savings estimates. However, in this case, the vendor provided multiple months of logger data to support the savings estimates and KEMA was able to verify that the estimates were realistic. A more rigorous approach to estimating energy savings would include a billing analysis, but such an analysis was not pursued for this evaluation based on the limited number of sample points available (four). The 2004-2005 statewide Multi-Family Energy Efficiency Rebate (MFEER) program attempted to validate vendor data for boiler control measures but was ultimately unable to gain vendor cooperation. Evaluators are now pursuing a billing analysis among nearly 200 participants (customers who have boiler controls installed) as well as among non-participants (customers who do not have controls installed). These results will be available from KEMA in the fall of 2006.
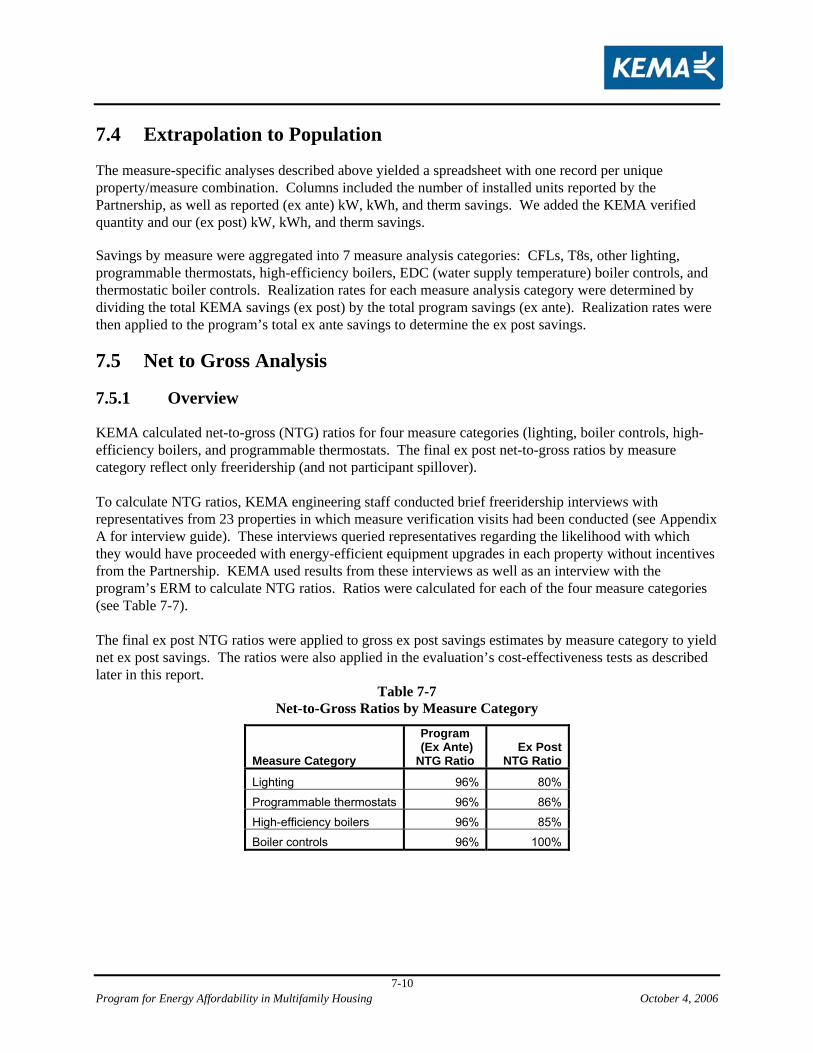
Program for Energy Affordability in Multifamily Housing October 4, 2006
7-10
7.4 Extrapolation to Population
The measure-specific analyses described above yielded a spreadsheet with one record per unique property/measure combination. Columns included the number of installed units reported by the Partnership, as well as reported (ex ante) kW, kWh, and therm savings. We added the KEMA verified quantity and our (ex post) kW, kWh, and therm savings.
Savings by measure were aggregated into 7 measure analysis categories: CFLs, T8s, other lighting, programmable thermostats, high-efficiency boilers, EDC (water supply temperature) boiler controls, and thermostatic boiler controls. Realization rates for each measure analysis category were determined by dividing the total KEMA savings (ex post) by the total program savings (ex ante). Realization rates were then applied to the program’s total ex ante savings to determine the ex post savings.
7.5 Net to Gross Analysis
7.5.1 Overview
KEMA calculated net-to-gross (NTG) ratios for four measure categories (lighting, boiler controls, high-efficiency boilers, and programmable thermostats. The final ex post net-to-gross ratios by measure category reflect only freeridership (and not participant spillover). To calculate NTG ratios, KEMA engineering staff conducted brief freeridership interviews with representatives from 23 properties in which measure verification visits had been conducted (see Appendix A for interview guide). These interviews queried representatives regarding the likelihood with which they would have proceeded with energy-efficient equipment upgrades in each property without incentives from the Partnership. KEMA used results from these interviews as well as an interview with the program’s ERM to calculate NTG ratios. Ratios were calculated for each of the four measure categories (see Table 7-7). The final ex post NTG ratios were applied to gross ex post savings estimates by measure category to yield net ex post savings. The ratios were also applied in the evaluation’s cost-effectiveness tests as described later in this report.
Table 7-7 Net-to-Gross Ratios by Measure Category
Measure Category
Program (Ex Ante) NTG Ratio
Ex Post NTG Ratio
Lighting 96% 80%
Programmable thermostats 96% 86%
High-efficiency boilers 96% 85%
Boiler controls 96% 100%
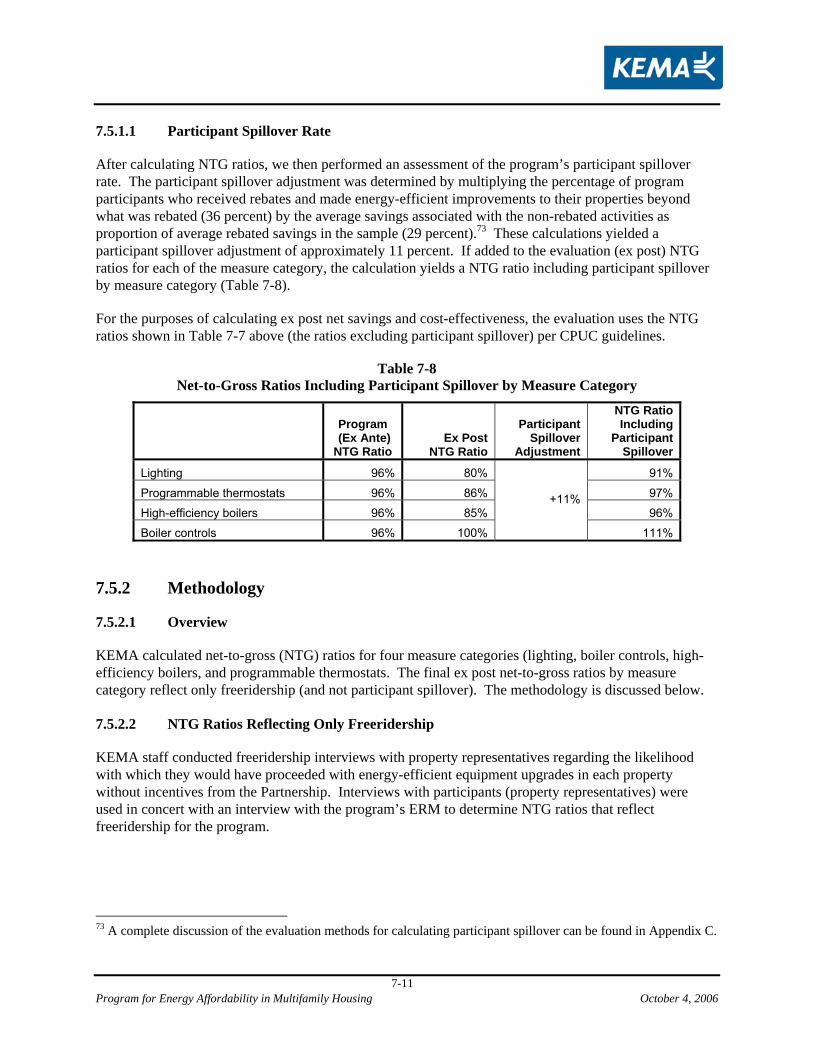
Program for Energy Affordability in Multifamily Housing October 4, 2006
7-11
7.5.1.1 Participant Spillover Rate
After calculating NTG ratios, we then performed an assessment of the program’s participant spillover rate. The participant spillover adjustment was determined by multiplying the percentage of program participants who received rebates and made energy-efficient improvements to their properties beyond what was rebated (36 percent) by the average savings associated with the non-rebated activities as proportion of average rebated savings in the sample (29 percent).73 These calculations yielded a participant spillover adjustment of approximately 11 percent. If added to the evaluation (ex post) NTG ratios for each of the measure category, the calculation yields a NTG ratio including participant spillover by measure category (Table 7-8).
For the purposes of calculating ex post net savings and cost-effectiveness, the evaluation uses the NTG ratios shown in Table 7-7 above (the ratios excluding participant spillover) per CPUC guidelines.
Table 7-8 Net-to-Gross Ratios Including Participant Spillover by Measure Category
Program (Ex Ante) NTG Ratio
Ex Post NTG Ratio
Participant Spillover
Adjustment
NTG Ratio Including
Participant Spillover
Lighting 96% 80% 91%
Programmable thermostats 96% 86% 97%
High-efficiency boilers 96% 85% 96%
Boiler controls 96% 100%
+11%
111%
7.5.2 Methodology
7.5.2.1 Overview
KEMA calculated net-to-gross (NTG) ratios for four measure categories (lighting, boiler controls, high-efficiency boilers, and programmable thermostats. The final ex post net-to-gross ratios by measure category reflect only freeridership (and not participant spillover). The methodology is discussed below. 7.5.2.2 NTG Ratios Reflecting Only Freeridership
KEMA staff conducted freeridership interviews with property representatives regarding the likelihood with which they would have proceeded with energy-efficient equipment upgrades in each property without incentives from the Partnership. Interviews with participants (property representatives) were used in concert with an interview with the program’s ERM to determine NTG ratios that reflect freeridership for the program.
73 A complete discussion of the evaluation methods for calculating participant spillover can be found in Appendix C.
Program for Energy Affordability in Multifamily Housing October 4, 2006
7-12
As demonstrated in the 2004 California Evaluation Framework74, participant self-report data on freeridership “can easily provide biased results… [as] respondents can overestimate what they would have done, either because they see that response as socially desirable or because respondents do “intend to” save energy, but there are many things people can intend to do that never happen or are postponed significantly.” Because of the bias introduced by participant self-reports, we interviewed the program’s ERM to provide a consistency check on the initial NTG ratios calculated based on participant response.
Our judgment in this case was that the ERM could provide an objective assessment of a property representative’s likelihood of undertaking a particular project within a specified timeframe as well as the program’s potential influence on the project details and timing. The ERM works for a non-profit organization serving the affordable housing sector (LISC). LISC’s main objective is to advocate on behalf of the affordable housing community. The ERM became intimately familiar with the participating properties and (along with ICF and other partnership staff) maintained frequent contact with property representatives. In many cases, it may not be sensible to incorporate a program implementer’s opinion with regard to program influence into NTG ratio calculation; in this case, however, we felt that LISC (the organization by which the ERM was employed) was more motivated by serving its constituency and providing program services (and providing rebates and achieving gross impacts) than by credit for delivering net impacts. That is, we felt that there was a very low likelihood the ERM’s responses were intended to game the system and give the program more credit. We viewed the ERM in this case as essentially a neutral party.
During the interviews with property representatives, interviewees who said they would have been at least “somewhat likely” to have made the upgrades without the program’s incentives were then asked about the timing for these projects, their awareness of the technologies prior to receiving engineering services through the program, and whether these measures had been installed in their properties in the past. Because we recognize that the views and opinions of the individual property representatives with whom we spoke may not reflect those of each organization as a whole, we were cautious in assigning value to responses that could over- or under-estimate the program’s influence on the organizations’ ultimate actions.75
NTG ratios were calculated at the property/measure category level based on property representatives’ responses to questions in the freeridership interview and the program ERM’s responses to the first question only. The NTG ratio that reflected freeridership for each measure category is a weighted average of the freeridership-only NTG ratios calculated at the property/measure category level.76 This is further explained below. The interview guide consisted of 6 questions, 4 of which were utilized in determining the freeridership-based NTG ratio for a particular property/measure category combination, and the remaining 2 of which
74 TecMarket Works Framework Team, 2004. "The California Evaluation Framework." Project Number K2033910. Prepared for Southern California Edison Company, June 2004. 75 For example, as shown below, instead of assigning a freeridership rate of 0% for properties at which representatives indicated the rebated projects would have been undertaken in absence of rebates, we assigned a freeridership rate of 20%. 76 Recall that each property may have had more than one measure type installed through the program; the entire set of six freeridership interview questions were asked of each property representative for each measure type installed through the program.
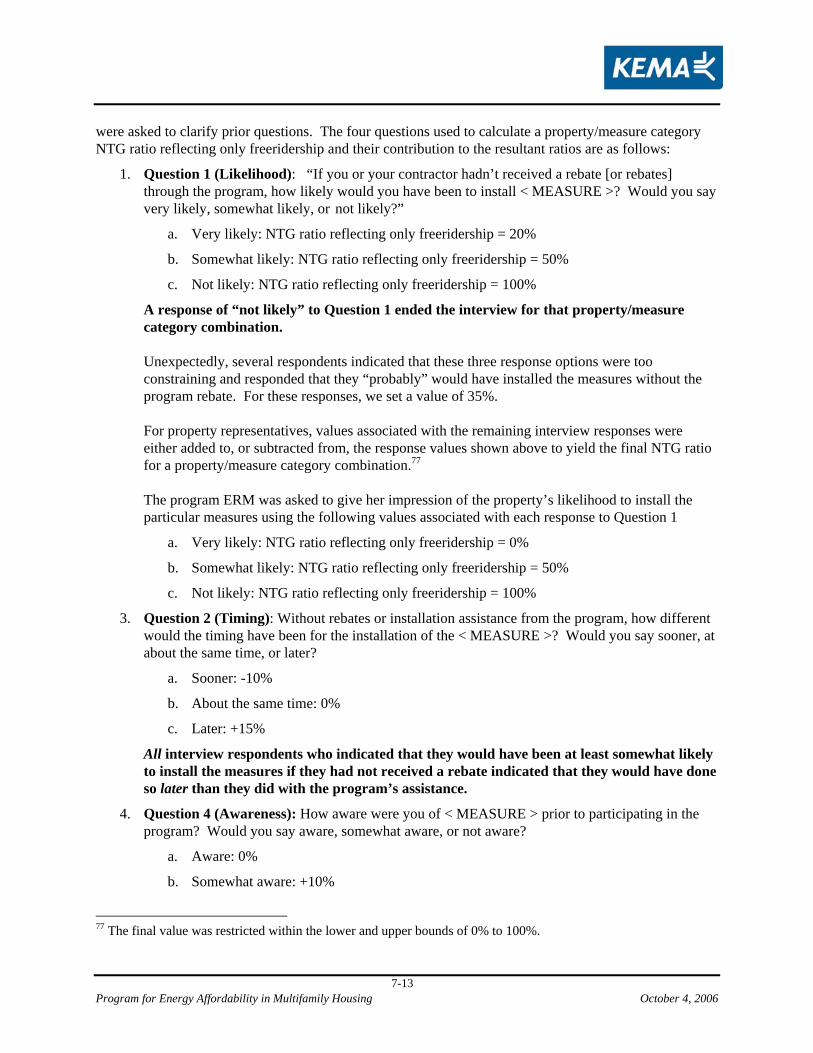
Program for Energy Affordability in Multifamily Housing October 4, 2006
7-13
were asked to clarify prior questions. The four questions used to calculate a property/measure category NTG ratio reflecting only freeridership and their contribution to the resultant ratios are as follows:
1. Question 1 (Likelihood): “If you or your contractor hadn’t received a rebate [or rebates] through the program, how likely would you have been to install < MEASURE >? Would you say very likely, somewhat likely, or not likely?”
a. Very likely: NTG ratio reflecting only freeridership = 20%
b. Somewhat likely: NTG ratio reflecting only freeridership = 50%
c. Not likely: NTG ratio reflecting only freeridership = 100%
A response of “not likely” to Question 1 ended the interview for that property/measure category combination. Unexpectedly, several respondents indicated that these three response options were too constraining and responded that they “probably” would have installed the measures without the program rebate. For these responses, we set a value of 35%. For property representatives, values associated with the remaining interview responses were either added to, or subtracted from, the response values shown above to yield the final NTG ratio for a property/measure category combination.77 The program ERM was asked to give her impression of the property’s likelihood to install the particular measures using the following values associated with each response to Question 1
a. Very likely: NTG ratio reflecting only freeridership = 0%
b. Somewhat likely: NTG ratio reflecting only freeridership = 50%
c. Not likely: NTG ratio reflecting only freeridership = 100%
3. Question 2 (Timing): Without rebates or installation assistance from the program, how different would the timing have been for the installation of the < MEASURE >? Would you say sooner, at about the same time, or later?
a. Sooner: -10%
b. About the same time: 0%
c. Later: +15%
All interview respondents who indicated that they would have been at least somewhat likely to install the measures if they had not received a rebate indicated that they would have done so later than they did with the program’s assistance.
4. Question 4 (Awareness): How aware were you of < MEASURE > prior to participating in the program? Would you say aware, somewhat aware, or not aware?
a. Aware: 0%
b. Somewhat aware: +10%
77 The final value was restricted within the lower and upper bounds of 0% to 100%.
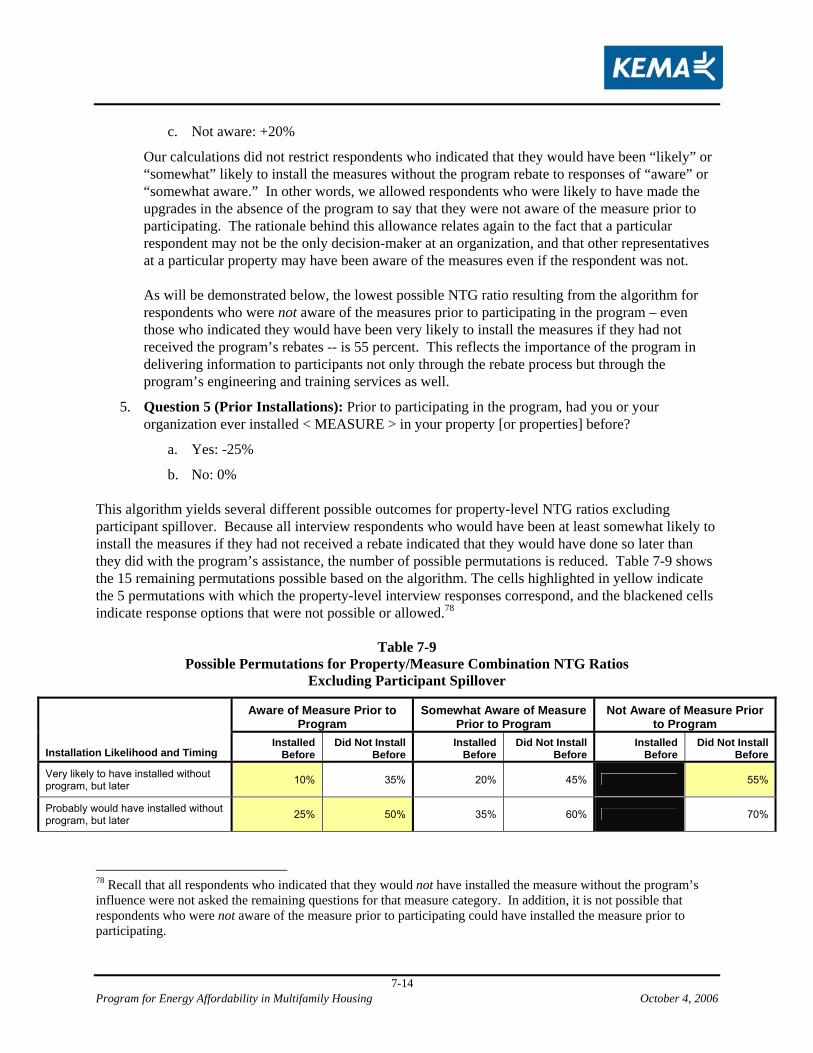
Program for Energy Affordability in Multifamily Housing October 4, 2006
7-14
c. Not aware: +20%
Our calculations did not restrict respondents who indicated that they would have been “likely” or “somewhat” likely to install the measures without the program rebate to responses of “aware” or “somewhat aware.” In other words, we allowed respondents who were likely to have made the upgrades in the absence of the program to say that they were not aware of the measure prior to participating. The rationale behind this allowance relates again to the fact that a particular respondent may not be the only decision-maker at an organization, and that other representatives at a particular property may have been aware of the measures even if the respondent was not. As will be demonstrated below, the lowest possible NTG ratio resulting from the algorithm for respondents who were not aware of the measures prior to participating in the program – even those who indicated they would have been very likely to install the measures if they had not received the program’s rebates -- is 55 percent. This reflects the importance of the program in delivering information to participants not only through the rebate process but through the program’s engineering and training services as well.
5. Question 5 (Prior Installations): Prior to participating in the program, had you or your organization ever installed < MEASURE > in your property [or properties] before?
a. Yes: -25%
b. No: 0% This algorithm yields several different possible outcomes for property-level NTG ratios excluding participant spillover. Because all interview respondents who would have been at least somewhat likely to install the measures if they had not received a rebate indicated that they would have done so later than they did with the program’s assistance, the number of possible permutations is reduced. Table 7-9 shows the 15 remaining permutations possible based on the algorithm. The cells highlighted in yellow indicate the 5 permutations with which the property-level interview responses correspond, and the blackened cells indicate response options that were not possible or allowed.78
Table 7-9 Possible Permutations for Property/Measure Combination NTG Ratios
Excluding Participant Spillover
Aware of Measure Prior to Program
Somewhat Aware of Measure Prior to Program
Not Aware of Measure Prior to Program
Installation Likelihood and Timing Installed
Before Did Not Install
Before Installed
Before Did Not Install
Before Installed
Before Did Not Install
Before
Very likely to have installed without program, but later 10% 35% 20% 45% 55%
Probably would have installed without program, but later 25% 50% 35% 60% 70%
78 Recall that all respondents who indicated that they would not have installed the measure without the program’s influence were not asked the remaining questions for that measure category. In addition, it is not possible that respondents who were not aware of the measure prior to participating could have installed the measure prior to participating.
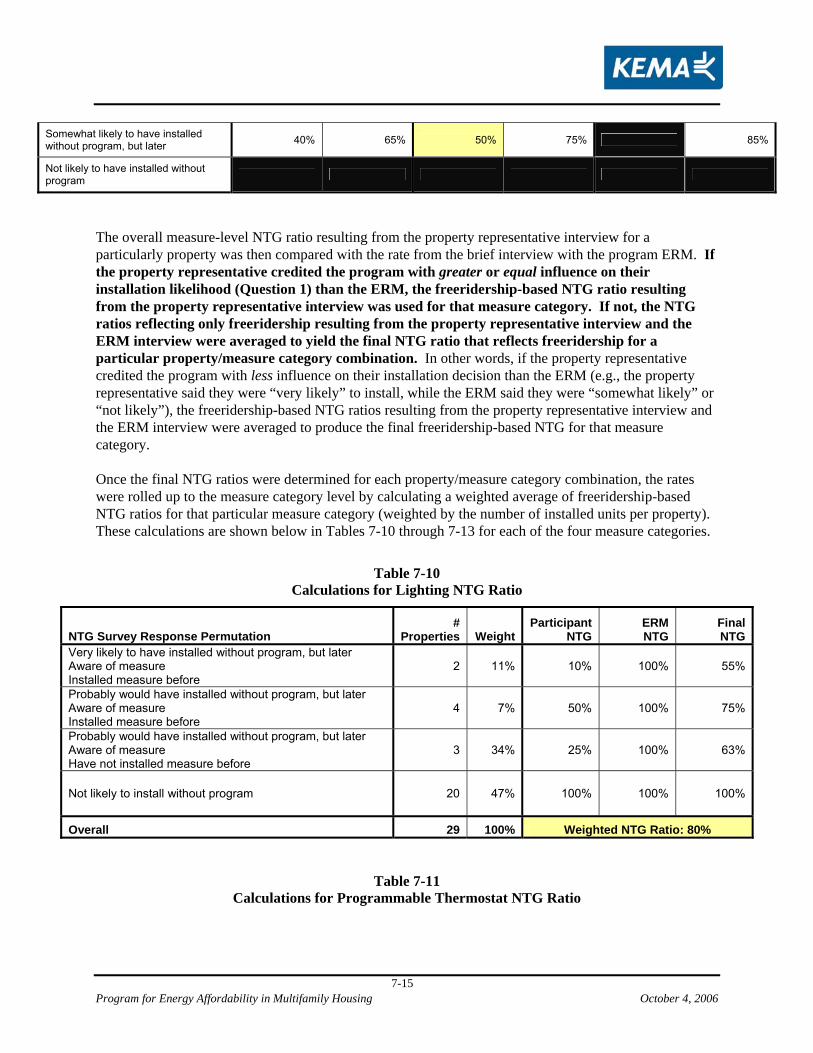
Program for Energy Affordability in Multifamily Housing October 4, 2006
7-15
Somewhat likely to have installed without program, but later 40% 65% 50% 75% 85%
Not likely to have installed without program
The overall measure-level NTG ratio resulting from the property representative interview for a particularly property was then compared with the rate from the brief interview with the program ERM. If the property representative credited the program with greater or equal influence on their installation likelihood (Question 1) than the ERM, the freeridership-based NTG ratio resulting from the property representative interview was used for that measure category. If not, the NTG ratios reflecting only freeridership resulting from the property representative interview and the ERM interview were averaged to yield the final NTG ratio that reflects freeridership for a particular property/measure category combination. In other words, if the property representative credited the program with less influence on their installation decision than the ERM (e.g., the property representative said they were “very likely” to install, while the ERM said they were “somewhat likely” or “not likely”), the freeridership-based NTG ratios resulting from the property representative interview and the ERM interview were averaged to produce the final freeridership-based NTG for that measure category. Once the final NTG ratios were determined for each property/measure category combination, the rates were rolled up to the measure category level by calculating a weighted average of freeridership-based NTG ratios for that particular measure category (weighted by the number of installed units per property). These calculations are shown below in Tables 7-10 through 7-13 for each of the four measure categories.
Table 7-10 Calculations for Lighting NTG Ratio
NTG Survey Response Permutation #
Properties WeightParticipant
NTG ERMNTG
FinalNTG
Very likely to have installed without program, but later Aware of measure Installed measure before
2 11% 10% 100% 55%
Probably would have installed without program, but later Aware of measure Installed measure before
4 7% 50% 100% 75%
Probably would have installed without program, but later Aware of measure Have not installed measure before
3 34% 25% 100% 63%
Not likely to install without program 20 47% 100% 100% 100%
Overall 29 100% Weighted NTG Ratio: 80%
Table 7-11
Calculations for Programmable Thermostat NTG Ratio
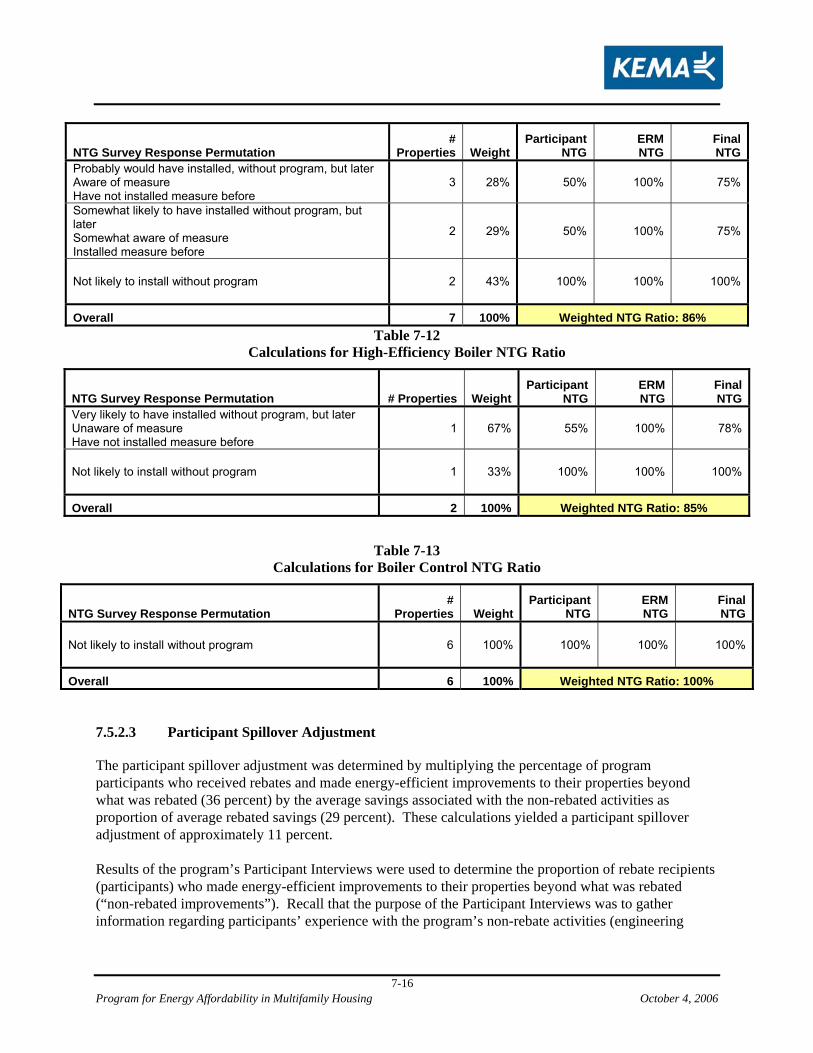
Program for Energy Affordability in Multifamily Housing October 4, 2006
7-16
NTG Survey Response Permutation #
Properties WeightParticipant
NTG ERMNTG
FinalNTG
Probably would have installed, without program, but later Aware of measure Have not installed measure before
3 28% 50% 100% 75%
Somewhat likely to have installed without program, but later Somewhat aware of measure Installed measure before
2 29% 50% 100% 75%
Not likely to install without program 2 43% 100% 100% 100%
Overall 7 100% Weighted NTG Ratio: 86% Table 7-12
Calculations for High-Efficiency Boiler NTG Ratio
NTG Survey Response Permutation # Properties WeightParticipant
NTG ERMNTG
FinalNTG
Very likely to have installed without program, but later Unaware of measure Have not installed measure before
1 67% 55% 100% 78%
Not likely to install without program 1 33% 100% 100% 100%
Overall 2 100% Weighted NTG Ratio: 85%
Table 7-13 Calculations for Boiler Control NTG Ratio
NTG Survey Response Permutation #
Properties WeightParticipant
NTG ERMNTG
FinalNTG
Not likely to install without program 6 100% 100% 100% 100%
Overall 6 100% Weighted NTG Ratio: 100%
7.5.2.3 Participant Spillover Adjustment
The participant spillover adjustment was determined by multiplying the percentage of program participants who received rebates and made energy-efficient improvements to their properties beyond what was rebated (36 percent) by the average savings associated with the non-rebated activities as proportion of average rebated savings (29 percent). These calculations yielded a participant spillover adjustment of approximately 11 percent. Results of the program’s Participant Interviews were used to determine the proportion of rebate recipients (participants) who made energy-efficient improvements to their properties beyond what was rebated (“non-rebated improvements”). Recall that the purpose of the Participant Interviews was to gather information regarding participants’ experience with the program’s non-rebate activities (engineering
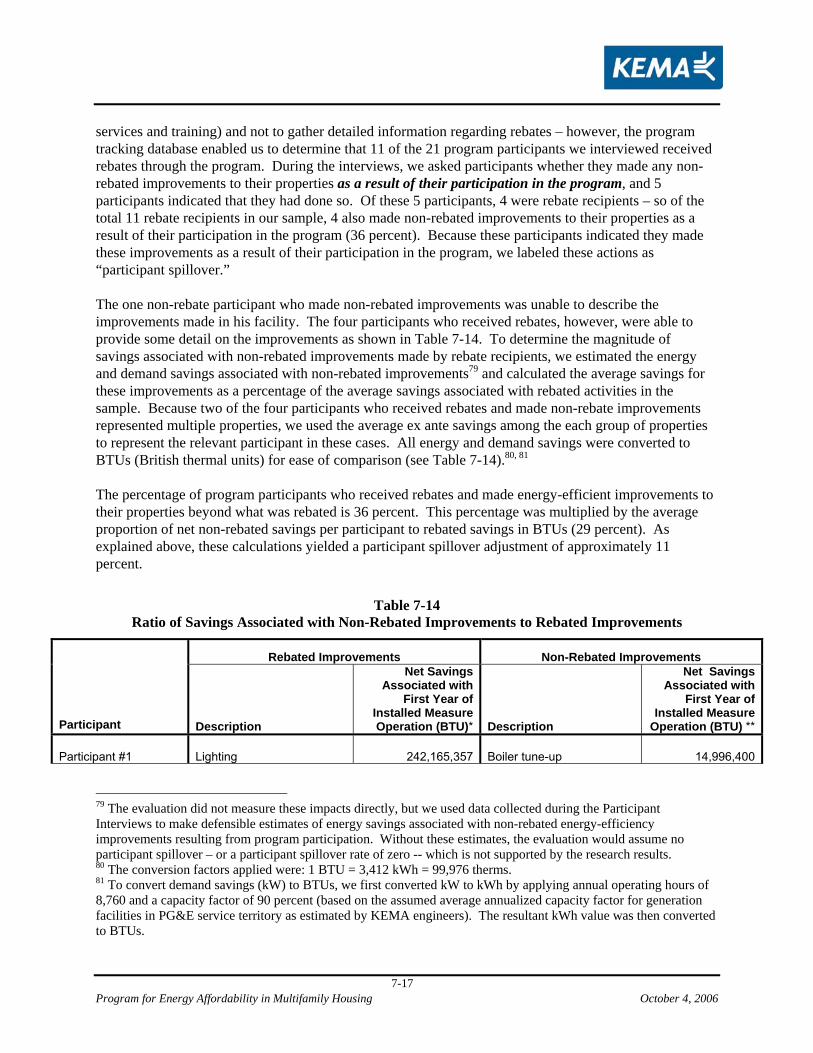
Program for Energy Affordability in Multifamily Housing October 4, 2006
7-17
services and training) and not to gather detailed information regarding rebates – however, the program tracking database enabled us to determine that 11 of the 21 program participants we interviewed received rebates through the program. During the interviews, we asked participants whether they made any non-rebated improvements to their properties as a result of their participation in the program, and 5 participants indicated that they had done so. Of these 5 participants, 4 were rebate recipients – so of the total 11 rebate recipients in our sample, 4 also made non-rebated improvements to their properties as a result of their participation in the program (36 percent). Because these participants indicated they made these improvements as a result of their participation in the program, we labeled these actions as “participant spillover.” The one non-rebate participant who made non-rebated improvements was unable to describe the improvements made in his facility. The four participants who received rebates, however, were able to provide some detail on the improvements as shown in Table 7-14. To determine the magnitude of savings associated with non-rebated improvements made by rebate recipients, we estimated the energy and demand savings associated with non-rebated improvements79 and calculated the average savings for these improvements as a percentage of the average savings associated with rebated activities in the sample. Because two of the four participants who received rebates and made non-rebate improvements represented multiple properties, we used the average ex ante savings among the each group of properties to represent the relevant participant in these cases. All energy and demand savings were converted to BTUs (British thermal units) for ease of comparison (see Table 7-14).80, 81 The percentage of program participants who received rebates and made energy-efficient improvements to their properties beyond what was rebated is 36 percent. This percentage was multiplied by the average proportion of net non-rebated savings per participant to rebated savings in BTUs (29 percent). As explained above, these calculations yielded a participant spillover adjustment of approximately 11 percent.
Table 7-14 Ratio of Savings Associated with Non-Rebated Improvements to Rebated Improvements
Rebated Improvements Non-Rebated Improvements
Participant Description
Net Savings Associated with
First Year of Installed Measure Operation (BTU)* Description
Net Savings Associated with
First Year of Installed Measure
Operation (BTU) **
Participant #1 Lighting 242,165,357 Boiler tune-up 14,996,400
79 The evaluation did not measure these impacts directly, but we used data collected during the Participant Interviews to make defensible estimates of energy savings associated with non-rebated energy-efficiency improvements resulting from program participation. Without these estimates, the evaluation would assume no participant spillover – or a participant spillover rate of zero -- which is not supported by the research results. 80 The conversion factors applied were: 1 BTU = 3,412 kWh = 99,976 therms. 81 To convert demand savings (kW) to BTUs, we first converted kW to kWh by applying annual operating hours of 8,760 and a capacity factor of 90 percent (based on the assumed average annualized capacity factor for generation facilities in PG&E service territory as estimated by KEMA engineers). The resultant kWh value was then converted to BTUs.
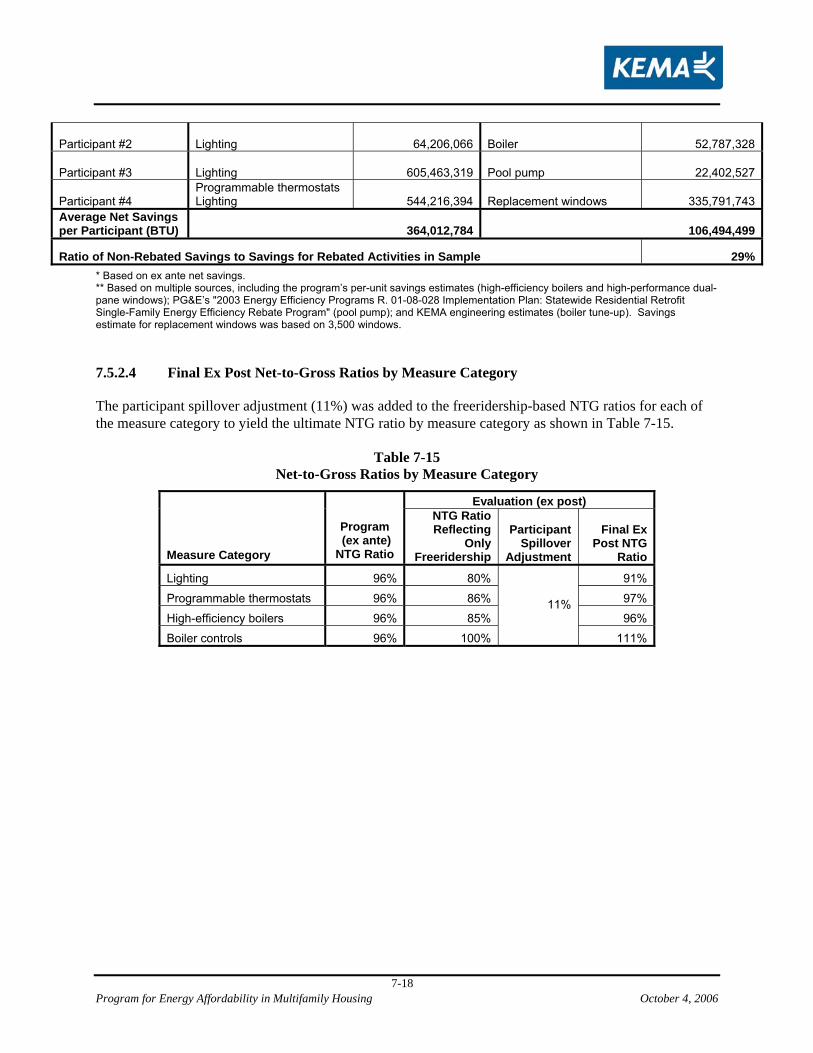
Program for Energy Affordability in Multifamily Housing October 4, 2006
7-18
Participant #2 Lighting 64,206,066 Boiler 52,787,328
Participant #3 Lighting 605,463,319 Pool pump 22,402,527
Participant #4 Programmable thermostats Lighting 544,216,394 Replacement windows 335,791,743
Average Net Savings per Participant (BTU) 364,012,784 106,494,499
Ratio of Non-Rebated Savings to Savings for Rebated Activities in Sample 29%* Based on ex ante net savings. ** Based on multiple sources, including the program’s per-unit savings estimates (high-efficiency boilers and high-performance dual-pane windows); PG&E’s "2003 Energy Efficiency Programs R. 01-08-028 Implementation Plan: Statewide Residential Retrofit Single-Family Energy Efficiency Rebate Program" (pool pump); and KEMA engineering estimates (boiler tune-up). Savings estimate for replacement windows was based on 3,500 windows.
7.5.2.4 Final Ex Post Net-to-Gross Ratios by Measure Category
The participant spillover adjustment (11%) was added to the freeridership-based NTG ratios for each of the measure category to yield the ultimate NTG ratio by measure category as shown in Table 7-15.
Table 7-15 Net-to-Gross Ratios by Measure Category
Evaluation (ex post)
Measure Category
Program (ex ante) NTG Ratio
NTG Ratio Reflecting
Only Freeridership
Participant Spillover
Adjustment
Final Ex Post NTG
Ratio
Lighting 96% 80% 91%
Programmable thermostats 96% 86% 97%
High-efficiency boilers 96% 85% 96%
Boiler controls 96% 100%
11%
111%