Embed Size (px)
Citation preview

EVALUATION OF TESTING PROTOCOLS FOR THE
ENVIRONMENTAL ASSESSMENT OF
FLY ASH STABILIZED SOILS
(RMRC PROJECT #50)
Final Report Submitted to Federal Highway Administration
Recycled Materials Resource Center
by
Ahmet H. Aydilek, Ph.D.
August 18, 2011
Department of Civil and Environmental Engineering
University of Maryland College Park, Maryland 20742

EXECUTIVE SUMMARY
Beneficial reuse of coal combustion byproducts requires an evaluation of metal leaching
potential. A comprehensive laboratory study was conducted to evaluate the trace metal
leaching from fly ash stabilized soils in a highway environment. The study had two
parts. The first part focused on metal leaching in from fly ashes in highway bases and
embankments and comprised both laboratory analysis and numerical simulations. The
second part of the study had a deeper focus on chemical processes with a critical
discussion of the three commonly used leaching testing procedures, namely the water
leach test (WLT), the Toxicity Characteristic Leaching Procedure (TCLP), and the
column leach test (CLT). The effect of test methodology and pH on several metals was
examined. Based on these results, a combined WLT and CLT leaching protocol for
testing fly ash mixtures is presented.

TRACE METAL LEACHING FROM HIGH CARBON FLY ASH MIXED SOILS
TABLE OF CONTENTS
1 INTRODUCTION ................................................................................................................ 1 2 LITERATURE REVIEW .................................................................................................... 4 3 METAL LEACHING FROM HCFA STABILIZED BASE LAYERS ........................... 7
3.1 Introduction ...................................................................................................................... 7 3.2 Materials........................................................................................................................... 8 3.3 METHODS....................................................................................................................... 9
3.3.1 Batch Water Leach Test (WLT) ............................................................................... 9 3.3.2 Column Leach Tests ............................................................................................. 100 3.3.3 Chemical Analysis ................................................................................................ 112
3.4 RESULTS..................................................................................................................... 122 3.4.1 Water Leach Tests................................................................................................... 12 3.4.2 Column Leach Tests ............................................................................................. 155 3.4.3 Metal Leaching ..................................................................................................... 166
3.5 Comparison of WLTs and CLTs.................................................................................. 222 3.6 CHEMICAL TRANSPORT MODELING .................................................................. 233
3.6.1 Numerical Model .................................................................................................. 235 3.6.2 Model Formulation in Vadose Zone ..................................................................... 257 3.6.3 Model Formulation in Groundwater ....................................................................... 27 3.6.4 WiscLEACH Results .............................................................................................. 29
3.7 CONCLUSIONS.......................................................................................................... 311 TABLES AND FIGURES ........................................................................................... 313
4 METAL LEACHING FROM HCFA AMENDED STRUCTURAL FILLS.............. 555 4.1 INTRODUCTION........................................................................................................ 555 4.2 MATERIALS............................................................................................................... 577 4.3 METHODS..................................................................................................................... 58 4.4 RESULTS....................................................................................................................... 59
4.4.1 Water Leach Tests................................................................................................... 59 4.4.2 Column Leach Tests ............................................................................................... 61 4.4.3 Toxicity Leaching Procedure Tests ...................................................................... 633 4.4.4 Comparison of the Leaching Results of Different Tests....................................... 644
4.5 CHEMICAL TRANSPORT MODELING .................................................................. 655 4.5.1 Numerical Model .................................................................................................. 655 4.5.2 WiscLEACH Results .............................................................................................. 65
4.6 CONCLUSIONS............................................................................................................ 66 TABLES AND FIGURES ............................................................................................. 69
REFERENCES.................................................................................................................... 94 APPENDIX A...................................................................................................................... 94 APPENDIX B ...................................................................................................................... 94

1
1 INTRODUCTION
According to ACAA, the 45% of the electricity consumed in the United States in 2009 were
supplied from the power plants that burn coal. Approximately 92.8 million of tons of coal
combustion byproducts (CCBs) are produced in the United States each year as a result of burning
coal at the electric power plants (ACAA 2008). As of 2009, 78% of these CCBs are fly ashes,
and 42.3 million tons of fly ash is landfilled. American Coal Association Agency estimates that
this landfilled or stockpiled amount will be increasing each year.
Fly ash production causes two main problems: impacts to the environment and occupying
valuable landspace. The first one is particularly important as fly ashes may contain high
concentrations of important trace elements such as Arsenic, Boron, Chromium, Copper, Zinc,
Vanadium, and Nickel among many others. Disposing large amounts of fly ashes into landfills
can cause leaching of these heavy metals to the groundwater through the soil vadose zone and
may threaten the aquatic life and environment as well as human health.
There have been significant efforts on reusing of fly ash materials in construction and
decreasing the disposing rate of fly ash as residues. Fly ash is siliceous or alumino-siliceous
pozzolanic material that can form cementitious compounds in the presence of water. The
physical, chemical and mineralogical properties of the fly ash are strongly dependent on the type
of the coal burning, type of combustion process, type of pollution control facilities and handling
(Komonweeraket et al. 2010). Fly ash is classified into two classes, F and C, based on the
chemical composition of the fly ash, and the C (self-cementitious) type fly ashes are readily and
F type ashes are commonly reused as concrete additive or in cement production. However, fly
ashes produced by several power plants in United States in the last 5 years occasionally contains
significant amounts of unburned carbon (i.e., high loss on ignition) due to the increasingly

2
common use of low nitrogen oxide (NOx) and sulphur oxide (SOx) burners. This ash, called high
carbon fly ash (HCFA), has a carbon content of 12-25%, cannot be efficiently re-burnt by using
current technology, and has no value as a concrete additive as the unburned carbon tends to
adsorb the air entrainment admixtures that are added to the cement to prevent crack formation
and propagation. These ashes are typically classified as off-spec fly ashes meaning that they do
not meet the physical and chemical requirements criteria outlined in ASTM C618 and are
landfilled at large percentages.
The fly ashes produced by several power plants in Maryland and elsewhere occasionally
contains significant amounts of unburned carbon (i.e., high loss on ignition), and cannot be used
in concrete production. On the other hand geotechnical applications pose great potential for
beneficial reuse of the fly ashes. In the current study, the applications of reusing of fly ash in
construction of highway base layers (Section 3) and embankments (Section 4) will be discussed.
Several studies have conducted on leaching behavior of metals from coal combustion by-
products and mechanisms that control the release of these metals (Wang et al. 2006, Bin-
Shafique et al. 2006, Chen et al. 2006, Goswami and Mahanta 2007, Gosh 2008, Vitkova et al.
2008, Srivastava et al. 2008, Deng et al. 2008, Dutta et al. 2009, Komonweeraket et al.
2010).However, there is lack of information on leaching of these contaminants from high carbon
fly ash mixtures. The environmental risks associated with fly ash stabilization may be reduced
when HCFAs are used as a stabilizing agent (e.g., unburned carbon or activated carbon is often
used for pollution control). The high organic carbon content of HCFA may act as a sorbent to
the heavy metals in the fly ash, and reduce the amount of metals that are released into the
environment. Because of enhanced adsorption of metals by the unburned carbon, metal
concentrations are likely to decrease to much lower values than the ones experienced in previous
3
field applications. The environmental benefits of the high carbon content may also result in a
broader range of permissible reuse applications for fly ash.
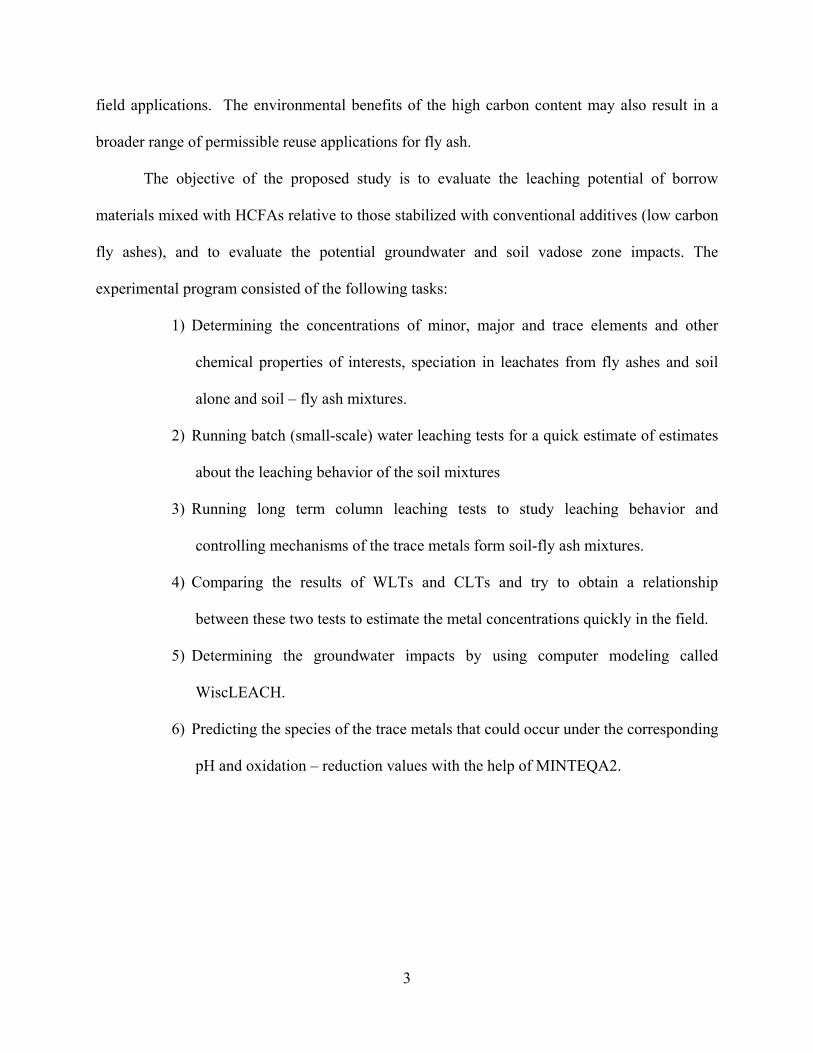
The objective of the proposed study is to evaluate the leaching potential of borrow
materials mixed with HCFAs relative to those stabilized with conventional additives (low carbon
fly ashes), and to evaluate the potential groundwater and soil vadose zone impacts. The
experimental program consisted of the following tasks:
1) Determining the concentrations of minor, major and trace elements and other
chemical properties of interests, speciation in leachates from fly ashes and soil
alone and soil – fly ash mixtures.
2) Running batch (small-scale) water leaching tests for a quick estimate of estimates
about the leaching behavior of the soil mixtures
3) Running long term column leaching tests to study leaching behavior and
controlling mechanisms of the trace metals form soil-fly ash mixtures.
4) Comparing the results of WLTs and CLTs and try to obtain a relationship
between these two tests to estimate the metal concentrations quickly in the field.
5) Determining the groundwater impacts by using computer modeling called
WiscLEACH.
6) Predicting the species of the trace metals that could occur under the corresponding
pH and oxidation – reduction values with the help of MINTEQA2.

4
2 LITERATURE REVIEW
Previous studies showed that high carbon fly ashes (HCFA) could be used in variety of
applications, including as a barrier in the remediation of contaminated groundwater (Demirkan et
al. 2006), and bulk fill material in geotechnical fills and highway bases (Cetin et al. 2009). The
advantages of using fly ash as a bulk fill material include low cost, low unit weight, and good
strength. Furthermore, roadways and embankment constructions have high potential for large
volume use of HCFA. Using this fly ash as a part of base course material in highways and
embankment is one of the most beneficial ways of utilizing the already disposed fly ash. On the
other hand, the leachability of heavy metals from the fly ash into soil and groundwater is a
significant concern, creating environmental health problems due to their high potential for
cumulative build-up and long life in the environment (Ghosh and Subbarao 1998, Wang et al.
2006, Bin-Shafique et al. 2006, Chen et al. 2006, Goswami and Mahanta 2007, Sushil and Batra
et al. 2008, Vitkova et al. 2008, Srivastava et al. 2008, Dutta et al. 2009).
Naik et.al (2001) evaluated the performance and leaching of controlled low strength
materials incorporating fly ash and foundry sand. The concentrations of heavy metals were
below the enforcement standards of State of Wisconsin, and were not significantly affected by
the type and source of fly ash or foundry sand. Bin-Shafique et.al (2006) showed that water
leaching and column leaching tests yielded similar trends with fly ash content, leachate pH, and
soil properties. The column tests provided a good indication of the conditions likely to occur in
the field, whereas water leaching tests were used to estimate the initial concentrations of Cd, Cr,
Se, and Ag in the field. Fly ashes were used as a pre-filter material for the retention of Pb ions by

5
Pandian et al. (1996) and leaching of Pb ions was observed to be the highest at extreme pH
conditions. Similarly, Wang et al. (2008) also demonstrated the metal adsorption capability of
Class F fly ashes and its relation to the carbon content. Jo et al. (2007) looked at the
environmental feasibility of using fly ash as a fill material and showed that all metals except Mn
were below the EPA limits. It has been shown that fly ash can also be used in the stabilization of
residual lateric soils (Goswami and Mahanta 2007). In such applications, calcium content of fly
ash affects the pH of soil significantly and leaching behavior of metals is highly dependent on
the pH of the aqueous solution. A study carried out by Baba et al. (2008) revealed that the heavy
metal concentrations increase with increasing acidity and temperature of the aqueous
environment. Chen et al. (2006) studied the leaching potential of Cd, Ni, Pb, Cu and Zn from
acidic sandy soil amended with dolomite phosphate rock (DPR) fertilizers and determined that
the maximum leachate concentrations of all five metals were below drinking water guidance
limits set by the Florida Department of Natural Resources. Suzuki and Ono (2008) researched
the leaching characteristics of stabilized/solidified fly ashes and observed pH-dependent
concentrations for Pb, Cu and Zn. Stabilization of Zn, Fe and Mn were achieved at neutral pH
conditions in another study conducted by Srivastava et al. (2008).
Despite the leaching of heavy metals, cementitious properties and low cost of fly ash
makes it a good candidate for improving the mechanical properties of soils. In the last decade,
significant efforts have been made to understand leaching characteristics of heavy metals from
soil-fly ash mixtures; however, lack of information exists on leaching of HCFA or off-spec fly
ashes especially when they are amended with an activator rich in CaO. It is well known that the
high pH may fix some of the heavy metals within the stabilized soil mixtures (Bin-Shafique et al.
2006, Dutta et al. 2009). In addition, the alkalinity and calcium content of the stabilized soil

6
affect the leaching characteristics of heavy metals significantly by increasing the pH of soil and
decreasing the leaching potential of metals (Goswami and Mahanta 2007, Dutta et al. 2009). On
the other hand, a significant increase in the pH of the aqueous solutions is likely to increase the
solubility of anionic metal species like Al, Cr, As and Se which are also critical metals in
threatening aquatic life and human health (Al-Abed 2006, Morar 2007, Wang et al. 2007,
Malferrari et al. 2008, Wang et al. 2008, Wang et al. 2009). Thus, there is an emerging need to
evaluate the environmental solubility of fly ash-stabilized soils amended with calcium-rich
agents.

7
3 METAL LEACHING FROM HCFA STABILIZED BASE
LAYERS
3.1 Introduction
Using fly ash in highway applications is gaining importance due to its potential to solve the
landfilling problems and provide good strengthen material. The most important problem in
highway constructions is building the suitable base layer that can provide enough support to the
asphalt layer. The two conventional methods to stabilize the base layer are removing the soft soil
and replacing it with a stronger material, such as granular materials (gravel), or in situ
stabilization of the soil via physical and chemical techniques. However, these conventional
methods can be costly and time consuming, and alternative approaches such as fly ash
amendment could be very practical and provide an economical solution for stabilization of the
existing soil (Cetin et al. 2010). Leaching of the metals from HCFA-stabilized soil layers is, on
the other hand, the main concern for construction applications (Bin Shafique et al. 2002, Sauer et
al. 2005, Goswami and Mahanta 2007).
In order to evaluate the environmental suitability of fly ash-stabilized soils for potential
highway applications, a series of short term batch water and long term column leaching
experiments were conducted. These mixtures were selected based on strength and moduli
determined in an earlier study by Cetin et al. (2010). Results were used to determine leaching
patterns and relationships between concentrations from the two laboratory tests. Numerical
modeling tools were also utilized to predict concentrations at different times and locations in
the field.
8
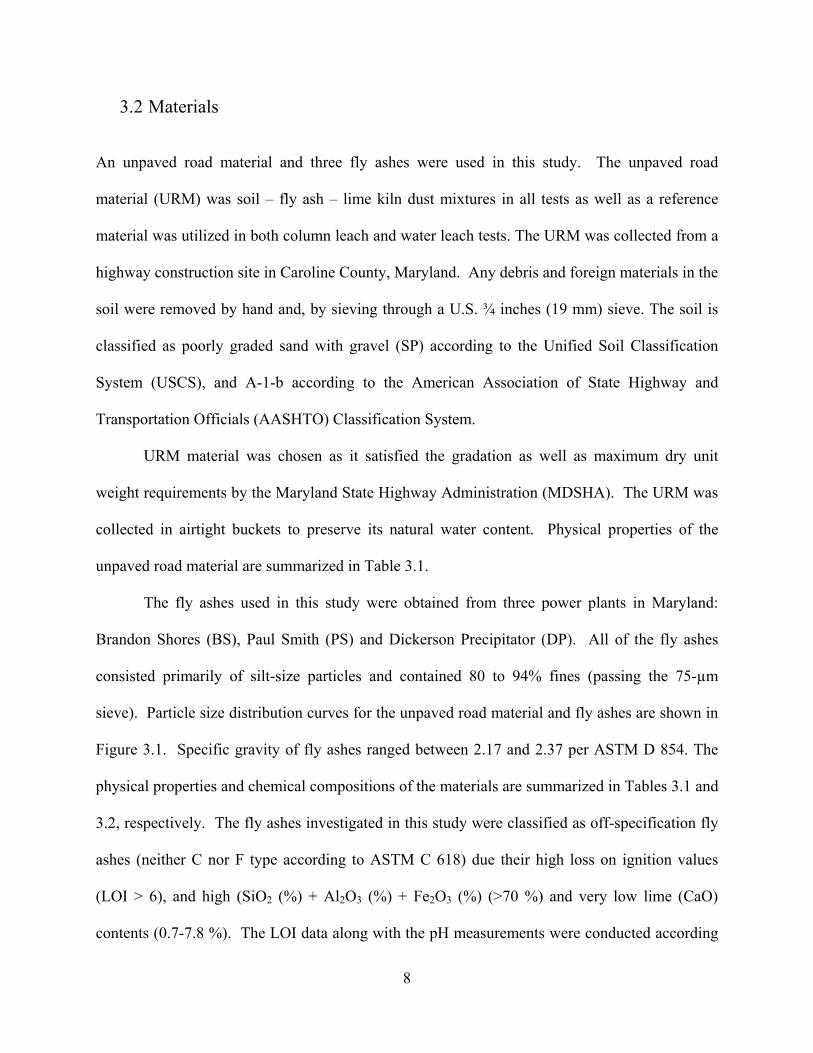
3.2 Materials
An unpaved road material and three fly ashes were used in this study. The unpaved road
material (URM) was soil – fly ash – lime kiln dust mixtures in all tests as well as a reference
material was utilized in both column leach and water leach tests. The URM was collected from a
highway construction site in Caroline County, Maryland. Any debris and foreign materials in the
soil were removed by hand and, by sieving through a U.S. ¾ inches (19 mm) sieve. The soil is
classified as poorly graded sand with gravel (SP) according to the Unified Soil Classification
System (USCS), and A-1-b according to the American Association of State Highway and
Transportation Officials (AASHTO) Classification System.
URM material was chosen as it satisfied the gradation as well as maximum dry unit
weight requirements by the Maryland State Highway Administration (MDSHA). The URM was
collected in airtight buckets to preserve its natural water content. Physical properties of the
unpaved road material are summarized in Table 3.1.
The fly ashes used in this study were obtained from three power plants in Maryland:
Brandon Shores (BS), Paul Smith (PS) and Dickerson Precipitator (DP). All of the fly ashes
consisted primarily of silt-size particles and contained 80 to 94% fines (passing the 75-µm
sieve). Particle size distribution curves for the unpaved road material and fly ashes are shown in
Figure 3.1. Specific gravity of fly ashes ranged between 2.17 and 2.37 per ASTM D 854. The
physical properties and chemical compositions of the materials are summarized in Tables 3.1 and
3.2, respectively. The fly ashes investigated in this study were classified as off-specification fly
ashes (neither C nor F type according to ASTM C 618) due their high loss on ignition values
(LOI > 6), and high (SiO2 (%) + Al2O3 (%) + Fe2O3 (%) (>70 %) and very low lime (CaO)
contents (0.7-7.8 %). The LOI data along with the pH measurements were conducted according

9
to EPA Method SW-846 Method 9045 are also presented in Table 3.2. Since the three fly ashes
do not have high cementing potential, lime kiln dust (LKD) was used to initiate pozzolanic
reactions for stabilization of the soil. LKD was obtained from Carmeuse Lime and Stone
Company, Pittsburgh, Pennsylvania and contained approximately 60% CaO by weight. The
specific gravity (Gs) of LKD is 2.97. Total elemental analyses of the three fly ashes and URM
were conducted following the procedures outlined in EPA SW-846 Method 6800 and
summarized in Table 3.3.
3.3 METHODS
3.3.1 Batch Water Leach Test (WLT)
Batch water leach tests were conducted on the soil, fly ashes and soil mixtures using different
percentages of fly ashes and lime kiln dusts in accordance with ASTM D 3987. Two
modifications were made on the standard method. First, instead of using 2-L, a 50-mL mixture
of leachant/solid volume was used because of the size of centrifuge machine employed in the
current study. Second, a constant liquid-to-solid (L:S) ratio of 20:1 was used for all materials.
The air dried soil was crushed and sieved from U.S. No. 4 sieve (4.75 mm), and the soil was
mixed homogeneously with fly ash and lime kiln dust at different percentages. Each specimen
was cured for 7 days in plastic bags in a moisture controlled humidity chamber (21 Cº and 100%
relative humidity). After curing, 2.4 g of soil mixture was added to a 50-mL plastic centrifuge
tube followed by 48 mL leachant (i.e., the 0.1 M NaBr solution). The soil mixtures were rotated
continuously on a rotator at 29 revolutions per minute, room temperature (19 Cº - 25 Cº) for 18
hours for equilibration. After equilibrium, the specimens were settled for 5 minutes and placed

10
in the Beckman GPR centrifuge machine. The mixtures were centrifuged at 3000 rpm for 20
minutes. Next, the suspended solids were filtered through the 0.2-µm pore size, 25 mm diameter
membrane disk filters fitted in a 25-mm Easy Pressure syringe filter holder by using a 60-mL
plastic syringe. After filtration, pH, electrical conductivity and oxidation reduction values were
recorded. Then, the filtered samples were acidified to pH < 2 using high-purity nitric acid and
stored in 15 mL high density polyethylene centrifuge tubes. Before use, the sample bottles were
washed with acid (2 % HNO3) and rinsed with deionized water. All samples were stored at 4 Cº
for chemical analysis. Triplicate WLTs were conducted on all soil mixtures using each soil
solution.
3.3.2 Column Leach Tests
The column leach test (CLTs) were conducted on soil, fly ashes alone and soil mixtures to
provide more realistic results about leaching behavior and transport parameters of heavy metals.
The soils, fly ashes their mixtures prepared for CLTs tests were the same materials prepared for
WLTs. Air-dried soil was sieved from U.S. No.4 (0.425mm) sieve. All specimens were
compacted in a PVC mold having 101.6 mm diameter and 116.4 mm height by using standard
Proctor compaction effort (ASTM D 698). Table 3.4 provides the optimum moisture contents
(OMCs) and maximum dry unit weights (γdm) of the mixtures based on compaction tests. PVC
molds were preferred to minimize the outside effects on effluent metal concentrations. All soil
mixtures were cured for 7 days in a humidity chamber with 100% relative humidity and 21 Cº
following compaction.
After curing, the CLTs were started immediately. The columns were operated in an up-
flow mode with flow provided by a peristaltic pump on the influent line. The polypropylene (PP)
influent lines were connected to a polyethelene reservoir tank which was filled with the 0.1 M

11
NaBr solution with adjusted pH (pH 6.5~7). On the effluent end of the column,
polytetrafluoroethylene (PTFE) tubing transferred the effluent solution into the collection bottle.
A sketch of the column test set up is shown in Figure 3.2. An inflow rate of 60 mL/hr was used
for all tests following the recommendations of Gelhar et al. (1992) and Morar (2007).
A 0.1 M NaBr solution was used to provide influent with an ionic strength comparable to
that of percolating water (Papini et al. 1999, Bin-Shafique 2006). The solution was prepared with
NaBr salts dissolved in ASTM Type II water. Br was selected because it is a non-reactive tracer.
pH of the influent solution was open to atmosphere and adjusted by adding NaOH solution to
stay between 6.5 and 7.
During the first three days of testing, frequent sampling (every 4 hours) was necessary in
order to catch the breakthrough curve describing the leaching of each metal studied. After 72 h,
the sampling frequency was decreased to twice a day for two days, and 2 to 7 times a week as the
temporal changes in the metals concentrations became less significant. pH and electrical
conductivity measurements were recorded immediately after the sample collection. The protocol
for sample filtration and preservation followed those employed in WLTs.
3.3.3 Chemical Analysis
pHs of the leachate samples collected from the CLTs and WLTs were determined following the
methods outlines in ASTM D1293. pHs of the fly ashes were determined by using SW-846
Method 9045. Three replicate samples were measured for each sample and the mean values were
reported. The metals selected for analysis were Ag, Al, Ba, Be, Ca, Cd, Co, Cr, Cu, Fe, Hg, Mn,
Ni, Pb, Sb, Si, Sr, TI, V, Zn. The selection was based on the total elemental analyses presented in
Table 3.3. However, initial spectroscopy analyses showed effluent concentrations below the
detection limits for all metals, except Al, Cr, Cu, Fe, Mn, Sb, V, Zn. These eight metals pose

12
health concerns based on the recommendations of the U.S. Environmental Protection Agency,
and therefore, included in further analyses. The metals also represent different mobilities. For
instance, at the pHs typical of soil-fly ash mixtures (10-12.5), Cr forms oxyanions that can be
very mobile, whereas Al forms hydroxyl compounds and their attachment to the soil surface
depends on the solubility level.
The concentrations of all metals were determined by inductively coupled plasma optical
emission spectroscopy (ICP-OES) using a Varian Vista-MPX CCD Simultaneous ICP-OES
instrument. All sampling equipment that contacted the leachate samples was acid cleaned, dried,
and bagged in clean and sealed bags. Blanks were run every 10-20 analyses and the calibration
was verified every 10 analyses. A reagent blank was tested every 20 samples and a spiked
sample was analyzed every 10 samples. Minimum detection limits (MDLs) for ICP-OES were
determined for each metals and a set of calibration standards according to the U.S. Code of
Federal Regulations Title 40. The MDLs for Al, Cr, Cu, Fe, Mn, Sb, V, and Zn metals were
determined as 2.5 ppb, 0.5 ppb, 0.7 ppb, 3.2 ppb, 0.05 ppb, 3 ppb, 0.1 ppb, and 1 ppb,
respectively.
3.4 RESULTS
3.4.1 Water Leach Tests
Triplicate batch water leach tests (WLTs) using two leaching solutions were conducted on
different combinations of mixtures. These included URM only, fly ash only, and several unpaved
road material (URM)-fly ash- lime kiln dust (LKD) mixtures. Table 3.5 summarizes the pH and
electrical conductivity of the specimens tested.
Figure 3.3 shows that the rate of increase in pH was initially high and addition of LKD
above 2.5% by weight did not affect pH significantly. It is speculated that an increase in LKD
13
amount increased the release of free lime (CaO), hydrated calcium silicate (C-S-H) and
portlandite (Ca (OH2)) which resulted in increase in pH values. The fly ash, as compared to
LKD, had little effect on the resulting pH of the mixture due to its relatively lower calcium
content (Table 3.5). All three fly ashes except Brandon Shores (BS) fly ash used in this study had
calcium contents of less than 5% compared to a calcium content of approximately 60% for LKD.
Such calcium contents resulted in high pH contents for the mixtures, the values being higher than
8.5, the allowable limit in various states including Maryland.
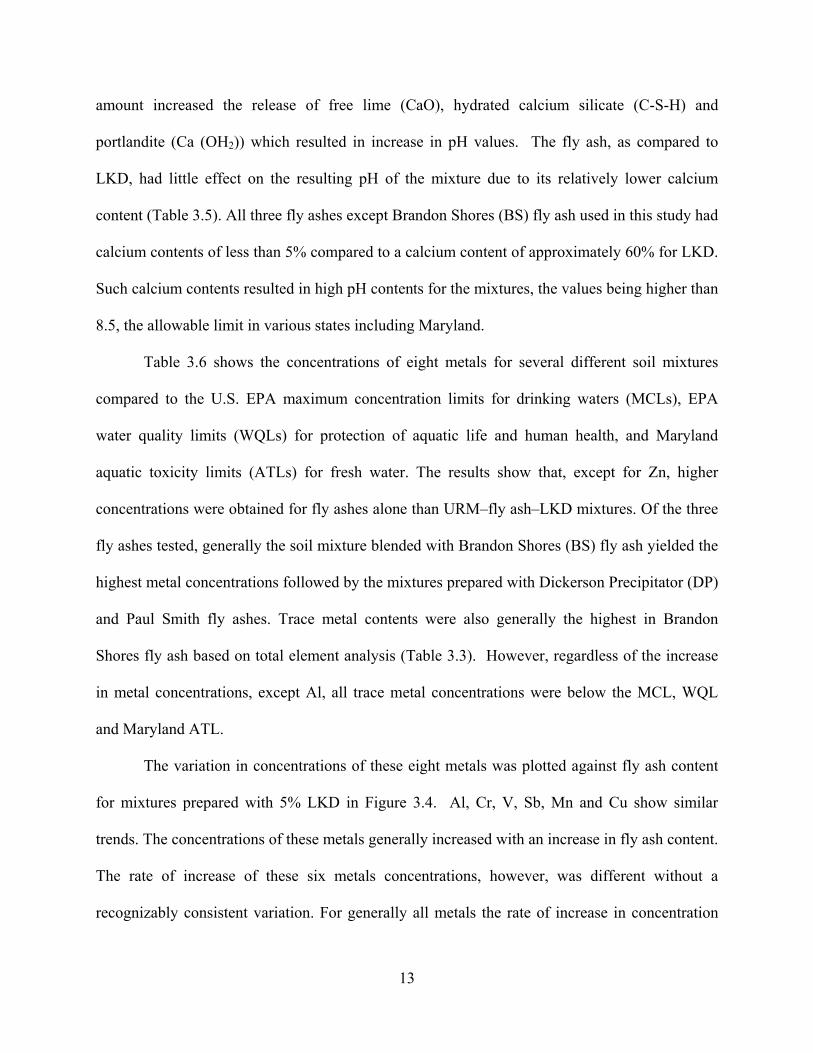
Table 3.6 shows the concentrations of eight metals for several different soil mixtures
compared to the U.S. EPA maximum concentration limits for drinking waters (MCLs), EPA
water quality limits (WQLs) for protection of aquatic life and human health, and Maryland
aquatic toxicity limits (ATLs) for fresh water. The results show that, except for Zn, higher
concentrations were obtained for fly ashes alone than URM–fly ash–LKD mixtures. Of the three
fly ashes tested, generally the soil mixture blended with Brandon Shores (BS) fly ash yielded the
highest metal concentrations followed by the mixtures prepared with Dickerson Precipitator (DP)
and Paul Smith fly ashes. Trace metal contents were also generally the highest in Brandon
Shores fly ash based on total element analysis (Table 3.3). However, regardless of the increase
in metal concentrations, except Al, all trace metal concentrations were below the MCL, WQL
and Maryland ATL.
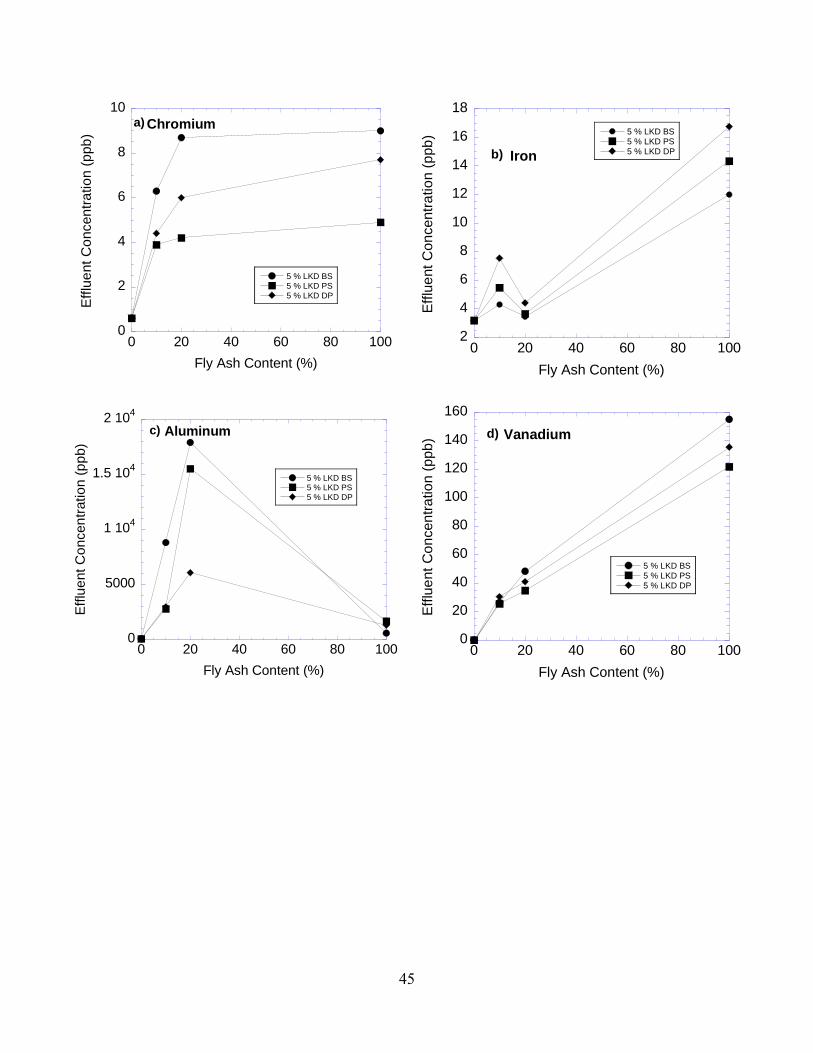
The variation in concentrations of these eight metals was plotted against fly ash content
for mixtures prepared with 5% LKD in Figure 3.4. Al, Cr, V, Sb, Mn and Cu show similar
trends. The concentrations of these metals generally increased with an increase in fly ash content.
The rate of increase of these six metals concentrations, however, was different without a
recognizably consistent variation. For generally all metals the rate of increase in concentration

14
was high initially as fly ash amount was increased from 0% to 10% by weight, but the rate
generally decreased when the fly ash amount was increased from 10% to 20%.
The effluent concentrations of all metals, except Zn, were higher for the fly ash alone
than the soil alone. For the soil-fly ash-LKD mixtures, a higher fly ash contents generally yielded
higher effluent concentrations of metals, which is consistent with the higher values for fly ash
alone. However, the increase in metal concentrations was not linear with fly ash content, even
though the mass of metals in soil mixture increases approximately linearly with increasing fly
ash content. Therefore, the use of linear dilution calculations will underestimate the resulting
concentrations of metals from soil mixtures.
The fly ashes were richer in Cr, Cu, V, Mn and Sb metals than the URM alone based on
total elemental analyses (Table 3.3). Thus, an increase in Cr, Cu, V, Mn and Sb concentrations
with the incremental increase of fly ash content in soil mixture observed in Figure 3.4 is
expected.
High concentrations of Al were observed in the effluent leachates. As with Cr, the
solubility of Al is highly dependent on pH of the aqueous solution. The solubility of Al is
minimum at a pH of about 6.5 and increases with increasing pH values (Lim et al. 2004,
Komonweeraket et al. 2010). As seen in Table 3.6, the aluminum concentration in fly ashes
alone was at least 30 times lower than that of the mixtures. The addition of the LKD is most
probably responsible for leaching of Al. Aluminum produces anionic species and cannot be
absorbed by the negatively charged surface. High pH values may have showed a significant
change in the size of negatively charged particle surface occupied by the hydrogen ions, causing
a serious space decrease for Al and other metals (Sparks 2003). Figure 3.4 shows that an
increase in fly ash content caused a decrease in Zn concentration as URM contains higher
15
amounts of Zn than all the three fly ashes based on total elemental analyses. On the other hand,
an increase in LKD content from 2.5% to 5% LKD caused an increase in Zn concentrations in
the aqueous solution. Goh and Tay (1993) and Ghosh and Subbaroa (1998) also showed that Zn
concentration increased when pH was increased from 9 to 12 which is controversial with the
findings in the current study. The reason for that could be explained as the main metal resource is
the dominant parameter that affects the leaching of Zn in this situation.
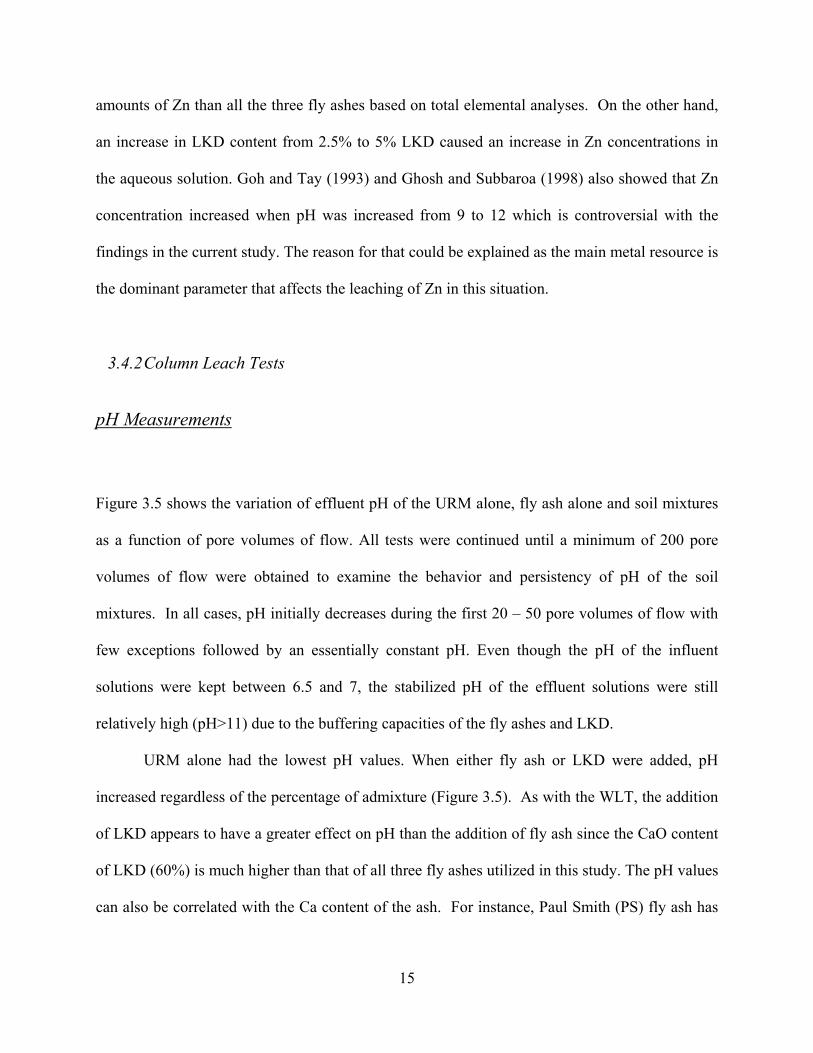
3.4.2 Column Leach Tests
pH Measurements
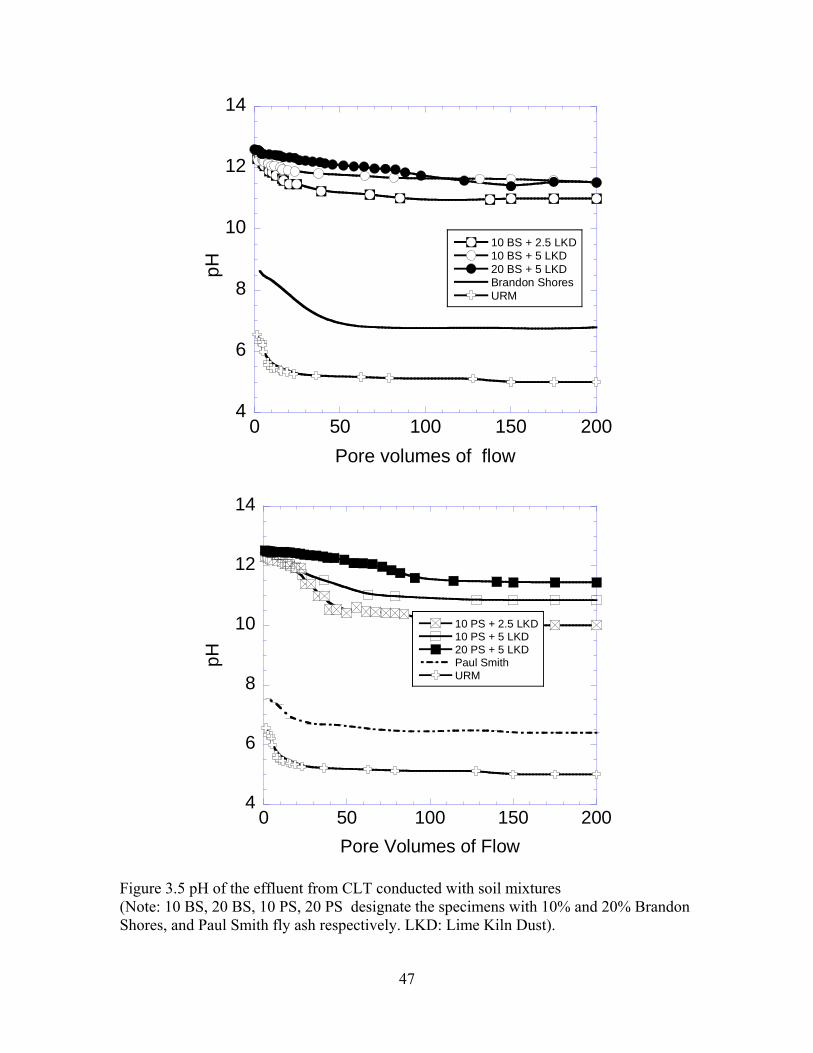
Figure 3.5 shows the variation of effluent pH of the URM alone, fly ash alone and soil mixtures
as a function of pore volumes of flow. All tests were continued until a minimum of 200 pore
volumes of flow were obtained to examine the behavior and persistency of pH of the soil
mixtures. In all cases, pH initially decreases during the first 20 – 50 pore volumes of flow with
few exceptions followed by an essentially constant pH. Even though the pH of the influent
solutions were kept between 6.5 and 7, the stabilized pH of the effluent solutions were still
relatively high (pH>11) due to the buffering capacities of the fly ashes and LKD.
URM alone had the lowest pH values. When either fly ash or LKD were added, pH
increased regardless of the percentage of admixture (Figure 3.5). As with the WLT, the addition
of LKD appears to have a greater effect on pH than the addition of fly ash since the CaO content
of LKD (60%) is much higher than that of all three fly ashes utilized in this study. The pH values
can also be correlated with the Ca content of the ash. For instance, Paul Smith (PS) fly ash has
16
lower pH than Brandon Shores (BS) fly ash (Table 3.2), which yielded in relatively lower
stabilized pH values in CLTs (Figure 3.5).
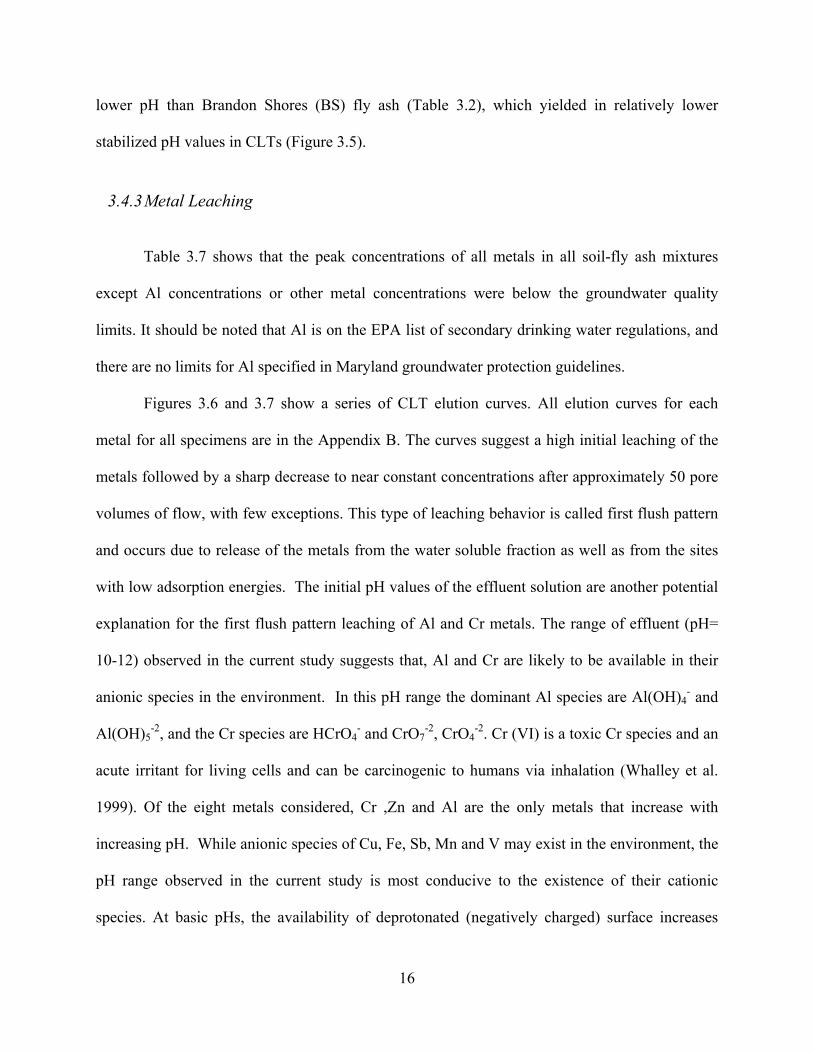
3.4.3 Metal Leaching
Table 3.7 shows that the peak concentrations of all metals in all soil-fly ash mixtures
except Al concentrations or other metal concentrations were below the groundwater quality
limits. It should be noted that Al is on the EPA list of secondary drinking water regulations, and
there are no limits for Al specified in Maryland groundwater protection guidelines.
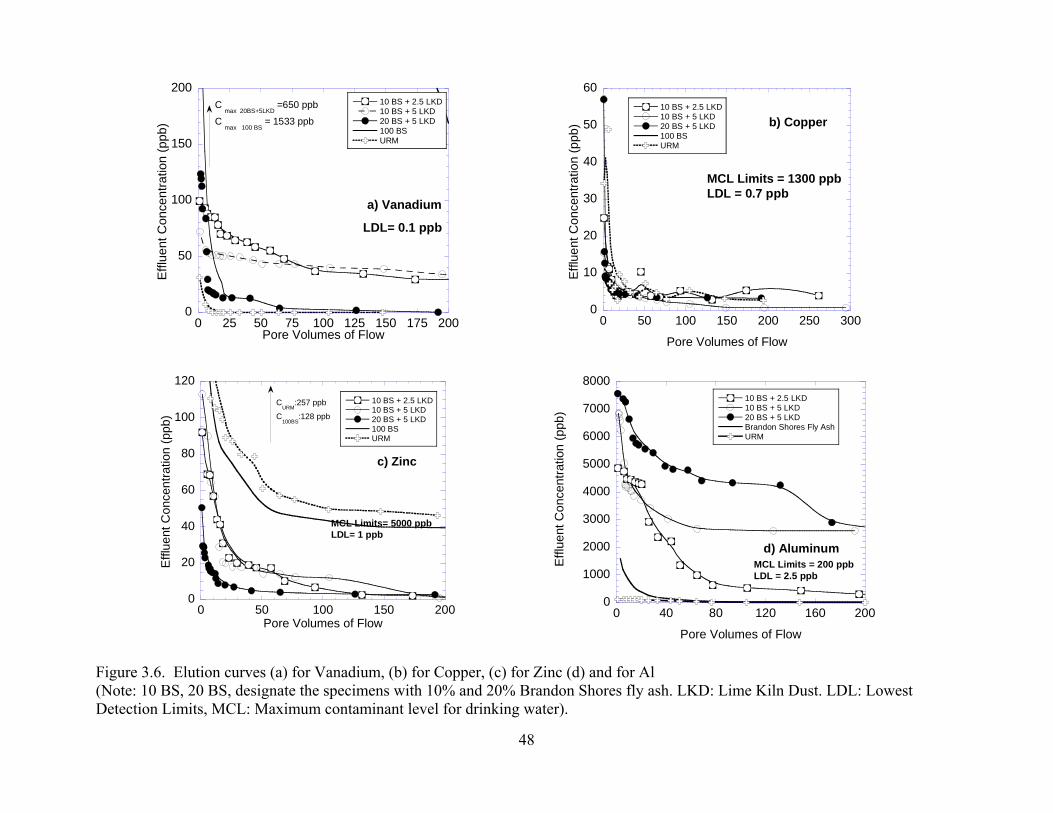
Figures 3.6 and 3.7 show a series of CLT elution curves. All elution curves for each
metal for all specimens are in the Appendix B. The curves suggest a high initial leaching of the
metals followed by a sharp decrease to near constant concentrations after approximately 50 pore
volumes of flow, with few exceptions. This type of leaching behavior is called first flush pattern
and occurs due to release of the metals from the water soluble fraction as well as from the sites
with low adsorption energies. The initial pH values of the effluent solution are another potential
explanation for the first flush pattern leaching of Al and Cr metals. The range of effluent (pH=
10-12) observed in the current study suggests that, Al and Cr are likely to be available in their
anionic species in the environment. In this pH range the dominant Al species are Al(OH)4- and
Al(OH)5-2, and the Cr species are HCrO4
- and CrO7-2, CrO4
-2. Cr (VI) is a toxic Cr species and an
acute irritant for living cells and can be carcinogenic to humans via inhalation (Whalley et al.
1999). Of the eight metals considered, Cr ,Zn and Al are the only metals that increase with
increasing pH. While anionic species of Cu, Fe, Sb, Mn and V may exist in the environment, the
pH range observed in the current study is most conducive to the existence of their cationic
species. At basic pHs, the availability of deprotonated (negatively charged) surface increases

17
(Stumm and Morgan1996). This may have led to an increase in adsorption of cationic species
and caused a decrease in the concentrations of Cr, Cu, Fe, V, Sb and Mn into the solution. Since
the initial pH of the effluent was high, it probably enhanced the solubility of anionic species of
these Cr, Al, Zn metals due to unavailability of positively charged surface species for
complexation. However, the pH values decreased from pH~12 to pH~10.5 after nearly 50 pore
volumes of flow and caused a decrease in the solubility of anionic species of Al, Zn and Cr in the
effluent solution.
The solubility of some metals is highly dependent on the pH of the solution. Table 3.5
shows that the pH of the soil mixtures was very high (pH> 11.5), indicating a very basic effluent
solution. It is well-known that the solubility of Cu decreases significantly with increasing pH
(Ricou et al. 1999, Yan et al. 2001, Goswami and Mahanta 2007). It is assumed in alkaline
conditions that Cu metals are either included in low-solubility minerals or fixed in precipitates
(Wehrer and Totsche 2008), which is consistent with the findings obtained in this study. Wang et
al. (2006) related ammonia content of fly ashes to Cu adsorption capability. Their results
indicated that the Cu concentration increased between a pH of 7 to 10 and then began to decrease
at a pH greater than 10. The variations in Cu concentrations as a result of LKD addition in this
study (Table 3.7) are consistent with the findings of Wang et al. (2006).
Table 3.7 shows that the Cu in the leachate generally decreased with increasing pH. As
seen in Table 3.5, an increase in LKD amount from 2.5 % to 5 % by weight caused an increase in
pH of the effluent solution, which may have resulted in a reduction in Cu concentrations in the
aqueous solution due to the more adsorption of Cu metals to the soil surface (Sparks 2003).
Jegadeesan et al. (2008) also showed that the leaching of cationic metals such as Cu can be very
low in alkaline conditions (pH > 10). Material amendments into soils that include Fe oxides and

18
alkaline materials can also reduce the mobility and availability of metals in soil by adsorption,
complexation, precipitation or combination (Kumpiene et al. 2007). Brown at al. (2005) showed
that iron oxides have a high sorptive capacity for metals that help decrease metal concentrations
and X-ray diffraction analyses conducted on fly ashes tested in the current study revealed
significant amounts of Fe2O3 (3.2 – 5.8 % by weight).
The leaching of aluminum from the soil fly ash mixtures is controlled by the solubility of
aluminum hydroxides (Roy 1984, Komonweeraket 2007). The leaching behavior of Al shows an
amphoteric pattern which represents higher leaching concentrations at extreme pH levels and
lesser leaching concentration at neutral pH (Langmuir 1997, Kenkel 2003). Tables 3.6 and 3.7
show that the Al concentrations rise with an increase in LKD and fly ash contents suggesting that
Al leaching also reflects an amphoteric pattern. Aluminum is very insoluble at neutral pH
(Sparks 2003) and its solubility is controlled by dissolution-precipitation oxide and hydroxide
minerals (Komonweeraket et al. 2010). The behavior of Al leaching is good agreement with
other studies which shows that Al leaching is the lowest at neutral pH and highest at very basic
pH (Lim et al.2004, Komonweeraket et al.2010).
The amounts of metals that exist in chemical compositions of the fly ashes are also
important to define the leaching behavior of the metals. The Al content, for example, is high in
all three fly ashes (Table 3.3) resulting in significantly high Al concentrations in the effluent
leachate. Similar to other metals studied, Al also showed the first flush leaching behavior mainly
due to basic conditions at the initial pore volumes which probably enhanced the Al
solubilization. Edil et al. (1992) and Chichester and Landsberg (1996) reported similar first-flush
patterns for metals with high concentrations and a sharp decrease at early PVFs flowed by
flattening of the elution curves during column testing of soil-fly ash mixtures. Ogunro and

19
Inyang (2003) also observed wash-out and detachment of Al and Cu metals by percolating
solution during the initial stages of a column test. They attributed this phenomenon to an increase
in the chemical potential which initiated the leaching of metals from the solid matrix into the
surrounding solution. Such an increased chemical potential continued to occur until the
concentration difference between the leachant and the solid material was reduced and a steady-
state condition was reached.
Figure 3.7 shows that an increase in the initial Cr metal concentrations occurs with
increasing fly ash content. This level of increase is due to the large amounts of Cr concentrations
in the fly ash itself. At initial pore volumes of flow, relatively high levels of Cr were observed in
mixtures that included 20% fly ash, however, after nearly 20 PVFs the concentrations for all
mixtures were comparable. Solubility of Cr is highly dependent on pH of the aqueous solution.
Cr mobility is very low at a neutral pH, but the metal is very mobile at very acidic and basic
conditions. As seen in Table 3.7, an increase in LKD caused an increase in pH and Cr
concentrations in the effluent leachate. At a high pH, Cr generally produces anionic species
which cannot be retained on the negatively charged fly ash surfaces. No testing was conducted
to identify the oxidation state of Cr speciation in the leachate, however Cornelis (2008) claimed
that Cr is always hexavalent because equilibrium with insoluble Ca-CrIII minerals causes
Cr(OH)-4 concentrations to be very low. CrIII could be found only in the soil mixtures having
strong reductive capacity and low Ca contents that cause some soluble Cr(OH)-4 to exist
(Cornelis 2008). Ca–CrIII compounds may exist in alkaline leachates as Ca2Cr2O5 (Jing 2006).
At basic conditions, the solubility of CaCrO4 is very high compared to other Cr containing
compounds (Allison et al. 1991). On the other hand, most of the oxyanionic species tend to
produce surface adsorption complexation with Fe oxides. Dzombak and Morel (1990) showed

20
that desorption of CrIII from Fe oxides above pH>12.5 and CrVI starts at pH >7. Pourbaix
diagrams for the Cr-O-H system indicate that Cr determined in WLT leachates in the current
study is likely to exist as CrO4-2 or HCrO4
- for the pH conditions present (pH= 10 to 12.5)
(Brookins 1988). Thus, it should be kept in mind that most of the Cr concentrations determined
in the leachate are likely to be CrVI which is of concern to environmental safety (Whalley et al.
1999).
Table 3.7 shows that the leaching of antimony decreases with an increase in pH in
alkaline conditions and increases with fly ash amount which is most likely due to an increase in
main metal source in the soil fly ash mixture. Leaching of antimony (Sb) is significantly related
to the redox potential and pH conditions of the aqueous solution. Cornelis (2008) suggests that
SbV is more commonly found in alkaline waste leachates (pH>10). However, Leuz et al. (2006b)
explained that oxidation of SbIII by Fe oxides are generally faster at a high pH which is less
soluble than SbV in alkaline conditions (Cornelis et al. 2008). Garavaglia and Caramuscio
(1994) reported that no solubility-controlling solid phases exist for Sb. Jackson et al. (1999) and
Komonweeraket et al. (2010) found that the leaching of Sb is the highest around neutral pH and
decreases at extreme pH conditions which is in agreement with the findings of the current study.
There is growing interest in leaching behavior of Vanadium (V) over the past years.
Similar to antimony, V is also very redox and pH sensitive. Some oxidation states of V can form
oxyanions at very alkaline conditions which cause a desorption of V from the soil surfaces due to
the negatively charged surfaces of the soil surface. Vanadium can be found as V(OH)+2 ,
VO(OH)+2 and VO-3
4 species (Cornelis et al. 2008). Pavageau et al. (2004) found only VV in fly
ash. Even though it is possible that the oxyanionic species of V desorps from the soil and fly ash
particles surface, Table 3.7 shows retention of total V is higher than the release of oxyanionic V

21
species, which may be a cause in decrease in V concentrations with an increase in LKD content
from 2.5% to 5% by weight. Since the oxidation states of the both influent and effluent solutions
were not constant, the oxidation states of the V may fluctuate and may not transform the
oxyanionic vanadium species.
Fe and Mn metals exhibited a similar leaching behavior (Table 3.6 and 3.7). Both Fe and
Mn concentrations in the aqueous solutions tended to decrease or remain nearly the same with an
increase in pH. Both Mn oxides and Fe oxides are very important for the surface complexation of
the other oxyanions in the aqueous solutions (van der Hoek et al.1996, Piantone et al. 2004,
Kumpiene et al. 2006). Most of the oxyanions can complex during the co-precipitation of iron
metals in the vadose zone (Dixit and Hering 2003, Peacock and Sherman 2004, Jegadeesan et al.
2008, Dutta et al. 2009). Precipitation of FeIII starts as Fe – (hydr)oxides after pH > 6 (Espana et
al. 2005, Cornelis et al. 2008 and Dutta et al. 2009). Metal adsorption of Fe-oxide is increasing
with pH (Cornell and Schwertmann 2003) which causes a decrease in the metal concentrations in
the effluent solutions. The current study showed that both Mn and Fe concentrations decreases
with an increase in pH, which is an agreement with the previous studies (Cornelis et al. 2008,
Dutta et al. 2009 and Komonweeraket et al. 2010).
Figure 3.6 shows the variation of Zn with fly ash content. The total elemental analyses
conducted on the materials showed that higher amounts of Zn exist in URM than the three fly
ashes (Table 3.3). Thus, an increase in fly ash content may have caused a decrease in Zn
concentration in the effluent solution. Even though an increase in fly ash content caused an
increase in pH of the materials tested in the current study (Table 3.5), this effect was probably
suppressed by high amounts of Zn in URM. The results presented in Table 3.7 suggest that the
leaching of Zn follow an amphoteric pattern, which was also confirmed by Lim (2004),

22
Garrabrants (2004) and Komonweeraket et al. (2010). On the other hand, Jegadeesan et al.
(2008) showed that a decrease in leaching of Zn with pH is due to its surface complexation to Fe-
Al-oxide or silicate material or the formation of insoluble hydroxides. Futhermore, beyond
neutral pH, the Zn metals start precipitating as Zn(OH)2 and dissolve completely under very
alkaline conditions as Zn(OH)3- (Cotton and Wilkinson 1999). Shrivastava et al. (1998) also
mentioned that Zn may be transformed to the oxidizable forms which are more soluble in
alkaline conditions and lime addition may increase the possibility of this transformation in the
aqueous solutions.
3.5 Comparison of WLTs and CLTs
Attempts were made to compare the water leach and column leach test data obtained from URM
alone, fly ash alone and soil- fly ash-lime kiln dust mixtures. The peak effluent concentrations
from the CLTs (Ci) are plotted against the concentrations from the WLTs (Cw) in Figure 3.8. The
peak concentrations found in the leachate from the column leaching tests are consistently greater
than the concentrations from the water leach tests. Differences in L:S ratio between the two
leaching tests (a ratio of 20:1 in WLTs versus 0.1:1 in CLTs in the initial PVFs) could be
responsible for the significant metal concentration differences measured in these two leaching
tests. Figure 3.8 shows that Ci for Al is 2 to 50 times higher than Cw. Similarly, Ci for Cu, Zn, V,
Fe, Sb and Mn is up to 40, 30, 11, 100, 50 and 20 times higher than Cw, respectively. The only
exception was for the Cr concentrations, and a 1:1 linear relationship existed between
concentrations measured from CLTs and WLTs. The lack of linear relationship between the
WLT concentrations and the peak concentrations from CLTs for most metals could be attributed
23
to the variation in effluent pHs. Bin Shafique et al. (2006) made similar observations during
comparison of WLTs and CLTs.
The scale factors mentioned above should be used with caution as the testing conditions
between the CLT and WLT are different. First, the liquid-to-solid ratio remains constant in
WLTs but varies in CLTs (Ogunro and Inyang, 2003). A second issue of concern is the
difference in duration of the tests. CLT is a dynamic test and the data fluctuates for an extended
period of time, while WLTs are finalized in 24 hours. The peak concentrations in CLTs typically
occur in the transient stage, and may be different than the ones observed in WLTs. Third, the
water flows smoothly through the column set-up while in the WLTs the samples are agitated
aggressively, likely enhancing the surface contact of the leaching solution and the solid
particulates. This may result in both a higher leaching rate of the metals and a shorter period of
time to the equilibrium state between the liquid and solid phases. The pH conditions may also be
influenced by this agitation as well as by the dissolution of the mineral components of the metals
that were tested. Because the speciation of Al, Cr, V and Sb are highly dependent on redox
conditions, the different environments of the two tests are likely to contribute to the difference in
the test results.
3.6 . CHEMICAL TRANSPORT MODELING
3.6.1 Numerical Model
The flow and transport problem was simulated using WiscLEACH, a recent and verified
windows-based software package for simulating water and solute movement in two-dimensional
variably saturated and unsaturated media. Three analytical solutions to the advection-dispersion-

24
reaction equation are combined in WiscLEACH to develop a method for assessing impacts to
groundwater and the soil vadose zone caused by leaching of trace elements from fly ashes used
in highway layers.
WiscLEACH simulations were conducted to study the locations of maximum soil vadose
zone and groundwater concentrations (e.g., at the centerline of the pavement structure, at the
vicinity of point of compliance) and contours of trace metals are predicted at different years as a
function of depth to groundwater, thickness of the base layer, percent fly ash by weight,
hydraulic conductivity of the least conductive layer in the vadose zone, hydraulic conductivity of
the aquifer material and the initial concentration in the fly ash.
Flow Simulation
Input to the model consists of the annual precipitation rate were found for State of
Maryland from the National Weather Service, physical properties of the pavement layers and
underlying soils were used from Li et al. (2007), leaching characteristics of the byproducts
derived from column leaching tests and transport parameters for the subsurface layers were used
from Li et al. (2007). The parameters that were used in the current study, are summarized in
Table 3.8 and Table 3.9.
Figure 3.9 shows that schematic diagram of a typical highway structure including asphalt
layer along with the pavement and shoulders, fly ash stabilized base layer and a subgrade. The
depth of groundwater can be adjusted according to the properties of the region. All materials in
the profile are assumed to be homogeneous and isotropic. In addition, in WiscLEACH it is
assumed that all precipitation falling on the pavement surface, the shoulders and surrounding
ground will infiltrate the soil (Li et al. 2007).

25
3.6.2 Model Formulation in Vadose Zone
WiscLEACH considers only steady 1D unit gradient flow in the pavement layers and the
soil vadose zone and the rate of flow qv is determined by the comparison of the least conductive
layer in the profile and the annual precipitation rate. The lowest of these values are used as the
rate of flow in the program. It is assumed that possible horizontal movement of the flow is
ignored whereas the rate of vertical flow may change with depth, but the net infiltration rate is
assumed to equal qv. No water loss is assumed and the water infiltrates to the soil vadose zone
toward groundwater without any loss on the pavement and ground surface. Surface runoff and
evaporation from the pavement surface are ignored (Li et al. 2007). In the current study leaching
pattern is first-flush leaching from the HCFA stabilized base layer. In WiscLEACH a first-flush
leaching from the HCFA base layer is assumed to follow the ADRE with linear, instantaneous
and reversible sorption (Li et al. 2007).
In WiscLEACH, transport in the vadose zone beneath the HCFA layer is assumed to
follow the ADRE for 1D steady state vertical flow with 2D dispersion and linear, instantaneous
and reversible sorption (Li et al. 2007).
Equation 1.
C: Metal concentration
T: Time
X: Horizontal distance from the centerline of the pavement
Z: Depth below ground surface
υz: Seepage velocity in vertical direction
Dx: Dispersion coefficient in x direction

26
Dz: Dispersion coefficient in z direction
R: Retardation factor
The analytical solution to Equation 1 is obtained by applying the following initial and
boundary conditions (Li et al. 2007):
Equation 2.a
Equation 2.b
Equation 2.c
Equation 2.d
Co: Initial metal concentration
ZT: Depth of the top of the fly ash stabilized base layer
ZB: Depth of the bottom of the fly ash stabilized base layer
L: Sum of the width of the shoulder and half of the pavement width
Equation 2a and 2b indicate that the fly ash stabilized base layer is the only source of trace
elements and no trace elements leached from the pavements or ground surface that is above the
fly ash stabilized base layer. Equations 2c and 2d imply that the effect of dispersion and
diffusion in the soil vadose zone is insignificant with a distance from the pavement surface and

27
the centerline of the pavement structure. The analytical solution to Equations 1 and 2 is (Li et al.
2007):
Equation 3. Analytical solutions to Equations 1 and 2
Equation 3 is applied from the surface of the pavement to the groundwater table (Fig. 9).
3.6.3 Model Formulation in Groundwater
The transportation of the trace metal elements that leach into the groundwater is at
horizontal and vertical direction, although the direction of horizontal flow movement is dominant
in the groundwater (Li et al. 2007). The groundwater flow is assumed to be saturated, and the
transport of the trace elements is assumed to follow the ADRE with instantaneous, reversible and
linear sorption as assumed in transportation in soil vadose zone (Li et al. 2007).
Equation 4.
C: Metal concentration

28
T: Time
υh: Groundwater seepage velocity in the horizontal direction
Dxw: Hydrodynamic dispersion coefficient in horizontal direction
Dzw: Hydrodynamic dispersion coefficient in vertical direction
Rw: Retardation factor in groundwater
.In Equation 4 the cross – dispersion terms are ignored due to the dominant horizontal flow in a
uniform and isotropic medium (Li et al. 2007). An analytical solution to Equation 4 for the
following initial and boundary conditions:
Equation 5.a
Equation 5.b
Equation 5.c
Equation 5.d
zgwt: Depth of groundwater table
g(t): Metal concentration at the groundwater table
x1, x2: Lateral extent over g(t) applies
It is assumed that initially groundwater is not contaminated with any trace elements or any other
elements that can effect to the sorption of the trace elements which is suggested by Equation 5a.

29
Equation 5b indicates that the amount of trace elements in the vadose zone of the soil directly
above the groundwater table is equal to the amount in the groundwater. Equations 5c and 5d
indicate that the effect of diffusion and dispersion in groundwater are ignorable at the locations
that are very far from the centerline of the pavement and the groundwater table. The solution to
Equations 4 and 5 for a condition if Z is larger than ZGWT is (Li et al. 2007):
Equation 6. Analytical solution of the Equation 4 and 5
Equation 6 estimates the metal concentrations that leached from a line source at the groundwater
table between X1 and X2.
3.6.4 WiscLEACH Results
WiscLEACH was used to predict the metal concentrations in contour graphs at different years
and determine the location of maximum concentrations of the trace metals in the groundwater in
100 years. The input data in Table 3.8 used for all the soil mixture same to be consistent. The
hydraulic conductivities and transport parameters of the pavement layers and soil mixtures were
summarized in Table 3.9. Layer thicknesses for each different specimen were obtained from
Cetin et al. (2010). The transport parameters were determined from laboratory tracer tests. The
pavement properties and subgrade properties were used from Li et al. (2007). The retardation
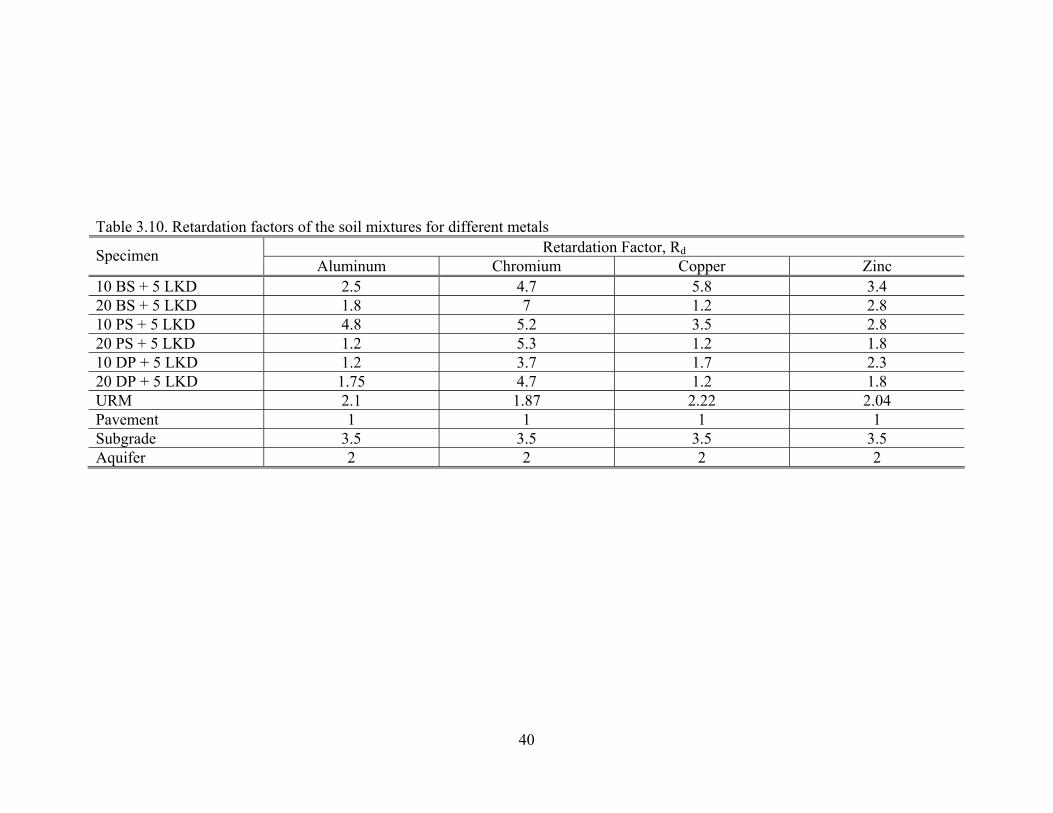
factors for all soil mixtures and different metals were shown in Table 3.10.

30
The pavement structural variables that were needed to be input into the program were
provided by Cetin et al. (2010). The annual precipitation rate selected in this study was 2.19
m/year which is the average annual rainfall in the State of Maryland according to the U.S.
Geological Survey. The leaching behavior of the four metals for all soil mixtures is shown in The
Trace metals concentrations in the column leach tests (CLT) effluents are summarized in Table
3.9. The retardation factor for the specimens and the metals were determined from laboratory
tracer tests and shown in Table 3.10.
Figures 3.10 and 3.11 show the contour plots of the predicted concentrations of Cr, Al, in
the soil vadose zone as well as the groundwater, respectively. Other contour plots for Cr, Al, Zn
and Cu are in Appendix A. The contour plots provide the predictions of the metal concentrations
after 1, 2, 4 and 8 years of construction. As expected, metal concentrations in the vadose zone
decrease significantly with time. Previous studies show that the leaching of metals from the fly
ash amended soil exhibits a first-flush pattern, meaning initially the release of metals in the
vadose zone is very high, then with time the leached metal concentrations decreases significantly
(Bin- Shafique et al.2006, Goswami and Mahanta 2007). Except Al, the other metals were not
observed in the groundwater even after 10 years, according to the WiscLEACH model.
As shown in Figures 3.10 and 3.11 the metal concentrations decreases with distance from
HCFA stabilized layer surface and groundwater surface which is most probably due to the
dispersion of the metals in the soil vadose zone. High annual precipitation rate may also have
caused an increase in the leaching rate of the metals from HCFA stabilized base layer and
absorbing the metals before reaching to the groundwater.

31
3.7 CONCLUSIONS
A laboratory study was conducted to investigate the environmental feasibility of reusing
chemically stabilized road surface material in construction of highway bases. Non-cementitious
off-spec high carbon fly ash was activated with lime kiln dust and used to stabilize an unpaved
road material (URM) collected from within the state of Maryland. The effects of both fly ash and
lime kiln dust addition on environmental suitability of highway base layers were studied. A
series of column leach and water leach tests were performed to evaluate leaching potential of
heavy metals from high carbon fly ash. The observations from the current study are as follows:
1. The initial pH values from column leach tests (CLT) were relatively higher than those
measured in water leach tests (WLT) most likely due to difference between the liquid-to-
solid-ratio in two tests (a ratio of 20:1 in WLTs versus 0.1:1 in the initial PVFs in CLTs).
2. The metal concentrations increased with increasing fly ash content in WLTs which can
be a result of the increased total metal amount in the soil compound. The addition of fly
ash, on the other hand, caused an increase in pH values and in concentrations of Cu, Sb,
V and Mn. However, the increase in the metal source (fly ash addition) seemed to be
more dominant compared the effect of pH increase on metal solubility.
3. The addition of lime kiln dust (LKD) had different effects on the leaching of metal into
the porous medium. Since the addition of LKD is directly correlated to a change in pH of
the effluent solutions, it is an important variable to consider in the control of metal
leaching. LKD addition caused a decrease in CLT concentrations of Cu, Sb, V and Mn
due to an increase on the negative surface charge on the solid surface. However, Al and
Cr concentrations increased with LKD addition due to an increase on the solubility of
their anionic species.

32
4. The release of all metals from the soil mixtures in CLTs exhibited a first-flush pattern
followed by a decrease in concentrations. Most of the metals were leached out at the
beginning of the tests, and eventually reached an equilibrium concentration over time (at
50-60 pore volumes of flow). The higher initial pH values of the effluent solutions may
have contributed to an increase in the solubility of anionic species, especially for Al and
Cr.
5. An attempt was made to establish a correlation between the metal concentrations from
CLTs and the metal concentrations from WLTs to provide a practical tool to field
engineers. The concentrations of Al, Cu, Zn, V, Fe, Sb and Mn can be conservatively
estimated from WLTs by multiplying the concentrations with 50, 40, 30, 11, 100, 50 and
20, respectively. However, caution should be exercised in using these correlation factors
as the testing conditions are different for these two systems, due to different liquid-to-
solid ratios, test durations, and agitation motion in the batch procedure as compared to
the relatively smooth fluid movement inside the column set-up.
6. The concentrations of Cr, Sb, V, Zn, Cu, Mn, and Fe were below the EPA MCLs, WQLs
and Maryland ATLs. Al was only the exception. It should be noted that Al is on the EPA
list of secondary drinking water regulations, and there are no limits for Al specified in
Maryland groundwater protection guidelines.
7. Numerical simulations showed that the metal concentrations decrease over time and
distance and that all the metals are sufficiently dispersed in the vadose zone such that
they do not reach the groundwater after approximately 8 years.

33
TABLES

34
Table 3.1. Index properties of the materials used in current study
Classification
Sample
Cu Gs wopt (%)
γd (kN/m3)
LL (%)
PI (%)
Gravel Content
(%)
Fines Content (<75
µm) (%)
Fineness (>45 µm)
(%)
USCS
AASHTO
URM 6.7 2.64 13.4 18.8 NP NP 30 3 0 SP A - 1 – b (0) BS 0.43 2.17 ─ ─ NP NP ─ 80 60 ML A - 2 – 4 (0) PS 11 2.2 ─ ─ NP NP ─ 95 86 ML A - 2 – 4 (0) DP 3.6 2.37 ─ ─ NP NP ─ 85 77 ML A - 2 – 4 (0) .
Table 3.2. Chemical composition of the fly ashes. Concentrations of major minerals were determined by X-ray fluorescence spectroscopy analysis. All concentrations are in percentage by weight.
Chemical Composition
Fly ash pH
LOI (%)
SiO2
(%)
Al2O3 (%)
Fe2O3 (%)
CaO (%)
K2O (%)
TiO2 (%)
MgO (%)
Na2O (%)
Cr2O3 (%)
P2O5 (%)
SrO (%)
BaO (%)
BS 9.6 13.4 45.1 23.1 3.16 7.8 1.7 1.4 0.8 0.3 0.02 0.09 0.06 0.06 PS 7.55 10.7 50.8 26.9 5.5 0.7 2.2 1.5 0.6 0.2 0.02 0.2 0.03 0.05 DP 8.8 20.5 34.9 24.4 12.6 3.2 1.1 1.3 0.5 0.3 0.03 1.0 0.2 0.11 URM: Unpaved road material, PS: Paul Smith fly ash, DP: Dickerson Precipitator fly ash, BS: Brandon Shores fly ash, LOI: Loss on ignition. Gs: Specific gravity, Cu: coefficient of uniformity, Cc: coefficient of curvature, woptm: optimum water content, γdmax: maximum dry unit weight, LL: liquid Limit, PL: plastic limit, NP: Nonplastic.

35
Table 3.3Total metal content of the fly ashes and unpaved road material from the total elemental analysis. Sample Al
(ppm) Cr (ppm)
Cu (ppm)
Fe (ppm)
Mn (ppm)
Sb (ppm)
V (ppm)
Zn (ppm)
URM 2367 15.5 1.28 6,313 26.5 0.02 16.5 82.3 BS 28637 65.7 74.7 34,619 114.9 0.01 164.3 58.2 PS 10060 24.3 25.3 10,757 38.2 0.02 53.7 28.5 DP 19257 47.1 58.7 12,770 38.3 0.02 82.4 45.6 Table 3.4. Legend and compositions of the mixtures.
Legend of Mixtures Fly Ash Content (%)
LKD Content (%)
Optimum Water Content (%)
Maximum Dry Unit Weight (kN/m3)
URM 0 0 13.4 18.8
URM+10 BS + 2.5 LKD 10 2.5 10 19.2
URM+10 BS + 5 LKD 10 5 9.5 19.2 URM+20 BS + 2.5 LKD 20 2.5 10 18.5 URM+20 BS + 5 LKD 20 5 13 17.4 URM+10 PS + 2.5 LKD 10 2.5 9.0 18.8 URM+10 PS + 5 LKD 10 5 10 18.8 URM+20 PS + 2.5 LKD 20 2.5 12 17.3 URM+20 PS + 5 LKD 20 5 13 17.0 URM+10 DP + 2.5 LKD 10 2.5 9.0 19.1 URM+10 DP + 5 LKD 10 5 10 19.4 URM+20 DP +2.5 LKD 20 2.5 10 18.1 URM+20 DP + 5 LKD 20 5 12 18.0 Note: BS: Brandon Shores fly ash, PS: Paul Smith fly ash, DP: Dickerson Precipitator fly ash, LKD: Lime kiln dust, URM: Unpaved road material. The numbers that follow the fly ashes and LKD indicate the percentages by weight of admixtures added to the soil.

36
Table 3.5. pH and electrical conductivity values from batch water leach tests
Specimen Name Fly Ash Content (%)
LKD Content (%)
pHNaBr ECNaBr
(mmho)
100 BS 100 - 7.91 8.36
10 BS + 2.5 LKD 10 2.5 11.54 8.43
10 BS + 5 LKD 10 5 11.82 8.96
20 BS + 5 LKD 20 5 11.87 9.19
100 PS 100 - 7.53 8.36
10 PS + 2.5 LKD 10 2.5 11.67 9.07
10 PS + 5 LKD 10 5 12.02 9.91
20 PS + 5 LKD 20 5 12.04 10.06
100 DP 100 - 8.55 8.41
10 DP + 2.5 LKD 10 2.5 11.77 9.34
10 DP + 5 LKD 10 5 12.03 9.90
20 DP + 5 LKD 20 5 12.1 10.14 LKD - 100 12.52 12.44 URM 100 - 4.81 8.08
Note: pHNaBr = pH measured in WLTs with 0.1 M NaBr solution, ECNaBr =electrical conductivity measured in WLTs with 0.1 M NaBr solution. 10 BS, 20 BS designate the specimens with 10 % and 20 % Brandon Shores fly ash respectively, 10 PS, 20 PSdesignate the specimens with 10 % and 20 % Paul Smith fly ash respectively, 10 DP, 20 DP designate the specimens with 10 % and 20 % Dickerson Precipitator fly ash respectively, LKD: Lime Kiln Dust).

37
Table 3.6. Aqueous concentrations of metals from WLTs
Aluminum (mg/L) Antimony (µg/L) Chromium(µg/L) Copper (µg/L) Iron (mg/L) Manganese
(µg/L) Vanadium
(µg/L) Zinc (µg/L)
Specimen Name Caq
NaBr CaqNaBr Caq
NaBr CaqNaBr Caq
NaBr CaqNaBr Caq
NaBr CaqNaBr
100 BS 557 26 9 5.7 12 29.0 156 11.0
10 BS + 2.5 LKD 6158 6 6.3 2.3 4.7 2.0 47.3 4.0
10 BS + 5 LKD 8797 5.7 6.6 2.0 4.31 0.1 26.4 25.8
20 BS + 5 LKD 17886 6 8.7 2.2 3.46 0.2 48.4 21.5
100 PS 1866 14 4.9 3.2 14.35 11.7 121.7 9.1
10 PS + 2.5 LKD 2692 5 3.8 2.7 6.9 0.2 37.5 23.5
10 PS + 5 LKD 2766 3.6 3.9 2.1 5.5 0.1 25.5 51.5
20 PS + 5 LKD 15513 4.3 4.2 2.3 3.67 0.3 34.8 42.2
100 DP 1278 10 7.7 3.2 16.76 0.67 135.6 3
10 DP + 2.5 LKD 2955 5 4.4 2.7 12.60 0.8 49 14.8
10 DP + 5 LKD 3075 4.5 4.5 2.1 7.55 0.3 30.5 51.6
20 DP + 5 LKD 6055 5.3 6 2.5 4.43 0.4 41 32.8
URM 44 <3 0.6 1.26 3.2 <0.05 <0.1 58
U.S. EPA MCL (µg / L) 200 6 100 1300 300 50 NA 5000
U.S. EPA WQL (µg / L) 750 NA 570 340 NA NA NA NA
Chronic Acute Chronic Acute Chronic Acute Chronic Acute Chronic Acute Chronic Acute Chronic Acute Chronic Acute MD ATL (µg / L)
NA NA NA NA 74 570 9 13000 NA NA NA NA NA NA 120 120
Notes: Caq
NaBr = aqueous concentrations measured in WLTs with 0.1 M NaBr solution and; MCL= maximum contaminant levels for drinking water; MCL for Al is based on a secondary non-enforceable drinking water regulation; WQL= water quality limits for protection of aquatic life and human health in fresh water. ATL = aquatic toxicity limits for fresh water.

38
Table 3.7. Stabilized pH and peak effluent concentrations in CLTs.
Specimen Name Fly Ash Content
(%)
LKD Content
(%) pH
Al (µg/L)
Cr (µg/L)
Cu (µg/L)
Fe (µg/L)
Mn (µg/L)
Sb (µg/L)
V (µg/L)
Zn (µg/L)
100 BS 100 - 8.63 1588 43 25 223 76 304 1533 128
10 BS + 2.5 LKD 10 2.5 12.1 4870 28 25 216 2 17 100 92
10 BS + 5 LKD 10 5 12.48 6850 40 15 197 0.5 9 72 113
20 BS + 5 LKD 20 5 12.53 7572 44 57 64 0.6 49 649 51
100 PS 100 - 7.56 262 76 43 174 1654 156 891 129
10 PS + 2.5 LKD 10 2.5 12.3 6028 11 15 18 1 19 89 141
10 PS + 5 LKD 10 5 12.49 6662 12 9 15.2 0.3 8 53 151
20 PS + 5 LKD 20 5 12.52 7227 15 40 13 0.4 24 487 88
100 DP 100 - 7.9 954 252 181 162 257 48 1093 78
10 DP + 2.5 LKD 10 2.5 12.1 5810 16 18 30 0.5 10 170 64
10 DP + 5 LKD 10 5 12.4 6250 26 17 21 0.3 7 78 94
20 DP + 5 LKD 20 5 12.6 8644 31 24 16 1 8.7 195 60
Field Material 100 - 6.5 122 0.8 49 91 3.5 33 32 258
U.S. EPA MCL (µg / L) 200 100 1300 300 50 6 NA 5000
U.S. EPA WQL (µg / L) 750 570 340 NA NA NA NA NA
MD ATL (µg / L) NA NA 13000 NA NA NA NA 12000
Note: 10 BS, 20 BS designate the specimens with 10 % and 20 % Brandon Shores fly ash respectively, 10 PS, 20 PS designate the specimens with 10 % and 20 % Paul Smith fly ash respectively, 10 DP, 20 DP designate the specimens with 10 % and 20 % Dickerson Precipitator fly ash respectively. LKD: Lime kiln dust

39
Table 3.8. Input Site Parameters for conceptual model
Point of compliance (Wpoc), m
Pavement Width (Wp), m
Shoulder Width (Ws), m
Depth to the ground water table (ZGWT), m
Annual precipitation (Prcpt), m/year
Maximum simulation time (Tmax), years
Constant values for all specimens
20 10.4 1.5 6 2.19 60
Table 3.9 Hydraulic Properties and transport for pavement layers and aquifer input to WiscLeach
Specimen Layer Thickness (m)
Hydraulic Conductivity, Ks,(m/s)
θr Effective Porosity, ne
Hydraulic Gradient
αL (m)
αT (m)
10 BS + 5 LKD 0.407 1.34 x 10⁻⁷ 0.0 0.23 1.0 0.04 0.004 20 BS + 5 LKD 0.356 1.04 x 10⁻⁷ 0.0 0.31 1.0 0.07 0.007 10 PS + 5 LKD 0.375 2.22 x 10⁻⁷ 0.0 0.26 1.0 0.06 0.006 20 PS + 5 LKD 0.396 2.5 x 10⁻⁷ 0.0 0.33 1.0 0.03 0.003 10 DP + 5 LKD 0.375 2.86 x 10⁻⁷ 0.0 0.24 1.0 0.01 0.001 20 DP + 5 LKD 0.396 1.87 x 10⁻⁷ 0.0 0.29 1.0 0.02 0.002 URM 0.791 8.2 x 10⁻⁵ 0.0 0.32 1.0 0.085 0.0085 Pavement 0.125 5.8 x 10⁻⁷ 0.0 0.35 1.0 0.1 0.01 Subgrade NA 3.2 x 10⁻⁸ 0.0 0.35 1.0 0.1 0.01 Aquifer NA 1.2 x 10⁻⁴ 0.0 0.30 1.0 0.1 0.01 Notes;αL : Longitudinal dispersivity, αT : Transeverse dispersivity, the parameters for soil – water characteristics such as parameter alpha in soil water retention function is from HYDRUS 2D Database, hydraulic gradients is assumed as 1 to simulate the natural conditions,
40
Table 3.10. Retardation factors of the soil mixtures for different metals Retardation Factor, Rd Specimen
Aluminum Chromium Copper Zinc 10 BS + 5 LKD 2.5 4.7 5.8 3.4 20 BS + 5 LKD 1.8 7 1.2 2.8 10 PS + 5 LKD 4.8 5.2 3.5 2.8 20 PS + 5 LKD 1.2 5.3 1.2 1.8 10 DP + 5 LKD 1.2 3.7 1.7 2.3 20 DP + 5 LKD 1.75 4.7 1.2 1.8 URM 2.1 1.87 2.22 2.04 Pavement 1 1 1 1 Subgrade 3.5 3.5 3.5 3.5 Aquifer 2 2 2 2

41
FIGURES

42
0
20
40
60
80
100
0.0010.010.1110100
URMBrandon ShoresPaul SmithDickerson Precipitator
Pe
rce
nt F
iner
(%
)
Particle Size (mm)
a)
Figure 3.1.Particle size distribution of unpaved road material (URM) and fly ashes

43
Figure 3.2. Schematic diagram of the column leach test set-up

44
7
8
9
10
11
12
13
0 1 2 3 4 5
10 BS10 PS10 DP
pH
Amount of LKD
Figure 3.3 Effect of LKD content on pH of the soil mixtures (Note: 10 BS, 10 PS, 10 DP designate the specimens with 10% Brandon Shores, Paul Smith, and Dickerson Precipitator fly ash respectively. LKD: Lime Kiln Dust).
45
0
2
4
6
8
10
0 20 40 60 80 100
5 % LKD BS5 % LKD PS5 % LKD DP
Eff
lue
nt C
on
cen
tra
tion
(ppb
)
Fly Ash Content (%)
Chromiuma)
2
4
6
8
10
12
14
16
18
0 20 40 60 80 100
5 % LKD BS5 % LKD PS5 % LKD DP
Eff
lue
nt C
on
cent
ratio
n (p
pb)
Fly Ash Content (%)
Ironb)
0
5000
1 104
1.5 104
2 104
0 20 40 60 80 100
5 % LKD BS5 % LKD PS5 % LKD DP
Eff
lue
nt C
on
cen
trat
ion
(p
pb)
Fly Ash Content (%)
Aluminumc)
0
20
40
60
80
100
120
140
160
0 20 40 60 80 100
5 % LKD BS5 % LKD PS5 % LKD DP
Eff
lue
nt C
on
cen
tra
tion
(ppb
)
Fly Ash Content (%)
Vanadiumd)

46
0
5
10
15
20
25
30
0 20 40 60 80 100
5 % LKD BS5 % LKD PS5 % LKD DP
Eff
lue
nt C
on
cen
trat
ion
(p
pb)
Fly Ash Content (%)
Antimonye)
0
10
20
30
40
50
60
0 20 40 60 80 100
5 % LKD BS5 % LKD PS5 % LKD DP
Eff
lue
nt C
on
cen
tra
tion
(ppb
)Fly Ash Content (%)
Zincf)
0
5
10
15
20
25
30
0 20 40 60 80 100
5 % LKD BS5 % LKD PS5 % LKD DP
Eff
lue
nt C
on
cen
tra
tion
(ppb
)
Fly Ash Content (%)
Manganeseg)
1
2
3
4
5
6
0 20 40 60 80 100
5 % LKD BS5 % LKD PS5 % LKD DP
Eff
lue
nt C
on
cen
tra
tion
(ppb
)
Fly Ash Content (%)
Copperh)
Figure 3.4 Concentrations of eight metals in effluent from WLTs (Note: BS= Brandon Shores, PS= Paul Smith, DP= Dickerson Precipitator fly ash respectively. LKD: Lime Kiln Dust).
47
Figure 3.5 pH of the effluent from CLT conducted with soil mixtures (Note: 10 BS, 20 BS, 10 PS, 20 PS designate the specimens with 10% and 20% Brandon Shores, and Paul Smith fly ash respectively. LKD: Lime Kiln Dust).
4
6
8
10
12
14
0 50 100 150 200
10 BS + 2.5 LKD10 BS + 5 LKD20 BS + 5 LKDBrandon ShoresURM
pH
Pore volumes of flow
4
6
8
10
12
14
0 50 100 150 200
10 PS + 2.5 LKD10 PS + 5 LKD20 PS + 5 LKDPaul SmithURM
pH
Pore Volumes of Flow
48
Figure 3.6. Elution curves (a) for Vanadium, (b) for Copper, (c) for Zinc (d) and for Al (Note: 10 BS, 20 BS, designate the specimens with 10% and 20% Brandon Shores fly ash. LKD: Lime Kiln Dust. LDL: Lowest Detection Limits, MCL: Maximum contaminant level for drinking water).
0
50
100
150
200
0 25 50 75 100 125 150 175 200
10 BS + 2.5 LKD10 BS + 5 LKD20 BS + 5 LKD100 BSURM
Pore Volumes of Flow
a) Vanadium
Effl
uent
Con
cen
tra
tion
(p
pb)
C max 20BS+5LKD
=650 ppb
C max 100 BS
= 1533 ppb
LDL= 0.1 ppb
0
10
20
30
40
50
60
0 50 100 150 200 250 300
10 BS + 2.5 LKD10 BS + 5 LKD20 BS + 5 LKD100 BSURM
Eff
lue
nt C
once
ntr
atio
n (
ppb
)
Pore Volumes of Flow
b) Copper
MCL Limits = 1300 ppbLDL = 0.7 ppb
0
20
40
60
80
100
120
0 50 100 150 200
10 BS + 2.5 LKD10 BS + 5 LKD20 BS + 5 LKD100 BSURM
Pore Volumes of Flow
c) Zinc
Effl
uent
Con
cen
trat
ion
(pp
b)
CURM
:257 ppb
C100BS
:128 ppb
MCL Limits= 5000 ppbLDL= 1 ppb
0
1000
2000
3000
4000
5000
6000
7000
8000
0 40 80 120 160 200
10 BS + 2.5 LKD10 BS + 5 LKD20 BS + 5 LKDBrandon Shores Fly AshURM
Pore Volumes of Flow
MCL Limits = 200 ppbLDL = 2.5 ppb
d) AluminumE
fflue
nt C
onc
entr
atio
n (
ppb
)

49
0
50
100
150
200
0 40 80 120 160 200
10 PS + 2.5 LKD10 PS + 5 LKD20 PS + 5 LKD100 PSURM
Pore Volumes of Flow
Effl
uent
Con
cen
tra
tion
(ppb
)a) VanadiumLDL = 0.1 ppb
C100 PS
: 891 ppb
C20 PS + 5 LKD
:487 ppb
0
5
10
15
20
0 50 100 150 200
10 PS + 2.5 LKD10 PS + 5 LKD20 PS + 5 LKD100 PSURM
Pore Volumes of Flow
b) Chromium
Eff
lue
nt C
once
ntr
atio
n (
ppb
)
MCL Limits: 100 ppbLDL: 0.5 ppb
0
5
10
15
20
25
30
0 50 100 150 200
10 PS + 2.5 LKD10 PS + 5 LKD20 PS + 5 LKD100 PSURM
Pore Volumes of Flow
c) Copper
Effl
uent
Con
cen
tra
tion
(p
pb)
MCL Limits: 1300 ppbLDL: 0.7 ppb
C20 PS+ 5 LKD
: 40ppb
C00 PS: 43 ppb
0
5
10
15
20
25
30
35
40
0 40 80 120 160 200
10 PS + 2.5 LKD10 PS + 5 LKD20 PS + 5 LKD100 PSURM
Pore Volumes of Flow
MCL Limits = 6 ppbLDL = 3 ppb
d) Antimony
Eff
lue
nt C
once
ntr
atio
n (
ppb)
C100 PS max
=156 ppb
Figure 3.7 Elution curves (a) for Antimony, (b) for Chromium, (c) for Iron. (Note: 10 PS, 20 PS, designate the specimens with 10% and 20% Paul Smith fly ash. LKD: Lime Kiln Dust. LDL: Lowest Detection Limits, MCL: Maximum contaminant level for drinking water).
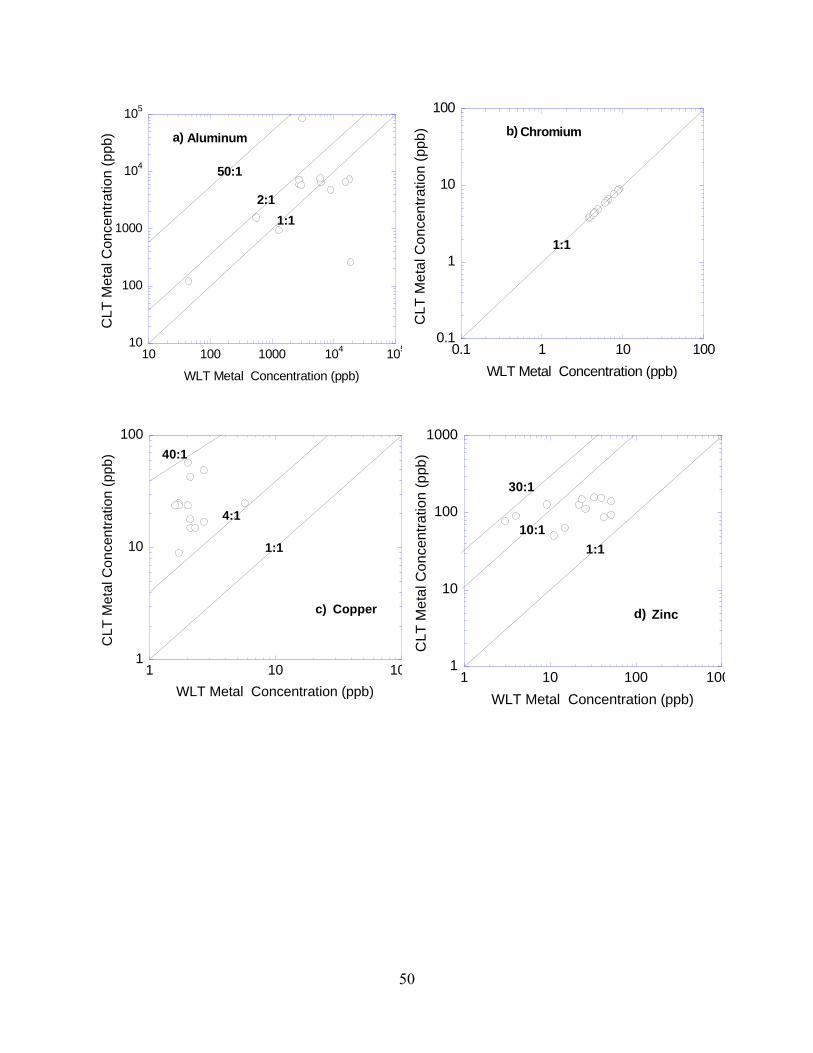
50
10
100
1000
104
105
10 100 1000 104 105
CLT
Met
al C
once
ntr
atio
n (
ppb)
WLT Metal Concentration (ppb)
Aluminum
1:1
2:1
50:1
a)
0.1
1
10
100
0.1 1 10 100
CLT
Me
tal C
on
cen
trat
ion
(pp
b)
WLT Metal Concentration (ppb)
Chromium
1:1
b)
1
10
100
1 10 10
CLT
Me
tal C
on
cen
trat
ion
(pp
b)
WLT Metal Concentration (ppb)
Copper
1:1
40:1
4:1
c)
1
10
100
1000
1 10 100 100
CLT
Me
tal C
on
cen
trat
ion
(p
pb)
WLT Metal Concentration (ppb)
Zinc
1:1
10:1
30:1
d)

51
10
100
1000
104
10 100 1000 104
CLT
Con
cen
tra
tion
s (p
pb)
WLT Concentrations (ppb)
Vanadium
1:1
11:1
e)
1
10
100
1000
1 10 100 1000
CLT
Co
nce
ntr
atio
ns (
ppb
)
WLT Concentrations (ppb)
Iron1:1
10:1
100:1
f)
1
10
100
1000
1 10 100 1000
CLT
Co
nce
ntr
atio
n (p
pb)
WLT Concentration (ppb)
1:1
10:1
50:1
Antimonyg)
0.01
0.1
1
10
100
1000
104
0.01 0.1 1 10 100 1000 104
CLT
Co
nce
ntr
atio
ns (
ppb
)
WLT Concentrations (ppb)
Manganese
1:1
20:1
h)
Figure 3.8 Comparison of peak effluent concentrations of eight metals from the CLTs and the WLTs

52
Figure 3.9 Conceptual model in WiscLeach for predicting impacts to the vadose zone and groundwater from HCFA stabilized highway base layer

53
5
5 10
1515
Horizontal Distance (m)
De
pth
Be
low
Gro
un
dS
urf
ace
(m)
-10 -5 0 5 10 15 20
0
2
4
6
8 Leaching heavy metalconcentration (ppb) after 1 yr
Ground Water Flow
PavementHCFA Stabilized Base Layer
Chromium
10 BS + 5 LKD
5
5
510
Horizontal Distance (m)
De
pth
Be
low
Gro
un
dS
urf
ace
(m)
-10 -5 0 5 10 15 20
0
2
4
6
8 Leaching heavy metalconcentration (ppb) after 2 yrGround Water Flow
Chromium
PavementHCFA Stabilized Base Layer
10 BS + 5 LKD
0.1
0.1
0.2
0.2
0.3
0.4 0.4
0.5
0.6 0.6
0.7
Horizontal Distance (m)
De
pth
Be
low
Gro
un
dS
urf
ace
(m)
-10 -5 0 5 10 15 20
0
2
4
6
8 Leaching heavy metalconcentration (ppb) after 4 yr
Ground Water Flow
Chromium
PavementHCFA Stabilized Base Layer
10 BS + 5 LKD
0.005 0.01
0.015
0.0150.02
0.025
0.025
0.03
0.035
0.035
0.04
Horizontal Distance (m)
De
pth
Be
low
Gro
un
dS
urf
ace
(m)
-10 -5 0 5 10 15 20
0
2
4
6
8
Leaching heavy metalconcentration (ppb) after 8yr
Ground Water Flow
Chromium
PavementHCFA Stabilized Base Layer
10 BS + 5 LKD
Figure 3.10 Predicted Cr concentrations in vadose zone and ground water (Note: 10 BS designate the specimens with 10 % Brandon Shores fly ash, LKD: Lime Kiln Dust

54
5
5
10
15
20
20
25
30
30
35
Horizontal Distance (m)
De
pth
Be
low
Gro
un
dS
urf
ace
(m)
-10 -5 0 5 10 15 20
0
2
4
6
8 Leaching heavy metalconcentration (ppb) after 1 yr
Ground Water Flow
Aluminum
PavementHCFA Stabilized Base Layer
10 PS + 5 LKD
5
10
10
15
1520 20
Horizontal Distance (m)
De
pth
Be
low
Gro
un
dS
urf
ace
(m)
-10 -5 0 5 10 15 20
0
2
4
6
8 Leaching heavy metalconcentration (ppb) after 4 yr
Ground Water Flow
Aluminum
PavementHCFA Stabilized Base Layer
10 PS + 5 LKD
0.1
0.1
0.2
0.2
0.2
0.3
0.3
0.3
0.3
0.4
0.4
0.4
0.4
0.5 0.5
0.5
0.5
0.60.6
0.6
0.7
0.7
0.7
Horizontal Distance (m)
De
pth
Be
low
Gro
un
dS
urf
ace
(m)
-10 -5 0 5 10 15 20
0
2
4
6
8
Leaching heavy metalconcentration (ppb) after 6 yr
Ground Water Flow
Aluminum
PavementHCFA Stabilized Base Layer
10 PS + 5 LKD
0.
005
0.005
0.01
0.015
0.0150.02
0.02
0.025
0.0250.03
0.03
0.035
0.035
0.04
Horizontal Distance (m)
De
pth
Be
low
Gro
un
dS
urf
ace
(m)
-10 -5 0 5 10 15 20
0
2
4
6
8
Leaching heavy metalconcentration (ppb) after 10 yr
Ground Water Flow
Aluminum
PavementHCFA Stabilized Base Layer
10 PS + 5 LKD
Figure 3.11. Predicted Al concentrations in vadose zone and ground water (Note: 10 PS designate the specimens with 10 % Paul Smith fly ash, LKD: Lime Kiln Dust

55
4 LEACHING OF METALS FROM HCFA AMENDED STRUCTURAL FILLS
4.1 INTRODUCTION
The objective of the current study in this section is to evaluate the leaching potential of
embankment construction materials mixed with fly ash relative to those stabilized with
conventional materials, and to evaluate the potential groundwater and surface water impacts. The
beneficial reuse of fly ash in embankments construction not only helps ease one of the most
pressing environmental problems (safe disposal), but may result in significant cost savings as
well.
American Society of Civil Engineers estimates that $1.6 trillion is needed over a five-
year period to bring the nation’s infrastructure to a good condition. A large portion of the earthen
materials needed for these transportation infrastructure projects have the potential to use recycled
materials to aid in their stabilization; however, these materials must be also be safe for the
environment in which they are placed. This issue becomes more critical if recycled materials are
used in applications such as embankment repair and construction, where surface waters may be
affected.
Utilization of fly ash in embankment construction has been documented in earlier studies
(Baykal et al. 2004, Zhang and Solis 2008, Yoon et al. 2009). However, previous studies, in
general, focused on the mechanical improvement of fly ash-amended embankments and no
information was available for leached concentrations of metals and other inorganic under field
conditions. Even though, mechanical properties of the fly ash-amended embankments deemed
satisfactory, one key issue that precludes embankment stabilization with fly ash is the potential
for surface and groundwater impacts caused by metals in the fly ash. Public perception on fly

56
ash use was also affected by the failure of a dike in Tennessee. The failure of a dike built with
100% fly ash at the Kingston Fossil Plant, Tennessee in 2008 led to the release of approximately
5.4 million cubic yards of impounded fly ash onto surrounding land and into the adjacent Emory
River. This event most directly affected citizens living in close proximity to the plant and
indirectly impacted all coal burning utilities and other large coal users. For example, as a result
of this event, the U.S. Environmental Protection Agency (EPA) directed plant operators and
power companies to conduct on-site assessments to determine the structural integrity and
vulnerabilities of all ash management facilities and to order repairs where needed. EPA
determined in 1993 and in 2000 that waste from the combustion of coal and other fossil fuels is
to be regulated as nonhazardous; however, many organizations, including Congress, are urging
EPA to propose new rules regulating coal combustion waste under the Resource Conservation
and Recovery Act (RCRA).
The Kingston release has focused new attention on all aspects of CCP management. Even
though it was quickly recognized that the dike material was pure fly ash, additional research was
warranted to ensure the environmental suitability of future soil-fly ash embankments. Moreover,
high carbon fly ashes (HCFAs) may have different behavior than conventional Class F or C fly
ashes and such behavior needs to be studied. In order to study the water quality impacts of fly
ash amendment into embankments in Maryland, a research program was initiated. The
objectives of this chapter of the current study are to determine the leaching pattern of the heavy
metals and determine the effect of fly ash content and fly ash type on the leaching behavior of
the trace metals from the embankments constructed with HCFA.

57
4.2 MATERIALS
Sandy soil (borrow material) that is commonly used in embankment construction by the
Maryland State Highway Administration was utilized in preparing the soil-fly ash mixtures.
Soil was collected from a pit in Denton, Maryland, and was sieved through No 4 sieve (4. 75
mm) upon transporting to the laboratory. The soil was classified as poorly graded sand with silt
(SP-SM) according to the Unified Soil Classification System, and A-3 (fine sand) according to
the American Association of State Highway and Transportation Officials (AASHTO)
Classification System. , and showed no plasticity. The physical properties of the soil along with
the fly ashes are summarized in Table 4.1.
The fly ashes used in this study were collected from Brandon Shores (BS), Paul Smith
Precipitator (PSP), Dickerson Precipitator (DP), Morgan Town (MT) and Columbia power
plants. All fly ashes, except Columbia, were obtained from the power plants in Maryland were
classified as off-spec fly ashes according to ASTM 618C. The Columbia ash, a Class C fly ash,
was collected from a power plant in Wisconsin and was included in the testing program due its
high CaO content and low loss on ignition value. All of the fly ashes consisted primarily of silt-
size particles and contained 80 to 90% fines (passing the 75-mm sieve). Specific gravity of fly
ashes ranged between 2.1 and 2.5 (ASTM D 854), and the pHs ranged between 4.5 and 9.5 (EPA
Method SW- 846 Method 945), respectively. The physical properties and chemical compositions
of the materials are summarized in Tables 11 and 12, respectively. Total elemental analyses of
the 5 fly ashes and sandy soil were conducted following the procedures outlined in EPA SW-846
Method 6800 and summarized in Table 4.3.
Fly ash addition to the soil was 10, 20, and 40% by weight. The lower percentages were
selected to cover the typical range used in soil stabilization by fly ash while 40% was chosen to

58
study the effect of ash content on the leaching behavior. All column leach test specimens were
compacted at their 2% dry of optimum moisture contents (OMCs) in an acrylic tube having a
101.6 mm inside diameter and 305 mm height. By compacting to the dry of OMC, higher
hydraulic conductivities could be achieved that allow enough sample to be collected in a
reasonable amount of time. Standard Proctor effort (ASTM D 698) was used during compaction
consisting of 8 layers with 29 blows per layer to achieve a target dry unit weight of 19.2 kN/m3,
which is a minimum value for highway embankments specified by the Maryland State Highway
Administration. The mixtures prepared with Maryland fly ashes were used directly after
compaction. However, due to their high calcium content, Columbia fly ash mixtures were then
cured for 7 days at 95% relative humidity and 23 Cº. Table 4.4 provides the list of soil mixtures
that are used in the current study along with their maximum dry unit weights and optimum
moisture contents.
4.3 METHODS
The testing procedures for WLT and CLT were same of those summarized in Section 3
tests. A series of toxicity leaching characteristic procedure (TCLP) tests were also conducted on
fly ash amended borrow materials..
The soils, fly ashes their mixtures prepared for TCLP tests were the same materials
prepared for WLTs. The TCLP test is designed to determine the mobility of organic and
inorganic compounds present in liquid, solid and multiphase wastes. EPA Method 1311 was
followed during TCLP tests. The soil mixtures were sieved through U.S. No. 3/8 inches sieve.
Liquid to Solid (L:S) ratio of 20:1 was used for all soil-fly ash mixtures as used in WLTs. For all
soil-fly ash mixtures, acetic acid solution with pH 5 were used as an extraction fluid. The acetate
buffer is added only once, at the start of the extraction. pH and electrical conductivity

59
measurements were recorded immediately after the sample collection. The protocol for sample
preparation and preservation followed those employed in WLTs except the filtration procedure.
The samples were vacuum filtered through TCLP glass fiber filters. Then filtered leachates were
acidified to pH<2 with 2% HNO3 acid solution and preserved in 4 Cº for chemical analysis.
4.4 RESULTS
4.4.1 Water Leach Tests
Duplicate batch water leach test were conducted on fly ash alone, soil alone and soil –
fly ash mixtures. The pH values for each specimen were measured and summarized in Table 4.5.
Table 4.2 shows the chemical compositions of the fly ashes. Brandon Shores (BS) fly ash has
the least CaO content in all fly ashes which could be a good explanation for the relatively lower
pH obtained for this ash in the batch water leach test. Table 4.5 shows the variation of pH values
and suggests a modest increase in pH with increasing fly ash content. This can be explained by
the release of CaO, portlandite (Ca(OH)2) and MgO minerals into the aqueous solutions
(Cornelis et al. 2008). The pHs of the effluent solutions are between 5.5 and 9.8. Table 4.2 shows
that there is a strong correlation between CaO contents and the pH of the effluent solutions.
Morgan Town (MT) fly ash has the highest CaO content therefore the pH of the effluent
solutions of the mixtures prepared with fly ash is relatively higher than others.
Table 4.5 shows that, expect the 100% fly ash specimens, the concentrations of six metals
that leached from the soil mixtures are below the U.S EPA maximum concentration limits for
drinking water (MCLs), EPA water quality limits (WQLs) for the protection of aquatic life and
human health, and Maryland aquatic toxicity limits (ATLs) for fresh water. Arsenic, Chromium

60
and Selenium concentrations were below the detection limits in soil mixtures, except the 100%
MT and 100% PSP fly ash specimens due to the fact that As, Se and Cr show amphoteric
leaching pattern (Langmuir 1997, Dutta et al. 2009, Komonweeraket et al. 2010). They dissolve
lowest at the neutral pH but highest at the extreme pH conditions.
The Manganese and Boron concentrations increase with an increase in fly ash content in
the soil-fly ash mixtures, except the ones prepared with MT fly ash (Table 4.5). The increase in
B and Mn concentrations is not linear with fly ash content, even though the mass of metals in
soil mixtures increases approximately linearly with fly ash content. Therefore, the use of linear
dilution calculations will underestimate the resulting concentrations of these two metals from
soil-fly ash mixtures.
Mn concentrations decrease with increasing fly ash content in soils amended with MT
ashes. The leaching pattern of the Mn is generally dominated by the pH of the effluent solutions
(Goswami and Mahanta 2007). Since the pH of the effluent vary between 7.2 and 10 for the soil-
MT fly as mixtures, precipitation of Mn with Al-oxides and Fe-oxides occur and generates a
decrease in Mn concentrations in the aqueous solutions even though the main source of metals
was increased (McBride 1994, Goswami and Mahanta 2007, Jegadeesan et al. 2008).
There is no consistent relationship between the fly ash content of the soil mixtures and aluminum
concentrations in the leachate solutions, except the ones prepared with MT fly ash (Table 4.5).
This is somewhat expected as aluminum leaching is highly dependent on the pH of the solution,
and a pH of 7 or above is usually required to see a pH effect on Al concentrations (Spark 2003).
Furthermore, Al exhibits an amphoteric leaching behavior similar to As, Cr, Se (Komonweeraket
et al. 2010).

61
4.4.2 Column Leach Tests
Figure 4.1 shows the variation of the effluent pHs as a function of pore volumes (PV) of flow.
All tests were continued until a minimum of 50 pore volumes of flow was obtained to examine
the behavior and persistency of the pH of the soil mixtures as discussed in Section 3. The pHs of
the effluent solutions fluctuate for all specimens until 20 PV of flow then the pHs begins to
remain constant. As observed in batch water leach tests, there is a strong correlation between the
CaO content of the fly ashes and pH of the leachate solutions in column leach test. The pHs of
the specimens prepared with Morgan Town (MT) fly ashes has the highest pH values. An
increase in fly ash causes an increase in the effluent pHs of the all specimens as observed in
water leach tests. Pure sandy soil has the lowest pH values.
Table 4.6 summarizes the variation of the six metal concentrations along with the pH of
the aqueous solutions. Except Mn, the concentrations of Al, As, Cr, B and Se increase with an
increase in fly ash content regardless of the ash type. The leaching of some of the metals exceeds
the EPA MCLs, EPA WQLs and Maryland ATLs. Considering this, the design of the
embankment construction should be analyzed carefully to ensure that the metal concentrations in
the leachate of the solution do not exceed the quality limits mentioned above. However, column
leach tests provide relatively high metal concentrations that are typically unrepresentative of
field conditions (Bin-Shafique et al. 2006, Li et al. 2007). Thus, computer models, such as
WisLEACH, become useful in predicting concentration profiles in the field.
As, Cr, Al and Se are the metals that generally show an amphoteric leaching behaviors.
(Komonweeraket 2010). An increase in fly ash content causes an increase in the amount of main
metal source and an increase in the pH of the effluent solution due to the dissolution of CaO and
MgO minerals (Figure 4.2). Considering the observed pH range in the effluent of the column

62
leach tests (pH= 5.75 – 10.0), As, Cr, Al, and Se are likely to be available in their anionic
species. In this pH range the dominating Se species are SeO42- and SeO3
2- (Doina 2007), the
dominant Cr species are HCrO4- and CrO7
-2, CrO4-2. It should be recognized that Cr (VI) is a
toxic Cr species and an acute irritant for living cells and can be carcinogenic to humans via
inhalation (Whalley et al. 1999).
Boron concentrations also increase with increasing fly ash content. However, B has
cationic species and these species are adsorbed by the soil and fly ash particles in the aqueous
solution or precipitated with Al-oxides and iron oxides at pH > 6.5 (Pagenkof and Connolly
1982). Therefore, the B concentrations are expected to decrease with an increase in pH of the
effluent solution. However, an opposite trend is observed for the specimens tested in the current
study. Figure 3.3 and Table 6 show that an increase in fly ash content increases the B
concentrations in the effluent solution. It is speculated that the large amounts of boron in the fly
ash is the main cause for the observed pattern (Table 4.3).
Table 4.6 and Figure 4.2 show that the leaching patterns of the Mn are strongly
dominated by the pH of the effluent solutions. Mn tends to decrease with pH. In addition, Mn
metals precipitate by complexing with cationic metals that exist in the aqueous solutions such as,
Zn, Cu, Cd, Cr and Ca. Mn concentrations only increase with BS fly ash alone and PSP fly ash
alone which have both pH around 7. However, the leaching of Mn is lower with MT fly ash
alone compared to soil mixtures prepared with lower amount of MT fly ashes. This trend
observed is due to the high pH of the leachate solution of the soil mixtures prepared with MT fly
ash. No clear trends are evident for the mixtures amended with Columbia and Dickerson
Precipitator fly ashes as these tests have not been completed yet.

63
Figure 4.3 to 4.9 show a series of column leach test elution curves for the specimens tested
so far. The curves for all but As suggest a high initial leaching of metals followed by a sharp
decrease to near constant concentrations after 5-15 pore volumes of flow. This is called first-
flush of leaching and occurs due to the release of metals from the water soluble fraction as well
as from the sites with low adsorption energies. The leaching curves for As metals showed a
lagged flush response. The leaching of As metals keep increasing until 10-20 pore volumes of
flow then start decreasing dramatically. The As concentrations that were leached out from the
specimens prepared with 10% and 20% MT fly ashes were generally below the detection limit
(0.01 ppm) and did not exhibit any clear leaching trend. The specimens prepared with 40% and
100% fly ashes showed lagged response type of leaching patterns. The As concentrations
decreased significantly in the first 3-4 pore volumes of flow then increased up to 35 – 40 pore
volumes of flow followed by a dramatic decrease. In general, the immobility of the metals causes
a lagged response type leaching pattern in the aqueous solution (Sauer et al. 2005. Arsenic is
very mobile at extreme acidic and extreme basic conditions (Komonweeraket et al. 2010, Dutta
et al. 2009). The pHs of the effluent solutions of all specimens in the current study are either
lower than 10 or higher than 6, which could be a reason for observing a lagged response leaching
pattern for As.
4.4.3 Toxicity Leaching Procedure Tests
Duplicate Toxicity Leaching Procedure tests (TCLPs) were conducted on soil alone, fly
ash alone and soil-fly ash mixtures. As expected, the effluent pH values of the specimens were
stabilized at a pH of 4.8 to 4.9 except the specimens prepared with MT and Co fly ashes. The
effluent solutions of these specimens were not buffered due to the high CaO content in these two
fly ashes. Leaching of CaO to the aqueous solutions increased the pH values of the effluent

64
solutions as seen in Table 4.7. Table 4.7 indicates that an increase in fly ash content generally
caused an increase in the all six metals (Al, As, B, Cr, Mn, Se) concentrations regardless of fly
ash types.
4.4.4 Comparison of the Leaching Results of Different Tests
Attempts were made to compare the water leach and column leach test data, column
leach data and TCLP data, and TCLP data and WLT data obtained from sand alone, fly ash alone
and soil- fly ash mixtures. The peak effluent concentrations from the CLTs are plotted against
the concentrations from the WLTs in Figure 4.10. The maximum concentrations found in the
leachate from the column leaching tests are consistently greater than the concentrations from the
water leach tests. Differences in L:S ratio between the two leaching tests (a ratio of 20:1 in
WLTs versus 0.1:1 in CLTs in the initial PVFs) could be responsible for the significant metal
concentration differences measured in these two leaching tests. Figure 4.10 shows that the
maximum concentrations of the Al, As, B, Cr, Mn and Se from CLTs is up to 16, 100, 100, 100,
35 and 50 times higher than the metal concentrations obtained from WLTs, respectively.
In addition, the maximum concentrations found in the leachate from the column leaching
tests are consistently greater than the concentrations from the TCLP tests. Figure 4.11 shows that
the maximum concentrations of the As, B, Cr, and Se from CLTs is several times higher than the
metal concentrations obtained from TCLPs, respectively. No relations were found between CLT
and TCLP results for Al and Mn metals concentrations. Furthermore, Figure 4.12 shows that the
concentrations of the As, B, Cr, Mn and Se from TCLPs is up to 20, 20, 10, 33 and 16 times
higher than the metal concentrations obtained from WLTs, respectively. No relation was found
between TCLP and WLTs results for Al metal concentrations.
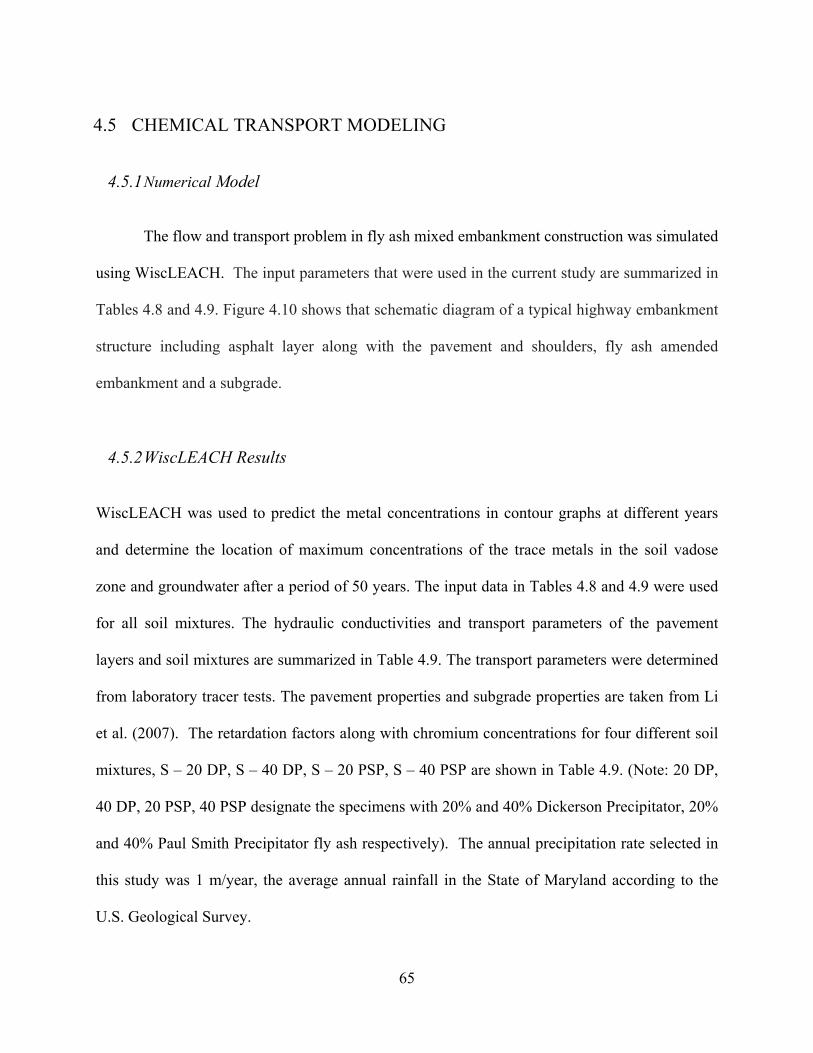
65
4.5 CHEMICAL TRANSPORT MODELING
4.5.1 Numerical Model
The flow and transport problem in fly ash mixed embankment construction was simulated
using WiscLEACH. The input parameters that were used in the current study are summarized in
Tables 4.8 and 4.9. Figure 4.10 shows that schematic diagram of a typical highway embankment
structure including asphalt layer along with the pavement and shoulders, fly ash amended
embankment and a subgrade.
4.5.2 WiscLEACH Results
WiscLEACH was used to predict the metal concentrations in contour graphs at different years
and determine the location of maximum concentrations of the trace metals in the soil vadose
zone and groundwater after a period of 50 years. The input data in Tables 4.8 and 4.9 were used
for all soil mixtures. The hydraulic conductivities and transport parameters of the pavement
layers and soil mixtures are summarized in Table 4.9. The transport parameters were determined
from laboratory tracer tests. The pavement properties and subgrade properties are taken from Li
et al. (2007). The retardation factors along with chromium concentrations for four different soil
mixtures, S – 20 DP, S – 40 DP, S – 20 PSP, S – 40 PSP are shown in Table 4.9. (Note: 20 DP,
40 DP, 20 PSP, 40 PSP designate the specimens with 20% and 40% Dickerson Precipitator, 20%
and 40% Paul Smith Precipitator fly ash respectively). The annual precipitation rate selected in
this study was 1 m/year, the average annual rainfall in the State of Maryland according to the
U.S. Geological Survey.

66
Figures 4.14-4.17 show the contour plots of the predicted concentrations of Cr in the soil
vadose zone as well as the groundwater. The contour plots provide the predictions of the metal
concentrations generally after 5, 10, 20 and 50 years of construction. WiscLEACH simulations
indicate that Cr concentrations are below the EPA MCL Limits (100 ppb), except the S – 40 PSP
specimen which is prepared with Paul Smith Precipitator fly ash at 40% by weight. The results
indicate that the maximum Cr concentrations are reached in approximately 10 to 20 years. After
it reaches its maximum concentration rate, Cr concentrations in the vadose zone decrease
significantly with time. In addition, Cr concentrations are far below the EPA MCL limit when
reaches to the ground water. Therefore, according to WiscLEACH results, using fly ash as a soil
amendment in embankment construction is safe when it is used at reasonable percentages such as
10% to 20%.
As shown in Figures 4.14 through 4.17, the Cr metal concentrations decreases with away
from the embankment surface which is most probably due to the dispersion of the metals in the
soil vadose zone. High annual precipitation rate may also have caused an increase in the leaching
rate of the metals from HCFA amended embankment and absorbing the metals before reaching
groundwater.
4.6 CONCLUSIONS
The primary objective of this study was to investigate the leaching behavior and the controlling
mechanisms of the heavy metals from fly ash-amended soils used in embankment constructions.
A second objective was to estimate the potential contamination of the groundwater in an
embankment construction through computer modeling. The effect of fly ash addition and its
feasibility to use in geotechnical applications is studied. To achieve these objectives, a series of

67
batch water leach test (WLTs) and column leach test (CLTs) to evaluate the leaching pattern of
the metals from fly ash mixed soils. The conclusions from the current study are summarized as
follows:
1. An increase in fly ash content increases the pH values of the soil – fly ash mixtures
significantly due to the release of CaO, and MgO minerals regardless type of fly ashes.
An increase in fly ash content from 0 to 40 % is by weight has greater influence on pH
increase than an increase in fly ash content from 40 to 100 %.
2. Except the concentrations of manganese all other five metals (Arsenic, Aluminum,
Chromium, Boron and Selenium) concentrations increases with fly ash amount. The
solubility of Mn is highly dependent on the pH of the effluent solution and pH > 6 the
Mn metals are likely to precipitate with Al – oxides and Fe – oxides.
3. The curves for all but As exhibit a first flush leaching pattern that occurs due to the
release of metals from the water soluble fraction as well as from the sites with low
adsorption energies. The concentrations of Al, B, Cr, Mn and Se metals begin to stabilize
after 10 – 15 pore volumes of flows. Only the leaching curves for As metals showed
lagged flush response. The leaching of As metals keep increasing until 10 – 20 pore
volumes of flow then start decreasing dramatically.
4. The concentrations of the six metals are influenced by the pH of the effluent solution
significantly which suggest that the leaching pattern is highly dependent on the pH of the
aqueous solutions.
5. The concentrations of the metals exceeded the EPA MCLs beyond addition of 20% of fly
ashes especially with the specimens prepared with MT fly ash, most probably due to

68
high pH of the MT fly ash. Increase in pH of the effluent solution increases metal
concentrations, except B and Mn metals
6. The laboratory test results obtained in current study suggest that, in a real field
application, aqueous samples should be collected especially during the construction
phase since metal concentrations in leachates that come out of the mixtures are expected
to be higher at the initial stages. The laboratory test results suggested that metal
concentrations are expected to be very low after this first-flush period.
7. The WiscLeach results indicated that the maximum Cr concentrations are reached in
approximately 10 to 20 years, after which Cr concentrations in the vadose zone decrease
significantly with time. In addition, Cr concentrations are far below the EPA MCL limit
upon reaching ground water. Therefore, according to WiscLEACH results, using fly ash
as a soil amendment in embankment construction is safe when it is used at reasonable
percentages.

69
TABLES

70
Table 4.1. Physical Properties of the soil and fly ashes
Sample Gs
wopt (%)
γd (kN/m3)
LL (%)
PI (%)
Fines Content (<75 µm)
(%)
Fineness (>45 µm)
(%) Sandy Soil 2.6 11 19.2 NP NP 2 -
BS 2.28 16 11.87 NP NP 84 13 PSP 2.17 22 9.96 NP NP 87 20 DP 2.43 36 9.93 NP NP 82 15 MT 2.4 25 13.8 NP NP 80 16 Co 2.7 21 15.6 NP NP 90 14.4
BS: Brandon Shores, PSP: Paul Smith Precipitator fly ash, DP: Dickerson Precipitator fly ash, BS: Morgan Town fly ash, Co: Columbia fly ash, Gs: Specific gravity, woptm: optimum water content, γdmax: maximum dry unit weight, LL: liquid Limit, PL: plastic limit, NP: Nonplastic. Table 4.2. Chemical composition of the fly ashes. Concentrations of major minerals were determined by X-ray fluorescence spectroscopy analysis. All concentrations are in percentage by weight.
Chemical Composition
Fly ash
pH
LOI (%)
SiO2
(%)
Al2O3 (%)
Fe2O3 (%)
CaO (%)
MgO (%)
SiO2 + Al2O3 + Fe2O3, min (%)
Moisture Content, (max)(%)
BS 6.1 6.2 45.1 27.1 3.16 1.07 0.6 75 0.007 PSP 6.6 6.8 52.8 21.4 6.7 0.4 1.2 81 0.004 DP 8.1 16 40.1 32.1 14.7 0.6 1.5 87 0.006 MT 9.5 8.1 49.2 25.5 13.7 2.5 1.9 88 0.011 Co FW 0.4 31.1 18.3 6.1 19.41 3.7 56 0.004 Class C NA 6 40 17 6 24 5 70 3 Class F NA 6 55 26 7 9 2 50 3 BS: Brandon Shores PSP: Paul Smith Precipitator fly ash, DP: Dickerson Precipitator fly ash, BS: Morgan Town fly ash, Co: Columbia fly ash, LOI: Loss on ignition. FW: Future Work, NA : Not applicable

71
Table 4.3. Total metal content of the fly ashes and sandy soil material from the total elemental analysis.
Sample Al (ppm) As(ppm) B (ppm) Cr (ppm) Mn (ppm) Se (ppm) Sandy Soil 28760 <3 2.86 15.5 38.16 <3 BS 21333 24.16 21.33 49.51 33.93 38.5 PSP 11770 39.68 30.43 30.08 215.64 21.4 DP 17638 41.63 78.73 42 61.58 9.47 MT 29123 52.08 240.77 68 207.73 46 Co 91848 15.01 600.4 64.6 91.58 54
Table 4.4 Legend and compositions of the mixtures.
Legend of Mixtures Fly Ash Content (%)
Optimum Water Content (%)
Maximum Dry Unit Weight (kN/m3)
100 Soil 0 11 19.2
S – 10 BS 10 9 19.33
S – 20 BS 20 11 18.79 S – 40 BS 40 13 16.7 100 BS 100 26 11.87 S – 10 PSP 10 11 19.11 S – 20 PSP 20 13 18.74 S – 40 PSP 40 17 16.00 100 PSP 100 22 9.96 S – 10 MT 10 10 19.24 S – 20 MT 20 11 19.03 S – 40 MT 40 12 18 100 MT 100 25 13.18 S – 10 DP 10 14 16.62 S – 20 DP 20 15 15.62 S – 40 DP 40 18 13.2 100 DP 100 36 9.93 S – 10 Co 10 11 18.94 S – 20 Co 20 13 18.79 S – 40 Co 40 16 16.4 100 Co 100 21 15.58
Note: BS: Brandon Shores fly ash, PSP: Paul Smith Precipitator fly ash, DP: Dickerson Precipitator fly ash, MT: Morgan Town fly ash, Co: Columbia fly ash. The numbers that follow the fly ashes indicate the percentages by weight of admixtures added to the soil.

72
Table 4.5 Stabilized pH and effluent concentrations in WLTs
Specimen Name Fly Ash Content
(%) pH
Al (mg/L)
As (µg/L)
B (µg/L)
Cr (µg/L)
Mn (µg/L)
Se (µg/L)
S – 10 BS 10 6.3 0.08 <0.01 <0.02 <0.001 0.028 <0.03
S – 20 BS 20 6.4 0.001 <0.01 0.178 <0.001 0.034 <0.03
S – 40 BS 40 6.81 0.05 0.01 0.12 <0.001 0.075 <0.03 100 BS 100 5.5 0.146 <0.01 0.340 <0.001 0.031 <0.03
S – 10 PSP 10 6 0.215 <0.01 FW <0.001 0.017 <0.03
S – 20 PSP 20 6.4 <0.05 <0.01 0.163 <0.001 0.027 <0.03
S – 40 PSP 40 7.02 <0.05 0.21 0.34 0.01 0.12 0.09 100 PSP 100 7.7 0.683 0.226 0.579 0.007 0.018 0.132
S – 10 MT 10 7.2 0.2 <0.01 0.747 0.011 <0.001 <0.03
S – 20 MT 20 8.7 0.345 <0.01 1.355 0.021 <0.001 0.076
S – 40 MT 40 9.64 2.44 0.08 2.23 0.06 <0.001 0.12 100 MT 100 9.8 6.736 0.058 6.562 0.126 <0.001 0.279
S – 10 DP 10 7.05 <0.05 <0.01 0.2 0.002 0.07 <0.03 S – 20 DP 20 7.11 <0.05 <0.01 0.33 0.008 0.03 0.04 S – 40 DP 40 7.78 <0.05 0.04 0.74 0.01 0.01 0.12
100 DP 100 7.96 0.07 0.05 1.45 0.015 0.03 0.17 S – 10 Co 10 11.88 45 <0.01 0.65 0.04 <0.001 <0.03 S – 20 Co 20 11.95 48 <0.01 0.22 0.06 <0.001 <0.03 S – 40 Co 40 12.07 57 <0.01 0.16 0.06 <0.001 <0.03
100 Co 100 12.15 55 <0.01 <0.02 0.04 <0.001 <0.03 Sandy Soil - 6.74 <0.05 <0.01 <0.02 <0.001 <0.001 <0.03
MDL (mg/L) 0.05 0.01 0.02 0.001 0.001 0.03
U.S. EPA MCL (mg / L) 0.2 0.01 NA 0.1 0.05 0.05
U.S. EPA WQL (mg / L) 0.75 0.34 NA 0.57 NA 0.005
MD ATL (µg / L) NA NA 13000 0.57 NA NA Note: 10 BS, 20 BS, 40 BS designate the specimens with 10 %, 20 % and 40 % Brandon Shores fly ash respectively, 10 PSP, 20 PSP, 40 PSP designate the specimens with 10 %, 20 % and 40 % Paul Smith Precipitator fly ash respectively, 10 MT, 20 MT, 40 MT designate the specimens with 10 %, 20 % and 40 % Morgan Town fly ash respectively 10 DP, 20 DP, 40 DP designate the specimens with 10 %, 20 % and 40 % Dickerson Precipitator fly ash respectively, 10 Co, 20 Co, 40 Co designate the specimens with 10 %, 20 % and 40 % Columbia fly ash respectively, MDL: Minimum Detection Limits, MCL= maximum contaminant levels for drinking water; MCL for Al is based on a secondary non-enforceable drinking water regulation; WQL= water quality limits for protection of aquatic life and human health in fresh water. ATL = aquatic toxicity limits for fresh water.

73
Table 4.6Stabilized pH and peak effluent concentrations in CLTs.
Specimen Name Fly Ash Content
(%) pH
Al (mg/L)
As (mg/L)
B (mg/L)
Cr (mg/L)
Mn (mg/L)
Se (mg/L)
S – 10 BS 10 5.75 0.132 <0.01 1.46 <0.001 0.902 <0.03
S – 20 BS 20 6.25 0.162 0.04 1.63 <0.001 0.816 0.04
S – 40 BS 40 6.7 0.16 0.09 8.68 0.03 0.82 <0.03 100 BS 100 7.3 0.14 0.73 19.11 0.05 3.07 <0.03
S – 10 PSP 10 6.3 0.062 <0.01 1.05 <0.001 0.253 0.031
S – 20 PSP 20 6.6 0.1 0.09 2.78 0.003 0.332 0.09
S – 40 PSP 40 7 0.38 1.58 30.54 0.44 3.88 1.79
100 PSP 100 7.1 0.34 2.06 56 0.06 1.68 2.08
S – 10 MT 10 7.2 0.11 <0.01 13.8 0.318 0.023 0.063
S – 20 MT 20 8.3 0.296 0.075 26.4 1.59 0.006 0.202
S – 40 MT 40 9.8 2.7 0.34 115 3.48 0.005 1.74
100 MT 100 10 12.6 0.36 166 3.23 0.01 5.84
S – 10 DP 10 6.6 0.17 <0.01 11.6 0.002 1.28 0.11 S – 20 DP 20 6.72 0.07 0.34 23.8 0.003 0.6 0.37
S – 40 DP 40 7.2 0.32 0.5 42.12 0.01 0.39 1.12 100 DP 100 7.9 2.41 0.75 43.2 0.03 0.048 1.68
S – 10 Co 10 11.88 98.3 0.03 1.52 0.17 0.003 0.05 S – 20 Co 20 11.95 187.26 0.07 23.6 0.36 0.58 0.36 S – 40 Co 40 12.07 94.48 0.08 1.44 0.12 <0.001 0.08
100 Co 100 12.15 206.14 0.05 7.86 1.13 0.0025 0.94 Sandy Soil - 5.2 <0.05 <0.01 0.7 <0.001 0.64 <0.03
MDL (mg/L) 0.05 0.01 0.02 0.001 0.001 0.03
U.S. EPA MCL (mg / L) 0.2 0.01 NA 0.1 0.05 0.05
U.S. EPA WQL (mg / L) 0.75 0.34 NA 0.57 NA 0.005
MD ATL (µg / L) NA NA 13000 NA NA NA Note: 10 BS, 20 BS, 40 BS designate the specimens with 10 %, 20 % and 40 % Brandon Shores fly ash respectively, 10 PSP, 20 PSP, 40 PSP designate the specimens with 10 %, 20 % and 40 % Paul Smith Precipitator fly ash respectively, 10 MT, 20 MT, 40 MT designate the specimens with 10 %, 20 % and 40 % Morgan Town fly ash respectively 10 DP, 20 DP, 40 DP designate the specimens with 10 %, 20 % and 40 % Dickerson Precipitator fly ash respectively, 10 Co, 20 Co, 40 Co designate the specimens with 10 %, 20 % and 40 % Columbia fly ash respectively, MDL: Minimum Detection Limits, MCL= maximum contaminant levels for drinking water; MCL for Al is based on a secondary non-enforceable drinking water regulation; WQL= water quality limits for protection of aquatic life and human health in fresh water. ATL = aquatic toxicity limits for fresh water.

74
Table 4.7. Effluent metal concentrations in TCLP tests.
Specimen Name Fly Ash Content
(%) pH
Al (mg/L)
As (µg/L)
B (µg/L)
Cr (µg/L)
Mn (µg/L)
Se (µg/L)
S – 10 BS 10 4.82 <0.05 <0.01 0.1 0.01 0.21 <0.03 S – 20 BS 20 4.82 0.055 <0.01 0.08 0.01 0.105 <0.03 S – 40 BS 40 4.82 <0.05 <0.01 0.135 0.01 0.135 <0.03
100 BS 100 4.83 0.06 0.045 0.39 0.02 0.04 <0.03 S – 10 PSP 10 4.84 0.085 <0.01 0.105 <0.001 0.18 <0.03 S – 20 PSP 20 4.85 <0.05 <0.01 0.15 <0.001 0.18 <0.03 S – 40 PSP 40 4.85 0.27 0.15 0.35 <0.004 0.3 0.075
100 PSP 100 4.86 0.58 0.465 1.025 0.0045 0.475 0.345 S – 10 MT 10 4.87 0.185 <0.01 0.91 0.02 0.15 <0.03 S – 20 MT 20 4.89 0.32 <0.01 1.37 0.03 0.16 <0.03 S – 40 MT 40 4.92 2.37 <0.01 2.435 0.085 0.29 <0.03
100 MT 100 5.12 5.425 0.03 7.3 0.11 0.43 0.085 S – 10 DP 10 7.05 4.83 0.605 0.01 0.25 0.01 0.23 S – 20 DP 20 7.11 4.87 1.25 0.145 0.38 0.02 0.24 S – 40 DP 40 7.78 4.87 2.07 0.455 0.525 0.03 0.235
100 DP 100 7.96 4.87 8.695 0.05 1.65 0.06 0.275 S – 10 Co 10 5.21 3.945 <0.01 1.115 0.02 0.18 <0.03 S – 20 Co 20 5.42 0.985 0.025 1.725 0.035 0.21 0.045 S – 40 Co 40 7.41 0.05 0.045 3.075 0.07 0.11 0.135
100 Co 100 10.86 14.445 0.06 4.315 0.225 0.04 0.345 Sandy Soil - 6.74 <0.05 <0.01 <0.02 <0.001 <0.001 <0.03
MDL (mg/L) 0.05 0.01 0.02 0.001 0.001 0.03
U.S. EPA MCL (mg / L) 0.2 0.01 NA 0.1 0.05 0.05
U.S. EPA WQL (mg / L) 0.75 0.34 NA 0.57 NA 0.005
MD ATL (µg / L) NA NA 13000 0.57 NA NA Note: 10 BS, 20 BS, 40 BS designate the specimens with 10 %, 20 % and 40 % Brandon Shores fly ash respectively, 10 PSP, 20 PSP, 40 PSP designate the specimens with 10 %, 20 % and 40 % Paul Smith Precipitator fly ash respectively, 10 MT, 20 MT, 40 MT designate the specimens with 10 %, 20 % and 40 % Morgan Town fly ash respectively 10 DP, 20 DP, 40 DP designate the specimens with 10 %, 20 % and 40 % Dickerson Precipitator fly ash respectively, 10 Co, 20 Co, 40 Co designate the specimens with 10 %, 20 % and 40 % Columbia fly ash respectively, MDL: Minimum Detection Limits, MCL= maximum contaminant levels for drinking water; MCL for Al is based on a secondary non-enforceable drinking water regulation; WQL= water quality limits for protection of aquatic life and human health in fresh water. ATL = aquatic toxicity limits for fresh water.

75
Table 4.8 Input Site Parameters for conceptual model.
Wpoc Wp Ws ZGWT Prcpt Tmax T
(m) Side Slope
(H:V) Constant values for all
specimens 30 6 2 5 1.00 50 5 2:1
Notes: All measurements are in meter, Wpoc: Point of compliance, Wp: Pavement width, Ws: Shoulder width, ZGWT: Depth to groundwater table, Prcpt; Annual precipitation rate in m/year, Tmax: 50 years, Thicknes of embankment structure,
Table 4.9 Hydraulic Properties and transport for pavement layers and aquifer input to WiscLeach
Specimen Hydraulic Conductivity,
Ks,(m/year) ne
Hydraulic Gradient
αL (m)
αT (m) Rd for Cr
S – 20 PSP 8.67 0.302 0.001 0.193 0.0193 27 S – 40 PSP 6 0.395 0.001 0.485 0.0485 8 S – 20 DP 25.23 0.42 0.001 0.401 0.0401 1.1 S – 40 DP 20.08 0.489 0.001 0.671 0.0671 15 Pavement 18.29 0.35 0.001 0.1 0.01 1 Subgrade 1.01 0.35 0.001 0.1 0.01 3.5 Aquifer 3784 0.30 0.001 0.1 0.01 1 Notes;αL : Longitudinal dispersivity, αT : Transeverse dispersivity, hydraulic gradients is assumed as 0.001 to simulate the natural conditions, ne : effective porosity, Cr: Chromium.

76
FIGURES

77
5.00
6.00
7.00
8.00
9.00
10.00
11.00
12.00
13.00
0.0 20.0 40.0 60.0 80.0 100.0
S - BSS - PSPS - MTS - DPS -Co
pHFly Ash Content (%)
a)
5.00
6.00
7.00
8.00
9.00
10.00
11.00
12.00
0.0 20.0 40.0 60.0 80.0 100.0
S - BSS - PSPS - MTS - DPS -Co
pH
Fly Ash Content (%)
b)
4.00
5.00
6.00
7.00
8.00
9.00
10.00
11.00
0.0 20.0 40.0 60.0 80.0 100.0
S - BSS - PSPS - MTS - DPS -Co
pH
Fly Ash Content (%)
c)
Figure 4.1. Effect of fly ash content on pH of the soil mixtures (Note: BS: Brandon Shores Fly Ash, PSP: Paul Smith Precipitator Fly ash, MT: Morgantown Fly ash)

78
4
4.5
5
5.5
6
6.5
7
7.5
0 10 20 30 40 50 60 70 80
S - 10 BSS - 20 BS100 BSSandy Soil
pH
Pore Volumes of Flow
5
5.5
6
6.5
7
7.5
8
0 10 20 30 40 50 60 70 80
S - 10 PSPS - 20 PSPS - 40 PSP100 PSPSandy Soil
pH
Pore Volumes of Flow
5
6
7
8
9
10
11
0 10 20 30 40 50 60 70 80
S - 10 MTS - 20 MTS -40 MT100 MTSandy Soil
pH
Pore Volumes of Flow
5
6
7
8
9
10
11
12
13
0 10 20 30 40 50 60 70 80
S - 20 DP100 DPS - 20 Co100 CoSandy Soil
pH
Pore Volumes of Flow
Figure 4.2 pH of the effluent from CLT conducted with soil mixtures

79
0.0
0.2
0.4
0.6
0.8
1.0
0 20 40 60 80 100
S - BSS - PSPS - MTS - DPS - Co
Al C
once
ntr
atio
ns
(pp
m)
Amount of Fly Ash (%)
a) Aluminum
0.0
0.5
1.0
1.5
2.0
2.5
0 20 40 60 80 100
S - BSS - PSPS - MTS - DPS - Co
As
Co
nce
ntra
tions
(pp
m)
Amount of Fly Ash (%)
b) Arsenic
0
50
100
150
200
0 20 40 60 80 100
S - BSS - PSPS - MTS - DPS - Co
Bor
on C
once
ntra
tions
(pp
m)
Amount of Fly Ash (%)
c) Boron
0.0
0.5
1.0
1.5
2.0
2.5
3.0
3.5
4.0
0 20 40 60 80 100
S - BSS - PSPS - MTS - DPS - Co
Chr
omiu
m c
onc
ent
ratio
ns (
ppm
)
Amount of Fly Ash (%)
d) Chromium
0.0
0.5
1.0
1.5
2.0
2.5
3.0
3.5
4.0
0 20 40 60 80 100
S - BSS - PSPS - MTS - DPS - Co
Mn
Con
cen
trat
ion
s (p
pm
)
Amount of Fly Ash (%)
e) Manganese
0.0
1.0
2.0
3.0
4.0
5.0
6.0
0 20 40 60 80 100
S - BSS - PSPS - MT S - DPS - Co
Sel
en
ium
Con
cen
trat
ions
(p
pm)
Amount of Fly Ash (%)
g) Selenium
Figure 4.3 Concentrations of 6 metals in the effluent from CLTs(Note: BS: Brandon Shores, PSP: Paul Smith Precipitator, MT: Morgan Town)

80
0.04
0.06
0.08
0.1
0.12
0.14
0.16
0.18
0 20 40 60 80 100
S - 10 BSS - 20 BSS - 40 BS100 BSA
l Con
cent
ratio
ns (
ppm
)
Pore Volumes of Flow
Al
LDL: 0.05 ppmEPA : 0.2 ppm
0
0.5
1
1.5
2
2.5
3
3.5
4
0 20 40 60 80 100
S - 10 MTS -20 MTS - 40 MT100 MT
Al C
once
ntra
tions
(pp
m)
Pore Volumes of Flow
Al LDL: 0.05 ppmEPA : 0.2 ppm
0
50
100
150
200
0 20 40 60 80 100 120 140
S - 10 CoS - 20 CoS - 40 Co100 Co
Al C
once
ntra
tions
(p
pm
)
Pore Volumes of Flow
Al LDL: 0.05 ppmEPA : 0.2 ppm
0
0.05
0.1
0.15
0.2
0.25
0.3
0.35
0.4
0 20 40 60 80 100
S - 10 PSPS - 20 PSPS - 40 PSP100 PSP
Al C
once
ntra
tions
(pp
m)
Pore Volumes of Flow
Al LDL: 0.05 ppmEPA : 0.2 ppm
0
2
4
6
8
10
0 20 40 60 80 100 120
S - 10 DPS - 20 DPS - 40 DP100 DP
Alu
min
um C
once
ntra
tion
s (p
pm
)
Pore Volumes of Flow
LDL: 0.05 ppmEPA : 0.2 ppm
Al
Figure 4.4 Elution curves for Aluminum Metal
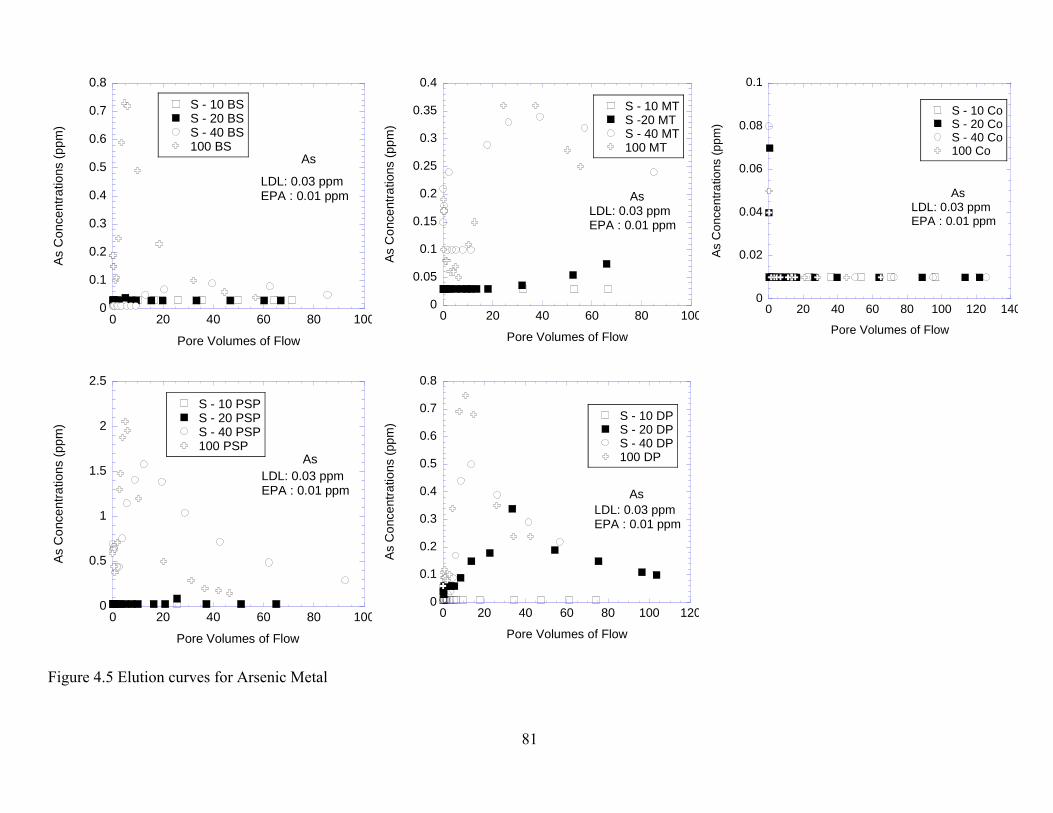
81
0
0.1
0.2
0.3
0.4
0.5
0.6
0.7
0.8
0 20 40 60 80 100
S - 10 BSS - 20 BSS - 40 BS100 BS
As
Co
ncen
tra
tions
(p
pm
)
Pore Volumes of Flow
As
LDL: 0.03 ppmEPA : 0.01 ppm
0
0.05
0.1
0.15
0.2
0.25
0.3
0.35
0.4
0 20 40 60 80 100
S - 10 MTS -20 MTS - 40 MT100 MT
As
Co
nce
ntra
tions
(pp
m)
Pore Volumes of Flow
AsLDL: 0.03 ppmEPA : 0.01 ppm
0
0.02
0.04
0.06
0.08
0.1
0 20 40 60 80 100 120 140
S - 10 CoS - 20 CoS - 40 Co100 Co
As
Co
nce
ntra
tions
(pp
m)
Pore Volumes of Flow
LDL: 0.03 ppmEPA : 0.01 ppm
As
0
0.5
1
1.5
2
2.5
0 20 40 60 80 100
S - 10 PSPS - 20 PSPS - 40 PSP100 PSP
As
Co
nce
ntra
tions
(pp
m)
Pore Volumes of Flow
AsLDL: 0.03 ppmEPA : 0.01 ppm
0
0.1
0.2
0.3
0.4
0.5
0.6
0.7
0.8
0 20 40 60 80 100 120
S - 10 DPS - 20 DPS - 40 DP100 DP
As
Co
ncen
tra
tions
(pp
m)
Pore Volumes of Flow
AsLDL: 0.03 ppmEPA : 0.01 ppm
Figure 4.5 Elution curves for Arsenic Metal

82
0
0.5
1
1.5
2
2.5
3
3.5
4
0 20 40 60 80 100
S - 10 BSS - 20 BSS - 40 BS100 BS
B C
onc
entr
atio
ns (
ppm
)
Pore Volumes of Flow
Boron
LDL : 0.02 ppm
0
50
100
150
200
0 20 40 60 80 100
S - 10 MTS - 20 MTS - 40 MT100 MT
B C
onc
entr
atio
ns (
ppm
)
Pore Volumes of Flow
BoronLDL : 0.02 ppm
0
5
10
15
20
25
0 20 40 60 80 100
S - 10 CoS - 20 CoS - 40 Co100 Co
B c
on
cen
trat
ions
(pp
m)
Pore Volumes of Flow
BoronLDL : 0.02 ppm
0
1
2
3
4
5
0 20 40 60 80 100
S - 10 PSPS - 20 PSPS - 40 PSP100 PSP
B C
onc
ent
ratio
ns (
ppm
)
Pore Volumes of Flow
Boron
LDL: 0.02 ppm
0
10
20
30
40
50
0 20 40 60 80 100 120
S - 10 DPS - 20 DPS - 40 DP100 DP
B c
on
cen
trat
ions
(pp
m)
Pore Volumes of Flow
Boron
LDL: 0.02 ppm
Figure 4.6 Elution Curves for Boron metal

83
0
0.01
0.02
0.03
0.04
0.05
0.06
0 20 40 60 80 100
S - 10 BSS - 20 BSS - 40 BS100 BS
Cr
Con
cen
trat
ions
(p
pm)
Pore Volumes of Flow
Cr
LDL: 0.001 ppmEPA: 0.1 ppm
0
0.5
1
1.5
2
2.5
3
3.5
0 20 40 60 80 100
S - 10 MTS -20 MTS - 40 MT100 MT
Cr
Con
cen
trat
ions
(p
pm)
Pore Volumes of Flow
CrLDL: 0.001 ppmEPA: 0.1 ppm
0
0.2
0.4
0.6
0.8
1
0 20 40 60 80 100 120
S - 10 CoS - 20 CoS - 40 Co100 Co
Cr
Con
cen
trat
ion
s (p
pm)
Pore Volumes of Flow
CrLDL: 0.001 ppmEPA: 0.1 ppm
0
0.02
0.04
0.06
0.08
0.1
0 20 40 60 80 100
S - 10 PSPS - 20 PSPS - 40 PSP100 PSP
Cr
Con
cen
trat
ion
s (p
pm)
Pore Volumes of Flow
CrLDL: 0.001 ppmEPA: 0.1 ppm
0
0.02
0.04
0.06
0.08
0.1
0 10 20 30 40 50 60
S - 10 DPS - 20 DPS - 40 DP100 DP
Cr
Con
cen
tra
tion
s (p
pm
)
Pore Volumes of Flow
Cr
LDL: 0.001 ppmEPA: 0.1 ppm
Figure 4.7 Elution curves for chromium metal

84
0
0.5
1
1.5
2
2.5
3
3.5
0 20 40 60 80 100
S - 10 BSS - 20 BSS - 40 BS100 BS
Mn
Con
cen
trat
ion
s (p
pm)
Pore Volumes of Flow
Mn
LDL: 0.001ppmEPA:0.05 ppm
0
0.005
0.01
0.015
0.02
0.025
0 20 40 60 80 100
S - 10 MTS -20 MTS - 40 MT100 MT
Mn
Con
cen
trat
ion
s (p
pm)
Pore Volumes of Flow
Mn
LDL: 0.001ppmEPA:0.05 ppm
0
0.1
0.2
0.3
0.4
0.5
0.6
0 20 40 60 80 100 120 140
S - 10 CoS - 20 CoS - 40 Co100 Co
Mn
Con
cen
trat
ions
(p
pm
)
Pore Volumes of Flow
Mn
LDL: 0.001ppmEPA:0.05 ppm
0
0.5
1
1.5
2
2.5
3
3.5
4
0 20 40 60 80 100
S - 10 PSPS - 20 PSPS - 40 PSP100 PSP
Mn
Co
nce
ntr
atio
ns
(ppm
)
Pore Volumes of Flow
MnLDL: 0.001ppmEPA:0.05 ppm
0
0.2
0.4
0.6
0.8
1
1.2
1.4
0 20 40 60 80 100 120
S - 10 DPS - 20 DPS - 40 DP100 DP
Mn
Con
cen
trat
ion
s (p
pm
)
Pore Volumes of Flow
LDL: 0.001ppmEPA:0.05 ppm
Mn
Figure 4.8 Elution curve for Manganese metal

85
0.028
0.03
0.032
0.034
0.036
0.038
0.04
0.042
0 20 40 60 80 100
S - 10 BSS - 20 BSS - 40 BS100 BS
Se
Con
cen
trat
ions
(p
pm
)
Pore Volumes of Flow
SeLDL: 0.03 ppmEPA: 0.05 ppm
0
1
2
3
4
5
6
0 20 40 60 80 100
S - 10 MTS -20 MTS - 40 MT100 MT
Se
Co
nce
ntr
atio
ns
(ppm
)
Pore Volumes of Flow
SeLDL: 0.03 ppmEPA: 0.05 ppm
0
0.2
0.4
0.6
0.8
1
0 20 40 60 80 100 120 140
S - 10 CoS - 20 CoS - 40 Co100 Co
Se
Con
cen
trat
ion
s (p
pm)
Pore Volumes of Flow
SeLDL: 0.03 ppmEPA: 0.05 ppm
0
0.5
1
1.5
2
2.5
0 20 40 60 80 100
S - 10 PSPS - 20 PSPS - 40 PSP100 PSP
Se
Con
cen
trat
ions
(p
pm)
Pore Volumes of Flow
SeLDL: 0.03 ppmEPA: 0.05 ppm
0
0.5
1
1.5
2
0 20 40 60 80 100 120
S - 10 DPS - 20 DPS - 40 DP100 DP
Se
Con
cen
trat
ions
(p
pm)
Pore Volumes of Flow
SeLDL: 0.03 ppmEPA: 0.05 ppm
Figure 4.9 Elution curves for selenium metal

86
0.0
0.1
1.0
10.0
100.0
1000.0
0.0 0.1 1.0 10.0 100.0 1000.0
CL
T M
etal
Con
cen
trat
ions
(p
pm)
WLT Metal Concentrations (ppm)
Aluminum
1:1
16:1
0.001
0.01
0.1
1
10
0.001 0.01 0.1 1 10
CL
T M
etal
Con
cen
trat
ion
s (p
pm)
WLT Metal Concentrations (ppm)
1:1
Arsenic
100:1
0.
0.
1
10
100
1000
0.0 0.1 1.0 10.0 100.0 1000.0
CL
T M
etal
Co
nce
ntr
atio
ns (
ppm
)
WLT Metal Concentrations (ppm)
Boron
1:1
100:1
0.001
0.01
0.1
1
10
0.001 0.01 0.1 1 10
CL
T M
etal
Con
cen
trat
ions
(p
pm)
WLT Metal Concentrations (ppm)
1:1
Chromium
100:1
0.001
0.01
0.1
1
10
0.001 0.01 0.1 1 10
CLT
Met
al C
onc
ent
ratio
ns (
ppm
)
WLT Metal Concentrations (ppm)
1:1
35:1
Manganese
0.01
0.1
1
10
0.01 0.1 1 10
CL
T M
etal
C
once
ntr
atio
ns
(ppm
)
WLT Metal Concentrations (ppm)
1:1
Selenium
50:1
Figure 4.10. Comparison of peak effluent concentrations of six metals from the CLTs and the WLTs

87
0.01
0.1
1
10
100
1000
0.01 0.1 1 10 100 1000
TC
LP
s M
etal
Con
cen
trat
ions
(p
pm
)
CLT Metal Concentrations (ppm)
1:1
Aluminum
0.001
0.01
0.1
1
10
0.001 0.01 0.1 1 10
TC
LP
s M
etal
C
once
ntr
atio
ns
(pp
m)
CLT Metal Concentrations (ppm)
1:1
Arsenic
0.03:1
0.01
0.1
1
10
100
1000
0.1 1 10 100 1000
TC
LP
s M
etal
Con
cen
trat
ions
(p
pm
)
CLT Metal Concentrations (ppm)
1:1
Boron0.02:1
0.001
0.01
0.1
1
10
0.001 0.01 0.1 1 10
TC
LP
s M
etal
C
onc
en
trat
ion
s (p
pm
)
CLT Metal Concentrations (ppm)
1:1Chromium
0.008:1
0.001
0.01
0.1
1
10
100
1000
0.001 0.01 0.1 1 10 100 1000
TC
LP
s M
etal
Con
cen
trat
ions
(p
pm)
CLT Metal Concentrations (ppm)
1:1
Manganese
0.01
0.1
1
10
100
1000
0.01 0.1 1 10 100 1000
TC
LP
s M
eta
l C
once
ntr
atio
ns (
pp
m)
CLT Metal Concentrations (ppm)
1:1
Selenium0.01:1
Figure 4.11. Comparison of peak effluent concentrations of six metals from the CLTs and the TCLPs

88
0.01
0.1
1
10
100
0.01 0.1 1 10 100
TC
LP
s M
eta
l C
once
ntr
atio
ns (
ppm
)
WLT Metal Concentrations (ppm)
1:1Aluminum
0.001
0.01
0.1
1
0.001 0.01 0.1 1
TC
LP
s M
etal
C
once
ntr
atio
ns (
ppm
)
WLT Metal Concentrations (ppm)
1:1
Arsenic
20:1
0.01
0.1
1
10
0.01 0.1 1 10
TC
LP
s M
etal
Co
ncen
tra
tions
(p
pm)
WLT Metal Concentrations (ppm)
20:1
1:1
Boron
0.001
0.01
0.1
1
0.001 0.01 0.1 1
TC
LP
s M
etal
C
once
ntr
atio
ns (
pp
m)
WLT Metal Concentrations (ppm)
1:1Chromium
10:1
0.001
0.01
0.1
1
0.001 0.01 0.1 1
TC
LP
s M
etal
Co
ncen
tra
tions
(p
pm)
WLT Metal Concentrations (ppm)
Manganese
1:1
33:1
0.01
0.1
1
0.01 0.1 1
TC
LP
s M
etal
Con
cen
trat
ions
(p
pm
)
WLT Metal Concentrations (ppm)
1:1Selenium
16:1
Figure 4.12. Comparison of peak effluent concentrations of six metals from the WLTs and the TCLPs

89
Figure 4.13. Conceptual model for embankment structure

90
Figure 4.14. Predicted Cr concentrations in vadose zone and ground water (Note: 20 PSP designate the specimens with 20 % Paul Smith Precipitator fly ash.)
0.200.40 0.60
Horizontal Distance (m)
De
pth
Be
low
Pa
vem
en
tS
urf
ace
(m)
-20 -10 0 10 20
0
5
10
15
20
25
Ground Water Flow
CCr: g/l
After 5 yr
Subgrade
Fly Ash Mixed Soil
S - 20 PSP
EPA Limit for Chromium : 100 ppb
1.00
Horizontal Distance (m)
De
pth
Be
low
Pa
vem
en
tS
urf
ace
(m)
-20 -10 0 10 20
0
5
10
15
20
25
Ground Water Flow
CCr: g/l
After 10 yr
Subgrade
Fly Ash Mixed Soil
S - 20 PSP
EPA Limit for Chromium : 100 ppb
1.00 1.502.00
Horizontal Distance (m)
De
pth
Be
low
Pa
vem
en
tS
urf
ace
(m)
-20 -10 0 10 20
0
5
10
15
20
25
Ground Water Flow
CCr: g/l
After 20 yr
Subgrade
Fly Ash Mixed Soil
S - 20 PSP
EPA Limit for Chromium : 100 ppb
0.20 0.20
0.40
0.60 0.6
0.801.20
1.40
Horizontal Distance (m)
De
pth
Be
low
Pa
vem
en
tS
urf
ace
(m)
-20 -10 0 10 20
0
5
10
15
20
25
Ground Water Flow
CCr: g/l
After 50 yr
Subgrade
Fly Ash Mixed Soil
S - 20 PSP
EPA Limit for Chromium : 100 ppb

91
Figure 4.15. Predicted Cr concentrations in vadose zone and ground water (Note: 40 PSP designate the specimens with 40 % Paul Smith Precipitator fly ash.)
100.00 150.00200.00
Horizontal Distance (m)
De
pth
Be
low
Pa
vem
en
tS
urf
ace
(m)
-20 -10 0 10 20
0
5
10
15
20
25
Ground Water Flow
CCr: g/l
After 5 yr
Subgrade
Fly Ash Mixed Soil
S - 40 PSP
EPA Limit for Chromium : 100 ppb
5
0.0
0
100.00150.00
200.00
Horizontal Distance (m)
De
pth
Be
low
Pa
vem
en
tS
urf
ace
(m)
-20 -10 0 10 20
0
5
10
15
20
25
Ground Water Flow
CCr: g/l
After 10 yr
Subgrade
Fly Ash Mixed Soil
S - 40 PSP
EPA limit for Chromium : 100 ppb
50
.00
100.00150.00
200.00
Horizontal Distance (m)
De
pth
Be
low
Pa
vem
en
tS
urf
ace
(m)
-20 -10 0 10 20
0
5
10
15
20
25
Ground Water Flow
CCr: g/l
After 20 yr
Subgrade
Fly Ash Mixed Soil
S - 40 PSP
EPA Limit for Chromium : 100 ppb
20.00
40.0
40.00
60.0080.00
Horizontal Distance (m)
De
pth
Be
low
Pa
vem
en
tS
urf
ace
(m)
-20 -10 0 10 20
0
5
10
15
20
25
Ground Water Flow
CCr: g/l
After 50 yr
Subgrade
Fly Ash Mixed Soil
S - 40 PSP
EPA Limit for Chromium : 100 ppb

92
1.00 1.502.00
Horizontal Distance (m)
De
pth
Be
low
Pa
vem
en
tS
urf
ace
(m)
-20 -10 0 10 20
0
5
10
15
20
25
Ground Water Flow
CCr: g/l
After 5 yr
Subgrade
Fly Ash Mixed Soil
S - 20 DP
EPA Limit for Chromium: 100 ppb
0.5
0
1.00
1.50
Horizontal Distance (m)
De
pth
Be
low
Pa
vem
en
tS
urf
ace
(m)
-20 -10 0 10 20
0
5
10
15
20
25
Ground Water Flow
CCr: g/l
After 10 yr
Subgrade
Fly Ash Mixed Soil
S - 20 DP
EPA Limit for Chromium : 100 ppb
0.5
0.5
01.00
Horizontal Distance (m)
De
pth
Be
low
Pa
vem
en
tS
urf
ace
(m)
-20 -10 0 10 20
0
5
10
15
20
25
Ground Water Flow
CCr: g/l
After 20 yr
Subgrade
Fly Ash Mixed Soil
S - 20 DP
EPA Limit for Chromium : 100 ppb
0.10
0.20
0.3
Horizontal Distance (m)
De
pth
Be
low
Pa
vem
en
tS
urf
ace
(m)
-20 -10 0 10 20
0
5
10
15
20
25
Ground Water Flow
CCr: g/l
After 30 yr
Subgrade
Fly Ash Mixed Soil
S - 20 DP
EPA Limit for Chromium : 100 ppb
Figure 4.16 Predicted Cr concentrations in vadose zone and ground water (Note: 20 DP designate the specimens with 20 % Dickerson Precipitator fly ash.)

93
1.003.00
Horizontal Distance (m)
De
pth
Be
low
Pa
vem
en
tS
urf
ace
(m)
-20 -10 0 10 20
0
5
10
15
20
25
Ground Water Flow
CCr: g/l
After 5 yr
Subgrade
Fly Ash Mixed Soil
S - 40 DP
EPA Limit for Chromium : 100 ppb
1.00 2.003.00 4.00
Horizontal Distance (m)
De
pth
Be
low
Pa
vem
en
tS
urf
ace
(m)
-20 -10 0 10 20
0
5
10
15
20
25
Ground Water Flow
CCr: g/l
After 10 yr
Subgrade
Fly Ash Mixed Soil
S - 40 DP
EPA Limit for Chromium : 100 ppb
1.00
2.0
0 3.004.00
Horizontal Distance (m)
De
pth
Be
low
Pa
vem
en
tS
urf
ace
(m)
-20 -10 0 10 20
0
5
10
15
20
25
Ground Water Flow
CCr: g/l
After 20 yr
Subgrade
Fly Ash Mixed Soil
S - 40 DP
EPA Limit for Chromium : 100 ppb
1.0
0 2.00
3.0
3.00
Horizontal Distance (m)
De
pth
Be
low
Pa
vem
en
tS
urf
ace
(m)
-20 -10 0 10 20
0
5
10
15
20
25
Ground Water Flow
CCr: g/l
After 50 yr
Subgrade
Fly Ash Mixed Soil
S - 40 DP
EPA Limit for Chromium : 100 ppb
Figure 4.17 Predicted Cr concentrations in vadose zone and ground water (Note: 40 DP designate the specimens with 40 % Dickerson Precipitator fly ash.)

94
REFERENCES
ACAA (2008). “2008 Coal Combustion Product Production and Use”, American Coal Ash
Association, Denver, Colorado
Al-Abed, S.R., Jegadeesan, G. and Pinto, P. (2008). “Influence of Trace Metal Distribution on its
Leachability from Coal Fly Ash”, Fuel, Vol. 87, pp. 1887-1893.
Allison, J.D., Brown, D.S., Novo-gradac, K.J. (1991). “MINTEQA2/PRODEFA2, A
Geochemical Assesment Model for Environmental Systems. Version 3.11 Databases and
Version 3.0 User`s Manual”, US EPA, Athens.
ASTM D854 (2005). “Standard test methods for specific gravity of soil solids by water
pycnometer”, Annual Book of ASTM Standards, Vol. 04.01, American Society for
Testing and Materials, West Conshohocken, Pennsylvania, USA.
ASTM D1293 (2005). “Standard test method for pH of water”, Annual Book of ASTM
Standards, Vol. 04.01, American Society for Testing and Materials, West
Conshohocken, Pennsylvania, USA.
ASTM D3987 (1992). “Standard test method for shake extraction of solid waste with water”,
Annual Book of ASTM Standards, Vol. 04.01, American Society for Testing and
Materials, West Conshohocken, Pennsylvania, USA.
ASTM C618 (2008). “ Standard specification for coal fly ash and raw or calcined Natural
pozzolan for use in concrete”, Annual Book of ASTM Standards, Vol. 04.01,
American Society for Testing and Materials, West Conshohocken, Pennsylvania, USA.
Baba A., Gurdal G., Sengunalp, F., and Ozay, O. (2008). “Effects of Leachant Temperature and
pH on Leachability of Metals from Fly Ash. A Case Study: Can Thermal Power Plant,
Province of Canakkale, Turkey.” Environmental Monit. Assess. Vol. 139, pp. 287-298.
95
Baykal, G., Edincliler, A., Saygili, A. (2004). “Highway Embankment Construction Using Fly
Ash in Cold Regions”, Resources, Conversation and Recycling, Vol. 42 - 3, 209-222.
Bin-Shafique, S., Benson, C., Edil, T. and Hwang, K. (2006). Leachate Concentrations from
Water leach and Column Leach Tests on Fly – Ash Stabilized Soil, Environmental
Engineering Science, 23(1), 51-65.
Brookins, D. G., Eh-pH Diagrams for Geochemistry, (1988). Springer-Verlag Berlin
Heidelberg, United States.
Brown, S., Christensen, B. Lombi, E., McLaughin, M., McGrath, S., Colpaert, J., and
Vangronsveld, J. (2005). “An Inter-Laboratory Study to Test the Ability of Amendments
to Reduce the Availibility of Cd, Pb, and Zn In Situ.”, Environmental Pollution, Vol. 138,
pp. 34-45.
Cetin, B., Aydilek, A.H., and Guney, Y. (2010). “Stabilization of Recycled Base Material Using
High Carbon Fly Ash”, Resources, Conservation and Recycling, Vol. 54, pp. 879-892.
Chen, G.G., He, Z.L., Stoffella, P.J., Yang, X.E., Yu, S., Yang, J.Y., and Calvert, D.V. (2006).
“Leaching Potential of Heavy Metals (Cd, Ni, Pb, Cu, Zn) from Acidic Sandy Soil
Amended with Dolomite Phosphate Rock (DPR) Fertilizers”, Journal of Trace Elements
in Medicine and Biology, Vol. 20, pp. 127 – 133.
Chichester, D.L. and Landsberger, S. (1996). “Determination of the leaching dynamics of metals
from municipal solid waste incinerator fly ash using a column test”, Journal of Air and
Waste Management Association, Vol. 46, pp. 643-649.
Cornelis, G., Johnson, C.H., Van Gerven, T., Vandecasteele, C (2008). “Leaching Mechanisms
of Oxyanionic Metalloid and Metal Species in Alkaline Solid Wastes”, Applied
Geochemistry, Vol. 23, 955-976.

96
Cornell, R.M., and Schwertmann, U. (2003). The Iron Oxides : Structure, Properties, Reactions,
Occurences and Uses, Second Edition Wiley – VCH, Weinheim.
Cotton , A.F, and Wilkinson, G. (1999)., Advanced Inorganic Chemistry, 5th ed. John Wiley & Sons, Inc., New York
Demirkan, M.M., Seagren, E.A., and Aydilek, A.H. (2006). “Reuse of Fly Ash Amended
Petroleum Contaminated Soils in Highway Embankments”, Journal of the Transportation
Research Board, No. 1975, pp. 104-111.
DiGioia, A. M. and Nuzzo, W. L. (1972). “Fly Ash as Structural Fill,” J. Power Div., ASCE,
New York, Vol. 98 (1), pp. 77-92.
Dijkstra, J.J., Van der Sloot, H.A., and Comans, R.N.J (2002). “Process Identification and Model
Development of Contaminant Transport in MSWI Bottom Ash”, Waste Management,
Vol. 22(5), 531.
Dijkstra, J.J., Meeussen, J.C.L and Comans, R.N.J (2004). “Leaching of Heavy Metals From
Contaminated Soils : An Experimental and Modeling Study”, Environmental Science and
Technology, Vol. 38(16), 4390.
Dixit, S., and Herring, J.G. (2003). “Comparison of Arsenic (V) and Arsenic (III) Sorption onto
Iron Oxide Minerals; Implications for Arsenic Mobility”, Environmental Science and
technology, Vol. 37, 4182-4189.
Dutta, B.K., Khanra and S., Mallick, D. (2009). “Leaching of elements from coal fly ash:
Assesment of its potential for use in filling abandoned coal mines”, Journal of Fuel, Vol.
88, pp. 1314-1323.
Dzombak, D.A. and Morrel, F.M.M. (1990). , Surface Complexation Modeling: Hydrous Ferric
Oxide , John Wiley and Sons, New York.

97
Edil, T.B., Sandstorm, L.K., and Berthouex, P.M. (1992). “Interaction of inorganic leachate with
compacted pozzolanic fly ash”, Journal of Geotechnical Engineering, Vol.118, No. 9, pp.
1410-1430.
Espana, J.S., Pamo, E.L., Santofimia, E., Aduvire, O., Reyes, J., and Barettino,D. (2005). “Acid
Mine Drainage in the Iberian Pyrite Belt (Odiel River Water Shed, Huelva,
Spain):Geochemistry, mineralogy and Environmental Implication”, Applied
Geochemistry, Vol. 20, pp. 1320-56.
Garavaglia, R., and Caramuscio, P. (1994). “Coal Fly – Ash Leaching Behavior and Solubility
Controlling Solids ”, Maastricht, Neth, 87.
Garrabrants, A.C., Sanchez, F., and Kosson, D.S.(2004). “Changes in Constituent Equilibrium
Leaching and Pore Water Characteristics of a Portland Cement Mortar as a Result of
Carbonation”, Waste Management, Vol. 24, pp. 19 - 36.
Gelhar, L.W., Welty, C., and Rehfeldt, K.R. (1992). “A critical review of data on field-scale
dispersion in aquifers”, Water Resources Research, Vol. 28, No. 7, pp. 1955–1974.
Ghosh, A. and Subbarao, C. (1998). “Hydraulic conductivity and leachate characteristics of
stabilized fly ash”, Journal of Environmental Engineering, Vol. 124, No. 9, pp. 812-820.
Goh, A. T. C., and Tay, J. H. (1993). “Municipal Solid Waste Incinerator Fly Ash for
Geotechnical Applications,” J. of Geotech. Engrg., ASCE, New York, Vol.
119 (5), pp. 811-825.
Goswami, R.K. and Mahanta, C. (2007). “Leaching Characteristics of Residual Lateric soils
Stabilized with Fly Ash and Lime for Geotechnical Applications”, Waste Management,
Vol. 27, pp. 466 – 481.

98
Jackson, B.P., Miller, W.P., Schumann, A.W., and Sumner, M.E. (1999). “Trace Element
Solubility from Land Application of Fly Ash / Organic Waste Mixtures”, Journal of
Environmental Quality, Vol. 28 (2), pp. 639.
Jegadeesan, G., Al-Abed, S.R., and Pinto, P. (2008). “Influence of Trace Metal Distribution on
its Leachability from Coal Fly Ash”, Fuel, Vol. 87, pp. 1887-1893.
Jing, C., Liu, S., Korfiatis, P., Meng, X. (2006). “Leaching Behavior of Cr (III) in Stabilized /
Solidified Soil”, Chemosphere, Vol. 64, 379-385.
Jo, H.Y., Min, S.H., Lee, T.Y., Ahn, H.S., Lee, H.S, Yang, J.Y., and Hong, J.K. (2007).
“Environmental Feasibility of Using Coal Ash as a Fill Material to Raise Ground Level ”,
Journal of Hazardous Materials, Vol. 154, pp. 933 – 945.
Kenkel, J. (2003). ANAlytical Chemistry for Technicians, Lewis Publishers, Boca Raton, FL.
Kumpiene, J., Lagerkvist, A., and Maurice, C. (2007). “Stabilization of Pb and Cu Contaminated
Soil Using Coal Fly Ash and Peat, Environmental Pollution, Vol. 145, pp. 365 – 373.
Komonweeraket, K. Benson, C.H., Edil, T.B., and Bleam, W.F.(2010). “Mechanisms Controlling
Leaching of Heavy Metals from Soil Stabilized with Fly Ash”, Geo Engineering Report
No. 02-14, Geo Engineering Program, University of Wisconsin-Madison, Madison, WI.
Langmuir, D. (1997). Aqueous Environmental Geochemistry, Prentice – Hall, Inc., Vol. 47, New
Jersey.
Leuz, A.K., Monch, H., Johnson, A.C. (2006b). “Sorption of Sb(III) and Sb(V) to Geothite:
Influence on Sb(III) Oxidation and Mobilization”, Environmental Science and
Technology, Vol. 40, 7277 - 7282.
99
Lim, T.T., Tay, J.H., Tan, L.C., Choa, V., and The, C.I. (2004). “Changes in Mobility and
Speciation of Heavy Metals in Clay – Amended Incinerator Fly Ash”, Environmental
Geology, Vol. 47, 1-10.
Li, L, Benson, C.H., Edil, T.B., and Hatipoglu, B. (2007). “Groundwater Impacts from Coal Ash
in Highways”, Waste and Resource Management, Vol. 159, pp. 151 – 163.
Malferrari, D., Brigatti, M.F., Laurora, and A., Pini, S. (2008). “Heavy Metals in Sediments from
Canals for Water Supplying and Drainage: Mobilization and Control Strategies”, Journal
of Hazardous Materials, Vol. 161, pp. 723-729.
Morar, D.L. (2007). “Leaching of Metals from Fly Ash – Amended Permeable Reactive
Barriers”, M.S. Thesis, University of Maryland – College Park.
Naik, T.R., Singh, S.S., and Ramme, B.W. (2001). “ Performance and Leaching Assessment of
Flowable Slurry”, Journal of Environmental Engineering, Vol.127, No.4, pp.359-368.
Ogunro, V.O. and Inyang, H.I. (2003). “Relating batch and column diffusion coefficients for
leachable contaminants in particulate waste materials”, Journal of Environmental
Engineering, ASCE, Vol. 129, Issue 10, pp. 930-942.
Pagenkopf, G.K., and Connolly, J.M., (1982). “Retention of Boron by Coal Ash”, Environmental
Science & Technology, Vol. 16, No. 9, 609 - 613.
Pandian, N.S., Rajasekhar, C., and Sridharan, A. (1996). “Fly Ash as a Pre-Filter Material for the
Retention of Lead Ions”, Journal of Testing and Evaluation, Vol.24, No.3, pp.181-186.
Papini, M. P., Kahie, Y. D., Troia, B., and Majone, M. (1999). “Adsorption of Lead at
Variable pH onto a Natural Porous Medium: Modeling of Batch and Column
Experiments,” Environ. Sci. and Technol., Vol. 33, pp. 4457-4464.

100
Pavageau, M., Morin, H., Seby, F., Guiman, C., Krupp, E. Pecheyran, C., Poulleau, J., Donard,
O.F.X.(2004). “Partioning of Metal Species During an Enriched Fuel Combustion
Experiment. Speciation in the Gaseous and Particulates Phases, Environmental Science
and Technology, Vol. 38, 2252-2263.
Peacock, C.L. and Sherman, D.M. (2004). “Vanadium (V) Adsorption onto Geothite (α –
FeOOH) at pH 1.5 to pH 12: A Surface Complexation Model Based on an Initio
Molecular Geometries and EXAFS Spectroscopy”, Geochim. Cosmochim, Vol. 68, pp.
1723 - 1733.
Piantone, P., Bodenan, F., Chatelet – Sniduro, L., (2004). “Minerological Study of Secondary
Mineral Phases from Weathered MSWI Bottom Ash: Implications for the Modelling and
Trapping of Heavy Metals”, Applied Geochemistry, Vol. 19, 1981-1904.
Rai, D. and Zachara, J.M. (1984). “Chemical Attenuation Rates, Coefficients, and Constants in
Leachate Migration Review”, Vol. 1, Electric Power Institute Rep. EPRI, EA - 3356 .
Ricou, P., Lecuyer, I., and Le Cloirec, P. (1999). “Removal of Cu2+, Zn2+ and Pb2+ By
Adsorption Onto Fly Ash and Fly Ash/Lime Mixing”, Wat. Sci. Tech., Vol. 39, pp. 239 –
247.
Sauer, J.J., Benson, C.H., and Edil, T.B. (2005). “Leaching of Heavy Metals from Organic Soils
Stabilized with High Carbon Fly Ash”, Geo Engineering Report No. 05-01, Geo
Engineering Program, University of Wisconsin – Madison, Madison, WI.
Samaras, P., Papadimitriou, C.A., Haritou, I., Zouboluis, A.I. (2008). “Investigation of Sewage
Sludge Stabilization Potential by the Addition of Fly Ash and Lime”, Journal of
Hazardous Materials, Vol. 154, pp. 1052-1059.

101
Soco, E., and Kalembkiewicz, J. (2007). “Investigations of Sequential Leaching Behavior of Cu
and Zn from Coal Fly Ash and Their Mobility in Environmental Conditions”, Journal of
Hazardous Materials, Vol, 145, 482-487.
Sparks, D.L. (2003). Environmental Soil Chemistry, Academic Press, California, USA, 300 p.
Srivastava, S., Chaudhary, R., and Khale, D. (2008). “ Influence of pH, Curing Time and
Environmental Stress on the Immobilization of Hazardous Waste Using Activated Fly
Ash”, Journal of Hazardous Materials, Vol. 153, pp. 1103 – 1109.
Stumm, W. and Morgan, J.J. (1996). Aquatic Chemistry, Chemical Equilibria and Rates in
Natural Waters, 3rd ed. John Wiley & Sons, Inc., New York, 1022 p.
Sushil, S., and Batra, V.S. (2006). “Analysis of Fly Ash Heavy Metal Content and Disposal in
Three Thermal Power Plants in India”, Journal of Fuel, Vol. 85, pp. 2676 – 2679.
Suzuki, K., and Ono, Y. (2008). “Leaching Characteristics of Stabilized/Solidified Fly Ash
Generated from Ash – Melting Plant”, Journal of Chemosphere, Vol. 71, pp. 922 – 932.
Theis, T.M and Wirth, J. L. (1977). “Sorptive Behavior of Trace Metals on Fly Ash in Aqueous
Systems,” Envir. Sci. and Technol., Vol. 11(12), pp. 1096 – 1100.
van der Hoek, E.E., van Elteren, J.T., Comans, R.N.J., (1996). “Determination of As, Sb, and Se
Speciation in Fly Ash Leachates”, Internat. Environ, Vol. 63, 67-79.
Vitkova, M., Ettler, V., Sebek, O.,and Mihaljevic, M. (2008). “Metal – ContamiNAnt Leaching
from Lead Smelter Fly Ash Using pH – Stat Experiments”, Mineralogical Magazine,
Vol. 72, pp. 521 – 524.
Wang, W., Qin, Y., Song, D., and Wang, K. (2008). “Column Leaching of Coal and Its
Combustion Residues, Shizuishan, ChiNA”, International Journal of Coal Geology, Vol.
75, pp. 81 -87.

102
Wang, J., Ban, H., Teng, X., Wang, H.,and Ladwig, K. (2006). “Impacts of pH and Ammonia on
the Leaching of Cu(II) and Cd(II) from Coal Fly Ash”, Journal of Chemosphere, Vol. 64,
pp. 1892 – 1898.
Wang, T., Wang, J, Tang, Y., Shi, H., and Ladwig, K (2009). “Leaching Characteristics of
Arsenic and Selenium from Coal Fly Ash: Role of Calcium”, Journal of Energy & Fuels,
Vol. 23, pp. 2959 – 2966.
Wehrer, M. and Totsche, K.U. (2008). “Effective Rates of Heavy Metal Release from Alkaline
Wastes – Quantified by Column Outflow Experiments and Inverse Simulations”,Journal
of Contaminant Hydrology, Vol. 101, pp. 53 – 66.
Whalley, C., Hursthouse, A., Rowlat, S., Iqbal-Zahid, P., Vaughan, H., and Durant, R. (1999),
“Chromium Speciation in Natural Waters Draining Contaminated Land, Glasgow, U.K.”
Water Air Soil Pollution, Vol. 112, pp. 389 – 405.
Yan, R., Gauthier, D., and Flamant, G. (2001). “Volatility and Chemistry of Trace Elements in a
Coal Combustor”, Fuel, Vol. 80, pp. 2217 – 2226.
Yoon, S., Balunaini, U., Yildirim, Z.I., Prezzi, M.,and Siddiki, N. (2009). “Construction of
Embankment with Fly and Bottom Ash Mixture, Field Performance Study”, J.Mat. in
Civ. Engrg, Vol. 21 – 6, pp. 271 – 278.
Zhang, J., and Solis, R. (2008). “Fly Ash Stabilized Gypsiferous Soil as Embankment Material”,
Earth & Environmental Science, Vol. 6, pp. 809 – 814.

103

104
APPENDIX A
Elution Curves for Metals for High Carbon Fly Ash Stabilized Base Layer

105

106
0
10
20
30
40
50
0 40 80 120 160 200
10 BS + 2.5 LKD10 BS + 5 LKD20 BS + 5 LKD100 BSURM
Pore Volumes of Flow
MCL Limits = 6 ppbLDL = 3 ppb
a) Antimony
Effl
uent
Con
cen
trat
ion
(ppb
)C
100BSMax= 304 ppb
0
10
20
30
40
50
0 50 100 150 200
10 BS + 2.5 LKD10 BS + 5 LKD20 BS + 5 LKD100 BSURM
Eff
lue
nt C
once
ntr
atio
n (
ppb
)
Pore Volumes of Flow
b) Chromium
MCL Limits = 100 ppbLDL = 0.5 ppb
0
50
100
150
0 50 100 150 200 250 300
10 B S + 2 .5 LK D10 B S + 5 L KD20 B S + 5 L KD100 B SU R M
Effl
uent
Con
cen
trat
ion
(p
pb)
P o re V olum es o f F low
c) Iron
E PA M C L = 300 ppbLD L = 3.2 p pb
C100 BS m ax
=223 ppb
C10 B S + 2 .5 L K D
= 2 16 ppb
C10 B S + 5 LK D
= 197 ppb

107
0
5
10
15
20
25
0 50 100 150 200
10 PS + 2.5 LKD10 PS + 5 LKD20 PS + 5 LKD100 PSURM
Pore Volumes of Flow
MCL Limits = 300 ppbLDL = 3.2 ppb
a) Iron
Eff
lue
nt C
once
ntr
atio
n (
ppb
)C
URM: 92 ppb
C100 PS
: 174 ppb
0
0.2
0.4
0.6
0.8
1
1.2
0 40 80 120 160 200
10 PS + 2.5 LKD
10 PS + 5 LKD
20 PS + 5 LKD
100 PS
Pore Volumes of Flow
MCL Limits = 50 ppbLDL = 0.05 ppb
b) Manganese
Eff
lue
nt C
once
ntr
atio
n (
pp
b)
C100 PS
: 1654 ppb
0
50
100
150
200
0 20 40 60 80 100 120 140 160
10 PS + 2.5 LKD10 PS + 5 LKD20 PS + 5 LKD100 PSURM
Pore Volumes of Flow
MCL Limits = 5000 ppbLDL = 1 ppb
c) Zinc
Eff
lue
nt C
once
ntr
atio
n (
ppb
)
CURM
: 258 ppb
0
1000
2000
3000
4000
5000
6000
7000
0 40 80 120 160 200
10 PS + 2.5 LKD10 PS + 5 LKD20 PS + 5 LKD100 PSURM
Pore Volumes of Flow
MCL Limits = 200 ppbLDL = 2.5 ppb
Eff
lue
nt C
once
ntr
atio
n (
ppb
)
d) Aluminum
C20 PS + 5 LKD
: 7228 ppb

108
0
1000
2000
3000
4000
5000
6000
7000
0 40 80 120 160 200
10 DP + 2.5 LKD10 DP + 5 LKD20 DP + 5 LKD100 DPURM
Pore Volumes of Flow
MCL Limits = 200 ppbLDL = 2.5 ppb
Effl
uent
Con
cent
ratio
n (p
pb)
a) Aluminum
C20 DP + 5 LKD
: 8644 ppb
0
5
10
15
20
25
30
0 40 80 120 160 200
10 DP + 2.5 LKD10 DP + 5 LKD20 DP + 5 LKD100 DPURM
Pore Volumes of Flow
MCL Limits = 100 ppbLDL = 0.5 ppb
b) Chromium
Eff
lue
nt C
once
ntr
atio
n (
ppb
)
C100 DP
: 253 ppb
0
5
10
15
20
25
30
0 40 80 120 160 200
10 DP + 2.5 LKD10 DP + 5 LKD20 DP + 5 LKD100 DPURM
Pore Volumes of Flow
MCL Limits = 1300 ppbLDL = 0.7 ppb
c) Copper
Eff
lue
nt C
once
ntr
atio
n (
ppb
)
C100 DP
: 181 ppb
0
5
10
15
20
25
30
0 40 80 120 160 200
10 DP + 2.5 LKD10 DP + 5 LKD20 DP + 5 LKD100 DPURM
Pore Volumes of Flow
MCL Limits = 300 ppbLDL = 3.2 ppb
d) Iron
Eff
lue
nt C
once
ntr
atio
n (p
pb) C
URM: 92 ppb
C100DP
: 162 ppb

109
0
0.2
0.4
0.6
0.8
1
1.2
0 40 80 120 160 200
10 DP + 2.5 LKD
10 DP + 5 LKD
20 DP + 5 LKD
100 DP
Pore Volumes of Flow
EPA MCL = 50 ppbLDL = 0.05 ppb
a) Manganese
Effl
uent
Con
cen
trat
ion
(p
pb)
C100 DP
: 257 ppb
0
50
100
150
200
250
0 40 80 120 160 200
10 DP + 2.5 LKD10 DP + 5 LKD20 DP + 5 LKD100 DPURM
Pore Volumes of Flow
Effl
uent
Con
cen
tra
tion
(ppb
)
b) VanadiumLDL= 0.1 ppb
C100 DP
: 1093 ppb
0
50
100
150
200
0 40 80 120 160 200
10 DP + 2.5 LKD10 DP + 5 LKD20 DP + 5 LKD100 DPURM
Pore Volumes of Flow
c) Zinc
Eff
lue
nt C
once
ntr
atio
n (
pp
b)
MCL Limit: 5000 ppbLDL= 1 ppb
CURM
: 257 ppb

110
APPENDIX B
Predicted Cr concentrations in vadose zone and ground water for High Carbon Fly Ash Stabilized Base Layer

111
5
5 10
1515
Horizontal Distance (m)
De
pth
Be
low
Gro
un
dS
urf
ace
(m)
-10 -5 0 5 10 15 20
0
2
4
6
8 Leaching heavy metalconcentration (ppb) after 1 yr
Ground Water Flow
PavementHCFA Stabilized Base Layer
Chromium
10 BS + 5 LKD
5
5
510
Horizontal Distance (m)
De
pth
Be
low
Gro
un
dS
urf
ace
(m)
-10 -5 0 5 10 15 20
0
2
4
6
8 Leaching heavy metalconcentration (ppb) after 2 yrGround Water Flow
Chromium
PavementHCFA Stabilized Base Layer
10 BS + 5 LKD
0.1
0.1
0.2
0.2
0.3
0.4 0.4
0.5
0.6 0.6
0.7
Horizontal Distance (m)
De
pth
Be
low
Gro
un
dS
urf
ace
(m)
-10 -5 0 5 10 15 20
0
2
4
6
8 Leaching heavy metalconcentration (ppb) after 4 yr
Ground Water Flow
Chromium
PavementHCFA Stabilized Base Layer
10 BS + 5 LKD
0.005 0.01
0.015
0.0150.02
0.025
0.025
0.03
0.035
0.035
0.04
Horizontal Distance (m)
De
pth
Be
low
Gro
un
dS
urf
ace
(m)
-10 -5 0 5 10 15 20
0
2
4
6
8
Leaching heavy metalconcentration (ppb) after 8yr
Ground Water Flow
Chromium
PavementHCFA Stabilized Base Layer
10 BS + 5 LKD
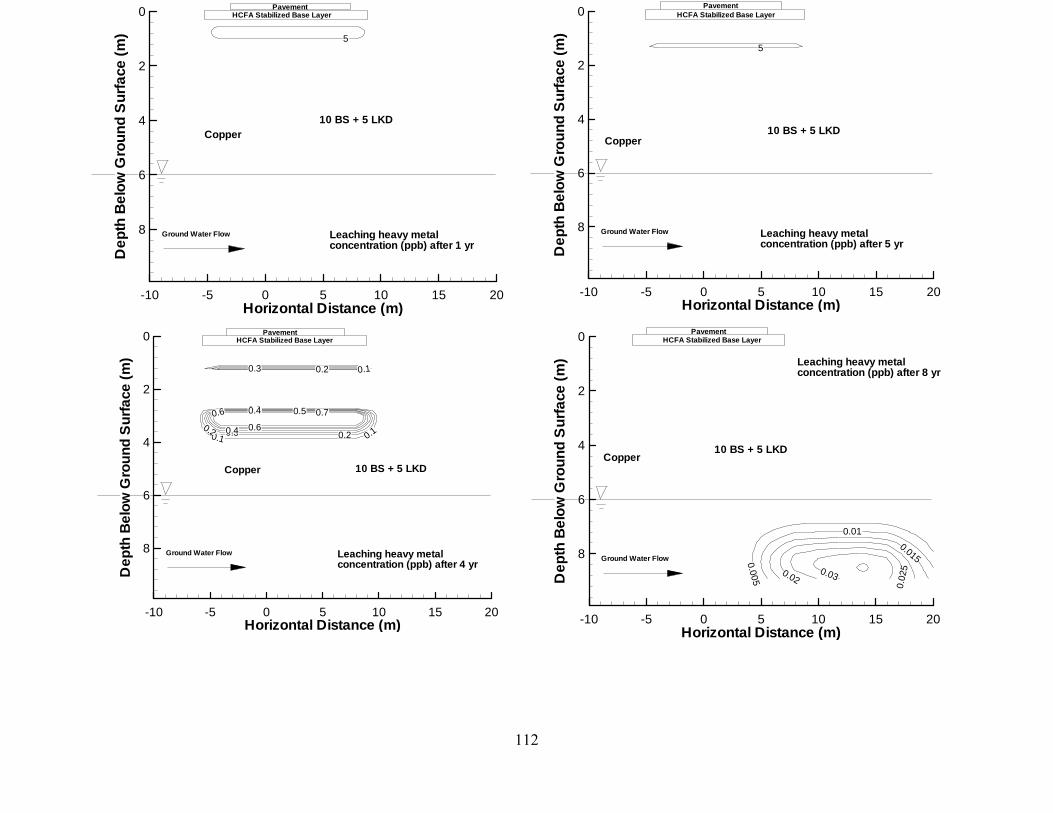
112
5
Horizontal Distance (m)
De
pth
Be
low
Gro
un
dS
urf
ace
(m)
-10 -5 0 5 10 15 20
0
2
4
6
8 Leaching heavy metalconcentration (ppb) after 1 yr
Ground Water Flow
Copper
PavementHCFA Stabilized Base Layer
10 BS + 5 LKD
5
Horizontal Distance (m)
De
pth
Be
low
Gro
un
dS
urf
ace
(m)
-10 -5 0 5 10 15 20
0
2
4
6
8 Leaching heavy metalconcentration (ppb) after 5 yr
Ground Water Flow
Copper
PavementHCFA Stabilized Base Layer
10 BS + 5 LKD
0.1 0.1
0.1
0.2 0.2
0.2
0.3
0.3
0.3
0.4
0.4
0.50.6
0.6
0.7
Horizontal Distance (m)
De
pth
Be
low
Gro
un
dS
urf
ace
(m)
-10 -5 0 5 10 15 20
0
2
4
6
8 Leaching heavy metalconcentration (ppb) after 4 yr
Ground Water Flow
Copper
PavementHCFA Stabilized Base Layer
10 BS + 5 LKD
0.005
0.01
0.015
0.02
0.02
50.03
Horizontal Distance (m)
De
pth
Be
low
Gro
un
dS
urf
ace
(m)
-10 -5 0 5 10 15 20
0
2
4
6
8
Leaching heavy metalconcentration (ppb) after 8 yr
Ground Water Flow
Copper
PavementHCFA Stabilized Base Layer
10 BS + 5 LKD

113
5 5
10 15
20 20
25
30
30 35
Horizontal Distance (m)
De
pth
Be
low
Gro
un
dS
urf
ace
(m)
-10 -5 0 5 10 15 20
0
2
4
6
8 Leaching heavy metalconcentration (ppb) after 1 yr
Ground Water Flow
Zinc
Pavement
HCFA Stabilized Base Layer
10 BS + 5 LKD
5 5
5
10
10 10
15
15 15 20
Horizontal Distance (m)
De
pth
Be
low
Gro
un
dS
urf
ace
(m)
-10 -5 0 5 10 15 20
0
2
4
6
8 Leaching heavy metalconcentration (ppb) after 2 yr
Ground Water Flow
Zinc
PavementHCFA stabilized Base Layer
10 BS + 5 LKD
0.1
0.1
0.2
0.2
0.3
0.4 0.4
0.5
0.6 0.6
0.7
Horizontal Distance (m)
De
pth
Be
low
Gro
un
dS
urf
ace
(m)
-10 -5 0 5 10 15 20
0
2
4
6
8 Leaching heavy metalconcentration (ppb) after 4 yr
Ground Water Flow
Zinc
PavementHCFA Stabilized Base Layer
10 BS + 5 LKD
0.005 0.01
0.015
0.0150.02
0.025
0.0250.03
0.035 0.035
0.04
Horizontal Distance (m)
De
pth
Be
low
Gro
un
dS
urf
ace
(m)
-10 -5 0 5 10 15 20
0
2
4
6
8
Leaching heavy metalconcentration (ppb) after 8 yr
Ground Water Flow
Zinc
PavementHCFA Stabilized Base Layer
10 BS + 5 LKD
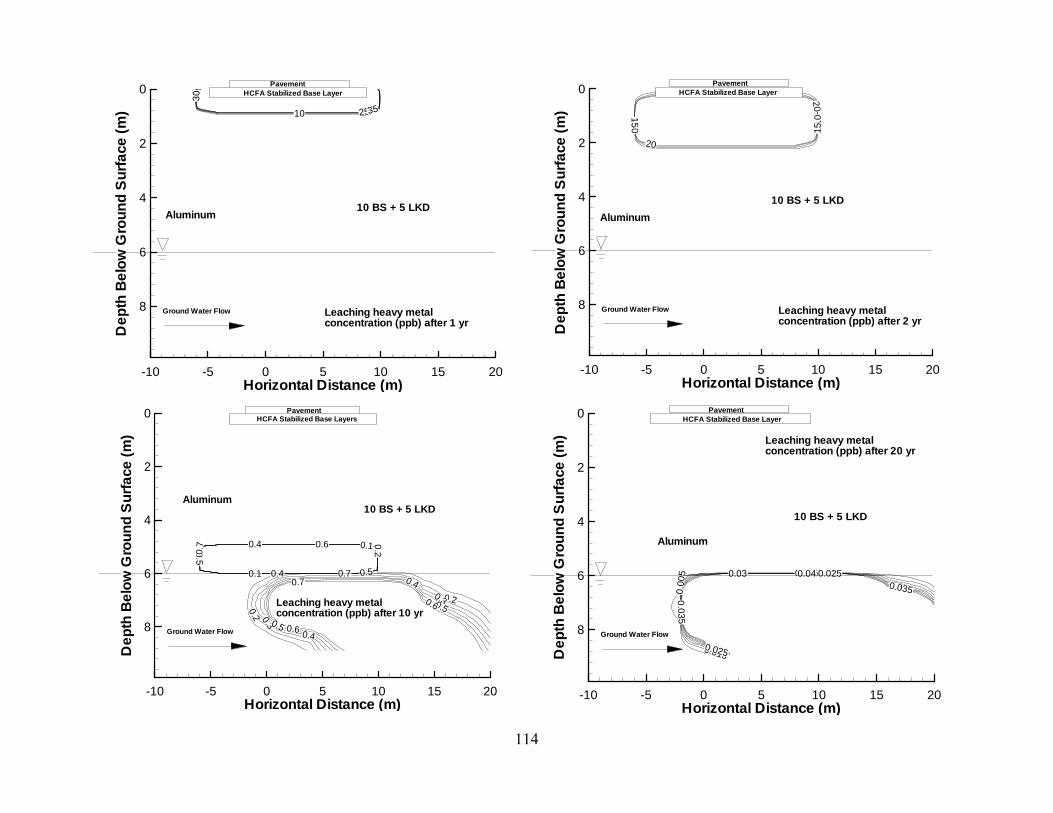
114
5
10 15
20
25
30
35
Horizontal Distance (m)
De
pth
Be
low
Gro
un
dS
urf
ace
(m)
-10 -5 0 5 10 15 20
0
2
4
6
8 Leaching heavy metalconcentration (ppb) after 1 yr
Ground Water Flow
PavementHCFA Stabilized Base Layer
Aluminum10 BS + 5 LKD
5
10 1
015
15
20
20
Horizontal Distance (m)
De
pth
Be
low
Gro
un
dS
urf
ace
(m)
-10 -5 0 5 10 15 20
0
2
4
6
8 Leaching heavy metalconcentration (ppb) after 2 yr
Ground Water Flow
Aluminum
PavementHCFA Stabilized Base Layer
10 BS + 5 LKD
0.1
0.1
0.2
0.2
0.2
0.3
0.3
0.3
0.3
0.4
0.4
0.4
0.4
0.5
0.5
0.5
0.5
0.6
0.6
0.6
0.7
0.7
0.7
Horizontal Distance (m)
De
pth
Be
low
Gro
un
dS
urf
ace
(m)
-10 -5 0 5 10 15 20
0
2
4
6
8
Leaching heavy metalconcentration (ppb) after 10 yr
Ground Water Flow
Aluminum
PavementHCFA Stabilized Base Layers
10 BS + 5 LKD
0.0
05 0.01
0.015
0.0150.02
0.025
0.0250.03
0.0
35
0.035
0.04
Horizontal Distance (m)
De
pth
Be
low
Gro
un
dS
urf
ace
(m)
-10 -5 0 5 10 15 20
0
2
4
6
8
Leaching heavy metalconcentration (ppb) after 20 yr
Ground Water Flow
Aluminum
PavementHCFA Stabilized Base Layer
10 BS + 5 LKD

115
5
5 1015
Horizontal Distance (m)
De
pth
Be
low
Gro
un
dS
urf
ace
(m)
-10 -5 0 5 10 15 20
0
2
4
6
8 Leaching heavy metalconcentration (ppb) after 1 yr
Ground Water Flow
Chromium
PavementHCFA Stabilized Base Layer
20 BS + 5 LKD
5
10
Horizontal Distance (m)
De
pth
Be
low
Gro
un
dS
urf
ace
(m)
-10 -5 0 5 10 15 20
0
2
4
6
8 Leaching heavy metalconcentration (ppb) after 2 yr
Ground Water Flow
Chromium
PavementHCFA Stabilized Base Layer
20 BS + 5 LKD
0.1
0.1
0.1
0.2
0.2
0.2
0.3
0.3
0.3
0.4
0.4
0.40.4
0.5
0.5
0.5
0.6
0.6
0.7
0.7
Horizontal Distance (m)
De
pth
Be
low
Gro
un
dS
urf
ace
(m)
-10 -5 0 5 10 15 20
0
2
4
6
8 Leaching heavy metalconcentration (ppb) after 4 yr
Ground Water Flow
Chromium
PavementHCFA Stabilized Base Layer
20 BS + 5 LKD
0.0050.005
0.005
0.01 0.01
0.010.01
0.015
0.0150.015
0.02 0.02
0.020.02
0.025
0.025
0.03
0.030.035
0.040.04
Horizontal Distance (m)
De
pth
Be
low
Gro
un
dS
urf
ace
(m)
-10 -5 0 5 10 15 20
0
2
4
6
8
Leaching heavy metalconcentration (ppb) after 8 yr
Ground Water Flow
Chromium
PavementHCFA Stabilized Base Layer
20 BS + 5 LKD

116
5
510
101520 20 25
Horizontal Distance (m)
De
pth
Be
low
Gro
un
dS
urf
ace
(m)
-10 -5 0 5 10 15 20
0
2
4
6
8 Leaching heavy metalconcentration (ppb) after 1 yr
Ground Water Flow
Copper
PavementHCFA Stabilized Base Layer
20 BS + 5 LKD
5
510
Horizontal Distance (m)
De
pth
Be
low
Gro
un
dS
urf
ace
(m)
-10 -5 0 5 10 15 20
0
2
4
6
8 Leaching heavy metalconcentration (ppb) after 2 yr
Ground Water Flow
Copper
PavementHCFA Stabilized Base Layer
20 BS + 5 LKD
0.1
0.1
0.1
0.2
0.2
0.2
0.3
0.3
0.3
0.4
0.4
0.40.4
0.5
0.5
0.5
0.6
0.6
0.7
0.7
Horizontal Distance (m)
De
pth
Be
low
Gro
un
dS
urf
ace
(m)
-10 -5 0 5 10 15 20
0
2
4
6
8 Leaching heavy metalconcentration (ppb) after 4 yr
Ground Water Flow
Copper
PavementHCFA Stabilized Base Layer
20 BS + 5 LKD
0.
005
0.005
0.01
0.015
0.0150.02
0.025 0.025
0.030.035
Horizontal Distance (m)
De
pth
Be
low
Gro
un
dS
urf
ace
(m)
-10 -5 0 5 10 15 20
0
2
4
6
8
Leaching heavy metalconcentration (ppb) after 8 yr
Ground Water Flow
Copper
PavementHCFA Stabilized Base Layer
20 BS + 5 LKD

117
5
510 10
15
Horizontal Distance (m)
De
pth
Be
low
Gro
un
dS
urf
ace
(m)
-10 -5 0 5 10 15 20
0
2
4
6
8 Leaching heavy metalconcentration (ppb) after 1 yr
Ground Water Flow
Zinc
PavementHCFA Stabilized Base Layer
20 BS + 5 LKD
510
Horizontal Distance (m)
De
pth
Be
low
Gro
un
dS
urf
ace
(m)
-10 -5 0 5 10 15 20
0
2
4
6
8 Leaching heavy metalconcentration (ppb) after 2 yr
Ground Water Flow
Zinc
PavementHCFA Stabilized Base Layer
20 BS + 5 LKD
0.1
0.1 0.20.3
Horizontal Distance (m)
De
pth
Be
low
Gro
un
dS
urf
ace
(m)
-10 -5 0 5 10 15 20
0
2
4
6
8 Leaching heavy metalconcentration (ppb) after 4 yr
Ground Water Flow
Zinc
PavementHCFA Stabilized Base Layer
20 BS + 5 LKD
0.005
0.005
0.01
0.015
0.015
0.02
0.025
0.02
5
0.03
0.035
Horizontal Distance (m)
De
pth
Be
low
Gro
un
dS
urf
ace
(m)
-10 -5 0 5 10 15 20
0
2
4
6
8
Leaching heavy metalconcentration (ppb) after 8 yr
Ground Water Flow
Zinc
PavementHCFA Stabilized Base Layer
20 BS + 5 LKD

118
5
510
10
15
1520
20
25
2530
30
35
35
Horizontal Distance (m)
De
pth
Be
low
Gro
un
dS
urf
ace
(m)
-10 -5 0 5 10 15 20
0
2
4
6
8 Leaching heavy metalconcentration (ppb) after 1 yr
Ground Water Flow
Aluminum
PavementHCFA Stabilized Base Layer
20 BS + 5 LKD
55 1015
Horizontal Distance (m)
De
pth
Be
low
Gro
un
dS
urf
ace
(m)
-10 -5 0 5 10 15 20
0
2
4
6
8 Leaching heavy metalconcentration (ppb) after 4 yr
Ground Water Flow
Aluminum
PavementHCFA Stabilized Base Layer
20 BS + 5 LKD
0.1
0.10.2
0.2
0.3
0.40.4
0.5
0.60.6
0.7
Horizontal Distance (m)
De
pth
Be
low
Gro
un
dS
urf
ace
(m)
-10 -5 0 5 10 15 20
0
2
4
6
8
Leaching heavy metalconcentration (ppb) after 8 yr
Ground Water Flow
Aluminum
PavementHCFA Stabilized Base Layer
20 BS + 5 LKD
0.00
5
0.005
0.01
0.01
0.015
0.0150.02
0.02
0.025
0.0250.03
0.03
0.035
0.0350.04
Horizontal Distance (m)
De
pth
Be
low
Gro
un
dS
urf
ace
(m)
-10 -5 0 5 10 15 20
0
2
4
6
8
Leaching heavy metalconcentration (ppb) after 20 yr
Ground Water Flow
Aluminum
PavementHCFA Stabilized Base Layer
20 BS + 5 LKD
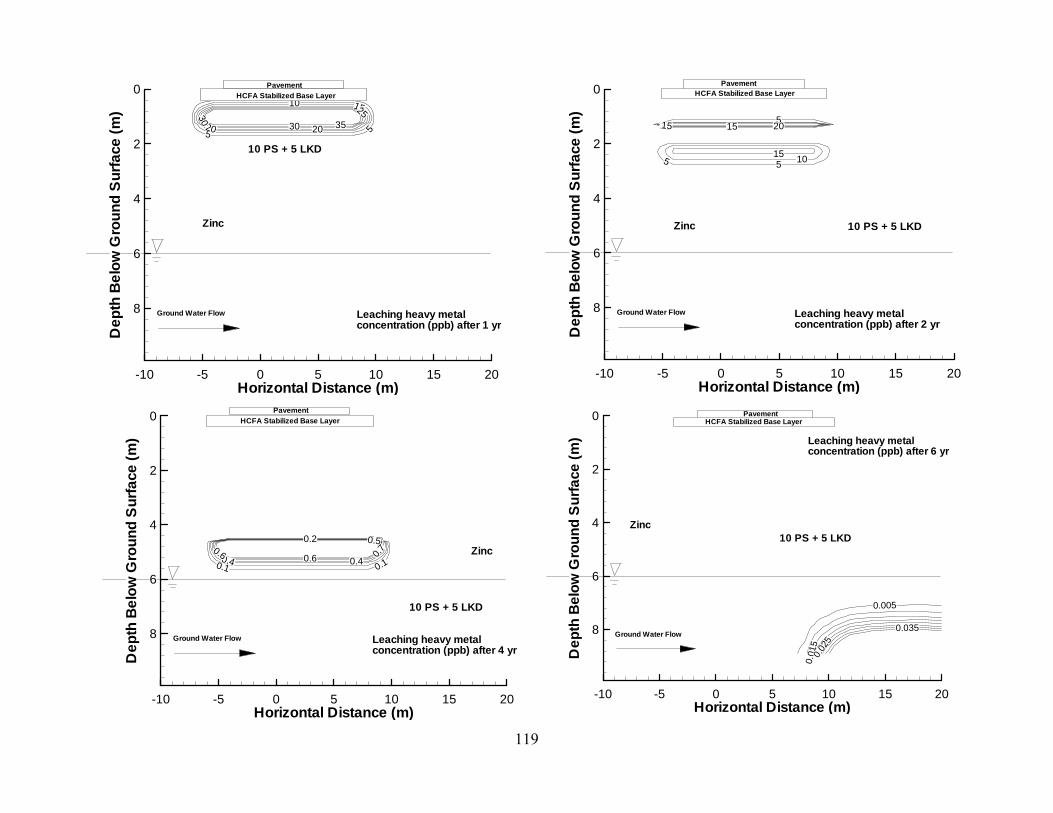
119
5 5
10 15
20 20
2530
30 35
Horizontal Distance (m)
De
pth
Be
low
Gro
un
dS
urf
ace
(m)
-10 -5 0 5 10 15 20
0
2
4
6
8 Leaching heavy metalconcentration (ppb) after 1 yr
Ground Water Flow
Zinc
Pavement
HCFA Stabilized Base Layer
10 PS + 5 LKD
5 5
5
10
10 10
15
15 15 20
Horizontal Distance (m)
De
pth
Be
low
Gro
un
dS
urf
ace
(m)
-10 -5 0 5 10 15 20
0
2
4
6
8 Leaching heavy metalconcentration (ppb) after 2 yr
Ground Water Flow
Zinc
PavementHCFA Stabilized Base Layer
10 PS + 5 LKD
0.1 0.1
0.2 0.3
0.4 0.4
0.50.6 0.6 0.
7
Horizontal Distance (m)
De
pth
Be
low
Gro
un
dS
urf
ace
(m)
-10 -5 0 5 10 15 20
0
2
4
6
8 Leaching heavy metalconcentration (ppb) after 4 yr
Ground Water Flow
Zinc
Pavement
HCFA Stabilized Base Layer
10 PS + 5 LKD
0.005
0.01
50.
025
0.035
Horizontal Distance (m)
De
pth
Be
low
Gro
un
dS
urf
ace
(m)
-10 -5 0 5 10 15 20
0
2
4
6
8
Leaching heavy metalconcentration (ppb) after 6 yr
Ground Water Flow
Zinc
PavementHCFA Stabilized Base Layer
10 PS + 5 LKD

120
5
Horizontal Distance (m)
De
pth
Be
low
Gro
un
dS
urf
ace
(m)
-10 -5 0 5 10 15 20
0
2
4
6
8Leaching heavy metalconcentration (ppb) after 1 yrGround Water Flow
Chromium
PavementHCFA Stabilized Base Layer
10 PS + 5 LKD
5
Horizontal Distance (m)
De
pth
Be
low
Gro
un
dS
urf
ace
(m)
-10 -5 0 5 10 15 20
0
2
4
6
8 Leaching heavy metalconcentration (ppb) after 2 yr
Ground Water Flow
Chromium
PavementHCFA Stabilized Base Layer
10 PS + 5 LKD
0.1
0.1
0.2
0.20.3 0.3
0.40.5
Horizontal Distance (m)
De
pth
Be
low
Gro
un
dS
urf
ace
(m)
-10 -5 0 5 10 15 20
0
2
4
6
8 Leaching heavy metalconcentration (ppb) after 4 yr
Ground Water Flow
Chromium
PavementHCFA Stabilized Base Layer
10 PS + 5 LKD
0.005
0.01
0.0
10.015 0.02
Horizontal Distance (m)
De
pth
Be
low
Gro
un
dS
urf
ace
(m)
-10 -5 0 5 10 15 20
0
2
4
6
8
Leaching heavy metalconcentration (ppb) after 8 yr
Ground Water Flow
Chromium
PavementHCFA Stabilized Base Layer
10 PS + 5 LKD

121
5
Horizontal Distance (m)
De
pth
Be
low
Gro
un
dS
urf
ace
(m)
-10 -5 0 5 10 15 20
0
2
4
6
8 Leaching heavy metalconcentration (ppb) after 1 yr
Ground Water Flow
Chromium
PavementHCFA Stabilized Base Layer
20 PS + 5 LKD
5
Horizontal Distance (m)
De
pth
Be
low
Gro
un
dS
urf
ace
(m)
-10 -5 0 5 10 15 20
0
2
4
6
8 Leaching heavy metalconcentration (ppb) after 2 yr
Ground Water Flow
Chromium
PavementHCFA Stabilized Base Layer
20 PS + 5 LKD
0.1 0.1
0.2 0.3
0.4 0.4 0.5
0.6
0.6 0.7
Horizontal Distance (m)
De
pth
Be
low
Gro
un
dS
urf
ace
(m)
-10 -5 0 5 10 15 20
0
2
4
6
8 Leaching heavy metalconcentration (ppb) after 4 yr
Ground Water Flow
Chromium
PavementHCFA Stabilized Base Layer
20 PS + 5 LKD
0.005
0.005 0.005
0.01
0.015 0.015
0.020.025
0.025 0.03
0.035
0.035
0.04
Horizontal Distance (m)
De
pth
Be
low
Gro
un
dS
urf
ace
(m)
-10 -5 0 5 10 15 20
0
2
4
6
8
Leaching heavy metalconcentration (ppb) after 6 yr
Ground Water Flow
Chromium
PavementHCFA Stabilized Base Layer
20 PS + 5 LKD

122
5 510
Horizontal Distance (m)
De
pth
Be
low
Gro
un
dS
urf
ace
(m)
-10 -5 0 5 10 15 20
0
2
4
6
8 Leaching heavy metalconcentration (ppb) after 1 yr
Ground Water Flow
Copper
PavementHCFA Stabilized Base Layer
20 PS + 5 LKD
5
Horizontal Distance (m)
De
pth
Be
low
Gro
un
dS
urf
ace
(m)
-10 -5 0 5 10 15
0
2
4
6
8 Leaching heavy metalconcentration (ppb) after 2
Ground Water Flow
Copper
Pavement
HCFA Stabilized Base Layer
20 PS + 5 LKD
0.1
0.10.2
0.3
Horizontal Distance (m)
De
pth
Be
low
Gro
un
dS
urf
ace
(m)
-10 -5 0 5 10 15 20
0
2
4
6
8 Leaching heavy metalconcentration (ppb) after 3 yr
Ground Water Flow
Copper
PavementHCFA Stabilized Base Layer
20 PS + 5 LKD
0. 00
5 0.005
0.01
0.015
0.015
0.02
0.025 0.02
5
0.03
0.03
5
0.04
Horizontal Distance (m)
De
pth
Be
low
Gro
un
dS
urf
ace
(m)
-10 -5 0 5 10 15
0
2
4
6
8
Leaching heavy metalconcentration (ppb) after
Ground Water Flow
Copper
PavementHCFA Stabilized Base Layer
20 PS + 5 LKD

123
5
510 10
15
2025 25 30
Horizontal Distance (m)
De
pth
Be
low
Gro
un
dS
urf
ace
(m)
-10 -5 0 5 10 15 20
0
2
4
6
8 Leaching heavy metalconcentration (ppb) after 1 yr
Ground Water Flow
Zinc
PavementHCFA Stabilized Base Layers
20 PS + 5 LKD
5
Horizontal Distance (m)
De
pth
Be
low
Gro
un
dS
urf
ace
(m)
-10 -5 0 5 10 15 20
0
2
4
6
8 Leaching heavy metalconcentration (ppb) after 2 yr
Ground Water Flow
Zinc
PavementHCFA Stabilized Base Layer
20 PS + 5 LKD
0.1
0.1
0.2
0.20.3 0.30.4
0.5
Horizontal Distance (m)
De
pth
Be
low
Gro
un
dS
urf
ace
(m)
-10 -5 0 5 10 15 20
0
2
4
6
8 Leaching heavy metalconcentration (ppb) after 4 yr
Ground Water Flow
Zinc
PavementHCFA Stabilized Base Layer
20 PS + 5 LKD
0.005 0.00
5
0.01
0.01
0.015
0.0
2
0.0250.03
Horizontal Distance (m)
De
pth
Be
low
Gro
un
dS
urf
ace
(m)
-10 -5 0 5 10 15 20
0
2
4
6
8
Leaching heavy metalconcentration (ppb) after 8 yr
Ground Water Flow
Zinc
PavementHCFA Stabilized Base Layer
20 PS + 5 LKD

124
5
510
10
15
1520
2025
2530
30
35
35
Horizontal Distance (m)
De
pth
Be
low
Gro
un
dS
urf
ace
(m)
-10 -5 0 5 10 15 20
0
2
4
6
8 Leaching heavy metalconcentration (ppb) after 1 yr
Ground Water Flow
Aluminum
Pavement
HCFA Stabilized Base Layer
20 PS + 5 LKD
5 510
15
Horizontal Distance (m)
De
pth
Be
low
Gro
un
dS
urf
ace
(m)
-10 -5 0 5 10 15 20
0
2
4
6
8Leaching heavy metalconcentration (ppb) after 4 yr
Ground Water Flow
Aluminum
PavementHCFA Stabilized Base Layer
20 PS + 5 LKD
0.1
0.1
0.2
0.2
0.3
0.30.4
0.40.5
0.5
0.6
0.60.7
Horizontal Distance (m)
De
pth
Be
low
Gro
un
dS
urf
ace
(m)
-10 -5 0 5 10 15 20
0
2
4
6
8Leaching heavy metalconcentration (ppb) after 8 yrGround Water Flow
Aluminum
PavementHCFA Stabilized Base Layer
20 PS + 5 LKD
0.005 0.01
0.015
0.0150.02
0.025
0.0250.03
0.0
35
0.0350.04
Horizontal Distance (m)
De
pth
Be
low
Gro
un
dS
urf
ace
(m)
-10 -5 0 5 10 15 20
0
2
4
6
8
Leaching heavy metalconcentration (ppb) after 16 y
Ground Water Flow
Aluminum
PavementHCFA Stabilized Base Layer
20 PS + 5 LKD

125
5
5
10
15
15
20
20
25
25
30
30
35
35
Horizontal Distance (m)
De
pth
Be
low
Gro
un
dS
urf
ace
(m)
-10 -5 0 5 10 15 20
0
2
4
6
8 Leaching heavy metalconcentration (ppb) after 1 yr
Ground Water Flow
Aluminum
PavementHCFA Stabilized Base Layer
10 DP + 5 LKD
510
101515
20 20
Horizontal Distance (m)
De
pth
Be
low
Gro
un
dS
urf
ace
(m)
-10 -5 0 5 10 15 20
0
2
4
6
8 Leaching heavy metalconcentration (ppb) after 4 yr
Ground Water Flow
Aluminum
PavementHCFA Stabilized Base Layer
10 DP + 5 LKD
0.10.1
0.2
0.2
0.3
0.4 0.4
0.5
0.60.6
0.7
Horizontal Distance (m)
De
pth
Be
low
Gro
un
dS
urf
ace
(m)
-10 -5 0 5 10 15 20
0
2
4
6
8
Leaching heavy metalconcentration (ppb) after 8 yr
Ground Water Flow
Aluminum
PavementHCFA Stabilized Base Layer
10 DP + 5 LKD
0.
005
0.005
0.01
0.010.015
0.015
0.015
0.02
0.02
0.025
0.0250.03
0.03
0.035
0.035
0.04
0.04
Horizontal Distance (m)
De
pth
Be
low
Gro
un
dS
urf
ace
(m)
-10 -5 0 5 10 15 20
0
2
4
6
8
Leaching heavy metalconcentration (ppb) after 20 yr
Ground Water Flow
Aluminum
PavementHCFA Stabilized Base Layer
10 DP + 5 LKD
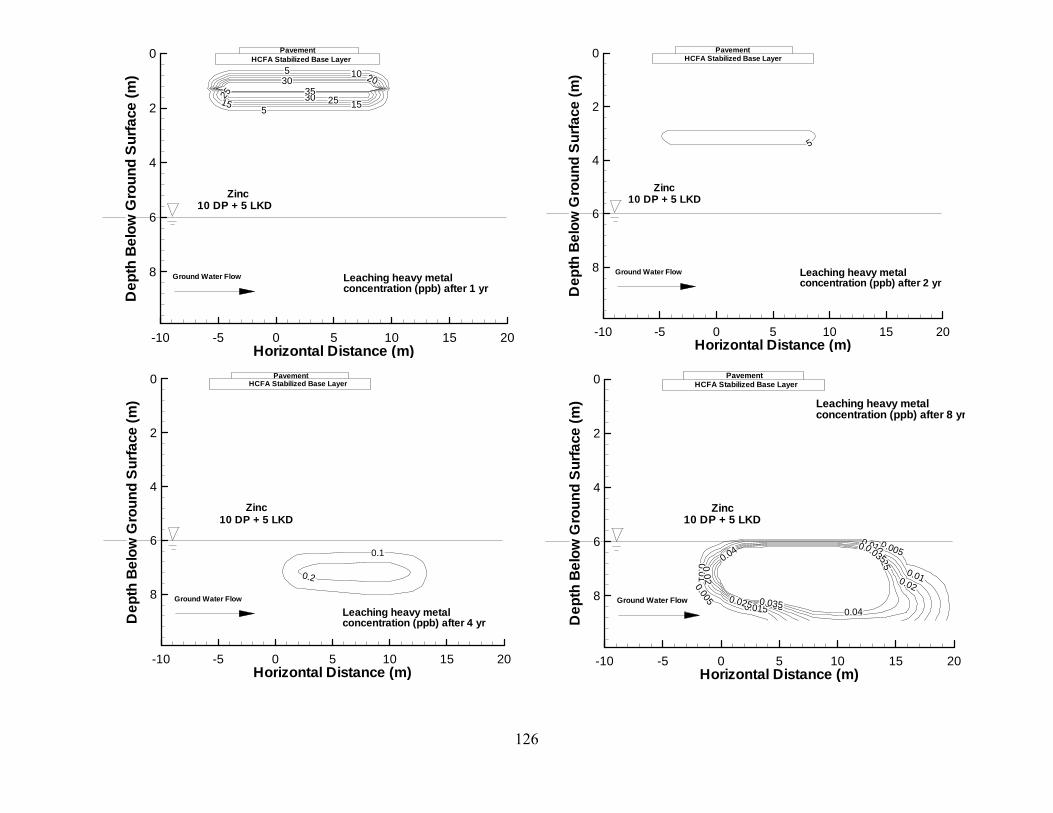
126
5
5
10
15 15
20
25 2530
3035
Horizontal Distance (m)
De
pth
Be
low
Gro
un
dS
urf
ace
(m)
-10 -5 0 5 10 15 20
0
2
4
6
8 Leaching heavy metalconcentration (ppb) after 1 yr
Ground Water Flow
Zinc
PavementHCFA Stabilized Base Layer
10 DP + 5 LKD
5
Horizontal Distance (m)
De
pth
Be
low
Gro
un
dS
urf
ace
(m)
-10 -5 0 5 10 15 20
0
2
4
6
8 Leaching heavy metalconcentration (ppb) after 2 yr
Ground Water Flow
Zinc
PavementHCFA Stabilized Base Layer
10 DP + 5 LKD
0.1
0.2
Horizontal Distance (m)
De
pth
Be
low
Gro
un
dS
urf
ace
(m)
-10 -5 0 5 10 15 20
0
2
4
6
8Leaching heavy metalconcentration (ppb) after 4 yr
Ground Water Flow
Zinc
PavementHCFA Stabilized Base Layer
10 DP + 5 LKD
0.005
0.005
0.0
1 0.01
0.015
0.015
0.0
2 0.020.025
0.025
0.03
0.03
0.035
0.0350.04
0.04
Horizontal Distance (m)
De
pth
Be
low
Gro
un
dS
urf
ace
(m)
-10 -5 0 5 10 15 20
0
2
4
6
8
Leaching heavy metalconcentration (ppb) after 8 yr
Ground Water Flow
Zinc
PavementHCFA Stabilized Base Layer
10 DP + 5 LKD

127
5
Horizontal Distance (m)
De
pth
Be
low
Gro
un
dS
urf
ace
(m)
-10 -5 0 5 10 15 20
0
2
4
6
8 Leaching heavy metalconcentration (ppb) after 1 yr
Ground Water Flow
Copper
PavementHCFA Stabilized Base Layer
10 DP + 5 LKD
0.1
0.2
Horizontal Distance (m)
De
pth
Be
low
Gro
un
dS
urf
ace
(m)
-10 -5 0 5 10 15
0
2
4
6
8 Leaching heavy metalconcentration (ppb) after 3 yr
Ground Water Flow
Copper
PavementHCFA Stabilized Base Layer
10 DP + 5 LKD
0.005 0.005
0.0050.010.010.0150.015
0.020.0250.030.035 0.04
Horizontal Distance (m)
De
pth
Be
low
Gro
un
dS
urf
ace
(m)
-10 -5 0 5 10 15 20
0
2
4
6
8
Leaching heavy metalconcentration (ppb) after 4 yr
Ground Water Flow
Copper
Pavement
HCFA Stabilized Base Layer
10 DP + 5 LKD

128
510
Horizontal Distance (m)
De
pth
Be
low
Gro
un
dS
urf
ace
(m)
-10 -5 0 5 10 15 20
0
2
4
6
8 Leaching heavy metalconcentration (ppb) after 1 yrGround Water Flow
Chromium
PavementHCFA Stabilized Base Layer
10 DP + 5 LKD
5
Horizontal Distance (m)
De
pth
Be
low
Gro
un
dS
urf
ace
(m)
-10 -5 0 5 10 15 20
0
2
4
6
8 Leaching heavy metalconcentration (ppb) after 2 yr
Ground Water Flow
Chromium
PavementHCFA Stabilized Base Layer
10 DP + 5 LKD
0.1
0.1
0.2
0.20.3 0.3
0.40.5
Horizontal Distance (m)
De
pth
Be
low
Gro
un
dS
urf
ace
(m)
-10 -5 0 5 10 15 20
0
2
4
6
8 Leaching heavy metalconcentration (ppb) after 4 yr
Ground Water Flow
Chromium
PavementHCFA Stabilized Base Layer
10 DP + 5 LKD
0.005
0.005
0.01 0.015
0.02
0.020.025
0.03
Horizontal Distance (m)
De
pth
Be
low
Gro
un
dS
urf
ace
(m)
-10 -5 0 5 10 15 20
0
2
4
6
8
Leaching heavy metalconcentration (ppb) after 6 yr
Ground Water Flow
Chromium
PavementHCFA Stabilized Base Layer
10 DP + 5 LKD

129
5
10
Horizontal Distance (m)
De
pth
Be
low
Gro
un
dS
urf
ace
(m)
-10 -5 0 5 10 15 20
0
2
4
6
8 Leaching heavy metalconcentration (ppb) after 1 yr
Ground Water Flow
Chromium
PavementHCFA Stabilized Base Layers
20 DP + 5 LKD
5510
Horizontal Distance (m)
De
pth
Be
low
Gro
un
dS
urf
ace
(m)
-10 -5 0 5 10 15 20
0
2
4
6
8 Leaching heavy metalconcentration (ppb) after 2 yr
Ground Water Flow
Chromium
PavementHCFA Stabilized Base Layer
20 DP + 5 LKD
0.1 0.1
0.2 0.3
0.4 0.4
0.50.6
0.6 0.7
Horizontal Distance (m)
De
pth
Be
low
Gro
un
dS
urf
ace
(m)
-10 -5 0 5 10 15 20
0
2
4
6
8 Leaching heavy metalconcentration (ppb) after 4 yr
Ground Water Flow
Chromium
PavementHCFA Stabilized Base Layer
20 DP + 5 LKD
0.005 0.01
0.015
0.0150.02
0.025
0.025
0.030.035
Horizontal Distance (m)
De
pth
Be
low
Gro
un
dS
urf
ace
(m)
-10 -5 0 5 10 15 20
0
2
4
6
8
Leaching heavy metalconcentration (ppb) after 6 yr
Ground Water Flow
Chromium
PavementHCFA Stabilized Base Layer
20 DP + 5 LKD

130
5 510
Horizontal Distance (m)
De
pth
Be
low
Gro
un
dS
urf
ace
(m)
-10 -5 0 5 10 15 20
0
2
4
6
8 Leaching heavy metalconcentration (ppb) after 1 yr
Ground Water Flow
Copper
PavementHCFA Stabilized Base Layer
20 DP + 5 LKD
5
Horizontal Distance (m)
De
pth
Be
low
Gro
un
dS
urf
ace
(m)
-10 -5 0 5 10 15 20
0
2
4
6
8 Leaching heavy metalconcentration (ppb) after 2 yr
Ground Water Flow
Copper
PavementHCFA Stabilized Base Layer
20 DP + 5 LKD
0.1
0.10.2
0.3
Horizontal Distance (m)
De
pth
Be
low
Gro
un
dS
urf
ace
(m)
-10 -5 0 5 10 15 20
0
2
4
6
8 Leaching heavy metalconcentration (ppb) after 3 yr
Ground Water Flow
Copper
PavementHCFA Stabilized Base Layer
20 DP + 5 LKD
0. 0
05 0.005
0.01
0.015
0.015
0.02
0.025 0.02
5
0.03
0.03
5
0.04
Horizontal Distance (m)
De
pth
Be
low
Gro
un
dS
urf
ace
(m)
-10 -5 0 5 10 15 20
0
2
4
6
8
Leaching heavy metalconcentration (ppb) after 4yr
Ground Water Flow
Copper
PavementHCFA Stabilized Base Layer
20 DP + 5 LKD

131
5 5
10 15
20 2025
30 35
Horizontal Distance (m)
De
pth
Be
low
Gro
un
dS
urf
ace
(m)
-10 -5 0 5 10 15 20
0
2
4
6
8 Leaching heavy metalconcentration (ppb) after 1 yr
Ground Water Flow
Zinc
PavementHCFA Stabilized Base Layer
20 DP + 5 LKD
5
Horizontal Distance (m)
De
pth
Be
low
Gro
un
dS
urf
ace
(m)
-10 -5 0 5 10 15
0
2
4
6
8 Leaching heavy metalconcentration (ppb) after 2
Ground Water Flow
Zinc
PavementHCFA Stabilized Base Layer
20 DP + 5 LKD
0.0050.005
0.01 0.0150.02 0.02 0.
025
0.03
Horizontal Distance (m)
De
pth
Be
low
Gro
un
dS
urf
ace
(m)
-10 -5 0 5 10 15 20
0
2
4
6
8
Leaching heavy metalconcentration (ppb) after 8 yr
Ground Water Flow
Zinc
PavementHCFA Stabilized Base Layer
20 DP + 5 LKD

132
5
510
10
15
1520
2025
2530
30
35
35
Horizontal Distance (m)
De
pth
Be
low
Gro
un
dS
urf
ace
(m)
-10 -5 0 5 10 15 20
0
2
4
6
8 Leaching heavy metalconcentration (ppb) after 1 yr
Ground Water Flow
PavementHCFA Stabilized Base Layer
Aluminum20 DP + 5 LKD
5
5
5
10
10
10
15
15
15
20
20
20
Horizontal Distance (m)
De
pth
Be
low
Gro
un
dS
urf
ace
(m)
-10 -5 0 5 10 15
0
2
4
6
8 Leaching heavy metalconcentration (ppb) after 2 yr
Ground Water Flow
Aluminum
PavementHCFA Stabilized Base Layer
20 DP + 5 LKD
0.1
0.1 0.10.2
0.2
0.3
0.30.3
0.4
0.4
0.4
0.4
0.50.5
0.5
0.5
0.6
0.6
0.6
0.6
0.7
0.7
0.7
Horizontal Distance (m)
De
pth
Be
low
Gro
un
dS
urf
ace
(m)
-10 -5 0 5 10 15 20
0
2
4
6
8
Leaching heavy metalconcentration (ppb) after 4 yr
Ground Water Flow
Aluminum
PavementHCFA Stabilized Base Layer
20 DP + 5 LKD
0.0
05
0.005
0.01
00
1
0.015
0.0150.02
0.020.025
0.0250.03
0.03
0.0
35
0.0350.04
Horizontal Distance (m)
De
pth
Be
low
Gro
un
dS
urf
ace
(m)
-10 -5 0 5 10 15 2
0
2
4
6
8
Leaching heavy metalconcentration (ppb) after 8 yr
Ground Water Flow
Aluminum
PavementHCFA Stabilized Base Layer
20 DP + 5 LKD

i
COMPARATIVE EVALUATION OF LABORATORY LEACHING TESTS
TABLE OF CONTENTS CHAPTER 1: INTRODUCTION................................................................................. 1 CHAPTER 2: MATERIALS AND METHODS .......................................................... 9
2.1 Materials ....................................................................................................... 9 2.2 Sample Preparation ..................................................................................... 10 2.3 Leaching Test Procedures ........................................................................... 11
2.3.1 Water Leach Test (WLT).................................................................... 11 2.3.2 Column Leach Test (CLT).................................................................. 13 2.3.3 Toxicity Characteristic Leaching Procedure (TCLP) ......................... 15
2.4 Analytical Methods..................................................................................... 15 2.4.1 pH and electrical conductivity (EC) measurements............................ 15 2.4.2 Bromide Measurements ...................................................................... 16 2.4.3 Leachate Metal Concentrations........................................................... 17
CHAPTER 3: RESULTS AND DISCUSSION.......................................................... 19 3.1 Leaching Test Results: Copper ................................................................... 19
3.1.1 General Trends.................................................................................... 19 3.1.2 Effect of fly ash content on copper leaching ...................................... 22 3.1.3 Effect of pH on copper leaching ......................................................... 23
3.2 Leaching Test Results: Arsenic .................................................................. 26 3.2.1 General Trends.................................................................................... 26 3.2.2 Effect of fly ash on arsenic leaching................................................... 28 3.2.3 Effect of pH on arsenic leaching......................................................... 29
3.3 Leaching Test Results: Chromium.............................................................. 30 3.3.1 General Trends.................................................................................... 30 3.3.2 Effect of fly ash content on chromium leaching................................. 32 3.3.3 Effect of pH on chromium leaching.................................................... 33
3.4 CLT Reproducibility................................................................................... 36 3.5 Tracer study results ..................................................................................... 37 3.6 Comparison of Different Leaching Test Results ........................................ 38
CHAPTER 4: PRACTICAL IMPLICATIONS.......................................................... 45 CHAPTER 5: SUMMARY AND CONCLUSIONS.................................................. 50 TABLES AND FIGURES .......................................................................................... 58 APPENDIX A: DETAILED MATERIALS AND METHODS ............................... 106
A.1 Preparation and Determination of Extraction Fluids ................................ 106 A.2 Preliminary Compaction Tests.................................................................. 107 A.3 Column Compaction Procedure................................................................ 107
REFERENCES ......................................................................................................... 109

1
1 Introduction
More than 50% of the electricity demand in the United States is met from coal-fired
power plants, which burn over 1 billion metric tons of coal annually to provide
electricity to homes, businesses, and industries (Kim 2006). This generation of
electricity results in production of coal combustion by-products (CCBs) that require
proper handling and disposal or beneficial reuse. For example, fly ash, one of the
main types of CCBs, is the collected particulate matter from the exhaust gases of coal
power plants. The CCB disposal problem has been exacerbated by increases in
electricity demand, which have led to higher rates of coal burning, producing more
CCBs. This coupled with the high levels of hazardous metals in CCBs and the large
landfill space required, has resulted in CCB disposal receiving increasing attention.
Correspondingly, there have been increased efforts to research and develop new,
more sustainable disposal methods for CCBs that do not compromise the well-being
of the environment or endanger human health.
Disposal of CCBs presents an environmental challenge due to both
environmental and human health concerns. The majority of CCBs have traditionally
been placed in landfills, which may adversely affect both terrestrial and aquatic
resources. In addition, decreases in available areas suitable for new landfill space has
magnified the need for the development of alternative disposal and management
options. For instance, 1.7 million tons of fly ash were produced at various facilities in
Maryland in 2008, and nearly 745,000 tons of this ash were reused in beneficial
applications throughout the state, corresponding to about 44% of the generated ash
(MDE 2008). This quantity of reused fly ash represents a significant portion of fly

2
ash that would otherwise be disposed of in a landfill, taking up large areas of space.
However, the risk of contaminating groundwater supplies and harming wildlife from
soil and/or water contamination are examples of issues that need to be addressed
before beneficial reuse of fly ash can become widespread.
A common beneficial use of fly ash has been as a concrete additive due to its
natural pozzolanic properties. However, changes in the U.S. Clean Air Act requiring
the use of low sulfur and nitrogen oxide emission burners has resulted in CCBs with
higher carbon contents. High carbon fly ash is problematic in concrete applications
because it absorbs the air-entraining additives that are added for increasing the
porosity of the concrete (Cetin 2009). As a result, there is currently a renewed
emphasis on incorporating suitable CCB into construction activities. One area of
CCB reuse that has received much attention is the construction of highways and
roadway embankments. Both the reduction in construction materials required and
large volume of fly ash that can be recycled make embankment construction an ideal
candidate for beneficial fly ash reuse. Nevertheless, despite the advantages of reusing
CCBs, potential impacts on groundwater quality still remain an issue when these by-
products are used in construction applications.
Two major environmental concerns related to the reuse of fly ash in
construction applications, such as the building of roadway base layers or highway
embankments, are leaching of heavy metals and the consequences from changes in
pH. Heavy metals such as As, Cr, Cu, Pb, Se, Cd, and Zn can be present in fly ash in
levels up to several hundred parts per million (Bin Shafique et al. 2002, Ram et al.
2007, Shah et al. 2008). Leaching of metals from fly ash-amended materials has the

3
potential to contaminate nearby natural waters. Although metal leaching can occur at
the parts-per-billion scale, the potential to accumulate in the natural environment and
various means of transport throughout ecosystems require investigation into the
unintended effects of beneficial fly ash reuse. There have been numerous studies
looking at heavy metal leaching from fly ash mixtures, and the general consensus is
that both fly ash composition and pH have important effects on leaching behavior and
speciation of metals (Fytianos et al. 1998, Bin Shafique et al. 2007, Jegadessan et al.
2008, Jo et al. 2008, Morar et al. 2010).
Work by Shah et al. (2008) showed that metal concentrations in coal fly ash
collected from an Australian power plant were roughly 2-4 times the original
concentration in the source coal. This was attributed to the loss of mass on ignition
from the organic carbon being oxidized to carbon dioxide in the combustion process.
Ram et al. (2007) also state that metal can become concentrated during the coal
burning process by factors of 4-10. For example, Shah et al. (2008) measured 0.857
mg/kg of Cr(VI) in a fly ash compared to 0.065 mg/kg in the source coal. Changes in
metal speciation may also occur during and after the combustion process. This is
illustrated by the study of Shah et al. (2008), which showed that a fly ash had 90% of
As present in the As(V) form compared to 65% in original coal material. This is
important because it could also have implications for leaching behavior, and it is
widely known that certain species of metals are more toxic than others. For example,
As(III) is 50 times more toxic to humans than As(V) while Se(IV) had higher reported
toxicity than Se(VI) (Shah et al. 2008).

4
The pH of the leachate from a fly ash-containing soil has a strong influence on
many other natural processes that occur within the soil matrix. The speciation of
metals, availability of nutrients such as nitrogen and phosphorus, soil weathering, and
partitioning (and therefore transport) of pollutants are all affected by changes in pH.
With respect to partitioning processes, the sorption, precipitation, and dissolution
processes that largely control metal leaching behavior are all pH dependent, with
dissolution of metal-containing minerals seen under acidic pH, while precipitation
and complexation dominate at higher pH values (Jegadessan et al. 2008, Morar et al.
2010). The mobility and toxicity of heavy metals are related to both the amount of
these metals that enter the environment from leaching processes and the metal species
present.
Coupled with the increased interest in the beneficial reuse of CCBs has been
an increase in the development of regulations governing their disposal and use. In
particular, concerns with environmental health and human safety have prompted
agencies across the country to begin to devise programs outlining proper methods to
handle and dispose of fly ash and other CCBs. While the U.S. EPA has been working
to create federal regulations for CCBs since 2000, there have been no laws passed.
This has resulted in an opportunity for states to devise their own standards while
federal regulations are being proposed. For instance, the Maryland Department of the
Environment (MDE) created the Regulation of Coal Combustion Byproducts
legislation (COMAR 26.04.10.00) to address the issue of safe CCB handling,
processing, disposal, and reuse, and to develop procedures for disposing of or reusing
fly ash in beneficial applications. Also included are activities that are prohibited
5
based on issues of water, air, and human health quality concerns. One of the primary
topics of the regulations is the risk associated with heavy metal leaching from fly ash
mixtures used in construction projects, such as highway embankments.
Therefore, despite the advantages of reusing CCBs, potential impacts on
groundwater quality remain an issue when these by-products are used in construction
applications. Currently, the MDE requires that the CCBs or other industrial by-
products be subjected to the EPA Toxicity Characteristic Leaching Procedure (TCLP)
test to determine if the material can be used in field construction applications without
causing groundwater and surface water contamination. However, concerns have been
raised by various interested parties about the use of this testing methodology, as the
testing conditions are typically harsher than those encountered in the field, the test is
not material or site specific, and it neither represents the actual leachate produced in
the field nor simulates a site-specific transport condition (Baba and Kaya 2004,
ASTM D3987-06, Ram et al. 2007). Furthermore, the test method is used to
determine if the material is hazardous or not; however, more than 15 years of research
based on TCLP and column tests clearly shows that the CCBs are generally non-
hazardous (Creek and Shackelford 1992, Kyper 1992, Chichester and Landsberger
1996, Edil 1998, Ghosh and Subbarao 1998, Qiao et al. 2006, Bin Shafique et al.
2006).
Concerns with the use of the TCLP test has led to interest in alternative ways
of evaluating leaching of fly ash-soil mixtures. One alternative is the use of field
lysimeters (Ahmed et al. 2010); however, their high costs and long testing duration
stand as barriers to their widespread use. Furthermore, the composition of fly ash can

6
vary even within daily batches. Thus, there is a demand for methodologies that can
appropriately evaluate leaching potential using more standard laboratory equipment
and do so at more frequent intervals. This would provide fly ash producers with more
real-time data and aid in better selection of fly ash disposal or reuse options.
Similarly, regulators at the state and federal level would also benefit from having a
standardized way to easily gage the expected leaching behavior of a fly ash mixture,
and could use this information as a tool in accessing the feasibility of beneficial reuse
of fly ash and other CCBs.
Clearly, there is a need to determine the most appropriate leaching test for
evaluating the potential environmental impacts of CCBs when beneficially used, such
as in highway construction applications. The experimental conditions of the selected
leaching test must realistically predict leaching, thereby helping regulators and power
plant companies minimize risk. The selected method must also be cost-effective and
timely, and avoid misleading results, which would hinder efforts to promote increased
reuse of CCBs. For example, Baba and Kaya (2004) found that ASTM batch leach
tests indicated a fly ash waste was non-toxic whereas TCLP results showed elevated
leachate metal concentrations and a toxic classification. Therefore, the primary
objective of this project was to compare the methodologies and leaching results of
three leaching tests commonly used today: the ASTM water leaching test (WLT), the
TCLP test, and the ASTM flow-through column leaching test (CLT). Both batch and
column tests were run to understand how the testing conditions influence the leaching
results. In addition, the tests were conducted on different mixtures of soils and fly
ashes, and the concentrations measured in each test were compared with those
7
obtained by other researchers as well to the state and federal regulatory limits. The
effect of pH on leaching was also examined through a series of batch-scale leaching
tests. The results of these tests were used to provide recommendations on how to
select leaching tests that give consistent leachate concentrations most representative
of the field leaching conditions.
An initial survey of the metals present in the tested fly ashes was used to
select the metals monitored in the three types of leach tests. The criteria for selection
were that the metal must: (1) be present in relatively high levels in the fly ash, (2) be
a concern from an environmental or human health perspective, and (3) be accurately
measured on available instrumentation. Based on these criteria, chromium, copper,
and arsenic were selected for study in this project. Chromium and arsenic are
hazardous to human health which is reflected in their inclusion in the U.S. EPA’s
Safe Drinking Water Act as Maximum Contaminant Levels (MCLs). Copper was
chosen because of its known toxicity to fish and other aquatic life (Horne and Dunson
1995). Although arsenic is a metalloid, it is referred to as a metal through this study.
These metals also allowed anionic and cationic species to be examined across a wide
pH range.
The work is presented in the following chapters. Chapter 2 outlines the
materials used in this study and the procedures followed in performing the
preliminary work and leaching tests. The results from the different leaching tests on
the soil-fly ash mixtures are presented and discussed in Chapter 3. Chapter 4
provides some practical implications of the leaching test results, including an

8
integrated protocol for the testing of fly ash-soil mixtures. Lastly, Chapter 5 contains
a summary of the results and the main conclusions from this study.

9
2 Materials and Methods
2.1 Materials
Mixtures of two fly ashes and two soils were used to evaluate the effect of a range of
chemical and physical properties on metal leaching. Fly ashes were added to the soils
at 10% and 20% by weight to bracket the range most commonly applied in on-site
embankment construction. Both soils underwent testing to determine several basic
geotechnical properties, including specific gravity (ASTM D859), pH (ASTM
D4972), loss on ignition (LOI) (ASTM D7848-08), and Atterberg limits (ASTM
D318). Sieve analyses were also performed on the soils to classify them according to
the Unified Soil Classification System. Total elemental analyses (TEA) were
performed on soils and fly ashes at the University of Wisconsin Soil Testing and
Plant Analysis Laboratories by using a Thermo Jarrell Ash IRIS Advantage
Inductively Coupled Plasma Optical Emission Spectrometer. The results from the
TEA are provided in Table 2.1. Table 2.2 provides a summary of physical and
chemical properties of the materials used in this study. The classification of the soils
showed that they are sandy soils, with varying percentages of clay particles. The first
soil, designated as Soil C, has a higher fines (clayey) content while the sandy soil
(Soil S) is more uniformly graded.
The fly ashes used in this study, Brandon Shores (BS) and Columbia (C),
were provided by power plants in Maryland and Wisconsin, respectively. These
represent a non-cementitious (low calcium oxide) fly ash (BS) and self-cementitious
(high calcium oxide) fly ash (C). The higher calcium content reported in the TEA
(14.4%) for the Columbia fly ash provides its self-cementitious property upon

10
hydration. Specifically, a higher calcium level is indicative of higher levels of
calcium oxide, which reacts with water to form hydroxide ions. This is reflected in
the more alkaline pH of 11.9 of the C fly ash compared to the BS fly ash pH of 8.8
Two extraction fluids were used in the leaching tests described below. In the
batch water leach tests (WLTs) and column leach tests (CLTs), the leaching solution
was a 0.02 M NaCl solution. The ionic strength of the solution was selected to
simulate the ionic strength of groundwater that would be flowing through a
constructed embankment (Morar et al. 2010). Sodium chloride was expected to have
minimal effect on the leaching process and the molarity was selected to be consistent
with that of similar studies (Bin Shafique et al. 2007 and Morar et al. 2010).
Extraction fluid #1, an acetate buffer solution, was used as the extraction solution in
the TCLP tests. The solution was selected as outlined in EPA Method 1311 (U.S.
EPA SW-846) on the basis of the pH of the soil-fly ash mixture after heating and
addition of HCl. A detailed description of the preparation and selection of these
extraction solutions is provided in Appendix B.
2.2 Sample Preparation
As part of the specimen preparation, the soils were oven dried at 120°C for a
minimum of 24 hours to remove all moisture. This was necessary to accurately
assess the water content during preliminary compaction tests and achieve proper
moisture content in the final compacted mixtures. For the column tests, the soils were
sieved using a No. 4 sieve (4.76 mm). A total of 12 different mixtures were prepared
for testing. For the batch tests, additional sieving through a No. 12 (2.00 mm) sieve

11
was done to account for the smaller size of the testing equipment. No sieving of fly
ashes upon shipment was necessary due to their relatively fine grain sizes. To
maximize the degree of homogeneity, the soil-fly ash mixtures were mixed by hand
and using metal spoons in five-gallon buckets. Mixing was carried on for a minimum
of 5 minutes or until the mixture appeared well mixed. Mixture samples were labeled
using the following format: soil (C for clayey or S for sandy) – fly ash used (C for
Columbia or BS for Brandon Shores) – percent fly ash by mass (10 or 20). For
example, sample S-BS-10 contained a mixture of sandy soil plus 10% (by mass) BS
fly ash. Table 2.3 provides a complete list of mixtures used in this study.
2.3 Leaching Test Procedures
2.3.1 Water Leach Test (WLT)
WLTs were performed on 12 mixtures according to ASTM D3987 with two
modifications. One, the size of the extraction vessel was downsized from 2 L to a 60
mL centrifuge tube to fit the equipment available in the laboratory as previously done
by Morar et al. (2010). Two, a 0.02 M NaCl leaching solution was used instead of
the deionized water specified by the standard method. This background electrolyte
produced conductivities more representative of actual embankment situations. To
initiate the test, a 2.5-gram aliquot of the sample mixture was transferred to an acid-
washed centrifuge tube, and 50 mL of leaching solution were added, corresponding to
a 20:1 liquid-to-solid ratio. The tubes were rotated at 29 rpm for 18 hours ± 2 hours
using an end-over-end tumbling mixer (ATR Corporation) to allow for equilibration.

12
After rotation, the WLT samples were then placed in a centrifuge (Beckman
Allegra) at 2000 rpm for 10 minutes to separate the liquid leachate and solid phases.
Additional solids separation was achieved by filtering the resulting leachate through a
0.2 μm membrane filter (Pall Corporation) using a 60-mL LuerLock syringe fitted
with a 25-mm Easy Pressure filter holder. Electric conductivity and pH
measurements were taken for all samples immediately after filtration. The samples
were then acidified to pH < 2 by adding roughly 0.5 mL of concentrated trace metal
grade HNO3. All samples were refrigerated at 4° C until metal analysis could occur.
A second series of WLTs were performed to examine the effect of pH on the
leaching behavior of the fly ash-soil mixtures. These tests followed the WLT
procedures described above, except the 0.02 M sodium chloride extraction solution
was buffered at target pHs of 7 and 9. The biological buffers, BES and CAPSO (>
99% Sigma Aldrich) were used to maintain a pH of 7 and 9, respectively, due to their
minimal interference with metals. The buffered solutions were prepared by
dissolving 2.13 grams of BES and 2.47 grams of CAPSO in 100 mL of the original
WLT extraction fluid. The pH was measured and adjusted to the target value by the
addition of 4 N NaOH during constant mixing by magnetic stirrer. Preliminary tests
were conducted to confirm that the addition of the buffers provided adequate
buffering capacity. Specifically, pH measurements were performed on WLT samples
every two hours for the first 6 hours of the preliminary testing and then again after 24
hours to check for pH fluctuations.

13
2.3.2 Column Leach Test (CLT)
Columns were used to more realistically simulate field leaching conditions. All
specimens were compacted at their 2% dry of optimum moisture contents (OMCs) in
an acrylic tube having a 101.6 mm inside diameter and 305 mm height. By
compacting to the dry of optimum water content, higher hydraulic conductivities
could be achieved that helped allow enough sample to be collected in a reasonable
amount of time. Standard Proctor effort (ASTM D 698) was used during compaction.
Table 2.4 provides the optimum moisture content and maximum dry unit weights
(dm) of the mixtures based on compaction tests. The mixtures with the Brandon
Shores fly ash were used directly after compaction, However, due to their high
calcium content, the mixtures prepared with Columbia fly ash ash were cured for 7
days in a humidity chamber (95% relative humidity, 23 Cº) following compaction.
Additional information on the column compaction procedures can be found in
Appendix B. Figure 2.1 presents a schematic diagram of the column setup. Acid-
washed plastic centrifuge tubes were used to store the samples before metal analysis
and were labeled using the same system as described above.
After compaction, the column reactors were fabricated by placing porous
stones above and below the sample to prevent the compacted media from being
washed out of the column and evenly distribute the influent solution. The columns
were then capped with top and bottom latex plastic end plates that contained ports for
influent and effluent tubing attached to plastic connectors. The plates were held in
place using threaded rods, sealed with silicone sealant for a water-tight connection.
Influent to the column was provided in a downflow flow direction via a peristaltic

14
pump (Cole Palmer, Masterflex Model 7518-00) and 1/4 inch Masterflex plastic
tubing (Cole Palmer) at a rate of 60 mL/hr as recommended by Gelhar et al. (1992)
and Morar et al. (2010). The influent 0.02 M sodium chloride solution was stored in
five-gallon buckets, and continuously mixed by magnetic stirrer.
A total of 10 CLTs were performed in two sets. In each test, sampling of the
column effluent was conducted 4-5 times a day for the first 3 days to capture the
initial fluctuations in metal leachate concentrations. Sampling frequency was then
decreased to 3 times a day, followed by twice a day, daily, and once every two days
as the testing duration increased. Acid-washed plastic bottles were used to collect
between 30 to 50 mL of leachate samples at each sampling time. All samples were
analyzed for pH and EC, and then preserved by acidification with trace metal grade
HNO3 to pH < 2 and refrigeration (4) for later metals analysis. The pH of the
influent solution was measured at least twice daily and adjusted using 1 N NaOH to
ensure it remained within the designated pH range of 6.5-7. The CLTs were run until
the EC and pH values appeared to be approaching equilibrium and at least 25 pore
volumes of flow (typically 35-65) had occurred.
A tracer study using bromide as a conservative tracer was conducted at the
conclusion of both sets of CLTs to provide a basis for comparison to the metal
leachate concentrations. The procedure summarized by Morar et al. (2010) was
followed. A stock solution of 1000 mg/L bromide was prepared by dissolving 0.64
grams of NaBr (Sigma Aldrich) into 500 mL of the 0.02 M NaCl solution. The
bromide stock solution was diluted with additional 0.02 M NaCl influent solution to
prepare 100 and 250 mg/L bromide solutions for the first and second set of columns,

15
respectively. Three or four samples were taken of column effluent prior to the
influent tubing being switched to the bromide solution to create a step input.
Sampling of effluent during the tracer study occurred every hour initially then
decreased to every two hours, with a total elapsed study time of roughly 30 hours.
The samples were then analyzed for bromide concentration as described in Section
2.4.2.
2.3.3 Toxicity Characteristic Leaching Procedure (TCLP)
The TCLP test was conducted on the 12 soil-fly ash mixtures as outlined in EPA
method 1311 (U.S. EPA SW-846), except that the size of the extraction vessel was
downsized as described for the WLT (George et al. 2007). Based on the TCLP test,
extraction fluid #1, an acetate buffered solution, was used as the leaching solution.
Sample preparation, mixing, and post-mixing handling followed the steps described
above for the WLT except that the leachate collected after centrifugation was vacuum
filtered through TCLP glass fiber filters (Fisher Scientific) instead of membrane
filters. Electric conductivity and pH measurements were taken for all samples
immediately after filtration. The filtered leachate was then acidified to pH < 2 using
trace metal grade HNO3 and refrigerated until analyzed for metal concentrations.
2.4 Analytical Methods
2.4.1 pH and electrical conductivity (EC) measurements
Measurements of pH were performed using a combination pH probe (Orion, Model
91560) and meter (Orion, Model 520A). The meter was calibrated before each use

16
using standard buffer solutions at pH 4, 7, and 10. The probe tip was thoroughly
rinsed with deionized water between each standard and sample measured.
Calibrations were performed roughly every 4 hours during the CLTs and two hours
for the WLTs. A conductance meter (YSI, Model 35) was used to measure electrical
conductivity. The tip of the probe was repeatedly submerged a minimum of three
times into the solution being tested to allow the EC meter to stabilize. Once the same
EC value was measured three times successively, it was recorded. Again, thorough
rinsing of the probe was carried out to prevent contamination.
2.4.2 Bromide Measurements
Bromide concentrations were measured using a voltmeter (Orion, Model 520A)
equipped with a Br selective membrane probe (Cole Palmer, Model 27506-00), which
was used according to the manufacturer’s instructions. Five standards (1, 10, 50, 100,
and 500 mg/L bromide) were made by serial dilution of the stock solution described
in Section 2.3.2. An ionic strength adjuster (ISA), 5 N NaNO3, was added to both
standards and samples in a ratio of 1 mL ISA to 50 mL standard or sample. Standards
were thoroughly mixed and a calibration was performed every two hours during the
tracer studies, with duplicate measurements. The average voltage values were used to
construct a calibration curve relating meter voltage to bromide concentration. Linear
regression was performed and only calibration curves with R2 values of greater than
0.995 were used to convert sample voltage readings to Br concentration.

17
2.4.3 Leachate Metal Concentrations
The samples from all of the leaching tests were analyzed for heavy metals using an
atomic absorption spectrophotometer (Perkin Elmer, Model 5100ZL) equipped with a
graphite tube furnace module. A separate FIAS-400 hydride generator was used to
determine concentrations of arsenic. AS-90 and AS-71 autosamplers were used to
assist in sample analysis for the furnace and hydride generator apparatuses,
respectively. Hollow cathode lamps were used for chromium and copper, while an
electrodeless discharge lamp with a Perkin Elmer EDL System 2 power source was
required for arsenic. The lamps were set at the following wavelengths specific to the
metal being analyzed for: 193.7 nm for As, 357.9 nm for Cr, and 324.8 nm for Cu.
Certified stocks solutions of 1000 mg/L (Fisher Scientific) were used to
prepare sets of standards for each metal. Five to six standards were created, ranging
from 2 to 40 g/L for chromium and copper and 0.5 to 10 g/L for arsenic based on
the range where a linear relationship between absorbance and concentration was
found. The standards were made using the same background matrix as the samples.
Calibration curves with an R2 value of greater than 0.99 were used. Two standards
were measured as samples before and after sample analysis to check the accuracy of
calibration and precision of instrument. An approximately 1 mL aliquot of each
sample was placed in plastic cups, transferred to the autosampler rack, and analyzed.
Estimated metal concentrations in the leachate were calculated from calibration
curves produced internally by the AA instrument software. Metal concentrations and
sample absorbance values were recorded for each sample duplicate. Dilutions were
made when necessary to ensure a sample’s absorbance was within the range of

18
standards used. A new calibration curve was constructed every 20-25 samples. The
detection limits of the equipment based on the 0.02 M NaCl leaching solution for As,
Cr, and Cu as determined by the EPA Method Detection Limit procedure (Standard
Method 1030C) were 0.22, 0.35, and 1.00 g/L, respectively. Method detection
limits were higher for the TCLP Extraction Fluid #1 matrix, and were determined to
be 0.49, 1.8, and 1.4 g/L for As, Cr, and Cu, respectively.

19
3 Results and Discussion
WLT, TCLP, and CLT leaching tests were performed on the same 8 different fly ash-
soil mixtures to evaluate the metal leaching behavior as a function of the
characteristics of the different testing protocols and the soil/fly ash properties. In
addition, pure fly ash and pure soil samples were tested to provide a basis for
comparison in terms of expected upper and lower bounds for metal leaching. A series
of WLTs were conducted at variable pH values to observe the effect of pH on
leaching. Leachate pH and Cu, As, and Cr concentrations were monitored in the
three tests and compared to the Maryland State Aquatic Toxicity limits (MDE
COMAR) and EPA Drinking Water MCLs (EPA Drinking Water Contaminants). In
the following paragraphs, the Cu, As, and Cr concentrations observed in the three
tests are discussed sequentially, specifically as a function of the fly ash content and
the solution pH. Subsequently, the CLTs are examined in more detail, focusing on
the reproducibility of the tests, and interpretation of the tracer study results. Finally,
the results of the three test methods are compared.
3.1 Leaching Test Results: Copper
3.1.1 General Trends
Cu concentrations in the WLT leachate (Table 3.1) were below the strict Maryland
chronic Cu Aquatic Toxicity limit of 9 μg/L in 75% of the fly ash-soil mixture
samples, with the exception of the C-C-10 and C-C-20 samples at 12 and 14 μg/L,
respectively. These differences in leaching behavior are likely the combined result of
the fly ash and soil composition (e.g., metal content and alkalinity) and other factors,

20
such as pH, which are discussed further below (Bin Shafique et al. 2002, Palumbo et
al. 2007). For example, based on the TEA (Table 2.1), soil C (27.16 mg/kg) and C
fly ash (188.56 mg/kg) had a higher Cu content compared to soil S (1.28 mg/kg) and
the BS fly ash (59.63 mg/kg). Correspondingly, mixtures containing C fly ash
generally had higher leachate Cu concentrations (up to 6 times) than similar mixtures
with the BS fly ash. The exception to this was the 100% fly ash samples, where both
fly ashes had WLT Cu leachate concentrations below 3 μg/L.
The TCLP results (Table 3.2) showed Cu leaching increased in all soil S
mixtures compared to the WLT, especially for fly ash BS, while soil C mixtures had
TCLP Cu concentrations that were approximately the same as the WLT for the BS fly
ash and about 40-50% lower for the C fly ash. TCLP Cu concentrations in the soil C
mixtures were all below the Maryland Cu Aquatic Toxicity chronic limit, but three
out of the four soil S mixtures (S-C-10, S-BS-10, and S-BS-20) had Cu
concentrations exceeding that criterion.
Based on the replicate CLTs for the S-BS mixtures (Figure 3.1), Cu leaching
exhibited a first flush behavior, with concentrations decreasing from 12-20 μg/L to <
5 μg/L after the first 1-2 PV. Interestingly, the S-BS column with the higher fly ash
content (i.e., 20% vis-à-vis 10%) did not always have the higher Cu concentration in
the leachate. The replicate C-BS CLTs also exhibited a first flush behavior (Figure
3.2); however, lower initial peak Cu concentrations (~ 7 μg/L) were measured in the
C-BS-20 columns compared to the initial peak Cu concentrations in the S-BS
columns (~ 20 μg/L) despite soil C having approximately 21 times the copper content
as soil S based on the TEA. One possible explanation for the difference in leaching

21
between the soils is that adsorption of aqueous Cu onto the mineral surface may have
occurred at the pH range of 4-6 for the BS fly ash CLTs and contributed to the
reduced leaching found from soil C. For example, in column studies under acidic
conditions, Ariese et al. (2002) observed a large portion of the leached metals were
retained by the soils, reducing aqueous concentrations by different adsorption or
binding mechanisms. Soil C, with a higher percentage of fines (silts and clays), is
likely to have increased surface area and surface charge compared to soil S, which are
important factors in determining soil adsorption capacity.
Both the S-C-10 and S-C-20 columns had initial Cu concentrations above 20
μg/L (Figure 3.3). These concentrations decreased dramatically with continued
leaching, and after 5 PV concentrations were below the Cu Aquatic Toxicity limit.
The C-C-20 column exhibited similar leaching behavior as the S-C columns (Figure
3.4). The initial peak Cu concentration was measured at 110 μg/L, or about 12 times
the Maryland aquatic toxicity chronic limit for Cu, but concentrations stabilized
around 12 μg/L after 20 PV.
CLT leaching of Cu from the soil S-fly ash mixtures was comparable both in
behavior and magnitude to that of the 100% soil S column (Figure 3.5). This
indicates that the soil can act as a source of metal ions, especially given that 80-90%
of the mixture mass is soil and if the soil contains metals in more easily solubilized
forms compared to fly ash. The contribution of soil to leaching would vary with its
composition and fluctuations in pH. Soils can play a large role in metal leaching
because of their effect on processes that govern leaching mechanisms as well as
serving as a “compartment” for the storage and/or release of metals. Since soils can
22
comprise a large portion (greater than 80% by mass) of the total mixture, soil
buffering capacity can influence leachate pH which directly affects metal
concentrations. Depending on soil properties, soils can be highly adsorptive and
remove dissolved metals or release additional metal ions into solution (Bin Shafique
et al. 2007). The effect of the fly ash content and pH on Cu leaching are examined
further below.
3.1.2 Effect of fly ash content on copper leaching
Increased fly ash content had less effect on the WLT Cu concentrations in the BS fly
ash mixtures than the C fly ash mixtures, with aqueous copper for all BS fly ash
mixtures measured at < 5 μg/L (Figures 3.6 and 3.7). For the BS fly ash mixtures, the
largest increase in Cu concentration was observed going from 10% to 20% fly ash. In
comparison, the C fly ash mixtures showed the largest increase (9.4 μg/L for soil C
and 6.2 μg/L for soil S) in leachate Cu when fly ash content was raised from 0 to 10%
as shown in Figures 3.8 and 3.9; however, the Cu concentrations decreased as the fly
ash content increased further, from 10% to 20% and/or 100%.
The trends in TCLP Cu concentrations as a function of fly ash content were
also different between the BS and C fly ashes. BS fly ash mixtures exhibited a
positive, nonlinear relationship between fly ash content and leachate metal
concentration, with higher levels of leaching observed in the soil S compared to soil
C (Figures 3.10 and 3.11). This difference could be attributed to the larger surface
area of soil C due to a higher clay content, which would facilitate adsorption onto soil
particles, including iron and aluminum oxide surface deposits (Evans 1989). On the
23
other hand, C fly ash mixtures had a large increase in TCLP leachate Cu
concentrations upon the initial addition of fly ash to the soils (from 0 to 10% fly ash
by mass), followed by a decrease in Cu concentrations in mixtures with 20 and 100%
fly ash (Figures 3.12 and 3.13).
This nonlinear relationship between the leaching of metals from fly ash
mixtures with variable fly ash contents has been observed by others (Bin Shafique et
al. 2007, Morar et al. 2010) and illustrates the difficultly in predicting leaching
behavior. The low metal content in both soils compared to the fly ashes is likely a
factor in the nonlinear relationship, especially under the more acidic conditions in the
TCLP in which fly ash can serve as the source of the majority of the leached metal.
However, as the fly ash content is increased, the percent of soil by mass decreases,
thereby reducing the ability of the dissolved metal ions to interact with substances
found in the soil. This is particularly relevant to copper because of its high affinity
for complexation with humic and fulvic acid portions of soil organic matter, which
can cause increased detection of soluble copper (Evans 1989). The difference in
TCLP leaching between soils is supported by the higher LOI measured for soil S
(8.6%) compared to soil C (7.1%), which would provide more organic matter for Cu
complexation.
3.1.3 Effect of pH on copper leaching
Changes in pH can affect the speciation, and therefore the solubility, of metals in the
leachate. The distribution of common Cu(II) species as determined by the Visual
Minteq chemical equilibrium software is shown in Figure 3.14. In the case of copper,

24
the Cu2+ cation is the dominant species at pH < 8 (Evans 1989). Above this pH,
hydroxide precipitation of Cu is expected, which would lead to lower measured
aqueous levels. However, the presence of inorganic and organic compounds can
cause the formation of soluble complexes that can increase leachate metal
concentrations (Rigol et al. 2009). For example, comparing the two fly ashes studied,
it is clear the approximate 5 unit difference in leachate pH is a major contributor to
the increased WLT Cu leaching seen from the C fly ash (Table 3.1). Calcium in fly
ash in the form of calcium oxide reacts with water to form calcium hydroxide,
CaO + H2O Ca(OH)2 + heat (3.1)
which dissociates to give 1 mole of Ca2+ and two moles of OH-,
Ca(OH)2 Ca2+ + 2OH- (3.2)
Thus, the higher calcium content in the C fly ash compared to the BS fly ash
(14.43% vis-à-vis 0.22%), and correspondingly higher CaO content, result in more
alkalinity and pH values around 11.5 as observed in the unbuffered WLTs and CLTs
(Table 3.3). Calcium levels in the fly ash have been reported as a major factor in
determining the leachate pH because of relatively high levels of calcium compared to
other alkaline elements (Palumbo et al. 2007). Conversely, increased acidity can
desorb Cu and release more Cu through the dissolution of minerals, as illustrated by

25
all 4 TCLP soil S samples having higher leachate Cu than the WLT results for the
same mixtures (Table 3.2).
To examine the effect of pH on Cu leaching more closely, all batch Cu data
were compiled in Figure 3.15 for the S-C mixtures and Figure 3.16 for the C-C
mixtures. No clear trends in Cu leaching were observed in the buffered WLTs from
the BS fly ash mixtures due to the large scatter of data, so those data are not shown.
For the mixtures with C fly ash (Figures 3.15 and 3.16), the Cu concentrations were
higher in the samples buffered at pH 7 and 9 compared to those from the original
WLTs (pH ~11.5) and the TCLP tests. Similar results were seen for both soils and
supported increased leaching of Cu as the pH is decreased from the unbuffered value.
This is possibly attributed to higher levels of Cu release from increased dissolution of
fly ash and soil particles under acidic conditions and complexation reactions with
positively-charged Cu species and negatively-charged soil organic matter resulting in
higher soluble Cu levels (Fytianos et al. 1998, Ram et al. 2007).
The pH also impacted the results of the CLTs. The BS fly ash columns
exhibited more fluctuations in the CLT pH measurements, sometimes changing 1-2
pH units within several pore volumes. In contrast, columns containing C fly ash had
stable pH measurements throughout the test duration. There were certain CLTs, such
as the S-BS-20 (Figure 3.1) and C-BS-20 (Figure 3.2) columns, where in some
portions of the leaching curves there appears to be a correlation between decreases in
pH and increased Cu concentrations. This confirms the importance of pH in
determining leachate metal concentrations, and how simple pH measurements can aid
in predicting metal speciation and leaching behavior.

26
3.2 Leaching Test Results: Arsenic
3.2.1 General Trends
Aqueous WLT arsenic concentrations were measured below the EPA MCL of 10
μg/L for all fly ash-soil mixtures (Table 3.1). In fact, leachate As concentrations were
generally < 1 μg/L with little variation between mixtures of different soils or fly ashes
in the WLTs, except for the 100% BS fly ash at 23 μg/L. This suggests that the same
leaching mechanisms are occurring in mixtures of the different soil and fly ashes.
The low (generally < 1 μg/L) levels of As detected also suggest that soluble arsenic is
either being strongly adsorbed or precipitated out of solution.
Similarly, the aqueous TCLP arsenic concentrations were also measured at
below the EPA MCL for all soil-fly ash mixtures (Table 3.2). However, both 100%
fly ash samples exceeded the MCL with concentrations of 30 and 85 μg/L for C and
BS fly ashes, respectively. The TEA results (Table 2.1) indicate that the arsenic
content of the BS fly ash is higher than that of the C fly ash (24.2 mg/kg versus 15.0
mg/kg), consistent with the higher leaching in the 100% BS fly ash samples. The S-
BS-20 mixture had the highest TCLP As concentration of the soil-fly ash mixtures,
but the arsenic leachate concentrations for all fly ash-soil mixtures exhibited a very
tight range compared to the other metals, with all ranging from < 0.49 to 3.0 μg/L.
Thus, the presence of the soils dramatically influenced the As concentrations in the
leachate. The addition of fly ash to soil C appeared to have a less pronounced effect
on As leaching as the 100% C soil samples had a slightly greater concentration for
leachate arsenic (1.7 μg/L) than the fly ash-soil mixtures (<0.49 to 1.1 μg/L).
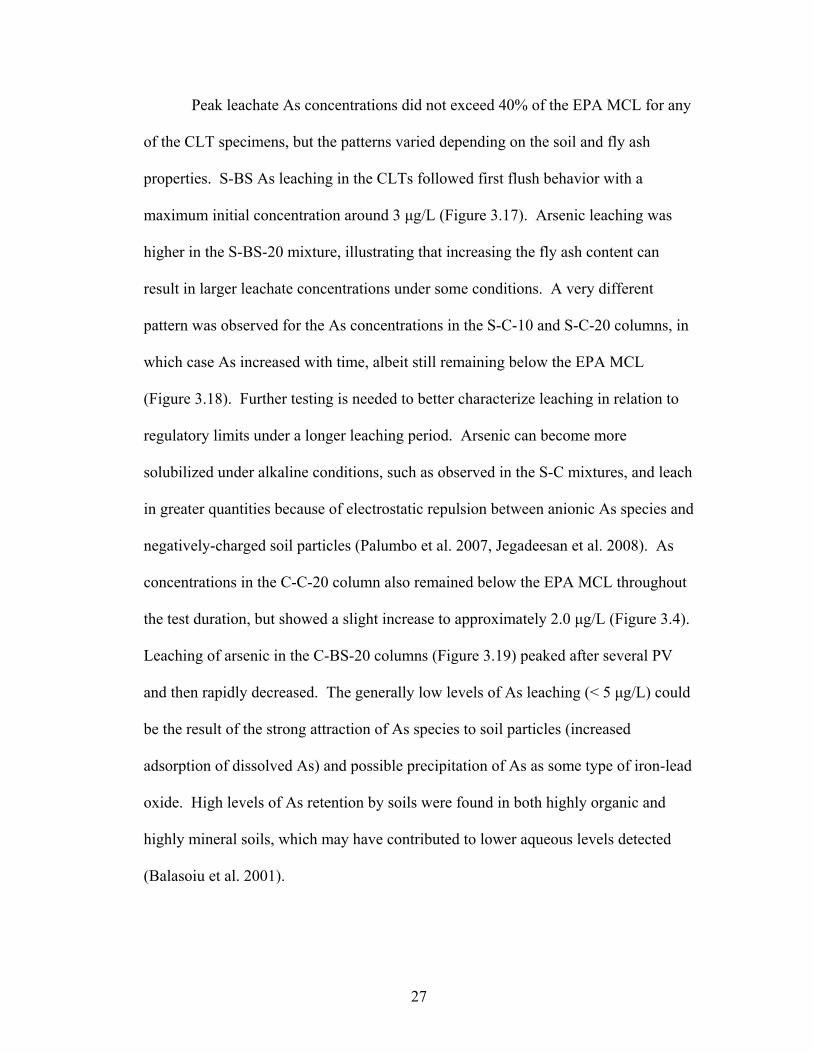
27
Peak leachate As concentrations did not exceed 40% of the EPA MCL for any
of the CLT specimens, but the patterns varied depending on the soil and fly ash
properties. S-BS As leaching in the CLTs followed first flush behavior with a
maximum initial concentration around 3 μg/L (Figure 3.17). Arsenic leaching was
higher in the S-BS-20 mixture, illustrating that increasing the fly ash content can
result in larger leachate concentrations under some conditions. A very different
pattern was observed for the As concentrations in the S-C-10 and S-C-20 columns, in
which case As increased with time, albeit still remaining below the EPA MCL
(Figure 3.18). Further testing is needed to better characterize leaching in relation to
regulatory limits under a longer leaching period. Arsenic can become more
solubilized under alkaline conditions, such as observed in the S-C mixtures, and leach
in greater quantities because of electrostatic repulsion between anionic As species and
negatively-charged soil particles (Palumbo et al. 2007, Jegadeesan et al. 2008). As
concentrations in the C-C-20 column also remained below the EPA MCL throughout
the test duration, but showed a slight increase to approximately 2.0 μg/L (Figure 3.4).
Leaching of arsenic in the C-BS-20 columns (Figure 3.19) peaked after several PV
and then rapidly decreased. The generally low levels of As leaching (< 5 μg/L) could
be the result of the strong attraction of As species to soil particles (increased
adsorption of dissolved As) and possible precipitation of As as some type of iron-lead
oxide. High levels of As retention by soils were found in both highly organic and
highly mineral soils, which may have contributed to lower aqueous levels detected
(Balasoiu et al. 2001).

28
3.2.2 Effect of fly ash on arsenic leaching
BS fly ash mixtures generally had increasing WLT As concentrations as the fly ash
content was raised from 0 to 100% fly ash (Figures 3.6-3.7) , although the
relationship was nonlinear. The soil C mixture actually had a small decrease in As
concentrations increasing from 10 to 20% fly ash content, but the increase from 20 to
100% fly ash produced the largest increase in concentration up to 22 μg/L. This fly
ash content increment corresponded to the largest change in leachate WLT pH (2.8
pH unit increase for S-BS and 2.2 pH unit increase for C-BS) (Table 3.1), supporting
the connection between changes in pH from fly ash addition and the amount of
leached metalloid or metal, as discussed further below. The C fly ash mixtures for
both soils showed an increase in WLT As concentration from 0 to 10% but decreased
as the fly ash content was raised further (Figures 3.8-3.9). This initial increase in As
concentration also corresponded to the largest pH change in the WLT samples, an
increase of 5.8 units for soil S mixtures and 2.6 units for soil C mixtures. Higher
leaching from the 100% BS fly ash compared to 100% C fly ash (Table 3.1) is likely
to be related to the higher As content of this fly ash by roughly 10 mg/kg based on the
TEA (Table 2.1).
In the TCLP test, increasing the fly ash content from 10 to 20% resulted in 1-2
μg/L higher As concentration in the leachate for soil S samples with both fly ashes
(Figures 3.10 and 3.12), but this trend was not seen with soil C (Figures 3.11 and
3.13). The largest increase in As concentration in all of the TCLP tests occurred with
the increase from the 20 to 100% fly ash content, and could be the result of the

29
absence of soil particles that enhance adsorption or release precipitating agents from
the fly ash which such as lead or sulfide.
3.2.3 Effect of pH on arsenic leaching
Previous studies have found that As is found in fly ash primarily as As(V), possibly
due to the highly oxidizing environment of coal combustion, which would convert
arsenite (As(III)) species to As(V) species (Cullen and Reimer 1989, Shah et al.
2008). A distribution of As(V) species produced by Visual Minteq software is
provided in Figure 3.20. Alkaline pH conditions favor increasingly negatively-
charged As species, such as HAsO42- and AsO4
3- for As(V), to dominate in solution,
with the latter present in appreciable quantities at pH > 11. However, if As(III) is the
main form of As present in the fly ash, then leaching could produce arsenous acid
(H3AsO3) or H2AsO3-. Arsenite can become more significant at higher pH values and
in reducing environments, such as may have occurred in the closed, saturated CLT
system. This is important because retention of As(III) by soils is less than that of
As(V) (Balasoiu et al. 2001). If dissolved concentrations exceed the adsorption
capacity of the soil, increased leaching of arsenic can be observed because of
repulsion between the metal ion and the soil particle surface. Therefore, at very
alkaline pH values above 11, As species can exhibit reduced adsorption to negatively-
charge surfaces and therefore leach in higher concentrations under conditions such as
those seen with the C fly ash (Wang et al. 2006, Morar et al. 2010). A more in-depth
speciation study would be helpful in confirming the As species present and providing
evidence of the observed leaching behavior.
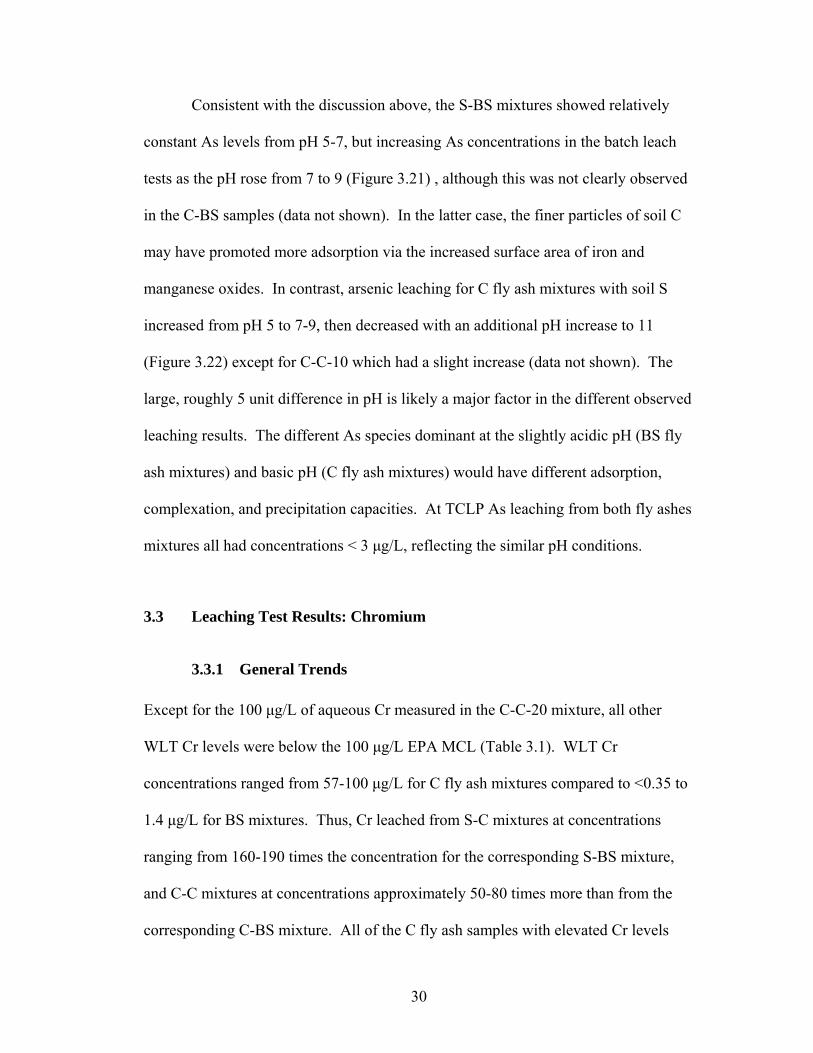
30
Consistent with the discussion above, the S-BS mixtures showed relatively
constant As levels from pH 5-7, but increasing As concentrations in the batch leach
tests as the pH rose from 7 to 9 (Figure 3.21) , although this was not clearly observed
in the C-BS samples (data not shown). In the latter case, the finer particles of soil C
may have promoted more adsorption via the increased surface area of iron and
manganese oxides. In contrast, arsenic leaching for C fly ash mixtures with soil S
increased from pH 5 to 7-9, then decreased with an additional pH increase to 11
(Figure 3.22) except for C-C-10 which had a slight increase (data not shown). The
large, roughly 5 unit difference in pH is likely a major factor in the different observed
leaching results. The different As species dominant at the slightly acidic pH (BS fly
ash mixtures) and basic pH (C fly ash mixtures) would have different adsorption,
complexation, and precipitation capacities. At TCLP As leaching from both fly ashes
mixtures all had concentrations < 3 μg/L, reflecting the similar pH conditions.
3.3 Leaching Test Results: Chromium
3.3.1 General Trends
Except for the 100 μg/L of aqueous Cr measured in the C-C-20 mixture, all other
WLT Cr levels were below the 100 μg/L EPA MCL (Table 3.1). WLT Cr
concentrations ranged from 57-100 μg/L for C fly ash mixtures compared to <0.35 to
1.4 μg/L for BS mixtures. Thus, Cr leached from S-C mixtures at concentrations
ranging from 160-190 times the concentration for the corresponding S-BS mixture,
and C-C mixtures at concentrations approximately 50-80 times more than from the
corresponding C-BS mixture. All of the C fly ash samples with elevated Cr levels

31
had pH values > 10, similar to the results obtained by Fytianos et al. (1998) and
Palumbo et al. (2007).
TCLP Cr concentrations were measured below the EPA MCL for Cr in all
soil-fly ash mixtures (Table 3.2). Only the 100% C fly ash exceeded the MCL,
consistent with the relatively high Cr content of this fly ash based on the TEA (64.6
mg/kg). With the exception of the S-C and C-C mixtures, all of the TCLP Cr
concentrations exceeded the WLT Cr concentrations. This is probably due at least in
part to the lower pH of the TCLP (average pH of 6.3 for 100% C fly ash samples).
Zandi and Russell (2007) describe how certain metals such as Cr are typically found
in the glassy, exterior coating of the fly ash particles resulting from condensation
following coal combustion. More acidic conditions degrade this surface Cr and
release it into solution, leading to more dissolved Cr as seen in the BS fly ash
mixtures. In addition, the lower pH range (4.8 to 6.3) of the TCLP favors the
dominance of cationic species of Cr such as CrOH2+ and Cr(OH)2+ that would adsorb
less to soils under acidic conditions because of the dominance of positively-charged
surfaces.
Several of the CLT tests exhibited a lagged leaching response for Cr, and had
portions of the leaching curves that showed decreases in pH resulting in increased Cr
concentrations. For example, Cr concentrations from the first set of CLTs with S-BS
(Figure 3.23) had the most variation and showed a lagged leaching response with two
periods of elevated chromium levels above 50 μg/L. A lagged Cr leaching response
could be caused by Cr being located in less easily solubilized fractions of the soil and
fly ash particles. Thus, as time progresses, leaching solution is able to reach these Cr

32
sources and dissolution reactions reach the point where the Cr is released into
solution. Edil et al. (1992) also observed that while the majority of CLTs exhibited
first flush leaching, Cr had a different leaching response. A sharp spike in Cr to 250
μg/L in the first set S-BS-20 column around 10 PV was the only time the CLT
leachate concentrations exceeded the Cr MCL limit. Similar lagged spikes in Cr
concentration to 35 μg/L and 20 μg/L were observed in the second set S-BS-20
column (Figure 3.23), and first C-BS-20 column (Figure 3.24), respectively, which
corresponded to the first major drop in pH. In contrast, both the S-C-10 and S-C-20
columns had initial Cr concentrations that exceeded the EPA MCL (Figure 3.25), but
quickly dropped within 5 PV to below regulatory limits. The C-C-20 column also
had initial Cr concentrations (238 μg/L) over two times the 100 μg/L regulation limit
(Figure 3.4), similar in order of magnitude to leaching from other columns containing
C fly ash, followed by declining Cr levels.
3.3.2 Effect of fly ash content on chromium leaching
Fly ash content appeared to have minimal effect on WLT Cr leachate concentrations
in the BS fly ash mixtures, with a range of Cr concentration of < 0.35 to 2.8 μg/L in
the 100% BS fly ash sample (Figures 3.6-3.7). Mixtures of both soils and C fly ash
show an increase in WLT Cr concentration initially with a peak at 20% fly ash before
decreasing with 100% fly ash sample (Figure 3.8-3.9). The higher leachate Cr from
soil-fly ash mixtures is possibly due to the increased repulsion of Cr species with
charged surfaces more abundant in the presence of the soil particles. The presence of
soluble soil organic matter could also play an important role in causing increased Cr

33
in the leachate. Mixtures of fly ash with soil C displayed higher Cr concentrations
than the corresponding mixtures with soil S, which may be partially due to this soil
having the highest levels of Cr present (65.9 mg/kg) of all 4 materials, although soil C
itself had lower leachate levels than soil S (Table 2.1). The relatively sharp increase
in metal concentration from 0 to 10% C fly ash can be attributed to the pH change of
approximately 6 for soil S and 3 for soil C that occurred from the increase of 0 to
10% fly ash, which may have led to an increased attack on the mineral structure of
the soils and dissolution of the exterior coating on fly ash particles.
The TCLP leaching results indicated an approximately linear relationship
between leachate Cr concentrations and fly ash content for all soil and fly ash
mixtures (Figures 3.10-3.13), with a minimum coefficient of determination
determined to be 0.9655 (trendlines not shown). The slope of this relationship is
similar for the BS fly ash mixtures, as it is for the C fly ash mixtures, suggesting that
the fly ash metal content was determining the results. The more uniform leaching
pattern observed corresponds to the more consistent pH in the TCLP samples
compared to those from the WLT. The smaller fluctuations in pH with varying fly
ash content seen in the TCLP (Table 3.2) could produce a more consistent release of
Cr into solution as the acidity with different fly ash contents remains relatively
constant.
3.3.3 Effect of pH on chromium leaching
Cr can be present in fly ash as Cr(VI) in low percentages (< 5%) that vary with the
coal source and combustion conditions (Shah et al. 2008). The dominance of either
the Cr(III) or Cr(VI) form is strongly linked to pH and other conditions such as the pE

34
of the system, which indicates the thermodynamic driving force for reduction and
oxidation of Cr species. Cr(III) typically forms increasingly negative species with
minimum solubility around pH 6-7, and eventually precipitates out as Cr(OH)3 (Rai et
al. 1987). At very alkaline pH values greater than 10, Cr(III) can form species like
Cr(OH)4-, which behaves like other anions with decreased adsorption under alkaline
conditions (Shah et al. 2008). This change in Cr(III) speciation is shown in Figure
3.26 which has the relative distribution of Cr(III) species as a function of pH. This
anionic behavior is probably a main contributor to the higher unbuffered WLT Cr
concentrations from the C fly ash mixtures, which have higher pH values of roughly
11.5 compared to around 6.5 for BS fly ash mixtures (Table 3.3, Figures 3.27-3.28).
TCLP Cr concentrations were higher than for the unbuffered WLT as the pH was
decreased for the BS fly ash, but the opposite effect was observed for the C fly ash
mixtures. The leaching of Cr is generally magnified at acidic pH values compared to
negligible leaching occurring in neutral or alkaline conditions as the acidic conditions
aggressively attack the Cr-containing compounds in the materials, releasing Cr into
solution (Fytianos et al. 1998, Jo et al. 2008). These findings are consistent with the
increased leaching of Cr under acidic TCLP conditions observed in the current study
for the BS fly ash mixtures.
Consistent with the discussion above, the Cr concentrations in the buffered
WLT with the BS fly ash mixtures increased from pH 7 to pH 9, with a similar but
less dramatic effect in the C fly ash samples (see Figure 3.27-3.28). The weaker trend
with the C fly ash can be explained if a majority of the Cr present in this fly ash was
Cr(VI), which has high solubilities over a pH range of 2-12 and, thus, aqueous

35
concentrations would be similar at different pHs (Rai et al. 1989). A single
colorimetric determination of Cr(VI) with diphenylcarbazide reagent performed on
one set of CLT samples showed levels of Cr(VI) in the BS fly ash column leachate to
be below 1.0 μg/L, while C fly ash had 114 μg/L, which represented approximately
50% of the total leached Cr. Thus, if the BS fly ash mixtures have predominantly
Cr(III), then the combined TCLP and buffered WLT test results from this study agree
well with the expected bowl-shaped solubility of Cr(III) across the pH scale: at acidic
pH values (~ 5.5 for TCLP), solubility of Cr(III) is raised and higher leachate
concentrations are observed; similarly, at alkaline pH values (9 for buffered WLT),
solubility and therefore leaching of Cr(III) is again enhanced after reaching a minimal
around neutral pH (Rai et al. 1987). In comparison, the relatively consistent
magnitude of the Cr concentration in the leachate from the C fly ash mixtures across
the pH values tested is consistent with Cr(VI) being dominant in C fly ash, whose
distribution of species as a function of pH is shown in Figure 3.29. Interestingly, at
the high pH values (> 10) where increased leaching of As was found, Balasoiu et al.
(2001) found that the presence of arsenate significantly decreased Cr(VI) adsorption
on an iron oxide surface deposits due to competition for adsorption sites and
electrostatic effects. This potential for interactions between metal ions illustrates
another aspect of the complexity of natural leaching mechanisms, especially when
dealing with several metals of interest at once.

36
3.4 CLT Reproducibility
The duplicate columns prepared with soil C and fly ash BS at 20% all exhibited a
similar leaching behavior for all of the metals, which could be described as a first
flush response pattern (Figures 3.2, 3.19, and 3.24). In addition, with the exception of
a spike in Cr concentration in the C-BS-20 #1 column, the magnitude of the leachate
concentrations also exhibited good reproducibility, with effluent concentrations that
differed by less than 3 μg/L throughout the test. The highly variable pH in the BS fly
ash mixtures could explain the difference in leaching behavior in the duplicated
columns because sudden fluctuations in pH could affect the solubilization processes
occurring in a specific portion of the column.
Duplicate S-BS-10 and S-BS-20 columns showed similar first flush leaching
behavior for Cu and As (Figures 3.1, 3.17, and 3.23). Differences in leachate
concentration between duplicate CLTs were small at < 5 μg/L for Cu and < 1 μg/L for
As throughout the test duration. Cr leached from the S-BS column exhibiting first a
lagged and then a first flush leaching response, with the lagged response CLTs have
higher measured leachate Cr. Again, differences in the flow through the column
media and natural heterogeneity could be the cause of discrepancies in leaching from
columns composed using the same mixture.
In addition to pH, another factor that could contribute to variability between
replicate columns is the formation of preferential flow paths, which could facilitate
the solubilization of portions of the column having varying amounts of metals
present. This is supported by the difference in breakthrough times between the first
and second set of CLTs. In addition, due to the heterogeneous nature of the soils and

37
fly ash, differences within materials could contribute to fluctuations in both metal
concentration and effluent pH. Nonetheless, although differences exist in leaching
between columns composed of the same mixture, the results show that CLTs can be
reproduced and similar estimates of leaching potential obtained.
3.5 Tracer Study Results
Bromide breakthrough curves showing C/Co as function of pore volumes of flow for
both sets of CLTs are shown in Figures 3.30-3.31. All of the tests were performed in
the same manner, although there was less variation in influent solution bromide
measurements from the second set of CLTs. Breakthrough curves are useful tools in
assessing the transport parameters of mixtures and evaluating the presence of flow
anomalies such as preferential flow paths that could impact the leaching of heavy
metals as the leaching solution flows through the column media. Despite some
inconsistency in the influent bromide concentrations, the breakthrough curves for all
10 columns were similar, with all exhibiting the typical “S” curve response to the step
input of bromide. However, there was some variability in the timing of the
breakthrough point, which was reported as reached when the C/Co ratio
approximately equaled 1. For example, the tracer studies for the first set of CLTs
(Figure 3.30) had earlier breakthrough points compared to the second set of columns
(Figure 3.31). In addition, within the first set, the type of fly ash appeared to have a
strong impact on the point of breakthrough, with the C fly ash mixtures having
breakthrough occur earlier than the BS fly ash mixtures, at approximately 0.25 and
0.75 PV, respectively. In comparison, all columns from the second set of CLTs had

38
breakthroughs occur at roughly the same time around 1 PV as expected for a
conservative tracer.
One possible explanation for the observation of an earlier breakthrough in the
first set of C fly ash columns compared to other columns could be the increased
porosity that results from combining the soils with a smaller particle size fly ash.
However, this phenomenon should have affected the BS fly ash columns as well.
Therefore, it is more likely that these results suggest that there was either short
circuiting along the column walls or preferential flow paths could have developed
within the fly ash columns that would allow leaching solution to pass through the
columns more rapidly than expected, thereby changing the extraction time and metal
leaching behavior.
3.6 Comparison of Different Leaching Test Results
There were significant differences in the leachate metal concentrations obtained in the
three leaching tests performed, as shown in Table 3.4 and Figures 3.32-3.34. When
comparing results from leaching test methodologies, it is important to consider the
impact of chemical factors, such as pH differences, and hydrologic conditions (flow-
through or static). For example, critics of the use of the TCLP for evaluating the
leaching potential of fly ash point out that the more acidic test conditions
characteristic of landfill leachate often result in higher leaching and can overestimate
the leaching potential of fly ash mixtures when placed in other environments (Baba
and Kaya 2004). This is demonstrated by the results of a study by Jegadeesan et al.
(2008) comparing the synthetic precipitation leaching procedure (SPLP), which uses

39
a sulfuric and nitric acid mixture as the leaching solution for fly ash, and the TCLP
test. They found that aqueous As and Cr concentrations were three times higher in
the TCLP tests, while Cu concentrations were <0.006 mg/L for the SPLP compared to
0.81 mg/L for the TCLP (Jegadeesan et al. 2008).
In comparing the batch results from this research, pH was the major factor
contributing to the different observed metal leachate concentrations. Leachate
concentrations from the TCLP were generally higher compared to those from the
WLT for both Cu and As (Figures 3.35 and 3.36), with the exception of C-BS-10 and
five of the C fly ash mixtures, for which the WLT concentrations were higher.
Increased Cr concentrations were also seen in the WLTs for all of the C fly ash
mixtures (Figure 3.37). TCLP As concentrations were higher than the WLT results
for the 100% fly ash samples by approximately 30 μg/L for C fly ash and 60 μg/L for
the BS fly ash (Tables 3.1 and 3.2). In comparison, the increases in the TCLP As
concentration observed in BS fly ash mixtures were small (< 2 μg/L) compared to the
WLT results. Jo et al. (2008) also reported leaching of As and Cu concentrations
similar in magnitude from bottom and lagoon coal ash. The magnitude of the
difference in pH between the TCLP (~5.3) and WLT (~6.5 for BS fly ash and ~11.5
for C fly ash) is largely responsible for explaining the different leaching trends. The
difference between the TCLP and WLT concentrations were lower for the BS fly ash
mixtures because of the smaller differences in pH (~1 pH unit) compared to the C fly
ash mixtures (~7 pH units) which had Cr concentrations roughly double from the
TCLP to the WLT.

40
When comparing the batch and CLT results, both pH and contact time become
important. In this regard, the work by Ariese et al. (2002) is helpful in explaining
some of the findings in this study. Ariese et al. (2002) concluded from pH-stat
experiments on several different fly ashes at pH 3 and 5 that extraction time (7 vis-à-
vis 24 hrs) had little effect on leachate concentrations, indicating equilibrium was
possibly reached early on. This observation is consistent with the first flush leaching
behavior seen in the majority of the CLT results, with highest transformation and
transport of metal ions occurring in the beginning of the leaching test. Furthermore,
sequential extraction tests performed by Ariese et al. (2002) showed that the readily
exchangeable fractions of Cu comprised 60% of the total extractable amount. Thus,
the high Cu concentrations leaching from the C fly ash in some of the CLTs in this
study could result from increased solubilization from cation exchange reactions and
steady-state being achieved early on. Ariese et al. (2002) also found that leachate Cu
concentrations were higher under more acidic conditions. This confirms that
changing the testing conditions, including lowering the pH, can affect metal leachate
concentrations and yield higher or lower estimates of leaching potential. For
example, elevated levels of Cr were measured at alkaline pHs in this study, and
leachate Cu and Cr concentrations at pH 5 from the same pH-state tests by Ariese et
al. (2002) were similar to the TCLP results from the current study. The different
leaching behavior seen for the three metals studied reflect their different speciation
and adsorption/precipitation mechanisms.
Performing a reasonable comparison of the batch leach tests to the CLTs also
requires careful consideration of the point of comparison. For this work, two
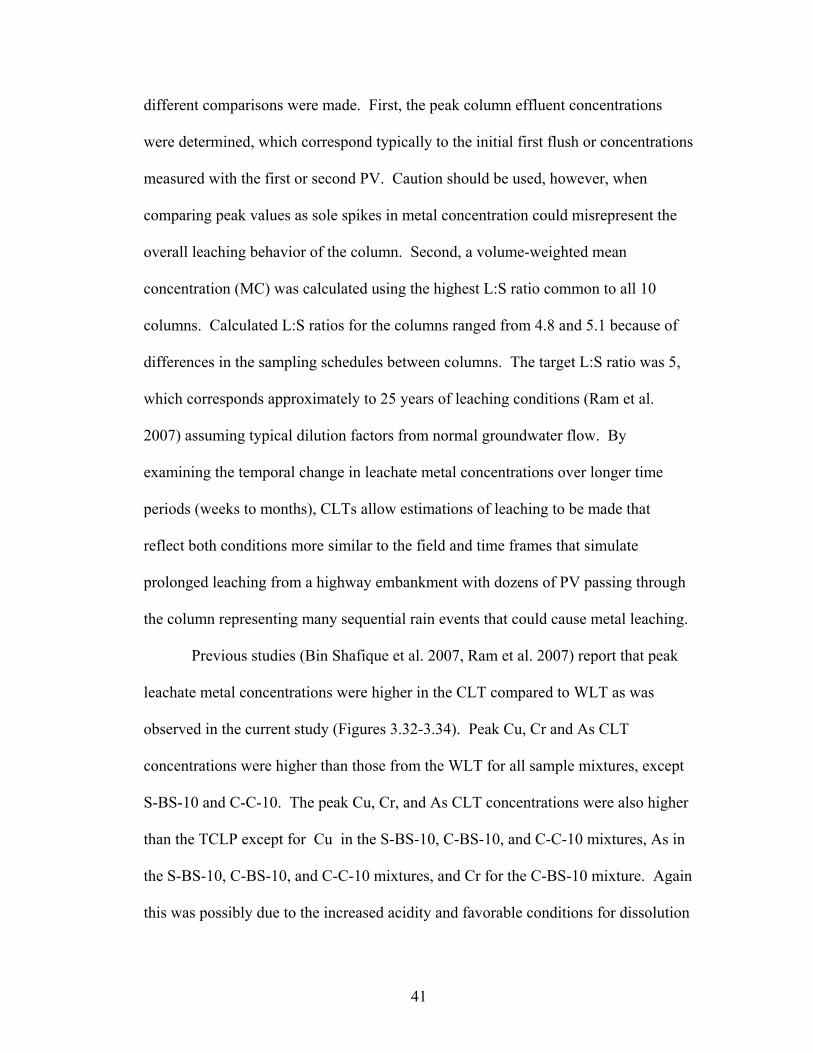
41
different comparisons were made. First, the peak column effluent concentrations
were determined, which correspond typically to the initial first flush or concentrations
measured with the first or second PV. Caution should be used, however, when
comparing peak values as sole spikes in metal concentration could misrepresent the
overall leaching behavior of the column. Second, a volume-weighted mean
concentration (MC) was calculated using the highest L:S ratio common to all 10
columns. Calculated L:S ratios for the columns ranged from 4.8 and 5.1 because of
differences in the sampling schedules between columns. The target L:S ratio was 5,
which corresponds approximately to 25 years of leaching conditions (Ram et al.
2007) assuming typical dilution factors from normal groundwater flow. By
examining the temporal change in leachate metal concentrations over longer time
periods (weeks to months), CLTs allow estimations of leaching to be made that
reflect both conditions more similar to the field and time frames that simulate
prolonged leaching from a highway embankment with dozens of PV passing through
the column representing many sequential rain events that could cause metal leaching.
Previous studies (Bin Shafique et al. 2007, Ram et al. 2007) report that peak
leachate metal concentrations were higher in the CLT compared to WLT as was
observed in the current study (Figures 3.32-3.34). Peak Cu, Cr and As CLT
concentrations were higher than those from the WLT for all sample mixtures, except
S-BS-10 and C-C-10. The peak Cu, Cr, and As CLT concentrations were also higher
than the TCLP except for Cu in the S-BS-10, C-BS-10, and C-C-10 mixtures, As in
the S-BS-10, C-BS-10, and C-C-10 mixtures, and Cr for the C-BS-10 mixture. Again
this was possibly due to the increased acidity and favorable conditions for dissolution

42
in the TCLP. The higher fixed L:S ratios (20:1 in the TCLP and WLT) found in
batch leach tests can explain the lower concentrations generally found in the leachate
of those tests. High initial concentrations of metals are also commonly found in the
first few PV from CLTs because of the lower L:S ratio at the beginning of the CLT.
However, as the saturation increases, the L:S ratio increases and concentrations
generally decrease (Jo et al. 2008). Thus, the CLT MC concentrations are generally
reduced for all metals compared to the peak concentrations, as expected given the
typical exponential decrease in leaching observed in CLTs. Based on these results, it
is expected that both test duration and L:S ratio are important parameters in
comparing the results of CLTs and batch tests, while the pH of the TCLP
distinguishes its leaching results from other testing methods.
Work done by Bin Shafique et al. (2006) and Ram et al. (2007) compared
WLT and CLT results to estimate conservative scaling factors (e.g., 10 for Cr) for
converting estimations of leachate metal concentration between WLT and CLT.
Relative leaching of the three tests performed in this research was consistent with
these other studies comparing different leaching protocols, with the fly ash and soil
composition accounting for any differences. From this work, the ratio of CLT peak
concentration to WLT concentration ranged from 3.1-5.5 for As, 1.9-12.4 for Cu, and
2.4-714 for Cr. These ratios, however, are noticeably reduced when the CLT mean
concentrations are used: 0.9-2.5 for As, 0.3-1.9 for Cu, and 0.5-60 for Cr (see Table
3.5). Figures 3.32-3.34 show that in the C fly ash and BS fly ash mixtures, the peak
CLT concentrations were 2-8 and 1-15 times the highest TCLP or WLT leachate
metal concentration, respectively. Clearly, the batch tests confirm the importance of

43
pH in metal leaching and the CLTs show how much leachate metal concentrations
can vary with time.
Table 3.6 provides estimations of leachate metal concentrations for a
theoretical 100% leaching scenario, where all metal present in the soil-fly ash mixture
is solubilized and released into the leachate. Though very unlikely to happen in the
field, the leaching predictions provide a useful frame of reference. For example, the
highest predicted As concentration for 100% leaching is 9.87 mg/kg, which is orders
of magnitude greater than the highest concentrations reported from the leach tests. A
comparison between Table 3.4 and Tables 3.6 indicate that even the highest leaching
observed is resulting from only a small portion ( <10%) of the total metal present in
the mixture becoming dissolved in solution.
The effect of extraction time and solution pH are connected to the distribution
of metals in different fractions, such as exchangeable, attached to Fe oxides, or
contained in carbonate compounds. Ram et al. (2007) describe two phases or
“compartments” where metals can accumulate within the materials: the magnetic (Cu)
phase and the non-magnetic (Cr and As) phase, which primarily involves the fly ash
particle surfaces with high dissolution capacity and is similar between both batch and
column leach tests. For example, Cr leaching was shown by Zandi and Russell
(2007) to be controlled by the amount of the metal present in the fly ash; therefore,
estimations of aqueous Cr could be made from knowledge of concentrations of metals
in the soils and fly ashes. This agrees with the near linear relationship between fly
ash content and leachate concentration in the TCLP tests of this study. As stated
before, the properties of the materials used in fly ash-soil mixtures can have a major

44
effect on the processes that contribute to overall leaching behavior, such as
precipitation, sorption, and dissolution. Wang et al. (2004) states that surface
characteristics such as surface charge, specific surface area, and metal binding
capacities govern the metal partitioning in fly ash. While some of these properties
(e.g., effective surface area) have been extensively studied, others such as metal
binding site densities and acidity constants have not been quantified. Continued
research into examining these mechanisms and properties would be useful, especially
in the development and verification of leaching models.

45
4 Practical Implications
Obviously two of the most important parameters to consider when selecting a
protocol for assessing metal leaching from fly ash are pH and the L:S ratio. While
sorption processes play an integral role in determining metal concentrations in the
leachate, large fluctuations in pH can facilitate the dissolution of metal-containing
minerals, especially under acidic conditions (Bin Shafique et al. 2007). Changes in
pH over time affect the amount of metals released into solution, but also what
precipitates and complexes are formed that affect the re-adsorption of dissolved
metals and mobility of metals in the environment. In this study, the pH
measurements in the WLTs and CLTs exhibited a larger pH range than in the TCLP
that more clearly illustrates the effect of fly ash composition on leachate pH. A
comparison of leaching protocols provided by this study highlights the importance of
pH, as well as leaching time and the L:S ratio, for understanding the larger picture for
a given fly ash mixture.
The higher L:S ratios seen in batch tests compared to CLTs can be viewed as
representative of more dilute leaching, possibly related to potential groundwater
contamination, while CLTs can simulate leaching behavior seen in the soil solution in
areas immediately close to the fly ash-soil mixtures. Thus, different leaching tests
can represent different scenarios, including the soil solution in the areas containing
the fly ash-soil mixture or estimations of concentrations of metals that might migrate
to groundwater supplies. For example, initial results from CLTs would likely
overestimate risk of leaching if regulations compare leachate concentrations to federal
drinking water standards (Jo et al. 2008).

46
While CLTs can provide more realistic leaching measurements given the more
site-specific and flow-through conditions, WLTs, on the other hand, are viewed as a
rapid method to gain reasonable estimation of metal leaching concentrations. Batch
leach tests require less time to run and a simpler experimental setup, which is why
they are typically included in regulations governing CCB disposal. These tests,
however, can misrepresent actual field conditions by having pH values or L:S ratios
not typically seen in the field. For example, the increased metal leaching found under
TCLP conditions observed for some metals and fly ash mixtures in this study
supports the statement that the TCLP leaching solution is too aggressive, while tests
like the ASTM WLT provide more a reasonable simulation of natural leaching
conditions (Baba and Kaya 2004). The WLT or CLT is preferred because their
leaching solution is more similar to the natural water that would flow through an
embankment compared to the acetic acid solution used in the TCLP to simulate
landfill leachate conditions. Additionally, the hazardous waste criteria pertaining to
heavy metal concentrations listed in the TCLP standard procedure are much less
stringent compared to the Aquatic Toxicity limits or the EPA MCLs (mg/L vis-à-vis
μg/L). For this reason, the listed concentrations do not accurately reflect the hazards
to environmental or human health.
Furthermore, the flow-through nature of CLTs compared to the static,
contained system in the TCLP and WLT provides different contact times, soil-fly ash
interactions, and L:S ratios that can alter the reactions and equilibration processes
which affect final pH and aqueous metal concentrations. Clearly, leaching in an
actual highway embankment is more accurately characterized by the downward

47
infiltration of rain or movement of surface runoff than the end-over-end tumbling
action used in the batch tests. Ram et al. (2007) states that column tests are preferred
to evaluate long-term leaching and risks to the environment/humans, but batch tests
should also be incorporated into guidelines. CLTs can be more easily adjusted to fit
certain site-specific conditions, including changes to the influent flow rate and the
physical properties of the fly ash medium such as unit weight, moisture content, and
porosity. This would allow for leaching results to be obtained that better reflect
environmental conditions in a certain area, and more accurately assess potential risks
and alternatives for CCB disposal.
Based on the results of this study and the work of others (Baba and Kaya
2004, Bin Shafique et al. 2007, Zandi and Russell 2007), a leaching test protocol was
developed, which combined batch and column tests aimed at characterizing different
aspects of leaching behavior (Figure 4.1). The proposed protocol includes
preliminary work aimed at characterizing the materials and using knowledge of field
conditions to select the test parameters. Preliminary batch leaching tests can serve as
an integral part of the testing framework to provide initial fly ash mixture
characterization and pinpoint reasonable parameters for future testing. In the first
step of the proposed protocol, the application scenario of interest is defined, and the
pertaining regulatory constraints assembled. In addition, the fly ashes and soils are
characterized in terms of their pH, total elemental analysis, and geotechnical
properties. Then batch WLTs are performed with the soil-fly ash mixtures of interest
to determine the system parameters, such as pH, and their effect on metal leaching.

48
Batch tests are used initially because they are advantageous when a large
number of fly ashes mixtures are being screened for use in actual construction. Next,
candidate fly ash-soil mixtures that result in increased leaching based on the WLTs
are selected and subjected to CLTs to evaluate the spatial and temporal evolution of
key system parameters and metal concentrations. CLTs would provide a more
detailed evaluation of long-term leaching potential for the selected mixtures. By
comparing the WLT and CLT leachate metal concentrations to applicable state and
federal water quality criteria, risks from heavy metal leaching could be gauged. The
goal of the proposed protocol is provide a flexible testing framework that attempts to
most closely simulate field leaching conditions while allowing evaluation of fly ash
mixtures under varying detail, cost, and time constraints. When a simpler approach is
needed (there is neither the time nor resources to run CLTs), the quicker WLTs could
be used and additional factors such as the L:S adjusted to be more consistent with
field conditions.
It is important that the protocols developed for the testing of CCBs be
sufficiently flexible that a variety of leaching conditions can be investigated in one
study, including area-specific factors. The testing of fly ash and other CCBs should
incorporate standardized leaching tests that provide regulators and other interested
parties with a mechanism for encouraging CCB reuse and the development of
disposal guidelines. Continued research in characterizing the leaching of fly ash-soil
mixtures is needed to better understand the leaching behavior of these materials and
the different factors that affect it. Selecting a leaching protocol that provides both
consistent and realistic predictions of metal leaching has ramifications in both the

49
protection of natural ecosystems and the costs and time required for proper fly ash
waste management and disposal.
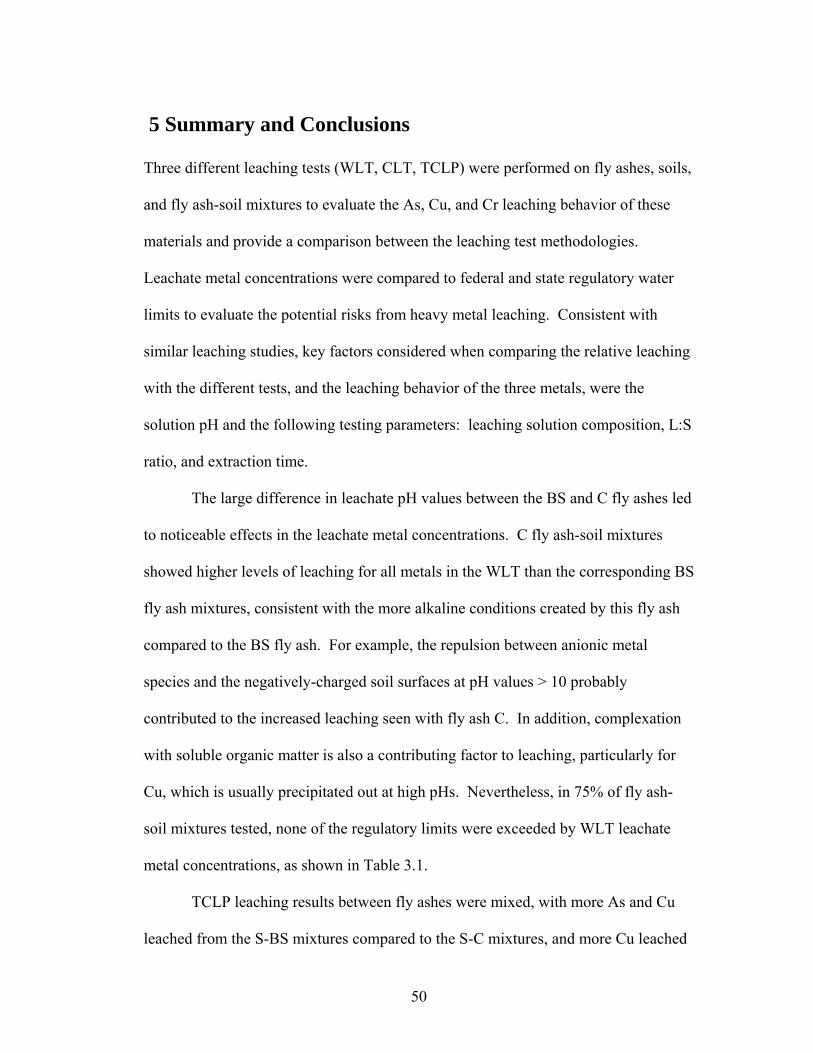
50
5 Summary and Conclusions Three different leaching tests (WLT, CLT, TCLP) were performed on fly ashes, soils,
and fly ash-soil mixtures to evaluate the As, Cu, and Cr leaching behavior of these
materials and provide a comparison between the leaching test methodologies.
Leachate metal concentrations were compared to federal and state regulatory water
limits to evaluate the potential risks from heavy metal leaching. Consistent with
similar leaching studies, key factors considered when comparing the relative leaching
with the different tests, and the leaching behavior of the three metals, were the
solution pH and the following testing parameters: leaching solution composition, L:S
ratio, and extraction time.
The large difference in leachate pH values between the BS and C fly ashes led
to noticeable effects in the leachate metal concentrations. C fly ash-soil mixtures
showed higher levels of leaching for all metals in the WLT than the corresponding BS
fly ash mixtures, consistent with the more alkaline conditions created by this fly ash
compared to the BS fly ash. For example, the repulsion between anionic metal
species and the negatively-charged soil surfaces at pH values > 10 probably
contributed to the increased leaching seen with fly ash C. In addition, complexation
with soluble organic matter is also a contributing factor to leaching, particularly for
Cu, which is usually precipitated out at high pHs. Nevertheless, in 75% of fly ash-
soil mixtures tested, none of the regulatory limits were exceeded by WLT leachate
metal concentrations, as shown in Table 3.1.
TCLP leaching results between fly ashes were mixed, with more As and Cu
leached from the S-BS mixtures compared to the S-C mixtures, and more Cu leached

51
from the C-C mixtures than the C-BS mixtures, but with similar As levels. Elevated
Cr concentrations were measured for the C fly ash mixtures compared to the BS fly
ash mixtures. TCLP metal concentrations were observed to be higher than those from
WLTs in the majority (about 60%) of mixtures. Leaching of Cr from the C fly ash
mixtures was one of the exceptions to this trend, where WLT Cr concentrations were
approximately two to three times the TCLP concentrations. Leaching of the 100% fly
ashes was also magnified under TCLP conditions compared to those found in the
WLT, with the exception of Cu for the C fly ash, consistent with increased dissolution
of minerals and solubilization of metals at low pHs.
The results of the CLT showed that the fly ash-soil mixtures typically
exhibited one of two different leaching behaviors as described by Edil et al. (1992):
first flush or lagged response. Of the fly ash–soil mixtures exhibiting the first flush
behavior, the general observed trend was an exponential decay curve, as commonly
seen in other CLT studies (Bin Shafique et al. 2007, Ram et al. 2007, Morar et al.
2010). The one exception to that trend was the arsenic concentrations for the C fly
ash mixtures, which followed the initial decrease in concentration with a recovery in
concentration. As a result of the typical first flush pattern, peak concentrations were
generally measured at the start of the test. Consequently, in 70% of the CLTs, at least
one metal was measured at the beginning of the test in concentrations above the
appropriate regulatory limit. Effluent metal concentrations, however, in 80% of the
columns tests decreased with time and stabilized around detection limits generally
after 10-20 PV. The C fly ash columns seemed to show a more prolonged release of
metal, with higher concentrations of metals measured for a longer duration of the test.

52
C fly ash mixtures also exhibited relatively constant pH values around 11.5 which
supports the smoother leaching curves obtained from the C fly ash mixtures compared
to large spikes in metal concentration seen in the BS fly ash mixtures, which also
experienced pH fluctuations. CLT pH values were slightly lower than those of the
WLTs, possibly due to the difference of contact time between solid media and
leaching solution (Bin Shafique et al. 2007). Increased contact time in the WLT
between leaching solution and solid phase mixture could allow for equilibrium to be
more closely approached, or reached.
Overall, Cu levels for the S-C and C-C mixtures and As levels for the S-C
mixture were elevated at intermediate pH (pH 7-9), and reduced at lower (pH ≈ 5)
and higher (pH ≈ 11) pH values. However, As and Cr levels with the S-BS mixture
showed an opposite trend, with reduced concentrations in the leachate at pH 7 and
elevated levels at pH ≈5 and pH ≈9. In contrast, Cr levels with the C-C mixture
exhibited a relatively flat pattern, with a gradual increase in Cr leachate concentration
as the pH increased from ≈ 5 to 11. The differences in leaching behavior for Cr as a
function of pH for mixtures S-BS and C-C were largely a result of different Cr
speciation (Cr(VI) in C fly ash and Cr(III) in BS fly ash) as well as the effect of
higher clay content of the C soil that can lead to higher leaching through repulsion
between metal ion and particle surface.
Clearly, the “leachability” of these elements is affected by many factors,
including their solubility and adsorption capacity, the composition of coal ash, and
the chemistry of the extracting water, including pH and ionic strength (Jo et al. 2008).
More data from additional testing would be useful in confirming trends and predicting

53
leaching behavior based on pH measurements. Nevertheless, these results illustrate
the significant effect that leachate pH can have on the leaching of heavy metals from
fly ash-soil mixtures. A comparison of test results across a pH range from
approximately 5-11 indicates that while leaching behavior varies by metal, under
smaller pH ranges metal concentrations from some mixtures were found to be
inversely proportional to the leachate pH (e.g., Cr leached from S-BS mixtures)
which has been concluded in other soil-fly ash leaching studies (Bin Shafique et al.
2007, Ram et al. 2007, Palumbo et al. 2007).
The L:S ratio is second most important parameter behind pH in determining
leaching behavior of heavy metals from amended soil media (Zandi and Russell,
2007). As discussed above, the majority of the CLT leaching curves exhibited first
flush behavior, with leachate metal concentrations started high and sharply decreasing
after several PV. Peak (typically initial) concentrations from the CLTs were typically
higher than those of the TCLP and WLT batch tests, which is expected given the low
L:S ratio present at start of CLTs. These CLT results are consistent with previous
studies (Bin Shafique et al. 2007, Morar et al. 2010) and indicate that although
leachate concentrations can initially exceed regulatory limits, this is observed for a
short period of the leaching test and concentrations quickly decrease. Thus, while
leachate concentrations from an embankment constructed with fly ash-amended soil
might initially be measured at or above the regulatory limits, these elevated metal
concentrations might only exist in the environment for a short period of time (i.e.,
hours to days), thereby reducing the overall risk of endangerment to aquatic and
human health.

54
Increased fly ash content generally resulted in more metal leaching, although
the rate of increase was not always uniform, nor was this trend observed in all sample
mixtures and tests. For example, for Cu in S-BS TCLP mixtures, the difference in
leachate concentrations between 10 and 20% fly ash was less compared to the initial
addition of fly ash to the 100% soils (i.e., 0 to 10% fly ash), and the increase in fly
ash content from 20% to 100%. This non-linear relationship makes simple
estimations based solely on fly ash contents difficult and likely to either over- or
underestimate actual metal concentrations in the leachate.
The test data also suggest that soil type has an importance influence on
leaching. For example, TCLP Cr and Cu metal concentrations from soil S mixtures
were 3-10 and 5-15 times higher, respectively, than the same mixtures with soil C.
Similarly, WLT concentrations of Cu and Cr sometimes measured 10-30 μg/L higher
in the soil S mixtures compared those with soil C. Soil C mixtures in the CLTs
showed similar results with lower peak levels of aqueous metals measured compared
to soil S mixtures, except for Cu in C-C-20 column. This is partly the result of
different soil properties controlling adsorption onto particles surfaces and dissolution
of minerals. The higher content of all metals in soil C, combined with lower
observed leaching suggests that adsorption onto the finer particles in soil C was likely
occurring and having a strong influence on leachate metal concentrations. Soils can
be a sink through metal adsorption or a source through dissolution depending on pH
conditions and the composition (metal content) of the other materials in the mixture,
further complicating the leaching evaluation.
In summary, the key conclusions based on these results are as follows:

55
1) There exists a nonlinear relationship between leachate pH and fly ash
content. As pH is one of the most important factors in determining metal
leaching behavior, this relationship helps to explain differences in leaching
between soil materials (C versus BS fly ash mixtures) and leaching tests
(TCLP versus WLT). Processes that determine the final leachate pH are
complex and vary both temporally and spatially within a soil column.
Simple pH and oxidation-reduction potential measurements can serve as
tools for predicting leachate metal species and their mobility and toxicity
in the environment.
2) Although increased fly ash content may produce higher leaching of
metals, the results of this study suggest that there is often a nonlinear
relationship between leachate metal concentrations and fly ash content.
For this reason, predictions of leaching based on simple dilution factors
correcting for fly ash content are often not accurate and can under-predict
actual metal concentrations (Bin Shafique et al. 2007). This potential for
error highlights the need for reliable leaching protocols that can provide
reasonable information necessary to determine risks associated with heavy
metal leaching.
3) The chemical composition of the soil and the fly ash were key factors in
determining leaching behavior by dictating the amount of available metal
ions, the dominant species, and the location of metal ions on the particles
(i.e., on the surface or embedded in mineral matrix). The distribution of
metal species depends on the type of coal burned and the conditions of

56
combustion. When comparing the results of leaching tests, it is important
to factor in higher initial metal contents in materials that exhibit increased
leaching. Materials containing high original metal contents can become
sources for dissolved metals, while materials with high adsorption
capacities can provide sinks for dissolved metals and reduced aqueous
metal concentrations.
4) There were instances in both the batch and column tests where leachate
metal concentrations exceeded the corresponding regulatory limits for all
three metals. However, caution should be exercised when applying leach
test results to the development of CCB regulations and disposal
guidelines. Batch tests do not always represent realistic field conditions
while the typically high peaks seen at the beginning of CLTs are not
representative of the long-term leaching risks.
5) Conducting CLTs with numerous samples of different soils and fly ashes
would be impractical due to the long testing time needed and high costs of
laboratory work. However, they provide useful insight into prolonged
leaching as it would more likely occur in the field. Therefore, these tests
should be included as part of a thorough investigation into leaching
potential of any fly ash mixture.
6) TCLP leaching from the 100% soil and 100% fly ash samples provided
upper and lower boundary limits for the leaching of fly ash-soil mixtures,
as observed metal concentrations typically fell between these two. This
trend was not as clearly observed in the WLTs, where levels of copper in

57
the 100% BS and C fly ashes and As in the 100% C fly ash were lower
than in the soil-fly ash mixtures. A possible explanation of this is that
precipitation and dissolution reactions can control metal concentrations
when soil is not present (i.e., 100% fly ash samples). Soils provide an
abundance of organic and inorganic ligands for complexation and
precipitation and can increase soluble metal fractions.
7) Batch leach tests have an important role in the characterization of leaching
behavior due to their short test duration, simple procedure, and relatively
low costs. Efforts, however, should be taken to adjust test parameters to
more reasonable values that better simulate the field. These adjustments
could include reducing the L:S ratio to more accurately reflect average
porosity and hydraulic conductivities in the constructed embankment or
highway or changing the leaching solution used. Depending on the
composition of the soils used, pH values could be adjusted to simulate a
large carbonate content or the ionic strength increased to model
groundwaters with a high salt content.

58
Tables and Figures

59
Table 2.1: Total elemental analysis results conducted on soils and fly ashes by University of Wisconsin Soil Testing and Plant Analysis Laboratories. All concentrations are reported as mg/kg dry weight except when stated otherwise.
Material P
(%) K
(%) Ca (%)
Mg (%)
S (%) Zn B Mn Fe Cu Al Na
BS FA 0.04 0.37 0.22 0.10 0.08 53.9 21.3 33.9 6400 59.6 21300 539 C FA 0.16 0.25 14.4 2.41 0.81 92.2 600 91.6 24400 189 91800 11200 Soil C 0.04 0.27 0.06 0.19 0.01 58.2 3.25 220 42200 27.2 49400 75 Soil S 0.02 0.05 0.03 0.04 0.01 15.0 2.86 38.2 10800 1.28 28800 33 Material Cd Co Cr Mo Ni Pb Li As V Ag Sb Tl BS FA 0.42 20.9 49.5 11.7 21.3 23.0 35.7 24.2 78.8 0.001 0.05 <0.001C FA 1.14 19.5 64.6 4.54 2.31 15.8 38.7 15.0 187 <0.001 0.06 <0.001Soil C <0.4 13.1 65.9 0.79 13.1 10.1 19.3 6.30 116 <0.001 0.02 <0.001Soil S <0.4 4.62 15.5 <0.4 <0.3 <2 4.02 <3 16.5 <0.001 0.02 <0.001

60
Table 2.2: Select chemical and physical properties of soils and fly ashes
Material pH Loss on Ignition
Classification Atterberg
Limits Specific Gravity
Soil S 7.99 8.6% SP-SC (poorly graded sand with silt)2
N/A 2.6
Soil C 6.07 7.1% SW-SC (well graded sand with clay & gravel)2
37/213 2.8
BS Fly Ash 4.98 5.5% Off-spec1 N/A 2.3 C Fly Ash 12.11 0.4% Class C1 N/A 2.7
Notes: 1ASTM C816 classification; 2USCS classification; 3liquid limit/plastic limit Table 2.3: Soil-fly ash mixture labels used in this study
Mixture Label Fly Ash Soil % Fly Ash by Weight
S-BS-10 Brandon Shores Soil S 10 S-BS-20 Brandon Shores Soil S 20 S-C-10 Columbia Soil S 10 S-C-20 Columbia Soil S 20
C-BS-10 Brandon Shores Soil C 10 C-BS-20 Brandon Shores Soil C 20 C-C-10 Columbia Soil C 10 C-C-20 Columbia Soil C 20 BS FA Brandon Shores None 100 C FA Columbia None 100 Soil S None Soil S 0 Soil C None Soil C 0
Table 2.4: Properties of soil-fly ash mixtures obtained from preliminary compaction testing. This information was used in the setup of column leach tests to select compaction specifications of specimens.
Mixture Optimum Moisture
Content (%)
Dry Unit Weight (kN/m3)
Pore Volume
(mL) S-BS-10 9 19.33 577 S-BS-20 11 18.65 622 S-C-10 11 18.94 643 S-C-20 13 18.79 665 Soil S 11 13.42 1171 C-BS-20 16 16.27 953 C-C-20 11 18.65 622

61
Table 3.1: pH measurements and concentrations of leachate Cu, Cr, and As from Water Leach Tests on soils, fly ashes, and soil-fly ash mixtures. EPA MCLs and Maryland freshwater Aquatic Toxicity limits are provided for comparison. Concentrations are averages of 4 replicates for fly ash-soil mixtures, 3 replicates for fly ash, and 2 replicates for soil.
Metal Concentration (μg/L)
Soil Fly Ash Fly Ash
Content (%) Leachate
pH Cu Cr As 10 11.6 7.6 57 0.90
Columbia 20 11.6 4.4 66 0.64 10 6.7 1.7 <0.35 0.29
Soil S Brandon Shores
20 6.0 3.9 <0.35 0.72 10 11.3 12 69 1.2
Columbia 20 11.5 14 100 0.63 10 6.2 1.9 1.4 0.40
Soil C Brandon Shores
20 6.6 3.9 1.2 0.38 Soil S None 0 5.8 1.4 0.90 <0.22 Soil C None 0 8.7 2.6 0.36 <0.22
Columbia 100 11.9 2.0 45 0.35 None
Brandon Shores 100 8.8 2.6 2.8 23 U.S. EPA Drinking Water MCL 1300 100 10
Maryland State Aquatic Toxicity Acute Limits 13 570/16* 340 Maryland State Aquatic Toxicity Chronic Limits 9 74/11* 150
*regulation limits for chromium given as [Cr III]/[Cr VI]

62
Table 3.2: pH measurements and concentrations of leachate Cu, Cr, and As from Toxicity Characteristic Leaching Procedure Tests on soils, fly ashes, and soil-fly ash mixtures. EPA MCLs and Maryland freshwater Aquatic Toxicity limits are provided for comparison. Concentrations are averages of 4 replicates for fly ash-soil mixtures, 3 replicates for fly ash, and 2 replicates for soil.
Metal Concentration (μg/L)
Soil Fly Ash Fly Ash
Content (%) Leachate
pH Cu Cr As 10 5.2 11 20 <.49
Columbia 20 5.5 5.3 30 1.3 10 4.9 29 8.0 1.0
Sandy Brandon Shores
20 4.8 26 17 3.0 10 5.2 7.6 25 <.49
Columbia 20 5.5 7.3 54 <.49 10 4.8 1.8 2.5 1.1
Clayey Brandon Shores
20 4.8 4.7 7.3 0.49 Sandy None 0 4.8 <1.4 <1.8 <.49 Clayey None 0 4.8 <1.4 <1.8 1.7
Columbia 100 6.3 <1.4 140 30 None
Brandon Shores 100 4.9 93 45 85 U.S. EPA Drinking Water MCL 1300 100 10
Maryland State Aquatic Toxicity Acute Limits 13 570/16* 340 Maryland State Aquatic Toxicity Chronic Limits 9 74/11* 150
*regulation limits for chromium given as [Cr III]/[Cr VI]

63
Table 3.3: pH measurements and Cu, Cr, and As leachate concentrations for buffered water leach tests. The water leach test procedure was performed twice for each mixture using each of the two buffers used (BES and CAPSO). Concentrations are reported as μg/L. Concentrations below detection limit for Cr (0.35 μg/L) and As (0.22 μg/L) are reported as ½ of the detection limit.
Mixture Buffer pH [Cu] [Cr] [As]
S-BS-10 1 BES 6.99 42.9 0.175 0.634 S-BS-10 2 BES 6.99 41.8 0.175 0.253 S-BS-10 3 CAPSO 9.01 1.23 1.74 4.79 S-BS-10 4 CAPSO 9.00 3.19 6.23 4.31 S-C-10 1 BES 7.23 66.5 22.3 2.66 S-C-10 2 BES 7.20 63.4 10.8 2.31 S-C-10 3 CAPSO 9.29 50.7 54.3 2.89 S-C-10 4 CAPSO 9.28 49.6 52.3 2.81 S-BS-20 1 BES 6.95 47.0 0.175 1.77 S-BS-20 2 BES 6.97 46.1 0.175 1.69 S-BS-20 3 CAPSO 9.09 2.50 3.43 8.94 S-BS-20 4 CAPSO 9.11 5.46 3.86 14.6 S-C-20 1 BES 7.34 78.9 29.0 8.84 S-C-20 2 BES 7.32 79.2 29.2 10.0 S-C-20 3 CAPSO 9.46 87.0 19.8 3.57 S-C-20 4 CAPSO 9.44 81.2 21.3 4.79 C-C-10 1 BES 7.24 55.2 33.8 0.438 C-C-10 2 BES 7.25 53.2 31.4 0.308 C-C-10 3 CAPSO 9.35 53.5 73.8 0.467 C-C-10 4 CAPSO 9.31 55.3 76.7 0.333 C-C-20 1 BES 7.44 28.0 54.0 0.789 C-C-20 2 BES 7.42 25.2 50.3 1.19 C-C-20 3 CAPSO 9.45 64.4 112 0.498 C-C-20 4 CAPSO 9.49 72.1 117 0.762 C-BS-10 1 BES 7.06 31.6 1.67 0.110 C-BS-10 2 BES 7.05 12.3 1.31 0.110 C-BS-10 3 CAPSO 8.77 2.00 4.68 0.359 C-BS-10 4 CAPSO 8.77 2.74 4.50 0.518 C-BS-20 1 BES 7.04 27.4 1.71 0.110 C-BS-20 2 BES 7.03 24.4 1.57 0.110 C-BS-20 3 CAPSO 8.81 2.61 6.05 0.756 C-BS-20 4 CAPSO 8.79 2.64 7.35 1.07

64
Table 3.4: Comparison of leaching results from all three leaching tests conducted. Column leach test peak concentration is the highest measured concentration throughout the testing period. Column leach test MC concentrations are calculated based on a liquid-to-solid ratio of 5 and represent a volume-weighted average concentration. Concentrations are all reported as μg/L. N/A listed for the column leach tests indicate that that specific mixture was not tested using the CLT methodology.
TCLP WLT CLT - Peak Conc. CLT - L:S Ratio MC Mixture Cu As Cr Cu As Cr Cu As Cr Cu As Cr Soil S <1.4 <.49 <1.8 1.4 <.22 0.90 12 0.62 160 1.7 0.28 9.9 S-BS-10 29 1.0 8.0 1.7 0.29 <.35 21 0.89 67 1.6 0.26 8.4 S-BS-20 26 3.0 17 3.9 0.72 <.35 12 3.1 250 1.3 0.97 21 S-C-10 11 <.49 20 7.6 0.9 57 83 3.8 290 7.5 1.9 44 S-C-20 5.3 1.3 30 4.4 0.64 66 35 3.5 270 5.5 1.6 36 Soils C <1.4 1.7 <1.8 2.6 <.22 0.36 N/A N/A N/A N/A N/A N/A C-BS-10 1.8 1.1 2.5 1.9 0.4 1.4 N/A N/A N/A N/A N/A N/A C-BS-20 4.7 0.49 7.3 3.9 0.38 1.2 7.6 1.7 20 1.5 0.45 1.1 C-C-10 7.6 <.49 25 12 1.2 69 N/A N/A N/A N/A N/A N/A C-C-20 7.6 <.49 54 14 0.63 100 110 2.0 240 26 1.4 88 C FA <1.4 30 140 2 0.35 45 N/A N/A N/A N/A N/A N/A
BS FA 93 85 45 2.6 23 2.8 N/A N/A N/A N/A N/A N/A

65
Table 3.5: Estimated scaling factors based on ratio of column leach test metal concentrations to water leach test metal concentrations. Part (a) uses peak column leach test concentrations while part (b) uses the volume-weighted average concentration up to a liquid-to-solid ratio of 5:1. An asterisk indicates that the scaling factor for Cr is based on a water leach test concentration of 0.35 μg/L since measured concentrations for these mixtures were below this detection limit.
(a) Peak CLT Mixture Cr Cu As
S-BS-10* 191 12.4 3.1 S-BS-20* 714 3.1 4.3 S-C-10 5.1 10.9 4.2 S-C-20 4.1 8.0 5.5 C-BS-20 16.7 1.9 4.5 C-C-20 2.4 7.9 3.2 (b) Mean CLT
Mixture Cr Cu As S-BS-10* 24.0 0.9 0.9 S-BS-20* 60.0 0.3 1.3 S-C-10 0.8 1.0 2.1 S-C-20 0.5 1.3 2.5 C-BS-20 0.9 0.4 1.2 C-C-20 0.9 1.9 2.2

66
Table 3.6: Leachate metal concentrations representing a 100% leaching scenario based on a mass-weighted average of original material metal content. Concentrations are reported in mg/kg dry weight.
Mixture Maximum [Cu] Maximum [Cr] Maximum [As] S-BS-10 7.12 18.9 5.12 S-BS-20 13.0 22.3 7.23 S-C-10 20.0 20.4 4.20 S-C-20 38.7 25.3 5.40 C-BS-10 30.4 64.3 8.09 C-BS-20 33.7 62.7 9.87 C-C-10 43.3 65.8 7.17 C-C-20 59.4 65.7 8.04

67
Figure 2.1: Schematic of experimental setup for column leach test.

68
0
5
10
15
20
25
0 10 20 30 40 50 60 70
Pore Volumes
Dis
solv
ed C
op
per
(u
g/L
)
0
1
2
3
4
5
6
7
8
pH
S-BS-10 S-BS-20 S-BS-10 pH S-BS-20 pH Influent pH
0
5
10
15
20
25
0 10 20 30 40 50 60 70 80
Pore Volumes
Dis
solv
ed C
op
per
(u
g/L
)
0
1
2
3
4
5
6
7
8
pH
S-BS-10 S-BS-20 S-BS-10 pH S-BS-20 pH Influent pH
Figure 3.1: Copper leachate concentrations from: (a) the 1st set of column leach test S-BS mixtures, and (b) the 2nd set of column leach test S-BS mixtures. Each symbol represents the average of two sample replicate metal measurements. Concentrations < 1.0 μg/L were reported as ½ of the detection limit. Dashed lines represent Aquatic Toxicity limit of 9 μg/L.
(a)
(b)

69
0
1
2
3
4
5
6
7
8
0 5 10 15 20 25 30 35 40 45
Pore Volumes
Dis
solv
ed C
op
per
(u
g/L
)
0
1
2
3
4
5
6
7
8
pH
C-BS-20 #1 C-BS-20 #2 C-BS-20 1 pH C-BS-20 2 pH Influent pH
Figure 3.2: Copper leachate concentrations from column leach test C-BS mixtures. Each symbol represents the average of two sample replicate metal measurements. Concentrations < 1.0 μg/L were reported as ½ of the detection limit.

70
0
10
20
30
40
50
60
70
80
90
0 5 10 15 20 25 30 35 40 45
Pore Volumes
Dis
solv
ed C
op
per
(u
g/L
)
0
2
4
6
8
10
12
14
pH
S-C-10 S-C-20 S-C-10 pH S-C-20 pH Influent pH
Figure 3.3: Copper leachate concentrations from the column leach test S-C mixtures. Each symbol represents the average of two sample replicate metal measurements. Concentrations < 1.0 μg/L were reported as ½ of the detection limit. Dashed line represents Aquatic Toxicity limit of 9 μg/L.

71
0
50
100
150
200
250
0 10 20 30 40 50 60 70
Pore Volumes
Dis
solv
ed C
r an
d C
u (
ug
/L)
0
0.5
1
1.5
2
2.5
Dis
solv
ed A
rsen
ic (
ug
/L)
Copper Chromium Arsenic
Figure 3.4: Copper, chromium, and arsenic leachate concentrations from column leach test C-C-20 mixture. Each symbol represents the average of two sample replicate metal measurements. The regulatory limits were 100 μg/L for Cr, 9 μg/L for Cu, and 10 μg/L for As.

72
0
20
40
60
80
100
120
140
160
180
0 5 10 15 20 25 30
Pore Volumes
Dis
solv
ed C
r an
d C
u (
ug
/L)
0
0.1
0.2
0.3
0.4
0.5
0.6
0.7
Dis
solv
ed A
s (u
g/L
)
Copper Chromium Arsenic
Figure 3.5: Copper, chromium, and arsenic leachate concentrations from column leach test 100% soil S mixture. Each symbol represents the average of two sample replicate metal measurements. The regulatory limits were 100 μg/L for Cr, 9 μg/L for Cu, and 10 μg/L for As.

73
0
5
10
15
20
25
0 10 20 30 40 50 60 70 80 90 100 110
Fly Ash Content (%)
Lea
chat
e M
etal
Co
nce
ntr
atio
n (
ug
/L)
Copper Arsenic Chromium
Figure 3.6: Effect of fly ash content on leachate metal concentrations for water leach test S-BS mixtures. Total estimated metal concentrations from 100% leaching scenario based on original material metal contents for S-BS-10 mixture are 7.12, 18.9, and 5.12 μg/L and for the S-BS-20 mixture are 13.0, 22.3, and 7.23 μg/L for Cu, Cr, and As, respectively.

74
0
5
10
15
20
25
0 10 20 30 40 50 60 70 80 90 100 110
Fly Ash Content (%)
Le
ac
ha
te M
eta
l Co
nc
en
tra
tio
n (
ug
/L)
Copper Arsenic Chromium
Figure 3.7: Effect of fly ash content on leachate metal concentrations for water leach test C-BS mixtures. Total estimated metal concentrations from 100% leaching scenario based on original material metal contents for C-BS-10 mixture are 30.4, 64.3, and 8.09 μg/L and for the C-BS-20 mixture are 33.7, 62.7, and 9.87 μg/L for Cu, Cr, and As, respectively.

75
0
10
20
30
40
50
60
70
0 10 20 30 40 50 60 70 80 90 100 110
Fly Ash Content (%)
Lea
chat
e M
etal
Co
nce
ntr
atio
n (
ug
/L)
Copper Arsenic Chromium
Figure 3.8: Effect of fly ash content on leachate metal concentrations for water leach test S-C mixtures. Total estimated metal concentrations from 100% leaching scenario based on original material metal contents for S-C-10 mixture are 20.0, 20.4, and 4.20 μg/L and for the S-C-20 mixture are 38.7, 25.3, and 5.40 μg/L for Cu, Cr, and As, respectively.

76
0
20
40
60
80
100
120
0 20 40 60 80 100 120
Fly Ash Content (%)
Lea
chat
e M
etal
Co
nce
ntr
atio
n (
ug
/L)
Copper Arsenic Chromium
Figure 3.9: Effect of fly ash content on leachate metal concentrations for water leach test C-C mixtures. Total estimated metal concentrations from 100% leaching scenario based on original material metal contents for C-C-10 mixture are 43.3, 65.8, and 7.17 μg/L and for the C-C-20 mixture are 59.4, 65.7, and 8.04 μg/L for Cu, Cr, and As, respectively.

77
0
10
20
30
40
50
60
70
80
90
100
0 10 20 30 40 50 60 70 80 90 100 110
Fly Ash Content (%)
Lea
chat
e M
etal
Co
nce
ntr
atio
n (
ug
/L)
Copper Arsenic Chromium
Figure 3.10: Effect of fly ash content on leachate metal concentrations for Toxicity Characteristic Leaching Procedure S-BS mixtures. Total estimated metal concentrations from 100% leaching scenario based on original material metal contents for S-BS-10 mixture are 7.12, 18.9, and 5.12 μg/L and for the S-BS-20 mixture are 13.0, 22.3, and 7.23 μg/L for Cu, Cr, and As, respectively.
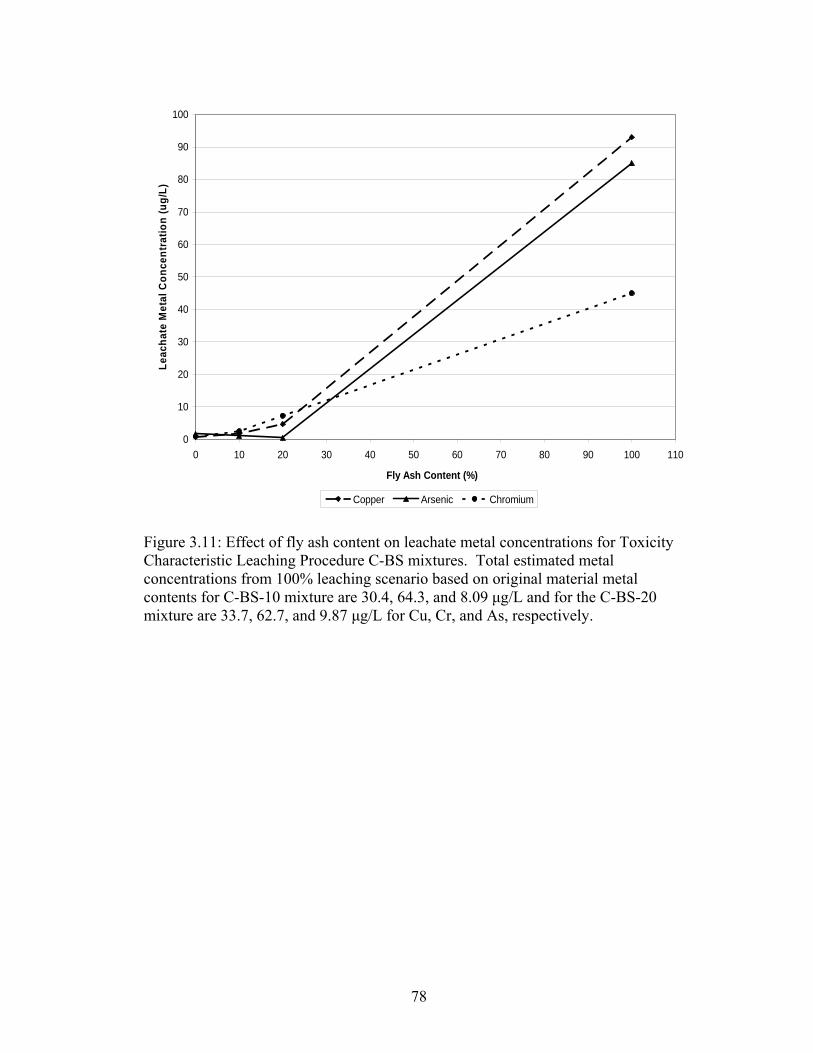
78
0
10
20
30
40
50
60
70
80
90
100
0 10 20 30 40 50 60 70 80 90 100 110
Fly Ash Content (%)
Lea
chat
e M
etal
Co
nce
ntr
atio
n (
ug
/L)
Copper Arsenic Chromium
Figure 3.11: Effect of fly ash content on leachate metal concentrations for Toxicity Characteristic Leaching Procedure C-BS mixtures. Total estimated metal concentrations from 100% leaching scenario based on original material metal contents for C-BS-10 mixture are 30.4, 64.3, and 8.09 μg/L and for the C-BS-20 mixture are 33.7, 62.7, and 9.87 μg/L for Cu, Cr, and As, respectively.

79
0
20
40
60
80
100
120
140
160
0 20 40 60 80 100 120
Fly Ash Content (%)
Lea
chat
e M
etal
Co
nce
ntr
atio
n (
ug
/L)
Copper Arsenic Chromium
Figure 3.12: Effect of fly ash content on leachate metal concentrations for Toxicity Characteristic Leaching Procedure S-C mixtures. Total estimated metal concentrations from 100% leaching scenario based on original material metal contents for S-C-10 mixture are 20.0, 20.4, and 4.20 μg/L and for the S-C-20 mixture are 38.7, 25.3, and 5.40 μg/L for Cu, Cr, and As, respectively.

80
0
20
40
60
80
100
120
140
160
0 20 40 60 80 100 120
Fly Ash Content (%)
Le
ac
ha
te M
eta
l Co
nc
en
tra
tio
n (
ug
/L)
Copper Arsenic Chromium
Figure 3.13: Effect of fly ash content on leachate metal concentrations for Toxicity Characteristic Leaching Procedure C-C mixtures. Total estimated metal concentrations from 100% leaching scenario based on original material metal contents for C-C-10 mixture are 43.3, 65.8, and 7.17 μg/L and for the C-C-20 mixture are 59.4, 65.7, and 8.04 μg/L for Cu, Cr, and As, respectively.

81
0
10
20
30
40
50
60
70
80
90
100
2 3 4 5 6 7 8 9 10 11 12
pH
Pe
rce
nt
of
tota
l C
u I
I
Cu(OH)2 (aq) Cu(OH)3- Cu(OH)4-2 Cu+2
Cu2(OH)2+2 Cu3(OH)4+2 CuOH+
Figure 3.14: Effect of pH on Cu(II) species distribution. Relative distribution of species determined from Visual Minteq program with a fixed ionic strength of 0.02 and a total Cu(II) concentration of 1 mg/L. Notice the rise in dominance of the neutral and then anionic forms of Cu as the pH increases.

82
1
10
100
4 5 6 7 8 9 10 11 12 13
pH
Dis
solv
ed C
op
per
(u
g/L
)
S-C-10 WLT S-C-20 WLT S-C-10 TCLP S-C-20 TCLP
Figure 3.15: Effect of pH on leachate copper concentrations for S-C mixtures. Both water leach test and Toxicity Characteristic Leaching Procedure data are presented. Lower concentrations around pH 11.5 could reflect precipitation likely under alkaline conditions, while higher concentrations measured around neutral pH suggest complexation with soil organic matter could maintain soluble metal in the leachate.

83
1
10
100
4 5 6 7 8 9 10 11 12
pH
Dis
solv
ed C
op
per
(u
g/L
)
C-C-10 WLT C-C-20 WLT C-C-10 TCLP C-C-20 TCLP
Figure 3.16: Effect of pH on leachate copper concentrations for C-C mixtures. Both water leach test and Toxicity Characteristic Leaching Procedure data are presented. Soil organic matter is likely responsible for the higher leachate concentrations measured around pH 7-8 through complexation processes.

84
0.0
0.5
1.0
1.5
2.0
2.5
3.0
3.5
0 10 20 30 40 50 60 70
Pore Volumes
Dis
solv
ed A
rsen
ic (
ug
/L)
0
1
2
3
4
5
6
7
8
pH
S-BS-10 S-BS-20 S-BS-10 pH S-BS-20 pH Influent pH
0.0
0.5
1.0
1.5
2.0
2.5
3.0
3.5
0 10 20 30 40 50 60 70 80
Pore Volumes
Dis
solv
ed A
rsen
ic (
ug
/L)
0
1
2
3
4
5
6
7
8
pH
S-BS-10 S-BS-20 S-BS-10 pH S-BS-20 pH Influent pH Figure 3.17: Arsenic leachate concentrations from: (a) the 1st set of column leach test S-BS mixtures, and (b) the 2nd set of column leach test S-BS mixtures. Each symbol represents the average of two sample replicate metal measurements. Concentrations < 0.22 ug/L were reported as ½ of the detection limit.
(a)
(b)

85
0
0.5
1
1.5
2
2.5
3
3.5
4
0 5 10 15 20 25 30 35 40 45
Pore Volumes
Dis
solv
ed A
rsen
ic (
ug
/L)
0
2
4
6
8
10
12
14
pH
S-C-10 S-C-20 S-C-10 pH S-C-20 pH Influent pH
Figure 3.18: Arsenic leachate concentrations from column leach test S-C mixtures. Each symbol represents the average of two sample replicate metal measurements. Concentrations < 0.22 μg/L were reported as ½ of the detection limit.

86
0.0
0.2
0.4
0.6
0.8
1.0
1.2
1.4
1.6
1.8
0 5 10 15 20 25 30 35 40 45
Pore Volumes
Dis
solv
ed A
rsen
ic (
ug
/L)
0
1
2
3
4
5
6
7
8
pH
C-BS-20 #1 C-BS-20 #2 C-BS-20 1 pH C-BS-20 2 pH Influent pH
Figure 3.19: Arsenic leachate concentrations from column leach test C-BS mixtures. Each symbol represents the average of two sample replicate metal measurements. Concentrations < 0.22 μg/L were reported as ½ of the detection limit.

87
0
10
20
30
40
50
60
70
80
90
100
2 3 4 5 6 7 8 9 10 11 12
pH
Per
cen
t o
f to
tal A
s V
AsO4-3 H2AsO4- H3AsO4 HAsO4-2
Figure 3.20: Effect of pH on As(V) species distribution. Relative distribution of species determined from Visual Minteq program with a fixed ionic strength of 0.02 and a total As(V) concentration of 1 mg/L.
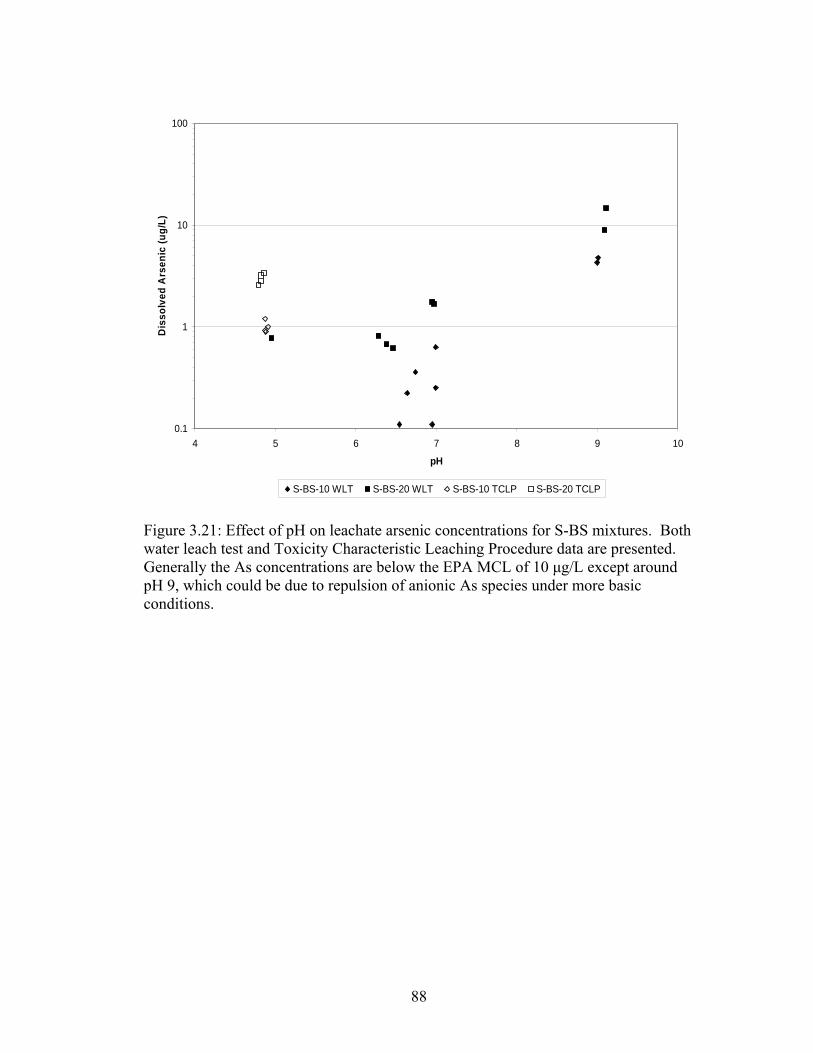
88
0.1
1
10
100
4 5 6 7 8 9 10
pH
Dis
so
lve
d A
rse
nic
(u
g/L
)
S-BS-10 WLT S-BS-20 WLT S-BS-10 TCLP S-BS-20 TCLP
Figure 3.21: Effect of pH on leachate arsenic concentrations for S-BS mixtures. Both water leach test and Toxicity Characteristic Leaching Procedure data are presented. Generally the As concentrations are below the EPA MCL of 10 μg/L except around pH 9, which could be due to repulsion of anionic As species under more basic conditions.

89
0.1
1
10
4 5 6 7 8 9 10 11 12 13
pH
Dis
solv
ed A
rsen
ic (
ug
/L)
S-C-10 WLT S-C-20 WLT S-C-10 TCLP S-C-20 TCLP
Figure 3.22: Effect of pH on arsenic concentrations for S-C mixtures. Both water leach test and Toxicity Characteristic Leaching Procedure data are presented. Anionic repulsion could result in the higher concentrations seen in the pH range of 7-10. Highly alkaline conditions could cause the precipitation of As, leading to lower levels in the leachate as seen on the right side of the figure.

90
0
50
100
150
200
250
300
0 10 20 30 40 50 60 70
Pore Volumes
Dis
solv
ed C
hro
miu
m (
ug
/L)
0
1
2
3
4
5
6
7
8
pH
S-BS-10 S-BS-20 S-BS-10 pH S-BS-20 pH Influent pH
0
5
10
15
20
25
30
35
40
0 10 20 30 40 50 60 70 80
Pore Volumes
Dis
solv
ed C
hro
miu
m (
ug
/L)
0
1
2
3
4
5
6
7
8
pH
S-BS-10 S-BS-20 S-BS-10 pH S-BS-20 pH Influent pH Figure 3.23: Chromium leachate concentrations from: (a) the 1st set of column leach test S-BS mixtures, and (b) the 2nd set of column leach test S-BS mixtures. Each symbol represents the average of two sample replicate metal measurements. Concentrations < 0.35 μg/L were reported as ½ of the detection limit. Dashed line represents EPA MCL of 100 μg/L.
(a)
(b)

91
0
5
10
15
20
25
0 5 10 15 20 25 30 35 40 45
Pore Volumes
Dis
solv
ed C
hro
miu
m (
ug
/L)
0
1
2
3
4
5
6
7
8
pH
C-BS-20 #1 C-BS-20 #2 C-BS-20 1 pH C-BS-20 2 pH Influent pH
Figure 3.24: Chromium leachate concentrations from column leach test C-BS mixtures. Each symbol represents the average of two sample replicate metal measurements. Concentrations < 0.35 μg/L were reported as ½ of the detection limit.
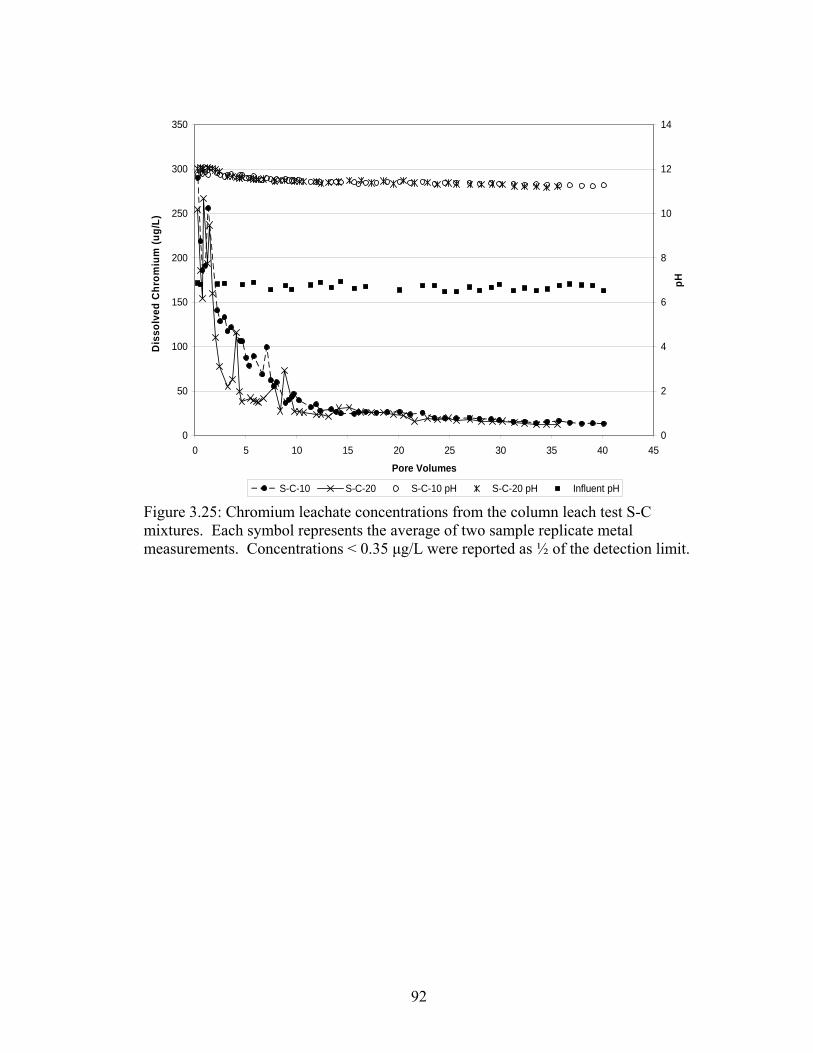
92
0
50
100
150
200
250
300
350
0 5 10 15 20 25 30 35 40 45
Pore Volumes
Dis
solv
ed C
hro
miu
m (
ug
/L)
0
2
4
6
8
10
12
14
pH
S-C-10 S-C-20 S-C-10 pH S-C-20 pH Influent pH
Figure 3.25: Chromium leachate concentrations from the column leach test S-C mixtures. Each symbol represents the average of two sample replicate metal measurements. Concentrations < 0.35 μg/L were reported as ½ of the detection limit.

93
0
10
20
30
40
50
60
70
80
90
100
2 3 4 5 6 7 8 9 10 11 12
pH
Per
cen
t o
f to
tal C
r III
Cr(OH)2+1 Cr(OH)3 (aq) Cr(OH)4- Cr+3 CrOH+2
Figure 3.26: Effect of pH on Cr(III) species distribution. Relative distribution of species determined from Visual Minteq program with a fixed ionic strength of 0.02 and a total Cr(III) concentration of 1 mg/L. As the pH increased from 2 to 12, the dominant Cr(III) species changes from Cr+3 to Cr(OH)4-.

94
1
10
100
1000
4 5 6 7 8 9 10 11 12
pH
Dis
solv
ed C
hro
miu
m (
ug
/L)
C-C-10 WLT C-C-20 WLT C-C-10 TCLP C-C-20 TCLP
Figure 3.27: Effect of pH on leachate chromium concentrations for C-C mixtures. Both water leach test and Toxicity Characteristic Leaching Procedure data are presented. Note the concentrations are within the same order of magnitude over a wide pH range from 5-10 and begin to approach and exceed the EPA MCL of 100 μg/L at pH values above 9.

95
0.1
1
10
100
4 5 6 7 8 9 10
pH
Dis
solv
ed C
hro
miu
m (
ug
/L)
S-BS-10 WLT S-BS-20 WLT S-BS-10 TCLP S-BS-20 TCLP
Figure 3.28: Effect of pH on leachate chromium concentrations for S-BS mixtures. Both water leach test and Toxicity Characteristic Leaching Procedure data are presented. The increased leaching of Cr at more acidic pH values (~5) and more alkaline pH values (~9) is similar to the solubility of Cr(III).

96
0
10
20
30
40
50
60
70
80
90
100
2 3 4 5 6 7 8 9 10 11 12
pH
Per
cen
t o
f to
tal C
r V
I
H2CrO4 (aq) Cr2O7-2 HCrO4- CrO4-2
Figure 3.29: Effect of pH on Cr(VI) species distribution. Relative distribution of species determined from Visual Minteq program with a fixed ionic strength of 0.02 and a total Cr(VI) concentration of 1 mg/L. In the pH range of 2-12, the dominant Cr(VI) species are anionic, which contributes to high solubility of Cr(VI) over a wide pH range.

97
0.0
0.2
0.4
0.6
0.8
1.0
1.2
1.4
1.6
-0.50 0.00 0.50 1.00 1.50 2.00 2.50 3.00
Pore Volumes
C/C
o
0
20
40
60
80
100
120
140
160
180
200
-500 0 500 1000 1500 2000 2500 3000
Total Volume (mL)
Br
Co
nce
ntr
atio
n(m
g/L
)
S-BS-10 S-BS-20 S-C-10 S-C-20 Soil S Influent
NaBr solution started
Figure 3.30: Breakthrough Curves from Tracer Study for 1st Set of Column Leach Tests. Influent bromide solution was 100 mg/L using NaBr. Negative numbers indicate conditions before switch to bromide step input.

98
0.0
0.2
0.4
0.6
0.8
1.0
1.2
1.4
1.6
-0.50 0.00 0.50 1.00 1.50 2.00 2.50 3.00 3.50
Pore Volumes
C/C
o
0
50
100
150
200
250
300
350
-300 0 300 600 900 1200 1500 1800 2100
Total Volume (mL)
Br
Co
nce
ntr
atio
n (
mg
/L)
S-BS-10 S-BS-20 C-BS-20 #1 C-BS-20 #2 C-C-20 Influent
NaBr solution started
Figure 3.31: Breakthrough Curves from Tracer Study for 2nd Set of Column Leach Tests. Influent bromide solution was 250 mg/L using NaBr. Negative numbers indicate conditions before switch to bromide step input.

99
0
20
40
60
80
100
120
S-BS-10 S-BS-20 S-C-10 S-C-20 C-BS-10 C-BS-20 C-C-10 C-C-20
Mixture
Dis
solv
ed C
op
per
(u
g/L
)
TCLP WLT CLT Peak CLT MC
Figure 3.32: Comparison of copper leaching from water leach test, column leach test, and Toxicity Characteristic Leaching Procedure samples. C-BS-10 and C-C-10 mixtures were not tested using CLT methodology so no CLT data are reported in figure. Concentrations below detection limit are displayed as 0.

100
0.0
0.5
1.0
1.5
2.0
2.5
3.0
3.5
4.0
S-BS-10 S-BS-20 S-C-10 S-C-20 C-BS-10 C-BS-20 C-C-10 C-C-20
Mixture
Dis
solv
ed A
rsen
ic (
ug
/L)
TCLP WLT CLT Peak CLT MC
Figure 3.33: Comparison of arsenic leaching from water leach test, column leach test, and Toxicity Characteristic Leaching Procedure samples. C-BS-10 and C-C-10 mixtures were not tested using CLT methodology so no CLT data are reported in figure. Concentrations below detection limit are displayed as 0.
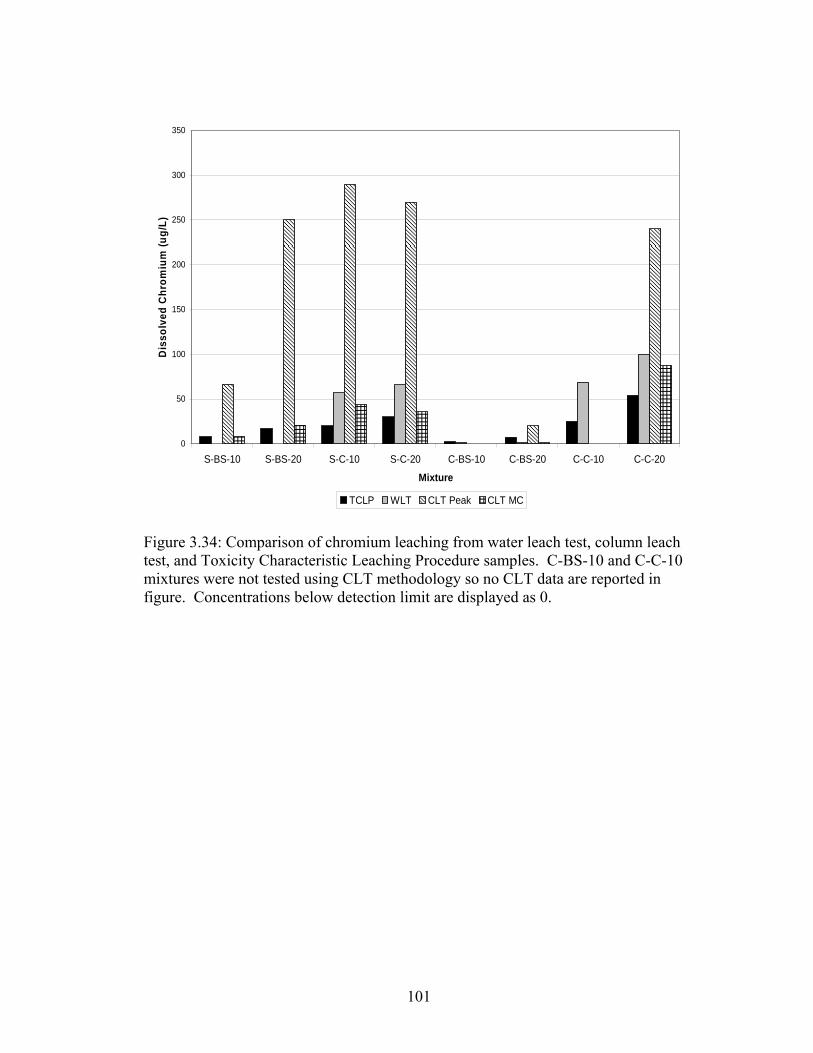
101
0
50
100
150
200
250
300
350
S-BS-10 S-BS-20 S-C-10 S-C-20 C-BS-10 C-BS-20 C-C-10 C-C-20
Mixture
Dis
solv
ed C
hro
miu
m (
ug
/L)
TCLP WLT CLT Peak CLT MC
Figure 3.34: Comparison of chromium leaching from water leach test, column leach test, and Toxicity Characteristic Leaching Procedure samples. C-BS-10 and C-C-10 mixtures were not tested using CLT methodology so no CLT data are reported in figure. Concentrations below detection limit are displayed as 0.

102
0
10
20
30
40
50
60
70
80
90
100
S-C-10 S-C-20 C-C-10 C-C-20 ColumbiaFA
S-BS-10 S-BS-20 C-BS-10 C-BS-20 BS FA Sandysoil
Clayeysoil
Mixture
Dis
solv
ed C
op
per
(u
g/L
)
WLT TCLP
Figure 3.35: Comparison of water leach test and Toxicity Characteristic Leaching Procedure leachate copper concentrations. Concentrations below detection limit are displayed as 0.

103
0
10
20
30
40
50
60
70
80
90
S-C-10 S-C-20 C-C-10 C-C-20 ColumbiaFA
S-BS-10 S-BS-20 C-BS-10 C-BS-20 BS FA Sandysoil
Clayeysoil
Mixture
Dis
solv
ed A
rsen
ic (
ug
/L)
WLT TCLP
Figure 3.36: Comparison of water leach test and Toxicity Characteristic Leaching Procedure leachate arsenic concentrations. Concentrations below detection limit are displayed as 0. Note that no soil-fly ash mixture has arsenic concentrations that exceed the 10 μg/L EPA MCL.

104
0
20
40
60
80
100
120
140
160
S-C-10 S-C-20 C-C-10 C-C-20 ColumbiaFA
S-BS-10 S-BS-20 C-BS-10 C-BS-20 BS FA Sandysoil
Clayeysoil
Mixture
Dis
solv
ed C
hro
miu
m (
ug
/L)
WLT TCLP
Figure 3.37: Comparison of water leach test and Toxicity Characteristic Leaching Procedure leachate chromium concentrations. Concentrations below detection limit are displayed as 0. As shown, the C fly ash mixtures on the left side have higher leachate chromium compared to the BS fly ash mixtures for both leaching tests, mainly a result of the highly alkaline pH conditions (~11.5) of the C fly ash.

105
Figure 4.1: Summary of proposed leaching protocol. Preliminary testing provides foundation for conducting the water leach tests and column leach tests. Synthesis of different leaching test results provide evaluation of risks associated with heavy metal leaching. Additional preliminary testing, including L:S and contact time experiments, as well as numerical modeling, could be performed and incorporated depending on required level of detail and time frame.

106
Appendix A: Detailed Materials and Methods
A.1 Preparation and Determination of Extraction Fluids
The leaching solution for the CLT and WLT was prepared by dissolving 2.3376
grams sodium chloride (Fisher Scientific) in 2 liters of deionized water and mixing by
magnetic stirrer for 5 minutes. The pH of each new batch was immediately
measured, and adjusted to between 6.5 and 7 using 0.1 M NaOH prior to use in
leaching tests.
Two different extraction fluids can be used in the TCLP test, depending on the
sample properties. To determine which TCLP extraction fluid to use, 96.5 mL of
deionized water were added to a beaker containing 5.0 grams of sample material,
vigorously stirring for 5 minutes, and then measuring the pH. A measured pH of < 5
indicates that extraction fluid #1 should be used, whereas if the pH was > 5, 3.5 mL
of 1 N HCL are added and the mixture heated to 50°C for 10 minutes. If at this point
the pH is < 5, extraction fluid #1 is used, but if the pH is > 5, extraction fluid #2 is
used. In this work, extraction fluid #1 was appropriate in all cases. Extraction fluid
#1 was prepared in large batches (5 liters) to maximize solution homogeneity. To
create the solution, first 5.7 mL of glacial acetic acid (Fisher Scientific) was added to
500 mL of deionized water. Then 64.3 mL of 1N NaOH was added to the original
solution, which was diluted to a final volume of 1 L with deionized water before
mixing for 10 minutes. The pH of the solution was immediately measured and
compared to the specified value of 4.93 ± .05 units. Generally, there was very close

107
agreement between the observed and required pH. In the case of discrepancies, 1 N
NaOH was used to adjust the solution to the correct pH.
A.2 Preliminary Compaction Tests
The goal of these compaction tests was to determine the maximum dry unit weight
and corresponding optimum water content. These values were needed in calculating
the pore volume of each specific mixture for the CLTs. Compaction tests were
performed on all soils and fly ash-soil mixtures according to ASTM D698. The
compaction was done in three layers with 25 blows per layer from a standard
compaction hammer in a circular motion. The dry unit weight of each mixture was
calculated and plotted against water content to determine the water content that
corresponded to the maximum unit weight. Two series of tests were performed: no
delay and a 2 hour delay between the wetting of the mixture and compaction. Based
on the compaction test results, the 2 hour delay had no significant impact on the
maximum dry unit weights, and therefore was selected for use in the actual column
specimen preparation. This delay simulated the delay often seen in actual compaction
processes used on construction sites between the time the soil is moistened and
mechanical compaction is applied.
A.3 Column Compaction Procedure
To prepare the compacted specimens for the CLTs, 10 kilograms batches of fly ash-
soil mixture were mixed in five-gallon plastic buckets. The acrylic tubes were acid
washed and then coated with a layer of silicone lubricant. The 100% silicone product

108
was not expected to influence the leaching results and would aid in the release of the
compacted mixtures from the columns. After thorough mixing, sufficient water was
added to the material to give a moisture content equal to 2% less than the OMC.
Compaction of soil mixtures in the field typically is carried out dry of the OMC to
account for additional wetting that occurs from precipitation. Subsequent mixing was
done by hand and with a metal spoon to ensure the water was evenly distributed.
After a period of two hours, the wetted fly ash-soil mixture was compacted in 8 equal
layers, with 28 blows from a standard compaction hammer per layer in a circular
motion. The procedure for compacting each column was determined from calculation
of total energy (13750 ft-lbf/ft3) delivered to the compacted media adjusted for the
taller column height compared to the standard 4 inch tall Proctor compaction mold.

109
References Ahmed, A., Khalid, H., Ahmed, A.,Chen, D., 2010. A lysimeter experimental study and numerical characterisation of the leaching of incinerator bottom ash waste. Waste Manag. 30, 1536-1543. Ariese, F., Swart, K., Morabito, R., Brunori, C., Balzamo, S., Slobodnik, J., Korenokova, E., Janos, P., Wilderova, M., Hlavay, J., Polya’k, K., Fodor, P., Muntau, H., 2002. Leaching studies of inorganic and organic compounds from fly ash. Intn. J. Environ. Anal. Chem., 82, 751–770. Balasoiu, C., Zagury, G., Deschenes, L., 2001. Partitioning and speciation of chromium, copper, and arsenic in CCA-contaminated soils: influence of soil composition. Sci. Total Environ. 280, 239-255. Bin Shafique, S., Benson, C., Edil, T., 2002. Leaching of heavy metals from fly ash stabilized soils used in highway pavements. Geo Engineering Report 02-14, University of Wisconsin. Bin Shafique, S., Benson, C., Edil, T., Hwang, K., 2007. Leachate concentrations from water leach and column leach tests on fly ash-stabilized soils. Environ. Eng. Sci. 23, 53-67. Cetin, B., 2009. Stabilization of recycled base materials with high carbon fly ash. Web. Digital Repository at the University of Maryland. <http://hdl.handle.net/1903/9573> Chichester, D. L. and Landsberger, S. (1996). Determination of Leaching Dynamics of metals from Municipal Solid Waste Incinerator Fly Ash Using a Column Test. J. Air and Waste Manage. Assoc., 46, 643-649. Creek, D. N. and Shackelford, C. D. (1992). Permeability and Leaching Characteristics of Fly Ash Liner Materials. Transp. Res. Rec., 1345. Transportation Research Board. Cullen, W. and Reimer, K., 1989. Arsenic Speciation in the Environment. Chem. Rev. 89, 713-764. Edil, T., Benson, C., Bin Shafique, S., Tanyu, B., Kim, W., Senol, A., 2002. Field evaluation of construction alternatives for roadway over soft subgrade. Transport. Res. Rec. 36, 1786. Edil, T. B. (1998). Geotechnics of Industrial By-Products. Recycled Materials in Geotechnical Applications, Geotechnical Special Publication, ASCE New York, N.Y., 1-18.
110
EPA Drinking Water Contaminants. Updated July 1, 2010. United States Environmental Protection Agency <www.epa.gov/safewater/contaminants/index.html> EPA Test Method 1311: Toxicity Characteristic Leaching Procedure. Methods for Evaluating Solid Waste, Physical/Chemical Methods (SW-864), 3rd edition. United States Environmental Protection Agency <www.epa.gov/osw/hazard/testmethods/sw846/online/index.htm> Evans, L.J., 1989. Chemistry of metal retention by soils. Environ. Sci. and Technol. 23, 1046-1056. Fytianos, K., Tsaniklidi, B., Voudrias, E., 1998. Leachability of heavy metals in Greek fly ash from coal combustion. Environ. Int., 24, 477-486. Gelhar, L.W., Welty, C., and Rehfeldt, K.R. (1992). A critical review of data on field-scale dispersion in aquifers. Water Resour. Res., Vol. 28, No. 7, 1955-1974. Ghosh, A. and Subbarao, C. 1998. Hydaulic conductivity and leachate characteristics of stabilized fly ash. J. of Environ. Eng. 124, 812-820. Horne, M. T. and Dunson, W. A., 1995. Effects of low pH, metals, and water hardness on larval amphibians. Arch. Environ. Contam. Toxicol. 29, 500-505. Jegadeesan, G., Al-Abed S., Pinto, P., 2008. Influence of trace metal distribution on its leachability from coal fly ash. Fuel. 87, 1887-1893. Jo, H., Minb, S., Lee, T., Ahna, H., Lee, S., Honga, J., 2008. Environmental feasibility of using coal ash as a fill material to raise the ground level. J. Hazard Mater. 154, 933-945. Kim, A., 2006. The effect of alkalinity of Class F PC fly ash on metal release. Fuel. 85, 1403-1410. Kyper, T.N. (1992). “Institutional Constraints to the Use of Coal Fly Ash in Civil Engineering Construction”. Utilization of Waste Materials in Civil Engineering Construction, Published by ASCE, New York, N.Y., 32-43. MDE COMAR. Numerical Criteria for Toxic Substances in Surface Waters. Code of Maryland Regulations 26.08.02.03-2.03-2 (Toxic Substance Water Quality Criteria). Maryland Department of the Environment <www.dsd.state.md.us/comar/SubtitleSearch.aspx?search=26.08.02.*>
Morar, D., Aydilek, A.H., Seagren, E.A., and Demirkan, M.M., 2010. Metal Leaching from Fly Ash-Sand Reactive Barriers. Journal of Contam. Hydrol., in review.
111
Palumbo, A., Tarver, J., Fagan, L., McNeilly, M., Ruther, R., Fisher, L., Amonette, J., 2007. Comparing metal leaching and toxicity from high pH, low pH, and high ammonia fly ash. Fuel. 86, 1623-1630. Qiao X.C., Poon C.S, and Cheeseman, C. (2006). “Use of Flue Gas Desulphurisation (FGD) Waste and Rejected Fly ash in Waste Stabilization/Solidification Systems”. Waste Manag, Vol. 26, 141-149. Ram, L., Srivastava, N., Tripathi, R., Thakur, S., Sinha, A., Jha, S., Masto, R., Mitra, S., 2007. Leaching behavior of lignite fly ash with shake and column tests. Environ. Geol. 51, 1119-1132. Rigol, A., Mateu, J., González-Nú˜nez, R., Rauret, G., Vidal, M., 2009. pHstat vs. single extraction tests to evaluate heavy metals and arsenic leachability in environmental samples. Anal. Chem. Acta. 632, 69-79. Shackelford, C.D. and Glade, M.J.(1997). “Analytical Leaching Model for Contaminated Soil and Stabilized Waste”. Groundwater, Vol. 35, No. 2, 233-242. Shah, P., Strezov, V., Prince, K., Nelson, P., 2008. Speciation of As, Cr, Se and Hg under coal fired power station conditions. Fuel. 87, 1859-1869. Standard Method 1030C: Data Quality. American Public Health Association; American Water Works Association; Water Environment Federation, 1995. Standard Methods for the Examination of Water and Wastewater, 19th ed. American Public Health Association: Washington, D.C.; American Water Works Association: Denver, Colorado; Water Environment Federation: Alexandria, Virginia. Wang, J., Ban, H., Teng, X., Wang, H., Ladwig, K., 2006. Impacts of pH and ammonia on the leaching of Cu(II) and Cd(II) from coal fly ash. Chemosphere. 64, 1892-1898. Wang, J., Teng, X., Wang, H., Ban, H., 2004. Characterizing the Metal Adsorption Capability of a Class F Coal Fly Ash. Environ. Sci. and Technol. 38, 6710-6715. Zandi, M. and Russell, N. V., 2007. Design of a Leaching Test Framework for Coal Fly Ash Accounting for Environmental Conditions. Environ. Monit Assess. 131, 509-526.

![[MS-SPO]: SharePoint Protocols OverviewMS-SPO... · SharePoint Protocols Overview ... 2018 [MS-SPO]: SharePoint Protocols Overview This overview describes the SharePoint Protocols](https://img.pdfslide.us/doc/110x75/5ece03cb25b3922c1e1461bd/ms-spo-sharepoint-protocols-overview-ms-spo-sharepoint-protocols-overview.jpg)