Embed Size (px)
Citation preview

1
EVALUATION OF SUMMER COVER CROPS SORGHUM SUDANGRASS (SORGHUM BICOLORL. (MOENCH) X SORGHUM SUDANENSE) AND PIGEON PEA
(CAJANUS CAJAN L.) MANAGEMENT ON FALL CABBAGE
By
DAKSON SANON
A THESIS PRESENTED TO THE GRADUATE SCHOOL
OF THE UNIVERSITY OF FLORIDA IN PARTIAL FULFILLMENT OF THE REQUIREMENTS FOR THE DEGREE OF
MASTER OF SCIENCE
UNIVERSITY OF FLORIDA
2013

2
© 2013 Dakson Sanon

3
To my Mom and my daughter Daknishael Bezaleel

4
ACKNOWLEDGMENTS
I wish above all to thank God for giving me health, strength and courage to
achieve this important journey in my life. My deepest gratitude goes to my major
professor, Dr. Danielle D. Treadwell for all of her help over the past two years. She has
not only guided me through my research and my writing but also allowed me to grow
socially, academically, and professionally. My sincere thanks go as well to the members
of my advisory committee, Dr. Oscar E. Liburd and Dr. Lincoln Zotarelli for their
assistance, technical support, and guidance.
I would particularly like to thank Mike Alligood and Dr. Teresia W. Nyoike, for
they have given me a great deal of help through this process.
I would also like to thank the United States Agency for International Development
/Watershed Initiative for National Natural Environmental Resources (USAID/WINNER) -
Project for granting a scholarship for my graduate program at the University of Florida. I
would like to thank University of Florida/Institute of Food and Agricultural Sciences (UF-
IFAS) International office staff members, Florence Sergile, Dr.Walter Bowen, Jennifer
Holloran, Shary Arnold, and Melissa Wokasch for their support. I also thank WINNER-
Project staff Members in Haiti, Dr. Jean Robert Estime and Marie-Claude Vorbe.
I want to thank Dr. Liburd laboratory members for their assistance in identifying
and counting insects. Thanks also to Dr. Steve A. Sargent for helping with the
microscope in his laboratory.
I would like to thank my friends and colleagues Lilian Mpinga, Reginald
Toussaint, Winjing Guan, Lidwine Hypolite, Marie Pascale Francois, Joseph Beneche,
Libby Rens, Allisson L. Beyer, Lyn Max, Desire, Mildred, Seth, Maggie Golman, Ronald
Cademus, Lemane Delva, Marie Solaine Leogene Dorestant, and Lejuin Brutus for their

5
help. My sincere thanks go to the UF/IFAS experimental field crew in Live Oak
including; Jerry Butler, Randi Randell, and Wanda Laughlin for always being glad and
ready to help.
I am deeply indebted to my family members for constantly supporting me during every
moment of my Master’s program.
Knowing that the heart can feel what the mouth has forgotten to say, may
everyone who one way or another contributed to this achievement find here the
expression of my sincere thanks.

6
TABLE OF CONTENTS page
ACKNOWLEDGMENTS .................................................................................................. 4
LIST OF TABLES ............................................................................................................ 8
LIST OF FIGURES ........................................................................................................ 10
ABSTRACT ................................................................................................................... 11
CHAPTER
1 INTRODUCTION .................................................................................................... 13
Cover Crops ............................................................................................................ 16 Pigeon Pea as a Cover Crop ............................................................................ 18
Sorghum Sudangrass as a Cover Crop ............................................................ 20 Cover Crop Mixtures ........................................................................................ 22
Cover Crop Management System for Vegetable Production .................................. 23
Cover Crops in Integrated Pest Management (IPM) ............................................... 24 Key Pests in Cabbage ............................................................................................ 26
Cabbage Production and Management .................................................................. 30 Conclusions ............................................................................................................ 33
2 CABBAGE RESPONSE TO PIGEON PEA AND SORGHUM SUDANGRASS COVER CROP FERTILTY AND RESIDUE MANAGEMENT .................................. 35
Materials and Methods............................................................................................ 38
Experimental Site ............................................................................................. 38 Experimental Design ........................................................................................ 39
Cover Crop Management ................................................................................. 40 Cabbage Management ..................................................................................... 40 Data Collection ................................................................................................. 41
Cover crop biomass ................................................................................... 41 Soil nutrients .............................................................................................. 42 Weed biomass in transplanted cabbage .................................................... 42 Cabbage yield and yield parameters .......................................................... 43
Statistical Analysis ............................................................................................ 43
Results and Discussion........................................................................................... 43 Weather conditions ........................................................................................... 43 Soil Nitrogen (nitrate) ....................................................................................... 44 Effect of Fertilizer on Cover Crop and Weed Biomass ..................................... 44
Cover crop biomass ................................................................................... 44 Weed biomass at cover crop termination ................................................... 45 Weed biomass during cabbage production ................................................ 46
Cabbage Yield and Yield Parameters .............................................................. 47

7
Interaction Effects on Cabbage Yield and Yield Parameters ............................ 48
Yield Parameters .............................................................................................. 50 Fall 2012 .................................................................................................... 50
Cover crop x cover crop termination methods interaction effect on MH ..... 51 Cover crop x fertilizer x CTM interaction effects on TY, PHW, and WW .... 51 Cover crop x fertilizer x CTM interaction effects on yield parameters ........ 52
Conclusions ............................................................................................................ 52
3 PIGEON PEA AND SORGHUM SUDANGRASS MANAGEMENT CHANGES THE POPULATION OF PEST AND BENEFICIAL INSECTS IN CABBAGE. .......... 75
Materials and Methods............................................................................................ 78 Experimental Site ............................................................................................. 78 Experimental Design ........................................................................................ 78
Cover Crop Management ................................................................................. 79 Cabbage Management ..................................................................................... 79
Data Collection ................................................................................................. 81 Statistical Analysis ............................................................................................ 82
Results and Discussion........................................................................................... 82 Effect of Cover Crops and Tillage on Insect Populations from Pitfall Traps ..... 82 Effect of Fertilizer and Tillage on GB and FA Populations ................................ 83
Effect of Cover Crops and Tillage on Insect Populations from YST ................. 84 Effect of Cover Crops and Tillage on Insect Populations from in Situ Count .... 85
Conclusions ............................................................................................................ 87
4 CONCLUSIONS ..................................................................................................... 99
LIST OF REFERENCES ............................................................................................. 102
BIOGRAPHICAL SKETCH .......................................................................................... 114

8
LIST OF TABLES
Table page 2-1 Cover crops repartition and seeding rate establishment for summer 2011 and
2012 growing seasons in Live Oak Florida ......................................................... 55
2-2 Main effect treatments arrangement according to the experimental design established during growing season 2011 and 2012 in Live Oak Florida. ............ 56
2-3 Soil chemical properties (0 -15 cm depth) of the experimental site in Live Oak Florida during fall 2011 and 2012. ...................................................................... 58
2-4 Analysis of variance summary for cover for cover crop dry weight, weed dry weight, cabbage yield as affected by cover crop planting, fertilizer, and CTM. .. 59
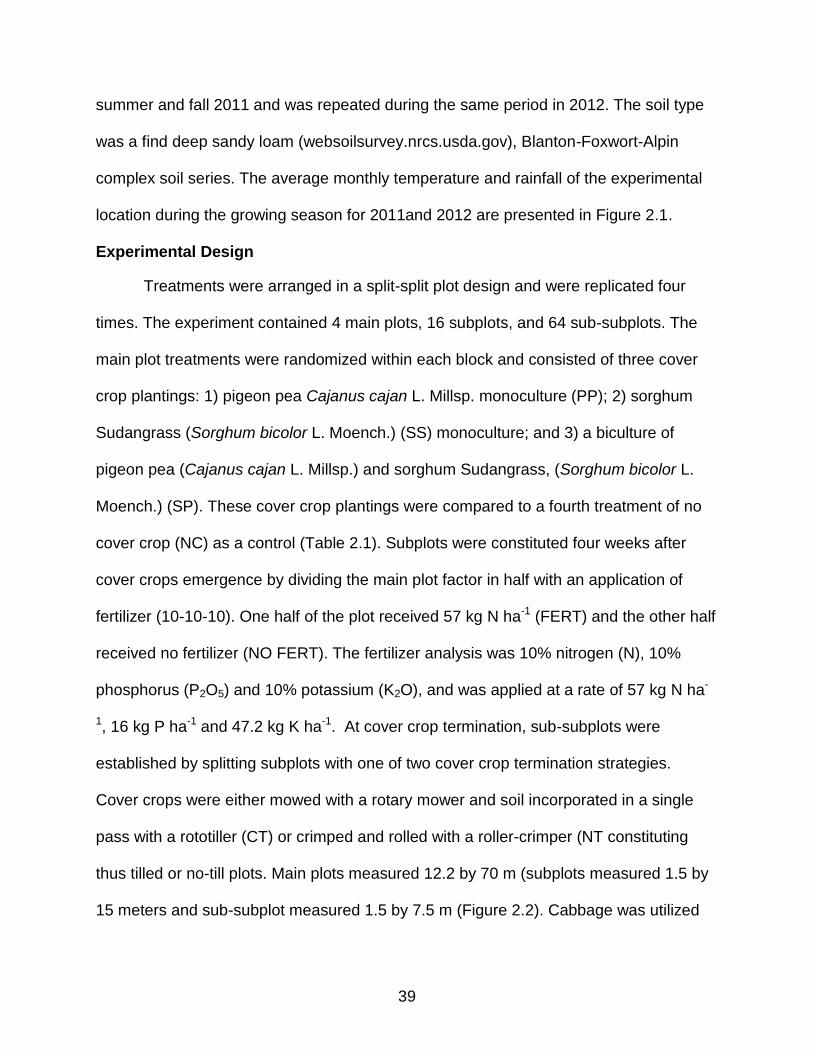
2-5 Interaction effects of CC species and fertilizer on CC dry weight in g.m-1, dried at 70 oC for 48 hours.. ................................................................................ 61
2-6 Interaction effects of cover crop species and fertilizer on weed dry weight in g.m-1, dried at 70 oC for 48 hours. ...................................................................... 62
2-7 Interaction effects of cover crop species and fertilizer on weed dry weight in g.m-1, dried at 70 oC for 48 hours. ...................................................................... 63
2-8 Effects of cover crops, fertilizer, and tillage on weed dry weight in cabbage (Brassica oleracea cv. Bravo). ............................................................................ 64
2-9 Interaction effects of fertilizer and cover crop termination method; cover crop species and CTM on weed dry weight in Live Oak Florida. ................................ 65
2-10 Interaction effects of cover crop species and cover crop termination method on cabbage total yield and percent of head weight at harvest ............................ 66
2-11 Interaction effects of cover crop species and cover crop termination method on cabbage wrapper leaf and marketable head at harvest ................................ 67
2-12 Interaction effects of cover crop species and cover crop termination method on cabbage head diameter and head height at harvest ..................................... 68
2-13 Interaction effects of cover crop species and cover crop termination method on cabbage head core width at harvest in fall 2011 in Live Oak, Florida. .......... 69
2-14 Interaction effects of fertilized cover crop residues and cover crop termination method on cabbage yields and yield parameters at harvest .............................. 70
2-15 Interaction effects of fertilized cover crop residues and cover crop termination method on cabbage wrapper leaf weight and marketable yield at harvest ........ 71
9
2-16 Interaction effects of cover crop species, fertilizer, and tillage on cabbage head diameter, head height, and head core width at harvest in fall 2012 ........... 72
2-17 Interaction effects of cover crop species, fertilizer, and tillage on cabbage head diameter, head height, and head core width at harvest ............................. 73
3-1 Cover crops repartition and seeding rate establishment for summer 2011 and 2012 growing seasons in Live Oak Florida ......................................................... 89
3-2 Main effect treatments arrangement according to the experimental design established during growing season 2011 and 2012 in Live Oak Florida. ............ 91
3-3 Analysis of variance summary for beneficial and insect pest populations as affected by cover crops mulches, fertilizer and tillage ........................................ 94
3-4 Effect of Cover crops, fertilizer, and tillage on insect pest and beneficial populations captured in cabbage from passive pitfall traps ................................ 95
3-5 Effect of fertilizer, and tillage on ground beetles and fire ants populations captured in cabbage from passive pitfall traps during fall 2011 and 2012 .......... 96
3-6 Effect of Cover crops, fertilizer, and tillage on insect pest and beneficial populations captured in cabbage from active yellow sticky traps ....................... 97
3-7 Effect of Cover crops, fertilizer, and tillage on insect pest and beneficial populations captured in cabbage from in situ count during fall 2011 and 2012. . 98

10
LIST OF FIGURES
Figure page 2-1 Monthly air temperature at a height of 60 cm, relative humidity, and rainfall at
a height of 2m . ................................................................................................... 54
2-2 Sketch of the split split-plot design of the experiment laid out in Live Oak, Florida ................................................................................................................ 57
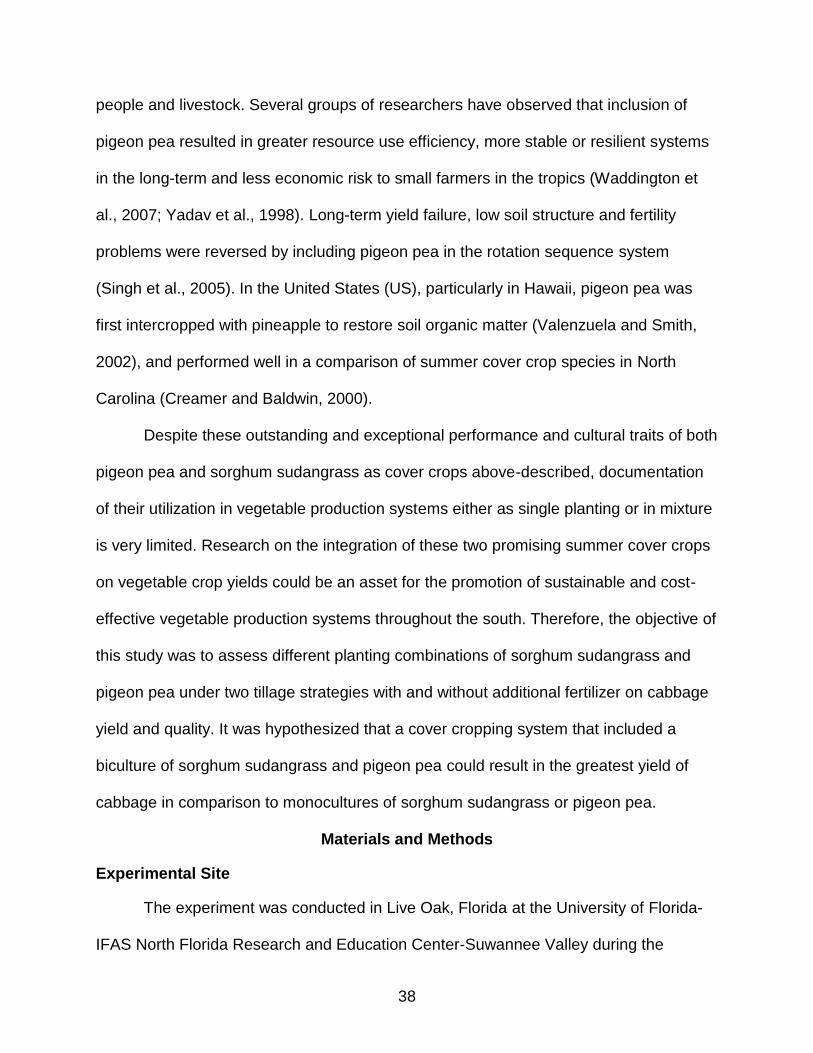
2-3 View of the experiment before and at cover crop (CC) termination.. .................. 60
2-4 Cabbage pictures collected at harvest for fall 2012 in Live Oak, Florida. ......... 74
3-1 Sketch of the split split-plot design of the experiment laid out in Live Oak, Florida ................................................................................................................ 90
3-2 Sampling methods used during the experiment for both years. .......................... 92
3-3 A) Stand point where systematic visual counting had lieu every other week; B) Gridded used to count aphids on unbaited yellow sticky traps. ...................... 93

11
Abstract of Thesis Presented to the Graduate School of the University of Florida in Partial Fulfillment of the Requirements for the Degree of Master of Science
EVALUATION OF SUMMER COVER CROPS SORGHUM SUDANGRASS
(SORGHUM BICOLORL. (MOENCH) X SORGHUM SUDANENSE) AND PIGEON PEA (CAJANUS CAJAN L.) MANAGEMENT ON FALL CABBAGE
By
Dakson Sanon
May 2013
Chair: Danielle D. Treadwell Major: Horticultural Science
This two-year experiment had two objectives. The first objective was to identify
the cover crop planting arrangement and tillage method that resulted in the greatest
cabbage yield in tropical and subtropical environment by evaluating two different
summer cover crops. The second objective consisted of investigating the effect of this
two summer cover crops planting arrangement and tillage on management of key pest
and beneficial insects in cabbage, Brassica oleracea var. Capitata used as a test crop.
The experiment was conducted in Live Oak, Florida at the UF-IFAS North Florida
Research and Education Center-Suwannee Valley in fall 2011 and was repeated in fall
2012.
Treatments were arranged in a split split-plot design and replicated four times.
Main effects included four cover crop (CC) treatments: pigeon pea, (PP); sorghum
Sudangrass, (SS); PP and SS biculture (SP); and no cover crop (control). Cover crop
plots were equally split in week four after CC emergence with two levels of nitrogen (N):
57 kg ha-1 or 0 kg ha-1 (subplots). Each subplot was equally split again prior to cabbage
transplanting. Cover crops were mowed and soil-incorporated (CT) or rolled (NT) with a

12
roller-crimper (sub-subplots). Data were collected on CC biomass, weed biomass,
cabbage yield and yield parameters, key pests on cabbage including; and beneficial
insects using yellow sticky cards, pitfall traps and foliar counts. Measured cabbage total
and marketable yields were greater in fall 2011 than fall 2012. The greatest cabbage
yield and marketable yield were 54 and 38 ton.ha-1, respectively in fall 2011 and 38 and
17 ton.ha-1, respectively in fall 2012. Yields obtained in general from CT plots were
significantly greater (P≤ 0.05) than NT plots in both years. Total yield and marketable
yield were consistently greater in PP plots in both years. Aphid populations were
significant within most of the treatments in both years except in PP main effect
treatments. DBM was not significant in any treatment in both years. Whitefly population
was lowest in SS main effect treatments. Among the most common beneficial insects,
ground beetles, spiders, and fire ants, wasps, and syrphid flies were significantly more
abundant during both cabbage growing seasons

13
CHAPTER 1 INTRODUCTION
For ages, worldwide agriculture has experienced serious changes and
consequently has become more and more fragile in terms of sustainability. This
situation has sparked the necessity for new strategies by researchers and farmers to
cultivate the soil to alleviate this prominent fragility of current agricultural practices. For
example, concerns over soil quality degradation have given rise to the development of
conservation tillage during the last five decades Baldwin (2009). Indeed, this cultural
practice is more common in vegetable production, especially sustainable and organic
vegetable production.
Conservation tillage presents several economic benefits and opportunities for
growers in the United States (U.S). Recent studies suggest that conservation tillage
practices can be beneficial to the production of horticultural crops (Hoyt et al., 1994).
One of the major components of conservation tillage systems for vegetable production
is cover cropping systems. In general, cover crops can reduce soil erosion (Dabney et
al., 2001), limit runoff and surface water pollution (Hall et al., 1984), influence soil fertility
by providing a source of nitrogen (N) for subsequent crops (Carof et al., 2007; Kuo and
Jellum, 2002) and capturing soil mineral N to prevent loss to leaching (Thiessen-
Martens et al., 2005). When rotated into organic production systems, cover crops may
also provide alternatives to chemical inputs for pest management, as they have been
demonstrated to suppress weeds (Finney et al., 2009; Treadwell et al., 2007), disrupt
pest and disease cycle (Hartwig and Ammon, 2002; Liburd et al., 2008), and suppress
nematode populations (Brainard et al., 2011).

14
Experiments conducted on cover crops have focused more on winter annual
species than summer species. Sorghum sudangrass (Sorghum bicolor L. Moench X
Sorghum sudanense) and pigeon pea (Cajanus cajan) as summer cover crops in
conservation tillage systems seem to be subject of very few studies. Despite that, these
two species retain researchers’ attention for several reasons. Sorghum sudangrass as a
summer cover crop has the potential to produce abundant biomass (Creamer and
Baldwin, 2000), suppress weeds through physical and chemical interference (Creamer
and Baldwin, 2000; Weston et al., 1989) and decrease soil compaction (Wolfe et al.,
1998). Sorhum sudangrass is commonly cultivated as a forage crop for grazing, hay, or
silage (Chamblee et al., 1995), and may be suited to cultivate as both cover and hay
crop in organic sustainable conservation tillage vegetable production. Sorghum
sudangrass can produce allelopathic chemicals that can disrupt the growth of
neighboring plants (Weston et al., 1989). Sorghum sundangrass mulch has been
demonstrated to inhibit germination of summer annual weeds including common
purslane (Portulaca oleracea L.), common lambsquaters (Chenopodium album L.),
redroot pigweed (Amaranthus retroflexus L.) and smooth crabgrass (Digitaria
ischaemum (Schreb.) Muhl) (Putman and DeFrank, 1983).
In addition, pigeon pea is recognized as cover crop for its potential to produce
abundant biomass, prevent nutrient leaching, suppress weeds, fix nitrogen (N) and
sequester carbon (Valenzuela, 2011). In terms of N fixation, pigeon peas are nodulated
by a wide range of rhizobia strains including Bradyrhizobium spp. (cowpea group).
Pigeon peas are considered to have greater N fixation rates compared to other legume
species (Chikowo et al., 2004). Nitrogen fixation rates in an African study were

15
estimated to range from 40-97 kg ha-1 (Mafongoya et al., 2006). Other research results
from Africa and India also showed N contributions from pigeon pea to the following crop
in the rotation to be in the range of 40-60 kg N ha-1 (Odeny, 2007). In Florida, N fixation
from pigeon pea was estimated to be 250 kg N ha-1 (Reddy et al., 1986a). Estimates
indicate that leaf-drops can contribute up to 40 kg N ha-1 to the system (Mafongoya et
al., 2006). Pigeon peas develop a deep-rooting taproot up to 2 m in depth which helps
to break compacted soil layer, improve soil water infiltration and percolation, and mines
nutrients and moisture from the lower soil layers (Mafongoya et al., 2006). The amount
of nutrient released from root decomposition amounted to over 40 kg N ha-1 and over 80
kg ha-1 phosphorous, representing a potential valuable pool of nutrient for the following
crops in the rotation (Barber and Navarro, 1994).
Pigeon peas are used in intercropping and multiple cropping systems. In many
tropical regions, pigeon peas are cultivated in intercropping systems with crops such as
millet or corn. In Hawaii, pigeon pea was interplanted with pineapple to improve soil
properties (Valenzuela, 2011). Mulch from pigeon pea residues can be effective for
weed suppression (Ekeleme et al., 2003). As a cover crop, pigeon peas have been
used as cover in particular in coffee, corn, and other crops. Benefits of the pigeon pea
cover crop include improved soil fertility, reducing weed competition, and increased
arthropod diversity (Odeny, 2007). Some pigeon pea varieties have reported resistance
to root-knot nematodes, Meloidogyne incognita (Reddy et al., 1986b; Baldwin and
Creamer, 2003).
Pigeon peas are cultivated as forage as well. They have been evaluated in the
Southeastern of U.S. for their use as both cover and forage crop, in integrated crop-

16
livestock systems (Franzluebbers, 2007). Overall the use of pigeon pea in multiple
cropping systems resulted in greater resource use efficiency, crop productivity, more
stable or resilient systems over time and in less economic risks to small farmers in the
tropics (Yadav et al, 1998; Waddington et al., 2007).
Based upon these findings, conducting an experiment that is taken into
consideration different planting management of pigeon pea and sorghum sudangrass as
cover crops could be significant to evaluate their subsequent effects on vegetable cash
crops planted into their residues that are either left on the soil surface or incorporated
into the ground.
The general purpose of this research was to identify the best cover crop
management strategy suitable for optimizing vegetable production in tropical
environments. Specifically, our goals were to investigate the cover crop planting
arrangement and tillage method that results in the greatest cabbage yield (Chapter 2)
as well as to monitor the insect populations to determine how the cover crop planting
arrangement and tillage method influences key insect pests and beneficial populations
(Chapter 3).
Cover Crops
Cover crops, as defined by Allison (1968), are crops that are in general grown to
protect the soil surface by providing living or dead mulch which is positively enhanced
soil fertility, soil physical properties, and nutrient management. Cover crops are crops
including grasses, legumes, forbs, or other herbaceous plants established for seasonal
cover and soil conservation purposes (NRCS-Minnesota, 2007). Based on the
cultivated-purpose, cover crops may have several appellations. They may be called:
“catch crop” when grown to scavenge nutrients preventing them from leaching; “green

17
manure” when incorporated into the soil at termination prior to the subsequent cash
crop; “trap crop” when grown to attract beneficial insects and disrupt insect pests;
“windbreak crop” when cultivated to protect growing crops from damage by wind and
wind-borne soil particles; “smother crop” destined to especially suppress weeds; et
cetera. Originally cover crops were introduced into agriculture just to provide soil cover
or protection (Allison, 1968) and therefore contributed to the control of soil erosion, as
well as to reduce runoff, improve infiltration, maintain soil moisture, and increase soil
tilth (Dabney et al., 2001; Carof et al., 2007; Hoyt et al., 1994; Teasdale 1996; Mohler
and Teasdale, 1993).
Leguminous cover crops are basically rich in N and most of the time release
sufficient amount of N that might replace chemical fertilizer (Thiessen-Martens et al.,
2005). Both legume and non-legume cover crops contribute to scavenging and recycling
the surplus of macro and micronutrients from the previous crop and therefore reduce
the risk of nutrient leaching or surface run off to water bodies.
Many researchers have determined that cover crops contribute to weed
suppression (Daniel C. et al., 2011; Treadwell et al., 2007; Williams et al., 2009), and
according to Blackshaw (2001), a lot of cover crop species provide weed suppression
both during growth and after termination. Cover crops with plant parts containing
comparatively high C:N (greater than 20:1) and significant dry weight, such as grass
and hard stem legumes, present increased weed control for a longer period of time
through the growing season compared to cover crops with low C:N (less or equals to
20:1) ratios (Cherr et al., 2006). Weed suppression may be maximized by using high
18
residue cover crops capable to provide at least 4,500 kg ha-1 of biomass as ground
cover (Balkcom et al., 2007).
Cover crops are often attractive ecological habitats for beneficial insects
(Reeves, 1994). Conservation tillage coupled with cover crops allows creating year-
round such an ambiance leading to interactions between natural enemy and insect
pests. Because of this, cover crop management is becoming one of the Integrated Pest
Management (IPM) strategies promoting the reduction of pest populations while
encouraging beneficial populations in the cropping systems. Cover crops also suppress
nematode populations (Hill et al., 2006).
Another potential benefit of cover crops is the potential to increase subsequent
crop yield. Cover crops may or may not increase yield of subsequent crops (Blanco-
Canqui et. al., 2012; Olson et al., 2010). Fertilized cover crops have increased weeds
suppression and crops yield in celery (Charles et al., 2006). Practical Farmers of Iowa
(PFI) reported that yield of soybeans was increased when planted following winter rye
(Secale cereale L.) cover crop (Carlson and Anderson, 2010). Legume cover crop such
as hairy vetch (Vicia villosa L.) and crimson clover (Trifolium incarnatum L.) are to a
large extent more able to enhance crop yields than grass cover crops such as wheat
based on the potentiality of legumes to provide nitrogen to the following crop, reducing
therefore required nitrogen inputs (Roberts et al., 1998). Charles (2006) showed that in
hand-weeding farming system on celery, cover crops can successfully improve weed
management and yield, entailing reduced fertilizer inputs.
Pigeon Pea as a Cover Crop
Pigeon pea, Cajanus cajan L. Millsp., belongs to Fabaceae family along with
soybean (Glycine max L.), field bean (Phaseolus vulgaris L.), and mungbean (Vignata

19
radiate L.). Pigeon pea is a widely grown legume especially on tropics and subtropics.
Pigeon pea is a multipurpose legume with a long tradition of cultivation in Hawaii
(Valenzuela and Smith, 2002). Pigeon peas appear among the top ten worldwide grown
legumes, along with chick peas (Latin name needed for each of these please),
broadbeans, peas, lentils, and common beans.
Important characteristics of pigeon pea are that they are an excellent source of
nitrogen, they are used to improve the soil, they are drought tolerant, they are an
efficient nutrient scavenger, pigeon pea is a good forage for animal production systems,
and finally pigeon pea is easily integrated in annual production systems (vegetables,
herbs, cut flowers and ornamentals) intercropping systems and agroforestry systems.
Pigeon pea is well-adapted to low soil fertility because of its ability to fix atmospheric N
and its deep root system (Gauchan et al., 2003). As a drought species, pigeon pea can
withstand long-term stress during its growth cycle (Sinclair, 2004). Pigeon pea varieties
vary in the duration to harvest, ranging from less than 60 days (early varieties) to over
200 days (late varieties). Pigeon pea varieties may be determinate (short) or
indeterminate (long) (Mligo and Craufurd, 2007). Pigeon pea blooms under short-day
conditions. Under long-day and cold temperatures, flowering is delayed or does not
occur (Mligo and Craufurd, 2005).
Pigeon pea is an excellent weed suppressive crop. Biomass production has been
found to be roughly 87.5 tons ha-1 of fresh weight green matter and about 6.25 ton ha-1
of dry matter contributing about 57 kg of N per ton of dry matter. Pigeon pea is effective
at breaking soil compaction due to its deep root system. Pigeon pea develops a taproot
that can go deeper than 2m (6ft). In India, pigeon pea in rotation contributed to a

20
reduction of bulk density, an increase in root volume and increase in root weight of the
subsequent crop in rotation (Singh et al., 2005). Pigeon pea has the potential of
maintaining adequate growth under low P conditions compared to the other crops, for
instance, corn and soybeans (Sinclair, 2004). However, Adu-Gyamfi (1998) found that
the lower soil P levels may reduce N fixation in pigeon pea, more specifically in the
short duration varieties. Pigeon pea exudes via its roots several organic acids such as
citric, piscidic, and tartaric acid that contribute to mobilizing P in the soil (Sinclair, 2004).
The intercropping of pigeon pea with grass species increased P uptake by the
companion grass crops (Raghothama, 1999). The development of mychorrhizal
associations by pigeon pea enhanced nutrient uptake efficiency (Chickowo et al., 2004).
Based on its drought, heat, and low fertility conditions tolerance, pigeon pea
could be an important crop or cover crop to alleviate the effects of climate change.
Sorghum Sudangrass as a Cover Crop
Sorghum sudangrass hybrids can produce more organic matter per acre, and at
a lower seed cost, than any major cover crop grown in the U.S.A. (Clark, A., 2007;
Valenzuela and Smith, 2002). Sorghum sudangrass is a hybrid issued from forage-type
sorghum and sudangrass. Sorghum in general has a narrow leaf area, numerous
secondary roots, a waxy leaf surface, and other traits that contribute to drought
tolerance (Sarrantonio, M., 1994). For best growth, sorghum sudangrass needs good
soil fertility and supplemental N-inputs (Clark, A., 2007). Sorghum sudangrass can
produce up to 4,500 to 5,500 kg ha-1of dry matter. Creamer and Balwin (2000) reported
that sorghum sudangrass suppresses weed through physical and chemical interference.
Scott, and Weston (1991) assessed that “Sogoleone” is the main root exudate of
sorghums which is active at extremely low concentration in comparison with some

21
synthetic herbicides. Sorghum sudangrass is renowned for being very effective at
suppressing annual weeds such as, velvetleaf, large crabgrass, barnyardgrass
(Einhelling, and Souze, 1992; Nimbal et al., 1996), green foxtail, smooth pigweed,
redroot pigweed, common ragweed, and common purslane (Peet, 1995; Putman and
DeFrank, 1983).
Sorghum sudangrass is also an important tool in integrated pest management
(IPM) program. Planting sorghum sudandgrass in lieu of a host crop can help disrupt
the life cycle of a stream of diseases, nematodes and other pests. According to an IPM
specialist from Cornell Extension, John Mishanec, the use of sorghum sudangrass
helps to control nutsedge infestation (personal communication). Soghum sudangrass
attracts beneficial insects such as seven-spotted lady beetles, Coccinella
septempunctata and green lacewings, Chrisopa carnea (University of California CCWG,
1996).
Sudangrass can contribute to N recycling, up to 210 kg ha-1. This potential for N
recycling combined with the subsoiling action of its root systems and its effects on
weeds and nematodes make sorghum sudangrass renowned for being able to restore
soil fertility. On a low-producing muck soil in New York where onion yields were
registered less than one third of the local average, only one year of a dense planting of
sorghum sudangrass restored the soil to an almost-similar condition to that of newly
cleared land (Jacobs, 1995). Sorghum sudangrass was demonstrated to reduce
pesticide cost, rejuvenate the soil, and increase the yield of onion in rotation on organic
soil (Jacobs, 1995).

22
According to a group of researchers at Cornell University, reported by (Clark,
2007), sorghum sudangrass was the best cover crop for breaking soil compaction in
vegetable fields when planted in summer. Soil compaction slows root expansion,
prevent nutrient uptake, stunt plants, retard maturity and increase the incidence of pests
and diseases (Wolfe, 1997). According to Wolfe (1997), slow-growing cabbage directly
seeded into compacted soil was vulnerable to flea beetle (Latin name of flea beetle)
infestations. Sorghum sudangrass in Colorado contributed to enhancing irrigated potato
tuber quality and total marketable yield (Delgado, et al., 2007). Its use also increased
nutrient uptake efficiency on high pH sandy soils (Delgado, and Lemunyon. 2006).
Cover Crop Mixtures
Cover crop mixtures are combinations of at least two different cover crop
species. For instance, planting involving a grass with a legume is a mixture. Mixtures
have more benefits because each crop in the mixed may respond differently to soil, pest
and weather conditions according to the Sustainable Agriculture Network (2007).
Associations of crops present considerable benefits in production systems. Some of
positive impacts of cover crop mixtures are availability of nitrogen in appropriate
quantities and ideal moment for following crops, attraction of several different species of
beneficial insects, and providing adequate soil cover for a longer period of time. Under
field conditions, a mixture of sorghum sudangrass and sunn hemp produced more dry
weight biomass combined (2410 kg ha-1) compared to monoculture dry weight 2010 kg
ha-1 for sorghum and 290 kg ha-1 for sunn hemp. Once soil incorporated, a cover crop
mixture that includes a grass and a legume can reduce the high C: N ratio of the grass
thus facilitating decomposition of organic matter by bacteria. In conjunction with that,
Balkon et al. (2007) reported that a mixture of hairy vetch and rye results in a C: N no

23
more than 25:1, while the C: N for 100% rye is between 30:1 and 66:1. Morse (2001)
found that the use of winter rye in combination with hairy vetch terminated by a roller in
the spring was the best combination assessed for production of no-till summer broccoli.
Similarly, McNeill et al. (2012) also reported that a biculture mixture of sorghum
sudangrass and velvet bean (Macuna pruriens) harbored a high number of syrphid flies
(Syrphidae) which contributed to reducing the aphid population in the subsequent
squash (Cucurbita moschata) crop.
Cover Crop Management System for Vegetable Production
In vegetable production, cover crops may be managed either under conservation
tillage or conventional tillage. The former is, in general, cover crops or/and crop
residues-dependent. According to Hebblethwaite (1997), conservation tillage, and in
particular no-tillage (NT) systems, have become normal methods of crop production for
field corn and soybean in some areas of the US. The use of cover crops in vegetable
became frequent with the adoption of NT in vegetable crops in the 1990s. Despite the
increase in adoption of NT for vegetable crops, many farmers are still reluctant to
practice it especially those who cultivate small-seeded crops (Morse, 1999). Morse
stated that research is still needed to assess NT direct-seeded for vegetable crops
cultivated in rotation with a good stand and well-managed high-residue cover crops. The
desire for farmers to reduce chemical weed suppression, produce high-value and
quality crops in NT agronomic crops (Reeves et al., 1997) and transplanted vegetable
crops (Morse,1995) have sparked innovation of improved practices for successful
growth and management of cover crop residues. The use of cover crops in NT systems
initially had a unique objective to suppress weeds and reduce surface water runoff.
Jointly, researchers and farmers showed that the combination of growing and keeping

24
uniformly distributed high-residue covers and appropriate use of preemergence and
postemergence herbicides provided better weed suppression than that obtained in
conventional tillage systems (Abdul-Baki et al., 1997). However, recent research
conducted on NT vegetable crops showed that farming practices can increase crop
yield as well. In a study led by Abdul-Baki et al. (1997), similar yields were found for fall
broccoli planted on residues of forage soybean and foxtail millet than for broccoli
cultivated conventionally.
Hoyt (1999), researched the utilization of tillage and cover crops on vegetable
yields, and concluded that yield of income-generating crops was dependent on the
appropriate selection of cover crop type and the amount of cover crop biomass. Mark
and Morse (2007) stated that NT cover crop management optimizes cover crop biomass
and soil cover, reduces the time between the cover crop termination and the
subsequent vegetable crop planting, and contributes to suppression of annual weeds.
Cover Crops in Integrated Pest Management (IPM)
The use of cover crops is a cultural tactic that is used in IPM for reducing pest
populations while encouraging beneficial insect populations in sustainable cropping
systems. According to Liburd et al. (2008), cover crops are a key component of organic
and sustainable agriculture. Back in 1991, Bugg stated that cover crops can be utilized
in many ways for insect management practices. When incorporated with a cash crop,
cover crops enhance the natural enemy populations (Liburd et al., 2008; Nyoike and
Liburd, 2010). Cover crops have the ability to create resilient and balanced
agroecosystems. In balanced ecosystems, insect pests remain in check by their natural
enemies (Sustainable Agriculture Network. 2005).

25
Besides its role of preventing soil erosion, improving soil structure, and
enhancing fertility, cover crops manage several pests including weeds, arthropods,
nematodes and various other pathogens, cover crops can attract several groups of
beneficial livings including natural enemies of insect pests, pollinators and soil nutrient
recyclers. Natural enemies attracted by cover crops that may benefit famers include
hoverflies (Syrphidae), parasites and/or parasitoids, lady beetles (Harmonia axyridis
Pellas), lacewings (Chrysoperla sp.), spiders (Araneae), ants (Formicidae), assassin
bugs (Platimeris biguttatus), minute pirate bugs (Orius sp.), ground beetles (Elaphrus
viridis), and big eyed bugs (Geocoris sp.). Insectary plants used as cover crops provide
in food (nectar and pollen) that is indispensable for the survival, development and
reproduction of a number of natural enemies including hoverflies and parasitoids (Hogg
et al., 2011). Hogg et al. (2011), proposed seven criteria to consider when choosing
cover crops for an IPM program: 1) attractiveness to beneficial insects; 2) early and long
blooming period; 3) low potential to host plant viruses; 4) ability to out compete weeds;
5) low potential to become a weed; 6) low attractiveness to pest species; and 7) low
cost of seed and establishment.
In Hawaii, IPM research conducted on cover crops to manage beneficial
organisms both above and below ground provided useful tools to farmers (Koon-Hui
Wang, 2012). For instance, buckwheat (Fagopayum esculentum Moench) intercropped
with zucchini (Curcubita pepo L.), reduced population densities of whiteflies and aphids,
as a result, reducing silver leaf symptoms and aphid-transmitted viruses on zucchini
(Hooks et al., 1998). Hooks and Johnson (2001) reported that intercropping yellow
sweet clover (Melilotus indicus) with broccoli (Brassica oleracea) reduced the number of

26
imported cabbageworm and cabbage looper on broccoli but did not increase insect pest
predation. Later, in 2004, they attested that intercropping involving yellow sweet cover
with broccoli increased the number of spiders that in turn considerably reduced the
occurrence of lepidopteran pests on broccoli foliage. Wang et al. (2011) reported a
significant increase abundance of soil mesoarthropods such as oribatid, predatory
mites, collembola, and isopods under a strip-till cropping system of sunn hemp and
marigold (Latin of marigold). Jointly, McNeill et al. (2012) reported that biculture
(mixture) sorghum sudangrass with velvet bean harbored high number of syrphid flies
which contributed to lower aphid levels in squash as the subsequent cash crop. Nyoike
et al. (2008) showed that the utilization of living mulches in combination with the
insecticide imidacloprid lowered the number of whiteflies per leaf on zucchini.
Key Pests in Cabbage
In cabbage, like any other vegetable crop, insect pests are generally the main
pest entity. Worldwide, the greatest insect issue for cabbage growers remains the
diamondback moth (DBM), Plutella xylostella. Diamondback moth is also known as the
first major cabbage insect pest in the state of Florida (Mossler et al., 2011). Other
cabbage major insect pests are cabbage looper, Trichoplusia ni, cabbageworm, Hellula
rogatalis, imported cabbageworm, Artogeia rapae, silverleaf whitefly, Bemisia
argentifolii, and aphids (turnip aphid, Hyadaphis erysimi; green peach aphid, Myzus
persicae; cabbage aphid, Brevicoryne brassicae). Whitefly and aphids are more
significant in southern Florida where they are viewed as key pests (Hayslip et al., 1953).
Diamondback moth became the main pest in Florida on cabbage during the course of
the 1980s, and since then, it has become one of the most critical issue that the state’s
cabbage producers face annually (Leibee, 1996). Diamondback moth attacks cabbage
27
at all stage of growth. Generally, DBM feeding causes many small holes in the leaves,
and the size of the feeding holes increases as larvae increase in size. They also feed on
developing cabbage heads, resulting in shallow tunnels on the top of the heads.
Diamondback moth damage may make the head and leaves entry points prone to
decay by secondary pathogens (Hayslip et al., 1953). From mid-winter through the
spring, DBM may cause losses of up to 70% when no control is taken (Nuessly et al.,
1999). DBM are active at temperatures between 10oC and 26.7oC (Hyyslip et al., 1953).
The economic thresholds for fresh market cabbage infested by DBM and other
caterpillar pests are: ≥ 30% before cupping, ≥ 20 % cupping to early heading, ≥ 10%
early heading to mature head (Foster and Flood, 1995).
Cabbage lopper (CL) is also one among the most harmful annual pest for
cabbage in Florida. Research on CL showed that adult populations tend to be highest in
late spring and summer, and sometimes in the late fall (Nuessly et al., 1999). However,
in central Florida, CL populations are highest during the course of early fall and late
spring (Leibee, 1996). According to Mossler et al. (2011), cabbage looper is generally
much more of an issue on Florida cabbage in the fall compared to the winter and spring
months. Cabbage looper feed on cabbage leaves and developing heads. Research in
Texas showed that control is necessary when population densities reach 0.3 larvae per
plant (Capinera, 1999a). Establishment of an action threshold of 0.1 medium to large CL
larvae per plant was effective In Florida for cabbage (Hayslip et al., 1953; Liebee,
1996). Their life cycle can be achieved at a temperature range between 21oC and 32oC
(Hayslip et al., 1953; Liebee, 1996).
28
Cabbageworms (CW) as well as imported cabbageworms (ICW) may be
controlled by treatments similar to that for DBM. Cabbageworms feed on cabbage in
seedbeds and in the field (Hayslip et al., 1953). Cabbage head formation can fail and
the plant appearance tends to be lopsided following feeding by CW (Hayslip et al.,
1953). Imported cabbage worm produces large holes in leaves and may attack heads
up to head fill, causing damage similar to DBM (Workman, 1983). Whitefly (WF) is not
known as major pest for cabbage, but it is very frequent on cabbage in southern Florida.
Whiteflies extract plant sap by piercing and sucking. They excrete excess liquid in the
form of honeydew that can give rise to the growth of sooty mold (Johnson et al., 1996).
In a study conducted on zucchini squash, Nyoike et al. (2008) reported that living
mulches were effective in reducing densities of WF on zucchini plants. Studies
conducted on the evaluation of living mulches on WF and aphids showed a successful
reduction in their population densities and a possible delay of the debut and distribution
of associated insect-borne diseases.
Aphids are one of the most economically important pests for cruciferous crops in
general, and for cabbage in particular. The three aphid species that attack cabbage in
Florida include Turnip aphid, (Hyadaphis erysimi); green peach aphid (Myzus persicae)
and cabbage aphid (Brevicoryne brassicae) and are among the five more economically
important aphid species for cruciferous crops in the U.S. Turnip aphid and green peach
aphid remain the most common aphids on cabbage in Florida (Webb, 2003). With low
pest density, honeydew and the black sooty mold fungus obtained as a result of their
feeding may contaminate the crop and reduce its marketability. However, when
population density is high, sooty mold can become very thick and block sunlight thus

29
lowering photosynthesis and ultimately reducing yield. Aphid can be protected from
insecticide applications within the curled leaves or inside the cupped leaves of cabbage
heads (Hayslip et al., 1953). Alternatively, many researchers in organic and sustainable
agriculture stated that cultural practices including use of cover crops contributes to
reducing aphid population densities to a tolerable level in cruciferous crops (Wang et al.,
2011). There is no scientific-based economic threshold established for aphids on any
cruciferous crops. However, several empirical action thresholds were determined to
evaluate the economic impact of aphid infestation (Liu and Spark Jr., 2001). For some
researchers in cabbage, the effect of aphid infestation is more significant at cabbage
early stage. Palumbo (2006) reported significant head contamination at a 10% action
threshold (10% plants infested with 5 or more aphids) when aphids on cabbage were
managed exclusively with reduced-risk insecticides.
Associated natural enemies of insect pests in cabbage. Cover crops are
renowned to be able to enhance natural enemy populations when intercropping with a
cash crop (Frank and Liburd, 2005; Liburd et al., 2008; Nyoike and Liburd, 2010). The
majority of associated natural enemies of insect pests in vegetable production systems
are effective for insect pest management in cabbage as well. These beneficial insects
include beneficial arthropods, various parasitoids and predators, predatory wasps, lady
beetles, ground beetles, lacewings, spiders, ants, big eyed bugs, damsel bugs, syrphid
flies, et cetera. Hooks and Johnson (2004) reported that spiders contributed to
considerably reducing lepidopteran pests on broccoli foliage. All stages of the DBM are
attacked by a stream of parasitoids and predators (Reddy et al., 2002). According to
Romeis et al. (1997), emission of volatiles by sorghum (Sorghum bicolor L.) attract and

30
capture Trichogramma chilonis that Muira and Kobayashi (1998) further reported as a
particularly effective in control of DBM. Areneae (Lycosiadae, Clubionidae, Oxyopidae),
Coleotera (Carabidae, Coccinelidae, Staphylinidae), Neuroptera (Chrysopidae), and
formicidae were the most abundant group of predatory beneficials that were captured in
pitfall traps in cabbage trial and correlated to important mortality of DBM (Furlong et al.,
2004. According to Ramirez and Patterson (2011), damsel bugs are generalist
predators that consume significant amounts of aphids and caterpillars.
Cabbage Production and Management
The U.S. fresh-market cabbage production is consistently led by California, and
along with New York, Florida, Texas and Georgia, constituted the top five cabbage-
producing states in 2011. Florida ranks third in terms of harvested acreage, yield, and
market value (National Agricultural Statistics Service, 2012). Florida cabbage production
and market value were estimated at 350 million kg and $74 million respectively in 2011
(NASS, 2012). According to NASS (2012), the total harvested acreage for the same
year was approximately 3,200 ha. In Florida, cabbage production is occurs during fall.
First planting dates for cabbage in Florida are usually between August and March. In
north Florida, first planting dates are between August and February, for central Florida
between September and February, and for south Florida, between September and
January (Maynard et al., 2003). Sargent (1999) reported that the maximum quality
cabbage was produced during the late fall, winter and early spring months in Florida.
This planting window gives the state’s producers the advantage of shipping fresh
cabbage to areas of the U.S. where cabbage cannot be produced economically during
that same period of the year.

31
Cabbage development is influenced by climatic hazards. For optimal
development, cabbage needs an ideal temperature range from 15oC to 20oC (UCDANR,
1992). Cabbage can induce “bolting” (variety-dependent disorder consisting of switching
from vegetative growth to reproductive growth) when temperatures exceed 24oC (Guide
to Commercial Cabbage Production, 1999). Cabbage needs a significant amount of N
during the early stage of development (Sanders, 2001). For instance, The University of
Florida’s Institute of Food and Agricultural Sciences (UF-IFAS) recommends that 25 to
50% of N be applied before planting or transplanting unmulched cole crops (Olson et
al., 2013). The nitrogen requirement rate for cabbage in Florida is 200 kg ha-1 N (Olson
et al., 2013). Westerveld et al. (2002) found that summer cabbage yields were better
when N rates ranged between 220 and 260 kg ha-1 compared to the current
recommended rate of 170 kg ha-1 N. Legume cover crops can play an important role in
contributing to the supply of the early N requirement (Hoyt and Hargrove, 1986).
Cover crops are usually used in No-tillage (NT) production systems for their
potential to control weeds and therefore have sparked the curiosity of a multitude of
researchers to initiate the implementation of cover crops in vegetable production
systems as a strategy to suppress weeds. That tendency also prevails when cover
crops are integrated in brassicas, mainly in cabbage and broccoli production systems.
In conventional systems, cover crop biomass is usually removed for animal forage
purposes before the soil is tilled. In contrast, in NT systems cover crop residues remain
as mulch on the soil surface.
Previous studies conducted on cover crop effects on cabbage production showed
that most of the time results are similar for NT cabbage compared to conventional tillage

32
(CT) management systems. In contrast, Knavel and Herron (1981) stated that spring
cabbage yields were decreased in NT when compared to CT. Wilhot et al. (1990)
attributed cabbage yield reduction to poor plant establishment and impeded crop growth
that extended beyond the effect of NT production system alone. Although cover crop
residues do reduce weed germination and growth, weed control in NT cabbage usually
involved the use of pre-emergence (PRE) herbicides. Bellinder et al. (1984) found
similar yield to cabbage cultivated both under NT and CT systems when weed control
methods and PRE were used. Weed management remains the main drawback of
implementing of NT cabbage production systems. Therefore, the cover crop type is
extremely important when implemented NT cabbage system. For instance, Morse and
Seward (1986), corroborated later by Schonbeck et al. (1993), reported that hairy vetch
and Austrian winter pea (Pisum sativum L.) were better residue covers than winter rye
for NT cabbage production, this was likely due to N released by the legumes via
decomposition of plant residues provided some additional benefit. In contrast, Masiunas
et al. (1997) reported that the use of fall-seeded winter rye was a more amenable mulch
system in NT cabbage for weed management ; also, weed management using winter
rye in NT system was comparable to that achieved in CT using trifluralin applied PRE.
Morse (1999a) conducted research on broccoli and observed yield was greater in a NT
cover crop mulch system in comparison to a NT bare soil system. Morse proposed that
NT broccoli can be successfully achieved without incorporating herbicides, especially
when proper high-residue cover crop are correctly killed by flail mowing or rolling and
broccoli transplants are appropriately placed and maintained in this uniformly distributed
cover crop mulches.

33
Cover crop mixtures as mulches show promise for NT brassica production
systems. Morse (2001) found that the use of winter rye in combination with hairy vetch
that was rolled in the spring turned out to be the best combination assessed for
production of summer broccoli. However, Morse concluded that NT broccoli yield is
inversely correlated with the amount of weed biomass produced.
Conclusions
Cover crops are integrated into vegetable production systems for their ability to
suppress weeds and scavenge nutrients that may be ultimately available to subsequent
cash crops. Several researchers have attempted to implement cover cropping as a
management strategy for weed suppression in vegetable production. However, few of
those experiments were focused on determining the direct effect of cover crop
management on both cash crop yields and insect pest and beneficial populations.
Indeed, the incorporation of cover cropping systems to improve vegetable crop yields is
challenging and research in this field is limited. Moreover, most research on cover
cropping systems has been focused on winter cover crops, primarily in cotton, corn,
wheat etc. and more often in temperate climates than in subtropical and tropical
systems. Trials conducted on cover crops in vegetable production systems are primarily
focused on cover crop efficacy on weed suppression and associated data on the cover
crops ability to supply nutrient and reduce insect pest populations to subsequent crops
is limited. To our knowledge, there have been no studies that involve the investigation of
the subsequent effects of cover crops on insect populations and yield of cash crops
cultivated into cover crops residues that are either incorporated or laid on the soil
surface.

34
The objective of this research was to investigate cover crop planting and
management strategy that is suitable for optimizing vegetable production in tropical
environments. The specific objectives pursued were to:
1. Identify the cover crop planting strategy and tillage method that results in the greatest cabbage yield.
2. Determine via monitoring how the cover crop planting strategies and tillage method influence key insect pests and beneficial populations.

35
CHAPTER 2 CABBAGE RESPONSE TO PIGEON PEA (Cajanus cajan (L.) Millsp.) AND SORGHUM
SUDANGRASS [Sorghum bicolor (L.) MOENCH VAR. sudanense (PIPER) HITCHC.] COVER CROP FERTILTY AND RESIDUE MANAGEMENT
In tropical and subtropical farming systems where soil erosion poses a significant
threat to farm sustainability, vegetable productivity and profitability can be improved by
integration of cover crops in the farming system. For instance, intensive vegetable
production systems are usually associated with removal of a considerable amount of
nutrients from the soil that is consequently impacted the soil surface layer that, when
those nutrients are not readily replaced, may render it difficult to grow a next crop
especially in tropical farming systems where nutrients are expensive. Other
consequences of soil surface layer impairing especially in conventionally tilled vegetable
production systems, are microbial activity impediment and reduction of nutrient
availability (Burke et al., 1989). Over time, repeated tillage has been shown to reduce
soil organic matter (Karlen et al., 1990) and deteriorate soil structure (Reicosky et al.,
1997). In research conducted on the use of cover crops in vegetable production
systems, Creamer et al. (1996) and Cher et al. (2006) reported that the use of cover
crops in vegetable production systems is one way to replenish the soil surface layer with
active soil organic matter and readily available nutrients. Therefore, inclusion of cover
crops in the crop rotation turns out to be important to enhance soil quality and fertility
and maximize crop productivity. However, several factors need to be considered to
integrate cover crops in a farming system. The type of cover crop (legume vs non-
legume), the species and sometimes cultivar, the season (winter vs summer), the site of
cultivation (temperate vs tropical) and tillage management are among the most
important factors to consider when incorporating cover crops in an agricultural

36
production system. This study was focused on the use of summer cover crops to
improve vegetable production in subtropical and tropical agro-ecosystems. Summer
cover crops have potential for enhancing soil quality, fertility and crop yield in
subtropical and tropical production systems (Wang et al., 2003a; Wang and Waldemar,
2006). Nutrient retention can be enhanced by the integration of summer cover crops. In
tropical areas including Florida, heavy rainfall in summer months remain a major
impediment to maintain nutrients within the surface layer area due to erosion and
leaching (Wang et al., 2005).
Pigeon pea and sorghum sudangrass are suitable summer cover crop species
for tropical and subtropical farming systems because they generate significant biomass
within a short period of time. For instance, top-growth biomass production for pigeon
pea has been reported to be about 40 tons of fresh weight green matter per hectare (35
tons a-1) and up to 3 tons ha-1 of dry weight, contributing to about 57 kg N ha-1 per ton of
dry weight (Valenzuela et Smith, 2002). In Florida, pigeon pea to growth has been found
to be contained between 3.5 and 6.5 tons ha-1 Plant heights can reach up to 150 cm at
14 weeks at summer planting (Valenzuela and Smith, 2002). Sorghum sudangrass is
very effective in adding soil organic matter, reducing nutrient leaching, and suppressing
weeds. Valenzuela and Smith (2002) followed by Clark (2007) reported that Sorghum
sudangrass hybrids remain the number one cover crop species in terms of production of
organic matter per acre and at a lower seed cost than any major cover crop grown in
the United States. Integration of sorghum sudangrass in a rotation can recycle up to 172
kg N ha-1 and 13.9 ton ha-1of dry weight (Baldwin and Creamer, 2006). Jacobs (1995)
found that on a low-producing muck soil in New York where yields of onion were less

37
than one third of the local average, integration of sorghum sudangrass in only one year
rejuvenated the soil to an almost-similar condition to newly cleared land. Research
conducted with sorghum sudangrass as a cover crop on potato in Colorado showed that
sorghum sudangrass contributed to enhancing potato tuber quality and total marketable
yield (Delgado, et al., 2007). According to Delgado and Lemunyon (2006), sorghum
sudangrass contributed to the increase in nutrient absorption efficiency on a high pH
sandy soil.
Pigeon pea is a promising summer cover crop based on its cultural traits. Food
and Agriculture Organization (FAO), 2008, reported that worldwide, pigeon pea farming
increased at an annual rate from approximately 2.7 million hectares in 1961 to about 4.6
million hectares in 2007. Pigeon pea in the US is mostly cultivated in Hawaii. However,
Li et al. (2012) reported that pigeon pea had potential for success in southern Florida
agro-ecosystems. Pigeon pea is also renowned as having the greater N fixation rate in
comparison to other legume species. In Florida, Reddy et al. (1986a) estimated N
fixation by pigeon pea at approximately 250 kg N ha-1. Beyond pigeon pea’s ability to fix
atmospheric N as legume, Barber and Navarro, 1994 reported that pigeon pea released
up to 40 kg N ha-1 and 80 kg ha-1 of Phosphorus (P) from root decomposition. The roots
of pigeon pea exude organic acids such as citric, piscidic, and tartaric, that help to
mobilize P in the ground by making it readily available for plant uptake (Sinclair, 2004).
In addition, Raghothama (1999) added that the intercropping of pigeon pea with a grass
species increased P uptake by the companion grass crop. In the tropics, pigeon peas
are cultivated in intercropping systems along with crops such as corn, sorghum and
millet. Pigeon pea is a multi-purpose crop, and is also used as a food crop for both
38
people and livestock. Several groups of researchers have observed that inclusion of
pigeon pea resulted in greater resource use efficiency, more stable or resilient systems
in the long-term and less economic risk to small farmers in the tropics (Waddington et
al., 2007; Yadav et al., 1998). Long-term yield failure, low soil structure and fertility
problems were reversed by including pigeon pea in the rotation sequence system
(Singh et al., 2005). In the United States (US), particularly in Hawaii, pigeon pea was
first intercropped with pineapple to restore soil organic matter (Valenzuela and Smith,
2002), and performed well in a comparison of summer cover crop species in North
Carolina (Creamer and Baldwin, 2000).
Despite these outstanding and exceptional performance and cultural traits of both
pigeon pea and sorghum sudangrass as cover crops above-described, documentation
of their utilization in vegetable production systems either as single planting or in mixture
is very limited. Research on the integration of these two promising summer cover crops
on vegetable crop yields could be an asset for the promotion of sustainable and cost-
effective vegetable production systems throughout the south. Therefore, the objective of
this study was to assess different planting combinations of sorghum sudangrass and
pigeon pea under two tillage strategies with and without additional fertilizer on cabbage
yield and quality. It was hypothesized that a cover cropping system that included a
biculture of sorghum sudangrass and pigeon pea could result in the greatest yield of
cabbage in comparison to monocultures of sorghum sudangrass or pigeon pea.
Materials and Methods
Experimental Site
The experiment was conducted in Live Oak, Florida at the University of Florida-
IFAS North Florida Research and Education Center-Suwannee Valley during the
39
summer and fall 2011 and was repeated during the same period in 2012. The soil type
was a find deep sandy loam (websoilsurvey.nrcs.usda.gov), Blanton-Foxwort-Alpin
complex soil series. The average monthly temperature and rainfall of the experimental
location during the growing season for 2011and 2012 are presented in Figure 2.1.
Experimental Design
Treatments were arranged in a split-split plot design and were replicated four
times. The experiment contained 4 main plots, 16 subplots, and 64 sub-subplots. The
main plot treatments were randomized within each block and consisted of three cover
crop plantings: 1) pigeon pea Cajanus cajan L. Millsp. monoculture (PP); 2) sorghum
Sudangrass (Sorghum bicolor L. Moench.) (SS) monoculture; and 3) a biculture of
pigeon pea (Cajanus cajan L. Millsp.) and sorghum Sudangrass, (Sorghum bicolor L.
Moench.) (SP). These cover crop plantings were compared to a fourth treatment of no
cover crop (NC) as a control (Table 2.1). Subplots were constituted four weeks after
cover crops emergence by dividing the main plot factor in half with an application of
fertilizer (10-10-10). One half of the plot received 57 kg N ha-1 (FERT) and the other half
received no fertilizer (NO FERT). The fertilizer analysis was 10% nitrogen (N), 10%
phosphorus (P2O5) and 10% potassium (K2O), and was applied at a rate of 57 kg N ha-
1, 16 kg P ha-1 and 47.2 kg K ha-1. At cover crop termination, sub-subplots were
established by splitting subplots with one of two cover crop termination strategies.
Cover crops were either mowed with a rotary mower and soil incorporated in a single
pass with a rototiller (CT) or crimped and rolled with a roller-crimper (NT constituting
thus tilled or no-till plots. Main plots measured 12.2 by 70 m (subplots measured 1.5 by
15 meters and sub-subplot measured 1.5 by 7.5 m (Figure 2.2). Cabbage was utilized

40
as a test crop to determine effect of fertilized cover crop planting arrangement and
tillage management on cabbage quality and yield.
Cover Crop Management
Prior to planting the cover crops, the experimental site was in native vegetation
composed predominantly of bahia grass (Paspalum notatum). Plots were disked with a
rolling disk harrow. In 2011, cover crops were seeded on August 8 with a Great Plains
No-Till Grain Drill (model 606 NT, Wichita, KS) 7.5 in row spacing at a rate of 22.8 kg
ha-1 for SS and 57 kg ha-1 for PP. The SP was seeded using half of the seeding rate for
each of the single species: SS 11.4 kg ha-1 and PP 28.5 kg ha-1. In 2012, the seeding
rate for SS was doubled in response to insufficient biomass production in 2011 and
consequently the SP seeding rate became SS 22.8 kg ha-1 and PP 28.5 kg ha-1. With
the same implement used in 2011, cover crops were seeded on July 18 2012. In 2012,
fertilizer treatment was assigned four weeks after cover crops emergence in the same
manner as 2011. Two weeks before cabbage transplanting on November 14, cover
crops were terminated in the same manner as 2011 (Table 2.2).
Cabbage Management
Cabbage transplants were produced in the greenhouses on the farm in 72-cell plastic
trays and Fafard Superfine Germination mix that consisted of peat, vermiculite,
dolomitic limestone, wetting agent, and a starter charge (Conrad Fafard Inc. Agawam,
MA) Seeds were planted on October 24 2011 and September 10 2012. Cabbage
transplants were managed for insects and diseases during both years, twice each year
with Dipel ES (Libertyville, IL) at the rate of 28 grams per gallon. Cabbage transplants
received 120 ppm N within one week of transplanting. Cabbage (cv. Bravo F1, Harris®
Seeds, Rochester, NY) was transplanted by hand on November 30, 2011 and October

41
24, 2012 at a density of about 35,000 plants per hectare. Sub-subplots consisted of two
rows of cabbage 7.5 m in length with plant and in-row spacing of 30 cm (12’’). Each
sub-subplot contained 40 plants. Cabbage was harvested on April 2, 2012 and February
27, 2013. Fertilizer (Super Rainbow Plant Food, Agrium®, Denver, CO) was applied at
transplanting at the rate of 85 kg N ha-1. Liquid ammonium fertilizer was applied to the
soil as a drench 4 and 8 weeks after transplanting (WAT) at a rate of 85 kg/ha (11% N,
35% P2O5, 0% K2O, Simplot, Hempstead, TX). Overhead irrigation was used to irrigate
when necessary based on soil moisture. Insecticides were applied three times during
the two-year experiment. Aphid infestations threatened the crop each year in the early
part of the season. Fulfill® 50 WG (Syngenta Canada Inc., Guelph, ON) was applied
once in week 8 during the 2011 growing season, and twice (week 6 and week 7) during
the 2012 season. In order to control black spot disease cause by a fungus (Alternaria
spp.) that occurred in both growing seasons 10 WAT, fungicides [Bravo (1.7 kg ha-1),
Endura (9oz ha-1), Cabrio (14 oz ha-1), Quaris (15 oz ha-1), and Maned (2.3 kg ha-1)]
were alternately applied on a weekly basis from 10 WAT to one week before harvest.
Weed removal was performed weekly by hand during 2011 and by plowing 8 WAT in
2012 in conventional tillage plots.
Data Collection
Cover crop biomass
At cover crop termination and before mowing and rolling operations, cover crop
and weed biomass were sampled in all sub-subplots. A 1 m2 quadrat was randomly
placed perpendicular to the bed in sub-subplots and cover crops and weeds were cut at
the soil level using hand clippers. Cut plant material was separated by cover crop

42
species, broadleaf weeds and grass weeds. Biomass was dried in a forced air drier at
70oC for at least 48h until constant weight, and then weighed.
Soil nutrients
Soil samples were taken at harvest in fall 2011and three times during fall 2012
growing seasons: at cover crop termination, 6 WAT and at harvest. During fall 2011, soil
samples were sorted into two categories from 32 points of fertilized and unfertilized sub-
subplots. In order to increase precision, during the 2012 growing season, 10 samples
were taken each time and grouped into four categories: 1) four samples from
unfertilized sub-subplots from four replicates; 2) four from fertilized sub-subplots from 4
replicates; 3) one sample from 32 points of unfertilized sub-subplots; 4) one sample
from 32 points of fertilized sub-subplots. Samples were collected using a hand probe
that was 5 cm in diameter to a soil depth of 15 cm. Six cores were collected in each
sub-subplot, combined in a bucket and thoroughly mixed prior to submission for
analysis. Samples were submitted to Waters Agricultural Laboratories, Inc. (Camilla,
GA) for analysis. Soil samples were analyzed using Mehlich 1 method for soil nutrient
content including nitrate nitrogen (Table 2-3).
Weed biomass in transplanted cabbage
Weeds removals were performed by hand during fall 2011 growing season and
by plowing during fall 2012 one, both at week 8 AT. Prior to the weeding operation,
weed biomass was sampled using a 0.5 m2 quadrat randomly placed along the width
within all sub-subplots. At harvest a second set of weed samples was collected within
every sub-subplot. Weed biomass was dried and weighed according to the procedure
previously described for cover crop biomass.

43
Cabbage yield and yield parameters
The harvest operation was performed on April 2, 2012 for the first growing
season and on February 21, 2013 for the second one. 15 plants were harvested in the
middle of each sub-subplot. Plants were pulled up, then cut to remove wrapper leaves
and weighed to determine fresh weight. Head height, head diameter, and head core
width were measured and recorded as well. Cabbage yield were determined on a head
weight basis. Cabbage head weight ranging within 0.5 kg (1 pound) or more was
considered as marketable according to the US Standards for Grades of Cabbage
(Shelton et al., 1982).
Statistical Analysis
Data from cover crop biomass, weed biomass, cabbage yield and yield
parameters were analyzed using repeated measures analysis (PROC GLIMMIX, SAS®
9.3, version 2006-2010 by SAS Institute Inc., Cary, NC, USA) in order to determine
main effects of cover crops planting, fertilizer, and tillage management as well as their
possible interactions. Means separation was performed using least squares means
(LSMeans). Results were considered significant at P≤0.05. Due to significant
interactions between years and main effect factors, the results are presented by year.
Results and Discussion
Weather conditions
Weather conditions were different between years. Cabbage harvest was delayed
in both years due to cold temperatures. During fall 2011, minimum and maximum
temperatures (T) were -1 and 26.9o C; respectively, at the beginning of cabbage
growing season, and 6.2 and 33.8o C at the end of the season. In contrast, during the
fall 2012 season, minimum and maximum T were 4.4 and 32.9o C at the beginning of

44
the season and -6 and 17o C at the end, respectively (Figure 2.1). This weather
condition may be contributed to decreasing cabbage yields during both years. However,
the fact that the weather was cooler in 2012 than 2011, this yield decrease observed in
cabbage was more important in fall 2012 than fall 2011 as well (Tables 2.11, 2.12, 2.14,
2.15, and 2.16).
Soil Nitrogen (nitrate)
At the end of the fall 2011 season, soil nitrate (NO3-) content in fertilized subplots
was less than unfertilized plots. Inversely, in fall 2012, soil nitrate was greater in
fertilized subplots than unfertilized plots (Table 2.3).This may be attributed to improved
mineralization and N uptake in fall 2011 than fall 2012.
Effect of Fertilizer on Cover Crop and Weed Biomass
Cover crop biomass
In 2011, cover crop biomass recorded as dry weight was greater for both SS and
SP than PP within both fertilized and unfertilized subplots (Table 2-5). Sorghum
sudangrass dry weight was 32% greater within fertilized subplots than unfertilized
subplots. Mixture dry weight was similar with SS dry weight within fertilized subplots and
was slightly greater within unfertilized subplots. Pigeon pea dry weight was not different
within both fertilized and unfertilized subplots. In 2012, except for PP where dry weight
within fertilized subplots was greater than unfertilized subplots, results were the same
as for 2011 among and between cover crop species. However, although SP dry weight
(4.1 and 1.2 ton ha-1) was slightly greater than SS dry weight (3.7 and 1.1 ton ha-1)
under both fertilization rates, both SP and SS dry weight increased in 2012 compared to
2011 (Table 2-5). This increase observed in SS and SP dry weight may be explained by
the fact that their seeding rates were increased in 2012. Pigeon pea dry weight

45
increased in 2012 as well. In this case, as PP was seeded at the same seeding rate
than 2012, this increase in biomass over that period seemed to be linked with planting
date and increase in air temperature during 2012 season (Figure 2.1). In 2011, during
the cover crop growing period the lowest monthly air temperature was below -2o C. At
such a low temperature, PP could not achieve its optimum growth. The optimal growing
temperature for PP ranges between 18-30o C (Valenzuela and Smith, 2002). Based on
that, it can be inferred that the lower the minimum monthly air temperature during the
growing season, the lower the biomass production for PP. However, because both SS
and PP are not cold tolerant, the greater biomass production of SS compared to PP
biomass may be attributed to a greater potential for SS to scavenge nutrients due to its
expansive root system and produce greater biomass. This observation is also
corroborated by Clark A. (2007) reporting that SS has potential to produce more organic
matter per acre, and at a less expense than any major cover crop cultivated in the US.
The greater biomass production observed within SS fertilized subplots than SS
unfertilized subplots is in accordance with Clark (2007) who reported that SS usually
required supplemental N for optimum growth. Though not significant, the mean dry
weight observed in SP subplots was numerically greater compared to the other subplots
is in accordance with previous studies, in particular those of Treadwell D. et al., 2008;
Balkcom et al., 2005, who concluded that cover crop combinations have the potential to
increase biomass production compared to monoculture cover crop plantings.
Weed biomass at cover crop termination
Grass species, particularly large crabgrass (Digitaria sanguinalis), crowfootgrass
(Dactyloctenium aegyptium) and nutsedge (Cyperaceae spp.) were predominant during
cover crop growth period over both years. Cover crop species and fertilizer interaction

46
effects were significant over both seasons for grass and total weed dry weight at CC
termination (P-value= 0.0005 and 0.0001 for one and two; respectively). In both growing
seasons, total weeds dry weights were reduced within SS and SP subplots compared to
PP subplots at CC termination independently of the presence of N added in week four
after CC emergence (Tables 3-6 and 3-7). Sorghum sudangrass and SP weed
suppression potential seemed to be independent of the addition of fertilizer. Grass weed
dry weights among unfertilized subplots were similar in 2011 and 2012. Additionally,
total weeds dry weights were similar among fertilized SS and SP subplots and
unfertilized SS and SP subplots; respectively (Table 2-6 and 2-7). During both years,
there was more weeds’ biomass in PP fertilized plots (1, 750 kg ha-1 and 630 kg ha-1
respectively, 2011 and 2012) compared to PP unfertilized plots (630 kg ha-1 and 250 kg
ha-1 respectively, 2011 and 2012). The addition of fertilizer to the legume cover crop
benefited weed growth more than the addition of fertilizer to SS.
Weed biomass during cabbage production
Following cabbage transplanting, there was a predominance of broadleaf species
compared to grass species. Florida pusley (Richardia scabra L.) was more abundant
among broadleaf species observed in transplanted cabbage during both growing
seasons. Because weeds removal was not performed in all subplots after cabbage
transplanting, results on weed dry weight are represent data collected 8 WAT than
weed dry weight obtained at harvest. In fall 2011, except within SS subplots where
weed dry weight was lower than the control of no cover crop, there were no significant
main effects of cover crops or fertilizer on weed dry weight compared to the control 8
WAT (Table 2-8). However, cover crop termination method did affect weed biomass in
transplanted cabbage. Weed dry weight was reduced in subplots where cover crops

47
were incorporated compared to subplots that were crimped and rolled (Table 2-8). The
greatest weed dry weight was recorded within NT sub-subplots. The increase in weed
biomass may be the result of a continued progression of weed growth in these sub-
subplots after cover crop termination. The lower weed biomass recorded in CT sub-
subplots may be due to the fact that weed seeds were buried by tillage and, moreover,
the critical weed-free period for cabbage is between 3 WAT and 4 WAT (Ontario
CropIPM, 2009) and that weeds emerging after that critical weed-free period were
smothered by well-established cabbage canopies in those sub-subplots.
In fall 2011, broad leaf dry weight or total weeds dry weight were not influenced
by main effects of cover crops or fertilizer at 8 WAT. However, cover crop termination
method and fertilizer did influence grass (monocots) weed dry weight. Weed (monocots)
dry weight was lower within unfertilized CT sub-subplots than fertilized CT sub-subplot
and NT subplots. Independently of the presence of fertilizer, monocot s’ weed dry
weight was lower within CT sub-subplots than NT sub-subplots (Table 2-9). This is
consistent with observations made in fall 2011. It may be inferred that the ability of the
cover crops to suppress weeds were not fertilizer-dependent when cover crop biomass
was incorporated. However, among NT systems, the addition of N fertilizer to cover
crops during the early growth stage resulted in the production of more biomass, more
surface residue, and thus more weed suppressive ability compared to systems that
included tillage and incorporation of cover residue.
Cabbage Yield and Yield Parameters
Cover crop planting and fertilizer main effects did not influence cabbage yield or
yield parameters in 2011 (Table 2-4). In 2011, there were two significant two-way
interactions (cover crop x cover crop termination method, and fertilizer x cover crop

48
termination methods) for cabbage yield and yield parameters. In 2012, the main effect
of cover crop did not affect marketable yield, percent of head weight, and wrapper
leaves. However, in 2012, there was a significant three-way interaction (cover crop x
fertilizer x cover crop termination methods) for every parameter studied (Table 2-4).
In fall 2011, total yields ranged from 30 to 54 ton ha-1 averaged across all
treatments, in fall 2012, total yields ranged from 15 to 47 ton ha-1. Marketable head
weight ranged from 6 to 38 ton ha-1 in fall 2011 and from 3 to 17 ton ha-1 in fall 2012.
The percent of head weights relative to head weight divided by total plant weight (sum
of head and wrapper leaves weights) ranged from 41.7% to 65.7% in fall 2011 and from
6.7% to 48.5% in fall 2012.Total yield, percent of heads, and marketable heads were
greater in fall 2011 than in fall 2012 (Tables 2-4, 2-10, 2-11 and 2-16; respectively). This
difference in both years may generally be due to the fact that it was cooler in fall 2012
than fall 2011 (Figure 2-1). The main effect of Pigeon pea in sub-subplots was
associated with in an increase in yield consistently both years. This is resulted to the
greater amount of readily-available soil NO3 released within these sub-subplots. Yields
were lowest in SP NT plots in fall 2011 and in SS NT plots in fall 2012.
Interaction Effects on Cabbage Yield and Yield Parameters
Fall 2011. Cover crop (CC) x Land preparation [cover crop termination methods
(CTM)] and fertilizer x CTM interactions effects significantly impacted total yield (TY),
percent of head weight (PHW), and marketable heads (MH). Cover crop x fertilizer did
not affect yield or yield parameters (Table 2-4). Therefore, it can be inferred that CTM
had more influence on yield than CC and fertilizer. Yields were significantly greater in all
CT sub-subplots than NT sub-subplots. Cover crops did not influence yields in CT sub-
subplots (Tables 2-10, 2-11, 2-12 and 2-13). The higher yield production observed in CT

49
sub-subplots may be attributed to a better mineralization rate of incorporated residues
and therefore resulted in more readily available soil NO3 for cabbage uptake. However,
TY and PHW within SS CT sub-subplots were not significantly different than TY and
PHW within PP NT sub-subplots. This may be explained by a possible immobilization of
soil nitrogen within SS NT sub-subplots by soil microbes representing main engine of
the soil mineralization. As a result, less soil NO3 was available in these sub-subplots for
plant uptake compared to PP sub-subplots. Balkcom et al. (2007, 2011) pointed out that
the presence of high carbon to nitrogen ration, referring to nitrogen immobilization by
grass cover crop species incorporated into the soil, may be due to nitrogen to carbon
ratio as reported by Balkcom et al. (2007, 2011). Within NT treatments, yields from sub-
subplots were as follows: PP > SS > SP ≥ NC. It may be concluded that with this no-till
system, the legume cover crop contributed to an increase of cabbage yield compared to
the grass cover crop. Cabbage total yield, percent of head weight, and marketable yield
were all influenced by the interaction effects of fertilizer x CTM (Table 2-4). However,
yields were significantly higher within all CT sub-subplots than NT sub-subplots which
means incorporated residues was a more important influence on yields than fertilized
residues on the surface (Tables 2-14 and 2-15). Within fertilized CT sub-subplots, yields
were greater than unfertilized CT sub-subplots. In contrast, although not significant,
yields from unfertilized NT sub-subplots trended greater than fertilized NT sub-subplots.
Fertilized cover crops managed as NT with residues remaining on the soil surface had
minimal influence on total cabbage yield compared to unfertilized cover crop NT sub-
subplots. The lack of yield response attributed to cover crop fertilizer treatments among

50
NT systems may be explained by cooler soil temperatures under the dense fertilized CC
residue that possibly reduced cabbage growth and, as a result, decreased yields.
Yield Parameters
Yield parameters wrapper leaf, head height, and head core width generally
reflected yield results. Cover crop x CTM interaction effects were significantly influenced
yield parameters (Table 2-4). Also, CTM main effect was significant. That means CTM
main effect counts for more variability than cover crops. In other words, CTM was a
more important influence on yield parameters. Head diameter (HD) was similar among
CT sub-subplots and NT sub-subplots. Among the NT sub-subplots, HD was greater
from plots planted to PP and SS monocultures than the SP mixture. Head height (HH)
was similar among CT sub-subplots. Head height was significantly higher within NT PP,
SS, and NC sub-subplots than NT SP sub-subplots. Head core width (HCW) was not
significantly different within CT sub-subplots and PP and SS NT sub-subplots. HCW
within CT sub-subplots was greater than HCW within NT PP and SS sub-subplots
(Tables 2-12, 2-13, 2-14, and 2-15). Based on these results, it can be inferred that HD
and HH parameters were better indicators of yield in cabbage than HCW.
Fall 2012
Significant three-way interaction effects (CC x CTM x fertilizer) were recorded for
every measured parameter in fall 2012 (Table 2-4). Thus, results are presented only for
the three-way interaction effects except for marketable heads. In that instance, the 3-
way interaction (P-value= 0.0343) was deemed weak because CC, CTM and fertilizer
factor influences on head weight were predominantly influenced by the two way
interaction of CC x CTM. Consequently, the two-way interaction (CC x CTM) effect
(P<0.0001) was presented instead for MH.

51
Cover crop x cover crop termination methods interaction effect on MH
Marketable head was significantly greater within CT sub-subplots than NT sub-
subplots. This may be explained by the fact that it was cool during fall 2012 growing
season, and that soil temperature was lower under residues cover crops even within
sub-subplots where residues were incorporated into the soil. This result is in
accordance with Walters and Young (2008) findings on zucchini with winter rye mulch in
cool weather. Marketable head yield was improved in PP and NC sun-subplots
regardless of tillage compared to SS and SP sub-subplots. This may be attributed to
the fact that soil NO3 was more accessible within these plots.
Cover crop x fertilizer x CTM interaction effects on TY, PHW, and WW
Total yield was better within PP and NC plots when all the three main effects
were present. TY was in general tend to be better within plots were cover crop residues
were incorporated than plots where cover crop residues were rolled on the soil surface.
Total yield was also greater when fertilized CC residues were absent within sub-
subplots with PP and NC both within CT and NT sub-subplots (Table 3-15). TY was
similar within CT sub-subplots with fertilized PP residues, no-till sub-subplots with
fertilized PP residues, and CT sub-subplots with fertilized NC residues.
Total yield was similar within CT fertilized sub-subplots with NT fertilized with PP
residues. Inversely, TY was significantly greater within NT fertilized SS sub-subplots
than CT fertilized sub-subplots. This may be due to N confiscation via dense
incorporated SS residue biomass. Although, within PP and SP subplots, tillage did not
significantly influence TY when fertilizer was present, the inverse was observed with
PHW where PHW were significantly higher within CT fertilized PP and SP sub-subplots,
respectively (Table 3-15). That means tillage played anyway an important role in

52
cabbage head formation. CC x fertilizer x CTM had a similar influence on wrapper
leaves weight. However, a significant difference between WW issued from fertilized CT
SP sub-subplots and NT fertilized sub-subplot was recorded. The lowest yields were
observed with SS residues when tillage and fertilizer were absent.
Cover crop x fertilizer x CTM interaction effects on yield parameters
Cover crops x Fertilizer x CTM interaction effects for yield parameters were
similar with 3-way interaction effects for yields. However, unlike yield, there were no
significant differences on HD when all the three factors were present than when either
tillage or fertilizer was absent within sub-subplots with PP (Table 2-16). Pigeon pea and
NC were significantly influence HD, HH, and HCW, respectively either when all the
three factors were present or when tillage was absent. There was a general trend,
independently of the CC main effect, for results to be significantly influenced by tillage
(incorporated cover crop residues) than no-till (cover crop residues laid on the soil
surface) either in presence or absence of fertilized residues. Overall, yield parameters
as well as yields were lowest within SS residues sub-subplots when tillage and fertilizer
were absent.
Conclusions
There were several environmental differences between both growing seasons.
For instance, cover crop biomass residues were denser in fall 2012 than fall 2011; fall
2012 growing season was cooler than fall 2011; and an extra 34 kg of N per hectare
were added to transplanted cabbage in fall 2012 growing season that provided
additional nutrients to bolster cabbage recovery following unseasonably cold
temperatures.

53
Overall, cabbage total and marketable yields were greater (44% to 50% for TY
and 50% to 86% for MH) in fall 2011 than fall 2012. In fall 2011, PP, SP, and NC
coupled with CT produced greater cabbage yields. In fall 2012, PP and NC produced
greater yields in presence of CT and fertilizer. Cabbage yield was greater within NT PP
sub-subplots than SS, SP, and NC sub-subplots. Within NT PP sub-subplots, cabbage
yield was greater when fertilizer was present. It can be concluded that the addition of 57
kg N ha-1 beforehand during cover crop growth benefited cabbage yield even with PP
legume cover crop. It can be concluded as well that incorporation of CC by tillage
promoted mineralization and therefore, resulted in greater cabbage yield than when
residues cover crops were laid on the soil surface as mulch.
Overall, for a better result, it would be enviable for vegetable growers working on
cover cropping systems to incorporate cover crop residues into the soil instead of laying
them on the soil surface. It would be beneficial as well whether a portion of fertilizer
would apply beforehand to cover crops during cover crop growth. Finally, when the
cultural objective within especially NT systems is yield increased, the use of PP could
be the better option.

54
A
B
Figure 2-1. Monthly air temperature at a height of 60 cm, relative humidity, and rainfall at a height of 2m ; A) Data related to 2011 growing season; B) Data related 2012 growing season; both downloaded from Florida Automated Weather Network (FAWN) for Live Oak, Florida.

55
Table 2-1. Cover crops repartition in kg ha-1and seeding rate establishment for summer 2011 and 2012 growing seasons in Live Oak Florida
Growing season
Pigeon pea (PP)
Sorghum sudangrass (SS) Mixture (PP xSS)
PP SS
2011
50 20 25 10
2012
50 40 25 20

56
Table 2-2. Main effect treatments arrangement according to the experimental design established during growing season 2011 and 2012 in Live Oak Florida.
zEven numbers correspond to no- till and odd numbers to tillage. NC: no cover (control); PP: pigeon pea (legume); SS: sorghum sudangrass (grass); SP: mixture b/w PP and SS.
TreatmentZ Cover Cropy Fertilizationx Tillage Methodsw
1
NC Y CT
NC N CT
2
NC Y NT
NC N NT
3
PP Y CT
PP N CT
4
PP Y NT
PP N NT
5
SS Y CT
SS N CT
6
SS Y NT
SS N NT
7
SP Y CT
SP N CT
8
SP Y NT
SP N NT

57
Figure 2-2. Sketch of the split split-plot design of the experiment laid out in Live Oak, Florida

58
Table 2-3. Soil chemical properties (0 -15 cm depth) of the experimental site in Live Oak Florida during fall 2011 and
2012.
Fall 2011 P K Mg Ca pH S B Zn Mn Fe Cu Nitrate N
Fert. Soil composite
At harvest
204 105 69 720 6.1 68 0.8 5.1 8 40 2.3 11.16
Unfert. Soil composite At harvest
165 91M 73 699 6.1 58 0.6 3.5 7 33 2.1 20.32
Fall 2012 Fert. Soil composite At cover crop termination
120 44 40 593 5.5 43 0.2 2.8 8 31 1.6 7.23
Week 6 after transplanting
120 110 38 572 5.8 15 0.3 2.6 7 24 1.1 16.97
At harvest
117 132 42 682 5.4 22 0.7 3.5 11 30 1.5 52.95
Unfert. Soil composite At cover crop termination
106 34 43 586 6.1 6 0.2 2.4 7 25 1.5 3.39
Week 6 after transplanting
103 73 35 526 6.0 6 0.3 1.9 6 27 1 19.47
At harvest 110 124 40 560 5.5 28 0.6 2.6 9 30V 1.3 28.04

59
Table 2-4. Analysis of variance summary for cover for cover crop dry weight, weed dry weight, cabbage total head weight, marketable head, percentage of head weight, wrapper leaf, head diameter, head height, and head core width as affected by cover crop planting type, fertilizer, and cover crop termination methods.
*Significant at P≤0.05; **significant at P≤0.001; ***significant at P≤0.0001; NS: not significant; df: degrees of freedom zCover crop;
ysingle Piegon pea and single
sorghum sudangrass planting, biculture of pigeon pea and sorghum sudangrass, and fallow no cover xtreatment consisting of addition of 57kg/ha to half of each
cover crops planting plot; wAt cover crop termination, one part of each cover crop planting was mowed and incorporated into the soil and the other part was
crimped and rolled on the soil surface. ACT: at cover crop termination; WAT: week after transplanting; G: grass; BL: broad leaf; Tot.: total; THW: total head weight
MH: marketable head (≥0.5 kg); PHW: percentage of head weight; WW: wrapper leaf; HD: head diameter; HH: head height; HCW: head core width.
Season Source df CDWz Weeds dry weight Yield and yield parameters
ACT 8 WAT THW MH PHW WW HD HH HCW
G BL Tot. G BL Tot.
Fall2011 Replication 3
Plantingy 3 *** *** ns *** ns ns ns ns ns ns ns ns ns ns
Fertilizationx 1 *** *** ns *** ns ns ns ns ns * ns ns ns ns
Land Pw 1 n/a n/a n/a n/a ns * * *** *** *** *** *** *** ***
2-way interactions
PlantingxLand P 3 n/a n/a n/a n/a ns ns ns * *** ** * *** ** **
PlantingxFertilization 3 *** ** ns * ns ns ns ns ns ns ns ns ns ns
Land PxFertilization 1 n/a n/a n/a n/a ns ns ns ** *** *** * *** *** **
3-way interactions
PlantingxLand Pxfert. 3 n/a n/a n/a n/a ns ns ns ns ns ns ns ns ns ns
Fall2012 Replication 3
Planting 3 ** ** ** ** ns ns ns ** ns ns ns ** ** **
Fertilization 1 *** * ns ns ns ns ns *** *** *** *** *** *** ***
Land P 1 n/a n/a n/a n/a ns ns ns *** *** *** *** *** *** ***
2-way interactions
PlantingxLand P 3 n/a n/a n/a n/a ns ns ns *** *** *** ns ** ** *
PlantingxFertilization 3 *** * ns * ns ns ns ns ns ns ns ns * ns
Land PxFertilization 1 n/a n/a n/a n/a * ns ns ns ns * * * ** *
3-way interactions
PlantingxLand Pxfert. 3 n/a n/a n/a n/a ns ns ns ** * ** ** ** ** **
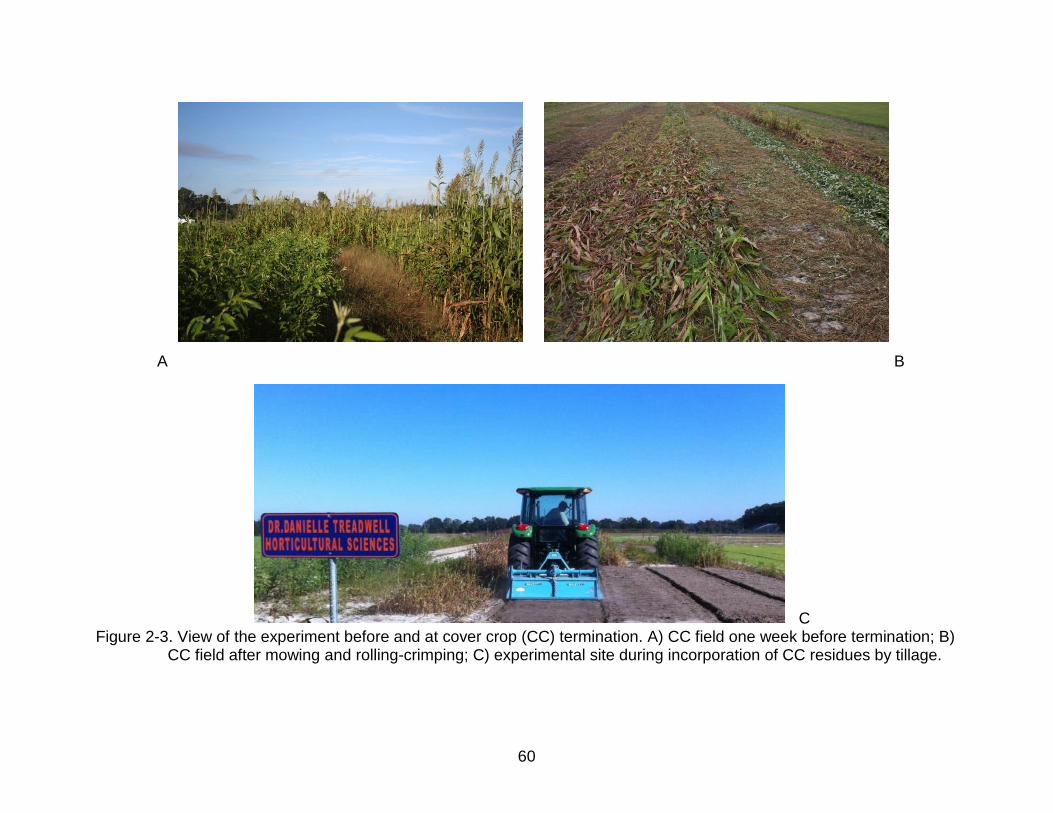
60
A B C Figure 2-3. View of the experiment before and at cover crop (CC) termination. A) CC field one week before termination; B)
CC field after mowing and rolling-crimping; C) experimental site during incorporation of CC residues by tillage.
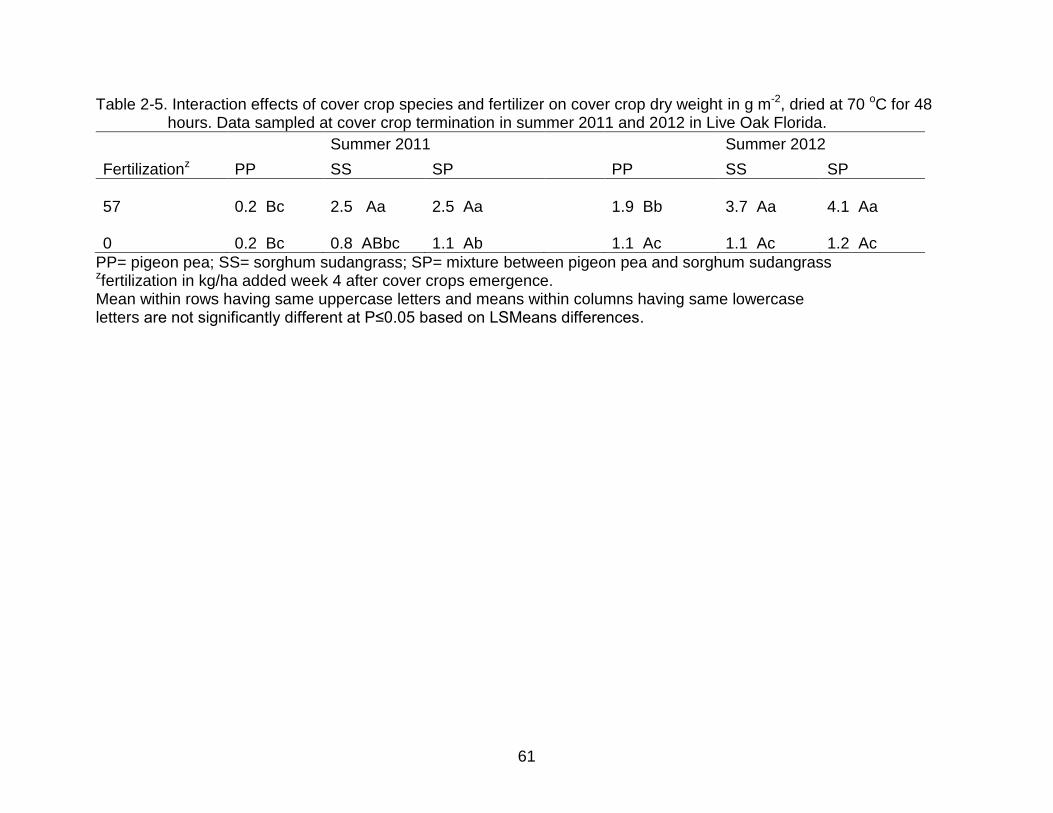
61
Table 2-5. Interaction effects of cover crop species and fertilizer on cover crop dry weight in g m-2, dried at 70 oC for 48 hours. Data sampled at cover crop termination in summer 2011 and 2012 in Live Oak Florida.
Summer 2011
Summer 2012
Fertilizationz PP SS SP PP SS SP
57 0.2 Bc 2.5 Aa 2.5 Aa
1.9 Bb 3.7 Aa 4.1 Aa
0 0.2 Bc 0.8 ABbc 1.1 Ab 1.1 Ac 1.1 Ac 1.2 Ac
PP= pigeon pea; SS= sorghum sudangrass; SP= mixture between pigeon pea and sorghum sudangrass zfertilization in kg/ha added week 4 after cover crops emergence. Mean within rows having same uppercase letters and means within columns having same lowercase letters are not significantly different at P≤0.05 based on LSMeans differences.

62
Table 2-6. Interaction effects of cover crop species and fertilizer on weed dry weight in g m-2, dried at 70 oC for 48 hours. Data sampled at cover crop termination in summer 2011 in Live Oak Florida.
Grass Total Fertilizationz PP SS SP NC PP SS SP NC 57 165 Bb 15 Cc 42 Cc 249 Aa 175 Bb 16 Cd 43 Ccd 264 Aa 0 55 Ac 9 Ac 8 Ac 73 Ac 63 ABcd 9 Bd 9 Bd 90 Ac S.E. 23 23 23 23 24 24 24 24 PP: pigeon pea; SS: sorghum sudangrass; SP: mixture between pigeon pea and sorghum sudangrass NC: no cover crop (control); zfertilization in kg/ha added week 4 after cover crops emergence; S.E.: standard error Mean within rows having same uppercase letters and means within columns having same lowercase letters are not significantly different at P≤0.05 based on LSMeans differences.

63
Table 2-7. Interaction effects of cover crop species and fertilizer on weed dry weight in g.m-2, dried at 70 oC for 48 hours. Data sampled at cover crop termination in summer 2012 in Live Oak Florida
Grass Total Fertilizationz PP SS SP NC PP SS SP NC 57 48 Bb 4 Cc 9 Cc 123 Aa 63 Bb 7 Cd 14 Ccd 145 Aa 0 18 Ac 11 Ac 12 Ac 48 Ac 25 ABcd 17 Bd 16 Bd 89 Ac S.E 16 16 16 16 14 14 14 14 PP: pigeon pea; SS: sorghum sudangrass; SP: mixture between pigeon pea and sorghum sudangrass NC: no cover crop; zfertilization in kg/ha added week 4 after cover crops emergence. SE: standard error Mean within rows having same uppercase letters and means within columns having same lowercase letters are not significantly different at P≤0.05 based on LSMeans differences.

64
Table 2-8. Effects of cover crops, fertilizer, and tillage on weed dry weight in g m-2 in cabbage (Brassica oleracea cv. Bravo). Data sampled week 8 after transplanting in fall 2011 in Live Oak, Florida.
Main effects Grass Broadleaf Total
Cover crops treatment Pigeon pea 0.01 0.84 ab 0.85 ab
Sorghum sudan. 0.01 0.44 b 0.45 b
Mixture 0.10 1.63 ab 1.8 ab
No cover 0.00 2.44 a 2.44 a
S.E.M. 0.06 0.59 0.60
P-value 0.2612 0.0932 0.0793
Fertilization treatment Yesz 0.02 0.99 1.02
No 0.06 1.68 1.74
S.E.M. 0.04 0.42 0.41
P-value 0.5851 0.2512 0.2237
Tillage treatment Till 0.01 0.62 b 0.63 b
No-till 0.07 2.1 a 2.13 a
S.E.M. 0.04 0.42 0.41
P-value 0.3149 0.0193 0.0139 z57 kg of N/ha added week 4 after cover crops emergence. Means separation within columns grouped by LSMeans at P≤0.05. Means bearing the same letters are not significantly different
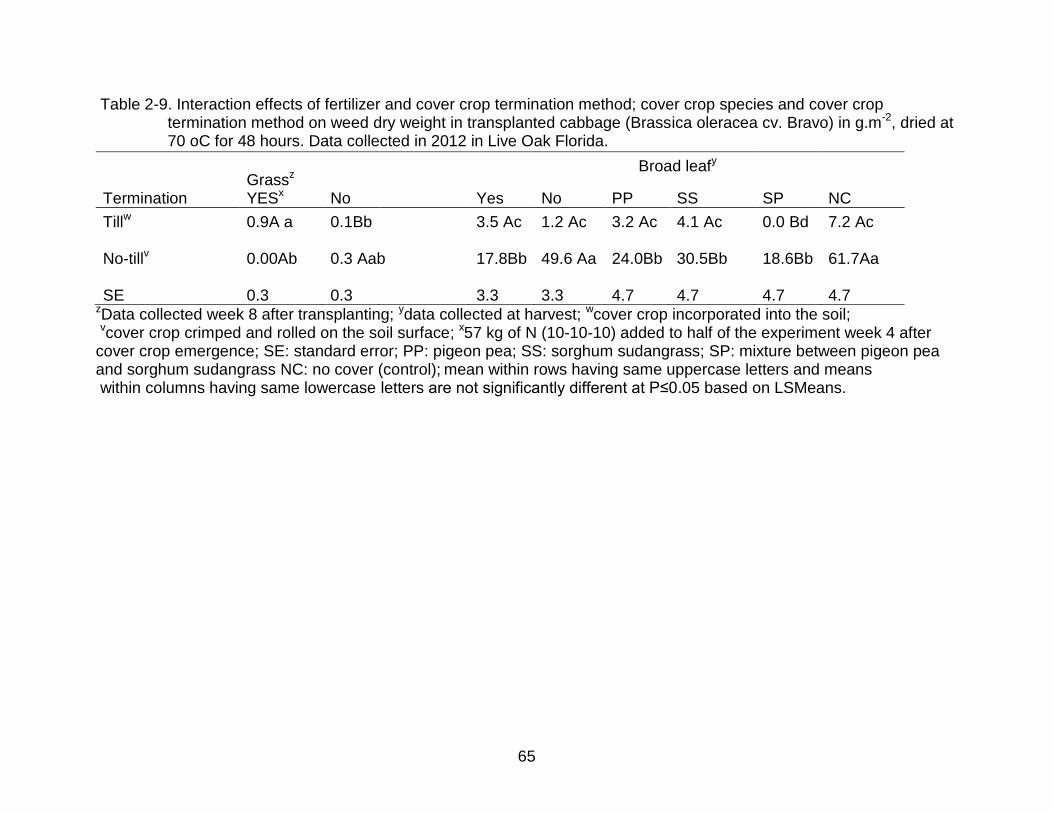
65
Table 2-9. Interaction effects of fertilizer and cover crop termination method; cover crop species and cover crop termination method on weed dry weight in transplanted cabbage (Brassica oleracea cv. Bravo) in g.m-2, dried at 70 oC for 48 hours. Data collected in 2012 in Live Oak Florida.
Grassz YESx
No
Broad leafy
Termination Yes No PP SS SP NC
Tillw 0.9A a 0.1Bb
3.5 Ac 1.2 Ac 3.2 Ac 4.1 Ac 0.0 Bd 7.2 Ac No-tillv 0.00Ab 0.3 Aab 17.8Bb 49.6 Aa 24.0Bb 30.5Bb 18.6Bb 61.7Aa SE 0.3 0.3 3.3 3.3 4.7 4.7 4.7 4.7
zData collected week 8 after transplanting; ydata collected at harvest; wcover crop incorporated into the soil; vcover crop crimped and rolled on the soil surface; x57 kg of N (10-10-10) added to half of the experiment week 4 after cover crop emergence; SE: standard error; PP: pigeon pea; SS: sorghum sudangrass; SP: mixture between pigeon pea and sorghum sudangrass NC: no cover (control); mean within rows having same uppercase letters and means within columns having same lowercase letters are not significantly different at P≤0.05 based on LSMeans.
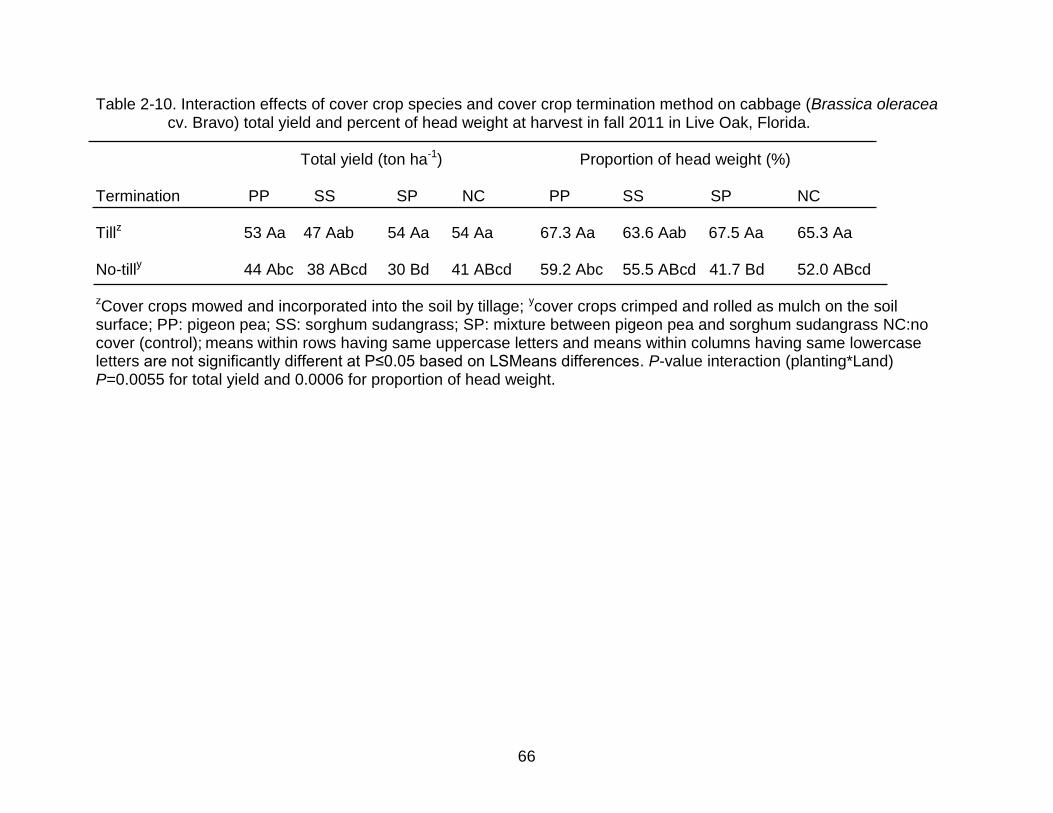
66
Table 2-10. Interaction effects of cover crop species and cover crop termination method on cabbage (Brassica oleracea cv. Bravo) total yield and percent of head weight at harvest in fall 2011 in Live Oak, Florida.
Total yield (ton ha-1) Proportion of head weight (%) Termination PP SS SP NC PP SS SP NC Tillz 53 Aa 47 Aab 54 Aa 54 Aa 67.3 Aa 63.6 Aab 67.5 Aa 65.3 Aa No-tilly 44 Abc 38 ABcd 30 Bd 41 ABcd 59.2 Abc 55.5 ABcd 41.7 Bd 52.0 ABcd
zCover crops mowed and incorporated into the soil by tillage; ycover crops crimped and rolled as mulch on the soil surface; PP: pigeon pea; SS: sorghum sudangrass; SP: mixture between pigeon pea and sorghum sudangrass NC:no cover (control); means within rows having same uppercase letters and means within columns having same lowercase letters are not significantly different at P≤0.05 based on LSMeans differences. P-value interaction (planting*Land) P=0.0055 for total yield and 0.0006 for proportion of head weight.

67
Table 2-11. Interaction effects of cover crop species and cover crop termination method on cabbage (Brassica oleracea cv. Bravo) wrapper leaf and marketable head at harvest in fall 2011 in Live Oak, Florida.
Wrapper leaf (ton ha-1) Marketable head (ton ha-1) Termination PP SS SP NC PP SS SP NC Tillz 15 Aa 15 Aab 17 Aa 15 Aa 33 Aa 30 Aab 38 Aa 36 Aa No-tilly 15 Abc 14 ABcd 12 Bd 14 ABcd 24 Abc 8 ABcd 6 Bd 9 ABcd zCover crops mowed and incorporated into the soil by tillage; ycover crops crimped and rolled as mulch on the soil surface; PP: pigeon pea; SS: sorghum sudangrass; SP: mixture between pigeon pea and sorghum sudangrass NC:no cover (control); means within rows having same uppercase letters and means within columns having same lowercase letters are not significantly different at P≤0.05 based on LSMeans differences. P-value interaction (planting*Land) P=0.0094 for wrapper leaf and 0.0003 for marketable head.
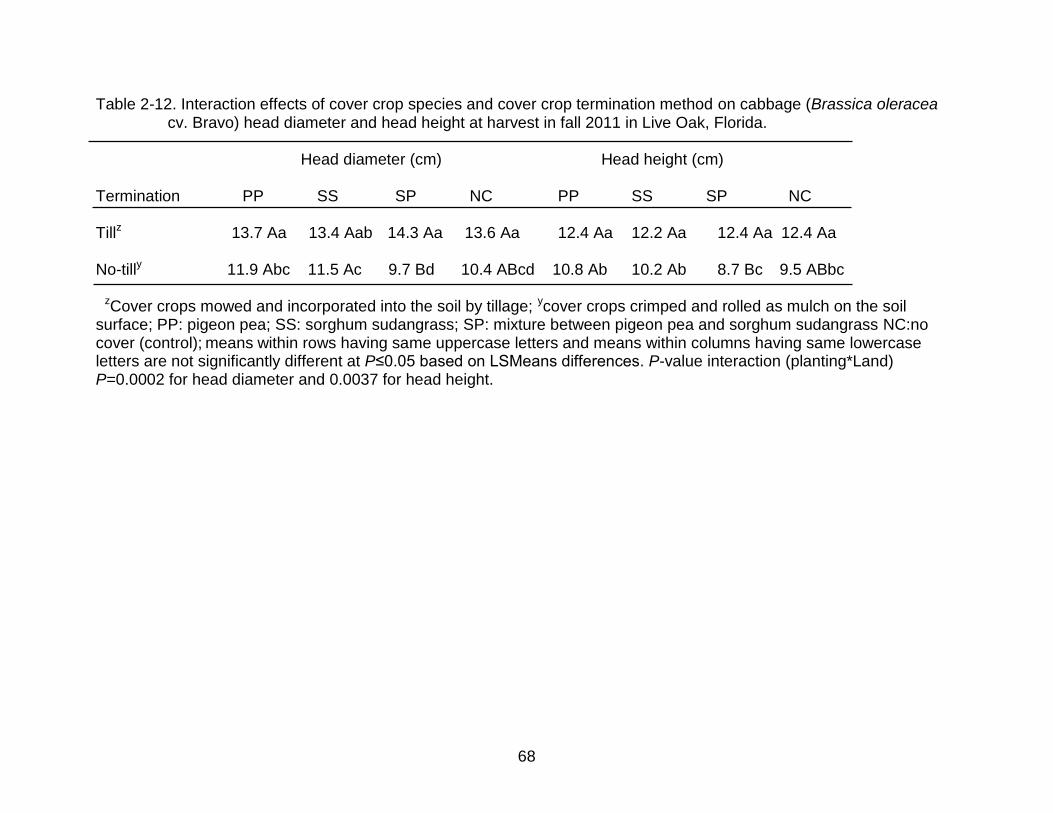
68
Table 2-12. Interaction effects of cover crop species and cover crop termination method on cabbage (Brassica oleracea cv. Bravo) head diameter and head height at harvest in fall 2011 in Live Oak, Florida.
Head diameter (cm) Head height (cm) Termination PP SS SP NC PP SS SP NC Tillz 13.7 Aa 13.4 Aab 14.3 Aa 13.6 Aa 12.4 Aa 12.2 Aa 12.4 Aa 12.4 Aa No-tilly 11.9 Abc 11.5 Ac 9.7 Bd 10.4 ABcd 10.8 Ab 10.2 Ab 8.7 Bc 9.5 ABbc zCover crops mowed and incorporated into the soil by tillage; ycover crops crimped and rolled as mulch on the soil surface; PP: pigeon pea; SS: sorghum sudangrass; SP: mixture between pigeon pea and sorghum sudangrass NC:no cover (control); means within rows having same uppercase letters and means within columns having same lowercase letters are not significantly different at P≤0.05 based on LSMeans differences. P-value interaction (planting*Land) P=0.0002 for head diameter and 0.0037 for head height.

69
Table 2-13. Interaction effects of cover crop species and cover crop termination method on cabbage (Brassica oleracea cv. Bravo) head core width at harvest in fall 2011 in Live Oak, Florida.
Head core width (cm) Termination PP SS SP NC Tillz 3.0 Aa 2.9 Aab 3.0 Aa 2.9 Aab No-tilly 2.6 Aabc 2.5 Abc 2.1 Bd 2.3 ABcd
zCover crops mowed and incorporated into the soil by tillage; ycover crops crimped and rolled as mulch on the soil surface; PP: pigeon pea; SS: sorghum sudangrass; SP: mixture between pigeon pea and sorghum sudangrass NC:no cover (control); means within rows having same uppercase letters and means within columns having same lowercase letters are not significantly different at P≤0.05 based on LSMeans differences. P-value interaction (planting*Land) P=0.0033.

70
Table 2-14. Interaction effects of fertilized cover crop residues and cover crop termination method on cabbage (Brassica oleracea cv. Bravo) yields and yield parameters at harvest in fall 2011 in Live Oak, Florida.
TY PHW HD HH HCW Termination 57z 0y 57 0 57 0 57 0 57 0 Tillx 54Aa 51Bb 66.8Aa 65.1Aa 14.3Aa 13.2Bb 12.8Aa 11.9Bb 3.0Aa 2.9Aa No-tillw 35Ac 41Ac 46.3Bc 57.9Ab 10.2Bd 11.5Ac 9.3Bd 10.2Ac 2.3Bc 2.5Ab z57 kg N ha-1 (10-10-10) added to half of the experiment week 4 after cover crop emergence; ythe other half with no fertilizer (0 kg N ha-1); xCover crops mowed and incorporated into the soil by tillage; wcover crops crimped and rolled as mulch on the soil surface; TY: total yield in ton ha-1; PHW: proportion of head weight in %; HD: head diameter; HH: head height; and HCW: head core width; respectively in cm. Means within rows having same uppercase letters and means within columns having same lowercase letters are not significantly different at P≤0.05 based on LSMeans differences.

71
Table 2-15. Interaction effects of fertilized cover crop residues and cover crop termination method on cabbage (Brassica oleracea cv. Bravo) wrapper leaf weight and marketable yield in ton ha-1 at harvest in fall 2011 in Live Oak, Florida.
WW MH 57z 0y 57 0 Tillx 17 Aa 15 Bb 38 Aa 30 Bb No-tillw 14 Ac 11 Ac 18 Ac 21 Ac z57 kg of N (10-10-10) added to half of the experiment week 4 after cover crop emergence; ythe other half with no fertilizer; xCover crops mowed and incorporated into the soil by tillage; wcover crops crimped and rolled as mulch on the soil surface; WW: wrapper leaf; MH: marketable head; means within rows having same uppercase letters and means within columns having same lowercase letters are not significantly different at P≤0.05 based on LSMeans differences.

72
Table 2-16. Interaction effects of cover crop species, fertilizer, and tillage on cabbage (Brassica oleracea cv. Bravo) total yield and wrapper leaf in ton ha-1 , and proportion of head in % at harvest in fall 2012 in Live Oak, Florida.
Interaction effectsz PP SS SP NC
57 kg of N/ha
Total Yield
Tilly
44 AaA 27BdBw 30 AcdB 47 AaA
No-tillx 39 AabA 32 AbcAB 26 AdC 30 BcdBC
0 kg of N/ha Till 33 AbcA 24 AdeB 23 AdefB 35 AbA
No-till 26 BdA 15 BfC 20 AefBC 23 BdefABC
57 kg of N/ha
Wrapper leaf Till 23 AaA 20 AbAB 21 abA 21 abA
No-till 21 AabA 21 AabA 17 cdB 17 cdB
0 kg of N/ha Till 18 AbcA 17 AcdA 17 AcdA 18 AbcA
No-till 17 BcdA 14 AdA 15 AdA 15 BdA
57 kg of N/ha
Prop. of head weight Till 40.9 AaA 22.0 AdeB 24.7 AdB 48.5 AaA
No-till 38.9 BbcA 24.3 AdB 19.3 BeC 26.8 BcdAB
0 kg of N/ha Till 38.8 AbcB 20.7 AdeC 21.3 AdeC 39.1 AabA
No-till 28.2 AcdA 6.7 BfC 14.4 AeB 23.9 BdA zThree way interaction significant P=0.0046,0.0012 & 0.0031 total yield, wrapper leaf & proportion of head, respectively. Nitrogen fertilizer (10-10-
10) was added in half of the experiment at the rate of 57 kg/ha week 4 after cover crop emergence. yCover crops mowed and incorporated into the
soil by tillage; xcover crops crimped and rolled as mulch on the soil surface. PP: pigeon pea; SS: sorghum sudangrass; SP: mixture (PP+SS); NC:
control (no cover); wPair means within columns having same left uppercase letters, means within rows having same right uppercase letters, and
means within columns having same lowercase letters do not differ at P≤0.05 according to least square.

73
Table 2-17. Interaction effects of cover crop species, fertilizer, and tillage on cabbage (Brassica oleracea cv. Bravo) head diameter, head height, and head core width in cm at harvest in fall 2011 and 2012 in Live Oak, Florida.
Fall2011z
PP
Fall 2012y
SS SP
NC Interaction effects PP SS SP NC
HD
57 kg of N/ha Tillx 35.3 32.2 33.2 34.1
26.2 AaAv 14.8 AcC 17.2 AbcBC 27.8 AaA
No-tillw 26.5 25.8 20.9 23.9
24.5 AaA 17.8 AbcB 12.7 BdC 17.5 BbcB 0 kg of N/ha
Till 29.4 31.3 34.4 30.3
23.2 AaA 14.8 AcB 14.8 AcB 24.9 AaA
No-till 29.9 29.4 25.1 25.4
18.7 BbA 5.5 BeB 10.0 BeB 16.1 BbA 57 kg of N/ha
HH
Till 32.0 30.0 29.4 31.3
22.5 AabA 14.2 AdeB 15.6 AcdB 24.5 AaA No-till 24.0 23.0 19.2 22.3
22.0 AabA 15.4 AdeBC 11.1 BfC 15.6 BcdB
0 kg of N/ha Till 26.6 29.2 30.3 27.7
19.9 AcA 12.7AbB 14.2 AdeB 21.0 AbcA
No-till 26.6 25.7 22.3 22.8
15.4 BdeA 4.7 BgB 8.8 BfgB 13.3 BeA 57 kg of N/ha
HCW
Till 7.6 7.1 7.1 7.1
6.4 AaA 4.7 AcdB 4.7 AcdB 6.4 AaA No-till 5.9 5.7 4.7 5.4
5.9 AaA 4.7 AcdB 3.3 BefC 4.7 BcdB
0 kg of N/ha Till 7.1 7.1 7.3 6.8
5.5 AbcA 4.3 AdeB 4.3 AdeB 5.7 AabcA
No-till 6.4 6.2 5.5 5.5 4.7 AcdA 1.5 BgC 2.6 BfgC 4.0 BeB zThree way interaction not significant P=0.2775, 0.2589 & 0.5330 for head diameter, head height & head core width, respectively.
yThree way interaction significant
P=0.0275,0.0082 & 0.0045 for head diameter, head height & head core width, respectively. Nitrogen fertilizer (10-10-10) was added in half of the experiment at the rate of 57 kg/ha week 4 after cover crop emergence. x
Cover crops mowed and incorporated into the soil by tillage; wcover crops crimped and rolled as mulch on
the soil surface. PP: pigeon pea; SS: sorghum sudangrass; SP: mixture (PP+SS); NC: control (no cover); HD: head diameter; HH: head height; HCW: head core width;
vPair means within columns having same left uppercase letters, means within rows having same right uppercase letters, and means within columns having
same lowercase letters do not differ at P≤0.05 according to least square.

74
Figure 2-4. Cabbage pictures collected at harvest for fall 2012 in Live Oak, Florida. A) Represented cabbage issued from
sub-subplots with cover crop residue biomass incorporated in the soil by tillage (CT); B) Displayed cabbage issued from sub-subplots with cover crop residue biomass rolled and laid as mulch on the soil surface (NT). In each single picture, cabbage on the left was issued from unfertilized residue biomass sub-subplots and cabbage placed on the right from fertilized residue biomass. PP: pigeon pea; SS: sorghum S.; SP: mixture (SSxPP); ans NC: no cover (control).
SP-CT PP-CT
SS-CT NC-CT
SP-NT
NC-NT SS-NT
PP-NT
A
B

75
CHAPTER 3 PIGEON PEA (Cajanus cajan (L.)Millsp.) AND SORGHUM SUDANGRASS [Sorghum
bicolor (L.) MOENCH VAR. sudanense (PIPER) HITCHC.] MANAGEMENT CHANGES THE POPULATION OF PEST AND BENEFICIAL INSECTS IN CABBAGE.
Benefits obtained from the use of cover crops include increasing soil biological
activity, creating or reconciling environmentally friendly and sound sustainable
ecosystems, and contributing to weed, disease and insect suppression (Snapp et al.,
2005). The bottom-line in cover crop integration is an overall enhancement of farm
ecology. Cover crops remain important to improve crop quality and to lower production
costs. Cover crops have become a pillar on North American farms. In controlled tillage
systems with a suitable variety choice and sufficient biomass, cover crops have
potential to suppress weeds, diseases, nematodes and insect pests. Farmers and
researchers who view the farm as an agro-ecosystem have made the use of cover
crops a veritable tool to sustainably manage the cropland and preserve farm’s natural
resources.
Well-thought sustainable pest management commences with establishment of
healthy soils. However, building healthy soil is not limited to increasing soil organic
matter. Soil organic matter increases with the incorporation of animal-based residues
and crop residues into the soil. Integration of cover crops can lower soil erosion, reduce
runoff, enhance water infiltration, soil structure, soil organic matter, and increase soil
flora and fauna (Reeves; 1994). Research in South Georgia reported that crops grown
on biologically active soils resist pest pressure far better than those cultivated on low
fertility soils.
In balanced ecosystems, insect pests can be managed by remained in control by
their natural enemies (Sustainable Agriculture Network, 2005). Natural enemies, or

76
beneficial insects, include predators, parasitoids, and parasites. Beneficial insects can
be attracted by a diversity of cover crop species. Brunson (1991) reported that 13
known beneficial insects associated with cover crops were identified during the
vegetable production season in South Georgia. Brunson (1991) identified more than
120 species of beneficials including arthropods, spiders and ants in cotton fields that
were managed with cover crop residues on the soil surface and no insecticides were
applied. In Mississippi, Georgia, and Alabama, research on summer vegetables planted
in residues of cool-season cover crops illustrated that many beneficial insects relocated
from adjacent areas to surface residues to attack crop pests (Bugg, 1992). In
conjunction with these findings, Tumlinson et al. (1993) reported that when crops are
attacked by pests, they transmit chemical signals that attract beneficial insects that are
active predators. Cover crop management strategies may also be important tools
leading to the modification of insect populations and enhancement of crop productivity.
Following this rationale, Altieri (1994) and Reeves (1994) reported that conservation
tillage and cover crops can contribute to lower production costs via enhanced soil
relationships and long-term soil productivity, increased niche for beneficial insects and
greater agro-ecosystem stability. Conservation tillage along with cover crops promotes
year-round natural enemy and pest interactions by providing alternate prey or hosts,
reproductive sites, and shield against adverse conditions.
Sorghum sudangrass hybrid has been in use in the US as a summer cover crop
on many southeastern farms. Sorghum sudangrass has been documented to attract
beneficial insects and in particular lady beetles that help control aphids. Epieru (1997)
found that cotton grown in combination with various crops including sorghum increased

77
the occurrence of common predators such as coccinellidae, anthocoridae, spiders, ants,
earwings, rove beetles, chrysopids, and syrphids. Sharma et al. (2004) found that
sorghum harbored more natural enemies of cotton bollworms than other crops and gave
evidence of the migration of predators between sorghum and cotton. Pigeon pea, on the
other side, has been found efficient in attracting predators (arthropods) when
intercropped (Odeny, 2007, Valenzuela and Smith, 2002).
Despite cover crops appearance of playing a leading role in IPM by maximizing
natural enemy-pest interactions, research in that area is limited. Many published
accounts are focused on cover crops and natural enemy-pest interactions have been
conducted in the north with winter species. Currently, research on cover crops in
conservation tillage systems is conducted primarily in row crop systems such as cotton,
corn, wheat etc., and more often in temperate climates than in subtropical and tropical
agro-ecosystems. McCutcheon et al., (1995), Ruberson et al. (1995), and McCutcheon
(2000) stated that further research needs to be focused on cover crops with
conservation tillage in cropping systems in the south to increase beneficial insects. It is
true that cover crops in conservation tillage systems promote a simple approach to
managing pests, but more information on the effects of cover crops on key pest and
beneficial insect populations are needed to facilitate appropriate decision-making. The
objective of this 2-year field experiment was to determine how pigeon pea and sorghum
sudangrass planting arrangement and tillage method influences key pests and
beneficial insects in cabbage (Brassica oleracea L.). It was hypothesized that pigeon
pea and sorghum sudangrass planting arrangements and termination strategies would

78
differentially influence the density and diversity of insect pests and beneficials in fall
cabbage.
Materials and Methods
Experimental Site
The experiment was conducted in Live Oak, Florida at the University of Florida-
IFAS North Florida Research and Education Center-Suwannee Valley during the
summer and fall 2011 and was repeated during the same period in 2012. The soil type
was a find deep sandy loam (websoilsurvey.nrcs.usda.gov), Blanton-Foxwort-Alpin
complex soil series. The average monthly temperature and rainfall of the experimental
location during the growing season for 2011and 2012 are presented in Figure 2.1.
Experimental Design
Treatments were arranged in a split-split plot design and were replicated four
times. The experiment contained 4 main plots, 16 subplots, and 64 sub-subplots. The
main plot treatments were randomized within each block and consisted of three cover
crop plantings: 1) pigeon pea Cajanus cajan L. Millsp. monoculture (PP); 2) sorghum
Sudangrass (Sorghum bicolor L. Moench.) (SS) monoculture; and 3) a biculture of
pigeon pea (Cajanus cajan L. Millsp.) and sorghum Sudangrass, (Sorghum bicolor L.
Moench.) (SP). These cover crop plantings were compared to a fourth treatment of no
cover crop (NC) as a control (Table 3.1). Subplots were constituted four weeks after
cover crops emergence by dividing the main plot factor in half with an application of
fertilizer (10-10-10). One half of the plot received 57 kg N ha-1 (FERT) and the other half
received no fertilizer (NO FERT). The fertilizer analysis was 10% nitrogen (N), 10%
phosphorus (P2O5) and 10% potassium (K2O), and was applied at a rate of 57 kg N ha-
1, 16 kg P ha-1 and 47.2 kg K ha-1. At cover crop termination, sub-subplots were

79
established by splitting subplots with one of two cover crop termination strategies.
Cover crops were either mowed with a rotary mower and soil incorporated in a single
pass with a rototiller (CT) or crimped and rolled with a roller-crimper (NT constituting
thus tilled or no-till plots. Main plots measured 12.2 by 70 m (subplots measured 1.5 by
15 meters and sub-subplot measured 1.5 by 7.5 m (Figure 3.2). Cabbage was utilized
as a test crop to determine effect of fertilized cover crop planting arrangement and
tillage management on cabbage quality and yield.
Cover Crop Management
Prior to planting the cover crops, the experimental site was in native vegetation
composed predominantly of bahia grass (Paspalum notatum). Plots were disked with a
rolling disk harrow. In 2011, cover crops were seeded on August 8 with a Great Plains
No-Till Grain Drill (model 606 NT, Wichita, KS) 7.5 in row spacing at a rate of 22.8 kg
ha-1 for SS and 57 kg ha-1 for PP. The SP was seeded using half of the seeding rate for
each of the single species: SS 11.4 kg ha-1 and PP 28.5 kg ha-1. In 2012, the seeding
rate for SS was doubled in response to insufficient biomass production in 2011 and
consequently the SP seeding rate became SS 22.8 kg ha-1 and PP 28.5 kg ha-1. With
the same implement used in 2011, cover crops were seeded on July 18 2012. In 2012,
fertilizer treatment was assigned four weeks after cover crops emergence in the same
manner as 2011. Two weeks before cabbage transplanting on November 14, cover
crops were terminated in the same manner as 2011 (Table 3.2).
Cabbage Management
Cabbage transplants were produced in the greenhouses on the farm in 72-cell plastic
trays and Fafard Superfine Germination mix that consisted of peat, vermiculite,
dolomitic limestone, wetting agent, and a starter charge (Conrad Fafard Inc. Agawam,

80
MA) Seeds were planted on October 24, 2011 and September 10, 2012. Cabbage
transplants were managed for insects and diseases during both years, twice each year
with Dipel ES (Libertyville, IL) at the rate of 28 grams per gallon. Cabbage transplants
received 120 ppm N within one week of transplanting. Cabbage (cv. Bravo F1, Harris®
Seeds, Rochester, NY) was transplanted by hand on November 30, 2011 and October
24, 2012 at a density of about 35,000 plants per hectare. Sub-subplots consisted of two
rows of cabbage 7.5 m in length with plant and in-row spacing of 30 cm (12’’). Each
sub-subplot contained 40 plants. Cabbage was harvested on April 2, 2012 and February
27, 2013. Fertilizer (Super Rainbow Plant Food, Agrium®, Denver, CO) was applied at
transplanting at the rate of 85 kg N ha-1. Liquid ammonium fertilizer was applied to the
soil as a drench 4 and 8 weeks after transplanting (WAT) at a rate of 85 kg/ha (11% N,
35% P2O5, 0% K2O, Simplot, Hempstead, TX). Overhead irrigation was used to irrigate
when necessary based on soil moisture. Insecticides were applied three times during
the two-year experiment. Aphid infestations threatened the crop each year in the early
part of the season. Fulfill® 50 WG (Syngenta Canada Inc., Guelph, ON) was applied
once in week 8 during the 2011 growing season, and twice (week 6 and week 7) during
the 2012 season. In order to control black spot disease cause by a fungus (Alternaria
spp.) that occurred in both growing seasons 10 WAT, fungicides [Bravo (1.7 kg ha-1),
Endura (9oz ha-1), Cabrio (14 oz ha-1), Quaris (15 oz ha-1), and Maned (2.3 kg ha-1)]
were alternately applied on a weekly basis from 10 WAT to one week before harvest.
Weed removal was performed weekly by hand during 2011 and by plowing 8 WAT in
2012 in conventional tillage plots.

81
Data Collection
Sampling. Sampling methods were similar during both years. Key cabbage
insect pests and beneficial insects were sampled using in situ counts, unbaited
(TRÉCÉ® Inc.) yellow sticky cards, and pitfall traps (Figure 3.3). In both years, sampling
started two week after cabbage transplanting, continuing every two weeks until cabbage
head fill. Sampling started on December 19, 2011 and was terminated on March 12,
2012 for the 1st year. During the 2nd year, sampling started on November 12, 2012 and
finished on January 14, 2013. Systematic sampling was established by collecting
samples every other week from a starting point randomly chosen during the setting of
the first traps (Figure 3.4). In the visual (in situ) count, a total of five plants were
sampled from the two rows of each sub-subplot. The youngest cabbage leaves were
carefully observed (Figure 3.3C) for aphids, whiteflies and worms including
(Diamondback moth and Cabbage looper). Pitfall and yellow sticky traps were placed in
the field for four days and then collected, taken back to the laboratory at horticultural
sciences department of University of Florida for counting and identification. In the field,
yellow cards were vertically attached on stakes, randomly placed in each sub-subplot,
at a height greater than 0.30 m and less than 1 m (Figure 3.3A). For pitfall traps,
transparent solo cups were put in previously dug holes in each sub-subplot (Figure
3.3B), and filled with water mixed with detergent to disrupt the surface tension (MCNeill
et al., 2012; Webb et al., 1994). At the lab, a subsampling technique was applied to
assess massive flying aphids collected on the yellow sticky cards by randomly selected
six small squares on each side of the yellow card which was beforehand wrapping with
a transparent paper (Figure 3.5) (Liburd et al., 2009). This sampling tactic excludes

82
errors from counting and decreases the time allocated per trap (Liburd et al., 2009). A
40X electronic microscope was used to identify microscopic insects.
Statistical Analysis
Data from all sampling strategies were analyzed using repeated measures
analysis (PROC GLIMMIX, SAS® 9.3, version 2006-2010 by SAS Institute Inc., Cary,
NC, USA) in order to determine mean effects of cover crops planting, fertilizer, and
tillage management as well as their possible interactions. Means separation was
performed using least squares means (LSMeans). Results were considered significant
at P≤0.05.
Results and Discussion
Effect of Cover Crops and Tillage on Insect Populations from Pitfall Traps
Species collected in the pitfall traps were predominantly natural enemies during
both growing seasons. Groups of species captured included spiders (Oxyopidae,
Licosidae and Araneae), fire ants (FA), wasps (mostly Braconidae, Aphidiidae and
Trichogrammatidae), syrphid flies (SF) particularly hover flies, and ground beetles
(Carabidea and Staphynilidae). Aphids, including green peach (Myzus persicae) and
turnip (Lipaphis erysimi) were the only insect pests recorded from pitfall traps during the
experiment. Statistical analysis revealed no interactions between cover crops planting,
fertilizer, and tillage methods on natural enemies’ populations except for ground beetles
(GB) in fall 2011 and FA in fall 2012; respectively, where a two-way interaction between
fertility and tillage was recorded (Table 3-3). A significantly greater number of SF and
aphids were recorded in fall 2011 in sorghum sudangrass subplots compared to other
treatments. Syrphid flies were found in significant number as well in fertilized plots in fall
2011. Aphid populations were greater in fertilized plots in fall 2012. This may be due to

83
the decrease of SF population in these plots compared to fall 2011growing season
(Table 3-4). However, there was a general tendency in both years for SF populations to
be greater in plots where aphid populations were also greater. This may be explained
by the affinity of SF species to feed on aphids. In conjunction with that trend, Tumlinson
et al. (1993) reported that when crops are attacked by pests, they transmit chemical
signals that attract beneficial insects. A predominance of aphids in transplanted
cabbage was observed mainly before heading, an observation also noted by Mossler et
al. (2011). These authors reported that green peach aphids are attracted to cabbage
immediately prior to heading. It is important to notice that the greatest number of syrphid
flies were observed where the aphid population was greater but seemed to be
insufficient to regulate aphid density (improperly density related factor; MCneill et al.,
2012). Spiders were abundant within NT subplots, and were present in greater
numbers than CT (Table 3-4). The strong occurrence of natural enemies in pitfall traps
in cabbage may be due to the presence of decaying cover crop residues.
Effect of Fertilizer and Tillage on GB and FA Populations
The addition of fertilizer to cover crops affected GB populations during fall and
the FA population during fall 2012. Ground beetle populations were greater in NT
fertilized plots. However, there was no significant difference between GB populations in
NT and CT unfertilized subplots and fertilized CT subplots (Table 3-5). This result
showed that ground beetles were more active in cropping systems involving residue
mulches. This observation is in accordance with Eyre et al. (2009) who reported that
some ground beetles species were significantly more active in weedier fields. Prasifkaet
al. (2006) also found that living mulches increased the occurrence of GB populations
and improved predation within corn-soybean-forage rotation systems.

84
Fire ant populations were significantly greater in unfertilized NT subplots
compared to unfertilized CT subplots (Table 3-5). This observation is supported by
previous reports that ground-dwelling species prefer botanically diverse (weedy)
environments. Although cultural techniques and sampling strategy were the same within
CT plots and NT plots, this tendency for ground insect populations from pitfall traps to
be greater in NT plots than CT plots is consistent with previous research conducted in
this area that documents a general trend for ground-dwelling species to have affinity
with weedy fields or systems with soil surface residues.
Effect of Cover Crops and Tillage on Insect Populations from Yellow Sticky Traps
Insect populations captured from active yellow sticky cards (YSC) included the
pest diamondback moth (DBM), and beneficial lady bugs (LB), wasps and SF in fall
2011. In addition to species recorded during the previous season, adult flying aphids
and damsel bugs (DB) were also captured during fall 2012. There was no interaction
effects of treatments on pests or beneficial populations recorded from the yellow sticky
traps (Table 3-3). In both years, any of the treatments significantly affected pest or
beneficial insect populations except for SF in fall 2012 when a significant greater
number was recorded in CT plots compared to NT plots (Table.3-6).
This behavioral trend observed among yellow sticky card insect data may be
attributed to the absence of a buffer zone between treatment plots, and that flying
insects may easily move from one plot to another at any given time. Except for SS NT
plots, Aphid population means were inversely higher within NT and CT plots (Table 3-6)
within yellow sticky cards compared to results obtained with pitfall traps (Table 3-4) and
in situ counts (Table 3-7); respectively. Based on that observation, it could be attested
that this inconsistency concerning the results obtained from yellow sticky cards in

85
comparison with the two others sampling strategies may be explained by the following
reasons:
1. There was no buffer zone separating CT and NT plot which means insects could intentionally fly from one plot to another;
2. There was a periodical wind blowing during sampling dates for both years meaning as a result, insects could unintentionally travel over the neighbor and adjacent plots; and
3. Concerning aphids particularly, a subsampling technique was applied during the counting procedure where 6 squares from each side of the YSC were randomly selected to estimate aphids’ population captures from YSC sampling strategy which may to a lesser extent played on the results as well.
These results consisting of a non-significant effects of treatments obtained on insect
populations captured with YST were similar to those obtained by Bhan in 2007 and
2008 respectively using the same sampling technique to monitor aphids and whitefly
populations under cover crops and intercropping growing systems in organically grown
sweet corn and bell pepper in Florida (Bhan, 2010).
Effect of Cover Crops and Tillage on Insect Populations from in Situ Count
In situ count (ISC) sampling strategy was carried out on every insect found on
cabbage leaves during all sampling times. However, statistical analysis was performed
uniquely on species that showed a relatively analyzable number.
Aphids. In 2011, aphid populations were not significantly different within cover crops
and fertilized plots. However, SS and SP had higher number of aphids than PP and NC.
In fall 2012, aphid population was significantly higher in SS plots than PP plots. SP and
unfertilized plot however showed higher mean than NC plots. For both years, aphid
populations were significantly higher within NT plots than CT plots (Table 4-7). The
highest aphid numbers, in both years were recorded in SS and SP plots. This is
obvious, in view of the fact that SS is well known as a tolerant plant species for aphids.

86
In comparison with other grass species evaluated, Rustamani and Kanehisa (1992)
reported that sorghum in general tend to tolerate aphids due to their low aconitic acid
(less than 200 µg/wet weight) considered as moderate anti-feedent to aphids.
Results obtained from ISC showed consistency with results obtained with aphids
from the pitfall trap sampling strategy (Table 3-4 and 3-7). Sorghum sudangrass
subplots were associated with more aphids than SP subplots. This is in accordance with
results obtained during 2007 and 2008 by Bhan who observed that within the summer
cover crop mixtures of sorghum sudangrass and velvetbean, aphids, thrips and whitefly
populations were less than the other treamentsin sweet corn and bell pepper (Bhan,
2010).
Whiteflies. In both years, whitefly was not a problem in comparison with aphids. No
significant difference was recorded in any treatment in both years. In the first year, all
treatments displayed similar average numbers of whitefly. However, during the second
year, the greatest number of whitefly was recorded within SP, fertilized and unfertilized
plots and CT plots (Table 3-7). This result suggests that PP and SS reduced whitefly
numbers more than other treatments in fall 2012. The lowest whitefly counts observed
in SS plots is in accordance with results found with SS by McNeill et al. (2012) on
effects of cover crops on aphids and whiteflies. It is hard to explain this change
observed in whitefly population between treatments in fall 2012. However, it may be
attributed to a possible uneven distribution of whitefly movement during that specific
growing season. Also, the non- significance difference observed on whitefly populations
during both year between treatments is corroborated by Bhan (2009) in a research

87
conducted on cover crops included SS on whitefly population in sweet corn and bell
pepper (Bhan, 2010).
Conclusions
In summary, it is obvious that pigeon pea and sorghum sudangrass summer
cover crop residue biomass, when either incorporated by tillage or laid on the soil
surface as mulches, may change population of some key cabbage pests such as aphids
as well as some associated natural enemies such as syrphid flies, spiders, ground
beetles, and fire ants to a lesser extent. However, we do not have sufficient evidence to
attest that change would be resulted in pest suppression in cabbage based on the non-
significant presence of DBM population and the relative abundance of natural enemies
considering that several parameters such temperature, soil fertility and quality, plant
antixenosis, antibiosis and tolerance properties may also contribute to slowing down
insect populations. It is also important to point out that aphids accounting among key
cabbage pests in Florida were found in significant number over both growing seasons
within most of the treatment.
However, only pigeon pea among cover crops planting showing the lowest
number of aphids during both years. Therefore, we can come up with the assumption
that, although more data is necessary before advancing any solid recommendation,
growers dealing with organic and sustainable vegetable production could be willing to
use pigeon pea as cover crop in their production systems in the agro-ecosystems where
aphids would be considered as a frequent insect pest. At the same time, having regard
to the lowest number of whitefly in sorghum sudangrass although not significant in
comparison with the other treatments, we may advance that a special regard could be
attributed to sorghum sudangrass in an agro-ecosystem where whitefly would be a

88
problem. These results also suggest that the cover crops used could harbor important
insect predators and parasitoids for vegetable production in general and cabbage in
particular. At last, this study could serve as beginnings to any organic and sustainable
vegetable production schemes in tropical and subtropical environments where insect
pests constantly remain an issue.

89
Table 3-1. Cover crops repartition and seeding rate establishment for summer 2011 and 2012 growing seasons in Live Oak Florida
Growing season Pigeon pea (PP) Sorghum sudangrass (SS)
Mixture PP
SS
2011
50 20 25 10
2012 50 40 25 20

90
Figure 3-1. Sketch of the split split-plot design of the experiment laid out in Live Oak, Florida

91
Table 3-2. Main effect treatments arrangement according to the experimental design
established during growing season 2011 and 2012 in Live Oak Florida.
zEven numbers correspond to no- till and odd numbers to tillage. NC: no cover (control); PP: pigeon pea (legume); SS: sorghum sudangrass (grass); SP: mixture b/w PP and SS.
TreatmentZ Cover Cropy Fertilizationx Tillage Methodsw
1
NC Y CT
NC N CT
2
NC Y NT
NC N NT
3
PP Y CT
PP N CT
4
PP Y NT
PP N NT
5
SS Y CT
SS N CT
6
SS Y NT
SS N NT
7
SP Y CT
SP N CT
8
SP Y NT
SP N NT

92
Figure 3-2. Sampling methods used during the experiment for both years. A) Unbaited yellow sticky card setting up at a
height contained between 0.30 – 1m; B) pitfall trap put in the ground with top-end level with the soil surface; C) In situ count scouting for pests; D) a view of the experiment after traps installation.
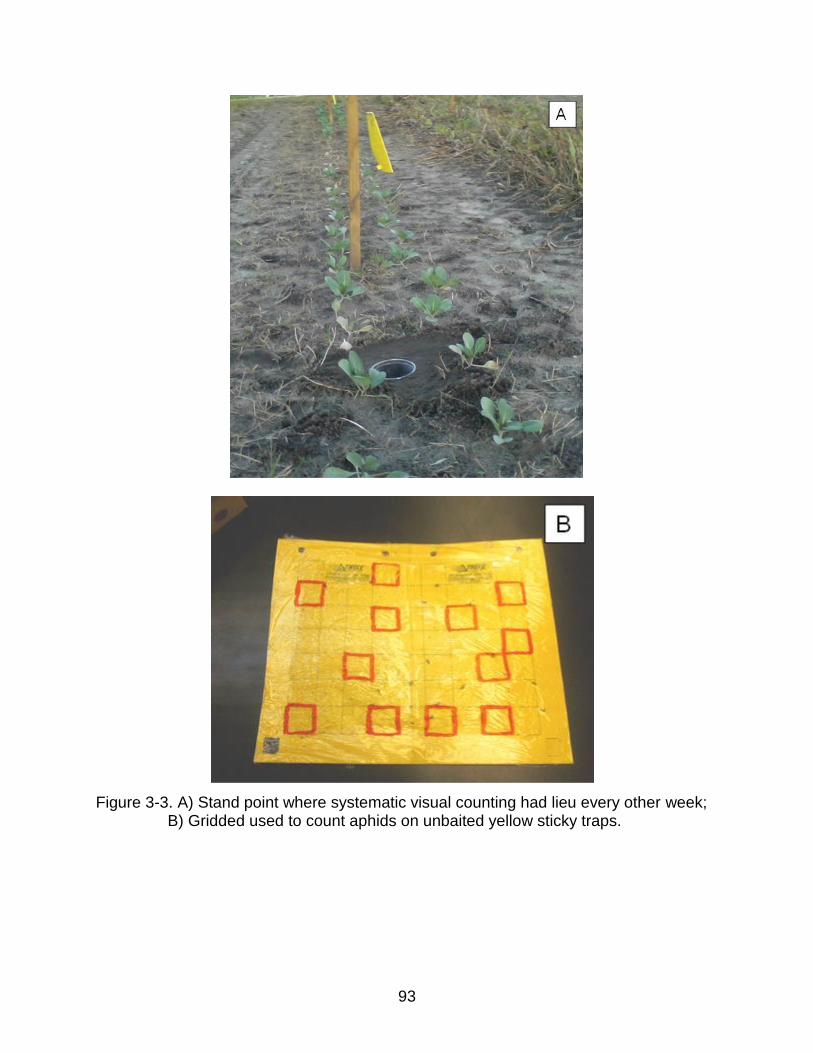
93
Figure 3-3. A) Stand point where systematic visual counting had lieu every other week;
B) Gridded used to count aphids on unbaited yellow sticky traps.
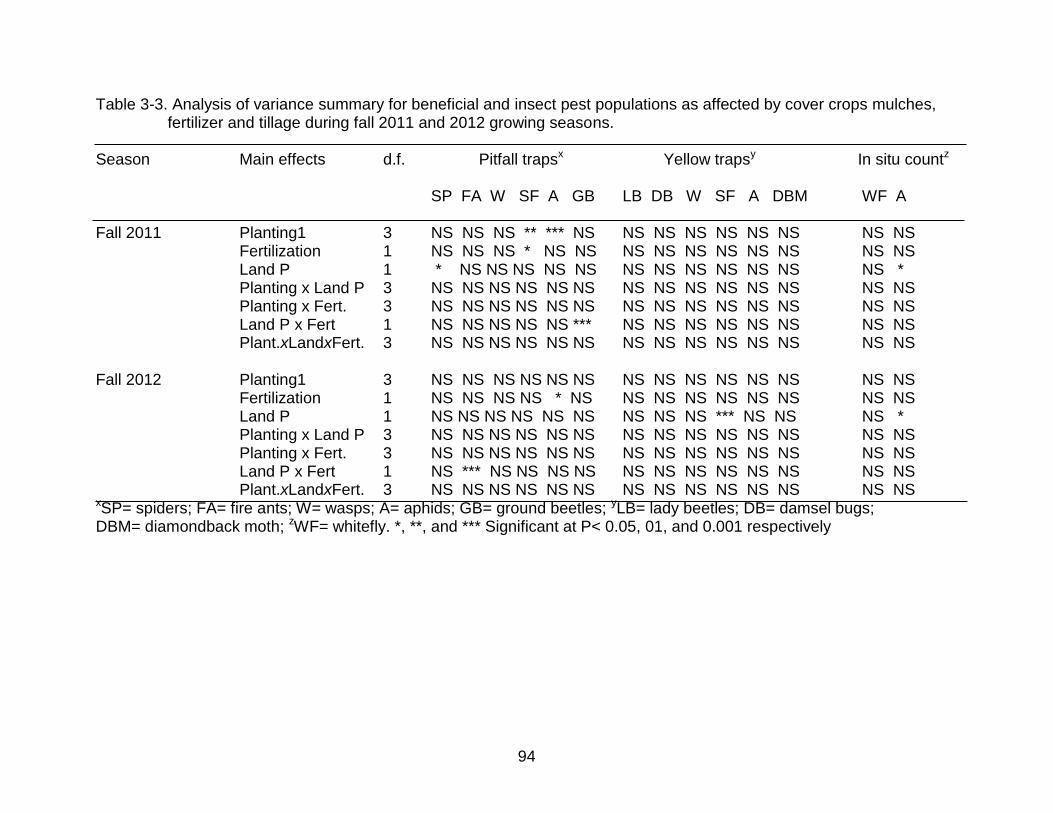
94
Table 3-3. Analysis of variance summary for beneficial and insect pest populations as affected by cover crops mulches, fertilizer and tillage during fall 2011 and 2012 growing seasons.
Season Main effects d.f. Pitfall trapsx Yellow trapsy In situ countz SP FA W SF A GB LB DB W SF A DBM WF A Fall 2011 Planting1 3 NS NS NS ** *** NS NS NS NS NS NS NS NS NS Fertilization 1 NS NS NS * NS NS NS NS NS NS NS NS NS NS Land P 1 * NS NS NS NS NS NS NS NS NS NS NS NS * Planting x Land P 3 NS NS NS NS NS NS NS NS NS NS NS NS NS NS Planting x Fert. 3 NS NS NS NS NS NS NS NS NS NS NS NS NS NS Land P x Fert 1 NS NS NS NS NS *** NS NS NS NS NS NS NS NS Plant.xLandxFert. 3 NS NS NS NS NS NS NS NS NS NS NS NS NS NS Fall 2012 Planting1 3 NS NS NS NS NS NS NS NS NS NS NS NS NS NS Fertilization 1 NS NS NS NS * NS NS NS NS NS NS NS NS NS Land P 1 NS NS NS NS NS NS NS NS NS *** NS NS NS * Planting x Land P 3 NS NS NS NS NS NS NS NS NS NS NS NS NS NS Planting x Fert. 3 NS NS NS NS NS NS NS NS NS NS NS NS NS NS Land P x Fert 1 NS *** NS NS NS NS NS NS NS NS NS NS NS NS Plant.xLandxFert. 3 NS NS NS NS NS NS NS NS NS NS NS NS NS NS xSP= spiders; FA= fire ants; W= wasps; A= aphids; GB= ground beetles; yLB= lady beetles; DB= damsel bugs; DBM= diamondback moth; zWF= whitefly. *, **, and *** Significant at P< 0.05, 01, and 0.001 respectively

95
Table 3-4. Effect of Cover crops, fertilizer, and tillage on insect pest and beneficial populations captured in cabbage from passive pitfall traps during fall 2011 and 2012 growing seasons. Mean ± SEM no. insects per pitfall trap in cabbage for all sampling dates; Mean ± SEM no. insects per pitfall trap in cabbage for all sampling dates
Spiders
Fall 2011 Syrphid
Aphids
Spiders
Fall 2012 Syrphid
Aphids Main effects Fire A. Wasps
Ground Wasps
Flies beetles Flies
Cover crops treat. Pigeon pea 1.1±0.2 4.4±1.3 1.1±0.2 0.4±0.1b 0.1±0.1ab
1.3±0.3 0.7±0.1 0.7±1.8 0.3±0.1 0.9±0.3
Sorghum S. 1.0±0.2 3.8±1.3 1.3±0.2 0.9±0.1a 0.3±0.1 a
1.0±0.3 0.7±0.1 4.0±1.8 0.1±0.1 1.3±0.3
Mixture 0.8±0.2 5.5±1.3 0.7±0.2 0.5±0.1b 0.2±0.1ab
1.7±0.3 0.5±0.1 1.4±1.8 0.5±0.1 1.3±0.3
Control 0.8±0.2 4.9±1.3 1.3±0.2 0.5±0.1b 0.0±0.1 b
1.0±0.3 0.7±0.1 0.5±1.8 0.3±0.1 1.3±0.3
P-value1 0.3062 0.7937 0.3569 0.0140 0.0013
0.3380 0.3311 0.4865 0.3465 0.5979
Fertilization treat.
Yes* 0.9±0.1 4.2±0.8 1.2±0.1 0.7±0.1a 0.2±0.0
1.3±0.2 0.6±0.1 2.7±1.3 0.2±0.1 0.9±0.2b
No 1.0±0.1 5.2±0.8 1.0±0.1 0.5±0.1b 0.2±0.0
1.2±0.2 0.7±0.1 0.5±1.3 0.3±0.1 1.6±0.2a
P-value 0.5680 0.3550 0.1254 0.0457 0.7571
0.6411 0.1228 0.2145 0.2935 0.0048
Tillage treatment Till 0.8±0.1b 4.0±0.8 1.1±0.1 0.6±0.1 0.1±0.0
1.3±0.2 0.7±0.1 2.8±1.3 0.3±0.1 1.1±0.2
No-till 1.1±0.1a 5.3±0.8 1.2±0.1 0.7±0.1 0.2±0.0
1.2±0.2 0.6±0.1 0.5±1.3 0.2±0.1 1.4±0.2
P-value 0.0320 0.2600 0.5245 0.1761 0.1228 0.6766 0.3304 0.2032 0.3940 0.2679
*50lbs of N/acre (57 kg /ha) applied week 4 after cover crops emergence; 1Mean separation within colunms by Student's Least Squares Means (LSMeans) test at P≤0.05; Means followed by the same letter are not significantly different

96
Table 3-5. Effect of fertilizer, and tillage on ground beetles and fire ants populations captured in cabbage from passive pitfall traps during fall 2011 and 2012 growing seasons. Mean ± SEM no. insects per pitfall trap in cabbage for all sampling dates
1Ground beetle (ground and rove beetles); 2fire ants. Mean within rows having same uppercase letters and means within columns having same lowercase letters are not significantly different at P≤0.05 based on LSMeans differences.
GB1/ fall 2011
FA2/ fall 2012
Main effect 57kg ha-1 N 0 kg ha-1 N 57kg ha-1 N 0 kg ha-1 N
Till 0.3±1.8Ab 0.4±1.8 Ab 12.1±1.8 Aa 6.9±1.8 Bb No-till 1.2±1.8Aa 0.4±1.8 Bb 9.1±1.8 ABab 13.5±1.8 Aa

97
Table 3-6. Effect of Cover crops, fertilizer, and tillage on insect pest and beneficial populations captured in cabbage from active yellow sticky traps during fall 2011 and 2012 growing seasons. Mean ± SEM no. insects per yellow sticky trap in cabbage for all sampling dates
*50lbs of N/acre (57 kg /ha) applied week 4 after cover crops emergence; 1Diamondback moth; 2Mean separation within colunms by Student's Least Squares Means (LSMeans) test at P≤0.05; Means followed by the same letter are not significantly different.
DBM1
Fall 2011 Syrphid
Aphids
Fall 2012 Syrphid Main effects Lady B. Wasps
DBM Wasps Damsel
Flies bugs Flies
Cover crops Pigeon pea 0.4±0.7 0.3±0.9 1.9±0.3 0.5±0.1
0.1±0.0 1.4±0.2 0.1±0.0 0.9±0.2 0.5±0.2
Sorghum sudangrass 0.2±0.7 0.3±0.9 2.0±0.3 0.7±0.1
0.1±0.0 1.3±0.2 0.0±0.0 1.0±0.2 0.8±0.2
Mixture 0.2±0.7 0.4±0.9 2.1±0.3 0.7±0.1
0.1±0.0 1.4±0.2 0.1±0.0 1.1±0.2 0.9±0.2
Control 0.2±0.7 0.4±0.9 2.1±0.3 0.6±0.1
0.1±0.0 1.4±0.2 0.1±0.0 1.0±0.2 0.8±0.2
P-value2 0.4501 0.5463 0.8937 0.6517
0.7668 0.9702 0.7232 0.9138 0.4140
Fertilization
Yes* 0.3±0.5 0.4±0.6 2.2±0.2 0.6±0.1
0.1±0.0 1.4±0.2 0.1±0.0 1.0±0.1 0.9±0.1
No 0.2±0.5 0.3±0.6 2.0±0.2 0.6±0.1
0.0±0.0 1.3±0.2 0.1±0.0 1.0±0.1 0.7±0.1
P-value 0.7921 0.3360 0.2245 0.9582
0.1241 0.7659 0.5067 0.9733 0.1639
Tillage Till 0.3±0.5 0.3±0.6 2.0±0.2 0.6±0.1
0.1±0.0 1.5±0.2 0.1±0.0 1.2±0.1 1.0±0.1a
No-till 0.3±0.7 0.4±0.6 2.0±0.2 0.6±0.1
0.1±0.0 1.2±0.2 0.1±0.0 0.8±0.1 0.5±0.1b
P-value 0.4472 0.1093 0.5911 0.8751 0.5378 0.2341 0.7398 0.0668 0.0007

98
Table 3-7. Effect of Cover crops, fertilizer, and tillage on insect pest and beneficial populations captured in cabbage from in situ count during fall 2011 and 2012 growing seasons. Mean ± SEM no. insects per sample of 5cabbage plants for all sampling dates
Fall 2011 Fall 2012
Main effects Aphids Whitefly
Aphids Whitefly
Cover crops Pigeon pea 0.0±0.2 0.1±0.1
11.9±6.5 b 0.3±0.2
Sorghum sudangrass 0.3±0.2 0.1±0.1
33.5±6.5 a 0.2±0.2
Mixture 0.3±0.2 0.1±0.1
22.0±6.5 ab 0.4±0.2
Controlx 0.2±0.2 0.1±0.8
20.2±6.5 ab 0.5±0.2
P-valuey 0.7636 0.9632
0.1372 0.6437
Fertilization Yesy 0.1±0.1 0.1±0.1
16.6±4.6 0.4±0.1
No 0.2±0.1 0.1±0.1
27.2±4.6 0.4±0.1
P-value 0.4840 0.2897
0.1056 0.8516
Tillage Till 0.1±0.1 b 0.1±0.1
14.8±4.6 b 0.4±0.1
No-till 0.4±0.13 a 0.1±0.1
28.9±4.6 a 0.3±0.1
P-value 0.0277 1.0000 0.0307 0.3759
*50lbs of N/acre (57 kg /ha) applied week 4 after cover crops emergence; 1Mean separation within colunms by Student's Least Squares Means (LSMeans) test at P≤0.05; Means followed by the same letter are not significantly different

99
CHAPTER 4 CONCLUSIONS
The main objective of this research was to identify the best cover crop planting
and management strategy that is suitable for optimizing vegetable production in tropical
environments. Specifically, it aimed at, on one hand, evaluating effects of grass-legume
planting arrangement and tillage method (cover crop termination method) on yield of
subsequent cash crop. And on the other hand, determining how the cover crop planting
arrangement and tillage method influences key insect pest and beneficial populations.
To achieve these purposes, two summer cover crops, pigeon pea, Cajanus cajan L. and
sorghum sudangrass hybrid, Sorghum bicolor var. Sudanense were for that end
evaluated.
The effect of cover crop on yield of subsequent cash crop has been well
documented in conservation tillage in both organic and sustainable production.
However, those researches have been conducted mostly on agronomic crops than
vegetable crops and much more in temperate climates than subtropical and tropical
agro-ecosystems. This research provided insights on subsequent effects of these two
summer cover crops on yield as well as insects populations of subsequent cash crops in
subtropical and tropical farming systems.
Results showed that out of low air temperature conditions, farming systems
involving a combination of sorghum sudangrass and pigeon pea could be promising for
growers in the tropics considering growing organic or sustainable vegetables. Under
adequate temperature conditions, pigeon pea can produce high biomass residue for
conservation tillage production systems. Results from this research showed that pigeon
pea was the best cover crop to integrate in sustainable vegetable production systems.
100
From the point of view of conservation tillage, all considered, pigeon pea was the best
cover crop species among those evaluated to integrate within conservation tillage
vegetable production schemes.
From a tillage perspective in general, cabbage yields were better when cover
crop residues were incorporated into the soil. Another interesting aspect of the results
was residues biomass previously fertilized before incorporated by tillage resulted in
greatest yield in every case except with sorghum sudangrass during the second year of
the experiment the opposite was recorded. Also, with yield of subsequent cash crop
was not tillage dependent only when fertilized pigeon pea residues were used.
On the IMP aspect of the research, a lot of beneficial insect populations were harbored
during the growing seasons. Dimondback moth, a potential pest for cabbage was not
found in significant number during the growing season. However, aphids which are also
cabbage key pest in Florida were found in significant numbers on the other side during
the experiment. The highest aphids’ population was found within sorghum sudangrass
plots. Thus, growers in the tropics growing vegetables that are susceptible to aphids
should avoid utilized sorghum sudangrass as cover crops. Pigeon pea would be a better
alternative in that case. At last, this study could serve as beginnings to any organic and
sustainable vegetable production schemes in tropical and subtropical environments
where insect pests constantly remain an issue.
Overall, In Tropical farming systems, like in the Caribbean where the climate is
more or less constant, No-till vegetable production with pigeon pea and biculture
between pigeon pea and sorghum sudangrass as cover crop could be promising.

101
Further study is needed to evaluate pigeon pea potentiality in comparison with other
summer legume cover crops commonly used throughout the south both in no-till and
conventional vegetable farming.

102
LIST OF REFERENCES
Abdul-Baki, A. A. 1997. Broccoli production in forage soybean and foxtail millet cover crop mulches. Hort-Science 32:836-839.
Chamblee, D.S. and J.T. Green (eds.). Production and Utilization of Pastures and
Forages in North Carolina. Technical Bulletin 305. Adu-Gyamfi, J.J., K. Fujita, and S. Ogata. 1989. Phosphorus absorption and utilization
efficiency in pigeon pea in relation to dry matter production and dinitrogen fixation. Plant and Soil 119:315-324
Allison, F. E. 1968. Soil aggregation-some facts and fallacies as seen by a
microbiologist. Soil Sci. 106: 136-140. Altieri, M. A. 1994. Biodiversity and pest management in agroecosystems.Food
Products Press, New York 3-10. Ashford, D. L. D. W. R. 2003. Use of a mechanical roller-crimper as an alternative kill
method for cover crops. Amer. J. Alt. Ag. 18: 37-45. Baldwin, K. R. 2009. Conservation tillage on organic farms. Center for Environmental
Farming Systems. Raleigh, NC: North Carolina State University. http://scholar.google.com/scholar?hl=tl&q=conservation+tillage+on+organic+farms
Baldwin, K. R., and Creamer, N. G. 2006. Cover crops for organic farms. N. Carolina
Coop. Ext. Serv., Raleigh. Baldwin, K.B. and N.G. Creamer. 2003. Cover crops for organic farmers. North Carolina
State Univ CES. AG-659W-03. 22. Balkcom, K.S., H. Schomberg, D.W. Reeves, and A. Clark. 2007. Managing cover crops
in conservation tillage systems. In A. Clark (ed.). Managing Cover Crops Profitably. SARE. College Park, MD: 44-61.
Balkcom, K.S., J.M. Massey, J.A. Mosjidis, A.J. Price, and S.F. Enloe. 2011. Planting
date and seeding rate effects on sunn hemp biomass and nitrogen production for a winter cover crop. International Journal of Agronomy 2011: 1-8.
Barber, R.G. and F. Navarro. 1994. Evaluation of the characteristics of 14 cover crops
used in a soil rehabilitation trial. Land Degradation & Rehabilitation. 5:201-214. Bellinder, R.R.; Hines, T.E. and Wilson, H.P. 1984. Herbicide programs and tillage
systems for cabbage. Proc. Northeastern Weed Sci. Soc. 38: 191-194.

103
Bhan, M. 2010. Cropping system complexity for suppressing pests in organic vegetable production (Doctoral dissertation, University of Florida).
Blackshaw, R. E., J. R. Moyer, R. C. Doram, and A. L. Boswell. 2001. Yellow sweet
clover, green manure, and its residues effectively suppress weeds during fallow. Weed Sci. 49:406-413.
Brainard, D. C., Bellinder, R. R., and Kumar, V. 2011. Grass-legume mixtures and soil
fertility affect cover crop performance and weed seed production. Weed Technology, 25(3), 473-479.
Brunson, K. E. 1991. Winter cover crops in the integrated pest management of
sustainable cantaloupe production. M. S. Thesis. Univ. of Georgia, Athens, GA. Bugg, R. L. 1992. Using cover crops to manage arthropod on truck farms. HortScience
27:741-745. Bugg, R. L., F. L. Wa¨ckers, K. E. Brunson, J. D. Dutcher, and S. C. Phatak. 1991.
Cool-season cover crops relay intercropped with cantaloupe: influence on a generalist predator, Geocoris punctipes (Hemiptera: Lygaeidae).J.Econ. Entomol.84: 408-416.
Burke, I. C., Yonker, C. M., Parton, W. J., Cole, C. V., Schimel, D. S., and Flach, K.
1989. Texture, climate, and cultivation effects on soil organic matter content in US grassland soils. Soil Science Society of America Journal, 53(3):800-805. cabbage using high residue levels. Appl. Agric. Res. 5: 338-342.
Capinera, J.L. 1999a. Cabbage Looper. Featured Creatures EENY-116. Entomology
and Nematology Department, University of Florida. Available: http://edis.ifas.ufl.edu/IN273.
Carlson, S., and Anderson, A. 2010. Winter Rye Cover Crop Effect on Cash Crop
Yields: Year 3. http://scholar.google.com/scholar?q=Winter+Rye+Cover+Crop+Effect+on+Cash+Crop+Yields%3A+Year+3&btnG=&hl=tl&as_sdt=0%2C10
Carof, M., S. de Tourdonnet, Y. Coquet, V. Hallaire, and J. Roger-Estrade. 2007.
Hydraulic conductivity and porosity under conventional and no-tillage and the eff ect of three species of cover crop in northern France. Soil Use Manage. 23:230-237.
Chamblee, D.S., J.T. Green, and J.C. Burns. 1995. Principle forages of North Carolina:
adaptation, characteristics, management, and utilization. In Chamblee, D.S. and J.T. Green (eds.). Production and Utilization of Pastures and Forages in North Carolina. Technical Bulletin 305.

104
Charles, K. S., Ngouajio, M., Warncke, D. D., Poff, K. L., and Hausbeck, M. K. 2006. Integration of cover crops and fertilizer rates for weed management in celery. Weed science, 54(2):326-334.
Cherr, C. M., J. M. S. Scholberg, and R. McSorley. 2006. Green manure approaches to
crop production: a synthesis. Agronomy Journal 98:302-19. Cherr, C.M., J.M.S. Scholberg, and R. McSorley. 2006. Green manure as nitrogen
source for sweet corn in a warm–temperate environment. Agron. J. 98:1173-1180.
Chikowo, R., P. Mapfumo, P. Nyamugafata and K.E. Giller. 2004. Woody legume fallow
productivity, biological N2-fixation and residual benefits to two successive maize crops in Zimbabwe. Plant and Soil. 262: 303-315.
Clark, A. 2007. Managing cover crops profitably. Handbook Series Book 9. Sustainable
Agriculture Network, Beltsville, MD. Creamer, N.G. and K.R. Baldwin. 2000. An evaluation of summer cover crops for use in
vegetable production systems in North Carolina. HortSci. 35(4):600-603. Creamer, N. G., Bennett, M. A., and Stinner, B. R. 1997. Evaluation of cover crop
mixtures for use in vegetable production systems. HortScience 32(5): 866-870. Dabney, S.M., J.A. Delegado, and D.W. Reeves. 2001. Using winter cover crops to
improve soil and water quality. Communication in Soil Science and Plant Analysis 32:1221-1250.
Delgado, J. A. and J. Lemunyon. 2006. Nutrient Management. In R. Lal (ed.).
Encyclopedia Soil Sci. Markel and Decker, New York. 1157-1160. Delgado, J. A. et al. 2007. Cover crops-potato rotations: Part III, making the connection-
green manure cover crop effects on potato yield and quality. In Proceedings of the 25th Annual San Luis Valley Potato Grain Conference. Jan. 30–Feb. 2, 2007. Monte Vista, CO.
Ekeleme, F., I.O. Akobundu, R.O. Fadayomi, D. Chikoye, and Y.A. Abayomi. 2003.
Characterization of Legume Cover Crops for Weed Suppression in the Moist Savanna of Nigeria. Weed Technology 17:1-13.
Epieru, G. 1997. Insect pest and predator incidence in cotton/bean inter-cropping
systems and the surrounding crops in eastern Uganda. In African Crop Science Conference Proceedings 3: 1173-1176.
Eyre, M. D., Labanowska-Bury, D., Avayanos, J. G., White, R., and Leifert, C. 2009.
Ground beetles (Coleoptera, Carabidae) in an intensively managed vegetable

105
crop landscape in eastern England. Agriculture, Ecosystems & Environment. 131(3): 340-346.
Finney, D. M., Creamer, N. G., Schultheis, J. R., Wagger, M. G., and Brownie, C. 2009.
Sorghum sudangrass as a summer cover and hay crop for organic fall cabbage production. Renewable Agriculture and Food Systems 24(3):225.
Foster, R., and Flood, B. 1995. Vegetable insect management: With emphasis on the
Midwest. Meister Pub. Co. Frank, D. L., and O. E. Liburd. 2005. Effects of living and synthetic mulch on the
population dynamics of whiteflies and aphids, their associated natural enemies and insect-transmitted plant diseases in zucchini. Environmental Entomology 34: 857-865.
Franzluebbers, A.J. 2007. Integrated Crop–Livestock Systems in the Southeastern
USA. Agron. J. 99:361-372. Furlong, M. J., Zu-Hua, S., Yin-Quan, L., Shi-Jian, G., Yao-Bin, L., Shu-Sheng, L., and
Zalucki, M. P. 2004. Experimental analysis of the influence of pest management practice on the efficacy of an endemic arthropod natural enemy complex of the diamondback moth. Journal of economic entomology 97(6):1814-1827.
Gauchan, D. B.R. Sthapit and D.I. 2003. Agrobiodiversity conservation on-farm: Nepal’s
contribution to a scientific basis for national policy recommendations. International Plant Genetic Resources Institute (IPGRI). Jarvis (eds.) Rome, Italy. 55 pp. ISBN 92-9043-575-5.
Hall, J. K., Hartwig, and D.L. Hoffman. 1984. Cyanazine losses in runoff from no-tillage
corn in living and dead mulches vs. unmulched conventional tillage. J. Environ. Qual. 13: 105-110.
Hartwig, N. L., and H.U. Ammon. 2002. Cover crops and living mulches. Weed Science
50: 688-699. Hayslip, N.C., Genung, W.G., Kelsheimer, E.G. and Wilson, J.W. 1953. Insects
Attacking Cabbage and Other Crucifers in Florida. University of Florida, Agricultural Experiment Station, Gainesville. 57.
Hebblethwaite, J. 1997. Survey-environmental friendly farming eclipses intensive tillage.
Partners/CTIC 15(6): 1-4; 13-14. Hogg, B. N., R.L. Bugg, and K.M. Daane. 2011. Attractiveness of common insectary
and harvestable floral resources to beneficial insects. Biological Control 56: 76 84.

106
Hooks, C., and M. Johnson. 2001. Broccoli growth parameters and level of head infestations in simple and mixed plantings: Impact of increased flora diversification. Association of Applied Biologists 138: 269-280.
Hooks, C., and M. Johnson. 2004. Using undersown clovers as living mulches: effects
on yields, lepidopterous pest infestations, and spider densities in a Hawai`ian broccoli agrosystem. International Journal of Pest Management 50: 115-120.
Hoyt, G. D., and W. L. Hargrove. 1986. Legume cover crops for improving crop and soil
management in the southern United States. Hort-Science 21: 397-402. Hoyt, G.D., D.W. Monks, and T.J. Monaco. 1994. Conservation tillage for vegetable
production. HortTech. 4(2): 129-135. Hoyt, G.D. 1999. Tillage and cover residue effects on vegetable yields. Hort-Technology
9:351-358. Jacobs, E. 1995. Cover crop breathes life into old soil: Sorghum-sudangrass, used as
an onion rotation crop on organic soils, cuts pesticide costs, rejuvenates soil and increases yields. Amer. Agriculturist 192:8.
Johnson, F.A., Short, D.E. and Castner, J.L. 1996. Sweetpotato/Silverleaf Whitefly Life
Stages and Damage. Entomology and Nematology Department SP 90. Florida Cooperative Extension Service, Institute of Food and Agricultural Sciences, University of Florida. Available:http://edis.ifas.ufl.edu/IN004.
Karlen, D. L., D. C.Erbach, T.C. Kaspar, T.S. Colvin, E. C. Berry, and D. R. Timmons.
1990. Soil tilth: A review of past conceptions and future needs. Soil Sci. Sco. Am. J. 54: 153-161.
Kuo, S., and E. J. Jellum. 2002. Influence of winter cover crop and residue management
on soil nitrogen availability and corn. Agronomy journal 94: 501-508. Kuo, S., and E.J. Jellum. 2000. Long-term winter cover cropping eff ects on corn (Zea
mays L.) production and soil nitrogen availability. Biol. Fertil. Soils 31:470-477. Leibee, G.L. 1996. Insect pest management in crucifers in Florida. In D. Rosen, F. D.
Bennett and J. L. Capinera (ed.), Pest Management in the Subtropics, Integrated Pest Management - A Florida Perspective. Intercept, Andover, UK. 413-422.
Li, Y., E. Hanlon, W. Klassen, Q. Wang, T. Olczyk, and I. V. Ezenwa. 2006. Cover crop
benefits for south Florida commercial vegetable producers. EDIS Publication SL242. http://edis.ifas.ufl.edu/SS461.

107
Liburd, O. E., E.M. Sarzynski, H. A. Arèvalo, and K. MacKenzie. 2009. Monitoring and emergence of flower thrips species in rabbiteye and southern highbush blueberries. Acta Horticulturae 810: 251-258.
Liburd, O.E., T.W. Nyoike, and C.A. Scott. 2008. Cover, border and trap crops for pest
and disease management in Springer,Dordrecht, The Netherlands. J.L Capinera Ed., Encyclopedia of Entomology, 2nd Ed. 1: 1095-1100.
Liu, T. X., and Sparks Jr, A. N. 2001. Aphids on Cruciferous Crops: Identification and
Management. Available electronically from http://hdl. handle. net/1969, 1, 87054. Mafongoya, P.L., A. Bationo, J. Kihara, B. S. Waswa. 2006. Appropriate technologies to
replenish soil fertility in southern Africa. Nutr. Cycl. Agroecosyst. 76:137-151. Management strategies for improved soil quality with emphasis on soil compaction.
Cornell Univ. Dept. of Fruit & Veg. Sci. Report No. 72. Mark, S., and R. Morse. 2007. Reduced Tillage and Cover Cropping Systems for
Organic Vegetable Production. Virginia Association for Biologist Farming Information Sheet 9. http://www.sare.org/Learning-Center/Project-Products/Southern-SARE-Project-Products/Reduced-Tillage-and-Cover-Cropping-Systems-for-Organic-Vegetable-Production
Masuinas, J.B., Eastburn, D.M., Mwaja, V.N. and Eastman, C.E. (1997). The impact of living and cover crop mulch systems on pests and yields of snap beans and cabbage. J.Sustainable Agr. 9(2/3): 61-89.
Maynard, D.N., Hochmuth, G.J., Vavrina, C.S., Stall, W.M., Kucharek, T.A., Stansly,
P.A., Taylor, T.G., Smith, S.A., Smajstrla, A.G., Webb, S.E., and Olson, S.M. 2003. Cole Crop Production in Florida. University of Florida, Institute of Food and Agricultural Sciences. Available: http://edis.ifas.ufl.edu/CV122.
McCutcheon, G. S. 2000. BeneÞcial arthropods in conservation tillage cotton - a three
year-study. In Proceedings, Beltwide Cotton Conference.National Cotton Council, Memphis, TN. 1302-1306.
McCutcheon, G. S., P. J. Bauer, J. G. Alphin, and J. R. Frederick.1995. Population
dynamics of insect pests and beneÞcial arthropods in a crimson clover/cotton ecosystem with conservation tillage cotton. In Proceedings, Southern Conservation Tillage Conference for Sustainable Agriculture 103-107.
Mcneill, C. A. O. E. Liburd, C. A. Chase. 2012. Effect of cover crops on aphids,
whiteflies and their associated natural enemies in organic squash. Journal of Sustainable Agriculture 36:382-403.

108
Mligo, J.K. And P. Q. Craufurd. 2007. Productivity and optimum plant density of pigeonpea in different environments in Tanzania. Journal of Agricultural Science 145: 343-351.
Molher, C. L., and J. R. Teasdale. 1993. Reponse of weed emergence to rate of Vicia
villosa Roth and Secale cereal L. residue. Weed Res. 40:27-47. Morse, R.D. and Seward, D.L. 1986. No-tillage production of broccoli and cabbage.
Applied Agric. Res. 1: 96-99. Morse, R.D. 2001. No-herbicide, no-till summer broccoli-quantity of rye and hairy
vetchmulch on weed suppression and crop yield. In: Proc. 24th Annual Southern Conservation Tillage Conference for Sustainable Agriculture, J.H. Stiegler (Ed.), Oklahoma City, Oklahoma, USA, 9-11 July 85-94.
Morse, R.D. 1999a. No-till vegetable production-its time is now. HortTechnology 9: 373-
379. Morse, R.D. 1999. Cultural weed management methods for high-residue/no-till
production of transplanted broccoli (Brassica oleraceae L. gp. italica). Acta Hort.(ISHS) 504: 121-128.
Mossler, M. A., Larson, B. C., and Nesheim, O. N. 2011. Florida Crop/Pest
Management Profile: Cabbage. National Agricultural Statistics Service (NASS). 2012. Vegetables 2011 Summary.
United States Department of Agriculture. Ngouajio, M., M. E. McGriffen, Jr., and C. M. Hutchinson. 2003. Effects of cover crop
and management system on weed populations in lettuce. Crop Protection 22:57-64.
Nimbal, C. I. et al. 1996. Phytotoxicity and distribution of sorgoleone in grain sorghum
germplasm. J. Agric. Food Chem. 44:1343-1347. Nuessly, G. and Hentz, M. 1999. EREC Moth Pheromone Trap Data. University of
Florida, Everglades Research and Education Center, Belle Glade. Nyoike, T. W., O. E. Liburd, and S. E. Webb. 2008. Suppression of whiteflies, Bemisia
tabaci (Hemiptera: Aleyrodidae) and incidence of Cucurbit leaf crumble virus, a whitefly-transmitted virus of zucchini squash new to Florida, with mulches and imidacloprid. Florida Entomologist 91: 460-465.
Nyoike, T.W., and O. E. Liburd. 2010. Effect of living (buckwheat) and UV reflective
mulches with and without imidacloprid on whiteflies, aphids and marketable yields of zucchini squash. International Journal of Pest Management 56: 31-39.

109
Odeny, D.A. 2007. The potential of pigeonpea (Cajanus cajan (L.) Millsp.) in Africa. Natural Resources Forum. 31:297-305.
Olson, K.R., S.A. Ebelhar, and J.M. Lang. 2010. Cover crop effects on crop yields and
soil organic carbon content. Soil Sci. 175:89-98. Olson, S. M., P. J. Dittmar, G. E. Vallad, S. E. Webb, S. A. Smith. 2013. Cole crop
production in Florida.Vegetable production handbook for Florida. Lincolnshire, IL: Vance 55.
Ontario CropIPM. 2009. Critical weed-free period. Ministry of agriculture food and rural
affairs. http://www.omafra.gov.on.ca/IPM/english/weeds-herbicides/critical-weed-free.html
Palumbo, J. 2006. Action Thresholds for Aphid Management with Reduced-Risk and
Conventional Insecticides in Desert Head Lettuce. Prasifka, J., et al. 2006. Effects of living mulches on predator abundance and sentinel
prey in a corn-soybean-forage rotation. Environmental entomology 35(5): 1423-1431.
Putnam A.R., and DeFrank J. 1983. Use of phytotoxic plant residues for selective weed
control. Crop Protection 2: 173-181. Raghothama, K.G. 1999. Phosphate acquisition. Annu. Rev. Plant Physiol. Plant Mol.
Biol. 50:665-93. Ramirez, R. and R. Patterson. 2011. Beneficial True Bugs: Damsel Bugs. ENT 146.
http://extension.usu.edu/files/publications/factsheet/ENT-146-11pr.pdf Ranells, N. N. and M. G. Wagger. 1996. Nitrogen release from grass and legume cover
crop monocultures and bicultures. Agron. J. 88:777-782. Reddy, G. V. P., Holopainen, J. K., and Guerrero, A. 2002. Olfactory responses of
Plutella xylostella natural enemies to host pheromone, larval frass, and green leaf cabbage volatiles. Journal of chemical ecology 28(1):131-143.
Reddy, K.C., A.R. Soff es, and G.M. Prine. 1986a. Tropical legumes for green manure:
Nitrogen production and the effects on succeeding crop yields. Agron. J. 78:1-4. Reeves, D. W. 1994. Cover crops and rotations. J. L. Hatfield B. A. Stewart Crops
residue management. Advances in soil science 125-172. Reeves, D.W., M.G. Patterson, and B.E. Gamble. 1997. Cover crops for weed control in
conservation-tilled soybean. Tillage Conf. Sustainable Agr., Gainesville, Fla., 24 to 26 June. In: R.N. Gallaher and R. McSorley (eds.). Proc. S. Conserv. 140-142.

110
Reicosky, D.C., W. A. Dugas, and H. A. Torbert. 1997. Tillage-induced soil carbon dioxide loss from different cropping systems. Soil Tillage Res. 41: 105-118.
Roberts, R.K., J.A. Larson, D.D. Tyler, B.N. Duck, and K.D. Dillivan. 1998. Economic
analysis of the effects of winter cover crops on no-tillage corn yield response to applied nitrogen. Journal of Soil and Water Conservation 53:280-284.
Romeis, J., Shanower, T. G., and Zebitz, C. P. 1997. Volatile plant infochemicals
mediate plant preference of Trichogramma chilonis. Journal of Chemical Ecology 23(11): 2455-2465.
Ruberson, J. R., W. J. Lewis, D. J. Waters, O. Stapel, and P. B. Haney. 1995. Dynamics
of insect populations in a reduced-tillage, crimson clover/cotton system. Proceedings, Beltwide Cotton Conference. National Cotton Council Memphis, TN. 814-821.
Rustamani, M. A., et al. 1992. Further observations on the relationship between aconitic
acid contents and aphid densities on some cereal plants. Bulletin of the Research Institute for Bioresources 1: 9-20.
Sargent, S. 1999. Handling Florida Vegetables: Cabbage. SS-VEC 923. Florida
Cooperative Extension Service, Institute of Food and Agricultural Sciences, University of Florida. Available: http://edis.ifas.ufl.edu/VH083.
Sarrantonio, M. 1994. Northeast Cover Crop Handbook. Soil Health Series. Rodale
Institute, Kutztown, PA. SAS Institute. 2010. The SAS System 9.3 for Windows. SAS Institute, Cary, NC. USA. Schonbeck, M.S., Herbert, S., DeGregorio, R., Mangan, F., Guillard, K., Sideman, E.,
Herbst,J. and Jaye, R. 1993. Cover cropping system in the northeastern United States: 1.Cover crop and vegetable yields, nutrients and soil conditions. J. Sustainable Agric.
Scott, J. E. and L. A. Weston. 1991. Cole crop (Brassica oleracea) tolerance to
Clomazone. Weed Sci. 40:7-11. Sharma, H. C., Sharma, K. K., and Crouch, J. H. 2004. Genetic transformation of crops
for insect resistance: potential and limitations. Critical Reviews in Plant Sciences 23(1), 47-72.
Shelton, A. M., Andaloro, J. T., and Barnards, J. 1982. Effects of cabbage looper,
imported cabbageworm, and diamondback moth on fresh market and processing cabbage. Journal of Economic Entomology 75(4): 742-745.

111
Sinclair, T.R. 2004. Increasing yield potential of legume crops similarities and contrasts with cereals. New directions for a diverse planet. Proceedings of the 4th International Crop Science Congress, Brisbane, Australia.
Singh, V.K., B.S. Dwivedi, Arvind K. Shukla, Y.S. Chauhan, and R.L. Yadav. 2005.
Diversification of rice with pigeonpea in a rice–wheat cropping system on a Typic Ustochrept: effect on soil fertility, yield and nutrient use efficiency. Field Crops Research 92:85-105.
Snapp, S. S., S. M. Swinton, R. Labarta, D. Mutch, J. R. Black, R. Leep, J. Nyiraneza,
and K. O’Neil. 2005. Evaluating cover crops for benefits, cost, and performance within cropping system niches. Agronomy Journal 97:322-332.
Sustainable Agriculture Network. 2005. Manage Insects on Your Farm: a Guide to
Ecological Strategies. Beltsville, MD. www.sare.org/learning-center/insect Sustainable Agriculture Network. 2007. Managing cover crop profitably. A. Clark (ed).
Beltsville, MD. sweet clover, green manure, and its residues effectively suppress weeds 26-34; 106-111.
Teasdale, J. R. 1996. Contributions of cover crops to weed management in sustainable
agricultural systems. J. Prod. Agriculture 9:475-479. Tesdale Jr, and Daughtry C.S.T. 1993. Wed suppression by live and dessicated hairy
vetch (Vicia vilosa). Weed Science 41: 207-212. Thiessen-Martens, J. R., M. H. Entz, and J. W. Hoeppner. 2005. Legume cover crops
with winter cereals in southern Manitoba: Fertilizer replacement values for oat. Canadian Journal of Plant Science 85:645-648.
Treadwell, D. D., N. G. Creamer , J. R. Schultheis, and G. D. Hoyt. 2007. Cover Crop
Management Influences Weed Suppression in Organically Managed Sweetpotato Systems. Weed Technology 21:1039-1048.
Treadwell, D. D., W. Klassen, and M. Alligood. 2008. Annual cover crops in Florida
vegetable systems part 2: Production. EDIS Publication HS1141. http://edis.ifas.ufl.edu/hs389.
Treadwell, D.D., N.G. Creamer, G.D. Hoyt, J.S. Schultheis. 2008. Nutrient management
with cover crops and compost affects development and yield in organically managed sweetpotato systems. HortScience 43(5):1423-1433.
Tumlinson, J. H., W. J. Lewis and L. E. M. Vet. 1993. How parasitic wasps find their
hosts. Sci. American 26:145-154.

112
University of California Division of Agriculture and Natural Resources (UCDANR). 1992. Integrated pest management for cole crops and lettuce. Publication 3307.
Valenzuela, H. 2011. Pigeon peas: A Multipurpose Crop for Hawaii.
http://www.ctahr.hawaii.edu/sustainag/news/articles/V7-Valenzuela-cajanus.pdf
Valenzuela, H.R. and J. Smith. 2002. CTAHR Sustainable Agriculture Green Manure Crops Series: Pigeonpea. Univ. Hawaii. Coop. Ext. Serv. SA-GM-8.
Waddington, S., Webster D Sakala, W.D. and M. Mekuria. 2004. Progress in lifting soil
fertility in Southern Africa. In: New directions for a diverse planet. Proceedings of the 4th International Crop Science Congress.
Waddington, S.R., S.R. Mulugetta Mekuria, S. Siziba and J. Karigwindi. 2007. Long-
term yield sustainability and financial returns from grain legume–maize intercrops on a sandy soil in subhumid north central Zimbabwe. Expl Agric. 43:489-503.
Walters, S. A. 2011. Weed management systems for no-tillage vegetable production.
Herbicides: Theory and applications. InTech, Rijeka, Croatia 17-40. Walters, S.A. and Young, B.G. 2008. Utility of winter rye living mulch for weed
management in zucchini squash production. Weed Tech. 22: 724-728. Wang Koon-Hui, 2012. Cover crops as insectary plants to enhance above and below
ground beneficial organisms. The food provider. http://www.ctahr.hawaii.edu/sustainag/news/articles/V11-Wang insectarycovercrops.pdf
Wang, K.-H., C.R.R. Hooks, and S.P. Marahatta. 2011. Can using a strip-tilled living
mulch system enhance organisms higher up in the soil food web hierarchy? Applied Soil Ecology 49:107-117.
Wang, Q., Li, Y., and Klassen, W. 2006. Summer cover crops and soil amendments to
improve growth and nutrient uptake of okra. HortTechnology 16(2) :328-338. Wang, Q., W. Klassen, H.H. Bryan, Y. Li, and A. A. Abdul-Baki. 2003a. Influence of
summer cover crops on growth and yield of subsequent tomato crop in south Florida. Proc. Fla. State Hort. Soc. 11: 140-143.
Wang, Q., Y. Li, and W. Klassen. 2005. Influence of summer cover crops on
conservation of soil water and nutrients in a subtropical area.J. Soil Water Conservation 60: 58-63.
Westerman, P. R., A. Hofman, L.E.M. Vet, and W. van der Werf. 2003. Relative
importance of vertebrates and invertebrates in epigeaic weed seed predation in organic cereal fields. Agric. Ecosystems Environ. 95:417-425.
113
Westerveld, S. M., McDonald, M. R., McKeown, A. W., and Scott-Dupree, C. D. 2002. Optimum nitrogen fertilization of summer cabbage in Ontario. In XXVI International Horticultural Congress: Toward Ecologically Sound Fertilization Strategies for Field Vegetable Production 627: 211-215.
Weston, L.A., R. Harmon, and S. Mueller. 1989. Allelopathic potential of sorghum
sudangrass hybrid (sudex). J. Chem. Ecol. 15(6):1855-1865. Wilhot, J.H.; Morse, R.D. and Vaughan, D.H. 1990. Strip tillage production of summer
cabbage using high residue levels. Appl. Agric. Res. 5: 338-342. Wolfe, D.W., D. Riggs, G. Abawi, H. vanEs, L. Stivers-Young, and L. Pederson. 1998.
Management strategies for improved soil quality with emphasis on soil compaction. Cornell Univ. Dept. of Fruit & Veg. Sci. Report No. 72.
Wolfe, D. 1997. Soil Compaction: Crop Response and Remediation. Cornell Univ.,
Department of Fruit and Vegetable Science, Ithaca, N.Y. Report No. 63. Workman, R.B. 1983. Diagnosis of Insect or Similar Damage on Crops in the Hastings
area. Hastings ARC Research, Hastings. Report 1983-1. Y. Li, E. A. Hanlon, W. Klassen, Q. Wang, T. Olczyk, and I. V. Ezenwa. 2012. Cover
crop benefits for south Florida commercial vegetable croducers. EDIS Publication SL 242. http://edis.ifas.ufl.edu/ss641.
Yadav, R.L., K. Prasad, K S. Gangwar and B.S. Dwivedi. 1998. Cropping systems and
resource-use efficiency. Indian Journal of Agricultural Sciences. 68: 548-58.

114
BIOGRAPHICAL SKETCH
Dakson Sanon was born in Aquin, South Haiti. He is father of a beautiful 4 year-
old girl named Daknishael Bezaleel Sanon. Dakson did his Bachelor of Science in
agronomy in 2003 at State university of Haiti. He did two in-service training in Israel
(2004) and in France (2005) in “Conservation and marketing of fresh produce” and
“Research and Development in rural environment” respectively. In 2006, he moved
back to Aquin and began working for Agronomist and Veterinarians without Borders
(AVSF) as Assistant Coordinator of a Project for Production and Marketing of Fruit. In
2007, Dakson contributed to introducing new cultivars of watermelon and eggplant
seeds in the agro-ecosystems of Aquin. From 2007 to 2009, he worked for Funds for
Economic and Social Assistance as an agronomist responsible for implemented
economic project in rural communities. Before granting the scholarship to start his
master’s at University of Florida, he has been hired as extension agent for Ministry of
Agriculture in Damien, Haiti where he contributed to structuring growers’ farms and
organizations in the southern region of Haiti. Dakson’s major professional interest
includes promoting and improving organic and sustainable agriculture in the south.