Embed Size (px)
Citation preview
EVALUATION OF SUBSTRATES IN CONSTRUCTED, RAISED-BEDS FOR
VEGETABLE CULTURE
by
JESSICA LYNNE CUDNIK
(Under the Direction of David Berle)
ABSTRACT
With the increased interest in urban food production and community
gardens, many gardeners are constructing raised beds. Constructed raised beds offer
potential for better drainage and easier access to the growing area. Constructed raised
beds also have the ability to increase yield. Substrates for constructed raised beds are
often an afterthought, with little scientific basis for selecting materials or consideration
for the broader environmental effects of materials. This study evaluates eight substrates
and two crops, kale and basil, for yield and chlorophyll content. The same eight
substrates were also evaluated for sustainability factors such as carbon-mineralization (C-
min) over time and soil microbial biomass carbon (SMBC). Based on yield alone, the
100% compost substrate resulted in the highest yield across all three crop trials. The
native soil substrate had the lowest C-min and SMBC rate. Results varied with season
and crop, but yield and C-min indicate a substrate composed of compost/native soil is the
best overall.
INDEX WORDS: raised beds, vegetable yields, chlorophyll leaf content,
oxidation of organic matter, carbon, mineralization, substrate, soil microbial biomass
EVALUATION OF SUBSTRATES IN CONSTRUCTED, RAISED-BEDS FOR
VEGETABLE CULTURE
by
JESSICA LYNNE CUDNIK
B.S.A., University of Georgia, 2004
A Thesis Submitted to the Graduate Faculty of The University of Georgia in Partial
Fulfillment of the Requirements for the Degree
MASTER OF SCIENCE
ATHENS, GEORGIA
2014
© 2014
Jessica Lynne Cudnik
All Rights Reserved
EVALUATION OF SUBSTRATES IN CONSTRUCTED, RAISED-BEDS FOR
VEGETABLE CULTURE
by
JESSICA LYNNE CUDNIK
Major Professor: David Berle
Committee: George E. Boyhan
Julia W. Gaskin
Electronic Version Approved:
Maureen Grasso
Dean of the Graduate School
The University of Georgia
May 2014
iv
DEDICATION
To all those before me and all those that come after, may my work be but my
simple contribution to this community. I thank my family for raising me with strength, a
determined work ethic, and a thirst for knowledge as well as with a healthy sense of
adventure. I dedicate this accomplishment to all those who graciously offered support,
time, or a simple warm meal to get me that much closer to this personal goal of mine, a
Master’s of Science Degree in Horticulture.
v
ACKNOWLEDGEMENTS
I would like to thank Dr. Bailey and the generous funding that made my research
and graduate experience possible. I acknowledge David Berle and the entire staff of the
Horticulture community both locally in Athens, Georgia and afar, without their help and
expertise this thesis would not have happened. Working at UGArden was inspiring and
I’m proud that this student run farm exists for its purpose is greater and farther reaching
than the vegetables it grows. I acknowledge those with the vision and strong backs that
made it happen and all those that continue to make it a rich place to work. I would not be
where I am today and my research would not have been possible without the contacts
I’ve made in my previous professional career. You all have made the difference and I’m
proud to be a member of both the academic and private professional horticulture world.
vi
TABLE OF CONTENTS
Page
ACKNOWLEDGEMENTS .................................................................................................v
LIST OF TABLES ........................................................................................................... viii
LIST OF FIGURES ........................................................................................................... ix
CHAPTER
1 INTRODUCTION AND LITERATURE REVIEW .........................................1
Potential Substrates ......................................................................................3
C-mineralization and Microbial Biomass Impact ........................................6
Research Objectives .....................................................................................9
Literature Cited ..........................................................................................10
2 EVALUATION OF SUBSTRATES IN CONSTRUCTED, RAISED-BEDS
FOR VEGETABLE CULTURE…………………………………………………14
Abstract ......................................................................................................15
Introduction ................................................................................................15
Materials and Methods ...............................................................................16
Results ........................................................................................................20
Conclusion .................................................................................................21
3 ADDITIONAL DATA AND ANALYSIS…………………………………..36
Substrate Settling………………………………………………………...36
EC Readings……………………………………………………………..37

vii
Root Weight and Photographs…………………………………………...37
4 DISCUSSION AND CONCLUSIONS ...........................................................43
Future Work ...............................................................................................45
REFERENCES ..................................................................................................................47
viii
LIST OF TABLES
Page
Table 1: Eight substrates in the evaluation, their constituents and source.........................22
Table 2: Initial substrate properties, base line nutrient test and pH ...................................23
Table 3: Crop one kale yields grouping information using Fishers LSD ..........................25
Table 4: Crop two basil yields grouping information using Fisher’s LSD ........................27
Table 5: Crop three kale yields grouping information using Fishers LSD ........................29
Table 6: C mineralized over time per day ..........................................................................30
Table 7: Total C mineralized vs treatment grouping information using Fishers LSD…..31
Table 8: SMBC for first three day crop one kale yield kg versus treatment grouping
information using Fishers LSD ..............................................................................31
Table 9: Substrate drop in cm and grouping information using Fishers LSD ...................39
Table 10: Crop one kale EC and grouping information using Fishers LSD ......................40
Table 11: Crop two basil EC and grouping information using Fishers LSD .....................40
Table 12: Crop three kale EC and grouping information using Fishers LSD ....................40
Table 13: Crop one kale root weights in kg and grouping information using Fishers
LSD………………………………………………………………………………41
Table 14: Crop two basil root weights in kg and grouping information using Fishers
LSD………………………………………………………………………………42
ix
LIST OF FIGURES
Page
Figure 1: Research area with 24 beds in a complete randomized design ..........................24
Figure 2: Analysis of variance for SPAD reading average. ...............................................26
Figure 3: Analysis of variance for CCM reading average .................................................28
Figure 4: Analysis of variance for CCM reading average .................................................29
Figure 5: Graph of mean trends across all three crop trials ...............................................30
Figure 6: Integration of c-min and yield to see ideal substrate in lower right quadrant
where high yield and low c-min meet at compost/native soil.…………………..32
Figure 7: Constructed raised bed design with substrates and kale crop……..……..……33
Figure 8: Planting kale transplants at 30 x 30 cm spacing .................................................33
Figure 9: Re-tilling beds for next crop ...............................................................................34
Figure 10: Incubation experiment, respiration of re-wetted substrates..............................34
Figure 11: Barium chloride (BaCl₂) was added to the sodium hydroxide (NaOH) to form
barium carbonate (BaCO3) precipitate, the absorbed CO2 .....................................35
Figure 12: Using the CCM to take a chlorophyll measurement from crop three kale .......35
Figure 13: Graph pf substrate drop in cm over time by treatment .....................................39
Figure 14: Crop one kale photograph representative root from each treatment ................41
Figure 15: Crop two basil photograph representative root from each treatment ...............42
1
CHAPTER 1
INTRODUCTION AND LITERATURE REVIEW
Nationwide, community gardens are on the rise. A 1998 nationwide survey
reported over 6,000 community gardens (Association 1998). That number is estimated to
be closer to 10,000 today (Lee 2010). In recent years, urban gardening has become
increasingly popular in nearly all socioeconomic groups in the United States (Hanna and
Oh 2000). Community gardens are synonymous with the local food movement, with
gardeners often opting for organic or sustainable methods to grow produce (Morgan and
Murdoch 2000). In step with the increased interest in locally grown is concern about the
source of food and the impact agricultural practices have on the environment, the overall
effect of food productions carbon footprint.
Urban gardening is often challenging due to tough soil conditions like compaction
and lack of access to open ground in urban areas where concrete and asphalt can cover
the majority of the outdoor spaces (Hatch 1981). Some open urban spaces are considered
brownfields, with issues of possible soil contamination from heavy metals or chemicals.
Excess heavy metal accumulation in soils can be toxic to humans and other animals
(United States Department of Agriculture 2000). For example, lead is generally higher in
urban areas with older housing stock (Finster, Gray et al. 2004). Raised beds, filled with
the appropriate substrate, offer one way to address these concerns.
2
There are over 313,000,000 people living in the Unites States. Of that population,
less than 1 percent claim farming as an occupation (Agency 2007). While according to a
2008 (Association, 2009), 31 percent of all U.S. households participated in food
gardening. This estimates to be about 36 million households. Food gardening includes
growing vegetables, fruit, berries, and herbs. Estimates are that 21 percent of food
gardening households are new to gardening (Association 2009). Only 3 percent or about
1 million households, garden in a community garden plot with the majority having these
plots at home. The scale of this experiment is in line with a recent study that showed,
57% of people that have food gardens have a size of 100 sq. feet or less. This research
will help gardeners make a substrate choice that will increase yield while reducing the
potential impact of C released into the atmosphere.
Raised-bed vegetable culture can provide advantages such as: remediation of
difficult sites, improved drainage, higher yield per square foot, and ease of season
extension using covers (Starbuck 2003). Raised beds can be free-form were the soil is
simply mounded higher than the surrounding area or they can be created using
constructed boxes or containers. For purposes of this thesis, the term constructed raised
bed (CRB) will be employed and is defined as a wood-frame box, at least 8 inches tall,
built to hold a growing substrate. A CRB could also be built using rock, cement blocks,
or other suitable materials. In many situations, a CRB offers an easy way to prevent soil
compaction and provide easy access for young children and the elderly. Because of these
advantages, CRBs are a popular option for community and school gardens.
Typically, CRBs are filled with substrates available from garden centers in bags,
such as potting soil, compost, manure, and sometimes, native soil or some combination of
3
these materials. The most important physical properties of any substrate, native or
artificial, are good aeration and drainage, and optimum water retention capacity (Cabrera
2001). The capacity of a substrate to store water and air, as well its ability to provide
them to the plant (via its hydraulic conductivity and rate of gas exchange) are determined
by its total porosity (TP) and porosity characteristics (Raviv, Wallach et al. 2002).
Artificial soil substrates have been widely used in greenhouse and nursery
production for many years, so it is no surprise that essentially all of the current research
on soil substrates focuses on suitability for this industry. The production of greenhouse
crops involves a number of cultural inputs. Among these, perhaps the most important is
the type of growing substrate used and due to the relatively shallow depth and limited
volume of a container, growing media must be amended to provide the appropriate
physical and chemical properties necessary for plant growth (Sevgican 1997). Criteria for
selecting a substrate for CRBs are similar, along with considerations of local availability
and cost, especially for organizations with a limited budget.
Potential Substrates for a CRB
Pine Bark (PB)
In Georgia, pine bark (PB) is a reliable substrate in the nursery industry,
suggesting possible use in a CRB. Pine bark is a by-product of the wood and paper
industries in the state. Pine bark is commonly available in bags at gardens centers. Bark,
when used as a container media, has been shown to increase cation exchange capacity
(CEC) and water holding capacity, but decreases air porosity (Lemaire, Rivière et al.
1997). There have been some instances of plant toxicity from phenolic compounds in
4
fresh bark that have not been composted (Politycka, Wójcik-Wojtkowiak et al. 1985)
Aging and composting is an efficient way to reduce phytotoxicity by eradicating bark
toxins.
Wood Fiber Substrates (WFS)
Wood chips, or wood fiber substrates (WFS), which come from ground up trees
or tree trimmings, are a renewable resource, and may serve as a good alternative to peat
and/or PB. They are currently used in agriculture and landscape applications for mulch,
weed control, and to add organic matter over time. Wood fiber substrates (WFS) come
from trees growing locally, are reasonably priced and widely available. Wood fiber
substrates (WFS) have shown promise as a substrate for greenhouse and nursery crops
(Wright and Browder 2005). Fresh WFS is rarely used as a stand-alone growth substrate,
and usually forms a constituent in mixtures (normally less than 50%) (Raviv, Wallach et
al. 2002).
Nitrogen immobilization is a problem with substrates containing fresh WFS
(Handreck 1992). Under typical nursery growing conditions, moisture, temperature and
nutrient content within a growth medium are favorable to the biological decomposition of
wood wastes. Unlike bark, WFS’s originate from the inner part of the tree and are less
resistant to decay. Their lignin content is lower and carbon: nitrogen (C:N) ratio is higher
than bark. A C:N ratio of 24:1 prevents microorganisms from immobilizing soil nitrogen
and ensures a gradual and stable release of nutrients (Dorais 2007). In fact, in one study,
extremely high C/N ratios were found (Goh and Haynes 1977). This is important to
5
consider as we look at the sustainability of these substrates by measuring C-
mineralization and soil microbial biomass carbon.
Peat
Peat is of value for both the greenhouse industry and gardening. Its use dates to
the 18th
century (Perfect 1759). Peat has a higher water holding content when compared
with other container substrates (Sambo, Sannazzaro et al. 2008). It is a very common
base for many commercially available potting mixes (PM), and yet questions have been
raised about the sustainability and environmental impact of mining peat. (Rutherford and
Juma 1992). In addition, because peat bogs are important in atmospheric CO2
assimilation, there is a need to look for more renewable replacements (Raviv, Wallach et
al. 2002).
Compost
Compost (CP), is a general term, describing organic matter that has undergone
long, thermophilic, aerobic decomposition (Raviv, Wallach et al. 2002). Compost can
provide many desirable qualities, such as organic matter (OM), nutrients, and offers
potential for disease suppression and other physical, chemical, and biological properties
(Raviv 2005) The nutritional, organic, and chemical makeup of CP varies depending on
the raw materials inputs, typically based on readily available local materials. Compost is
an increasingly popular component in container media. This is partly because CP is a
cheaper alternative to peat (Compton 1980). Many growers now substitute part or all of
the peat in their substrate mix with CP, because mature CP has been shown to suppress
6
soil borne pathogens and acts, to a large extent, as a slow-release fertilizer (Williams and
Nelson 1992). However, non-mature CP can immobilize a significant amount of N.
Native Soil (NS)
Native soil (NS) is made up of four components: minerals, air, water, and OM. In
typical soils, minerals represent approximately 45%, water and air 25% each, and OM
from 2% to 5% of the total volume (Sullivan 1999). Although field soils are generally
unsatisfactory for container plant production (SAHIN, ORS et al. 2006), there can a
benefit to using them in a CRB, which do not have the same limitations imposed on
nursery containers such as weight and portability. Native soil is economical and readily
available for use in a CRB. Much of the native soil in Athens, GA (33°53'55.3"N
83°22'05.9"W) is sandy clay loam (Agriculture 2013), a soil type commonly found
throughout the southeast. Generally, as clay and OM increase, CEC and soil nutrients
increase. Clay soils also fix a certain amount of phosphorus (Broderson 2000) which is
very insoluble to plants and generally is in the form of inorganic phosphate compounds
that resist mineralization by mycorrhizal fungi in the soil (Busman, 1997 ) However, it
makes sense to consider NS as a potential substrate in a CRB in spite of the popular
belief among gardeners that clay soils are bad.
Evaluation of CRB Substrates
Yield and Chlorophyll Content
Yield was the primary means for treatment comparison. In addition to yield
chlorophyll content was compared. For this experiment a SPAD 502 Plus chlorophyll
7
meter was used as well as a CCM (chlorophyll content meter). The SPAD 502 Plus broke
after crop one. These meters provide a ‘chlorophyll index’ value expressed as relative
chlorophyll content and can indicate overall plant health and condition. This is relevant
because low chlorophyll concentration can directly limit photosynthetic potential and
hence primary production (Curran, Dungan et al. 1990, Filella, Serrano et al. 1995).
Chlorophyll content in leaves is an indirect measure of nutrient status and pigmentation
and can be related to stress physiology as concentrations of carotenoids increase and
chlorophylls generally decrease under stress and during senescence (Peñuelas and Filella
1998). These relative concentrations of pigments are known to change with abiotic
factors (light, radiation, water;(Larcher 2003) In this case, different substrates could
inherently affect the concentrations of pigments which can show up in a chlorophyll
content reading. Quantifying these proportions can provide important information about
relationships between plants and their environment (Richardson, Duigan et al. 2002).
C-mineralized and microbial biomass and impact
The Kyoto Protocol on climate change in 1992 demands fundamental
understanding of carbon (C) stabilization in soils because the amount of organic matter
stored in soils represents one of the largest reservoirs of organic C on a global scale
(Schlesinger 1995). Consequently, any change in the size and turnover rate of soil C
pools may potentially alter the atmospheric CO₂ concentration and the global climate
(Lützow, Kögel-Knabner et al. 2006). Carbon dioxide (CO₂) is produced in soil and
ultimately emitted into the atmosphere when microorganisms decompose organic
substrates to obtain energy for their growth and functioning (Wang, Dalal et al. 2003).
8
Carbon is stored in soil OM; however, most agricultural soils have been depleted
of C. A number of physical, management and climatic variables affect the capacity of soil
to store C and its loss as CO2. It is well known that fine-textured soils generally have
higher organic C and N contents than their coarse-textured counterparts (Jenny 1941).
To make a sound substrate recommendation one must look at potential environmental
impacts in addition to vegetable yields in CRBs. Carbon dioxide evolution is a good
indicator of carbon cycling and potential contributions to greenhouse gases. It is also
well correlated with soil microbial biomass (Franzluebbers, Haney et al. 1996) and an
index of and nutrient cycling. Consequently, CO2 evolution was chosen as an indicator
of potential environmental impacts of the chosen substrates.
Great efforts have also been made to quantify the readily decomposable soil
organic matter, i.e. the microbial substrates, using chemical, physical or incubation
methods in order to predict the rate of soil C mineralization (Davidson, Galloway et al.
1987) and (Sikora and McCoy 1990). Microbial biomass affects C cycling as well as
most other nutrient cycles. Microorganisms are generally considered as the driving force
behind the decomposition process and the cycling of C, N, P, and S and thus it is its
magnitude that will affect the nutrient flux (Smith and Paul 1990). For example, the
processes of the nitrogen cycle, carried out by microbes, transforms nitrogen from one
form to another. It is ‘fixed’ into a plant available form (NH₃). Knowledge of the roles of
microbial biomass and substrate supply and their interaction with soil matrix will help in
developing management strategies to improve soil fertility and to increase C
sequestration in soil (Wang, Dalal et al. 2003). Thus, in addition to a CO₂ measurement,
we need a microbial biomass measurement to make sure that we choose a suitable soil
9
that has a low C footprint but adequate microbial activity to maintain yields over time by
the breakdown of organic matter and making nutrients plant available.
Research Objectives
Though yield and carbon mineralization are common measures employed for
evaluating agricultural practices, it is rare the same level scrutiny is applied to gardening
practices, and yet gardening is practiced by far more people than farming. Though a
square meter of production space is far less than farm scale, information gleamed from
small plot work could be a starting point for making more environmentally educated
choices in regard to agriculture and lifestyle practices and their effect on C release. There
is strong interest in carbon footprint calculations, but academic definitions of ‘carbon
footprint’ vary. The scientific literature is surprisingly void of clarifications, despite the
fact that countless studies in energy and ecological economics measuring a ‘carbon
footprint’ have been published.
The lack of research on suitable soil mixes for used in raised beds has left room
for a lot of misinformation and misunderstanding regarding the reasons for selecting
substrates and the potential benefits or problems from using each one. The purpose of this
study is to evaluate locally available substrates suitable for use in CRB culture. Since
soils can be a source or sink for carbon it is logical to evaluate potential substrates with
equal weight to yield for c-mineralization.
10
Literature Cited
Agency, U. S. E. P. (2007, 4/15/2013). "Ag 101." Demographics Retrieved 3/14, 2014,
from http://www.epa.gov/oecaagct/ag101/demographics.html.
Association, A. C. G. (1998). "National Community Gardening Survey: 1996." New
York: America Community Garden Association.
Association, N. G. (2009). "The impact of home and community gardening in America."
South Burlington, VT. Accessed February 25: 2009.
Baiyeri, K. and B. Mbah (2006). "Effects of soilless and soil-based nursery media on
seedling emergence, growth and response to water stress of African breadfruit (Treculia
africana Decne)." African Journal of Biotechnology 5(15).
Broderson, W. D. (2000). "From the Surface Down An Introduction to Soil Surveys for
Agronomic Use." 26.
Cabrera, R. (2001). "Fundamentals of container media management: Part I Physical
properties." The State University of New Jersey Agricultural Experiment Station, to be
found at< http://aesop. rutgers. edu/~ Floriculture/publications/physprop. htm.
Chong, C. (2005). "Experiences with Wastes and Composts in Nursery Substrates."
HortTechnology 15(4): 739-747.
Compton, F. H. a. I. J. (1980). "Sowing date, harvest date and the yield of forage brassica
crops." Grass and Forage Science 35(2): 147–157.
Curran, P. J., J. L. Dungan and H. L. Gholz (1990). "Exploring the relationship between
reflectance red edge and chlorophyll content in slash pine." Tree Physiology 7(1-2-3-4):
33-48.
Davidson, E., L. Galloway and M. Strand (1987). "Assessing available carbon:
Comparison of techniques across selected forest soils 1." Communications in Soil
Science & Plant Analysis 18(1): 45-64.
Dorais, M. (2007). "Organic production of vegetables: State of the art and challenges."
Canadian Journal of Plant Science 87(5): 1055-1066.
11
Filella, I., L. Serrano, J. Serra and J. Penuelas (1995). "Evaluating wheat nitrogen status
with canopy reflectance indices and discriminant analysis." Crop Science 35(5): 1400-
1405.
Finster, M. E., K. A. Gray and H. J. Binns (2004). "Lead levels of edibles grown in
contaminated residential soils: a field survey." Science of The Total Environment 320(2–
3): 245-257.
Franzluebbers, A. J., R. L. Haney, F. M. Hons and D. A. Zuberer (1996). "Determination
of microbial biomass and nitrogen mineralization following rewetting of dried soil." Soil
Science Society of America Journal 60(4): 1133-1139.
Goh, K. M. and R. Haynes (1977). "Evaluation of potting media for commercial nursery
production of container grown plants: III. Effects of media, fertiliser nitrogen, and a
nitrification inhibitor on soil nitrification and nitrogen recovery of Callistephus chinensis
(L.) Nees ‘Pink Princess’." New Zealand journal of agricultural research 20(3): 383-393.
Handreck, K. A. (1992). "Rapid assessment of the rate of nitrogen immobilisation in
organic components of potting media: I. Method development." Communications in Soil
Science & Plant Analysis 23(3-4): 201-215.
Hanna, A. K. and P. Oh (2000). "Rethinking Urban Poverty: A Look at Community
Gardens." Bulletin of Science, Technology & Society 20(3): 207-216.
Hatch, D. L. (1981). "Raised bed gardening."
Jenkinson, D. and D. S. Powlson (1976). "The effects of biocidal treatments on
metabolism in soil—V: a method for measuring soil biomass." Soil biology and
biochemistry 8(3): 209-213.
Jenny, H. (1941). Factors of soil formation, McGraw-Hill Book Company New York,
NY, USA.
Larcher, W. (2003). Physiological plant ecology: ecophysiology and stress physiology of
functional groups, Springer.
Lee, V. N. (2010). Community Gardens.
Lemaire, F., L. Rivière, S. Stievenard, O. Marfa, S. Gschwander and F. Giuffrida (1997).
Consequences of organic matter biodegradability on the physical, chemical parameters of
substrates. International Symposium on Composting & Use of Composted Material in
Horticulture 469.
12
Lützow, M. v., I. Kögel-Knabner, K. Ekschmitt, E. Matzner, G. Guggenberger, B.
Marschner and H. Flessa (2006). "Stabilization of organic matter in temperate soils:
mechanisms and their relevance under different soil conditions – a review." European
Journal of Soil Science 57(4): 426-445.
Morgan, K. and J. Murdoch (2000). "Organic vs. conventional agriculture: knowledge,
power and innovation in the food chain." Geoforum 31(2): 159-173.
Peñuelas, J. and I. Filella (1998). "Visible and near-infrared reflectance techniques for
diagnosing plant physiological status." Trends in plant science 3(4): 151-156.
Perfect, F. (1759). The Practice of Gardening.
Politycka, B., D. Wójcik-Wojtkowiak and T. Pudelski (1985). "Phenolic compounds as a
cause of phytotoxicity in greenhouse substrates repeatedly used in cucumber growing."
Acta Hortic 156: 89-94.
Raviv, M. (2005). "Production of high-quality composts for horticultural purposes: A
mini-review." HortTechnology 15(1): 52-57.
Raviv, M., R. Wallach, A. Silber and A. Bar-Tal (2002). "Substrates and their analysis."
Richardson, A. D., S. P. Duigan and G. P. Berlyn (2002). "An evaluation of noninvasive
methods to estimate foliar chlorophyll content." New Phytologist 153(1): 185-194.
Rutherford, P. and N. Juma (1992). "Influence of texture on habitable pore space and
bacterial-protozoan populations in soil." Biology and fertility of soils 12(4): 221-227.
SAHIN, U., S. ORS, S. ERCISLI, O. ANAPALI and A. ESITKEN (2006). "Effect of
pumice amendment on physical soil properties and strawberry plant growth." Journal of
Central European Agriculture 6(3): 361-366.
Sambo, P., F. Sannazzaro and M. R. Evans (2008). "Physical properties of ground fresh
rice hulls and sphagnum peat used for greenhouse root substrates." HortTechnology
18(3): 384-388.
Schlesinger, W. H. (1995). An overview of the C cycle. Boca Raton, FL, Lewis
Publishers.
Sevgican, A. (1997). Protected cultivation in Turkey. International Symposium
Greenhouse Management for Better Yield & Quality in Mild Winter Climates 491.
13
Sikora, L. and J. McCoy (1990). "Attempts to determine available carbon in soils."
Biology and Fertility of Soils 9(1): 19-24.
Smith, J. and E. Paul (1990). "The significance of soil microbial biomass estimations."
Soil biochemistry 6: 357-396.
Spiertz, J. (2010). "Nitrogen, sustainable agriculture and food security. A review."
Agronomy for Sustainable Development 30(1): 43-55.
Starbuck, C. (2003). "Raised-bed gardening." MU Guide, University of Missouri
Columbia, MO: 4.
Sullivan, P. (1999). Sustainable soil management, Appropriate Technology Transfer for
Rural Areas.
UNEP (2007). Reactive nitrogen in the environment: too much or too little of a good
thing. Paris, France, USA and UNEP DTIE Sustainable Consumption and Production
Branch.
United States Department of Agriculture, N. R. C. S. (2000). "Soil Quality - Urban
Technical Note." 3.
Voroney, R. P. and E. A. Paul (1984). "Determination of C and N in situ for calibration
of the chloroform fumigation-incubation method." Soil Biology and Biochemistry 16(1):
9-14.
Wang, W., R. Dalal, P. Moody and C. Smith (2003). "Relationships of soil respiration to
microbial biomass, substrate availability and clay content." Soil Biology and
Biochemistry 35(2): 273-284.
Williams, K. A. and P. V. Nelson (1992). "Low, controlled nutrient availability provided
by organic waste materials for chrysanthemum." Journal of the American Society for
Horticultural Science 117(3): 422-429.
Wright, R. D. and J. F. Browder (2005). "Chipped pine logs: A potential substrate for
greenhouse and nursery crops." HortScience 40(5): 1513-1515.
14
CHAPTER 2
EVALUATION OF SUBSTRATES IN CONSTRUCTED, RAISED-BEDS FOR
VEGETABLE CULTURE
___________________________
1 Cudnik, J.L., D.C. Berle, G.E. Boyhan, and J.W. Gaskin. To be submitted to HortTechlology.
15
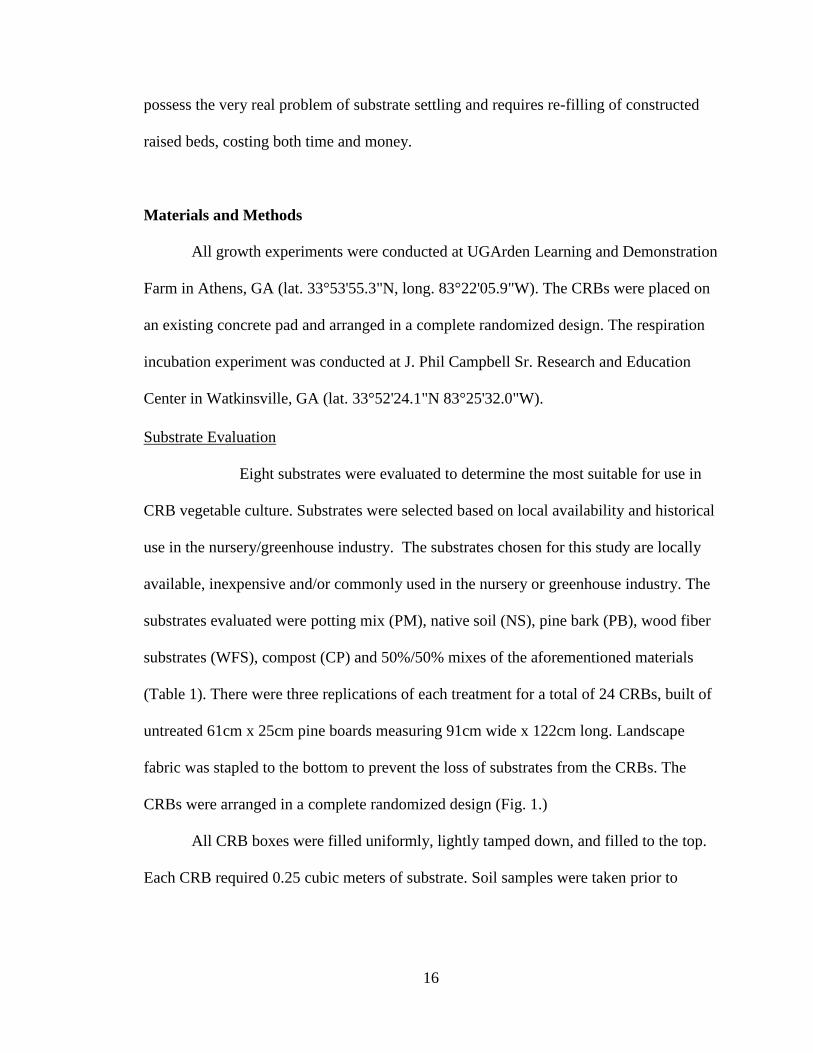
Abstract
With the increased interest in urban food production and community gardens,
many gardeners are constructing raised beds. Constructed raised beds offer potential for
better drainage and easier access to the growing area. Constructed raised beds also have
the ability to increase yield. Substrates for constructed raised beds are often an
afterthought, with little scientific basis for selecting materials or consideration for the
broader environmental effects of materials. This study evaluates eight substrates and two
crops, kale and basil, for yield and chlorophyll content. The same eight substrates were
also evaluated for sustainability factors such as carbon-mineralization (C-min) over time
and soil microbial biomass carbon (SMBC). Based on yield alone, the 100% compost
substrate resulted in the highest yield across all three crop trials. The native soil substrate
had the lowest C-min and SMBC rate. Results varied with season and crop, but yield and
C-min indicate a substrate composed of compost/native soil is the best overall.
Introduction
One critical consideration for community garden programs and urban farming is
soil or substrate for growing fruits and vegetables. The decision to work with existing soil
or import substrate materials is one that is often made without knowledge of horticulture
practices or understanding of broader environmental implications. Plant growth and yield
are practical measures of success of substrate selected, but equally important are
considerations of CO2 footprint over time as the substrate respires and oxidizes.
Oxidation of substrate may, at first, seem beyond the realm of small gardens, however, it
16
possess the very real problem of substrate settling and requires re-filling of constructed
raised beds, costing both time and money.
Materials and Methods
All growth experiments were conducted at UGArden Learning and Demonstration
Farm in Athens, GA (lat. 33°53'55.3"N, long. 83°22'05.9"W). The CRBs were placed on
an existing concrete pad and arranged in a complete randomized design. The respiration
incubation experiment was conducted at J. Phil Campbell Sr. Research and Education
Center in Watkinsville, GA (lat. 33°52'24.1"N 83°25'32.0"W).
Substrate Evaluation
Eight substrates were evaluated to determine the most suitable for use in
CRB vegetable culture. Substrates were selected based on local availability and historical
use in the nursery/greenhouse industry. The substrates chosen for this study are locally
available, inexpensive and/or commonly used in the nursery or greenhouse industry. The
substrates evaluated were potting mix (PM), native soil (NS), pine bark (PB), wood fiber
substrates (WFS), compost (CP) and 50%/50% mixes of the aforementioned materials
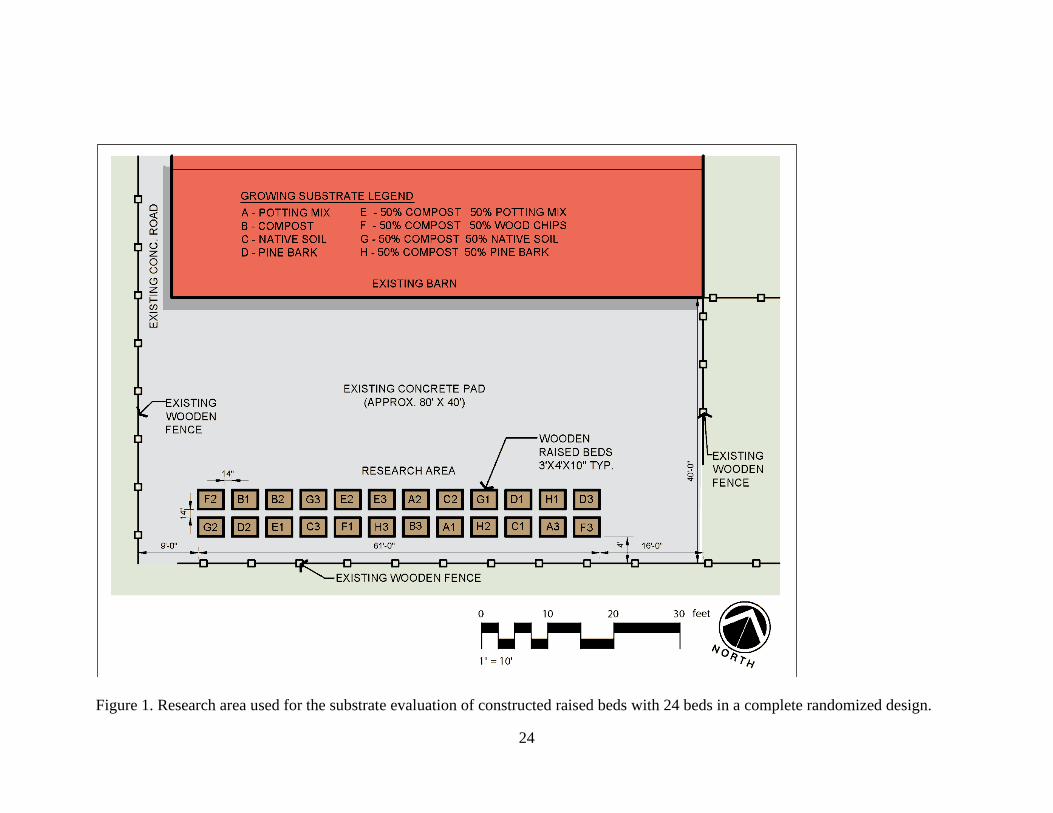
(Table 1). There were three replications of each treatment for a total of 24 CRBs, built of
untreated 61cm x 25cm pine boards measuring 91cm wide x 122cm long. Landscape
fabric was stapled to the bottom to prevent the loss of substrates from the CRBs. The
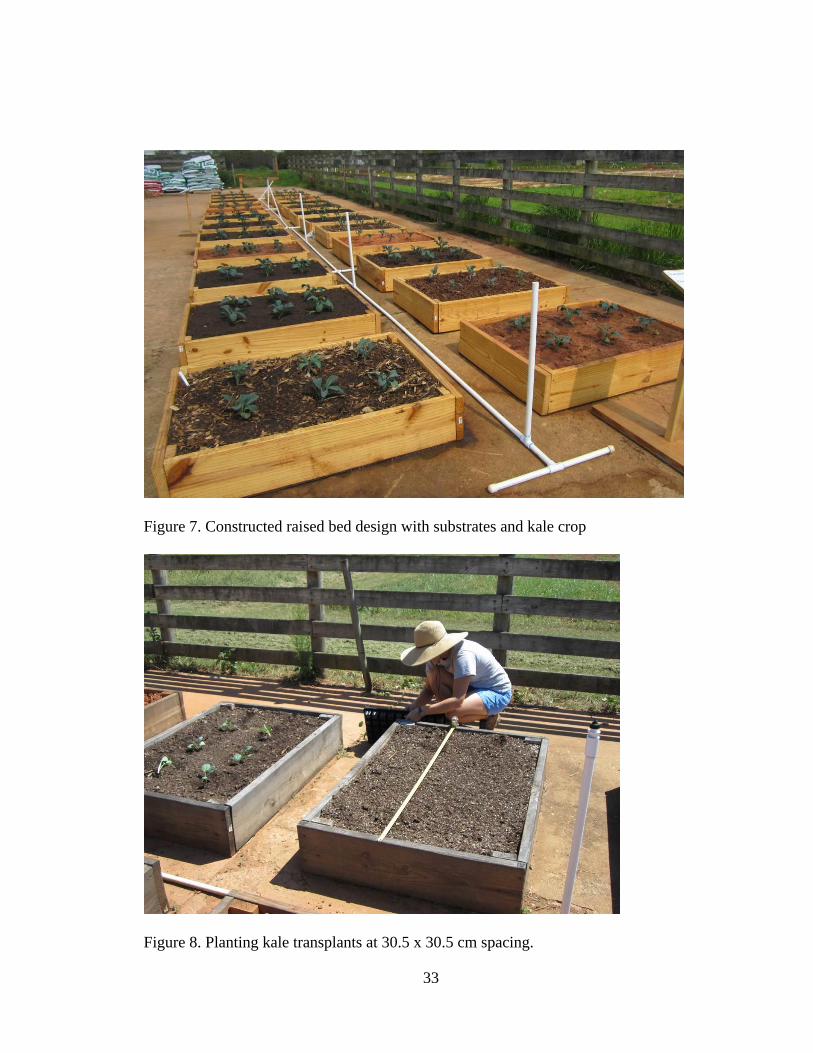
CRBs were arranged in a complete randomized design (Fig. 1.)
All CRB boxes were filled uniformly, lightly tamped down, and filled to the top.
Each CRB required 0.25 cubic meters of substrate. Soil samples were taken prior to
17
fertilization and pH adjusted according to the results by adding the recommended amount
of lime 1.13 kg per treatment area. Lime was added only to the PB treatment.
Symphony (5-4-3, + 0.09 Ca) granular fertilizer was incorporated at a rate of
0.32kg per treatment to provide nitrogen at the rate of 145kg/hectare1.
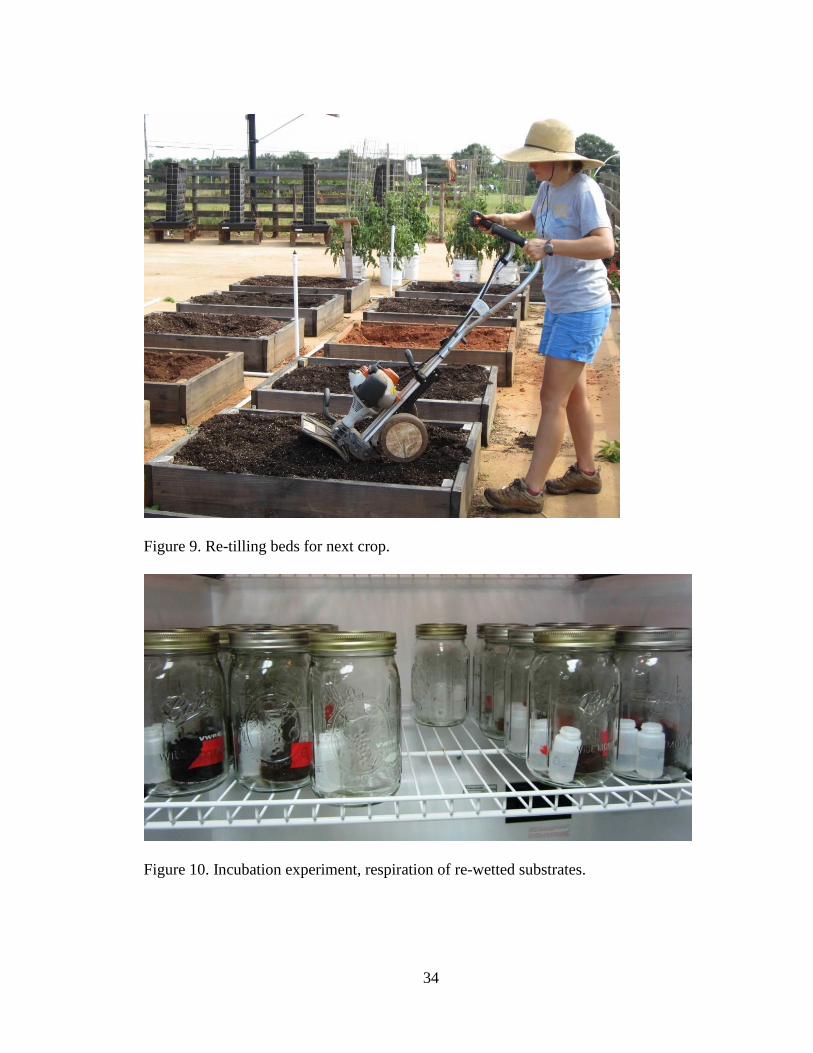
Kale (Brassica oleracea ‘Toscano’) was the first crop grown and planted on 30.5
cm x 30.5 cm spacing in spring on March 30, 2013. The second crop was sweet
mammoth basil (Ocimum basilicum) planted on 30.5 cm x 30.5 cm spacing in summer on
June 14, 2013. The third crop was kale (Brassica oleracea ‘Toscano’) planted on 30.5 cm
x 30.5 cm spacing in fall on September 13, 2013. All crops were irrigated uniformly with
overhead mini-sprinklers on an as-needed basis. Weeds were removed by hand and
insects were either removed by hand or sprayed with pesticides approved by the USDA
National Organic Program guidelines.
Kale was harvested every two weeks after an initial four week growth period over
a 66 day period. On the day of harvest SPAD (chlorophyll content) meter readings were
taken of all twenty-four beds. (The SPAD meter died after the first crop season and was
replaced with a Chlorophyll Content Meter (CCM) which gives the same between
treatment index.)
Prior to planting the second crop, CRBs were cleaned of plant debris and
measured for substrate drop from top of bed. Symphony fertilizer (5-4-3 + 0.09 Ca) was
broadcast and incorporated at the rate of 0.32 kg per treatment which is 145 kg/hectare.
This is at the lower end of the recommended rates which provides adequate plant growth
yet allows the substrate characteristics to evolve. Basil was grown for the second crop
1 Symphony is composted poultry manure and comes from a USDA organic egg laying operation.
18
trial during the summer months. At maturity, basil was harvested every two weeks after
an initial four week growth period. At each harvest, WET and CCM readings were taken.
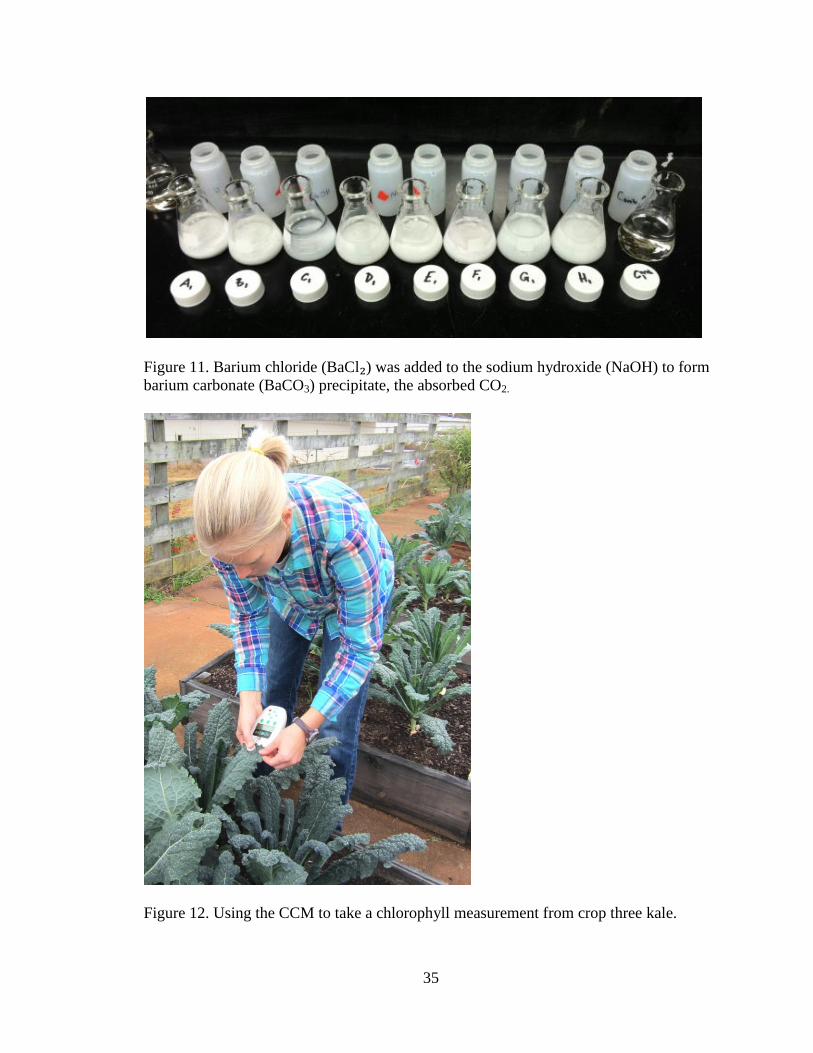
After the final basil harvest the CRBs were cleaned of any plant debris and
measured to determine the amount of settling and/or respiration. The CRBs were re-tilled,
Symphony fertilizer (5-4-3 + 0.09 Ca) was incorporated at of 0.32 kg per treatment and
planted with six kale plants for the fall season. An early frost ended the kale harvest
earlier than anticipated on November 13, 2013.
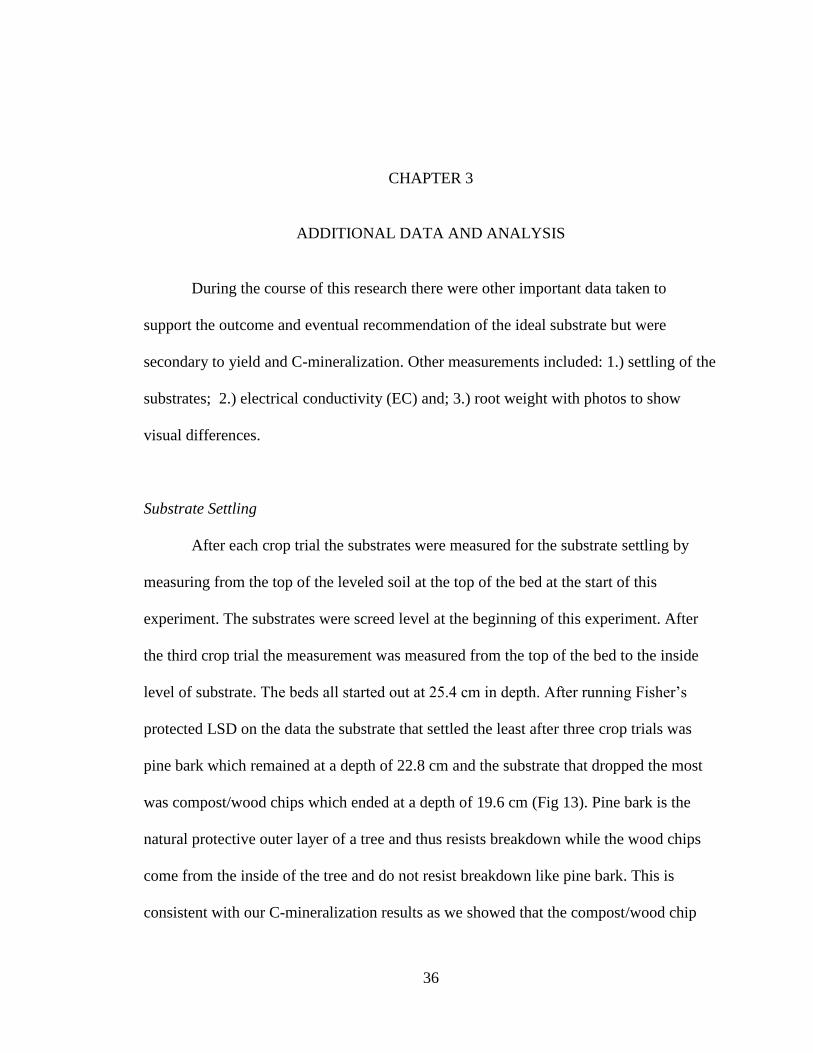
2.2 Laboratory respiration following rewetting of dried substrates
A companion laboratory respiration experiment evaluated the C-mineralized and
microbial biomass of the substrates, mimicking the crop cycle of 66 days of trial one kale
(Brassica oleracea, ‘Toscano’). Thirty grams of each substrate were air-dried and sieved
through a 4.75 mm sieve and then moistened to 55% of water-filled pore space (WFP) in
a Pyrex beaker (Fig. 10). This was accomplished by determining the volume occupied by
soil in the beaker by packing and leveling the soil and determining the amount of water
needed with these equations: mL H₂O = 0.55 x porosity x volume occupied by soil; and
porosity = 1-(bulk density/2.65) bulk density = (g of soil/mL of soil). The beaker,
together with a scintillation vial with deionized (DI) water and a scintillation vial with 10
mL of NaOH, was placed in a 1 L wide-mouth mason jar and capped. There were eight
substrates used and four repetitions of each for a total of thirty-two jars arranged in a
randomized complete block design.
Fresh NaOH vials were changed out at previously determined intervals of 3 days,
7 days, 14 days, another 14 days and then 28 days to total 66 days, mimicking the kale
19
crop cycle. Franzluebbers et al. (1996) showed the initial flush of CO₂ in the first 3 days
of rewetted soil is well correlated with soil microbial biomass; consequently our first
interval was designed to capture this initial flush. Carbon dioxide mineralization typically
increases initially then tapers off with time. The next 7- day interval was expected to
capture the CO2 peak. After the first 10 days, the CO₂ slowly declines and therefore two,
2 week intervals and a final 4 week interval were chosen with the expectation that soil
microbial biomass carbon activity would be low enough not to exceed absorption abilities
of the NaOH vial .
At the end of each interval, the jars were taken out of the incubator, and the traps
rapidly removed and sealed (to avoid CO₂ contamination). Each NaOH vial was removed
from the jar, immediately capped for later titration, and a fresh NaOH scintillation vial
was placed back in the jar to capture CO₂ for another interval. The jars were placed in an
incubator at 2 C for the duration of the experiment.
Carbon dioxide evolution was measured by titration. Barium chloride (BaCl2) was
added to the NaOH to form a barium carbonate (BaCO3) precipitate containing the
absorbed CO2 (Fig. 11). Three drops of phenolphthalein indicator were added to the vials
that were titrated with hydrochloric acid (HCl) until no color was observed. The amount
of acid used to force the color change represented unconsumed NaOH. The following
equations were used to calculate the quantity of C-mineralized (CMIN) CMIN (mg * kgˉ¹
AD soil) = (mL BLANK – mL SAMPLE) x N HCl x 6 x 1000/ (g AD soil); where AD
represent air dried soil. To calculate the concentration of soil microbial biomass carbon
(SMBC) from the titration use SMBC (mg * kgˉ¹ AD soil) = (mL BLANK – mL
SAMPLE) x N HCl x 6 x 1000/((g AD soil)/kc) where, 6 = equivalent weight of C and kc
20
= 0.41 (efficiency factor). (Jenkinson and Powlson 1976, Voroney and Paul 1984,
Franzluebbers, Haney et al. 1996).
Statistical Analysis
For the CRB study, yield was analyzed using one-way ANOVA. Mean separation
was determined using Fisher’s LSD method. Carbon-mineralization was analyzed using a
general linear model. Soil microbial biomass carbon was analyzed using Fisher’s test.
Chlorophyll content data was analyzed using repeated measures ANOVA to identify
significant interactions.
Results
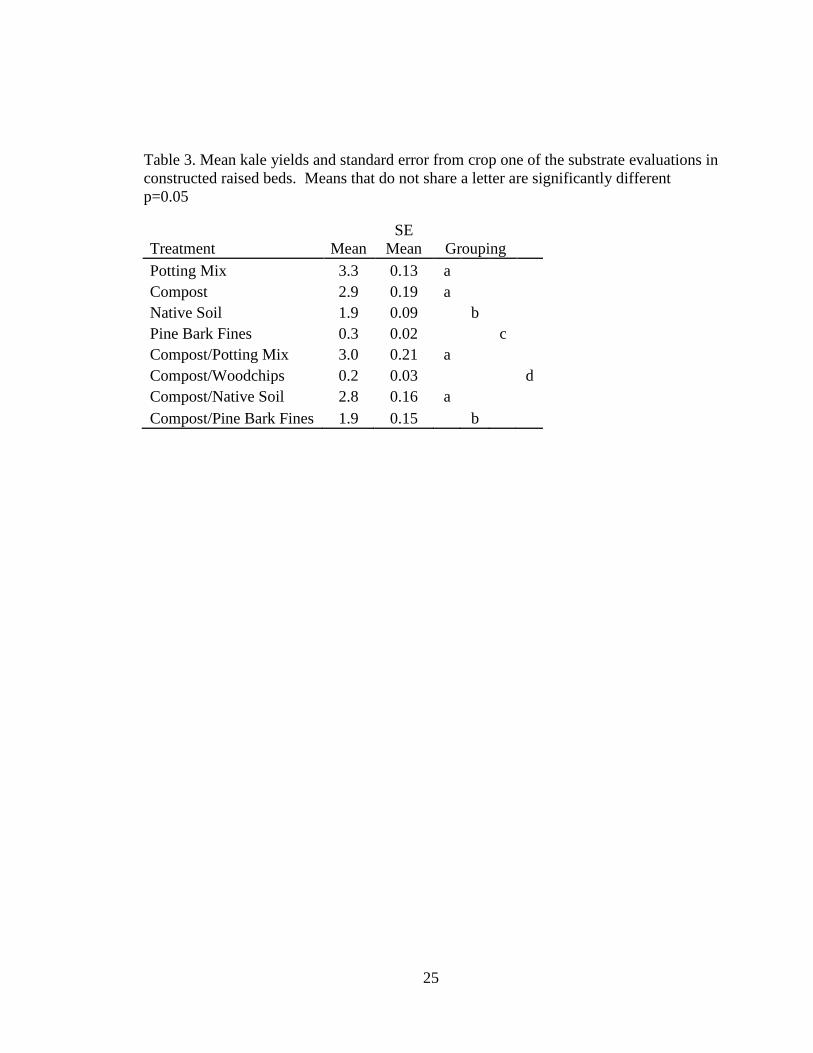
Kale yield differed significantly as a function of substrate. In the first kale crop
trial, the highest yielders were PM, CP, CP/PM, and CP/NS (Table 3). Basil yield also
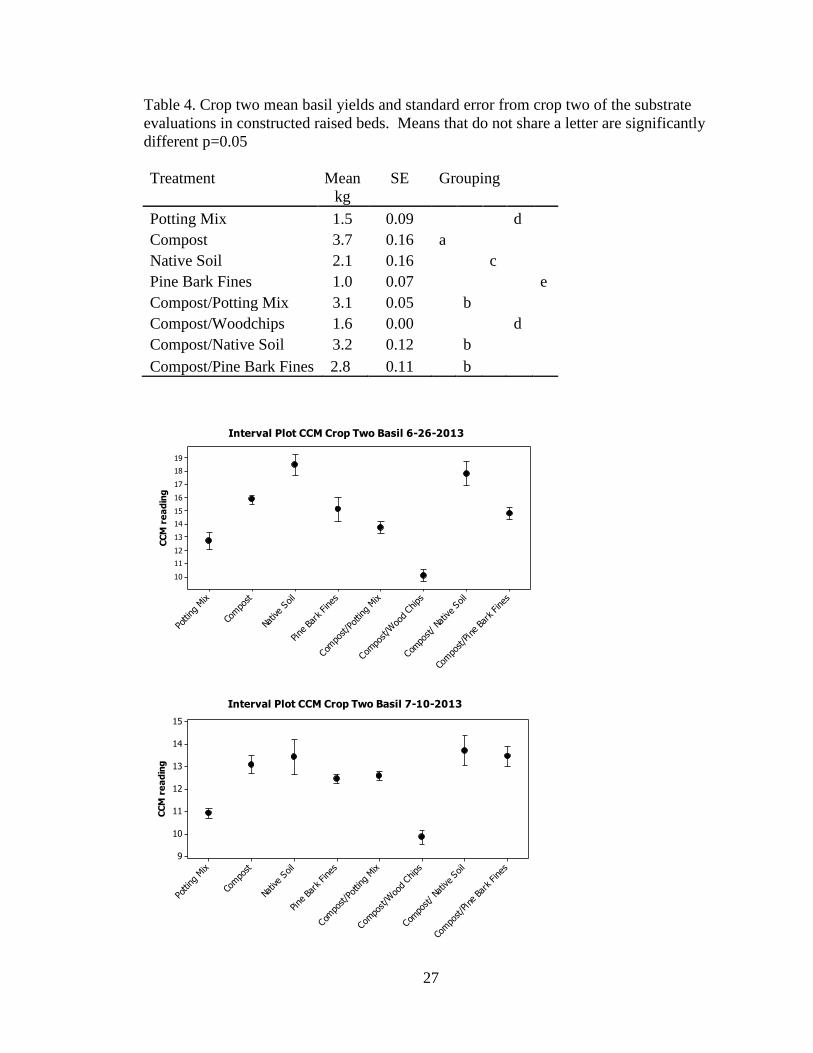
was significantly different as a function of substrate. In the second crop trial, basil yields
were highest in CP, followed by CP/NS, CP/PM, and CP/PB (Table 4). Differences were
smaller for the third trial of kale, with highest yield in CP, CP/PM, CP/PB, and NS (Table
5). There was disease in one of the beds with CP/NS reducing the total yield in this
treatment.
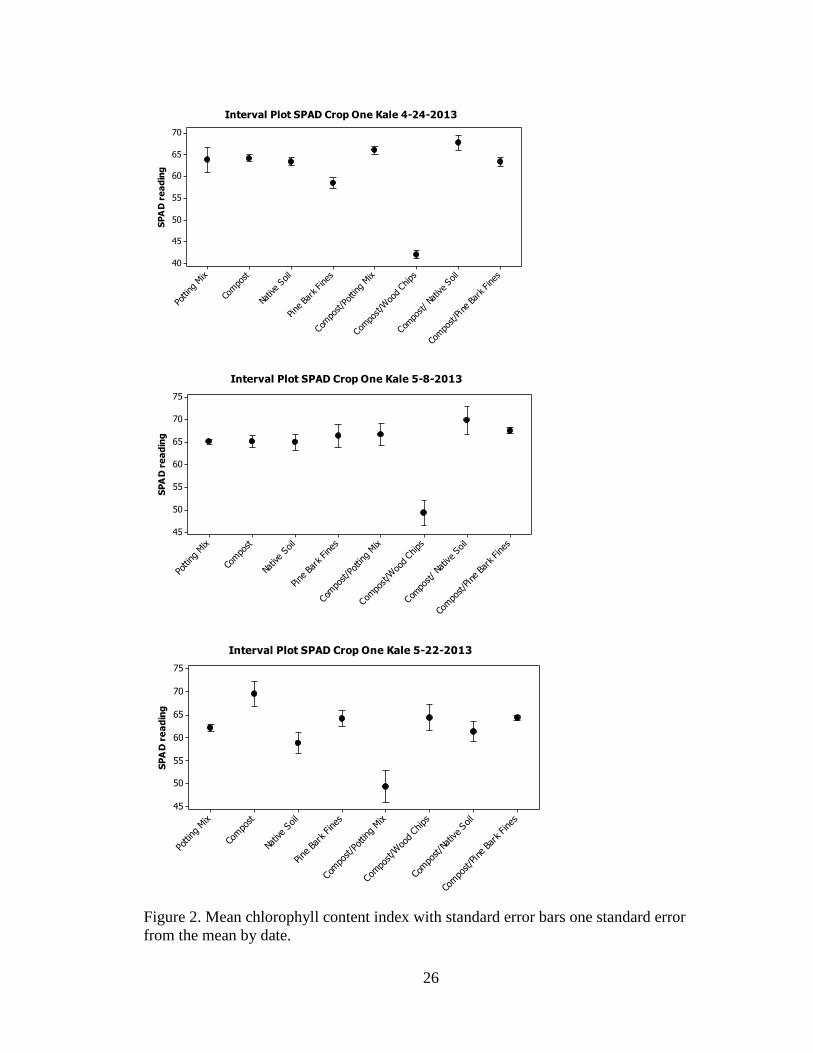
SPAD meter chlorophyll readings followed a similar trend in crop one kale with
CP/ NS having the highest reading indicating the highest chlorophyll content (Fig. 2).
Crop one kale chlorophyll content differed significantly between treatments as a function
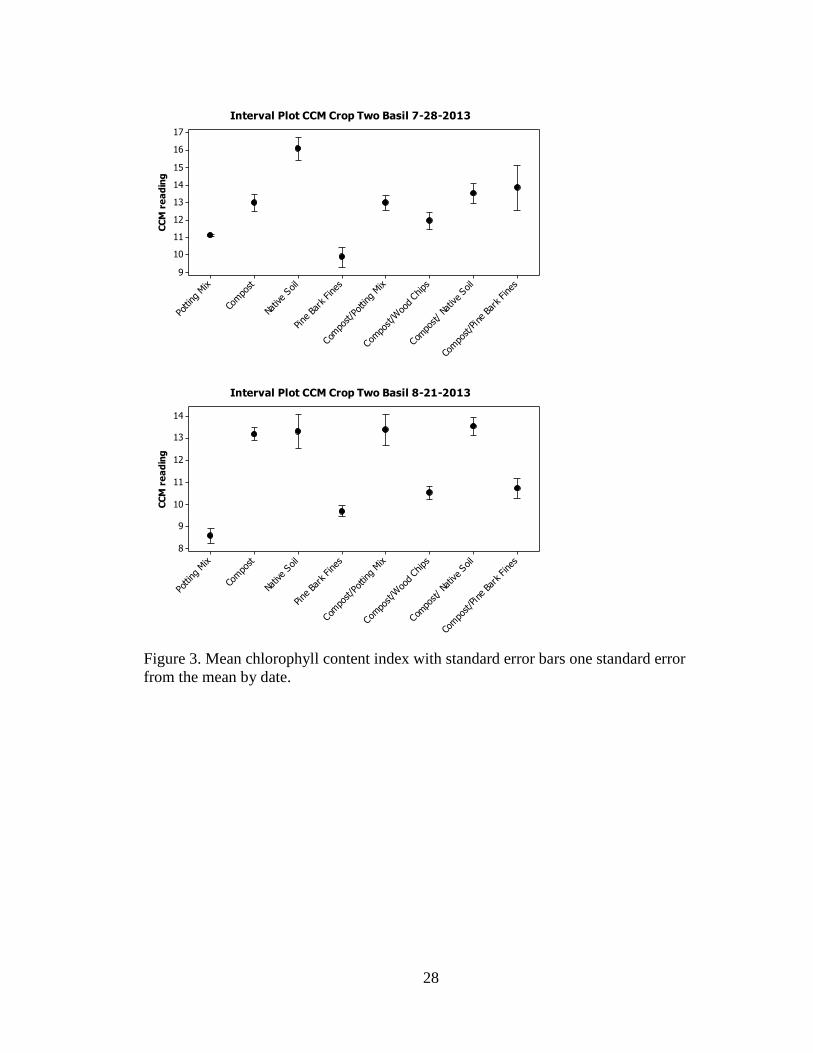
of substrate. In crop two basil NS had the highest chlorophyll reading followed closely
by CP/NS (Fig. 3). Crop two basil chlorophyll content differed significantly between
21
substrates. In crop three the substrates chlorophyll content differed slightly between
substrates as a function of treatment (Fig. 4). There were only two CCM measurements
taken because an early frost killed the crop on Nov. 13, 2013. It was expected that over
time the CCM measurements would have shown greater significant had there been a
longer crop time.
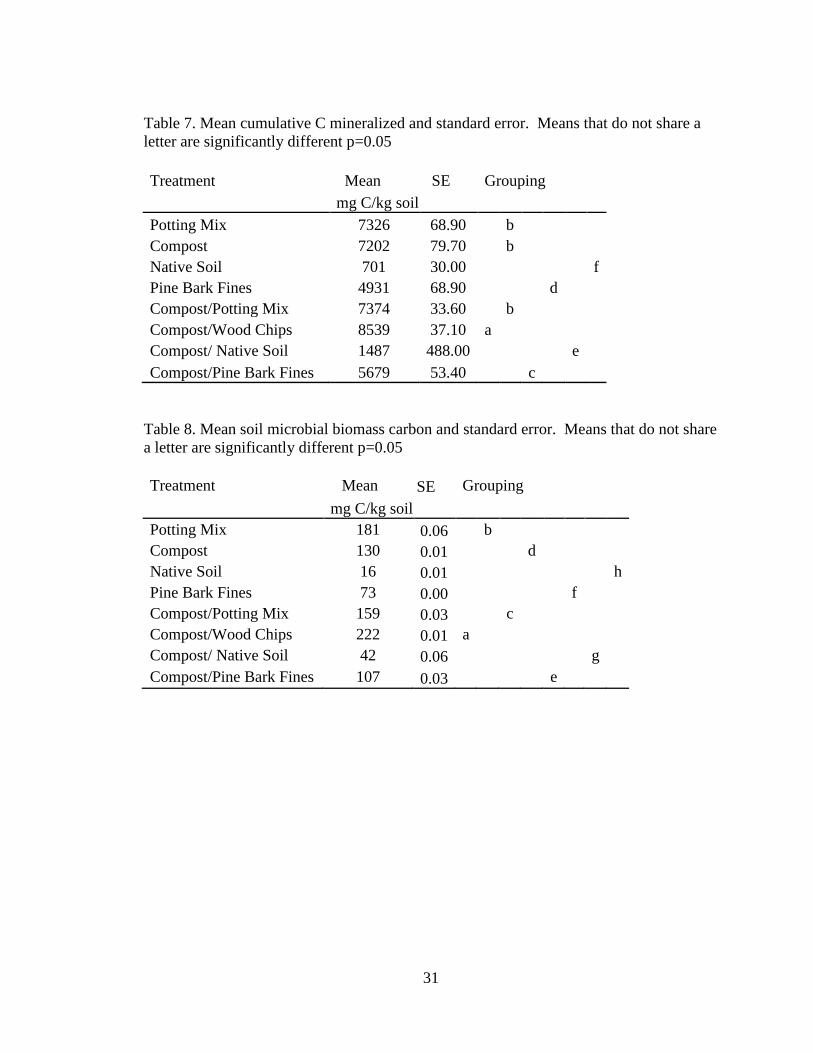
C-mineralization results showed that NS had the lowest rate followed by the next
least substrate, CP/NS (Table 7). Total C-min differed significantly as a function of
substrate. All substrates were significantly different in their SMBC. The highest was
CP/WC with a mean of 222.2 mg per kg -1
AD soil and the lowest was NS with a mean of
16 mg per kg -1
AD soil (Table 8).
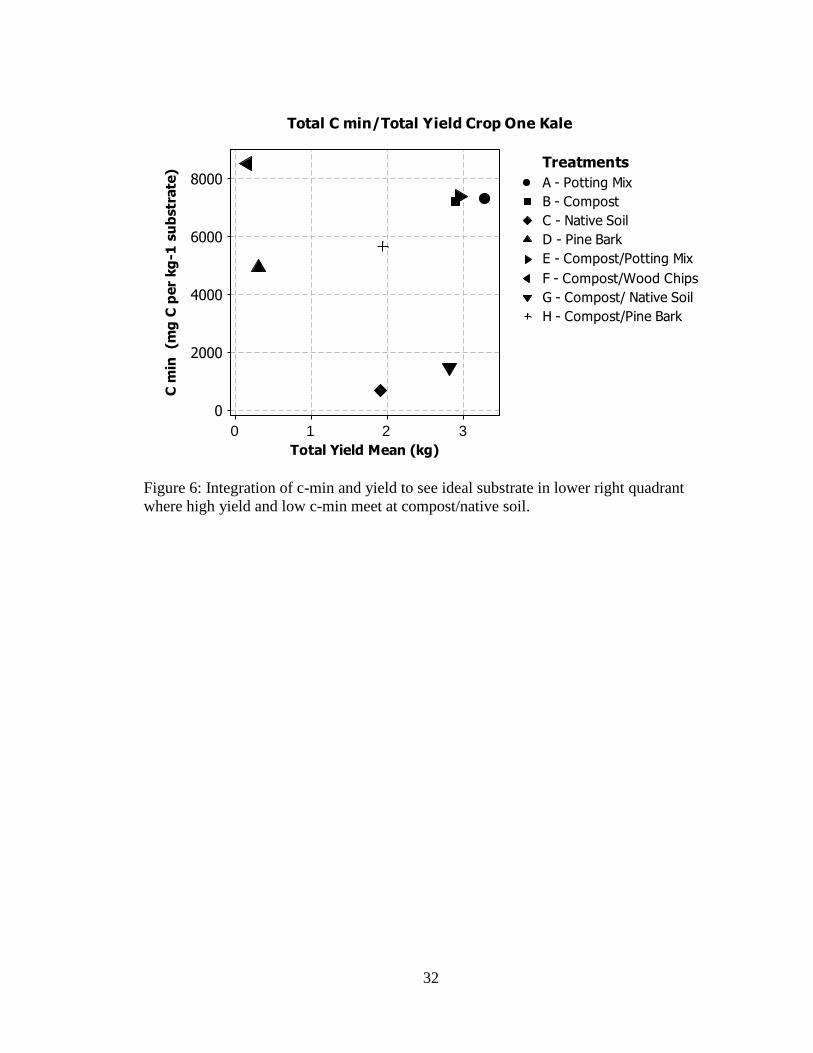
Conclusion
Compost was the top yielding substrate in all three cropping trials, while NS had
the lowest C mineralization. When selected for optimal yield with lowest respiration rate,
the compost/native soil is best compromise of the two measures (Fig. 6).
22
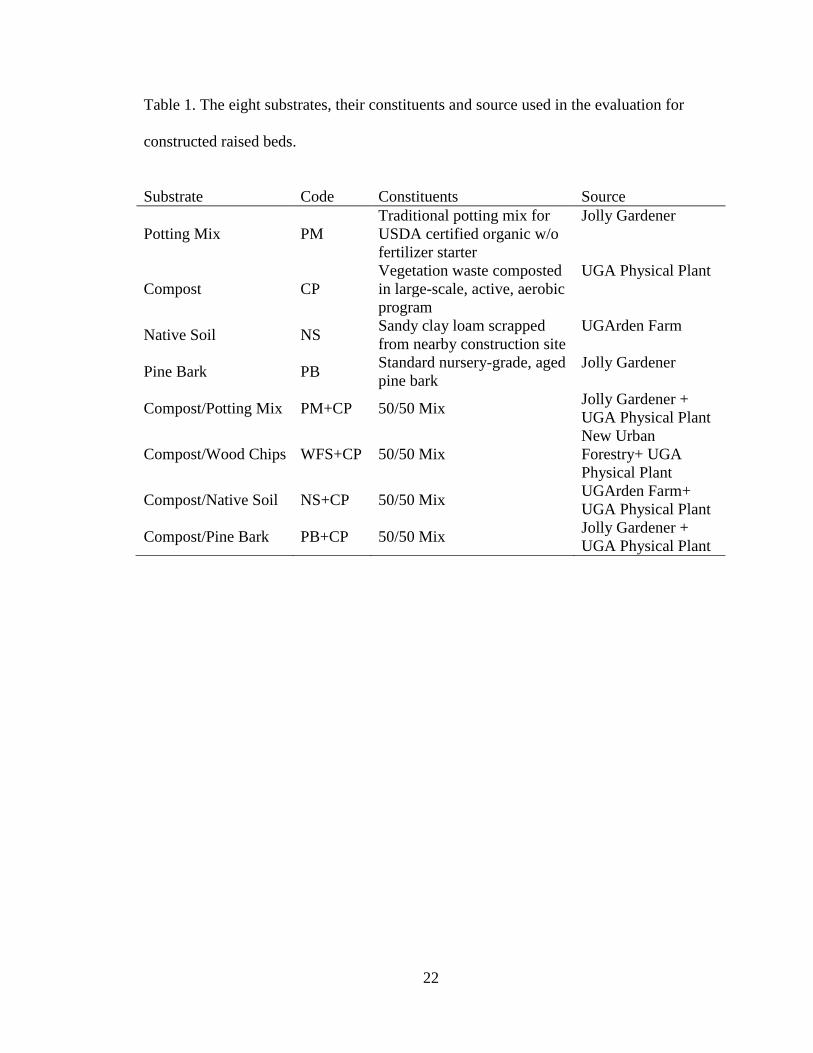
Table 1. The eight substrates, their constituents and source used in the evaluation for
constructed raised beds.
Substrate Code Constituents Source
Potting Mix PM
Traditional potting mix for
USDA certified organic w/o
fertilizer starter
Jolly Gardener
Compost CP
Vegetation waste composted
in large-scale, active, aerobic
program
UGA Physical Plant
Native Soil NS Sandy clay loam scrapped
from nearby construction site
UGArden Farm
Pine Bark PB Standard nursery-grade, aged
pine bark
Jolly Gardener
Compost/Potting Mix PM+CP 50/50 Mix Jolly Gardener +
UGA Physical Plant
Compost/Wood Chips WFS+CP 50/50 Mix
New Urban
Forestry+ UGA
Physical Plant
Compost/Native Soil NS+CP 50/50 Mix UGArden Farm+
UGA Physical Plant
Compost/Pine Bark PB+CP 50/50 Mix Jolly Gardener +
UGA Physical Plant
23
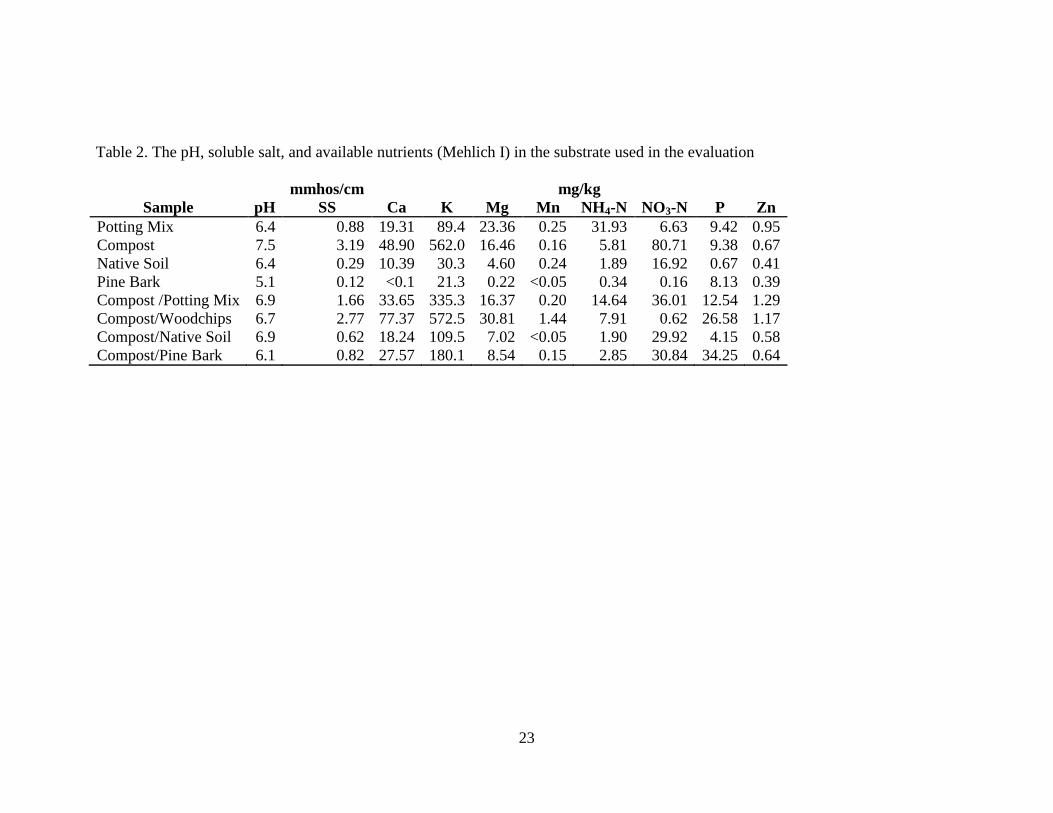
Table 2. The pH, soluble salt, and available nutrients (Mehlich I) in the substrate used in the evaluation
mmhos/cm mg/kg
Sample pH SS Ca K Mg Mn NH4-N NO3-N P Zn
Potting Mix 6.4 0.88 19.31 89.4 23.36 0.25 31.93 6.63 9.42 0.95
Compost 7.5 3.19 48.90 562.0 16.46 0.16 5.81 80.71 9.38 0.67
Native Soil 6.4 0.29 10.39 30.3 4.60 0.24 1.89 16.92 0.67 0.41
Pine Bark 5.1 0.12 <0.1 21.3 0.22 <0.05 0.34 0.16 8.13 0.39
Compost /Potting Mix 6.9 1.66 33.65 335.3 16.37 0.20 14.64 36.01 12.54 1.29
Compost/Woodchips 6.7 2.77 77.37 572.5 30.81 1.44 7.91 0.62 26.58 1.17
Compost/Native Soil 6.9 0.62 18.24 109.5 7.02 <0.05 1.90 29.92 4.15 0.58
Compost/Pine Bark 6.1 0.82 27.57 180.1 8.54 0.15 2.85 30.84 34.25 0.64
24
Figure 1. Research area used for the substrate evaluation of constructed raised beds with 24 beds in a complete randomized design.
25
Table 3. Mean kale yields and standard error from crop one of the substrate evaluations in
constructed raised beds. Means that do not share a letter are significantly different
p=0.05
Treatment Mean
SE
Mean Grouping
Potting Mix 3.3 0.13 a
Compost 2.9 0.19 a
Native Soil 1.9 0.09
b
Pine Bark Fines 0.3 0.02
c
Compost/Potting Mix 3.0 0.21 a
Compost/Woodchips 0.2 0.03
d
Compost/Native Soil 2.8 0.16 a
Compost/Pine Bark Fines 1.9 0.15 b
26
Compo
st/Pine Ba
rk Fines
Compo
st/ Na
tive So
il
Compo
st/W
ood Ch
ips
Compo
st/P
ottin
g Mix
Pine
Bar
k Fine
s
Nativ
e So
il
Compo
st
Potting
Mix
70
65
60
55
50
45
40
SP
AD
re
ad
ing
Interval Plot SPAD Crop One Kale 4-24-2013
Compo
st/Pine Ba
rk Fines
Compo
st/ Na
tive So
il
Compo
st/W
ood Ch
ips
Compo
st/P
ottin
g Mix
Pine
Bar
k Fine
s
Nativ
e So
il
Compo
st
Potting
Mix
75
70
65
60
55
50
45
SP
AD
re
ad
ing
Interval Plot SPAD Crop One Kale 5-8-2013
Compo
st/Pine Ba
rk Fines
Compo
st/N
ative
Soil
Compo
st/W
ood Ch
ips
Compo
st/P
ottin
g Mix
Pine
Bar
k Fine
s
Nativ
e So
il
Compo
st
Potting
Mix
75
70
65
60
55
50
45
SP
AD
re
ad
ing
Interval Plot SPAD Crop One Kale 5-22-2013
Figure 2. Mean chlorophyll content index with standard error bars one standard error
from the mean by date.
27
Table 4. Crop two mean basil yields and standard error from crop two of the substrate
evaluations in constructed raised beds. Means that do not share a letter are significantly
different p=0.05
Treatment
Mean
kg
SE
Grouping
Potting Mix 1.5 0.09
d
Compost 3.7 0.16 a
Native Soil 2.1 0.16
c
Pine Bark Fines 1.0 0.07
e
Compost/Potting Mix 3.1 0.05
b
Compost/Woodchips 1.6 0.00
d
Compost/Native Soil 3.2 0.12
b
Compost/Pine Bark Fines 2.8 0.11 b
Compo
st/Pine Ba
rk Fines
Compo
st/ Na
tive So
il
Compo
st/W
ood Ch
ips
Compo
st/P
ottin
g Mix
Pine
Bar
k Fine
s
Nativ
e So
il
Compo
st
Potting
Mix
19
18
17
16
15
14
13
12
11
10
CC
M r
ea
din
g
Interval Plot CCM Crop Two Basil 6-26-2013
Compo
st/Pine Ba
rk Fines
Compo
st/ Na
tive So
il
Compo
st/W
ood Ch
ips
Compo
st/P
ottin
g Mix
Pine
Bar
k Fine
s
Nativ
e So
il
Compo
st
Potting
Mix
15
14
13
12
11
10
9
CC
M r
ea
din
g
Interval Plot CCM Crop Two Basil 7-10-2013
28
Compo
st/Pine Ba
rk Fines
Compo
st/ Na
tive So
il
Compo
st/W
ood Ch
ips
Compo
st/P
ottin
g Mix
Pine
Bar
k Fine
s
Nativ
e So
il
Compo
st
Potting
Mix
17
16
15
14
13
12
11
10
9
CC
M r
ea
din
g
Interval Plot CCM Crop Two Basil 7-28-2013
Compo
st/Pine Ba
rk Fines
Compo
st/ Na
tive So
il
Compo
st/W
ood Ch
ips
Compo
st/P
ottin
g Mix
Pine
Bar
k Fine
s
Nativ
e So
il
Compo
st
Potting
Mix
14
13
12
11
10
9
8
CC
M r
ea
din
g
Interval Plot CCM Crop Two Basil 8-21-2013
Figure 3. Mean chlorophyll content index with standard error bars one standard error
from the mean by date.
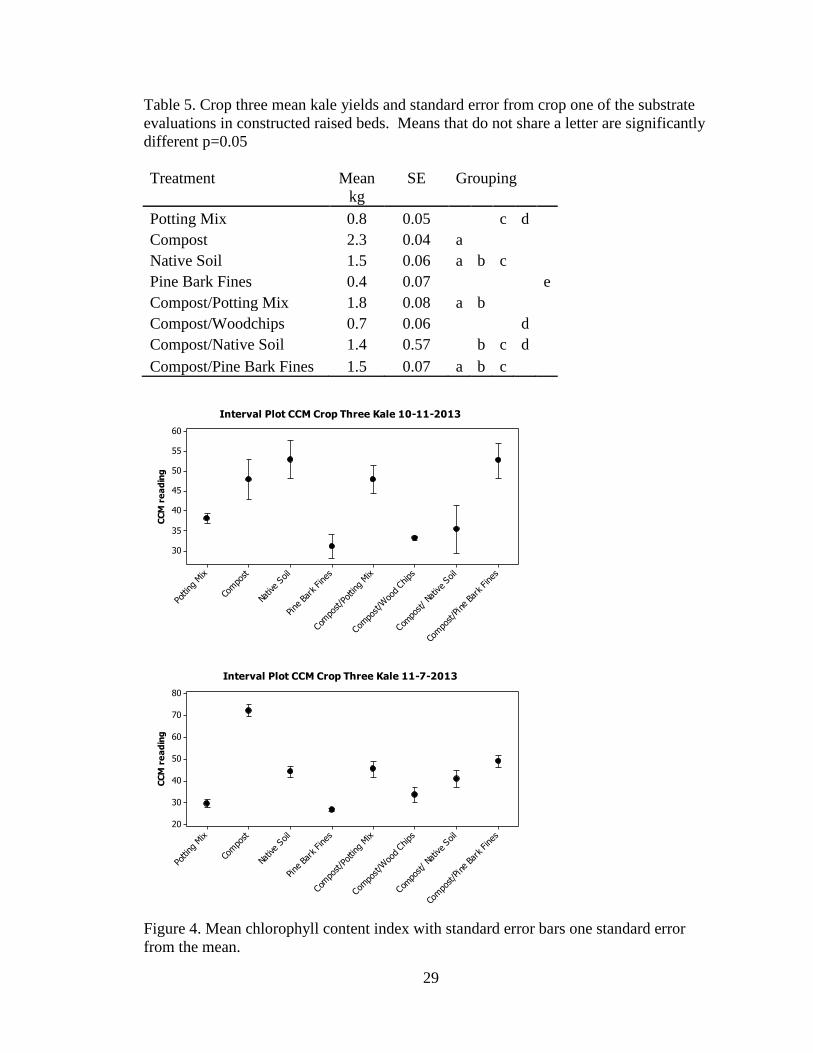
29
Table 5. Crop three mean kale yields and standard error from crop one of the substrate
evaluations in constructed raised beds. Means that do not share a letter are significantly
different p=0.05
Treatment
Mean
kg
SE
Grouping
Potting Mix 0.8 0.05
c d
Compost 2.3 0.04 a
Native Soil 1.5 0.06 a b c
Pine Bark Fines 0.4 0.07
e
Compost/Potting Mix 1.8 0.08 a b
Compost/Woodchips 0.7 0.06
d
Compost/Native Soil 1.4 0.57
b c d
Compost/Pine Bark Fines 1.5 0.07 a b c
Compo
st/Pine Ba
rk Fines
Compo
st/ Na
tive So
il
Compo
st/W
ood Ch
ips
Compo
st/P
ottin
g Mix
Pine
Bar
k Fine
s
Nativ
e So
il
Compo
st
Potting
Mix
60
55
50
45
40
35
30
CC
M r
ea
din
g
Interval Plot CCM Crop Three Kale 10-11-2013
Compo
st/Pine Ba
rk Fines
Compo
st/ Na
tive So
il
Compo
st/W
ood Ch
ips
Compo
st/P
ottin
g Mix
Pine
Bar
k Fine
s
Nativ
e So
il
Compo
st
Potting
Mix
80
70
60
50
40
30
20
CC
M r
ea
din
g
Interval Plot CCM Crop Three Kale 11-7-2013
Figure 4. Mean chlorophyll content index with standard error bars one standard error
from the mean.
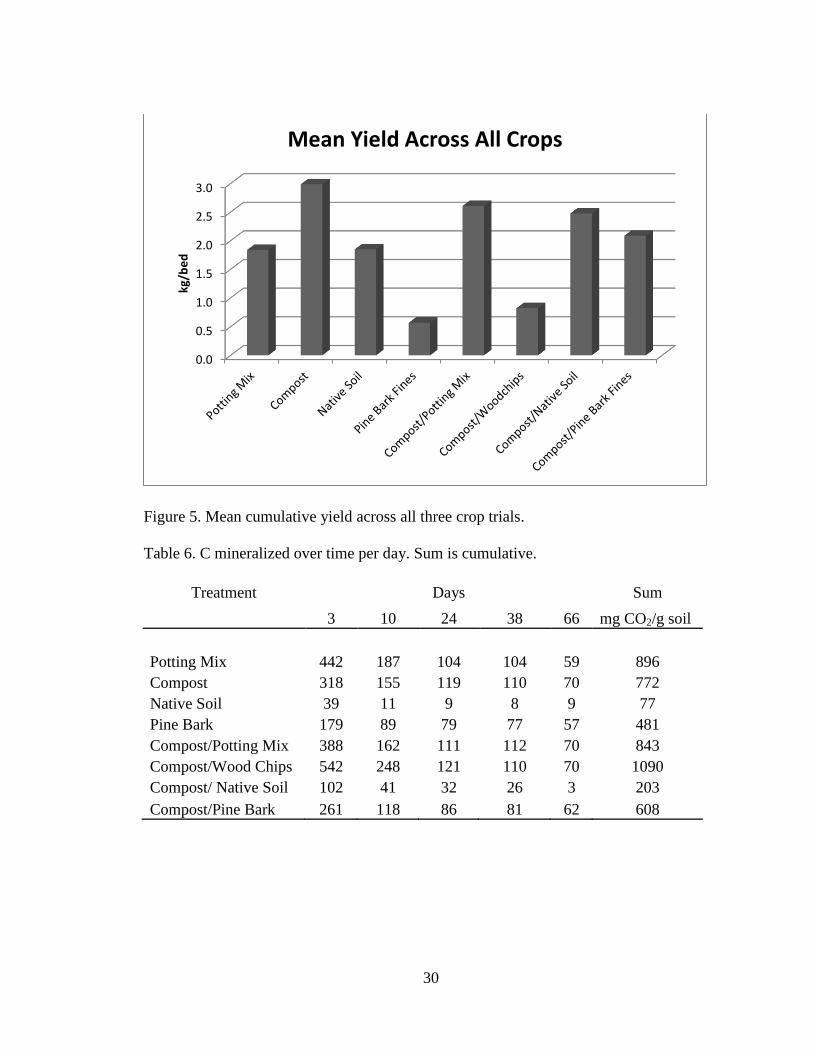
30
Figure 5. Mean cumulative yield across all three crop trials.
Table 6. C mineralized over time per day. Sum is cumulative.
Treatment Days Sum
3 10 24 38 66 mg CO2/g soil
Potting Mix 442 187 104 104 59 896
Compost 318 155 119 110 70 772
Native Soil 39 11 9 8 9 77
Pine Bark 179 89 79 77 57 481
Compost/Potting Mix 388 162 111 112 70 843
Compost/Wood Chips 542 248 121 110 70 1090
Compost/ Native Soil 102 41 32 26 3 203
Compost/Pine Bark 261 118 86 81 62 608
0.0
0.5
1.0
1.5
2.0
2.5
3.0kg
/be
d
Mean Yield Across All Crops
31
Table 7. Mean cumulative C mineralized and standard error. Means that do not share a
letter are significantly different p=0.05
Treatment Mean SE Grouping mg C/kg soil
Potting Mix 7326 68.90
b
Compost 7202 79.70
b
Native Soil 701 30.00
f
Pine Bark Fines 4931 68.90
d
Compost/Potting Mix 7374 33.60
b
Compost/Wood Chips 8539 37.10 a
Compost/ Native Soil 1487 488.00
e
Compost/Pine Bark Fines 5679 53.40 c
Table 8. Mean soil microbial biomass carbon and standard error. Means that do not share
a letter are significantly different p=0.05
Treatment Mean SE Grouping
mg C/kg soil
Potting Mix 181 0.06
b
Compost 130 0.01
d
Native Soil 16 0.01
h
Pine Bark Fines 73 0.00
f
Compost/Potting Mix 159 0.03
c
Compost/Wood Chips 222 0.01 a
Compost/ Native Soil 42 0.06
g
Compost/Pine Bark Fines 107 0.03 e
32
3210
8000
6000
4000
2000
0
Total Yield Mean (kg)
C m
in (m
g C
per
kg
-1 s
ub
str
ate
)A - Potting Mix
B - Compost
C - Native Soil
D - Pine Bark
E - Compost/Potting Mix
F - Compost/Wood Chips
G - Compost/ Native Soil
H - Compost/Pine Bark
Treatments
Total C min/Total Yield Crop One Kale
Figure 6: Integration of c-min and yield to see ideal substrate in lower right quadrant
where high yield and low c-min meet at compost/native soil.
33
Figure 7. Constructed raised bed design with substrates and kale crop
Figure 8. Planting kale transplants at 30.5 x 30.5 cm spacing.
34
Figure 9. Re-tilling beds for next crop.
Figure 10. Incubation experiment, respiration of re-wetted substrates.
35
Figure 11. Barium chloride (BaCl₂) was added to the sodium hydroxide (NaOH) to form
barium carbonate (BaCO3) precipitate, the absorbed CO2.
Figure 12. Using the CCM to take a chlorophyll measurement from crop three kale.
36
CHAPTER 3
ADDITIONAL DATA AND ANALYSIS
During the course of this research there were other important data taken to
support the outcome and eventual recommendation of the ideal substrate but were
secondary to yield and C-mineralization. Other measurements included: 1.) settling of the
substrates; 2.) electrical conductivity (EC) and; 3.) root weight with photos to show
visual differences.
Substrate Settling
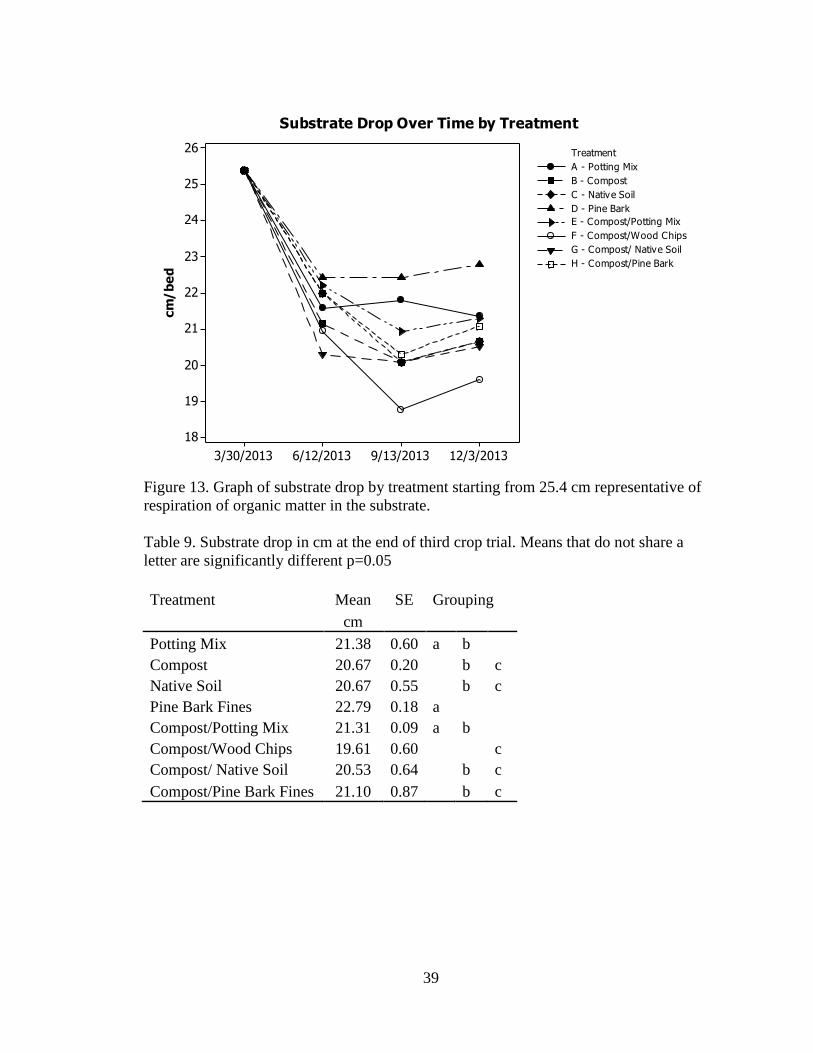
After each crop trial the substrates were measured for the substrate settling by
measuring from the top of the leveled soil at the top of the bed at the start of this
experiment. The substrates were screed level at the beginning of this experiment. After
the third crop trial the measurement was measured from the top of the bed to the inside
level of substrate. The beds all started out at 2 .4 cm in depth. After running Fisher’s
protected LSD on the data the substrate that settled the least after three crop trials was
pine bark which remained at a depth of 22.8 cm and the substrate that dropped the most
was compost/wood chips which ended at a depth of 19.6 cm (Fig 13). Pine bark is the
natural protective outer layer of a tree and thus resists breakdown while the wood chips
come from the inside of the tree and do not resist breakdown like pine bark. This is
consistent with our C-mineralization results as we showed that the compost/wood chip
37
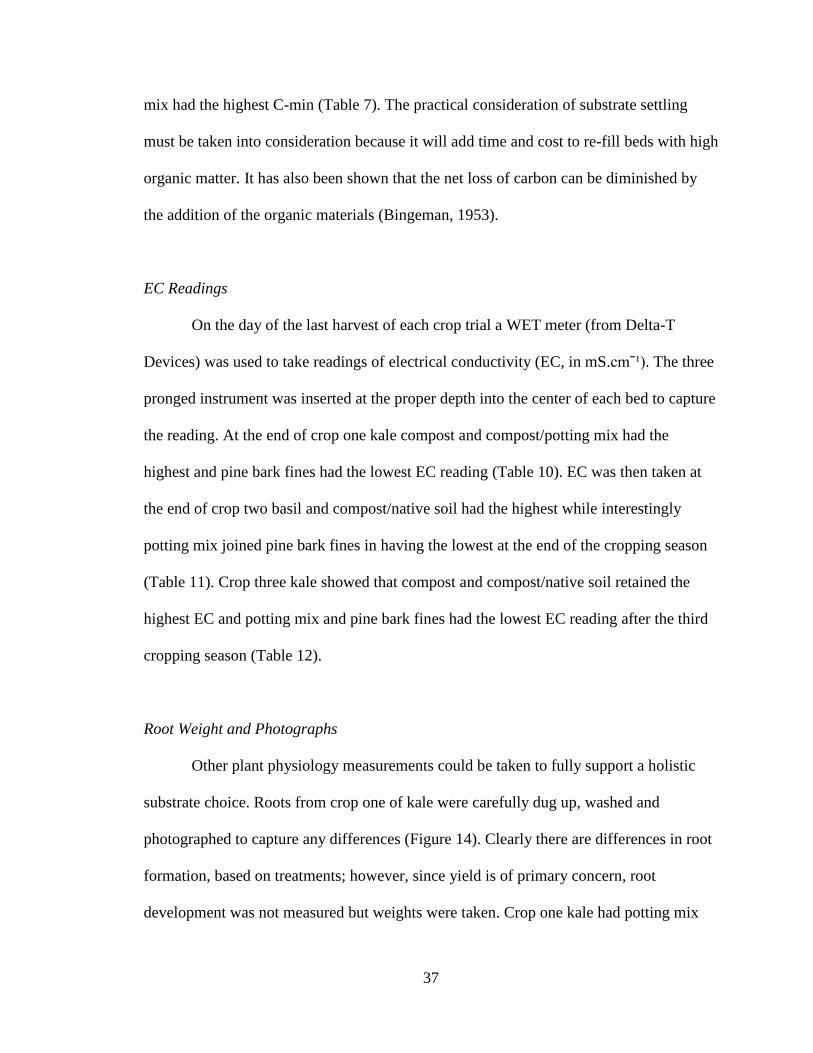
mix had the highest C-min (Table 7). The practical consideration of substrate settling
must be taken into consideration because it will add time and cost to re-fill beds with high
organic matter. It has also been shown that the net loss of carbon can be diminished by
the addition of the organic materials (Bingeman, 1953).
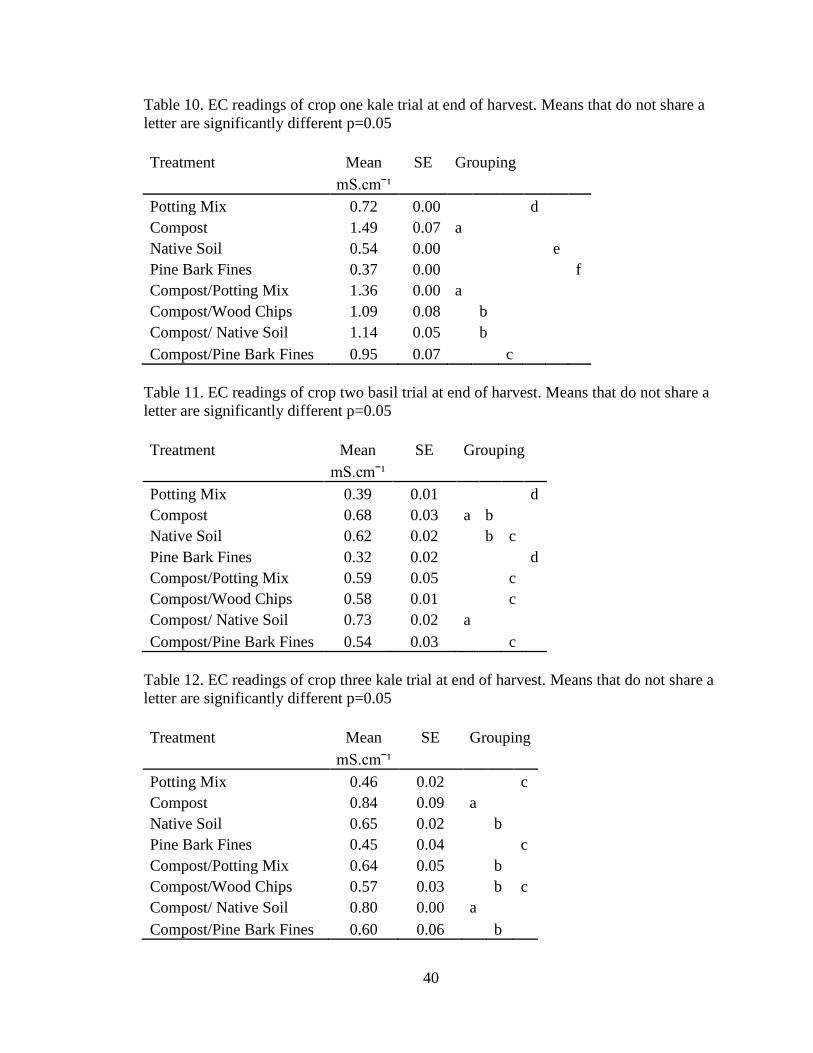
EC Readings
On the day of the last harvest of each crop trial a WET meter (from Delta-T
Devices) was used to take readings of electrical conductivity (EC, in mS.cmˉ¹). The three
pronged instrument was inserted at the proper depth into the center of each bed to capture
the reading. At the end of crop one kale compost and compost/potting mix had the
highest and pine bark fines had the lowest EC reading (Table 10). EC was then taken at
the end of crop two basil and compost/native soil had the highest while interestingly
potting mix joined pine bark fines in having the lowest at the end of the cropping season
(Table 11). Crop three kale showed that compost and compost/native soil retained the
highest EC and potting mix and pine bark fines had the lowest EC reading after the third
cropping season (Table 12).
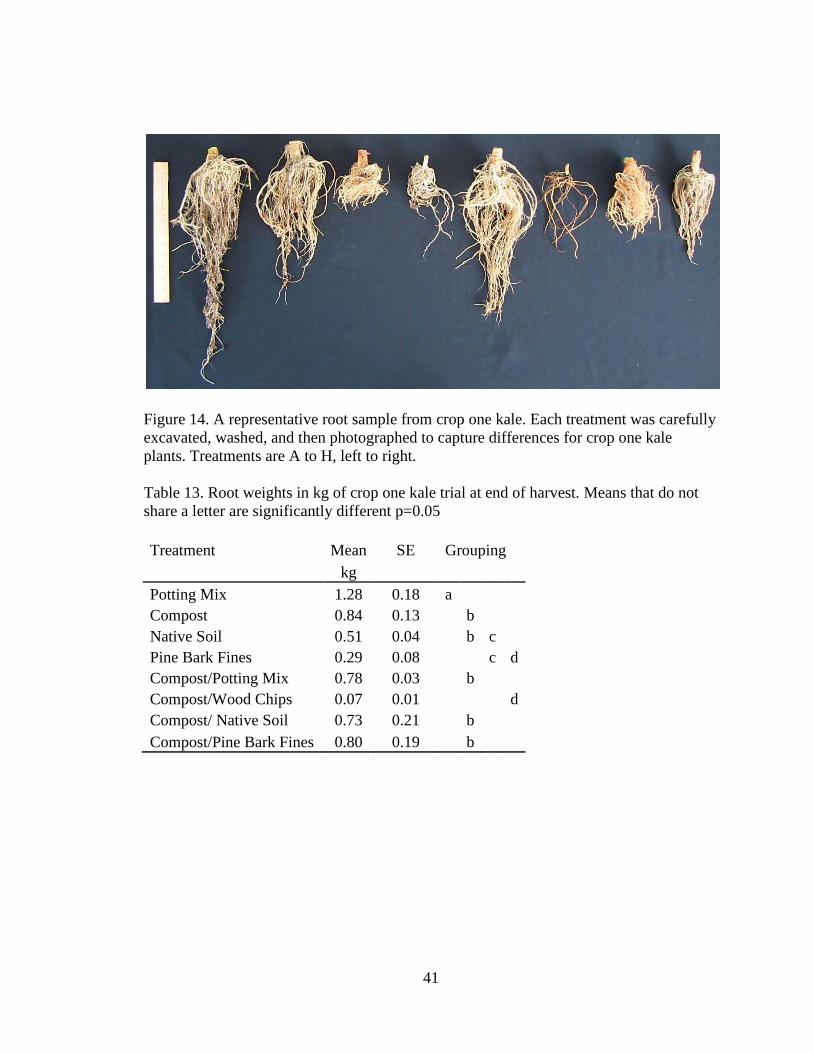
Root Weight and Photographs
Other plant physiology measurements could be taken to fully support a holistic
substrate choice. Roots from crop one of kale were carefully dug up, washed and
photographed to capture any differences (Figure 14). Clearly there are differences in root
formation, based on treatments; however, since yield is of primary concern, root
development was not measured but weights were taken. Crop one kale had potting mix
38
with the most weight in roots and compost/wood chips had the least weight in roots
(Table 13). This trend in roots is the same as the yield mean results with potting mix
having the highest yields and compost/wood chips having the lowest yield (Table 3).
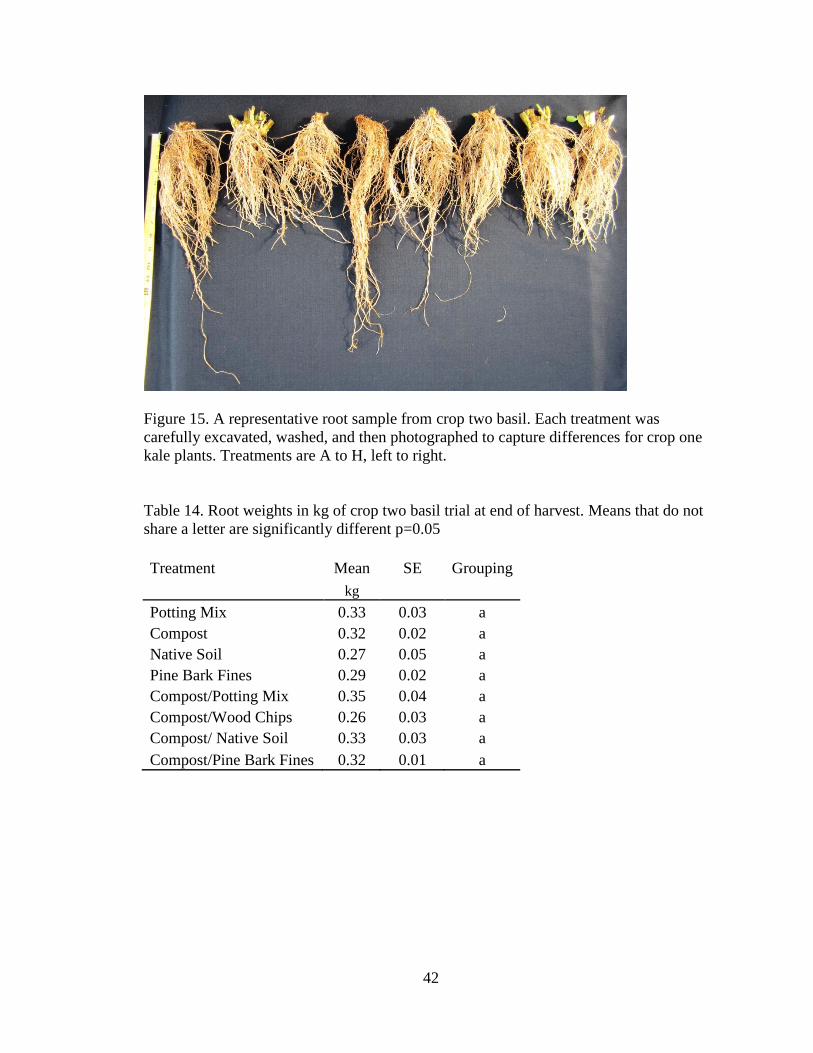
When the roots were photographed for crop two basil there was less evidence of
differences and after running the statistics on the root weights we could see that there are
in fact no statistical differences between treatments as far as root weight (Fig. 15 and
Table 14). This could be because basil is not an ideal indicator crop because it so
adaptable to different environments. There were no photographs or root weights taken for
crop three kale.
There may be something to the way the roots form that would be worth exploring
in future studies, particularly with crops with a longer growth cycle, like tomatoes. It
would be expected that those plants with well-developed root systems would fare better
in drought conditions. It also is crop dependent which we saw in the basil’s ability to
adapt and grow equal root masses despite the different substrates.
39
12/3/20139/13/20136/12/20133/30/2013
26
25
24
23
22
21
20
19
18
cm
/b
ed
A - Potting Mix
B - Compost
C - Native Soil
D - Pine Bark
E - Compost/Potting Mix
F - Compost/Wood Chips
G - Compost/ Native Soil
H - Compost/Pine Bark
Treatment
Substrate Drop Over Time by Treatment
Figure 13. Graph of substrate drop by treatment starting from 25.4 cm representative of
respiration of organic matter in the substrate.
Table 9. Substrate drop in cm at the end of third crop trial. Means that do not share a
letter are significantly different p=0.05
Treatment Mean SE Grouping
cm
Potting Mix 21.38 0.60 a b
Compost 20.67 0.20
b c
Native Soil 20.67 0.55
b c
Pine Bark Fines 22.79 0.18 a
Compost/Potting Mix 21.31 0.09 a b
Compost/Wood Chips 19.61 0.60
c
Compost/ Native Soil 20.53 0.64
b c
Compost/Pine Bark Fines 21.10 0.87 b c
40
Table 10. EC readings of crop one kale trial at end of harvest. Means that do not share a
letter are significantly different p=0.05
Treatment Mean SE Grouping
mS.cmˉ¹
Potting Mix 0.72 0.00
d
Compost 1.49 0.07 a
Native Soil 0.54 0.00
e
Pine Bark Fines 0.37 0.00
f
Compost/Potting Mix 1.36 0.00 a
Compost/Wood Chips 1.09 0.08
b
Compost/ Native Soil 1.14 0.05
b
Compost/Pine Bark Fines 0.95 0.07 c
Table 11. EC readings of crop two basil trial at end of harvest. Means that do not share a
letter are significantly different p=0.05
Treatment Mean SE Grouping
mS.cmˉ¹
Potting Mix 0.39 0.01
d
Compost 0.68 0.03 a b
Native Soil 0.62 0.02
b c
Pine Bark Fines 0.32 0.02
d
Compost/Potting Mix 0.59 0.05
c
Compost/Wood Chips 0.58 0.01
c
Compost/ Native Soil 0.73 0.02 a
Compost/Pine Bark Fines 0.54 0.03 c
Table 12. EC readings of crop three kale trial at end of harvest. Means that do not share a
letter are significantly different p=0.05
Treatment Mean SE Grouping
mS.cmˉ¹
Potting Mix 0.46 0.02
c
Compost 0.84 0.09 a
Native Soil 0.65 0.02
b
Pine Bark Fines 0.45 0.04
c
Compost/Potting Mix 0.64 0.05
b
Compost/Wood Chips 0.57 0.03
b c
Compost/ Native Soil 0.80 0.00 a
Compost/Pine Bark Fines 0.60 0.06 b
41
Figure 14. A representative root sample from crop one kale. Each treatment was carefully
excavated, washed, and then photographed to capture differences for crop one kale
plants. Treatments are A to H, left to right.
Table 13. Root weights in kg of crop one kale trial at end of harvest. Means that do not
share a letter are significantly different p=0.05
Treatment Mean SE Grouping
kg
Potting Mix 1.28 0.18 a
Compost 0.84 0.13
b
Native Soil 0.51 0.04
b c
Pine Bark Fines 0.29 0.08
c d
Compost/Potting Mix 0.78 0.03
b
Compost/Wood Chips 0.07 0.01
d
Compost/ Native Soil 0.73 0.21
b
Compost/Pine Bark Fines 0.80 0.19 b
42
Figure 15. A representative root sample from crop two basil. Each treatment was
carefully excavated, washed, and then photographed to capture differences for crop one
kale plants. Treatments are A to H, left to right.
Table 14. Root weights in kg of crop two basil trial at end of harvest. Means that do not
share a letter are significantly different p=0.05
Treatment Mean SE Grouping
kg
Potting Mix 0.33 0.03 a
Compost 0.32 0.02 a
Native Soil 0.27 0.05 a
Pine Bark Fines 0.29 0.02 a
Compost/Potting Mix 0.35 0.04 a
Compost/Wood Chips 0.26 0.03 a
Compost/ Native Soil 0.33 0.03 a
Compost/Pine Bark Fines 0.32 0.01 a
43
CHAPTER 4
DISCUSSION AND CONCLUSIONS
Consideration of soil substrates for constructed raised beds (CRB) leads to
different conclusions each based on evaluation factors. Plant growth and yield are
practical measures of success of substrate selected, but equally important are
considerations of CO2 footprint over time as the substrate respires and oxidizes.
Oxidation of substrate may, at first, seem beyond the realm of small gardens, however, it
possess the very real problem of substrate settling and requires re-filling of constructed
raised beds, costing both time and money.
Peat based potting mixes (PM) are a common choice because of availability at
garden centers. Though the PM had a high yield in the first crop trial of this study, over
the last two cropping trials, yield decreased to second from last in the basil crop trial, just
above pine bark fines (PB) (Table 4) and in the third crop trial with kale the yield was
third to last just above compost/woodchips and PB (Table 5). In addition, PM was the
second highest in C-min and SMBC (Tables 7 and 8), suggesting a greater CO2 footprint
and greater settling over time. Depending on availability and cost of the other substrates
compared in this study, PM would likely be the most expensive.
Compost (CP) was a high yielder over all three cropping trials, however beds
filled with 100% CP had high C-mineralization (Table 7) and ‘shrunk’ the most of all
44
substrates evaluated. The plants grown in CP had high chlorophyll content measurements
across all three crop trials (Figs. 2, 3, and 4). Compost is a highly variable product that
changes depending on raw material inputs, decomposition method and time. Using large
quantities of CP can be costly, depending on source and availability. From an
environmental perspective, CP as a substrate can perform as well as peat moss, while
avoiding concerns of peat bog harvesting and sustainability (Raviv, 2002).
Native Soil (NS) alone was a moderate yielder in crop one and two, and a top
yielder in crop three. In crop one, the best performing group for yield (group one)
consisted of PM, CP/PM. CP, and CP/NS (Table 3). In crop two basil, NS was the only
substrate in the third statistical group which was lower than CP, CP/NS, CP/PM, and
CP/PB (Table 4). In crop three, kale, NS was a top yielder, statistically the same as CP,
CP/PM, and CP/PB (Table 5). NS had the lowest C-min (Table 7) as well as the lowest
SMBC (Table 8) However, when mixed 50/50 with CP, it was a top yielder in the crop
trial one (Table 3) and had the second highest yield in crop trials two and three (Table 4
and Table 5). Plants in the CP/NS beds had high chlorophyll content across all three
crops (Figs. 2, 3, and 4). NS had moderate C-min and SMBC rates (Table 7 and Table 8)
suggesting a lower environmental impact. It is worth noting that topsoil is relatively
scarce in some regions and digging up large volumes of soil is laborious and there are
potential negative consequences on the soil environment (Baiyeri and Mbah 2006).
Source and cost are important consideration with NS as with other substrates considered
in this study.
Pine bark (PB) is a common component for container mixes in the southeast. This
study demonstrated that growing in 100% PB resulted in low yield across all three crop
45
trials (Tables 3, 4, and 5) and moderate-low in C-min. The plants grown in PB appeared
malnourished or stunted, suggesting N immobilization. The lower initial pH of 5.1 of PB
required the addition of lime and may have been a contributing factor in the first crop
trial. Low yield of PB could also be a result of the slow break down of organic matter
because tree bark developed as a protective layer to desiccation and phytopathogenic
organisms and this layer is very resistant to microbial decomposition (Raviv, 2002). The
lack of microbial activity could also affect the nutrient cycling for crops grown in PB.
The nursery industry successfully uses PB through managed fertilization. PB in CRB’s
could be possible if the plants nutritional needs are met.
Adding CP to any of the pure substrates greatly improved the yield and
chlorophyll content readings but again there could be an opportunity to trial different
rates of CP to fine tune this researches recommendation.
Future Work
While this research showed that the ideal substrate is one that is a compost/native
soil mix the rates used in this experiment were 50% compost and 50% native soil. More
work is needed to determine the ideal ratio of CP/NS, as it might be possible to further
reduce C-min while maintaining yield. This study also demonstrated its possible to grow
in 100% CP, though typically a grower would use a blend of CP and either PM or native
soil (NS), more often, amounts are in the range of 10% to 20% (Chong 2005).
Future research could expand the sustainability component by measuring leachate.
It is imperative to look into water use and leachate of each of the substrates because
Nitrogen (N) fertilizers comprise almost 60% of the global reactive N load attributable to
46
human activities; especially in China (UNEP 2007). Concerns about the environmental
impact of intensive agricultural systems require an improvement in production
technologies to maximize resource-use efficiencies, and to minimize the environmental
impact (Spiertz 2010). There already exists information for N fertilizers making it a
logical comparison gathering this information from these substrates.
Additionally, alternative sites, such as placing CRBs on bare ground and different
irrigation methods could be tested. There are also other substrates to consider such as
mushroom compost or vermicompost. Further considerations to fine tune this research
would include different fertilizers and amounts. An investigation into the true cost of
filling the CRBs with the different substrates would also help in choosing the ideal
substrate. Details about the water holding capacity could lead us to a substrate mix that
efficiently absorbs and holds water for plant uptake making the recommended substrate
choice for CRB’s even more environmentally considerate. Water conservation in addition
to CO2 can play a potentially critical role as resources become limited or costly.
47
REFERENCES
Baiyeri, K. and B. Mbah (2006). "Effects of soilless and soil-based nursery media on
seedling emergence, growth and response to water stress of African breadfruit (Treculia
africana Decne)." African Journal of Biotechnology 5(15).
Chong, C. (2005). "Experiences with Wastes and Composts in Nursery Substrates."
HortTechnology 15(4): 739-747.
Spiertz, J. (2010). "Nitrogen, sustainable agriculture and food security. A review."
Agronomy for Sustainable Development 30(1): 43-55.
UNEP (2007). Reactive nitrogen in the environment: too much or too little of a good
thing. Paris, France, USA and UNEP DTIE Sustainable Consumption and Production
Branch.