Embed Size (px)
Citation preview

Evaluation of Structural Dome Formwork
Systems in Concrete Pavement
Applications
by
Aleks Kristjan Kivi
A thesis
presented to the University of Waterloo
in fulfillment of the
thesis requirement for the degree of
Master of Applied Science
in
Civil Engineering
Waterloo, Ontario, Canada, 2013
©Aleks Kristjan Kivi 2013

ii
Author's Declaration
I hereby declare that I am the sole author of this thesis. This is a true copy of the thesis, including any
required final revisions, as accepted by my examiners.
I understand that my thesis may be made electronically available to the public.
iii
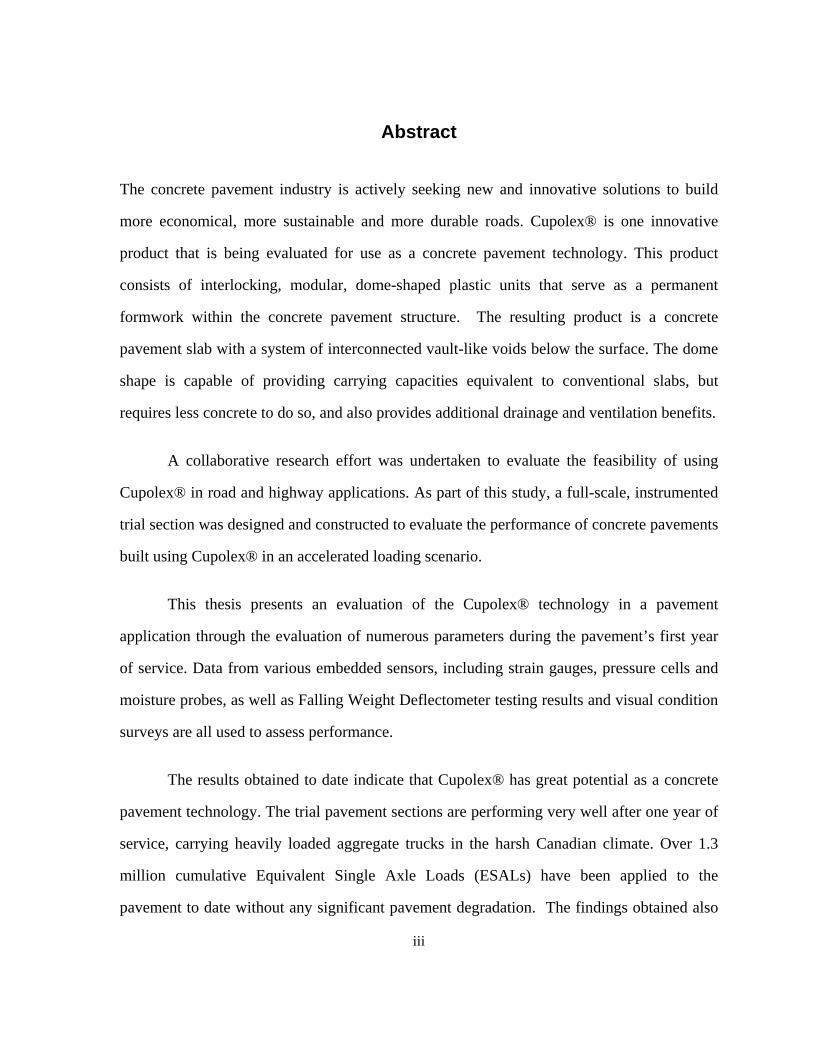
Abstract
The concrete pavement industry is actively seeking new and innovative solutions to build
more economical, more sustainable and more durable roads. Cupolex® is one innovative
product that is being evaluated for use as a concrete pavement technology. This product
consists of interlocking, modular, dome-shaped plastic units that serve as a permanent
formwork within the concrete pavement structure. The resulting product is a concrete
pavement slab with a system of interconnected vault-like voids below the surface. The dome
shape is capable of providing carrying capacities equivalent to conventional slabs, but
requires less concrete to do so, and also provides additional drainage and ventilation benefits.
A collaborative research effort was undertaken to evaluate the feasibility of using
Cupolex® in road and highway applications. As part of this study, a full-scale, instrumented
trial section was designed and constructed to evaluate the performance of concrete pavements
built using Cupolex® in an accelerated loading scenario.
This thesis presents an evaluation of the Cupolex® technology in a pavement
application through the evaluation of numerous parameters during the pavement’s first year
of service. Data from various embedded sensors, including strain gauges, pressure cells and
moisture probes, as well as Falling Weight Deflectometer testing results and visual condition
surveys are all used to assess performance.
The results obtained to date indicate that Cupolex® has great potential as a concrete
pavement technology. The trial pavement sections are performing very well after one year of
service, carrying heavily loaded aggregate trucks in the harsh Canadian climate. Over 1.3
million cumulative Equivalent Single Axle Loads (ESALs) have been applied to the
pavement to date without any significant pavement degradation. The findings obtained also

iv
indicate that the Cupolex® technology can provide significant material and potential cost
savings, when compared to conventional jointed plain concrete pavements.

v
Acknowledgements
I wish to express my sincere gratitude to my supervisor, Dr. Susan Tighe. Your
support, guidance, and encouragement during the past two years have been greatly
appreciated.
I would also like to thank the members of the Cupolex® pavement trial project team
from Holcim (Canada) Inc., Dufferin Construction Company, Pontarolo Engineering Inc. and
Applied Research Associates, Inc. for the opportunity to work on this unique and exciting
innovative research study.
I am thankful to my parents, Ester and Rob, who have always provided me with
support and encouragement throughout my studies.
I am particularly grateful to David Hein at Applied Research Associates, Inc. for his
support and helpful advice throughout the duration of this study.
I would also like to express my sincere appreciation to David and the current and
former staff of Applied Research Associates, Inc. in Toronto for giving me the opportunity to
discover my passion.
The efforts of Walter Lupton and Shila Khanal at Applied Research Associates, Inc.
are also acknowledged. Thank you for your assistance with Falling Weight Deflectometer
data collection and processing, as well as traffic data analysis.
Finally, I would like to thank my colleagues in the CPATT research group for your
support and collaboration over the past two years.

vi
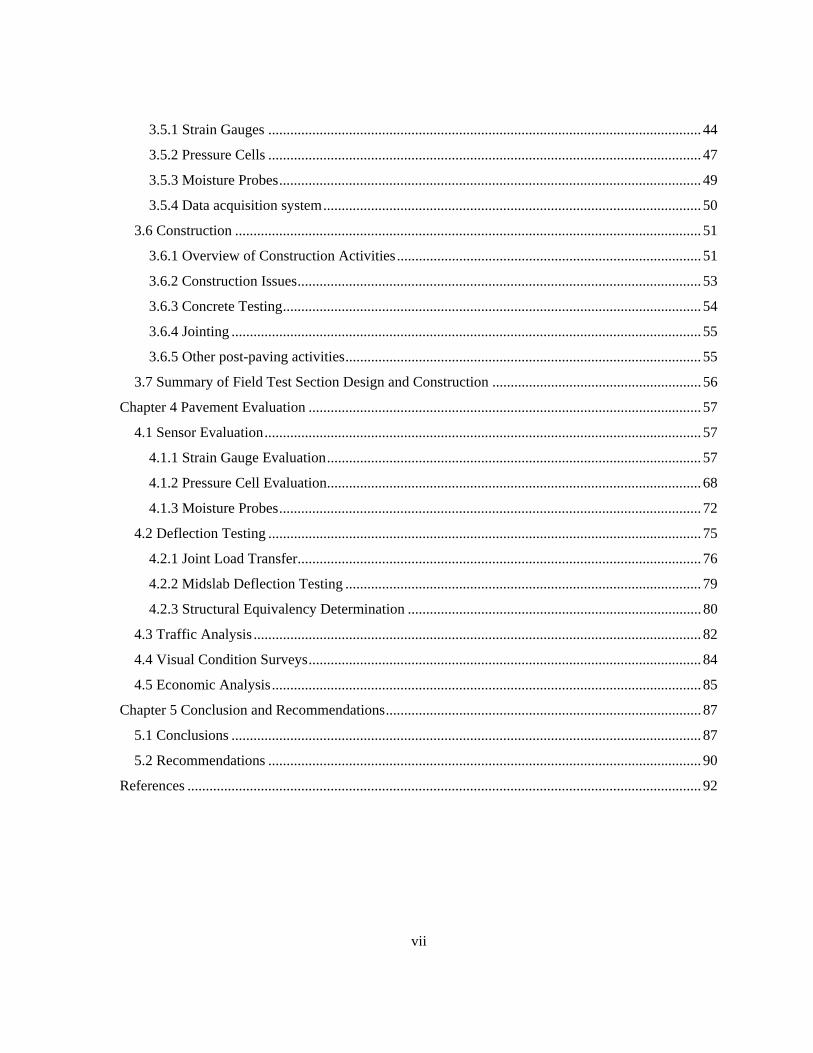
Table of Contents
Author's Declaration .............................................................................................................................. ii
Abstract ................................................................................................................................................. iii
Acknowledgements................................................................................................................................ v
Table of Contents.................................................................................................................................. vi
List of Figures ..................................................................................................................................... viii
List of Tables ......................................................................................................................................... x
Chapter 1 Introduction ........................................................................................................................... 1
1.1 General Statement ........................................................................................................................ 1
1.2 Cupolex®..................................................................................................................................... 3
1.3 Research Objectives and Scope ................................................................................................... 5
1.4 Scope and Methodology............................................................................................................... 6
1.5 Thesis Outline .............................................................................................................................. 8
Chapter 2 Literature Review.................................................................................................................. 9
2.1 Overview of concrete pavements ................................................................................................. 9
2.1.1 Sustainable concrete pavements.......................................................................................... 12
2.2 Concrete pavement design and construction state-of-the-practice............................................. 15
2.2.1 Concrete pavement mechanics............................................................................................ 15
2.2.2 Design considerations for concrete pavements ................................................................... 17
2.2.3 Concrete pavement design methodologies.......................................................................... 18
2.3 Evaluation of new pavement technologies................................................................................. 22
2.3.1 Pavement instrumentation................................................................................................... 23
2.3.2 Accelerated load testing of pavements................................................................................ 28
2.4 Overview of aerated slab systems.............................................................................................. 30
2.4.1 Mechanics of arches and domes.......................................................................................... 31
2.4.2 Summary of Previous Use of Structural Dome Formwork System in Concrete Pavements32
Chapter 3 Trial Design and Construction ............................................................................................ 34
3.1 Introduction................................................................................................................................ 34
3.2 Concrete Pavement Design ........................................................................................................ 36
3.3 Joint Design ............................................................................................................................... 40
3.4 Concrete Mix Design ................................................................................................................. 41
3.5 Instrumentation Selection, Layout and Installation ................................................................... 42
vii
3.5.1 Strain Gauges ...................................................................................................................... 44
3.5.2 Pressure Cells ...................................................................................................................... 47
3.5.3 Moisture Probes................................................................................................................... 49
3.5.4 Data acquisition system....................................................................................................... 50
3.6 Construction ............................................................................................................................... 51
3.6.1 Overview of Construction Activities................................................................................... 51
3.6.2 Construction Issues.............................................................................................................. 53
3.6.3 Concrete Testing.................................................................................................................. 54
3.6.4 Jointing ................................................................................................................................ 55
3.6.5 Other post-paving activities................................................................................................. 55
3.7 Summary of Field Test Section Design and Construction ......................................................... 56
Chapter 4 Pavement Evaluation ........................................................................................................... 57
4.1 Sensor Evaluation....................................................................................................................... 57
4.1.1 Strain Gauge Evaluation...................................................................................................... 57
4.1.2 Pressure Cell Evaluation...................................................................................................... 68
4.1.3 Moisture Probes................................................................................................................... 72
4.2 Deflection Testing ...................................................................................................................... 75
4.2.1 Joint Load Transfer.............................................................................................................. 76
4.2.2 Midslab Deflection Testing ................................................................................................. 79
4.2.3 Structural Equivalency Determination ................................................................................ 80
4.3 Traffic Analysis .......................................................................................................................... 82
4.4 Visual Condition Surveys........................................................................................................... 84
4.5 Economic Analysis..................................................................................................................... 85
Chapter 5 Conclusion and Recommendations...................................................................................... 87
5.1 Conclusions ................................................................................................................................ 87
5.2 Recommendations ...................................................................................................................... 90
References ............................................................................................................................................ 92
viii
List of Figures
Figure 1-1: Example of Cupolex® formwork........................................................................................ 3
Figure 1-2: Research framework............................................................................................................ 7
Figure 2-1: Jointed plain concrete pavement (JPCP)........................................................................... 10
Figure 2-2: Jointed reinforced concrete pavement (JRCP) .................................................................. 11
Figure 2-3: Continuously reinforced concrete pavement (CRCP)....................................................... 11
Figure 3-1: Location of the Dufferin Aggregates Milton Quarry (Milton, Ontario)............................ 35
Figure 3-2: Location of the Cupolex® trial at the Milton Quarry ....................................................... 35
Figure 3-3: View of excavated test pit showing shale subgrade material ............................................ 36
Figure 3-4: Pavement designs for Cupolex® trial ............................................................................... 38
Figure 3-5: Schematic of Cupolex® units used ................................................................................... 38
Figure 3-6: BetonStop®, companion end cap for Cupolex® units...................................................... 39
Figure 3-7: Installed BetonStop® products, doubled up to prevent punchout..................................... 39
Figure 3-8: Plan view of pavement instrumentation layout ................................................................. 43
Figure 3-9: Schematic of strain gauge placement on Cupolex® unit .................................................. 45
Figure 3-10: Arrangement of strain gauges on Cupolex® unit............................................................ 46
Figure 3-11: General arrangement of pressure cells in right wheelpath (Plan View).......................... 48
Figure 3-12: Typical Arrangement of Pressure Cells (Profile View) .................................................. 48
Figure 3-13: Moisture Probe Installation (Profile View)..................................................................... 49
Figure 3-14: Weatherproof enclosure with data acquisition system, located on berm ........................ 50
Figure 3-15: Construction photos ........................................................................................................ 52
Figure 3-16: Separation of Cupolex® units from incorrect installation .............................................. 53
Figure 4-1: Daily cycles in strain and temperature in July 2012 (three months after construction) .... 59
Figure 4-2: Measured concrete strain at strain gauge 08 (inbound lane, right wheelpath, longitudinal
orientation, 150 mm of concrete) from May 2012 to April 2013. ....................................................... 60
Figure 4-3: Measured concrete temperatures at strain gauge 08 (inbound lane, right wheelpath,
longitudinal orientation, 150 mm of concrete) from May 2012 to April 2013. ................................... 60
Figure 4-4: Measured strain ranges in all 16 strain gauges................................................................. 62
Figure 4-5: Strain-temperature relations in 150 mm of concrete section (SG01-SG08)...................... 66
Figure 4-6: Strain-temperature relations in 175 mm of concrete section (SG09-SG16)...................... 67
Figure 4-7: Pressure Cell Behaviour during first year of service – May 2012 to April 2013.............. 69
ix
Figure 4-8: Static pressure cell testing results ...................................................................................... 71
Figure 4-9: Granular Moisture Content and Rain Events..................................................................... 73
Figure 4-10: Comparison of Granular Moisture Content and Base Pressure Readings ....................... 74
Figure 4-10: Falling Weight Deflectometer testing in progress ........................................................... 75
Figure 4-11: Load Transfer Efficiency Results – June 2013................................................................ 78
Figure 4-12: Midslab deflections – June 2013 ..................................................................................... 80
Figure 4-13: Comparison of midslab deflections between Cupolex® and conventional concrete
pavements............................................................................................................................................. 81
Figure 4-14: Milton trial cumulative ESAL progression...................................................................... 83
Figure 4-16: Surface distress examples 1 ............................................................................................ 84
Figure 4-17: Surface distress examples 2 ............................................................................................ 85
x
List of Tables
Table 2-1: List of commonly used sensor in pavement structures....................................................... 23
Table 3-1: Design vehicle characteristics ............................................................................................ 37
Table 3-2: Concrete Mix Design.......................................................................................................... 41
Table 3-3: Selected Instrumentation Types ......................................................................................... 44
Table 3-4: Strain gauge locations......................................................................................................... 45
Table 3-5: Pressure cell locations ........................................................................................................ 47
Table 3-6: Moisture probe locations .................................................................................................... 50
Table 3-7: Concrete Compressive Strength Testing Results................................................................ 54
Table 3-8: Concrete Flexural Strength Testing Results ....................................................................... 54
Table 4-1: Strain-Temperature Regression Analysis Results .............................................................. 67
Table 4-2: Geophone Sensor Configuration (mm)............................................................................... 76
Table 4-3: Transverse Joint Location Descriptions ............................................................................. 77

1
Chapter 1
Introduction
1.1 General Statement
Modern, safe and effective transportation systems are a necessity for the economic and social
well-being of all Canadians. One essential component is a well-functioning road and
highway network. Roads and highways play an integral role in enabling economic
productivity and competitiveness by providing the mobility needed to access employment
and recreation and to transport goods between different markets. Ninety percent of goods in
Canada are transported by truck (TAC 2012). Nationally, Canada has over one million
equivalent two-lane kilometres of roadway, 40% of which is paved (Transport Canada 2011).
This major asset has an approximate value of 120 to 160 billion dollars, highlighting the
significance of this investment (Transport Canada 2004).
High quality pavements are a key component of any effective road or highway
system. Portland cement concrete is one material that is widely used to pave highways, roads,
airports, parking lots and other similar types of infrastructure. These pavements typically
provide years of service with little or no maintenance needs when properly designed and
constructed (Delatte 2008).
The concrete pavement industry is currently facing many challenges, including
pressure to design and build longer lasting, more durable pavements with fewer financial
resources, while incorporating more marginal materials, reducing environmental impacts and
minimizing construction impacts on the travelling public (FHWA 2012). This seemingly
impossible goal is attainable through innovative solutions that have been thoroughly
researched and evaluated.
2
Consequently, much effort is currently underway to innovate and modernize concrete
pavement designs and construction methods. In short, current concrete pavement design
methodologies and construction techniques can be transformed to meet the various
competing needs of modern transportation networks, including heavier traffic loads and
climate change. Consequently, the concrete pavement industry and researchers are exploring
more economical and more environmentally friendly pavement materials and placement
techniques in an effort to make concrete pavements more efficient by lasting longer at a
lower overall cost over their lifecycle.
Innovation is a key component to developing the next generation of transportation
solutions for our roads and highways. Proposed changes to designs, materials and
construction processes can provide many benefits to highway agencies and road users,
including reduced costs, simplified construction and extended service lives.
Despite the advent and usage of mechanized equipment, as well as new materials and
techniques in the concrete paving sector, such as the slipform paver, materials recycling,
precast/prestressed concrete panels and quieter surface textures, the basic pavement structure
has not changed dramatically since the first concrete pavements were constructed over one
hundred years ago.
However, Cupolex®, a structural dome formwork system, is an innovative product
that challenges the status quo in the concrete pavement industry. As with any new and
innovative concept, new technologies in the pavement industry must be thoroughly
investigated to evaluate feasibility. The evaluation must ensure that comparable performance
to conventional technologies can be obtained and must assess the costs and benefits. As part
3
of this research, a collaborative research study was undertaken to evaluate the feasibility of
using Cupolex® in road and highway applications.
1.2 Cupolex®
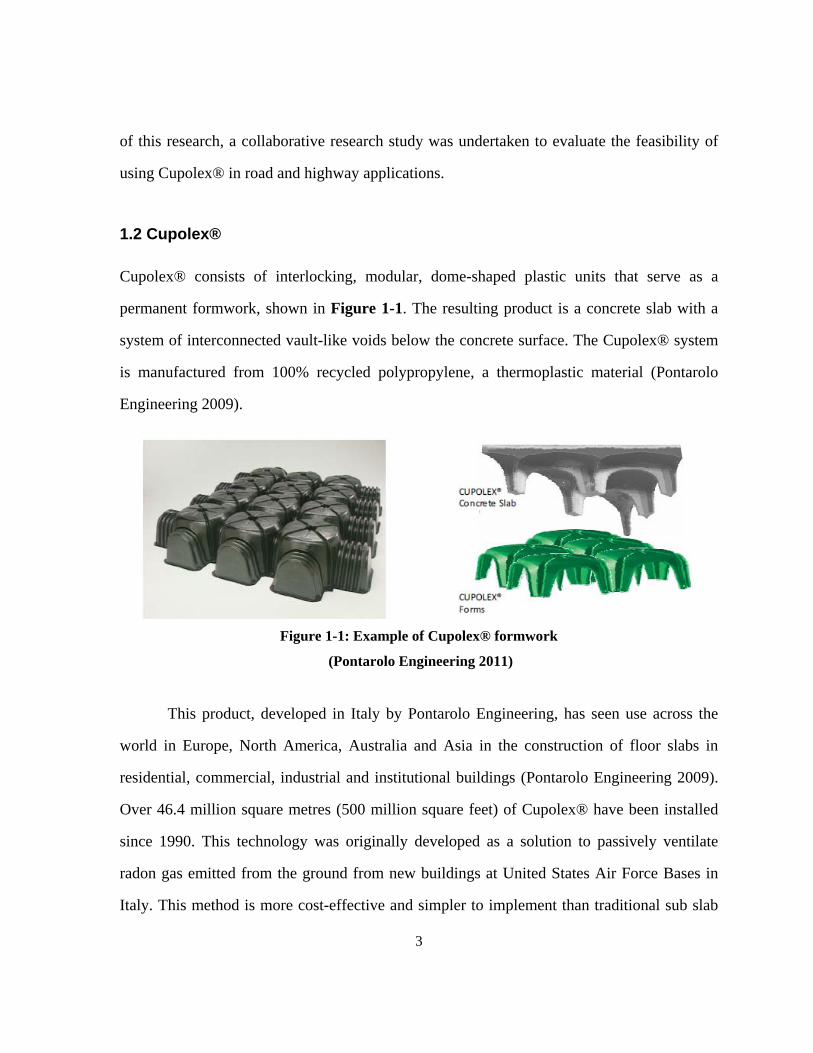
Cupolex® consists of interlocking, modular, dome-shaped plastic units that serve as a
permanent formwork, shown in Figure 1-1. The resulting product is a concrete slab with a
system of interconnected vault-like voids below the concrete surface. The Cupolex® system
is manufactured from 100% recycled polypropylene, a thermoplastic material (Pontarolo
Engineering 2009).
Figure 1-1: Example of Cupolex® formwork
(Pontarolo Engineering 2011)
This product, developed in Italy by Pontarolo Engineering, has seen use across the
world in Europe, North America, Australia and Asia in the construction of floor slabs in
residential, commercial, industrial and institutional buildings (Pontarolo Engineering 2009).
Over 46.4 million square metres (500 million square feet) of Cupolex® have been installed
since 1990. This technology was originally developed as a solution to passively ventilate
radon gas emitted from the ground from new buildings at United States Air Force Bases in
Italy. This method is more cost-effective and simpler to implement than traditional sub slab
4
depressurization, which involves actively venting the gas with fans through a gravel layer
(Pontarolo Engineering 2009).
The Cupolex® system provides some potential benefits. The dome shape is capable of
providing carrying capacities equivalent to conventional slabs, but requires less concrete
(Pontarolo Engineering 2009). The underslab void reduces the slab’s contact with the base
layers. Water cannot leach up through the bottom of the concrete slab, providing protection
from moisture and humidity. The plastic layer does not allow moisture to enter into the
concrete slab, eliminating any concerns with mould and mildew growth or damage to
floorings when used in building applications. The underslab void also allows for the quick,
easy and cost-effective installation and repair of buried utilities, such as cables and pipes,
after construction. The Cupolex® system has inherent properties associated with the dome
shape which reduce slab curling, when compared to conventional concrete slabs. The use of
Cupolex® can also reduce the need for granular base materials or engineered fill. This
product can also be incorporated into creative stormwater management solutions, using the
underslab void as a reservoir.
Although it has been used in the construction of floor slabs in residential, commercial,
industrial and institutional buildings as noted above, this product had not been previously
utilized in concrete pavement applications. Pavements are subject to different conditions than
most floor slabs, including frequent and heavy dynamic loads and exposure to a wide range
of harsh environmental conditions. Furthermore, it is not clear what kind of structural
contribution the Cupolex® system contributes to the concrete pavement structure and how
much concrete consumption savings can be achieved. Additionally, the performance
characteristics of a Cupolex® pavement over time are still unknown. Lastly, whether
Cupolex® pavements can be constructed effective with traditional slipform paving
5
equipment needs to be determined. The future maintenance and rehabilitation needs of
Cupolex® pavements are also unknown. The applicability of conventional pavement
maintenance and rehabilitation strategies to Cupolex® pavements must also be investigated.
The concrete industry is investing significant resources into reducing the
environmental impact of its product. The production of cement and concrete require large
amounts of raw materials and energy, making the cement and concrete industry a major
producer of greenhouse gases. However, Cupolex® also has the potential to reduce this
impact by reducing the amount of concrete required, while continuing to produce equally
durable infrastructure. It should also be noted the Cupolex® system is made out of recycled
polypropylene. The use of recycled materials keeps valuable resources out of landfills.
Polypropylene, a durable thermoplastic material, can be easily re-used with minimal
environmental impact (Pontarolo Engineering 2009). This results in both environmental and
economic benefits. However, its technical performance in pavement applications must first
be thoroughly evaluated prior to full scale implementation in the concrete pavement industry.
1.3 Research Objectives and Scope
A collaborative research effort was undertaken by Holcim (Canada) Inc, Dufferin
Construction Company, Pontarolo Engineering Inc., Applied Research Associates, Inc. and
the Centre for Pavement and Transportation Technology (CPATT) at the University of
Waterloo to evaluate the feasibility of using Cupolex® in road and highway applications as a
concrete pavement technology.
This research project involved a number of objectives:
6
Construct a full-scale trial, instrumented pavement section using the Cupolex®
system in an accelerated loading scenario.
Evaluate the constructability of the Cupolex® system in concrete pavements.
Evaluate the mechanical responses of the pavement structure under heavy truck
traffic and environmental loading using embedded instrumentation.
Evaluate the performance of the trial pavement using non-destructive testing and
visual evaluation methods.
Validate the experimental designs and offer design recommendations for future
designs.
1.4 Scope and Methodology
For the purpose of assessing the performance of the Cupolex® system in pavement
applications, a full-scale, instrumented test section was designed and constructed. The trial
pavement was subjected to an accelerated loading scenario. This site of the experimental
pavement almost exclusively carries high volumes of heavily loaded trucks. The accelerated
loading allows for a much quicker evaluation of the structural carrying capacity of Cupolex®
pavements. The magnitudes and frequencies of the traffic loadings are easily quantified at
this location, due to the fact that traffic data with vehicle/axle weights is readily available
from the quarry’s scales.
To evaluate the performance of the pavement, the test section was designed and
equipped with a variety of sensors to monitor the pavement response to vehicular loads and
environmental effects. Pavement response data from the sensors, including concrete strain
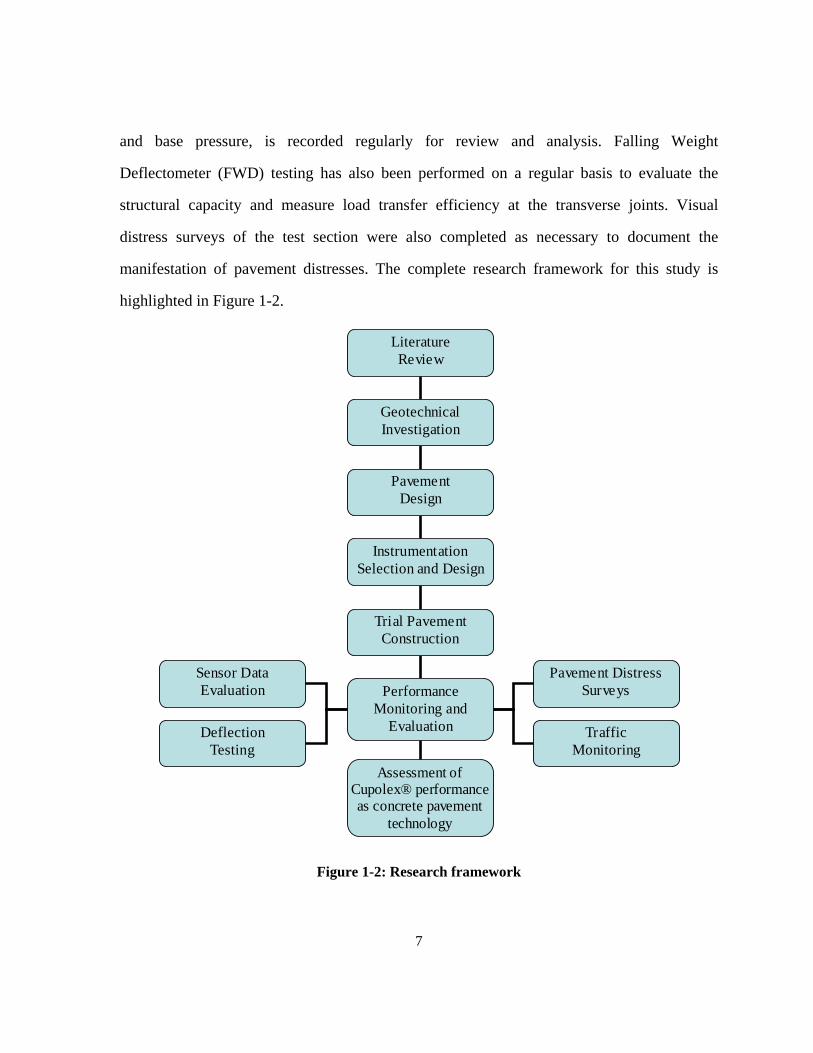
7
and base pressure, is recorded regularly for review and analysis. Falling Weight
Deflectometer (FWD) testing has also been performed on a regular basis to evaluate the
structural capacity and measure load transfer efficiency at the transverse joints. Visual
distress surveys of the test section were also completed as necessary to document the
manifestation of pavement distresses. The complete research framework for this study is
highlighted in Figure 1-2.
Literature Review
Geotechnical Investigation
Pavement Design
Instrumentation Selection and Design
Trial Pavement Construction
Performance Monitoring and
Evaluation
Assessment ofCupolex® performance as concrete pavement
technology
Sensor Data Evaluation
Deflection Testing
Pavement Distress Surveys
Traffic Monitoring
Figure 1-2: Research framework

8
The instrumented trial pavement at the accelerated loading site provides an excellent
opportunity to gain further knowledge and understanding of Cupolex® as a pavement
technology. The inclusion of instrumentation in the test section provides a basis for better
insight into the behaviour of the dome-shaped slab under heavy traffic loads in a concrete
pavement. Ongoing performance monitoring allows for the assessment of the benefits and
challenges associated with the use of Cupolex® in pavements.
1.5 Thesis Outline
This thesis consists of five chapters:
Chapter 1 details the motivation, scope and objectives of the research presented in this thesis.
Chapter 2 presents a literature review of concrete pavements, their design and construction,
as well as information about pavement instrumentation and pavement testing. Background
information about the Cupolex® system is also included.
Chapter 3 describes in detail the design, instrumentation and construction of the experimental
pavement sections built as part of this research effort.
Chapter 4 presents an analysis of the pavement performance observed to date and discusses
the significance of the results obtained.
Chapter 5 summarizes the research findings, presents the conclusions to date and provides
recommendations for future work relating to this project.
9
Chapter 2
Literature Review
2.1 Overview of concrete pavements
Portland cement concrete (PCC) is one of the two primary pavement types, the other being
asphalt concrete. Although the vast majority of the road network in the USA and Canada
consists of asphalt pavements, concrete pavements are widely used on roads and highways
that carry high volumes and heavily loaded traffic. In the United States, 56% of the Interstate
network is comprised of pavements consisting of a significant layer of concrete, i.e. rigid or
composite (FHWA 2008).
Three types of concrete pavements are generally used in highway applications:
Jointed Plain Concrete Pavements (JPCP), Jointed Reinforced Concrete Pavements (JRCP)
and Continuously Reinforced Concrete Pavements (CRCP).
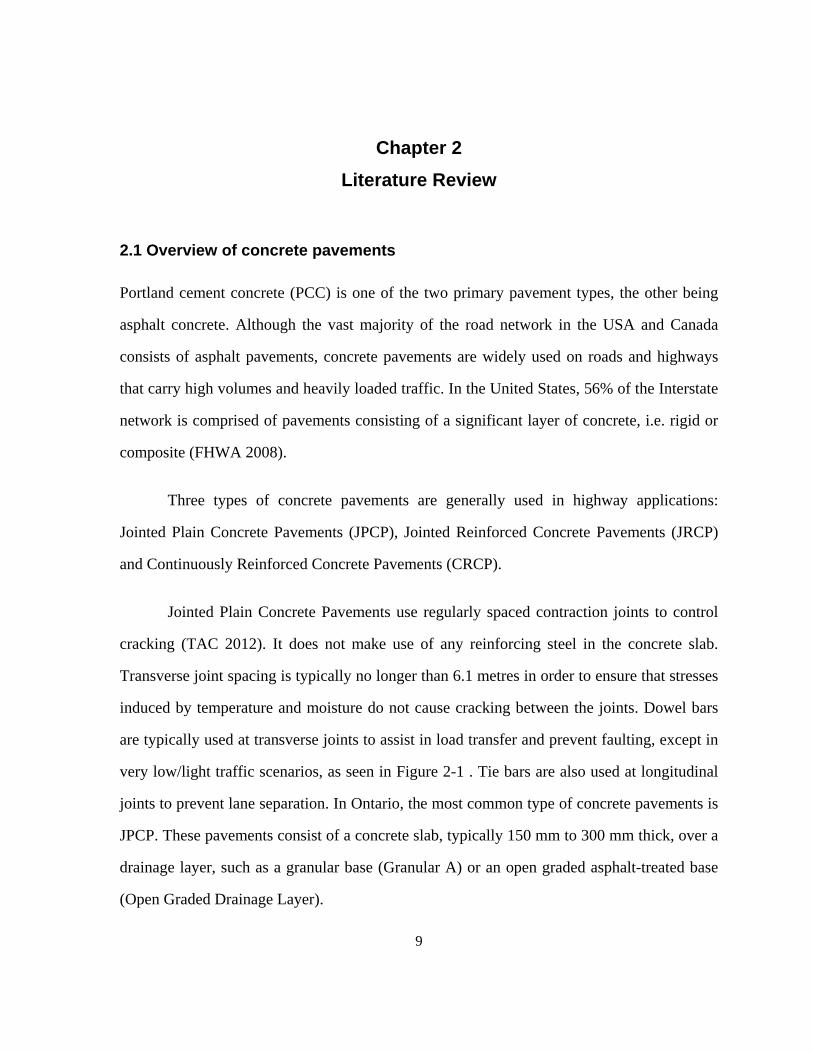
Jointed Plain Concrete Pavements use regularly spaced contraction joints to control
cracking (TAC 2012). It does not make use of any reinforcing steel in the concrete slab.
Transverse joint spacing is typically no longer than 6.1 metres in order to ensure that stresses
induced by temperature and moisture do not cause cracking between the joints. Dowel bars
are typically used at transverse joints to assist in load transfer and prevent faulting, except in
very low/light traffic scenarios, as seen in Figure 2-1 . Tie bars are also used at longitudinal
joints to prevent lane separation. In Ontario, the most common type of concrete pavements is
JPCP. These pavements consist of a concrete slab, typically 150 mm to 300 mm thick, over a
drainage layer, such as a granular base (Granular A) or an open graded asphalt-treated base
(Open Graded Drainage Layer).
10
Figure 2-1: Jointed plain concrete pavement (JPCP)
(Delatte 2008)
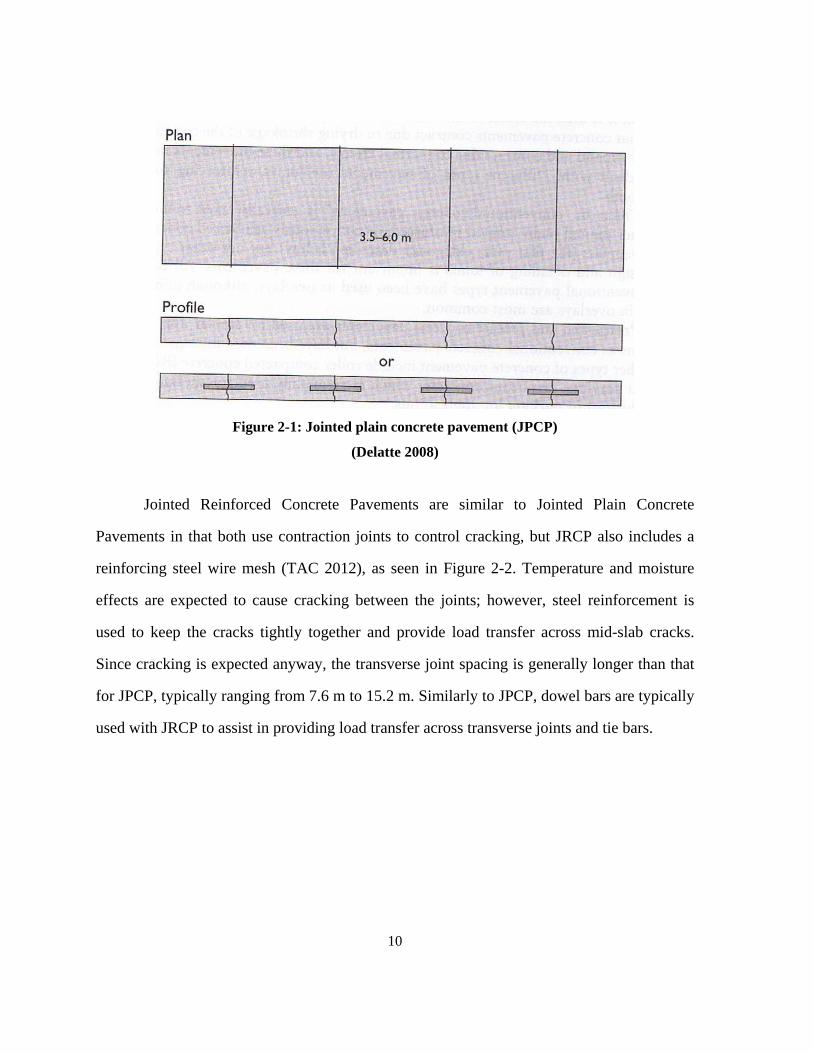
Jointed Reinforced Concrete Pavements are similar to Jointed Plain Concrete
Pavements in that both use contraction joints to control cracking, but JRCP also includes a
reinforcing steel wire mesh (TAC 2012), as seen in Figure 2-2. Temperature and moisture
effects are expected to cause cracking between the joints; however, steel reinforcement is
used to keep the cracks tightly together and provide load transfer across mid-slab cracks.
Since cracking is expected anyway, the transverse joint spacing is generally longer than that
for JPCP, typically ranging from 7.6 m to 15.2 m. Similarly to JPCP, dowel bars are typically
used with JRCP to assist in providing load transfer across transverse joints and tie bars.
11
Figure 2-2: Jointed reinforced concrete pavement (JRCP)
(Delatte 2008)
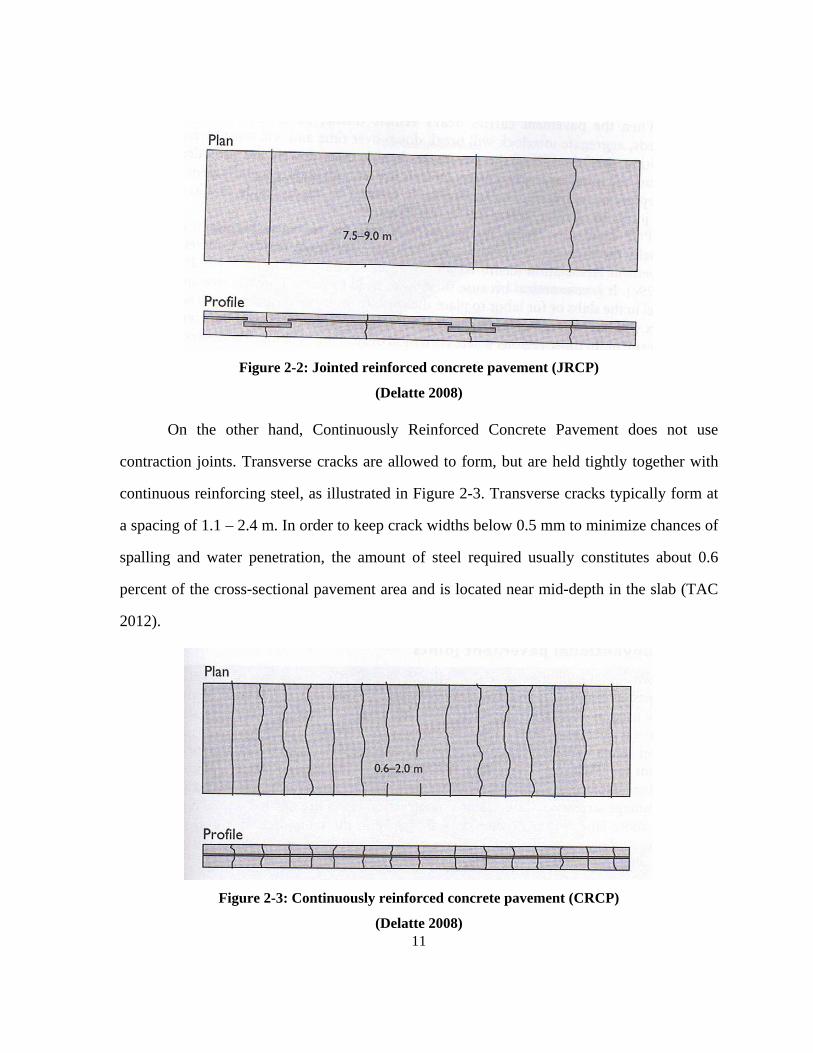
On the other hand, Continuously Reinforced Concrete Pavement does not use
contraction joints. Transverse cracks are allowed to form, but are held tightly together with
continuous reinforcing steel, as illustrated in Figure 2-3. Transverse cracks typically form at
a spacing of 1.1 – 2.4 m. In order to keep crack widths below 0.5 mm to minimize chances of
spalling and water penetration, the amount of steel required usually constitutes about 0.6
percent of the cross-sectional pavement area and is located near mid-depth in the slab (TAC
2012).
Figure 2-3: Continuously reinforced concrete pavement (CRCP)
(Delatte 2008)

12
JPCP is the most common type of concrete pavement among Canadian agencies and
U.S. state departments of transportation (TAC 2012). Although much of the Interstate
network in the Eastern and Midwestern United States was initially constructed with JRCP,
this pavement type has fallen out of favour, due to performance concerns.
Approximately 70% of US state departments of transportation build JPCP, 20% build
JRCP and 6 or 7 individual agencies build CRCP (Rajib and El-Korchi 2009).
2.1.1 Sustainable concrete pavements
Sustainability has been defined as activity or development “that meets the needs of the
present without compromising the ability of future generations to meet their own needs”
(WCED 1987). The development of sustainable solutions involves balancing three
competing factors: economic, social and environmental (Van Dam et al. 2011). Concrete
pavements already provide many sustainable benefits, including longevity, recyclability, use
of waste materials and minimal maintenance requirements (Delatte 2008). However, cement
and concrete production are major producers of greenhouse gas emissions worldwide. The
environmental impacts of cement and concrete production must be considered when
considering the lifecycle analysis of concrete pavements.
2.1.1.1 Environmental Impacts of Concrete
Concrete is one of the most commonly used civil engineering materials. Globally,
approximately 1.6 billion tonnes of cement and 10 billion tonnes of aggregates are used
annually (Mehta 2001). Concrete structures are durable and economic, but these features do
not come without a significant impact on the natural environment. Portland cement
production is an energy intensive process with notable impact on the physical environment,
including the ground, the air and water sources. Annually, the production of cement results in

13
about 7% of worldwide carbon dioxide emissions (Mehta 2001). In 1996, about 26% of all
concrete used in the United States (roughly 226 million tonnes) went to highway and road
applications (Low 2005). To put this into perspective, approximately 51,800 tonnes of
aggregate are required to construct one kilometre of six-lane expressway (APAO 2004).
Large amounts of raw materials are required, e.g. limestone, clay and fuel, such as
coal or gas. Greenhouse gas emissions from cement plants primarily come from two sources:
calcination of the limestone, the primary raw ingredient of Portland cement clinker, and
fossil fuel consumption to heat the raw materials to the temperature required to form clinker
(Tennis et al. 2011). The production of one tonne of Portland cement requires about four
gigajoules of energy and emits 1.25 tonnes of carbon dioxide into the atmosphere (Wilson
1993).
In addition to the greenhouse gas contributions of cement production, aggregate
production also has an undeniable environmental impact. The amount of high quality
aggregate available for construction use is declining rapidly. Worldwide aggregate use is
estimated to be ten to eleven billion tonnes each year. Of this, approximately eight billion
tonnes of aggregate are being used in Portland cement concrete every year (Naik 2005,
Mehta 2001). In Canada, annual aggregate consumption is estimated as approximately 350.5
million (Panagapko 2003).
The extraction of aggregates has many significant environmental impacts (Naik
2005). The development of pits or quarries requires the removal of all natural vegetation, top
soil and subsoil. This results in the destruction of habitats and therefore, a loss in
biodiversity. Aggregate extraction also disrupts surface water and groundwater flows.
14
Moreover, pit and quarry operations results in noise, dust and contaminated water, which can
be harmful to adjacent residents and wildlife.
The transportation of aggregates and cement also contributes to the negative
environmental impact of concrete. As nearby quarries are depleted, high quality aggregate
must be transported from further away, directly increasing the associated costs.
The environmental impacts of concrete can be reduced in various ways. The use of
supplementary cementing materials, such as fly ash and steel slag reduce the need for virgin
cement. Waste concrete can be reused as Recycled Concrete Aggregate in new concrete,
reducing the need for quarrying, processing and transporting virgin natural aggregates.
There are three key aspects to sustainable development in the concrete industry
(Mehta 1999). First, conserve concrete making material. This can be achieved by recycling
aggregate by crushing demolished concrete. Also, using recycled water from mixing plants
and wash water from trucks would decrease the need for fresh mixing water. Finally, using
by-products, such as fly ash, slag and silica fume, from other industries reduces the amount
of cement needed in the concrete.
Recent advances in cement production have helped reduce the impact of this industry
on the environment. Examples of these advances include energy efficiency improvements at
cement manufacturing facilities, alternative fuels, blended cements and carbon capture
systems (EPA 2010). However, much work remains to be done. Future innovations will also
assist in reducing the impact of cement and concrete.
15
2.2 Concrete pavement design and construction state-of-the-practice
2.2.1 Concrete pavement mechanics
Portland cement concrete’s high modulus of elasticity (23-35 Gigapascals) gives it
significant rigidity compared to other pavement materials (TAC 2012). Portland cement
concrete also has a reasonable degree of beam strength, derived from its flexural strength,
which typically ranges between 3.3 to 6.0 MPa in pavement mixes. These properties result in
a stiff pavement, which is capable of distributing loads over wide areas. By distributing loads
over a greater area, the pressures applied to the subgrade are minimized.
The application of wheel loads causes bending in the concrete slab, which induces
both compressive and tensile stresses (TAC 2012). The compressive stresses induced are
usually low in comparison to the high compressive strength of concrete and consequently, are
not critical in design. However, the tensile stresses produced tend to be fairly high with
respect to the fairly low flexural strength of concrete. As a result, the tensile stresses must be
minimized to ensure long life. The fatigue life of concrete structures is directly proportional
to the ratio of stress to strength (TAC 2012). By keeping the induced stresses low, the
potential for fatigue failure approaches zero, as stated in Miner’s hypothesis.
Most of a concrete pavement’s strength is derived from the PCC material itself.
Unlike asphalt pavements, the base or subbase layers in concrete pavement systems do not
provide significant load carrying capacity. These underlying layers, however, play an
important role in ensuring uniform slab support, providing good drainage, reducing erosion
of materials near joints and providing buffer space for frost heave, shrinkage and swelling of
subgrade materials (TAC 2012). This layer also serves as a platform for pavement
construction.
16
Environmental factors play a significant role in concrete pavement performance.
These factors include temperature, humidity, precipitation, and frost heave. Temperature
gradients throughout the depth of the concrete slab cause curling and warping on a daily
basis, which can be cumulatively damaging. During the day, the air temperature and solar
radiation will increase the temperature of the slab, resulting downward curling
(Papagiannakis and Masad 2008). The top of the slab will expand more than the bottom of
the slab. However, since the self-weight of the slab prevents free expansion or contraction,
this will induce compressive stresses at the top of the slab and tensile stresses at the bottom
of the slab. The opposite behaviour is observed overnight. The bottom of the pavement is
warmer than the top, resulting in upward curling. Compression is induced at the bottom of
the slab and tension at the top. Temperature gradients not only induce curling stresses, but
also affect the slab–subgrade contact. A partial loss of subgrade contact can increase the
stresses in concrete. Temperature gradients in concrete slabs can amplify fatigue damage
significantly. A gradient of 0.02°C/mm (1°F/in) increases the fatigue damage caused by truck
traffic by a factor of 10, in comparison to that of a slab with no thermal gradient (Mashad
1996, Ahmad 1998).
The moisture content of the concrete slab can also affect pavement performance.
Moisture gradients may result in differential shrinkage between the top and the bottom of the
pavement (Papagiannakis and Masad 2008). This leads to additional curling stresses, placing
the top of the pavement into tension and the bottom into compression. Again, the slab is
susceptible to additional damage from traffic loads when deformed due to moisture effects.
Similarly, the moisture content of the underlying layers affects the structural capacity
of the concrete pavement structure. Poor drainage of the base materials will diminish the
ability of the underlying layers to support the concrete slab. The presence of water in the
17
aggregate layers results in a loss of shear strength, resulting in increased deformations when
subjected to traffic loads (Rajib and El-Korchi 2009).
2.2.2 Design considerations for concrete pavements
Structural design of concrete pavements is generally based on limiting the pavement stresses,
strains and deflections to prevent damage and deterioration of the pavement beyond
acceptable levels and delaying pavement failure (REF). Stresses are influenced by a number
of factors including restrained temperature and moisture deformation external loads, volumes
changes of the supporting layers (including frost action), continuity of subgrade support
through plastic deformation and material loss from pumping action. The foremost factor
affecting concrete pavement performance is traffic loading (Hillier and Roesler 2005).
Ambient environmental conditions also have a significant influence.
Generally, the goal of pavement design is to develop the lowest-cost structure that is
capable of supporting the predicted traffic loads over the design life period while resisting
degradation from external environmental factors, such as temperature and moisture.
Pavement performance can be divided into two categories: structural performance and
functional performance (Delatte 2008). Structural performance is the expectation that the
pavement thickness to provide sufficient structural strength to sustain the traffic loads over
the performance period. Functional performance is the expectation that a pavement type will
provide an acceptable level of service to the road user over its design life. The major
component of serviceability is riding comfort or ride quality, with safety being an additional
consideration.
Concrete pavements can be analyzed fairly easily using mechanistic principles. A
concrete pavement’s slabs can be modelled in a similar fashion to concrete beams. Typical

18
models represent the slab as a concrete plate subjected to biaxial bending and supported by a
continuous elastic foundation, also known as Winkler springs or a dense liquid foundation
(Papagiannakis and Masad 2008). This permits the use of well-established moment-curvature
relationships for concrete beams to complete the thickness design for the anticipated loadings
(traffic and environmental) and check critical responses for adequacy.
The slab thickness is often considered to be the primary design output for a concrete
pavement. However, a complete concrete pavement design also includes the selection of base
materials and thickness, concrete mix design properties, joint properties (e.g. spacing, use of
dowel bars) and drainage features (Delatte 2008).
2.2.3 Concrete pavement design methodologies
Concrete pavement design is a complex procedure with multiple interacting variables. Many
factors that must be considered are difficult to quantify. Various different concrete pavement
methodologies are currently in use. These design methodologies all revolve around the
design of a flat concrete slab resting on a base layer or directly on subgrade. Empirical
methods, based on observations of pavement performance, are the simplest. However, these
methods usually do not accurately account for the influences of factors such as material
properties and drainage. Mechanistic methods use theoretical models to predict stresses and
strains, which can in turn be minimized in the design to ensure long-term performance.
2.2.3.1 American Association of State Highway and Transportation Officials (AASHTO
Guide for Design of Pavement Structures
The American Association of State Highway and Transportation Officials (AASHTO) design
procedure is based on the results of American Association of State Highway Officials
(AASHO) Road Test of the 1960s. The AASHO Road Test was an experiment, conducted in
19
Ottawa, Illinois, that consisted of around the clock loadings of various test loops for two
years. Six test loops with a variety of asphalt and concrete pavement structures were tested to
establish performance trends. This experiment was used to develop the 1972 AASHTO
Guide for Design of Pavement Structures (AASHTO 1972). Subsequent revisions were
released in 1986 and 1993 (AASHTO 1986, AASHTO 1993). The 1993 AASHTO Guide
currently remains the most common pavement design methodology in North America
(Canada and the United States) for both new construction and rehabilitation designs (TAC
2012). However, a major shift towards mechanistic-empirical pavement design is in progress.
Current pavement design needs require extrapolating the AASHO Road Test data far beyond
the measured values, which is somewhat imprudent.
Despite its prevalence, the AASHTO Pavement Design Guide has a number of
deficiencies that are associated with the limitations of the AASHTO Road Test. The
empirical data collected from the AASHO Road Test is highly dependent on the specific
conditions of the experiment, including the subgrade soil type, construction materials, unique
Illinois environmental conditions and the single traffic type (NCHRP 2004). Some basic
assumptions are applied to the empirical equations to allow for the use of the AASHTO
procedures in other locales with different materials, environmental conditions and traffic
loadings.
In 1998, AASHTO published a supplement to 1993 pavement design guide. This
supplemental guide, entitled Part II – Rigid Pavement Design & Rigid Pavement Joint
Design, provides an alternate concrete pavement design procedure to address flaws that were
resulting in premature pavement failures (AASHTO 1998). The existing AASHTO design
procedure for concrete pavement was exhibiting numerous deficiencies associated with poor
transfer, long joint spacings, subbase erosion and poor drainage. This procedure is not based

20
on the AASHO Road Test. Instead finite element structural modeling was used to develop
designs and the designs were validated using data from the FHWA’s Long-Term Pavement
Performance (LTPP) program.
2.2.3.2 Mechanistic Empirical Pavement Design Guide (MEPDG)
The state-of-the-art Mechanistic Empirical Pavement Design Guide (MEPDG) incorporates
the principles of engineering mechanics in a rational design process to improve the designs of
asphalt and concrete pavements (NCHRP 2004). In 1996, the American Association of State
Highway and Transportation Officials (AASHTO) identified the need for a new modern
pavement design methodology, based on mechanistic-empirical principles. This need led to
the start of the National Cooperative Highway Research Program’s (NCHRP) project 1-37A.
The MEPDG considers numerous factors such as climate, traffic and materials properties to
propose a trial design. Using integrated pavement response models, the trial design is
evaluated for performance by predicting roughness and distresses such as cracking and
rutting using performance models developed with data from the Long-Term Pavement
Performance database. This process is repeated iteratively until the performance meets the
established criteria.
Accurate finite element models for calculating pavement structural behaviour under
traffic and environmental loadings are at the core of mechanistic design. Stresses, strains and
deflections must be correctly determined to design long-lasting, sustainable and cost-
effective pavements. Furthermore, pavement response information is also necessary to
calculate fatigue damage and predict distress manifestation. The MEPDG is able to provide
significant improvement over existing design methods, achieving more cost-effective
pavement designs and rehabilitation strategies. However, its reliability is dependent on the
quality of the performance models and the input data.
21
The MEPDG must be calibrated for local conditions and materials to validate the
integrated distress models and ensure the desired level of reliability (Swan and Hein 2008).
This task is difficult and time consuming. Some agencies lack historical pavement
performance data, traffic data, materials characterization data and construction and
maintenance history. Furthermore, the effects of advances in pavement design and
construction may not be accurately reflected in these models. Accurate performance models
are dependent on a good understanding of pavement mechanics, which determine the
associated responses.
In addition to different levels of material inputs depending on the availability of
material properties, the MEPDG is able to simulate variations in material properties due to
climate and load (NCHRP 2004). A master climate database is used to model the variation in
the properties of the pavement and subgrade materials. These models allow engineers to
determine the impact of a change in environmental conditions on a specific material property.
For example, hot mix asphalt (HMA) is considered a visco-elastic material which is affected
by temperature change. As the temperature increases the HMA modulus decreases. Similarly,
precipitation and various environment conditions can negatively impact subgrade strength.
The MEPDG is able to model these changes based on environmental condition.
The traffic characterization method used in the MEPDG also differs significantly
from the 1993 AASHTO design procedure. Rather than using the conventional Equivalent
Single Axle Load (ESAL) technique used by previous guides to convert mixed traffic to a
single value, the MEPDG has adopted an axle load spectra method (TAC 2012). Detailed
traffic data, including truck count by class, direction and lane are required for traffic
characterization. Axle load spectra distributions are then obtained for each vehicle class from
22
known axle weight data. The traffic volumes are then forecasted by vehicle class over the
selected design period.
The complexity of the MEPDG design procedures requires the use of computer
software. The procedures of the MEPDG are distributed through the AASHTOWare
Pavement ME Design software, which can be obtained through the American Association of
State Highway and Transportation Officials. In the MEPDG, concrete pavements are
modeled using Westergaard theory using finite element analysis based on the ISLAB2000
suite developed at the University of Illinois (Delatte 2008). The outputs from this system
have been well validated. The program computes and sums the load-related and load-
independent stresses and strains at each time increment.
Most US state and Canadian provincial transportation agencies are working towards
full implementation of the MEPDG (TAC 2012). However, the MEPDG is a sophisticated
tool which requires substantial effort to implement. MEPDG implementation requires large
amounts of reliable data, technical skills and financial resources. Most agencies are using
their existing design methodologies and the MEPDG simultaneously, with the goal of
eventual transition to using the MEPDG solely.
2.3 Evaluation of new pavement technologies
The detailed evaluation of new pavement technologies is necessary to determine whether
they provide the expected levels of performance. Various tools are available to assist with
this objective. The use of embedded instrumentation and accelerated load testing are two
options that can provide valuable insight into in-situ pavement performance.

23
2.3.1 Pavement instrumentation
A good understanding of pavement responses to traffic loads and environmental effects is
necessary to predict a pavement’s future performance. Mechanistic design procedures are
being more widely adopted. These new design procedures can be significantly more reliable
than existing design methods and can be used to develop the most optimized and cost-
effective designs. However, the success of mechanistic pavement design is dependent on the
accuracy of integrated pavement response models. The models must be able to correctly
predict pavement responses to be able to reliably complete design pavements and predict
their performance. The embedment of instrumentation into newly constructed or rehabilitated
pavements can provide the data necessary for developing new pavement responses models
and also for verifying existing models.
A wide range of sensors can be installed in pavements to provide meaningful data
about pavement responses. The primary responses of interest in all pavements are loads,
strains, pressures, displacements, temperature and moisture (Al-Qadi 2010). Some of the
most common gauges used to monitor these responses are listed in Table 2-1.
Table 2-1: List of commonly used sensor in pavement structures
(Willis 2008)
Strain Gauges Pressure Cells Thermistors or Thermocouples Moisture Probes Linearly Variable Differential Transducers (LVDTs)
Traffic Sensors (traffic loops, weigh-in-motion scales)
The determination of concrete strains is important in predicting crack development.
Unreinforced concrete pavements have fairly low flexural strengths (TAC 2012). If traffic
and environmental loadings induce strains such that flexural strength, cracking will initiate

24
and propagate with repeated load applications. Strain gauges can monitor the tensile strains
and quantify the fatigue damage induced (Willis 2008). Concrete pavements are also
sensitive to thermal effects (expansion and contraction). Strain gauges can also be utilized to
measure these environmental effects (Willis 2008).
Subgrade materials are typically the most stress sensitive components of a pavement
structure. Pavements are typically designed with multiple strong layers to reduce the
pressures on the subgrade (TAC 2012). Pressure cells can be used to measure the resulting
pressures and are typically placed at the top of the subgrade materials (Willis 2008). These
gauges can also be placed at the top of the base materials to verify the loadings on the
intermediate structural layers.
Portland cement concrete is also a temperature sensitive material (TAC 2012). As
discussed earlier, thermal expansion and thermal gradients can contribute to increased
pavement damage. Thermocouples and thermistors can be used to quantify temperature
change and its contribution to the changes in other responses such as strain (Willis 2008).
Many vibrating wire strain gauges have integrated thermistors (RST Instruments 2004).
The moisture content in subgrade materials and unbound granular materials is also a
key performance factor (Willis 2008). The strength of these structural layers is sensitive to
their water content. Moisture gauge data can be placed in these layers and the resulting data
can be analyzed to understand the quality of the pavement’s drainage characteristics and the
variability in soil strength owing to moisture.
In concrete pavements, displacements such as those due to temperature gradient-
related curling and warping and those related to joint movement can have an impact on
pavement performance. Gauges such as Linearly Variable Differential Transducers (LVDTs)
25
can be employed to measure these displacements and model the contributions of changing
slab shapes and positions on pavement life (Willis 2008).
The ability to quantify the traffic loads on an instrumented test section is necessary to
quantify the impacts of traffic on pavement performance. For closed test sites with vehicles
of known weights, traffic loops must be sufficient to estimate the required values. However,
on sites with variable traffic types and weights, weigh-in-motion (WIM) scales may be more
beneficial to measure more precisely the traffic loads (Zhang et al 2008).
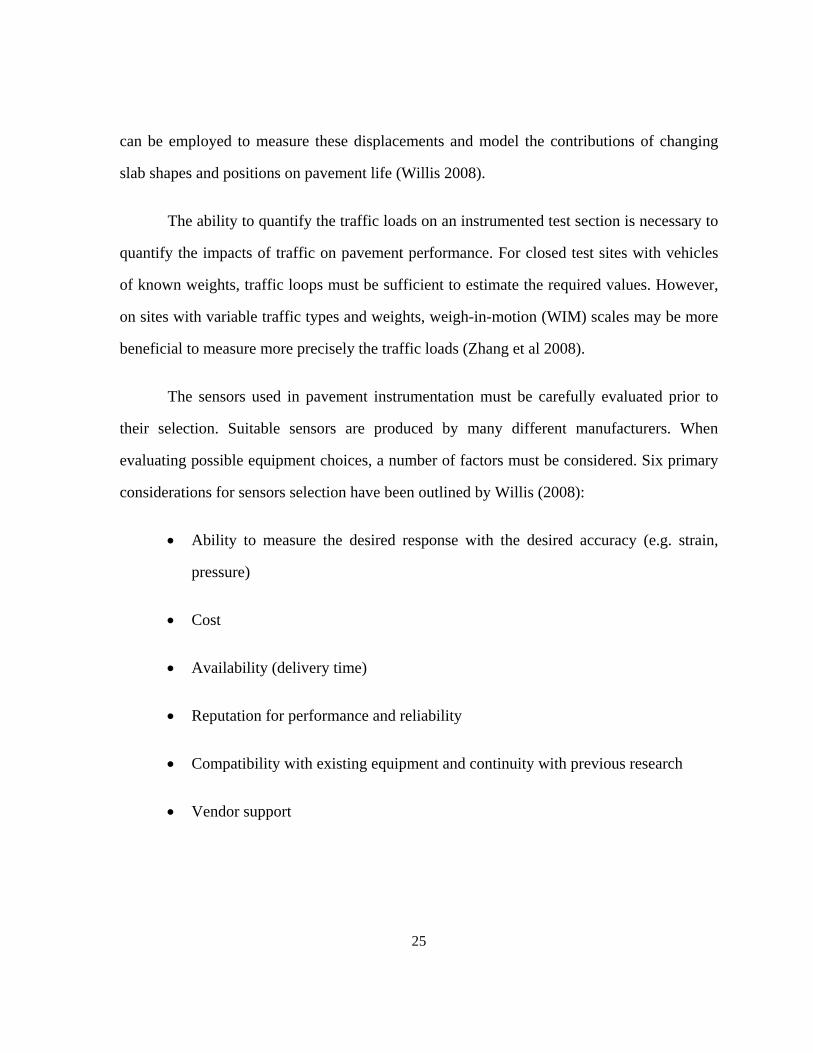
The sensors used in pavement instrumentation must be carefully evaluated prior to
their selection. Suitable sensors are produced by many different manufacturers. When
evaluating possible equipment choices, a number of factors must be considered. Six primary
considerations for sensors selection have been outlined by Willis (2008):
Ability to measure the desired response with the desired accuracy (e.g. strain,
pressure)
Cost
Availability (delivery time)
Reputation for performance and reliability
Compatibility with existing equipment and continuity with previous research
Vendor support

26
In Canada, it is also important to ensure that the selected sensors are suitable for the
harsh climatic conditions, which include both warm and cold temperatures, as well as
extensive freeze-thaw cycling.
As agencies continue to experiment with new mix designs, new materials and new
design features for a variety of reasons, including improved performance, lower costs and
sustainability, the use of instrumentation in these experimental pavements helps agencies
understand the behaviour of the pavement and provides detailed information that helps
evaluate their suitability for widespread use (Goulias et al. 2011).
For example, in order to address increasing traffic congestion, user delay costs,
reduced construction budgets and requirements to keep lanes open, the state of Minnesota is
striving to build long-life pavements (Rohne 2009). The Minnesota Department of
Transportation (MnDOT) wants to construct concrete pavements with 60 year design lives.
However, there have been no experiences with such pavements and consequently, service life
and performance estimates are based on significant extrapolation from experiences based on
current design methods. To evaluate trial design, MnDOT has built a test section in their
MnRoad test facility on the limited-access low volume test track. A large number of
electronic sensors have been integrated to monitor performance. The sensors used include
dynamic strain gauges for measuring traffic impacts, static strain gauges for measuring
environmental loads, LVDTs for measuring curling/warping displacements, moisture probes,
joint opening sensors, maturity gauges and temperature sensors.
Numerous challenges complicate the use of instrumentation in pavement structures.
The embedment of pavement instrumentation is not a simple task and not suitable for all
projects (Willis 2008). The biggest challenge is associated with designing the

27
instrumentation plan. Very few guidelines for determining sensor type, quantity and
placement exist. However, it must be noted that each experiment has its specific research
objectives and the instrumentation must be selected to satisfy these objectives and any other
constraints, such as access to site, and loading and environmental conditions. The pavement
responses of interest for each site and their locations must be selected, resulting in significant
differences in instrumentation plans for each project (Willis 2008). Often, instrumentation
plans are developed by checking how comparable sites with similar objectives were
established and how the data collected has assisted with evaluating the research objectives.
Another major impediment is the significant added cost. The required robustness and
precision of the equipments raises the prices of sensors and data acquisition systems (Willis
2008). The gauges must have sufficient sensitivity to record minor changes in pavement
response and also be sufficiently durable to survive the initial construction process, while
remaining reliable in the long-term when subjected to traffic and environmental loadings in
the pavement (Willis 2008). Also, since duplication of gauges is desirable to allow
researchers to check the quality of the data, further costs are incurred.
Additionally, the installation of sensors is a complicating factor. Most contractors are
not used to the placement of instrumentation and this will result in related issues, such as
time delays. The gauges and their wiring will often create significant inconvenience in
construction activities. Care must be taken to protect the sensors from damage from
construction equipment and processes. Diligent quality control during installation will reduce
the likelihood of future issues with sensor performance and data quality.
The final major challenge is associated with data analysis. In order for pavement
instrumentation experiments to be successful, the data collected must be accurate and precise.
28
A number of factors can affect the accuracy and precision of the sensor readings. However,
errors may present themselves and need to be addressed accordingly (Willis 2008). The
variability might be associated with the precision of the instruments, variability in
construction, such as materials properties or thicknesses and shifting gauge alignments. The
identification of these sources of error need to be identified and mitigated as best as possible
to ensure that reliable data is used for modeling.
2.3.2 Accelerated load testing of pavements
The pavement industry has seen many advances in finite element modeling and materials
characterization that have helped greatly in predicting and evaluating pavement performance.
However, empirical performance continues to have an important role in the evaluation of
new pavement technologies. Prior to their widespread adoption, the suitability and durability
of new technologies must be proven. However, pavement structures are typically designed to
last 20 or more years. Agencies do not have the time to take on uncompressed evaluation
strategies.
Full-scale accelerated pavement testing (APT) is defined as the controlled application
of loadings at or above the appropriate legal load limit to a prototype pavement system to
determine pavement response and performance under a controlled, accelerated accumulation
of damage in a compressed time period (NCHRP 2012). By accelerating damage through
increased load repetitions and heavier loads, results can be obtained faster. Accelerated field
testing helps bridge the gap between laboratory work and theoretical computer models, and
real long-term performance. This method has successfully been used to develop and verify
design procedures, evaluate material selections and validate pavement performance.
29
The NCHRP Research Synthesis 235 (1996) lists many specific applications of
accelerating pavement testing:
Extrapolating existing designs to heavier traffic levels;
Introducing designs for new materials and pavement configurations;
Evaluating non-traditional, recycled, by-product and waste materials;
Evaluating stabilization and geofabric treatments for subgrades;
Defining pavement deterioration phenomena;
Characterizing the effects of new axle, wheel and tire loads and configurations;
Investigating environmental effects, especially frost heave; and
Estimating remaining pavement life.
Four basic APT methods have been identified: test roads, circular tracks, linear
tracks, and pulse or static loading (NCHRP 2012). Test roads and circular tracks use loaded
trucks to apply traffic loadings. Linear tracks use specialized pavement testing equipment,
such as the Heavy Vehicle Simulator (HVS), to apply traffic loads.
Accelerated pavement testing programs have been undertaken for almost a century in
the United States. One of the earliest test roads was the Bates Experimental Road, built in
Illinois in 1922. The State Bureau of Roads, in search of the most effective designs, ran
trucks with various axle loads over different brick, asphalt and Portland cement concrete
pavement sections. Various major road testing programs have since been constructed. The
most notable experiment is the AASHTO Road Test, discussed previously, which led to the
30
development of the AASHTO Guide for Design of Pavement Structures, which remains the
predominant design methodology in most of the US and Canada.
Construction of APT facilities and implementation of the associated testing programs
are long-term commitments that require considerable investment (NCHRP 2012). In addition
to the price of the facility and the initial construction cost of the experimental pavements,
further costs are associated with laboratory testing, pavement surveys, pavement and facility
maintenance, data analysis and reporting.
Although APT programs are costly undertakings, waiting for results to accumulate at
an actual low traffic rates and the potential cost of failures under actual traffic provide good
justification for their implementation. APT programs also provide additional control over
experimental variables, such as traffic and environment (NCHRP 2012).
2.4 Overview of aerated slab systems
Although Cupolex® has been successfully used in all manners of floor slab applications, this
product had not been previously used in pavement applications. Pavements are subject to
different conditions than most floor slabs, including frequent and heavy dynamic loads and
exposure to a wide range of environmental conditions.
A review of the literature shows that this dome formwork product is unique. No
comparable products are available on the market. Furthermore, a search shows that nothing
similar has been previously implemented in any pavement or roadway application other than
by this research team.
31
2.4.1 Mechanics of arches and domes
Arches and domes have been used since early times. The semicircular arch was first used by
the Romans 2000 years ago (Giancoli 2008). These structures primarily resolve any forces
into compression, making them suitable for masonry or concrete construction.
An arch is two-dimensional architectural feature that can span large distances without
intermediate supports (Reid 1984). Arches carry loads by resolving external loads into
mainly internal axial compression forces. This is a particularly beneficial property for
materials with low tensile strengths, e.g. unreinforced concrete and masonry. Although
bending moments, causing both compressive and tensile stresses are generally induced, they
are typically small in magnitude (Schodek and Bechthold 2008). The supports of the arch
must carry horizontal and vertical forces. The thrust of externally applied loads tend to force
the bottom of the arch outwards, which can cause it to collapse. Consequently, sufficient
buttressing is required at the bottom of the arch to prevent this movement. It was discovered
that pointed arches, as compared to semicircular arches, have lower lateral thrusts and require
less resistance to prevent collapse.
A dome can be considered to be an arch that has been rotated around its central axis,
making it in essence a series of radial arch ribs (Sandaker et al. 2011). Similar to arch
behaviour, the bottom of a dome tends to thrust outwards from the compressive forces in the
arch ribs. These forces must be restrained in order to prevent collapse. Two primary methods
are employed to restrain the outward thrust. The first is the use of base tension ring. The
forces in the dome will apply radial horizontal forces to a base ring, putting it into a state of
tension. Materials such as cast iron and steel are used for this purpose. The other method is to
restrain the outward forces using sufficiently thick buttresses. The self-weight of the
buttresses resists the outward thrust of the dome structures, putting it into static equilibrium.
32
In a dome shaped shell, two sets of forces in separate directions act on the surface
(Schodek and Bechthold 2008). The in-plane meridional forces are always compressive
under full vertical loading. Hoop forces act in the circumferential direction, perpendicular to
the meridional forces. However, these forces may be tensile or compressive, depending on
their location in the shell. At the top of the shell, the hoop forces are typically compressive,
resisting inward movement. At the bottom of the same shell, the shell has a tendency to
deform outwards. Consequently, the resisting hoop forces are tensile. Uniform loading
generally induces fairly small stresses associated with hoop and meridional forces. However,
point loads may cause very high stresses and should be minimized in dome structures.
2.4.2 Summary of Previous Use of Structural Dome Formwork System in Concrete
Pavements
A review of the literature has not revealed any previous use of structural dome formwork
systems in concrete pavement construction nor the construction of aerated slabs in road or
highway applications other than by the members of this research team.
The first preliminary Cupolex® pavement section was constructed by Dufferin
Construction at Dufferin Aggregates’ Mill Creek Pit in Puslinch, Ontario in October 2010
(Rouault 2012). This initial experimental section was built to establish the possibility of
using Cupolex® in pavement applications. The first trial consisted of a 100 m long section of
pavement leading to the pit’s scalehouse. This section was constructed using fixed formwork
and consisted of three adjacent sections of 30 m, each with a different thickness (75 mm, 115
mm & 150 mm). Smooth, gradual transitions were built from one section to the next.
Cupolex® units with dimensions of 560 mm x 560 mm x 260 mm were used for the
Mill Creek trial. At the recommendation of the manufacturer, a welded wire mesh was placed

33
on top of the Cupolex prior to paving, with the expectation that the steel mesh will help hold
together any cracks that form. However, no load transfer devices were installed.
Falling Weight Deflectometer (FWD) testing, Ground Pentrating Radar (GPR)
testing, visual condition surveys and coring have been completed on this section to evaluate
pavement performance. Traffic data (truck volumes and weights) from the scalehouse have
been used to compute the number of Equivalent Single Axle Loads (ESAL) carried by the
test sections.
The Mill Creek Cupolex® trial is still in service, with the exception of the 75 mm
section, which failed prematurely and was removed and replaced with the pre-existing gravel
material. The remaining sections continue to perform adequately. The 115 mm section is in
fair condition, with moderate cracking and a few areas of surface spalling. The 150 mm is
somewhat better condition, showing only minimal low severity cracks. This section has
carried over 1.07 million ESALs to the end of May 2013 (over 30 months after opened to
traffic).
Additionally, Dufferin Construction had previously experimented with the possibility
of using a slipform paver to place concrete onto the Cupolex® formwork. Two short test
areas were built at Dufferin Construction’s Bronte Yard (Oakville, Ontario) in May and
September 2011, respectively, to evaluate the compatibility of modern paving equipment
with this product.
The instrumented test road constructed as part of the research presented in this thesis
is the second major pavement trial involving Cupolex® in Ontario. Lessons learned from the
Mill Creek trial were incorporated into the Milton trial.
34
Chapter 3
Trial Design and Construction
3.1 Introduction
To evaluate the potential of Cupolex® as an innovative concrete pavement technology, a
full-scale trial was designed and constructed by the research team. In order to obtain valuable
performance data in a reasonable period of time, an accelerated loading scenario was
proposed.
The trial Cupolex® pavement section for this research project was constructed in
April 2012 at the Dufferin Aggregates Milton Quarry. The Milton Quarry is located on
Dublin Line in the Town of Milton, Ontario (northwest of Highway 401 and Highway 25, as
indicated in Figure 3-1, forty minutes west of Toronto). This facility is Canada’s largest
active limestone quarry, drawing material resources from the Niagara Escarpment. This
quarry has been providing a wide range of aggregate materials for construction activities in
the densely populated Greater Toronto Area since 1962. Annual production consists of
approximately three to four million tonnes per year (Holcim 2010).
The Milton Cupolex® trial consists of a ninety-eight metre (98 m) long section of
two-lane roadway. Each lane is four metres wide. The Cupolex® trial was constructed on the
main access road into the quarry, adjacent to the tarping station, shown in Figure 3-2. This
road sees high volumes of heavy truck traffic. The primary vehicles on this access road
include multi-axle aggregate trucks, most of which exit the quarry with a full load of
aggregate products.
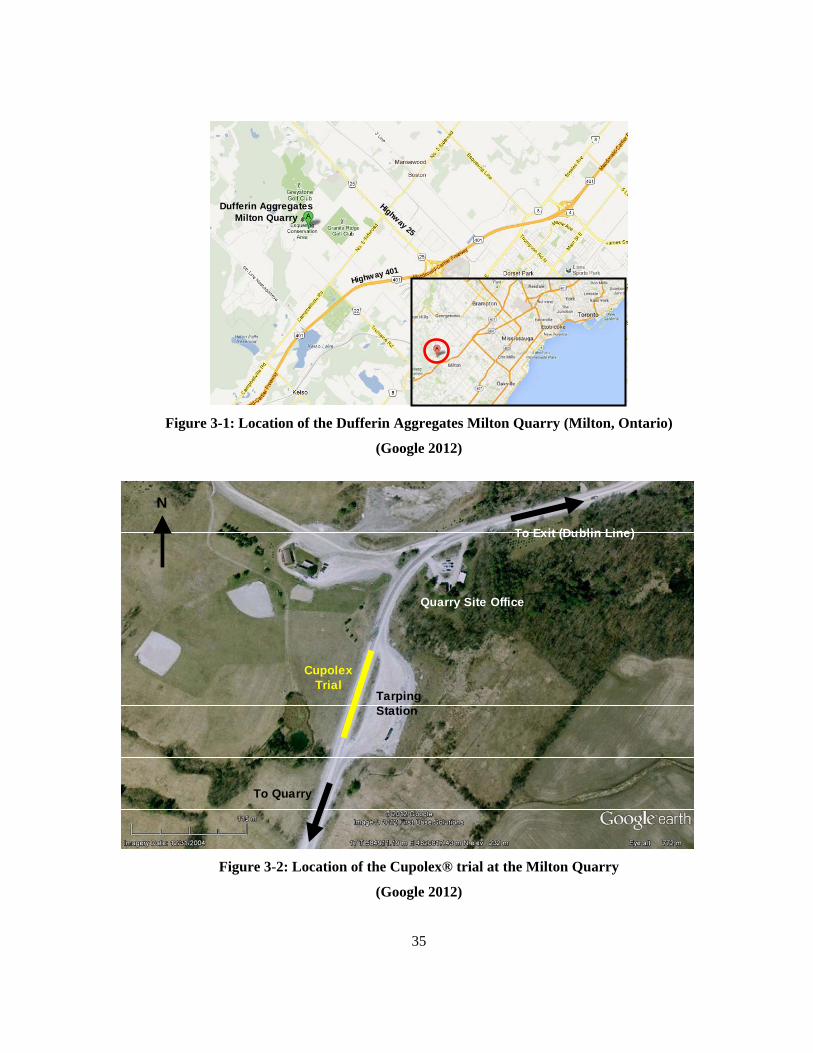
35
Dufferin Aggregates Milton Quarry
Highway 25
Highway 401
Figure 3-1: Location of the Dufferin Aggregates Milton Quarry (Milton, Ontario)
(Google 2012)
To Quarry
To Exit (Dublin Line)
Quarry Site Office
TarpingStation
Cupolex Trial
N
Figure 3-2: Location of the Cupolex® trial at the Milton Quarry
(Google 2012)
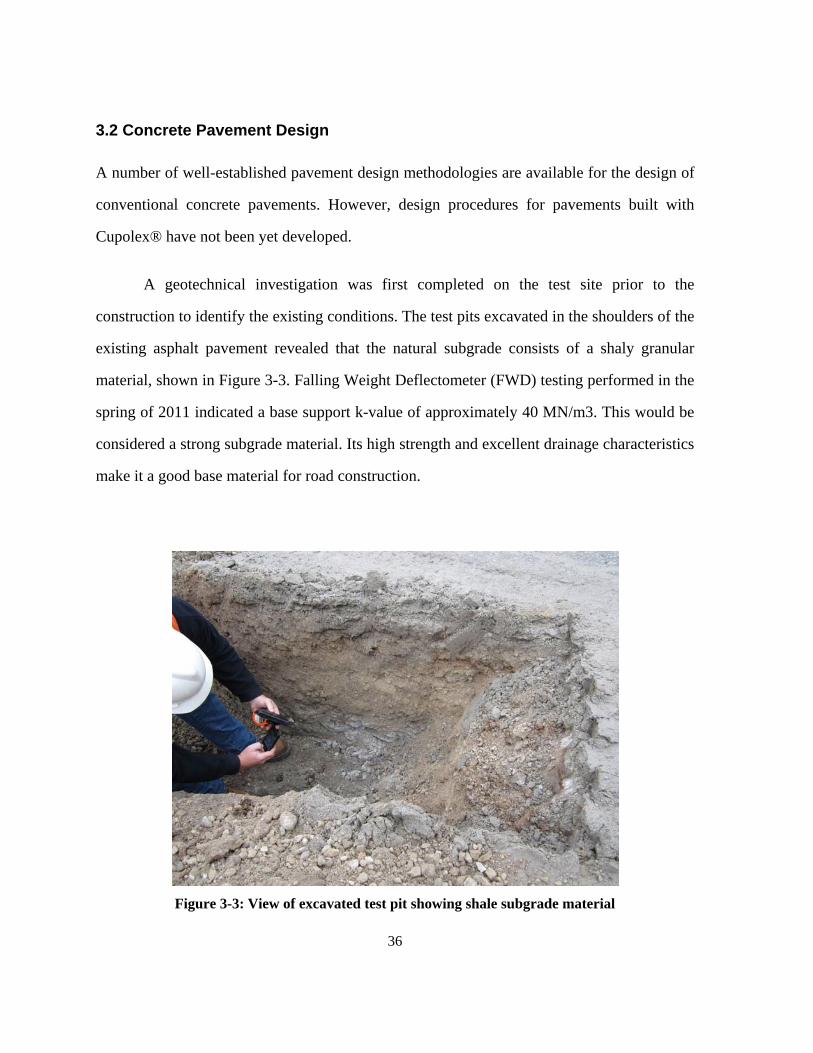
36
3.2 Concrete Pavement Design
A number of well-established pavement design methodologies are available for the design of
conventional concrete pavements. However, design procedures for pavements built with
Cupolex® have not been yet developed.
A geotechnical investigation was first completed on the test site prior to the
construction to identify the existing conditions. The test pits excavated in the shoulders of the
existing asphalt pavement revealed that the natural subgrade consists of a shaly granular
material, shown in Figure 3-3. Falling Weight Deflectometer (FWD) testing performed in the
spring of 2011 indicated a base support k-value of approximately 40 MN/m3. This would be
considered a strong subgrade material. Its high strength and excellent drainage characteristics
make it a good base material for road construction.
Figure 3-3: View of excavated test pit showing shale subgrade material

37
Based on the manufacturer’s experience with floor slab construction, recommendations from the pavement engineering design consultant and the limited previous field experience with
Cupolex® roadways, two pavement designs were proposed to satisfy the requirements for the design vehicle, described in
Table 3-1, representing a typical quarry vehicle, and the geotechnical conditions. The
southern half of the roadway consists of 150 mm of concrete above the Cupolex® unit,
whereas the northern half consists of 175 mm of concrete above the Cupolex® unit. Both
pavement designs are illustrated in Figure 3-4. On-going monitoring and evaluation will
show whether the slight difference in thickness has any noticeable effect on pavement
performance, if any. Both pavement designs would rest on the pre-existing 300 mm thick
granular base, which had placed over the natural subgrade for drainage and structural
support. This granular material meets Ontario Provincial Standards Specification 1010 for
base aggregates (OPSS 2013).
Table 3-1: Design vehicle characteristics
Design vehicle: Full size aggregate truck
Number of axles: 2
Weight per axle: 5,000 kg
Weight per dual tire configuration: 2,500 kg
Weight per individual tire: 1,250 kg
Average axle width (between outside edges of
tires):
2.60 m
Dual tire spacing (centre to centre): 0.30 m
Tire pressure: 830 kPa (120 psi)
Axle spacing (distance between the centre point of
contact between consecutive dual axles):
1.45 m
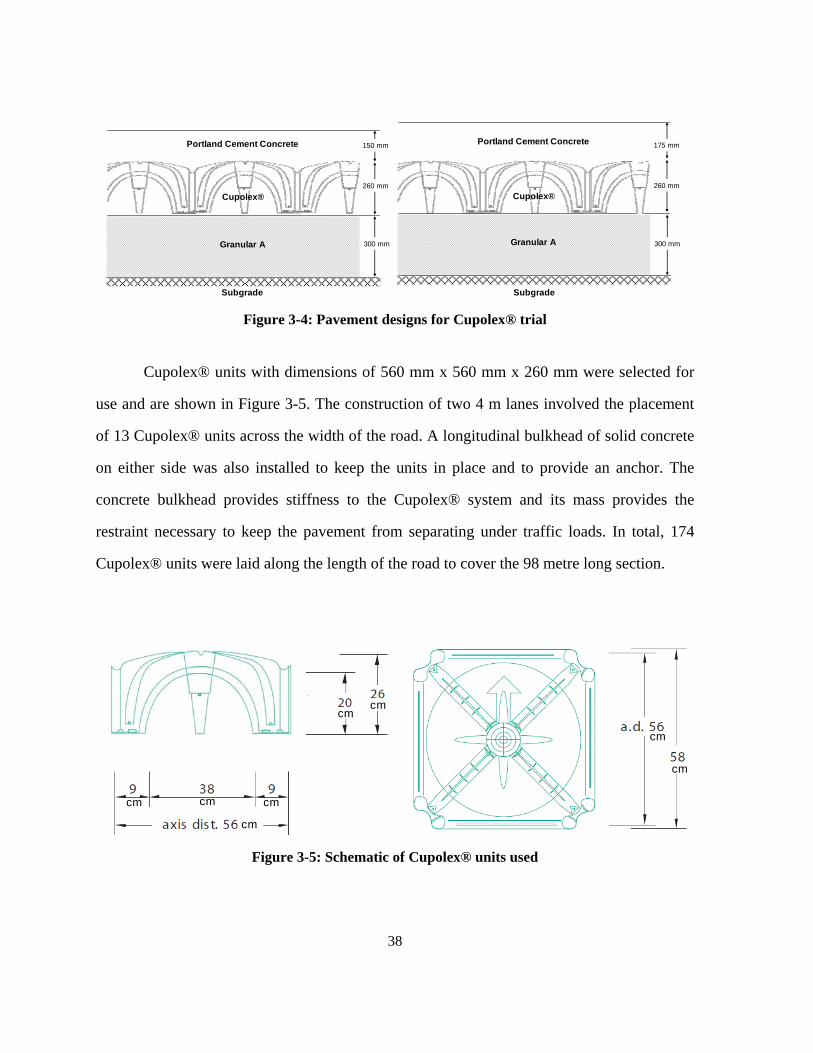
38
150 mm
260 mm
300 mmGranular A
Portland Cement Concrete
Subgrade
Cupolex®
175 mm
260 mm
300 mmGranular A
Portland Cement Concrete
Subgrade
Cupolex®
Figure 3-4: Pavement designs for Cupolex® trial
Cupolex® units with dimensions of 560 mm x 560 mm x 260 mm were selected for
use and are shown in Figure 3-5. The construction of two 4 m lanes involved the placement
of 13 Cupolex® units across the width of the road. A longitudinal bulkhead of solid concrete
on either side was also installed to keep the units in place and to provide an anchor. The
concrete bulkhead provides stiffness to the Cupolex® system and its mass provides the
restraint necessary to keep the pavement from separating under traffic loads. In total, 174
Cupolex® units were laid along the length of the road to cover the 98 metre long section.
cm cm cm
cm
cmcm
cm
cm
Figure 3-5: Schematic of Cupolex® units used
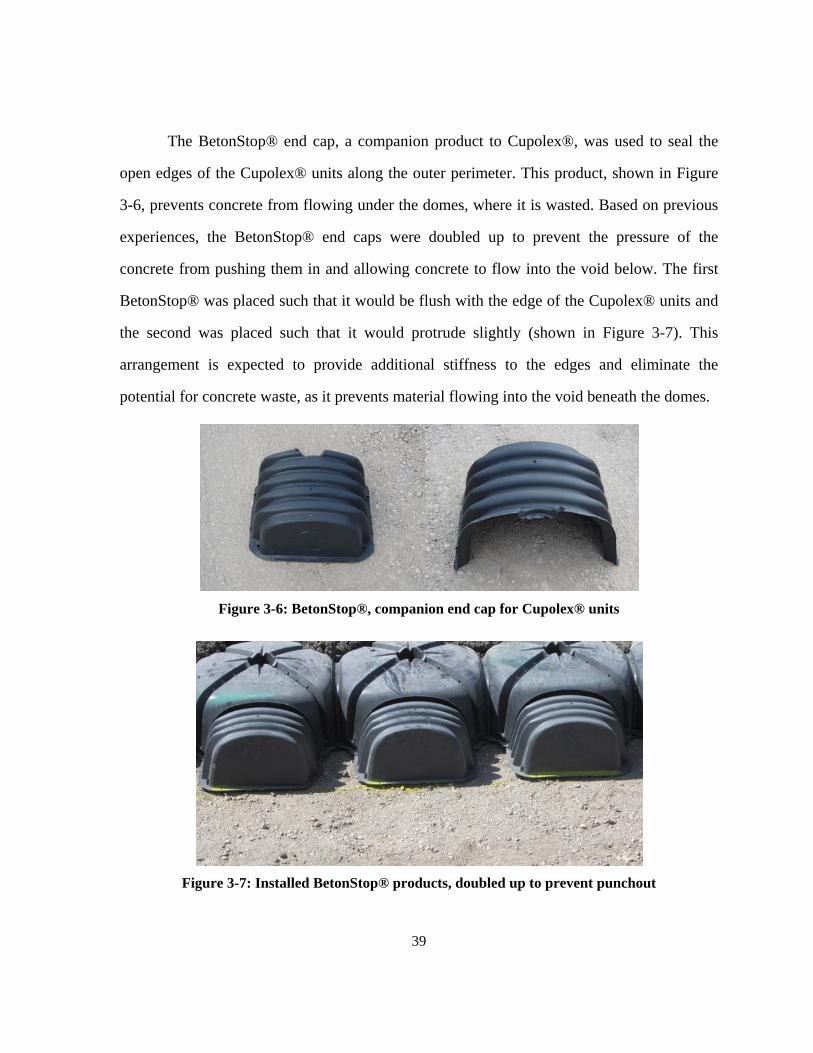
39
The BetonStop® end cap, a companion product to Cupolex®, was used to seal the
open edges of the Cupolex® units along the outer perimeter. This product, shown in Figure
3-6, prevents concrete from flowing under the domes, where it is wasted. Based on previous
experiences, the BetonStop® end caps were doubled up to prevent the pressure of the
concrete from pushing them in and allowing concrete to flow into the void below. The first
BetonStop® was placed such that it would be flush with the edge of the Cupolex® units and
the second was placed such that it would protrude slightly (shown in Figure 3-7). This
arrangement is expected to provide additional stiffness to the edges and eliminate the
potential for concrete waste, as it prevents material flowing into the void beneath the domes.
Figure 3-6: BetonStop®, companion end cap for Cupolex® units
Figure 3-7: Installed BetonStop® products, doubled up to prevent punchout
40
3.3 Joint Design
The proper construction of joints in a rigid pavement is very important to ensure good
performance. Joints installed at regular intervals are required to prevent shrinkage cracking,
which can lead to poor ride quality and premature failures. However, good load transfer
between adjacent slabs is critical for avoiding performance issues such as faulting and
cracking, due to slab movement.
Typically, dowel bars are placed in most rigid pavements that are exposed to high volumes of
traffic (TAC 2012). The anticipated traffic weights and volumes at a location such as a
quarry would warrant the use of dowel bars.
However, the research team discussed at length whether load transfer devices should
be included. Despite the recommendations of conventional pavement design methodologies
to include load transfer devices, the ability of the Cupolex® pavement to transfer load across
transverse through aggregate interlock alone warranted investigation. Additionally, the
inclusion of dowel bars introduced some constructability concerns. Conventional dowel
baskets are typically pinned to the granular base or subgrade. A creative solution would have
been required to fasten the dowel baskets on top of the Cupolex® units. The use of a Dowel
Bar Inserter (DBI) with the slipform paver was ruled out due to the minimal design slab
thickness.
The positioning of the joint with respect to the top of the dome was also suggested as
one possible factor affecting the quality of load transfer across a transverse joint. Joints
located directly over the top of the dome have the minimum amount of concrete below the
joint (150-175 mm of concrete with the selected Cupolex® units and concrete thicknesses),
41
whereas joints located over the legs of the Cupolex® have the maximum amount of concrete
below the joint (410-435 mm of concrete in this scenario).
The increased thickness over the legs should theoretically provide additional shear
area which should provide more aggregate interlock and consequently, better load transfer.
However, the need to ensure that transverse joints are located over the legs complicates
construction. Careful measurement would be required prior to concrete placement to
accurately pre-determine joint locations. In the end, it was decided that load transfer devices,
i.e. dowel bars, would be omitted.
3.4 Concrete Mix Design
A concrete mix design using a 19 mm aggregate mix and General Use Portland-Limestone
cement (Type GUL) was developed for this project. Full mix specifications are shown in
Table 3-2. The mix used had a specified 28 day compressive strength of 30 MPa, as well as a
specified air content of 6.0% and slump of 70 mm.
Portland-Limestone cement is a more sustainable Portland cement product, prepared
by replacing a portion of the cement clinker with raw limestone. In many applications,
Portland-Limestone cements provide equal performance to conventional Portland cements
with a lessened impact on the environment (Tennis et al. 2011).
Table 3-2: Concrete Mix Design
Material Description Proportions
Portland Cement (Type GUL) 268 kg/m3
Slag 87 kg/m3
Sand 860 kg/m3
19 mm limestone 1035 kg/m3
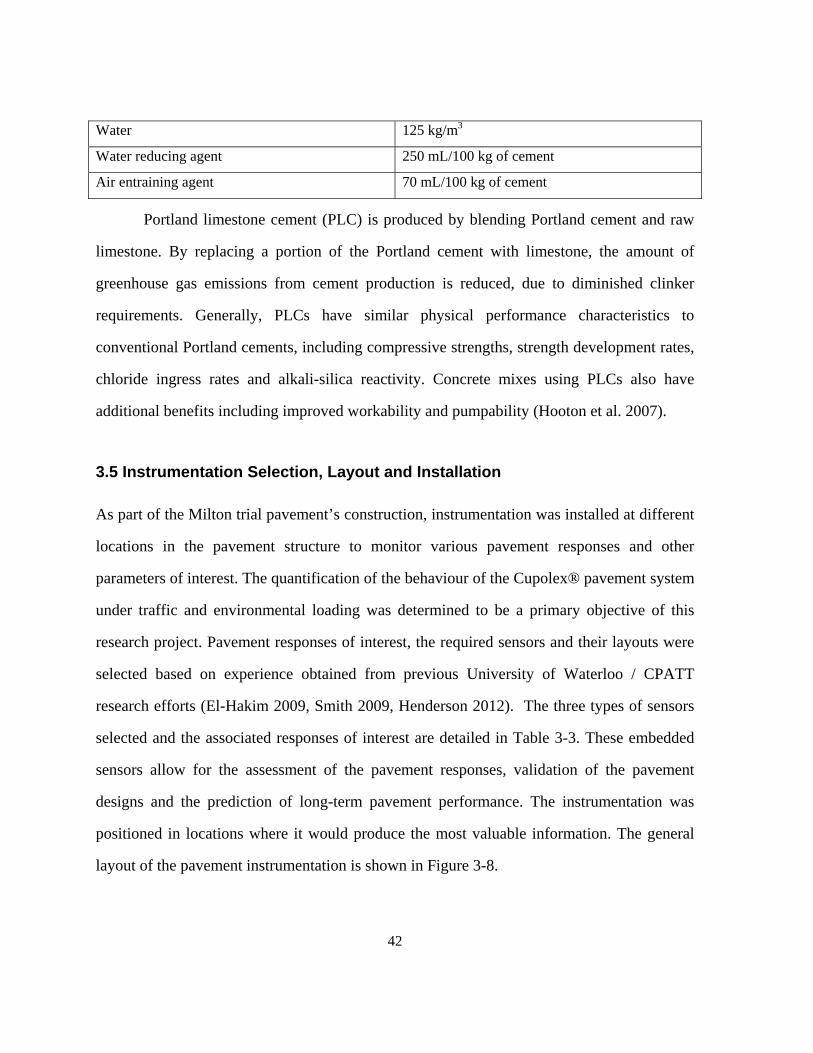
42
Water 125 kg/m3
Water reducing agent 250 mL/100 kg of cement
Air entraining agent 70 mL/100 kg of cement
Portland limestone cement (PLC) is produced by blending Portland cement and raw
limestone. By replacing a portion of the Portland cement with limestone, the amount of
greenhouse gas emissions from cement production is reduced, due to diminished clinker
requirements. Generally, PLCs have similar physical performance characteristics to
conventional Portland cements, including compressive strengths, strength development rates,
chloride ingress rates and alkali-silica reactivity. Concrete mixes using PLCs also have
additional benefits including improved workability and pumpability (Hooton et al. 2007).
3.5 Instrumentation Selection, Layout and Installation
As part of the Milton trial pavement’s construction, instrumentation was installed at different
locations in the pavement structure to monitor various pavement responses and other
parameters of interest. The quantification of the behaviour of the Cupolex® pavement system
under traffic and environmental loading was determined to be a primary objective of this
research project. Pavement responses of interest, the required sensors and their layouts were
selected based on experience obtained from previous University of Waterloo / CPATT
research efforts (El-Hakim 2009, Smith 2009, Henderson 2012). The three types of sensors
selected and the associated responses of interest are detailed in Table 3-3. These embedded
sensors allow for the assessment of the pavement responses, validation of the pavement
designs and the prediction of long-term pavement performance. The instrumentation was
positioned in locations where it would produce the most valuable information. The general
layout of the pavement instrumentation is shown in Figure 3-8.
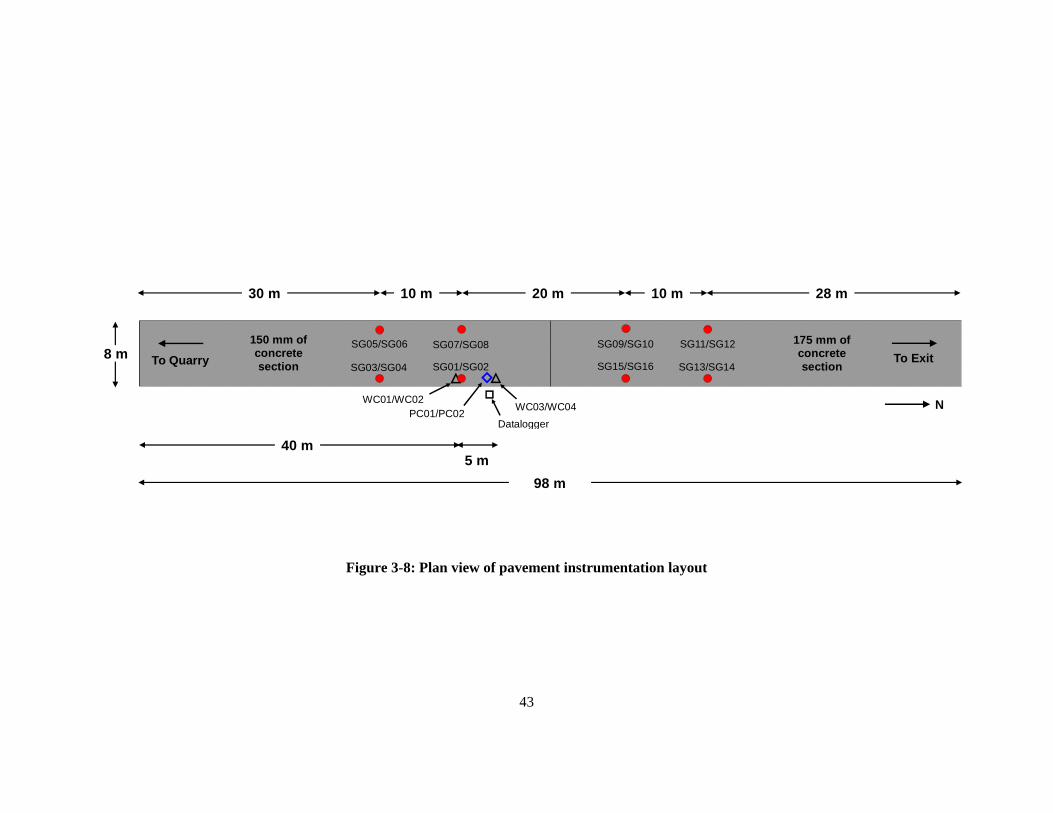
43
Figure 3-8: Plan view of pavement instrumentation layout
SG01/SG02SG03/SG04
SG05/SG06
SG13/SG14SG15/SG16
SG11/SG12 SG09/SG10
WC03/WC04WC01/WC02
PC01/PC02 Datalogger
150 mm of concrete section
175 mm of concrete section
N
To Exit To Quarry SG07/SG08
98 m
8 m
10 m20 m10 m30 m 28 m
5 m40 m
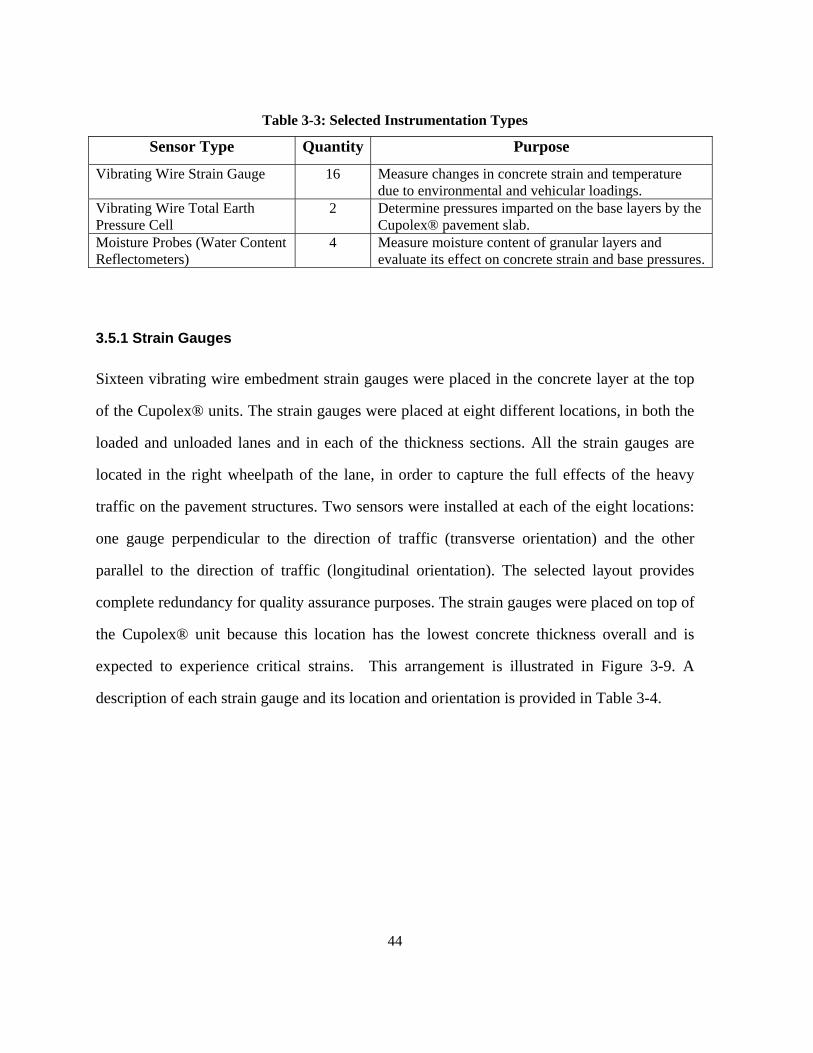
44
Table 3-3: Selected Instrumentation Types
Sensor Type Quantity Purpose
Vibrating Wire Strain Gauge 16 Measure changes in concrete strain and temperature due to environmental and vehicular loadings.
Vibrating Wire Total Earth Pressure Cell
2 Determine pressures imparted on the base layers by the Cupolex® pavement slab.
Moisture Probes (Water Content Reflectometers)
4 Measure moisture content of granular layers and evaluate its effect on concrete strain and base pressures.
3.5.1 Strain Gauges
Sixteen vibrating wire embedment strain gauges were placed in the concrete layer at the top
of the Cupolex® units. The strain gauges were placed at eight different locations, in both the
loaded and unloaded lanes and in each of the thickness sections. All the strain gauges are
located in the right wheelpath of the lane, in order to capture the full effects of the heavy
traffic on the pavement structures. Two sensors were installed at each of the eight locations:
one gauge perpendicular to the direction of traffic (transverse orientation) and the other
parallel to the direction of traffic (longitudinal orientation). The selected layout provides
complete redundancy for quality assurance purposes. The strain gauges were placed on top of
the Cupolex® unit because this location has the lowest concrete thickness overall and is
expected to experience critical strains. This arrangement is illustrated in Figure 3-9. A
description of each strain gauge and its location and orientation is provided in Table 3-4.
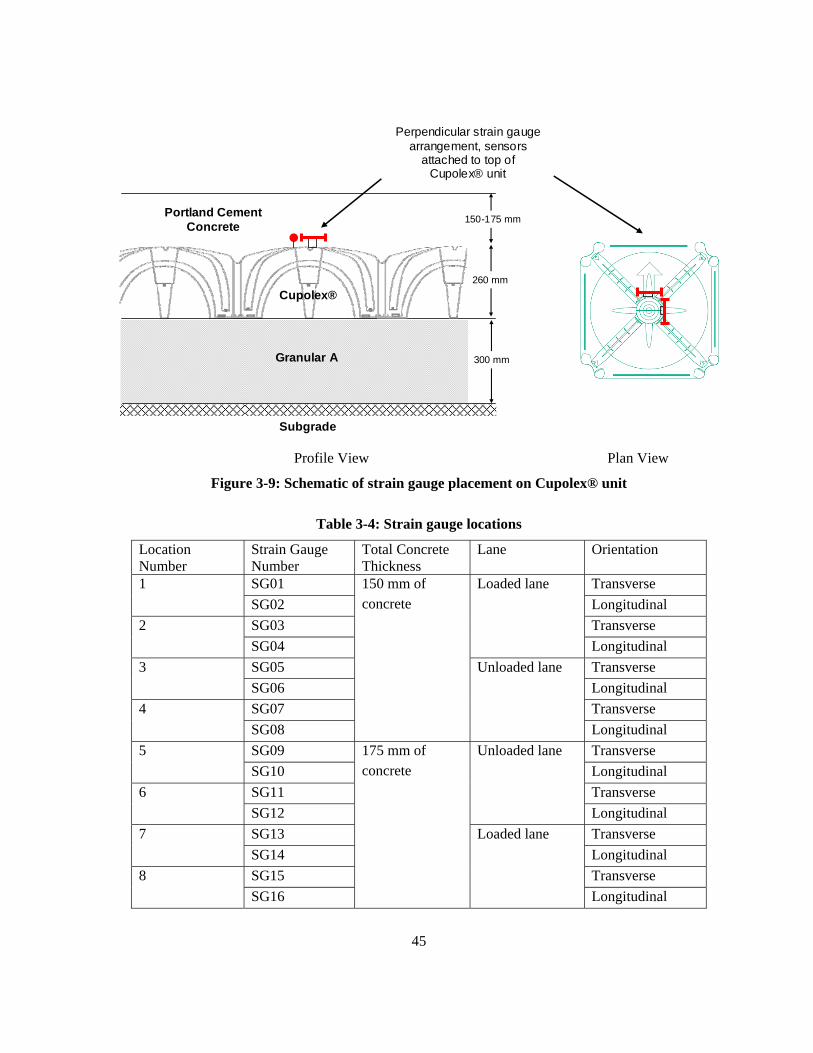
45
150-175 mm
260 mm
300 mmGranular A
Portland Cement Concrete
Subgrade
Cupolex®
Perpendicular strain gaugearrangement, sensors
attached to top of Cupolex® unit
Profile View Plan View
Figure 3-9: Schematic of strain gauge placement on Cupolex® unit
Table 3-4: Strain gauge locations
Location Number
Strain Gauge Number
Total Concrete Thickness
Lane Orientation
SG01 Transverse 1
SG02 Longitudinal
SG03 Transverse 2
SG04
Loaded lane
Longitudinal
SG05 Transverse 3
SG06 Longitudinal
SG07 Transverse 4
SG08
150 mm of concrete
Unloaded lane
Longitudinal
SG09 Transverse 5
SG10 Longitudinal
SG11 Transverse 6
SG12
Unloaded lane
Longitudinal
SG13 Transverse 7
SG14 Longitudinal
SG15 Transverse 8
SG16
175 mm of concrete
Loaded lane
Longitudinal
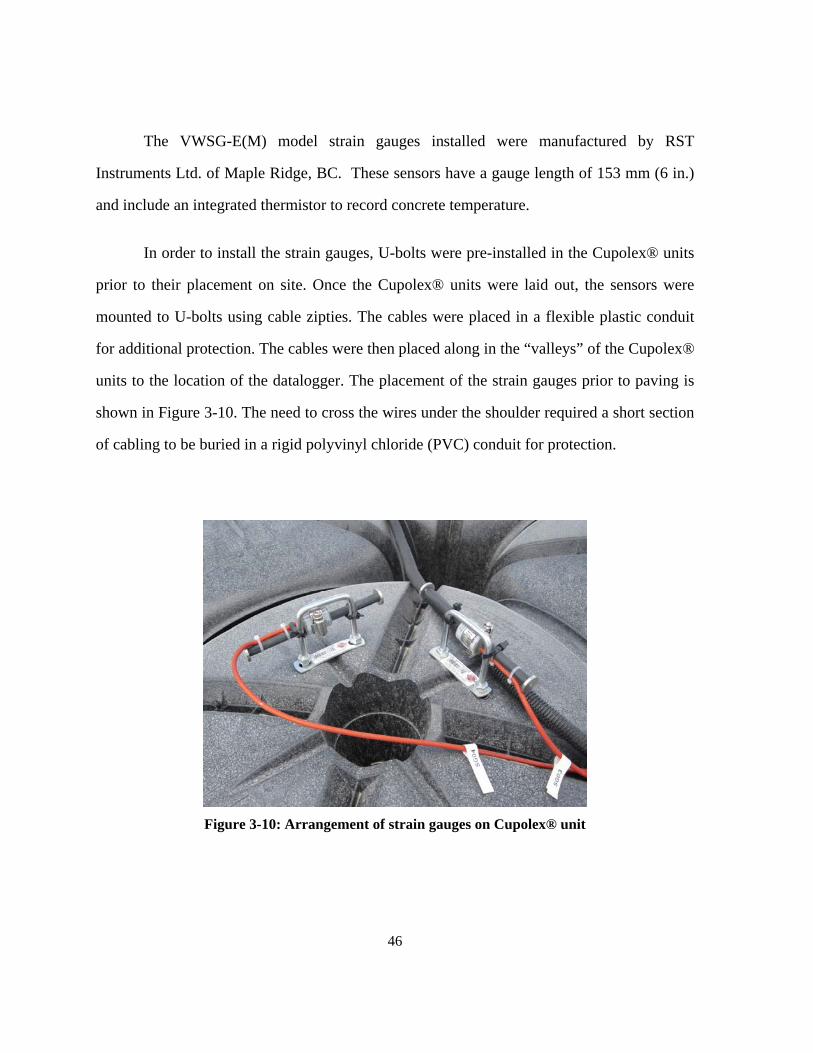
46
The VWSG-E(M) model strain gauges installed were manufactured by RST
Instruments Ltd. of Maple Ridge, BC. These sensors have a gauge length of 153 mm (6 in.)
and include an integrated thermistor to record concrete temperature.
In order to install the strain gauges, U-bolts were pre-installed in the Cupolex® units
prior to their placement on site. Once the Cupolex® units were laid out, the sensors were
mounted to U-bolts using cable zipties. The cables were placed in a flexible plastic conduit
for additional protection. The cables were then placed along in the “valleys” of the Cupolex®
units to the location of the datalogger. The placement of the strain gauges prior to paving is
shown in Figure 3-10. The need to cross the wires under the shoulder required a short section
of cabling to be buried in a rigid polyvinyl chloride (PVC) conduit for protection.
Figure 3-10: Arrangement of strain gauges on Cupolex® unit
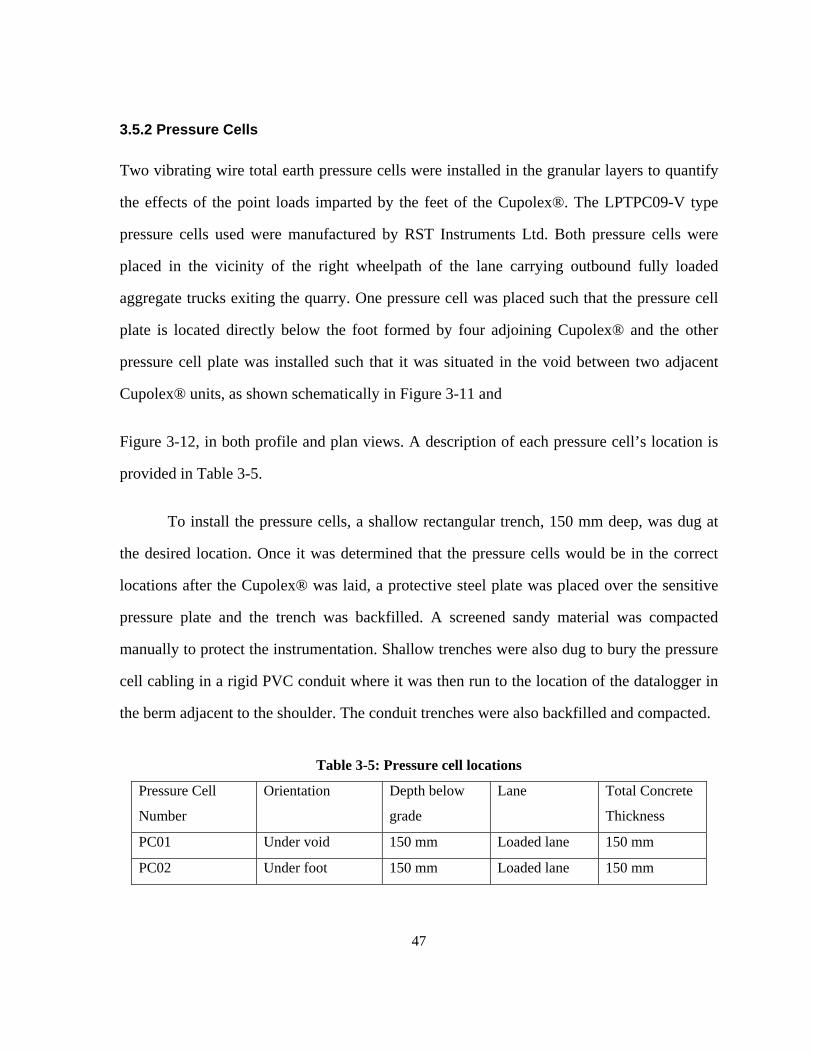
47
3.5.2 Pressure Cells
Two vibrating wire total earth pressure cells were installed in the granular layers to quantify
the effects of the point loads imparted by the feet of the Cupolex®. The LPTPC09-V type
pressure cells used were manufactured by RST Instruments Ltd. Both pressure cells were
placed in the vicinity of the right wheelpath of the lane carrying outbound fully loaded
aggregate trucks exiting the quarry. One pressure cell was placed such that the pressure cell
plate is located directly below the foot formed by four adjoining Cupolex® and the other
pressure cell plate was installed such that it was situated in the void between two adjacent
Cupolex® units, as shown schematically in Figure 3-11 and
Figure 3-12, in both profile and plan views. A description of each pressure cell’s location is
provided in Table 3-5.
To install the pressure cells, a shallow rectangular trench, 150 mm deep, was dug at
the desired location. Once it was determined that the pressure cells would be in the correct
locations after the Cupolex® was laid, a protective steel plate was placed over the sensitive
pressure plate and the trench was backfilled. A screened sandy material was compacted
manually to protect the instrumentation. Shallow trenches were also dug to bury the pressure
cell cabling in a rigid PVC conduit where it was then run to the location of the datalogger in
the berm adjacent to the shoulder. The conduit trenches were also backfilled and compacted.
Table 3-5: Pressure cell locations
Pressure Cell
Number
Orientation Depth below
grade
Lane Total Concrete
Thickness
PC01 Under void 150 mm Loaded lane 150 mm
PC02 Under foot 150 mm Loaded lane 150 mm
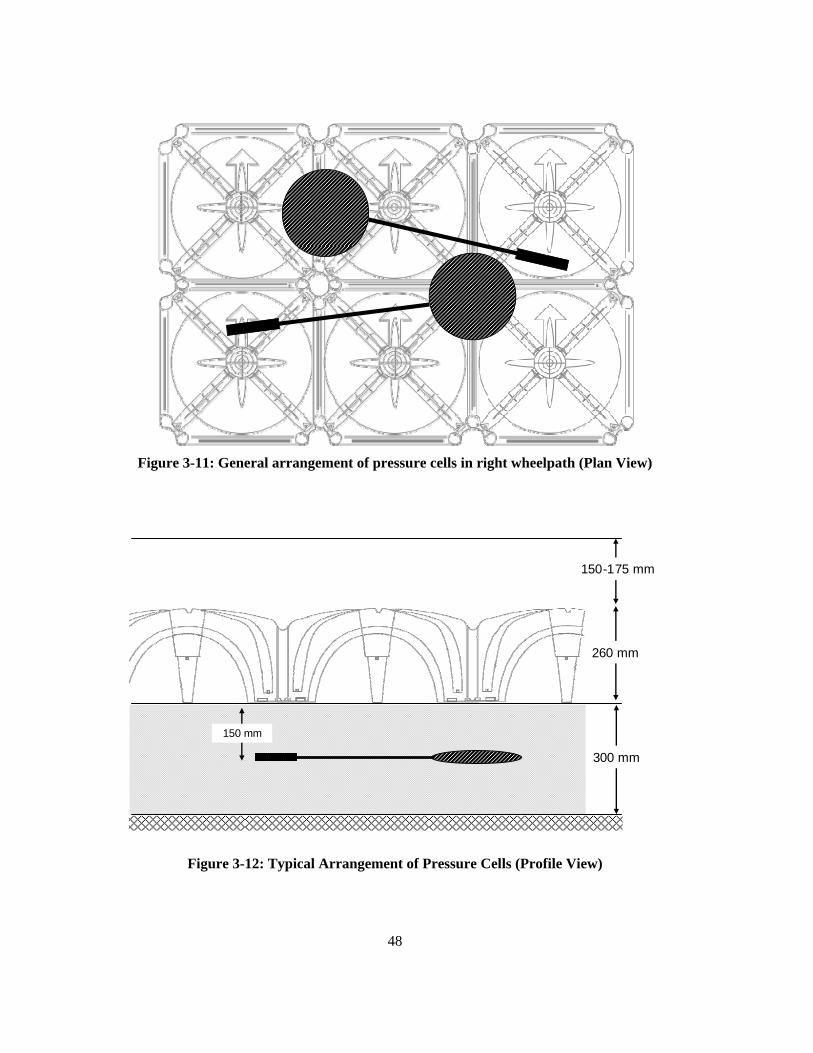
48
Figure 3-11: General arrangement of pressure cells in right wheelpath (Plan View)
150-175 mm
260 mm
300 mm
150 mm
Figure 3-12: Typical Arrangement of Pressure Cells (Profile View)
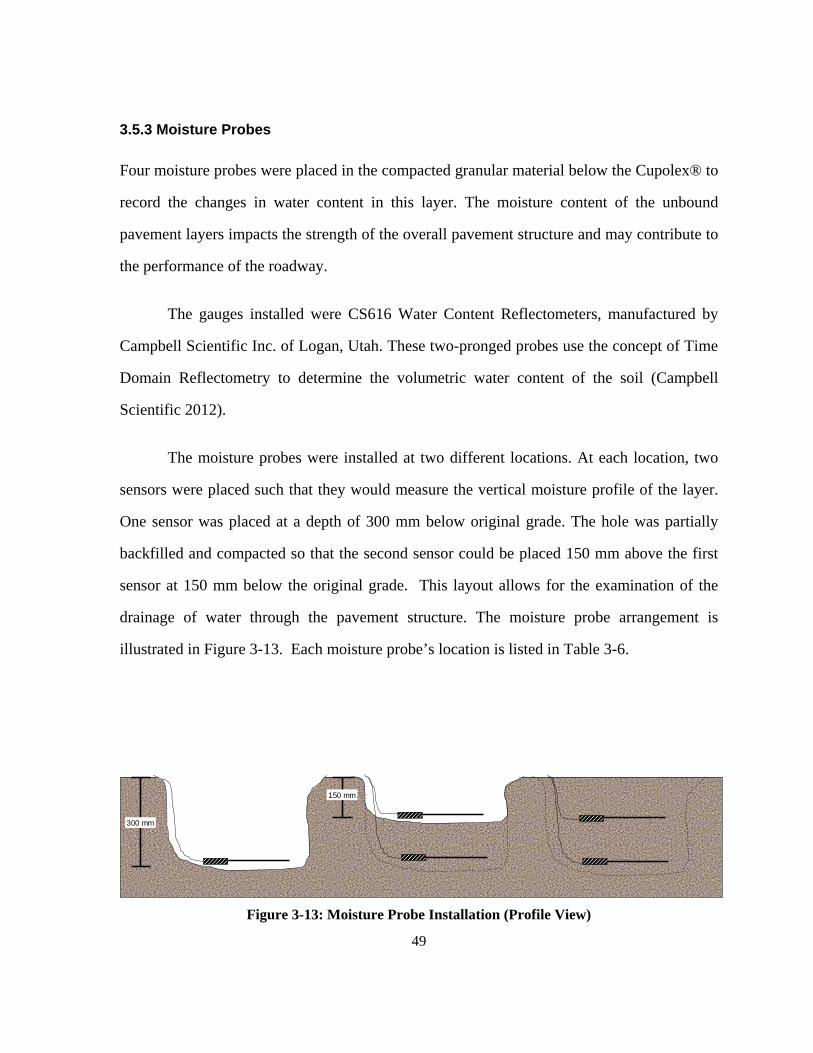
49
3.5.3 Moisture Probes
Four moisture probes were placed in the compacted granular material below the Cupolex® to
record the changes in water content in this layer. The moisture content of the unbound
pavement layers impacts the strength of the overall pavement structure and may contribute to
the performance of the roadway.
The gauges installed were CS616 Water Content Reflectometers, manufactured by
Campbell Scientific Inc. of Logan, Utah. These two-pronged probes use the concept of Time
Domain Reflectometry to determine the volumetric water content of the soil (Campbell
Scientific 2012).
The moisture probes were installed at two different locations. At each location, two
sensors were placed such that they would measure the vertical moisture profile of the layer.
One sensor was placed at a depth of 300 mm below original grade. The hole was partially
backfilled and compacted so that the second sensor could be placed 150 mm above the first
sensor at 150 mm below the original grade. This layout allows for the examination of the
drainage of water through the pavement structure. The moisture probe arrangement is
illustrated in Figure 3-13. Each moisture probe’s location is listed in Table 3-6.
300 mm
150 mm
Figure 3-13: Moisture Probe Installation (Profile View)
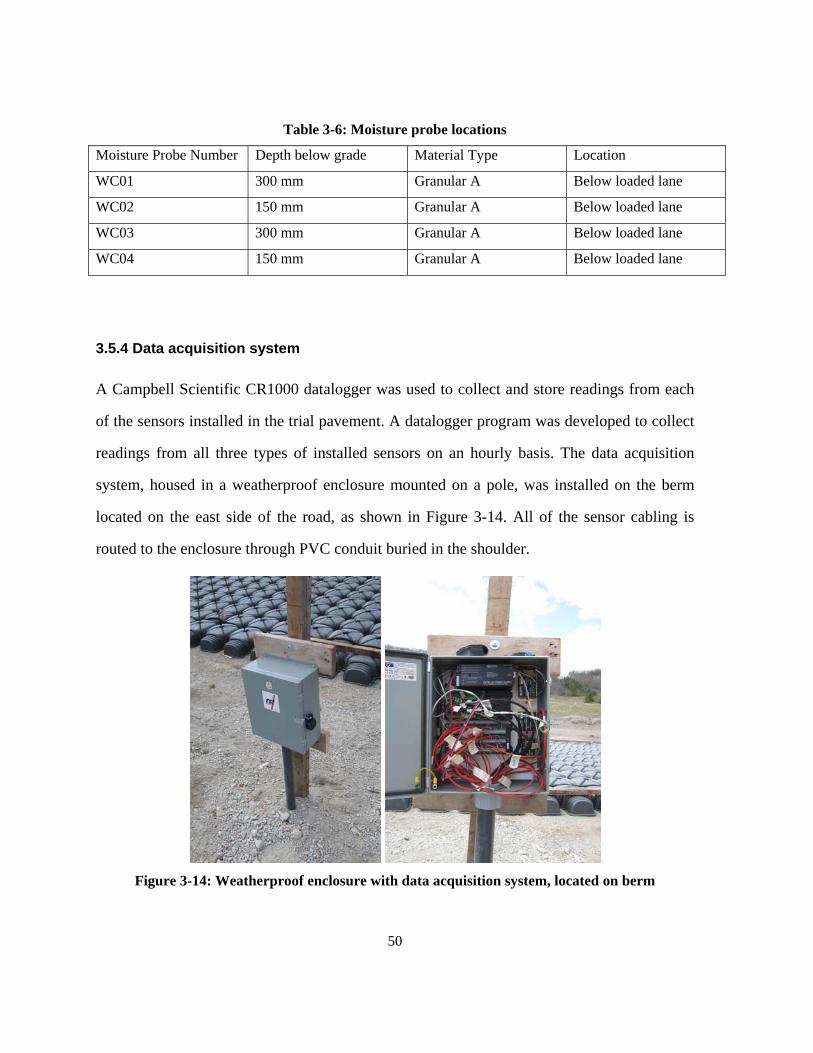
50
Table 3-6: Moisture probe locations
Moisture Probe Number Depth below grade Material Type Location
WC01 300 mm Granular A Below loaded lane
WC02 150 mm Granular A Below loaded lane
WC03 300 mm Granular A Below loaded lane
WC04 150 mm Granular A Below loaded lane
3.5.4 Data acquisition system
A Campbell Scientific CR1000 datalogger was used to collect and store readings from each
of the sensors installed in the trial pavement. A datalogger program was developed to collect
readings from all three types of installed sensors on an hourly basis. The data acquisition
system, housed in a weatherproof enclosure mounted on a pole, was installed on the berm
located on the east side of the road, as shown in Figure 3-14. All of the sensor cabling is
routed to the enclosure through PVC conduit buried in the shoulder.
Figure 3-14: Weatherproof enclosure with data acquisition system, located on berm
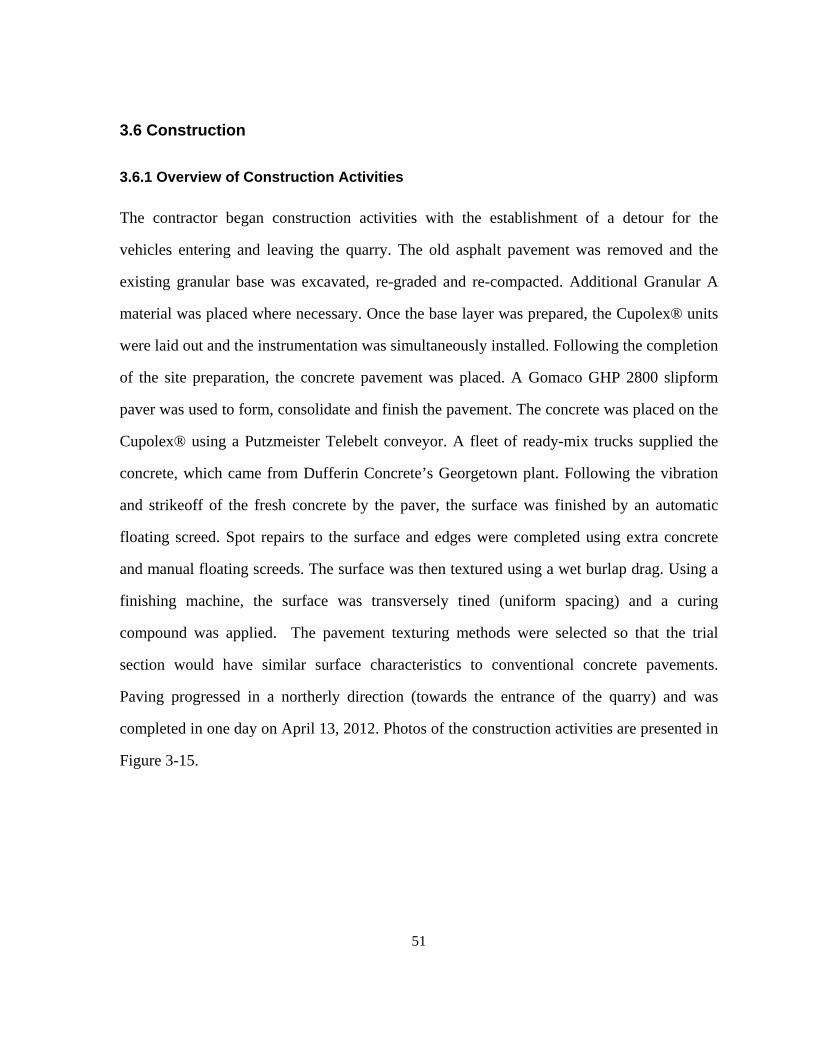
51
3.6 Construction
3.6.1 Overview of Construction Activities
The contractor began construction activities with the establishment of a detour for the
vehicles entering and leaving the quarry. The old asphalt pavement was removed and the
existing granular base was excavated, re-graded and re-compacted. Additional Granular A
material was placed where necessary. Once the base layer was prepared, the Cupolex® units
were laid out and the instrumentation was simultaneously installed. Following the completion
of the site preparation, the concrete pavement was placed. A Gomaco GHP 2800 slipform
paver was used to form, consolidate and finish the pavement. The concrete was placed on the
Cupolex® using a Putzmeister Telebelt conveyor. A fleet of ready-mix trucks supplied the
concrete, which came from Dufferin Concrete’s Georgetown plant. Following the vibration
and strikeoff of the fresh concrete by the paver, the surface was finished by an automatic
floating screed. Spot repairs to the surface and edges were completed using extra concrete
and manual floating screeds. The surface was then textured using a wet burlap drag. Using a
finishing machine, the surface was transversely tined (uniform spacing) and a curing
compound was applied. The pavement texturing methods were selected so that the trial
section would have similar surface characteristics to conventional concrete pavements.
Paving progressed in a northerly direction (towards the entrance of the quarry) and was
completed in one day on April 13, 2012. Photos of the construction activities are presented in
Figure 3-15.
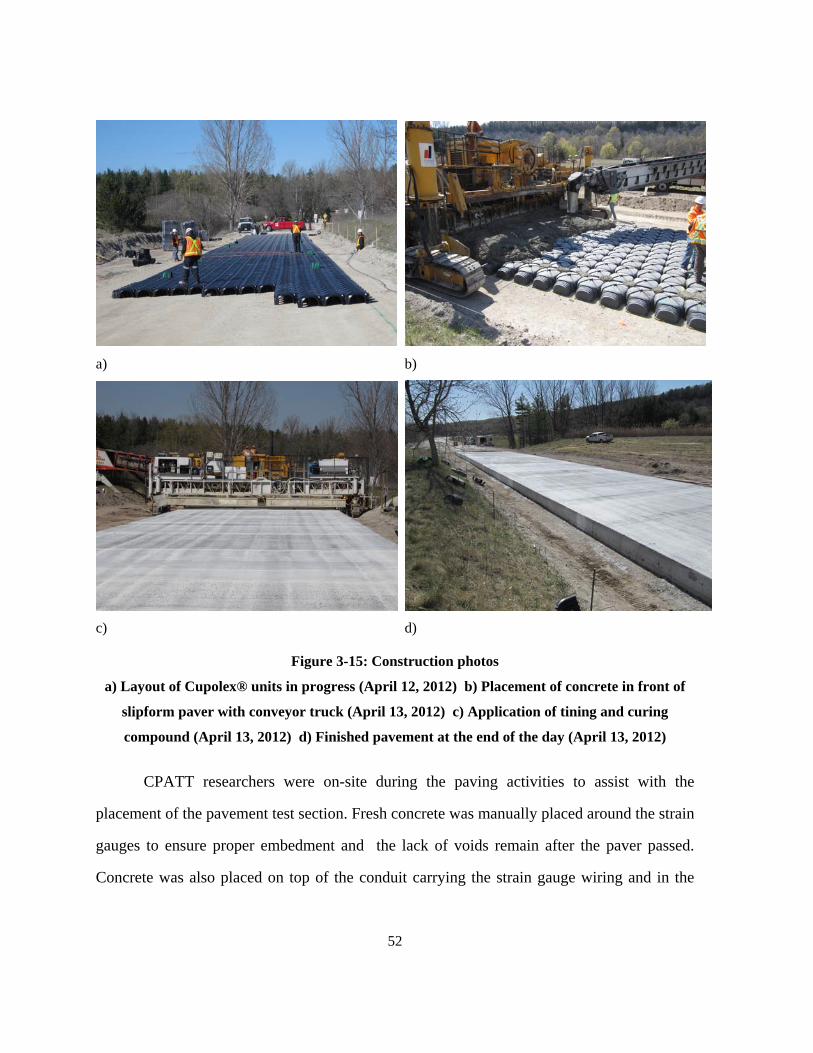
52
a) b)
c) d)
Figure 3-15: Construction photos
a) Layout of Cupolex® units in progress (April 12, 2012) b) Placement of concrete in front of
slipform paver with conveyor truck (April 13, 2012) c) Application of tining and curing
compound (April 13, 2012) d) Finished pavement at the end of the day (April 13, 2012)
CPATT researchers were on-site during the paving activities to assist with the
placement of the pavement test section. Fresh concrete was manually placed around the strain
gauges to ensure proper embedment and the lack of voids remain after the paver passed.
Concrete was also placed on top of the conduit carrying the strain gauge wiring and in the
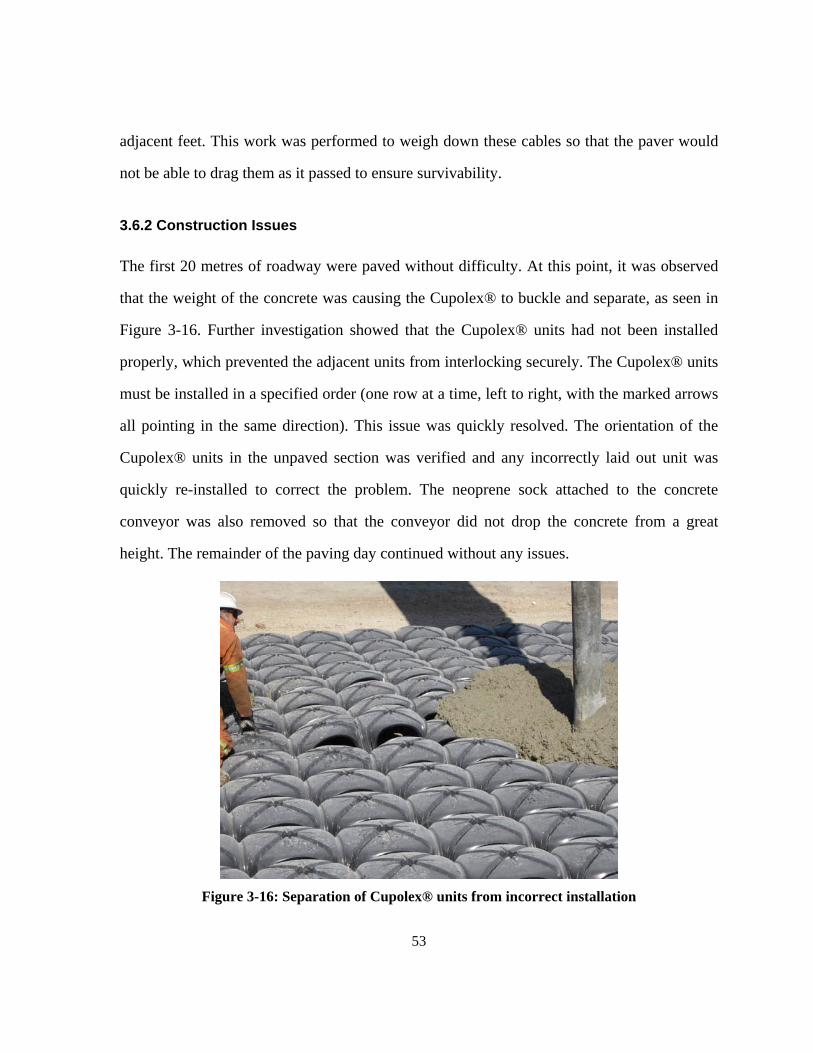
53
adjacent feet. This work was performed to weigh down these cables so that the paver would
not be able to drag them as it passed to ensure survivability.
3.6.2 Construction Issues
The first 20 metres of roadway were paved without difficulty. At this point, it was observed
that the weight of the concrete was causing the Cupolex® to buckle and separate, as seen in
Figure 3-16. Further investigation showed that the Cupolex® units had not been installed
properly, which prevented the adjacent units from interlocking securely. The Cupolex® units
must be installed in a specified order (one row at a time, left to right, with the marked arrows
all pointing in the same direction). This issue was quickly resolved. The orientation of the
Cupolex® units in the unpaved section was verified and any incorrectly laid out unit was
quickly re-installed to correct the problem. The neoprene sock attached to the concrete
conveyor was also removed so that the conveyor did not drop the concrete from a great
height. The remainder of the paving day continued without any issues.
Figure 3-16: Separation of Cupolex® units from incorrect installation
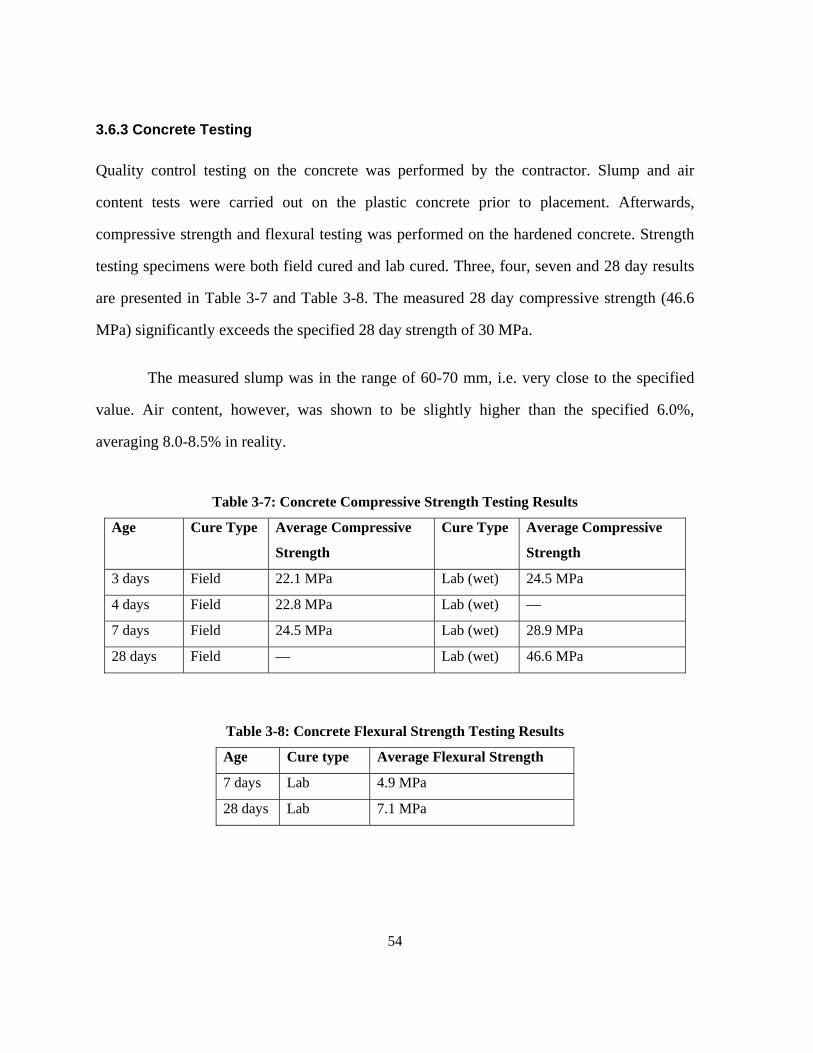
54
3.6.3 Concrete Testing
Quality control testing on the concrete was performed by the contractor. Slump and air
content tests were carried out on the plastic concrete prior to placement. Afterwards,
compressive strength and flexural testing was performed on the hardened concrete. Strength
testing specimens were both field cured and lab cured. Three, four, seven and 28 day results
are presented in Table 3-7 and Table 3-8. The measured 28 day compressive strength (46.6
MPa) significantly exceeds the specified 28 day strength of 30 MPa.
The measured slump was in the range of 60-70 mm, i.e. very close to the specified
value. Air content, however, was shown to be slightly higher than the specified 6.0%,
averaging 8.0-8.5% in reality.
Table 3-7: Concrete Compressive Strength Testing Results
Age Cure Type Average Compressive
Strength
Cure Type Average Compressive
Strength
3 days Field 22.1 MPa Lab (wet) 24.5 MPa
4 days Field 22.8 MPa Lab (wet) —
7 days Field 24.5 MPa Lab (wet) 28.9 MPa
28 days Field — Lab (wet) 46.6 MPa
Table 3-8: Concrete Flexural Strength Testing Results
Age Cure type Average Flexural Strength
7 days Lab 4.9 MPa
28 days Lab 7.1 MPa
55
3.6.4 Jointing
Joints were sawcut soon after the concrete hardened, i.e. 12 hours after paving was
completed. A continuous 75 mm deep longitudinal sawcut was made down the centreline to
divide the roadway into the two 4 metre wide lanes. Transverse joints were sawcut in both
lanes at a uniform spacing of 4 metres.
The joints were initially not sealed. However, it was observed the trucks using the
road were continuously tracking fine dust and dirt from the quarry onto the trial pavement. A
significant amount of fine aggregate was also blowing out of the truck beds onto the
pavement as the vehicles exited the quarry. The research team subsequently decided to seal
the joints after eight months of service. This was deemed to be necessary as the joints were
being exposed to large amounts of incompressible materials and this would lead to the
accelerated deterioration of the trial pavement, which would not be representative of typical
road and highway pavements. All joints were cleaned out with a high pressure air lance and a
pre-formed neoprene sealant was installed.
3.6.5 Other post-paving activities
Before the Cupolex® trial section could be opened to traffic, granular fill was placed on the
shoulders and graded to eliminate edge dropoff. The approaches at both ends of the section
were also backfilled with granular material and paved with asphalt. Finally, flexible plastic
delineators were installed down the centreline of the test section. The delineators were placed
to ensure that the trucks travelling along the road would remain in their designated lanes and
not travel down the centre of the roadway. The Cupolex® trial section was opened to traffic
one week after paving after verifying that the concrete had gained sufficient strength through
quality control testing.
56
3.7 Summary of Field Test Section Design and Construction
A 98 metre long trial Cupolex® concrete pavement section was constructed at Dufferin
Aggregates Milton Quarry in April 2012. This experimental pavement consists of two
pavement structural designs. Three types of pavement instrumentation, strain gauges,
pressure cells and moisture probes, were installed in the pavement structure to monitor
pavement responses and assist with pavement performance evaluation. The pavement was
placed using a conventional concrete slipform paver. The Cupolex® pavement was easily
constructed using the standard concrete pavement construction equipment in one day. One
critical point of importance was noted for successful construction. The Cupolex® units must
be installed with the proper orientation, as directed by the manufacturer. Otherwise, the
Cupolex® units will separate under the weight of the concrete, distorting the pavement and
allowing waste concrete to flow under the plastic domes.
57
Chapter 4
Pavement Evaluation
Following construction, the performance of the Cupolex® pavement trial at the Milton
Quarry has been evaluated through a variety of means. Strain, temperature, deflection, and
visual condition surveys are effective means for evaluating pavement performance and
validating pavement design. A summary of the performance data from the first year of
service is presented in this chapter.
4.1 Sensor Evaluation
4.1.1 Strain Gauge Evaluation
Prior to the placement of concrete, initial strains were recorded to establish baseline
measurements. Future strain measurements are compared to the initial baseline values to
determine the change in strain. Changes in strain, related to both environment and traffic load
effects, are recorded at hourly intervals. A positive strain value denotes that the pavement is
in tension, while a negative strain value indicates that the concrete is in compression.
Each time a dataset was downloaded from the datalogging equipment, it was
processed and underwent a quality control check. The measured strain value was subtracted
from the baseline value to calculate the change in strain at that time interval. Correction
factors to account for temperature variations and the different coefficients of thermal
expansion of the gauge and the concrete were applied using the RST Instruments Ltd.
recommended equations. Overrange and other erroneous values were removed from the
dataset prior to analysis.
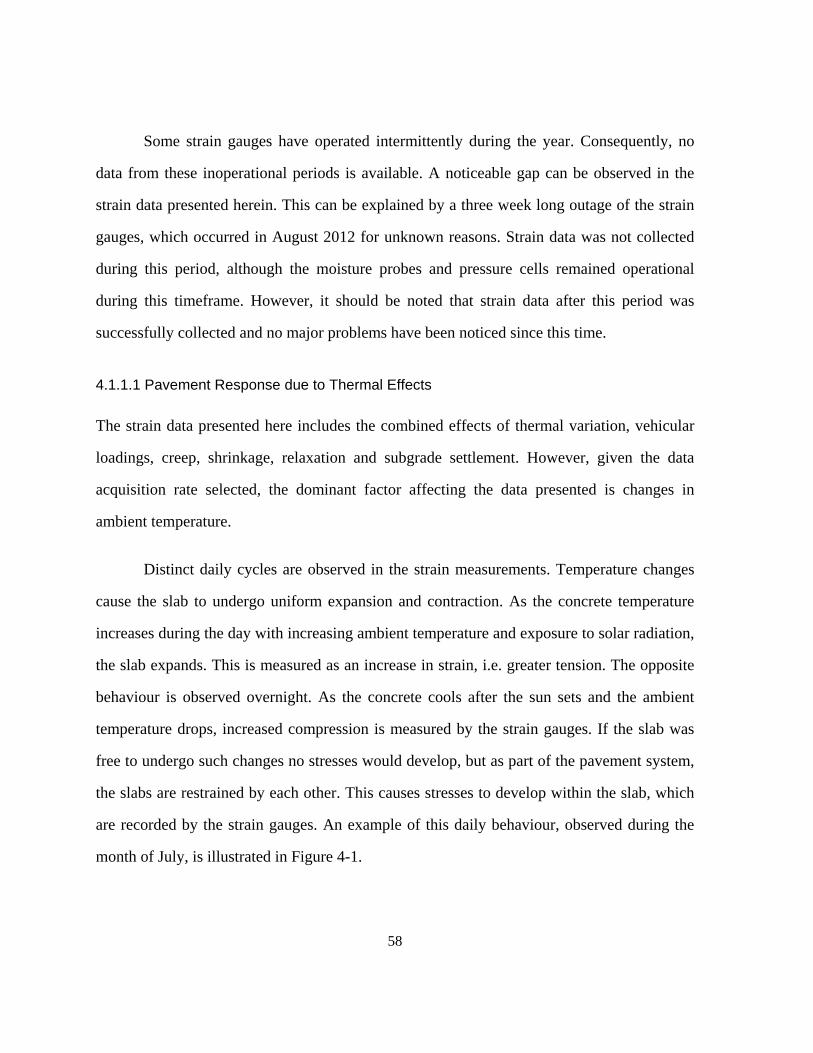
58
Some strain gauges have operated intermittently during the year. Consequently, no
data from these inoperational periods is available. A noticeable gap can be observed in the
strain data presented herein. This can be explained by a three week long outage of the strain
gauges, which occurred in August 2012 for unknown reasons. Strain data was not collected
during this period, although the moisture probes and pressure cells remained operational
during this timeframe. However, it should be noted that strain data after this period was
successfully collected and no major problems have been noticed since this time.
4.1.1.1 Pavement Response due to Thermal Effects
The strain data presented here includes the combined effects of thermal variation, vehicular
loadings, creep, shrinkage, relaxation and subgrade settlement. However, given the data
acquisition rate selected, the dominant factor affecting the data presented is changes in
ambient temperature.
Distinct daily cycles are observed in the strain measurements. Temperature changes
cause the slab to undergo uniform expansion and contraction. As the concrete temperature
increases during the day with increasing ambient temperature and exposure to solar radiation,
the slab expands. This is measured as an increase in strain, i.e. greater tension. The opposite
behaviour is observed overnight. As the concrete cools after the sun sets and the ambient
temperature drops, increased compression is measured by the strain gauges. If the slab was
free to undergo such changes no stresses would develop, but as part of the pavement system,
the slabs are restrained by each other. This causes stresses to develop within the slab, which
are recorded by the strain gauges. An example of this daily behaviour, observed during the
month of July, is illustrated in Figure 4-1.
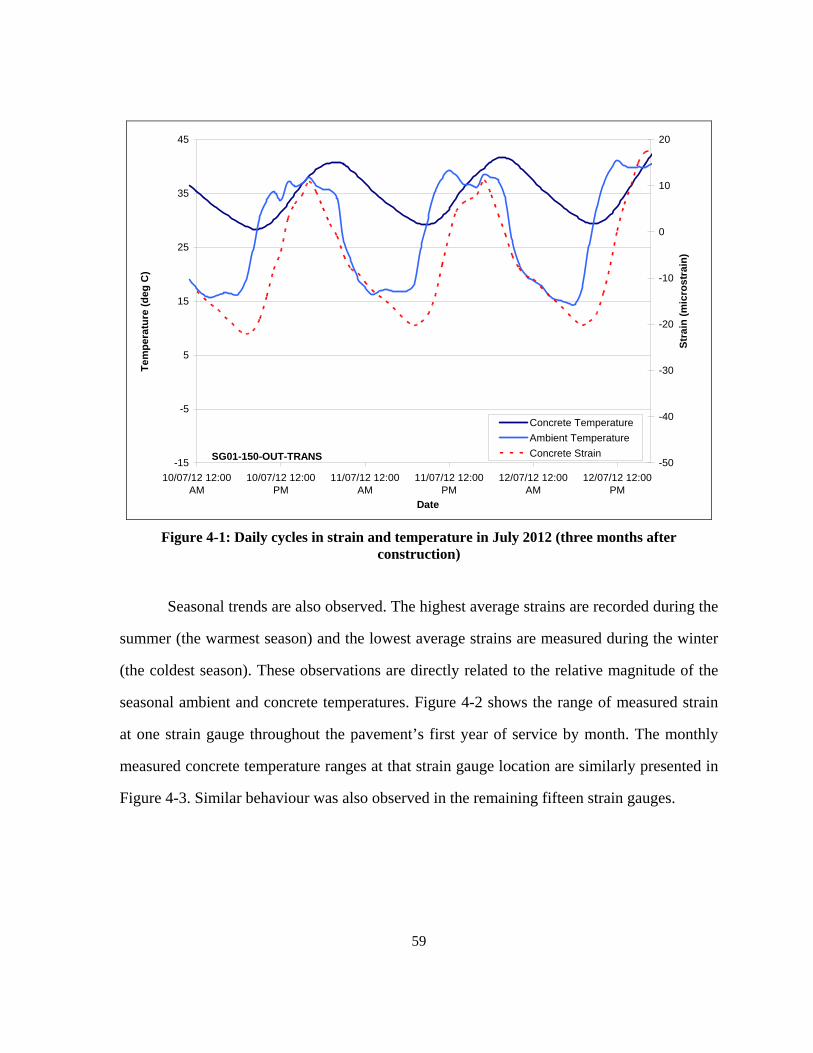
59
-15
-5
5
15
25
35
45
10/07/12 12:00AM
10/07/12 12:00PM
11/07/12 12:00AM
11/07/12 12:00PM
12/07/12 12:00AM
12/07/12 12:00PM
Date
Te
mp
era
ture
(d
eg C
)
-50
-40
-30
-20
-10
0
10
20
Str
ain
(m
icro
str
ain
)
Concrete Temperature
Ambient Temperature
Concrete StrainSG01-150-OUT-TRANS
Figure 4-1: Daily cycles in strain and temperature in July 2012 (three months after construction)
Seasonal trends are also observed. The highest average strains are recorded during the
summer (the warmest season) and the lowest average strains are measured during the winter
(the coldest season). These observations are directly related to the relative magnitude of the
seasonal ambient and concrete temperatures. Figure 4-2 shows the range of measured strain
at one strain gauge throughout the pavement’s first year of service by month. The monthly
measured concrete temperature ranges at that strain gauge location are similarly presented in
Figure 4-3. Similar behaviour was also observed in the remaining fifteen strain gauges.
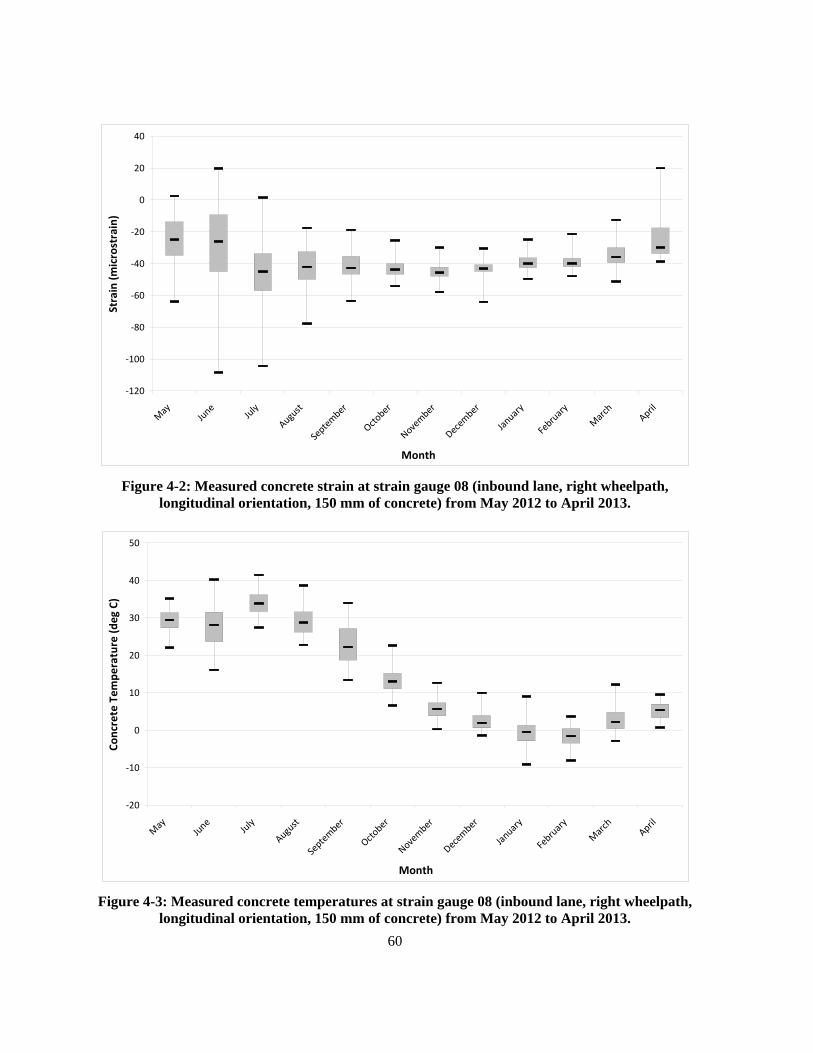
60
‐120
‐100
‐80
‐60
‐40
‐20
0
20
40
May
June Ju
ly
August
September
October
November
December
January
February
March
April
Month
Strain (microstrain)
Figure 4-2: Measured concrete strain at strain gauge 08 (inbound lane, right wheelpath, longitudinal orientation, 150 mm of concrete) from May 2012 to April 2013.
‐20
‐10
0
10
20
30
40
50
May
June Ju
ly
August
September
October
November
December
January
February
March
April
Month
Concrete Tem
perature (deg
C)
Figure 4-3: Measured concrete temperatures at strain gauge 08 (inbound lane, right wheelpath, longitudinal orientation, 150 mm of concrete) from May 2012 to April 2013.
61
In addition to the largest strain magnitudes, the summer season also brings the
greatest variability in strain measurements. This observation is due to the fact that the largest
daily ranges in ambient and, correspondingly, concrete temperatures are recorded during the
summer. In July 2012, at age two months, the greatest difference between the highest and
lowest daily concrete temperatures exceeded 28°C. On other hand, the strains measured
during the winter are much more consistent throughout a 24 hour period, which results in
much less fluctuation in strain measurements. In December 2012, after seven months in
service, the average daily change in concrete temperature was only 7°C.
For the majority of the year, the measured strains at all sensors remain compressive,
as seen in Figure 4-4. This behaviour is expected in dome shaped structures. Both the hoop
forces and the meridional forces at the top of any stable dome are compressive (Schodek and
Bechthold 2008). The highest concrete temperatures recorded in the summer (>35°C) have
induced low positive (tensile) strains, no greater than 50 microstrain. However, these highest
tensile values remain well below the anticipated tensile cracking threshold, which lies in the
range of 100 to 200 microstrain (Neville 1995).
The fact that the measured strains at the top of the dome are compressive is
encouraging. The dome shape of the Cupolex® ensures that the stresses at the location with
the thinnest concrete remain compressive almost always. By virtually eliminating the tensile
stresses, the possibility of cracks forming, particularly due to fatigue effects, is very low. It
can also be noted from Figure 4-4 that the annual variability in strain remains fairly low as
well. In 75% of the strain gauges, the interquartile range for strain is 25 microstrain or less,
throughout the year, i.e. 50% of all annual measured strains throughout the year are within a
range of 25 microstrain. This shows that the total change in strain is minimal and suggests
that chances of fatigue failure are lessened. Although the annual range of strains for SG08
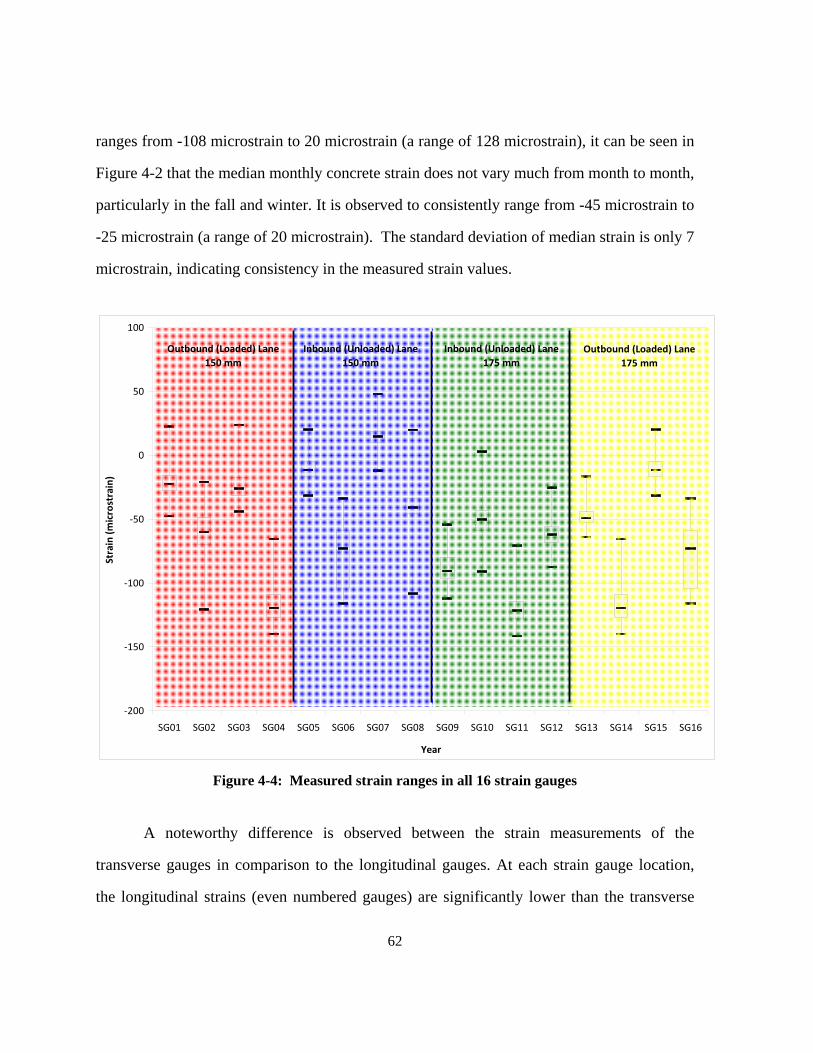
62
ranges from -108 microstrain to 20 microstrain (a range of 128 microstrain), it can be seen in
Figure 4-2 that the median monthly concrete strain does not vary much from month to month,
particularly in the fall and winter. It is observed to consistently range from -45 microstrain to
-25 microstrain (a range of 20 microstrain). The standard deviation of median strain is only 7
microstrain, indicating consistency in the measured strain values.
‐200
‐150
‐100
‐50
0
50
100
SG01 SG02 SG03 SG04 SG05 SG06 SG07 SG08 SG09 SG10 SG11 SG12 SG13 SG14 SG15 SG16
Year
Strain (microstrain)
Outbound (Loaded) Lane
150 mm
Inbound (Unloaded) Lane
150 mm
Inbound (Unloaded) Lane
175 mm
Outbound (Loaded) Lane
175 mm
Figure 4-4: Measured strain ranges in all 16 strain gauges
A noteworthy difference is observed between the strain measurements of the
transverse gauges in comparison to the longitudinal gauges. At each strain gauge location,
the longitudinal strains (even numbered gauges) are significantly lower than the transverse

63
strains (odd numbered gauges), indicating greater compression. The difference in these
results is being attributed to the edge restraint in the longitudinal direction, resulting in the
observed variation. The strain gauges are all located in the right wheelpath of the lane, within
300 mm of the edge of the pavement. The outside of edge of pavement is essentially a free
edge and allows for thermal expansion with less resisting forces. On the other hand, the
longitudinal gauges all have at least 20 metres of concrete pavement on either side, providing
significantly more restraint and reducing the amount of allowable slab movement in that
direction. This additional restraint results in greater compression being measured by the
strain gauges. One notable exception is observed in the 175 mm section of the inbound lane.
Both strain gauges in this section, the measured transverse strains are greater than the
longitudinal strains.
Although the two pavement structural designs constructed as part of this experiment
only vary slightly, a difference is observed in the measured strains, as shown in Figure 4-4.
In general, the strains measured in the 175 mm pavement section are lower than the 150 mm
concrete section. It appears that the additional 25 mm of concrete thickness provides
appreciable stiffness to the slab. The concrete temperatures do not vary significantly between
the two concrete sections, so it seems like the additional concrete does not provide much
additional insulation to reduce the strain variations.
Furthermore, differences between the strains measured by the strain gauges oriented
parallel to the roadway centreline (even numbered gauges) and the strains measured by the
strains gauges oriented perpendicular to the centreline (odd numbered gauges) are observed.
The even numbered sensors record slightly lower strains. This difference is believed to be
attributable to the level of available edge restraint. The strain gauges are all located in the
outside wheelpath. The gravel shoulder is believed to provide less restraint and thus, permits
64
the concrete to expand more. Accordingly, the odd numbered gauges would record greater
strain values. The one exception to this trend is found in the 175 mm section of unloaded
lane, where the opposite trend is observed.
4.1.1.2 Pavement Response due to Vehicular Loading
The hourly data acquisition rate selected for the strain gauges is not able to capture the
effects of traffic loads. Furthermore, even with a much faster data acquisition rate, vibrating
wire strain gauges are not capable of capturing the effects of dynamic loads, due to their slow
adjustment rate.
In order to quantify the pavement response due to vehicular loadings, testing was
performed using a static, fully loaded tridem dump truck weighing 16615 kilograms (36630
pounds) in August 2012. Each of the dump truck’s four axles was parked over a strain gauge
location for a short period of time, allowing the static strain gauges to adjust and measure the
load effects of the stopped trucks. The testing was repeated for each axle at each of the four
strain gauge locations in the outbound lane.
The results of this testing revealed that external traffic loads have a minimal impact
on the measured strain in the concrete. In all cases, the measured strain decreased slightly,
indicating greater compression, with the application of each axle load. These variations
ranged from a minimum change of -0.3 microstrain for the steering axle (the lightest axle) to
a maximum change of -2.7 microstrain for middle rear axle (the most heavily loaded axle).
Given that the daily change in strain during the spring can exceed 50 microstrain
during a 24 hour period, the impact from vehicular loading is almost insignificant. The
changes in strain induced by static axle loads only make up 5% of the daily thermal strain
variation.
65
The impact of dynamic truck loads, i.e. moving at highway speeds, is expected to be
even less. The moving loads are removed as fast as they are applied. Furthermore, the vehicle
used for static testing approaches the legal load limit in Ontario. The majority of vehicles
travelling on public roads and highways weigh significantly less, further reducing the impact
of vehicular loads.
4.1.1.3 Strain-Temperature Regression Analysis
The major factor influencing strains has been identified as temperature. The relationship
between concrete temperature (as measured by the strain’s gauge integrated thermistor) and
the measured strain reading was compared. Linear regression analysis was performed to
quantify the relationship between these two variables. The temperature-strain data for each
sensors have been plotted below. The data from the 150 mm section concrete pavement
(SG01-SG08) is presented in Figure 4-5, while the data from the 175 mm concrete pavement
section (SG09-SG16) is presented in Figure 4-6. The linear lines of best fit have also been
drawn on those plots.
In general, a positive relationship between temperature and strain is observed. This
observation is consistent with the expected behaviour. The concept of thermal expansion
suggests that as the concrete temperature increases, it experiences a corresponding increase
in volume, which is captured as an increase in strain by the sensor, i.e. greater tension.
However, in some cases, such as strain gauges 04 and 07, the data is very scattered which
results in a near zero slope relation output from the regression analysis. A negative
temperature-strain in SG02, where the data indicates that strains decrease with decreasing
temperature. This observation defies established theories regarding thermal behaviour of
materials.
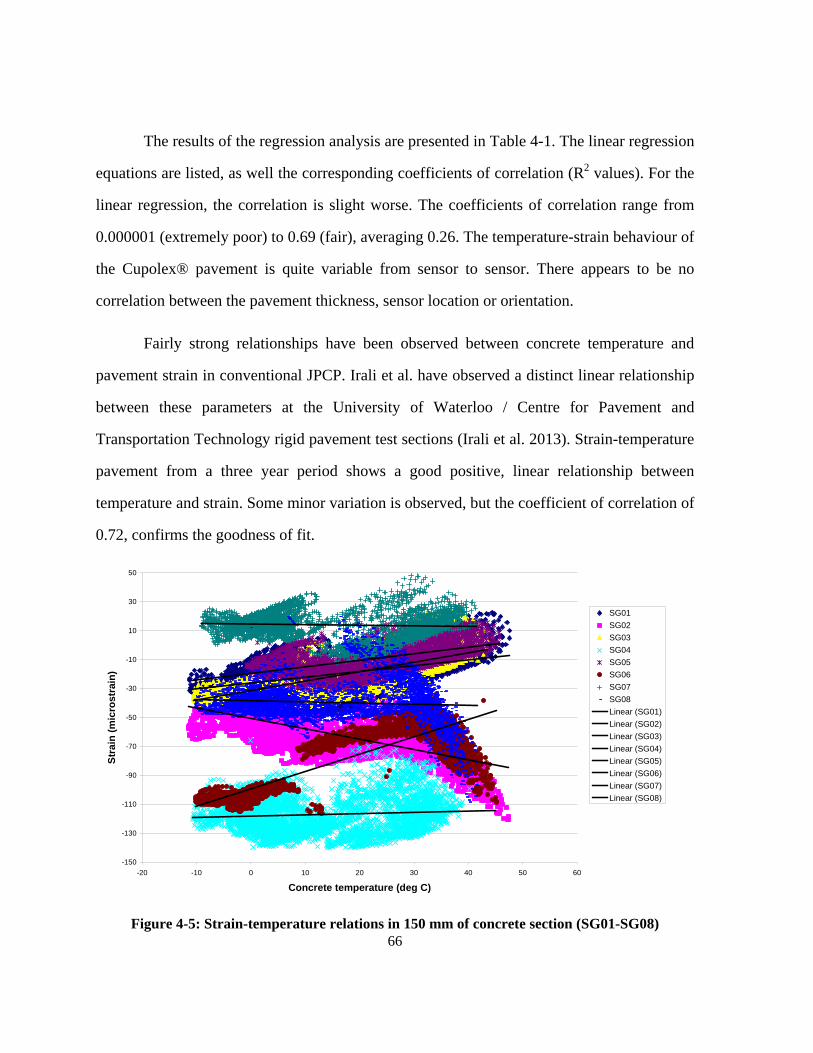
66
The results of the regression analysis are presented in Table 4-1. The linear regression
equations are listed, as well the corresponding coefficients of correlation (R2 values). For the
linear regression, the correlation is slight worse. The coefficients of correlation range from
0.000001 (extremely poor) to 0.69 (fair), averaging 0.26. The temperature-strain behaviour of
the Cupolex® pavement is quite variable from sensor to sensor. There appears to be no
correlation between the pavement thickness, sensor location or orientation.
Fairly strong relationships have been observed between concrete temperature and
pavement strain in conventional JPCP. Irali et al. have observed a distinct linear relationship
between these parameters at the University of Waterloo / Centre for Pavement and
Transportation Technology rigid pavement test sections (Irali et al. 2013). Strain-temperature
pavement from a three year period shows a good positive, linear relationship between
temperature and strain. Some minor variation is observed, but the coefficient of correlation of
0.72, confirms the goodness of fit.
-150
-130
-110
-90
-70
-50
-30
-10
10
30
50
-20 -10 0 10 20 30 40 50 60
Concrete temperature (deg C)
Str
ain
(m
icro
stra
in)
SG01
SG02
SG03
SG04
SG05
SG06
SG07
SG08
Linear (SG01)
Linear (SG02)
Linear (SG03)
Linear (SG04)
Linear (SG05)
Linear (SG06)
Linear (SG07)
Linear (SG08)
Figure 4-5: Strain-temperature relations in 150 mm of concrete section (SG01-SG08)
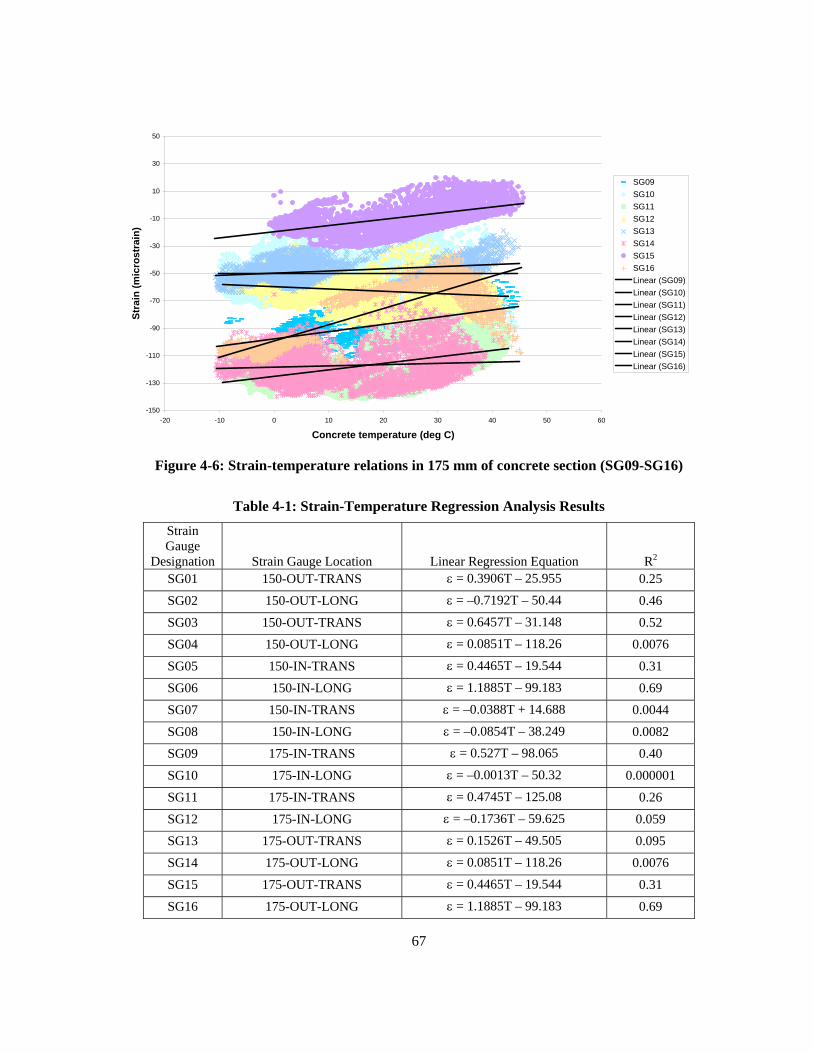
67
-150
-130
-110
-90
-70
-50
-30
-10
10
30
50
-20 -10 0 10 20 30 40 50 60
Concrete temperature (deg C)
Str
ain
(m
icro
str
ain
)
SG09
SG10
SG11
SG12
SG13
SG14
SG15
SG16
Linear (SG09)
Linear (SG10)
Linear (SG11)
Linear (SG12)
Linear (SG13)
Linear (SG14)
Linear (SG15)
Linear (SG16)
Figure 4-6: Strain-temperature relations in 175 mm of concrete section (SG09-SG16)
Table 4-1: Strain-Temperature Regression Analysis Results
Strain Gauge
Designation Strain Gauge Location Linear Regression Equation R2 SG01 150-OUT-TRANS = 0.3906T – 25.955 0.25
SG02 150-OUT-LONG = –0.7192T – 50.44 0.46
SG03 150-OUT-TRANS = 0.6457T – 31.148 0.52
SG04 150-OUT-LONG = 0.0851T – 118.26 0.0076
SG05 150-IN-TRANS = 0.4465T – 19.544 0.31
SG06 150-IN-LONG = 1.1885T – 99.183 0.69
SG07 150-IN-TRANS = –0.0388T + 14.688 0.0044
SG08 150-IN-LONG = –0.0854T – 38.249 0.0082
SG09 175-IN-TRANS = 0.527T – 98.065 0.40
SG10 175-IN-LONG = –0.0013T – 50.32 0.000001
SG11 175-IN-TRANS = 0.4745T – 125.08 0.26
SG12 175-IN-LONG = –0.1736T – 59.625 0.059
SG13 175-OUT-TRANS = 0.1526T – 49.505 0.095
SG14 175-OUT-LONG = 0.0851T – 118.26 0.0076
SG15 175-OUT-TRANS = 0.4465T – 19.544 0.31
SG16 175-OUT-LONG = 1.1885T – 99.183 0.69
68
4.1.2 Pressure Cell Evaluation
4.1.2.1 General Pressure Cell Trends
The pressure data obtained from both pressure cells between May 2012 and April 2013 is
presented in Figure 4-7. A gradual increase in pressure is observed in the pressure cell under
the foot (PC01) from May 2012 until approximately late December 2012. After that period,
the measured pressure levels off to a certain degree, in the range of 35 kPa. It should be noted
that the vibrating wire type earth pressure cells are sensitive to temperature changes, which
results in the “noisiness” seen in Figure 4-7. Temperature changes result in changes in fluid
pressure in closed hydraulic systems such as these, which influence the pressure reading.
Temperature corrections have been applied, but this does not completely eliminate the
problem.
The data from the pressure cell in the void (PC02) was particularly noisy for the first
three and a half months. Seeing this was not observed in the other pressure cell, it is believed
that some external factor, such as a loose connection or electrical interference, was affecting
the pressure cell readings. In early September 2012, this pressure cell’s readings became
more consistent. A gradual increase was observed until the month of December, at which
point the measured pressures remain fairly consistent in the range of 7 kPa.
The peaks recorded in base pressures occurred during the month of January at an age
of seven months. At this point, the unbound soil layers were frozen. The frozen soils would
have had significantly more stiffness than unfrozen materials. The frozen materials would
have provided additional support to the buried pressure cell. Under the same consistent dead
load, the measured pressure would be higher due to this fact.
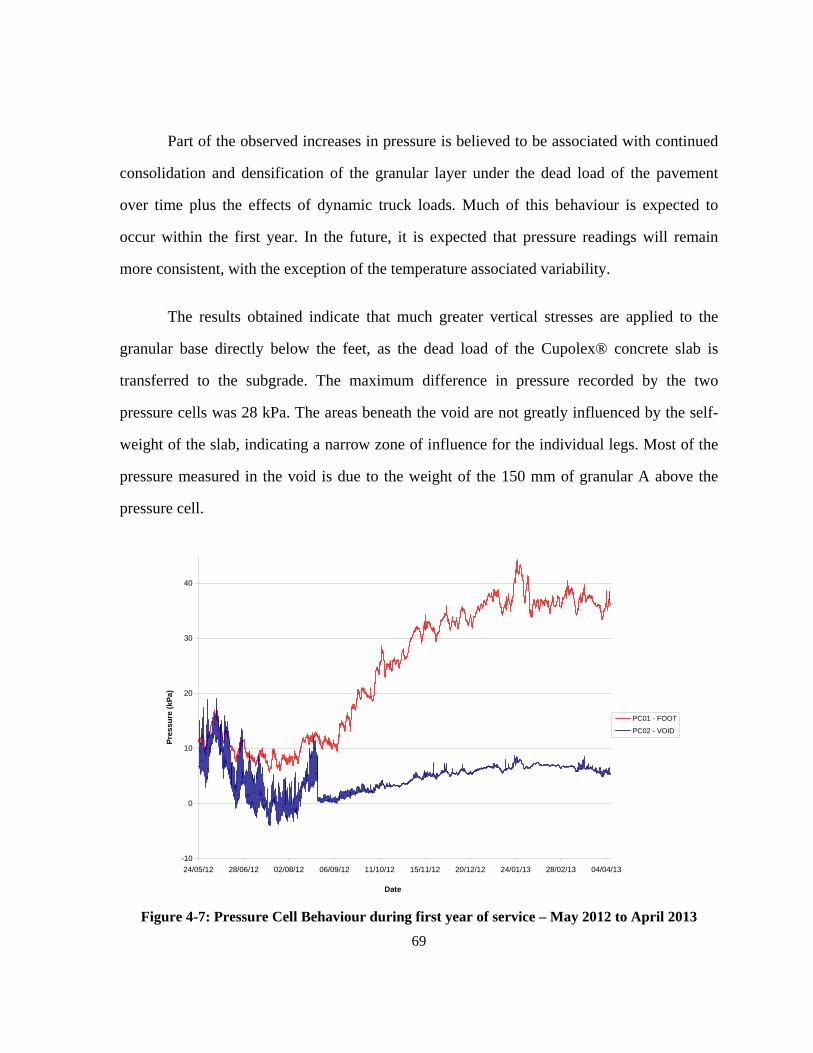
69
Part of the observed increases in pressure is believed to be associated with continued
consolidation and densification of the granular layer under the dead load of the pavement
over time plus the effects of dynamic truck loads. Much of this behaviour is expected to
occur within the first year. In the future, it is expected that pressure readings will remain
more consistent, with the exception of the temperature associated variability.
The results obtained indicate that much greater vertical stresses are applied to the
granular base directly below the feet, as the dead load of the Cupolex® concrete slab is
transferred to the subgrade. The maximum difference in pressure recorded by the two
pressure cells was 28 kPa. The areas beneath the void are not greatly influenced by the self-
weight of the slab, indicating a narrow zone of influence for the individual legs. Most of the
pressure measured in the void is due to the weight of the 150 mm of granular A above the
pressure cell.
-10
0
10
20
30
40
24/05/12 28/06/12 02/08/12 06/09/12 11/10/12 15/11/12 20/12/12 24/01/13 28/02/13 04/04/13
Date
Pre
ssu
re (
kPa)
PC01 - FOOT
PC02 - VOID
Figure 4-7: Pressure Cell Behaviour during first year of service – May 2012 to April 2013
70
4.1.2.2 Pressure Cell Response to Static Vehicular Loads
The vibrating wire type strain gauges are not designed to measure the effects of dynamic
loads, such as moving vehicles. In order to evaluate the effects of traffic loads on the base
pressures, a static testing program was devised. In August 2012, testing was performed over
top of the buried pressure cells using a tridem dump truck having a gross weight of 36 000
lbs. Each of the dump truck’s axles was parked over top of the pressure cell location for a
few minutes, allowing the pressure cell to respond to the applied load. Pressure
measurements were recorded for each test.
Conventional concrete pavements, such as jointed plain concrete pavements, can
distribute loads over a large area. However, with Cupolex®, the concrete slab rests on
individual “feet”. This design elicits concerns about the application of very high point loads
to the underlying pavement layers. Concentrated point loads can cause the overconsolidation,
as well as the settlement of the base and subgrade, if these layers are overstressed.
Differential action can induce high stresses in the concrete, which is then susceptible to
cracking if the tensile flexural stresses induced are greater than the concrete’s modulus of
rupture.
The key results obtained from the steering axle test are presented in Figure 4-8. A tire
load of approximately 13 kN was applied directly over top of the “foot” located above the
pressure cell location. The bearing area of each “foot” is approximately 150 cm2. The
application of the external load resulted in an increase in pressure of 1.3 kPa in PC01
(located under the foot) and 1.1 kPa (located in the void directly adjacent to the loaded foot).
Recall that both pressure cells are located 150 mm below the top of the base layer. If the tire
load had directly traveled from the point of application to the base layer, an increase in
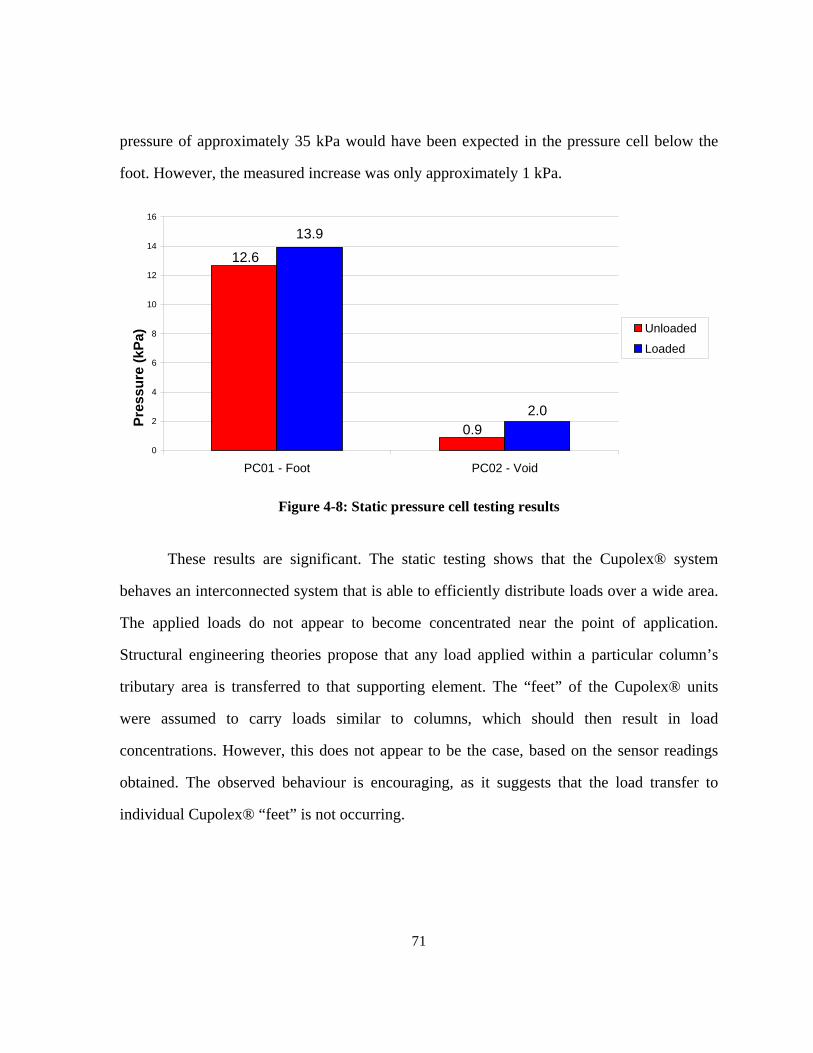
71
pressure of approximately 35 kPa would have been expected in the pressure cell below the
foot. However, the measured increase was only approximately 1 kPa.
12.6
0.9
13.9
2.0
0
2
4
6
8
10
12
14
16
PC01 - Foot PC02 - Void
Pre
ssu
re (
kPa)
Unloaded
Loaded
Figure 4-8: Static pressure cell testing results
These results are significant. The static testing shows that the Cupolex® system
behaves an interconnected system that is able to efficiently distribute loads over a wide area.
The applied loads do not appear to become concentrated near the point of application.
Structural engineering theories propose that any load applied within a particular column’s
tributary area is transferred to that supporting element. The “feet” of the Cupolex® units
were assumed to carry loads similar to columns, which should then result in load
concentrations. However, this does not appear to be the case, based on the sensor readings
obtained. The observed behaviour is encouraging, as it suggests that the load transfer to
individual Cupolex® “feet” is not occurring.
72
4.1.3 Moisture Probes
Although the concrete slab is the primary load carrying component of a rigid pavement
system, the underlying layers also play an important role is providing support. The unbound
granular layers and the subgrade material are moisture sensitive. High moisture contents
results in a loss of strength, which can have many consequences, including settlement and
pumping.
4.1.3.1 Data collection issues
Initially, some problems were encountered with the moisture probes, due to a wiring issue.
Soil moisture data was collected intermittently until the problem was resolved in late
September 2012 and full, reliable connectivity was achieved.
4.1.3.2 Rain Events and Soil Moisture Content
Figure 4-9 plots the volumetric water content of the granular layer of each of the four
moisture probes on a timescale. Daily precipitation totals, obtained from Environment
Canada’s meteorological station at Lester B. Pearson International Airport in Toronto,
Ontario (approximately 30 kilometres away), are also plotted on the same timescale. The
measured water contents range from 9% to 58%, averaging 25%. In total, 57 precipitation
events were recorded during the time interval presented. An average of 5 mm of precipitation
fell during each rain event, however, one day with 30 mm of rainfall was recorded in January
2013. It is observed that the similar trends are observed at each moisture probe location.
As noted earlier, the moisture probes buried 150 mm below grade typically measure
higher water contents by a few percent than the sensors buried 300 mm below grade, with
few exceptions. Very similar trends in water content are observed at both moisture probe
locations. The curves for the shallow sensor and the deep sensor have almost identical slopes
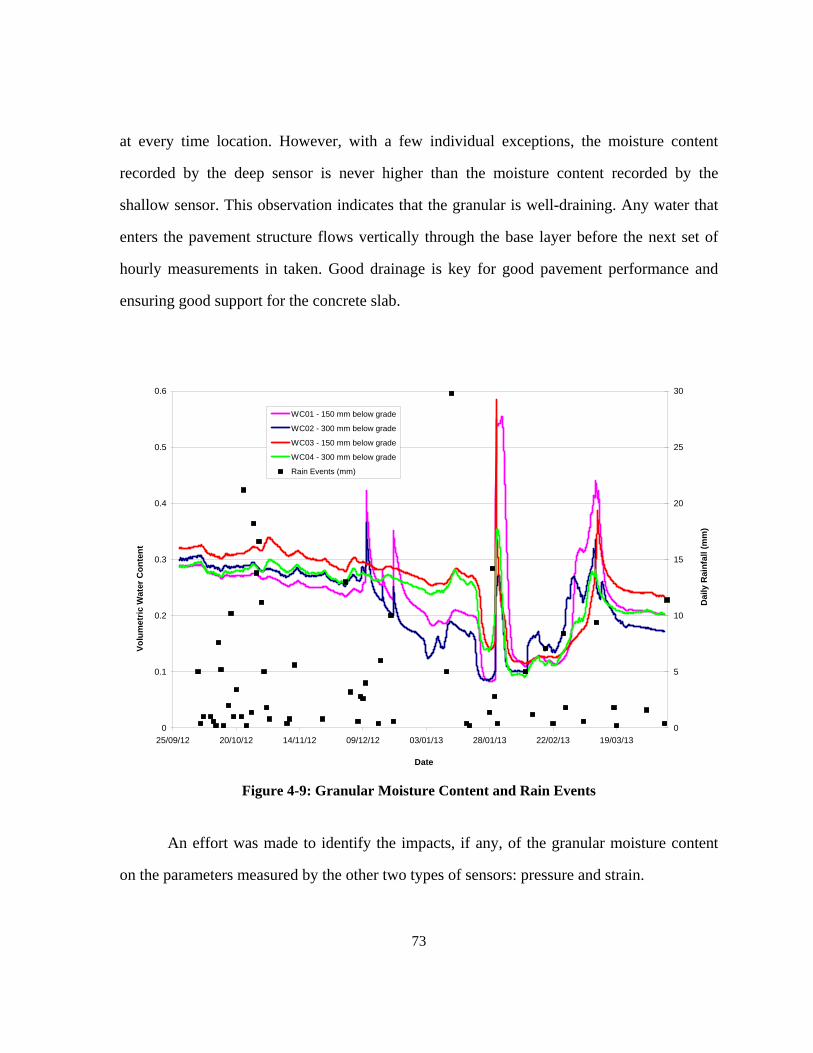
73
at every time location. However, with a few individual exceptions, the moisture content
recorded by the deep sensor is never higher than the moisture content recorded by the
shallow sensor. This observation indicates that the granular is well-draining. Any water that
enters the pavement structure flows vertically through the base layer before the next set of
hourly measurements in taken. Good drainage is key for good pavement performance and
ensuring good support for the concrete slab.
0
0.1
0.2
0.3
0.4
0.5
0.6
25/09/12 20/10/12 14/11/12 09/12/12 03/01/13 28/01/13 22/02/13 19/03/13
Date
Vo
lum
etri
c W
ater
Co
nte
nt
0
5
10
15
20
25
30
Dai
ly R
ain
fall
(mm
)
WC01 - 150 mm below grade
WC02 - 300 mm below grade
WC03 - 150 mm below grade
WC04 - 300 mm below grade
Rain Events (mm)
Figure 4-9: Granular Moisture Content and Rain Events
An effort was made to identify the impacts, if any, of the granular moisture content
on the parameters measured by the other two types of sensors: pressure and strain.
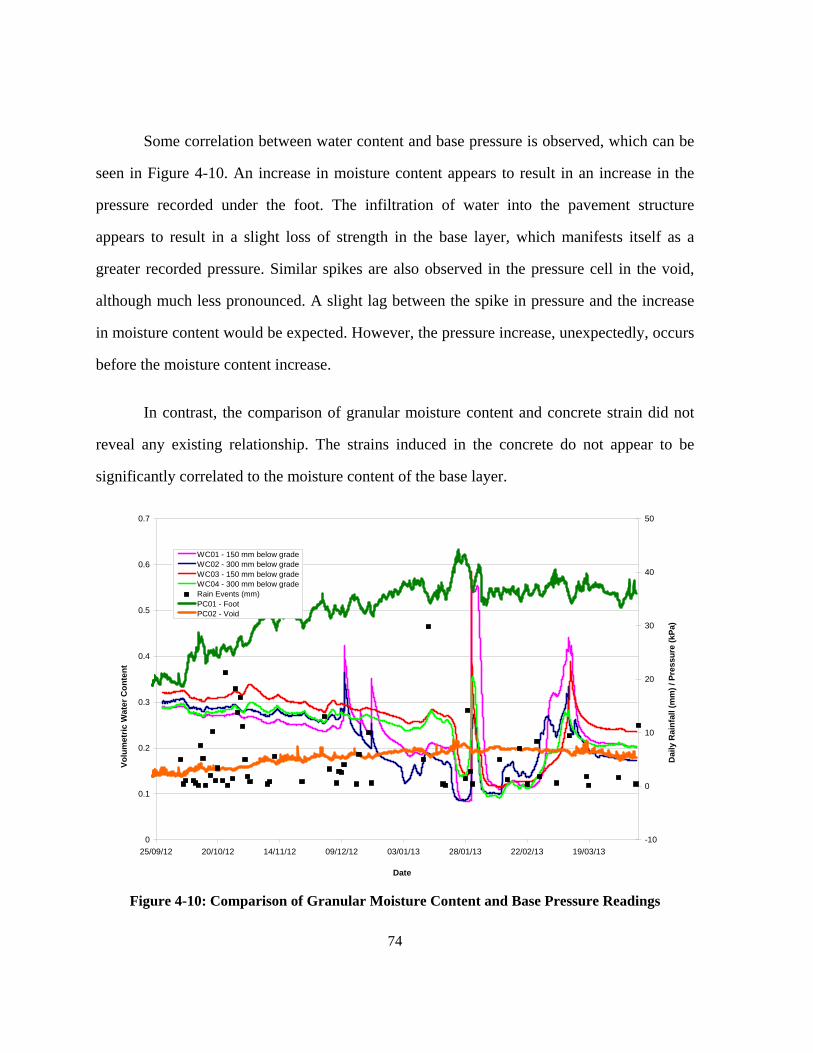
74
Some correlation between water content and base pressure is observed, which can be
seen in Figure 4-10. An increase in moisture content appears to result in an increase in the
pressure recorded under the foot. The infiltration of water into the pavement structure
appears to result in a slight loss of strength in the base layer, which manifests itself as a
greater recorded pressure. Similar spikes are also observed in the pressure cell in the void,
although much less pronounced. A slight lag between the spike in pressure and the increase
in moisture content would be expected. However, the pressure increase, unexpectedly, occurs
before the moisture content increase.
In contrast, the comparison of granular moisture content and concrete strain did not
reveal any existing relationship. The strains induced in the concrete do not appear to be
significantly correlated to the moisture content of the base layer.
0
0.1
0.2
0.3
0.4
0.5
0.6
0.7
25/09/12 20/10/12 14/11/12 09/12/12 03/01/13 28/01/13 22/02/13 19/03/13
Date
Vo
lum
etri
c W
ater
Co
nte
nt
-10
0
10
20
30
40
50
Dai
ly R
ain
fall
(mm
) / P
ress
ure
(kP
a)
WC01 - 150 mm below gradeWC02 - 300 mm below gradeWC03 - 150 mm below gradeWC04 - 300 mm below gradeRain Events (mm)PC01 - FootPC02 - Void
Figure 4-10: Comparison of Granular Moisture Content and Base Pressure Readings
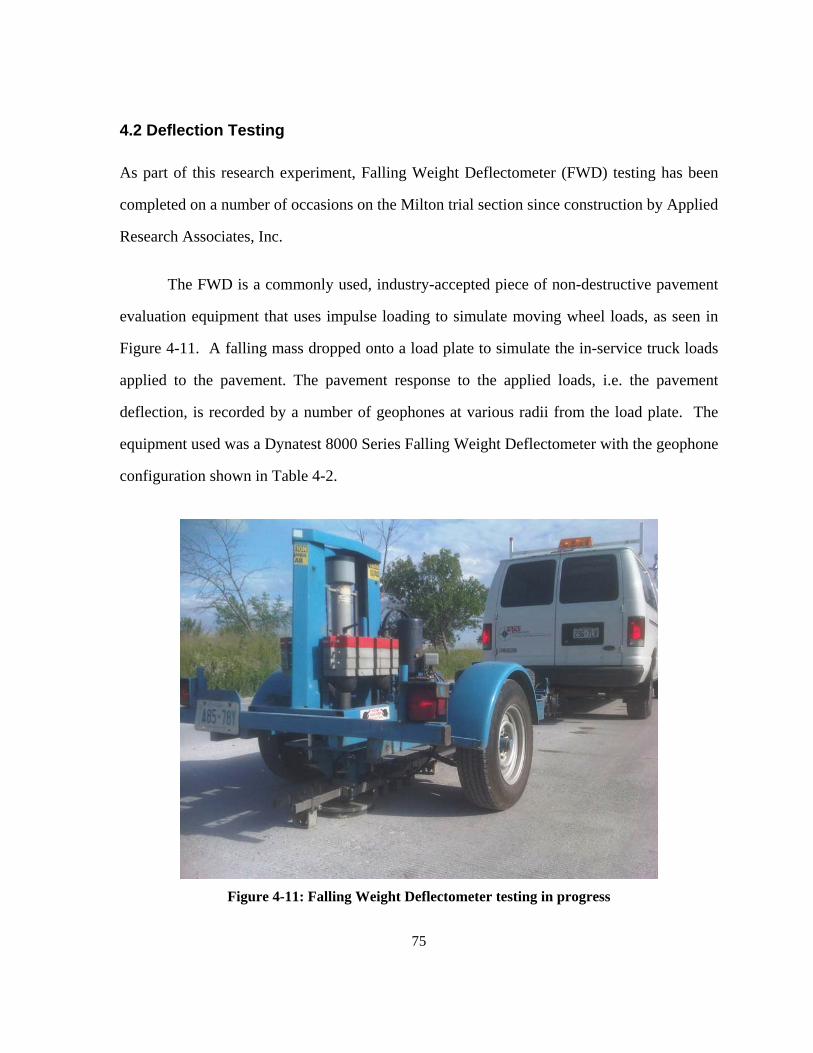
75
4.2 Deflection Testing
As part of this research experiment, Falling Weight Deflectometer (FWD) testing has been
completed on a number of occasions on the Milton trial section since construction by Applied
Research Associates, Inc.
The FWD is a commonly used, industry-accepted piece of non-destructive pavement
evaluation equipment that uses impulse loading to simulate moving wheel loads, as seen in
Figure 4-11. A falling mass dropped onto a load plate to simulate the in-service truck loads
applied to the pavement. The pavement response to the applied loads, i.e. the pavement
deflection, is recorded by a number of geophones at various radii from the load plate. The
equipment used was a Dynatest 8000 Series Falling Weight Deflectometer with the geophone
configuration shown in Table 4-2.
Figure 4-11: Falling Weight Deflectometer testing in progress
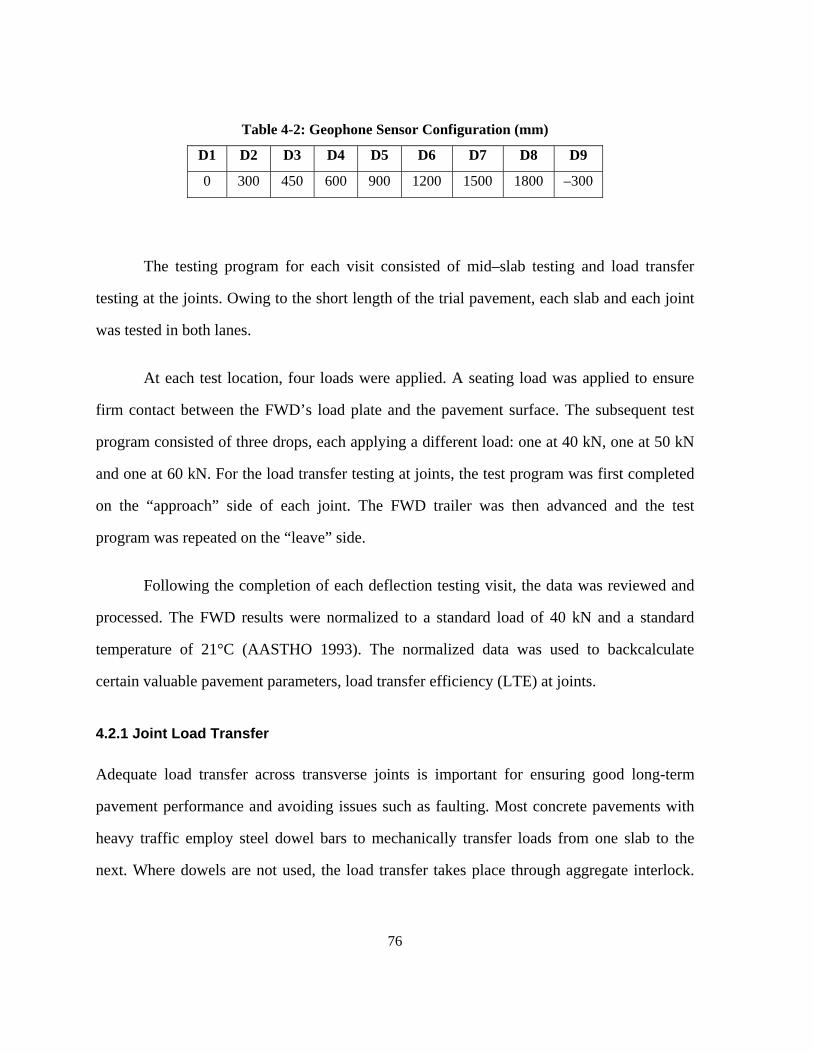
76
Table 4-2: Geophone Sensor Configuration (mm)
D1 D2 D3 D4 D5 D6 D7 D8 D9
0 300 450 600 900 1200 1500 1800 –300
The testing program for each visit consisted of mid–slab testing and load transfer
testing at the joints. Owing to the short length of the trial pavement, each slab and each joint
was tested in both lanes.
At each test location, four loads were applied. A seating load was applied to ensure
firm contact between the FWD’s load plate and the pavement surface. The subsequent test
program consisted of three drops, each applying a different load: one at 40 kN, one at 50 kN
and one at 60 kN. For the load transfer testing at joints, the test program was first completed
on the “approach” side of each joint. The FWD trailer was then advanced and the test
program was repeated on the “leave” side.
Following the completion of each deflection testing visit, the data was reviewed and
processed. The FWD results were normalized to a standard load of 40 kN and a standard
temperature of 21°C (AASTHO 1993). The normalized data was used to backcalculate
certain valuable pavement parameters, load transfer efficiency (LTE) at joints.
4.2.1 Joint Load Transfer
Adequate load transfer across transverse joints is important for ensuring good long-term
pavement performance and avoiding issues such as faulting. Most concrete pavements with
heavy traffic employ steel dowel bars to mechanically transfer loads from one slab to the
next. Where dowels are not used, the load transfer takes place through aggregate interlock.
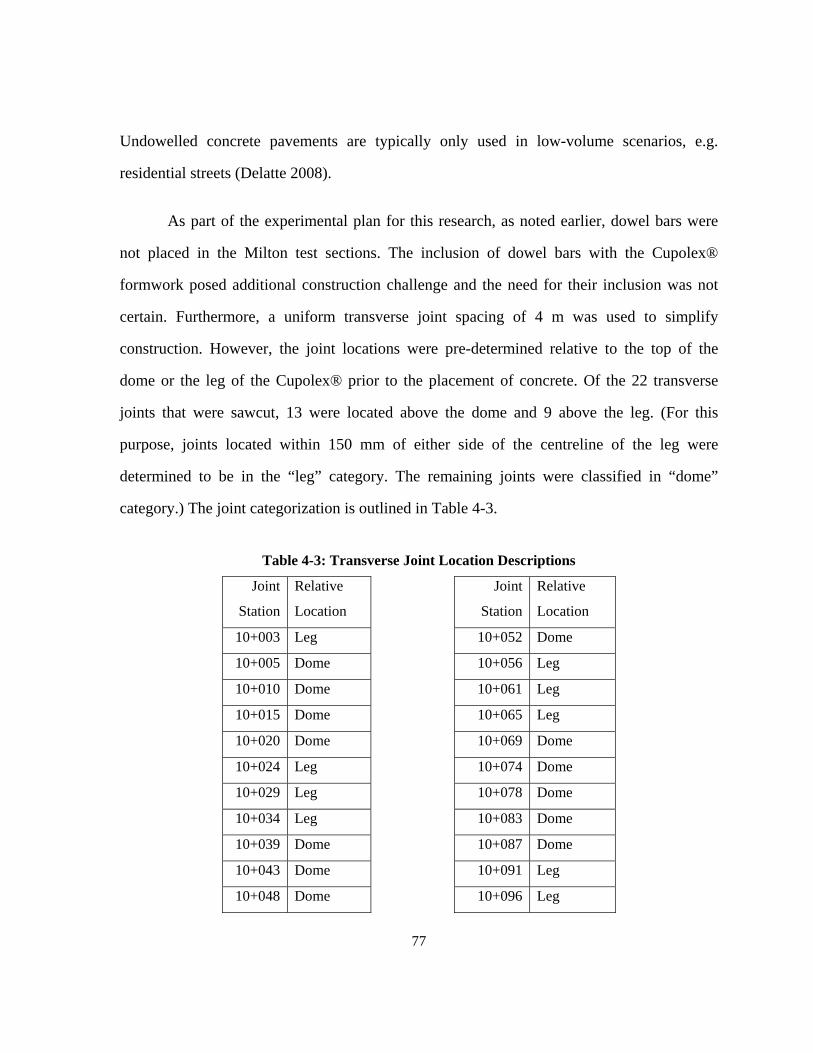
77
Undowelled concrete pavements are typically only used in low-volume scenarios, e.g.
residential streets (Delatte 2008).
As part of the experimental plan for this research, as noted earlier, dowel bars were
not placed in the Milton test sections. The inclusion of dowel bars with the Cupolex®
formwork posed additional construction challenge and the need for their inclusion was not
certain. Furthermore, a uniform transverse joint spacing of 4 m was used to simplify
construction. However, the joint locations were pre-determined relative to the top of the
dome or the leg of the Cupolex® prior to the placement of concrete. Of the 22 transverse
joints that were sawcut, 13 were located above the dome and 9 above the leg. (For this
purpose, joints located within 150 mm of either side of the centreline of the leg were
determined to be in the “leg” category. The remaining joints were classified in “dome”
category.) The joint categorization is outlined in Table 4-3.
Table 4-3: Transverse Joint Location Descriptions
Joint
Station
Relative
Location
Joint
Station
Relative
Location
10+003 Leg 10+052 Dome
10+005 Dome 10+056 Leg
10+010 Dome 10+061 Leg
10+015 Dome 10+065 Leg
10+020 Dome 10+069 Dome
10+024 Leg 10+074 Dome
10+029 Leg 10+078 Dome
10+034 Leg 10+083 Dome
10+039 Dome 10+087 Dome
10+043 Dome 10+091 Leg
10+048 Dome 10+096 Leg
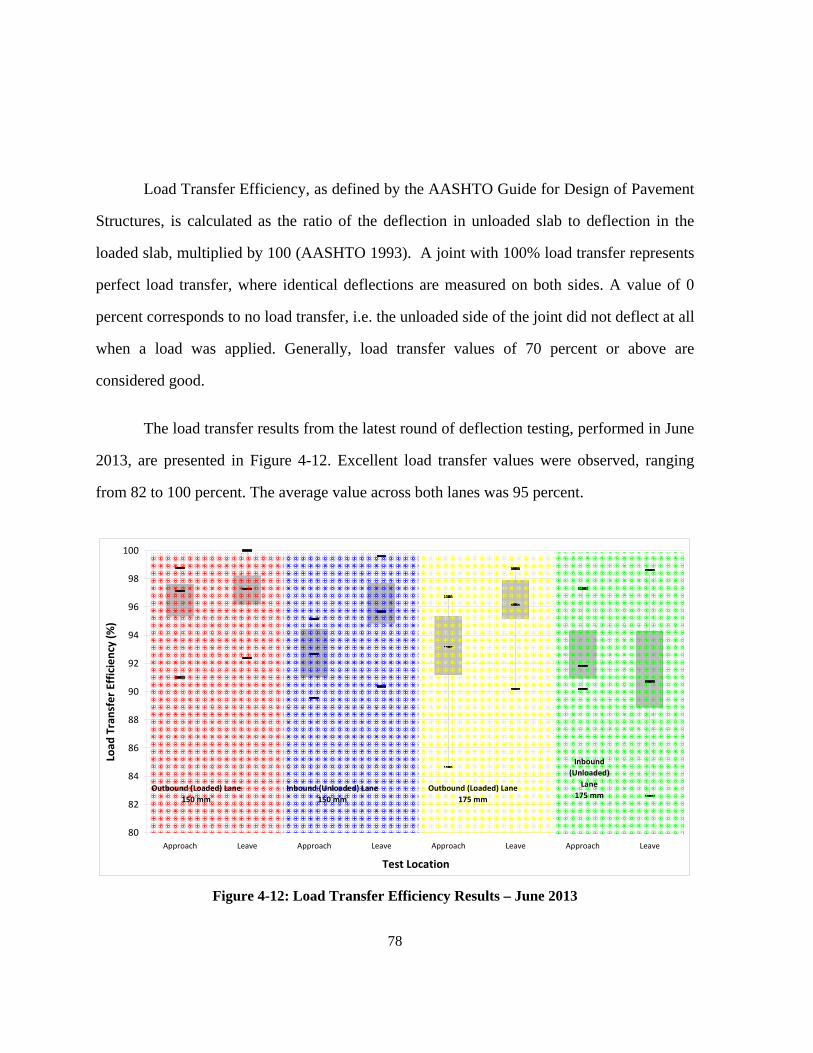
78
Load Transfer Efficiency, as defined by the AASHTO Guide for Design of Pavement
Structures, is calculated as the ratio of the deflection in unloaded slab to deflection in the
loaded slab, multiplied by 100 (AASHTO 1993). A joint with 100% load transfer represents
perfect load transfer, where identical deflections are measured on both sides. A value of 0
percent corresponds to no load transfer, i.e. the unloaded side of the joint did not deflect at all
when a load was applied. Generally, load transfer values of 70 percent or above are
considered good.
The load transfer results from the latest round of deflection testing, performed in June
2013, are presented in Figure 4-12. Excellent load transfer values were observed, ranging
from 82 to 100 percent. The average value across both lanes was 95 percent.
80
82
84
86
88
90
92
94
96
98
100
Approach Leave Approach Leave Approach Leave Approach Leave
Test Location
Load
Transfer Efficiency (%)
Outbound (Loaded) Lane
150 mm
Inbound (Unloaded) Lane
150 mm
Outbound (Loaded) Lane
175 mm
Inbound
(Unloaded)
Lane
175 mm
Figure 4-12: Load Transfer Efficiency Results – June 2013
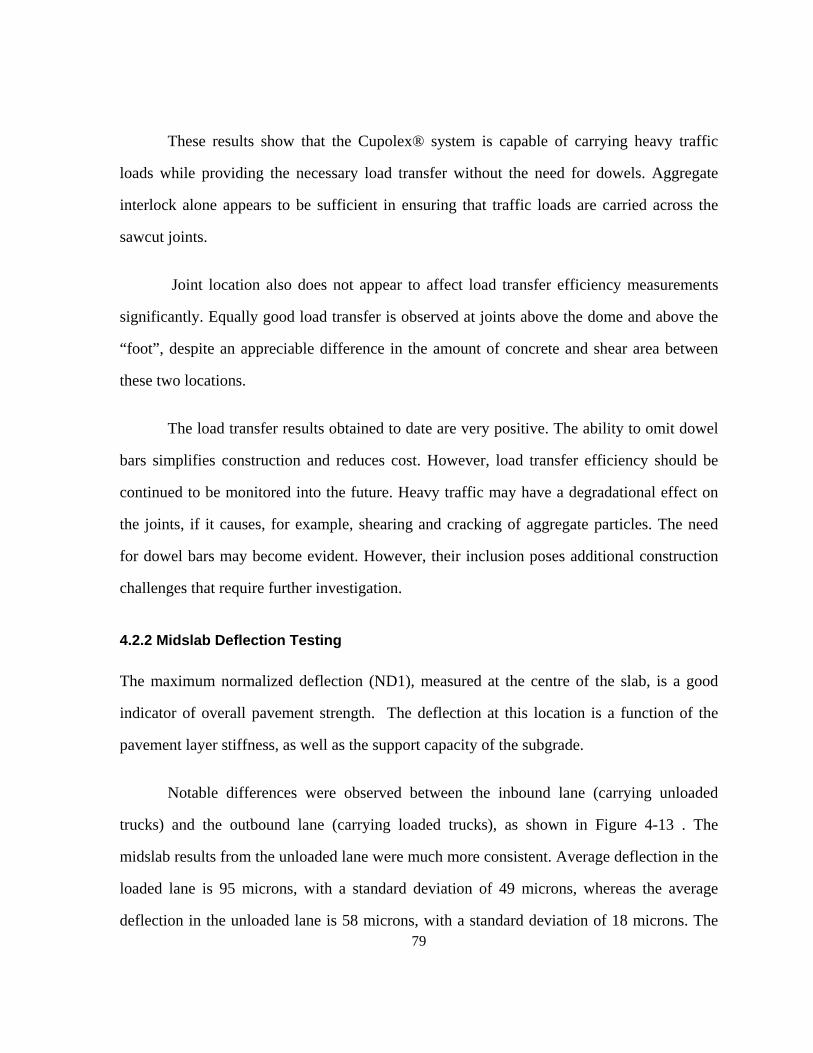
79
These results show that the Cupolex® system is capable of carrying heavy traffic
loads while providing the necessary load transfer without the need for dowels. Aggregate
interlock alone appears to be sufficient in ensuring that traffic loads are carried across the
sawcut joints.
Joint location also does not appear to affect load transfer efficiency measurements
significantly. Equally good load transfer is observed at joints above the dome and above the
“foot”, despite an appreciable difference in the amount of concrete and shear area between
these two locations.
The load transfer results obtained to date are very positive. The ability to omit dowel
bars simplifies construction and reduces cost. However, load transfer efficiency should be
continued to be monitored into the future. Heavy traffic may have a degradational effect on
the joints, if it causes, for example, shearing and cracking of aggregate particles. The need
for dowel bars may become evident. However, their inclusion poses additional construction
challenges that require further investigation.
4.2.2 Midslab Deflection Testing
The maximum normalized deflection (ND1), measured at the centre of the slab, is a good
indicator of overall pavement strength. The deflection at this location is a function of the
pavement layer stiffness, as well as the support capacity of the subgrade.
Notable differences were observed between the inbound lane (carrying unloaded
trucks) and the outbound lane (carrying loaded trucks), as shown in Figure 4-13 . The
midslab results from the unloaded lane were much more consistent. Average deflection in the
loaded lane is 95 microns, with a standard deviation of 49 microns, whereas the average
deflection in the unloaded lane is 58 microns, with a standard deviation of 18 microns. The
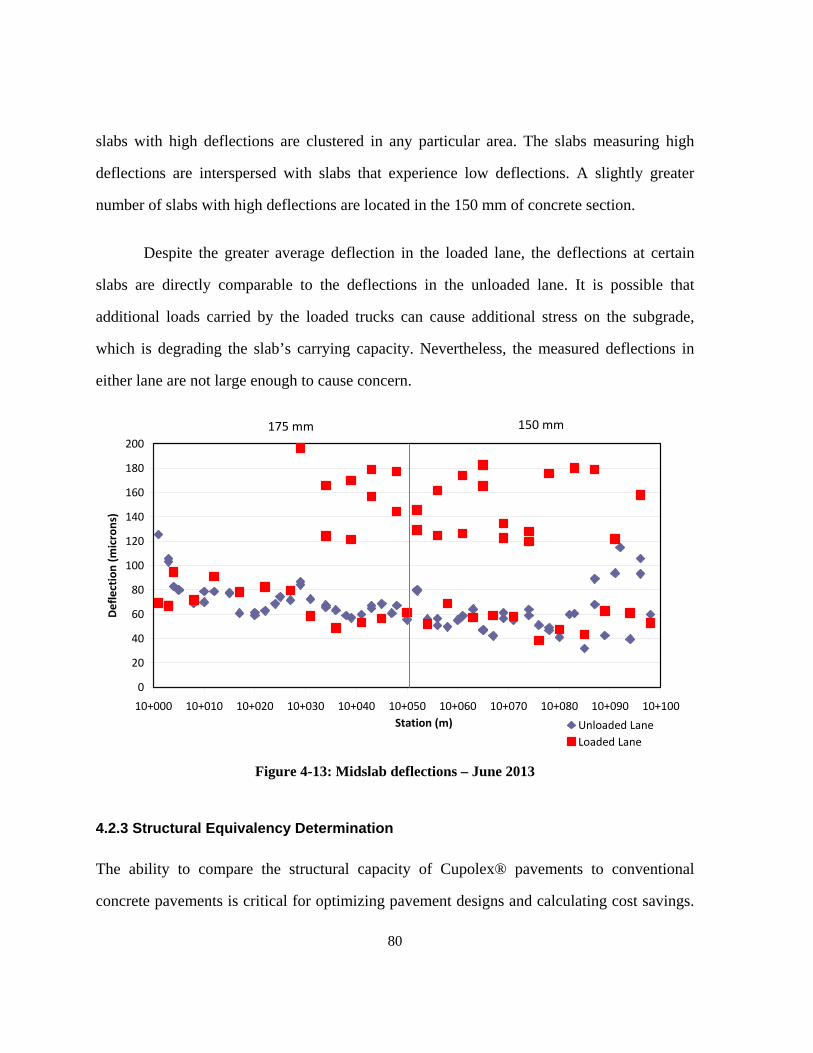
80
slabs with high deflections are clustered in any particular area. The slabs measuring high
deflections are interspersed with slabs that experience low deflections. A slightly greater
number of slabs with high deflections are located in the 150 mm of concrete section.
Despite the greater average deflection in the loaded lane, the deflections at certain
slabs are directly comparable to the deflections in the unloaded lane. It is possible that
additional loads carried by the loaded trucks can cause additional stress on the subgrade,
which is degrading the slab’s carrying capacity. Nevertheless, the measured deflections in
either lane are not large enough to cause concern.
0
20
40
60
80
100
120
140
160
180
200
10+000 10+010 10+020 10+030 10+040 10+050 10+060 10+070 10+080 10+090 10+100
Station (m)
Deflection (microns)
Unloaded Lane
Loaded Lane
175 mm 150 mm
Figure 4-13: Midslab deflections – June 2013
4.2.3 Structural Equivalency Determination
The ability to compare the structural capacity of Cupolex® pavements to conventional
concrete pavements is critical for optimizing pavement designs and calculating cost savings.
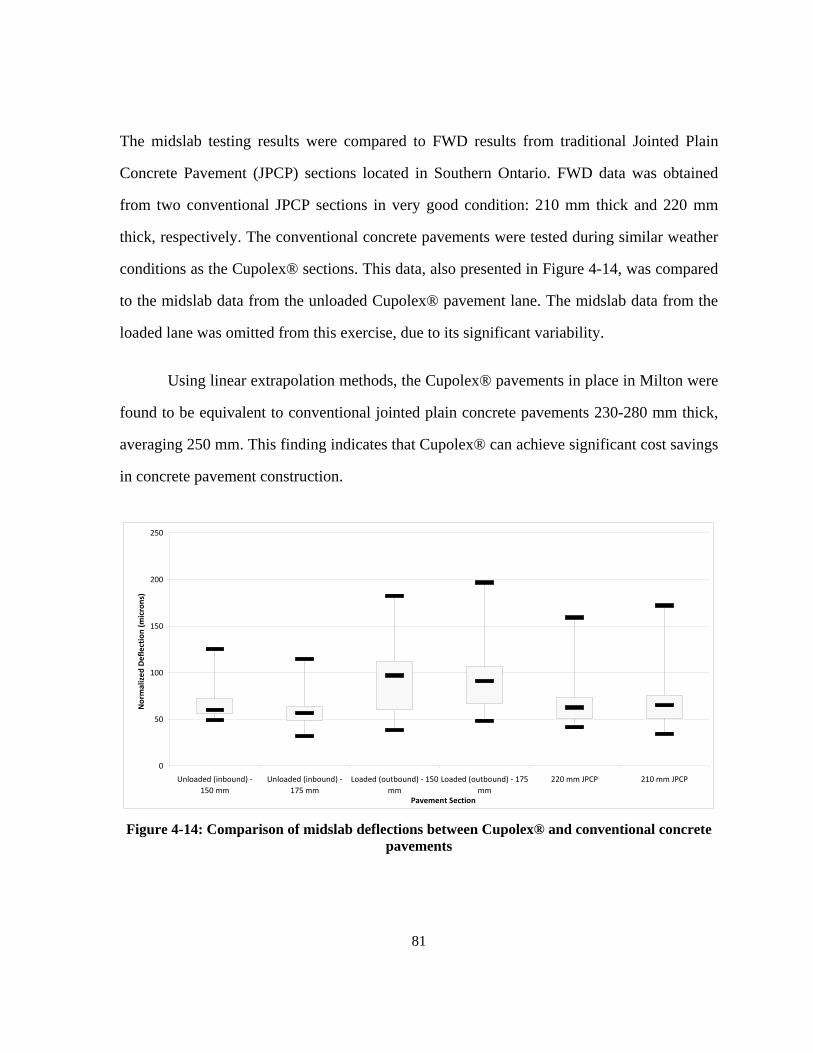
81
The midslab testing results were compared to FWD results from traditional Jointed Plain
Concrete Pavement (JPCP) sections located in Southern Ontario. FWD data was obtained
from two conventional JPCP sections in very good condition: 210 mm thick and 220 mm
thick, respectively. The conventional concrete pavements were tested during similar weather
conditions as the Cupolex® sections. This data, also presented in Figure 4-14, was compared
to the midslab data from the unloaded Cupolex® pavement lane. The midslab data from the
loaded lane was omitted from this exercise, due to its significant variability.
Using linear extrapolation methods, the Cupolex® pavements in place in Milton were
found to be equivalent to conventional jointed plain concrete pavements 230-280 mm thick,
averaging 250 mm. This finding indicates that Cupolex® can achieve significant cost savings
in concrete pavement construction.
0
50
100
150
200
250
Unloaded (inbound) ‐
150 mm
Unloaded (inbound) ‐
175 mm
Loaded (outbound) ‐ 150
mm
Loaded (outbound) ‐ 175
mm
220 mm JPCP 210 mm JPCP
Pavement Section
Norm
alized Deflection (microns)
Figure 4-14: Comparison of midslab deflections between Cupolex® and conventional concrete pavements
82
4.3 Traffic Analysis
Dufferin Aggregates’ Milton Quarry is an important source of high quality aggregates for the
Greater Toronto Area and surrounding regions. The supplied aggregates are in high demand,
and consequently the quarry sees high volumes of truck traffic year round. The quarry sees
an annual average daily traffic of 450 trucks per day throughout the year, rising to a peak of
750 trucks per day throughout the primary construction season (May to November). A wide
range of different dump trucks travel to and from the quarry, including standard tandem and
tridem end dump trucks, semi–trailer end dump trucks, semi–trailer live bottom dump trucks
and standard end dump trucks with trailers.
All trucks entering and leaving the quarry are weighed at the quarry scalehouse.
Truck weight data has been provided regularly by Dufferin Aggregates. This data has been
used to calculate the amount of Equivalent Single Axle Loads (ESALs) applied to the
pavements. An ESAL, as defined by the American Association of State Highway and
Transportation Officials (AASHTO), is equivalent to 80 kN (18 kips) (AASHTO 1993). The
AASHTO pavement design procedure uses the ESAL concept to convert mixed traffic of
various wheel loads and axle configurations to a standard load for easy comparison and
analysis. ESALs are commonly used as a measure of the accumulated damage for a
pavement.
By the end of May 2013, over 1.34 million ESALs have been applied to the
Cupolex® test sections. On an annual basis, this level of traffic is equivalent to a typical
major arterial road or a minor freeway. However, many minor collector and local roads are
designed to carry even fewer ESALs over their 20-30 year design life.
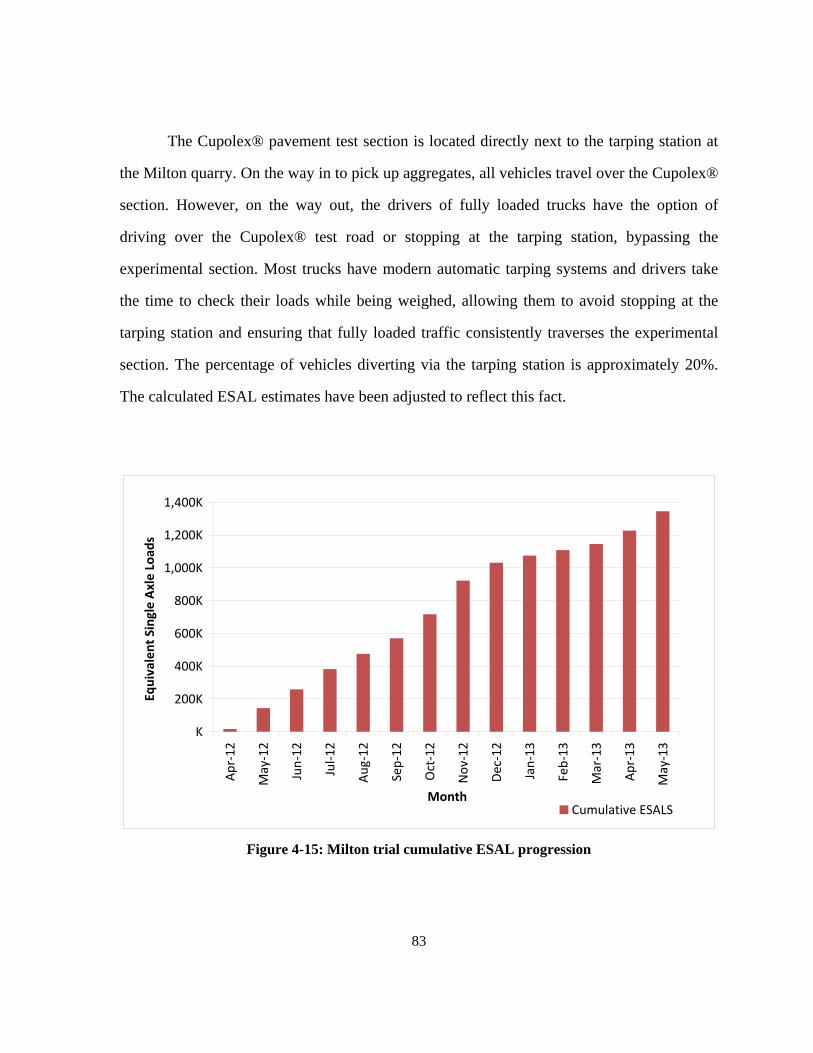
83
The Cupolex® pavement test section is located directly next to the tarping station at
the Milton quarry. On the way in to pick up aggregates, all vehicles travel over the Cupolex®
section. However, on the way out, the drivers of fully loaded trucks have the option of
driving over the Cupolex® test road or stopping at the tarping station, bypassing the
experimental section. Most trucks have modern automatic tarping systems and drivers take
the time to check their loads while being weighed, allowing them to avoid stopping at the
tarping station and ensuring that fully loaded traffic consistently traverses the experimental
section. The percentage of vehicles diverting via the tarping station is approximately 20%.
The calculated ESAL estimates have been adjusted to reflect this fact.
K
200K
400K
600K
800K
1,000K
1,200K
1,400K
Apr‐12
May‐12
Jun‐12
Jul‐12
Aug‐12
Sep‐12
Oct‐12
Nov‐12
Dec‐12
Jan‐13
Feb‐13
Mar‐13
Apr‐13
May‐13
Month
Equivalent Single Axle Load
s
Cumulative ESALS
Figure 4-15: Milton trial cumulative ESAL progression
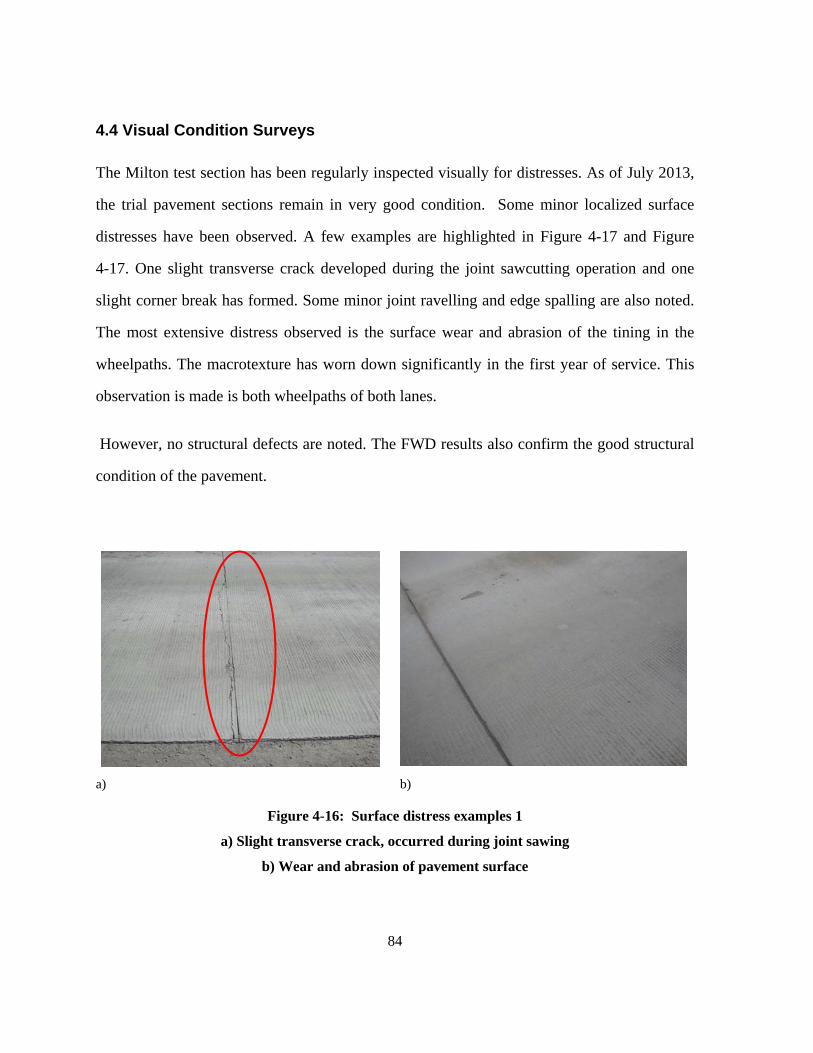
84
4.4 Visual Condition Surveys
The Milton test section has been regularly inspected visually for distresses. As of July 2013,
the trial pavement sections remain in very good condition. Some minor localized surface
distresses have been observed. A few examples are highlighted in Figure 4-17 and Figure
4-17. One slight transverse crack developed during the joint sawcutting operation and one
slight corner break has formed. Some minor joint ravelling and edge spalling are also noted.
The most extensive distress observed is the surface wear and abrasion of the tining in the
wheelpaths. The macrotexture has worn down significantly in the first year of service. This
observation is made is both wheelpaths of both lanes.
However, no structural defects are noted. The FWD results also confirm the good structural
condition of the pavement.
a) b)
Figure 4-16: Surface distress examples 1
a) Slight transverse crack, occurred during joint sawing
b) Wear and abrasion of pavement surface
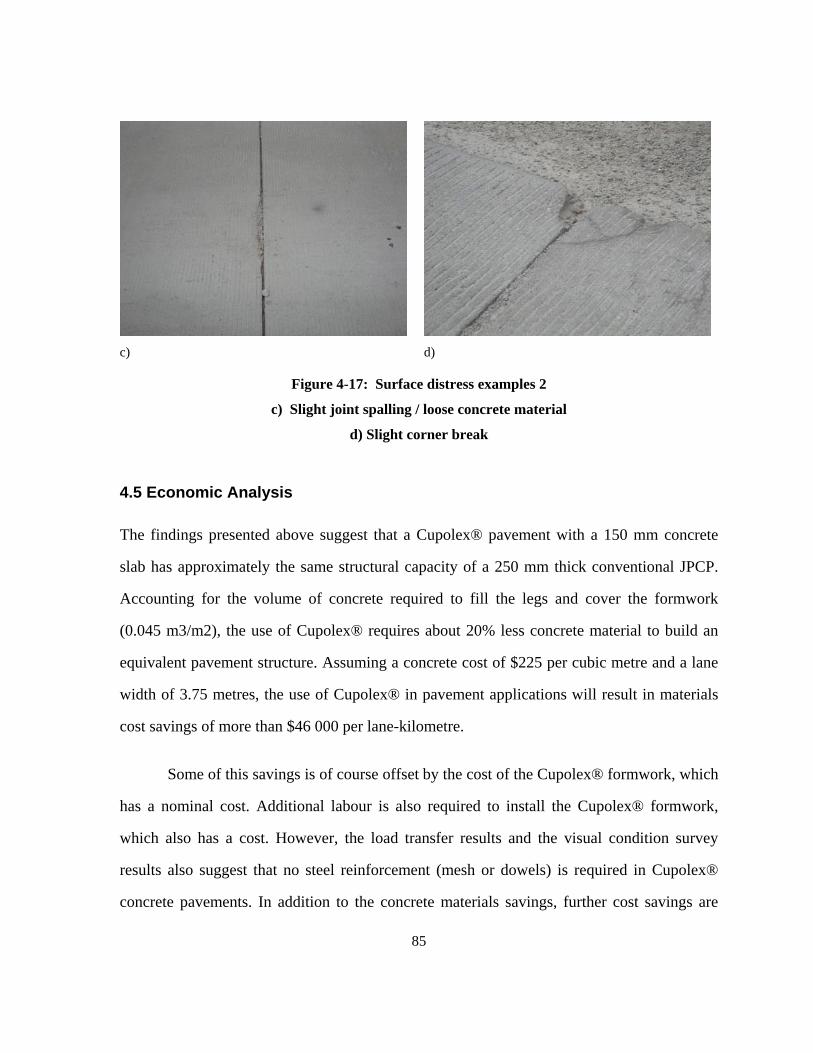
85
c) d)
Figure 4-17: Surface distress examples 2
c) Slight joint spalling / loose concrete material
d) Slight corner break
4.5 Economic Analysis
The findings presented above suggest that a Cupolex® pavement with a 150 mm concrete
slab has approximately the same structural capacity of a 250 mm thick conventional JPCP.
Accounting for the volume of concrete required to fill the legs and cover the formwork
(0.045 m3/m2), the use of Cupolex® requires about 20% less concrete material to build an
equivalent pavement structure. Assuming a concrete cost of $225 per cubic metre and a lane
width of 3.75 metres, the use of Cupolex® in pavement applications will result in materials
cost savings of more than $46 000 per lane-kilometre.
Some of this savings is of course offset by the cost of the Cupolex® formwork, which
has a nominal cost. Additional labour is also required to install the Cupolex® formwork,
which also has a cost. However, the load transfer results and the visual condition survey
results also suggest that no steel reinforcement (mesh or dowels) is required in Cupolex®
concrete pavements. In addition to the concrete materials savings, further cost savings are
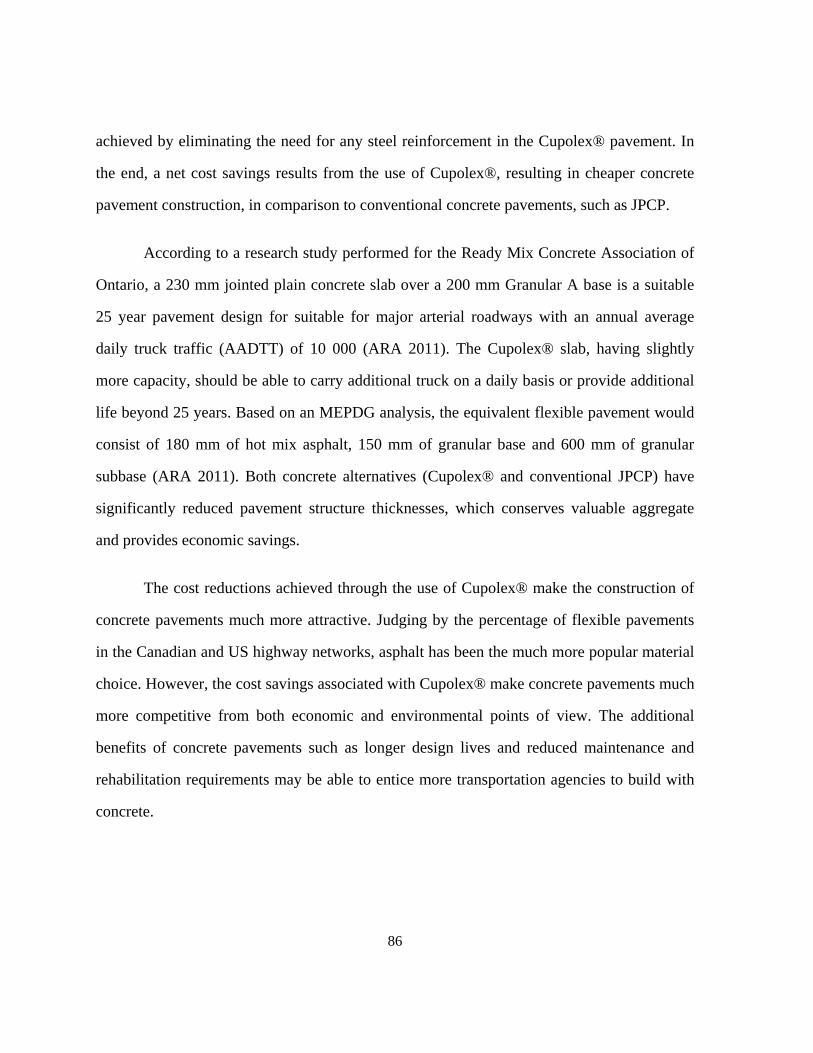
86
achieved by eliminating the need for any steel reinforcement in the Cupolex® pavement. In
the end, a net cost savings results from the use of Cupolex®, resulting in cheaper concrete
pavement construction, in comparison to conventional concrete pavements, such as JPCP.
According to a research study performed for the Ready Mix Concrete Association of
Ontario, a 230 mm jointed plain concrete slab over a 200 mm Granular A base is a suitable
25 year pavement design for suitable for major arterial roadways with an annual average
daily truck traffic (AADTT) of 10 000 (ARA 2011). The Cupolex® slab, having slightly
more capacity, should be able to carry additional truck on a daily basis or provide additional
life beyond 25 years. Based on an MEPDG analysis, the equivalent flexible pavement would
consist of 180 mm of hot mix asphalt, 150 mm of granular base and 600 mm of granular
subbase (ARA 2011). Both concrete alternatives (Cupolex® and conventional JPCP) have
significantly reduced pavement structure thicknesses, which conserves valuable aggregate
and provides economic savings.
The cost reductions achieved through the use of Cupolex® make the construction of
concrete pavements much more attractive. Judging by the percentage of flexible pavements
in the Canadian and US highway networks, asphalt has been the much more popular material
choice. However, the cost savings associated with Cupolex® make concrete pavements much
more competitive from both economic and environmental points of view. The additional
benefits of concrete pavements such as longer design lives and reduced maintenance and
rehabilitation requirements may be able to entice more transportation agencies to build with
concrete.

87
Chapter 5
Conclusion and Recommendations
5.1 Conclusions
The results obtained to date suggest that Cupolex® has very good potential as a concrete
pavement technology. The trial Cupolex® pavement section in Milton has demonstrated very
good performance since it was opened to traffic in April 2012. The pavement surface is in
very good condition, with the exception of some surface wear and abrasion and a few
individual minor distresses. The Cupolex® pavement appears to be in excellent structural
condition visually. This observation has been confirmed through non-destructive deflection
testing.
Over 1.34 million cumulative ESALs have been applied to the pavement to date.
This trial project has successfully demonstrated that Cupolex® pavements can successfully
carry heavy traffic close to the legal limit in the short term. The findings also suggest that
Cupolex® pavements have the ability to carry the 20-30 year design traffic for low-volume
roads, such as local streets. The load carrying capacity of Cupolex® pavements does not
appear to be a concern. However, the susceptibility to loss of load carrying capacity for
Cupolex® pavements has not been proven yet, with only one year of service. Continued
monitoring will help develop a better understanding of the long-term performance trends of
pavements using Cupolex®.
The technical viability of Cupolex® in pavement application translates to additional
economic, environmental and social benefits. The results of this research indicate the trial

88
Cupolex® pavements constructed in Milton are approximately equivalent to a 250 mm thick
conventional jointed plain concrete pavement in terms of pavement strength using FWD
testing data. The equivalency results in a significant reduction in concrete requirements
(approximately 20%). A reduction in the volume of concrete needed results in a significant
materials and cost savings. The reduction in construction costs allows the transportation
agency’s limited funds to go further. The material savings preserves limited supplies of high
quality virgin aggregates and reduces the amount of cement needed, meeting sustainability
goals.
The construction experiences of the Milton trial section has shown that the Cupolex®
product can be integrated into concrete pavement construction without much difficulty.
Cupolex® is compatible with conventional slipform paving equipment, allowing for fast and
easy paving. The construction process is slightly complicated, due to the need for a conveyor
or pump truck to place the concrete, since regular dump trucks cannot simply dump their
concrete loads in front of the paver. A small additional cost is associated with the need for
this specialized equipment. The need to place concrete from the roadway shoulder also
requires that sufficient room be available for these vehicles.
One minor issue was encountered with the incorrect orientation of the Cupolex®
units during layout. The proper orientation and layout of the individual units is critical to
ensure that they interconnect securely. Otherwise, the weight of the fresh concrete will cause
the units to pop apart and allow concrete to flow under the Cupolex® units, where it is
wasted. However, these issues were quickly identified and easily resolved after which paving
continued without difficulty. Thorough training of the installers will ensure this problem does
89
not repeat itself. Discussions with the manufacturer have indicated they will attempt to
simplify installation and construction with the next generation of Cupolex® units. The
upcoming Cupolex® units will be much larger, allowing for quicker layout, and will securely
“click” together to ensure that they separate or be blown away.
Thermal loads have been determined to have the greatest influence on measured
concrete strains. The strain gauge data shows that the concrete strains generally remain
compressive at the thinnest location, the top of the dome. This observation is very
encouraging, as it suggests that the Cupolex® slab has a low potential for cracking.
Furthermore, the low overall variability in strains reduces the potential for fatigue failures.
The Falling Weight Deflectometer testing has indicated that excellent load transfer
can be expected without needing the use of dowel bars at transverse joints. Furthermore, the
joint location with respect to the dome or the “foot” does not have an influence on load
transfer either. Consequently, painstaking effort does not need to taken to ensure that the
joints lie in any particular location to get good load transfer values.
In Canada, where concrete pavements (rigid and composite) make up only 3.1% of
federal, provincial and territorial pavement and 13% of municipal pavements (TAC 2012),
there is much room for greater use of concrete pavement. The technical, environmental and
economic benefits of Cupolex® can encourage competition with the asphalt industry to
encourage further use of concrete.
Life Cycle Cost Analyses (LCCA) are typically performed for all pavement design
projects. Concrete and asphalt pavement alternatives are typically compared. Although

90
concrete pavements have longer design lives and minimal maintenance requirements, they
often have greater initial costs than asphalt pavements, which require intermittent
rehabilitation activities, but can be constructed at lesser expense. Although the life cycle cost
can influence pavement type selection, this decision is more often based on the initial
construction costs. The ability of Cupolex® to reduce the initial construction costs of
concrete pavements can make them much more attractive economically to transportation
agencies.
5.2 Recommendations
The trial pavement constructed as part of this study has only been in service for one year. As
a result, the scope of this thesis is limited to the design, construction and early age
performance of a concrete pavement trial constructed using the Cupolex® technology. The
performance data obtained to date only permits a preliminary evaluation of this technology.
Continued monitoring and evaluation of the Milton test section are required to better
understand the long-term performance of Cupolex® in pavement applications. Additional
sensor data collection and analysis, visual inspection, deflection testing and traffic data
collection are required to perform a more thorough evaluation. This additional information
will help form stronger conclusions about the feasibility of using Cupolex®.
Finite element modelling should be performed to help quantify the effects of both
dynamic vehicular loads and environmental loads, particularly thermal gradients, on the
Cupolex® slab. Modelling will also assist help separate the thermal load induced effects
from the vehicular loading induced effects and can possibly help explain the observed load

91
transfer mechanism from slab to base. The modelling results will help validate the measured
pavement responses and predict future performance. These results can be utilized to optimize
slab thickness in order to maximize cost and materials savings.
Numerous additional aspects of this technology have not yet been investigated and/or
evaluated. For one, its maintenance and rehabilitation needs have not been determined. These
needs are expected to be very similar to conventional concrete pavements. However, certain
treatments, such as full-depth repairs or slab replacement, will likely need to be modified to
account for the increased total slab thickness. Best practices will need to be developed to
minimize cost and maximize performance. The end-of-life stage of Cupolex® concrete
pavements will also need to be studied. How the inclusion of the plastic formwork impacts
pavement decommissioning, reconstruction and/or recycling will need to be determined. If
any hindrances are found, they will need to be addressed.
Furthermore, the use of Cupolex® should be investigated in alternative pavement
applications. As an example, Cupolex® could be integrated into pervious concrete
pavements. The void under the slab could serve an integrated reservoir for stormwater. This
beneficial property can help reduce the need for thick clear reservoirs by incorporating the
retention reservoir into the slab.
Finally, a complete detailed lifecycle cost analysis must be completed in order to
better evaluate other long-term benefits and determine the true potential savings, such as
reduction in greenhouse gases and conservation of construction materials. Only with
information can the full potential of this technology be utilized.
92
References
Aggregate Producers Association of Ontario (APAO). 2004. “Importance of Aggregate,” The
About Aggregate Series, Aggregate Producers Association of Ontario, Mississauga,
Ontario.
Al-Qadi, I. L., S. Portas, M. Coni, and S. Lahouar. 2010. “Runway instrumentation and
response measurements.” Transportation Research Record: Journal of the
Transportation Research Board 2153, pp. 162-169.
American Association of State Highway and Transportation Officials (AASHTO). 1972.
AASHTO Interim Guide for Design of Pavement Structures. Washington, DC: American
Association of State Highway and Transportation Officials.
American Association of State Highway and Transportation Officials (AASHTO). 1986.
AASHTO Guide for Design of Pavement Structures. Washington, DC: American
Association of State Highway Transportation Officials.
American Association of State Highway and Transportation Officials (AASHTO). 1993.
AASHTO Guide for Design of Pavement Structures. Washington, D.C.: American
Association of State Highway and Transportation Officials.
American Association of State Highway and Transportation Officials (AASHTO). 1998.
Supplement to the AASHTO Guide for Design of Pavement Structures, Part II – Rigid
Pavement Design & Rigid Pavement Joint Design. Washington, D.C.: American
Association of State Highway and Transportation Officials.
Applied Research Associates, Inc. (ARA). 2011. “Methodology for the Development of
Equivalent Pavement Structural Design Matrix for Municipal Roadways.” Report
93
prepared for the Ready Mixed Concrete Association of Ontario and the Cement
Association of Canada. Toronto: Applied Research Associates, Inc.
Campbell Scientific, Inc. 2012. “CS616 and CS625 Water Content Reflectometers
Instruction Manual.” Logan, UT: Campbell Scientific, Inc.
Delatte, N. 2008. Concrete Pavement Design, Construction and Performance. New York:
Taylor and Francis.
El-Hakim, M.Y. 2009. “Instrumentation and Overall Evaluation of Perpetual and
Conventional Flexible Pavement Designs.” MASc Thesis. Waterloo, ON: University of
Waterloo.
Federal Highway Administration (FHWA). 2008. “Highway Statistics 2008.” Table HM-31.
Washington, D.C.: Federal Highway Administration.
Federal Highway Administration (FHWA). 2012. “Long-Term Plan for Concrete Pavement
Research and Technology—The Concrete Pavement Road Map (Second Generation):
Volume I, Background and Summary” Report No. FHWA-HRT-11-065. McLean, VA:
Federal Highway Administration.
Google. 2012. “Dufferin Aggregates Milton Quarry, Milton, Ontario.” [Google Earth
imagery]. Accessed April 19, 2012.
Goulias, D.G., H. Kim, and C.W. Schwartz. 2011. “Evaluation of in situ pavement material
properties and behavior through field instrumentation and load testing.” Journal of
Transportation Engineering 137:466.
Henderson, V. 2012. “Evaluation of the Performance of Pervious Concrete Pavement in the
Canadian Climate.” PhD Thesis. Waterloo, ON: University of Waterloo.
94
Holcim (Canada) Inc. 2010. “Dufferin Aggregates, Milton Quarry.” Accessed April 19,
2012. http://www.holcim.ca/fileadmin/templates/CA/doc/Brochures/
DFA_Milton_Brochure.pdf
Huang, Y.H. 1993. Pavement Design and Analysis. 2nd Edition. Englewood Cliffs, NJ:
Prentice Hall, Inc.
Irali, F., A. Kivi, J.T. Smith, S.L. Tighe and C. Sangiorgi. 2013. “Recycled Concrete
Aggregate in Concrete Pavements: A Five Year Study in its Effect on Pavement
Performance.” Paper presented at the Transportation Association of Canada Annual
Conference, 2013, Winnipeg, Canada.
Low, M-S. 2005. “Material Flow Analysis of Concrete in the United States.” Cambridge,
MA: Massachusetts Institute of Technology.
Mallick, R.B. and T. El-Korchi. 2009. Pavement engineering: Principles and practice. Boca
Raton: CRC Press.
Mehta, P.K. 2001. “Reducing the environmental impact of concrete.” Concrete International,
American Concrete Institute, Farmington Hills, MI, October issue, 61–66
Naik, T.R., and G. Moriconi. 2005. “Environmental-Friendly Durable Concrete Made with
Recycled Materials for Sustainable Concrete Construction,” Paper presented at the
International Symposium on Sustainable Development of Cement, Concrete and
Concrete Structures, Toronto, Ontario.
National Cooperative Highway Research Program (NCHRP). 1995. “Application of Full-
Scale Accelerated Pavement Testing.” NCHRP Synthesis 235. Washington, DC:
Transportation Research Board.

95
National Cooperative Highway Research Program (NCHRP). 2004. “Guide for Mechanistic-
Empirical Design of New and Rehabilitated Pavement Structures.” NCHRP Report 1-
37A. Washington, DC: National Cooperative Highway Research Program.
National Cooperative Highway Research Program (NCHRP). 2012. “Significant Findings
from Full-Scale Accelerated Pavement Testing.” NCHRP Synthesis 433. Washington,
DC: Transportation Research Board.
Neville, A.M. 1995. Properties of Concrete. 4th Edition. Essex, England: Prentice Hall.
Ontario Provincial Standard Specifications (OPSS). 2013. “Material Specification for
Aggregates - Base, Subbase, Select Subgrade, and Backfill Material”. OPSS.PROV
1010. April 2013.
Panagapko, D. 2003. Canadian Minerals Yearbook. Ottawa, ON: Natural Resources Canada.
Papagiannakis, A. T., and E. Masad. 2008. Pavement design and materials. Hoboken, N.J.:
John Wiley.
Pontarolo Engineering Inc (Pontarolo). 2009. “Frequently Asked Questions about
Cupolex®.” Vaughan, ON: Pontarolo Engineering Inc.
Pontarolo Engineering Inc (Pontarolo). 2011. “Everything You Ever Wanted to Know About
Cupolex®.” Vaughan, ON: Pontarolo Engineering Inc.
Pontarolo Engineering, Ltd. 2006. “Cupolex®: The Structural Dome Flooring System.”
Accessed April 18, 2012.
http://www.pontarolo.ca/downloads/Cupolex®%20Brochure.pdf
96
Portland Cement Association (PCA). 1993. “Cement and Concrete– Environmental
considerations.” Environmental Building News, v. 2, no. 20, Skokie, IL.
Reid, E. 1984. Understanding Building. Cambridge, MA: MIT Press.
Rohne, R. 2009. “Sixty-Year Design Concrete Pavement-Performance Model Development:
MnROAD Cell 53 Construction Report.” MN/RC 2009-31. St. Paul, MN: Minnesota
Department of Transportation.
RST Instruments Ltd. (RST). 2004. “Vibrating Wire Strain Gauge VWSG-E(M), VWSG-
A(M) Instruction Manual.” Coquitlam, BC: RST Instruments Ltd.
Sandaker, B.N., A.P. Eggen and M.R. Cruvellier. 2011. The structural basis of architecture.
2nd Edition. New York: Routledge.
Schodek, D.L. and M. Bechthold. 2008. Structures. 6th Edition. Upper Saddle River, NJ:
Pearson Prentice Hall.
Smith, J.T.. 2009. “Recycled Concrete Aggregate – A Viable Aggregate Source For Concrete
Pavements.” PhD Thesis. Waterloo, ON: University of Waterloo.
Swan, D.J. and Hein, D. 2008. “Creating Mechanistic Based Performance Models in PMS.”
Proceedings of the 8th International Conference on Managing Pavement Assets, Calgary,
AB.
Tennis, P. D., M.D.A. Thomas and W.J. Weiss. 2011. “State-of-the-Art Report on Use of
Limestone in Cements at Levels of up to 15%” PCA R&D Serial No. SN3148. Skokie,
IL: Portland Cement Association.

97
Transport Canada. 2004. “Interim Estimates of the Financial Costs and Revenues Associated
with the Provision of Road Infrastructure in Canada, 2000.” Ottawa, ON: Transport
Canada.
Transport Canada. 2006. “Transportation in Canada 2006 Annual Report.” Ottawa, ON
Transport Canada.
Transportation Association of Canada (TAC). 2012. Pavement Asset Design and
Management Guide, ed. S.L. Tighe. Ottawa: Transportation Association of Canada.
U.S. Environmental Protection Agency, Office of Air Quality Planning and Standards, Sector
Policies and Programs Division (U.S. EPA). 2010. “Available and Emerging
Technologies for Reducing Greenhouse Gas Emissions from the Portland Cement
Industry.” Durham, NC: U.S. Environmental Protection Agency.
Van Dam, T., P. Taylor, G. Fick, D. Gress, M. VanGeem and E. Lorenz. 2011. Sustainable
Concrete Pavements: A Manual of Practice. Ames, IA: National Concrete Pavement
Technology Center.
Willis, J.R. 2008. “A Synthesis of Practical and Appropriate Instrumentation Use for
Accelerated Pavement Testing in the United States.” Proceedings of the 2008
International Conference on Accelerated Pavement Testing, Madrid, Spain.
World Commission on the Environment and Development (WCED). 1987. “Our Common
Future: The Report of the World Commission on Environment and Development.” New
York: Oxford University Press.
Zhang, W., Q. Wang, and Z. Wang. 2008. “Rigid pavement strain as means of weighing
vehicles.” Paper presented at IEEE Vehicle Power and Propulsion Conference, 2008,
Harbin, China.