Embed Size (px)
Citation preview

Project Managers:
Rodrigo Herrera, PE
Principal Investigator:
Mike McVay, PhD (Phase I)
Jae H. Chung, PhD (Phase II)
Primary Researchers:
John Schwartz III, PhD student
Lin Huang, MS student
FDOT Contract No.: BDV31-977-05
Evaluation of Static Resistance of Deep Foundation
2
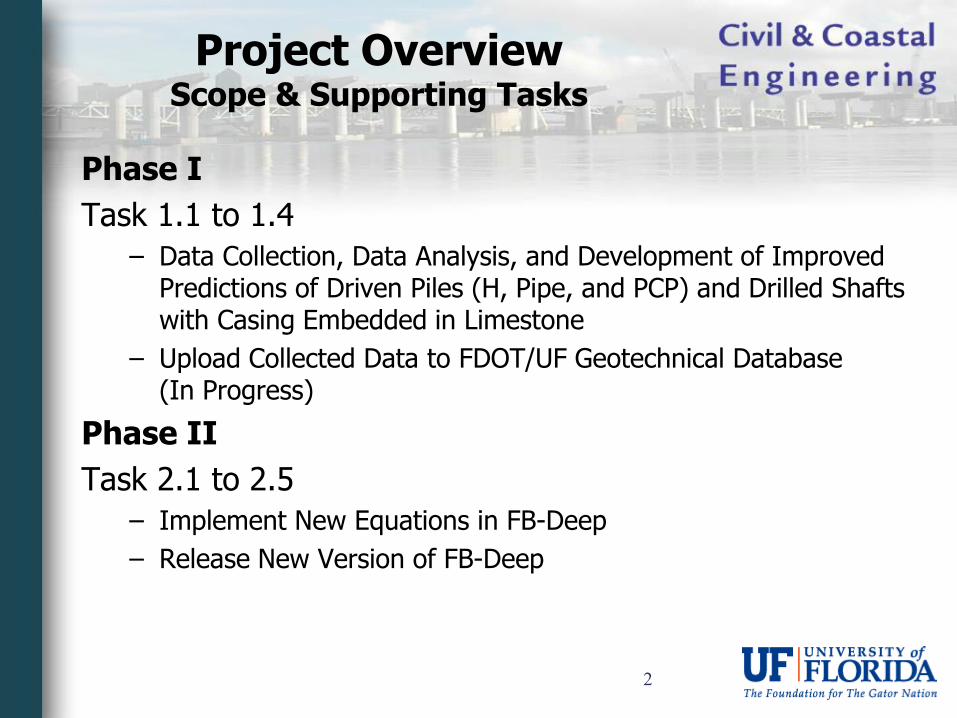
Project OverviewScope & Supporting Tasks
Phase I
Task 1.1 to 1.4
– Data Collection, Data Analysis, and Development of Improved Predictions of Driven Piles (H, Pipe, and PCP) and Drilled Shafts with Casing Embedded in Limestone
– Upload Collected Data to FDOT/UF Geotechnical Database (In Progress)
Phase II
Task 2.1 to 2.5
– Implement New Equations in FB-Deep
– Release New Version of FB-Deep

3
Project OverviewScope & Supporting Tasks
Phase I
Task 1.1: Collect Data form DOTs, Consultants, & Contractors (Completed)
– Driven Pile Data
• H, PCPs in Limestone, Steel Pipe, & Concrete Cylinder
• Geotechnical & Foundation Certification Reports
• In Situ (SPT, Lab Test Data, etc.)
• Dynamic Load Test (PDA & CAPWAP)
– Drilled Shafts with Steel Casing in Florida Limestone (Task 1.4)
• Geotechnical & Foundation Certification Reports
• In Situ (SPT, Lab Test Data, etc.)
• Load Test (Static & Statnamic)

4
Project OverviewScope & Supporting Tasks
Phase I
Task 1.2: Evaluate Pile Side Resistance & End Bearing(Steel H Piles Completed; PCPs Ongoing)
– Recorded SPT Blow Count & Estimated/Measured Pile Capacity (Dynamic Testing -CAPWAP)
– Develop Relationship between N Values vs. Side & Tip Resistance for All Soil Types
– Develop Method to Delineate between Weathered and Competent Limestone (Ongoing)
– Develop Relationship between N Values vs. Side &Tip Resistance for both Weathered and Competent Limestone

5
Project OverviewScope & Supporting Tasks
Phase I
Task 1.3: Evaluate Pile Side Resistance & End Bearing of Steel Pipe Piles & Concrete Cylinder Piles (In Progress)
– Recorded SPT Blow Count & Estimated/Measured Pile Capacity (Dynamic Load Test)
– Investigate Different Methods of Evaluating Total Side Resistance (IFR & API)
– Develop Relationship between N Value for Open & Closed Ended Piles in All Soil Types
• Unit Side Resistance
• Unit End Bearing
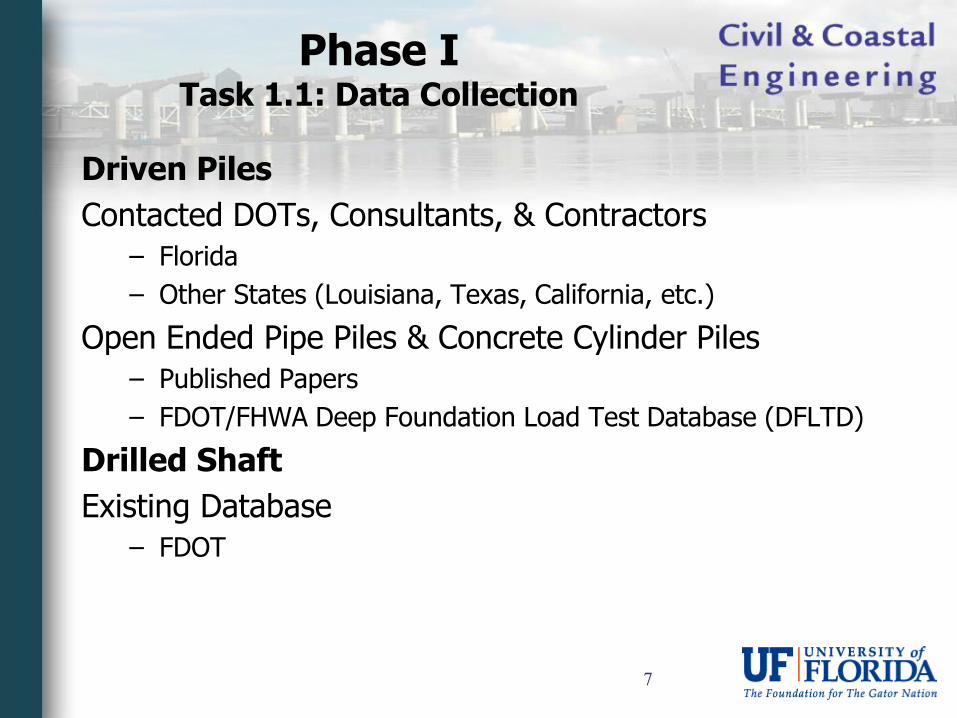
Phase ITask 1.1: Data Collection
Driven Piles
Contacted DOTs, Consultants, & Contractors
– Florida
– Other States (Louisiana, Texas, California, etc.)
Open Ended Pipe Piles & Concrete Cylinder Piles
– Published Papers
– FDOT/FHWA Deep Foundation Load Test Database (DFLTD)
Drilled Shaft
Existing Database
– FDOT
7

Phase ITask 1.1: Data Collection - Steel H Piles
Florida DOTs, Consultants, & Contractors
Project Number
(Financial)Project Site
# of Soil
Borings
Predominant
Soil TypeDimensions (in) Length (ft)
# of Piles
with
CAPWAP
# of BOR
CAPWAP
Analyses
208466-2-52-01SR 51 from Taylor County Line to Dixie County
Line66 Sand & Rock 14 x 89 60 - 120 3 1
221754-1-52-01 CR 146 over Aucilla River 9Sand, Clay &
Rock14 x 117 150 - 220 5 0
Widening I 95 (SR 9) over Hallandale Beach
Boulevard Bridge5 Sand & Rock 18 x 135 90 - 116 8 5
Widening I 95 (SR 9) over Hollywood Boulevard
(SR 820)3 Sand & Rock 18 x 135 90 - 115 11 3
Widening I 95 (SR 9) over Stirling Road (SR 848) 3 Sand & Rock 18 x 135 110 - 168 5 4
Widening I 95 (SR 9) over Pembroke Road Bridge 3 Sand & Rock 19 x 135 85 9 6
403984-1-52-01 Eller Drive Overpass (SR 862) 29 Sand & Rock 14 x 73 90 - 140 3 0
I-4 (SR 408)/SR 408 interchange (Widening at
Church Street Viaduct; Phase 1)29 Sand & Clay
14 x 89 &
12 x 5390 - 140 37 5
I-4 (SR 408)/SR 408 interchange (Widening over
Robinson Street; Phase 2)1 Sand 14 x 89
100 - 15014 1
I-4 (SR 408)/SR 408 interchange (Widening over
South Street; Phase 3)2 Sand & Clay 12 x 53 150 3 0
Ramp E (Phase 4) 3 Sand & Clay 14 x 89 150 3 0
Ramp F2 (Phase 5) 5 Sand 14 x 89 105 - 135 3 0
Ramps D & D1 (Phase 6) 20 Sand & Clay 12 x 53 90 - 115 18 1
Anderson Street Overpass & Ramp F1 (Phase 7) 7 Sand & Clay 14 x 89 --- 4 1
Ramp C (Phase 8) 12 Sand 14 x 89 --- 12 0
238429-3-52-01 US 27 (SR 50) Interchange at SR 50 7 Sand 14 x 73 99 - 120 33 18
204 171 45Total # of CAPWAP AnalysesTotal # of Soil Borings
Site Information Insitu Information Pile Information
422796-1-52-01 &
422796-2-52-01
242484-2-52-01
8
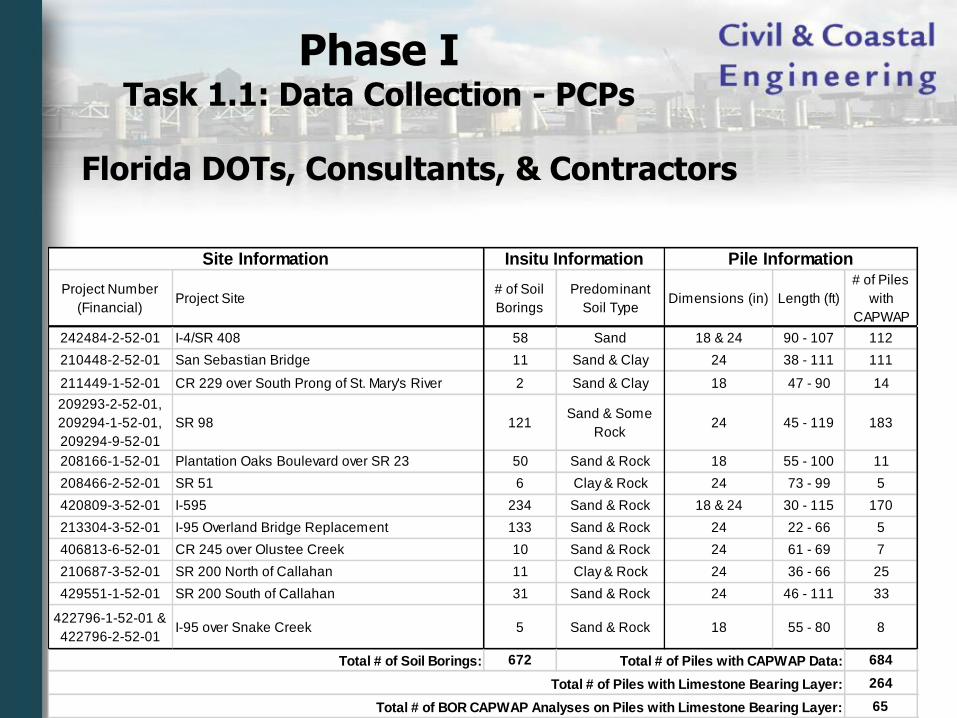
Phase ITask 1.1: Data Collection - PCPs
Project Number
(Financial)Project Site
# of Soil
Borings
Predominant
Soil TypeDimensions (in) Length (ft)
# of Piles
with
CAPWAP
242484-2-52-01 I-4/SR 408 58 Sand 18 & 24 90 - 107 112
210448-2-52-01 San Sebastian Bridge 11 Sand & Clay 24 38 - 111 111
211449-1-52-01 CR 229 over South Prong of St. Mary's River 2 Sand & Clay 18 47 - 90 14
209293-2-52-01,
209294-1-52-01,
209294-9-52-01
SR 98 121Sand & Some
Rock24 45 - 119 183
208166-1-52-01 Plantation Oaks Boulevard over SR 23 50 Sand & Rock 18 55 - 100 11
208466-2-52-01 SR 51 6 Clay & Rock 24 73 - 99 5
420809-3-52-01 I-595 234 Sand & Rock 18 & 24 30 - 115 170
213304-3-52-01 I-95 Overland Bridge Replacement 133 Sand & Rock 24 22 - 66 5
406813-6-52-01 CR 245 over Olustee Creek 10 Sand & Rock 24 61 - 69 7
210687-3-52-01 SR 200 North of Callahan 11 Clay & Rock 24 36 - 66 25
429551-1-52-01 SR 200 South of Callahan 31 Sand & Rock 24 46 - 111 33
422796-1-52-01 &
422796-2-52-01I-95 over Snake Creek 5 Sand & Rock 18 55 - 80 8
672 684
264
65Total # of BOR CAPWAP Analyses on Piles with Limestone Bearing Layer:
Total # of Piles with Limestone Bearing Layer:
Insitu Information Pile InformationSite Information
Total # of Piles with CAPWAP Data:Total # of Soil Borings:
Florida DOTs, Consultants, & Contractors
9
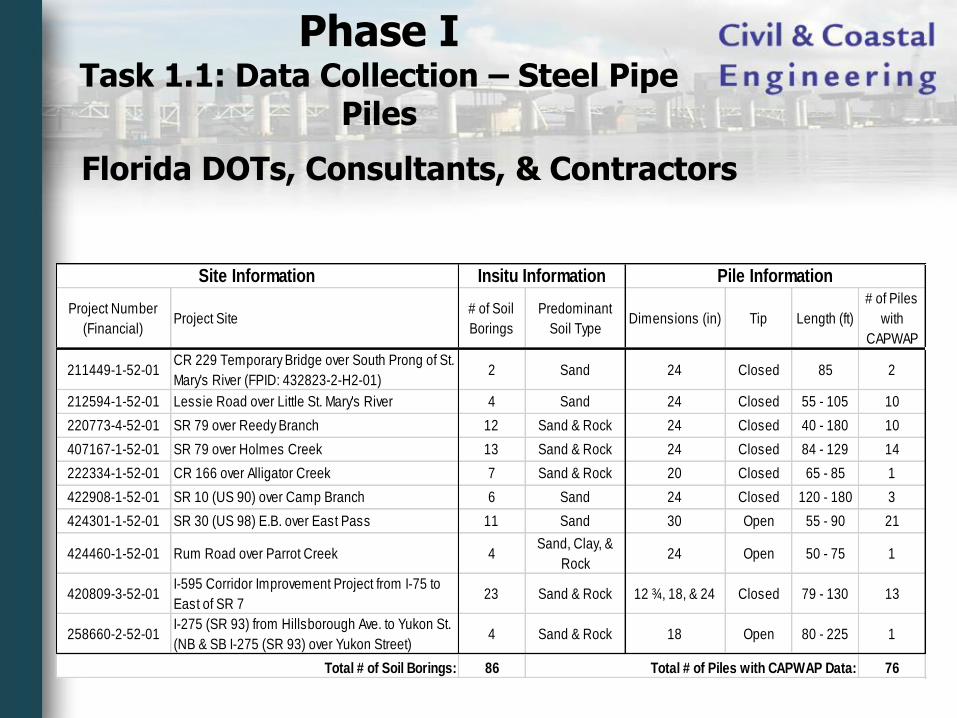
Phase ITask 1.1: Data Collection – Steel Pipe
Piles
Project Number
(Financial)Project Site
# of Soil
Borings
Predominant
Soil TypeDimensions (in) Tip Length (ft)
# of Piles
with
CAPWAP
211449-1-52-01CR 229 Temporary Bridge over South Prong of St.
Mary's River (FPID: 432823-2-H2-01)2 Sand 24 Closed 85 2
212594-1-52-01 Lessie Road over Little St. Mary's River 4 Sand 24 Closed 55 - 105 10
220773-4-52-01 SR 79 over Reedy Branch 12 Sand & Rock 24 Closed 40 - 180 10
407167-1-52-01 SR 79 over Holmes Creek 13 Sand & Rock 24 Closed 84 - 129 14
222334-1-52-01 CR 166 over Alligator Creek 7 Sand & Rock 20 Closed 65 - 85 1
422908-1-52-01 SR 10 (US 90) over Camp Branch 6 Sand 24 Closed 120 - 180 3
424301-1-52-01 SR 30 (US 98) E.B. over East Pass 11 Sand 30 Open 55 - 90 21
424460-1-52-01 Rum Road over Parrot Creek 4Sand, Clay, &
Rock24 Open 50 - 75 1
420809-3-52-01I-595 Corridor Improvement Project from I-75 to
East of SR 7 23 Sand & Rock 12 ¾, 18, & 24 Closed 79 - 130 13
258660-2-52-01I-275 (SR 93) from Hillsborough Ave. to Yukon St.
(NB & SB I-275 (SR 93) over Yukon Street)4 Sand & Rock 18 Open 80 - 225 1
86 76
Insitu Information Pile InformationSite Information
Total # of Soil Borings: Total # of Piles with CAPWAP Data:
Florida DOTs, Consultants, & Contractors
10
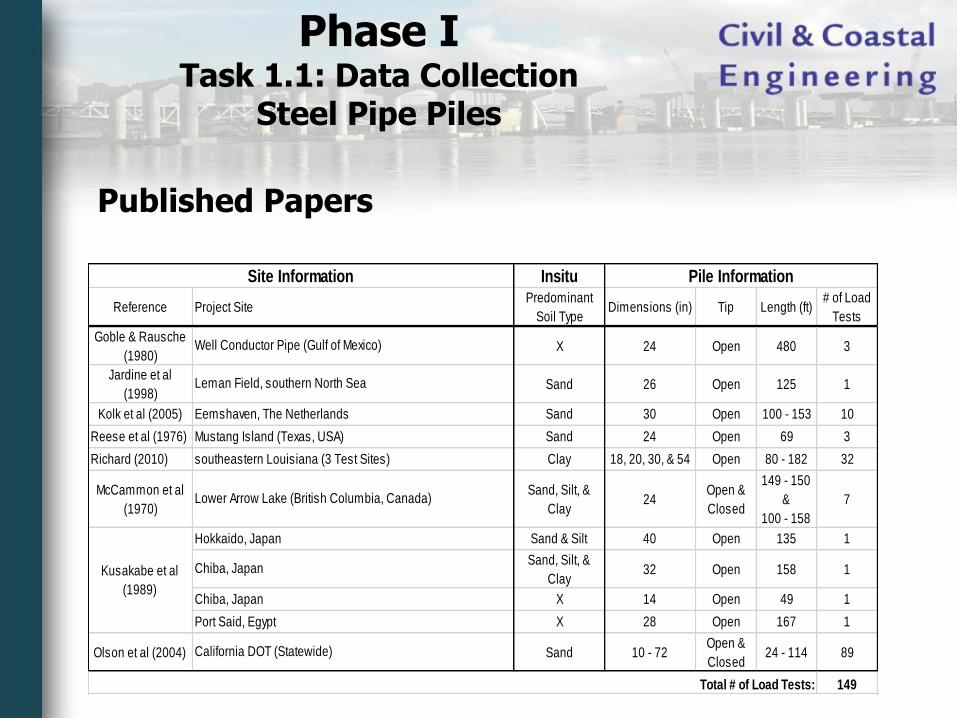
Phase ITask 1.1: Data Collection
Steel Pipe Piles
Insitu
ReferencePredominant
Soil TypeDimensions (in) Tip Length (ft)
# of Load
Tests
Goble & Rausche
(1980)X 24 Open 480 3
Jardine et al
(1998)Sand 26 Open 125 1
Kolk et al (2005) Sand 30 Open 100 - 153 10
Reese et al (1976) Sand 24 Open 69 3
Richard (2010) Clay 18, 20, 30, & 54 Open 80 - 182 32
McCammon et al
(1970)
Sand, Silt, &
Clay24
Open &
Closed
149 - 150
&
100 - 158
7
Sand & Silt 40 Open 135 1
Sand, Silt, &
Clay32 Open 158 1
X 14 Open 49 1
X 28 Open 167 1
Olson et al (2004) Sand 10 - 72Open &
Closed24 - 114 89
149
California DOT (Statewide)
Eemshaven, The Netherlands
Kusakabe et al
(1989)
Leman Field, southern North Sea
Hokkaido, Japan
Chiba, Japan
Total # of Load Tests:
Pile InformationSite Information
Project Site
Mustang Island (Texas, USA)
Lower Arrow Lake (British Columbia, Canada)
southeastern Louisiana (3 Test Sites)
Chiba, Japan
Port Said, Egypt
Well Conductor Pipe (Gulf of Mexico)
Published Papers
11
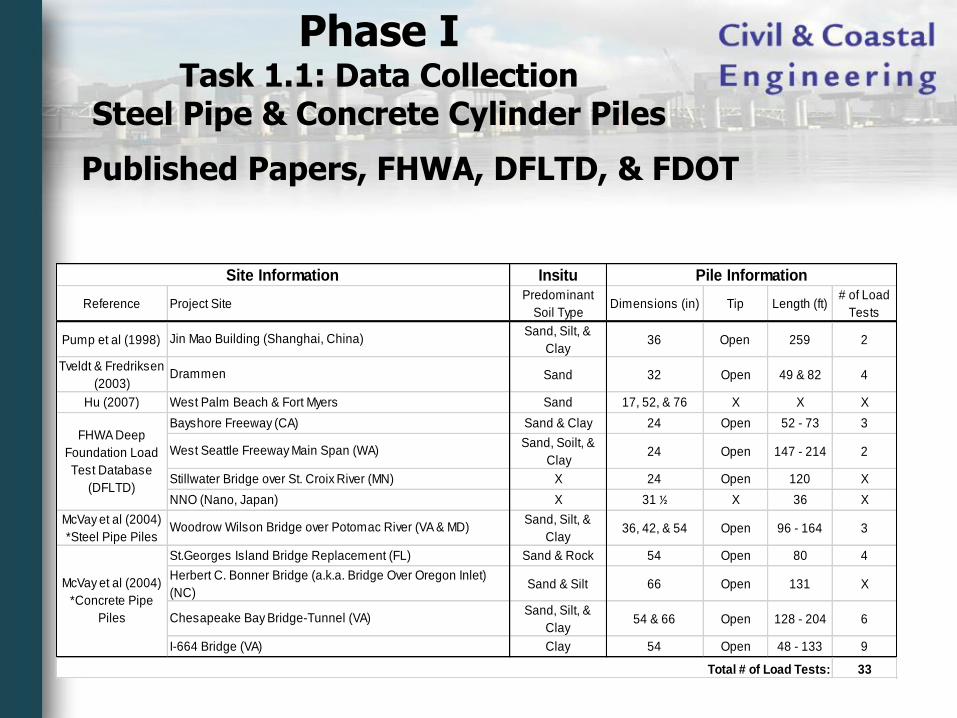
Phase ITask 1.1: Data Collection
Steel Pipe & Concrete Cylinder Piles
Insitu
ReferencePredominant
Soil TypeDimensions (in) Tip Length (ft)
# of Load
Tests
Pump et al (1998)Sand, Silt, &
Clay36 Open 259 2
Tveldt & Fredriksen
(2003) Sand 32 Open 49 & 82 4
Hu (2007) Sand 17, 52, & 76 X X X
Sand & Clay 24 Open 52 - 73 3
Sand, Soilt, &
Clay24 Open 147 - 214 2
X 24 Open 120 X
X 31 ½ X 36 X
McVay et al (2004)
*Steel Pipe Piles
Sand, Silt, &
Clay36, 42, & 54 Open 96 - 164 3
Sand & Rock 54 Open 80 4
Sand & Silt 66 Open 131 X
Sand, Silt, &
Clay54 & 66 Open 128 - 204 6
Clay 54 Open 48 - 133 9
33
Jin Mao Building (Shanghai, China)
Site Information Pile Information
Project Site
Drammen
FHWA Deep
Foundation Load
Test Database
(DFLTD)
West Palm Beach & Fort Myers
Total # of Load Tests:
Woodrow Wilson Bridge over Potomac River (VA & MD)
Bayshore Freeway (CA)
West Seattle Freeway Main Span (WA)
Stillwater Bridge over St. Croix River (MN)
NNO (Nano, Japan)
McVay et al (2004)
*Concrete Pipe
Piles
St.Georges Island Bridge Replacement (FL)
Herbert C. Bonner Bridge (a.k.a. Bridge Over Oregon Inlet)
(NC)
Chesapeake Bay Bridge-Tunnel (VA)
I-664 Bridge (VA)
Published Papers, FHWA, DFLTD, & FDOT

12
Phase ITask 1.4: Data Collection
Drilled Shaft with Casing Embedded in Limestone
Insitu
Project Number Project Site# of Soil
Borings
Dimensions
(in)Length (ft)
# of Load
Test
# of Viable
Shafts
10130-1544 Gandy Bridge 116 48 43 - 83 6 4
53020-3540 Victory Bridge 28 48 69 - 100 6 3
250445-1-52-01 Jewfish Creek 98 48 45 - 67 2 1
10190-1416 Lee Roy Selmon 504 48 47 - 80 13 1
416361-2-52-01
Lee Roy Selmon Crosstown
Expressway Bridge Widening and
Deck Replacement
247 48 47 - 83 5 1
10150-3543/3546 Hillsborough Avenue 31 30 & 48 65 - 79 2 2
*Barnett Bank Headquarters
Building15 28 & 36 58 - 90 2 1
86180-1522 17th Street 95 48 40 - 100 3 3
413485-1-31-01 CR 12A Bridge Replacement 4 48 20 - 68 * *
1138 16
* No Data Found
Total # of Load Tests:
Site Information
possibly five test shafts available,
but questionable due to length of
casing in limestone
of two possible shafts, only one
had at least 3 ft of casing-
limestone overlap
need to determine if casings
present and in limestone
Comments
Shaft Information
old report (UF hard copy)
casing on test shaft was intended
to be temporary but left in place
discrepancy between FDOT and
contractor reports regarding
lengths of casing in limestone
Total # of Soil Borings:
~ 60 Shafts with No Casing and/or No Casing Embedment in Limestone
FDOT

13
Phase ITask 1.2: Steel H Pile AnalysesConvert Data to Usable Format
SPT Data
– Enter data into “Insitu Excel 2.01 Application”
• Convert to XML
• Upload to FDOT Database
Dynamic Data
– Enter Dynamic Data into Microsoft Excel
– Convert Dynamic Data into XML Format
• Modified “SoilComplete” GUI to Include Pile Driving Data (Recently Completed)
• Upload to Database

14
End of Drive (EOD) vs. Beginning of Re-Strike (BOR)
– Consider Pile Set-Up & Relaxation
– BOR only to Develop Unit Side Resistance Relationships
– EOD and Some BOR to Develop Unit End Bearing Relationship
-40
-30
-20
-10
0
10
20
30
40
50
60
70
80
90
100
100 200 300 400 500 600 700
Tip
Ele
vati
on
(ft
)
Total CAPWAP Capacity (kip)
I-4 Church St.
EOD CAPWAP SideResistance
Average EOD CAPWAPSide Resistance
BOR CAPWAP SideResistance
Average BOR CAPWAPSide Resistance
+88.5%
60
70
80
90
100
110
120
130
140
150
160
170
100 150 200 250 300 350 400 450 500 550 600
Tip
Ele
vati
on
(ft
)
Total CAPWAP Capacity (kip)
US 27
EOD CAPWAP SideResistance
Average EOD CAPWAPSide Resistance
BOR CAPWAP SideResistance
Average BOR CAPWAPSide Resistance
+51.6%
Phase ITask 1.2: Evaluate Static Capacity of
Steel H Piles

Ultimate Capacity vs. Davisson Capacity
– Consider CAPWAP Simulated Load Test Curves during BOR
Phase ITask 1.2: Evaluate Static Capacity of
Steel H Piles
∆𝑳 =𝑷𝑳
𝑨𝑬
∆𝑶𝑺 =𝑩
𝟏𝟐𝟎+ 𝟎. 𝟏𝟓 (𝒊𝒏)
16
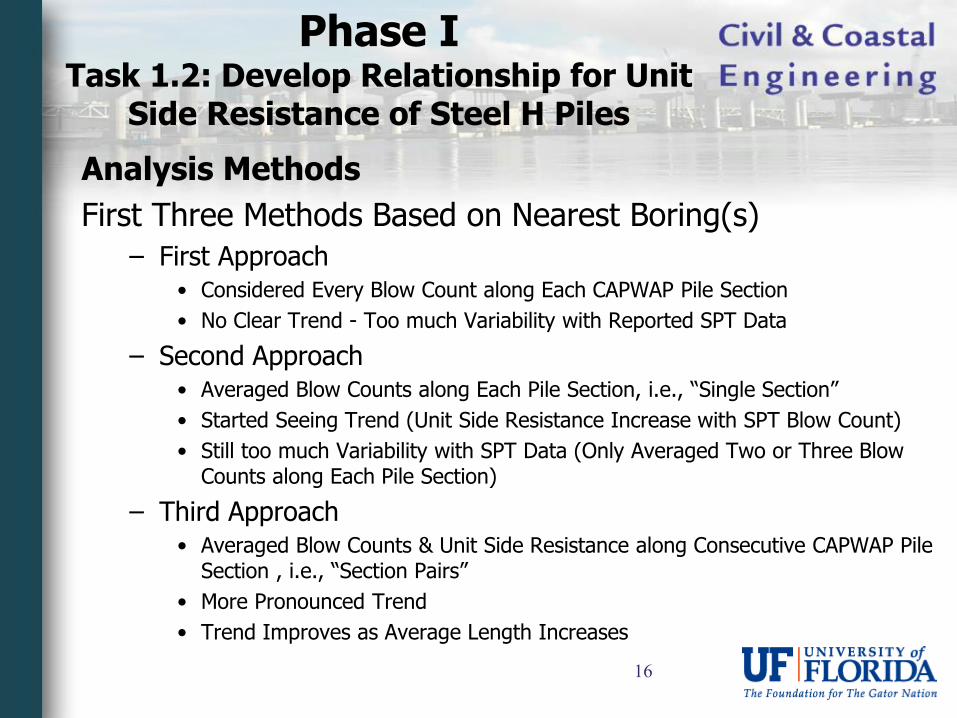
Analysis Methods
First Three Methods Based on Nearest Boring(s)
– First Approach• Considered Every Blow Count along Each CAPWAP Pile Section
• No Clear Trend - Too much Variability with Reported SPT Data
– Second Approach• Averaged Blow Counts along Each Pile Section, i.e., “Single Section”
• Started Seeing Trend (Unit Side Resistance Increase with SPT Blow Count)
• Still too much Variability with SPT Data (Only Averaged Two or Three Blow Counts along Each Pile Section)
– Third Approach• Averaged Blow Counts & Unit Side Resistance along Consecutive CAPWAP Pile
Section , i.e., “Section Pairs”
• More Pronounced Trend
• Trend Improves as Average Length Increases
Phase ITask 1.2: Develop Relationship for Unit
Side Resistance of Steel H Piles
17
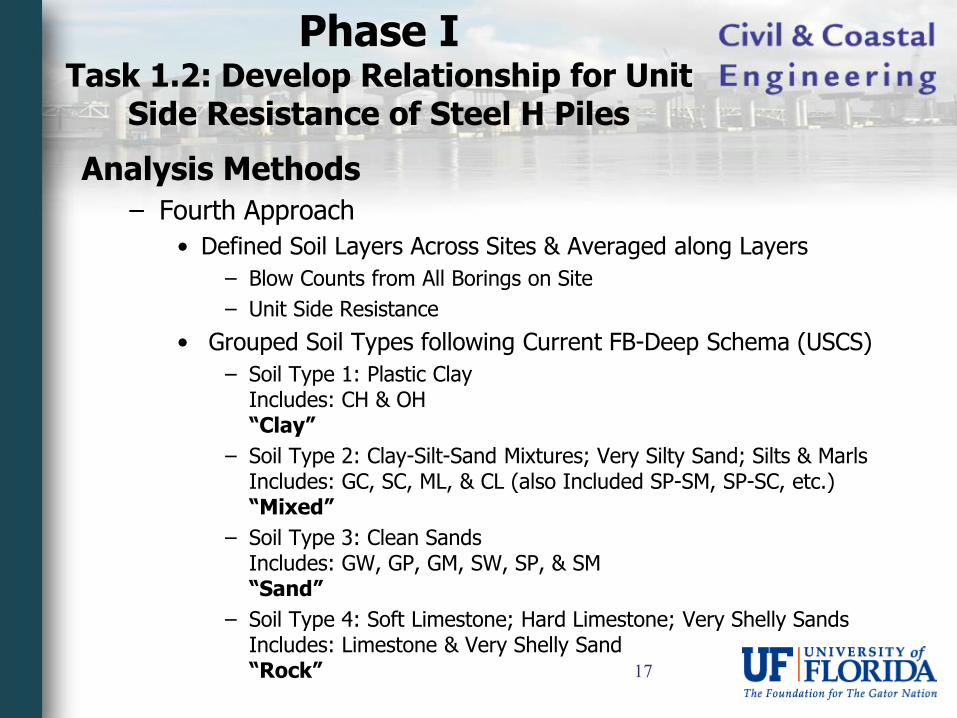
Analysis Methods
– Fourth Approach
• Defined Soil Layers Across Sites & Averaged along Layers
– Blow Counts from All Borings on Site
– Unit Side Resistance
• Grouped Soil Types following Current FB-Deep Schema (USCS)
– Soil Type 1: Plastic ClayIncludes: CH & OH“Clay”
– Soil Type 2: Clay-Silt-Sand Mixtures; Very Silty Sand; Silts & MarlsIncludes: GC, SC, ML, & CL (also Included SP-SM, SP-SC, etc.)“Mixed”
– Soil Type 3: Clean SandsIncludes: GW, GP, GM, SW, SP, & SM“Sand”
– Soil Type 4: Soft Limestone; Hard Limestone; Very Shelly SandsIncludes: Limestone & Very Shelly Sand“Rock”
Phase ITask 1.2: Develop Relationship for Unit
Side Resistance of Steel H Piles

18
0
0.5
1
1.5
2
2.5
3
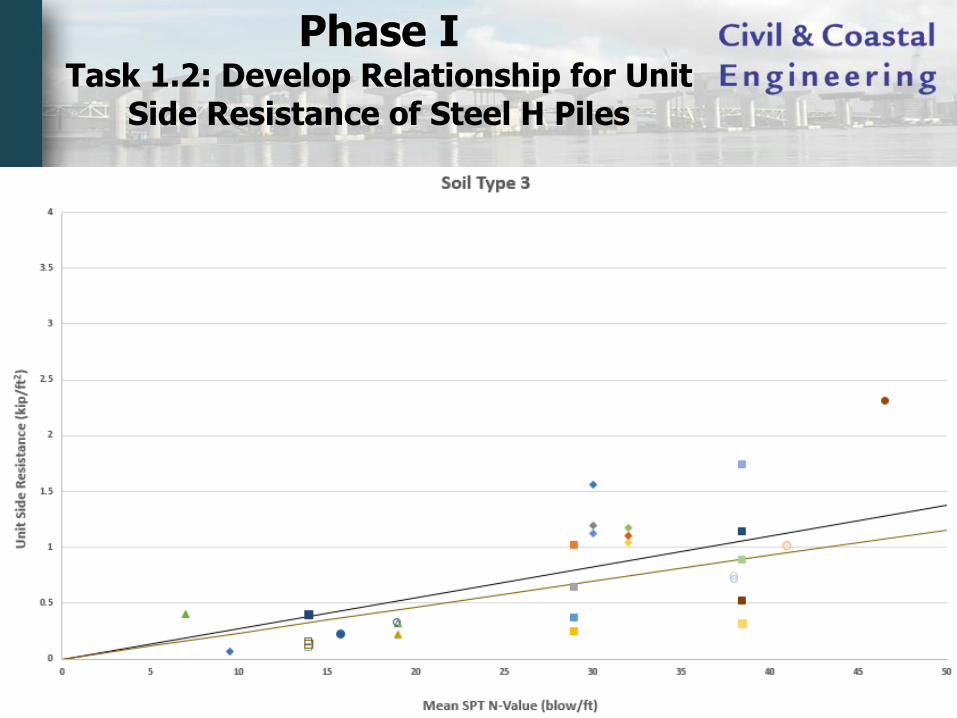
3.5
0 10 20 30 40 50 60 70
Un
it S
ide
Re
sist
an
ce (
kip
/ft2
)
SPT N-Value (blow/ft)
Soil Type 3
US 27
I-4 Ramp F1
I-4 Robinson Street
I-4 Church Street
I-95 Pembroke
I-95 Stirling
I-95 Hollywood
I-95 Hallandale
Trend Line (Zero Intercept)
Phase ITask 1.2: Develop Relationship for Unit
Side Resistance of Steel H Piles
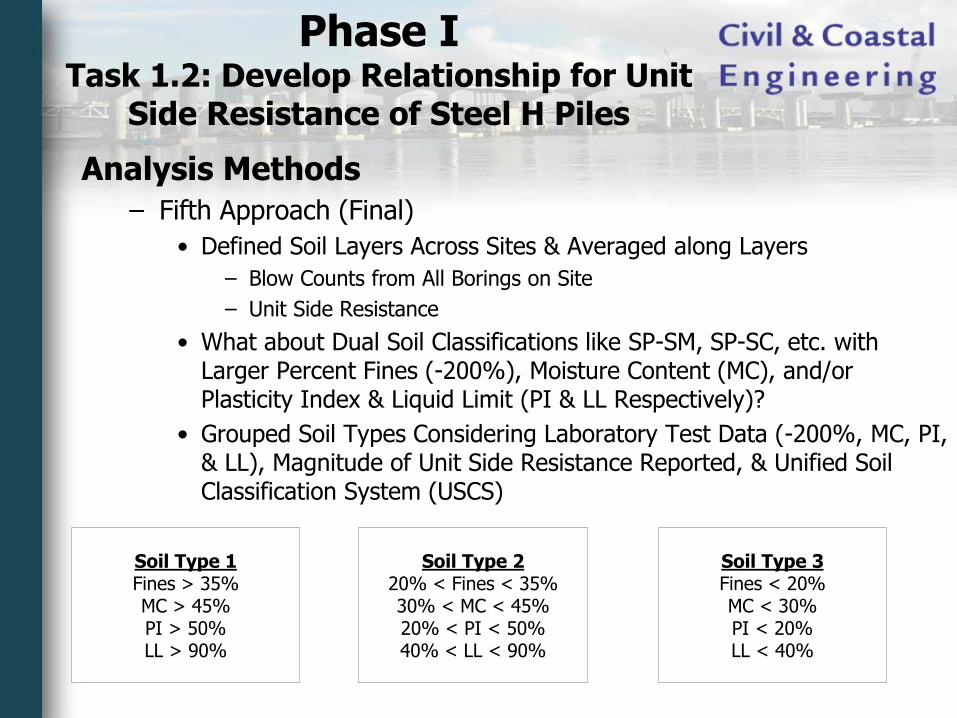
Analysis Methods
– Fifth Approach (Final)
• Defined Soil Layers Across Sites & Averaged along Layers
– Blow Counts from All Borings on Site
– Unit Side Resistance
• What about Dual Soil Classifications like SP-SM, SP-SC, etc. with Larger Percent Fines (-200%), Moisture Content (MC), and/or Plasticity Index & Liquid Limit (PI & LL Respectively)?
• Grouped Soil Types Considering Laboratory Test Data (-200%, MC, PI, & LL), Magnitude of Unit Side Resistance Reported, & Unified Soil Classification System (USCS)
Phase ITask 1.2: Develop Relationship for Unit
Side Resistance of Steel H Piles
Soil Type 1Fines > 35%MC > 45%PI > 50%LL > 90%
Soil Type 220% < Fines < 35%30% < MC < 45%20% < PI < 50%40% < LL < 90%
Soil Type 3Fines < 20%MC < 30%PI < 20%LL < 40%

20
Phase ITask 1.2: Develop Relationship for Unit
Side Resistance of Steel H Piles
0
10
20
30
40
50
60
0 10 20 30 40 50 60 70
Pe
rce
nt
Fin
es
(%)
Plasticity Index (%)
Soil Type 1
Soil Type 2
Soil Type 3
0
10
20
30
40
50
60
0 10 20 30 40 50 60
Pe
rce
nt
Fin
es
(%)
Moisture Content (%)
Soil Type 1
Soil Type 2
Soil Type 3
0
10
20
30
40
50
60
70
0 10 20 30 40 50 60
Pla
stic
ity
Ind
ex
(%)
Moisture Content (%)
Soil Type 1
Soil Type 2
Soil Type 3
21
Phase ITask 1.2: Develop Relationship for Unit
Side Resistance of Steel H Piles
22
Phase ITask 1.2: Develop Relationship for Unit
Side Resistance of Steel H Piles
23
Phase ITask 1.2: Develop Relationship for Unit
Side Resistance of Steel H Piles
0
0.1
0.2
0.3
0.4
0.5
0.6
0.7
0.8
0.9
1
1.1
1.2
1.3
1.4
1.5
1.6
1.7
1.8
0 10 20 30 40 50 60 70 80 90
Un
it S
ide
Re
sist
ance
(ts
f)
SPT N Value (blow/ft)
Ultimate Unit Side Resistance: Current FB-Deep vs. New Curves
Soil Type 1 - Plastic Clay (Current)
Soil Type 1 - Plastic Clays & Silts (New)
Soil Type 2 - Clay-Silt-Sand Mixtures (Current)
Soil Type 2 - Clay-Silt-Sand Mixtures (New)
Soil Type 3 - Clean Sand (Current)
Soil Type 3 - Clean Sand & Clay-Silt-Sand Mixtures (New)
Soil Type 4 - Soft Limestone & Very Shelly Sand (Current)
Soil Type 4 - Soft Limestone & Very Shelly Sand (New)

24
Phase ITask 1.2: Side Resistance of Steel H Piles
Current FB-Deep vs. Proposed
0
100
200
300
400
500
600
700
800
0 100 200 300 400 500 600 700 800
CAPW
AP
(kip
)
Proposed FB-Deep (kip)
Side Resistance: Proposed FB-Deep vs. CAPWAP
Mean Bias = 1.26StDev. = 0.48CV = 0.38N = 39
Under Predicts
Over Predicts
0
100
200
300
400
500
600
700
800
0 100 200 300 400 500 600 700 800
CA
PW
AP
(ki
p)
Current FB-Deep (kip)
Side Resistance: Current FB-Deep vs. CAPWAP
Mean Bias = 1.36StDev. = 0.60CV = 0.44N = 39
Under Predicts
Over Predicts
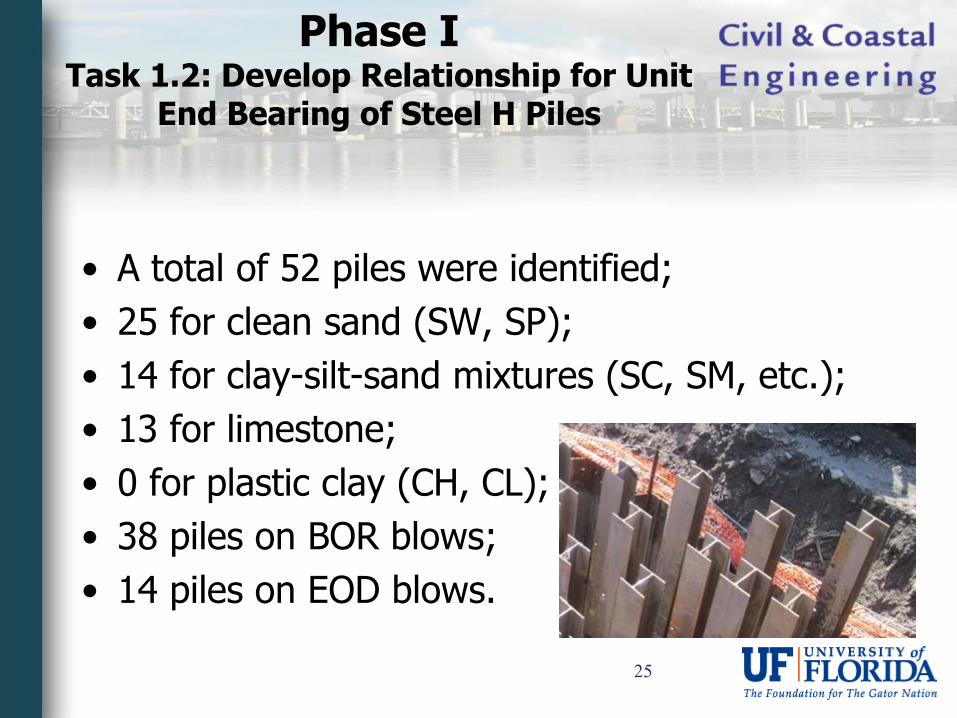
Phase ITask 1.2: Develop Relationship for Unit
End Bearing of Steel H Piles
• A total of 52 piles were identified;
• 25 for clean sand (SW, SP);
• 14 for clay-silt-sand mixtures (SC, SM, etc.);
• 13 for limestone;
• 0 for plastic clay (CH, CL);
• 38 piles on BOR blows;
• 14 piles on EOD blows.
25

26
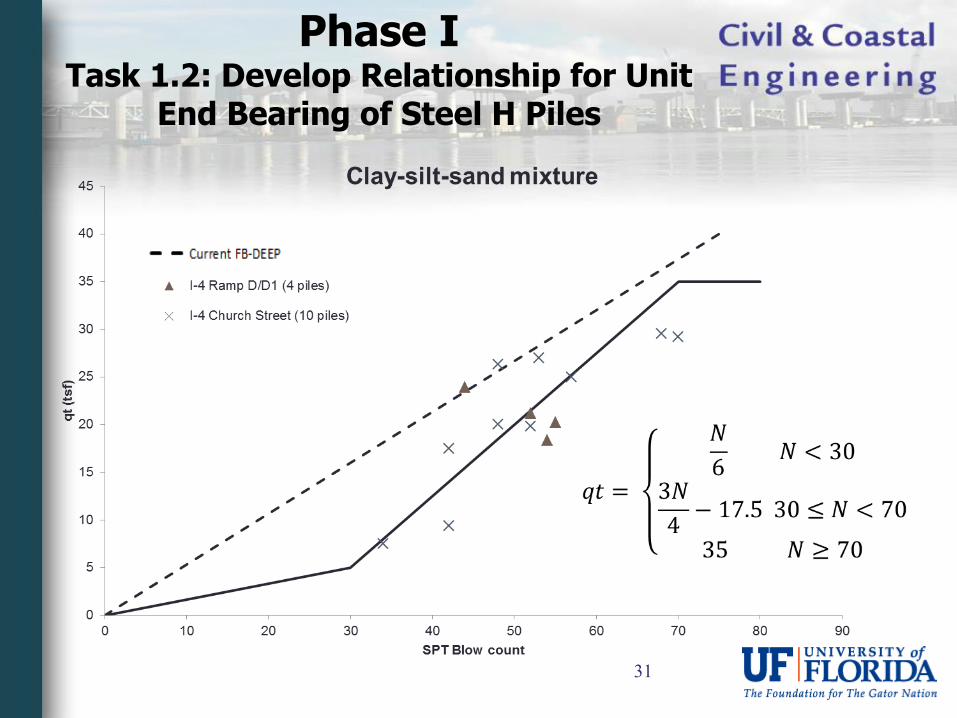
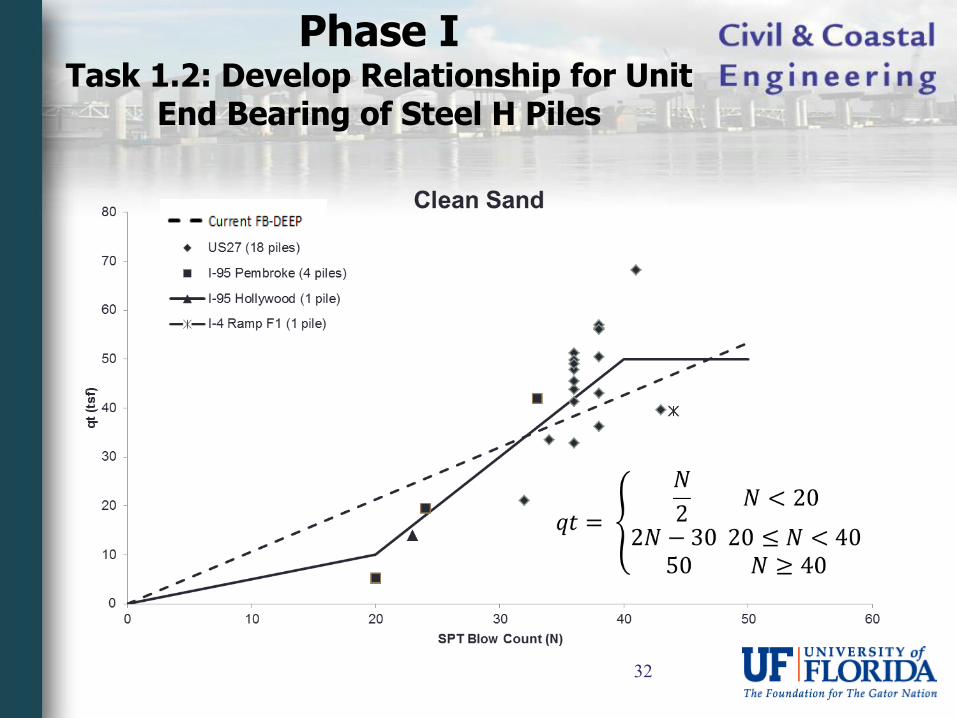
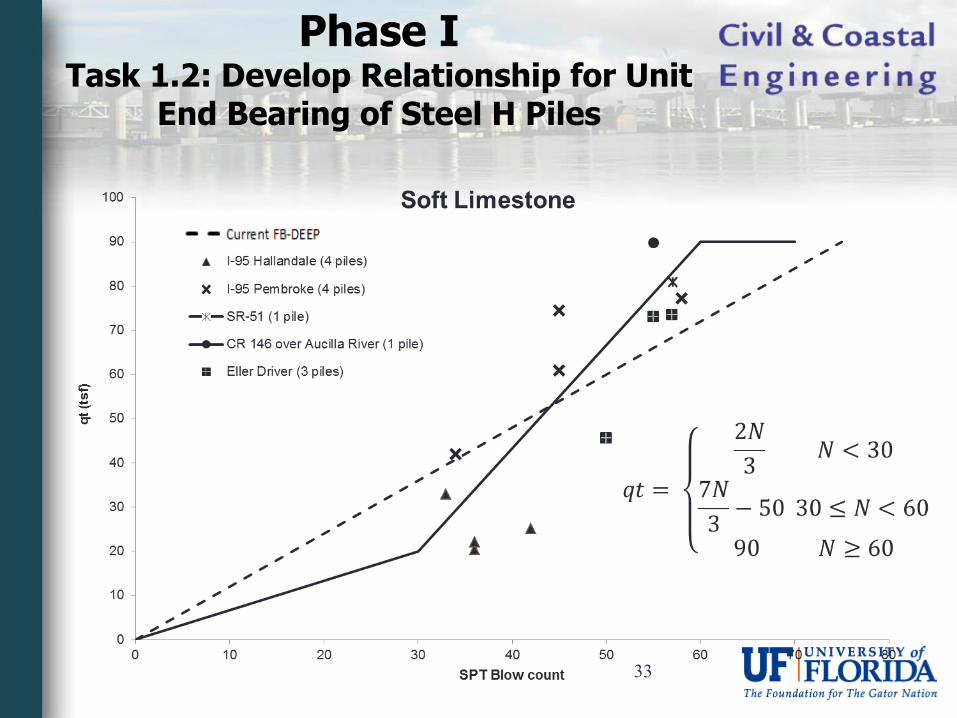
Phase ITask 1.2: Develop Relationship for Unit
End Bearing of Steel H Piles
Difference < 15%
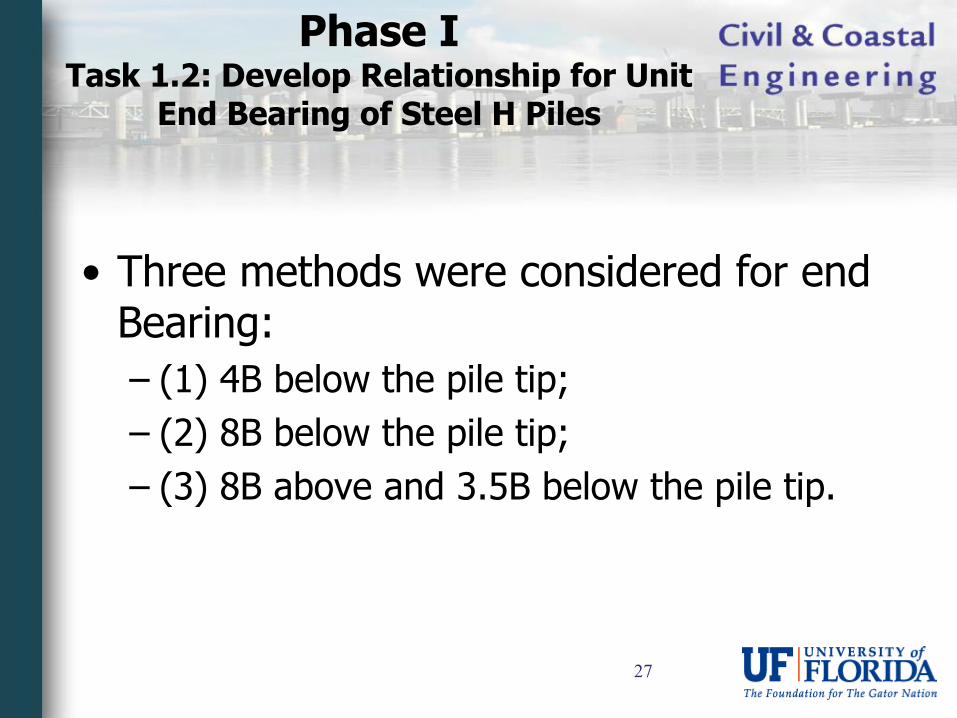
Phase ITask 1.2: Develop Relationship for Unit
End Bearing of Steel H Piles
• Three methods were considered for end Bearing:
– (1) 4B below the pile tip;
– (2) 8B below the pile tip;
– (3) 8B above and 3.5B below the pile tip.
27
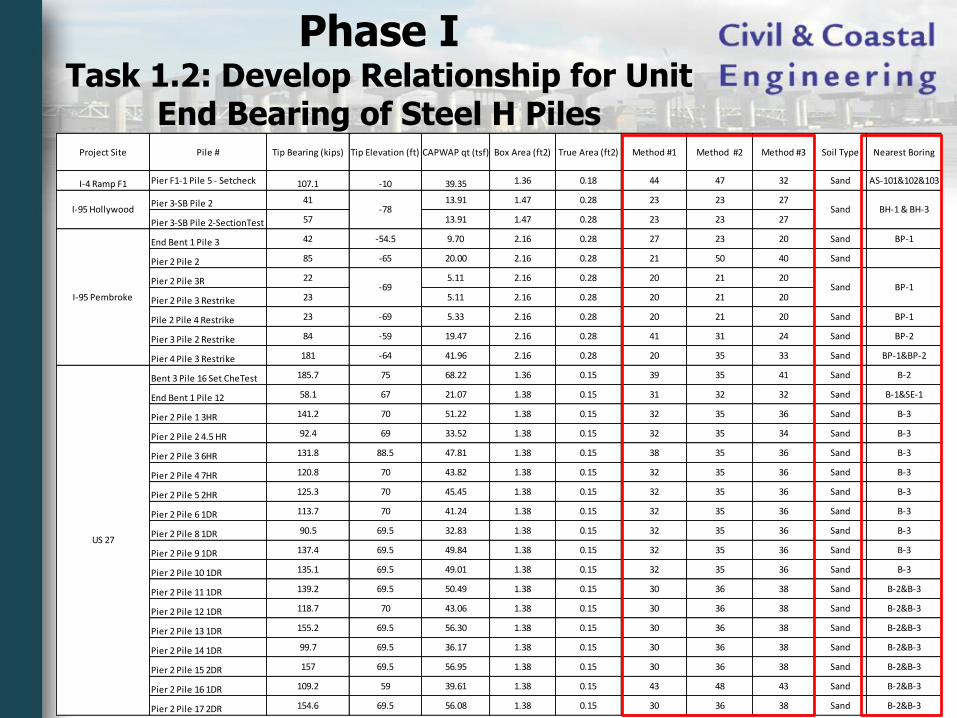
28
Project Site Pile # Tip Bearing (kips) Tip Elevation (ft) CAPWAP qt (tsf) Box Area (ft2) True Area (ft2) Method #1 Method #2 Method #3 Soil Type Nearest Boring
I-4 Ramp F1 Pier F1-1 Pile 5 - Setcheck 107.1 -10 39.35 1.36 0.18 44 47 32 Sand AS-101&102&103
Pier 3-SB Pile 2 41 13.91 1.47 0.28 23 23 27
Pier 3-SB Pile 2-SectionTest 57 13.91 1.47 0.28 23 23 27
End Bent 1 Pile 3 42 -54.5 9.70 2.16 0.28 27 23 20 Sand BP-1
Pier 2 Pile 2 85 -65 20.00 2.16 0.28 21 50 40 Sand
Pier 2 Pile 3R 22 5.11 2.16 0.28 20 21 20
Pier 2 Pile 3 Restrike 23 5.11 2.16 0.28 20 21 20
Pile 2 Pile 4 Restrike 23 -69 5.33 2.16 0.28 20 21 20 Sand BP-1
Pier 3 Pile 2 Restrike 84 -59 19.47 2.16 0.28 41 31 24 Sand BP-2
Pier 4 Pile 3 Restrike 181 -64 41.96 2.16 0.28 20 35 33 Sand BP-1&BP-2
Bent 3 Pile 16 Set CheTest 185.7 75 68.22 1.36 0.15 39 35 41 Sand B-2
End Bent 1 Pile 12 58.1 67 21.07 1.38 0.15 31 32 32 Sand B-1&SE-1
Pier 2 Pile 1 3HR 141.2 70 51.22 1.38 0.15 32 35 36 Sand B-3
Pier 2 Pile 2 4.5 HR 92.4 69 33.52 1.38 0.15 32 35 34 Sand B-3
Pier 2 Pile 3 6HR 131.8 88.5 47.81 1.38 0.15 38 35 36 Sand B-3
Pier 2 Pile 4 7HR 120.8 70 43.82 1.38 0.15 32 35 36 Sand B-3
Pier 2 Pile 5 2HR 125.3 70 45.45 1.38 0.15 32 35 36 Sand B-3
Pier 2 Pile 6 1DR 113.7 70 41.24 1.38 0.15 32 35 36 Sand B-3
Pier 2 Pile 8 1DR 90.5 69.5 32.83 1.38 0.15 32 35 36 Sand B-3
Pier 2 Pile 9 1DR 137.4 69.5 49.84 1.38 0.15 32 35 36 Sand B-3
Pier 2 Pile 10 1DR 135.1 69.5 49.01 1.38 0.15 32 35 36 Sand B-3
Pier 2 Pile 11 1DR 139.2 69.5 50.49 1.38 0.15 30 36 38 Sand B-2&B-3
Pier 2 Pile 12 1DR 118.7 70 43.06 1.38 0.15 30 36 38 Sand B-2&B-3
Pier 2 Pile 13 1DR 155.2 69.5 56.30 1.38 0.15 30 36 38 Sand B-2&B-3
Pier 2 Pile 14 1DR 99.7 69.5 36.17 1.38 0.15 30 36 38 Sand B-2&B-3
Pier 2 Pile 15 2DR 157 69.5 56.95 1.38 0.15 30 36 38 Sand B-2&B-3
Pier 2 Pile 16 1DR 109.2 59 39.61 1.38 0.15 43 48 43 Sand B-2&B-3
Pier 2 Pile 17 2DR 154.6 69.5 56.08 1.38 0.15 30 36 38 Sand B-2&B-3
I-95 Hollywood -78
US 27
Sand BH-1 & BH-3
-69 Sand BP-1I-95 Pembroke
Phase ITask 1.2: Develop Relationship for Unit
End Bearing of Steel H Piles
29
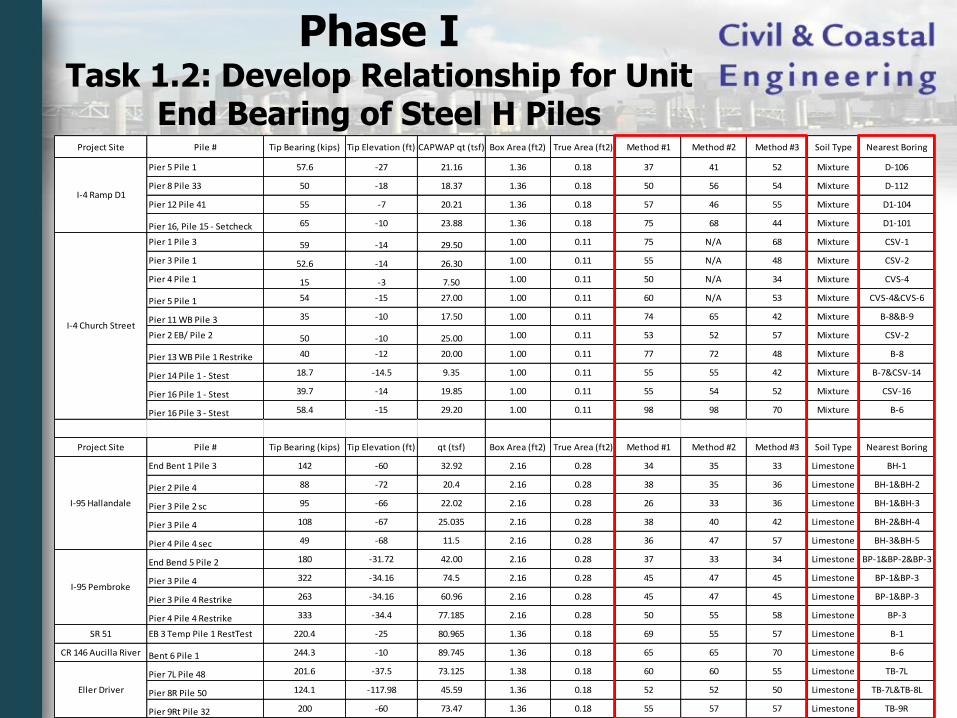
Project Site Pile # Tip Bearing (kips) Tip Elevation (ft) CAPWAP qt (tsf) Box Area (ft2) True Area (ft2) Method #1 Method #2 Method #3 Soil Type Nearest Boring
Pier 5 Pile 1 57.6 -27 21.16 1.36 0.18 37 41 52 Mixture D-106
Pier 8 Pile 33 50 -18 18.37 1.36 0.18 50 56 54 Mixture D-112
Pier 12 Pile 41 55 -7 20.21 1.36 0.18 57 46 55 Mixture D1-104
Pier 16, Pile 15 - Setcheck 65 -10 23.88 1.36 0.18 75 68 44 Mixture D1-101
Pier 1 Pile 3 59 -14 29.50 1.00 0.11 75 N/A 68 Mixture CSV-1
Pier 3 Pile 1 52.6 -14 26.30 1.00 0.11 55 N/A 48 Mixture CSV-2
Pier 4 Pile 1 15 -3 7.50 1.00 0.11 50 N/A 34 Mixture CVS-4
Pier 5 Pile 1 54 -15 27.00 1.00 0.11 60 N/A 53 Mixture CVS-4&CVS-6
Pier 11 WB Pile 3 35 -10 17.50 1.00 0.11 74 65 42 Mixture B-8&B-9
Pier 2 EB/ Pile 2 50 -10 25.00 1.00 0.11 53 52 57 Mixture CSV-2
Pier 13 WB Pile 1 Restrike 40 -12 20.00 1.00 0.11 77 72 48 Mixture B-8
Pier 14 Pile 1 - Stest 18.7 -14.5 9.35 1.00 0.11 55 55 42 Mixture B-7&CSV-14
Pier 16 Pile 1 - Stest 39.7 -14 19.85 1.00 0.11 55 54 52 Mixture CSV-16
Pier 16 Pile 3 - Stest 58.4 -15 29.20 1.00 0.11 98 98 70 Mixture B-6
Project Site Pile # Tip Bearing (kips) Tip Elevation (ft) qt (tsf) Box Area (ft2) True Area (ft2) Method #1 Method #2 Method #3 Soil Type Nearest Boring
End Bent 1 Pile 3 142 -60 32.92 2.16 0.28 34 35 33 Limestone BH-1
Pier 2 Pile 4 88 -72 20.4 2.16 0.28 38 35 36 Limestone BH-1&BH-2
Pier 3 Pile 2 sc 95 -66 22.02 2.16 0.28 26 33 36 Limestone BH-1&BH-3
Pier 3 Pile 4 108 -67 25.035 2.16 0.28 38 40 42 Limestone BH-2&BH-4
Pier 4 Pile 4 sec 49 -68 11.5 2.16 0.28 36 47 57 Limestone BH-3&BH-5
End Bend 5 Pile 2 180 -31.72 42.00 2.16 0.28 37 33 34 Limestone BP-1&BP-2&BP-3
Pier 3 Pile 4 322 -34.16 74.5 2.16 0.28 45 47 45 Limestone BP-1&BP-3
Pier 3 Pile 4 Restrike 263 -34.16 60.96 2.16 0.28 45 47 45 Limestone BP-1&BP-3
Pier 4 Pile 4 Restrike 333 -34.4 77.185 2.16 0.28 50 55 58 Limestone BP-3
SR 51 EB 3 Temp Pile 1 RestTest 220.4 -25 80.965 1.36 0.18 69 55 57 Limestone B-1
CR 146 Aucilla River Bent 6 Pile 1 244.3 -10 89.745 1.36 0.18 65 65 70 Limestone B-6
Pier 7L Pile 48 201.6 -37.5 73.125 1.38 0.18 60 60 55 Limestone TB-7L
Pier 8R Pile 50 124.1 -117.98 45.59 1.36 0.18 52 52 50 Limestone TB-7L&TB-8L
Pier 9Rt Pile 32 200 -60 73.47 1.36 0.18 55 57 57 Limestone TB-9R
I-95 Hallandale
Eller Driver
I-95 Pembroke
I-4 Ramp D1
I-4 Church Street
Phase ITask 1.2: Develop Relationship for Unit
End Bearing of Steel H Piles

Phase ITask 1.2: Develop Relationship for Unit
End Bearing of Steel H Piles
R-Square Method #1 Method #2 Method #3
Clay-silt-sand mixtures 0.11 0.15 0.67
Clean Sands 0.09 0.26 0.90
Soft limestone 0.14 0.82 0.77
• Based on the above analyses, Method 3 -8B above and 3.5B below resulted in the highest correlation
30
Phase ITask 1.2: Develop Relationship for Unit
End Bearing of Steel H Piles
31
Phase ITask 1.2: Develop Relationship for Unit
End Bearing of Steel H Piles
32
Phase ITask 1.2: Develop Relationship for Unit
End Bearing of Steel H Piles
33

34
Phase ITask 1.2: End Bearing of Steel H Piles
Current FB-Deep vs. Proposed

35
Phase ITask 1.2: Total Capacity of Steel H Piles
Current FB-Deep vs. Proposed
0
100
200
300
400
500
600
700
800
0 100 200 300 400 500 600 700 800
CA
PW
AP
(ki
p)
Current FB-Deep (kip)
Total Capacity: Current FB-Deep vs. CAPWAP
Mean Bias = 1.20StDev. = 0.35CV = 0.29N = 39
Under Predicts
Over Predicts
0
100
200
300
400
500
600
700
800
0 100 200 300 400 500 600 700 800
CA
PW
AP
(ki
p)
Proposed FB-Deep (kip)
Total Capacity: Proposed FB-Deep vs. CAPWAP
Mean Bias = 1.14StDev. = 0.29CV = 0.25N = 39
Under Predicts
Over Predicts

36
Phase ITask 1.4: Develop Relationship for Unit
Side Resistance between Casing & Limestone Interface

Phase ITask 1.4: Unit Side Resistance between
Casing & Limestone Interface
37
• 16 drilled shafts with casing into limestone;
• 9 Osterberg, 7 Statnamic;
• Reported thickness of the steel casings were approximately 1 inch;
• The average limestone elevation was determined from the Geotechnical reports;
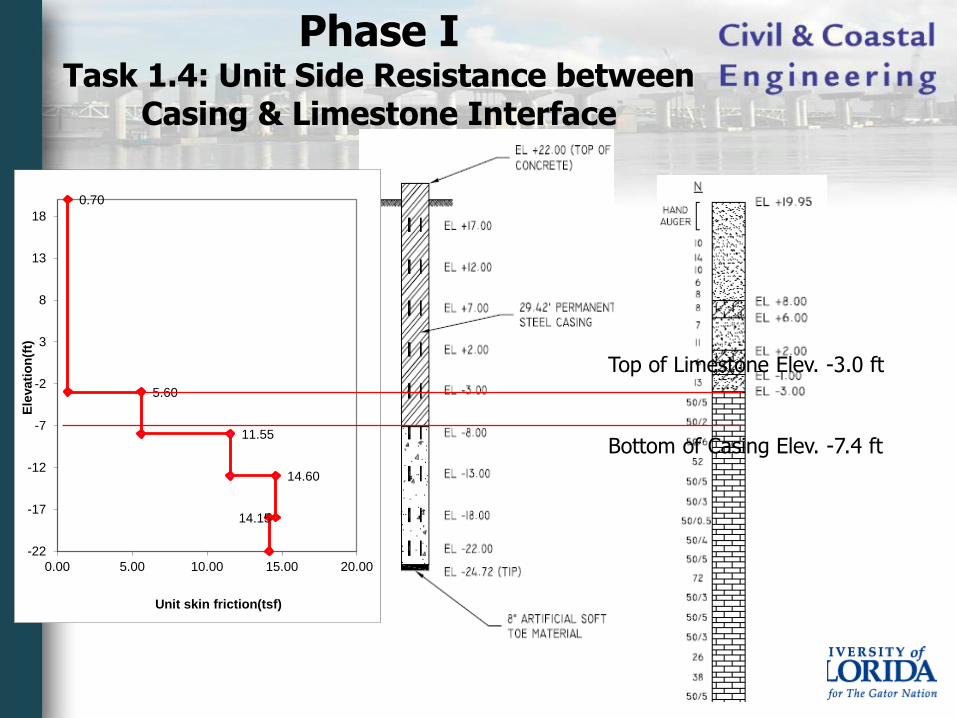
Top of Limestone Elev. -3.0 ft
Bottom of Casing Elev. -7.4 ft
0.70
5.60
11.55
14.60
14.15
-22
-17
-12
-7
-2
3
8
13
18
0.00 5.00 10.00 15.00 20.00
Ele
va
tio
n(f
t)
Unit skin friction(tsf)
Phase ITask 1.4: Unit Side Resistance between
Casing & Limestone Interface

T-Z CurvesFs = 1.5 tsf
Fs = 2.5 tsf
Phase ITask 1.4: Unit Side Resistance between
Casing & Limestone Interface
39
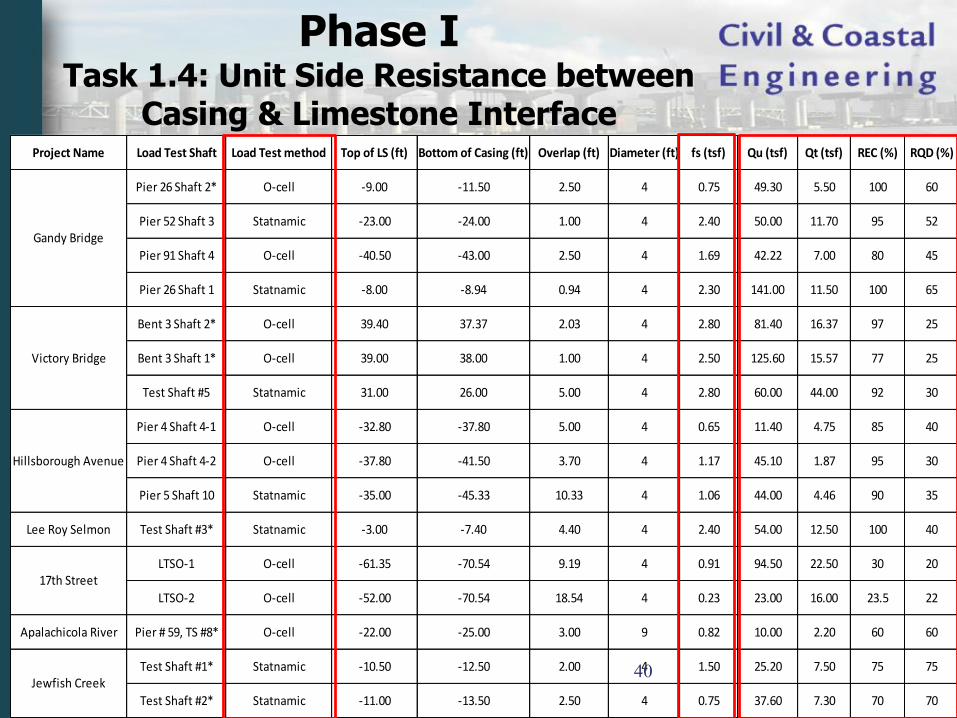
Project Name Load Test Shaft Load Test method Top of LS (ft) Bottom of Casing (ft) Overlap (ft) Diameter (ft) fs (tsf) Qu (tsf) Qt (tsf) REC (%) RQD (%)
Pier 26 Shaft 2* O-cell -9.00 -11.50 2.50 4 0.75 49.30 5.50 100 60
Pier 52 Shaft 3 Statnamic -23.00 -24.00 1.00 4 2.40 50.00 11.70 95 52
Pier 91 Shaft 4 O-cell -40.50 -43.00 2.50 4 1.69 42.22 7.00 80 45
Pier 26 Shaft 1 Statnamic -8.00 -8.94 0.94 4 2.30 141.00 11.50 100 65
Bent 3 Shaft 2* O-cell 39.40 37.37 2.03 4 2.80 81.40 16.37 97 25
Bent 3 Shaft 1* O-cell 39.00 38.00 1.00 4 2.50 125.60 15.57 77 25
Test Shaft #5 Statnamic 31.00 26.00 5.00 4 2.80 60.00 44.00 92 30
Pier 4 Shaft 4-1 O-cell -32.80 -37.80 5.00 4 0.65 11.40 4.75 85 40
Pier 4 Shaft 4-2 O-cell -37.80 -41.50 3.70 4 1.17 45.10 1.87 95 30
Pier 5 Shaft 10 Statnamic -35.00 -45.33 10.33 4 1.06 44.00 4.46 90 35
Lee Roy Selmon Test Shaft #3* Statnamic -3.00 -7.40 4.40 4 2.40 54.00 12.50 100 40
LTSO-1 O-cell -61.35 -70.54 9.19 4 0.91 94.50 22.50 30 20
LTSO-2 O-cell -52.00 -70.54 18.54 4 0.23 23.00 16.00 23.5 22
Apalachicola River Pier # 59, TS #8* O-cell -22.00 -25.00 3.00 9 0.82 10.00 2.20 60 60
Test Shaft #1* Statnamic -10.50 -12.50 2.00 4 1.50 25.20 7.50 75 75
Test Shaft #2* Statnamic -11.00 -13.50 2.50 4 0.75 37.60 7.30 70 70
Gandy Bridge
Victory Bridge
Jewfish Creek
17th Street
Hillsborough Avenue
Phase ITask 1.4: Unit Side Resistance between
Casing & Limestone Interface
40

Phase ITask 1.4: Unit Side Resistance between
Casing & Limestone Interface
41
• The rock’s cohesion, c, was found based on the rock strengths
• 𝐶𝑜ℎ𝑒𝑠𝑖𝑜𝑛, 𝑐 =1
2𝑞𝑢 𝑞𝑡
• then the estimated unit skin friction (FDOT), 𝑓𝑠𝑢∗ , for uncased shafts was found
• 𝑓𝑠𝑢∗ =
1
2𝑞𝑢 𝑞𝑡 𝑅𝐸𝐶
Unit skin friction of uncased shafts
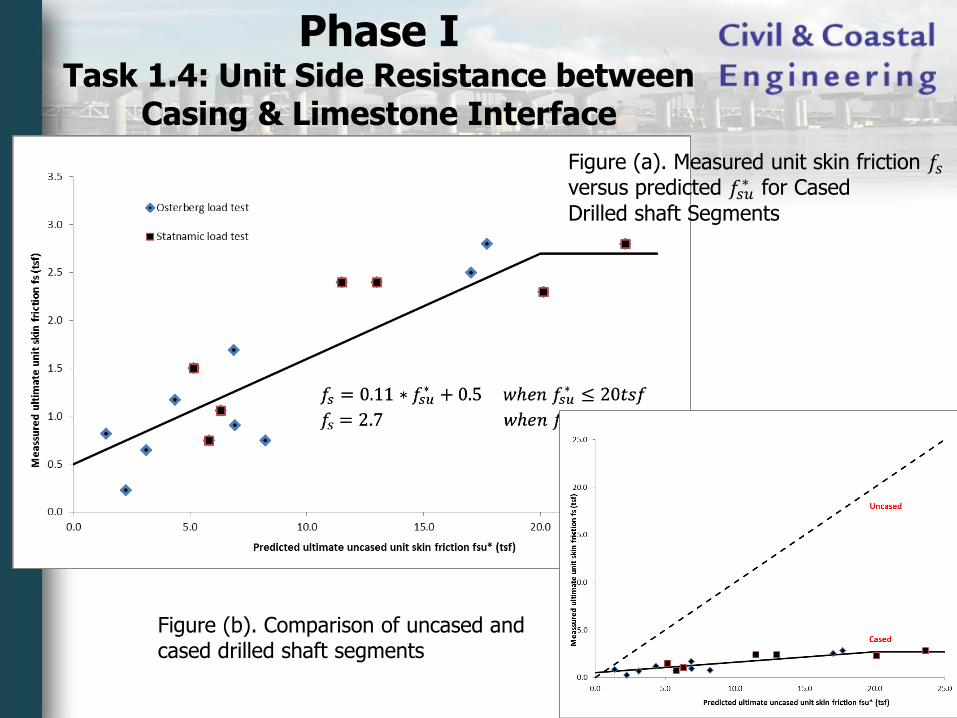
Figure (b). Comparison of uncased and cased drilled shaft segments
Phase ITask 1.4: Unit Side Resistance between
Casing & Limestone Interface
Figure (a). Measured unit skin friction 𝑓𝑠versus predicted 𝑓𝑠𝑢
∗ for Cased
Drilled shaft Segments
Thank You
Questions?


![Denial-of-Service Open Threat Signaling (DOTS). · architecture, called DDoS Open Threat Signaling (DOTS) [I-D.ietf-dots-architecture], in which a DOTS client can inform a DOTS server](https://img.pdfslide.us/doc/110x75/6018af73a358a566d57c4efb/denial-of-service-open-threat-signaling-dots-architecture-called-ddos-open-threat.jpg)


![ROTHER PRECISION · MSR [option] Battery charger Specification Direct thermal line printing Default : 42cpl 32cpl Option . 48cpl 6), 24cpl Eng : dots, dots Kor : dots dots] Simplified/Traditional](https://img.pdfslide.us/doc/110x75/5fd2b041bcfdb17b192b5e3d/rother-msr-option-battery-charger-specification-direct-thermal-line-printing-default.jpg)
![Untitled-2 [] · 2 DOTS 1 DOT 1 DOT POWER BY CYLINDER 2 DOTS 3 DOTS 2 DOTS 2 DOTS ELECTRO-INJECTOR GREEN WHITE RED 6 CYLINDERS TYPE AND 8 CYLINDERS ELECTRO-INJECTORS REFERENCE TABLE](https://img.pdfslide.us/doc/110x75/5f083f2f7e708231d4210fbe/untitled-2-2-dots-1-dot-1-dot-power-by-cylinder-2-dots-3-dots-2-dots-2-dots.jpg)