Embed Size (px)
Citation preview

DOT HS 813 099 September 2021
Evaluation of Seat Foams For the FMVSS No. 213 Test Bench

DISCLAIMER
This publication is distributed by the U.S. Department of Transportation, National Highway Traffic Safety Administration, in the interest of information exchange. The opinions, findings, and conclusions expressed in this publication are those of the authors and not necessarily those of the Department of Transportation or the National Highway Traffic Safety Administration. The United States Government assumes no liability for its contents or use thereof. If trade or manufacturers’ names or products are mentioned, it is because they are considered essential to the object of the publication and should not be construed as an endorsement. The United States Government does not endorse products or manufacturers.
NOTE: This report is published in the interest of advancing motor vehicle safety research. While the report may provide results from research or tests using specifically identified motor vehicle or motor vehicle equipment models, it is not intended to make conclusions about the safety performance or safety compliance of those motor vehicles or equipment items, and no such conclusions should be drawn.
Suggested APA Format Reference:
Wietholter, K., Louden, A., Sullivan, L., & Burton, R. (2016, June; revised 2021, September).Evaluation of seat foams for the FMVSS No. 213 test bench. (Report No. DOT HS 813 099). National Highway Traffic Safety Administration.

i
TECHNICAL REPORT DOCUMENTATION PAGE 1. Report No.DOT HS 813 099
2. Government Accession No. 3. Recipient's Catalog No.
4. Title and SubtitleEvaluation of Seat Foams for the FMVSS No. 213 Test Bench
5. Report Date September 2021 6. Performing Organization Code NHTSA/NSR-130
7. Authors Kedryn Wietholter, TRC Inc.; Allison Louden and Lisa Sullivan (formerly of the National Highway Traffic Safety Administration); and Ron Burton, TRC Inc.
8. Performing Organization ReportNo.
9. Performing Organization Name and Address National Highway Traffic Safety Administration Vehicle Research and Test Center P.O. Box 37 East Liberty, OH 43319
10. Work Unit No. (TRAIS)
11. Contract or Grant No.
12. Sponsoring Agency Name and Address National Highway Traffic Safety Administration 1200 New Jersey Avenue SE Washington, DC 20590
13.Type of Report and Period CoveredFinal Report 14. Sponsoring Agency Code NHTSA/NSR-130
15. Supplementary Notes
16. Abstract:Child restraint systems sold in the United States must meet performance requirements specified in Federal Motor Vehicle Safety Standard No. 213, “Child restraint systems,” which includes a sled test simulating a 48 kmh (30 mph) frontal impact to which manufacturers must certify. The design of the original FMVSS No. 213 test bench was based on a 1974 Chevrolet Impala bench seat. The agency updated some features of the bench seat in 2003 (68 FR 37620) to better represent vehicle seats of that time. As part of NHTSA’s periodic regulatory review, the agency once again evaluated whether the current FMVSS No. 213 test bench, including the seat foam, needs further modification to represent the rear seats of recent model passenger cars. This report describes the identification and testing of foam samples that are representative of more recent model year vehicles.
A pendulum impact device (PID) and test procedure capable of dynamically evaluating the foam response of rear seat foams were developed. The PID was used to evaluate a vehicle fleet of 15 recent model year vehicles, and results showed that the 2008 Nissan Sentra foam was the most representative of the average vehicle foam response. Working with the Woodbridge Group, a new, single-piece foam was developed. Multiple samples were manufactured and proved to be repeatable in PID testing, indentation force deflection testing, and sled testing on both the current and upgraded FMVSS No. 213 frontal buck.
This report is the same as the report with the same title found in Docket NHTSA-2020-0093-0010 and NHTSA-2013-0055-0013 dated June 2016, except for minor editorial updates. 17. Key Words FMVSS 213, seat foam
18. Distribution StatementDocument is available to the public from the National Technical Information Service, www.ntis.gov.
19. Security Classif. (of this report)Unclassified
20. Security Classif. (of this page)Unclassified
21. No. of Pages 75
22. Price
Form DOT F 1700.7 (8-72) Reproduction of completed page authorized

ii
Table of Contents Executive Summary ...................................................................................................................... 1
1. Introduction ........................................................................................................................... 2
2. Development of a Dynamic Impact Device ......................................................................... 5
2.1. FMVSS No. 213 Test Bench ............................................................................................ 5 2.2. Dynamic Impact Device Parameters ................................................................................ 6 2.3. Development of Pendulum Impact Device ...................................................................... 7 2.4. Pendulum Impact Device Fabrication .............................................................................. 8
3. Evaluation of MY 2006-2011 Vehicles ............................................................................... 10
3.1. Impact Locations ............................................................................................................ 10 3.2. Test Matrix ..................................................................................................................... 11 3.3. Impact Analysis .............................................................................................................. 12 3.4. Force-Displacement Plots .............................................................................................. 12
4. Dynamic Impact Evaluation of Foam Samples Out of Vehicle ....................................... 14
4.1. Test Set-Up ..................................................................................................................... 14 4.2. Test Matrix ..................................................................................................................... 14 4.3. Dynamic Impact Evaluation Results .............................................................................. 14
5. Development and Testing of Representative Foam Samples ........................................... 16
5.1. Evaluation of Representative Foam ............................................................................... 16
6. Development of Representative Foam ............................................................................... 17
7. Development of Single-Piece Foam .................................................................................... 21
8. Dynamic Impact Evaluation of Single-Piece Foams ........................................................ 22
9. Single-Piece Foam Sled Testing Evaluation ...................................................................... 29
10. Additional Testing of Single-Piece Foam .......................................................................... 32
11. Evaluation of the Durability and Dynamic Force-Deflection Characteristic of WB Foams Under Repeated Use ........................................................................................... 38
12. Evaluation of the Quasi-Static Force-Deflection Characteristics WB Foams under Repeated Use ................................................................................................................... 41
13. Summary .............................................................................................................................. 48
Appendix A ................................................................................................................................ A-1
Appendix B ................................................................................................................................ B-1
Appendix C ................................................................................................................................ C-1

iii
List of Tables Table 1. Vehicles Used for Quasi-Static Testing ............................................................................ 3 Table 2. Displacements and Velocities From 2009 Sled Tests ....................................................... 7 Table 3. Pendulum Impact Device Verification Tests .................................................................... 9 Table 4. Test Matrix of Vehicles Tested at VRTC ....................................................................... 11 Table 5. Foam Samples Tested ..................................................................................................... 14 Table 6. Nissan Sentra Foam CFD Results ................................................................................... 16 Table 7. Nissan Sentra Foam IFD Results .................................................................................... 16 Table 8. Dynamic Impact Test Matrix of EF and FMVSS No. 213 Foam Combinations ............ 17 Table 9. Adjustable Table Dynamic Impact Evaluation Test Matrix ........................................... 23 Table 10. Percent CV Comparison for Orange Cover on Adjustable Table ................................. 24 Table 11. Percent CV Comparison for Blue Cover on Adjustable Table ..................................... 26 Table 12. FMVSS No. 213 Bench Dynamic Impact Evaluation Test Matrix .............................. 26 Table 13. Percent CV Comparison on FMVSS No. 213 Bench ................................................... 27 Table 14. Test Matrix for Sled Testing ......................................................................................... 30 Table 15. Sled Testing Foam Displacement Results ................................................................... 31 Table 16. Sled Testing Foam Displacement Comparison ............................................................. 31 Table 17. PID Comparisons for WB Foams 1-4 Before and After Sled Testing.......................... 33 Table 18. Test Matrix for Evaluation of WB Foams 1-4 .............................................................. 34 Table 19. HIII 3YO in Evenflo Triumph Advance, Rear-Facing Harnessed, With LATCH ....... 35 Table 20. HIII 6YO in Graco SmartSeat Harness, With L/S Belt ................................................ 35 Table 21. HIII 6YO in Graco MyRide65, With LATCH ............................................................. 36 Table 22. 10 YO HIII ATD in a Graco SmartSeat Booster With 3-Pt Belts ................................ 36 Table 23. Average IFD Values ..................................................................................................... 41 Table 24. Comparison of WB and VRTC 50 Percent IFD Values ............................................... 43 Table 25. 25/65 Percent IFD Values Throughout Sled Series ...................................................... 44 Table 26. 50 Percent IFD Values Throughout Sled Series ........................................................... 45 Table 27. 2009 Sled Test Data .................................................................................................... A-1 Table 28. Single-Piece Foam Sled Tests..................................................................................... A-2 Table 29. WB Foam 1-4 Sled Testing ........................................................................................ A-3 Table 30. Experimental Foam Combination Test Matrix ........................................................... C-1
iv
List of Figures Figure 1. Quasi-Static Test Set-up .................................................................................................. 3 Figure 2. Force-Displacement Response for Quasi-Static Tests .................................................... 4 Figure 3. FMVSS No. 213 Test Bench Cushion Assembly ............................................................ 5 Figure 4. FMVSS No. 213 Set-up ................................................................................................... 6 Figure 5. Pendulum Impact Device ................................................................................................ 8 Figure 6. Geometry of the Rear Seat ............................................................................................ 10 Figure 7. Impact Locations in the Rear Seat ................................................................................. 11 Figure 8. Dynamic Force-Displacement Curves for the 2007 Jeep Commander ......................... 12 Figure 9. Force-Displacement Curves for the Vehicle Fleet at Location 2 .................................. 13 Figure 10. Force-Displacement Curves for the Vehicle Fleet at Location 2 ................................ 13 Figure 11. In-Vehicle and Out-of-Vehicle Nissan Sentra Results ................................................ 15 Figure 12. Dynamic Force-Displacement Plots of Foam Samples ............................................... 15 Figure 13. Out-of-Vehicle Foam Angle Verification ................................................................... 18 Figure 14. EF Dynamic Force-Displacement Comparison ........................................................... 19 Figure 15. Foam and Plywood Wrapped in ECE R44 Material ................................................... 19 Figure 16. 2008 Nissan Sentra Versus 5" (Tests 14 and 15) and 4" (Tests 22 and 23) Foam ...... 20 Figure 17. Difference Between Skin and No Skin ........................................................................ 21 Figure 18. Adjustable Table Versus FMVSS No. 213 Bench Set-up ........................................... 22 Figure 19. Comparison of WB Foams 1 and 2 With Orange Cover on Adjustable Table ........... 23 Figure 20. WB Foam 1 Cover Comparison .................................................................................. 25 Figure 21. WB Foam 2 Cover Comparison .................................................................................. 25 Figure 22. Comparison of WB Foams 1 and 2 on FMVSS No. 213 Bench ................................. 27 Figure 23. 2012 Average NCAP Light Vehicle Pulse Compared to Pulse for Sled Testing. ....... 29 Figure 24. WB Foams 1-4 Force-Displacement Curves Before and After Sled Testing .............. 32 Figure 25. WB Foam 4 (No Skin) Durability Evaluation ............................................................. 38 Figure 26. WB Foam 3 (No Skin) Durability Evaluation ............................................................. 39 Figure 27. WB Foam 2 Durability Evaluation .............................................................................. 40 Figure 28. WB Foam 2 Cut ........................................................................................................... 40 Figure 29. IFD Force-Displacement Curves for WB Foams 1 to 8 .............................................. 42 Figure 30. WB Foams 5 to 8 Force-Displacement Overlay for 50 Percent IFD Testing ............. 43 Figure 31. WB Foam 4 Force-Displacement Overlay for 25/65 Percent Testing ........................ 44 Figure 32. WB Foam 5 Force-Displacement Overlay for 25/65 Percent Testing ........................ 45 Figure 33. WB Foam 4 Force-Displacement Overlay for 50 Percent Testing.............................. 46 Figure 34. WB Foam 5 Force-Displacement Overlay for 50 Percent Testing.............................. 46

1
Executive Summary Child restraint systems sold in the United States must meet performance requirements specified in Federal Motor Vehicle Safety Standard No. 213, “Child restraint systems,” which includes a sled test simulating a 48 km/h (30mph) frontal impact to which manufacturers must certify. The design of the original FMVSS No. 213 test bench was based on a 1974 Chevrolet Impala bench seat. The National Highway Traffic Safety Administration updated some features of the bench seat in 2003 (68 FR 37620) to better represent vehicle seats of that time. As part of its periodic regulatory review, NHTSA once again evaluated whether the current FMVSS No. 213 test bench, including the seat foam, needs further modification to represent the rear seats of recent model passenger cars. This report describes the identification and testing of foam samples that are representative of more recent model year vehicles.
A dynamic impact test device and test procedure was developed for use in evaluating the force-displacement characteristics of the rear seat in recent model year vehicles. The pendulum impact device (PID) was used to evaluate the rear seats of 15 vehicles with model years ranging from 2006 to 2011. The 2008 Nissan Sentra force-displacement response was found to be most similar to the average vehicle seat response of the vehicles tested and was identified as the target foam response for production.
Working with a foam manufacturer, the Woodbridge Group, foam used in Nissan Sentras was evaluated and used to develop an experimental foam (EF) intended to resemble the Nissan Sentra foam response. The initial EF that was procured was stiffer than the 2008 Nissan Sentra, and a series of foam combinations were subsequently tested using the PID to identify a foam combination that was more representative of the 2008 Nissan Sentra. A two-piece foam comprised of 51 mm (2 in) EF on top of 51 mm (2 in) of the FMVSS No. 213 foam was selected for additional testing. The foam manufacturer tested the two-piece foam and recommended the following specifications for a single-piece foam: density of 47 kg/m³ ± 10 percent, 50 percent IFD value of 440 N ± 10 percent, and 50 percent CFD value of 6.6 pcf ± 10 percent.1
The foam manufacturer then produced four samples, and these new samples were tested using the PID and in sled testing. This allowed for comparison with the Nissan Sentra seat response and for the assessment of repeatability of each new foam sample. The new foam samples were found to have force-displacement responses similar to the Nissan Sentra in-vehicle response. The foam samples demonstrated repeatability in both PID testing and in the dummy injury response measures from sled testing. The dynamic and quasi-static force-displacement characteristics of the foam samples did not change appreciably with repeated use. However, the foam samples demonstrated an increased susceptibility to cuts after extensive use during sled testing. A solution to cuts in the foam was found using spray adhesive.
1 Provided by the Woodbridge Group

2
1. Introduction Child restraint systems sold in the United States must meet performance requirements specified in the Federal Motor Vehicle Safety Standard No. 213, which includes a sled test simulating a 48 km/h (30mph) frontal impact to which manufacturers must certify.2 In 1974, the Highway Safety Research Institute at the University of Michigan prepared a report for NHTSA that elaborated the development of a test bench for use in testing child restraint systems.3 The design of the original FMVSS No. 213 test bench was based on a 1974 Chevrolet Impala bench seat. The agency updated some features of the bench seat in 2003 (68 FR 37620) to better represent vehicle seats of that time. As part of NHTSA’s periodic regulatory review, the agency once again evaluated whether the current FMVSS No. 213 test bench, including the seat foam, needs further modification to represent the rear seats of recent model passenger cars.
To evaluate how the FMVSS No. 213 bench compares to more current vehicle seats, 13 vehicles were tested at NHTSA’s Vehicle Research and Test Center (VRTC) using a quasi-static device. The second-row seating positions of the vehicles listed in Table 1 were each tested at the longitudinal and lateral center of the seat. FMVSS No. 213 foam was tested in the standard bench configuration at the center location. Additionally, the foams specified in United Nations Economic Commission for Europe Regulation No. 44 (ECE R44)4 and New Programme for the Assessment of Child Restraint Systems (NPACS)5 were tested in the FMVSS No. 213 side impact bench configuration6 forward of the lateral center.
2 49 CFR 571 213 3 Stalnaker, R. L., Benson, J. B., & Melvin, J. W. (1974, September 14). Be1t retractor testing with standard vehicle seat (Appendix D) (Report No. DOT HS 4-00865). National Highway Traffic Safety Administration. Available at http://deepblue.lib.umich.edu/bitstream/2027.42/1306/2/32096.0001.001.pdf 4 Uniform provisions concerning the approval of restraining devices for child occupants of power driven vehicles (child restraint systems) 5 NPACS is similar to NHTSA’s (and the general European) New Car Assessment Program (NCAP), in that it is a voluntary consumer information program, rather than a binding regulation. The different is that NPACS is being designed to test CRSs, while NCAP focuses on how the vehicle performs. 6 Configuration proposed in the NPRM published January 28, 2014; 79 FR 4570

3
Table 1. Vehicles Used for Quasi-Static Testing
2003 Ford Crown Victoria
2005 Chrysler 300C
2006 Honda Ridgeline
2006 Volkswagen Passat
2007 Ford 500
2007 Ford Expedition
2007 Saturn Vue
2008 Ford Taurus X
2008 Mazda CX-9
2008 Nissan Sentra
2008 Nissan Versa
2008 Subaru Tribeca
2008 Toyota Highlander
The test apparatus, shown in Figure 1, loaded the seat using a 203 mm (8 in) diameter aluminum disk attached to a hydraulic device at an average rate of 0.37 mm/s. A string potentiometer measured displacement, and a load cell measured the force. The results shown in Figure 2 indicate that the FMVSS No. 213 foam is less stiff than the vehicle seats measured.
Figure 1. Quasi-Static Test Set-up

4
Figure 2. Force-Displacement Response for Quasi-Static Tests
The purpose of this report is to detail the development of foam samples that are representative of the characteristics of newer model vehicle seats. Since seats are dynamically loaded by the child and CRS in real-world crashes, it was decided that the development of a new FMVSS No. 213 test bench seat cushion foam would be done based on dynamic force-displacement characteristics rather than quasi-static. To accomplish this, a research tool was developed that was capable of distinguishing the dynamic force-displacement characteristics of the second-row seat in recent model year vehicles; this resulted in a dynamic impact test device and test procedure. FMVSS No. 213 sled testing was used to make assessments on the performance of the new foam samples.
5
2. Development of a Dynamic Impact Device
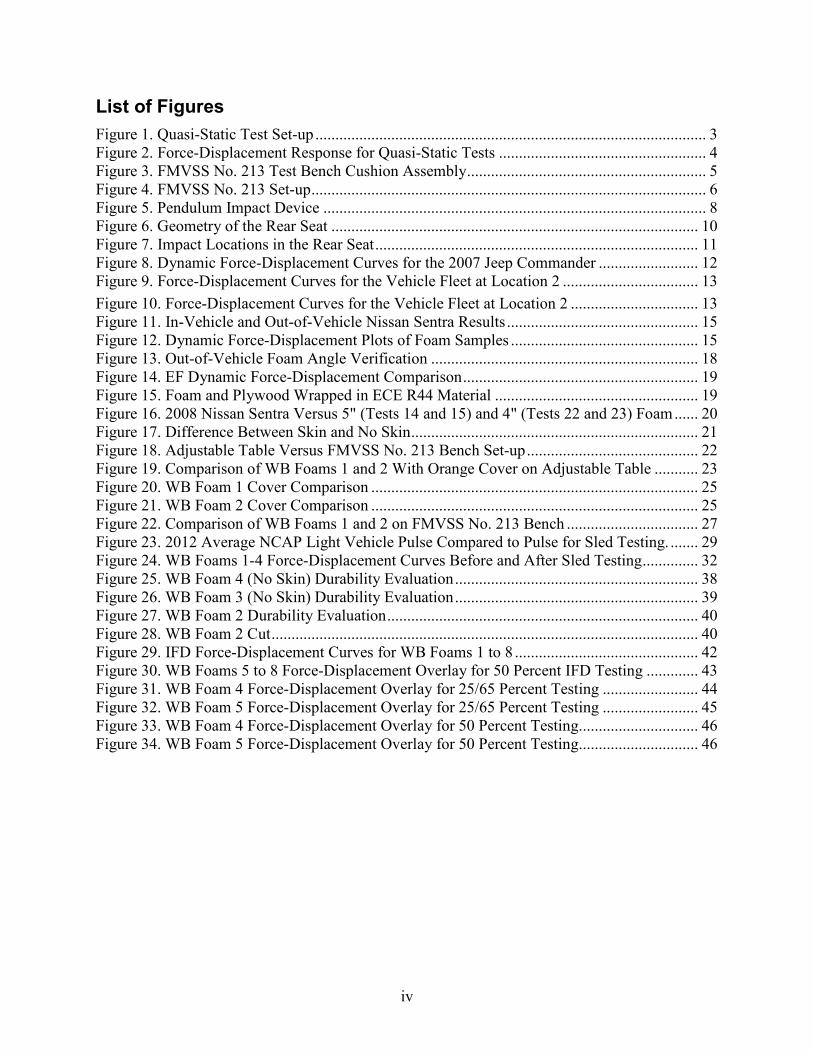
2.1. FMVSS No. 213 Test Bench The FMVSS No. 213 test bench is comprised of 102 mm (4 in) thick, medium soft grade foam and 51 mm (2 in) thick, extra firm, high-density grade foam placed on a plywood sheet inside a zippered vinyl cloth, assembled as shown in Figure 3.7
Figure 3. FMVSS No. 213 Test Bench Cushion Assembly
When conducting FMVSS No. 213 tests, a CRS and anthropomorphic test device (ATD) are installed on the test bench, and performance is assessed based on injury values and excursion limits of the ATD’s head and knee. Figure 4 shows a typical test set-up using a Hybrid III 6-year-old (HIII 6 YO) child ATD.
7 Stalnaker, Benson, & Melvin, 1974.

6
Figure 4. FMVSS No. 213 Set-up
2.2. Dynamic Impact Device Parameters To obtain meaningful dynamic force-displacement characteristics of seat foams, the impact device must compress the foam a similar amount as occurs in FMVSS No. 213 sled testing. Also, since foam characteristics can be rate dependent, the impact velocity used was selected to be similar to that encountered in sled tests. Therefore, the design parameters for the dynamic impact device came from a series of FMVSS No. 213 sled tests conducted in 2009 at Transportation Research Center Inc. Velocity and displacement parameters were determined based upon data from CRABI 12-month-old (CRABI 12 MO), HIII 3 YO, HIII 6 YO, and HIII 10 YO ATDs along with varying CRSs. A summary of the testing is located in Appendix A, Table A1.
CRS displacement into the seat cushion (Z-direction) was found using image analysis software for 23 tests (Test Numbers 001-012).The displacement values ranged from 34 mm to 136 mm. A displacement parameter for the impact device of 125 mm was selected, since it is near the higher end of the demonstrated range and is approximately 80 percent of the total thickness of the FMVSS No. 213 bench foam. Subsequently, the velocity parameter was found for tests 1-12 by differentiating the tracked displacements. The velocities ranged from approximately 1 m/s to 5 m/s, so 3 m/s was selected as the target velocity for the dynamic impact device. Velocity and displacement data is shown in Table 2.

7
Table 2. Displacements and Velocities From 2009 Sled Tests
Test # (VRTC #) ATD Size Child Restraint
Seat Displacement
– Z [mm]
Velocity – Z [m/s]
S091123-1 (Test_001)
CRABI 12 MO Chicco KeyFit 30 136 3.0 HIII 3 YO Graco MyRide65 72 0.8
S091124-1 (Test_002)
CRABI 12 MO Chicco KeyFit 30 50 2.7 HIII 3 YO Graco MyRide65 78 1.7
S091125-1 (Test_003)
CRABI 12 MO Graco MyRide65 78 2.0 HIII 3 YO Graco Comfort Sport 47 1.2
S091130-1 (Test_004)
CRABI 12 MO Graco MyRide65 57 1.2 HIII 3 YO Graco Comfort Sport 43 2.6
S091130-2 (Test_005)
CRABI 12 MO Sunshine Kids Radian 65 49 1.8 HIII 3 YO Sunshine Kids Radian 65 35 1.3
S091201-1 (Test_006)
CRABI 12 MO Sunshine Kids Radian 65 47 1.9 HIII 3 YO Sunshine Kids Radian 65 No Data (Lost Camera View)
S091203-1 (Test_007)
CRABI 12 MO Graco Comfort Sport 56 1.4 HIII 6 YO Cosco Pronto 85 2.4
S091203-2 (Test_008)
CRABI 12 MO Graco Comfort Sport 42 1.1 HIII 6 YO Evenflo Big Kid 73 2.1
S091204-1 (Test_009)
HIII 10 YO Cosco Pronto 46 5.0
HIII 6 YO Cosco Pronto Anomalous Data (Broken Belt)
S091208-1 (Test_010)
HIII 10 YO Evenflo Big Kid 68 1.8 HIII 6 YO Evenflo Big Kid 90 2.7
S091209-1 (Test_011)
HIII 10 YO Cosco Pronto 55 4.7 HIII 6 YO Cosco Pronto 92 2.6
S091218-2 (Test_012) HIII 10 YO Evenflo Big Kid 66 1.4
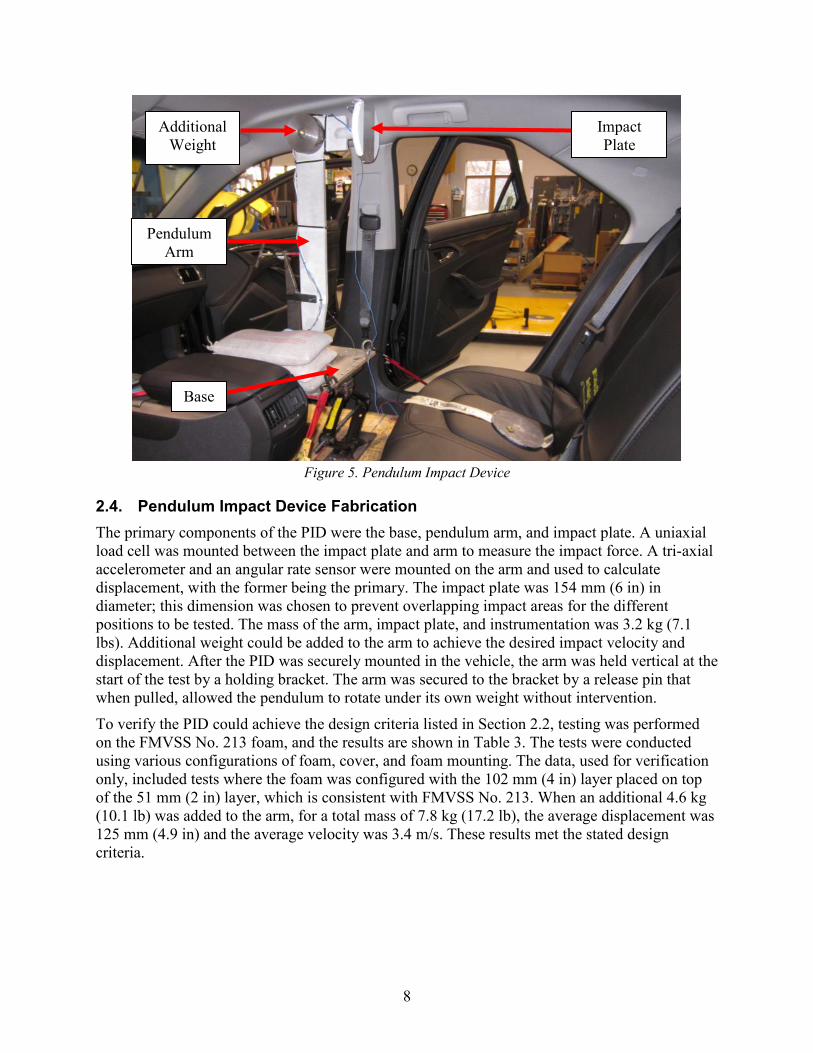
2.3. Development of Pendulum Impact Device Literature was reviewed for dynamic drop test set-ups, which included ideas such as a pendulum fixture and drop tower.8 To meet the design criteria for the dynamic impact device, a design similar to the pendulum dynamic test fixture was chosen. A pendulum impact device (PID) needed to be small enough to test inside a vehicle, so the rear compartment areas of a number of vehicles were surveyed. The PID was designed to fit within the minimum dimensions found. The PID was also designed so that the weight of the pendulum could be adjusted to achieve the target displacement and velocity parameters. Figure 5 shows the PID inside a vehicle.
8 Waagmeester, K. (2009, March 11). Test bench foam definition (PowerPoint, presented at GRSP Informal Group CRS Testing, 9th Meeting, Paris). Available at www.unece.org/fileadmin/DAM/trans/doc/2009/wp29grsp/CRS-09-08e.pdf
8
Base
Pendulum Arm
Impact Plate
Additional Weight
Figure 5. Pendulum Impact Device
2.4. Pendulum Impact Device Fabrication The primary components of the PID were the base, pendulum arm, and impact plate. A uniaxial load cell was mounted between the impact plate and arm to measure the impact force. A tri-axial accelerometer and an angular rate sensor were mounted on the arm and used to calculate displacement, with the former being the primary. The impact plate was 154 mm (6 in) in diameter; this dimension was chosen to prevent overlapping impact areas for the different positions to be tested. The mass of the arm, impact plate, and instrumentation was 3.2 kg (7.1 lbs). Additional weight could be added to the arm to achieve the desired impact velocity and displacement. After the PID was securely mounted in the vehicle, the arm was held vertical at the start of the test by a holding bracket. The arm was secured to the bracket by a release pin that when pulled, allowed the pendulum to rotate under its own weight without intervention.
To verify the PID could achieve the design criteria listed in Section 2.2, testing was performed on the FMVSS No. 213 foam, and the results are shown in Table 3. The tests were conducted using various configurations of foam, cover, and foam mounting. The data, used for verification only, included tests where the foam was configured with the 102 mm (4 in) layer placed on top of the 51 mm (2 in) layer, which is consistent with FMVSS No. 213. When an additional 4.6 kg (10.1 lb) was added to the arm, for a total mass of 7.8 kg (17.2 lb), the average displacement was 125 mm (4.9 in) and the average velocity was 3.4 m/s. These results met the stated design criteria.

9
Table 3. Pendulum Impact Device Verification Tests
Configuration Test Number
Displacement [mm] Velocity [m/s]
213 foam with cover mounted on 213 Bench 1 133 3.5 2 117 3.6
213 foam without cover on ground 3 126 3.3 4 121 3.3
213 foam without cover on adjustable table 5 128 3.4 Average 125 3.4

10
3. Evaluation of MY 2006-2011 Vehicles To identify a representative foam response under dynamic conditions, the PID was used to evaluate the rear seats of 15 vehicles with model years ranging from 2006 to 2011.
3.1. Impact Locations The rear seat impact locations were chosen after evaluating the geometry on the surface of the seat. Most rear seats had large angles or sloping sections, such as the waterfall and side bolster, which varied from vehicle to vehicle. As shown in Figure 6, the waterfall is near the seat bight and the side bolster is on the outboard section of the seat.
Figure 6. Geometry of the Rear Seat
The impact locations were chosen to evaluate the front, side, and center of the seat. For location 1, the forward edge of the impact plate was positioned 25 mm (1 in) aft of the front of the seat and centered on the longitudinal centerline of the seat. For location 2, the rearward edge of the impact plate was positioned 25 mm (1 in) forward of the waterfall location and centered on the longitudinal centerline of the seat. If there was no waterfall, location 2 was 25 mm (1 in) forward of the seat bight. Location 3 was the farthest outboard and forward location, where the edge of the impact plate was positioned 25 mm (1 in) from the farthest outboard edge of the seat and 25 mm (1 in) from the adjacent edge of the seat. The three indicated locations for testing provide three distinct locations on the rear seat and are marked in Figure 7.
Waterfall Seat bi
Side Bolster
Centerline
ght

11
1
2
Waterfall
1"
Centerline
1"
1"
3
Figure 7. Impact Locations in the Rear Seat
The PID was positioned such that the impact plate was horizontal at first contact with the seat. Other aspects of the test procedure using the PID include vehicle preparation, identifying impact locations, PID installation, testing, and data processing. The comprehensive test procedure is in Appendix B.
3.2. Test Matrix The PID was used to evaluate force-displacement characteristics of rear seats in 15 vehicles comprised of 7 cars, 5 SUVs, 2 vans, and a pickup truck. Table 4 identifies the vehicles that were tested.
Table 4. Test Matrix of Vehicles Tested at VRTC
Pickup SUV Van Car 2006 Dodge Durango 1 2006 Mercury Monterey 1 2007 Chevrolet Silverado 1 2007 Jeep Commander 1 2007 Saturn Vue 1 2008 Nissan Sentra 1 2008 Subaru Tribeca 1 2010 Buick Lacrosse 1 2010 Ford Taurus 1 2010 Kia Forte 1 2011 Acura MDX 1 2011 Cadillac CTS 1 2011 Cadillac CTS (2) 1 2011 Honda Odyssey 1 2011 Hyundai Sonata 1
Total 1 5 2 7 Pickup SUV Van Car
1"

12
3.3. Impact Analysis At locations 1 and 3, the force-displacement curves indicated that the PID interacted with the features underneath the seat. In some vehicles, the foam was supported by a sturdy metal brace or the vehicle’s floor pan near the edges of the seat. Less interaction was observed at location 2. The graph in Figure 8 shows an example where the maximum loads from locations 1 (red curve) and 3 (blue curve) were much higher than from location 2 (green curve), indicating that the PID did not interact with the seat supports at location 2 as it did at locations 1 and 3. Overall, the force-displacement curves recorded for location 2 were primarily from loading the foam and not the substructures, so the data from the location 2 tests were used for characterizing the rear seat foams. The average rear seat thickness at location 2 was 84 mm (3.3 in) with a standard deviation of 13 mm (0.5 in), which is much less than the current FMVSS No. 213 bench.
Figure 8. Dynamic Force-Displacement Curves for the 2007 Jeep Commander
3.4. Force-Displacement Plots Data from each vehicle tested in location 2 is shown in Figure 9. The force-displacement data from each vehicle is compared to the FMVSS No. 213, ECE R44, and NPACS foams. The FMVSS No. 213 foam was evaluated both on the test bench with the cover and on a flat surface without the cover for comparison. ECE R44 and NPACS foams were tested without their cover on a flat surface as well. The rear seat foams for all the vehicles were softer than the NPACS and ECE R44 foams but stiffer than either configuration of FMVSS No. 213 foam.
Because the results from the 2011 Hyundai Sonata were similar in shape to location 1 and 3 impacts seen in Figure 8, the seat was investigated for rigid structures underneath the impact location. Deconstruction of the seat proved that a plastic structure spanned along the entire underside of the seat. Because the force-displacement curve did not accurately represent foam response, the Hyundai Sonata was excluded from future analysis.

13
Figure 9. Force-Displacement Curves for the Vehicle Fleet at Location 2
The average location 2 force-displacement curve for the remaining vehicles was calculated and is plotted in Figure 10. It was found to be very similar to that from the 2008 Nissan Sentra, also highlighted in Figure 10. Thus, the Nissan Sentra seat foam was identified as being representative of that found in a typical rear seat.
Figure 10. Force-Displacement Curves for the Vehicle Fleet at Location 2

14
4. Dynamic Impact Evaluation of Foam Samples Out of Vehicle After testing vehicle seat foams in vehicle environments, testing was performed to compare the responses of vehicle foams and currently available frontal sled test bench foams in a constant environment outside of the vehicle. Testing required that the vehicle seat be disassembled so that just the foam remained, removing fabric covers and any rigid structures. This testing also included initial examination into the effect of covers.
4.1. Test Set-Up Foam samples were tested by placing them horizontally on an adjustable scissor jack table that was sturdy and did not move during impact. The adjustable table was used to mimic the flat, rigid surfaces of test benches that have no open areas or hard spots. Since the FMVSS No. 213 foam was larger than the other foam samples tested and did not fit on the adjustable table, it was placed on the ground for testing.
4.2. Test Matrix The rear seat foam from the 2008 Nissan Sentra was selected for additional testing and analysis, due to its similarity to the average vehicle seat response. It was tested both with and without its original cover. ECE R44, NPACS, and FMVSS No. 213 foams were also evaluated for comparison without their respective covers.
Table 5. Foam Samples Tested
Test Foam
ECE R44 Foam
NPACS Foam
213 Foam on Adjustable Table
2008 Nissan Sentra Foam, Cover
2008 Nissan Sentra Foam, No Cover
4.3. Dynamic Impact Evaluation Results The responses from the in-vehicle (dark green) and out-of-vehicle tests (bright green) on the Nissan Sentra foam were compared and were found to be similar (see Figure 11). Figure 12 shows the force-displacement curves for the foam samples tested with the PID. The current FMVSS No. 213 foam was the softest of all foam configurations tested.

15
Figure 11. In-Vehicle and Out-of-Vehicle Nissan Sentra Results
Figure 12. Dynamic Force-Displacement Plots of Foam Samples
16
5. Development and Testing of Representative Foam Samples
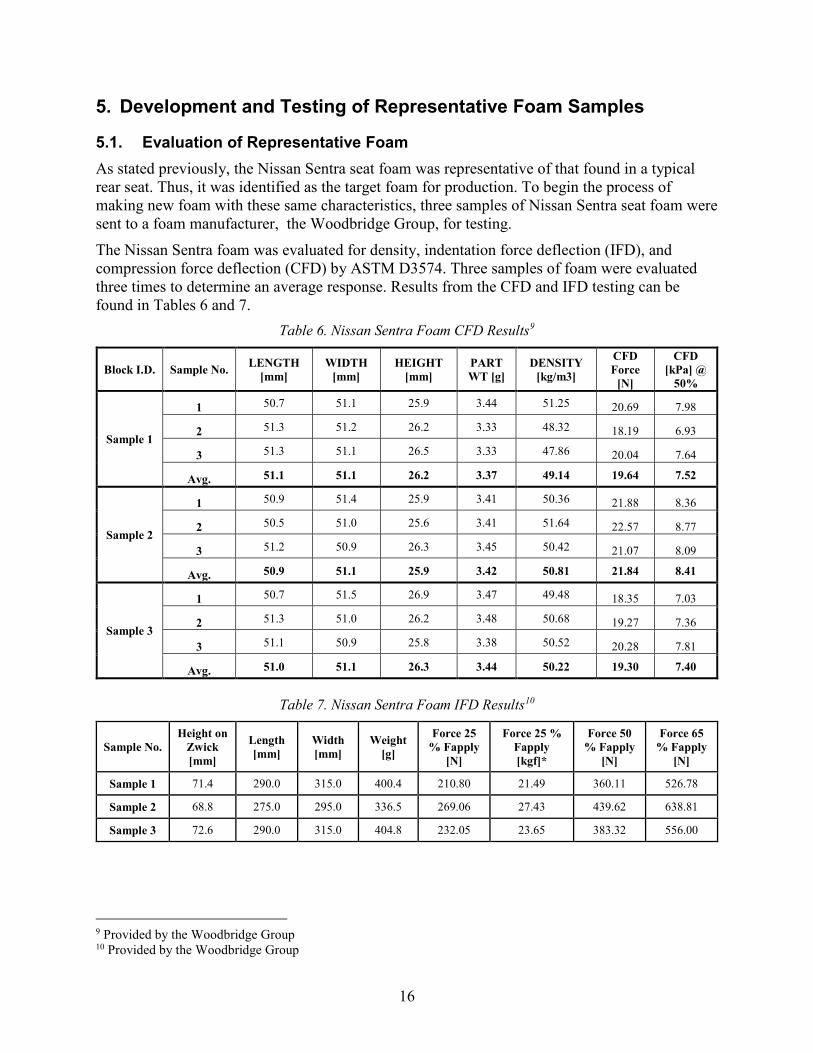
5.1. Evaluation of Representative Foam As stated previously, the Nissan Sentra seat foam was representative of that found in a typical rear seat. Thus, it was identified as the target foam for production. To begin the process of making new foam with these same characteristics, three samples of Nissan Sentra seat foam were sent to a foam manufacturer, the Woodbridge Group, for testing.
The Nissan Sentra foam was evaluated for density, indentation force deflection (IFD), and compression force deflection (CFD) by ASTM D3574. Three samples of foam were evaluated three times to determine an average response. Results from the CFD and IFD testing can be found in Tables 6 and 7.
Table 6. Nissan Sentra Foam CFD Results9
Block I.D. Sample No. LENGTH [mm]
WIDTH [mm]
HEIGHT [mm]
PART WT [g]
DENSITY [kg/m3]
CFD Force
[N]
CFD [kPa] @
50%
Sample 1
1 50.7 51.1 25.9 3.44 51.25 20.69 7.98
2 51.3 51.2 26.2 3.33 48.32 18.19 6.93
3 51.3 51.1 26.5 3.33 47.86 20.04 7.64
Avg. 51.1 51.1 26.2 3.37 49.14 19.64 7.52
Sample 2
1 50.9 51.4 25.9 3.41 50.36 21.88 8.36
2 50.5 51.0 25.6 3.41 51.64 22.57 8.77
3 51.2 50.9 26.3 3.45 50.42 21.07 8.09
Avg. 50.9 51.1 25.9 3.42 50.81 21.84 8.41
Sample 3
1 50.7 51.5 26.9 3.47 49.48 18.35 7.03
2 51.3 51.0 26.2 3.48 50.68 19.27 7.36
3 51.1 50.9 25.8 3.38 50.52 20.28 7.81
Avg. 51.0 51.1 26.3 3.44 50.22 19.30 7.40
Table 7. Nissan Sentra Foam IFD Results10
Sample No. Height on
Zwick [mm]
Length [mm]
Width [mm]
Weight [g]
Force 25 % Fapply
[N]
Force 25 % Fapply [kgf]*
Force 50 % Fapply
[N]
Force 65 % Fapply
[N]
Sample 1 71.4 290.0 315.0 400.4 210.80 21.49 360.11 526.78
Sample 2 68.8 275.0 295.0 336.5 269.06 27.43 439.62 638.81
Sample 3 72.6 290.0 315.0 404.8 232.05 23.65 383.32 556.00
9 Provided by the Woodbridge Group 10 Provided by the Woodbridge Group

17
6. Development of Representative Foam These results were used to develop an experimental foam (EF) that would resemble the Nissan Sentra foam. The EF was modeled after a nominal density of 50 g/L and a target force value of 460-510 N at 50 percent compression. The EF was formulated and molded into 178 mm (7 in) thick blocks of foam that could be cut down to accommodate the FMVSS No. 213 test bench. Since the properties used to develop the EF were static, the foam was also tested dynamically using the PID and test procedure.
Initial testing with the PID showed the EF was stiffer than the 2008 Nissan Sentra. To identify a foam more representative of the average vehicle response curve, a series of foam combinations were tested using the PID and test method. The EF was cut into various thicknesses for additional testing in combination with the 51 mm (2 in) extra firm (stiff) portion of the FMVSS No. 213 cushion assembly.
A series of dynamic impacts were performed on the EF and FMVSS No. 213 foams in various thickness combinations, both with orange ECE R44 and white muslin cloth covers. The ECE R44 cloth is the specific cover used on the sled test seat fixture under ECE R44. Tests 1 through 9 were positioned on a flat surface, with the PID positioned such that the impact plate was parallel to the surface of the foam at initial contact. Tests 10 through 23, shown in Table 8, were conducted to more closely mimic the tests performed inside the Nissan Sentra, which had a rear seat pan angle of 13.6 degrees. For all of the tests, a 19 mm (0.75 in) plywood sheet was placed at the base of the foam for support and wrapped in the cloth with the foam. Details and results for all of the tests can be found in Appendix C.
Table 8. Dynamic Impact Test Matrix of EF and FMVSS No. 213 Foam Combinations
TEST Description or Foam Used Angle of Arm at Impact [o]
Angle of Foam [o] Cover Used
TEST 10 4" EF Sample 4 on Top and 1" 213 Stiff Foam on Bottom 1 13.6 Orange ECE R44
Cloth
TEST 11 4" EF Sample 4 on Top and 1" 213 Stiff Foam on Bottom 1.4 13.6 Orange ECE R44
Cloth
TEST 12 1" 213 Stiff Foam on Top and 4" EF Sample 4 on Bottom 1.7 13.6 Orange ECE R44
Cloth
TEST 13 2" 213 Stiff Foam on Top and 3" EF Sample 4 on Bottom 1.5 13.6 Orange ECE R44
Cloth
TEST 14 3" EF Sample 4 on Top and 2" 213 Stiff Foam on Bottom 1.5 13.6 Orange ECE R44
Cloth
TEST 15 3" EF Sample 4 on Top and 2" 213 Stiff Foam on Bottom 1.5 13.6 Orange ECE R44
Cloth
TEST 16 3" EF Sample 4 on Top and 2" 213 Stiff Foam on Bottom 1.5 13.6 White Muslim
Cloth
TEST 17 2" 213 Stiff Foam on Top and 3" EF Sample 4 on Bottom 1.5 13.6 White Muslim
Cloth
TEST 18 4" EF Sample 4 on Top and 1" 213 Stiff Foam on Bottom 1.5 13.6 White Muslim
Cloth
TEST 19 3" EF Sample 4 on Top and 1" 213 Stiff Foam on Bottom 0.3 13.6 Orange ECE R44
Cloth
TEST 20 1" 213 Stiff Foam on Top and 3" EF Sample 4 on Bottom 0.3 13.6 Orange ECE R44
Cloth
TEST 21 2" 213 Stiff Foam on Top and 2" EF Sample 4 on Bottom 0.3 13.6 Orange ECE R44
Cloth

18
TEST Description or Foam Used Angle of Arm at Impact [o]
Angle of Foam [o] Cover Used
TEST 22 2" EF Sample 4 on Top and 2" 213 Stiff Foam on Bottom 0.3 13.6 Orange ECE R44
Cloth
TEST 23 2" EF Sample 4 on Top and 2" 213 Stiff Foam on Bottom 0.3 13.6 Orange ECE R44
Cloth
Tests conducted at 13.6 degrees provided the results most similar to those from the Sentra test, as shown in Figure 13. The iterations of foam combinations ultimately provided two combinations of EF and FMVSS No. 213 foams that closely represented the average response of the vehicle fleet, as seen in Figure 14. The foam in test 14 and repeat test 15 was a combination of 76 mm (3 in) EF on top of 51 mm (2 in) of the FMVSS No. 213 foam wrapped in the ECE R44 cover. The foam combination in test 22 and repeat test 23 was 51 mm (2 in) EF on top of 51 mm (2 in) of the FMVSS No. 213 foam wrapped in the ECE R44 material, as seen in Figure 15. This provided two foam thicknesses, 127 mm (5 in) and 102 mm (4 in), with force-displacement curves similar to that of the 2008 Nissan Sentra, as shown in Figure 16 below.
Figure 13. Out-of-Vehicle Foam Angle Verification

19
Figure 14. EF Dynamic Force-Displacement Comparison
Figure 15. Foam and Plywood Wrapped in ECE R44 Material

20
Figure 16. 2008 Nissan Sentra Versus 5" (Tests 14 and 15) and 4" (Tests 22 and 23) Foam
The combination of 51 mm (2 in) EF on top of 51 mm (2 in) of the FMVSS No. 213 foam wrapped in the ECE R44 material was selected for additional testing. In addition to its similarity to the Nissan Sentra force-displacement response, the total thickness of 102 mm (4 in) is more representative of real world vehicles. As stated previously, vehicle fleet data indicated the average rear seat foam thickness at location 2 was 84 mm (3.3 in) with a standard deviation of 13 mm (0.5 in). Additionally, the 102 mm (4 in) thickness was favored as this size eased foam procurement and industry standard testing.

21
7. Development of Single-Piece Foam Because the foam previously used during testing was a combination of EF and FMVSS No. 213 foam, a new foam was developed to provide a single foam for testing. To do this, the foam supplier tested the EF and FMVSS No. 213 foam combination to evaluate the properties needed to create a new EF. The 102 mm (4 in) thick foam comprised of 51 mm (2 in) EF and 51 mm (2 in) FMVSS No. 213 foam, hereafter referred to as two-piece foam, was sent to a supplier for density, IFD, and CFD analysis. These tests were conducted varying which foam was on top and bottom.
Based on their results with the two-piece foam, the foam manufacturer recommended the following specifications for a single-piece foam: density of 47 kg/m³ ± 10 percent, 50 percent IFD value of 440N ± 10 percent, and 50 percent CFD value of 6.6 pcf ± 10 percent.11 From this specification, two sets of foams, referred to as WB Foams 1 and 2, were procured.
The foams were made of polyurethane and produced using molding casts. The “bun,” or 8 inch block resulting, was then cut to the specified thickness of 102 mm (4 in). The foam had “skin” that results from increased density on the surfaces that were in contact with the cast during the molding process. The molding process also produced beveled edges on the foam, which were squared off when the skin was removed. Figure 17 illustrates the differences between skin and no skin.
Figure 17. Difference Between Skin and No Skin
11 Provided by the Woodbridge Group

22
8. Dynamic Impact Evaluation of Single-Piece Foams WB Foams 1 and 2 were tested using the PID and test procedure to compare them to the reference foams (Nissan Sentra tested in vehicle and two-piece foams, tested at 13.6 degree angle and covered with orange ECE R44 material). Testing was conducted on a level adjustable table as well as on the FMVSS No. 213 bench, which had a 16 degree seat pan angle. For both series of tests, the PID was positioned such that the impact plate was nominally horizontal at first contact with the foam. Figure 18 demonstrates the different set-ups.
Figure 18. Adjustable Table Versus FMVSS No. 213 Bench Set-up
Testing on the adjustable table with WB Foams 1 and 2 was also conducted to evaluate the effect of the skin and cover material. The orange cover material was the ECE R44 fabric previously tested, and the blue cover was 10 oz. duck cloth. The test matrix used for the adjustable table tests is given in Table 9. Figure 19 contains the dynamic force-displacement plots for the tests with the orange cover, along with those from the reference foams.

23
Table 9. Adjustable Table Dynamic Impact Evaluation Test Matrix
Foam Description Test I.D. Test Location Skin Side Tested
Cover Material
WB Foam 2 - 4in 10-WB2-4 Adjustable Table No Orange
WB Foam 2 - 4in 11-WB2-4 Adjustable Table Yes Orange
WB Foam 1 - 4in 12-WB1-4 Adjustable Table No Orange
WB Foam 2 - 4in 13-WB2-4 Adjustable Table No Blue
WB Foam 1 - 4in 14-WB1-4 Adjustable Table Yes Orange
WB Foam 2 - 4in 15-WB2-4 Adjustable Table Yes Blue
WB Foam 1 - 4in 16-WB1-4 Adjustable Table No Blue
WB Foam 1 - 4in 17-WB1-4 Adjustable Table Yes Blue
Figure 19. Comparison of WB Foams 1 and 2 With Orange Cover on Adjustable Table

24
The coefficient of variation (CV) was used to compare the dynamic force-displacement responses for PID testing. The CV is calculated by dividing the standard deviation by the average; multiplying the CV by 100 computes the percent CV. Since variation in test results is likely contributable to more than just the foam samples, a percent CV at or below 10 percent means results are similar. The percent CV values listed in Table 10 quantify the differences between WB Foams 1 and 2, covered with the orange ECE R44 material, and the two reference foams.
Table 10. Percent CV Comparison for Orange Cover on Adjustable Table
Set-up Maximum Force [N] Maximum Displacement [mm]
Orange Cover, Adjustable Table
All Foams
No Skin WB Foams, Reference
Foams
Skin WB Foams,
Reference Foams
All Foams
No Skin WB Foams, Reference
Foams
Skin WB Foams,
Reference Foams
No Skin WB Foam 1 1296 1296 71.8 71.8
WB Foam 2 1030 1030 78.2 78.2
Skin WB Foam 1 1250 1250 73.9 73.9 WB Foam 2 1029 1029 78.7 78.7
Reference Values
2 Piece Foam 1109 1109 1109 75.6 75.6 75.6 Nissan Sentra 1197 1197 1197 90.9 90.9 90.9
Average 1152 1158 1146 78.2 79.1 79.7
Std. Dev 113 115 97 6.7 8.3 7.7
% CV 9.9 9.9 8.5 8.6 10.4 9.6
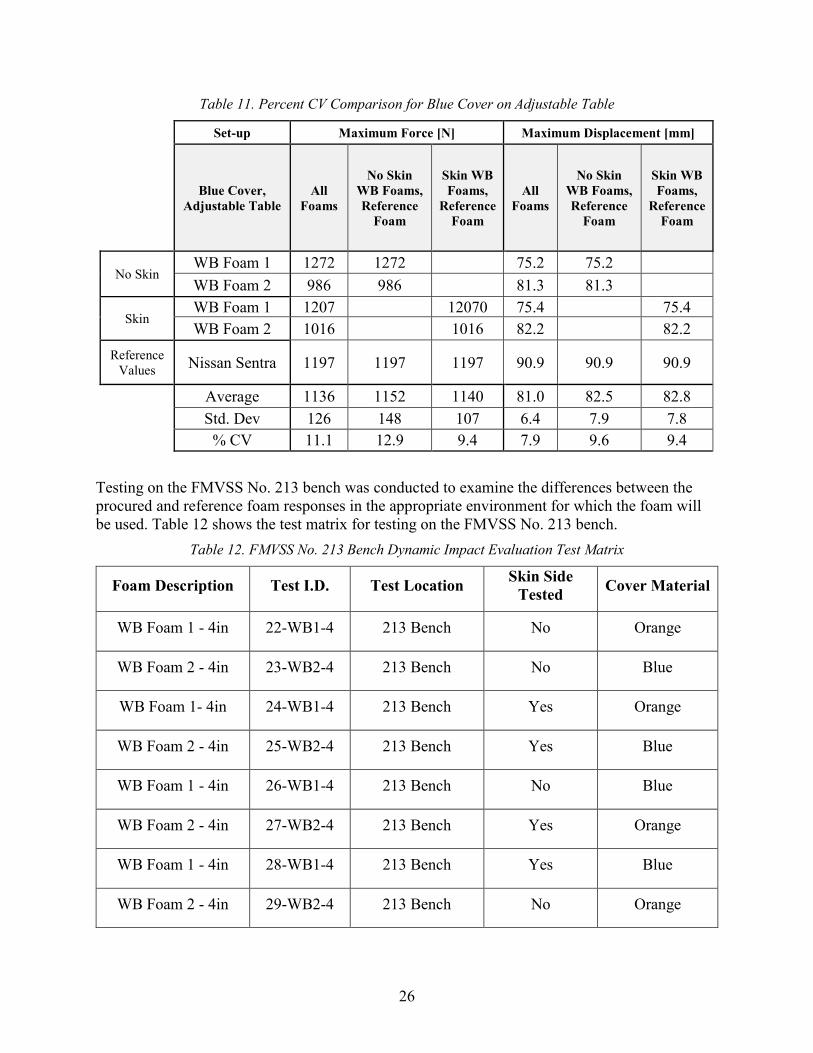
The force-displacement curves from tests on WB Foam 1 with the orange and blue covers are shown in Figure 20, and similar curves from tests on WB Foam 2 are shown in Figure 21. The results from the tests on the reference foams (all orange covers) are also included on these plots. Percent CV calculations to compare the foams when covered in the blue duck cloth are in Table 11.

25
Figure 20. WB Foam 1 Cover Comparison
Figure 21. WB Foam 2 Cover Comparison
26
Table 11. Percent CV Comparison for Blue Cover on Adjustable Table
Set-up Maximum Force [N] Maximum Displacement [mm]
Blue Cover, Adjustable Table
All Foams
No Skin WB Foams, Reference
Foam
Skin WB Foams,
Reference Foam
All Foams
No Skin WB Foams, Reference
Foam
Skin WB Foams,
Reference Foam
No Skin WB Foam 1 1272 1272 75.2 75.2
WB Foam 2 986 986 81.3 81.3
Skin WB Foam 1 1207 12070 75.4 75.4 WB Foam 2 1016 1016 82.2 82.2
Reference Values Nissan Sentra 1197 1197 1197 90.9 90.9 90.9
Average 1136 1152 1140 81.0 82.5 82.8
Std. Dev 126 148 107 6.4 7.9 7.8
% CV 11.1 12.9 9.4 7.9 9.6 9.4
Testing on the FMVSS No. 213 bench was conducted to examine the differences between the procured and reference foam responses in the appropriate environment for which the foam will be used. Table 12 shows the test matrix for testing on the FMVSS No. 213 bench.
Table 12. FMVSS No. 213 Bench Dynamic Impact Evaluation Test Matrix
Foam Description Test I.D. Test Location Skin Side Tested Cover Material
WB Foam 1 - 4in 22-WB1-4 213 Bench No Orange
WB Foam 2 - 4in 23-WB2-4 213 Bench No Blue
WB Foam 1- 4in 24-WB1-4 213 Bench Yes Orange
WB Foam 2 - 4in 25-WB2-4 213 Bench Yes Blue
WB Foam 1 - 4in 26-WB1-4 213 Bench No Blue
WB Foam 2 - 4in 27-WB2-4 213 Bench Yes Orange
WB Foam 1 - 4in 28-WB1-4 213 Bench Yes Blue
WB Foam 2 - 4in 29-WB2-4 213 Bench No Orange

27
Figure 22 compares the original FMVSS No. 213 foam with Nissan Sentra foam, as well as the WB Foams with both skin and no skin. Percent CV comparing WB Foams 1 and 2 to reference values are listed in Table 13.
Set-up Maximum Force [N] Maximum Displacement [mm]
Orange Cover, 213 Bench
All Foams
No Skin WB Foams, Reference
Foam
Skin WB Foams,
Reference Foam
All Foams
No Skin WB Foams, Reference
Foam
Skin WB Foams,
Reference Foam
No Skin WB Foam 1 1388 1388 83.3 83.3 WB Foam 2 1136 1136 89.2 89.2
Skin WB Foam 1 1344 1344 82.2 82.2 WB Foam 2 1166 1166 86.6 86.6
Reference Values Nissan Sentra 1197 1197 1197 90.9 90.9 90.9
Average 1246 1240 1236 86.4 87.8 86.5
Std. Dev 113 131 95 3.7 4.0 4.4
% CV 9.0 10.6 7.7 4.3 4.5 5.1
Figure 22. Comparison of WB Foams 1 and 2 on FMVSS No. 213 Bench
Table 13. Percent CV Comparison on FMVSS No. 213 Bench
28
The conclusion from this set of dynamic testing was that slight variations were found between the two foams received as well as compared to the reference values; however, because the differences were near or below 10 percent, the WB Foams were deemed representative of target response. Both WB Foams 1 and 2 were most similar to the Nissan Sentra foam when tested on the FMVSS No. 213 bench. From the PID testing on both the adjustable table and FMVSS No. 213 bench, it was observed that the foams with skin were marginally more similar to the Nissan Sentra foam than with no skin. Testing with duck cloth had increased percent CV values, thus ECE R44 cover material was identified for continued evaluation. For work described later in this report, only the adjustable table PID test equipment was selected for ease of use.

29
9. Single-Piece Foam Sled Testing Evaluation To better understand the foam response during sled testing and the repeatability between foams, sled testing was completed using WB Foams 1 and 2 on the standard FMVSS No. 213 bench seat. These sled tests used a more severe sled pulse and higher velocity than those specified in FMVSS No. 213. Figure 23 shows the sled pulse selected, which was intended to replicate an average NCAP light vehicle crash pulse with a peak acceleration over 35 g and a more aggressive, rear loaded pulse. The peak velocity was 35 mph, which is 5 mph faster than the standard FMVSS No. 213 peak velocity (for comparison, a compliance FMVSS No. 213 sled pulse is also shown in Figure 23). In addition to increasing the crash pulse and velocity in an effort to produce severe loading of the foam cushion, one of the heaviest CRS models available on the market at the time was selected, the Graco SmartSeat that weighs approximately 33 lbs. The HIII 10 YO, HIII 6 YO, and HIII 3 YO child ATDs were used, with the HIII 10 YO and 6 YO used in forward-facing (FF) configurations and the HIII 3 YO used in the rear-facing (RF) configuration. For the HIII 10YO, the CRS was used as a belt-positioning booster (BPB).
Figure 23. 2012 Average NCAP Light Vehicle Pulse Compared to Pulse for Sled Testing.
Details of the test parameters can be found in Appendix A, Table A2. The following test matrix, Table 14, was used for testing.

30
Table 14. Test Matrix for Sled Testing
6 yr. old 10 yr. old 3 yr. old
Bench Seat Configuration
#1
Passenger Side With
WB Foam 2
LATCH Graco SmartSeat HARNESSED 66
Lap/Shoulder Belt
Graco SmartSeat as BPB 61 62
Driver Side With WB Foam 1
Lap/Shoulder Belt
Graco SmartSeat HARNESSED
66 Rear- Facing
Graco SmartSeat as BPB 61 62
Bench Seat Configuration
#2
Passenger Side With
WB Foam 1
LATCH Graco SmartSeat HARNESSED 65
Lap/Shoulder Belt
Graco SmartSeat as BPB 63 64
Driver Side With WB Foam 2
Lap/Shoulder Belt
Graco SmartSeat HARNESSED
65 Rear- Facing
Graco SmartSeat as BPB 63 64
A total of six sled tests were performed with each test being repeated once so that each foam could be used under the same loading conditions and results could be compared between foam samples. The base unit was used in tests 65 and 66 for both rear-facing and forward-facing configurations.
Image analysis software was used to measure displacement. Displacement measurements were found by selecting a stationary point on the bench framework and making it the reference point. A target on the child restraint near the foam was then selected, and its displacement relative to the reference point was tracked. Displacement was calculated by subtracting the initial position of the CRS target from its position at maximum foam compression. Displacement results were given such that the vector was perpendicular to the angle of the foam. The displacement results can be found in Table 15. Rear-facing tests, tests 65 (left) and 66 (left), were excluded from analysis due to rotation over the edge of the cushion causing skewed displacement results.
31
Table 15. Sled Testing Foam Displacement Results
Test Number Side ATD Foam Displacement
[mm]
Test_061 Left 10YO 1 54
Test_062 Left 10YO 1 59
Test_063 Left 10YO 2 57
Test_064 Left 10YO 2 59
Test_061 Right 6YO 2 67
Test_062 Right 6YO 2 70
Test_063 Right 6YO 1 73
Test_064 Right 6YO 1 69
Test_065 Right 6YO 1 97
Test_066 Right 6YO 2 96
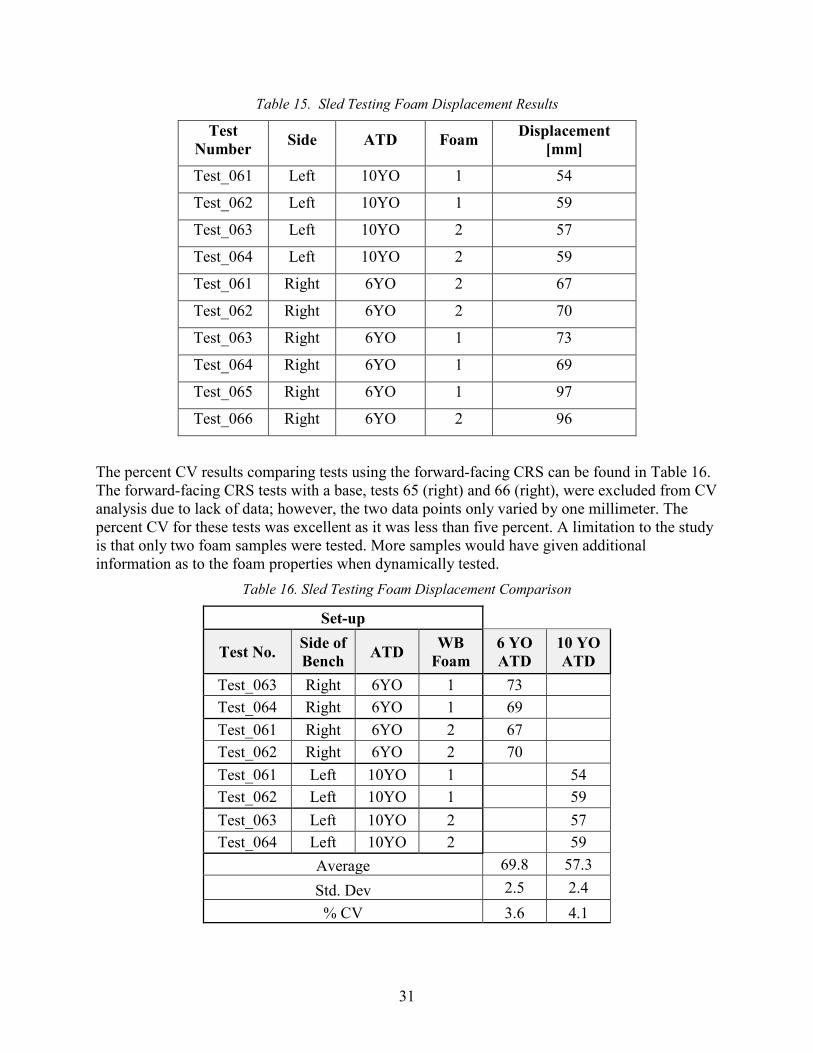
The percent CV results comparing tests using the forward-facing CRS can be found in Table 16. The forward-facing CRS tests with a base, tests 65 (right) and 66 (right), were excluded from CV analysis due to lack of data; however, the two data points only varied by one millimeter. The percent CV for these tests was excellent as it was less than five percent. A limitation to the study is that only two foam samples were tested. More samples would have given additional information as to the foam properties when dynamically tested.
Table 16. Sled Testing Foam Displacement Comparison
Set-up
Test No. Side of Bench ATD WB
Foam 6 YO ATD
10 YO ATD
Test_063 Right 6YO 1 73 Test_064 Right 6YO 1 69 Test_061 Right 6YO 2 67 Test_062 Right 6YO 2 70 Test_061 Left 10YO 1 54 Test_062 Left 10YO 1 59 Test_063 Left 10YO 2 57 Test_064 Left 10YO 2 59
Average 69.8 57.3 Std. Dev 2.5 2.4
% CV 3.6 4.1

32
10. Additional Testing of Single-Piece Foam Two additional foams samples (WB Foams 3 and 4) with the same specifications as WB Foams 1 and 2 were obtained and evaluated, in conjunction with WB Foams 1 and 2, using the PID as well as in sled testing. Percent CV was used to compare ATD and foam responses for like tests across the four foam samples using HIC 36, 3ms chest clip, head and knee excursions, and displacement. PID tests were performed both before and after sled testing on the adjustable table, to determine if the foam characteristics changed after a series of sled tests.
Figure 24 illustrates the pre-test and post-test force-displacement curves generated with the PID. The majority of the force-displacements curves are reasonably similar with the exception of WB Foam 1 pre-test. The peak force for this test was substantially higher and the maximum displacement was less than for all other tests.
Figure 24. WB Foams 1-4 Force-Displacement Curves Before and After Sled Testing
Table 17 lists the PID results and the percent CV’s for WB Foams 1-4, WB Foams 2-4, all foams pre-sled test, and all foams post-sled test. The results indicated that except for pre-test WB Foam 1, the maximum forces were very consistent across foams and did not change pre- and post-sled testing. The displacements had percent CV’s similar to those from testing discussed previously, and the pre-test WB Foam 1 displacement was not an outlier. Post-sled test displacements were higher than the pre-test displacement for each foam sample.

33
Table 17. PID Comparisons for WB Foams 1-4 Before and After Sled Testing
Set-up Maximum Force [N] Maximum Displacement [mm]
Pre-Sled All
Foams WB
2, 3, 4 Pre-test Post-test All
Foams WB
2, 3, 4 Pre-test Post-test WB Foam 1 1297 1297 74.7 74.7 WB Foam 2 1025 1025 1025 81.5 81.5 81.5 WB Foam 3 1035 1035 1035 80.1 80.1 80.1
WB Foam 4 1064 1064 1064 78.1 78.1 78.1 Post-Sled
WB Foam 1 1042 1042 84.0 84.0 WB Foam 2 1000 1000 1000 87.5 87.5 87.5 WB Foam 3 1007 1007 1007 80.4 80.4 80.4
WB Foam 4 1014 1014 1014 80.5 80.5 80.5
Average 1060.5 1024.2 1105.3 1015.8 80.8 81.4 78.6 83.1 Std. Dev 97.7 23.2 128.9 18.4 3.8 3.2 3.0 3.4
% CV 9.2 2.3 11.7 1.8 4.7 3.9 3.8 4.1
The sled test matrix for testing of WB Foams 1-4 can be seen in Table 18 below. Sled test parameters can be found in Appendix A, Table A3. The foams were used in the skin side down configuration. The sled tests were conducted using the FMVSS No. 213, 30 mph pulse. Testing used LATCH and lap/shoulder belt, with and without tether, configurations for child restraints: Graco MyRide 65 and Graco SmartSeat harnessed and BPB, as well as Evenflo Triumph rear-facing. The sled testing used a Hybrid III 3 YO, a 6 YO, and a 10 YO ATDs. Repeat tests were performed using each sets of foam.

34
Table 18. Test Matrix for Evaluation of WB Foams 1-4
3 yr. old 6 yr. old 10 yr. old
WB Foam 1
Pass. Side
Graco MyRide 65 FF LATCH
81 82
Evenflo Triumph RF LATCH
67 68
WB Foam 2
Driver Side
Graco SmartSeat Harnessed L/S Belt 67 68
Graco SmartSeat as BPB L/S Belt
With Tether
81 82
WB Foam 3
Pass. Side
Graco MyRide 65 FF LATCH 79 80
Evenflo Triumph RF LATCH 69 70
WB Foam 4
Driver Side
Graco SmartSeat Harnessed L/S Belt 69 70
Graco SmartSeat as BPB L/S Belt
With Tether
79 80
WB Foam 2
Pass. Side
Graco MyRide 65 FF LATCH 77 78
Evenflo Triumph RF LATCH 71 72
WB Foam 1
Driver Side
Graco SmartSeat Harnessed L/S Belt 71 72
Graco SmartSeat as BPB L/S Belt
With Tether
77 78
WB Foam 4
Pass. Side
Graco MyRide 65 FF LATCH 75 76
Evenflo Triumph RF LATCH 73 74
WB Foam 3
Driver Side
Graco SmartSeat Harnessed L/S Belt 73 74
Graco SmartSeat as BPB L/S Belt
With Tether
75 76
The HIC 36, 3ms chest clip, and foam displacement results for the HIII 3YO in the Evenflo Triumph Advance, rear-facing harnessed, with LATCH tests are shown in Table 19. Analysis of a RF configuration was included for this series because the CRS interaction with the seat foam was primarily on the top surface, and not about the front edge of the foam. Test 68 had an equipment failure with a LATCH anchor visibly breaking and thus was excluded from CV

35
analysis. The CV’s of 6.2 percent, 3.4 percent, and 6.2 percent indicate the results were similar across the foam samples for HIC 36, 3ms chest clip, and foam displacement, respectively.
Table 19. HIII 3YO in Evenflo Triumph Advance, Rear-Facing Harnessed, With LATCH
Test # Foam HIC 36 Chest Clip 3ms [g]
Foam Displacement
[mm]
67 1 611 39.2 65 69 3 561 40.5 70 70 3 682 40.3 70 71 2 629 37.8 77 72 2 655 39.5 77 73 4 606 41.5 69 74 4 617 38.0 69
Average 623.1 39.6 71.0 Std. Dev. 38.5 1.3 4.4
CV% 6.2 3.4 6.2
Table 20 shows the HIC 36, 3ms chest clip, head excursion, knee excursion, and foam displacement results for the HIII 6YO in the Graco SmartSeat, forward-facing harnessed, with 3-point belts. Test 74 was removed from CV analysis as anamolus data because of suspected incorrect installation. The percent CV values of the injury measures except HIC 36 were near or below 10 percent.
Table 20. HIII 6YO in Graco SmartSeat Harness, With L/S Belt
Test # Foam HIC 36 Chest Clip 3ms
[g]
Head Excursion
[mm]
Knee Excursion
[mm]
Foam Displacement
[mm]
67 2 436 42.6 620 741 67 68 2 584 41.6 606 729 67 69 4 718 42.9 684 744 58 70 4 536 44.3 655 725 64 71 1 694 42.0 599 719 69 72 1 595 42.2 666 733 63 73 3 692 40.7 639 727 70 Average 608.1 42.3 638.4 731.1 46.5 Std. Dev. 101.8 1.1 31.8 8.7 5.2
CV% 16.7 2.7 5.0 1.2 11.2

36
Table 21 shows the HIC 36, 3 ms chest clip, head excursion, knee excursion, and foam displacement results for the HIII 6YO in the Graco MyRide65, forward-facing, with LATCH. Test 75 was not included in the CV analysis as anamolus data because of suspected incorrect installation. The percentage CV values of the injury measures are well below 10 percent.
Table 21. HIII 6YO in Graco MyRide65, With LATCH
Test # Foam HIC 36 Chest Clip 3ms
[g]
Head Excursion
[mm]
Knee Excursion
[mm]
Foam Displacement
[mm]
76 4 558 44.6 558 737 70 77 2 581 45.8 560 717 77 78 2 527 44.7 531 718 71 79 3 538 44.3 555 722 73 80 3 594 45.1 553 714 71 81 1 523 44.6 516 709 69 82 1 626 44.6 556 726 70 Average 563.8 44.8 546.9 720.4 40.7 Std. Dev. 38.4 0.5 16.6 9.1 1.9
CV% 6.8 1.1 3.0 1.3 4.6
Table 22 shows the HIC 36, 3ms chest clip, head excursion, knee excursion, and foam displacement results for the HIII 10YO in the Graco SmartSeat Booster, forward-facing with tether. The percent CV values of the injury measures, except for HIC 36, were near or below 10 percent. HIC 36 is not an injury criterion for the HIII 10YO in FMVSS No. 213 but was analyzed for research purposes.
Table 22. 10 YO HIII ATD in a Graco SmartSeat Booster With 3-Pt Belts
Test # Foam HIC 36 Chest Clip 3ms
[g]
Head Excursion
[mm]
Knee Excursion
[mm]
Foam Displacement
[mm]
75 3 574 50.3 564 748 54 76 3 555 49.0 565 734 55 77 1 609 54.7 580 745 65 78 1 680 52.8 571 751 49 79 4 407 49.1 557 735 48 80 4 502 52.7 555 739 47 81 2 536 51.8 570 734 57 82 2 534 50.6 560 736 55 Average 549.8 51.4 565.1 740.3 53.8 Std. Dev. 79.3 2.0 8.3 7.0 5.9
CV% 14.4 3.9 1.5 0.9 10.9

37
Overall, most percent CV results were near or below 10 percent for all configurations. Although two of the configurations had slightly elevated HIC 36, the repeatability results were accepted and testing was continued.
38
11. Evaluation of the Durability and Dynamic Force-Deflection Characteristic of WB Foams Under Repeated Use Fifty-three CRS sled tests were conducted using WB Foams 2, 3, and 4 to evaluate the durability changes in force-deflection characteristics of the foam. All foams were covered with the orange ECE R44 material during sled testing. The sled tests were performed using the FMVSS No. 213, 30 mph pulse. A CRABI 12 MO was used in 14 tests on WB Foam 3, with 11 RF infant and 3 RF convertible configurations. A HIII 3 YO ATD was used for 13 tests on WB Foams 2 and 3, with 4 RF convertible and 9 FF convertible configurations. A HIII 6 YO ATD was used for 21 tests on WB Foam 4 with 15 FF convertible and 6 BPB configurations. Finally, a HIII 10 YO ATD was used for 5 tests on WB Foam 4 with one FF convertible and four BPB configurations.
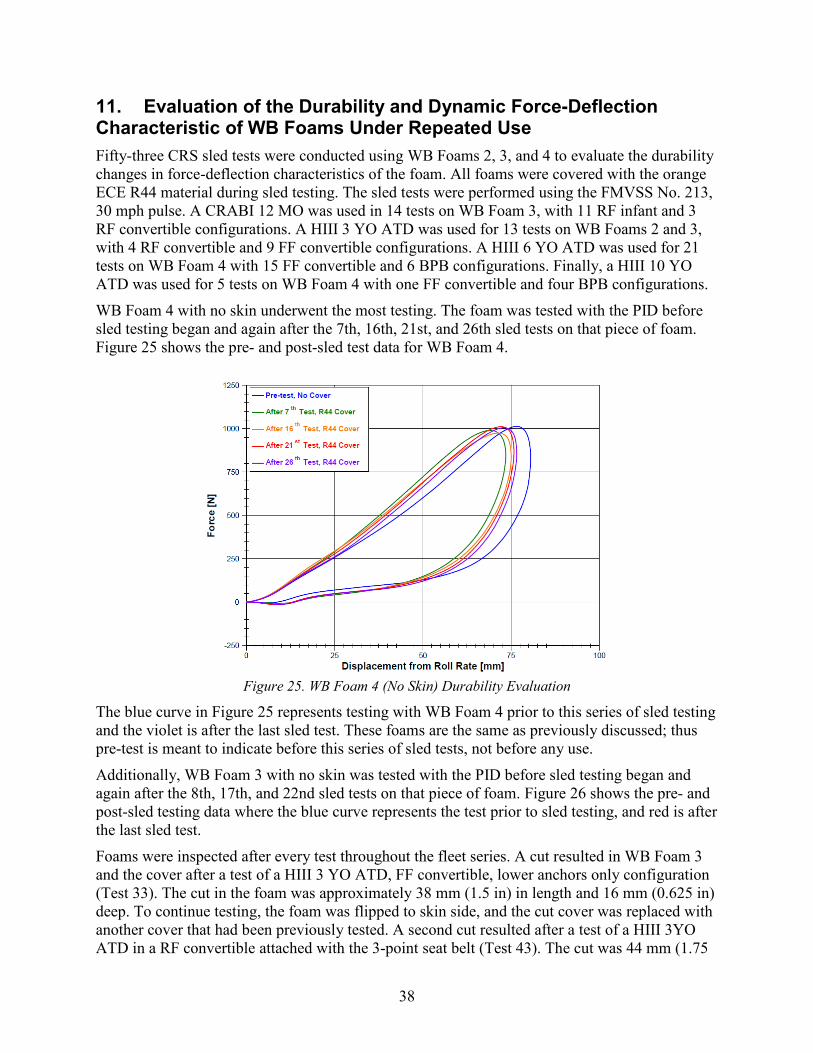
WB Foam 4 with no skin underwent the most testing. The foam was tested with the PID before sled testing began and again after the 7th, 16th, 21st, and 26th sled tests on that piece of foam. Figure 25 shows the pre- and post-sled test data for WB Foam 4.
Figure 25. WB Foam 4 (No Skin) Durability Evaluation
The blue curve in Figure 25 represents testing with WB Foam 4 prior to this series of sled testing and the violet is after the last sled test. These foams are the same as previously discussed; thus pre-test is meant to indicate before this series of sled tests, not before any use.
Additionally, WB Foam 3 with no skin was tested with the PID before sled testing began and again after the 8th, 17th, and 22nd sled tests on that piece of foam. Figure 26 shows the pre- and post-sled testing data where the blue curve represents the test prior to sled testing, and red is after the last sled test.
Foams were inspected after every test throughout the fleet series. A cut resulted in WB Foam 3 and the cover after a test of a HIII 3 YO ATD, FF convertible, lower anchors only configuration (Test 33). The cut in the foam was approximately 38 mm (1.5 in) in length and 16 mm (0.625 in) deep. To continue testing, the foam was flipped to skin side, and the cut cover was replaced with another cover that had been previously tested. A second cut resulted after a test of a HIII 3YO ATD in a RF convertible attached with the 3-point seat belt (Test 43). The cut was 44 mm (1.75

39
in) in length and of negligible depth. The covers used had undergone numerous tests throughout the evaluation of the WB Foams, which may be the reason why the covers and foams were susceptible to cuts.
Figure 26. WB Foam 3 (No Skin) Durability Evaluation
Due to cuts on both sides of WB Foam 3, WB Foam 2 with skin was used for the remaining testing. The same cover as used with previous WB Foam 3 tests was patched and used with WB Foam 2. The foam was tested with the PID before sled testing began and again after five sled tests on that piece of foam. Figure 27 shows the pre- and post-sled test data where the red curve is at the beginning of the testing with this foam and violet is at the end.
A cut in WB Foam 2 resulted after a test in the HIII 3YO ATD, FF convertible, lower anchors only configuration (Test 49). Shown in Figure 28, the cut was on both the front edge of the foam and the skin side of the foam. The approximate dimensions of the cut on the skin surface were 16 mm (0.625 in) in length and 16 mm (0.625 in) depth. On the front side of the foam, the approximate dimensions were 38 mm (1.5 in) in length and 7 mm (0.275 in) in depth.

40
Figure 27. WB Foam 2 Durability Evaluation
Figure 28. WB Foam 2 Cut
The dynamic force-displacement characteristics did not change appreciably during the course of the durability sled test series. The ECE R44 cover and WB Foam combination appeared to become more susceptible to cuts with repeated testing. Due to the cuts in half of the foams available for testing, four additional foam pieces were obtained. The foams will to be referred to as WB Foams 5 through 8.

41
12. Evaluation of the Quasi-Static Force-Deflection Characteristics WB Foams under Repeated Use Indentation force deflection (IFD) testing was completed at VRTC for additional comparisons of WB Foams. Although static testing is not able to capture the foam response under dynamic conditions, IFD testing is commonly used in the foam industry and can be used as a tool for comparison. The IFD testing was completed based on ASTM D3574-11 Test B1 with some deviations from the standard procedure.12 13 The scope of this test is “to measure the force necessary to produce designated indentation in the foam product, for example, at 25 and 65 percent deflections.”
The foams were tested at the dimensions used for sled buck of 28 inches by 19 inches and 4 inches thick and were tested at the approximate center. The results from the IFD testing include the force observed after 60 seconds to compress the foam to 25 and 65 percent of its original thickness (25% and 65% IFD values, respectively) as well as force-displacement curves. Three tests were completed for all foams, and the results were averaged. The average IFD values from all of the tests can be found in Table 23.
Table 23. Average IFD Values
25% IFD Value [N] 65% IFD Value [N]
WB1_4 IFD 229 725
WB2_4 IFD 200 623
WB3_4 IFD 208 673
WB4_4 IFD 229 752
WB5_4 IFD 245 714
WB6_4 IFD 234 728
WB7_4 IFD 236 722
WB8_4 IFD 234 731
Figure 29 illustrates the differences in foam response between WB Foams 1 through 8. There are apparent differences between the foams, however, it is important to note that Foams 1 to 4 had been used in numerous PID and sled tests prior to the IFD testing, while Foams 5 to 8 were new.
12ASTM D3574-11, “Standard Test Methods for Flexible Cellular Materials – Slab, Bonded, and Molded Urethane Foams” – “Test B1 ”Indentation Force Deflection Test – Specified Deflection (IFD).” 13Deviations from the standard procedure included non-standard dimensions of test specimens and loading locations at the approximate center. Another deviation from the ASTM standard was that the pre-flex was applied at 51 mm/min rather than 250 mm/min due to limitation from the equipment.

42
Figure 29. IFD Force-Displacement Curves for WB Foams 1 to 8
The results from the IFD testing, including the force observed after 60 seconds to compress the foam to 50 percent of its original thickness, were also recorded for WB Foams 5 through 8 in order to compare the VRTC test results to those provided by the foam manufacturer for the same pieces of foam. Percent difference was calculated as shown in Equation 1, and the results are shown in Table 24. The notation ‘X-###’ was used by the foam manufacturer while ‘WB#_#’ was used by VRTC. The differences found between the 50 percent IFD values from the foam supplier and VRTC tests were small (less than 5 percent); this indicates that IFD testing may be a reliable method for comparing foams between different labs and equipment.
Percent difference = (difference between maximums)(average of maximums)
∗ 100 (1)

43
Table 24. Comparison of WB and VRTC 50 Percent IFD Values
Test Specimen 50% IFD Value [N] Difference [N] Percent Difference
[%]
A-100 428.4 17.9 4.3
WB5_4 IFD 50 410.5
C-100 445.1 12.7 2.9
WB6_4 IFD 50 432.4
E-100 427.8 1.2 0.3
WB7_4 IFD 50 429.0
F-100 418.3 6.6 1.6
WB8_4 IFD 50 411.7
The average force-displacement data for WB Foams 5 to 8 measured during the 50 percent IFD testing at VRTC is plotted Figure 30.
Figure 30. WB Foams 5 to 8 Force-Displacement Overlay for 50 Percent IFD Testing
44
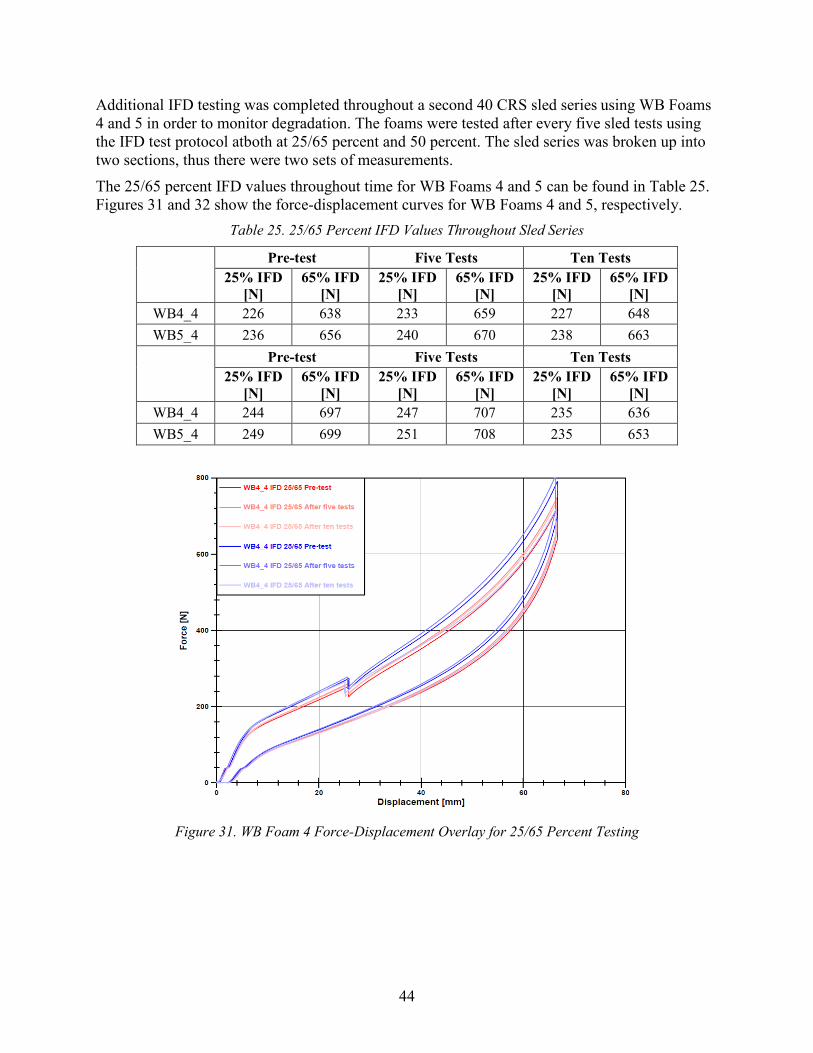
Additional IFD testing was completed throughout a second 40 CRS sled series using WB Foams 4 and 5 in order to monitor degradation. The foams were tested after every five sled tests using the IFD test protocol atboth at 25/65 percent and 50 percent. The sled series was broken up into two sections, thus there were two sets of measurements.
The 25/65 percent IFD values throughout time for WB Foams 4 and 5 can be found in Table 25. Figures 31 and 32 show the force-displacement curves for WB Foams 4 and 5, respectively.
Table 25. 25/65 Percent IFD Values Throughout Sled Series
Pre-test Five Tests Ten Tests
25% IFD [N]
65% IFD [N]
25% IFD [N]
65% IFD [N]
25% IFD [N]
65% IFD [N]
WB4_4 226 638 233 659 227 648 WB5_4 236 656 240 670 238 663
Pre-test Five Tests Ten Tests
25% IFD [N]
65% IFD [N]
25% IFD [N]
65% IFD [N]
25% IFD [N]
65% IFD [N]
WB4_4 244 697 247 707 235 636 WB5_4 249 699 251 708 235 653
Figure 31. WB Foam 4 Force-Displacement Overlay for 25/65 Percent Testing
45
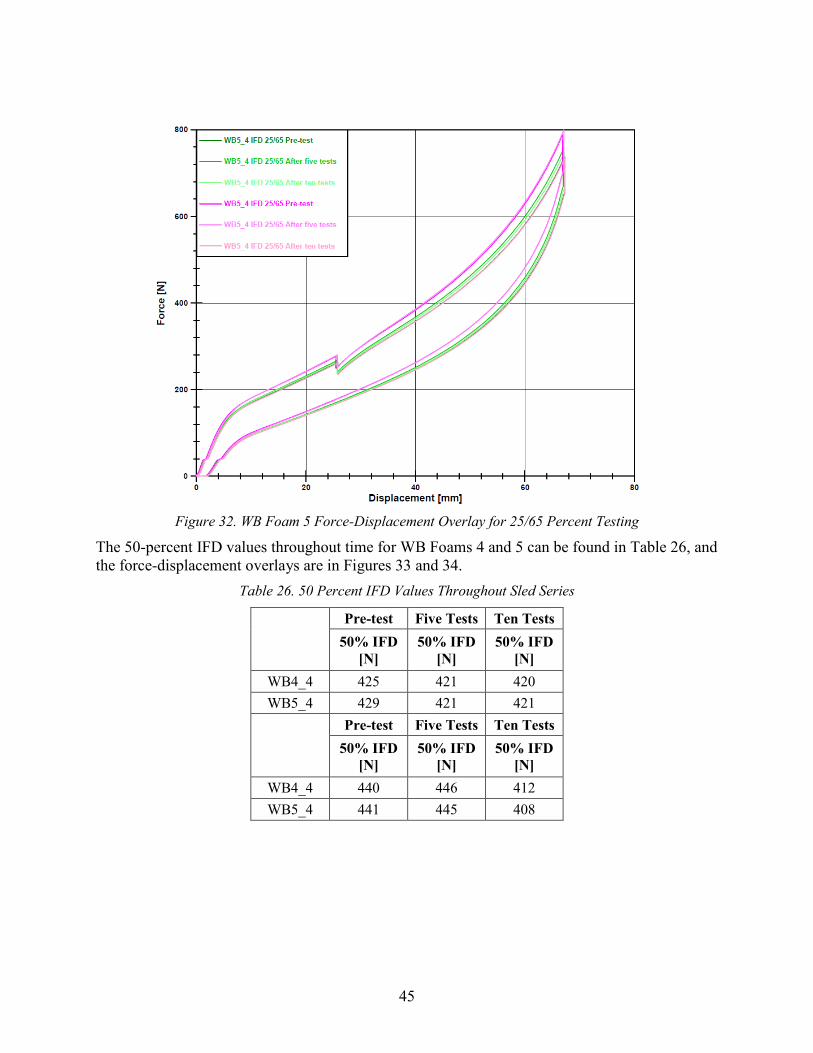
Figure 32. WB Foam 5 Force-Displacement Overlay for 25/65 Percent Testing
The 50-percent IFD values throughout time for WB Foams 4 and 5 can be found in Table 26, and the force-displacement overlays are in Figures 33 and 34.
Table 26. 50 Percent IFD Values Throughout Sled Series
Pre-test Five Tests Ten Tests
50% IFD [N]
50% IFD [N]
50% IFD [N]
WB4_4 425 421 420 WB5_4 429 421 421
Pre-test Five Tests Ten Tests 50% IFD
[N] 50% IFD
[N] 50% IFD
[N] WB4_4 440 446 412 WB5_4 441 445 408
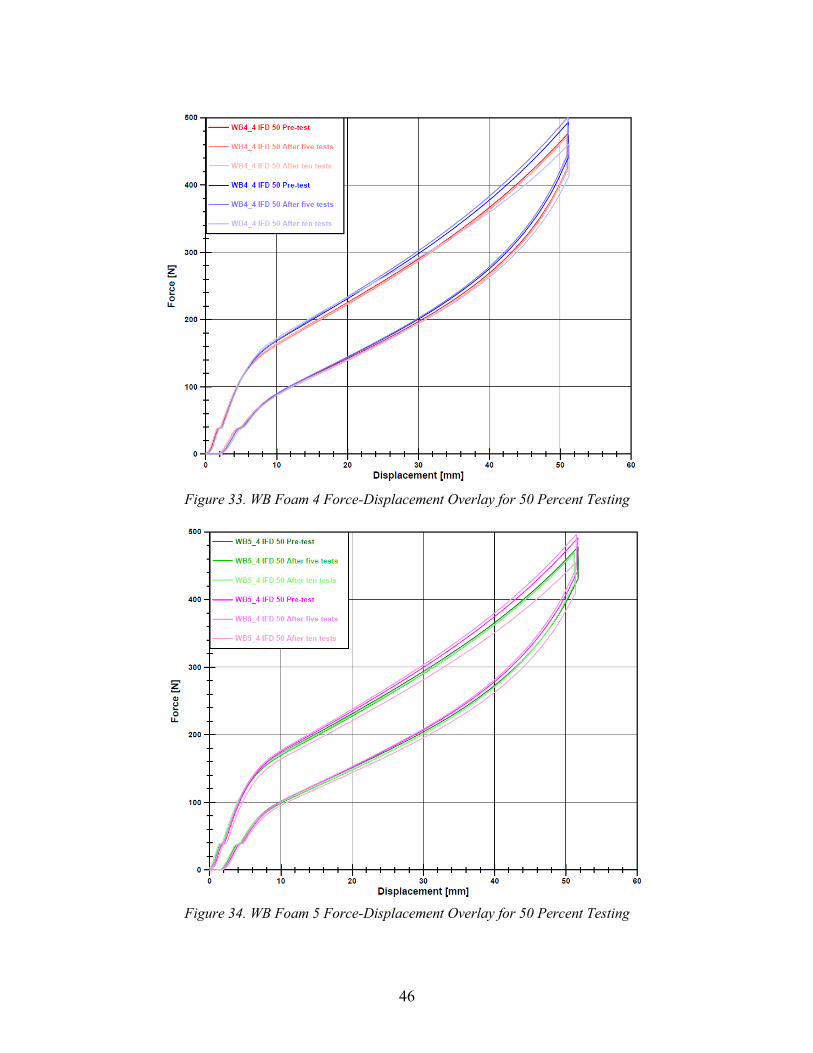
46
Figure 33. WB Foam 4 Force-Displacement Overlay for 50 Percent Testing
Figure 34. WB Foam 5 Force-Displacement Overlay for 50 Percent Testing

47
The IFD testing results throughout the sled series indicate the foams had minimal degradation. Interestingly, the foams appear to have stiffened for the second part of the test series; this could be due to how the foams were stacked during storage, although this was not verified. In total, percent difference of the foams did not vary more than 11 and 9 percent throughout the entire series for WB Foams 4 and 5, respectively. And, the foams were still within the tolerance specified for foam procurement.
Although the foam degradation was reasonable throughout the sled series, the durability of the foam and fabric was not. The wrapped foams were inspected after every test throughout the fleet series. At the start of the series, new covers were used. A cut resulted in WB Foam 4 and the cover after a test of a HIII 3 YO ATD, RF convertible, lower anchors only configuration (Test 87). The cut in the foam was approximately 25 mm (1.0 in) in length and 13 mm (0.5 in) deep. To continue testing, the foam was flipped to skin side up, and the cut cover was replaced with a new cover.
After the series, another cut was identified on the skin side of WB Foam 4; the cut was approximately 38 mm (1.5 in) in length and 13 mm (0.5 in) deep. However, there was no cut found in the cover. It was suspected that the cut was caused during the series.
In an attempt to fix WB Foam 4, spray adhesive was applied inside the cut. It was then tested per the IFD protocol, at both 25/65 percent and 50 percent, to determine if the adhesive had any effect on the results. After gluing, the 25 percent and 65 percent IFD values were 259N and 706N, respectively. The 50 percent IFD value was 455N. These results were approximately 10 percent stiffer than before gluing. As the foams were still within the tolerance specified, this was deemed an acceptable fix for minor cuts in the foams.

48
13. Summary A pendulum impact device (PID) and test procedure capable of dynamically evaluating the foam response of rear seat foams were developed. The PID was used to evaluate a vehicle fleet of 15 recent model year vehicles, and results showed that the 2008 Nissan Sentra foam was the most representative of the average vehicle foam response. Working with the Woodbridge Group, a new foam with an average foam PID response was developed. The foam has the following specifications: density of 47 kg/m³ ± 10 percent, 50 percent IFD value of 440 N ± 10 percent, and 50 percent CFD value of 6.6 pcf ± 10 percent.14 Foams were manufactured and proved to be repeatable in PID testing, indention force deflection (IFD) testing, and sled testing on both the current and upgraded FMVSS No. 213 frontal bucks. Also, PID and IFD testing showed limited degradation of the foam throughout different sled series.
14 Provided by the Woodbridge Group

A-1
Appendix A Table 27. 2009 Sled Test Data
VDB Test No.
Test Reference
No.
VRTC Test No.
Seating Position CRS Model ATD Type CRS
Orientation Restraint
Type Seat Foam Test Pulse
Test Velocity (mph)
8793 S091123-1 Test 1 Left Chicco KeyFit30 with Base CRABI 12 MO Rear-facing LA Only FMVSS No.
213 Seat Foam
FMVSS No. 213
Pulse 30
Right Graco MyRide65 HIII 3YO Forward-facing LATCH
8794 S091124-1 Test 2 Left Chicco KeyFit30 with Base CRABI 12 MO Rear-facing LA Only FMVSS No.
213 Seat Foam
FMVSS No. 213
Pulse 30
Right Graco MyRide65 HIII 3YO Forward-facing LATCH
8795 S091125-1 Test 3 Left Graco MyRide65 CRABI 12 MO Rear-facing LA Only FMVSS No.
213 Seat Foam
FMVSS No. 213
Pulse 30
Right Graco Comfort Sport HIII 3YO Forward-facing LATCH
8796 S091130-1 Test 4 Left Graco MyRide65 CRABI 12 MO Rear-facing LA Only FMVSS No.
213 Seat Foam
FMVSS No. 213
Pulse 30
Right Graco Comfort Sport HIII 3YO Forward-facing LATCH
8797 S091130-2 Test 5 Left Sunshine Kids Radian 65 CRABI 12 MO Forward-facing LATCH FMVSS No.
213 Seat Foam
FMVSS No. 213
Pulse 30
Right Sunshine Kids Radian 65 HIII 3YO Forward-facing LATCH
8798 S091202-1 Test 6 Left Sunshine Kids Radian 65 CRABI 12 MO Forward-facing LATCH FMVSS No.
213 Seat Foam
FMVSS No. 213
Pulse 30
Right Sunshine Kids Radian 65 HIII 3YO Forward-facing LATCH
8799 S091203-1 Test 7 Left Graco Comfort Sport CRABI 12 MO Forward-facing LATCH FMVSS No.
213 Seat Foam
FMVSS No. 213
Pulse 30
Right Cosco Pronto HIII 6YO Forward-facing SB3PT
8800 S091203-2 Test 8 Left Graco Comfort Sport CRABI 12 MO Forward-facing LATCH FMVSS No.
213 Seat Foam
FMVSS No. 213
Pulse 30
Right Evenflo Big Kid HIII 6YO Forward-facing SB3PT
8801 S091204-1 Test 9 Left Cosco Pronto HIII 10YO Forward-facing SB3PT FMVSS No.
213 Seat Foam
FMVSS No. 213
Pulse 30
Right Cosco Pronto HIII 6YO Forward-facing SB3PT
8802 S091208-1 Test 10 Left Evenflo Big Kid HIII 10YO Forward-facing SB3PT FMVSS No.
213 Seat Foam
FMVSS No. 213
Pulse 30
Right Evenflo Big Kid HIII 6YO Forward-facing SB3PT
8803 S091209-1 Test 11 Left Cosco Pronto HIII 10YO Forward-facing SB3PT FMVSS No.
213 Seat Foam
FMVSS No. 213
Pulse 30
Right Cosco Pronto HIII 6YO Forward-facing SB3PT
8804 S091221-1 Test 12 Left Evenflo Big Kid HIII 10YO Forward-facing SB3PT FMVSS No. 213 Seat Foam
FMVSS No. 213
Pulse 30

A-2
Table 28. Single-Piece Foam Sled Tests VDB Test No.
Test Reference
No.
VRTC Test No.
Seating Position CRS Model ATD Type CRS
Orientation Restraint
Configuration
Seat Cushion
Foam
Test Pulse
Test Velocity (mph)
8854 S130710-1 T62FRONT_061
Left Graco SmartSeat Booster HIII 10YO Forward-
facing L/S belt(3N) WB Foam 1 FMVSS
No. 213 35 Right Graco SmartSeat
Booster HIII 10YO Forward-facing L/S belt(3N) WB
Foam 2
8855 S130711-1 T62FRONT_062
Left Graco SmartSeat Booster HIII 10YO Forward-
facing L/S belt(3N) WB Foam 1 FMVSS
No. 213 35 Right Graco SmartSeat
Booster HIII 6YO Forward-facing L/S belt(3N) WB
Foam 2
8856 S130715-1 T62FRONT_063
Left Graco SmartSeat Booster HIII 10YO Forward-
facing L/S belt(3N) WB Foam 2 FMVSS
No. 213 35 Right Graco SmartSeat
Booster HIII 6YO Forward-facing L/S belt(3N) WB
Foam 1
8857 S130715-2 T62FRONT_064
Left Graco SmartSeat Booster HIII 10YO Forward-
facing L/S belt(3N) WB Foam 2 FMVSS
No. 213 35 Right Graco SmartSeat
Booster HIII 6YO Forward-facing L/S belt(3N) WB
Foam 1
8858 S130716-1 T62FRONT_065
Left Graco SmartSeat with Base HIII 3YO Rear-facing L/S belt(3N) WB
Foam 2 FMVSS No. 213 35
Right Graco SmartSeat with Base HIII 6YO Forward-
facing LATCH (LN) WB Foam 1
8853 S130709-1 T62FRONT_066
Left Graco SmartSeat with Base HIII 3YO Rear-facing L/S belt(3N) WB
Foam 1 FMVSS No. 213 35
Right Graco SmartSeat with Base HIII 6YO Forward-
facing LATCH (LN) WB Foam 2
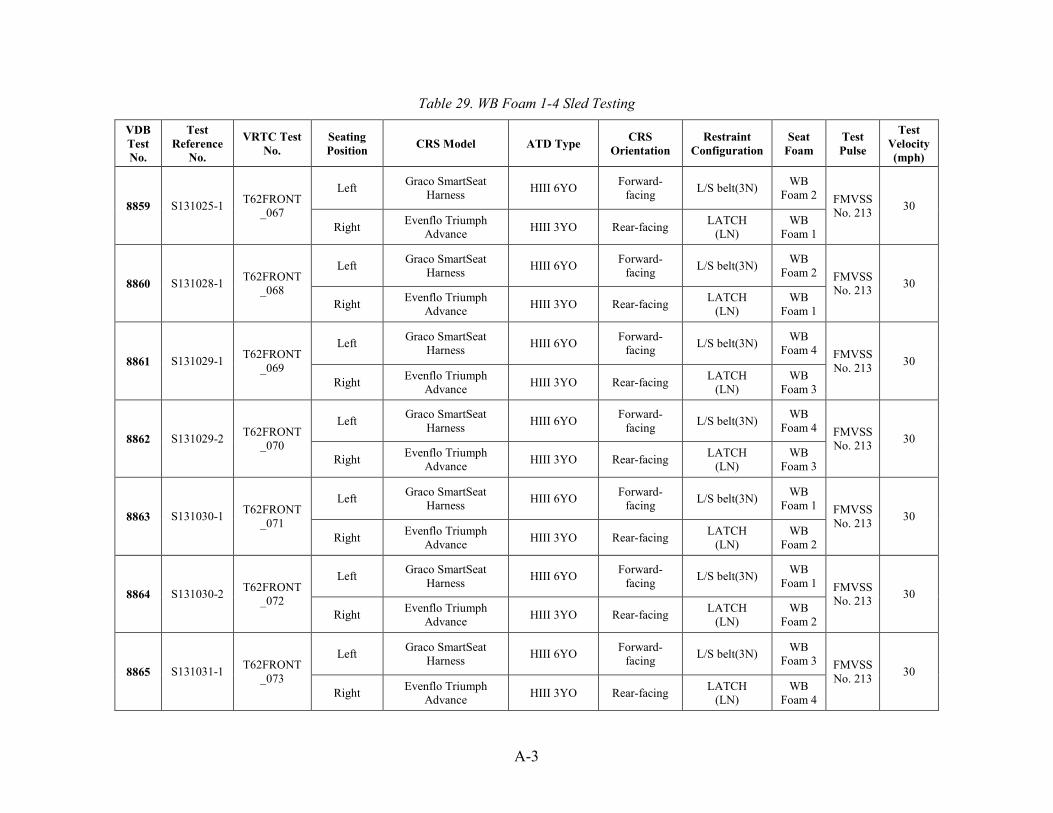
A-3
Table 29. WB Foam 1-4 Sled Testing
VDB Test No.
Test Reference
No.
VRTC Test No.
Seating Position CRS Model ATD Type CRS
Orientation Restraint
Configuration Seat
Foam Test Pulse
Test Velocity (mph)
8859 S131025-1 T62FRONT_067
Left Graco SmartSeat Harness HIII 6YO Forward-
facing L/S belt(3N) WB Foam 2 FMVSS
No. 213 30
Right Evenflo Triumph Advance HIII 3YO Rear-facing LATCH
(LN) WB
Foam 1
8860 S131028-1 T62FRONT_068
Left Graco SmartSeat Harness HIII 6YO Forward-
facing L/S belt(3N) WB Foam 2 FMVSS
No. 213 30
Right Evenflo Triumph Advance HIII 3YO Rear-facing LATCH
(LN) WB
Foam 1
8861 S131029-1 T62FRONT_069
Left Graco SmartSeat Harness HIII 6YO Forward-
facing L/S belt(3N) WB Foam 4 FMVSS
No. 213 30
Right Evenflo Triumph Advance HIII 3YO Rear-facing LATCH
(LN) WB
Foam 3
8862 S131029-2 T62FRONT_070
Left Graco SmartSeat Harness HIII 6YO Forward-
facing L/S belt(3N) WB Foam 4 FMVSS
No. 213 30
Right Evenflo Triumph Advance HIII 3YO Rear-facing LATCH
(LN) WB
Foam 3
8863 S131030-1 T62FRONT_071
Left Graco SmartSeat Harness HIII 6YO Forward-
facing L/S belt(3N) WB Foam 1 FMVSS
No. 213 30
Right Evenflo Triumph Advance HIII 3YO Rear-facing LATCH
(LN) WB
Foam 2
8864 S131030-2 T62FRONT_072
Left Graco SmartSeat Harness HIII 6YO Forward-
facing L/S belt(3N) WB Foam 1 FMVSS
No. 213 30
Right Evenflo Triumph Advance HIII 3YO Rear-facing LATCH
(LN) WB
Foam 2
8865 S131031-1 T62FRONT_073
Left Graco SmartSeat Harness HIII 6YO Forward-
facing L/S belt(3N) WB Foam 3 FMVSS
No. 213 30
Right Evenflo Triumph Advance HIII 3YO Rear-facing LATCH
(LN) WB
Foam 4
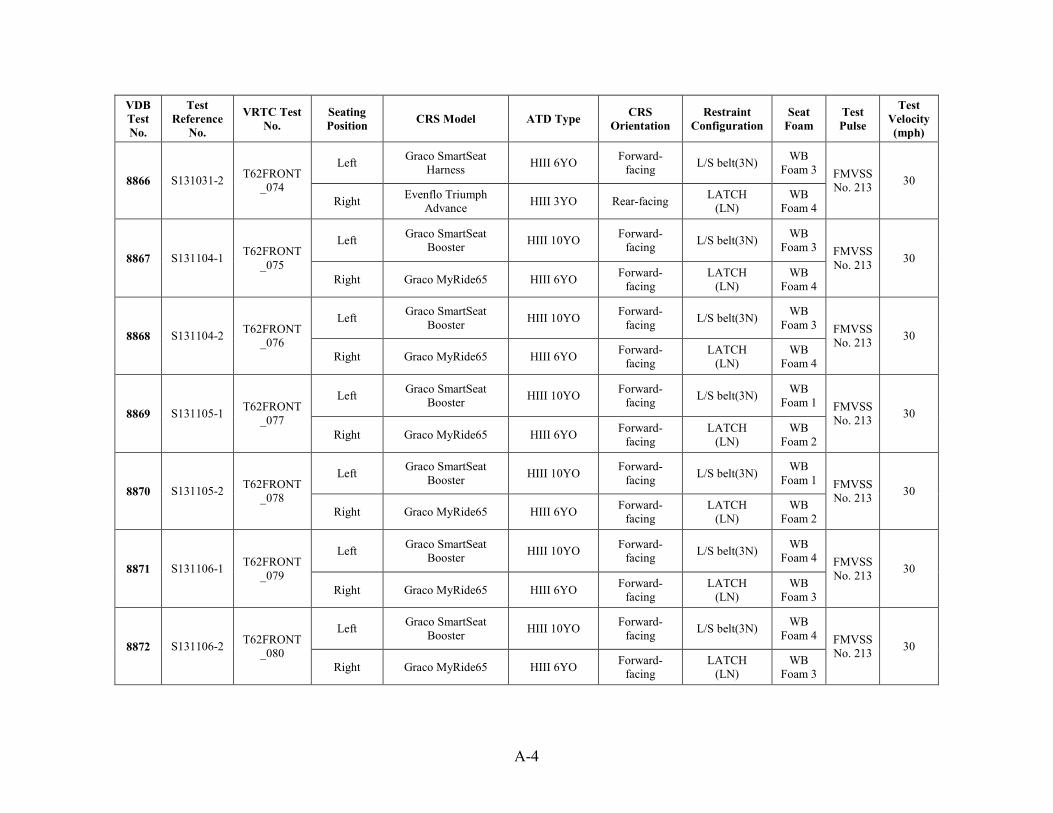
A-4
VDB Test No.
Test Reference
No.
VRTC Test No.
Seating Position CRS Model ATD Type CRS
Orientation Restraint
Configuration Seat
Foam Test Pulse
Test Velocity (mph)
8866 S131031-2 T62FRONT_074
Left Graco SmartSeat Harness HIII 6YO Forward-
facing L/S belt(3N) WB Foam 3 FMVSS
No. 213 30
Right Evenflo Triumph Advance HIII 3YO Rear-facing LATCH
(LN) WB
Foam 4
8867 S131104-1 T62FRONT_075
Left Graco SmartSeat Booster HIII 10YO Forward-
facing L/S belt(3N) WB Foam 3 FMVSS
No. 213 30
Right Graco MyRide65 HIII 6YO Forward-facing
LATCH (LN)
WB Foam 4
8868 S131104-2 T62FRONT_076
Left Graco SmartSeat Booster HIII 10YO Forward-
facing L/S belt(3N) WB Foam 3 FMVSS
No. 213 30
Right Graco MyRide65 HIII 6YO Forward-facing
LATCH (LN)
WB Foam 4
8869 S131105-1 T62FRONT_077
Left Graco SmartSeat Booster HIII 10YO Forward-
facing L/S belt(3N) WB Foam 1 FMVSS
No. 213 30
Right Graco MyRide65 HIII 6YO Forward-facing
LATCH (LN)
WB Foam 2
8870 S131105-2 T62FRONT_078
Left Graco SmartSeat Booster HIII 10YO Forward-
facing L/S belt(3N) WB Foam 1 FMVSS
No. 213 30
Right Graco MyRide65 HIII 6YO Forward-facing
LATCH (LN)
WB Foam 2
8871 S131106-1 T62FRONT_079
Left Graco SmartSeat Booster HIII 10YO Forward-
facing L/S belt(3N) WB Foam 4 FMVSS
No. 213 30
Right Graco MyRide65 HIII 6YO Forward-facing
LATCH (LN)
WB Foam 3
8872 S131106-2 T62FRONT_080
Left Graco SmartSeat Booster HIII 10YO Forward-
facing L/S belt(3N) WB Foam 4 FMVSS
No. 213 30
Right Graco MyRide65 HIII 6YO Forward-facing
LATCH (LN)
WB Foam 3

A-5
VDB Test No.
Test Reference
No.
VRTC Test No.
Seating Position CRS Model ATD Type CRS
Orientation Restraint
Configuration Seat
Foam Test Pulse
Test Velocity (mph)
8873 S131106-3 T62FRONT_081
Left Graco SmartSeat Booster HIII 10YO Forward-
facing L/S belt(3N) WB Foam 2 FMVSS
No. 213 30
Right Graco MyRide65 HIII 6YO Forward-facing
LATCH (LN)
WB Foam 1

B-1
Appendix B Procedure for a Rear Seat Dynamic Foam Test Overview: This procedure details the steps required to use the pendulum impact device (PID) inside and outside of a vehicle.
Glossary:
Angular rate sensor (ARS) measures the rate of change of position in degrees/second Redundant mounting block mounts accelerometers and angular rate sensors on the same block Seat bight is the location where the vehicle seatback and seat cushion meet Seat centerline is the midpoint laterally between the seams of the seat cushion Waterfall is the section of the seat near the seat bight where the cushion slopes upwards
PART 1: In-Vehicle Test
Tools and Equipment
- 4 ratchet straps - Sand bags or weights - Inclinometer - Tape measure - Masking tape - Ink pen - Aluminum foil tape - Digital camera - Test vehicle - 3 accelerometers (7264C) - 1 angular rate sensor (ARS-8k) - 1 Eurosid ATD pubic load cell - 1 event switch - 20” x 24” piece of plywood

B-2
Step 1: Vehicle Preparation Remove both front seats from the vehicle. In order to impact some of the locations on the rear seat, other objects may need to be removed, such as the center console. In order to stabilize the vehicle during impact, place jack stands under the rear of the vehicle so the shocks do not absorb the impact.
Step 1: Remove the front seats
Step 1: Place jack stands under the rear of the vehicle to isolate shock absorbers
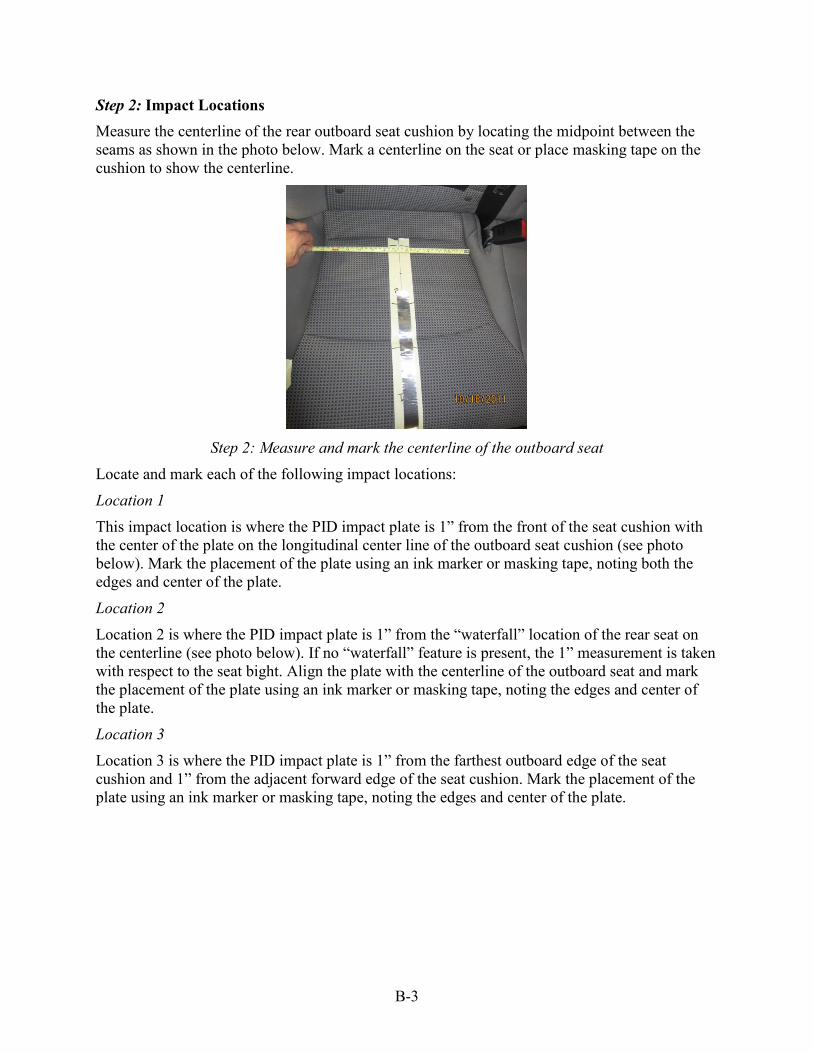
B-3
Step 2: Impact Locations Measure the centerline of the rear outboard seat cushion by locating the midpoint between the seams as shown in the photo below. Mark a centerline on the seat or place masking tape on the cushion to show the centerline.
Step 2: Measure and mark the centerline of the outboard seat
Locate and mark each of the following impact locations:
Location 1 This impact location is where the PID impact plate is 1” from the front of the seat cushion with the center of the plate on the longitudinal center line of the outboard seat cushion (see photo below). Mark the placement of the plate using an ink marker or masking tape, noting both the edges and center of the plate.
Location 2 Location 2 is where the PID impact plate is 1” from the “waterfall” location of the rear seat on the centerline (see photo below). If no “waterfall” feature is present, the 1” measurement is taken with respect to the seat bight. Align the plate with the centerline of the outboard seat and mark the placement of the plate using an ink marker or masking tape, noting the edges and center of the plate.
Location 3 Location 3 is where the PID impact plate is 1” from the farthest outboard edge of the seat cushion and 1” from the adjacent forward edge of the seat cushion. Mark the placement of the plate using an ink marker or masking tape, noting the edges and center of the plate.

B-4
3 1
2
Waterfall
1"
Centerline
1"
1"
1"
Step 2: Set up the PID and mark location Step 3: PID Installation Place a flat surface, such as a piece of plywood, on the front seat floor pan. Use wood shims as necessary to make the plywood sturdy and level. Install the PID in the vehicle. Use the inclinometer to confirm the plywood base is level. The base has two separate lift jacks that can be independently adjusted to move the baseplate of the PID. Align and level the PID over the impact site. Adjust the baseplate height to have the impact plate level at first contact with the seat, if possible. If not, raise the table to the highest position possible before the top of the PID contacts the roofline of the vehicle. Level the baseplate using an inclinometer in multiple directions or a circular bubble level. Using the inclinometer on the back of the PID pendulum arm, record the arm angle in the upright position and when the impact plate is at first contact with the seat.
Step 3: Measure the angle of the pendulum arm when it makes first contact with the seat

B-5
Step 4: Secure the PID To secure the PID during the impact, either attach and tighten the ratchet straps or place sand bags on the baseplate. If the ratchet straps are used, secure the baseplate using eyebolts and the frame of the vehicle. The eyebolts can be attached to the baseplate through any of the tapped holes to allow for optimum stabilization. Connect the hooks of the ratchet straps to the eyebolts on the baseplate and on a secure location of the vehicle, such as the chassis, frame, or body. If sand bags are used, place enough weight on the baseplate and the lift jacks so that the PID assembly stays secure during impact.
Step 4: Secure the PID using ratchet straps
Step 4: Alternative - secure the PID using ratchet straps and sand bags
Sandbags
Ratchet Straps

B-6
Step 5: Instrumentation and the Dynamic Foam Impact Mount a block that has tri-axis accelerometers and an angular rate sensor (ARS) (see photo below) on the PID arm, such that it is oriented at the centerline of the impact location with the ARS positioned to record the rotation of the arm about the y-axis. Attach a Eurosid ATD pubic load cell to the interface of the PID impact plate and arm to record the force of the impact. Use an event switch, such as aluminum foil tape, to record the time of impact. Data from the impact should include x-axis acceleration, y-axis acceleration, z-axis acceleration, force, angular roll rate, and the event switch.
Step 5: Attach an ARS and three accelerometers to the mounting block
Step 5: Attach the accelerometers, angular rate sensor, and load cell to the pendulum arm
X
Y Z
Front of Vehicle Rear of Vehicle

B-7
Event Tape
Event Tape
Step 5: Add event tape to the seat and PID impact plate Weight can be added to the arm to change the displacement and speed of the impact. Conduct preliminary impacts to find the weight that produces the desired speed and foam displacement. Record the weight attached to the arm in the notes section.
Weight
Weight
Step 5: Add weight to the pendulum arm
Step 6: Data Processing Synchronize the channels by setting time zero to be when the event switch is triggered. Process the data by filtering the accelerometers, angular rate sensor, and load cell at Channel Frequency Class 60 (CFC60). Additionally, process the angular rate sensor data to CFC180 for use in calculations. To calculate the rotation angle of the PID arm, integrate the angular rate sensor data filtered at CFC180. To determine the displacement of the PID arm into the seat, calculate the distance the arm travels per degree using the equations below. First convert degrees to radians (equation 1), then multiply the radians of travel by the length of the PID arm from its pivot to the center of the PID impact plate (equation 2). Calculate the displacement distance by subtracting
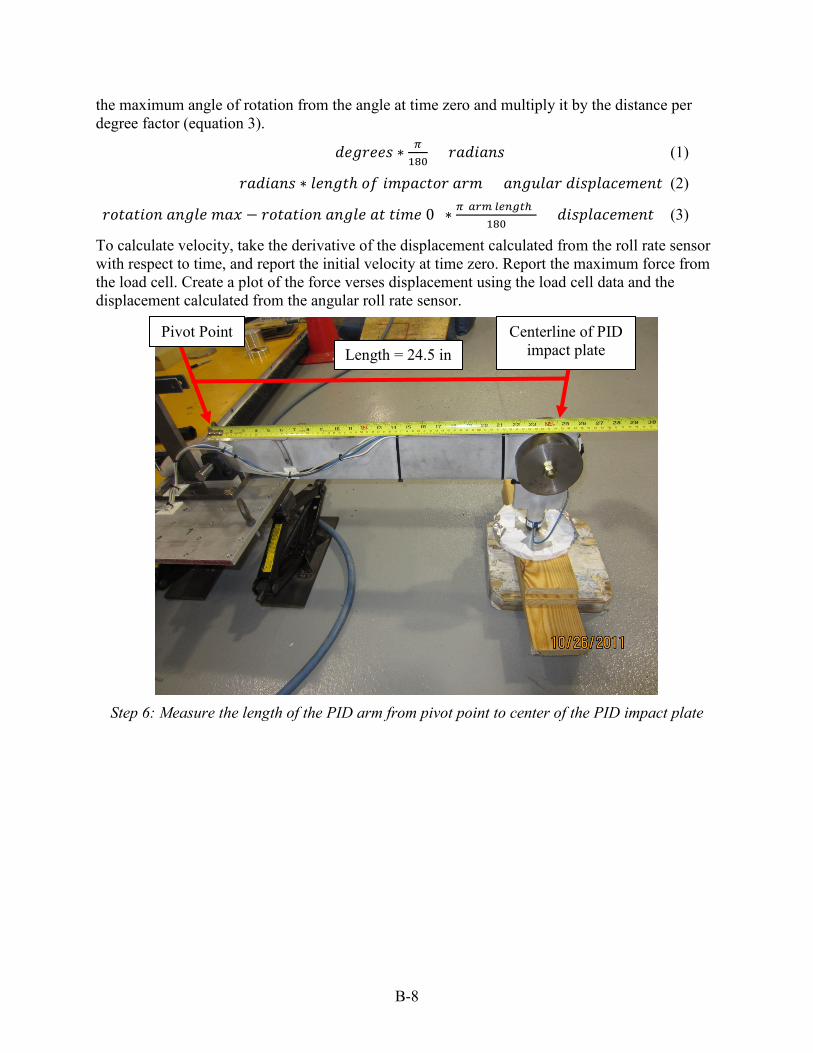
B-8
the maximum angle of rotation from the angle at time zero and multiply it by the distance per degree factor (equation 3).
𝑑𝑑𝑑𝑑𝑑𝑑𝑑𝑑𝑑𝑑𝑑𝑑𝑑𝑑 ∗ 𝜋𝜋180
= 𝑑𝑑𝑟𝑟𝑑𝑑𝑟𝑟𝑟𝑟𝑟𝑟𝑑𝑑 (1)
𝑑𝑑𝑟𝑟𝑑𝑑𝑟𝑟𝑟𝑟𝑟𝑟𝑑𝑑 ∗ 𝑙𝑙𝑑𝑑𝑟𝑟𝑑𝑑𝑛𝑛ℎ 𝑜𝑜𝑜𝑜 𝑟𝑟𝑖𝑖𝑖𝑖𝑟𝑟𝑖𝑖𝑛𝑛𝑜𝑜𝑑𝑑 𝑟𝑟𝑑𝑑𝑖𝑖 = 𝑟𝑟𝑟𝑟𝑑𝑑𝑎𝑎𝑙𝑙𝑟𝑟𝑑𝑑 𝑑𝑑𝑟𝑟𝑑𝑑𝑖𝑖𝑙𝑙𝑟𝑟𝑖𝑖𝑑𝑑𝑖𝑖𝑑𝑑𝑟𝑟𝑛𝑛 (2)
(𝑑𝑑𝑜𝑜𝑛𝑛𝑟𝑟𝑛𝑛𝑟𝑟𝑜𝑜𝑟𝑟 𝑟𝑟𝑟𝑟𝑑𝑑𝑙𝑙𝑑𝑑 𝑖𝑖𝑟𝑟𝑚𝑚 − 𝑑𝑑𝑜𝑜𝑛𝑛𝑟𝑟𝑛𝑛𝑟𝑟𝑜𝑜𝑟𝑟 𝑟𝑟𝑟𝑟𝑑𝑑𝑙𝑙𝑑𝑑 𝑟𝑟𝑛𝑛 𝑛𝑛𝑟𝑟𝑖𝑖𝑑𝑑 0) ∗ 𝜋𝜋(𝑎𝑎𝑎𝑎𝑎𝑎 𝑙𝑙𝑙𝑙𝑙𝑙𝑙𝑙𝑙𝑙ℎ)180
= 𝑑𝑑𝑟𝑟𝑑𝑑𝑖𝑖𝑙𝑙𝑟𝑟𝑖𝑖𝑑𝑑𝑖𝑖𝑑𝑑𝑟𝑟𝑛𝑛 (3)
To calculate velocity, take the derivative of the displacement calculated from the roll rate sensor with respect to time, and report the initial velocity at time zero. Report the maximum force from the load cell. Create a plot of the force verses displacement using the load cell data and the displacement calculated from the angular roll rate sensor.
Pivot Point Centerline of PID impact plate Length = 24.5 in
Step 6: Measure the length of the PID arm from pivot point to center of the PID impact plate

B-9
PART 2: Test Bench
Tools and Equipment
- Sand bags or weights - Inclinometer - Tape measure - Masking tape - Ink pen - Aluminum foil tape - Digital camera - Foam samples - 3 accelerometers - 1 angular rate sensor - 1 Eurosid ATD pubic load cell - 1 event switch
Step 1: Preparation Acquire the foam to be tested and place it on the ground or a mounting platform that is adjustable and sturdy.
Step 1: Place the foam on the ground or a sturdy adjustable table
Step 2: Preparation and Impact Locations Locate the centerline of the seating position on the foam sample. Mark a centerline on the foam, or place masking tape to show the centerline.
Step 3: PID Set-up Place the PID on a flat, sturdy surface. Align and level the PID over the impact site using the two lift jacks. Adjust the height of the baseplate to have the impact plate level with the foam sample at first contact. Level the baseplate using an inclinometer in multiple directions or a circular bubble level. Record the angle of the PID pendulum arm when the impact plate is at first contact with the foam sample and when it is in the upright position.

B-10
Step 3: Measure the angle of the pendulum arm when it makes first contact with the foam
Secure the PID using sand bags and/or weights on either side to prevent movement during impact.
Step 3: Secure the PID using sand bags and/or weights

B-11
Step 4: Instrumentation and the Dynamic Foam Impact Mount a block that has tri-axis accelerometers and an angular rate sensor (ARS) (see photo below) on the PID arm, such that it is oriented at the centerline of the impact location with the ARS positioned to record the rotation of the arm about the y-axis. Attach a Eurosid ATD pubic load cell to the interface of the PID impact plate and arm to record the force of the impact. Use an event switch, such as aluminum foil tape, to record the time of impact. Data from the impact should include x-axis acceleration, y-axis acceleration, z-axis acceleration, force, angular roll rate, and the event switch.
X
Y Z
Step 4: Attach the accelerometers, angular rate sensor, and load cell to the pendulum arm
Step 4: Attach an ARS and three accelerometers to the mounting block

B-12
Event Tape
Event Tape
Step 4: Add event tape to the foam and PID impact plate Weight can be added to the arm to change the displacement and speed of the impact. Conduct preliminary impacts to find the weight that produces the desired speed and foam displacement. Record the weight attached to the arm in the notes section.
Weight
Weight
Step 4: Add weight to the pendulum arm
Step 5: Data Processing Synchronize the channels by setting time zero to be when the event switch is triggered. Process the data by filtering the accelerometers, angular rate sensor, and load cell at Channel Frequency Class 60 (CFC60). Additionally, process the angular rate sensor data to CFC180 for use in calculations. To calculate the rotation angle of the PID arm integrate the angular rate sensor data filtered at CFC180. To determine the displacement of the PID arm into the foam sample, calculate the distance the arm travels per degree using the equations below. First convert degrees to radians (Equation 1), then multiply the radians of travel by the length of the PID arm from its pivot to the center of the PID impact plate (Equation 2). Calculate the displacement distance by subtracting the maximum angle of rotation from the angle at time zero and multiplying it by the distance per degree factor (Equation 3).

B-13
𝑑𝑑𝑑𝑑𝑑𝑑𝑑𝑑𝑑𝑑𝑑𝑑𝑑𝑑 ∗ 𝜋𝜋180
= 𝑑𝑑𝑟𝑟𝑑𝑑𝑟𝑟𝑟𝑟𝑟𝑟𝑑𝑑 (1)
𝑑𝑑𝑟𝑟𝑑𝑑𝑟𝑟𝑟𝑟𝑟𝑟𝑑𝑑 ∗ 𝑙𝑙𝑑𝑑𝑟𝑟𝑑𝑑𝑛𝑛ℎ 𝑜𝑜𝑜𝑜 𝑟𝑟𝑖𝑖𝑖𝑖𝑟𝑟𝑖𝑖𝑛𝑛𝑜𝑜𝑑𝑑 𝑟𝑟𝑑𝑑𝑖𝑖 = 𝑟𝑟𝑟𝑟𝑑𝑑𝑎𝑎𝑙𝑙𝑟𝑟𝑑𝑑 𝑑𝑑𝑟𝑟𝑑𝑑𝑖𝑖𝑙𝑙𝑟𝑟𝑖𝑖𝑑𝑑𝑖𝑖𝑑𝑑𝑟𝑟𝑛𝑛 (2)
(𝑑𝑑𝑜𝑜𝑛𝑛𝑟𝑟𝑛𝑛𝑟𝑟𝑜𝑜𝑟𝑟 𝑟𝑟𝑟𝑟𝑑𝑑𝑙𝑙𝑑𝑑 𝑖𝑖𝑟𝑟𝑚𝑚 − 𝑑𝑑𝑜𝑜𝑛𝑛𝑟𝑟𝑛𝑛𝑟𝑟𝑜𝑜𝑟𝑟 𝑟𝑟𝑟𝑟𝑑𝑑𝑙𝑙𝑑𝑑 𝑟𝑟𝑛𝑛 𝑛𝑛𝑟𝑟𝑖𝑖𝑑𝑑 0) ∗ 𝜋𝜋(𝑎𝑎𝑎𝑎𝑎𝑎 𝑙𝑙𝑙𝑙𝑙𝑙𝑙𝑙𝑙𝑙ℎ)180
= 𝑑𝑑𝑟𝑟𝑑𝑑𝑖𝑖𝑙𝑙𝑟𝑟𝑖𝑖𝑑𝑑𝑖𝑖𝑑𝑑𝑟𝑟𝑛𝑛 (3)
To calculate velocity, take the derivative of the displacement calculated from the roll rate sensor with respect to time, and report the initial velocity at time zero. Report the maximum force from the load cell. Create a plot of the force verses displacement using the load cell data and the displacement calculated from the angular roll rate sensor.
Pivot Point Centerline of PID
impact plate
Length = 24.5 in
Step 5: Measure the length of the PID arm from pivot point to center of the PID impact plate

C-1
Appendix C Table 30. Experimental Foam Combination Test Matrix
Test Number Description of Foam Used
Angle of Arm at
Impact (°)
Angle of Foam (°) Cover Used
TEST 1 7” EF Sample 4 11 0 No Cover TEST 2 7” EF Sample 4 0.3 0 No Cover TEST 3 7” EF Sample 4 0.3 0 No Cover TEST 4 7” EF Sample 4 0.3 0 No Cover TEST 5 7” EF Sample 4 – No “Skin” 0.3 0 No Cover TEST 6 5” EF Sample 4 0.2 0 No Cover
TEST 7 1” 213 Stiff Foam on Top and 4” EF Sample 4 on Bottom 0 0 No Cover
TEST 8 4” EF Sample on Top and 1” 213 Stiff Foam on Bottom 0 0 No Cover
TEST 9 4” EF Sample on Top and 1” 213 Stiff Foam on Bottom 11.3 0 No Cover
TEST 10 4" EF Sample 4 on Top and 1" 213 Stiff Foam on Bottom 1 13.6 Orange ECE R44 Cloth
TEST 11 4" EF Sample 4 on Top and 1" 213 Stiff Foam on Bottom 1.4 13.6 Orange ECE R44 Cloth
TEST 12 1" 213 Stiff Foam on Top and 4" EF Sample 4 on Bottom 1.7 13.6 Orange ECE R44 Cloth
TEST 13 2" 213 Stiff Foam on Top and 3" EF Sample 4 on Bottom 1.5 13.6 Orange ECE R44 Cloth
TEST 14 3" EF Sample 4 on Top and 2" 213 Stiff Foam on Bottom 1.5 13.6 Orange ECE R44 Cloth
TEST 15 3" EF Sample 4 on Top and 2" 213 Stiff Foam on Bottom 1.5 13.6 Orange ECE R44 Cloth
TEST 16 3" EF Sample 4 on Top and 2" 213 Stiff Foam on Bottom 1.5 13.6 White Muslin Cloth
TEST 17 2" 213 Stiff Foam on Top and 3" EF Sample 4 on Bottom 1.5 13.6 White Muslin Cloth
TEST 18 4" EF Sample 4 on Top and 1" 213 Stiff Foam on Bottom 1.5 13.6 White Muslin Cloth
TEST 19 3" EF Sample 4 on Top and 1" 213 Stiff Foam on Bottom 0.3 13.6 Orange ECE R44 Cloth
TEST 20 1" 213 Stiff Foam on Top and 3" EF Sample 4 on Bottom 0.3 13.6 Orange ECE R44 Cloth
TEST 21 2" 213 Stiff Foam on Top and 2" EF Sample 4 on Bottom 0.3 13.6 Orange ECE R44 Cloth
TEST 22 2" EF Sample 4 on Top and 2" 213 Stiff Foam on Bottom 0.3 13.6 Orange ECE R44 Cloth
TEST 23 2" EF Sample 4 on Top and 2" 213 Stiff Foam on Bottom 0.3 13.6 Orange ECE R44 Cloth
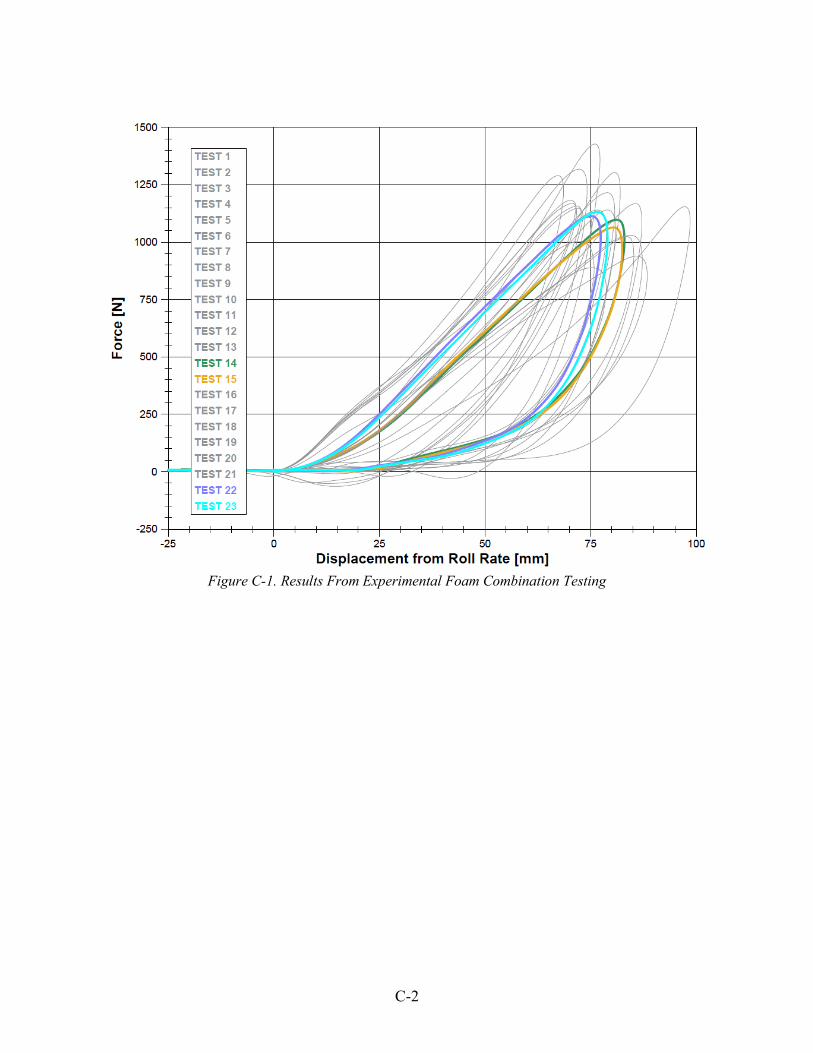
C-2
Figure C-1. Results From Experimental Foam Combination Testing

DOT HS 813 099 September 2021
15123-083121-v6