Embed Size (px)
Citation preview
Journal of Epidemiology and Community Health, 1986, 40, 143-153
An evaluation of screening policies for cervical cancerin England and Wales using a computer simulationmodelD M PARKIN1 AND S M MOSS2From the International Agency for Research on Cancer,1 Lyon, France and the-Institute for Cancer Research,2Sutton, Surrey, England
SUMMARY Several screening policies have been recommended for implementation in England andWales in the last 20 years, although no evidence as to their relative effectiveness or efficiency hasbeen provided. Using a computer simulation model, the outcomes expected from those policies hadthey been implemented over a 30 year period (1961-90) have been examined. The original policiesbased on five-yearly testing of women aged over 35 appear to be the most cost-effective, andextension of screening to younger age groups leads to loss of efficiency. Attempts to usenon-screening health care contacts in order to take cervical smears (eg, during pregnancy, familyplanning, at gynaecology clinics) produce few advantages and considerably complicate theestablishment of regular testing for the individual. The achievement of higher attendance rates is asimportant to the outcome of screening as concentration on more intensive or complex policies.
Cervical cytology screening is undoubtedly effectivein reducing the incidence of invasive carcinoma andin preventing subsequent death and disability.However, there is disagreement on the mostsatisfactory screening policy which should beemployed, even within a single population such asthat of England and Wales. There are manyconsiderations to bear in mind, the most important ofwhich is the natural history of the disease in terms ofthe incidence rate and sojourn-time of thepre-invasive stages of disease, and their variationwith age, which can be used in mathematical modelsto estimate the apparently optimal spacing of a givennumber of screening tests."q In addition, however,several other factors influence the precise policyadopted. These include epidemiological knowledgeof groups of the population at potentially higher riskof abnormalities of the cervix (eg, women attendingfamily planning or gynaecological clinics), practicalconsiderations such as the opportunity to examinewomen who might not normally attend for screening(eg, during or soon after pregnancy), and oftenintuitive judgements about the desirability ofdifferent outcomes. An example of the latter is theevident concern engendered by relatively few casesof cervical cancer in young women45 compared withthe ineffectiveness of the current screeningprogrammes in preventing disease in the elderly.6
In this paper we compare the predicted results ofimplementing several different screening policieswhich have been recommended for England andWales since 1965. This was done using a computersimulation model which reproduces the demographicstructure of the female population of England andWales over a 30-year period (1961-90) andsimulates the occurrence of cervical cancer in thispopulation, using different assumptions concerningnatural history. This allows, in effect, the comparisonof input and outcomes of different interventions insimilar populations, in an analogy with a series of(very large) clinical trials.
It is intuitively obvious that the outcome ofscreening, however measured, increases with thevolume of input-usually expressed as the number oftests performed.7 It is therefore essential to comparepolicies in terms of their cost-effectiveness: theresults obtained in proportion to the resourcesdeployed.8Methods
COMPUTER SIMULATION MODELThis has been described in detail elsewhere.9 Itemploys a microsimulation approach, where the lifehistories of individuals in a random sample of size100 000 of the female population of England andWales are modelled during the 30 years 1961-90.
143
Protected by copyright.
on 9 June 2019 by guest.http://jech.bm
j.com/
J Epidem
iol Com
munity H
ealth: first published as 10.1136/jech.40.2.143 on 1 June 1986. Dow
nloaded from
144The natura
by specifyingdifferent statoccult/microihysterectomyother causes)conditional cmarital statutransition ralnatural histoiThese naturareproduce thdisease and aEngland andscreening watransient conthe median dinatural historas shown in fThe incidei
precursors) is
300 Hi
200-No
100
0
200No
100
D M Parkin and S M MossA history of cervix cancer is reproduced marked differences in risk of disease in different birthsets of transition rates between eight cohorts;"0 in an unscreened population these changes
es (normal, dysplasia, carcinoma in situ, would give rise to increases in incidence, particularlyinvasive carcinoma, clinical cancer, among younger women belonging to cohorts born(, dead of cancer of cervix, and dead of since 1931.ff In order to simulate this increase, twoi.The transfer probabilities can be made different approaches were used:rn age, duration in state, parity, and (1) The incidence of dysplasia was weightedIs. For the present study, two sets of according to the relative risk of preclinical disease bytes were used, corresponding to the marital status and parity.1" The changing pattern ofries Hi and H3 previously described.9 marriage and divorce and, to a much lesser extent,.l histories are quite different, yet both childbearing during the 30-year period 1961-90e observed prevalence of preclinical results in increasing prevalence of preclinical diseaseige specific incidence rates observed in and a progressive increase in incidence.9 However,Wales in the early 1960s, before the observed changes in the shape of the age-specific
is introduced. In both, dysplasia is a incidence curve are not well reproduced by thisdition-75-800%0 of cases regress-and method.uration is only two years. However, the (2) For each five-year birth cohort, the transferry of carcinoma in situ is very different, rates from normal to dysplasia were multiplied by aFigure 1. cohort factor, c. These were calculated fromnce of carcinoma of the cervix (and its estimated rates of incidence of clinical cancer, by agechanging quite rapidly at present, with group and calendar period, in the absence of
screening,6 it being assumed that the relative risk ofdysplasia between cohorts would be the same as that
All lesions (upwer line) for clinical cancer. The cohort factors were calculated
Progressive lesions (Ilower lire) by fitting an age, period, and cohort model12 using theGLIM package; addition of period effects was notfound to improve the fit of the model, so that sucheffects were ignored. Since the simulation deals withwomen born between 1861 and 1991, someprojection of cohort factors was required. Those
; * - --\*,- ;; - l-;before1881 (the base year, c=1.0) were set to 1I0.Projection beyond the latest data point (1956) can bedone in various ways,;3 we chose to assume that therate of increase in c observed since 1946 continueduntil 1981 and then remained constant. The values ofc applied are shown in figure 2.
Natural histories Hi and H3 were used with both...I-.:-:X:.X.the marital/parity weighting (HiM, H3M) and with
the cohort factors (HiC, H3C).
05 10 15 20 25 30
YearsFig 1 Sojourn time distributions ofcarcinoma in situ. Thecurves represent the distribution of the durations ofcarcinomas in situ for two different sets of assumptionsconcerning natural history (HI and H3). The upper curve isthat for all lesions, the lower for those which progress tobecome invasive. The ratio of the areas below the curves
(open and shaded) represents the ratio of regressive toprogressive lesions.
In HI, the distribution ofsojourn times is exponential inform, their median duration is 10 years, and only 15% oflesions regress.
In H3, 500%. of cases regress; progressive lesions have a
skew (approximately log-normal) distribution of sojourntimes; their median duration is 12 years.
SCREENING POLICIESSeven screening policies which have beenrecommended for implementation in England andWales were simulated.
(1) (MOH) The original policy promulgated bythe Ministry of Health in 196614 was for the screeningof women aged 35 and over at five-yearly intervals.No upper age limit for testing was suggested; we haveassumed that screening will cease after age 65 (amaximum of seven tests per lifetime).
(2) (MOH+) The provision for beginningscreening after a third pregnancy was added to thispolicy in 1973.
(3) (BSCC) The British Society for ClinicalCytology made a new set of proposals in 1977:15
Protected by copyright.
on 9 June 2019 by guest.http://jech.bm
j.com/
J Epidem
iol Com
munity H
ealth: first published as 10.1136/jech.40.2.143 on 1 June 1986. Dow
nloaded from
An evaluation ofscreening policies for cervical cancer in Englad and Wales using a computer simulation model 14510-8-6-
0
...2
1-
0.8-0.6-
1861 181 1901 1921 194.1 1961 1981 2001Yeor of birth
Fig 2 Cohort factors (c) for onset of dysplasia. Theincrease in risk of dysplasia for women of different birthcohorts relative to that of1881. The solid line is derivedfrommodelling of England and Wales incidence rates for cervixcancer; the dotted lines are projections from this (see text).
Start screening around age 25 at any consultationfor contraception, pregnancy or venereal disease;any sexually active woman who has not been testedshould have a first smear at age 30. Tests should beperformed at five-yearly intervals until age 70 (noage limit for a first test).
Since the model simulates the occurrence of births,testing during pregnancy is easily incorporated. Inthe absence of information concerning individualprobability of consulting for contraception orvenereal disease, we have assumed an annualprobability of doing so of 0 13 (so that 509X. ofwomenwill be contacted between the ages of 25 and 29), andthat the prevalence of preclinical abnormalities inwomen who attend such consultations is twice that inthose who do not.
(4) (BSCC+) The same group suggested thatscreening should be performed at " three yearlyintervals in those aged over 35 if resources permit".
(5) (CGC) The policy recommended in 1982by the Committee on Gynaecological Cytology16 is asfollows:Smears should be taken at the ages 35, 40, 45, 50,
55, 60, 65, and also- early in the course of each pregnancy;
at age 22, or the next visit thereafter, forwomen attending for family planning advice,and who have not previously been screened;at age 30, for women attending for familyplanning advice, and who have not had a smear
during the previous five years.Any other woman aged between 22 and 35 who is,
or has been, sexually active should be screened on
one occasion in this age interval if she requests a test.
The complexity and ambiguity of this policy makeprecise specifications for the model rather difficult.The probability of attending for family planningadvice between ages 22 and 24 was set at 0- 5, and (forwomen unscreened in the preceeding five years) at0-3 at age 30. For attenders at such screening,prevalence of preclinical abnormality of the cervix isassumed to be double that of non-attenders.
(6) (CGC+) The committee making the aboverecommendations noted: "The practice of takingsmears at STD and gynaecological clinics is a usefulone since women attending these clinics are likely tobe in high risk groups". Screening at clinic attendancewas thus added to the policy defined in (5). Hospitaladmission rates, by age, for gynaecology are availablefrom HIPE, but for outpatients only total numbers ofattendances (new and old) are recorded."7 Theannual number of cytology tests from hospital clinicsbetween 1965 and 198018 corresponds very closelywith the number of gynaecology admissions. Clinicscreening is thus modelled using age-specificgynaecology admission rates for 1966-80 withextrapolations beyond these years based on theobserved annual increase of 20%o. For individuals withpreclinical disease, attendance rates are multiplied by3 to correspond with the observed relativeprevalence of abnormalities in clinic attenderscompared to other sources of tests.19
(7) (CGC II) The Committee forGynaecological Cytology has recently revised itsrecommendations.221 Emphasis is placed onscreening women over 35 and those who have hadthree or more pregnancies, at five-yearly intervals.Screening should start "for any woman who is or hasbeen sexually active on her first presentation forcontraceptive advice, or whenever she first requestsscreening. Screening should be repeated... at theages of 20, 25, 30, and 35 and not on any otheroccasion, except that every woman should bescreened early in. .. each pregnancy".For simulation of screening related to
contraceptive advice (or spontaneous demand) thesame parameters as Policy 3 were used, that is, anannual probability of 0-13 (starting at age 16) withprevalence of abnormality in attenders double that innon-attenders. Screening is stopped at age 65 forwomen with two consecutive negative smears.For comparison with the seven "recommended"
policies, the results from two very simple schedules oftests were studied:
(8) Five-yearly tests from age 25 to 65(maximum of nine per lifetime);
(9) Three-yearly tests from 25 to 64 (maximumof 14 per lifetime).
All of the policies tested comprise mixtures of"incidental" tests (taken during attendance for some
Protected by copyright.
on 9 June 2019 by guest.http://jech.bm
j.com/
J Epidem
iol Com
munity H
ealth: first published as 10.1136/jech.40.2.143 on 1 June 1986. Dow
nloaded from
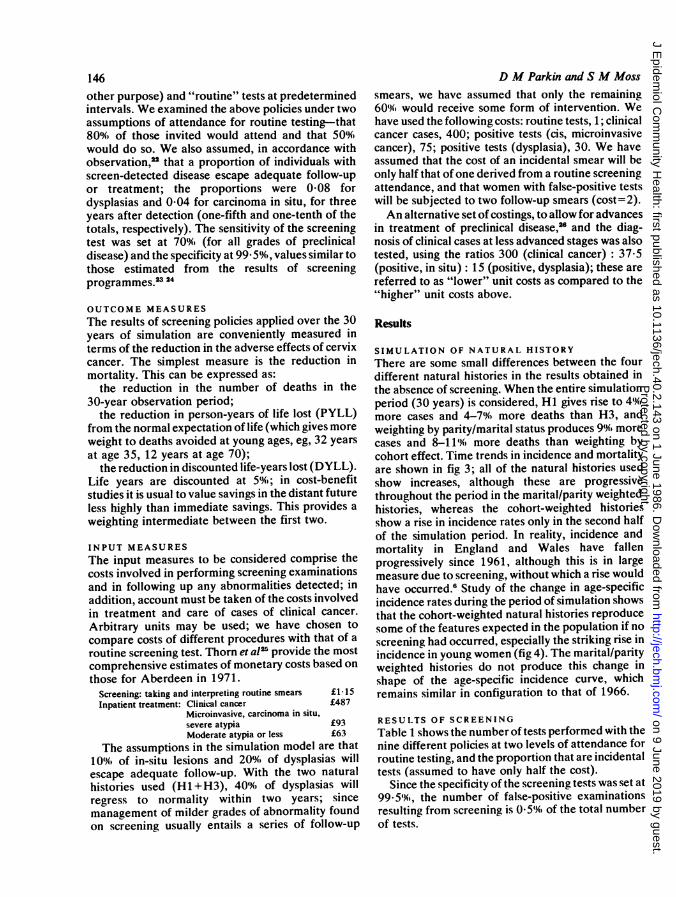
146other purpose) and "routine" tests at predeterminedintervals. We examined the above policies under twoassumptions of attendance for routine testing-that80%. of those invited would attend and that 50%.would do so. We also assumed, in accordance withobservation,22 that a proportion of individuals withscreen-detected disease escape adequate follow-upor treatment; the proportions were 0-08 fordysplasias and 0 04 for carcinoma in situ, for threeyears after detection (one-fifth and one-tenth of thetotals, respectively). The sensitivity of the screeningtest was set at 70%Ai (for all grades of preclinicaldisease) and the specificity at 99 59X., values similar tothose estimated from the results of screeningprogrammes.24
OUTCOME MEASURESThe results of screening policies applied over the 30years of simulation are conveniently measured interms of the reduction in the adverse effects of cervixcancer. The simplest measure is the reduction inmortality. This can be expressed as:
the reduction in the number of deaths in the30-year observation period;
the reduction in person-years of life lost (PYLL)from the normal expectation of life (which gives moreweight to deaths avoided at young ages, eg, 32 years
at age 35, 12 years at age 70);the reduction in discounted life-years lost (DYLL).
Life years are discounted at 50%6; in cost-benefitstudies it is usual to value savings in the distant futureless highly than immediate savings. This provides a
weighting intermediate between the first two.
INPUT MEASURESThe input measures to be considered comprise thecosts involved in performing screening examinationsand in following up any abnormalities detected; inaddition, account must be taken of the costs involvedin treatment and care of cases of clinical cancer.
Arbitrary units may be used; we have chosen tocompare costs of different procedures with that of a
routine screening test. Thorn et al25 provide the mostcomprehensive estimates of monetary costs based onthose for Aberdeen in 1971.
Screening: taking and interpreting routine smears £1-15Inpatient treatment: Clinical cancer £487
Microinvasive, carcinoma in situ,severe atypia £93Moderate atypia or less £63
The assumptions in the simulation model are that10%O of in-situ lesions and 201%, of dysplasias willescape adequate follow-up. With the two naturalhistories used (Hi+H3), 401% of dysplasias willregress to normality within two years; sincemanagement of milder grades of abnormality foundon screening usually entails a series of follow-up
D M Parkin and S M Mosssmears, we have assumed that only the remaining600, would receive some form of intervention. Wehave used the following costs: routine tests, 1; clinicalcancer cases, 400; positive tests (cis, microinvasivecancer), 75; positive tests (dysplasia), 30. We haveassumed that the cost of an incidental smear will beonly half that of one derived from a routine screeningattendance, and that women with false-positive testswill be subjected to two follow-up smears (cost=2).An alternative set of costings, to allow for advances
in treatment of preclinical disease,w and the diag-nosis of clinical cases at less advanced stages was alsotested, using the ratios 300 (clinical cancer) : 37-5(positive, in situ): 15 (positive, dysplasia); these arereferred to as "lower" unit costs as compared to the"higher" unit costs above.
Results
SIMULATION OF NATURAL HISTORY
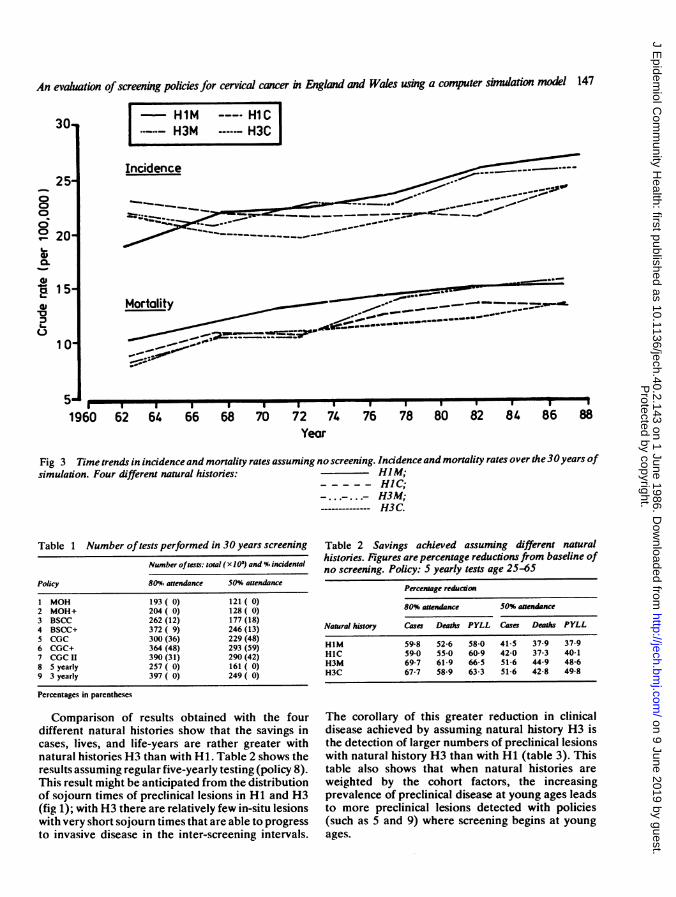
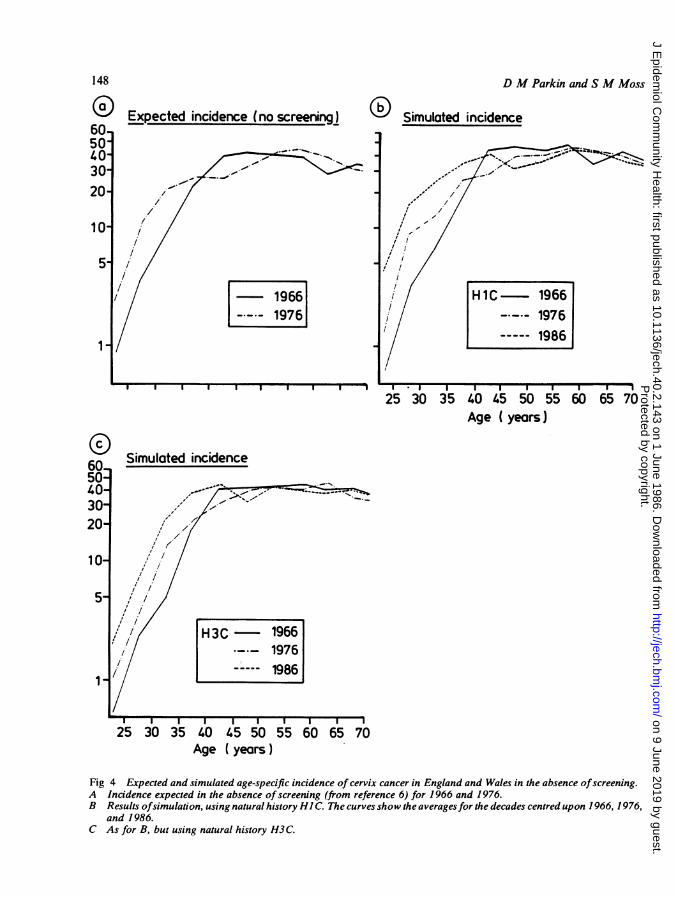
There are some small differences between the fourdifferent natural histories in the results obtained inthe absence of screening. When the entire simulationperiod (30 years) is considered, Hi gives rise to 4%.more cases and 4-7'%. more deaths than H3, andweighting by parity/marital status produces 9%. morecases and 8-11%. more deaths than weighting bycohort effect. Time trends in incidence and mortalityare shown in fig 3; all of the natural histories usedshow increases, although these are progressivethroughout the period in the marital/parity weightedhistories, whereas the cohort-weighted historiesshow a rise in incidence rates only in the second halfof the simulation period. In reality, incidence andmortality in England and Wales have fallenprogressively since 1961, although this is in largemeasure due to screening, without which a rise wouldhave occurred.6 Study of the change in age-specificincidence rates during the period of simulation showsthat the cohort-weighted natural histories reproducesome of the features expected in the population if noscreening had occurred, especially the striking rise inincidence in young women (fig 4). The marital/parityweighted histories do not produce this change inshape of the age-specific incidence curve, whichremains similar in configuration to that of 1966.
RESULTS OF SCREENINGTable 1 shows the number of tests performed with thenine different policies at two levels of attendance forroutine testing, and the proportion that are incidentaltests (assumed to have only half the cost).
Since the specificity of the screening tests was set at99*5%,, the number of false-positive examinationsresulting from screening is 0 51% of the total numberof tests.
Protected by copyright.
on 9 June 2019 by guest.http://jech.bm
j.com/
J Epidem
iol Com
munity H
ealth: first published as 10.1136/jech.40.2.143 on 1 June 1986. Dow
nloaded from
An evaluation ofscreening policies for cervical cancer in Engklnd and Wales using a computer simulation model 147
M HlM Hl-HCH3M H3C
Incidence ==___~~~ 7 _-_X
Motality ___ _____
*I- -----II1 * - I I I I. . W.
62 64 66 68 70 72 74 76 78 80 82 84 86 88Year
Fig 3 Time trends in incidenceand mortality rates assuming noscreening. Incidenceand mortality rates over the30years ofsimulation. Four different natural histories: HIMM;
----- HIC;--..-... H3M;
------------- H3C.
Table 1 Number of tests performed in 30 years screening
Number oftests: total (x 103) and % incidental
Policy 80% attendance 50% attendance
1 MOH 193 (0) 121 (0)2 MOH+ 204 (0) 128 (0)3 BSCC 262 (12) 177 (18)4 BSCC+ 372 ( 9) 246 (13)5 CGC 300 (36) 229 (48)6 CGC+ 364 (48) 293 (59)7 CGC II 390 (31) 290 (42)8 5 yearly 257 (0) 161 (0)9 3 yearly 397 (0) 249 (0)
Percentages in parentheses
Comparison of results obtained with the fourdifferent natural histories show that the savings incases, lives, and life-years are rather greater withnatural histories H3 than with Hi. Table 2 shows theresults assuming regular five-yearly testing (policy 8).This result might be anticipated from the distributionof sojourn times of preclinical lesions in HI and H3(fig 1); with H3 there are relatively few in-situ lesionswith very short sojourn times that are able to progressto invasive disease in the inter-screening intervals.
Table 2 Savings achieved assuming different naturalhistories. Figures are percentage reductions from baseline ofno screening. Policy: 5 yearly tests age 25-65
Percentage reduction80% attendance 50% attendance
Natural history Cases Deaths PYLL Casas Deaths PYLL
HlM 59-8 52-6 58-0 41-5 37-9 37-9H1C 59-0 550 60-9 42-0 37-3 40-1H3M 69-7 61-9 665 51-6 44 9 48-6H3C 67-7 58 9 63-3 51-6 42-8 49-8
The corollary of this greater reduction in clinicaldisease achieved by assuming natural history H3 isthe detection of larger numbers of preclinical lesionswith natural history H3 than with Hi (table 3). Thistable also shows that when natural histories are
weighted by the cohort factors, the increasingprevalence of preclinical disease at young ages leadsto more preclinical lesions detected with policies(such as 5 and 9) where screening begins at young
ages.
30
250006° 20L_GD
-W
,15
1 01-910
1960
Protected by copyright.
on 9 June 2019 by guest.http://jech.bm
j.com/
J Epidem
iol Com
munity H
ealth: first published as 10.1136/jech.40.2.143 on 1 June 1986. Dow
nloaded from
Expected incidence (no screening)
1966
L-7-- 19761
D M Parkin and S M Moss
O Simulated incidence
I I I I I I I I I I I .I I. I I I I I I.25 30 35 40 45 50 55 60 65 70
Age ( years)
Simulated incidence
25 30 35 40 45 50 55 60 65 70Age (years)
Fig 4 Expected and simulated age-specific incidence of cervix cancer in England and Wales in the absence ofscreening.A Incidence expected in the absence of screening (from reference 6) for 1966 and 1976.B Results ofsimulation, using natural history HI C. The curves show the averagesfor the decades centred upon 1966, 1976,
and 1986.C As for B, but using natural history H3C.
148
6050403020
10
5
1,
60
40-30-2011 0
5-
Protected by copyright.
on 9 June 2019 by guest.http://jech.bm
j.com/
J Epidem
iol Com
munity H
ealth: first published as 10.1136/jech.40.2.143 on 1 June 1986. Dow
nloaded from
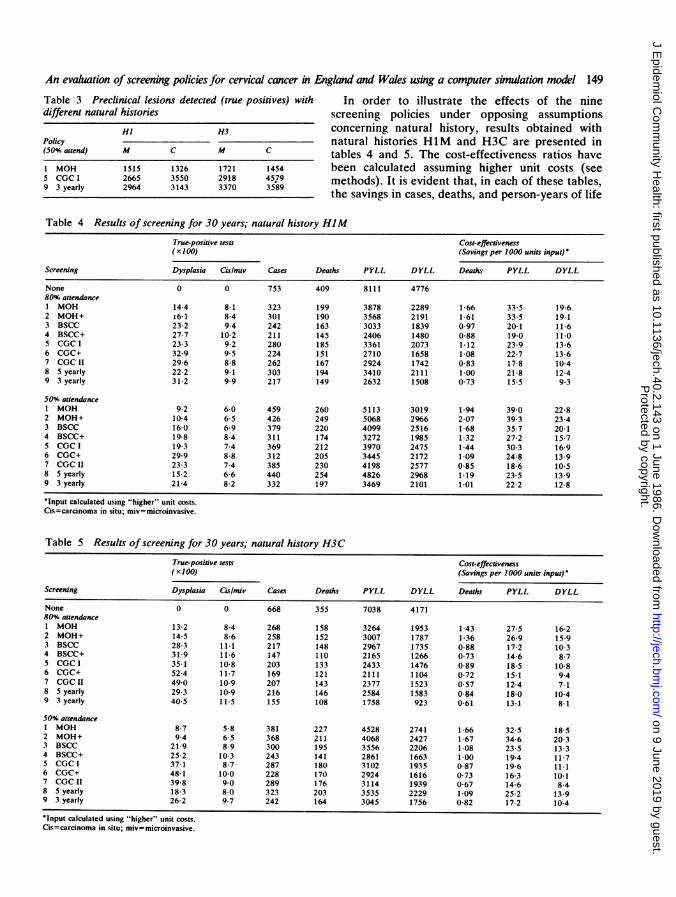
An evaluation ofscreening policies for cervical cancer in England and Wales using a computer simulation model 149Table 3 Preclinical lesions detected (true positives) with In order to illustrate the effects of the ninedifferent natural histories screening policies under opposing assumptions
Hl H3 concerning natural history, results obtained withPolicy natural histories HiM and H3C are presented in(50% attend) M C M C tables 4 and 5. The cost-effectiveness ratios have1 MOH 1515 1326 1721 1454 been calculated assuming higher unit costs (see5 CGC I 2665 3550 2918 4579 methods). It is evident that, in each of these tables,9 3 yearly 2964 3143 3370 35'89
the savings in cases, deaths, and person-years of life
Table 4 Results of screening for 30 years; natural history HlMTrue-positive tests Cost-effectiveness(x100) (Savings per 1000 units input)*
Screening Dysplasia CG/rmiv Cases Deaths PYLL DYLL Deaths PYLL DYLL
None 0 0 753 409 8111 477680u%, attendance1 MOH 14 4 8-1 323 199 3878 2289 1-66 33-5 19-62 MOH+ 6-1 8-4 301 190 3568 2191 1-61 33-5 19 13 BSCC 23-2 9 4 242 163 3033 1839 0-97 20-1 11-64 BSCC+ 27-7 10 2 211 145 2406 1480 0 88 19-0 11.05 CGC I 23-3 9-2 280 185 3361 2073 1-12 23-9 13-66 CGC+ 32-9 9 5 224 151 2710 1658 1-08 22-7 13-67 CGC 11 29-6 8-8 262 167 2924 1742 0-83 17-8 10-48 5 yearly 22-2 9-1 303 194 3410 2111 1-00 21-8 12-49 3 yearly 31-2 9-9 217 149 2632 1508 0-73 15-5 9 3
50% attendance1 MOH 9-2 6-0 459 260 5113 3019 1-94 39-0 22-82 MOH+ 10-4 6-5 426 249 5068 2966 2-07 39 3 23-43 BSCC 16-0 6-9 379 220 4099 2516 1-68 35-7 20-14 BSCC+ 19-8 8-4 311 174 3272 1985 1-32 27-2 15-75 CGCI 19-3 7-4 369 212 3970 2475 1-44 30 3 16-96 CGC+ 29-9 8-8 312 205 3445 2172 1-09 24-8 13-97 CGC 11 23-3 7-4 385 230 4198 2577 0-85 18-6 10-58 5 yearly 15-2 6-6 440 254 4826 2968 1-19 23-5 13-99 3 yearly 21-4 8-2 332 197 3469 2101 1-01 22-2 12-8
*Input calculated using "higher" unit costs.Cis=carcinoma in situ; miv=microinvasive.
Table 5 Results of screening for 30 years; natural history H3C
True-positive tests Cost-effectiveness(x 100) (Savings per 1000 units input)'
Screening Dysplasia Cis/miv Cases Deaths PYLL DYLL Deaths PYLL DYLL
None 0 0 668 355 7038 417180%. attendance1 MOH 13-2 8-4 268 158 3264 1953 143 27-5 16-22 MOH+ 14-5 8-6 258 152 3007 1787 1-36 26-9 15-93 BSCC 28-3 11-1 217 148 2967 1735 0-88 17-2 10-34 BSCC+ 31-9 11-6 147 110 2165 1266 0 73 14-6 8-75 CGC t 35-1 10-8 203 133 2433 1476 0-89 18-5 10-86 CGC+ 52-4 11-7 169 121 2111 1104 0-72 15-1 9 47 CGC 11 49-0 10.9 207 143 2377 1523 0-57 12 4 7-18 5 yearly 29-3 10-9 216 146 2584 1583 0-84 18-0 10-49 3 yearly 40-5 11-5 155 108 1758 923 0-61 13-1 8-1
50% attendance1 MOH 8-7 5-8 381 227 4528 2741 1-66 32-5 18-52 MOH+ 9-4 6-5 368 211 4068 2427 1-67 34-6 20-33 BSCC 21-9 8-9 300 195 3556 2206 1-08 23-5 13-34 BSCC+ 25-2 10-3 243 141 2861 1663 1-00 19-4 11-75 CGC I 37-1 8-7 287 180 3102 1935 0-87 19-6 11.16 CGC+ 48-1 10-0 228 170 2924 1616 0-73 16-3 10-17 CGC It 39-8 9-0 289 176 3114 1939 0-67 14 6 8-48 5 yearly 18-3 8-0 323 203 3535 2229 1-09 25-2 13-99 3 yearly 26-2 9-7 242 164 3045 1756 0-82 17-2 10-4
'Input calculated using "higher" unit costs.Cis=carcinoma in situ; miv=microinvasive.
Protected by copyright.
on 9 June 2019 by guest.http://jech.bm
j.com/
J Epidem
iol Com
munity H
ealth: first published as 10.1136/jech.40.2.143 on 1 June 1986. Dow
nloaded from
150vary considerably between the different policies.When attendance rates for routine screening are high(80%), the rankings of policies in terms of lives saved,or life-years saved, are practically the same, nomatter which natural history is assumed. Clearly, thegreatest reductions are achieved with the moreintensive policies. However, the greater savings thatcan be achieved by changing to more complex andintensive policies are in general no more than arepossible by increasing attendance rates for the samepolicy from 500,% to 80%,. When comparing policies bythe measures of efficiency (savings per 1000 units ofinput), the rankings are very largely reversed,although the correspondence is not exact. The mostefficient are the two low intensity policies (1 and 2).The CGC II policy (7) includes a large number of
incidental tests taken during pregnancy-89 000over the 30-year period. These tests account forrelatively small savings; pregnancy testing alone overthe 30 years gives rise to a saving of 33 lives and 999life-years with natural history HIM. Thecost-effectiveness of this policy is correspondinglypoor-the lowest in rank of all those examined(except under the assumption of high attendancerates and natural history H1M).The original CGC policy (5) performs moderately
well, its efficiency at high attendance rates is third inrank (after the low intensity policies), and fourthwhen attendance for routine screening is 50%. Underthe assumptions shown in tables 4 and 5 the additionof screening of symptomatic women (CGC+, policy6) leads to a fall in the cost-effectiveness ratio. This ispartly because of the increase in preclinical cases(especially dysplasia) which are detected and requiretreatment, the costs of which are usually sufficient tooffset the moderate reductions in clinical cancers anddeaths.When attendance rates for routine screening are
low, the simple BSCC policy (3) scores well inefficiency. It is interesting to compare this policy,which, in effect, adds three screenings to the simpleMOH policy (incidental tests around 25-29, rescreenat 30, and a test at age 70) with policy 8, which addstwo routine screens (at ages 25 and 30) to the simpleMOH policy. The marginal gains from the additionalroutine tests in young women are small (2-4%increase in lives saved, 9-11% in life-years,depending on attendance rates). The BSCC schedulehas the advantage of testing young women at higherthan average risk (family planning attenders) andadding a test in older women, whose risk of disease isstill high. The additional costs incurred by thediscovery of more preclinical lesions is offset by thefall in the number of cases of clinical invasive cancerthat require treatment.
D M Parkin and S M MossThe differences between screening with a
three-yearly interval between tests compared tofive-yearly can be seen by comparing policies 8 and 9.Firstly, it is clear that screening five-yearly with an800% attendance rate results in fewer cases, deathsand person-years of life lost than screeningthree-yearly with 50%, attendance. The differences incost-effectiveness are, however, small. With constantattendance rates, increasing frequency of testingleads to a 55%, increase in the number of testsperformed, but this is accompanied by a muchsmaller increase in the number of lives saved duringthe 30 year period (10-14%,, depending on naturalhistory and attendance rate). The cost ofimplementing the more intensive policy is alsoincreased by the need to investigate and treat theadditional positives generated by more frequenttesting (although at low attendance rates this extracost is offset by the reduction in cost of treatment ofclinical cancer cases). The cost-effectiveness ratiosare thus 15-30% lower (depending on the indexchosen). The differences between the two BSCCpolicies (3 and 4) are rather small, since the morefrequent schedule of testing in the BSCC+ policybegins only after the age of 35.The calculation of cost-effectiveness ratios using
the lower unit costs can be done using the datapresented in tables 1, 4, and 5. All of the values forsavings per 1000 units of input are increased, the sizeof this increase depending on the numbers ofpreclinical lesions and invasive cancers that requiretreatment. Thus the rankings of the different policies,and the relative differences between them, remainalmost unchanged.The comparisons between the different policies
above have been made in terms of their costs andsavings relative to those incurred over a 30-yearperiod during which absolutely no screening activityis undertaken. It could be argued that this is anunrealistic baseline, since even in the absence of anyscreening programme, cytological examinations areoften carried out on women attending medicalservices with gynaecological symptoms. Althoughsuch examinations can be regarded as a form ofselective screening (searching for unrecogniseddisease in a known high risk group), in practice theyare usually considered to be diagnostic tests. We havetherefore considered the results of the differentscreening policies against a background of"diagnostic testing", making the assumption that therate of such testing is one half that used forgynaecology testing in policy 6 (see methods), andthat the rate of abnormality in women receiving suchtests is three times that in the general population.
Over the 30-year simulation period, this diagnostictesting gave rise to the 33 500 cytological tests. Using
Protected by copyright.
on 9 June 2019 by guest.http://jech.bm
j.com/
J Epidem
iol Com
munity H
ealth: first published as 10.1136/jech.40.2.143 on 1 June 1986. Dow
nloaded from
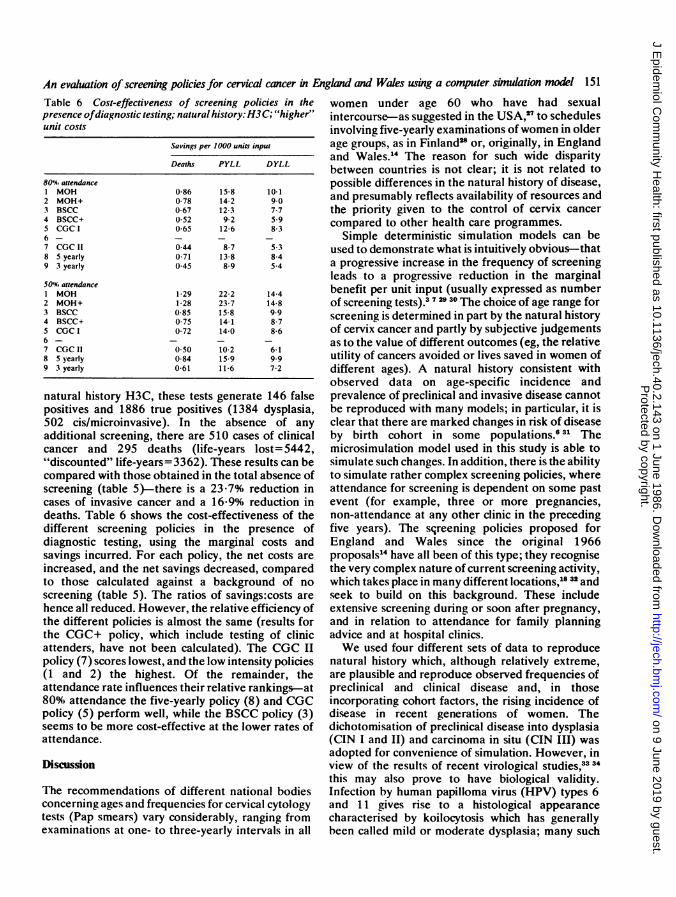
An evaluation of screening policies for cervical cancer in England and Wales using a computer simulation model 151Table 6 Cost-effectiveness of screening policies in thepresence ofdiagnostic testing; natural history: H3C; "higher"unit costs
Savings per 1000 units input
Deaths PYLL DYLL
80'% attendance1 MOH 0-86 15-8 10-12 MOH+ 0-78 14 2 9-03 BSCC 0-67 12-3 7-74 BSCC+ 0-52 9-2 5-95 CGC I 0-65 12-6 8-367 CGC 11 044 8-7 5-38 5 yearly 0-71 13-8 8-49 3 yearly 0-45 8-9 5-4
501% attendanceI MOH 1-29 22-2 14-42 MOH+ 1-28 23-7 14-83 BSCC 0-85 15-8 9 94 BSCC+ 0-75 14-1 8-75 CGC I 0-72 14-0 8-66- _ _ _7 CGC 11 0-50 10-2 6-18 5 yearly 0-84 15-9 9-99 3 yearly 0-61 11-6 7-2
natural history H3C, these tests generate 146 falsepositives and 1886 true positives (1384 dysplasia,502 cis/microinvasive). In the absence of anyadditional screening, there are 510 cases of clinicalcancer and 295 deaths (life-years lost= 5442,"discounted" life-years=3362). These results can becompared with those obtained in the total absence ofscreening (table 5)-there is a 23-7% reduction incases of invasive cancer and a 16 9% reduction indeaths. Table 6 shows the cost-effectiveness of thedifferent screening policies in the presence ofdiagnostic testing, using the marginal costs andsavings incurred. For each policy, the net costs areincreased, and the net savings decreased, comparedto those calculated against a background of noscreening (table 5). The ratios of savings:costs arehence all reduced. However, the relative efficiency ofthe different policies is almost the same (results forthe CGC+ policy, which include testing of clinicattenders, have not been calculated). The CGC IIpolicy (7) scores lowest, and the low intensity policies(1 and 2) the highest. Of the remainder, theattendance rate influences their relative rankings-at800%, attendance the five-yearly policy (8) and CGCpolicy (5) perform well, while the BSCC policy (3)seems to be more cost-effective at the lower rates ofattendance.
Discussion
The recommendations of different national bodiesconcerning ages and frequencies for cervical cytologytests (Pap smears) vary considerably, ranging fromexaminations at one- to three-yearly intervals in all
women under age 60 who have had sexualintercourse-as suggested in the USA,27 to schedulesinvolving five-yearly examinations ofwomen in olderage groups, as in Finland2" or, originally, in Englandand Wales.14 The reason for such wide disparitybetween countries is not clear; it is not related topossible differences in the natural history of disease,and presumably reflects availability of resources andthe priority given to the control of cervix cancercompared to other health care programmes.
Simple deterministic simulation models can beused to demonstrate what is intuitively obvious--thata progressive increase in the frequency of screeningleads to a progressive reduction in the marginalbenefit per unit input (usually expressed as numberof screening tests).3729 30 The choice of age range forscreening is determined in part by the natural historyof cervix cancer and partly by subjective judgementsas to the value of different outcomes (eg, the relativeutility of cancers avoided or lives saved in women ofdifferent ages). A natural history consistent withobserved data on age-specific incidence andprevalence of preclinical and invasive disease cannotbe reproduced with many models; in particular, it isclear that there are marked changes in risk of diseaseby birth cohort in some populations.6 31 Themicrosimulation model used in this study is able tosimulate such changes. In addition, there is the abilityto simulate rather complex screening policies, whereattendance for screening is dependent on some pastevent (for example, three or more pregnancies,non-attendance at any other clinic in the precedingfive years). The sqreening policies proposed forEngland and Wales since the original 1966proposals14 have all been of this type; they recognisethe very complex nature of current screening activity,which takes place in many different locations,1612 andseek to build on this background. These includeextensive screening during or soon after pregnancy,and in relation to attendance for family planningadvice and at hospital clinics.We used four different sets of data to reproduce
natural history which, although relatively extreme,are plausible and reproduce observed frequencies ofpreclinical and clinical disease and, in thoseincorporating cohort factors, the rising incidence ofdisease in recent generations of women. Thedichotomisation of preclinical disease into dysplasia(CIN I and II) and carcinoma in situ (CIN III) wasadopted for convenience of simulation. However, inview of the results of recent virological studies,33 3this may also prove to have biological validity.Infection by human papilloma virus (HPV) types 6and 11 gives rise to a histological appearancecharacterised by koilocytosis which has generallybeen called mild or moderate dysplasia; many such
Protected by copyright.
on 9 June 2019 by guest.http://jech.bm
j.com/
J Epidem
iol Com
munity H
ealth: first published as 10.1136/jech.40.2.143 on 1 June 1986. Dow
nloaded from
152lesions are quite transient. Infection by HPV types 16and 18, by contrast, is characterised by nuclearatypia, regular and atypical mitotic figures, andaneuploidy. In advanced lesions the patterncorresponds to severe dysplasia/carcinoma in situ;regression is less common than with HPV types 6 and11.The outcome measures chosen relate solely to
mortality from cervix cancer. These are convenientand easily recorded and have been the mostfrequently used in other assessments of costs andbenefits of screening for cervix cancer.293035 Thechoice of index has little effect on the evaluation ofthe different policies. These are not the onlyoutcomes of a screening programme that areimportant, however. The main objective of cervixcancer screening is the prevention of invasive cancer,and, of the cases so far prevented, only a proportionwould have been fatal and counted as deaths orlife-years lost. Screening will also lead to a reductionin non-fatal cancers, which might be counted as oneof the beneficial outcomes of the programme (savingsin disability, pain, etc) as well as contributing to areduction in cost.
Only the outcomes observed during the 30 years ofscreening have been included in the evaluation, alongwith the costs incurred during this period. Althoughthe benefits of a screening programme will continueto accrue after the actual screening has ceased, wehave not included these in the evaluation. It is mostunlikely that cervix cancer screening will ever bestopped, so that post-programme evaluation is arather theoretical idea. Furthermore, there is noreason to suppose that, in relation to the policiesexamined here, addition of post-screening benefitswould make any difference to their relativeefficiency. Since the items contributing to the costs(tests, follow-up investigations, treatment) arespread over the entire period, the total cost has beenreckoned at constant prices, with no attempt atdiscounting to a base year. Two sets of costs wereexamined, with almost no effect on the relativecost-effectiveness of the different policies. The costsinclude only the direct financial costs of the servicesprovided, and we have not attempted to estimateso-called indirect or intangible costs to the patients(or their relatives)-for example, due to loss of workduring investigation and treatment, or the anxietyengendered by a false-positive test.36From a cost-effectiveness point of view, the
original policies advocated for England and Wales,involving seven to eight tests per lifetime, performrather well. Increasing the frequency of testing andlowering the age of onset of testing both improveoutcomes, but with a lowering of thecost-effectiveness ratio. The most recent policy
D M Parkin and S M Moss
recommended by the Committee for GynaecologicalCytology'0 21 seems to be unsatisfactory, based on thecriteria that we have adopted here. Theconcentration of screening at young ages, eventhough such tests may be less costly than usual (eg, inpregnancy) and involve higher risk groups(contraceptive users), leads to high costs forrelatively small gains in outcome. It may be that thisrelative inefficiency will be less marked in the longerterm if the incidence of disease in young womencontinues to rise at rates even more marked thanthose incorporated in this simulation (fig 4).Nevertheless the wisdom of concentrating screeningtests at young ages, as in Canada (the latestrecommendations suggest 18 tests up to age of 35 andfive thereafter37), must be seriously questioned. Therationale is presumably to ensure that some womenwho may not volunteer to start a screeningprogramme will receive at least a first test during avisit for another purpose and may thereafter be morereadily induced to re-attend. It might reasonably bequestioned whether the complexity of theseprogrammes makes this possible advantageworthwhile. The absolute benefits from a programmeof five-yearly testing after age 25 are only slightlyinferior to those achieved by the much more complexpolicies recommended by the Committee forGynaecological Cytology, and, in comparison withthe latest recommendations, it is more efficient also.A system to ensure that all women receive invitationsfor screening (and that those who fail to attendreceive reminders) should be easy to install if any sortof age-sex register for general practice is in existence.The large volume of rather haphazard incidentaltesting in relation to pregnancy and family planningmight then be drastically curtailed.
Requests for reprints to Dr D M Parkin,International Agency for Research on Cancer, Lyon,France.
References
Knox EG. Ages and frequencies for cervical cancerscreening. Br J Cancer 1976; 34: 444-52.
'Albert A, Gertman PM, Louis TA, Liu S. Screening forthe early detection of cancer II. The impact of screeningon the natural history of the disease. Math Biosci 1975;40: 61-109.
3Yu Shan-Zhang, Miller AB, Sherman GJ. Optimising theage, number of tests and test interval for cervical cancerscreening in Canada. J Epidemiol Community Health1982; 36: 1-10.
4 Andrews FJ, Linehan JJ, Melcher DH. Cervical cancer inyounger women. Lancet 1978; ii: 776-8.
5Cotton R. Why DHSS screening policy puts young womenunnecessarily at risk. World Medicine 1980; 1S (no 13):21-6.
Protected by copyright.
on 9 June 2019 by guest.http://jech.bm
j.com/
J Epidem
iol Com
munity H
ealth: first published as 10.1136/jech.40.2.143 on 1 June 1986. Dow
nloaded from
An evaluation of screening policies for cervical cancer in England and Wales using a computer simulation model 153
6Parkin DM, Nguyen-Dinh X, Day NE. The impact ofscreening on the incidence of cervical cancer in Englandand Wales. Br J Obstet Gynaecol 1985; 92: 150-7.
7Eddy DM. American Cancer Society: guidelines for thecase-related checkup: recommendations and rationale.CA 1980; 30: 194-240.
'Simpson P. Economic aspects of screening. In: Prorok PC,Miller AB, eds. Screening for Cancer. UICC TechnicalReport Series, Vol 78. Geneva: UICC, 1984.
9Parkin DM. A computer simulation model for thepractical planning of cervical cancer screeningprogrammes. Br J Cancer 1985; 51: 551-68.
"Cook GA, Draper GJ. Trends in cervical cancer andcarcinoma in situ in Great Britain. BrJ Cancer 1984; 50:367-75.
"Parkin DM, Hodgson P, Clayden AD. Incidence andprevalence of preclinical carcinoma of cervix in a Britishpopulation. Br J Obstet Gynaecol 1982; 89: 564-70.
Osmond C, Gardner MJ. Age, period and cohort modelsapplied to cancer mortality rates. Statistics in Medicine1982; 1: 245-59.
13Osmond C. Using age, period and cohort models toestimate future mortality rates. Int J Epidemiol 1985;14: 124-9.
14 Ministry of Health. Population screening for cancer of thecervix. NHS circular HM (66)76; 1966.
"Spriggs Al, Husain OAN. Cervical smears. Br Med J1977; i: 1516-8.
6Draper GJ. Screening for cervical cancer: revised policy.The recommendations of the DHSS Committee onGynaecological Cytology. Health Trends 1982; 14:37-40.
Department of Health and Social Security. Health andPersonal Social Services Statistics. London: HMSO,1983.
"Roberts A. Cervical cytology in England and Wales,1965-80. Health Trends 1982; 14: 41-3.
"Parkin DM, Leach K, Cobb P, Clayden AD. Cervicalcytology screening in two Yorkshire areas: results oftesting. Public Health (London) 1982; 95: 3-14.
2Lancet. New advice on cervical screening. Lancet 1984; i:1196.
"Department of Health and Social Security. HealthServices Development; screening for cervical cancer.Circular 1984; HC (84) 17.
'Elwood JM, Cotton RE, Johnson GM, Curnow J, BeaverMW. Are patients with abnormal cervical smearsadequately managed? Br Med J 1984; 289: 891-4.
23Husain OAN. Quality control in cytological screening forcervical cancer. Tumori 1976; 62: 303-14.
14 Boyes DA, Morrison B, Knox EG, Draper GJ, Miller AB.A cohort study of cervical screening in British Columbia.Clin Invest Med 1982; 5: 1-29.
'Thorn JB, MacGregor JE, Russell EM, Swanson K. Costsof detecting and treating cancer of the uterine cervix innorth-east Scotland in 1971. Lancet 1975; i: 674-6.
'2Singer A, Walker P. Commentary: what is the optimumtreatment of cervical intraepithelial neoplasia? Br JObstet Gynaecol 1982; 89: 335-7.
'7National Institutes of Health, Consensus statement.Cervical cytology screening: the Pap smear. Br Med J1980; 281: 1264-6.
'Hakama M, Rasanen-Virtanen U. Effect of a massscreening program on the risk of cervical cancer. Am JEpidemiol 1976; 103: 512-7.
Knox EG. A simulation system for screening procedures.In: McLachlan G, ed. The future and presentindicatives. (Problems and Progress in Medical Care VolIX). Oxford: Nuffield Provincial Hospitals Trust, 1973.
3OEddy DM. Screening for cancer: theory, analysis anddesign. Englewood Cliffs, New Jersey: Prentice Hall,Inc, 1980.
31Hakama M. Trends in the incidence of cervical cancer inthe Nordic countries. In: Magnus K, ed. Trends in cancerincidence. Washington: Hemisphere Publishing Corp,1982.
32Parkin DM, Collins W, Clayden AD. Cervical cytologyscreening in two Yorkshire areas: pattern of service.Public Health (London) 1981; 95: 3 11-21.
33 Gissmann L. Papillomaviruses and their association withcancer in animals and in man. Cancer Sur 1984; 3:161-81. a
3'Schneider A, Kraus HA Schuhmann R, Gissmann L.Papillomavirus infectioln of the lower genital tract:detection of viral DNA in gynaecological swabs. Int JCancer 1985; 35: 443-8.
3 Dickinson L. Evaluation of the effectiveness of cytologicalscreening for cervical cancer. III Cost-benefit analysis.Mayo Clin Proc 1972; 47: 550-5.
36Klarman HE. Application of cost-benefit analysis tohealth-systems technology. J Occup Med 1974; 16:172-86.
37Department of National Health and Welfare. Cervicalcancer screening programs: summary of the 1982Canadian task force report. Can Med AssocJ 1982; 127:581-9.
Protected by copyright.
on 9 June 2019 by guest.http://jech.bm
j.com/
J Epidem
iol Com
munity H
ealth: first published as 10.1136/jech.40.2.143 on 1 June 1986. Dow
nloaded from