Embed Size (px)
Citation preview
Evaluation of Savings in Energy-Efficient Public Housing in the Pacific Northwest A. Gordon, M. Lubliner, L. Howard, and R. Kunkle BA-PIRC
October 2013

NOTICE
This report was prepared as an account of work sponsored by an agency of the United States government. Neither the United States government nor any agency thereof, nor any of their employees, subcontractors, or affiliated partners makes any warranty, express or implied, or assumes any legal liability or responsibility for the accuracy, completeness, or usefulness of any information, apparatus, product, or process disclosed, or represents that its use would not infringe privately owned rights. Reference herein to any specific commercial product, process, or service by trade name, trademark, manufacturer, or otherwise does not necessarily constitute or imply its endorsement, recommendation, or favoring by the United States government or any agency thereof. The views and opinions of authors expressed herein do not necessarily state or reflect those of the United States government or any agency thereof.
Available electronically at http://www.osti.gov/bridge
Available for a processing fee to U.S. Department of Energy and its contractors, in paper, from:
U.S. Department of Energy Office of Scientific and Technical Information
P.O. Box 62 Oak Ridge, TN 37831-0062
phone: 865.576.8401 fax: 865.576.5728
email: mailto:[email protected]
Available for sale to the public, in paper, from: U.S. Department of Commerce
National Technical Information Service 5285 Port Royal Road Springfield, VA 22161 phone: 800.553.6847
fax: 703.605.6900 email: [email protected]
online ordering: http://www.ntis.gov/ordering.htm
Printed on paper containing at least 50% wastepaper, including 20% postconsumer waste
iii
Evaluation of Savings in Energy-Efficient Public Housing in the Pacific Northwest
Prepared for:
The National Renewable Energy Laboratory
On behalf of the U.S. Department of Energy’s Building America Program
Office of Energy Efficiency and Renewable Energy
15013 Denver West Parkway
Golden, CO 80401
NREL Contract No. DE-AC36-08GO28308
Prepared by:
M. Lubliner, A. Gordon, L. Howard, and R. Kunkle
Washington State University Extension Energy Office
for
Building America Partnership for Improved Residential Construction
1967 Clearlake Road
Cocoa, FL 32922
NREL Technical Monitor: Stacey Rothgeb
Prepared under Subcontract No. KNDJ-0-40339-02
October 2013

iv
[This page left blank]
v
Table of Contents List of Figures ............................................................................................................................................ vi List of Tables ............................................................................................................................................. vii Definitions ................................................................................................................................................. viii Acknowledgments ..................................................................................................................................... ix Executive Summary .................................................................................................................................... x 1 Introduction ........................................................................................................................................... 1 2 Energy Audits ....................................................................................................................................... 3
2.1 Homeowner Surveys ........................................................................................................................ 7 3 Modeling Methods ................................................................................................................................ 8
3.1 Energy Analysis ............................................................................................................................... 8 3.2 Economic Analysis ........................................................................................................................... 9
4 Billing Analysis Methods ................................................................................................................... 11 5 Results ................................................................................................................................................. 12
5.1 Modeling ......................................................................................................................................... 12 5.2 Economic Analysis ......................................................................................................................... 14 5.3 Billing Analysis of Salishan 7 ......................................................................................................... 15
6 Ventilation System Discussion ......................................................................................................... 18 7 Conclusions ........................................................................................................................................ 20 8 Recommendations ............................................................................................................................. 21 References ................................................................................................................................................. 23 Appendix A. Floor Plans ........................................................................................................................... 24 Appendix B. Audit Summaries ................................................................................................................ 26

vi
List of Figures Figure 1. Salishan housing, prior to reconstruction ............................................................................... 1 Figure 2. Salishan demonstration duplex (left), and control duplex (right) .......................................... 3 Figure 3. Exhaust ventilation system controls ........................................................................................ 4 Figure 4. ERV indoor unit (left) and outside terminus (right) ................................................................. 4 Figure 5. Infrared image highlighting window vents during blower door induced pressurization
(wall exterior temperature provided as reference) ............................................................................ 5 Figure 6. Thermographic images, indicating leakage at bottom plate to slab intersection (left), and
attic access hatch (right) ..................................................................................................................... 6 Figure 7. Salishan 7 annual electricity use by housing unit ................................................................. 16 Figure 8. Salishan 7 electricity use by billing period ............................................................................ 17 Figure 9. Moisture sensor location (left) and interior detail (right) ...................................................... 21 Figure 10. First floor ................................................................................................................................. 24 Figure 11. Second floor ............................................................................................................................ 25 Figure 12. Control (left) and demonstration (right) duplexes ............................................................... 26 Figure 13. Infrared image of demonstration home under blower door-induced pressurization,
highlighting fresh air inlet vents per Washington code (wall exterior temperature provided as reference) ............................................................................................................................................ 28
Figure 14. Indication of air leakage at bottom plate to slab intersection ............................................ 30 Figure 15. Significant air leakage at exterior door due to lack of positive connection between door
and weather stripping ........................................................................................................................ 30 Figure 16. Significant air leakage at attic access hatch ........................................................................ 31 Figure 17. Daikin DHP indoor (left) and outdoor (right) units .............................................................. 31 Figure 18. DHP prefilters before (left) and after (right) cleaning. The filter had been in use for
roughly a year before cleaning. ........................................................................................................ 32 Figure 19. Hard-wired DHP thermostat, with hourly temperature and relative humidity data logger32 Figure 20. Location of whole-house ventilation fan (left) and lint buildup (right) from ventilation
fan grille ............................................................................................................................................... 33 Figure 21. Whole-house exhaust ventilation control ............................................................................ 33 Figure 22 (Clockwise, from top left) operable fresh air wall port in living room interior, exterior,
and infrared ......................................................................................................................................... 35 Figure 23. ERV indoor unit (left) and outside terminus (right) ............................................................. 36 Unless otherwise noted, all figures were created by BA-PIRC.

vii
List of Tables Table 1. Envelope Leakage Testing Results (ACH50) .............................................................................. 6 Table 2. Salishan House Characterization ................................................................................................ 9 Table 3. Incremental Costs From Salishan 6.......................................................................................... 10 Table 4. Modeled Energy Usage Results (kWh) ..................................................................................... 12 Table 5. Comparison of Modeled Results, Window Vents Closed and Open (kWh) .......................... 13 Table 6. Source Energy Use and Savings Over Building America Benchmark (MBtu/yr) ................. 14 Table 7. Economic Analysis ..................................................................................................................... 14 Table 8. Air Inlet Vent Contribution to Envelope Leakage .................................................................... 18 Table 9. Combined House Depressurization .......................................................................................... 19 Table 10. Energy Features of Salishan Demonstration and Control Duplexes .................................. 27 Table 11. Tested Infiltration Rates With Intakes Open and Closed...................................................... 28 Table 12. Air Inlet Vent Contribution to Envelope Leakage .................................................................. 29 Table 13. Combined House Depressurization With Exhaust Fans ...................................................... 37 Unless otherwise noted, all tables were created by BA-PIRC.

viii
Definitions
ACH50 Air Changes per hour at 50 Pascals
ASHRAE American Society of Heating, Refrigerating and Air-Conditioning Engineers
AW Area weighted
BIB Blown-in blanket
CFL Compact fluorescent lamp
CFM50 Cubic feet per minute at 50 Pascals
DHP Ductless heat pump
EF Energy factor
ELA Effective leakage area
EqLA Equivalent leakage area
ERV Energy recovery ventilator
HSPF Heating season performance factor
HVI Home Ventilation Institute
IAQ Indoor air quality
IRC International Residential Code
LEED Leadership in Energy and Environmental Design
SEER Seasonal energy efficiency ratio
THA Tacoma Housing Authority
TPU Tacoma Public Utilities
VIAQ Washington State Ventilation and Indoor Air Quality Code
WSEC Washington State Energy Code
WSU Washington State University
ix
Acknowledgments
This work is sponsored in large part by the U.S. Department of Energy Office of Building Technology’s Building America Industrialized Housing program under cooperative agreement DE-FC36-99GO10478.
The authors would like to thank the following persons and organizations for their contributions to this project and paper: Eric Martin, U.S. Department of Energy Building America; Ken Eklund and David Hales, Washington State University Energy Program; Bruce Carter, Tacoma Public Utilities; Derek Johnson, Walsh Construction; Theresa Weston, DuPont; Don Stevens, Panasonic USA; Gary Nelson and Collin Olson, Energy Conservatory.
x
Executive Summary
This project documents market-ready energy solutions to improve the efficiency of new affordable housing in the marine climate of Washington State.
The project analyzes the cost effectiveness of energy savings measures installed by a large public housing authority in Tacoma, Washington. This first year report focuses on the last of seven phases of affordable housing construction; subsequent reports will evaluate the previous phases.
The construction effort at Salishan is a good example of a not-for-profit housing authority utilizing the best available technology to construct highly efficient new housing. The major features of the 91 Salishan phase 7 homes, which were constructed in 2009–2010, include:
• Ductless heat pumps (DHPs), providing heat to the first floor, with electric resistance heating on the second floor, compared to electric resistance heating the homes in previous phases1
• Increased insulation
o R-15 slab perimeter, compared to R-10 in phase 6 homes
o R-23 Blown-in-blanket walls, compared to R-21 batts in phase 6 homes
o R-49 advanced framed (full depth) attic, compared to R-38 standard framing (insulation tapered at the heel) in phase 6 homes.
The last four units in the development were selected to demonstrate advanced technologies, including:
• R-5 exterior foam sheathing on the walls
• Panasonic energy recovery ventilators (ERVs)
• DuPont liquid-applied house wrap.
This report presents the results of an energy performance and a cost-effectiveness analysis. The Salishan phase 7 and demonstration homes were compared to Salishan phase 6 homes built to 2006 Washington State Energy Code specifications.2 Predicted annual energy savings (over Salishan phase 6) was 19% for Salishan phase 7, and 19%–24% for the demonstration homes (depending on ventilation strategy). Approximately two-thirds of the savings are attributable to the DHP.
Working with the electricity utility provider, Tacoma Public Utilities, researchers conducted a billing analysis for Salishan phase 7. Median energy use for the development is 11,000 kWh;
1 Some of the larger homes (a four-bedroom duplex design and a five-bedroom single-family home) were equipped with two-head DHPs. All of the other homes had single-head DHPs. 2 Per BEopt 1.3, the 2006 Washington State Energy Code shows 21.9% savings over the Building America Benchmark.

xi
annual energy costs are $780, with a fair amount of variation depending on the size of the home. Preliminary analysis of savings between Salishan 7 and previous phases (4–6) suggest savings of 20%–30%. A more comprehensive comparison between Salishan 7 and previous phases will take place in year 2 of this project.
1
1 Introduction
Salishan is a mixed-income neighborhood of Tacoma, Washington, originally built by the federal government in 1942 to provide worker housing to support the war effort. The Tacoma Housing Authority (THA) managed Salishan for the federal government until the war’s end, and afterward, when the federal government gave most of Salishan, with about 880 apartments on 188 acres, to THA to own and manage as a public housing community. Since construction, Salishan has been an important part of the city’s stock of affordable housing; in addition, it has been a gateway community—a first home for new immigrants.
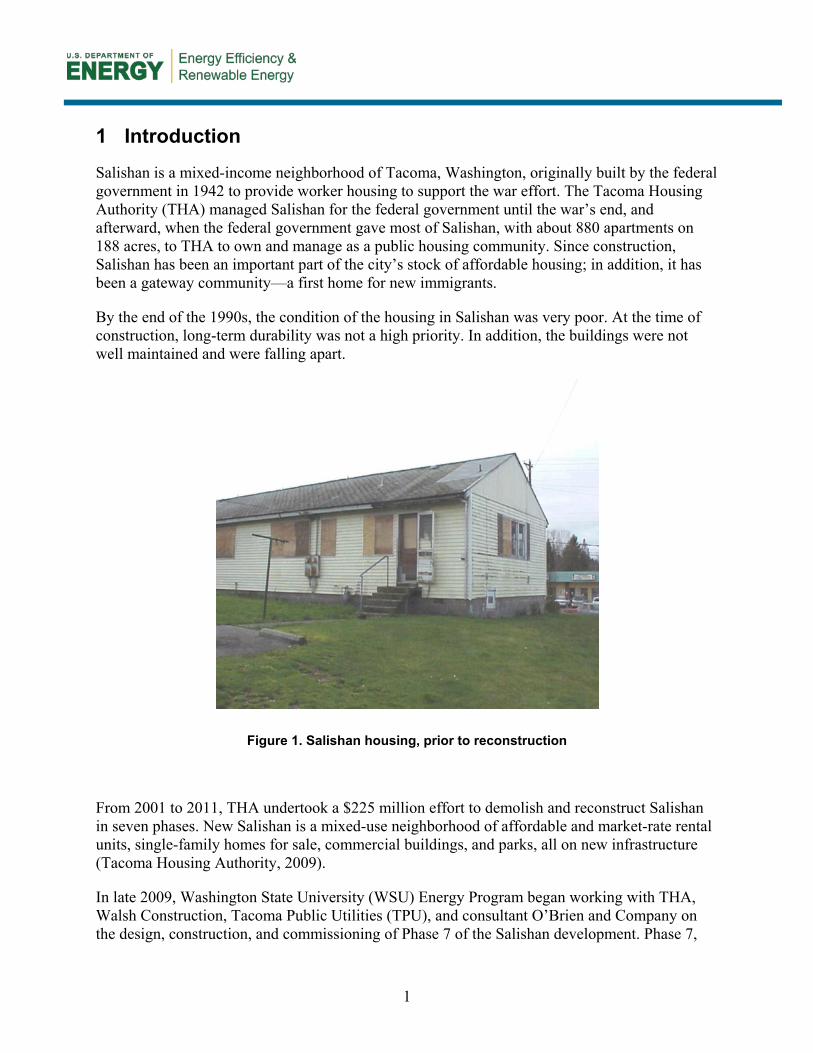
By the end of the 1990s, the condition of the housing in Salishan was very poor. At the time of construction, long-term durability was not a high priority. In addition, the buildings were not well maintained and were falling apart.
Figure 1. Salishan housing, prior to reconstruction
From 2001 to 2011, THA undertook a $225 million effort to demolish and reconstruct Salishan in seven phases. New Salishan is a mixed-use neighborhood of affordable and market-rate rental units, single-family homes for sale, commercial buildings, and parks, all on new infrastructure (Tacoma Housing Authority, 2009).
In late 2009, Washington State University (WSU) Energy Program began working with THA, Walsh Construction, Tacoma Public Utilities (TPU), and consultant O’Brien and Company on the design, construction, and commissioning of Phase 7 of the Salishan development. Phase 7,

2
which began construction in late 2009, and was completed in late 2010, is composed of 91 low-income housing units built to ENERGY STAR® standards, and is the first federal Hope VI project to achieve Leadership in Energy and Environmental Design (LEED) Platinum. Whereas previous phases were heated by electric baseboard units, Salishan 7 homes included ductless heat pumps (DHPs). In addition, the Salishan 7 units included improved insulation in the slab perimeter, walls, and ceiling.
With support from Building America, WSU and Walsh Construction coordinated the plans for the last four units to demonstrate advanced technologies, including exterior foam sheathing and Panasonic energy recovery ventilators (ERVs). This package of measures was designed and modeled to achieve 30% savings over the Building America Benchmark. In addition, DuPont provided liquid-applied house wrap (which has primarily been employed for commercial buildings) for the demonstration homes.
WSU coordinated with THA and TPU to collect energy usage data (2-month billing periods) for billing analysis.
Research questions:
• What are the performance improvements and cost benefits of the Salishan 7 homes compared to Salishan 6 homes, which were built to 2006 state code?
• What are the performance improvements and cost benefits of the demonstration technologies compared to homes built to state code?
• How do the different ventilation strategies available to the demonstration home affect the performance of those units?
• How does modeled energy use compare to the actual use derived from billing data?

3
2 Energy Audits
In February of 2012, WSU conducted detailed audits of one of the demonstration duplexes, and another (control) Salishan 7 duplex with an identical floor plan. The duplexes are located within two blocks of each other.
The duplexes are mirrored floor plan, 1,109-ft2, two-story, two-bedroom, 1½-bath units with a common wall separation. The homes are frame construction with trussed attics and perimeter insulated slab-on-grade floors. Bedrooms are located on the second floor.
Figure 2. Salishan demonstration duplex (left), and control duplex (right)
Each unit is heated with a single-head DHP with thermostatically controlled baseboard heaters located in both bedrooms and the second-floor bathroom. Domestic hot water is provided by electric tank water heaters located within the conditioned space.
Whole-house ventilation in the control duplexes is provided by a continuously operating exhaust fan. The control duplexes include seven dedicated fresh air intakes per dwelling unit; operable trickle vents in the frames of windows in the kitchens, living rooms, bedrooms, and bedroom closets; as well as operable wall ports in the living rooms and master bedrooms of both units. All fresh air intake vents in both units were found to be in the closed position.
Whole-house ventilation in the demonstration duplexes is provided by the same exhaust fan described above; in addition, the demonstration units are outfitted with ERVs, located at the top of the stairwell. In one of the demonstration duplexes, the exhaust system was in constant operation, with the ERV used very infrequently. In the other duplex, both systems were in continuous use.3
3 The ERVs were a late addition to the demonstration homes. The homes had been permitted and planned to use exhaust ventilation fans to meet code requirements; in the end, both systems were installed. According to Walsh

4
Figure 3 shows the exhaust ventilation system controls, which are only operable by a “key” used by THA staff.
Figure 3. Exhaust ventilation system controls
Flow rates were not captured for the ERVs in the demonstration units because it is challenging to capture individual supply and exhaust measurements. In both the inside unit and outside terminus the supply and exhaust are located side by side; at the outside terminus the issue is compounded by the fact that the terminus is located on the second story (see Figure 4).
Figure 4. ERV indoor unit (left) and outside terminus (right)
Construction, the demonstration homes were turned over to homeowners with the exhaust system on and the ERV off. Homeowners in the demonstration units had their ventilation options explained to them in an occupant manual, and via two orientation visits with THA (Johnson, 2012).
Supply air stream
Exhaust air stream
5
The ERVs are rated at 40 CFM for high speed and 20 CFM for low speed. Exhaust fan flow rates were measured for all units, for an average of 57 CFM. This is lower than their listed rate of 75 CFM (at 0.25 in. water column), but well exceeding the code requirement of 45 CFM for constant operation.
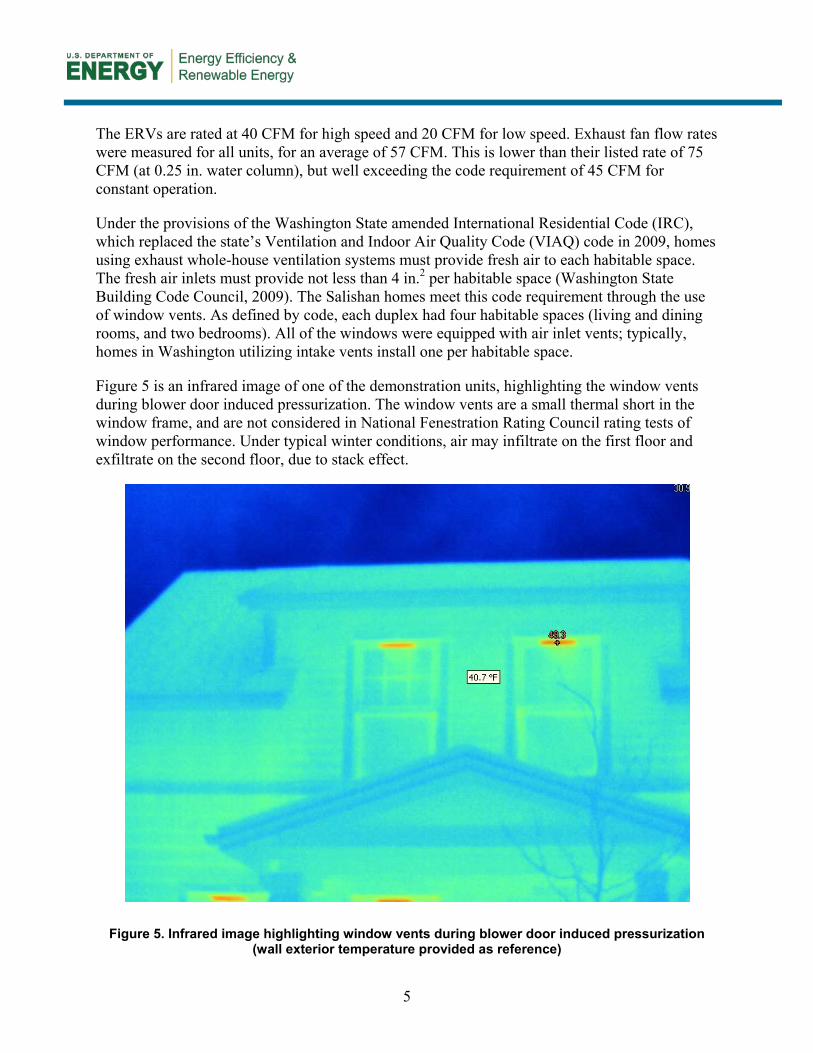
Under the provisions of the Washington State amended International Residential Code (IRC), which replaced the state’s Ventilation and Indoor Air Quality Code (VIAQ) code in 2009, homes using exhaust whole-house ventilation systems must provide fresh air to each habitable space. The fresh air inlets must provide not less than 4 in.2 per habitable space (Washington State Building Code Council, 2009). The Salishan homes meet this code requirement through the use of window vents. As defined by code, each duplex had four habitable spaces (living and dining rooms, and two bedrooms). All of the windows were equipped with air inlet vents; typically, homes in Washington utilizing intake vents install one per habitable space.
Figure 5 is an infrared image of one of the demonstration units, highlighting the window vents during blower door induced pressurization. The window vents are a small thermal short in the window frame, and are not considered in National Fenestration Rating Council rating tests of window performance. Under typical winter conditions, air may infiltrate on the first floor and exfiltrate on the second floor, due to stack effect.
Figure 5. Infrared image highlighting window vents during blower door induced pressurization (wall exterior temperature provided as reference)

6
The amended IRC requirements allow for the use of ASHRAE Standard 62.2 as an alternate route to compliance with state code. ASHRAE 62.2 does not require the use of fresh air inlets for exhaust only ventilation (American Society of Heating, Refrigerating and Air-Conditioning Engineers, 2007).
Air leakage testing was performed on both of the control and demo duplexes using blower door test equipment and infrared thermography. Blower door tests were conducted in two configurations: with window vents open and closed. Results of these tests are shown in Table 1.
Table 1. Envelope Leakage Testing Results (ACH50)
Tested House Infiltration Rate
Dwelling Unit CFM50 Vents Open
CFM50 Vents Closed
CFM50 Vents
Control A 520 384 136 Control B 515 411 104 Demo A 500 355 145 Demo B 430 310 120
A visual inspection of air leakage was also performed, using infrared imaging technology (Figure 6). Although the overall performance of the air barrier in these homes was superior to standard framed homes in the region (3.2–3.5 ACH50, compared to 5–7 ACH50 for typical construction), infrared inspection revealed air leakage in areas of the thermal enclosure where framing assemblies meet and at penetrations. Areas of note included framing intersections, attic hatches, windows, and doors, as well as outlets and switches. Similar leakage points were found through infrared imagery in both the demo and control duplexes.
Figure 6. Thermographic images, indicating leakage at bottom plate to slab intersection (left), and attic access hatch (right)
A complete audit summary is provided in Appendix B.

7
2.1 Homeowner Surveys As part of the energy audits, researchers surveyed the occupants of the demonstration and control homes to assess the occupancy patterns and other factors that might affect electricity use. The audits helped inform the modeling effort, and will provide a basis of comparison between Salishan 7 and earlier phases in future research.
• With the exception of a large-screen television in one of the control homes, there were no unusual electrical loads in any of the homes.
• Occupancy varied significantly among the homes—one of the control units was unoccupied 27 hours of the week, and one of the demonstration homes was unoccupied only 2 hours of the week.
• Homeowners had limited knowledge of the use of the ventilation system. The air inlet vents were closed in all homes except one of the demonstration units, where all the inlets had been opened by a THA employee. All homes had the exhaust ventilation system operating 24 hours a day, 7 days a week (operation was not controllable by the occupants). In one of the demonstration homes, the ERV was in constant operation on low speed; in the other demonstration home, the ERV was rarely used.
• All homeowners expressed a high degree of satisfaction with the indoor air quality (IAQ) in their homes; two respondents to the survey (one control and one demonstration) indicated that, while having suffered from allergy symptoms in their previous homes, they were symptom free at Salishan.
• The occupants of one of the demonstration homes used the DHP for cooling consistently during the summer months; the other occupants said they used it rarely.
• Occupant control of the DHP and baseboard heater varied greatly during the heating season. Temperature settings for the DHP ranged from a constant 68°–78°F when occupied, set back to 70°F when unoccupied. Baseboard heater use ranged from being on only in bedrooms at night to constant use when the house was occupied.
The homeowners were generally satisfied with the efficiency of their homes (based on the energy bills) and their overall comfort. There were some complaints about the uneven distribution of heat downstairs (DHP) and the difficulty in maintaining a steady and comfortable heat upstairs.

8
3 Modeling Methods
3.1 Energy Analysis Researchers used EnergyGauge USA version 2.8.05 for the energy use simulation modeling (Florida Solar Energy Center, 2012).
Modeling compared the predicted performance of:
• Homes built in phase 6, to the 2006 Washington State Energy Code (WSEC)
• Homes built in phase 7, under the 2009 WSEC, built to ENERGY STAR and LEED Platinum levels, with DHPs
• Homes built in phase 7, with additional demonstration technologies.
Since the demonstration homes had both exhaust air ventilation and ERVs, researchers decided to model the homes under three scenarios: as if both systems were operational at the same time, as if a home had either the exhaust system or the ERV operating.
The homes’ envelope and performance parameters are specified in Table 2.
Envelope leakage rates for Salishan 7 and demonstration models were based on field testing, with the window vents open; for Salishan 6, envelope leakage was assumed to be 7.0 ACH50, per 2006 WSEC assumptions. In year 2 of the project, researchers will determine envelope leakage for phases 1–6 via blower door testing.
Initially, BEopt was not used, since at the time the analysis was conducted, BEopt had limitations in the ability to model multifamily dwellings, DHPs, and combinations of different heating systems.
Subsequent to the initial analysis, the National Renewable Energy Laboratory released a version of BEopt that addressed these issues (National Renewable Energy Laboratory, 2012). WSU conducted a benchmarking analysis of Salishan 7 and demonstration units, and included WSEC 2006 and 2009 for reference.

9
Table 2. Salishan House Characterization
Measure Salishan 6 Salishan 7 Salishan 7 Demo Slab Insulation R-10 perimeter R-15 perimeter4 R-15 perimeter
Wall Insulation5 R-21 batt (U-.057)
R-23 BIBa (U-0.052)
R-23 BIB + R-5 foam (U-0.040)
Windows .35 AWb U-factor 0.29 AW U-factor 0.29 AW U-factor
Ceiling R-38 standard framing (U-.030)
R-49 advanced framing (U-0.020)
R-49 advanced framing (U-0.020)
Space Heating Baseboard (5.5 kW)
DHP 9.1 HSPFc/18 SEERd
(1.5 ton)
DHP 9.1 HSPF/18 SEER
(1.5 ton)
Thermostat Set Points 68°F heating 78°F cooling
68°F heating 78°F cooling
68°F heating 78°F cooling
Water Heating 0.95 EFe 0.95 EF 0.95 EF Lighting 100% CFLf 100% CFL 100% CFL
Dishwasher ENERGY STAR ENERGY STAR ENERGY STAR Refrigerator ENERGY STAR ENERGY STAR ENERGY STAR
Clothes Washer Standard, top load ENERGY STAR, front loaded
ENERGY STAR, front loaded
Ventilation VIAQ compliant6 62.2 compliant exhaust
62.2 compliant exhaust and ERV7
Envelope Leakage 7.0 ACH50 3.5 ACH50 3.2 ACH50 ENERGY STAR No Yes Yes
LEED No Yes Yes
a Blown-in blanket b Area weighted c Heating season performance factor d Seasonal energy efficiency ratio e Energy factor f Compact fluorescent lamp
3.2 Economic Analysis Incremental cost data were collected from Walsh Construction for the energy efficiency measures (incremental costs from Salishan 6). In addition, O’Brien and Company provided cost data for Northwest ENERGY STAR and LEED certifications. These costs are shown in Table 3.
The wholesale incremental cost for windows with inlet vents is $16.32 each, which is included as part of the incremental cost for the window package (Scott, 2012). For the floor plan used for the
4 Modeled as R-10, due to limitations within software. 5 Each scenario was also modeled with an R-11 party wall (U-.093) 6 Per VIAQ. Requirements allow for intermittent ventilation, minimum 8 hours per day, at rates less than ASHRAE 62.2 requirements. 7 Exhaust flows were added together, and recovery efficiency reduced as a weighted average of total fan flow.

10
demonstration and control homes, this amounts to almost $100 (six windows) in excess of code requirements, before markup.
Using the results from the EnergyGauge USA analysis, researchers conducted an economic analysis of the energy efficiency measures, including simple payback and monthly cash flow.
Table 3. Incremental Costs From Salishan 6
Salishan Demo
Salishan 7 As Built Exhaust Only ERV Only Slab, Wall Cavity and Ceiling
Insulation8 $1,261 $1,261 $1,261 $1,261
R-5 Exterior Foam on Walls – $350 $350 $350 Window Upgrade $310 $310 $310 $310 Baseboard to DHP $3315 $3315 $3315 $3315
Ventilation9 – $1050 – $426 Clothes Washer $341 $341 $341 $341 ENERGY STAR
Northwest Certification10 $364 $364 $364 $364
LEED Certification7 $473 $473 $473 $473 Total Incremental Cost $6,064 $7,464 $6,414 $6,840
8 Insulation contractor provided package cost only, not individual measure costs. 9 Exhaust only ventilation system cost was $624; ERV cost was $1,050. The “as built” scenario included both systems; the other two demonstration scenarios included either the exhaust fan or the ERV. 10 Includes design review, multiple on-site inspections and testing, ongoing technical assistance, submittal fees, and travel.

11
4 Billing Analysis Methods
TPU provided electricity use and consumption data for all 91 housing units in Salishan 7 along with the premise number, address, and change in account dates (signifying a change in occupancy). Data were provided for the period from June 2010 through February 2012. Most of the housing units were not occupied until later in 2010 or early 2011, so the data for a unit began when it was occupied. Electricity billing data are for 2-month periods.
Annual electricity use and costs were calculated for the period February 2011 through February 2012. Researchers adjusted electricity use to 365 days for each unit to account for any differences in meter reading dates (period lengths) or for the few units that did not have quite a full year of data. Researchers did not account for any changes in occupancy during this period. Researchers also calculated electricity use and cost for the six billing periods during this annual analysis period (from February 2011 to February 2012), adjusting electricity use so that the length of the billing period was 60 days.
The annual and billing period electricity use and cost were calculated for each housing unit. Aggregate electricity use and use by square foot were calculated for all the housing units, by type of unit, and by number of bedrooms. Two units were dropped from the analysis because they had very low electricity use. One of these was designated as the manager’s unit. Researchers suspect that these units were not fully occupied or that there was an error in matching the utility data to the unit, so the analysis was based on 89 of the 91 housing units in Salishan 7.
TPU also provided electricity billing data for the housing units in Salishan 4, 5, and 6. Data covered the period from December 2007 (when the first units in Salishan 4 began to be occupied) through February 2012. Researchers used these data to make a preliminary comparison between the annual electricity use in Salishan 7 with these other communities. This preliminary analysis does not account for differences in billing period lengths, changes in occupancy, differences in housing characteristics, or other data quality issues. It is intended only to give an early indication of any differences in electricity use between the units in Salishan 7 and the other Salishan communities.
12
5 Results
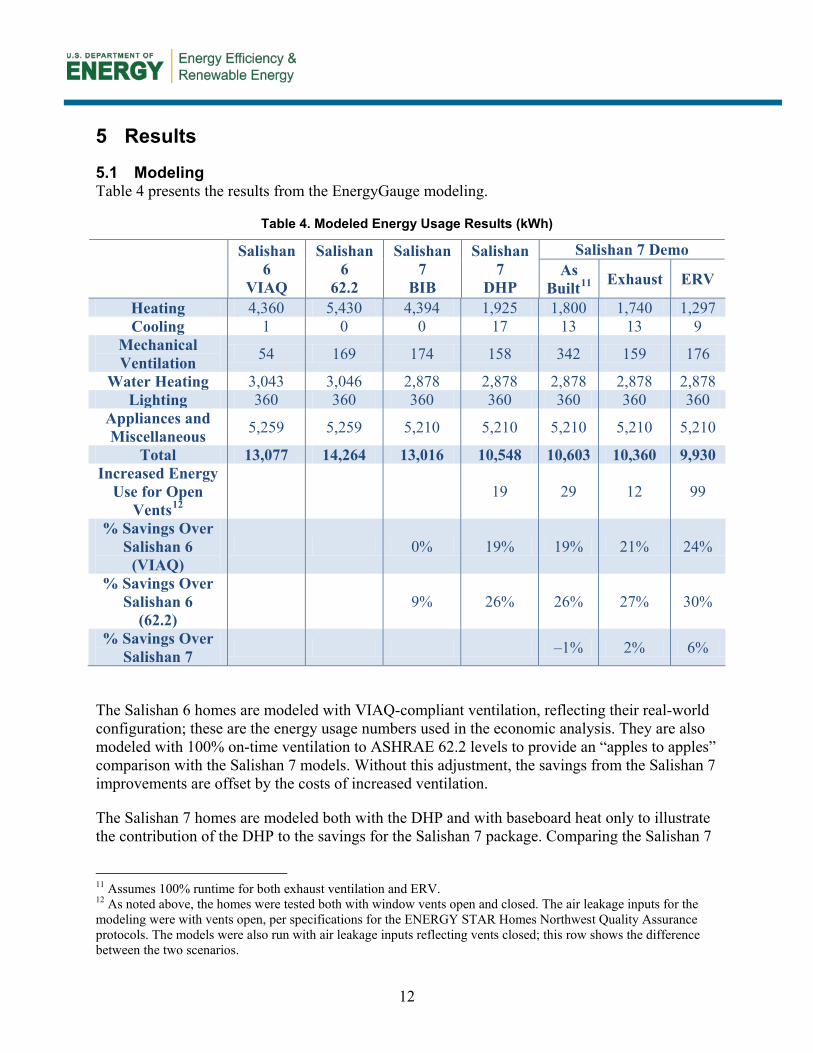
5.1 Modeling Table 4 presents the results from the EnergyGauge modeling.
Table 4. Modeled Energy Usage Results (kWh)
Salishan 6
VIAQ
Salishan 6
62.2
Salishan 7
BIB
Salishan 7
DHP
Salishan 7 Demo As
Built11 Exhaust ERV
Heating 4,360 5,430 4,394 1,925 1,800 1,740 1,297 Cooling 1 0 0 17 13 13 9
Mechanical Ventilation 54 169 174 158 342 159 176
Water Heating 3,043 3,046 2,878 2,878 2,878 2,878 2,878 Lighting 360 360 360 360 360 360 360
Appliances and Miscellaneous 5,259 5,259 5,210 5,210 5,210 5,210 5,210
Total 13,077 14,264 13,016 10,548 10,603 10,360 9,930 Increased Energy
Use for Open Vents12
19 29 12 99
% Savings Over Salishan 6
(VIAQ) 0% 19% 19% 21% 24%
% Savings Over Salishan 6
(62.2) 9% 26% 26% 27% 30%
% Savings Over Salishan 7 –1% 2% 6%
The Salishan 6 homes are modeled with VIAQ-compliant ventilation, reflecting their real-world configuration; these are the energy usage numbers used in the economic analysis. They are also modeled with 100% on-time ventilation to ASHRAE 62.2 levels to provide an “apples to apples” comparison with the Salishan 7 models. Without this adjustment, the savings from the Salishan 7 improvements are offset by the costs of increased ventilation.
The Salishan 7 homes are modeled both with the DHP and with baseboard heat only to illustrate the contribution of the DHP to the savings for the Salishan 7 package. Comparing the Salishan 7
11 Assumes 100% runtime for both exhaust ventilation and ERV. 12 As noted above, the homes were tested both with window vents open and closed. The air leakage inputs for the modeling were with vents open, per specifications for the ENERGY STAR Homes Northwest Quality Assurance protocols. The models were also run with air leakage inputs reflecting vents closed; this row shows the difference between the two scenarios.

13
model to the Salishan 6 model with 100% runtime ventilation, the DHP accounts for approximately two-thirds of the overall savings, with the shell measures accounting for the additional one-third (this analysis doesn’t account for the interactive effects between the shell and the DHP).
In EnergyGauge, heat pumps are assumed to have some level of backup resistance heat, typical for a ducted central heat pump. This scenario does not likely match the hybrid DHP/baseboard configuration used in the Salishan homes. Given that the homeowner surveys indicated a high level of use of the electric resistance heaters in the bedrooms, the homes would be expected to perform somewhere between the Salishan 7 baseboard and DHP modeled results.
The demonstration measures seem to have less impact, and are somewhat dependent on the ventilation strategy used. The “as built” case is overventilated (100% over IRC requirements), which masks the savings from the demonstration technologies.
As noted above, EnergyGauge USA does not currently have the capability of modeling slab perimeter insulation at higher than R-10. Researchers used two additional tools, REM/Rate (Architectural Energy Corporation, 2012) and the Simple Energy and Enthalpy Model (Ecotope Inc., 2012), to make assessments of the impact of this upgrade. This analysis suggested annual savings of 89–147 kWh for the increased perimeter insulation; since these estimates were conducted outside of the EnergyGauge analysis, and were not considered significant drivers for the economic analysis, they are not included in the table.
Table 5 compares Salishan 7 modeled results (with window vents open) to modeled results with the vents closed. The overall energy impact of the added leakage from the window vents is negligible; the ERV case shows the most impact, at 1% of total energy use.
Table 5. Comparison of Modeled Results, Window Vents Closed and Open (kWh)
Salishan 7 Demo Salishan 7 As Built Exhaust ERV
Vents Closed 10,548 10,603 10,360 9,930 Vents Open 10,567 10,632 10,372 10,029
Increased Energy Use From Open Vents 19 29 12 99
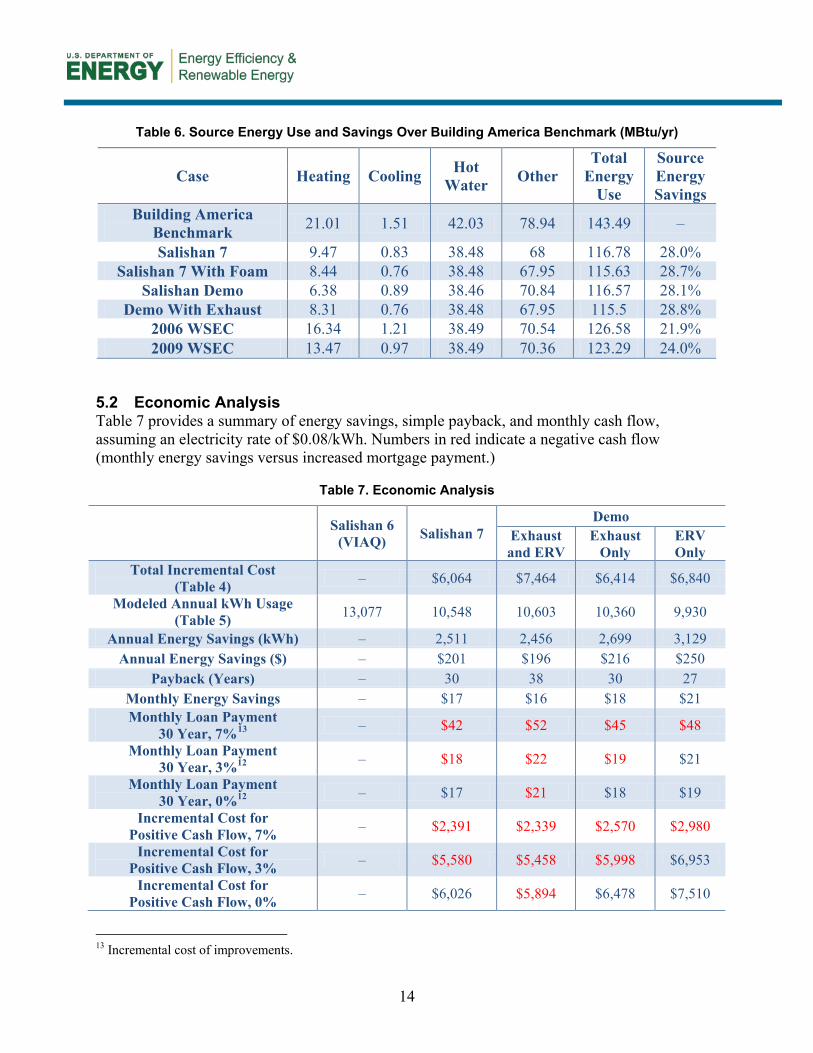
Table 6 provides the benchmarking results from BEOpt version 1.3.
14
Table 6. Source Energy Use and Savings Over Building America Benchmark (MBtu/yr)
Case Heating Cooling Hot Water Other
Total Energy
Use
Source Energy Savings
Building America Benchmark 21.01 1.51 42.03 78.94 143.49 –
Salishan 7 9.47 0.83 38.48 68 116.78 28.0% Salishan 7 With Foam 8.44 0.76 38.48 67.95 115.63 28.7%
Salishan Demo 6.38 0.89 38.46 70.84 116.57 28.1% Demo With Exhaust 8.31 0.76 38.48 67.95 115.5 28.8%
2006 WSEC 16.34 1.21 38.49 70.54 126.58 21.9% 2009 WSEC 13.47 0.97 38.49 70.36 123.29 24.0%
5.2 Economic Analysis Table 7 provides a summary of energy savings, simple payback, and monthly cash flow, assuming an electricity rate of $0.08/kWh. Numbers in red indicate a negative cash flow (monthly energy savings versus increased mortgage payment.)
Table 7. Economic Analysis
Salishan 6
(VIAQ) Salishan 7 Demo
Exhaust and ERV
Exhaust Only
ERV Only
Total Incremental Cost (Table 4) – $6,064 $7,464 $6,414 $6,840
Modeled Annual kWh Usage (Table 5) 13,077 10,548 10,603 10,360 9,930
Annual Energy Savings (kWh) – 2,511 2,456 2,699 3,129 Annual Energy Savings ($) – $201 $196 $216 $250
Payback (Years) – 30 38 30 27 Monthly Energy Savings – $17 $16 $18 $21 Monthly Loan Payment
30 Year, 7%13 – $42 $52 $45 $48
Monthly Loan Payment 30 Year, 3%12 – $18 $22 $19 $21
Monthly Loan Payment 30 Year, 0%12 – $17 $21 $18 $19
Incremental Cost for Positive Cash Flow, 7% – $2,391 $2,339 $2,570 $2,980
Incremental Cost for Positive Cash Flow, 3% – $5,580 $5,458 $5,998 $6,953
Incremental Cost for Positive Cash Flow, 0% – $6,026 $5,894 $6,478 $7,510
13 Incremental cost of improvements.
15
In no case is the improvement package cost effective at market-available financing (the interest rate for Salishan 7 was 7%14) (Schur, 2012). With both ventilation systems operating, the demonstration home will not achieve positive cash flow under any financing scenario, given the additional cost of the dual ventilation system, and its negative impact on the performance of the home.
As indicated in the table, a 30-year time frame was used for the cash flow analysis; the minimum simple payback is 27 years. The expected measure lives of the envelope measures sit comfortably within these time frames; equipment, including the DHP and ventilation system, does not. According to the Northwest’s Regional Technical Forum, a typical lifetime for DHPs is 20 years (Northwest Power and Conservation Council, 2012). In order to achieve a 20-year payback, the cost of energy would need to be $0.19/kWh for the best case (demonstration home with ERV only) and $0.26/kWh for the worst case (demonstration home with both systems operating.)
The certification costs for LEED and ENERGY STAR represent 10%–13% of the overall package costs. If these are taken out of the incremental costs, the Salishan 7 energy package (nondemonstration and the demonstration home with ERV only) reaches positive cash flow at a 3% interest rate, which is not unheard of in today’s market. This is not to suggest that the costs of the ENERGY STAR and LEED certifications should be removed from the overall costs of these packages. The decision to employ the technologies seen in Salishan 7 and the demonstration duplex are in large part due to the engagement of the ENERGY STAR/LEED verifier. Rather, the point is that as these technologies become more common and are integrated into code or recommended guidelines, and not part of voluntary programs like ENERGY STAR or LEED, their justification from a cost-benefit perspective improves.
Beyond the economic analysis, other, less tangible benefits of the Salishan 7 and demonstration measures should be considered. In the demonstration homes, the ERV provides added supplemental ventilation, while the exterior foam insulation provides added protection against condensation and wind-driven rain that cause mold and mildew.
5.3 Billing Analysis of Salishan 7 The average annual electricity use of the Salishan 7 housing units is 11,380 kWh and the median use is 11,000 kWh. The average annual electricity cost is $790 (median is $780).15 There is a fair amount of variation in the electricity use from the highest to the lowest user (more than a factor of 4), but most households have annual electricity use of 8,000–14,000 kWh (Figure 7).
14 THA pays for the loan; residents pay the energy bill. 15 Eleven of the Salishan 7 residents are on the TPU Low Income Elderly Rate. The rest pay standard rates. Some of these customers are on a Paygo system where they add money to their account as needed.

16
Figure 7. Salishan 7 annual electricity use by housing unit
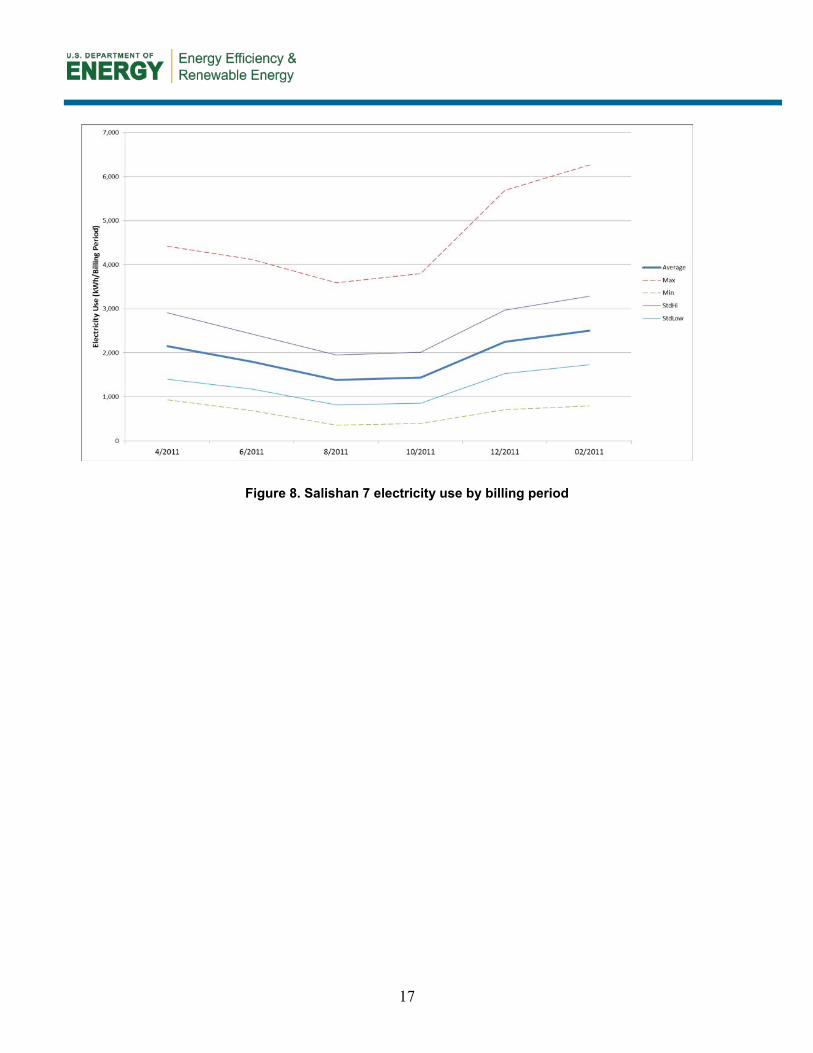
The electricity use by billing period profile shows the average electricity use for each billing period along with the standard deviation and the high and low values (Figure 8). The billing period profile for Salishan 7 is relatively flat. For low and average users, there is not a large difference in electricity use between warmer and colder periods. The difference in electricity use between high (StdHi line) and low (StdLow line) electricity users appears to be largely due to differences in base (nonheating) electricity use. These results suggest that these housing units are very efficient when it comes to heating use. One caution in interpreting these results is the 2-month billing periods tend to reduce variation in the electricity use profile because they mix cold weather periods with warmer periods (a 2-week cold snap will show up more clearly on a monthly bill than on a 2-month bill).
17
Figure 8. Salishan 7 electricity use by billing period
18
6 Ventilation System Discussion
The ventilation system used for the nondemonstration homes at Salishan 7 exceeds IRC flow requirements by 22%. The addition of the ERV in the demonstration homes provides an additional ventilation option, though at high speed, the ERV would be slightly under code flow requirements. As shown in the energy savings analysis, the ERV provides the best energy performance, though at a higher initial cost.
The exhaust ventilation control strategy used at Salishan 7 ensures that the ventilation system will be left on, but may be in conflict with code requirements. The Washington State amended IRC requires that ventilation system controls be “readily accessible to the occupant.” ASHRAE Standard 62.2-2007 has similar requirements. The ventilation controls used at Salishan are not readily accessible to occupants, unless the requirement can be interpreted to allow for a call to THA maintenance staff. Experience has shown that, given the opportunity to shut off a home’s ventilation system, many homeowners will do so, compromising the home’s ability to provide acceptable IAQ. The approach taken at Salishan (essentially “turn it on and leave it on”) does not subject the home’s IAQ to the whim of the homeowner, and is worth additional consideration by the Washington State Building Code Council and ASHRAE 62.2 committee.
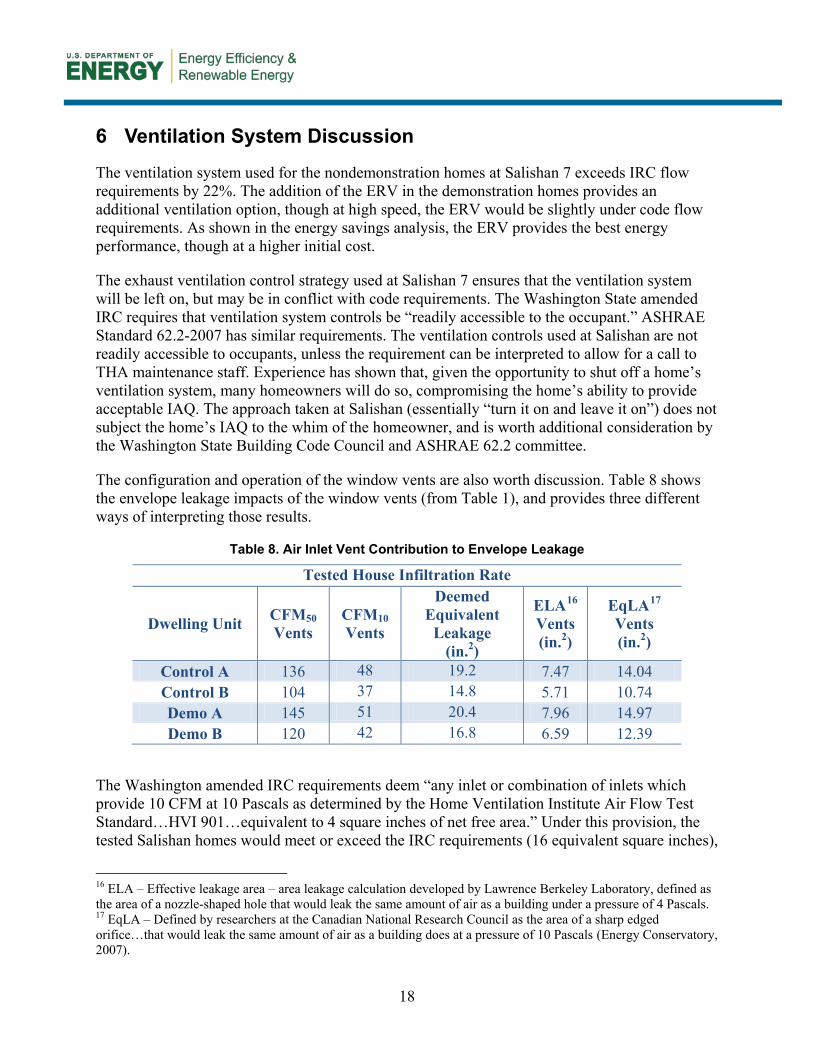
The configuration and operation of the window vents are also worth discussion. Table 8 shows the envelope leakage impacts of the window vents (from Table 1), and provides three different ways of interpreting those results.
Table 8. Air Inlet Vent Contribution to Envelope Leakage
Tested House Infiltration Rate
Dwelling Unit CFM50 Vents
CFM10 Vents
Deemed Equivalent
Leakage (in.2)
ELA16 Vents (in.2)
EqLA17 Vents (in.2)
Control A 136 48 19.2 7.47 14.04 Control B 104 37 14.8 5.71 10.74 Demo A 145 51 20.4 7.96 14.97 Demo B 120 42 16.8 6.59 12.39
The Washington amended IRC requirements deem “any inlet or combination of inlets which provide 10 CFM at 10 Pascals as determined by the Home Ventilation Institute Air Flow Test Standard…HVI 901…equivalent to 4 square inches of net free area.” Under this provision, the tested Salishan homes would meet or exceed the IRC requirements (16 equivalent square inches),
16 ELA – Effective leakage area – area leakage calculation developed by Lawrence Berkeley Laboratory, defined as the area of a nozzle-shaped hole that would leak the same amount of air as a building under a pressure of 4 Pascals. 17 EqLA – Defined by researchers at the Canadian National Research Council as the area of a sharp edged orifice…that would leak the same amount of air as a building does at a pressure of 10 Pascals (Energy Conservatory, 2007).
19
with the exception of control B. Note that there is a discrepancy between the IRC deemed equivalency and the ELA and EqLA calculations, which are generally accepted assessments of envelope leakage area.18
Regardless of the calculation of net free area employed, it is worth noting that the Salishan 7 homes had twice the number of window vents typically observed in new construction. It is also worth noting that the vents were closed in all but one home (where they had been opened by THA staff).
The use of window vents as part of a whole-house ventilation strategy is controversial; there is disagreement between state code requirements and ASHRAE 62.2 regarding their necessity with an exhaust only ventilation strategy. There are added costs for windows with vents, both in materials and the added cost of heating outside air.
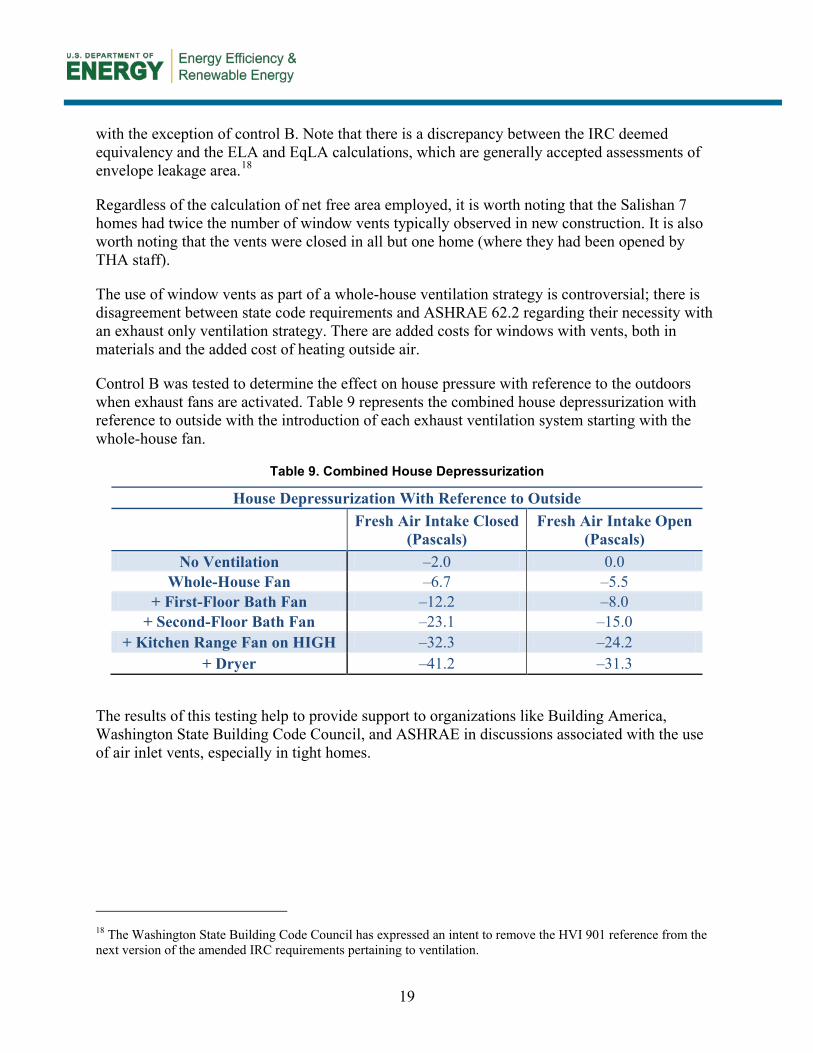
Control B was tested to determine the effect on house pressure with reference to the outdoors when exhaust fans are activated. Table 9 represents the combined house depressurization with reference to outside with the introduction of each exhaust ventilation system starting with the whole-house fan.
Table 9. Combined House Depressurization
House Depressurization With Reference to Outside
Fresh Air Intake Closed
(Pascals) Fresh Air Intake Open
(Pascals) No Ventilation –2.0 0.0
Whole-House Fan –6.7 –5.5 + First-Floor Bath Fan –12.2 –8.0
+ Second-Floor Bath Fan –23.1 –15.0 + Kitchen Range Fan on HIGH –32.3 –24.2
+ Dryer –41.2 –31.3
The results of this testing help to provide support to organizations like Building America, Washington State Building Code Council, and ASHRAE in discussions associated with the use of air inlet vents, especially in tight homes.
18 The Washington State Building Code Council has expressed an intent to remove the HVI 901 reference from the next version of the amended IRC requirements pertaining to ventilation.

20
7 Conclusions
The project demonstrated significant modeled savings (26% when the change in ventilation runtime is discounted) for improvements from 2006 WSEC to the technologies used in Salishan 7. Preliminary billing data comparing Salishan 7 to previous phases seem to support this analysis, though more analysis is needed to directly compare units of similar layout. WSU is working with TPU to obtain hourly utility data for Salishan 7 and earlier phases. The DHP represents the single most significant improvement to the modeled energy savings for Salishan 7.
The viability of the energy efficiency improvements, from a cost-benefit perspective, is limited due to the lack of availability of lower interest financing.
The additional demonstration technologies seem to provide less appreciable benefit over the Salishan 6 homes, though this is dependent to a large extent on the ventilation strategy adopted by the homeowner (and their ability to change said strategy based on the home’s configuration). Demonstration homes using the ERV as the sole whole-house ventilation system showed the highest modeled savings; a demonstration home operating with both systems used sufficient energy to mask the savings from the additional measures.
Technologies such as the ERV, exterior foam, and the liquid-applied house wrap may have indoor air quality and moisture mitigating benefits not readily apparent from the savings analyses. The benefits of ENERGY STAR and LEED certifications, including IAQ, durability, and overall resource efficiency, are also not captured in the economic or energy efficiency analyses (though the costs are), but also need to be taken into account.
The participant surveys indicated that the homeowners were generally pleased with the comfort and affordability of their homes post-retrofit. The surveys identify some issues with inconsistent heat in the DHP zone.
The use of a single-zone ERV may limit its effectiveness in rooms removed from the house core (bedrooms in particular). The DHP has similar issues in its ability to effectively heat and cool rooms behind closed doors.

21
8 Recommendations
More research is needed to investigate the spatial distribution effectiveness of both DHPs and zonal ERVs (for example, determining optimum thermostat settings, leaving doors open to reduce backup heating use, and installing fans to move air from one room to another to equalize temperatures).
Research is also needed to provide guidance to homeowners on the best use of DHP and ERV technologies. Education of homeowners, including baseboard and DHP set points, and the need to leave bedroom doors open when possible, is necessary if these technologies are to be used to their best advantage, save energy, and provide the best IAQ.
From a public policy perspective, it is worth investigating how housing authorities and other low-income focused organizations could have access to lower financing to provide maximum benefit.
Additional investigations into the various ventilation strategies available in the demonstration homes will provide occupants and THA with a ventilation strategy that provides good IAQ with lower operational costs.
WSU coordinated with DuPont to install monitoring equipment in the wall assemblies, to study the effectiveness of the liquid-applied house wrap on limiting moisture in the wall (Figure 9). The results of this monitoring will be provided by DuPont in the future.
Figure 9. Moisture sensor location (left) and interior detail (right)
During future site visits, researchers will use Energy Conservatory’s Flow Blaster for ERV and exhaust fan measurements. The Flow Blaster was designed in part to measure the low flows associated with ERVs. Researchers will also work with Energy Conservatory and the ERV manufacturer to determine the best means of testing the ERV, given the grille configuration.

22
Researchers will also use Energy Conservatory’s TECLOG software to perform more detailed assessments of the impact of the fresh air vents on Salishan 7 and earlier developments.
23
References
American Society of Heating, Refrigerating and Air-Conditioning Engineers. (2007). Ventilation and Acceptable Indoor Air Quality in Low-Rise Residential Buildings. Standard 62.2-2007.
American Society of Heating, Refrigerating and Air-Conditioning Engineers. (2012). Minutes of June, 2012 Meeting of Standing Committee 62.2, Ventilation and Acceptable Indoor Air Quality in Low-Rise Residential Buildings.
Architectural Energy Corporation. (2012, June). REM/Rate. version 12.99. Boulder, Colorado: AEC.
Ecotope Inc. (2012). Simple Energy and Enthalpy Model. SEEM, version 92. Seattle, WA: Ecotope, Inc.
Florida Solar Energy Center. (2012). EnergyGauge USA. v 2.80.5. Cocoa Beach, Florida.
Johnson, D. (2012, June 20). Salishan superintendent, Walsh Construction. (A. Gordon, Interviewer)
National Renewable Energy Laboratory. (2012). BEOpt. (v. 1.3e+). Golden, Colorado.
Northwest Power and Conservation Council. (2012, May 15). RTF Unit Energy Savings (UES) Measures and Supporting Documentation. Retrieved June 29, 2012, from Regional Technical Forum: http://www.nwcouncil.org/energy/rtf/measures/Default.asp
Schur, R. (2012, June 19). Senior Project Manager, Tacoma Housing Authority. (M. Lubliner, & A. Gordon, Interviewers)
Scott, M. (2012, June 27). Production Home Division Sales, Milgard Inc. E-mail Correspondence.
Tacoma Housing Authority. (2009, March 6). Salishan's Redevelopment. Retrieved June 19, 2012, from Tacoma Housing Authority: http://www.tacomahousing.org/Salishan/history.html
Washington State Building Code Council. (2009). Amendments to the International Mechanical Code.
24
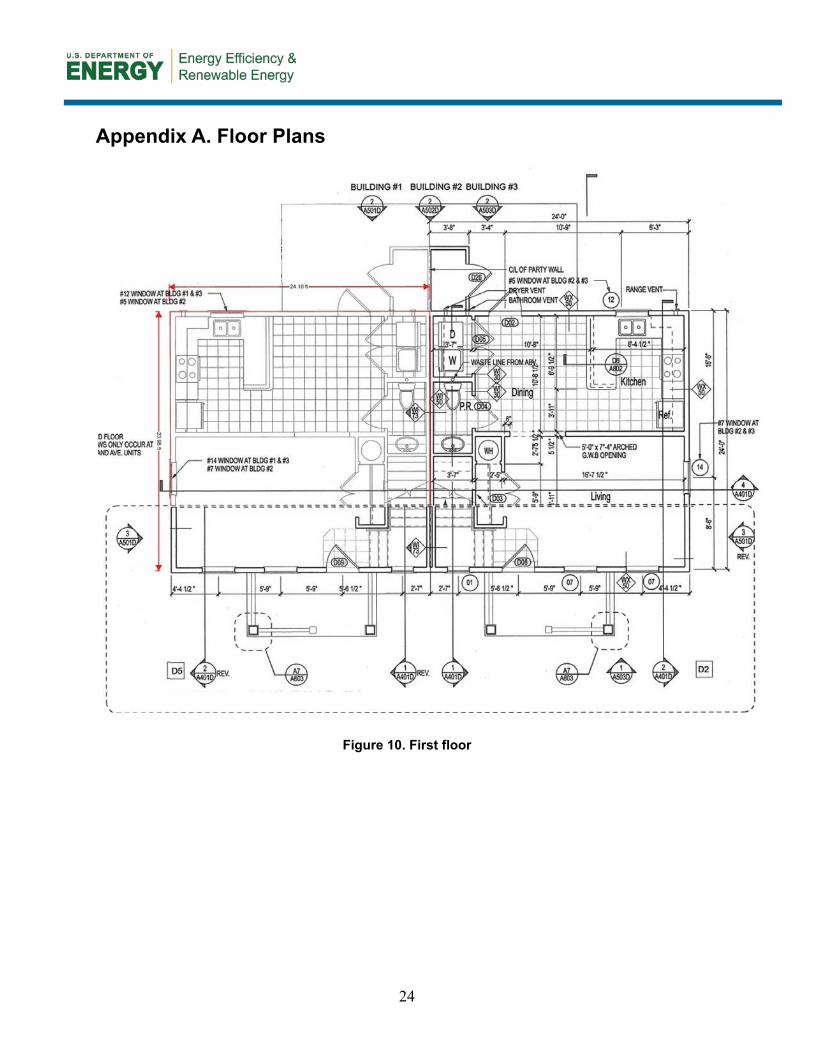
Appendix A. Floor Plans
Figure 10. First floor
25
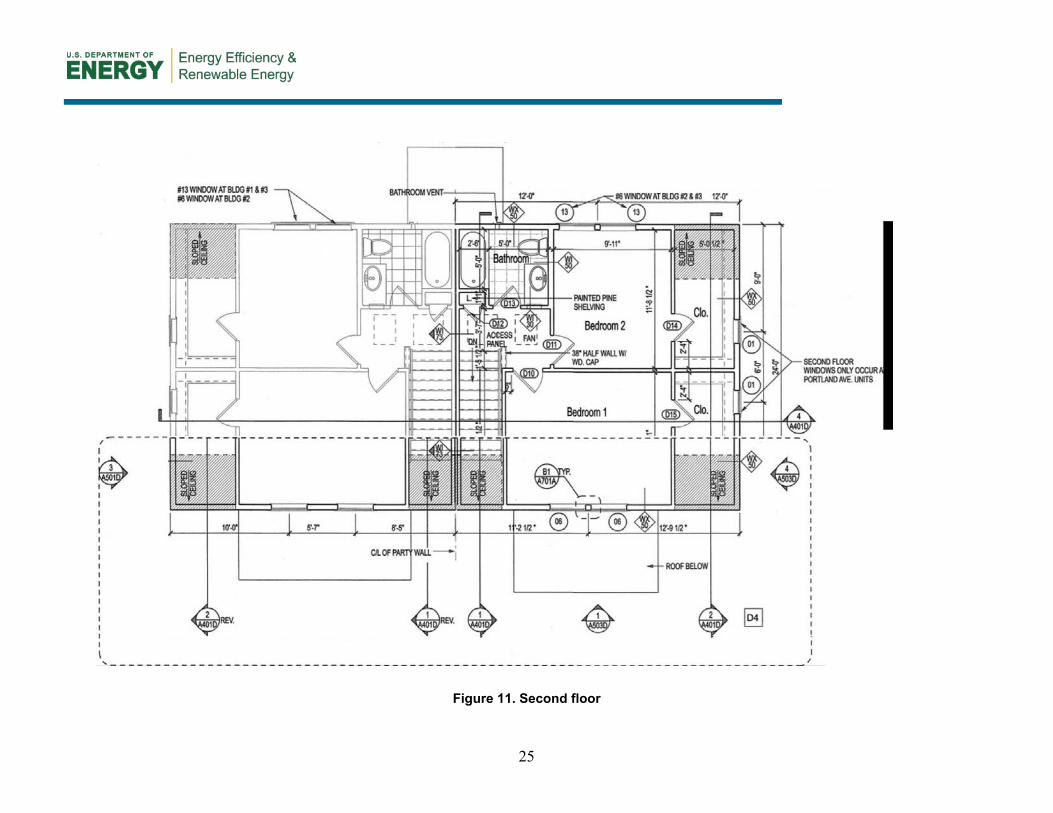
Figure 11. Second floor

26
Appendix B. Audit Summaries
Introduction Phase 7 of the Salishan development began construction in 2009. All units were occupied early in 2011. This phase of construction consisted primarily of two- and three-bedroom duplexes and triplexes. In February of 2012 WSU Energy Program conducted detailed audits of four two-bedroom duplexes identical in floor plan (model D#3). Both duplexes are located within two blocks of one another in the Salishan development. One pair of duplexes represents the control in this study; the other two represent the demonstration homes (see Figure 12)
The D#3 model duplex consists of mirrored floor plan, 1,109 ft2, two-story, two-bedroom, 1½-bath units, with a common wall separation. The homes are stick framed with trussed attics and slab-on-grade floors. Bedrooms are located on the second floors. All units are heated with a single-head Daikin DHP (RXS18DVJU) with 500-W thermostatically controlled baseboard heaters located in both bedrooms and the second-floor bathrooms. Domestic hot water is provided by electric tank type water heaters located within the conditioned space.
Figure 12. Control (left) and demonstration (right) duplexes
The above-grade walls are constructed with standard framing and insulated to R-23 with BIB fiberglass insulation. The walls are sheathed to the exterior with ½-in. plywood/oriented strand board sheet goods, with a continuous weather barrier installed between the wall sheathing and cement fiberboard lap siding. Interior walls are sheathed in ½-in. gypsum wall board. Roof structures are primarily advanced framed, raised heel trusses containing ventilated attic space insulated to R-49. There is 50 ft2 of roof area that is framed with 14-in. single rafter joists, ventilated, and insulated to R-38. Slab floors are insulated to 2 ft around the entire perimeter with R-15 rigid insulation. Window U-factors are 0.28. The UA of the typical D#3 floor plan duplex is 123, 17% lower than the 2009 International Energy Conservation Code target of 147.1. Infrared thermography did not indicate significant voids or degradation of exterior wall insulation.
27
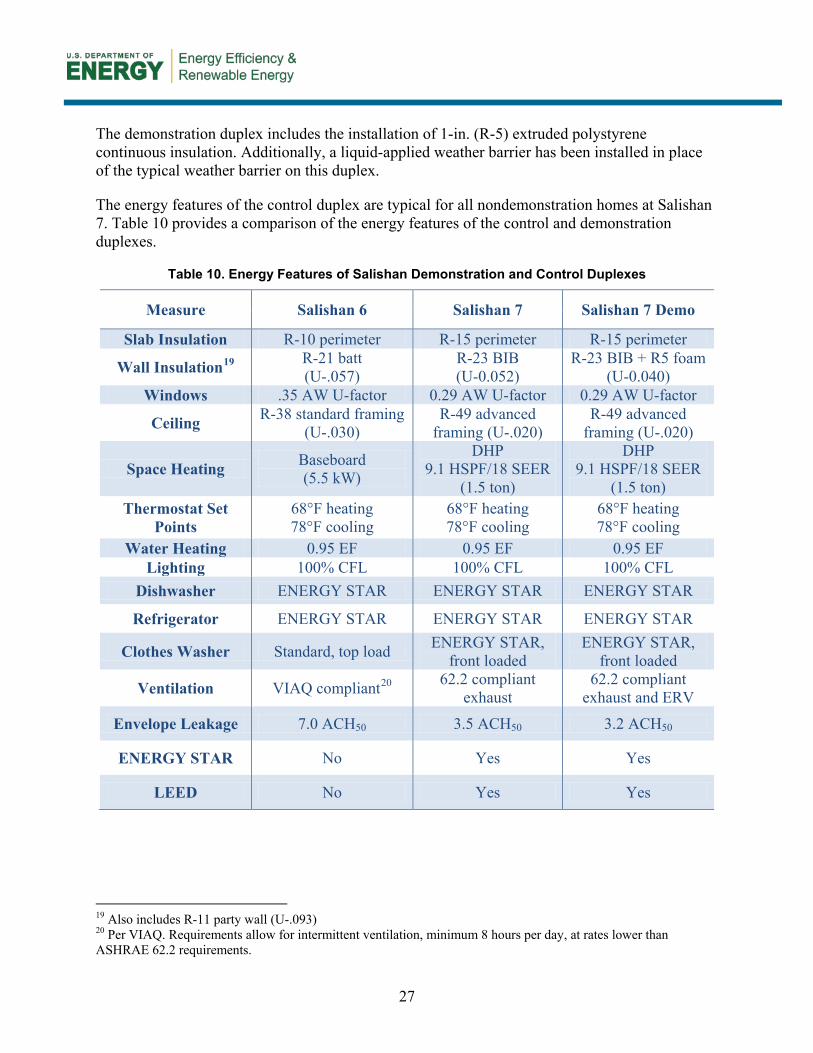
The demonstration duplex includes the installation of 1-in. (R-5) extruded polystyrene continuous insulation. Additionally, a liquid-applied weather barrier has been installed in place of the typical weather barrier on this duplex.
The energy features of the control duplex are typical for all nondemonstration homes at Salishan 7. Table 10 provides a comparison of the energy features of the control and demonstration duplexes.
Table 10. Energy Features of Salishan Demonstration and Control Duplexes
Measure Salishan 6 Salishan 7 Salishan 7 Demo
Slab Insulation R-10 perimeter R-15 perimeter R-15 perimeter
Wall Insulation19 R-21 batt (U-.057)
R-23 BIB (U-0.052)
R-23 BIB + R5 foam (U-0.040)
Windows .35 AW U-factor 0.29 AW U-factor 0.29 AW U-factor
Ceiling R-38 standard framing (U-.030)
R-49 advanced framing (U-.020)
R-49 advanced framing (U-.020)
Space Heating Baseboard (5.5 kW)
DHP 9.1 HSPF/18 SEER
(1.5 ton)
DHP 9.1 HSPF/18 SEER
(1.5 ton) Thermostat Set
Points 68°F heating 78°F cooling
68°F heating 78°F cooling
68°F heating 78°F cooling
Water Heating 0.95 EF 0.95 EF 0.95 EF Lighting 100% CFL 100% CFL 100% CFL
Dishwasher ENERGY STAR ENERGY STAR ENERGY STAR
Refrigerator ENERGY STAR ENERGY STAR ENERGY STAR
Clothes Washer Standard, top load ENERGY STAR, front loaded
ENERGY STAR, front loaded
Ventilation VIAQ compliant20 62.2 compliant exhaust
62.2 compliant exhaust and ERV
Envelope Leakage 7.0 ACH50 3.5 ACH50 3.2 ACH50
ENERGY STAR No Yes Yes
LEED No Yes Yes
19 Also includes R-11 party wall (U-.093) 20 Per VIAQ. Requirements allow for intermittent ventilation, minimum 8 hours per day, at rates lower than ASHRAE 62.2 requirements.

28
Findings
Figure 13. Infrared image of demonstration home under blower door-induced pressurization, highlighting fresh air inlet vents per Washington code
(wall exterior temperature provided as reference)
Air leakage testing was performed on the control and demonstration duplexes using blower door test equipment and infrared thermography. Blower door tests were conducted with fresh air intakes open and closed. Table 11 shows blower door infiltration rate test results of all four dwelling units audited with and without fresh air intake vents open.
Table 11. Tested Infiltration Rates With Intakes Open and Closed
Tested House Infiltration Rate
Dwelling Unit CFM50 Intakes Open
CFM50 Intakes Closed
CFM50 Intakes
Control A 520 384 136 Control B 515 411 104 Demo A 500 355 145 Demo B 430 310 120
29
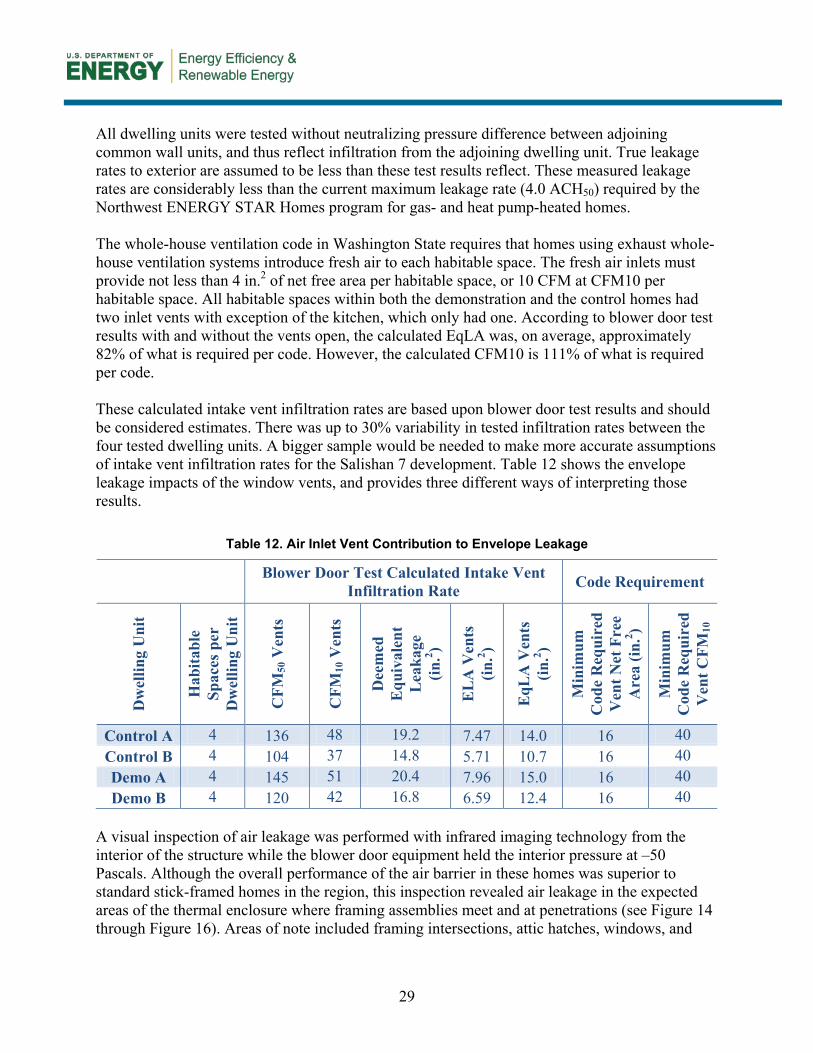
All dwelling units were tested without neutralizing pressure difference between adjoining common wall units, and thus reflect infiltration from the adjoining dwelling unit. True leakage rates to exterior are assumed to be less than these test results reflect. These measured leakage rates are considerably less than the current maximum leakage rate (4.0 ACH50) required by the Northwest ENERGY STAR Homes program for gas- and heat pump-heated homes. The whole-house ventilation code in Washington State requires that homes using exhaust whole-house ventilation systems introduce fresh air to each habitable space. The fresh air inlets must provide not less than 4 in.2 of net free area per habitable space, or 10 CFM at CFM10 per habitable space. All habitable spaces within both the demonstration and the control homes had two inlet vents with exception of the kitchen, which only had one. According to blower door test results with and without the vents open, the calculated EqLA was, on average, approximately 82% of what is required per code. However, the calculated CFM10 is 111% of what is required per code. These calculated intake vent infiltration rates are based upon blower door test results and should be considered estimates. There was up to 30% variability in tested infiltration rates between the four tested dwelling units. A bigger sample would be needed to make more accurate assumptions of intake vent infiltration rates for the Salishan 7 development. Table 12 shows the envelope leakage impacts of the window vents, and provides three different ways of interpreting those results.
Table 12. Air Inlet Vent Contribution to Envelope Leakage
Blower Door Test Calculated Intake Vent Infiltration Rate Code Requirement
Dw
ellin
g U
nit
Hab
itabl
e Sp
aces
per
D
wel
ling
Uni
t
CFM
50 V
ents
CFM
10 V
ents
Dee
med
E
quiv
alen
t L
eaka
ge
(in.2 )
EL
A V
ents
(in
.2 )
EqL
A V
ents
(in
.2 )
Min
imum
C
ode
Req
uire
d V
ent N
et F
ree
Are
a (in
.2 )
Min
imum
C
ode
Req
uire
d V
ent C
FM10
Control A 4 136 48 19.2 7.47 14.0 16 40 Control B 4 104 37 14.8 5.71 10.7 16 40 Demo A 4 145 51 20.4 7.96 15.0 16 40 Demo B 4 120 42 16.8 6.59 12.4 16 40
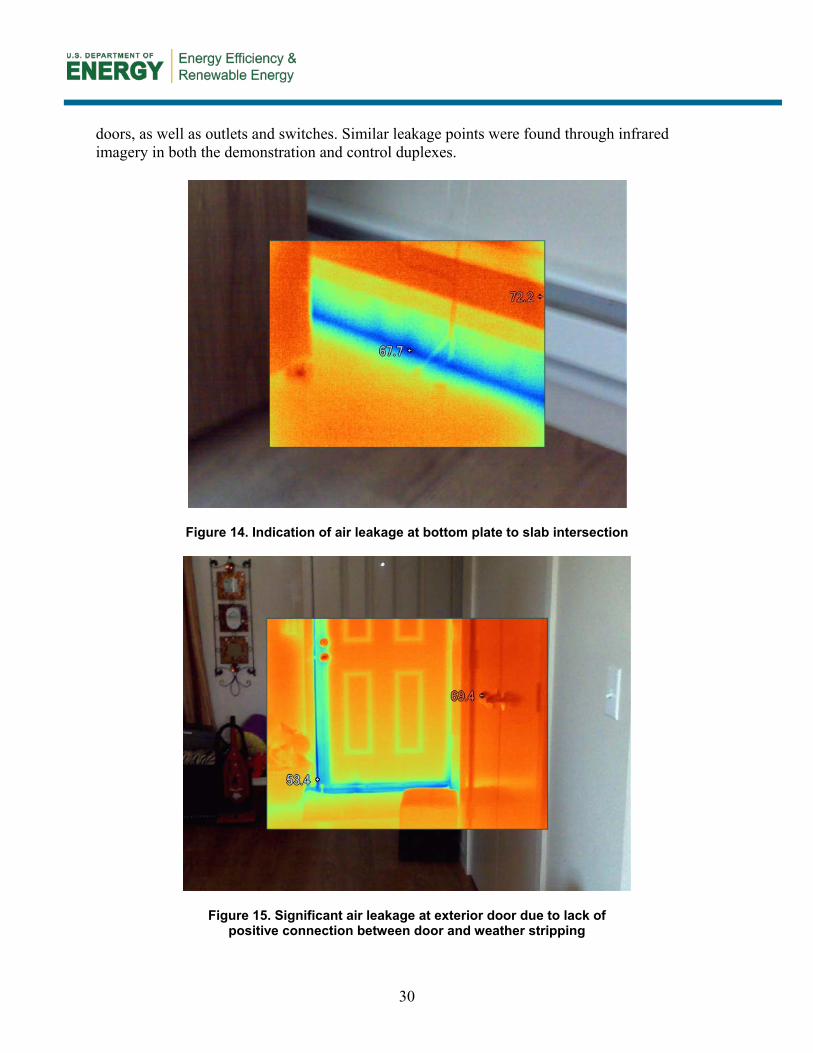
A visual inspection of air leakage was performed with infrared imaging technology from the interior of the structure while the blower door equipment held the interior pressure at –50 Pascals. Although the overall performance of the air barrier in these homes was superior to standard stick-framed homes in the region, this inspection revealed air leakage in the expected areas of the thermal enclosure where framing assemblies meet and at penetrations (see Figure 14 through Figure 16). Areas of note included framing intersections, attic hatches, windows, and
30
doors, as well as outlets and switches. Similar leakage points were found through infrared imagery in both the demonstration and control duplexes.
Figure 14. Indication of air leakage at bottom plate to slab intersection
Figure 15. Significant air leakage at exterior door due to lack of positive connection between door and weather stripping
31
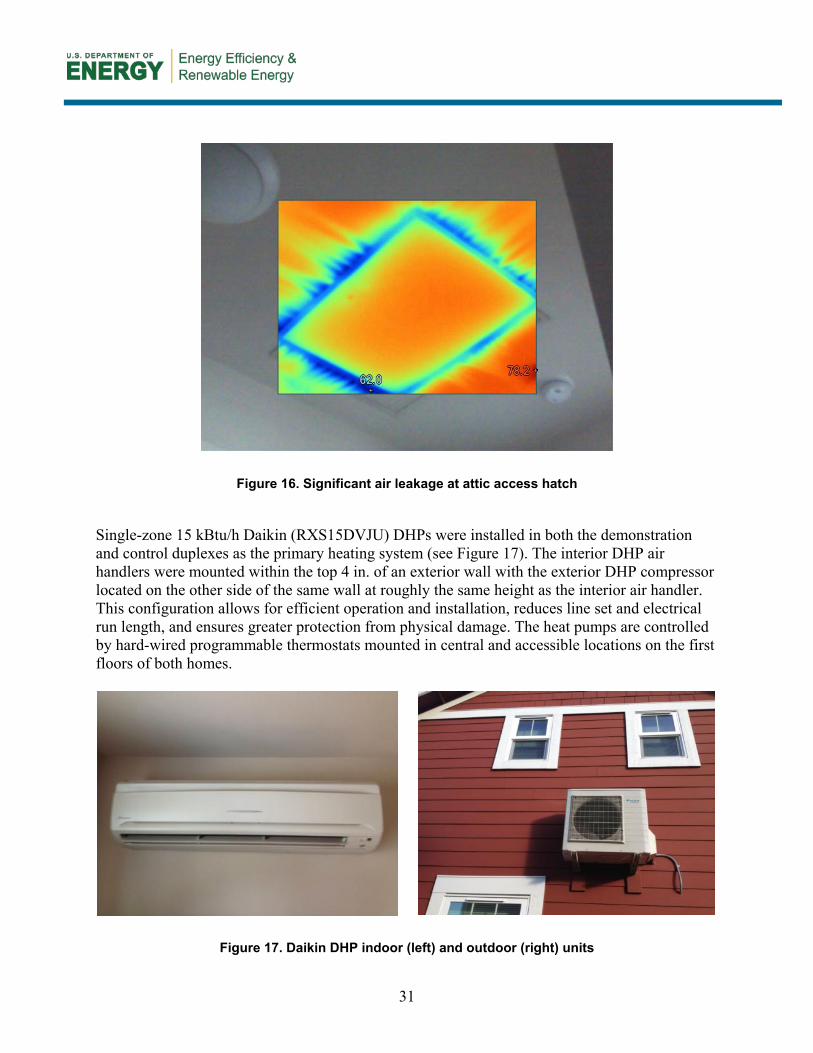
Figure 16. Significant air leakage at attic access hatch
Single-zone 15 kBtu/h Daikin (RXS15DVJU) DHPs were installed in both the demonstration and control duplexes as the primary heating system (see Figure 17). The interior DHP air handlers were mounted within the top 4 in. of an exterior wall with the exterior DHP compressor located on the other side of the same wall at roughly the same height as the interior air handler. This configuration allows for efficient operation and installation, reduces line set and electrical run length, and ensures greater protection from physical damage. The heat pumps are controlled by hard-wired programmable thermostats mounted in central and accessible locations on the first floors of both homes.
Figure 17. Daikin DHP indoor (left) and outdoor (right) units

32
Daikin recommends filters be cleaned every 2 weeks (see Figure 17). Cleaning of the filters is performed with vacuuming or washing under warm water (see Figure 18). The heat pump also has a deodorizing air filter that the manufuacturer recommends being washed with warm water every 6 months and replaced every 3 years. Traditional forced-air heating system manufacturers typically recommend filter replacement monthly, and in most cases these filters are not reusable.
Figure 18. DHP prefilters before (left) and after (right) cleaning. The filter had been in use for roughly a year before cleaning.
All bedrooms and bathrooms are equipped with 500-W electric baseboard heaters that are all independently thermostatically controlled (see Figure 19). Domestic hot water is provided by 0.95 EF electric 50-gal water heaters located in a utility closet within the conditioned space. Lighting in all homes is 100% high efficacy. The majority of the fixtures have Edison bases containing CFLs, but there are a few pin-based fixtures.
Figure 19. Hard-wired DHP thermostat, with hourly temperature and relative humidity data logger
33
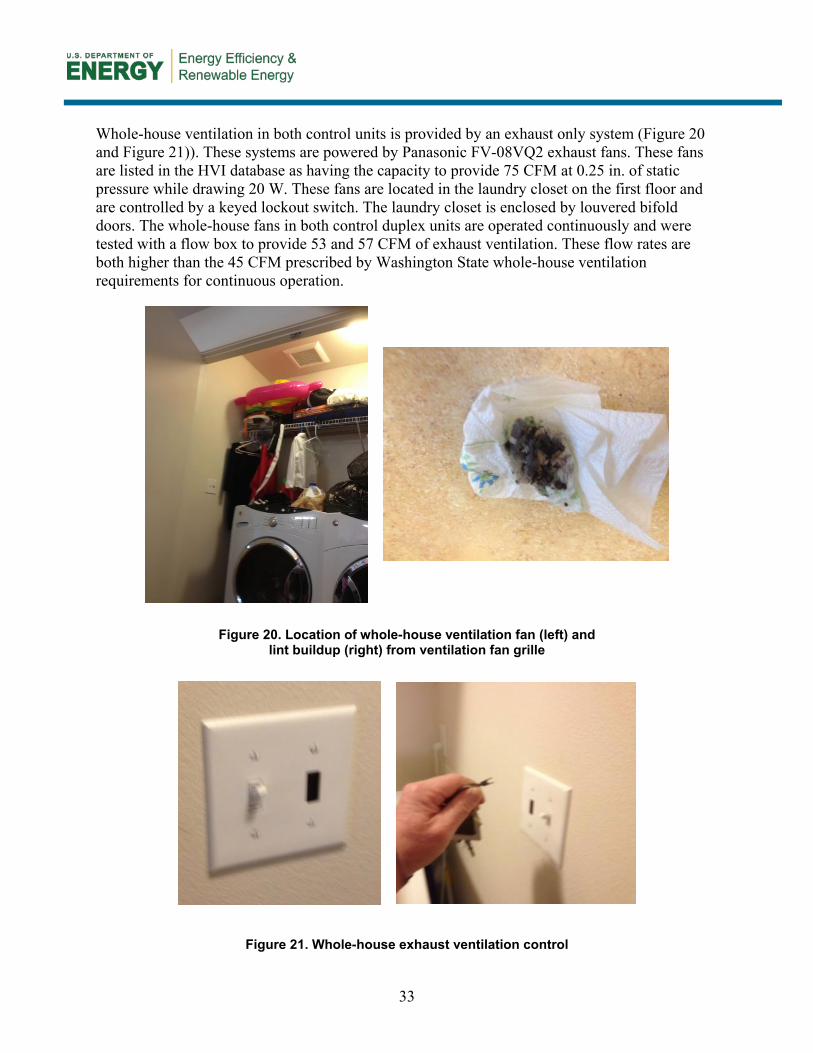
Whole-house ventilation in both control units is provided by an exhaust only system (Figure 20 and Figure 21)). These systems are powered by Panasonic FV-08VQ2 exhaust fans. These fans are listed in the HVI database as having the capacity to provide 75 CFM at 0.25 in. of static pressure while drawing 20 W. These fans are located in the laundry closet on the first floor and are controlled by a keyed lockout switch. The laundry closet is enclosed by louvered bifold doors. The whole-house fans in both control duplex units are operated continuously and were tested with a flow box to provide 53 and 57 CFM of exhaust ventilation. These flow rates are both higher than the 45 CFM prescribed by Washington State whole-house ventilation requirements for continuous operation.
Figure 20. Location of whole-house ventilation fan (left) and lint buildup (right) from ventilation fan grille
Figure 21. Whole-house exhaust ventilation control
34
This model of exhaust fan is rated for continuous operation and has a 60,000-hour warranty. However, it was observed during the site visit/audit that the whole-house exhaust fan grill contained considerable amounts of lint due to its proximity to the clothes dryer. The whole-house exhaust ventilation system for the control duplexes includes seven dedicated fresh air intakes per dwelling unit. These intakes are provided by operable trickle vents located in the frames of windows in the kitchens, living rooms, bedrooms, and bedroom closets. Additionally there are also operable wall ports in the living rooms and master bedrooms of both units in place of an operable trickle vent in the street facing (west) windows. As seen in the infrared image in Figure 11, use of this through the wall ventilation approach compromises the envelope’s air and thermal barrier due to the placement of fresh air duct in the wall cavity. All fresh air intake vents in both control units were found to be in the closed position. The unit at control A had one window partially open when these audits were performed. Whole-house ventilation in both of the demo duplex dwelling units was provided by Panasonic’s Whisper Comfort spot ERV. These systems are balanced and provide exhaust and intake from the same terminus at both the interior and exterior (see Figure 22). Flow rate testing for the ERVs was not performed due to access to indoor terminus and difficulties in terminus design that limit ability to effectively test flow rates. The ERVs were installed in the stairwell, where safe access to the unit’s interior terminus was not possible with equipment available at the time of the audit (safe access would have required complicated rigging.) Additionally, both the interior and exterior terminus design make it difficult to isolate the exhaust and supply air streams from one another with typical flow hoods and balometers.

35
Figure 22 (Clockwise, from top left) operable fresh air wall port in living room interior, exterior, and infrared
The ERVs in both dwelling units are operated by ON/OFF switches located on the wall below the fan. The ERV in demonstration A was rarely run by the home’s occupant. The ERV in demonstration B was always in the “ON” position. These ERVs also contain filters that had yet to be cleaned or serviced by the occupants. This system was in addition to the same whole-house exhaust ventilation strategy used in the control duplex. The fresh air intakes in these two dwelling units were all in the open position during the heating season (Figure 23).

36
Figure 23. ERV indoor unit (left) and outside terminus (right)
Flow rate testing of the whole-house exhaust ventilation fan in the demonstration duplex resulted in flow rates of 55 CFM for demonstration A and 62 CFM for demonstration B. Code-required minimum ventilation rate for this duplex is 45 CFM for continuous operation. With the addition of the ERV, combined ventilation rates for these dwelling units would be 75 CFM and 82 CFM, respectively, if the ERV is run on low speed. At high speed ventilation rates would be 95 and 102 CFM, respectively. At these rates the dwelling units are likely being overventilated. Source specific ventilation is provided for in both bathrooms of the house and in the kitchen with exhaust only fans. The bath fans are single-speed Panasonic fans and are controlled by twist timers. Flow rates for all bath fans in both units varied from 49–76 CFM. The kitchen was ventilated with a standard range hood and was controlled by a manual two-speed switch located on the unit. The kitchen fans were not tested for flow rate. Although none of the homes at Salishan 7 are built with combustion appliances, control B was tested to determine the effect on house pressure with reference to the outdoors when exhaust fans are activated. Table 13 represents the combined house depressurization with reference to outside with the introduction of each exhaust ventilation system starting with the whole-house fan.
Supply air stream
Exhaust air stream

37
Table 13. Combined House Depressurization With Exhaust Fans
Control B 2.8 ACH50
House Depressurization With Reference to Outside
Fresh Air Intake Closed
(Pascals) Fresh Air Intake Open
(Pascals) No Ventilation –2.0 0.0
Whole-house Fan –6.7 –5.5 + First-Floor Bath Fan –12.2 –8.0
+ Second-Floor Bath Fan –23.1 –15.0 + Kitchen Range Fan on HIGH –32.3 –24.2
+ Dryer –41.2 –31.3
buildingamerica.gov
DOE/GO-102013-3897 ▪ October 2013
Printed with a renewable-source ink on paper containing at least 50% wastepaper, including 10% post-consumer waste.