Embed Size (px)
Citation preview

Evaluation of Reduced-Order Models for Predictions of
Separated and Vortical Flows
Ryan Darragh∗ and Peter E. Hamlington†
Department of Mechanical Engineering, University of Colorado, Boulder, CO 80309
Mehdi Ghoreyshi‡ and Andrew J. Lofthouse§
High Performance Computing Research Center, U.S. Air Force Academy, CO 80840
Computational fluid dynamics (CFD) simulations have the potential to provide predic-tions of flow around airfoils and wings of arbitrary complexity, without the need to performreal-world testing and experimentation. However, the computational cost of such simula-tions increases dramatically as the complexity of the modeled geometry increases, thusimposing limitations on the use of CFD for design optimization where many different flightconditions must be considered. Reduced-order models can overcome these limitations byproviding rapid calculations of the flow field at a fraction of the computational cost, butthe accuracy of such models can be substantially reduced in flows with complex physics,such as flow separation. In this paper, we compare the accuracy of three reduced-ordermodels for calculating the coefficient of pressure, Cp, on both simple (i.e., NACA0012 air-foil) and complex (i.e., NACA64A006 wing) aerodynamic configurations at different anglesof attack, including high angles of attack where flow separation occurs. These models aretrained using CFD data and the capability of the models to predict Cp for new angles ofattack is characterized. We find that reduced-order models based on local interpolationmethods are the most accurate, although the accuracy becomes worse overall for a three-dimensional wing and worse in particular for high angles of attack where flow separationoccurs.
I. Introduction
Aircraft design optimization requires an understanding of the interactions between flow fields – which areoften unsteady, separated, and turbulent – and aerodynamic structures such as airfoils or wings. Althoughthese interactions can be studied using reduced-scale physical models in wind tunnels, a cheaper and fasteralternative is to numerically model the flow using computational fluid dynamics (CFD) simulations. Suchsimulations allow a broader range of design parameters to be tested than is experimentally feasible, typicallyin a much shorter span of time. However, CFD simulations can be prohibitively expensive for realisticgeometries, even using Reynolds-averaged Navier-Stokes (RANS) approaches. This is particularly true whena wide range of flight conditions, such as different angles of attack, must be considered.
The significant cost of performing many full CFD simulations has motivated the creation of reduced-order models. These models are commonly used as a reduced-cost approach to predict aircraft flow fieldsat different flight conditions. In contrast to CFD, reduced-order models do not involve the solution ofphysics-based governing equations, and instead use known experimental and CFD results as “training data”to empirically relate aerodynamic properties such as the coefficient of pressure, Cp, to flight conditions,such as the angle of attack. When considering a broad range of continuous flight conditions, building suchmodels can be much simpler than performing an essentially limitless series of CFD simulations, given that thespeed of reduced-order models is almost instantaneous when compared to typical CFD codes. The simplicity
∗Graduate Student, Aerospace Engineering Sciences, [email protected], AIAA Student Member†Assistant Professor, Mechanical Engineering, [email protected], AIAA Member‡Senior Aerospace Engineer, [email protected], AIAA Senior Member§Director, High Performance Computing Research Center, [email protected], AIAA Senior Member
1 of 18
American Institute of Aeronautics and Astronautics
Dow
nloa
ded
by U
NIV
ER
SIT
Y O
F C
OL
OR
AD
O B
OU
LD
ER
on
July
7, 2
016
| http
://ar
c.ai
aa.o
rg |
DO
I: 1
0.25
14/6
.201
6-43
25
34th AIAA Applied Aerodynamics Conference
13-17 June 2016, Washington, D.C.
AIAA 2016-4325
This material is declared a work of the U.S. Government and is not subject to copyright protection in the United States.
AIAA Aviation
and speed of these models also introduces the possibility of improved real-time flight control and stability.However, the accuracy of reduced-order models can suffer as a result of not directly solving physics-basedflow equations. This is particularly true when a flow undergoes a “regime change,” such as occurs duringflow separation at high angles of attack. As a result, any practically-useful reduced-order model must notonly be fast, but must also correctly predict the response of aerodynamic systems for a wide range of flightconditions.
A common reduced-order modeling approach is the “table-lookup” method,1–3 which requires the tabula-tion of large amounts of data at various flight conditions and the interpolation of known tabulated values todetermine unknown values. However, as modern interpolation, mode decomposition, and machine learningmethods have been developed, the accuracy and complexity of reduced-order models has improved. Krig-ing1,3–5 and Cokriging2,6–8 methods, in particular, have been widely used recently to create reduced-ordermodels for various aerodynamic problems using tabulated data of varying complexity, including results fromCFD. Motivated by the nonlinearity and complexity of flow field data that must be represented by reduced-order models, nonlinear Volterra series9,10 and linear convolution models with nonlinear corrections11 havealso been investigated for the prediction of unsteady aerodynamic loads. More recently, the use of modedecomposition methods such as radial basis functions10 and proper orthogonal decomposition12 have beenused to represent complex flow fields and aerodynamic responses with relatively few degrees of freedom.Lillian et al.12 used POD, and singular value decomposition (SVD) in particular, with CFD training datato predict the surface pressures on an F-16 wing.
In many cases, the development of reduced-order models has been posed as a “system identification”problem,13 on which many modern machine learning methods can be brought to bear. For example, artificialneural networks have been created to model the lateral and longitudinal responses of an aircraft in order todevelop a control system14 and to model aircraft response over wide ranges of angle of attack.15 Similarly,support vector machines have been used to capture the complicated flow generated at high angles of attackby complex aerodynamic geometries.16 In general, interpolation, mode decomposition, and machine learningmethods have all resulted in reasonably accurate reduced-order models, and work continues to improve theiroverall capabilities.17 Other methods for developing reduced-order models include the method of segments,which has been used in high Mach number regimes,11 and the auto-regressive moving average method todeal with airfoil gust responses.18 A number of these methods have been compiled together into a singlesoftware packaged called System Identification Programs for Aircraft (SIDPAC).19 This package includesa wide range of software to meet many system identification needs, and often serves as a baseline againstwhich new methods are tested.
In the present paper, we are specifically focused on the development of reduced-order models for bothsimple and complex aerodynamic configurations at different angles of attack, including high angles of attackwhere flow separation occurs. We consider three different reduced-order models, including (i) SVD, which isa global method inspired by the work of Lillian et al.,12 (ii) localized SVD, which is designed to increase thelocality of the SVD interpolation, and (iii) the Kriging method,1,3–5 which is a local interpolation method.These models are each “trained” here using data from a series of CFD simulations that solve the steadyRANS equations in order to obtain the coefficient of pressure, Cp, at different angles of attack. The resultingmodels are then tested at new angles of attack for both simple (i.e., the NACA0012 airfoil) and complex(i.e., the NACA64A006 wing) geometries, revealing that model accuracy depends on the complexity of thegeometry as well as on whether the flow has separated. Our particular interest is in determining whether asingle reduced-order model can accurately predict aerodynamic loads across a wide range of flight conditions(i.e., angles of attack) during which the flow transitions from a largely attached to a massively separatedbehavior, with a specific focus on the relative accuracies of local versus global interpolation methods.
In the following, a description of the CFD simulations is provided first, followed by an outline of thethree reduced order models used in this study. Results are then presented and a discussion and conclusionsare provided at the end.
II. Description of Numerical Simulations
Training data for the development of the three reduced-order models considered here is obtained fromnumerical simulations performed using the CFD code Cobalt,20 which is a parallelized finite volume flowsolver capable of resolving flow over complex geometries using both structured and unstructured grids intwo or three dimensions (2D or 3D, respectively). Cobalt solves the compressible RANS equations with up
2 of 18
American Institute of Aeronautics and Astronautics
Dow
nloa
ded
by U
NIV
ER
SIT
Y O
F C
OL
OR
AD
O B
OU
LD
ER
on
July
7, 2
016
| http
://ar
c.ai
aa.o
rg |
DO
I: 1
0.25
14/6
.201
6-43
25

(a) NACA0012 grid (b) NACA64A006 grid with tap positions
Figure 1: Computational grids for (a) the two-dimensional NACA0012 airfoil21 and (b) the three-dimensionalNACA64A006 wing.22 Panel (b) includes eight planes (or “taps”) in red where we measure Cp over the wing.The inset shows a profile view of these planes. Note that a peniche is included below the NACA64A006 wingto mimic the experimental setup Hovelmann et al.23
to second order spatial and temporal accuracy. It uses Godunov’s first-order accurate, cell-centered, finitevolume, exact Riemann solution method. A variety of flow data are output from Cobalt, including velocityand vorticity fields, as well as pressure at user-specified tap locations.
Using Cobalt, we solve the steady RANS equations for the NACA0012 airfoil21 and the NACA64A006wing22 at various angles of attack. All simulations for both geometries are performed using second orderspatial accuracy and an ideal gas equation of state. The 2D NACA0012 unstructured grid is shown inFigure 1(a) and the 3D NACA64A006 unstructured grid is shown in Figure 1(b). The geometry for theNACA64A006 case includes a peniche, mimicking the experimental configuration studied by Hovelmann etal.23 A total of 70198 grid cells24 are used for each of the NACA0012 simulations and 13.2 million gridcells25 are used for each of the NACA64A006 simulations. The Spalart-Allmaras rotation corrected (SARC)RANS model is used for both cases with second-order spatial accuracy.
Steady state flow fields are computed for both the NACA0012 airfoil and the NACA64A006 wing atvarious fixed angles of attack, where the incoming flow speed is Ma=0.15 in all cases (this flow speedmatches the experimental conditions of Hovelmann et al.23). The simulations for each angle of attack wererun on Cray XE6 (Garnet, 2.5GHz) and Cray XE6m (Copper, 2.3GHz) supercomputers for approximately3600 CPU hours over 256 CPUs. In all cases, 6000 iterations were required in order to reach a steady statecondition. Data is obtained by varying only the angle of attack in each simulation and keeping all otherparameters the same. We simulated angles ranging from 0˝ to 20˝ for the NACA0012 and 1˝ to 21˝ for theNACA64A006. The specific selection of angles is described in Section III.D.
In order to obtain Cp values on the 3D NACA64A006 wing, pressure measurement “taps” are placedat eight locations along the span of the wing, as shown in Figure 1(b). Tap locations are identical to themeasurement locations in the experiment of Hovelmann et al.23 and consist of planes at x{c “ t 0.12, 0.24,0.354, 0.366, 0.474, 0.486, 0.600, 0.72u, where c is the chord length, which varies along the span of the wing.For the 2D NACA0012 case shown in Figure 1(a), Cp values are taken along the surface of the airfoil.
III. Description of Reduced Order Models
The reduced-order models considered here involve the construction of an interpolating function usingknown values of Cp at a range of angles of attack, α. Interpolation methods can be categorized in a fewdifferent ways, but of greatest interest here are those that are global versus those that are local. Globalmethods take into account all of the information from a given range of input conditions. This causes thesemethods to act as though they are averaging the data, and thus they tend to produce better results whenextreme values must be neglected. On the other hand, local methods only take into account information fromdata near the condition of interest, causing them to better reproduce local characteristics of the function
3 of 18
American Institute of Aeronautics and Astronautics
Dow
nloa
ded
by U
NIV
ER
SIT
Y O
F C
OL
OR
AD
O B
OU
LD
ER
on
July
7, 2
016
| http
://ar
c.ai
aa.o
rg |
DO
I: 1
0.25
14/6
.201
6-43
25

they are interpolating, such as minima or maxima. In the following, we briefly describe the SVD method,which is a global method, and the localized SVD and Kriging methods, both of which are local methods.
A. Singular Value Decomposition
Singular value decomposition (SVD) is a matrix method that decomposes data into singular values andvectors. We implement the method of Lillian et al.12 on our matrix of Cp values at each angle of attackα and each tap location py, xq. We begin with an A matrix for a given tap, x0, where we want to create amodel out of n angles of attack α. Our matrix would then be
Ax0 “
»
—
—
—
—
–
Cppα0, y0, x0q Cppα1, y0, x0q . . . Cppαn, y0, x0q
Cppα0, y1, x0q Cppα1y1, x0q . . . Cppαn, y1, x0q...
.... . .
...
Cppα0, ym, x0q Cppα1, ym, x0q . . . Cppαn, ym, x0q
fi
ffi
ffi
ffi
ffi
fl
. (1)
We then decompose Ax0using SVD into A “ UΣV T where U and V are the left and right singular vectors
and Σ is the matrix of singular values. Next, we introduce
R “
»
—
—
—
—
–
α00 α1
0 α20 . . . αM0
α01 α1
1 α21 . . . αM1
......
.... . .
...
α0n α1
n α2n . . . αMn
fi
ffi
ffi
ffi
ffi
fl
(2)
where M P N is the maximum order to which we expand. For the present analysis, we use M “ 3. We thensolve for a matrix of coefficients C such that RC « V . Returning to our Ax0
matrix, we have
A “ UΣV T “ UΣpRCqT “ UΣCTRT . (3)
We can now interpolate to obtain Cp values at l new angles of attack by defining
R “
»
—
—
—
—
–
α00 α1
0 α20 . . . αM0
α01 α1
1 α21 . . . αM1
......
.... . .
...
α0l α1
l α2l . . . αMl
fi
ffi
ffi
ffi
ffi
fl
. (4)
We then solve A “ UΣCT RT with our new R matrix to obtain our interpolated Cp values. It is importantto note that this method interpolates across the entire domain of angles at once, meaning that this is not alocal method.
B. Localized Singular Value Decomposition
The localized SVD method provides a localization of the SVD global method described in Section A byrestricting the domain over which the SVD is performed. In particular, if our entire dataset ranges fromangles of attack αa to αb, with separation L “ αb ´ αa, and we are interested in interpolating at αc, whereαa ă αc ă αb, we do this by defining λ ă L and performing the SVD method over angles for which we havedata in subdomain
“
αc ´λ2 , αc `
λ2
‰
. If either the left or right bounds of our subdomain extend further than
our domain, we cut off the subdomain where the domain ends; that is, if αc `λ2 ą αb, we would define our
subdomain to be“
αc ´λ2 , αb
‰
.By restricting the domain in this manner, we are able to create a localized method since angles further
away from our desired interpolation angle do not affect our interpolation. However, this method doesintroduce potential issues near the edges of the domain or in sparsely populated sub-areas of the domain. Inthe present study we have used λ “ 8˝ and have kept M “ 3, as used in the global SVD approach.
4 of 18
American Institute of Aeronautics and Astronautics
Dow
nloa
ded
by U
NIV
ER
SIT
Y O
F C
OL
OR
AD
O B
OU
LD
ER
on
July
7, 2
016
| http
://ar
c.ai
aa.o
rg |
DO
I: 1
0.25
14/6
.201
6-43
25

C. Kriging Method
The Kriging method is an interpolation method commonly used on spatially correlated data. It works byconsidering many possible trajectories between given data points and determining the mean and varianceof those trajectories. The mean of those trajectories then becomes the prediction of our model, and thevariance provides an estimate for how well the model approximates the true value. We note that since thetrajectories are computed based on nearby points and pass through the prescribed data points, the methodis both exact and local.
For the NACA64A006 wing, we implement a different Kriging model for each tap, giving us eight modelsin total. The method is implemented using Matlab’s DACE toolbox.26 The DACE toolbox also providesvalues of the mean square error (MSE) based on the computed variance and the least squares solution. Weuse a second order polynomial regression model and a spline correlation model.
D. Selection of Training Data Angles of Attack
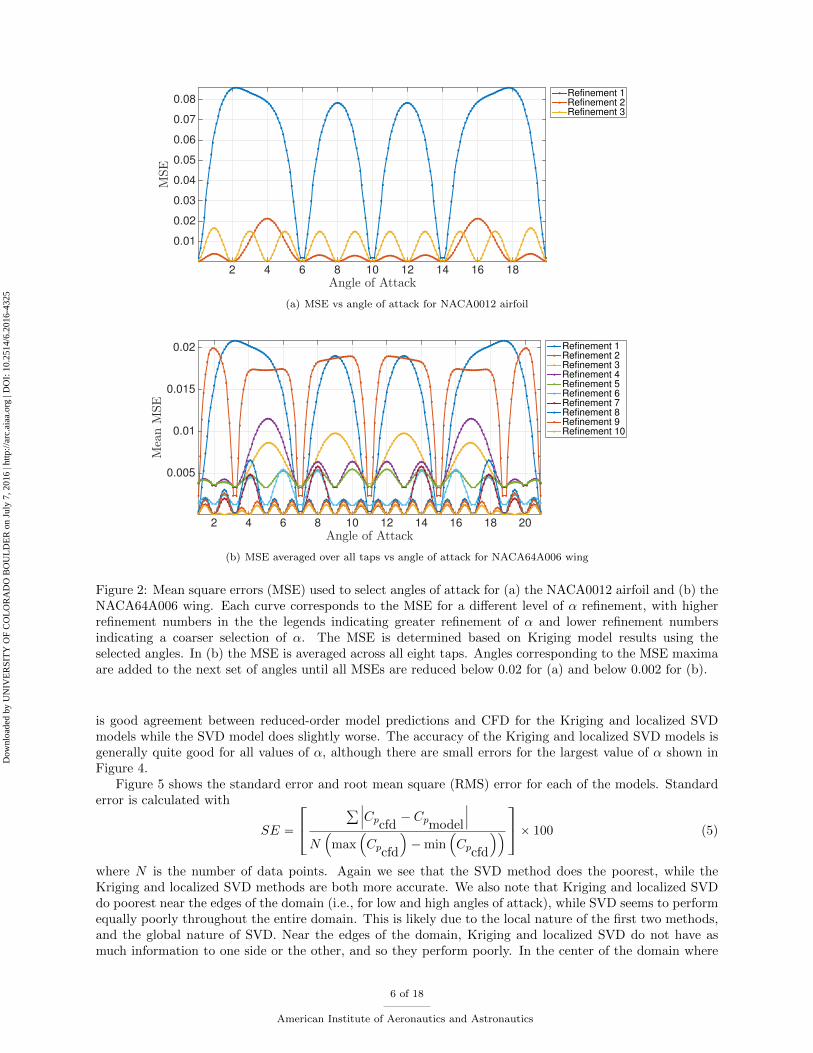
The selection of angles of attack α to be simulated using CFD for the purpose of “training” the reducedorder models is based on results from the Kriging model. We began by performing simulations for a setof five angles, t0˝, 6˝, 10˝, 14˝, 20˝u, for the NACA0012 airfoil and five angles, t1˝, 7˝, 11˝, 15˝, 21˝u, for theNACA64A006 wing. We then generated Kriging models on these sets of angles, and interpolated at variousangles to obtain the mean square error (MSE) as reported from the Kriging model. We then updated theangles in our model by adding in the angles with the highest MSE. Simulations were then performed forthese new angles and the process was repeated until the MSE was reduced below 0.002 for the NACA64A006case and 0.02 for the NACA0012 case.
Figure 2 shows the angle selection process for both cases. In the NACA64A006 case, the MSE from alleight models (one for each tap) is averaged at a given angle. The final sets of angles used to construct thetraining data sets are:
• NACA0012: 0, 2, 4, 6, 8, 10, 12, 14, 16, 18, 20 (all in degrees),
• NACA64A006: 1, 2, 2.6, 3.2, 4, 5, 6, 7, 8, 9, 10, 11, 12, 13, 14, 15, 16, 17, 18, 18.8, 19.4, 20, 21 (all in degrees).
Simulations were performed for each of these angles of attack, as described in Section II, in order to generatetraining data used to calculate the SVD, localized SVD, and Kriging reduced-order models described earlierin this section.
IV. Results
In the following, reduced-order model results are presented for the NACA0012 airfoil and the NACA64A006wing. For both cases, flow fields and Cp distributions from the CFD simulations are presented at severalangles of attack, and reduced-order model predictions are presented for angles of attack not included in thetraining data used to construct the models.
A. NACA0012 Airfoil
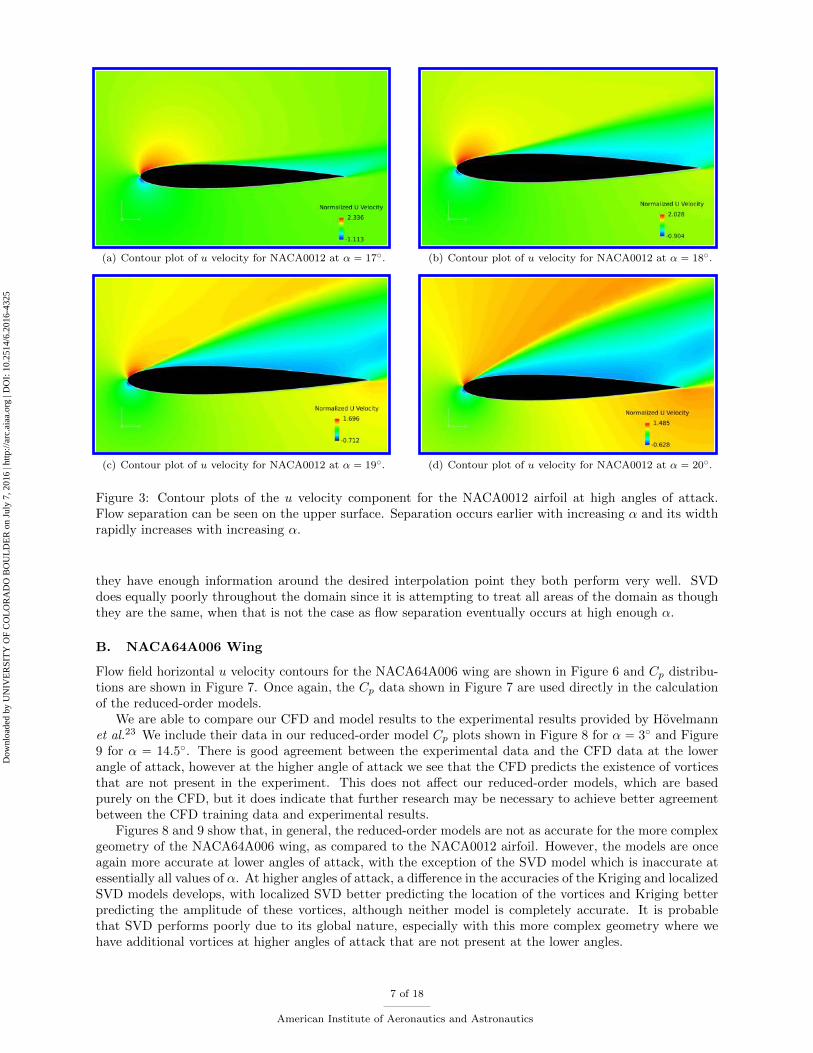
Contour plots of the horizontal (x) velocity u are shown in Figure 3 for the NACA0012 airfoil at high anglesof attack. For lower angles of attack, the flow remains attached and is relatively simple. Figure 3 showsthat, at such large values of α, the size of the separated flow region increases rapidly for increasing α whenα ą 17˝. This increase in the size of the separation region is accompanied by an increasingly early separationof the flow along the upper surface of the airfoil.
The corresponding distributions of Cp over the NACA0012 airfoil are shown in Figure 4 at both low andhigh angles of attack. These figures all show that Cp is generally higher on the bottom surface and loweron the upper surface, providing the airfoil with lift. However, Cp on both surfaces varies as α increases,resulting in a reduction in lift as the separation region grows.
Results from the three reduced-order models described in Section III are shown in Figure 4 for anglesof attack that were not included in the training data outlined in Section III.D. In Figure 4, we show thepredicted Cp value from the Kriging, SVD, and localized SVD models along with CFD results (which areused as the “truth” for these values of α) as a function of y normalized by c, the chord length. Overall, there
5 of 18
American Institute of Aeronautics and Astronautics
Dow
nloa
ded
by U
NIV
ER
SIT
Y O
F C
OL
OR
AD
O B
OU
LD
ER
on
July
7, 2
016
| http
://ar
c.ai
aa.o
rg |
DO
I: 1
0.25
14/6
.201
6-43
25
Angle of Attack2 4 6 8 10 12 14 16 18
MSE
0.01
0.02
0.03
0.04
0.05
0.06
0.07
0.08Refinement 1
Refinement 2
Refinement 3
(a) MSE vs angle of attack for NACA0012 airfoil
Angle of Attack2 4 6 8 10 12 14 16 18 20
MeanMSE
0.005
0.01
0.015
0.02 Refinement 1
Refinement 2
Refinement 3
Refinement 4
Refinement 5
Refinement 6
Refinement 7
Refinement 8
Refinement 9
Refinement 10
(b) MSE averaged over all taps vs angle of attack for NACA64A006 wing
Figure 2: Mean square errors (MSE) used to select angles of attack for (a) the NACA0012 airfoil and (b) theNACA64A006 wing. Each curve corresponds to the MSE for a different level of α refinement, with higherrefinement numbers in the the legends indicating greater refinement of α and lower refinement numbersindicating a coarser selection of α. The MSE is determined based on Kriging model results using theselected angles. In (b) the MSE is averaged across all eight taps. Angles corresponding to the MSE maximaare added to the next set of angles until all MSEs are reduced below 0.02 for (a) and below 0.002 for (b).
is good agreement between reduced-order model predictions and CFD for the Kriging and localized SVDmodels while the SVD model does slightly worse. The accuracy of the Kriging and localized SVD models isgenerally quite good for all values of α, although there are small errors for the largest value of α shown inFigure 4.
Figure 5 shows the standard error and root mean square (RMS) error for each of the models. Standarderror is calculated with
SE “
»
–
ř
ˇ
ˇ
ˇCpcfd
´ Cpmodel
ˇ
ˇ
ˇ
N´
max´
Cpcfd
¯
´min´
Cpcfd
¯¯
fi
flˆ 100 (5)
where N is the number of data points. Again we see that the SVD method does the poorest, while theKriging and localized SVD methods are both more accurate. We also note that Kriging and localized SVDdo poorest near the edges of the domain (i.e., for low and high angles of attack), while SVD seems to performequally poorly throughout the entire domain. This is likely due to the local nature of the first two methods,and the global nature of SVD. Near the edges of the domain, Kriging and localized SVD do not have asmuch information to one side or the other, and so they perform poorly. In the center of the domain where
6 of 18
American Institute of Aeronautics and Astronautics
Dow
nloa
ded
by U
NIV
ER
SIT
Y O
F C
OL
OR
AD
O B
OU
LD
ER
on
July
7, 2
016
| http
://ar
c.ai
aa.o
rg |
DO
I: 1
0.25
14/6
.201
6-43
25
(a) Contour plot of u velocity for NACA0012 at α “ 17˝. (b) Contour plot of u velocity for NACA0012 at α “ 18˝.
(c) Contour plot of u velocity for NACA0012 at α “ 19˝. (d) Contour plot of u velocity for NACA0012 at α “ 20˝.
Figure 3: Contour plots of the u velocity component for the NACA0012 airfoil at high angles of attack.Flow separation can be seen on the upper surface. Separation occurs earlier with increasing α and its widthrapidly increases with increasing α.
they have enough information around the desired interpolation point they both perform very well. SVDdoes equally poorly throughout the domain since it is attempting to treat all areas of the domain as thoughthey are the same, when that is not the case as flow separation eventually occurs at high enough α.
B. NACA64A006 Wing
Flow field horizontal u velocity contours for the NACA64A006 wing are shown in Figure 6 and Cp distribu-tions are shown in Figure 7. Once again, the Cp data shown in Figure 7 are used directly in the calculationof the reduced-order models.
We are able to compare our CFD and model results to the experimental results provided by Hovelmannet al.23 We include their data in our reduced-order model Cp plots shown in Figure 8 for α “ 3˝ and Figure9 for α “ 14.5˝. There is good agreement between the experimental data and the CFD data at the lowerangle of attack, however at the higher angle of attack we see that the CFD predicts the existence of vorticesthat are not present in the experiment. This does not affect our reduced-order models, which are basedpurely on the CFD, but it does indicate that further research may be necessary to achieve better agreementbetween the CFD training data and experimental results.
Figures 8 and 9 show that, in general, the reduced-order models are not as accurate for the more complexgeometry of the NACA64A006 wing, as compared to the NACA0012 airfoil. However, the models are onceagain more accurate at lower angles of attack, with the exception of the SVD model which is inaccurate atessentially all values of α. At higher angles of attack, a difference in the accuracies of the Kriging and localizedSVD models develops, with localized SVD better predicting the location of the vortices and Kriging betterpredicting the amplitude of these vortices, although neither model is completely accurate. It is probablethat SVD performs poorly due to its global nature, especially with this more complex geometry where wehave additional vortices at higher angles of attack that are not present at the lower angles.
7 of 18
American Institute of Aeronautics and Astronautics
Dow
nloa
ded
by U
NIV
ER
SIT
Y O
F C
OL
OR
AD
O B
OU
LD
ER
on
July
7, 2
016
| http
://ar
c.ai
aa.o
rg |
DO
I: 1
0.25
14/6
.201
6-43
25

x/c0 0.2 0.4 0.6 0.8 1
Cp
-0.8
-0.6
-0.4
-0.2
0
0.2
0.4
0.6
0.8
1
(a) NACA0012 at α “ 1˝
x/c0 0.2 0.4 0.6 0.8 1
Cp
-1.5
-1
-0.5
0
0.5
1
1.5
(b) NACA0012 at α “ 3˝
x/c0 0.2 0.4 0.6 0.8 1
Cp
-2
-1.5
-1
-0.5
0
0.5
1
1.5
(c) NACA0012 at α “ 5˝
x/c0 0.2 0.4 0.6 0.8 1
Cp
-8
-6
-4
-2
0
2
(d) NACA0012 at α “ 11˝
x/c0 0.2 0.4 0.6 0.8 1
Cp
-12
-10
-8
-6
-4
-2
0
2
(e) NACA0012 at α “ 15˝
x/c0 0.2 0.4 0.6 0.8 1
Cp
-7
-6
-5
-4
-3
-2
-1
0
1
2
(f) NACA0012 at α “ 19˝
Figure 4: Cp plots for the NACA0012 airfoil at varying angles of attack. CFD results are shown as blue lines,Kriging model predictions are purple circles, SVD predictions are green ˆ’s, and localized SVD predictionsare orange +’s. There is good agreement between reduced-order models and CFD at all angles of attack,but it is slightly worse at high and low angles of attack than at mid-range angles.
(a) NACA0012 standard error (b) NACA0012 RMS error
Figure 5: Standard error and RMS error for each reduced-order model as a function of the angle of attackfor the NACA0012. Kriging is in blue, SVD in red, and localized SVD in yellow. We see a large error forthe SVD model throughout the entire domain, while Kriging and localized SVD are both roughly equallyaccurate throughout the entire domain. For high and low α the error in Kriging and localized SVD bothincrease, likely due to the fact that they have less information to one side about the value of α they areinterpolating. This is not the case near the center of the domain where the error is lower.
8 of 18
American Institute of Aeronautics and Astronautics
Dow
nloa
ded
by U
NIV
ER
SIT
Y O
F C
OL
OR
AD
O B
OU
LD
ER
on
July
7, 2
016
| http
://ar
c.ai
aa.o
rg |
DO
I: 1
0.25
14/6
.201
6-43
25

(a) Contour plot of u velocity for NACA64A006at α “ 14˝.
(b) Contour plot of u velocity for NACA64A006at α “ 15˝.
(c) Contour plot of u velocity for NACA64A006at α “ 16˝.
(d) Contour plot of u velocity for NACA64A006at α “ 17˝.
Figure 6: Contour plots of the u velocity component for the NACA64A006 wing looking down the y axis athigh angles of attack. We see how the flow changes as separation occurs.
(a) Cp distribution over NACA64A006 at α “
1˝.(b) Cp distribution over NACA64A006 at α “
10˝.
(c) Cp distribution over NACA64A006 at α “
14.5˝.(d) Cp distribution over NACA64A006 at α “
21˝.
Figure 7: Cp distribution over NACA64A006 wing looking down the y axis. We see how the Cp distributionchanges as separation occurs.
9 of 18
American Institute of Aeronautics and Astronautics
Dow
nloa
ded
by U
NIV
ER
SIT
Y O
F C
OL
OR
AD
O B
OU
LD
ER
on
July
7, 2
016
| http
://ar
c.ai
aa.o
rg |
DO
I: 1
0.25
14/6
.201
6-43
25

y/c0 0.2 0.4 0.6 0.8 1
Cp
-0.4
-0.3
-0.2
-0.1
0
0.1
0.2
0.3
0.4
(a) NACA646006 at Tap 1
y/c0 0.2 0.4 0.6 0.8 1
Cp
-0.6
-0.5
-0.4
-0.3
-0.2
-0.1
0
0.1
0.2
0.3
0.4
(b) NACA646006 at Tap 2
y/c0 0.2 0.4 0.6 0.8 1
Cp
-1
-0.8
-0.6
-0.4
-0.2
0
0.2
0.4
(c) NACA646006 at Tap 3
y/c0 0.2 0.4 0.6 0.8 1
Cp
-1
-0.8
-0.6
-0.4
-0.2
0
0.2
0.4
(d) NACA646006 at Tap 4
y/c0 0.2 0.4 0.6 0.8 1
Cp
-1
-0.8
-0.6
-0.4
-0.2
0
0.2
0.4
(e) NACA646006 at Tap 5
y/c0 0.2 0.4 0.6 0.8 1
Cp
-1
-0.8
-0.6
-0.4
-0.2
0
0.2
0.4
(f) NACA646006 at Tap 6
y/c0 0.2 0.4 0.6 0.8 1
Cp
-1.2
-1
-0.8
-0.6
-0.4
-0.2
0
0.2
0.4
(g) NACA646006 at Tap 7
y/c0 0.2 0.4 0.6 0.8 1
Cp
-1.6
-1.4
-1.2
-1
-0.8
-0.6
-0.4
-0.2
0
0.2
0.4
(h) NACA646006 at Tap 8
Figure 8: NACA646006 wing at α “ 3˝. CFD results are shown as blue lines, Kriging model predictions arepurple circles, SVD predictions are green ˆ’s, localized SVD predictions are orange +’s, and experimentalresults are black squares. There is fairly good agreement between the CFD results and the Kriging andlocalized SVD predictions. SVD predicts which we see as minima at this angle that are not present in theCFD data.
10 of 18
American Institute of Aeronautics and Astronautics
Dow
nloa
ded
by U
NIV
ER
SIT
Y O
F C
OL
OR
AD
O B
OU
LD
ER
on
July
7, 2
016
| http
://ar
c.ai
aa.o
rg |
DO
I: 1
0.25
14/6
.201
6-43
25

y/c0 0.2 0.4 0.6 0.8 1
Cp
-5
-4
-3
-2
-1
0
1
(a) NACA646006 at Tap 1
y/c0 0.2 0.4 0.6 0.8 1
Cp
-4.5
-4
-3.5
-3
-2.5
-2
-1.5
-1
-0.5
0
0.5
(b) NACA646006 at Tap 2
y/c0 0.2 0.4 0.6 0.8 1
Cp
-4.5
-4
-3.5
-3
-2.5
-2
-1.5
-1
-0.5
0
0.5
(c) NACA646006 at Tap 3
y/c0 0.2 0.4 0.6 0.8 1
Cp
-4.5
-4
-3.5
-3
-2.5
-2
-1.5
-1
-0.5
0
0.5
(d) NACA646006 at Tap 4
y/c0 0.2 0.4 0.6 0.8 1
Cp
-2.5
-2
-1.5
-1
-0.5
0
0.5
(e) NACA646006 at Tap 5
y/c0 0.2 0.4 0.6 0.8 1
Cp
-2.5
-2
-1.5
-1
-0.5
0
0.5
(f) NACA646006 at Tap 6
y/c0 0.2 0.4 0.6 0.8 1
Cp
-1.6
-1.4
-1.2
-1
-0.8
-0.6
-0.4
-0.2
0
0.2
0.4
(g) NACA646006 at Tap 7
y/c0 0.2 0.4 0.6 0.8 1
Cp
-1
-0.8
-0.6
-0.4
-0.2
0
0.2
0.4
(h) NACA646006 at Tap 8
Figure 9: NACA 646006 wing at α “ 14.5˝. CFD results are shown as blue lines, Kriging model predictionsare purple circles, SVD predictions are green ˆ’s, localized SVD predictions are orange +’s, and experimentalresults are black squares. Agreement is much worse at this angle of attack. The Kriging and localized SVDmethods no longer appear to be much better than SVD as no method is able to accurately predict thelocation and amplitude of the vortices. Additionally we see better agreement at lower tap numbers whichcorresponds to lower values of x{c where we would be less likely to find vortices. Worse agreement is foundaround taps 3 and 4 since the CFD predicts vortices here, but not at lower angles of attack which we see inFigure 8.
11 of 18
American Institute of Aeronautics and Astronautics
Dow
nloa
ded
by U
NIV
ER
SIT
Y O
F C
OL
OR
AD
O B
OU
LD
ER
on
July
7, 2
016
| http
://ar
c.ai
aa.o
rg |
DO
I: 1
0.25
14/6
.201
6-43
25

Angle of Attack2 4 6 8 10 12 14 16 18
Mean E
rror
1
2
3
4
5
6
7
8
KrigingSVDLocalized SVD
(a) NACA64A006 standard error.
Angle of Attack2 4 6 8 10 12 14 16 18
Me
an
RM
S
0.02
0.04
0.06
0.08
0.1
0.12
0.14
0.16
0.18
0.2
0.22KrigingSVDLocalized SVD
(b) NACA64A006 RMS error.
Figure 10: NACA64A006 standard error and RMS error for each model. Both the error and RMS areaveraged across all eight taps. Kriging is in blue, SVD in red, and localized SVD in yellow. The error forSVD is again highest and fairly uniform while Kriging and localized SVD are again fairly similar. We do notsee as much of a reduction in error in the center of the domain for Kriging and localized SVD, likely due tothe more complex geometry and flow separation that occurs near the center of the domain.
Again we consider the standard error and RMS error of each reduced-order method in Figure 10. Aswith the NACA0012 airfoil, SVD is the least accurate and is again fairly uniform in its error. Kriging andlocalized SVD perform similarly with Kriging doing slightly better everywhere except near α “ 14.5˝. Theerror for both of these methods again goes up near the edges of the domain, although not as drastically asfor the NACA0012 airfoil, likely due to the higher error around 14.5˝.
C. Reducing Model Error
To this point, the results have indicated that the Kriging method performs best. The next task is to determinea set of model angles that most closely match the resulting model predictions. This is done by reducing thestandard error, rather than the MSE from earlier, and considering only the NACA64A006. Four models areconsidered with uniform separation of increasing refinement from one to twenty-one degrees:
• Refinement 1: Angles separated by five degrees.
• Refinement 2: Angles separated by two degrees.
• Refinement 3: Angles separated by one degree.
• Refinement 4: Angles separated by half a degree.
Panel (a) of Figure 11 shows the standard error averaged over seven taps at each test angle for the fourmodel refinements. The error steadily decreases with increasing refinement at angles below about 11˝, butfails to significantly decrease above 11˝ beyond the first refinement.
This failure to decrease can be attributed to the complexity of the flow after separation has occurred.Panel (b) presents a different view of the same data. Here the standard error for a given refinement has beenaveraged across all seven taps and all test angles of attack. That result is then plotted against the number ofangles used to create the model. We find a power law relationship between the error and number of anglesin the model. Additionally there seems to be an asymptote at around 1% error, providing a limit to howmuch the error can be reduced by. Given how close refinement 4 gets to this limit, it does not seem usefulto consider models with greater refinement for this range of angles.
Figure 12 shows a plot similar to Figure 11(a), except instead of averaging over all seven taps, the errorfor each tap is plotted for each refinement. We see similar behavior to Figure 11(a) with better performancebefore 11˝, and a failure to improve past 11˝. Additionally taps one, three, and four have a higher maximum
12 of 18
American Institute of Aeronautics and Astronautics
Dow
nloa
ded
by U
NIV
ER
SIT
Y O
F C
OL
OR
AD
O B
OU
LD
ER
on
July
7, 2
016
| http
://ar
c.ai
aa.o
rg |
DO
I: 1
0.25
14/6
.201
6-43
25

Angle of Attack2 4 6 8 10 12 14 16 18 20
MeanErrorPercent
0.5
1
1.5
2
2.5
3
3.5
4
4.5
(a) Kriging model error convergence.
Number of Angles in Model10
010
1
MeanErrorPercent
101
Error for Model
Fit over Models
(b) Mean model error vs number of angles included in model.
Figure 11: Panel (a) shows the standard error averaged over seven taps at each angle of attack for theNACA64A006 at each refinement level. Refinement 1 (five degree angle separation) is in blue, refinement 2(two degree angle separation) in red, refinement 3 (single degree angle separation) in yellow, and refinement4 (half degree angle separation) in purple. The error decreases nicely below angles of about 11˝, but failsto improve much with refinement at angles higher than 11˝. In (b) we see the standard error averaged overall seven taps and all test angles plotted against the number of angles used to create the model. We seea somewhat exponential looking curve indicating that the benefit of adding additional angles decreases asadditional angles are added.
error than taps five, six, seven, and eight. However, they do eventually reduce down to a similar level to thehigher taps.
Both Figures 11 and 12 show rapid variations in the error at high angles of attack. Figure 13 seeks toexplain this behavior by examining four closely spaced angles of attack, α “ 15.1, 15.2, 15.3, 15.4, and lookingat both the CFD results and the Kriging model predictions. The CFD results vary greatly between eachangle of attack, while the Kriging results are much smoother. This discrepancy would lead to a large rapidlyvarying error, as is seen at high angles of attack.
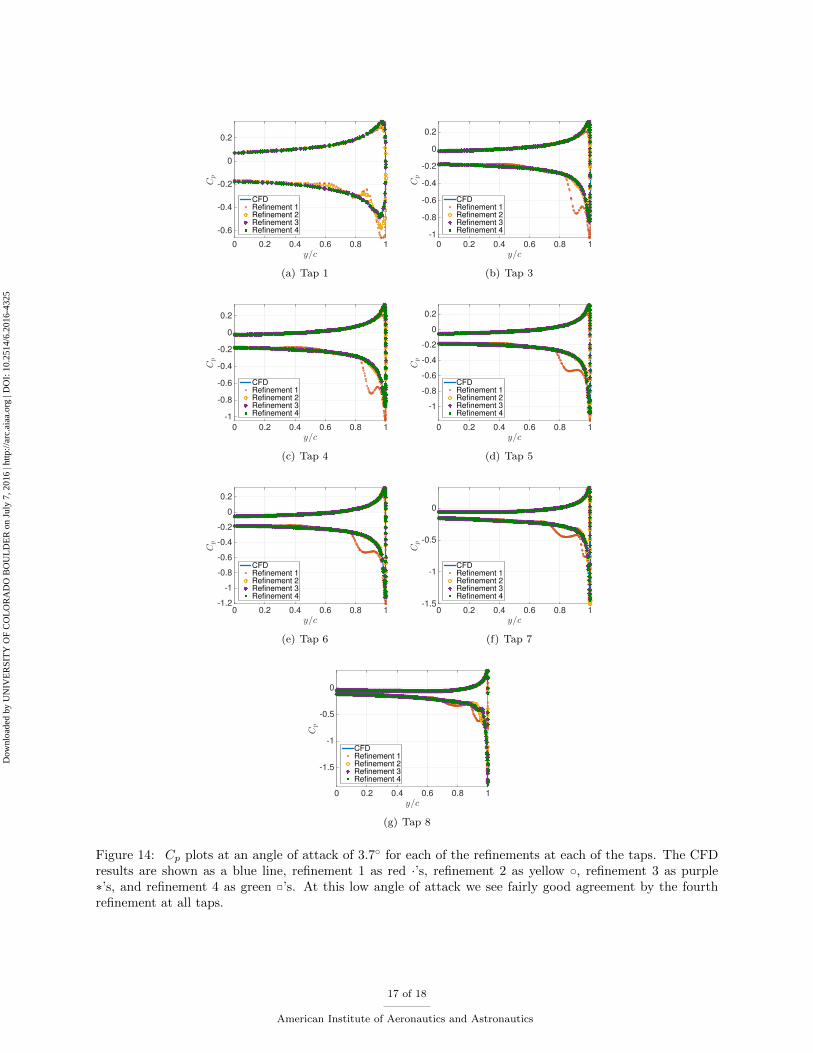
Finally, Figures 14 and 15 show Cp plots at 3.7˝ and 14.75˝ for the four refinements. Good agreementis found at 3.7˝ degrees, as would be expected based off the error plot. However Figure 14 shows thatrefinement 1 predicts a vortex to form at around y{c “ 0.9 for taps three through six. Higher refinementsdo not exhibit this same behavior. At 14.75˝, increasing refinement leads to less error, but the y{c locationof the vortex seems to be more accurate for refinement 3 than for refinement 4 at taps three through six.
V. Discussion and Conclusions
We have explored three different reduced-order methods to predict Cp for both simple and complexairfoils at varying angles of attack, including high angles of attack where flow separation occurs. Our resultsindicate that the two local reduced-order models – the Kriging and localized SVD models – perform betterthan the global SVD model. Both Kriging and localized SVD perform better than SVD regardless of thegeometrical complexity, indicating that local methods are preferable when dealing with multiple flow regimes,such as those considered here pre- and post-flow separation. Figure 5 provides strong indication that thereis a preference for using a local method with a simple geometry and Figure 10 indicates the same for morecomplex geometries, although not as strongly. It is also interesting to note the differences between thepredictions of the two local methods for the NACA64A006 wing, with one predicting the location of thevortex, and the other predicting the amplitude.
Accuracy is worse for the more complex geometry, especially after the flow separates. The NACA64A06geometry results in a distinctly different flow pattern after separation, as seen in Figure 6. Subsequently, ourmodels had a more difficult time predicting flow characteristics than for the separated flow in the NACA0012
13 of 18
American Institute of Aeronautics and Astronautics
Dow
nloa
ded
by U
NIV
ER
SIT
Y O
F C
OL
OR
AD
O B
OU
LD
ER
on
July
7, 2
016
| http
://ar
c.ai
aa.o
rg |
DO
I: 1
0.25
14/6
.201
6-43
25

Angle of Attack2 4 6 8 10 12 14 16 18 20
MeanErrorPercent
2
4
6
8 Refinement 1
Refinement 2
Refinement 3
Refinement 4
(a) Model convergence at tap 1
Angle of Attack2 4 6 8 10 12 14 16 18 20
MeanErrorPercent
1
2
3
4
5
6
7
8
9Refinement 1
Refinement 2
Refinement 3
Refinement 4
(b) Model convergence at tap 3
Angle of Attack2 4 6 8 10 12 14 16 18 20
MeanErrorPercent
2
4
6
8Refinement 1
Refinement 2
Refinement 3
Refinement 4
(c) Model convergence at tap 4
Angle of Attack2 4 6 8 10 12 14 16 18 20
MeanErrorPercent
1
2
3
4
Refinement 1
Refinement 2
Refinement 3
Refinement 4
(d) Model convergence at tap 5
Angle of Attack2 4 6 8 10 12 14 16 18 20
MeanErrorPercent
0.5
1
1.5
2
2.5
3
3.5
4
4.5
5 Refinement 1
Refinement 2
Refinement 3
Refinement 4
(e) Model convergence at tap 6
Angle of Attack2 4 6 8 10 12 14 16 18 20
MeanErrorPercent
1
2
3
4
5Refinement 1
Refinement 2
Refinement 3
Refinement 4
(f) Model convergence at tap 7
Angle of Attack2 4 6 8 10 12 14 16 18 20
MeanErrorPercent
0.5
1
1.5
2
2.5
3
3.5
4Refinement 1
Refinement 2
Refinement 3
Refinement 4
(g) Model convergence at tap 8
Figure 12: Error convergence as uniform refinement increases at each tap for the NACA64A006. Errorreduces with each refinement below 11˝, but fails to reduce significantly for angles of attack above 11˝.Additionally taps nearer the front of the wing have a slightly higher error at higher angles of attack thanthe taps further down.
14 of 18
American Institute of Aeronautics and Astronautics
Dow
nloa
ded
by U
NIV
ER
SIT
Y O
F C
OL
OR
AD
O B
OU
LD
ER
on
July
7, 2
016
| http
://ar
c.ai
aa.o
rg |
DO
I: 1
0.25
14/6
.201
6-43
25

(a) CFD results at four angles of attack. (b) Kriging results at four angles of attack.
Figure 13: CFD and Kriging model results at four closely spaced angles of attack on the NACA64A006.The Cp results from CFD vary much more than the Kriging results over the same set of angles. This leadsto a higher error in regions where the flow varies drastically between closely spaced angles of attack as theKriging model does not account for rapid fluctuations.
case. This increased difficulty resulted in larger errors for all three methods, particularly in the right half ofthe domain; i.e., for higher angles of attack. While their performance remained similar, Kriging performedbetter over most of the domain, only spiking at 14.5˝, with localized SVD consistently slightly above theKriging error outside of the spike. This is a different behavior than we see in the simpler geometry wherelocalized SVD and Kriging are almost indistinguishable at most angles of attack. These differences couldlikely be reduced by tuning the λ parameter in the localized SVD model. The fact that Kriging and localizedSVD perform very similarly indicates that the locality of a reduced-order model is more important than thespecific mathematics underlying a particular implementation.
Overall, the two local methods, Kriging and localized SVD, provide the best performance, with Krigingperhaps slightly preferable on more complex geometries where the accuracy of both methods is reducedcompared to that for the simpler geometry. The accuracy of all methods reduces after separation occurs, andadding additional angles to the model only improves accuracy up to around 3% error after separation occurswith the NACA64A006. Our results indicate that going beyond half degree uniform angle separation wouldyield little improvement, however better results may be obtained if a nonuniform refinement is considered.
Acknowledgements
This work was performed under Cooperative Agreement FA7000-16-2-0003 with the US Air Force Academy,with financial support coming from the US DoD High Performance Computing Modernization Program.
References
1Ghoreyshi, M., Badcock, K., and Woodgate, M., “Accelerating the numerical generation of aerodynamic models for flightsimulation,” Journal of Aircraft , Vol. 46, No. 3, 2009, pp. 972–980.
2Ghoreyshi, M., Badcock, K., Ronch, A. D., Marques, S., Swift, A., and Ames, N., “Framework for establishing limits oftabular aerodynamic models for flight dynamics analysis,” Journal of Aircraft , Vol. 48, No. 1, 2011, pp. 42–55.
3Da Ronch, A., Ghoreyshi, M., and Badcock, K., “On the generation of flight dynamics aerodynamic tables by computa-tional fluid dynamics,” Progress in Aerospace Sciences, Vol. 47, No. 8, 2011, pp. 597–620.
4Constantine, P. G., Doostan, A., Wang, Q., and Iaccarino, G., “A Surrogate Accelerated Bayesian Inverse Analysis ofthe HyShot II Flight Data,” AIAA Paper 2011-2037, 2011.
5Vallespin, D., Badcock, K., Da Ronch, A., White, M., Perfect, P., and Ghoreyshi, M., “Computational fluid dynamicsframework for aerodynamic model assessment,” Progress in Aerospace Sciences, Vol. 52, 2012, pp. 2–18.
6Laurenceau, J. and Sagaut, P., “Building efficient response surfaces of aerodynamic functions with kriging and cokriging,”AIAA Journal , Vol. 46, No. 2, 2008, pp. 498–507.
7Han, Z.-H., Zimmermann, R., and Gortz, S., “A New Cokriging Method for Variable-Fidelity Surrogate Modeling ofAerodynamic Data,” AIAA Paper 2010-1225, 2010.
15 of 18
American Institute of Aeronautics and Astronautics
Dow
nloa
ded
by U
NIV
ER
SIT
Y O
F C
OL
OR
AD
O B
OU
LD
ER
on
July
7, 2
016
| http
://ar
c.ai
aa.o
rg |
DO
I: 1
0.25
14/6
.201
6-43
25

8Toal, D. J. and Keane, A. J., “Efficient multipoint aerodynamic design optimization via cokriging,” Journal of Aircraft ,Vol. 48, No. 5, 2011, pp. 1685–1695.
9Ghoreyshi, M., Cummings, R. M., Ronch, A. D., and Badcock, K. J., “Transonic aerodynamic load modeling of X-31Aircraft Pitching Motions,” AIAA Journal , Vol. 51, No. 10, 2013, pp. 2447–2464.
10Ghoreyshi, M., Jirasek, A., and Cummings, R. M., “Reduced order unsteady aerodynamic modeling for stability andcontrol analysis using computational fluid dynamics,” Progress in Aerospace Sciences, Vol. 71, 2014, pp. 167–217.
11Skujins, T. and Cesnik, C. E., “Reduced-Order Modeling of Unsteady Aerodynamics Across Multiple Mach Regimes,”Journal of Aircraft , Vol. 51, No. 6, 2014, pp. 1681–1704.
12Lillian, C., Morton, S., and McDaniel, D., “Aircraft Loads Characteristics Determined by System Identification andProper Orthogonal Decomposition of CFD Simulations,” AIAA Paper 2010-4368, 2010.
13Dean, J. P., Morton, S. A., McDaniel, D. R., Clifton, J. D., and Bodkin, D. J., “Aircraft Stability and Control Charac-teristics Determined by System Identification of CFD Simulations,” AIAA Paper 2008-6378, 2008.
14Kirkpatrick, K., May Jr, J., and Valasek, J., “Aircraft system identification using artificial neural networks,” AIAA Paper2013-0878, 2013.
15Ignatyev, D. I. and Khrabrov, A. N., “Neural network modeling of unsteady aerodynamic characteristics at high anglesof attack,” Aerospace Science and Technology, Vol. 41, 2015, pp. 106–115.
16Wang, Q., Qian, W., and He, K., “Unsteady aerodynamic modeling at high angles of attack using support vectormachines,” Chinese Journal of Aeronautics, Vol. 28, No. 3, 2015, pp. 659–668.
17Kou, J. and Zhang, W., “An approach to enhance the generalization capability of nonlinear aerodynamic reduced-ordermodels,” Aerospace Science and Technology, Vol. 49, 2016, pp. 197–208.
18Raveh, D. E. and Zaide, A., “Numerical simulation and reduced-order modeling of airfoil gust response,” AIAA Journal ,Vol. 44, No. 8, 2006, pp. 1826–1834.
19Morelli, E. A., “System identification Programs for aircraft (SIDPAC),” AIAA Paper 2002-4704, 2002.20Grismer, M. J., Strang, W. Z., Tomaro, R. F., and Witzeman, F. C., “Cobalt: A parallel, implicit, unstructured
Euler/Navier–Stokes solver,” Advances in Engineering Software, Vol. 29, No. 3, 1998, pp. 365–373.21Jacobs, E. N., Ward, K. E., and Pinkerton, R. M., “The characteristics of 78 related airfoil sections from tests in the
variable-density wind tunnel,” NACA, Report No. 460, 1935.22McCulloughand, G. B. and Gault, D. E., “Boundary-layer and stalling characteristics of the NACA 64A006 airfoil
section,” NACA, Technical Note 1923, 1949.23Hovelmann, A., Grawunder, M., Buzica, A., and Breitsamter, C., “Experimental Analyses on the Flow Field Character-
istics of the AVT-183 Diamond Wing Configuration,” AIAA Paper 2015-0064, 2015.24Ghoreyshi, M., Jirasek, A., and Cummings, R. M., “Computational Investigation into the Use of Response Functions for
Aerodynamic-Load Modeling,” AIAA Journal , Vol. 50, No. 6, 2012, pp. 1314–1327.25Ghoreyshi, M., Ryszka, K. J., Cummings, R. M., and Lofthouse, A. J., “Vortical Flow Prediction of the AVT-183 Diamond
Wing,” AIAA Paper 2015-0292, 2015.26Lophaven, S. N., Nielsen, H. B., and Søndergaard, J., “DACE-A Matlab Kriging toolbox, Version 2.0,” Technical Report
IMM-TR-2002-12, 2002.
16 of 18
American Institute of Aeronautics and Astronautics
Dow
nloa
ded
by U
NIV
ER
SIT
Y O
F C
OL
OR
AD
O B
OU
LD
ER
on
July
7, 2
016
| http
://ar
c.ai
aa.o
rg |
DO
I: 1
0.25
14/6
.201
6-43
25
y/c0 0.2 0.4 0.6 0.8 1
Cp
-0.6
-0.4
-0.2
0
0.2
CFD
Refinement 1
Refinement 2
Refinement 3
Refinement 4
(a) Tap 1
y/c0 0.2 0.4 0.6 0.8 1
Cp
-1
-0.8
-0.6
-0.4
-0.2
0
0.2
CFD
Refinement 1
Refinement 2
Refinement 3
Refinement 4
(b) Tap 3
y/c0 0.2 0.4 0.6 0.8 1
Cp
-1
-0.8
-0.6
-0.4
-0.2
0
0.2
CFD
Refinement 1
Refinement 2
Refinement 3
Refinement 4
(c) Tap 4
y/c0 0.2 0.4 0.6 0.8 1
Cp
-1
-0.8
-0.6
-0.4
-0.2
0
0.2
CFD
Refinement 1
Refinement 2
Refinement 3
Refinement 4
(d) Tap 5
y/c0 0.2 0.4 0.6 0.8 1
Cp
-1.2
-1
-0.8
-0.6
-0.4
-0.2
0
0.2
CFD
Refinement 1
Refinement 2
Refinement 3
Refinement 4
(e) Tap 6
y/c0 0.2 0.4 0.6 0.8 1
Cp
-1.5
-1
-0.5
0
CFD
Refinement 1
Refinement 2
Refinement 3
Refinement 4
(f) Tap 7
y/c0 0.2 0.4 0.6 0.8 1
Cp
-1.5
-1
-0.5
0
CFD
Refinement 1
Refinement 2
Refinement 3
Refinement 4
(g) Tap 8
Figure 14: Cp plots at an angle of attack of 3.7˝ for each of the refinements at each of the taps. The CFDresults are shown as a blue line, refinement 1 as red ¨’s, refinement 2 as yellow ˝, refinement 3 as purple˚’s, and refinement 4 as green ˝’s. At this low angle of attack we see fairly good agreement by the fourthrefinement at all taps.
17 of 18
American Institute of Aeronautics and Astronautics
Dow
nloa
ded
by U
NIV
ER
SIT
Y O
F C
OL
OR
AD
O B
OU
LD
ER
on
July
7, 2
016
| http
://ar
c.ai
aa.o
rg |
DO
I: 1
0.25
14/6
.201
6-43
25

y/c0 0.2 0.4 0.6 0.8 1
Cp
-4
-3
-2
-1
0
CFD
Refinement 1
Refinement 2
Refinement 3
Refinement 4
(a) Tap 1
y/c0 0.2 0.4 0.6 0.8 1
Cp
-3.5
-3
-2.5
-2
-1.5
-1
-0.5
0
CFD
Refinement 1
Refinement 2
Refinement 3
Refinement 4
(b) Tap 3
y/c0 0.2 0.4 0.6 0.8 1
Cp
-3.5
-3
-2.5
-2
-1.5
-1
-0.5
0
CFD
Refinement 1
Refinement 2
Refinement 3
Refinement 4
(c) Tap 4
y/c0 0.2 0.4 0.6 0.8 1
Cp
-2
-1.5
-1
-0.5
0
CFD
Refinement 1
Refinement 2
Refinement 3
Refinement 4
(d) Tap 5
y/c0 0.2 0.4 0.6 0.8 1
Cp
-1.5
-1
-0.5
0
CFD
Refinement 1
Refinement 2
Refinement 3
Refinement 4
(e) Tap 6
y/c0 0.2 0.4 0.6 0.8 1
Cp
-1.2
-1
-0.8
-0.6
-0.4
-0.2
0
0.2
CFD
Refinement 1
Refinement 2
Refinement 3
Refinement 4
(f) Tap 7
y/c0 0.2 0.4 0.6 0.8 1
Cp
-1
-0.8
-0.6
-0.4
-0.2
0
0.2
CFD
Refinement 1
Refinement 2
Refinement 3
Refinement 4
(g) Tap 8
Figure 15: Cp plots at an angle of attack of 14.75˝ for each of the refinements at each of the taps. The CFDresults are shown as a blue line, refinement 1 as red ¨’s, refinement 2 as yellow ˝, refinement 3 as purple ˚’s,and refinement 4 as green ˝’s. With increasing refinement we see the model more closely matches the CFDresults, however it never lines up perfectly at this high of an angle of attack. We also see worse agreementat taps 3 and 4 than the others.
18 of 18
American Institute of Aeronautics and Astronautics
Dow
nloa
ded
by U
NIV
ER
SIT
Y O
F C
OL
OR
AD
O B
OU
LD
ER
on
July
7, 2
016
| http
://ar
c.ai
aa.o
rg |
DO
I: 1
0.25
14/6
.201
6-43
25