Embed Size (px)
Citation preview
ORIGINAL PAPER
Evaluation of ready-to-use SMLS and DWS devices to studyacid-induced milk gel changes and syneresis
Anne Rohart1 & Camille Michon1&
Jérôme Confiac1 & Véronique Bosc1
Received: 17 July 2015 /Revised: 27 January 2016 /Accepted: 15 February 2016 /Published online: 9 March 2016# INRA and Springer-Verlag France 2016
Abstract The aim of this study was to examine the potential of ready-to-usemulti-speckle diffusing wave spectroscopy (MS-DWS) and static multiple lightscattering (SMLS) devices to follow the acid-induced gelation of milk, as wellas to detect the appearance of gel syneresis. These light-scattering techniques,MS-DWS and SMLS, have been used in comparison to the classical rheology tostudy acid milk gel formation and syneresis detection. A systematic study of theeffects of heat treatment of milk on the formation of acid gels was conducted.Results obtained by DWS and rheology showed excellent correlation in goodagreement with the existence of a link between particle dynamics measured byDWS and the macroscopic viscoelastic response of the gel. Moreover, both lightscattering techniques showed ability to detect gel shrinkage due to their highsensitivity to particle mobility. DWS allowed evidencing wheying-off along thetubes’ glass walls, while SMLS performed well in detecting syneresis on gelsurface or confined in localized zones of the glass walls. The results werediscussed in light of a proposed model considering gel syneresis as regards ofgel properties. Light-scattering techniques proved to be very efficient tools todetect syneresis in acid milk gels and thus can be of great interest in preventingthis mechanism.
Keywords Gelation . Rheological properties . DWS . Syneresis
Dairy Sci. & Technol. (2016) 96:459–475DOI 10.1007/s13594-016-0281-6
* Camille [email protected]
1 UMR Ingénierie Procédés Aliments, AgroParisTech, Inra, Université Paris-Saclay, F-91300 Massy,France

1 Introduction
The behaviour of acid milk gels has been a topic of interest for a long time, likely fortheir great economic importance in the dairy industry. The process of acid-induced milkgelation results from the destabilization of colloidal particles (the casein micelles) andleads to a network of casein strands aggregated through isoelectric precipitation(Heertje et al. 1985; Lucey et al. 1997a). The pH reduction can be simulated by theuse of glucono-δ-lactone which mimics the acidification kinetics obtained with bacte-rial culture (Lucey et al. 1998a).
In practice, heat treatment is generally applied to milk for safety reasons. However, ithas a marked influence on rheology, microstructure and gel syneresis (Livney et al.2003). It is well-established that milk heating causes a denaturation of the wheyproteins and their partial attachments to the casein micelles which participate to thegel network formation (Donato and Guyomarc’h 2009; Famelart et al. 2004;Guyomarc’h et al. 2003). As a result, the strength and number of bonds betweenprotein particles increased, leading to increased storage modulus, G′, values comparedto gels made from unheated milk (Lucey et al. 1999).
Studies on milk acidification are mainly performed using rheology, microscopyor conventional light scattering techniques (Gastaldi et al. 1996; Lucey et al.1997b). Later on, diffusing wave spectroscopy (DWS) has been extensively usedin a number of laboratories to easily determine the structure in situ during theevolution of the system without disturbing the sample or needing a dilution(Corredig and Alexander 2008; Horne 1999; Nicolai 2007). Nevertheless, itshould be noted that most of the studies concerned only the earliest stages of acidgelation and did not cover structure changes such as network rearrangements inmature gels which can lead to whey expulsion (Alexander and Dalgleish 2007;Hemar et al. 2004).
Syneresis, apart from being considered as a quality defect in the production of setyoghurts, certainly causes problems in the study of acid gelation as regards therheological characteristics because of gel slippage. In that case, the decrease in thedynamic moduli during ageing of the gels is mainly the result of spontaneouswheying-off due to the loss of the ability of the gel to entrap all of the serum phase(Aichinger et al. 2003; Haque et al. 2001; van Vliet et al. 2004a; Xu et al. 2008).Although numerous empirical methods have been developed to quantify spontane-ous whey separation in set gels such as whey determination by siphon, drainage andcentrifugation (Aichinger et al. 2003; Lucey et al. 1998b), no systematic techniquehas been used so far to detect the appearance of syneresis during the acidificationprocess.
The objective of the current study was to investigate the potential of ready-to-usemulti-speckle diffusing wave spectroscopy in backscattering mode (MS-DWS) andstatic multiple light scattering (SMLS) devices to monitor the acid-induced gelation ofmilk, as well as to detect the appearance of gel syneresis. For this purpose, a multi-technique approach was used to highlight the contribution of the light scatteringtechniques, compared to rheological measurements, to study acid-induced gels madefrom milk previously heated at various temperatures. Syneresis detection by lightscattering techniques was discussed on the basis of the understanding of the structuraldifferences between the gels.
460 A. Rohart et al.
2 Materials and methods
2.1 Preparation of the gels
Skim milk with 46 g.kg−1 protein was reconstituted by dispersing low-heat skim milkpowder (CH low heat, Ingredia, Arras, France) in Milli-Q water under continuousstirring for 1 h at room temperature. The reconstituted skim milk was then left to fullyhydrate overnight at 4 °C. Heat treatment of the milk, when necessary, was performedin a water bath at 70, 80 or 90 °C for 7 min, followed by immediate cooling at 43 °C.
Milk acidification was achieved by the addition of 1.25 wt% glucono-δ-lactone(GDL) (Sigma Chemicals, St Louis, MO, USA) at a temperature of 43 °C with stirring.Stirring was continued for one minute, after which aliquots were transferred to theDWS and SMLS cells and to the rheometer cup where their behaviours duringacidification were monitored. The pH decline was followed in the meantime using apH-meter Consort D130 multiparameter analyzer (Turnhout, Belgium). Plots of themeasured pH against time for three repeated runs were averaged and analyzed in orderto provide interpolated pH values for all the experimentally-measured points in theDWS and SMLS instruments and rheometer. When a pH value of 4.6 (±0.05) wasobtained, the set acid milk gels were immediately stored at 4 °C overnight untilrequired analysis. Proportion of set acid milk gels at pH 4.6 that were subjected tosyneresis were calculated from 12 samples for acid milk gels from unheated milk ormilk heat-treated at 70 or 90 °C and 27 samples for acid milk gels from milk heat-treated at 80 °C.
2.2 Instrumental characterization
2.2.1 Static multiple light scattering (SMLS) measurements
Measurements were carried out using a Turbiscan LAB® and a Turbiscan ClassicMA 2000® instruments (Formulaction, France). Turbiscan LAB®, which isthermostated, was used to follow milk acidification; whereas Turbiscan ClassicMA 2000® was used to detect syneresis during milk gelation. Both devices arebased on the same principle.
Backscattering values at 880 nm (Turbiscan LAB®) and 850 nm (Turbiscan ClassicMA 2000®) were acquired every 40 μm along a 40 mm height of sample at differenttime intervals. The backscattering profile intensity along the sample height gives aqualitative indication of the particle sizes and concentrations. It therefore allows thedetection of the evolution of the distribution and movements of the particles. Then, thisready-to-use device allows calculating the photon transport mean free path l*, which isinversely proportional to the square root of the backscattering intensity value. The valueof l* depends on particle diameter and phase volume (Eq. 1) (Mengual et al. 1999).
l* d; ϕð Þ ¼ 2d
3ϕ 1−gð ÞQs ð1Þ
With d the particle mean diameter, ϕ the phase volume, g the asymmetry factor andQs the scattering efficiency factor arising from Mie theory.
Gelation and syneresis detection in acid gels 461
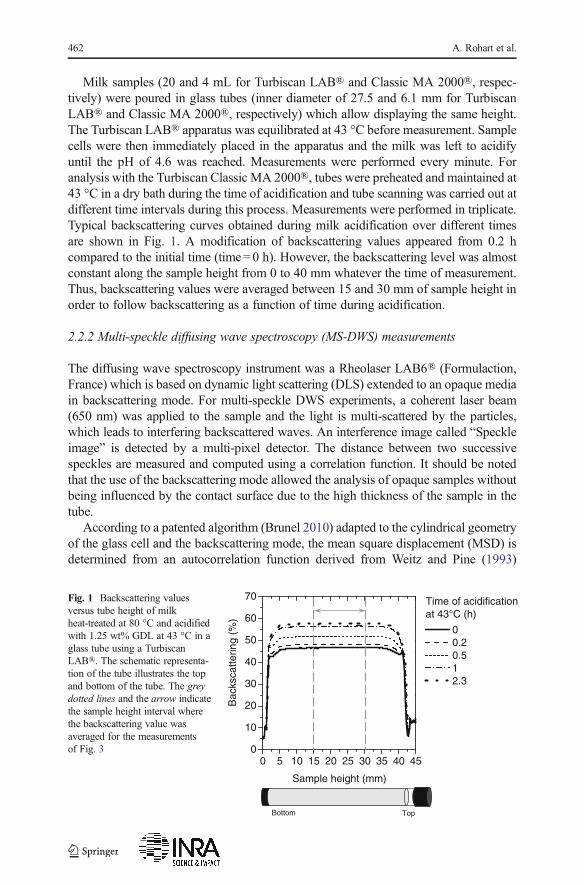
Milk samples (20 and 4 mL for Turbiscan LAB® and Classic MA 2000®, respec-tively) were poured in glass tubes (inner diameter of 27.5 and 6.1 mm for TurbiscanLAB® and Classic MA 2000®, respectively) which allow displaying the same height.The Turbiscan LAB® apparatus was equilibrated at 43 °C before measurement. Samplecells were then immediately placed in the apparatus and the milk was left to acidifyuntil the pH of 4.6 was reached. Measurements were performed every minute. Foranalysis with the Turbiscan Classic MA 2000®, tubes were preheated and maintained at43 °C in a dry bath during the time of acidification and tube scanning was carried out atdifferent time intervals during this process. Measurements were performed in triplicate.Typical backscattering curves obtained during milk acidification over different timesare shown in Fig. 1. A modification of backscattering values appeared from 0.2 hcompared to the initial time (time=0 h). However, the backscattering level was almostconstant along the sample height from 0 to 40 mm whatever the time of measurement.Thus, backscattering values were averaged between 15 and 30 mm of sample height inorder to follow backscattering as a function of time during acidification.
2.2.2 Multi-speckle diffusing wave spectroscopy (MS-DWS) measurements
The diffusing wave spectroscopy instrument was a Rheolaser LAB6® (Formulaction,France) which is based on dynamic light scattering (DLS) extended to an opaque mediain backscattering mode. For multi-speckle DWS experiments, a coherent laser beam(650 nm) was applied to the sample and the light is multi-scattered by the particles,which leads to interfering backscattered waves. An interference image called “Speckleimage” is detected by a multi-pixel detector. The distance between two successivespeckles are measured and computed using a correlation function. It should be notedthat the use of the backscattering mode allowed the analysis of opaque samples withoutbeing influenced by the contact surface due to the high thickness of the sample in thetube.
According to a patented algorithm (Brunel 2010) adapted to the cylindrical geometryof the glass cell and the backscattering mode, the mean square displacement (MSD) isdetermined from an autocorrelation function derived from Weitz and Pine (1993)
0 5 10 15 20 25 30 35 40 450
10
20
30
40
50
60
70 Time of acidification at 43°C (h)
0 0.2 0.5 1 2.3
Bac
ksca
tterin
g (%
)
Sample height (mm)
Bottom Top
Fig. 1 Backscattering valuesversus tube height of milkheat-treated at 80 °C and acidifiedwith 1.25 wt% GDL at 43 °C in aglass tube using a TurbiscanLAB®. The schematic representa-tion of the tube illustrates the topand bottom of the tube. The greydotted lines and the arrow indicatethe sample height interval wherethe backscattering value wasaveraged for the measurementsof Fig. 3
462 A. Rohart et al.

approach and depending on the turbidity. MSD of particles inside a media is directlylinked to the viscoelastic properties of the samples. Thus, measuring the particle MeanSquare Displacement (MSD) versus decorrelation time provides a viscoelastic param-eter, the elasticity index (EI) following Eq. 2.
EI ¼ 1
6δ2*ded
ð2Þ
where 6δ2 (nm2) is the mean value of MSD at low decorrelation times (<0.1 s), d (μm)is the mean particle diameter measured by laser diffraction and de the diameter of amodel particle used for calibration (TiO2) (de=1 μm).
This technique enables the detection of local particle mobility due to thermalagitation which is related to viscoelastic behaviour. Contrary to measurements carriedout with Turbiscan apparatus, the laser of the Rheolaser LAB6® analyzed the sampleonly at one height of 24 mm.
Elasticity Index (EI, nm−2) is computed from the elastic level of the MSD curves atshort decorrelation timescales, i.e. <0.1 s, and can be related to the solid-like behaviourof the sample. 20 mL of milk samples were poured at 43 °C in glass tubes (innerdiameter of 27.5 mm) and EI was followed as a function of time during acidificationuntil a pH of 4.6.
2.2.3 Rheological measurements
In addition to SMLS and MS-DWS experiments, rheological properties were alsocharacterized in parallel. Rheological measurements were carried out using aMCR301 stress-controlled rheometer (Anton Paar, Germany). The measurements wereperformed with a coaxial sand cylinder geometry (R1/R2=0.92) consisting of arotating inner cylinder with a 40 mm immersed height. After introducing the milksample into the measurement cell, a thin layer of low-viscosity silicone oil was appliedon the surface of the sample to prevent evaporation. The development of storagemodulus (G′) was monitored in the linear domain (1% strain) at a constant frequencyof 1 Hz at 43 °C until the pH of 4.6 was reached.
3 Results
3.1 Acidic gelation of milk
3.1.1 Study of the gelation process using DWS, SMLS and rheology
Typical mean square displacement (MSD) profiles versus decorrelation time obtainedby DWS of skim milk heated at 80 °C and gelled after addition of 1.25 wt% GDL areshown as a function of ageing time in Fig. 2a. The evolution of the MSD with ageing ischaracteristic of the changes in viscoelastic properties. Upon acidification, a decrease inthe levels of the MSD curves with acidification time (grey arrow, Fig. 2a) indicates achange in viscoelastic behaviour. At the beginning of the incubation time, MSD valuesincreased linearly with decorrelation time. As the acidification proceeded, the level and
Gelation and syneresis detection in acid gels 463
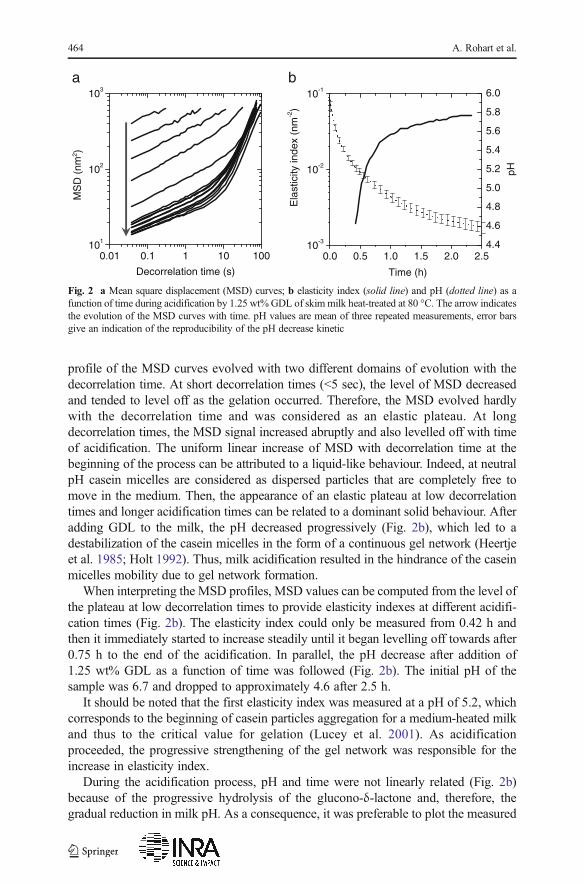
profile of the MSD curves evolved with two different domains of evolution with thedecorrelation time. At short decorrelation times (<5 sec), the level of MSD decreasedand tended to level off as the gelation occurred. Therefore, the MSD evolved hardlywith the decorrelation time and was considered as an elastic plateau. At longdecorrelation times, the MSD signal increased abruptly and also levelled off with timeof acidification. The uniform linear increase of MSD with decorrelation time at thebeginning of the process can be attributed to a liquid-like behaviour. Indeed, at neutralpH casein micelles are considered as dispersed particles that are completely free tomove in the medium. Then, the appearance of an elastic plateau at low decorrelationtimes and longer acidification times can be related to a dominant solid behaviour. Afteradding GDL to the milk, the pH decreased progressively (Fig. 2b), which led to adestabilization of the casein micelles in the form of a continuous gel network (Heertjeet al. 1985; Holt 1992). Thus, milk acidification resulted in the hindrance of the caseinmicelles mobility due to gel network formation.
When interpreting the MSD profiles, MSD values can be computed from the level ofthe plateau at low decorrelation times to provide elasticity indexes at different acidifi-cation times (Fig. 2b). The elasticity index could only be measured from 0.42 h andthen it immediately started to increase steadily until it began levelling off towards after0.75 h to the end of the acidification. In parallel, the pH decrease after addition of1.25 wt% GDL as a function of time was followed (Fig. 2b). The initial pH of thesample was 6.7 and dropped to approximately 4.6 after 2.5 h.
It should be noted that the first elasticity index was measured at a pH of 5.2, whichcorresponds to the beginning of casein particles aggregation for a medium-heated milkand thus to the critical value for gelation (Lucey et al. 2001). As acidificationproceeded, the progressive strengthening of the gel network was responsible for theincrease in elasticity index.
During the acidification process, pH and time were not linearly related (Fig. 2b)because of the progressive hydrolysis of the glucono-δ-lactone and, therefore, thegradual reduction in milk pH. As a consequence, it was preferable to plot the measured
0.0 0.5 1.0 1.5 2.0 2.510-3
10-2
10-1
pH
Ela
stic
ity in
dex
(nm
-2)
Time (h)
4.4
4.6
4.8
5.0
5.2
5.4
5.6
5.8
6.0
0.01 0.1 1 10 100101
102
103
MS
D (
nm2 )
Decorrelation time (s)
ba
Fig. 2 a Mean square displacement (MSD) curves; b elasticity index (solid line) and pH (dotted line) as afunction of time during acidification by 1.25 wt%GDL of skim milk heat-treated at 80 °C. The arrow indicatesthe evolution of the MSD curves with time. pH values are mean of three repeated measurements, error barsgive an indication of the reproducibility of the pH decrease kinetic
464 A. Rohart et al.
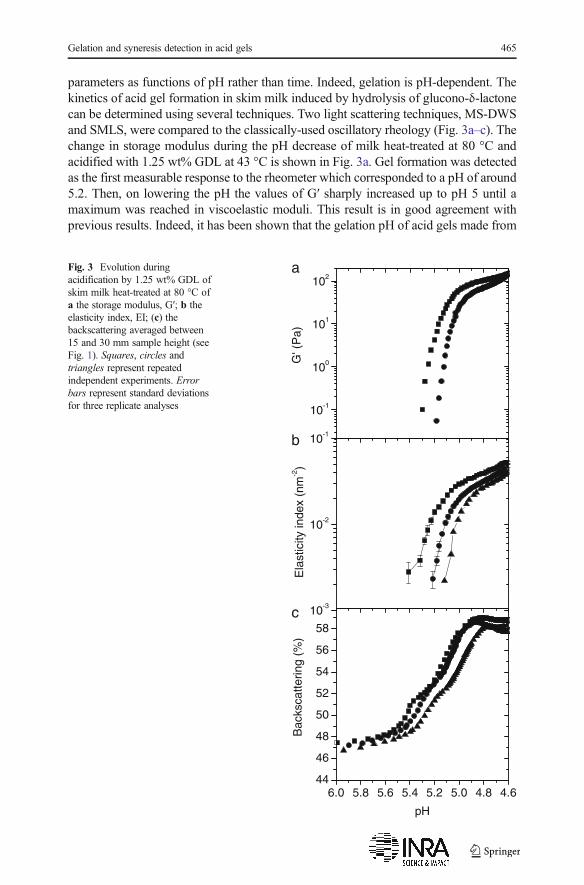
parameters as functions of pH rather than time. Indeed, gelation is pH-dependent. Thekinetics of acid gel formation in skim milk induced by hydrolysis of glucono-δ-lactonecan be determined using several techniques. Two light scattering techniques, MS-DWSand SMLS, were compared to the classically-used oscillatory rheology (Fig. 3a–c). Thechange in storage modulus during the pH decrease of milk heat-treated at 80 °C andacidified with 1.25 wt% GDL at 43 °C is shown in Fig. 3a. Gel formation was detectedas the first measurable response to the rheometer which corresponded to a pH of around5.2. Then, on lowering the pH the values of G′ sharply increased up to pH 5 until amaximum was reached in viscoelastic moduli. This result is in good agreement withprevious results. Indeed, it has been shown that the gelation pH of acid gels made from
10-3
10-2
10-1
Ela
stic
ity in
dex
(nm
-2)
10-1
100
101
102
G' (
Pa)
6.0 5.8 5.6 5.4 5.2 5.0 4.8 4.644
46
48
50
52
54
56
58
Bac
ksca
tterin
g (%
)
pH
a
b
c
Fig. 3 Evolution duringacidification by 1.25 wt% GDL ofskim milk heat-treated at 80 °C ofa the storage modulus, G′; b theelasticity index, EI; (c) thebackscattering averaged between15 and 30 mm sample height (seeFig. 1). Squares, circles andtriangles represent repeatedindependent experiments. Errorbars represent standard deviationsfor three replicate analyses
Gelation and syneresis detection in acid gels 465

medium-heated milk was around 5.2, and it was followed by abrupt changes in theslopes of the G′ versus pH curves (Lucey et al. 1998a; Xu et al. 2008).
The evolution of elasticity indexes calculated from MSD curves obtained by MS-DWS technique followed the same pattern (Fig. 3b). There was found a drastic increasefrom pH 5.2 followed by a more progressive increase in elasticity index at the end ofacidification. It should be reminded that repeatability, which is represented by the errorbars, was obtained for three replicate analyses whereas reproducibility was obtained forthree separate gel manufactures. Thus, it is interesting to observe that reproducibility ofgel manufacture was difficult to achieve accurately, although repeatability of MS-DWSmeasurements was satisfactory. As for rheological experiments, no measurable re-sponse could be obtained before reaching pH 5.2. Indeed, the charged couple device(CCD) could not numerically calculate the multi-speckle correlation function at thevery beginning of the acidification process because of the simultaneous detection of atoo-large number of speckles (Corredig and Alexander 2008). The changes in thespeckle image with time were too quick to be collected by the multi-pixel detector(CCD camera, 27 Hz). Complementary analyses have shown that measurements couldbe recorded from the beginning of the experiment using an upgraded device with afaster recording system (data not shown).
Another light scattering technique which is based on static multiple light scatteringwas used to follow the acid milk gelation with the measurement of backscatteringvalues (Figs. 1 and 3c). Little change was observed in the backscattering values untilthe pH had decreased to about 5.5–5.4, after which there was a substantial increase untilthe value peak reached a maximum. Then, the backscattering values decreased some-what before becoming constant below pH 4.8. As for the measurement of the elasticityindex (Fig. 3b), the slight shift observed between the backscattering curves was due tothe variability of gel manufacture. However, it is important to note that a shoulderbetween pH 5.4 and 5.2 was observed using SMLS for the three repeated gels.
It is of interest to compare the contribution of each technique to the analysis of themechanism of acid milk gel formation. Backscattering values from SMLS signalsshowed unusual trends between pH 5.4 and 5.2 with a shoulder. This tendency hasbeen observed by Ercili-Cura et al. (2013) and it can be related to a change in caseinmicelles in the range 5.5 to 5.0 with regard to the onset of protein aggregation. Whenapproaching the isoelectric point of the caseins, their solubility decreases leading to anassociation and a subsequent aggregation at about pH 5.2–5.0. These mechanismsinduced a change in optical properties.
The gelation point close to pH 5.2 obtained by rheology (Fig. 3a) was very similar tothe one obtained by DWS measurements (Fig. 3b), which is consistent with theliterature (Horne et al. 2003). In rheology, the transition from liquid to solid isclassically indicated by the crossover where G′ becomes greater than G′, and thus aself-supporting network is formed. Considering DWS measurements, the sign ofgelling mechanism was evidenced by the hindering and ultimately halting of particlemotion (Alexander and Dalgleish 2007; Horne et al. 2003; Stradner et al. 2001).Therefore, even if DWS is much more sensitive to the dynamics of the particles thanmacrorheology, these two techniques showed similar behaviours at the beginning of gelformation. Nevertheless, compared to rheometers, DWS and SMLS are non-destructivetechniques. Rheological measurements are performed by applying a mechanical stressor deformation to follow the development of the gel (Alexander and Dalgleish 2007;
466 A. Rohart et al.
Hemar et al. 2004; Nicolai 2007). When studying fragile systems such as milk proteingels, it is likely that the aggregation of the casein micelles is slightly modified by themechanical forces. Therefore, even if DWS and SMLS have already been used to studygelation, the DWS and SMLS ready-to-use devices were able to analyze the earlystages of milk acidification with changes in casein micelles before gelation occurs.
3.1.2 Correlation between DWS and rheology: effect of heat treatment
It has been widely reported that milk preheating plays a major role on the structuredevelopment and rheological properties of yoghurt gels (Lucey et al. 1999). Therefore,the effects of the heat treatment of milk were studied using both classical rheology andMS-DWS (Figs. 4 and 5) in order to determine if results from both techniques werecorrelated.
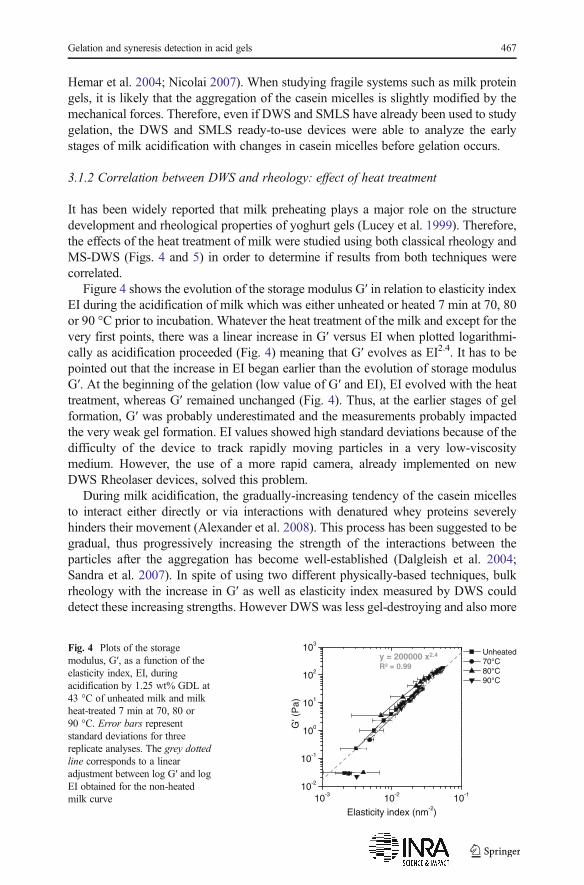
Figure 4 shows the evolution of the storage modulus G′ in relation to elasticity indexEI during the acidification of milk which was either unheated or heated 7 min at 70, 80or 90 °C prior to incubation. Whatever the heat treatment of the milk and except for thevery first points, there was a linear increase in G′ versus EI when plotted logarithmi-cally as acidification proceeded (Fig. 4) meaning that G′ evolves as EI2.4. It has to bepointed out that the increase in EI began earlier than the evolution of storage modulusG′. At the beginning of the gelation (low value of G′ and EI), EI evolved with the heattreatment, whereas G′ remained unchanged (Fig. 4). Thus, at the earlier stages of gelformation, G′ was probably underestimated and the measurements probably impactedthe very weak gel formation. EI values showed high standard deviations because of thedifficulty of the device to track rapidly moving particles in a very low-viscositymedium. However, the use of a more rapid camera, already implemented on newDWS Rheolaser devices, solved this problem.
During milk acidification, the gradually-increasing tendency of the casein micellesto interact either directly or via interactions with denatured whey proteins severelyhinders their movement (Alexander et al. 2008). This process has been suggested to begradual, thus progressively increasing the strength of the interactions between theparticles after the aggregation has become well-established (Dalgleish et al. 2004;Sandra et al. 2007). In spite of using two different physically-based techniques, bulkrheology with the increase in G′ as well as elasticity index measured by DWS coulddetect these increasing strengths. However DWS was less gel-destroying and also more
10-3 10-2 10-110-2
10-1
100
101
102
103
Unheated 70°C 80°C 90°C
G' (
Pa)
Elasticity index (nm-2)
y = 200000 x2.4
R² = 0.99
Fig. 4 Plots of the storagemodulus, G′, as a function of theelasticity index, EI, duringacidification by 1.25 wt% GDL at43 °C of unheated milk and milkheat-treated 7 min at 70, 80 or90 °C. Error bars representstandard deviations for threereplicate analyses. The grey dottedline corresponds to a linearadjustment between log G′ and logEI obtained for the non-heatedmilk curve
Gelation and syneresis detection in acid gels 467
sensitive than rheology in the early stages of gel formation. This could be explained bythe macroscopic nature of rheology, where all the components of the system areinvolved in the network. On the contrary, DWS may detect the change in particle size,i.e. voluminosity of casein micelles during the very early stages of acidification whichis not detected by traditional rheometry (Alexander and Dalgleish 2007; Alexanderet al. 2008).
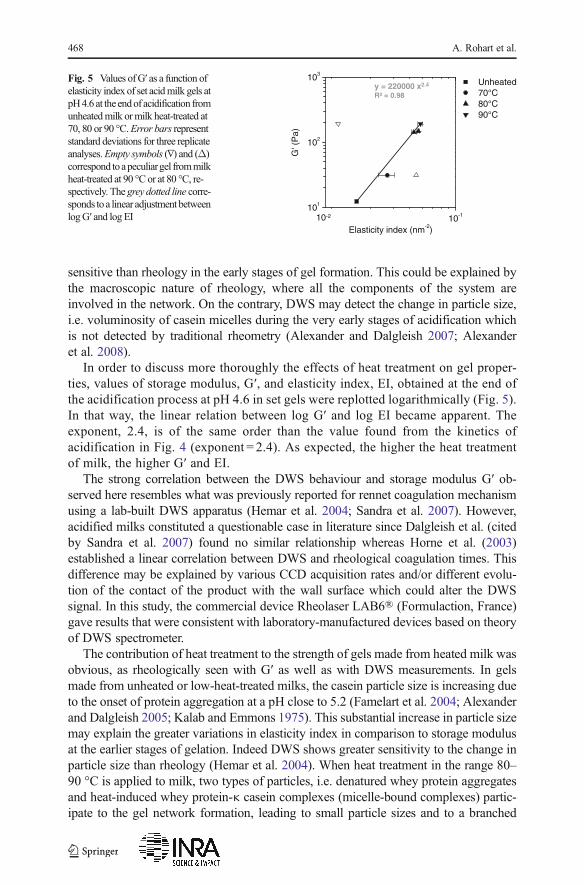
In order to discuss more thoroughly the effects of heat treatment on gel proper-ties, values of storage modulus, G′, and elasticity index, EI, obtained at the end ofthe acidification process at pH 4.6 in set gels were replotted logarithmically (Fig. 5).In that way, the linear relation between log G′ and log EI became apparent. Theexponent, 2.4, is of the same order than the value found from the kinetics ofacidification in Fig. 4 (exponent = 2.4). As expected, the higher the heat treatmentof milk, the higher G′ and EI.
The strong correlation between the DWS behaviour and storage modulus G′ ob-served here resembles what was previously reported for rennet coagulation mechanismusing a lab-built DWS apparatus (Hemar et al. 2004; Sandra et al. 2007). However,acidified milks constituted a questionable case in literature since Dalgleish et al. (citedby Sandra et al. 2007) found no similar relationship whereas Horne et al. (2003)established a linear correlation between DWS and rheological coagulation times. Thisdifference may be explained by various CCD acquisition rates and/or different evolu-tion of the contact of the product with the wall surface which could alter the DWSsignal. In this study, the commercial device Rheolaser LAB6® (Formulaction, France)gave results that were consistent with laboratory-manufactured devices based on theoryof DWS spectrometer.
The contribution of heat treatment to the strength of gels made from heated milk wasobvious, as rheologically seen with G′ as well as with DWS measurements. In gelsmade from unheated or low-heat-treated milks, the casein particle size is increasing dueto the onset of protein aggregation at a pH close to 5.2 (Famelart et al. 2004; Alexanderand Dalgleish 2005; Kalab and Emmons 1975). This substantial increase in particle sizemay explain the greater variations in elasticity index in comparison to storage modulusat the earlier stages of gelation. Indeed DWS shows greater sensitivity to the change inparticle size than rheology (Hemar et al. 2004). When heat treatment in the range 80–90 °C is applied to milk, two types of particles, i.e. denatured whey protein aggregatesand heat-induced whey protein-κ casein complexes (micelle-bound complexes) partic-ipate to the gel network formation, leading to small particle sizes and to a branched
10-1101
102
103
Unheated 70°C 80°C 90°C
G' (
Pa)
Elasticity index (nm-2)10-2
y = 220000 x2.4
R² = 0.98
Fig. 5 Values ofG′ as a function ofelasticity index of set acidmilk gels atpH4.6 at the endof acidification fromunheatedmilk ormilk heat-treated at70, 80 or 90 °C.Error bars representstandard deviations for three replicateanalyses.Empty symbols (∇) and (Δ)correspond toapeculiargel frommilkheat-treated at 90 °C or at 80 °C, re-spectively. The grey dotted line corre-sponds toa linear adjustment betweenlogG′ and log EI
468 A. Rohart et al.
structure. Therefore, the number of bonds between protein particles, and thus thestrength of gels made from heated milk, is higher than those made from unheatedmilk, as observable by the high values of G′ and elasticity indices (Donato andGuyomarc’h 2009; Famelart et al. 2004; Lucey et al. 1999).
Two peculiar observations also obtained at the end of the acidification processat pH 4.6 in set gels and represented by empty symbols (∇ and Δ) were plotted inFig. 5. That is, firstly, a drastic decrease in the dynamic moduli during gelformation appeared in one acid gel made from milk heated at 80 °C (Δ), whilethe elasticity indexes detected by DWS remained at 0.05 nm−2 for three otherrepeated gels. And secondly, a very low value of elasticity index was obtained forone of the two gels (∇) from milk heated at 90 °C prior to acidification while G′was at the same level.
It seems reasonable to suggest that the sudden drop in G′ (for the higher milkheat treatment), is due to slippage within the measurement cell during the rheo-logical test. When a thin layer of liquid is formed between the walls of themeasuring unit of the rheometer and the sample, the gel loses mechanical contactwith the cell wall which leads to apparent measured modulus tending to zero(Haque et al. 2001; Xu et al. 2008). Shrinkage of the gel during the measurementmay have led to wheying-off.
For the second case dealing with a gel made with milk previously treated at 80 °C,the decrease in EI should be considered as an increase in MSD values due a suddenincrease in particle motion at the point of measurement. It should be remembered thatfor DWS measurements, the laser is focused at a height of 24 mm.
3.2 Syneresis detection during gel formation
In order to explore the possible reasons for the appearance of two peculiar cases asseen in Fig. 5 (empty symbols (∇ and Δ)) more precisely, further experimentswere carried out using Turbiscan Classic MA 2000® which allows analyzing thesample along its height (Fig. 6a and b). Figure 6a shows the evolution ofbackscattering during the acidification of milk heated at 70 °C and acidified with1.25 wt% GDL at 43 °C over different times as a function of the sample height.When comparing the profiles to initial time, the backscattering level increased asacidification proceeded. This result is consistent with the behaviour of backscat-tering observed in Figs. 1 and 3c in spite of using two different SMLS apparatuses(Turbiscan LAB® and Turbiscan Classic MA 2000®) based on the same principlefor the experiments. Although backscattering levels remained constant along thesample height during gel formation (Fig. 6a), a slight decrease in backscatteringvalues appeared at the top of the tube at the end of acidification. This decreaseintensified after 24 h storage at 4 °C (Fig. 6c). The interactions between theprotein particles may have increased during the storage of 24 h at 4 °C, whichmay have contributed to increase the porosity of the gel, thus facilitating themoving of whey outside of the network. This behaviour can be attributed to thedecrease in particle concentration and thus to the formation of a serum layerdevoid of particles.
Figure 6b shows the variation of backscattering during the acidification of milk heat-treated at 90 °C and acidified with 1.25 wt% GDL at 43 °C over different times as a
Gelation and syneresis detection in acid gels 469

function of the sample height. Similarly to Fig. 6a, a subsequent increase in backscat-tering was observed and values were constant along the sample height until 0.9 h afterGDL addition. However, after 1.1 h, evidence of extensive variations of backscatteringvalues along the sample height appeared and it reinforced over time, particularly in themiddle and upper parts of the tube. The noisy signal was caused by a non-homogeneous gel containing whey in confined small cavities. It should be noted thatcontrary to Fig. 6c, no evolution of the backscattering profile was observed between theend of acidification (Fig. 6b) and after 24 h of storage at 4 °C (Fig. 6d). Therefore, thegel network did not evolve at long ageing times, thus maintaining the syneresis levelconstant and avoiding additional whey separation during storage.
In order to generalize the two observed profiles obtained by SMLS (Fig. 6a and b),the percentage of acid milk gels subjected to surface and/or wall syneresis wascalculated as a function of heat treatment applied to the milk prior to acidification(Fig. 7). Evidence of extensive syneresis on the surface due to the formation of a serumlayer was shown for gels from unheated milk or milk heat-treated at 70 °C. In contrastthere was a tendency towards a wall syneresis in the acid gels from more severely-heated, treated milk. Intermediate behaviour was observed for gels from milk heat-treated at 80 °C with a large number of gels subjected to either surface, wall or bothtype of syneresis. Therefore, low-heat treatment of the milk contributed to syneresis onthe gel surface whereas gels obtained from severely heat-treated milk were more proneto wall syneresis.
Syneresis phenomenon was also studied by DWS measurements. Figure 8a showsthe developments of elasticity index during acidification measured by DWS for the tworepeated gels made from milk heated at 90 °C corresponding to the gels analyzed inFig. 5. While the elasticity index continuously increased up to 0.053 nm−2 for onesample, in the second sample a sudden drop in elasticity index just after gel formationwas observed at a pH of 5.05, followed by a noisy signal. Photographs of the two set
0
10
20
30
40
50
60
70
80 Time of acidification at 43°C (h)
0 0.4 0.9 1.1 2.2
Bac
ksca
tterin
g (%
)
0
10
20
30
40
50
60
70
80
0 0.2 0.5 0.8 2.2
Bac
ksca
tterin
g (%
)Time of acidification at 43°C (h)
0 5 10 15 20 25 30 35 40 450
10
20
30
40
50
60
70
Bac
ksca
tterin
g (%
)
Sample height (mm)
0 5 10 15 20 25 30 35 40 450
10
20
30
40
50
60
70
Bac
ksca
tterin
g (%
)
Sample height (mm)
ba
dc35 36 37 38 39 40 41
20
30
40
50
60
70
0 0.2 0.5 0.8 2.2 24
Time (h)
Fig. 6 Backscattering values of a milk heat-treated at a 70 °C; b 90 °C acidified with 1.25 wt% GDL at 43 °Calong its height in a glass tube over acidification time (c) and d after a storage of 24 h at 4 °C, respectively.Grey dotted lines highlight appearance of a serum layer on the surface of the gel after 24 h. The inset in ashows the upper part of the sample tube over acidification time and after 24 h at 4 °C
470 A. Rohart et al.

acid milk gels were taken at the end of acidification at pH 4.6 (Fig. 8b). Ahomogeneous gel was obtained for one sample (top of the figure) whereas extensivesyneresis along the wall of the tube was evident for the second one (bottom of thefigure) especially at the laser height of 24 mm (grey line). In agreement withobservations by SMLS (Fig. 6b) and DWS (Fig. 8a), the rough surface appearance ofthe gels confirmed the presence of macroscopic zones of localized trapped serum,contributing to the non-homogeneity of the gel along its height.
In summary, under the various conditions of heat treatment, two consequences of gelrestructuring were identified: syneresis on the gel surface and wall syneresis. Moreover,it has been shown that light scattering techniques proved to be very efficient tools todetect these different consequences of the gel rearrangement which lead to syneresisduring gel formation, before visual defects are observable. Besides, such phenomenawere not systematically noticeable by classical rheological measurements.
3.3 Proposed model for syneresis in acid milk gels
A schematic representation of the two consequences of gel restructuring occurring inacid milk gels, namely ‘surface syneresis’ and ‘wall syneresis’ is proposed in Fig. 9. In
Unheated 70°C 80°C 90°C0
20
40
60
80
100
Per
cent
age
of a
cid
gels
(%
)
No syneresis On the wall On the surface+wall On the surface
Fig. 7 Proportion of set acid milk gels at pH 4.6 from unheated milk or milk heat-treated at 70, 80 or 90 °Csubjected to no syneresis, syneresis on the surface, wall syneresis or surface and wall syneresis as determinedby the backscattering profiles obtained by Turbiscan MA2000. The proportions were calculated from 12samples for acid milk gels from unheated milk or milk heat-treated at 70 or 90 °C and 27 samples for acid milkgels from milk heat-treated at 80 °C
5.4 5.3 5.2 5.1 5.0 4.9 4.8 4.7 4.610-3
10-2
10-1
Ela
stic
ity in
dex
(nm
-2)
pH
a bFig. 8 a Elasticity index as afunction of pH during acidificationby 1.25 wt% GDL at 43 °C for tworepeated milk heat-treated at90 °C; b Visual appearance of setacid gels from milk heat-treated at90 °C corresponding to the tworepeated gels analyzed in Fig. 5 atpH 4.6 (the pictures at the top andbottom correspond to the gel rep-resented by solid and dotted lines,respectively). The grey lines on thepictures correspond to the laserheight of DWS measurement
Gelation and syneresis detection in acid gels 471
the two situations, serum is expelled from the network due to gel rearrangement, whichresults in phase separation and a non-homogeneous system. However, a distinctionbetween the consequences of gel restructuring leading to syneresis can be made.
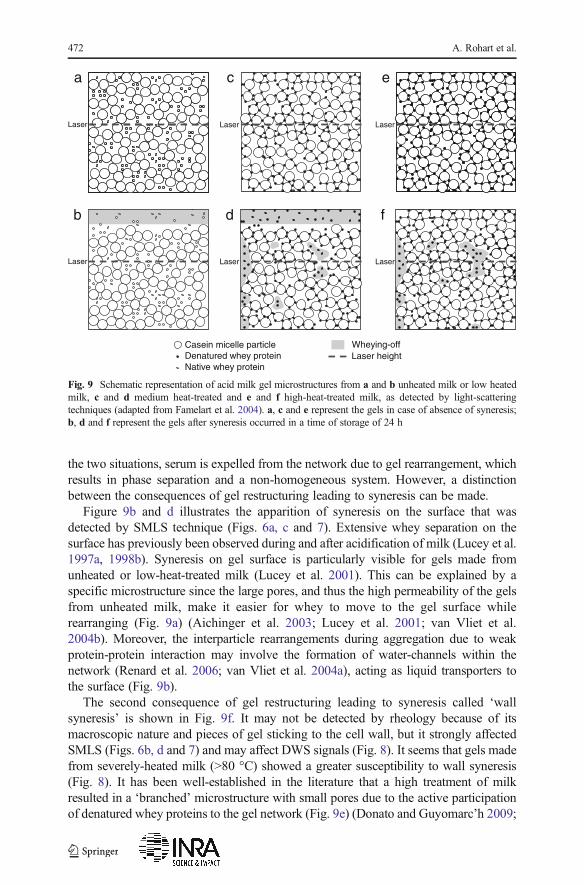
Figure 9b and d illustrates the apparition of syneresis on the surface that wasdetected by SMLS technique (Figs. 6a, c and 7). Extensive whey separation on thesurface has previously been observed during and after acidification of milk (Lucey et al.1997a, 1998b). Syneresis on gel surface is particularly visible for gels made fromunheated or low-heat-treated milk (Lucey et al. 2001). This can be explained by aspecific microstructure since the large pores, and thus the high permeability of the gelsfrom unheated milk, make it easier for whey to move to the gel surface whilerearranging (Fig. 9a) (Aichinger et al. 2003; Lucey et al. 2001; van Vliet et al.2004b). Moreover, the interparticle rearrangements during aggregation due to weakprotein-protein interaction may involve the formation of water-channels within thenetwork (Renard et al. 2006; van Vliet et al. 2004a), acting as liquid transporters tothe surface (Fig. 9b).
The second consequence of gel restructuring leading to syneresis called ‘wallsyneresis’ is shown in Fig. 9f. It may not be detected by rheology because of itsmacroscopic nature and pieces of gel sticking to the cell wall, but it strongly affectedSMLS (Figs. 6b, d and 7) and may affect DWS signals (Fig. 8). It seems that gels madefrom severely-heated milk (>80 °C) showed a greater susceptibility to wall syneresis(Fig. 8). It has been well-established in the literature that a high treatment of milkresulted in a ‘branched’ microstructure with small pores due to the active participationof denatured whey proteins to the gel network (Fig. 9e) (Donato and Guyomarc’h 2009;
ea
fb
Wheying-off Laser height
Casein micelle particleDenatured whey proteinNative whey protein
Laser Laser
c
d
Laser
Laser Laser Laser
Fig. 9 Schematic representation of acid milk gel microstructures from a and b unheated milk or low heatedmilk, c and d medium heat-treated and e and f high-heat-treated milk, as detected by light-scatteringtechniques (adapted from Famelart et al. 2004). a, c and e represent the gels in case of absence of syneresis;b, d and f represent the gels after syneresis occurred in a time of storage of 24 h
472 A. Rohart et al.

Famelart et al. 2004; Lucey et al. 1998b, 2001). As a consequence, the low waterretention should prevent extensive whey separation as commonly believed.Nevertheless, it is important to state that whey separation can also be a consequenceof the contraction of the gel network (Aichinger et al. 2003). In gels made from high-heat-treated milk, the continued aggregation of casein particles and incorporation ofdenatured whey proteins may cause local stresses in the networks (Lucey et al. 1998b).This mechanism can lead to localized cracks and the formation of whey-enriched zones(Fig. 9f), and thus to the apparition of rough surfaces, as seen in Fig. 8b. However, itshould be noted that DWS signal may be affected by wall syneresis only if the zone ofwhey pockets void of macroscopic gel and thus containing small particles free to movein the serum phase corresponded to the laser height of measurement.
It should be mentioned that both ‘surface syneresis’ and ‘wall syneresis’ occurring atthe same time can be found in intermediate-heat-treated gels, as in the case of theapplication of a heat treatment of 80 °C for 7 min (Fig. 9d). Moreover, the susceptibilityto wall syneresis is not only governed by the density of the network and the resistanceof the protein chains to deformation, but also by the container’s properties. Since thewhey remained in confined zones during and after the acidification process, the caseinnetwork was strongly sticking to the walls of the glass tube. Therefore, further researchshould be carried out on surface properties of glass, material packaging (glass, poly-styrene, stoneware) or surface topology to modify the adhesion of protein networks tothe wall and thus syneresis.
4 Conclusion
Acid milk gelation and syneresis detection were studied using two light scatteringtechniques, SMLS and DWS, in comparison to classically-used rheology. Strongcorrelations were highlighted between the DWS behaviour and the rheological mea-surements for the gel point detection but also during the kinetics of gel formation.Under various conditions of milk heat treatment, which lead to different gel properties,DWS proved to bring additional information to rheology. The combination of tech-niques made it possible to distinguish two consequences of gel restructuring leading tosyneresis, described respectively as ‘surface syneresis’ and ‘wall syneresis’. Theproposed model for syneresis in acid milk gels associates the type of syneresis withspecific gel microstructures obtained by various milk heat treatments. The use of DWScould therefore be of great interest in syneresis prevention in industrial environmentssuch as yoghurt manufacturing, particularly with the development of user-friendlyinstruments.
References
Aichinger PA, Michel M, Servais C et al (2003) Fermentation of a skim milk concentrate withStreptococcus thermophilus and chymosin: structure, viscoelasticity and syneresis of gels. ColloidSurface B 31:243–255
Alexander M, Dalgleish DG (2005) Interactions between denatured milk serum proteins and casein micellesstudied by diffusing wave spectroscopy. Langmuir 11380–11386
Gelation and syneresis detection in acid gels 473

Alexander M, Dalgleish DG (2007) Diffusing wave spectroscopy of aggregating and gelling systems. CurrOpin In 12:179–186
Alexander M, Piska I, Dalgleish DG (2008) Investigation of particle dynamics in gels involving caseinmicelles: a diffusing wave spectroscopy and rheology approach. Food Hydrocoll 22:1124–1134
Brunel L (2010) Procédé de caractérisation rhéologique d’un milieu complexe. WO 2010130766:A1Corredig M, Alexander M (2008) Food emulsions studied by DWS. Trends Food Sci Tech 19:67–75Dalgleish DG, Alexander M, Corredig M (2004) Studies of the acid gelation of milk using ultrasonic
spectroscopy and diffusing wave spectroscopy. Food Hydrocoll 18:747–755Donato L, Guyomarc’h F (2009) Formation and properties of the whey protein/κ-casein complexes in heated
skim milk—a review. Dairy Sci Technol 89:3–29Ercili-Cura D, Lille M, Legland D, Gaucel S, Poutanen K, Partanen R, Lantto R (2013) Structural mechanisms
leading to improvedwater retention in acidmilk gels by use of transglutaminase. FoodHydrocoll 30:419–427Famelart MH, Tomazewski J, Piot M, Pezennec S (2004) Comprehensive study of acid gelation of heated milk
with model protein systems. Int Dairy J 14:313–321Gastaldi E, Lagaude A, Tarodo de la Fuente BT (1996) Micellar transition state in casein between pH 5.5 and
5.0. J Food Sci 61:1–7Guyomarc’h F, Law AJ, Dalgleish DG (2003) Formation of soluble and micelle-bound protein aggregates in
heated milk. J Agr Food Chem 51:4652–4660Haque A, Richardson RK, Morris ER (2001) Effect of fermentation temperature on the rheology of set and
stirred yoghurt. Food Hydrocoll 15:593–602Heertje I, Visser J, Smits P (1985) Structure formation in acid milk gels. Food Microst 4:267–277Hemar Y, Singh H, Horne DS (2004) Determination of early stages of rennet-induced aggregation of casein
micelles by diffusing wave spectroscopy and rheological measurements. Curr Appl Phys 4:362–365Holt C (1992) Structure and stability of the bovine casein micelle. In: Afinsen CB, Sall JDED, Richards FK,
Eisenberg DS (eds) Advances in protein chemistry, pp 63–151Horne DS (1999) Formation and structure of acidified milk gels. Int Dairy J 9:261–268Horne DS, Hemar Y, Davidson CM (2003) Diffusing wave spectroscopy studies of gel formation. In:
Dickinson E, van Vliet T (eds) Food colloids—biopolymers and materials. RSC, Cambridge, pp 17–25Kalab M, Emmons DB (1975) Milk-gel structure. IV. Microstructure of yoghurts in relation to the presence of
thickening agents. J Dairy Res 42:453–458Livney YD, Corredig M, Dalgleish DG (2003) Influence of thermal processing on the properties of dairy
colloids. Curr Opin Colloid In 8:359–364Lucey JA, van Vliet T, Grolle K et al (1997a) Properties of acid casein gels made by acidification with
glucono-delta-lactone. 2. Syneresis, permeability and microstructural properties. Int Dairy J 7:389–397Lucey JA, van Vliet T, Grolle K et al (1997b) Properties of acid casein gels made by acidification with
glucono-delta-lactone. 1. Rheological properties. Int Dairy J 7:381–388Lucey JA, Tamehana M, Singh H, Munro PA (1998a) A comparison of the formation, rheological properties
and microstructure of acid skim milk gels made with a bacterial culture or glucono-delta-lactone. FoodRes Int 31:147–155
Lucey JA, Teo CT, Munro PA, Singh H (1998b) Microstructure, permeability and appearance of acid gelsmade from heated skim milk. Food Hydrocoll 12:159–165
Lucey JA, Munro PA, Singh H (1999) Effects of heat treatment and whey protein addition on the rheologicalproperties and structure of acid skim milk gels. Int Dairy J 9:275–279
Lucey JA, TamehanaM, Singh H, Munro PA (2001) Effect of heat treatment on the physical properties of milkgels made with both rennet and acid. Int Dairy J 11:559–565
Mengual O, Meunier G, Cayré I et al (1999) TURBISCAN MA 2000: multiple light scattering measurementfor concentrated emulsion and suspension instability analysis. Talanta 50:445–456
Nicolai T (2007) Food characterisation using scattering methods. In: McClements DJ (ed) Understanding andcontrolling the microstructure of complex foods, pp 288–310
Renard D, van de Velde F, Visschers RW (2006) The gap between food gel structure, texture and perception.Food Hydrocoll 423–431
Sandra S, Alexander M, Dalgleish DG (2007) The rennet coagulation mechanism of skim milk as observed bytransmission diffusing wave spectroscopy. J Colloid Interf Sci 308:364–373
Stradner A, Romer S, Urban C, Schurtenberger P (2001) Aggregation and gel formation in biopolymersolutions. Progr Coll Pol Sci 118:136–140
van Vliet T, Lakemond C, Visschers RW (2004a) Rheology and structure of milk protein gels. Curr OpinColloid In 9:298–304
474 A. Rohart et al.

van Vliet T, Lucey JA, Grolle K, Wastra P (2004b) Rearrangements in acid-induced casein gels during andafter gel formation. In: Dickinson E, Bergenstahl B (eds) Food colloids—proteins, lipids and polysac-charides. RSC, Cambridge, pp 335–345
Weitz DA, Pine DJ (1993) Diffusing-wave spectroscopy. In: In: W. Brown (Ed.), Dynamic light scattering: themethod and some applications. Oxford University Press. pp 652–670
Xu Z-M, Emmanouelidou DG, Raphaelides SN, Antoniou KD (2008) Effects of heating temperature andfat content on the structure development of set yogurt. J Food Eng 85:590–597. doi:10.1016/j.jfoodeng.2007.08.021
Gelation and syneresis detection in acid gels 475