Embed Size (px)
Citation preview
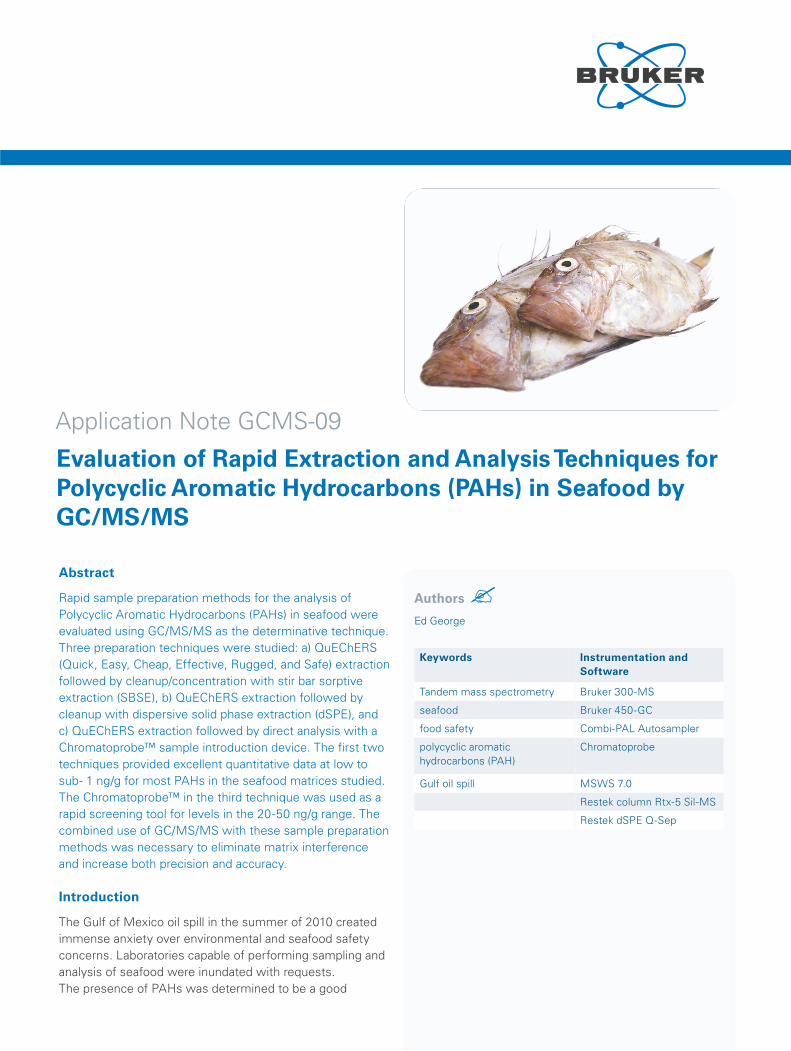
Abstract
Rapid sample preparation methods for the analysis of Polycyclic Aromatic Hydrocarbons (PAHs) in seafood were evaluated using GC/MS/MS as the determinative technique. Three preparation techniques were studied: a) QuEChERS (Quick, Easy, Cheap, Effective, Rugged, and Safe) extraction followed by cleanup/concentration with stir bar sorptive extraction (SBSE), b) QuEChERS extraction followed by cleanup with dispersive solid phase extraction (dSPE), and c) QuEChERS extraction followed by direct analysis with a Chromatoprobe™ sample introduction device. The first two techniques provided excellent quantitative data at low to sub- 1 ng/g for most PAHs in the seafood matrices studied. The Chromatoprobe™ in the third technique was used as a rapid screening tool for levels in the 20-50 ng/g range. The combined use of GC/MS/MS with these sample preparation methods was necessary to eliminate matrix interference and increase both precision and accuracy.
Introduction
The Gulf of Mexico oil spill in the summer of 2010 created immense anxiety over environmental and seafood safety concerns. Laboratories capable of performing sampling and analysis of seafood were inundated with requests. The presence of PAHs was determined to be a good
Authors
Ed George
Bru
ker
Dal
toni
cs is
con
tinua
lly im
prov
ing
its p
rodu
cts
and
rese
rves
the
rig
ht
to c
hang
e sp
ecifi
catio
ns w
ithou
t no
tice.
© B
ruke
r D
alto
nics
06
-201
5, G
CM
S-0
9, 1
838
159
Application Note GCMS-09
Evaluation of Rapid Extraction and Analysis Techniques forPolycyclic Aromatic Hydrocarbons (PAHs) in Seafood by GC/MS/MS
Keywords Instrumentation and Software
Tandem mass spectrometry Bruker 300-MS
seafood Bruker 450-GC
food safety Combi-PAL Autosampler
polycyclic aromatic hydrocarbons (PAH)
Chromatoprobe
Gulf oil spill MSWS 7.0
Restek column Rtx-5 Sil-MS
Restek dSPE Q-Sep
indicator of seafood contamination. As a result, laboratories turned to an approved method of analysis developed by the NOAA (National Oceanographic and Atmospheric Administration)[1]. The NOAA method, however, was incapable of processing the large numbers of samples that needed to be analyzed from an oil spill of this magnitude.
In order to meet the demand, organizations such as AOAC and others began to look for more rapid extraction techniques. The QuEChERS approach, which had been used successfully for the analysis of pesticide residues in a variety of food commodities, seemed to be a logical method to try with seafood [2]. It would allow an analyst to analyze 50-100 samples per day with minimal solvent consumption. Currently, the AOAC is in the process of evaluating a QuEChERS-like extraction method for seafood in an inter-laboratory study. The new method uses gas chromatography-mass spectrometry for detection, allowing either single ion monitoring (SIM) mode or tandem mass spectrometry [3].
Although the AOAC method provides a more rapid analysis than the NOAA method, it still requires two laborious solvent exchange steps and clean-up with a silica gel column. Typical cleanup of QuEChERS extracts employ dispersive solid phase extraction (dSPE), followed by rapid centrifugation; no further cleanup or solvent exchange is required. Cochran et. al. reported a method using QuEChERS with dSPE cleanup of shrimp and mussel tissue [4]. Ed Phankoch et.al. reported cleanup and concentration of QuEChERS extracts using stir bar sorptive extraction (SBSE) and thermal desorption or solvent back extraction GC/MS and LC/Fluorescence techniques [5],[6].
In this work, dSPE and SBSE cleanup techniques on QuEChERS seafood extracts were evaluated. In addition, a screening analysis for seafood samples is presented. GC/MS/MS was chosen because it provided excellent quantitative results in the low to sub-ng/g range.
Experimental
The seafood matrices studied were shrimp, oyster, Atlantic salmon, and blue mussel tissue (ASTM Standard spiked reference material). Calibration and matrix spikes were prepared and analyzed as described below.
Three sample preparation approaches were evaluated:
PAHs by QuEChERS with Stir Bar Sorptive Extraction (SBSE) – followed by Back Extraction (TBE) PAHs by QuEChERS with Dispersive Solid Phase
Extraction (dSPE) PAHs by QuEChERS “Express” Extraction and Screening
with the Chromatoprobe inlet
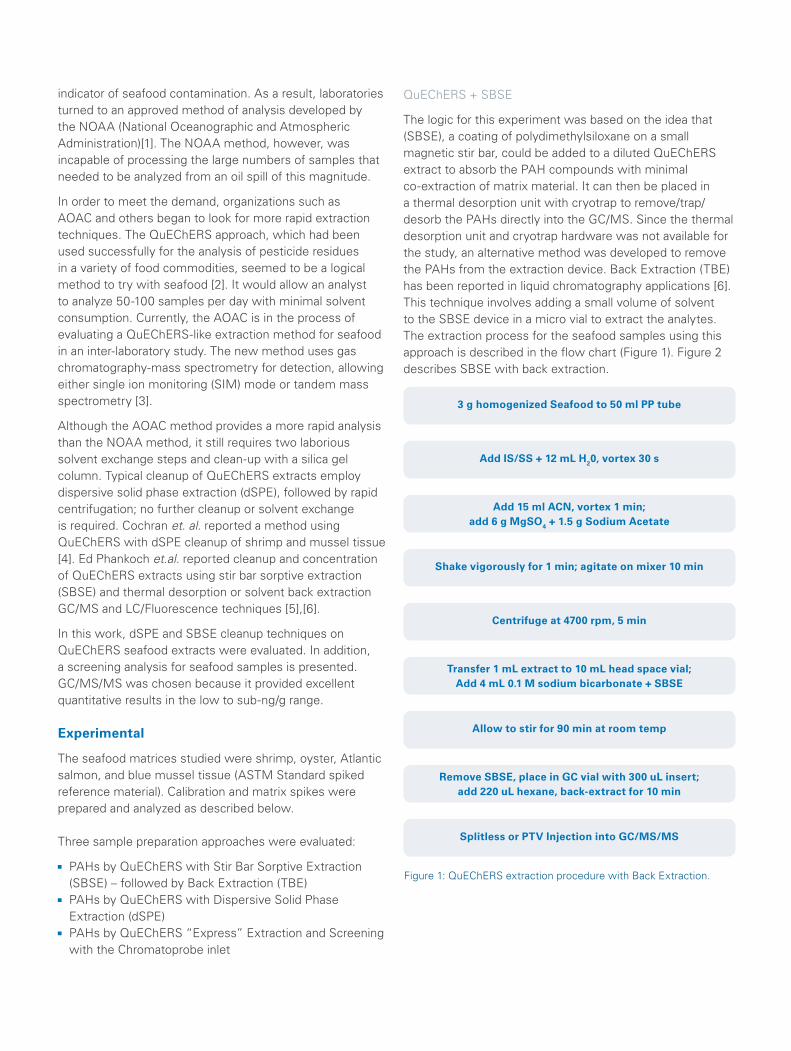
QuEChERS + SBSE
The logic for this experiment was based on the idea that (SBSE), a coating of polydimethylsiloxane on a small magnetic stir bar, could be added to a diluted QuEChERS extract to absorb the PAH compounds with minimal co-extraction of matrix material. It can then be placed in a thermal desorption unit with cryotrap to remove/trap/desorb the PAHs directly into the GC/MS. Since the thermal desorption unit and cryotrap hardware was not available for the study, an alternative method was developed to remove the PAHs from the extraction device. Back Extraction (TBE) has been reported in liquid chromatography applications [6]. This technique involves adding a small volume of solvent to the SBSE device in a micro vial to extract the analytes. The extraction process for the seafood samples using this approach is described in the flow chart (Figure 1). Figure 2 describes SBSE with back extraction.
3 g homogenized Seafood to 50 ml PP tube
Centrifuge at 4700 rpm, 5 min
Add IS/SS + 12 mL H20, vortex 30 s
Transfer 1 mL extract to 10 mL head space vial; Add 4 mL 0.1 M sodium bicarbonate + SBSE
Shake vigorously for 1 min; agitate on mixer 10 min
Add 15 ml ACN, vortex 1 min; add 6 g MgSO4 + 1.5 g Sodium Acetate
Allow to stir for 90 min at room temp
Splitless or PTV Injection into GC/MS/MS
Remove SBSE, place in GC vial with 300 uL insert;add 220 uL hexane, back-extract for 10 min
Figure 1: QuEChERS extraction procedure with Back Extraction.
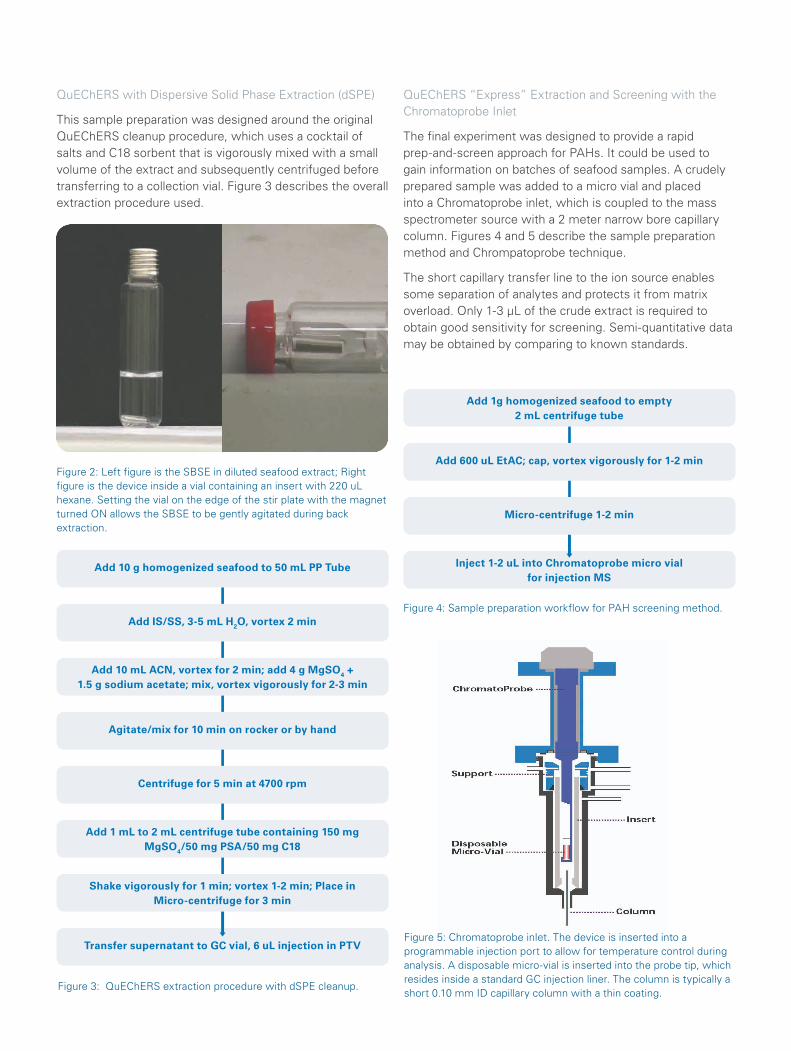
QuEChERS with Dispersive Solid Phase Extraction (dSPE)
This sample preparation was designed around the original QuEChERS cleanup procedure, which uses a cocktail of salts and C18 sorbent that is vigorously mixed with a small volume of the extract and subsequently centrifuged before transferring to a collection vial. Figure 3 describes the overall extraction procedure used.
Figure 2: Left figure is the SBSE in diluted seafood extract; Right figure is the device inside a vial containing an insert with 220 uL hexane. Setting the vial on the edge of the stir plate with the magnet turned ON allows the SBSE to be gently agitated during back extraction.
Add 10 g homogenized seafood to 50 mL PP Tube
Centrifuge for 5 min at 4700 rpm
Add IS/SS, 3-5 mL H2O, vortex 2 min
Add 1 mL to 2 mL centrifuge tube containing 150 mgMgSO4/50 mg PSA/50 mg C18
Agitate/mix for 10 min on rocker or by hand
Add 10 mL ACN, vortex for 2 min; add 4 g MgSO4 +1.5 g sodium acetate; mix, vortex vigorously for 2-3 min
Transfer supernatant to GC vial, 6 uL injection in PTV
Figure 3: QuEChERS extraction procedure with dSPE cleanup.
Shake vigorously for 1 min; vortex 1-2 min; Place inMicro-centrifuge for 3 min
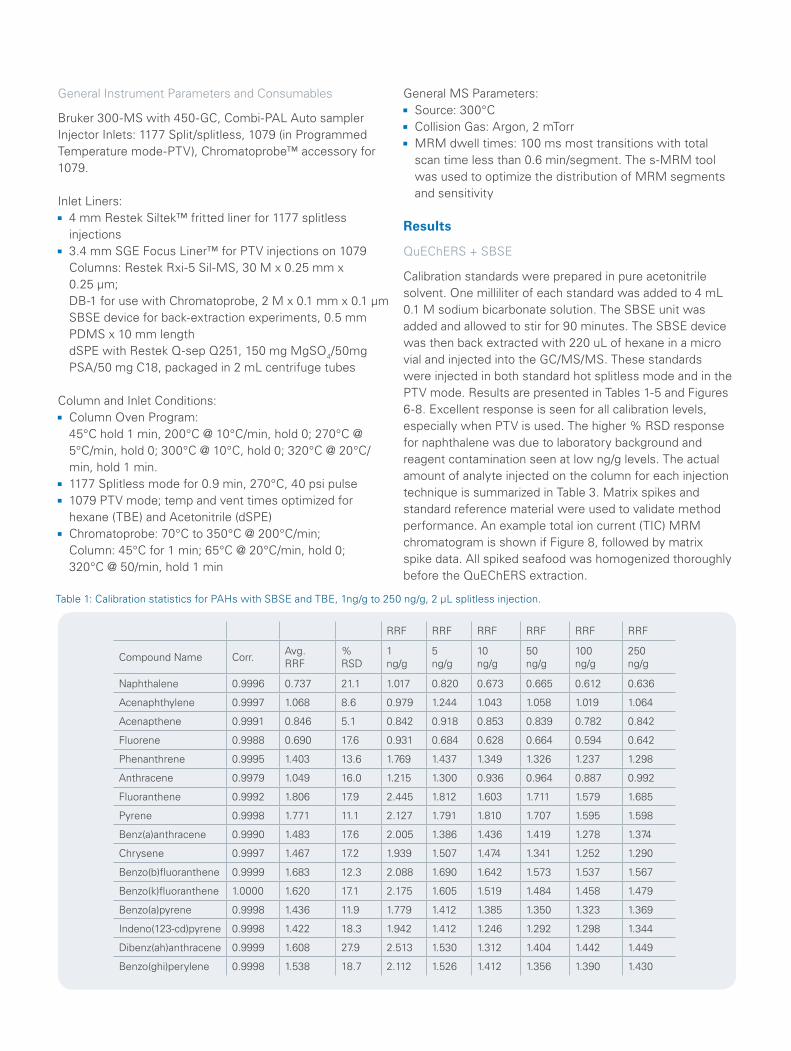
QuEChERS “Express” Extraction and Screening with the Chromatoprobe Inlet
The final experiment was designed to provide a rapid prep-and-screen approach for PAHs. It could be used to gain information on batches of seafood samples. A crudely prepared sample was added to a micro vial and placed into a Chromatoprobe inlet, which is coupled to the mass spectrometer source with a 2 meter narrow bore capillary column. Figures 4 and 5 describe the sample preparation method and Chrompatoprobe technique.
The short capillary transfer line to the ion source enables some separation of analytes and protects it from matrix overload. Only 1-3 µL of the crude extract is required to obtain good sensitivity for screening. Semi-quantitative data may be obtained by comparing to known standards.
Figure 4: Sample preparation workflow for PAH screening method.
Add 1g homogenized seafood to empty 2 mL centrifuge tube
Add 600 uL EtAC; cap, vortex vigorously for 1-2 min
Inject 1-2 uL into Chromatoprobe micro vial for injection MS
Micro-centrifuge 1-2 min
Figure 5: Chromatoprobe inlet. The device is inserted into a programmable injection port to allow for temperature control during analysis. A disposable micro-vial is inserted into the probe tip, which resides inside a standard GC injection liner. The column is typically a short 0.10 mm ID capillary column with a thin coating.
General Instrument Parameters and Consumables
Bruker 300-MS with 450-GC, Combi-PAL Auto samplerInjector Inlets: 1177 Split/splitless, 1079 (in Programmed Temperature mode-PTV), Chromatoprobe™ accessory for 1079.
Inlet Liners: 4 mm Restek Siltek™ fritted liner for 1177 splitless
injections 3.4 mm SGE Focus Liner™ for PTV injections on 1079
Columns: Restek Rxi-5 Sil-MS, 30 M x 0.25 mm x 0.25 μm; DB-1 for use with Chromatoprobe, 2 M x 0.1 mm x 0.1 μm SBSE device for back-extraction experiments, 0.5 mm PDMS x 10 mm length dSPE with Restek Q-sep Q251, 150 mg MgSO4/50mg PSA/50 mg C18, packaged in 2 mL centrifuge tubes
Column and Inlet Conditions: Column Oven Program:
45°C hold 1 min, 200°C @ 10°C/min, hold 0; 270°C @ 5°C/min, hold 0; 300°C @ 10°C, hold 0; 320°C @ 20°C/ min, hold 1 min. 1177 Splitless mode for 0.9 min, 270°C, 40 psi pulse 1079 PTV mode; temp and vent times optimized for
hexane (TBE) and Acetonitrile (dSPE) Chromatoprobe: 70°C to 350°C @ 200°C/min;
Column: 45°C for 1 min; 65°C @ 20°C/min, hold 0; 320°C @ 50/min, hold 1 min
General MS Parameters: Source: 300°C Collision Gas: Argon, 2 mTorr MRM dwell times: 100 ms most transitions with total
scan time less than 0.6 min/segment. The s-MRM tool was used to optimize the distribution of MRM segments and sensitivity
Results
QuEChERS + SBSE
Calibration standards were prepared in pure acetonitrile solvent. One milliliter of each standard was added to 4 mL 0.1 M sodium bicarbonate solution. The SBSE unit was added and allowed to stir for 90 minutes. The SBSE device was then back extracted with 220 uL of hexane in a micro vial and injected into the GC/MS/MS. These standards were injected in both standard hot splitless mode and in the PTV mode. Results are presented in Tables 1-5 and Figures 6-8. Excellent response is seen for all calibration levels, especially when PTV is used. The higher % RSD response for naphthalene was due to laboratory background and reagent contamination seen at low ng/g levels. The actual amount of analyte injected on the column for each injection technique is summarized in Table 3. Matrix spikes and standard reference material were used to validate method performance. An example total ion current (TIC) MRM chromatogram is shown if Figure 8, followed by matrix spike data. All spiked seafood was homogenized thoroughly before the QuEChERS extraction.
RRF RRF RRF RRF RRF RRF
Compound Name Corr. Avg. RRF
% RSD
1 ng/g
5 ng/g
10 ng/g
50 ng/g
100 ng/g
250 ng/g
Naphthalene 0.9996 0.737 21.1 1.017 0.820 0.673 0.665 0.612 0.636
Acenaphthylene 0.9997 1.068 8.6 0.979 1.244 1.043 1.058 1.019 1.064
Acenapthene 0.9991 0.846 5.1 0.842 0.918 0.853 0.839 0.782 0.842
Fluorene 0.9988 0.690 17.6 0.931 0.684 0.628 0.664 0.594 0.642
Phenanthrene 0.9995 1.403 13.6 1.769 1.437 1.349 1.326 1.237 1.298
Anthracene 0.9979 1.049 16.0 1.215 1.300 0.936 0.964 0.887 0.992
Fluoranthene 0.9992 1.806 17.9 2.445 1.812 1.603 1.711 1.579 1.685
Pyrene 0.9998 1.771 11.1 2.127 1.791 1.810 1.707 1.595 1.598
Benz(a)anthracene 0.9990 1.483 17.6 2.005 1.386 1.436 1.419 1.278 1.374
Chrysene 0.9997 1.467 17.2 1.939 1.507 1.474 1.341 1.252 1.290
Benzo(b)fluoranthene 0.9999 1.683 12.3 2.088 1.690 1.642 1.573 1.537 1.567
Benzo(k)fluoranthene 1.0000 1.620 17.1 2.175 1.605 1.519 1.484 1.458 1.479
Benzo(a)pyrene 0.9998 1.436 11.9 1.779 1.412 1.385 1.350 1.323 1.369
Indeno(123-cd)pyrene 0.9998 1.422 18.3 1.942 1.412 1.246 1.292 1.298 1.344
Dibenz(ah)anthracene 0.9999 1.608 27.9 2.513 1.530 1.312 1.404 1.442 1.449
Benzo(ghi)perylene 0.9998 1.538 18.7 2.112 1.526 1.412 1.356 1.390 1.430
Table 1: Calibration statistics for PAHs with SBSE and TBE, 1ng/g to 250 ng/g, 2 µL splitless injection.
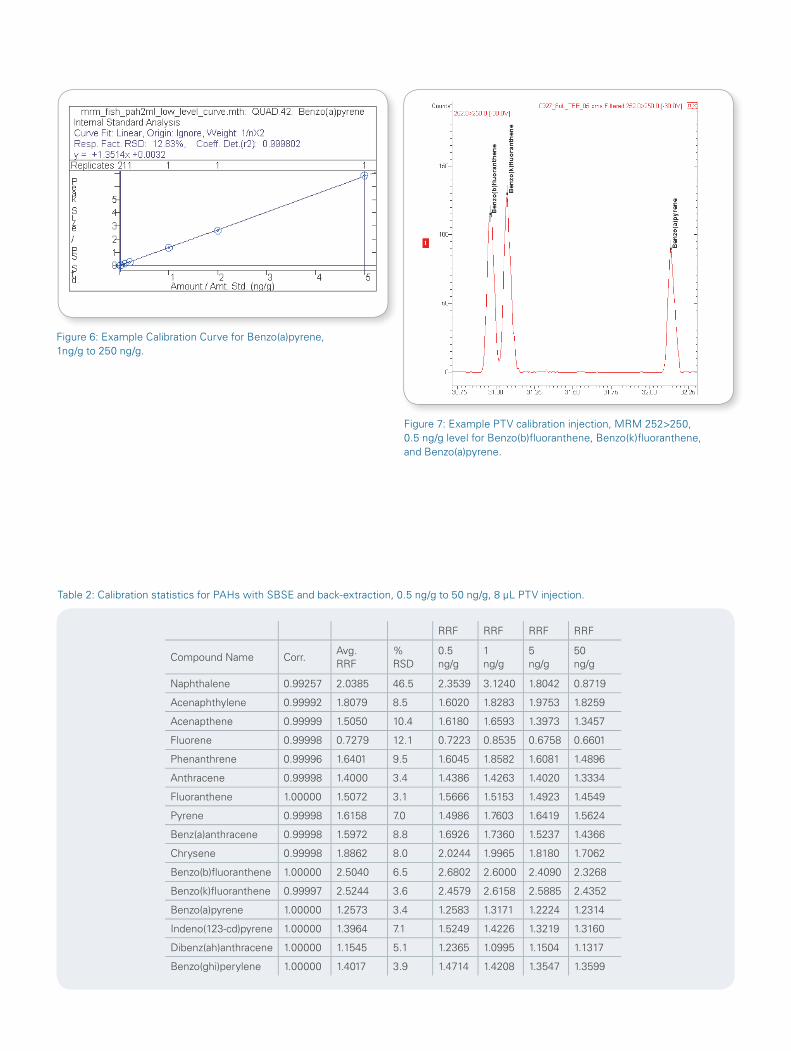
Figure 6: Example Calibration Curve for Benzo(a)pyrene, 1ng/g to 250 ng/g.
Figure 7: Example PTV calibration injection, MRM 252>250, 0.5 ng/g level for Benzo(b)fluoranthene, Benzo(k)fluoranthene, and Benzo(a)pyrene.
Table 2: Calibration statistics for PAHs with SBSE and back-extraction, 0.5 ng/g to 50 ng/g, 8 µL PTV injection.
RRF RRF RRF RRF
Compound Name Corr.Avg. RRF
% RSD
0.5 ng/g
1 ng/g
5 ng/g
50 ng/g
Naphthalene 0.99257 2.0385 46.5 2.3539 3.1240 1.8042 0.8719
Acenaphthylene 0.99992 1.8079 8.5 1.6020 1.8283 1.9753 1.8259
Acenapthene 0.99999 1.5050 10.4 1.6180 1.6593 1.3973 1.3457
Fluorene 0.99998 0.7279 12.1 0.7223 0.8535 0.6758 0.6601
Phenanthrene 0.99996 1.6401 9.5 1.6045 1.8582 1.6081 1.4896
Anthracene 0.99998 1.4000 3.4 1.4386 1.4263 1.4020 1.3334
Fluoranthene 1.00000 1.5072 3.1 1.5666 1.5153 1.4923 1.4549
Pyrene 0.99998 1.6158 7.0 1.4986 1.7603 1.6419 1.5624
Benz(a)anthracene 0.99998 1.5972 8.8 1.6926 1.7360 1.5237 1.4366
Chrysene 0.99998 1.8862 8.0 2.0244 1.9965 1.8180 1.7062
Benzo(b)fl uoranthene 1.00000 2.5040 6.5 2.6802 2.6000 2.4090 2.3268
Benzo(k)fl uoranthene 0.99997 2.5244 3.6 2.4579 2.6158 2.5885 2.4352
Benzo(a)pyrene 1.00000 1.2573 3.4 1.2583 1.3171 1.2224 1.2314
Indeno(123-cd)pyrene 1.00000 1.3964 7.1 1.5249 1.4226 1.3219 1.3160
Dibenz(ah)anthracene 1.00000 1.1545 5.1 1.2365 1.0995 1.1504 1.1317
Benzo(ghi)perylene 1.00000 1.4017 3.9 1.4714 1.4208 1.3547 1.3599
2 µL 8 µL
Spike Conc (ng) on (ng/mL) in (pg) inj (pg) inj
(ng/g) Twister TBE on column on column
0.1 0.02 0.091 0.182 0.728
0.5 0.1 0.46 0.91 3.64
1 0.2 0.91 1.82 7.28
5 1 4.6 9.1 36.4
10 2 9.1 18.2 72.8
50 10 45.5 91 364
100 20 91 182 728
250 50 228 455 1820
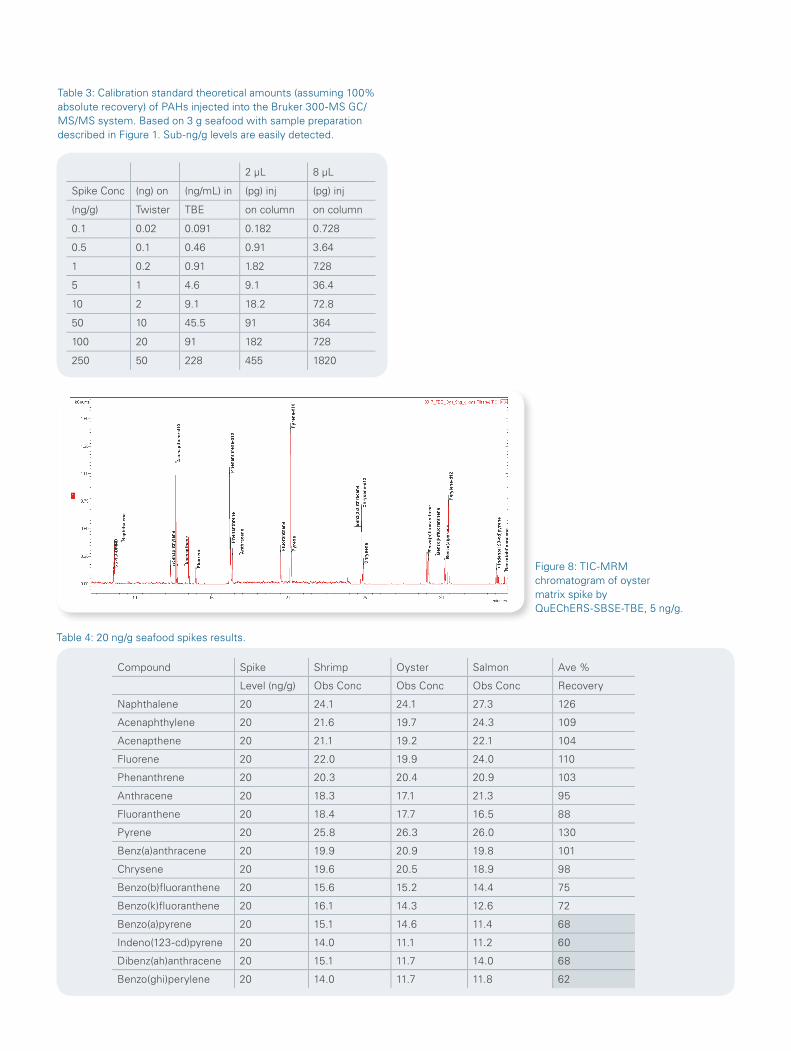
Table 3: Calibration standard theoretical amounts (assuming 100% absolute recovery) of PAHs injected into the Bruker 300-MS GC/MS/MS system. Based on 3 g seafood with sample preparation described in Figure 1. Sub-ng/g levels are easily detected.
Figure 8: TIC-MRM chromatogram of oyster matrix spike by QuEChERS-SBSE-TBE, 5 ng/g.
Table 4: 20 ng/g seafood spikes results.
Compound Spike Shrimp Oyster Salmon Ave %
Level (ng/g) Obs Conc Obs Conc Obs Conc Recovery
Naphthalene 20 24.1 24.1 27.3 126
Acenaphthylene 20 21.6 19.7 24.3 109
Acenapthene 20 21.1 19.2 22.1 104
Fluorene 20 22.0 19.9 24.0 110
Phenanthrene 20 20.3 20.4 20.9 103
Anthracene 20 18.3 17.1 21.3 95
Fluoranthene 20 18.4 17.7 16.5 88
Pyrene 20 25.8 26.3 26.0 130
Benz(a)anthracene 20 19.9 20.9 19.8 101
Chrysene 20 19.6 20.5 18.9 98
Benzo(b)fluoranthene 20 15.6 15.2 14.4 75
Benzo(k)fluoranthene 20 16.1 14.3 12.6 72
Benzo(a)pyrene 20 15.1 14.6 11.4 68
Indeno(123-cd)pyrene 20 14.0 11.1 11.2 60
Dibenz(ah)anthracene 20 15.1 11.7 14.0 68
Benzo(ghi)perylene 20 14.0 11.7 11.8 62
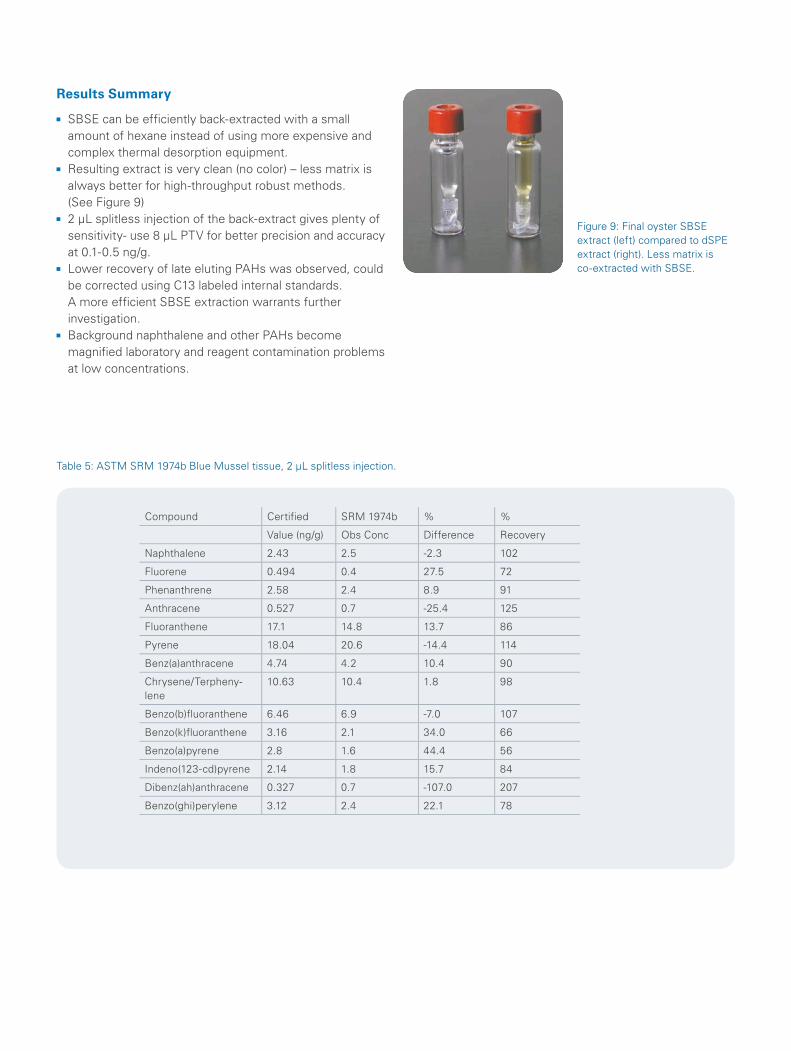
Results Summary
SBSE can be efficiently back-extracted with a small amount of hexane instead of using more expensive and complex thermal desorption equipment. Resulting extract is very clean (no color) – less matrix is
always better for high-throughput robust methods. (See Figure 9) 2 µL splitless injection of the back-extract gives plenty of
sensitivity- use 8 µL PTV for better precision and accuracy at 0.1-0.5 ng/g. Lower recovery of late eluting PAHs was observed, could
be corrected using C13 labeled internal standards. A more efficient SBSE extraction warrants further investigation. Background naphthalene and other PAHs become
magnified laboratory and reagent contamination problems at low concentrations.
Table 5: ASTM SRM 1974b Blue Mussel tissue, 2 µL splitless injection.
Figure 9: Final oyster SBSE extract (left) compared to dSPE extract (right). Less matrix is co-extracted with SBSE.
Compound Certified SRM 1974b % %
Value (ng/g) Obs Conc Difference Recovery
Naphthalene 2.43 2.5 -2.3 102
Fluorene 0.494 0.4 27.5 72
Phenanthrene 2.58 2.4 8.9 91
Anthracene 0.527 0.7 -25.4 125
Fluoranthene 17.1 14.8 13.7 86
Pyrene 18.04 20.6 -14.4 114
Benz(a)anthracene 4.74 4.2 10.4 90
Chrysene/Terpheny-lene
10.63 10.4 1.8 98
Benzo(b)fluoranthene 6.46 6.9 -7.0 107
Benzo(k)fluoranthene 3.16 2.1 34.0 66
Benzo(a)pyrene 2.8 1.6 44.4 56
Indeno(123-cd)pyrene 2.14 1.8 15.7 84
Dibenz(ah)anthracene 0.327 0.7 -107.0 207
Benzo(ghi)perylene 3.12 2.4 22.1 78
QuEChERS with Dispersive Solid Phase Extraction (dSPE)
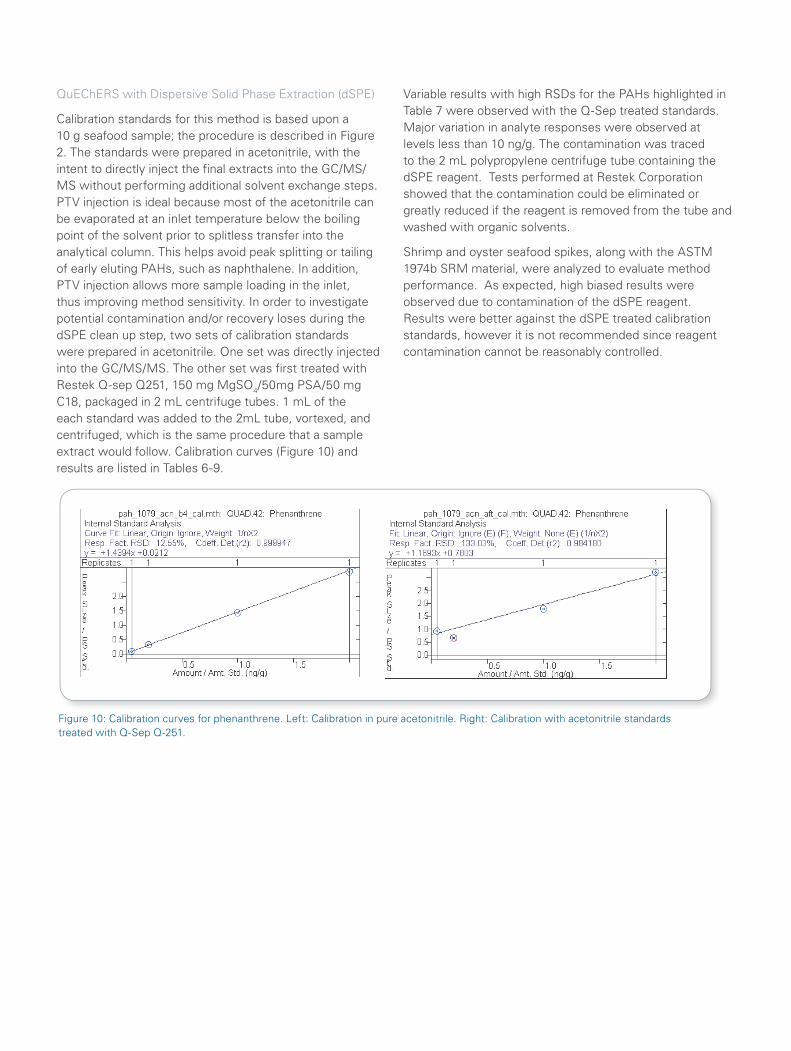
Calibration standards for this method is based upon a 10 g seafood sample; the procedure is described in Figure 2. The standards were prepared in acetonitrile, with the intent to directly inject the final extracts into the GC/MS/MS without performing additional solvent exchange steps. PTV injection is ideal because most of the acetonitrile can be evaporated at an inlet temperature below the boiling point of the solvent prior to splitless transfer into the analytical column. This helps avoid peak splitting or tailing of early eluting PAHs, such as naphthalene. In addition, PTV injection allows more sample loading in the inlet, thus improving method sensitivity. In order to investigate potential contamination and/or recovery loses during the dSPE clean up step, two sets of calibration standards were prepared in acetonitrile. One set was directly injected into the GC/MS/MS. The other set was first treated with Restek Q-sep Q251, 150 mg MgSO4/50mg PSA/50 mg C18, packaged in 2 mL centrifuge tubes. 1 mL of the each standard was added to the 2mL tube, vortexed, and centrifuged, which is the same procedure that a sample extract would follow. Calibration curves (Figure 10) and results are listed in Tables 6-9.
Variable results with high RSDs for the PAHs highlighted in Table 7 were observed with the Q-Sep treated standards. Major variation in analyte responses were observed at levels less than 10 ng/g. The contamination was traced to the 2 mL polypropylene centrifuge tube containing the dSPE reagent. Tests performed at Restek Corporation showed that the contamination could be eliminated or greatly reduced if the reagent is removed from the tube and washed with organic solvents.
Shrimp and oyster seafood spikes, along with the ASTM 1974b SRM material, were analyzed to evaluate method performance. As expected, high biased results were observed due to contamination of the dSPE reagent. Results were better against the dSPE treated calibration standards, however it is not recommended since reagent contamination cannot be reasonably controlled.
Figure 10: Calibration curves for phenanthrene. Left: Calibration in pure acetonitrile. Right: Calibration with acetonitrile standards treated with Q-Sep Q-251.
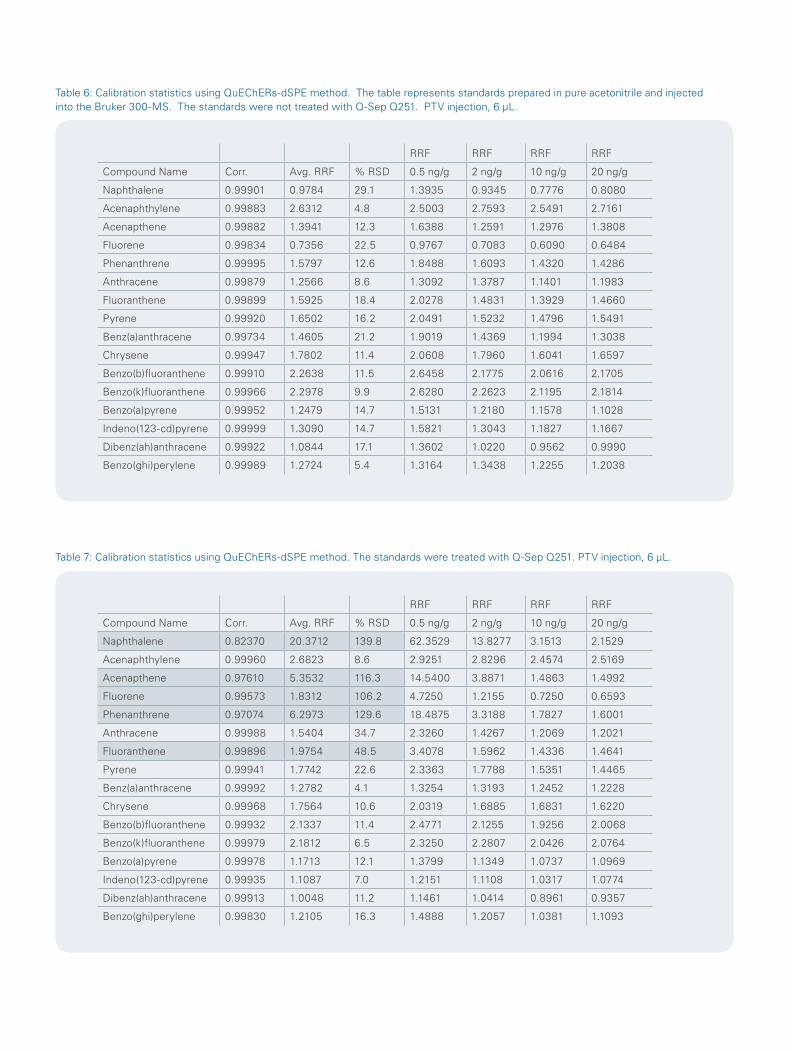
Table 6: Calibration statistics using QuEChERs-dSPE method. The table represents standards prepared in pure acetonitrile and injected into the Bruker 300-MS. The standards were not treated with Q-Sep Q251. PTV injection, 6 µL.
Table 7: Calibration statistics using QuEChERs-dSPE method. The standards were treated with Q-Sep Q251. PTV injection, 6 µL.
RRF RRF RRF RRF
Compound Name Corr. Avg. RRF % RSD 0.5 ng/g 2 ng/g 10 ng/g 20 ng/g
Naphthalene 0.99901 0.9784 29.1 1.3935 0.9345 0.7776 0.8080
Acenaphthylene 0.99883 2.6312 4.8 2.5003 2.7593 2.5491 2.7161
Acenapthene 0.99882 1.3941 12.3 1.6388 1.2591 1.2976 1.3808
Fluorene 0.99834 0.7356 22.5 0.9767 0.7083 0.6090 0.6484
Phenanthrene 0.99995 1.5797 12.6 1.8488 1.6093 1.4320 1.4286
Anthracene 0.99879 1.2566 8.6 1.3092 1.3787 1.1401 1.1983
Fluoranthene 0.99899 1.5925 18.4 2.0278 1.4831 1.3929 1.4660
Pyrene 0.99920 1.6502 16.2 2.0491 1.5232 1.4796 1.5491
Benz(a)anthracene 0.99734 1.4605 21.2 1.9019 1.4369 1.1994 1.3038
Chrysene 0.99947 1.7802 11.4 2.0608 1.7960 1.6041 1.6597
Benzo(b)fluoranthene 0.99910 2.2638 11.5 2.6458 2.1775 2.0616 2.1705
Benzo(k)fluoranthene 0.99966 2.2978 9.9 2.6280 2.2623 2.1195 2.1814
Benzo(a)pyrene 0.99952 1.2479 14.7 1.5131 1.2180 1.1578 1.1028
Indeno(123-cd)pyrene 0.99999 1.3090 14.7 1.5821 1.3043 1.1827 1.1667
Dibenz(ah)anthracene 0.99922 1.0844 17.1 1.3602 1.0220 0.9562 0.9990
Benzo(ghi)perylene 0.99989 1.2724 5.4 1.3164 1.3438 1.2255 1.2038
RRF RRF RRF RRF
Compound Name Corr. Avg. RRF % RSD 0.5 ng/g 2 ng/g 10 ng/g 20 ng/g
Naphthalene 0.82370 20.3712 139.8 62.3529 13.8277 3.1513 2.1529
Acenaphthylene 0.99960 2.6823 8.6 2.9251 2.8296 2.4574 2.5169
Acenapthene 0.97610 5.3532 116.3 14.5400 3.8871 1.4863 1.4992
Fluorene 0.99573 1.8312 106.2 4.7250 1.2155 0.7250 0.6593
Phenanthrene 0.97074 6.2973 129.6 18.4875 3.3188 1.7827 1.6001
Anthracene 0.99988 1.5404 34.7 2.3260 1.4267 1.2069 1.2021
Fluoranthene 0.99896 1.9754 48.5 3.4078 1.5962 1.4336 1.4641
Pyrene 0.99941 1.7742 22.6 2.3363 1.7788 1.5351 1.4465
Benz(a)anthracene 0.99992 1.2782 4.1 1.3254 1.3193 1.2452 1.2228
Chrysene 0.99968 1.7564 10.6 2.0319 1.6885 1.6831 1.6220
Benzo(b)fluoranthene 0.99932 2.1337 11.4 2.4771 2.1255 1.9256 2.0068
Benzo(k)fluoranthene 0.99979 2.1812 6.5 2.3250 2.2807 2.0426 2.0764
Benzo(a)pyrene 0.99978 1.1713 12.1 1.3799 1.1349 1.0737 1.0969
Indeno(123-cd)pyrene 0.99935 1.1087 7.0 1.2151 1.1108 1.0317 1.0774
Dibenz(ah)anthracene 0.99913 1.0048 11.2 1.1461 1.0414 0.8961 0.9357
Benzo(ghi)perylene 0.99830 1.2105 16.3 1.4888 1.2057 1.0381 1.1093
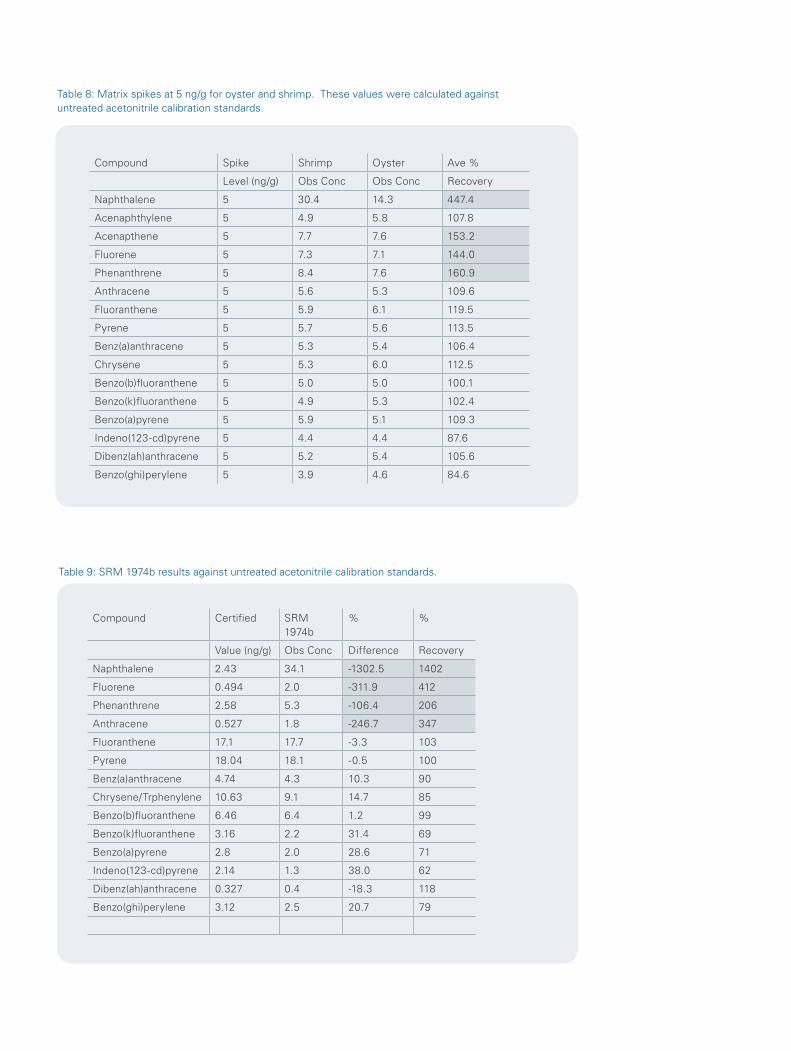
Table 8: Matrix spikes at 5 ng/g for oyster and shrimp. These values were calculated against untreated acetonitrile calibration standards.
Compound Spike Shrimp Oyster Ave %
Level (ng/g) Obs Conc Obs Conc Recovery
Naphthalene 5 30.4 14.3 447.4
Acenaphthylene 5 4.9 5.8 107.8
Acenapthene 5 7.7 7.6 153.2
Fluorene 5 7.3 7.1 144.0
Phenanthrene 5 8.4 7.6 160.9
Anthracene 5 5.6 5.3 109.6
Fluoranthene 5 5.9 6.1 119.5
Pyrene 5 5.7 5.6 113.5
Benz(a)anthracene 5 5.3 5.4 106.4
Chrysene 5 5.3 6.0 112.5
Benzo(b)fluoranthene 5 5.0 5.0 100.1
Benzo(k)fluoranthene 5 4.9 5.3 102.4
Benzo(a)pyrene 5 5.9 5.1 109.3
Indeno(123-cd)pyrene 5 4.4 4.4 87.6
Dibenz(ah)anthracene 5 5.2 5.4 105.6
Benzo(ghi)perylene 5 3.9 4.6 84.6
Compound Certified SRM 1974b
% %
Value (ng/g) Obs Conc Difference Recovery
Naphthalene 2.43 34.1 -1302.5 1402
Fluorene 0.494 2.0 -311.9 412
Phenanthrene 2.58 5.3 -106.4 206
Anthracene 0.527 1.8 -246.7 347
Fluoranthene 17.1 17.7 -3.3 103
Pyrene 18.04 18.1 -0.5 100
Benz(a)anthracene 4.74 4.3 10.3 90
Chrysene/Trphenylene 10.63 9.1 14.7 85
Benzo(b)fluoranthene 6.46 6.4 1.2 99
Benzo(k)fluoranthene 3.16 2.2 31.4 69
Benzo(a)pyrene 2.8 2.0 28.6 71
Indeno(123-cd)pyrene 2.14 1.3 38.0 62
Dibenz(ah)anthracene 0.327 0.4 -18.3 118
Benzo(ghi)perylene 3.12 2.5 20.7 79
Table 9: SRM 1974b results against untreated acetonitrile calibration standards.
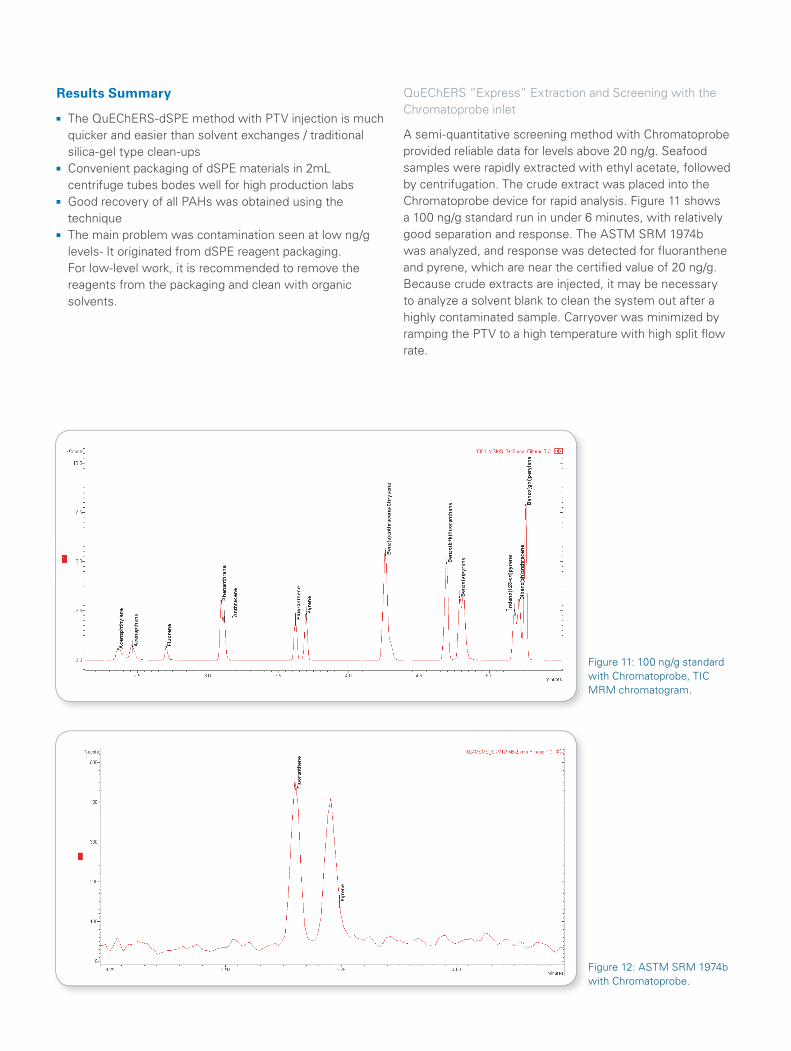
Results Summary
The QuEChERS-dSPE method with PTV injection is much quicker and easier than solvent exchanges / traditional silica-gel type clean-ups Convenient packaging of dSPE materials in 2mL
centrifuge tubes bodes well for high production labs Good recovery of all PAHs was obtained using the
technique The main problem was contamination seen at low ng/g
levels- It originated from dSPE reagent packaging. For low-level work, it is recommended to remove the reagents from the packaging and clean with organic solvents.
QuEChERS “Express” Extraction and Screening with the Chromatoprobe inlet
A semi-quantitative screening method with Chromatoprobe provided reliable data for levels above 20 ng/g. Seafood samples were rapidly extracted with ethyl acetate, followed by centrifugation. The crude extract was placed into the Chromatoprobe device for rapid analysis. Figure 11 shows a 100 ng/g standard run in under 6 minutes, with relatively good separation and response. The ASTM SRM 1974b was analyzed, and response was detected for fluoranthene and pyrene, which are near the certified value of 20 ng/g. Because crude extracts are injected, it may be necessary to analyze a solvent blank to clean the system out after a highly contaminated sample. Carryover was minimized by ramping the PTV to a high temperature with high split flow rate.
Figure 11: 100 ng/g standard with Chromatoprobe, TIC MRM chromatogram.
Figure 12: ASTM SRM 1974b with Chromatoprobe.
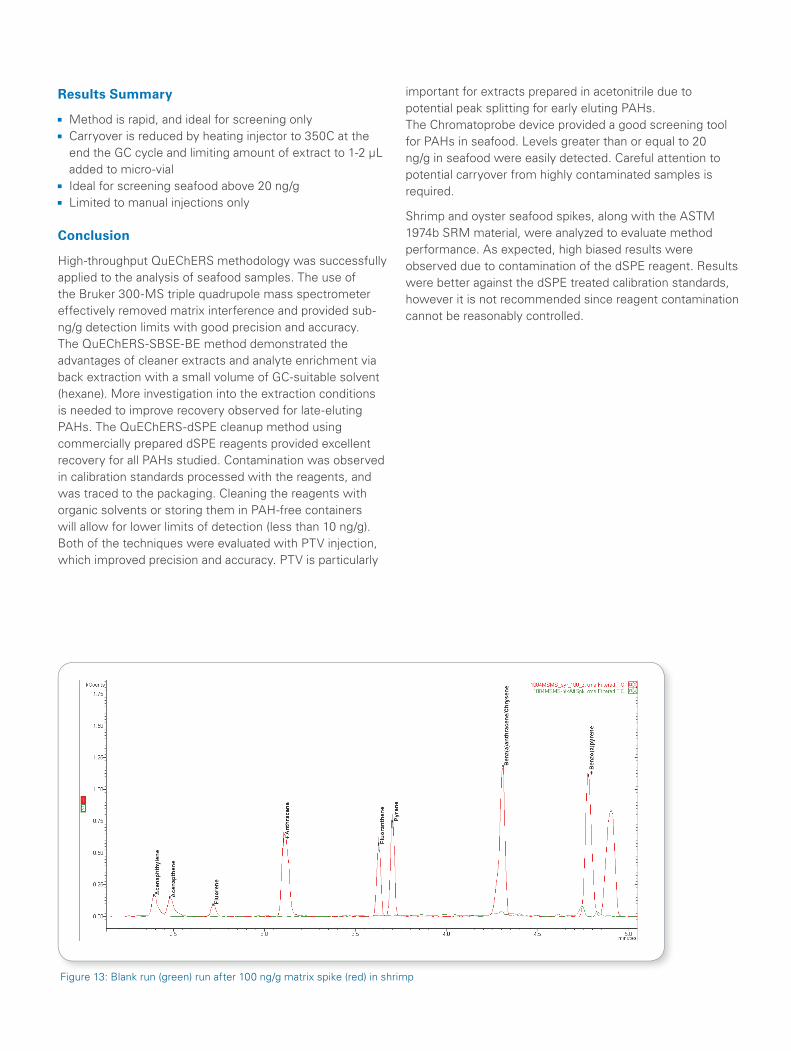
Results Summary
Method is rapid, and ideal for screening only Carryover is reduced by heating injector to 350C at the
end the GC cycle and limiting amount of extract to 1-2 µL added to micro-vial Ideal for screening seafood above 20 ng/g Limited to manual injections only
Conclusion
High-throughput QuEChERS methodology was successfully applied to the analysis of seafood samples. The use of the Bruker 300-MS triple quadrupole mass spectrometer effectively removed matrix interference and provided sub-ng/g detection limits with good precision and accuracy. The QuEChERS-SBSE-BE method demonstrated the advantages of cleaner extracts and analyte enrichment via back extraction with a small volume of GC-suitable solvent (hexane). More investigation into the extraction conditions is needed to improve recovery observed for late-eluting PAHs. The QuEChERS-dSPE cleanup method using commercially prepared dSPE reagents provided excellent recovery for all PAHs studied. Contamination was observed in calibration standards processed with the reagents, and was traced to the packaging. Cleaning the reagents with organic solvents or storing them in PAH-free containers will allow for lower limits of detection (less than 10 ng/g). Both of the techniques were evaluated with PTV injection, which improved precision and accuracy. PTV is particularly
important for extracts prepared in acetonitrile due to potential peak splitting for early eluting PAHs. The Chromatoprobe device provided a good screening tool for PAHs in seafood. Levels greater than or equal to 20 ng/g in seafood were easily detected. Careful attention to potential carryover from highly contaminated samples is required.
Shrimp and oyster seafood spikes, along with the ASTM 1974b SRM material, were analyzed to evaluate method performance. As expected, high biased results were observed due to contamination of the dSPE reagent. Results were better against the dSPE treated calibration standards, however it is not recommended since reagent contamination cannot be reasonably controlled.
Figure 13: Blank run (green) run after 100 ng/g matrix spike (red) in shrimp
Bru
ker
Dal
toni
cs is
con
tinua
lly im
prov
ing
its p
rodu
cts
and
rese
rves
the
rig
ht
to c
hang
e sp
ecifi
catio
ns w
ithou
t no
tice.
© B
ruke
r D
alto
nics
06
-201
5, G
CM
S-0
9, 1
838
159
For research use only. Not for use in diagnostic procedures.
Bruker Daltonik GmbH
Bremen · GermanyPhone +49 (0)421-2205-0Fax +49 (0)421-2205-103
Bruker Daltonics Inc.
Billerica, MA · USA Phone +1 (978) 663-3660 Fax +1 (978) 667-5993
[email protected] - www.bruker.com
References
[1] NOAA Technical Memorandum NMFS-NWFSC-59, Extraction, Cleanup, and Gas Chromatography/Mass Spectrometry Analysis of Sediments and Tissues for Organic Contaminants, Catherine A. Sloan, Donald W. Brown, Ronald W. Pearce, Richard H. Boyer, Jennie L. Bolton, Douglas G. Burrows, David P. Herman, and Margaret M. Krahn, Northwest Fisheries Science Center, Environmental Conservation Division, 2725 Montlake Blvd East, Seattle, Washington 98112, March 2004[2] M. Anastassiades, S.J. Lehotay, D. Stajnbaher and F.J. Schenck, J AOAC Int 86 (2003) 412.[3] Determination of Polycyclic Aromatic Hydrocarbons (PAHs) in Seafood using Gas Chromatography-Mass Spectrometry: A Collaborative Study Katerina Mastovski et.al., Covance Laboratories Inc., 671 S. Meridian Road, Greenfield, IN 46140[4] The QuEChERs Approach with GC-TOFMS and GCxGC-TOFMS for PAHs in Oil Contaminated Seafood; Jack Cochran, Restek Corporation, 110 Benner Circle, Bellefonte, PA 16823, Florida Pesticide Residue Workshop, 2010.[5] High Throughput Method for the Determination of PAHs in Seafood by QuEChERS-SBSE-GC-MSE; Edward A. Pfannkoch, John R. Stuff, Jeffrey H. Moran and Jacqueline A. Whitecavage GERSTEL Inc., 701 Digital Drive Suite J, Linthicum MD 21090, Public Health Laboratory, Arkansas Department of Health, 201 South Monroe Street, Little Rock Arkansas 72205.[6] Semi-Automated Stir Bar Sorptive Extraction (SBSE) in Combination with HPLC - Fluorescence Detection for the Determination of Polycyclic Aromatic Hydrocarbons in Water; Barbara Hauser, Peter Popp, Coretta Bauer, UZE-Centre for Environmental Research, Leipzig-Halle, Department of Analytical Chemistry, Permoserstr. 15, D-04318, Leipzig, Germany.