Embed Size (px)
Citation preview
Research Report UKTRP-88-11
EVALUATION OF PROCEDURES FOR TESTING AGGREGATES
by
David Q. Hunsucker Research Engineer Associate
Kentucky Transportation Center College of Engineering University of Kentucky Lexington, Kentucky
in cooperation with Kentucky Transportation Cabinet
and the Federal Highway Administration
U.S. Department of Transportation
The contents of this report reflect the views of the author who is responsible for the facts and accuracy of the data presented herein. The contents do not
necessarily reflect the official views or policies of the University of Kentucky, the Kentucky
Transportation Cabinet, nor the Federal Highway Administration. This report does not constitute
a standard, specification, or regulation.
March 1988
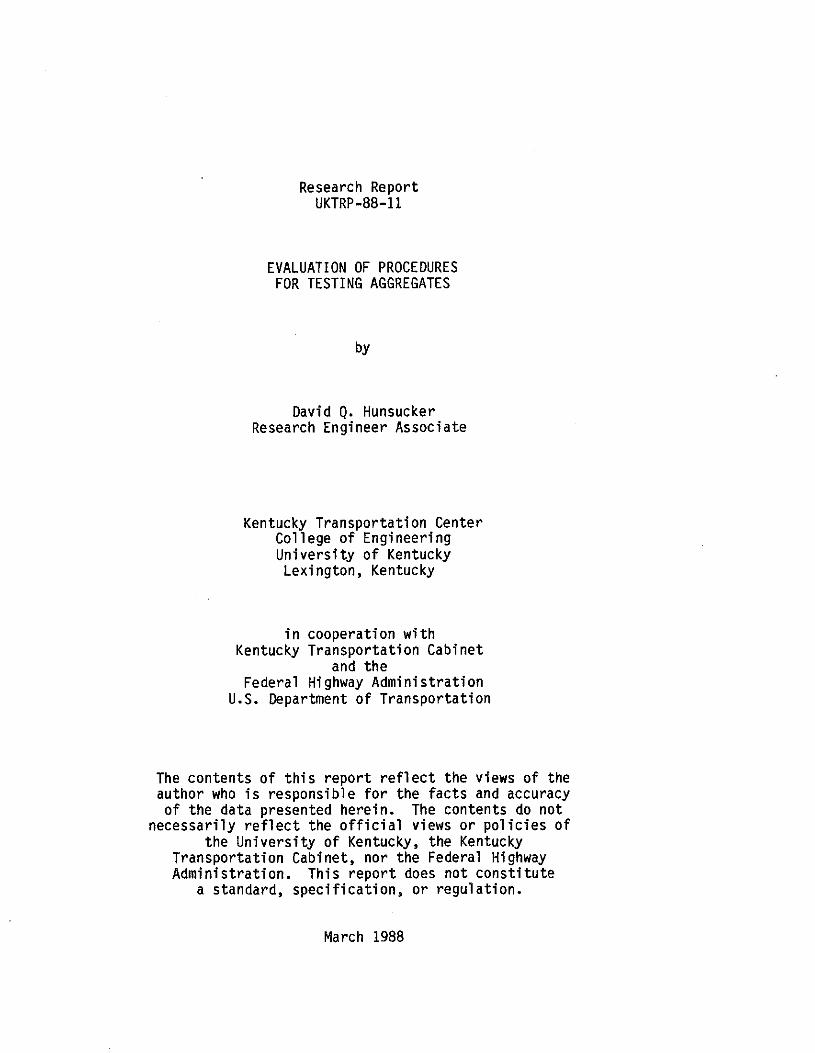
Technical Report Documentation Page
1. Report No. 2. Government Acceasion No. 3. Recipient's Cataioe No.
UKTRP-88-11 4. Title and Subtkio 5. Report Date
Evaluation of Procedures for Testing Aggregates March 1988
6. Performing Organization Code
7. Autho~s) 8. Performing Organization Report No.
David Q. Hunsucker UKTRP-88-11
9. Performing Organization Namo and Add110a 10. Work Unit No. (TRAiS)
Kentucky Transportation Research Program College of Engineering 11. Contract or Grant No.
University of Kentucky KYHPR-84-100 Lexington, KY 40506-0043
13. Typo of Report and Period Covered
Final Report ~ 12. Sponsoring Agency Name and Address
Kentucky Transportation Cabinet State Office Building 14. Sponsoring Agency Code Frankfort, KY 40622 NCP #4EBA6022
15. Supplementary Notes Prepared in cooperation with the U.S. Department of Transportation, Federal Highway Administration - Previous Reports: UKTRP-87-25, 'A Survey of States' Aggregate Soundness Specifications and Test Methods'.
16. Abstract
This report summarizes findings of a research study conducted to evaluate aggregate testing procedures as related to aggregate soundness and durability. The objectives of the study were to determine a suitable replacement or modification of Kentucky's existing Sodium Sulfate Soundness Test for aggregates which would more accurately reflect in-service performance of concrete pavements and bridges, to correlate freezing and thawing durability data and other test data with sodium sulfate soundness data, and to develop a rational implementation criterion for use of new or modified testing procedures.
There were no observable correlations between the various test methods evaluated and the Sodium Sulfate Soundness Test for aggregate types. Continued use of the soundness test, in strict accordance with Kentucky's Standard Test Method is recommended to evaluate aggregate soundness.
17. Key Words 18. Distribution Statement
Sodium Sulfate, Aggregate, Soundness, Durability, Unlimited, with approval of the Freeze-Thaw, Pore Index, Absorption, Portland Kentucky Transportation Cabinet. Cement Concrete, Asphaltic Concrete 19. Security ClassH. (of this report) 20. Security Classif. (of this page) 21. No. of Pages 22. Price
Unclassified Unclassified 95
Form DOT 1700.7 (8-72) Reproduction of completed page authorized
MILO D. BRYANT
SECRETARY
AND
tMISSIONER OF HIGHWAYS
Mr. Paul E. Toussaint Division Administrator
COMMONWEAL. TH OF KENTUCKY
TRANSPORTATION CABINET FRANKFORT, KENTUCKY 40622
Federal Highway Administration 330 West Broadway Frankfort, Kentucky 40602-0536
SUBJECT: Implementation Statement
WALLACE G. WILKINSON
GOVERNOR
February 27, 1990
. KYHPR 84-100, Evaluation of Procedures for Testing Aggregates
Dear Mr. Toussaint:
Research Report UKTRP 88-11 entitled "Evaluation of Procedures for Testing Aggregates" describes aggregate testing procedures as related to aggregate soundness and durabi 1 i ty. The primary study . objective was to determine a suitable replacement or modification of Kentucky's existing Sodium Sulfate Soundness Test that would more accurately reflect in-service performance of aggregates used in concrete pavements and bridges. Several laboratory tests. were conducted by the Kentucky Transportation Research Program and the Kentucky Department of Highways' Di vision of Materials. Results of those tests were correlated with the results of the Sodium Sulfate Soundness Test.
Results of carrel ati ons performed on the test data indicated that there were no observable correlations between the various test methods evaluated and the Sodi urn Sulfate Soundness Test for all aggregate types. Therefore, it is recommended that the Division of Materials continue testing aggregates for soundness and durability by the existing Kentucky Methods. Aggregates for use in concrete pavements should continue to be tested in accordance with ASTM C-666.
Sincerely,
State
MAN EQUAL. OPPORTUNITY EMPL.OYER M/F/H""
P.E. Engineer
TABLE OF CONTENTS
PAGE LIST OF TABLES ....................................................................... i i LIST OF FIGURES .......... 0 ........... II .. .. .. .. • • • • • • .. .. .. .. .. .. .. .. • • .. • • • • .. .. • .. .. .. .. • .. .. • i i INTRODUCTION • • • .. • • .. .. .. .. .. .. .. .. • • • .. .. • • • • .. .. .. .. .. .. . .. .. .. • • • • • • • .. • .. .. .. .. .. .. .. • • • • 1 BACKGROUND • .. .. • • • .. .. .. .. .. • • • • .. .. • .. .. .. • • • • • • .. • • .. .. • .. .. .. .. .. • • • • • • • • • • • .. • • .. • .. 1 LITERATURE REVIEW ........................................................ 2 LABORATORY TESTING .. .. • • • • • • .. .. .. • .. .. .. .. • • .. .. .. .. .. .. .. .. .. .. • .. • .. • .. .. . .. .. .. .. .. .. .. .. .. • .. 6
Sodi urn Sulfate Soundness Testing .. • • • • . . . • • • .. • .. • • . • . . • • . . • 6 Unconfined Freeze and Thaw Testing .•••.••••••••...•.•••••••• 12 Confined Freeze and Thaw Testing ·························~·· 12 Pore Index Testing ....................................................................... 16 Absorption Testing .................................................. 18 Evaluation of Shale Determination Test ...••••••.••...•...••. 18
RESULTS AND CORRELATIONS ......................................... 21 Sodi urn Sulfate Soundness Test ............................... 24 Unconfined Freeze and Thaw Test •..•.......•••.•..........••. 26 Confined Freeze and Thaw Test ..••••••••••.•..•..••••.•.•.... 28 Pore Index Test ............................................... 28
SUMMARY, CONCLUSIONS AND RECOMMENDATIONS •....•.•.•••••••••••.••.. 28 REFERENCES .......................................................... 33 APPENDIX A ............................................................. 36 APPENDIX B .••••••.......•••••••...........•••••..............••.• 52 APPENDIX C ••••••••••••••••••••••••••••••••••••••••••••••••••••••• 83
i
liST OF TABLES TABLE PAGE
1. Sample Weights for Nitric Acid Test ............................. 19 2. Nitric Acid Test Results .......................................... 20
3. Nitric Acid Test Results ........................................... 20
4. Nitric Acid Test of Shale Samples ..•..•••.•.•••••••••••••••••... 21 5. Results of Tests on No.8 Limestone Aggregates ..•••••••••••••••. 22 6. Results of Tests on No. 57 Limestone Aggregates •.••.•••.••••••.• 22 7. Results of Tests on All Other Size Limestone Aggregates .•.....•. 24 8. Results of Tests on No. 8 Crushed Gravel Aggregates ..•.......••• 25 9. Results of Tests on No. 57 Crushed Gravel Aggregates ............ 26
liST OF FIGURES FIGURE PAGE
1. Five-gallon Buckets Containing Sodium Sulfate Solution in Environmental Room at Constant Temperature ••••••••••••••••...... 7
2. Aggregate Samples Draining ...................................... 8 3. Aggregate Samples being Washed Free of Sodium Sulfate Solution 9 4. Aggregate Samples in Sodium Sulfate Solution at the Division
of Materials Laboratory ......................................... 10 5. Aggregate Samples Ready to be Drained at the Division of
Materials Laboratory .•.•.•.••••••••••.•...........•..•...•.•..•. 10 6. Aggregate Samples in Drying Oven at the Division of Materials
La·boratory . . . . . . . . . . . . . . . . . . . . . . . . . . . . . . . . . . . . . . . . . . . . . . . . . . . . . . 11
7. Aggregate Washing Facility at the Division of Materials Laboratory ................................ --.......................... 11
8. Sample Number 62-57 after 50 Cycles of Freeze-Thaw Testing ...••• 13 9. Conrad Environmental Chamber Used for Freeze-Thaw Testing ..••.•. 14
10. Freeze-Thaw Prisms in Conrad Environmental Test Chamber •••...... 14 11. Concrete Prism being Tested for Fundamental Transverse Frequency
with Soil test Sonometer .......................................... 15
12. Concrete Prism being Measured for Length Change in a Dial Stand • 15 13. Pore Index Apparatus ................................................. 17
14. Limestone Aggregate after Five Cycles of Sodium Sulfate Soundness Testing ............... o o .... o .................. o ..... o ............. 27
15. Close-up of Deteriorated Limestone Aggregate Particle after Five Cycles of Sodium Sulfate Soundness Testing •...•.•..•••......•... 27
i i
LIST OF FIGURES{cont.) FIGURE PAGE
16. Aggregate Pop-out Associated with Freeze-thaw Damage of Concrete Prism ...................................................................... 29
17. Cracking of Concrete Prism Assoc1ated with Freeze-Thaw Damage ••• 29
18. Relationship between KDOH Sodium Sulfate Soundness Loss and KTRP Sodium Sulfate Loss for No. 8 Limestone Aggregate ••..••..••••••• 37
19. Relationship between KDOH Sodium Sulfate Soundness Loss and KTRP Sodium Sulfate Loss for No. 57 Limestone Aggregate •••••••.••.... 37
20. Relationship between KDOH Sodium Sulfate Soundness Loss and KTRP Sodium Sulfate Loss for All Other Size Limestone Aggregate .••••• 38
21. Relationship between KDOH Sodium Sulfate Soundness Loss and KTRP Sodium Sulfate Loss for No. 8 Crushed Gravel Aggregate ••••••••.• 38
22. Relationship between KDOH Sodium Sulfate Soundness Loss and KTRP Sodium Sulfate Loss for No. 57 Crushed Gravel Aggregate ..•..••.• 39
23. Relationship between Unconfined Freeze-Thaw Loss and KDOH Sodium Sulfate Soundness Loss for No. 8 Limestone Aggregate ..•.....•••. 39
24. Relationship between Unconfined Freeze-Thaw Loss and KTRP Sodium Sulfate Soundness Loss for No. 8 Limestone Aggregate •••••••••... 40
25. Relationship between Unconfined Freeze-Thaw Loss and KDOH Sodium Sulfate Soundness Loss for No. 57 Limestone Aggregate •...•••••.• 40
26. Relationship between Unconfined Freeze-Thaw Loss and KTRP Sodium Sulfate Soundness Loss for No. 57 Limestone Aggregate •....•.•... 41
27. Relationship between Unconfined Freeze-Thaw Loss and KDOH Sodium Sulfate Soundness Loss for All Other Size Limestone Aggregate .•. 41
28. Relationship between Unconfined Freeze-Thaw Loss and KTRP Sodium Sulfate Soundness- Loss for All Other Size Limestone Aggregate •.• 42
29. Relationship between Unconfined Freeze-Thaw Loss and KDOH Sodium Sulfate Soundness Loss for No. 8 Crushed Gravel Aggregate .•...•. 42
30. Relationship between Unconfined Freeze-Thaw Loss and KDOH Sodium Sulfate Soundness Loss for No. 57 Crushed Gravel Aggregate ; ..... 43
31. Relationship between Unconfined Freeze-Thaw Loss and KTRP Sodium Sulfate Soundness Loss for No. 57 Crushed Gravel Aggregate •..•.. 43
32. Relationship between Unconfined Freeze-Thaw Loss and Pore Index for No. 8 Limestone Aggregate ................................... 44
33. Relationship between Unconfined Freeze-Thaw Loss and Pore Index for No. 57 Limestone Aggregate .................................. 44
iii
liST OF FIGURES(cont.)
FIGURE PAGE 34. Relationship between Unconfined Freeze-Thaw Loss and Pore Index
for All Other Size Limestone Aggregate ••..•.•.•••••••....•••••.• 45 35. Relationshfp between Unconfined Freeze-Thaw Loss and Pore Index
for No. 8 Crushed Gravel Aggregate •••...•.•••••••••....•••••..•• 45 36. Relationship between Unconfined Freeze-Thaw Loss and Pore Index
for No. 57 Crushed Gravel Aggregate .....••.•.••.•••.••••...••••• 46 37. Relationship between Durability Factor and Expansion of
Concrete Prism for No.8 Limestone Aggregate ••••..•..•••••...••• 46 38. Relationship between Durability Factor and Expansion of
Concrete Prism for No. 57 Limestone Aggregate .•••••••••••••••••• 47 39. Relationship between Durability Factor and Expansion of
Concrete Prism for All Other Size Limestone Aggregate ..•.•.•.•.• 47 40. Relationship between Durability Factor and Expansion of
Concrete Prism for No.8 Crushed Gravel Aggregate ....••.••.•..•• 48 41. Relationship between Durability Factor and Expansion of
Concrete Prism for No. 57 Crushed Gravel Aggregate ......••...... 48 42. Relationship between Absorption and Pore Index for No. 8
Limestone Aggregate ............................................. 49 43. Relationship between Absorption and Pore Index for No. 57
Limestone Aggregate ................................................ 49
44. Relationship between Absorption and Pore Index for All Other Size Limestone Aggregate ................................................. 50
45. Relationship between Absorption and Pore Index for No. 8 Crushed Gravel Aggregate ...•••..•.....•.••...•......••......•••. 50
--46. Relationship between Absorption and Pore Index for No. 57 Crushed Grave 1 Aggregate ••.•.•...•.••.•.•......•••••••...•..••.. 51
iv
INTRODUCTION
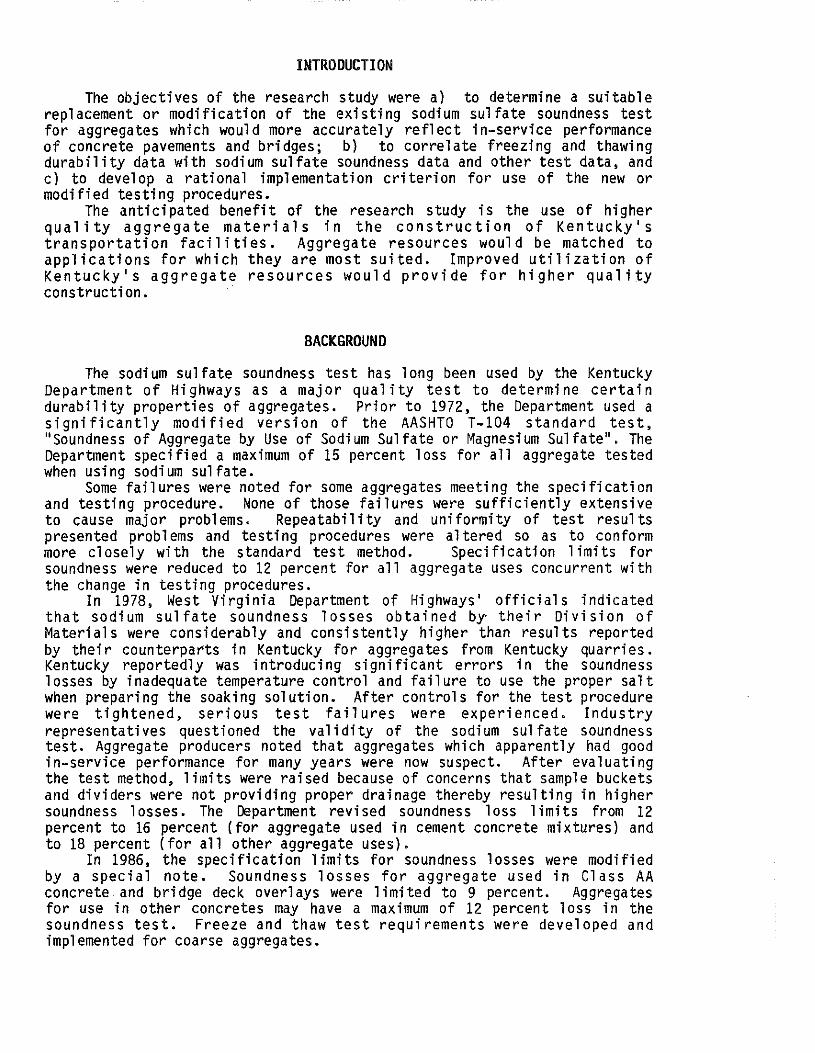
The objectives of the research study were a) to determine a suitable replacement or modification of the existing sodium sulfate soundness test for aggregates which would more accurately reflect in-service performance of concrete pavements and bridges; b) to correlate freezing and thawing durability data with sodium sulfate soundness data and other test data, and c) to develop a rational implementation criterion for use of the new or modified testing procedures.
The anticipated benefit of the research study is the use of higher quality aggregate materials in the construction of Kentucky's transportation facilities. Aggregate resources would be matched to applications for which they are most suited. Improved utilization of Kentucky's aggregate resources would provide for higher quality construction. ·
BACKGROUND
The sodium sulfate soundness test has 1 ong been used by the Kentucky Department of Highways as a major quality test to determine certain durability properties of aggregates. Prior to 1972, the Department used a significantly modified version of the AASHTO T-104 standard test, "Soundness of Aggregate by Use of Sodium Sulfate or Magnesium Sulfate". The Department specified a maximum of 15 percent loss for all aggregate tested when using sodium sulfate.
Some failures were noted for some aggregates meeting the specification and testing procedure. None of those failures were sufficiently extensive to cause major prob 1 ems. Repeatabi 1 i ty and uniformity of test results presented problems and testing procedures were altered so as to conform more closely with the standard test method. Specification 1 imits for soundness were reduced to 12 percent for all aggregate uses concurrent with the change in testing procedures.
In 1978, West Virginia Department of Highways' officials indicated that sodium sulfate soundness losses obtained by their Division of Materia 1 s were considerably and consistently higher than results reported by their counterparts in Kentucky for aggregates from Kentucky quarries. Kentucky reportedly was introducing si gni fi cant errors in the soundness losses by inadequate temperature control and failure to use the proper salt when preparing the soaking solution. After controls for the test procedure were tightened, serious test failures were experienced. Industry representatives questioned the validity of the sodium sulfate soundness test. Aggregate producers noted that aggregates which apparently had good in-service performance for many years were now suspect. After evaluating the test method, limits were raised because of concerns that sample buckets and dividers were not providing proper drainage thereby resulting in higher soundness 1 osses. The Department revised soundness 1 oss 1 imi ts from 12 percent to 16 percent (for aggregate used in cement concrete mixtures) and to 18 percent (for all other aggregate uses).
In 1986, the specification limits for soundness losses were modified by a special note. Soundness losses for aggregate used in Class AA concrete and bridge deck overlays were 1 imi ted to 9 percent. Aggregates for use in other concretes may have a maximum of 12 percent 1 oss in the soundness test. Freeze and thaw test requirements were developed and implemented for coarse aggregates.
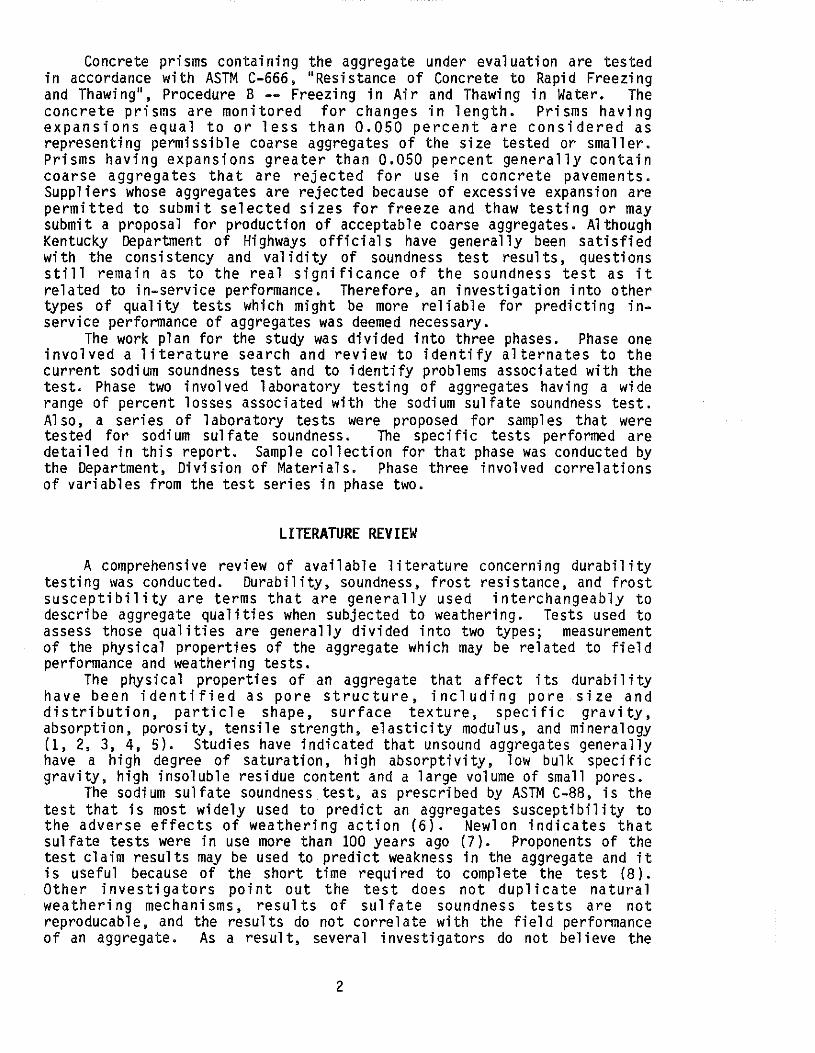
Concrete prisms containing the aggregate under evaluation are tested in accordance with ASTM C-666, "Resistance of Concrete to Rapid Freezing and Thawing", Procedure B -- Freezing in Air and Thawing in Water. The concrete prisms are monitored for changes in length. Prisms having expansions equal to or less than 0.050 percent are considered as representing permi ssi b 1 e coarse aggregates of the size tested or smaller. Prisms having expansions greater than 0.050 percent generally contain coarse aggregates that are rejected for use in concrete pavements. Suppliers whose aggregates are rejected because of excessive expansion are permitted to submit selected sizes for freeze and thaw testing or may submit a proposal for production of acceptable coarse aggregates. Although Kentucky Department of Highways officials have generally been satisfied with the consistency and validity of soundness test results, questions still remain as to the real significance of the soundness test as it related to in-service performance. Therefore, an investigation into other types of quality tests which might be more reliable for predicting inservice performance of aggregates was deemed necessary.
The work plan for the study was divided into three phases. Phase one involved a literature search and review to identify alternates to the current sodium soundness test and to identify problems associated with the test. Phase two involved 1 aboratory testing of aggregates having a wide range of percent losses associated with the sodium sulfate soundness test. Also, a series of laboratory tests were proposed for samples that were tested for sodium sulfate soundness. The specific tests performed are detailed in this report. Sample collection for that phase was conducted by the Department, Division of Materials. Phase three involved correlations of variables from the test series in phase two.
LITERATURE REVIEW
A comprehensive review of available literature concerning durability testing was conducted. Durability, soundness, frost resistance, and frost susceptibility are terms that are generally used interchangeably to describe aggregate qua 1 i ties whe.n subjected to weathering. Tests used to assess those qualities are generally divided into two types; measurement of the physical properties of the aggregate which may be related to field performance and weathering tests.
The physi ca 1 properties of an aggregate that affect its durability have been identified as pore structure, including pore size and distribution, particle shape, surface texture, specific gravity, absorption, porosity, tensile strength, elasticity modulus, and mineralogy (1, 2, 3, 4, 5). Studies have indicated that unsound aggregates generally have a high degree of saturation, high absorptivity, low bulk specific gravity, high insoluble residue content and a large volume of small pores.
The sodium sulfate soundness test, as prescribed by ASTM C-88, is the test that is most widely used to predict an aggregates susceptibility to the adverse effects of weathering action (6). Newlon indicates that sulfate tests were in use more than 100 years ago (7). Proponents of the test claim results may be used to predict weakness in the aggregate and it is useful because of the short time required to complete the test (8). Other investigators point out the test does not duplicate natural weathering mechanisms, results of sulfate soundness tests are not reproducab 1 e, and the results do not corre 1 ate with the field performance of an aggregate. As a result, several investigators do not believe the
2
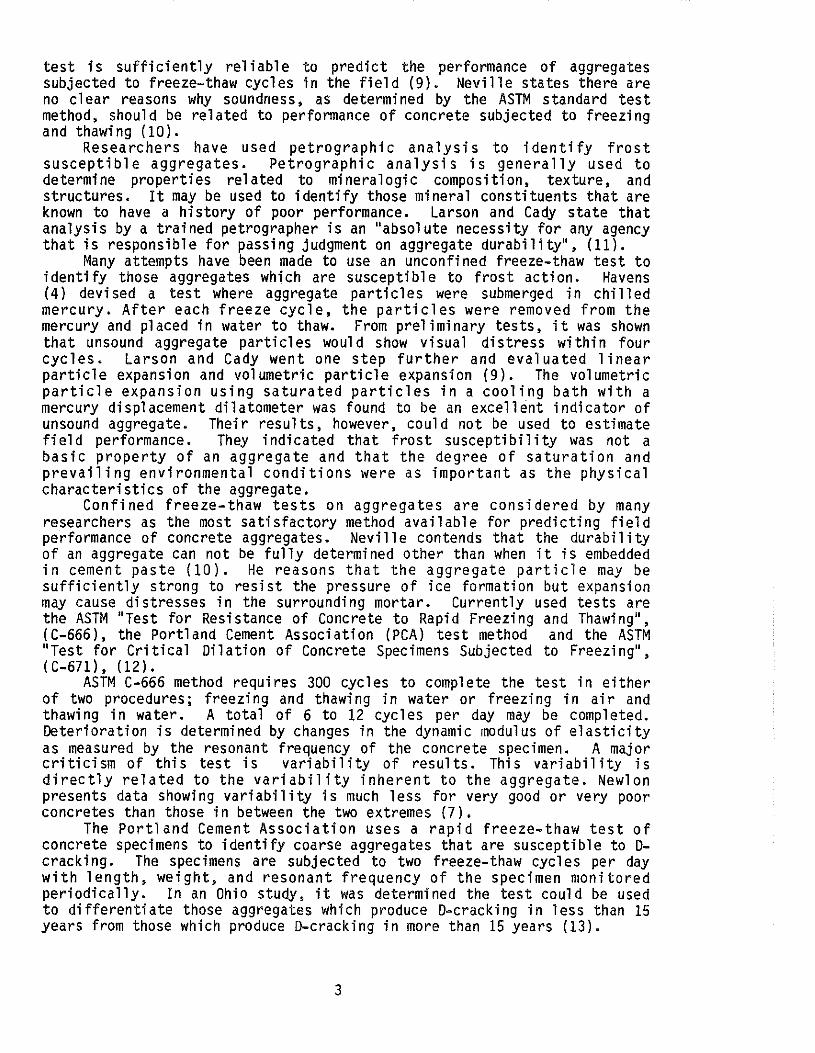
test is sufficiently reliable to predict the performance of aggregates subjected to freeze-thaw cycles in the field (9). Neville states there are no clear reasons why soundness, as determined by the ASTM standard test method, should be related to performance of concrete subjected to freezing and thawing (10).
Researchers have used petrographic analysis to identify frost susceptible aggregates. Petrographic analysis is generally used to determine properties related to mineralogic composition, texture, and structures. It may be used to identify those mineral constituents that are known to have a history of poor performance. Larson and Cady state that analysis by a trained petrographer is an "absolute necessity for any agency that is responsible for passing judgment on aggregate durability", (11).
Many attempts have been made to use an unconfined freeze-thaw test to identify those aggregates which are susceptible to frost action. Havens ( 4) de vi sed a test where aggregate particles were submerged in chi 11 ed mercury. After each freeze cycle, the particles were removed from the mercury and placed in water to thaw. From preliminary tests, it was shown that unsound aggregate particles would show visual distress within four cycles. Larson and Cady went one step further and evaluated linear particle expansion and volumetric particle expansion (9). The volumetric particle expansion using saturated particles in a cooling bath with a mercury displacement dilatometer was found to be an excellent indicator of unsound aggregate. Their results, however, could not be used to estimate field performance. They indicated that frost susceptibility was not a basic property of an aggregate and that the degree of saturation and prevailing environmental conditions were as important as the physical characteristics of the aggregate.
Confined freeze-thaw tests on aggregates are considered by many researchers as the most satisfactory method available for predicting field performance of concrete aggregates. Nevi 11 e contends that the durabi 1 i ty of an aggregate can not be fully determined other than when it is embedded in cement paste (10). He reasons that the aggregate particle may be sufficiently strong to resist the pressure of ice formation but expansion may cause distresses in the surrounding mortar. Currently used tests are the ASTM "Test for Resistance of Concrete to Rapid Freezing and Thawing", ( C-666), the Portland Cement Association ( PCA) test method and the ASTM "Test for Critical Dilation of Concrete Specimens Subjected to Freezing", ( C-671) , ( 12) .
ASTM C-666 method requires 300 cycles to complete the test in either of two procedures; freezing and thawing in water or freezing in air and thawing in water. A total of 6 to 12 cycles per day may be completed. Deterioration is determined by changes in the dynamic modulus of elasticity as measured by the resonant frequency of the concrete specimen. A major criticism of this test is variability of results. This variability is directly related to the variability inherent to the aggregate. Newlon presents data showing vari abi 1 i ty is much 1 ess for very good or very poor concretes than those in between the two extremes (7).
The Portland Cement Association uses a rapid freeze-thaw test of concrete specimens to identify coarse aggregates that are susceptible to Dcracking. The specimens are subjected to two freeze-thaw cycles per day with length, weight, and resonant frequency of the specimen monitored periodically. In an Ohio study, it was determined the test could be used to differentiate those aggregates which produce D-cracking in less than 15 years from those which produceD-cracking in more than 15 years (13).
3
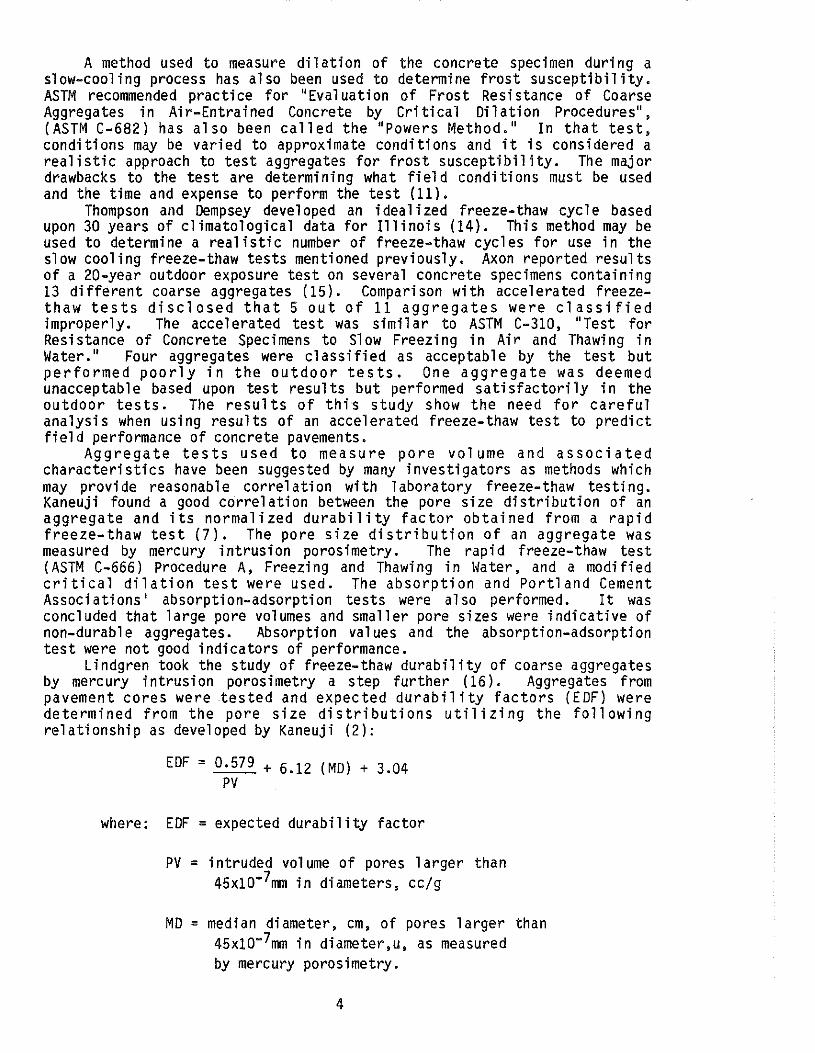
A method used to measure dilation of the concrete specimen during a slow-cooling process has also been used to determine frost susceptibility. ASTM recommended practice for "Evaluation of Frost Resistance of Coarse Aggregates in Air-Entrained Concrete by Cri tical Dilation Procedures", (ASTM C-682) has also been called the "Powers Method.'' In that test, conditions may be varied to approximate conditions and it is considered a realistic approach to test aggregates for frost susceptibility. The major drawbacks to the test are determining what field conditions must be used and the time and expense to perform the test (11).
Thompson and Dempsey developed an idealized freeze-thaw cycle based upon 30 years of climatological data for Illinois (14). This method may be used to determine a realistic number of freeze-thaw cycles for use in the slow cooling freeze-thaw tests mentioned previously. Axon reported results of a 20-year outdoor exposure test on several concrete specimens containing 13 different coarse aggregates ( 15). Comparison with accelerated freezethaw tests disclosed that 5 out of 11 aggregates were classified improperly. The accelerated test was similar to ASTM C-310, "Test for Resistance of Concrete Specimens to Slow Freezing in Air and Thawing in Water." Four aggregates were classified as acceptable by the test but performed poorly in the outdoor tests. One aggregate was deemed unacceptable based upon test results but performed satisfactorily in the outdoor tests. The results of this study show the need for careful analysis when using results of an accelerated freeze-thaw test to predict field performance of concrete pavements.
Aggregate tests used to measure pore volume and associated characteristics have been suggested by many investigators as methods which may pro vi de reasonab 1 e correlation with 1 aboratory freeze-thaw testing. Kaneuji found a good correlation between the pore size distribution of an aggregate and its normalized durability factor obtained from a rapid freeze-thaw test (7). The pore size distribution of an aggregate was measured by mercury intrusion porosimetry. The rapid freeze-thaw test ( ASTM C-666) Procedure A, Freezing and Thawing in Water, and a modified critical dilation test were used. The absorption and Portland Cement Associations' absorption-adsorption tests were also performed. It was concluded that large pore volumes and smaller pore sizes were indicative of non-durab 1 e aggregates. Absorption values and the absorption-adsorption test were not good indicators of performance.
Lindgren took the study of freeze-thaw durability of coarse aggregates by mercury intrusion porosimetry a step further (16). Aggregates from pavement cores were tested and expected durability factors (EDF) were determined from the pore size distributions utilizing the following relationship as developed by Kaneuji (2):
EDF = 0.579 + 6.12 (MD) + 3.04 PV
where: EDF =expected durability factor
PV = intruded volume of pores larger than 45xlo-7mm in diameters, cc/g
MD = median diameter, em, of pores larger than 45x1o-7mm in diameter,u, as measured by mercury porosimetry.
4
An average (EDF) value was assigned to each pavement associated with the cores. A good correlation was observed between the field performance and the average EDF values. It was determined that a pavement would most probably be durable for at least thirty years if its coarse aggregate had an EDF value greater than 50 for 90 percent or more of its aggregate. Lindgren concluded also that durability, as predicted by the EDF test, was a more accurate indicator of the durability of the coarse aggregate in a pavement than was the aggregate's 24-hour absorption.
Larson and Cady collected permeability, porosity, and absorption data on several aggregates and correlated those data with a test of average dilation per cycle in the slow cooling test. Analyses of those correlations revealed that vacuum saturated absorption values of less than one percent indicated durable aggregates while va 1 ues of more than five percent indicated non-durable aggregates (11).
Dolch lists several types of analyses to determine pore shape, equivalent pore size distribution, and pore size (17). Permeability and absorptivity must be measured to determine equivalent pore size, the porosity and specific surface. The absorptivity is determined by the rate at which water is imbibed by capi 11 ari ty. Dolch suggested the ratio of absorptivity to permeability as a measure of frost susceptibility.
Traylor investigated D-cracking in Illinois and determined that freeze-thaw of coarse aggregate was the root of the problem (1). Illinois DOT utilized both the Iowa Pore Index Test and the PCA Freeze-Thaw Test. Both crushed stone and gravels were tested in the study. A relationship between high pore index values and decreased field performance was observed for the crushed stones tested. There was no well defined correlation between field performance and pore index for gravels. The PCA Freeze-Thaw Test provided much more di sti net and decisive results than the Pore Index Test. The relationship between percent expansion and field performance was very pronounced. The major conclusion from Traylor's study was the PCA Freeze-Thaw test provided an accurate estimation of the durability of an aggregate when durability is defined in terms of resistance to D-cracking.
f4arks and Dubberke also utilized the Iowa Pore Index test to assess durability of concrete aggregates (18). The test was very effective in identifying aggregates having a substantial pore system of the 0.04-to 2-micron diameter size and correlated well with service records of nonargillaceous coarse aggregates used in portland cement concrete (PCC) pavements. They indicated that when 15 percent or more of the coarse aggregate particles were non durable, the PCC would probably exhibit Dcracking. They also concluded that non-durable coarse aggregates are generally fine grained and aggregates having good to exce 11 ent service records were generally coarse grained or extremely fine grained.
Iowa studies of other tests, including the sodium sulfate, magnesium sulfate, absorption-adsorption, and freeze-thaw of aggregates, indicated poor correlations of those test results with aggregate service records ( 18). Results of a modified ASTM C-666 Method B Procedure correlated well with aggregate performance but that test required nearly five months for completion.
There have been many suggestions made to improve the durability of aggregates in a freeze-thaw environment. Kaneuji recognized the effect of variability on the durability of aggregates on a quarry face and recommended sampling of individual ledges instead of stockpiles (2). Kansas researchers determined that reducing the maximum size aggregate decreased the rate at which D-cracking developed in concrete pavements (19). It also was concluded that pavements having limestone coarse
5
aggregate in excess of 35 percent were more 1 ike ly to be D-cracked than pavements having less than 35 percent limestone coarse aggregate.
Cady and others studied upgrading 1 ow-qua 1 i ty aggregates for use in portland cement concrete pavements (20). The upgrading procedures studied were impregnation, coating, and chemical treatment. They concluded that freeze-thaw sensitive aggregates could be rendered innocuous by impregnation or coating by using a variety of treatment materials; aggregates susceptible to D-cracking problems could be successfully upgraded with certain polymer impregnates; expansion of concrete due to alkali-carbonate reactivity could be significantly reduced by means of admixtures that provide suitable interfering cations in solution; and, some treatment materials appeared to have a detrimental effect on the mechanical properties of concrete mixtures. It was sus pi ci oned this could be remedied by taking appropriate corrective action in mixture design procedures.
An annotated bibliography appears in Appendix B.
LABORATORY TESTING
The search for a suitable test to measure an aggregate's durabi 1 i ty was influenced by a desire to formulate a test procedure that would yield
·data which would correlate well with the sodium sulfate soundness test data. Several physical aggregate test were considered, including absorption and unconfined freeze-thaw testing of discrete aggregate particles.
Sodium Sulfate Soundness Testing
A number of aggregate samples were tested for sodium sulfate soundness in general accordance with ASTM C-88-83 Standard Test Method, "Soundness of Aggregates by lJse of Sodium Sulfate or Magnesium Sulfate." All aggregate samples for testing were obtained by Kentucky Department of Highways, Division of Materials' personnel at the quarry sites.
Equipment used for sodium sulfate soundness tests included sieves conforming to ASTM E-ll (21) for sieve analysis of coarse aggregate samples, containers for immersing samples of aggregate in the solution, containers for the solution, an environmental room for temperature control, balances, an oven, and hydrometers conforming to the requirements set forth in ASTM E-100 (22).
Sieve analyses of the coarse aggregate samples were performed in accordance with ASTM C-136 (23). A sieve analysis is necessary so that the weighted percentage loss may be calculated at the end of the testing program.
Containers used to confine the aggregate samples for immersion in the sodium sulfate solution were aluminum cake pans. The pans were doubled to pro vi de ri gi di ty. Ho 1 es were drilled through the bottom of the pans to permit access of the solution to the aggregate and to allow for drainage of the sulfate solution from the sample without any loss of aggregate particles.
The containers used to confine the solution were plastic five-gallon paint buckets. The sodium sulfate sol uti on was prepared by mixing anhydrous salt (Na 2so4 ) with water. The rate of mixing was 350 grams anhydrous salt per liter of water. It was determined that 12 liters of water would pro vi de sufficient so 1 uti on to cover the aggregate samples. The anhydrous salt was dissolved in water at an average temperature of
6
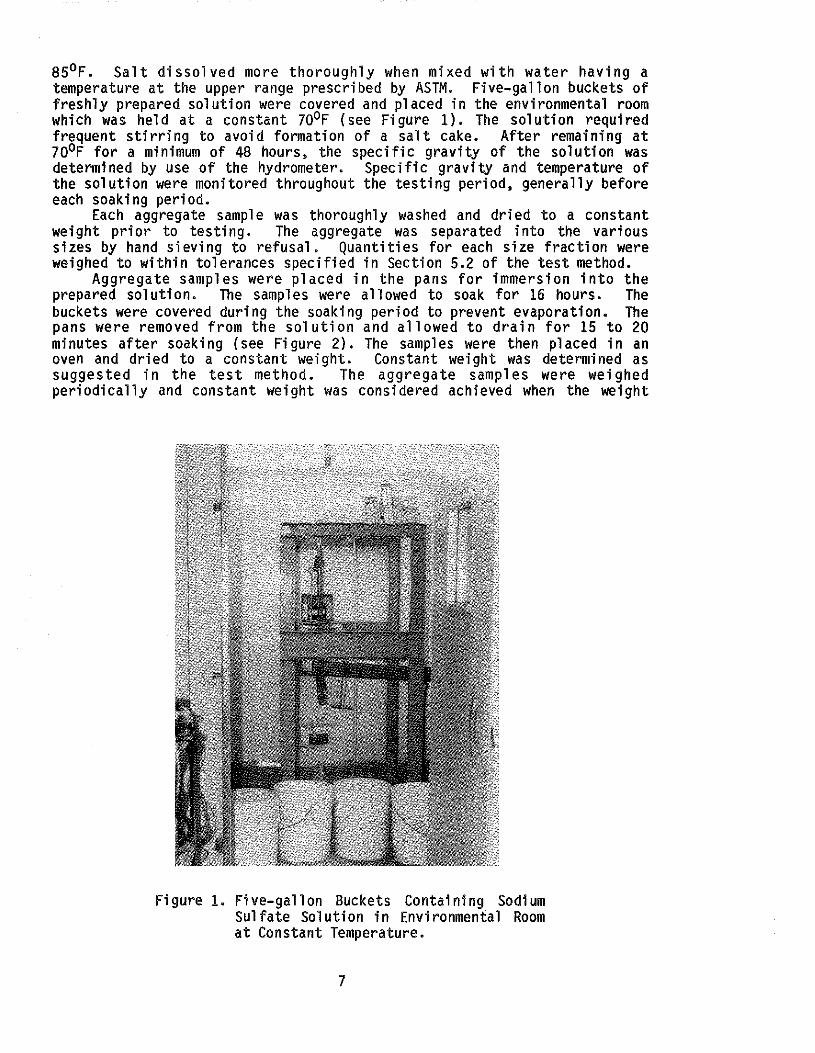
85°F. Salt dissolved more thoroughly when mixed with water having a temperature at the upper range prescribed by ASTM. Five-gallon buckets of freshly prepared solution were covered and placed in the environmental room which was held at a constant 70°F (see Figure 1). The sol uti on required frequent stirring to avoid formation of a salt cake. After remaining at 70°F for a minimum of 48 hours, the specific gravity of the solution was determined by use of the hydrometer. Specific gravity and temperature of the solution were monitored throughout the testing period, generally before each soaking period.
Each aggregate sample was thoroughly washed and dried to a constant weight prior to testing. The aggregate was separated into the various sizes by hand sieving to refusal. Quantities for each size fraction were weighed to within tolerances specified in Section 5.2 of the test method.
Aggregate samples were placed in the pans for immersion into the prepared solution. The samples were allowed to soak for 16 hours. The buckets were covered during the soaking period to prevent evaporation. The pans were removed from the solution and allowed to drain for 15 to 20 minutes after soaking (see Figure 2). The samples were then placed in an oven and dried to a constant weight. Constant weight was determined as suggested in the test method. The aggregate samples were weighed periodically and constant weight was considered achieved when the weight
Figure 1. Five-gallon Buckets Containing Sodium Sulfate Sol uti on in Environmental Room at Constant Temperature.
7
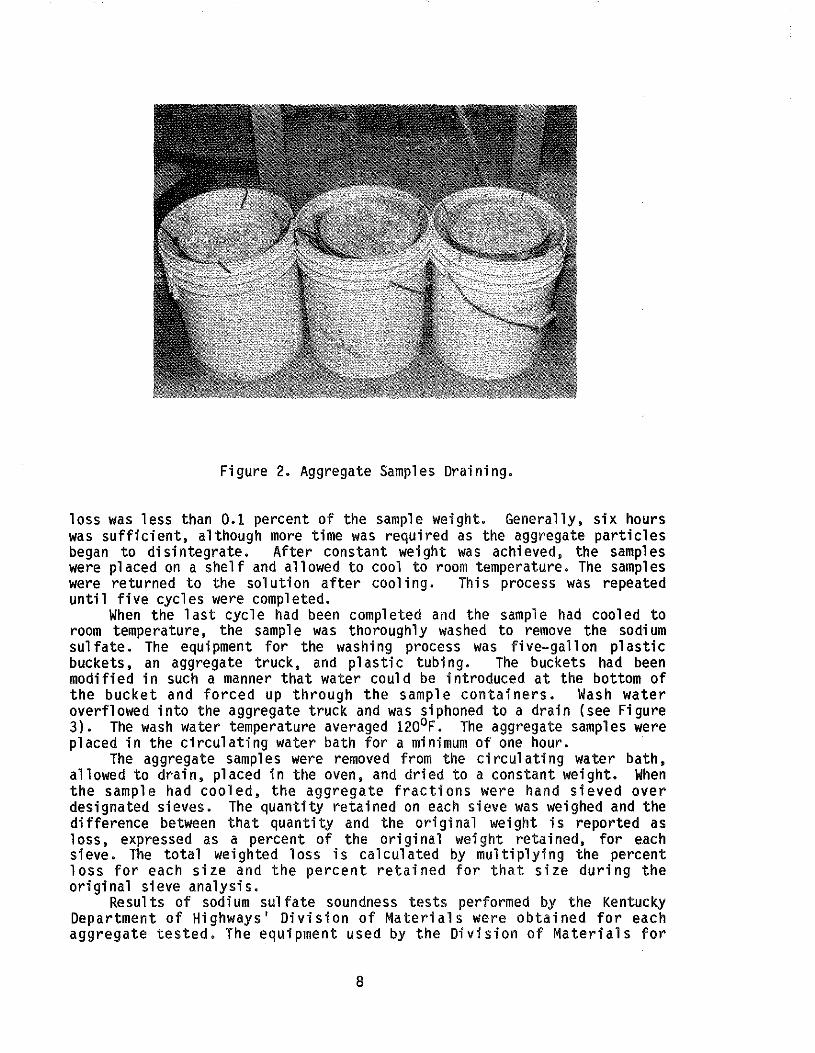
Figure 2. Aggregate Samples Draining.
loss was less than D.l percent of the sample weight. Generally, six hours was sufficient, although more time was required as the aggregate particles began to disintegrate. After constant weight was achieved, the samples were placed on a shelf and allowed to cool to room temperature. The samples were returned to the solution after cooling. This process was repeated until five cycles were completed.
When the last cycle had been completed and the sample had cooled to room temperature, the sample was thoroughly washed to remove the sodium sulfate. The equipment for the washing process was five-gall on plastic buckets, an aggregate truck, and plastic tubing. The buckets had been modified in such a manner that water could be introduced at the bottom of the bucket and forced up through the sample containers. Wash water overflowed into the aggregate truck and was siphoned to a drain (see Figure 3). The wash water temperature averaged 120°F. The aggregate samples were placed in the circulating water bath for a minimum of one hour.
The aggregate samples were removed from the ci rcul ati ng water bath, allowed to drain, placed in the oven, and dried to a constant weight. When the sample had cooled, the aggregate fractions were hand sieved over designated sieves. The quantity retained on each sieve was weighed and the difference between that quantity and the original weight is reported as loss, expressed as a percent of the original weight retained, for each sieve. The total weighted loss is calculated by multiplying the percent loss for each size and the percent retained for that size during the original sieve analysis.
Results of sodi urn sulfate soundness tests performed by the Kentucky Department of Highways' Division of Materials were obtained for each aggregate tested. The equipment used by the Division of Materials for
8
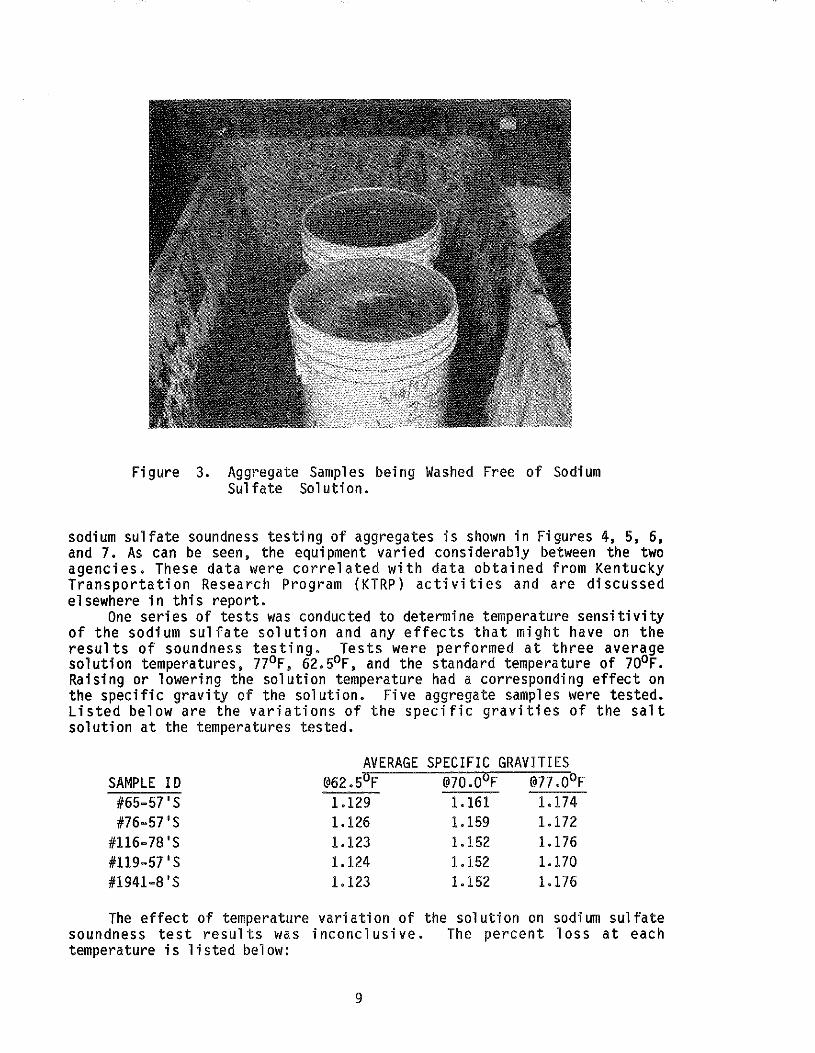
Figure 3. Aggregate Samples being Washed Free of Sodium Sulfate Solution.
sodium sulfate soundness testing of aggregates is shown in Figures 4, 5, 6, and 7. As can be seen, the equipment varied considerably between the two agencies. These data were correlated with data obtained from Kentucky Transportation Research Program (KTRP) activities and are discussed elsewhere in this report.
One series of tests was conducted to determine temperature sensitivity of the sodium sulfate solution and any effects that might have on the results of soundness testing. Tests were performed at three average solution temperatures, 77°F, 62.5°F, and the standard temperature of 70°F. Raising or lowering the solution temperature had a corresponding effect on the specific gravity of the solution. Five aggregate samples were tested. Listed below are the variations of the specific gravities of the salt solution at the temperatures tested.
AVERAGE SPECIFIC GRAVITIES SAMPLE I D @62.5°F @70.0°F @77 .0°F #65-57'S 1.129 1.161 1.174 #76-57'S 1.126 1.159 1.172
#116-78'S 1.123 1.152 1.176 #119-57 's 1.124 1.152 1.170 #1941-8'S 1.123 1.152 1.176
The effect of temperature variation of the solution on sodium sulfate soundness test results was inconclusive. The percent loss at each temperature is listed below:
9
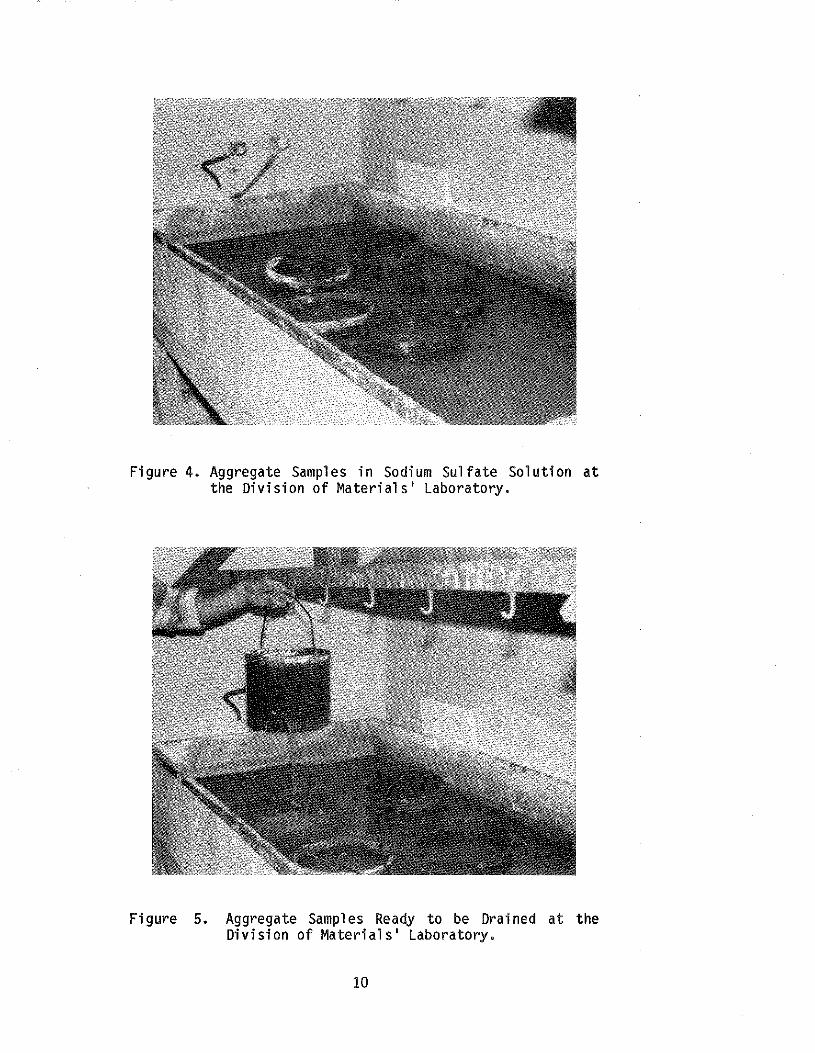
Figure 4. Aggregate Samples in Sodium Sulfate Solution at the Division of Materials' Laboratory.
Figure 5. Aggregate Samples Ready to be Drained at the Division of Materials' Laboratory.
10
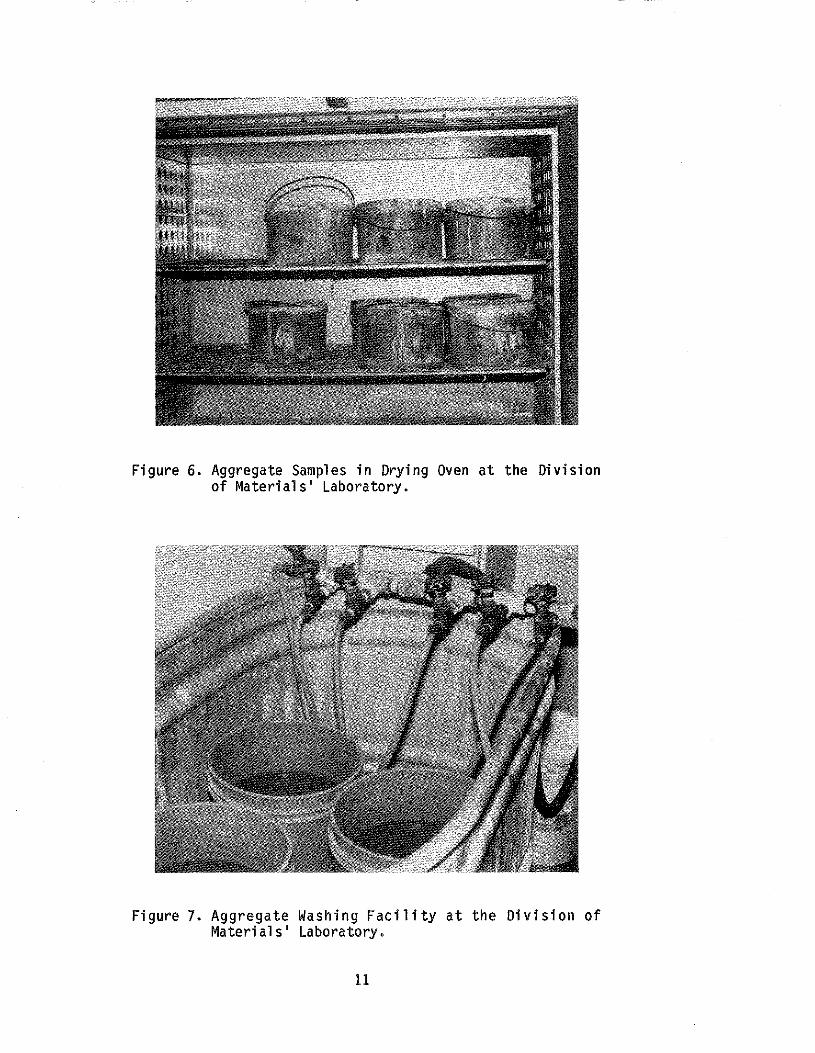
Figure 6. Aggregate Samples in Drying Oven at the Division of Materials' Laboratory.
Figure 7. Aggregate Washing Facility at the Division of Materials' Laboratory.
11
AVERAGE PERCENT LOSS KY METHOD ASTM C-88
SAMPLE ID KDOH @62.5°F @70.0°F @77 .o°F #65-57'S 12.0 9.5 12.3 12.1 #76-57'S 3.0 2.3 4.2 2.5
#116-78'S 9.0 11.4 12.0 11.3 #119-57' s 1.0 3.5 2.6 1.7 #1941-8'S 6.0 6.7 6.2 11.4
Unconfined Freeze and Thaw Testing
Freeze and thaw testing of individual aggregate particles was performed in accordance with AASHTO T 103-78 (1982), "Soundness of Aggregates by Freezing and Thawing." Procedure A (Total Immersion) of that test method was used. Freezing equipment used for this test was a Conrad En vi ronmenta 1 Test Chamber. The machine has the capabilities to perform the test satisfactorily.
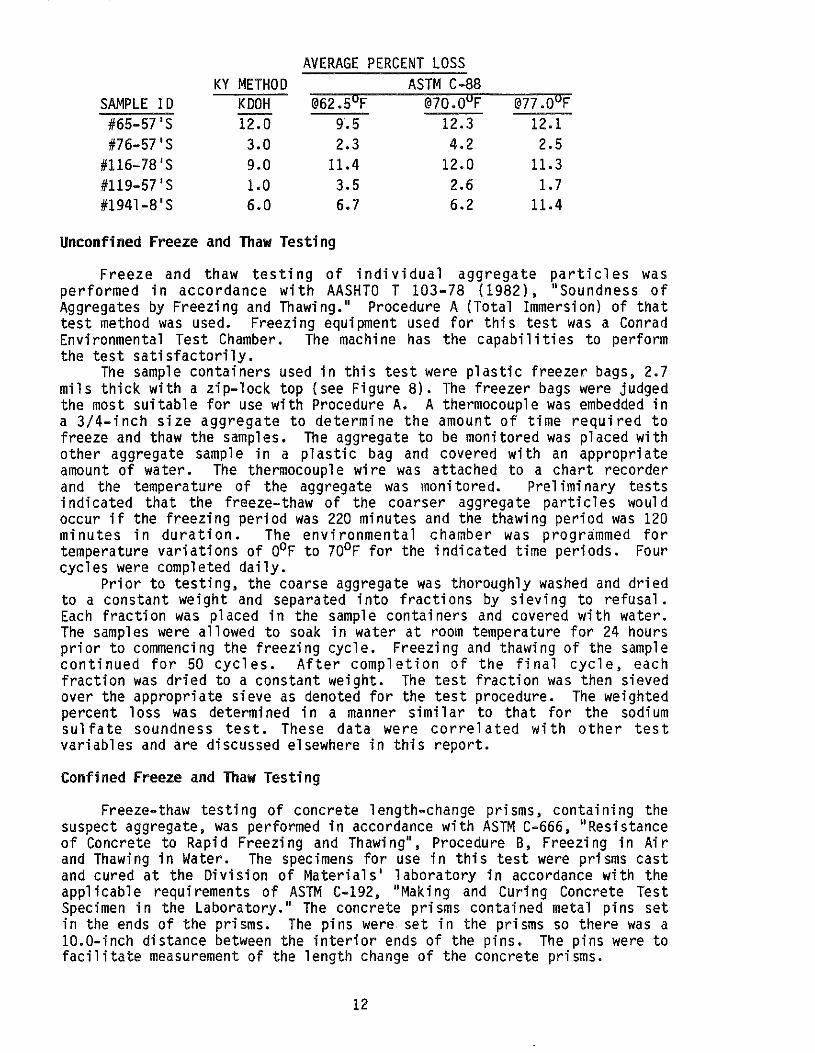
The sample containers used in this test were plastic freezer bags, 2.7 mils thick with a zip-lock top (see Figure 8). The freezer bags were judged the most suitable for use with Procedure A. A thermocouple was embedded in a 3/4-inch size aggregate to determine the amount of time required to freeze and thaw the samples. The aggregate to be monitored was placed with other aggregate sample in a plastic bag and covered with an appropriate amount of water. The thermocouple wire was attached to a chart recorder and the temperature of the aggregate was monitored. Preliminary tests indicated that the freeze-thaw of the coarser aggregate particles would occur if the freezing period was 220 minutes and the thawing period was 120 minutes in duration. The environmental chamber was programmed for temperature variations of 0°F to 70°F for the indicated time periods. Four cycles were completed daily.
Prior to testing, the coarse aggregate was thoroughly washed and dried to a constant weight and separated into fractions by sieving to refusal. Each fraction was p 1 aced in the sample containers and covered with water. The samples were allowed to soak in water at room temperature for 24 hours prior to commencing the freezing cycle. Freezing and tha1~i ng of the sample continued for 50 cycles. After completion of the final cycle, each fraction was dried to a constant weight. The test fraction was then sieved over the appropriate sieve as denoted for the test procedure. The weighted percent 1 oss was determined in a manner simi 1 ar to that for the sodi urn sulfate soundness test. These data were correlated with other test variables and are discussed elsewhere in this report.
Confined Freeze and Thaw Testing
Freeze-thaw testing of concrete 1 ength-change prisms, containing the suspect aggregate, was performed in accordance with ASTM C-666, "Resistance of Concrete to Rapid Freezing and Thawing", Procedure B, Freezing in Air and Thawing in Water. The specimens for use in this test were prisms cast and cured at the Division of Materials' laboratory in accordance with the applicable requirements of ASTM C-192, "Making and Curing Concrete Test Specimen in the Laboratory." The concrete prisms contained metal pins set in the ends of the prisms. The pins were set in the prisms so there was a 10.0-inch distance between the interior ends of the pins. The pins were to facilitate measurement of the length change of the concrete prisms.
12
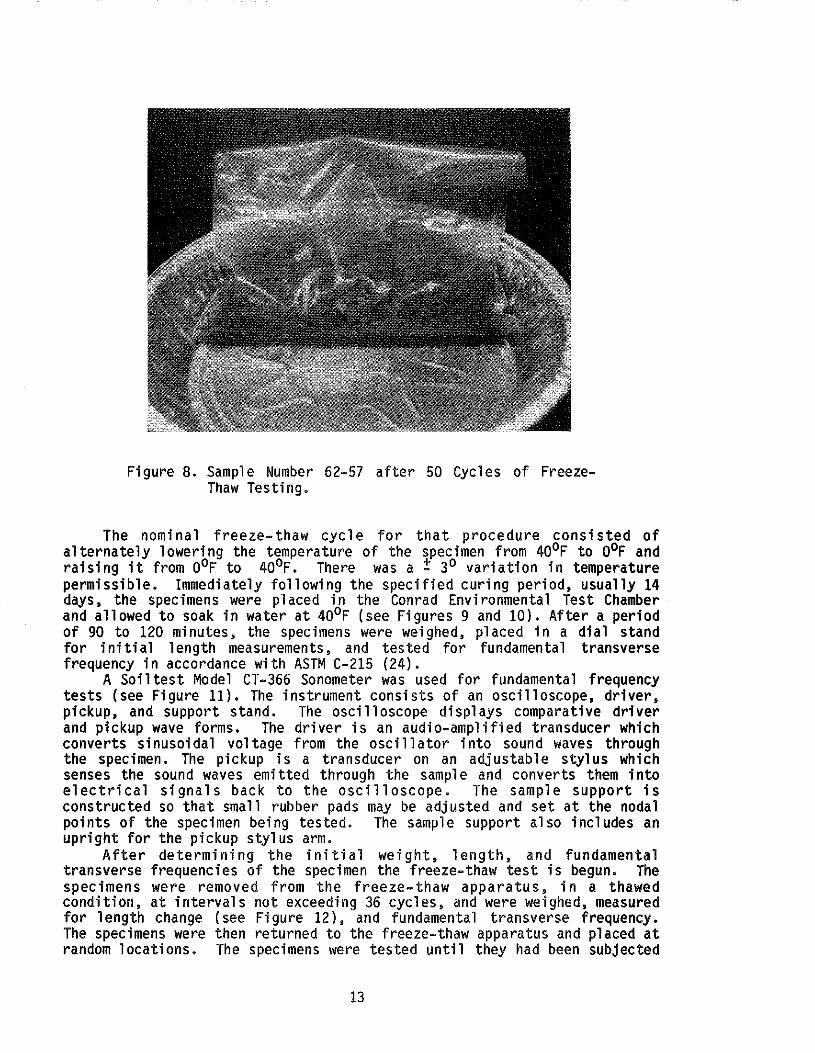
Figure 8. Sample Number 62-57 after 50 Cycles of FreezeThaw Testing.
The nominal freeze-thaw cycle for that procedure consisted of alternately lowering the temperature of the specimen from 40°F to 0°F and raising it from 0°F to 40°F. There was a f 3° variation in temperature permissible. Immediately following the specified curing period, usually 14 days, the specimens were placed in the Conrad Environmental Test Chamber and allowed to soak in water at 40°F (see Figures 9 and 10). After a period of 90 to 120 minutes, the specimens were weighed, placed in a dial stand for initial length measurements, and tested for fundamental transverse frequency in accordance with ASTM C-215 (24).
A Soi ltest Model CT -366 Sonometer was used for fundamental frequency tests (see Figure 11). The instrument consists of an oscilloscope, driver, pickup, and support stand. The oscilloscope displays comparative driver and pickup wave forms. The driver is an audi o-ampl ifi ed transducer which converts sinusoidal voltage from the asci 11 a tor into sound waves through the specimen. The pickup is a transducer on an adj us tab 1 e stylus which senses the sound waves emitted through the sample and converts them into electrical signals back to the oscilloscope. The sample support is constructed so that small rubber pads may be adjusted and set at the nodal points of the specimen being tested. The sample support also includes an upright for the pickup stylus arm.
After determining the i ni ti al weight, 1 ength, and fundamental transverse frequencies of the specimen the freeze-thaw test is begun. The specimens were removed from the freeze-thaw apparatus, in a thawed condition, at intervals not exceeding 36 cycles, and were weighed, measured for 1 ength change (see Figure 12), and fundamental transverse frequency. The specimens were then returned to the freeze-thaw apparatus and placed at random locations. The specimens were tested until they had been subjected
13
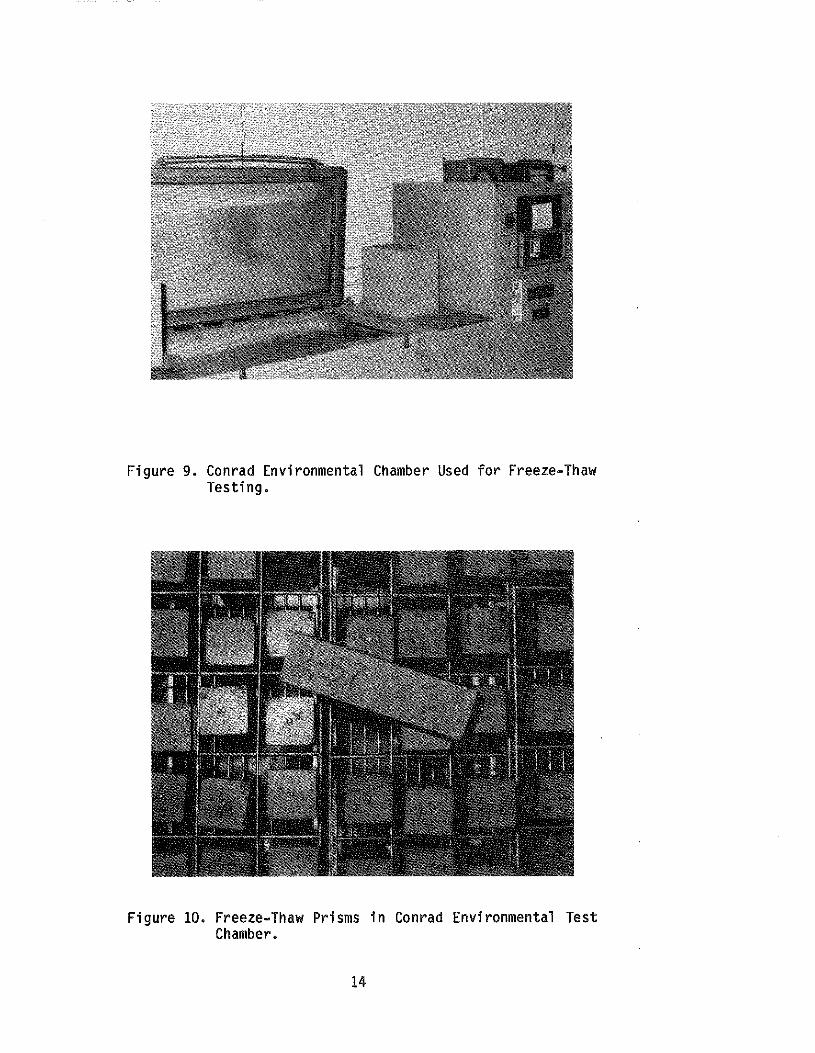
Figure 9. Conrad Environmental Chamber Used for Freeze-Thaw Testing.
Figure 10. Freeze-Thaw Prisms in Conrad Environmental Test Chamber.
14
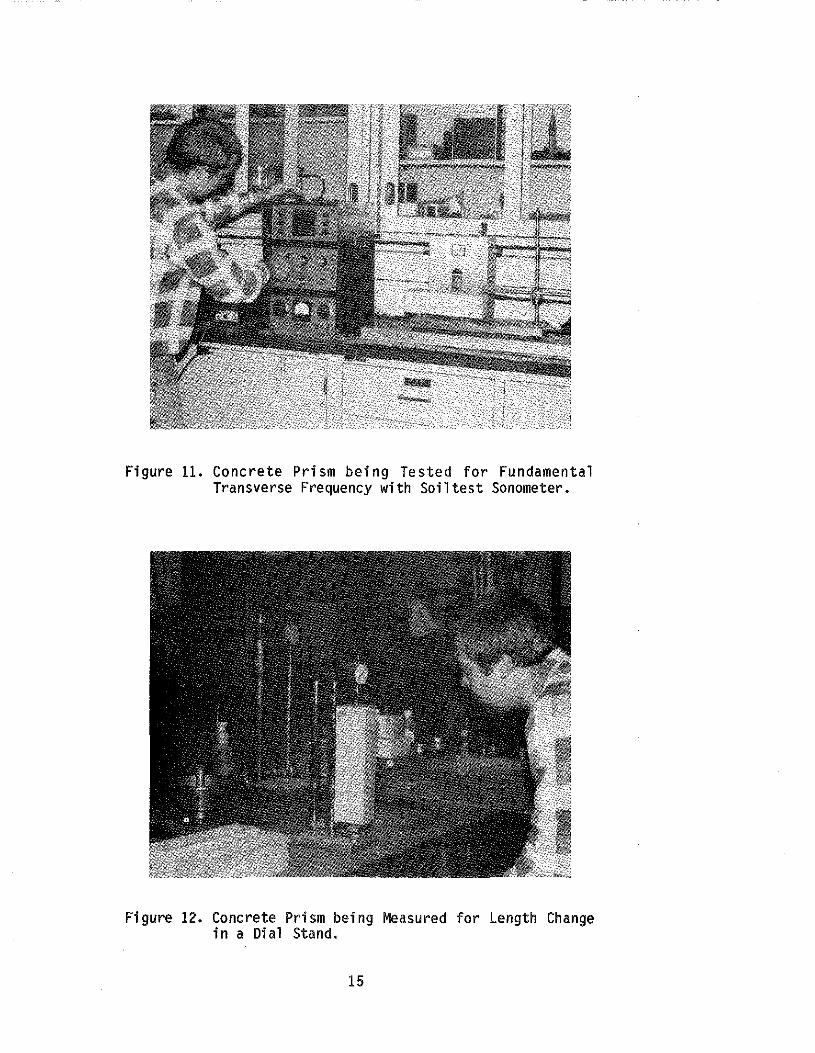
Figure 11. Concrete Prism being Tested for Fundamental Transverse Frequency with Soiltest Sonometer.
Figure 12. Concrete Prism being Measured for Length Change in a Dial Stand.
15
to 350 cycles or until their relative dynamic modulus of elasticity reached 60 percent of initial modulus. Each time a specimen was removed and tested it was visually inspected and any visible defects were noted.
The relative dynamic modulus of elasticity for each specimen was calculated as follows:
Pc = (nf/n2) x 100
where: Pc = relative dynamic modulus of elasticity after C cycles of freezing and thawing,
n = initial fundamental transverse frequency, and
n1 = fundamental transverse frequency after C cycles of freezing and thawing.
The durability factor for each specimen was calculated according to:
DF = PN/M
where: OF= durability factor of the test specimen,
P = relative dynamic modulus of elasticity at N cycles, percent,
N = number of cycles at which P reaches the specified minimum value for discontinuing the test or the specified number of cycles at which exposure was terminated, whichever i.s 1 ess, and
M = specified number of cycles at which the test was terminated.
Generally, at least two concrete prisms containing the same materials were tested. Results for each specimen were averaged. The average values for weight, length change, relative dynamic modulus of elasticity and durability factor were reported.
The length change data were used to calculate percent expansion. The formula used compared the change in length with the initial length of the specimen, stated as a percent. The Kentucky Department of Highways' specifies that expansion of durable concrete be equal to or less than 0.05 percent. Results of this testing activity were correlated with other test variables and are discussed elsewhere in this report.
Pore Index Testing
Data from the Pore Index Test which was performed by the Kentucky Department of Highways' Division of Materials (KM 64-623), were included in the correlation phase of this study. The objective of the test is to identify coarse aggregates having the potential for causing D-cracki ng in portland cement concrete pavements because of their susceptibility to critical saturation. Saturation of all voids to 91.7 percent is termed critical saturation, alluding to the degree of saturation beyond which the freezing of water over fills the voids with ice and creates internal expansive pressures (25).
16
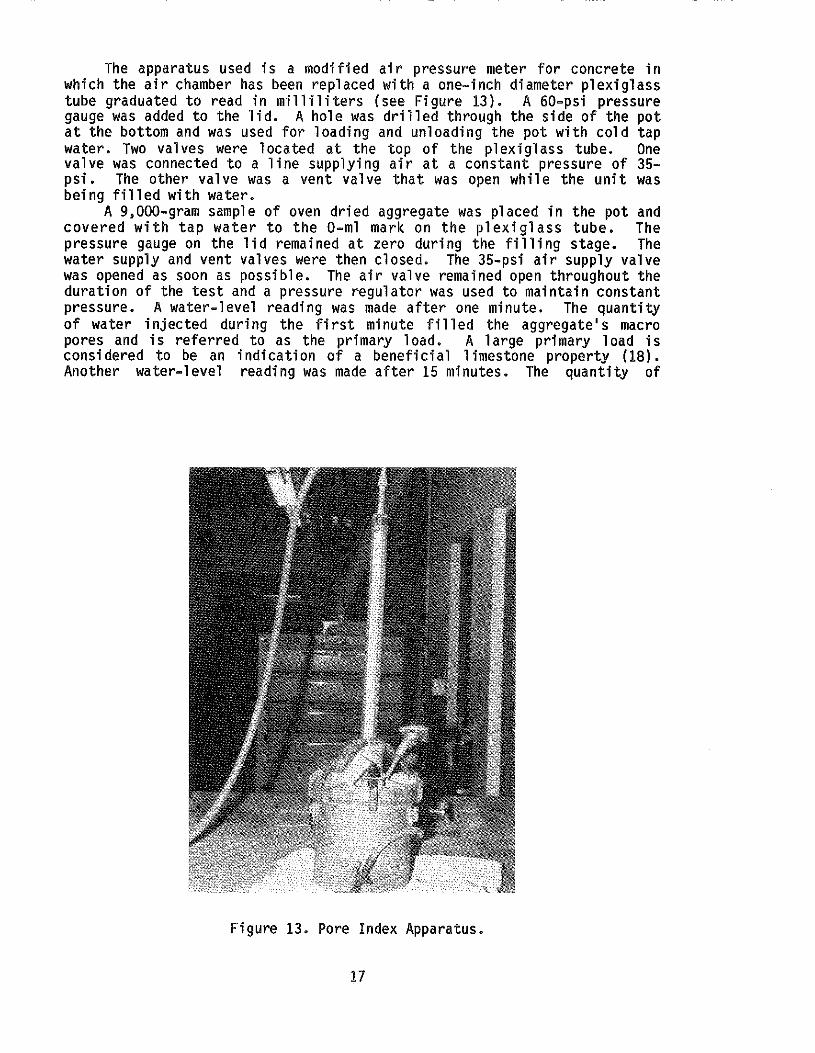
The apparatus used is a modified air pressure meter for concrete in which the air chamber has been replaced with a one-inch diameter plexiglass tube graduated to read in milliliters (see Figure 13). A 60-psi pressure gauge was added to the lid. A hole was drilled through the side of the pot at the bottom and was used for loading and unloading the pot with cold tap water. Two valves were located at the top of the plexiglass tube. One valve was connected to a line supplying air at a constant pressure of 35-psi. The other valve was a vent valve that was open while the unit was being filled with water.
A 9,000-gram sample of oven dried aggregate was placed in the pot and covered with tap water to the 0-ml mark on the plexiglass tube. The pressure gauge on the lid remained at zero during the fi 11 i ng stage. The water supply and vent valves were then closed. The 35-psi air supply valve was opened as soon as possible. The air valve remained open throughout the duration of the test and a pressure regulator was used to maintain constant pressure. A water-1 evel reading was made after one minute. The quantity of water injected during the first minute filled the aggregate's macro pores and is referred to as the primary 1 oad. A 1 arge primary load is considered to be an i ndi cation of a beneficia 1 1 imestone property ( 18). Another water-level reading was made after 15 minutes. The quantity of
Figure 13. Pore Index Apparatus.
17
water injected between one minute and 15 minutes is the secondary load and represents the amount of water injected into the aggregate's micro pore system. A high secondary load indicates a negative limestone property that correlates with a saturated aggregate's incapacity to withstand internal pressures caused during freezing. The secondary 1 oad, in mi 11 il i ters, is reported as the final pore index value (18). These data were correlated with other test variables and are discussed elsewhere in this report.
Absorption Testing
Absorption testing of aggregate samples was performed in accordance with ASTM C 127 and ASTM C 128 (26, 27). The methods cover determination of bulk and apparent specific gravity and absorption of coarse and fine aggregates respectively. The test used was dependent upon the size and gradation of the aggregate sample. Generally, the test for coarse aggregates was used for aggregates classified as No. 57's, No. 67's, No. 68's and No. 78's. The test for fine aggregates was used for those aggregates classified as No. 8's and No. 9-M's. Absorption data were correlated with other test variables and are discussed elsewhere in this report.
Evaluation of Shale Determination Test
An effort was made to evaluate the Kentucky test method used to determine the percentage of shale in aggregate during the laboratory phase of this study. The test, KM-64-604-83, is a visual method for determining the percentage by weight of shale in the plus No.4 portion of the aggregate. Shale, as defined for the test, is "interpreted to be a fi ss i1 e rock that is formed by the consolidation of clay, mud or silt, has a finely stratified or laminated structure, and is composed of minerals essentially unaltered since deposition," (28). This effort was reported by memorandum report and is included in Appendix C (29).
In an attempt to develop a better test method for determining the percent of shale in aggregate, Kentucky Transportation Research Program personnel devised a test method whereby the aggregate is tested using a diluted nitric acid solution. Nitric acid will react violently upon coming in contact with 1 imestone particles and show 1 i ttl e or no reaction upon coming in contact with shale particles. There are two shale formations that are exceptions to this general rule due primarily to their high carbonate content. These are the Leisman Shales and the Clays Ferry Shales. The procedure for the nitric acid test follows.
The equipment used in the test includes a balance, sieves conforming to AASHTO M-92, two large sample pans, mechanical aggregate shaker, sample splitter, and fume hood. Miscellaneous equipment used includes equipment suitable for washing, drying and storing the samples. Safety glasses, rubber aprons, and rubber gloves are used to prevent any acid from coming in contact with skin.
The ba 1 ance is sensitive to within 0.1 percent of the weight of the sample tested. The minimum sample weight and the weight of the test portion are listed in the Table 1.
The aggregate was thoroughly washed over a No. 4 sieve and dried to a constant weight in an oven at 230°F. The oven dried weight was recorded on a prepared data sheet.
18
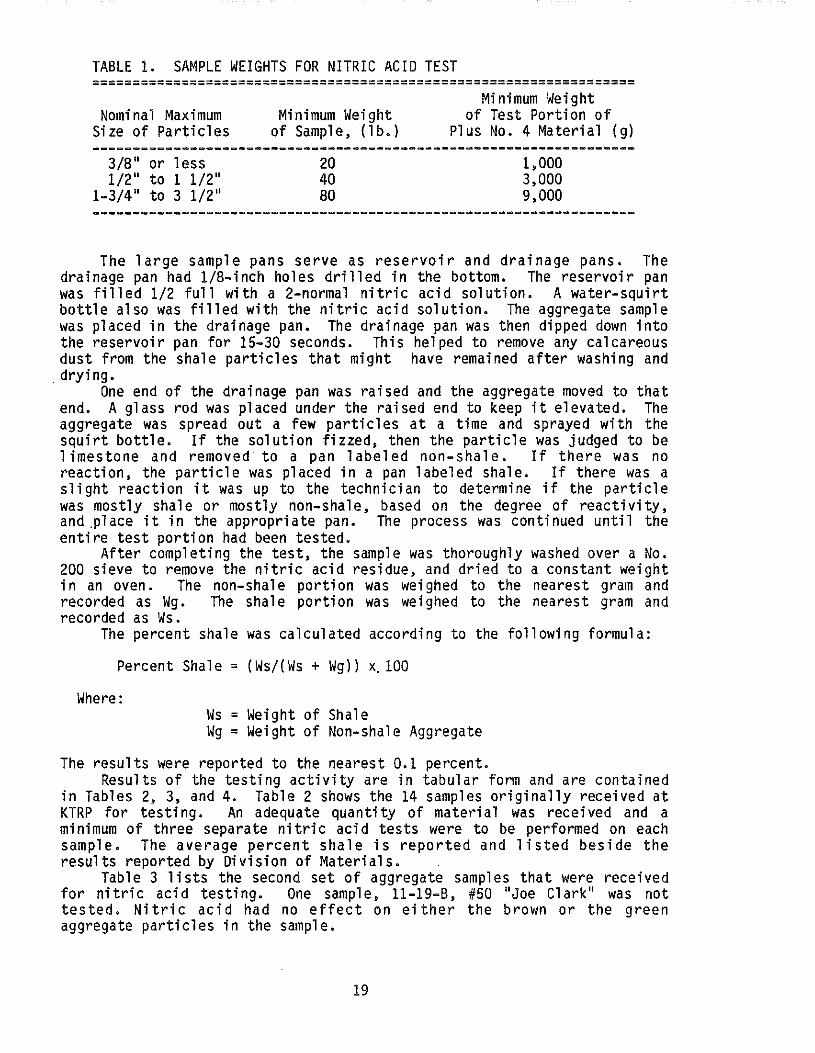
TABLE 1. SAMPLE WEIGHTS FOR NITRIC ACID TEST ===================================================================
Nominal Maximum Size of Particles
3/8" or less 1/2" to 1 1/2"
1-3/4" to 3 1/2"
Minimum Weight of Sample, (lb.}
20 40 80
Minimum Weight of Test Portion of
Plus No. 4 Material (g)
1,000 3,000 g,ooo
The large sample pans serve as reservoir and drainage pans. The drainage pan had 1/8-inch holes drilled in the bottom. The reservoir pan was filled 1/2 full with a 2-normal nitric acid solution. A water-squirt bottle also was filled with the nitric acid solution. The aggregate sample was placed in the drainage pan. The drainage pan was then dipped down into the reservoir pan for 15-30 seconds. This helped to remove any calcareous dust from the shale particles that might have remained after washing and
. drying. One end of the drainage pan was raised and the aggregate moved to that
end. A glass rod was placed under the raised end to keep it elevated. The aggregate was spread out a few particles at a time and sprayed with the squirt bottle. If the solution fizzed, then the particle was judged to be limestone and removed to a pan labeled non-shale. If there was no reaction, the particle was placed in a pan labeled shale. If there was a slight reaction it was up to the technician to determine if the particle was mostly shale or mostly non-shale, based on the degree of reactivity, and ,place it in the appropriate pan. The process was continued until the entire test portion had been tested.
After completing the test, the sample was thoroughly washed over a No. 200 sieve to remove the nitric acid residue, and dried to a constant weight in an oven. The non-shale portion was weighed to the nearest gram and recorded as Wg. The shale portion was weighed to the nearest gram and recorded as Ws.
The percent shale was calculated according to the following formula:
Percent Shale= (Ws/(Ws + Wg}} x. 100
Where: Ws = Weight of Shale Wg = Weight of Non-shale Aggregate
The results were reported to the nearest 0.1 percent. Results of the testing activity are in tabular form and are contained
in Tables 2, 3, and 4. Table 2 shows the 14 samples originally received at KTRP for testing. An adequate quantity of materia 1 was received and a minimum of three separate nitric acid tests were to be performed on each sample. The average percent shale is reported and listed beside the results reported by Division of Materials.
Table 3 lists the second set of aggregate samples that were received for nitric acid testing. One sample, 11-19-B, #50 "Joe Clark" was not tested. Nitric acid had no effect on either the brown or the green aggregate particles in the sample.
19
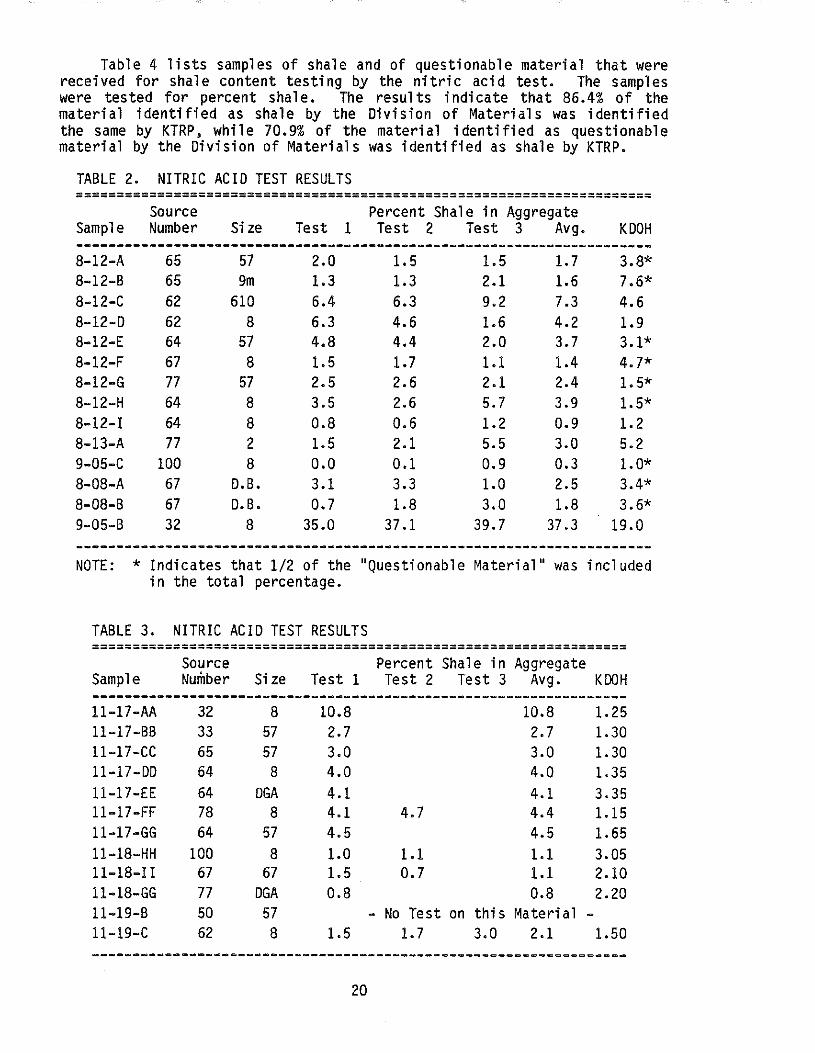
Table 4 lists samples of shale and of questionable material that were received for shale content testing by the nitric acid test. The samples were tested for percent shale. The results indicate that 86.4% of the material identified as shale by the Division of Materials was identified the same by KTRP, while 70.9% of the material identified as questionable material by the Division of Materials was identified as shale by KTRP.
TABLE 2. NITRIC ACID TEST RESULTS =======================================================================
Source Percent Shale in Aggregate Sample Number Size Test 1 Test 2 Test 3 Avg. KDOH -----------------------------------------------------------------------8-12-A 65 57 2.0 1.5 1.5 1.7 3.8* 8-12-B 65 9m 1.3 1.3 2.1 1.6 7.6* 8-12-C 62 610 6.4 6.3 9.2 7.3 4.6 8-12-D 62 8 6.3 4.6 1.6 4.2 1.9 8-12-E 64 57 4.8 4.4 2.0 3.7 3.1* 8-12-F 67 8 1.5 1.7 1.1 1.4 4.7* 8-12-G 77 57 2.5 2.6 2.1 2.4 1.5* 8-12-H 64 8 3.5 2.6 5.7 3.9 1.5* 8-12-I 64 8 0.8 0.6 1.2 0.9 1.2 8-13-A 77 2 1.5 2.1 5.5 3.0 5.2 9-05-C 100 8 o.o 0.1 0.9 0.3 1.0* 8-08-A 67 D.B. 3.1 3.3 1.0 2.5 3.4* 8-08-B 67 D.B. 0.7 1.8 3.0 1.8 3.6* 9-05-B 32 8 35.0 37.1 39.7 37.3 19.0
NOTE: *Indicates that 1/2 of the "Questionable Material" was included in the total percentage.
TABLE 3. NITRIC ACID TEST RESULTS ==================================================================
Source Percent Shale in Aggregate Sample Number Size Test 1 Test 2 Test 3 Avg. KDOH ------------------------------------------------------------------11-17-AA 32 8 10.8 10.8 1.25 11-17-BB 33 57 2.7 2.7 1.30 11-17-CC 65 57 3.0 3.0 1.30 11-17-DD 64 8 4.0 4.0 1.35 11-17-EE 64 DGA 4.1 4.1 3.35 11-17-FF 78 8 4.1 4.7 4.4 1.15 11-17-GG 64 57 4.5 4.5 1.65 11-18-HH 100 8 1.0 1.1 1.1 3.05 11-18-I I 67 67 1.5 0.7 1.1 2.10 11-18-GG 77 DGA 0.8 0.8 2.20 11-19-B 50 57 - No Test on this Material -11-19-C 62 8 1.5 1.7 3.0 2.1 1.50
20
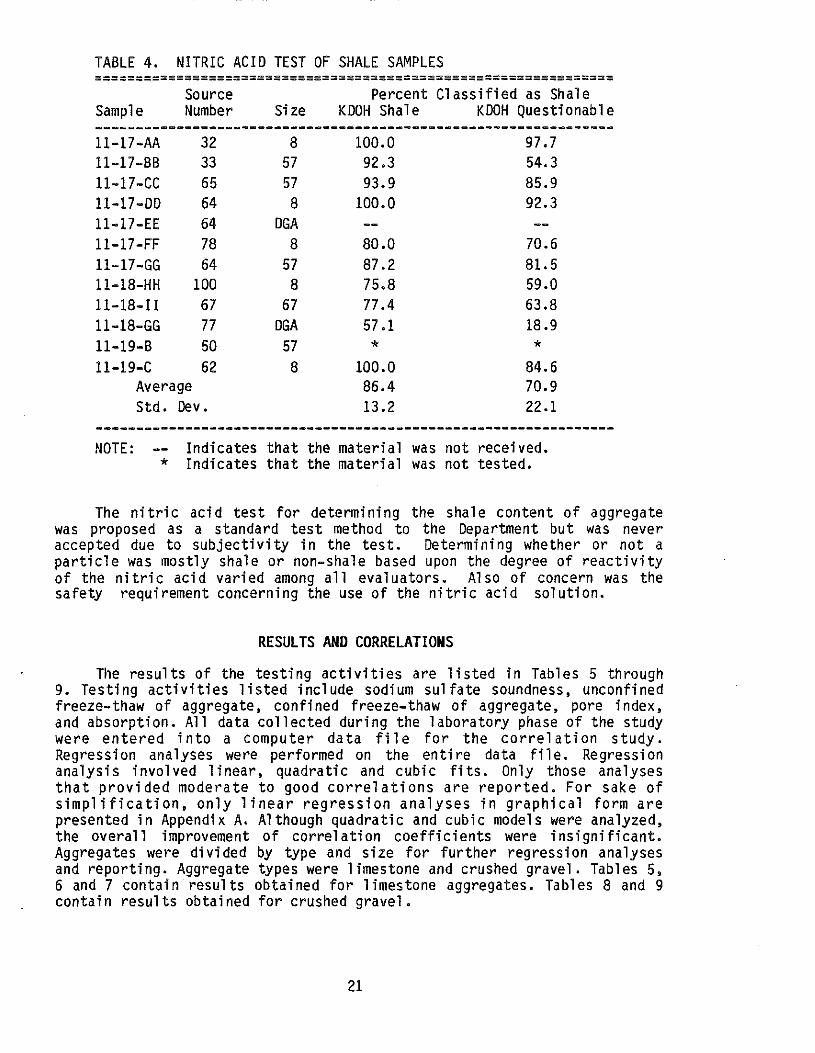
TABLE 4. NITRIC ACID TEST OF SHALE SAMPLES ================================================================
Source Percent Classified as Shale Sample Number Size KDOH Shale KDOH Questionable
----------------------------------------------------------------11-17-AA 32 8 100.0 97.7 11-17-BB 33 57 92.3 54.3 11-17-CC 65 57 93.9 85.9 11-17-DD 64 8 100.0 92.3 11-17-EE 64 DGA 11-17-FF 78 8 80.0 70.6 11-17-GG 64 57 87.2 81.5 11-18-HH 100 8 75.8 59.0 11-18-II 67 67 77.4 63.8 11-18-GG 77 DGA 57.1 18.9 11-19-B 50 57 * * 11-19-C 62 8 100.0 84.6
Average 86.4 70.9 Std. Dev. 13.2 22.1
NOTE: Indicates that the material was not received. * Indicates that the material was not tested.
The nitric acid test for determining the shale content of aggregate was proposed as a standard test method to the Department but was never accepted due to subjectivity in the test. Determining whether or not a particle was mostly shale or non-shale based upon the degree of reactivity of the nitric acid varied among all evaluators. Also of concern was the safety requirement concerning the use of the nitric acid solution.
RESULTS AND CORRELATIONS
The results of the testing activities are listed in Tables 5 through 9. Testing activities listed include sodium sulfate soundness, unconfined freeze-thaw of aggregate, confined freeze- thaw of aggregate, pore index, and absorption. All data collected during the laboratory phase of the study were entered into a computer data file for the correlation study. Regression analyses were performed on the entire data file. Regression analysis involved linear, quadratic and cubic fits. Only those analyses that provided moderate to good correlations are reported. For sake of simplification, only linear regression analyses in graphical form are presented in Appendix A. Although quadratic and cubic models were analyzed, the overall improvement of correlation coefficients were i nsi gni fi cant. Aggregates were divided by type and size for further regression analyses and reporting. Aggregate types were limestone and crushed gravel. Tables 5, 6 and 7 contain results obtained for limestone aggregates. Tables 8 and 9 contain results obtained for crushed gravel.
21
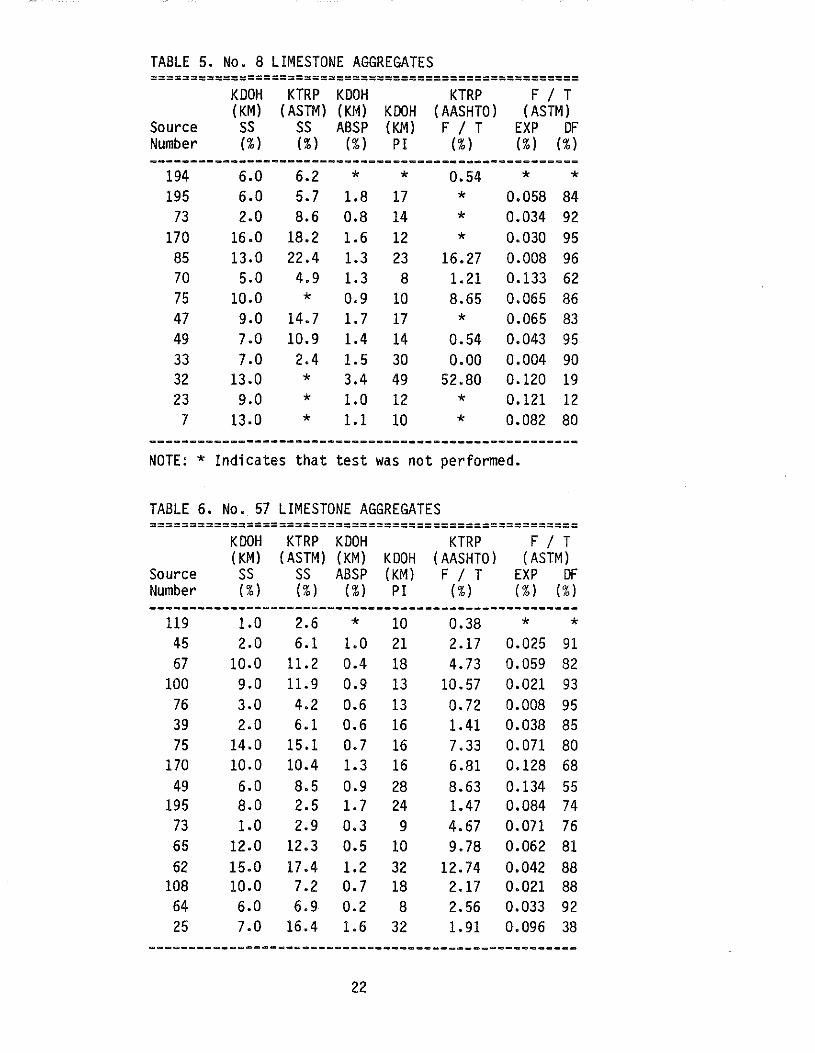
TABLE 5. No. 8 LIMESTONE AGGREGATES =====================================================
KOOH KTRP KOOH KTRP F I T (KM) (ASTM) (KM) KOOH ( AASHTO) (ASTM)
Source ss ss ABSP (KM) F I T EXP OF Number (%) (%) (%) PI (%) (%) (%)
-----------------------------------------------------194 6.0 6.2 * * 0.54 * * 195 6.0 5.7 1.8 17 * 0.058 84
73 2.0 8.6 0.8 14 * 0.034 92 170 16.0 18.2 1.6 12 * 0.030 95
85 13.0 22.4 1.3 23 16.27 0.008 96 70 5.0 4.9 1.3 8 1.21 0.133 62 75 10.0 * 0.9 10 8.65 0.065 86 47 9.0 14.7 1.7 17 * 0.065 83 49 7.0 10.9 1.4 14 0.54 0.043 95 33 7.0 2.4 1.5 30 0.00 0.004 90 32 13.0 * 3.4 49 52.80 0.120 19 23 9.0 * 1. 0 12 * 0.121 12 7 13.0 * 1.1 10 * 0.082 80
-----------------------------------------------------NOTE: * Indicates that test was not performed.
TABLE 6. No. 57 LIMESTONE AGGREGATES =====================================================
KOOH KTRP KOOH KTRP F I T (KM) (ASTM) (KM) KOOH ( AASHTO l ( ASTM)
Source ss ss ABSP (KM) F I T EXP OF Number (%) (%) (%) PI (%) (%) (%)
-----------------------------------------------------119 1. 0 2.6 * 10 0.38 * *
45 2.0 6.1 1.0 21 2.17 0.025 91 67 10.0 11.2 0.4 18 4.73 0.059 82
100 9.0 11.9 0.9 13 10.57 0.021 93 76 3.0 4.2 0.6 13 0.72 0.008 95 39 2.0 6.1 0.6 16 1.41 0.038 85 75 14.0 15.1 0.7 16 7.33 0.071 80
170 10.0 10.4 1.3 16 6.81 0.128 68 49 6.0 8.5 0.9 28 8.63 0.134 55
195 8.o 2.5 1.7 24 1.47 0.084 74 73 1.0 2.9 0.3 9 4.67 0.071 76 65 12.0 12.3 0.5 10 9.78 0.062 81 62 15.0 17.4 1.2 32 12.74 0.042 88
108 10.0 7.2 0.7 18 2.17 0.021 88 64 6.0 6.9 0.2 8 2.56 0.033 92 25 7.0 16.4 1.6 32 1.91 0.096 38
-----------------------------------------------------22
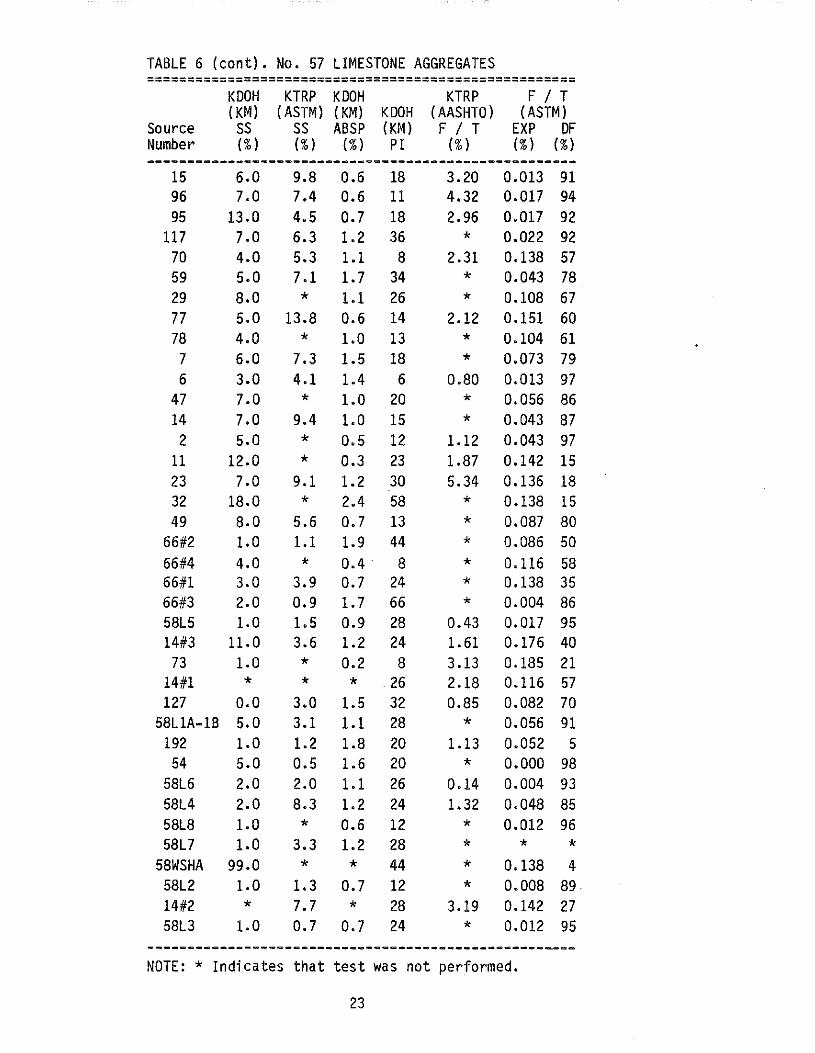
TABLE 6 (cont). No. 57 LIMESTONE AGGREGATES =====================================================
KDOH KTRP KDOH KTRP F I T (KM) ( ASTM) (KM) KDOH (AASHTO) (ASTM)
Source ss ss ABSP (KM) F I T EXP DF Number (%) (%) (%) PI (%) (%) (%)
-----------------------------------------------------15 6.0 9.8 0.6 18 3.20 0.013 91 96 7.0 7.4 0.6 11 4.32 0.017 94 95 13.0 4.5 0.7 18 2.96 0.017 92
117 7.0 6.3 1.2 36 * 0.022 92 70 4.0 5.3 1.1 8 2.31 0.138 57 59 s.o 7.1 1.7 34 * 0.043 78 29 8.0 * 1.1 26 * 0.108 67 77 s.o 13.8 0.6 14 2.12 0.151 60 78 4.0 * 1.0 13 * 0.104 61 7 6.0 7.3 1.5 18 * 0.073 79 6 3.0 4.1 1.4 6 0.80 0.013 97
47 7.0 * 1.0 20 * 0.056 86 14 7.0 9.4 1.0 15 * 0.043 87 2 5.0 * 0.5 12 1.12 0.043 97
11 12.0 * 0.3 23 1.87 0.142 15 23 7.0 9.1 1.2 30 5.34 0.136 18 32 18.0 * 2.4 58 * 0.138 15 49 8.0 5.6 0.7 13 * 0.087 80
66#2 1. 0 1.1 1.9 44 * 0.086 50 66#4 4.0 * 0.4 8 * 0.116 58 66#1 3.0 3.9 0.7 24 * 0.138 35 66#3 2.0 0.9 1.7 66 * 0.004 86 58L5 1.0 1.5 0.9 28 0.43 0.017 95 14#3 11.0 3.6 1.2 24 1.61 0.176 40
73 1.0 * 0.2 8 3.13 0.185 21 14#1 * * * 26 2.18 0.116 57 127 o.o 3.0 1.5 32 0.85 0.082 70
58LlA-lB 5.0 3.1 1.1 28 * 0.056 91 192 1.0 1.2 1.8 20 1.13 0.052 5 54 5.0 0.5 1.6 20 * o.ooo 98
58L6 2.0 2.0 1.1 26 0.14 0.004 93 58L4 2.0 8.3 1.2 24 1.32 0.048 85 58L8 1.0 * 0.6 12 * 0.012 96 58L7 1. 0 3.3 1.2 28 * * *
58WSHA 99.0 * * 44 * 0.138 4 58L2 1.0 1.3 0.7 12 * 0.008 89 14#2 * 7.7 * 28 3.19 0.142 27 58L3 1. 0 0.7 0.7 24 * 0.012 95
-----------------------------------------------------NOTE: * Indicates that test was not performed.
23
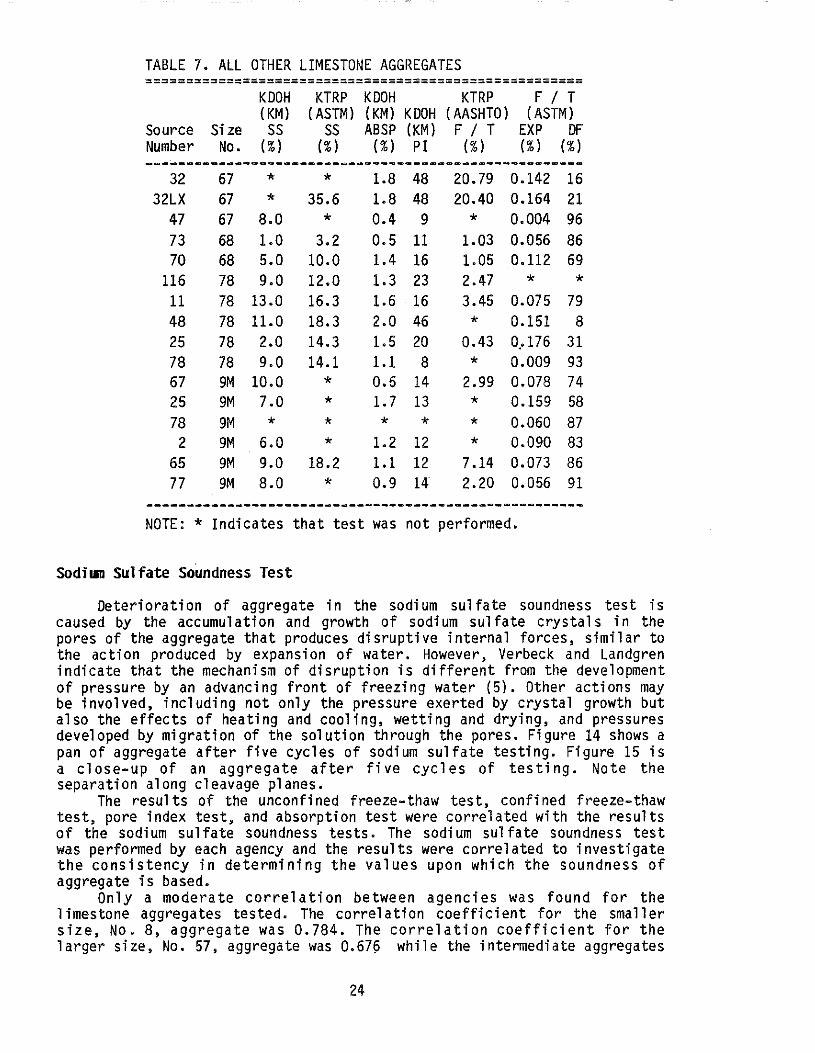
TABLE 7. ALL OTHER LIMESTONE AGGREGATES ======================================================
KDOH KTRP KDOH KTRP F I T {KM} {ASTM} {KM} KDOH { AASHTO} {ASTM}
Source Size ss ss ABSP {KM} F I T EXP OF Number No. {%} {%} {%} PI {%} {%} {%}
------------------------------------------------------32 67 * * 1.8 48 20.79 0.142 16 32LX 67 * 35.6 1.8 48 20.40 0.164 21
47 67 8.0 * 0.4 9 * 0.004 96 73 68 1.0 3.2 0.5 11 1.03 0.056 86 70 68 5.0 10.0 1.4 16 1.05 0.112 69
116 78 9.0 12.0 1.3 23 2.47 * * 11 78 13.0 16.3 1.6 16 3.45 0.075 79 48 78 11.0 18.3 2.0 46 * 0.151 8 25 78 2.0 14.3 1.5 20 0.43 0 .• 176 31 78 78 9.0 14.1 1.1 8 * 0.009 93 67 9M 10.0 * 0.5 14 2.99 0.078 74 25 9M 7.0 * 1.7 13 * 0.159 58 78 9M * * * * * 0.060 87 2 9M 6.0 * 1.2 12 * 0.090 83
65 9M 9.0 18.2 1.1 12 7.14 0.073 86 77 9M 8.0 * 0.9 14 2.20 0.056 91
------------------------------------------------------NOTE: * Indicates that test was not performed.
Sodium Sulfate Soundness Test
Deterioration of aggregate in the sodium sulfate soundness test is caused by the accumulation and growth of sodium sulfate crystals in the pores of the aggregate that produces disruptive internal forces, similar to the action produced by expansion of water. However, Verbeck and Landgren indicate that the mechanism of disruption is different from the development of pressure by an advancing front of freezing water {5}. Other actions may be involved, including not only the pressure exerted by crystal growth but also the effects of heating and cooling, wetting and drying, and pressures developed by migration of the solution through the pores. Figure 14 shows a pan of aggregate after five cycles of sodium sulfate testing. Figure 15 is a close-up of an aggregate after five cycles of testing. Note the separation along cleavage planes.
The results of the unconfined freeze-thaw test, confined freeze-thaw test, pore index test, and absorption test were correlated with the results of the sodium sulfate soundness tests. The sodium sulfate soundness test was performed by each agency and the results were correlated to investigate the consistency in determining the values upon which the soundness of aggregate is based.
Only a moderate correlation between agencies was found for the limestone aggregates tested. The correlation coefficient for the smaller size, No. 8, aggregate was 0.784. The correlation coefficient for the larger size, No. 57, aggregate was 0.676 while the intermediate aggregates
24
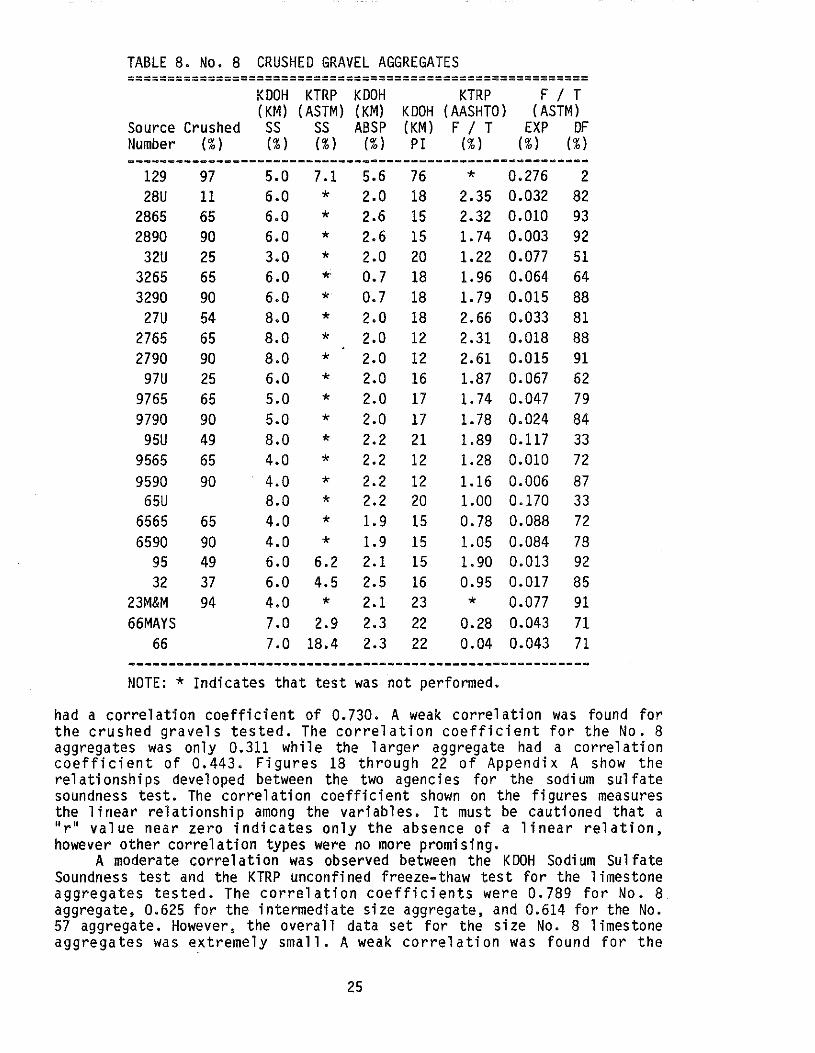
TABLE 8. No. 8 CRUSHED GRAVEL AGGREGATES =========================================================
Source Crushed Number (%)
129 97 28U 11
2865 65 2890 90
32U 25 3265 65 3290 90
27U 54 2765 65 2790 90
97U 25 9765 65 9790 90
95U 49 9565 65 9590 90
65U 6565 65 6590 90
95 49 32 37
23M&M 94 66MAYS
66
KDOH (KM) ss (%)
KTRP KDOH (ASTM) (KM) KDOH
SS ABSP (KM) (%) (%) PI
5.0 7.1 6.0 * 6.0 * 6 .. 0 * 3.0 * 6.0 * 6.0 * 8.0 * 8.0 * 8.o * 6.0 * 5.0 * 5.0 * 8.o * 4.0 * 4.0 * 8.0 * 4.0 * 4.0 * 6.0 6.2 6.0 4.5 4.0 * 7.0 2.9 7 .o 18.4
5.6 2.0 2.6 2.6 2.0 0.7 0.7 2.0 2.0 2.0 2.0 2.0 2.0 2.2 2.2 2.2 2.2 1.9 1.9 2.1 2.5 2.1 2.3 2.3
76 18 15 15 20 18 18 18 12 12 16 17 17 21 12 12 20 15 15 15 16 23 22 22
KTRP (AASHTO) F I T
(%)
F I T (ASTM)
EXP DF (%) (%)
* 0.276 2.35 0.032 2.32 0.010 1. 74 0.003 1.22 0.077 1. 96 0.064 1. 79 0.015 2.66 0.033 2.31 0.018 2.61 0.015 1.87 o. 067 1. 74 0.047 1.78 0.024 1.89 0.117 1. 28 o. 010 1.16 0.006 1.00 0.170 0.78 0.088 1.05 0.084 1. 90 0.013 0.95 0.017 * 0.077
0.28 0.043 0.04 0.043
2 82 93 92 51 64 88 81 88 91 62 79 84 33 72 87 33 72 78 92 85 91 71 71
NOTE: * Indicates that test was not performed.
had a correlation coefficient of 0.730. A weak correlation was found for the crushed gravels tested. The correlation coefficient for the No.8 aggregates was only 0.311 while the larger aggregate had a correlation coefficient of 0.443. Figures 18 through 22 of Appendix A show the rel ati onshi ps de vel oped between the two agencies for the sodium sulfate soundness test. The correlation coefficient shown on the figures measures the linear relationship among the variables. It must be cautioned that a "r" value near zero indicates only the absence of a linear relation, however other correlation types were no more promising.
A moderate carrel ati on was observed between the KDOH Sodium Sulfate Soundness test and the KTRP unconfined freeze-thaw test for the 1 imestone aggregates tested. The correlation coefficients were 0.789 for No. 8 aggregate, 0.625 for the intermediate size aggregate, and 0.614 for the No. 57 aggregate. However, the overall data set for the size No. 8 1 imes tone aggregates was extremely small. A weak correlation was found for the
25
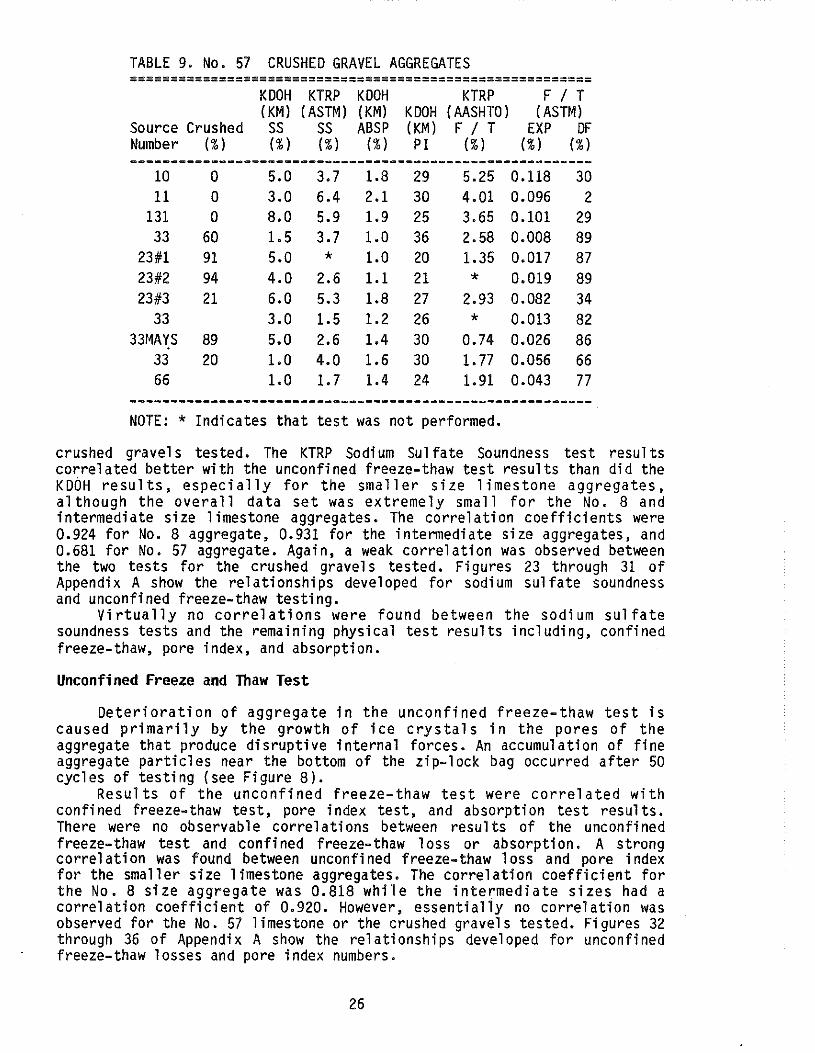
TABLE 9. No. 57 CRUSHED GRAVEL AGGREGATES =========================================================
KDOH KTRP KDOH KTRP F I T (KM) ( ASTM) (KM) KDOH ( AASHTO) ( ASTM)
Source Crushed ss ss ABSP (KM) F I T EXP OF Number (%) (%) (%) (%) PI (%) (%) (%)
---------------------------------------------------------10 0 5.0 3.7 1.8 29 5.25 0.118 30 11 0 3.0 6.4 2.1 30 4.01 0.096 2
131 0 8.0 5.9 1.9 25 3.65 0.101 29 33 60 1.5 3.7 1.0 36 2.58 0.008 89
23#1 91 5.0 * 1.0 20 1.35 0.017 87 23#2 94 4.0 2.6 1.1 21 * 0.019 89 23#3 21 6.0 5.3 1.8 27 2.93 0.082 34
33 3.0 1.5 1.2 26 * 0.013 82 33f1AYS 89 5.0 2.6 1.4 30 0.74 0.026 86
33 20 1.0 4.0 1.6 30 1. 77 0.056 66 66 1.0 1.7 1.4 24 1.91 0.043 77
---------------------------------------------------------NOTE: * Indicates that test was not performed.
crushed gravels tested. The KTRP Sodi urn Sulfate Soundness test results correlated better with the unconfined freeze-thaw test results than did the KDOH results, especially for the smaller size limestone aggregates, although the overall data set was extremely small for the No. 8 and intermediate size limestone aggregates. The correlation coefficients were 0.924 for No. 8 aggregate, 0.931 for the intermediate size aggregates, and 0.681 for No. 57 aggregate. Again, a weak correlation was observed between the two tests for the crushed gravels tested. Figures 23 through 31 of Appendix A show the relationships developed for sodium sulfate soundness and unconfined freeze-thaw testing.
Virtually no correlations were found between the sodium sulfate soundness tests and the remaining physical test results including, confined freeze-thaw, pore index, and absorption.
Unconfined Freeze and Thaw Test
Deterioration of aggregate in the unconfined freeze-thaw test is caused primarily by the growth of ice crystals in the pores of the aggregate that produce disruptive internal forces. An accumulation of fine aggregate particles near the bottom of the zip-lock bag occurred after 50 cycles of testing (see Figure 8).
Results of the unconfined freeze-thaw test were correlated with confined freeze-thaw test, pore index test, and absorption test results. There were no observable correlations between results of the unconfined freeze-thaw test and confined freeze-thaw 1 oss or absorption. A strong carrel ati on was found between unconfined freeze-thaw 1 oss and pore index for the smaller size limestone aggregates. The correlation coefficient for the No. 8 size aggregate was 0.818 while the intermediate sizes had a correlation coefficient of 0.920. However, essentially no correlation was observed for the No. 57 limestone or the crushed gravels tested. Figures 32 through 36 of Appendix A show the rel ati onshi ps developed for unconfined freeze-thaw losses and pore index numbers.
26
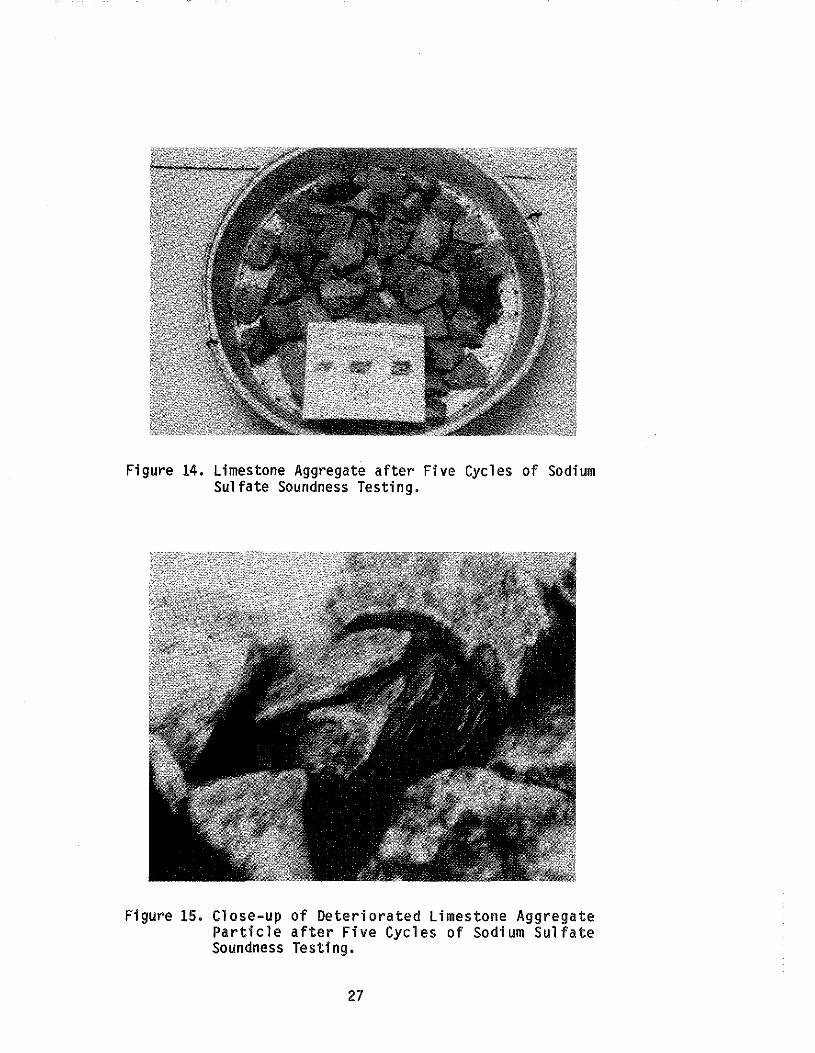
Figure 14. Limestone Aggregate after Five Cycles of Sodium Sulfate Soundness Testing.
Figure 15. Close-up of Deteriorated Limestone Aggregate Particle after Five Cycles of Sodium Sulfate Soundness Testing.
27
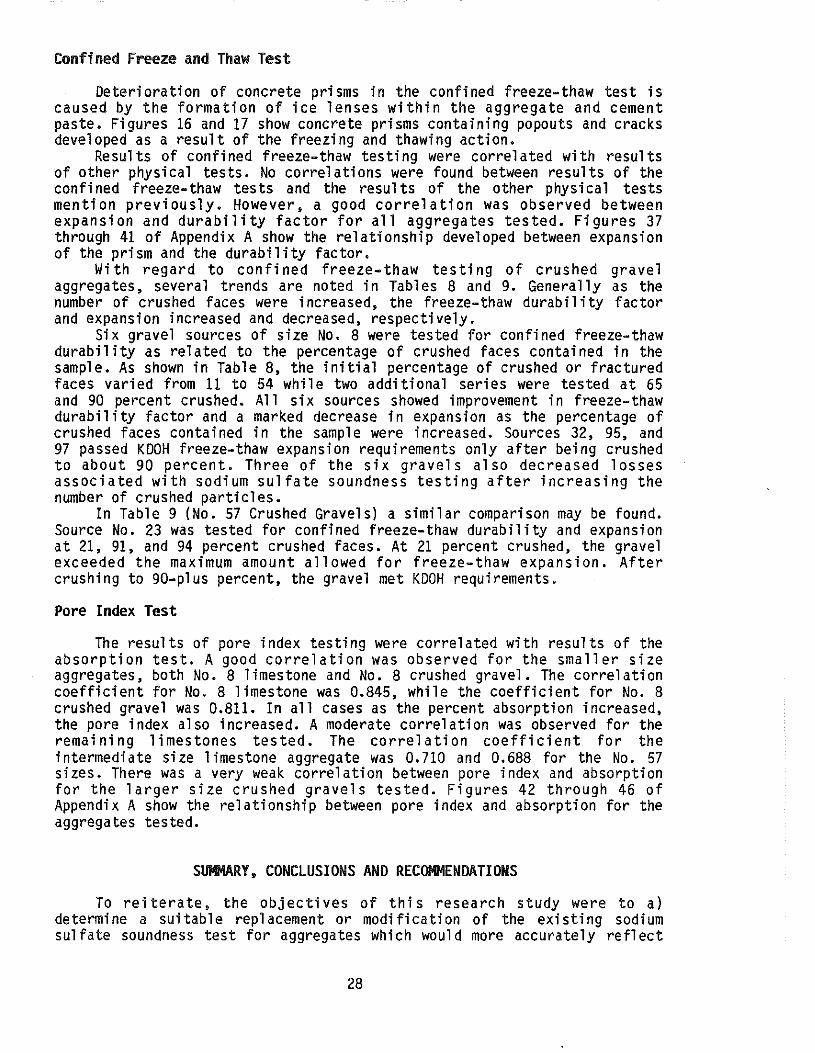
Confined Freeze and Thaw Test
Deterioration of concrete prisms in the confined freeze-thaw test is caused by the formation of ice lenses within the aggregate and cement paste. Figures 16 and 17 show concrete prisms containing popouts and cracks developed as a result of the freezing and thawing action.
Results of confined freeze-thaw testing were carrel a ted with results of other physical tests. No correlations were found between results of the confined freeze-thaw tests and the results of the other physical tests mention previously. However, a good correlation was observed between expansion and durability factor for all aggregates tested. Figures 37 through 41 of Appendix A show the relationship developed between expansion of the prism and the durability factor.
With regard to confined freeze-thaw testing of crushed gravel aggregates, several trends are noted in Tab 1 es 8 and 9. Generally as the number of crushed faces were increased, the freeze-thaw durability factor and expansion increased and decreased, respectively.
Six gravel sources of size No. 8 were tested for confined freeze-thaw durability as related to the percentage of crushed faces contained in the sample. As shown in Table 8, the initial percentage of crushed or fractured faces varied from 11 to 54 whi 1 e two addi ti anal series were tested at 65 and 90 percent crushed. All six sources showed improvement in freeze-thaw durability factor and a marked decrease in expansion as the percentage of crushed faces contained in the sample were increased. Sources 32, 95, and 97 passed KDOH freeze-thaw expansion requirements only after being crushed to about 90 percent. Three of the six gravels also decreased losses associated with sodium sulfate soundness testing after increasing the number of crushed particles.
In Table 9 (No. 57 Crushed Gravels) a similar comparison may be found. Source No. 23 was tested for confined freeze-thaw durability and expansion at 21, 91, and 94 percent crushed faces. At 21 percent crushed, the gravel exceeded the maximum amount allowed for freeze-thaw expansion. After crushing to 90-plus percent, the gravel met KDOH requirements.
Pore Index Test
The results of pore index testing were correlated with results of the absorption test. A good correlation was observed for the smaller size aggregates, both No. 8 limestone and No. 8 crushed gravel. The correlation coefficient for No. 8 limestone was 0.845, while the coefficient for No. 8 crushed gravel was 0.811. In all cases as the percent absorption increased, the pore index also increased. A moderate correlation was observed for the remaining limestones tested. The correlation coefficient for the intermediate size limestone aggregate was 0.710 and 0.688 for the No. 57 sizes. There was a very weak correlation between pore index and absorption for the larger size crushed gravels tested. Figures 42 through 46 of Appendix A show the relationship between pore index and absorption for the aggregates tested.
SUMMARY, CONCLUSIONS AND RECOMMENDATIONS
To reiterate, the objectives of this research study were to a) determine a suitable replacement or modification of the existing sodium sulfate soundness test for aggregates which waul d more accurately reflect
28
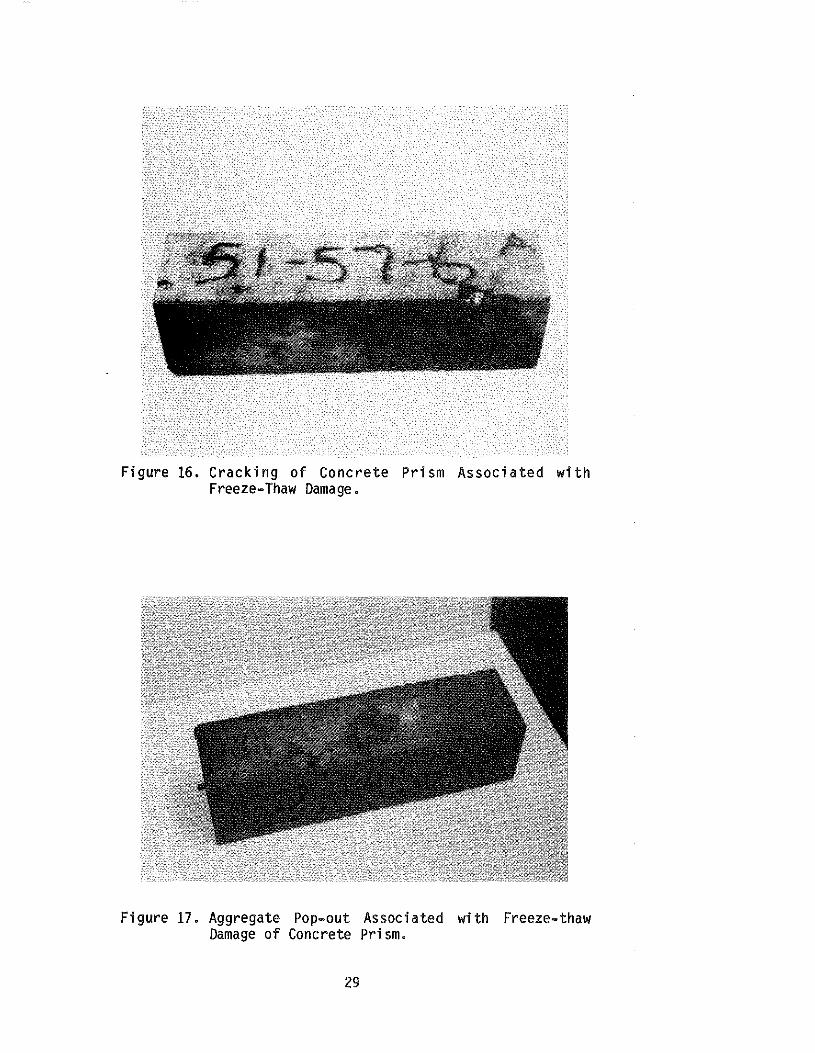
Figure 16. Cracking of Concrete Prism Associated with Freeze-Thaw Damage.
Figure 17. Aggregate Pop-out Associated with Freeze-thaw Damage of Concrete Prism.
29
in-service performance of concrete pavements and bridges; b) carrel ate freezing and thawing durabi 1 i ty data with sodi urn sulfate soundness test data and other test data, and c) develop a rational implementation criterion for use of the new or modified testing procedure. The work plan for the study included a literature search and review to identify alternatives to the sodi urn sulfate soundness test and identify problems associated with the test, laboratory testing of aggregates, and correlation of variables from laboratory testing.
The sodium sulfate soundness test is the most widely utilized test method to predict an aggregate's susceptibility to the adverse effects of weathering action. The test has proponents and detractors. Proponents claim. results may be used to predict weakness in aggregates and that the test is useful because of the short time required for completion. Other investigators insist there is no experimental support to assume that the sulfate soundness test simulates exposure to freeze-thaw of concrete or support field performance simulation. It is the author's belief that the sodium sulfate soundness test is the best currently available test method to determine the soundness of an aggregate. The test does indicate a weakness of the aggregate. It is almost certain that an aggregate exhibiting high losses during the test will produce non-durable concrete. There are some exceptions, especially for the smaller sized aggregate particles.
The freeze-thaw test of discrete aggregate particles correlated moderately well with the KTRP sodi urn sulfate soundness test but only for the smaller sized limestone aggregates tested. The overall data set for this carrel ati on was extremely small and the associ a ted carrel ati on coefficient may be misleading. There was no correlation observed.for size No. 57 1 imestone or crushed gravels for results of those two tests. The same was true for the correlation between the test for freeze-thaw of discrete aggregate particles and the pore index test. The two tests correlated moderately well for the smaller sized limestone aggregates tested. Again, because the overall data set for this correlation was extremely small, the correlation coefficient may be somewhat misleading. The freeze-thaw test of discrete aggregate particles takes approximately two weeks to complete.
The results of the sodium sulfate soundness test, as performed by the two agencies, indicated only a moderate correlation between the agencies for the limestone aggregates tested. There was no correlation between results for the crushed gravels tested. This indicates more variability in the test results for crushed gravels which reflects variability in the aggregate particles. The results of the confined freeze-thaw test did not correlate with any of the other test results including sodium sulfate soundness loss, unconfined freeze-thaw loss, pore index or absorption. With regard to the relationship between pore index and confined freeze-thaw durabi 1 i ty, a good carrel ati on may occur for 1 edge rock tested by the two methods. Expansion of concrete prisms indicated a good carrel ati on with durability factor for all aggregates tested. The durability factor is defined as a percentage reduction in the relative dynamic modulus of el asti city of the specimen. The confined freeze-thaw test requires approximately eight weeks to complete.
Correlations of results from the various tests with field performance of concrete pavements was not accomplished during the course of this study. However, these correlations should be performed prior to eliminating these tests from consideration. Based upon the findings listed, the following conclusions may be drawn regarding the objectives for this research:
30
1. The sodi urn sulfate soundness test is the best test to use in determining weak, non-durable aggregates;
2. The unconfined freeze-thaw test of discrete aggregate particles could be used to supplement sodi urn sulfate soundness tests but only for the small and intermediate sized limestone aggregates;
3. The confined freeze-thaw test of aggregate is the only test to satisfactorily determine an aggregate's resistance to freeze-thaw damage while embedded in concrete;
4. The pore index test indicates D-cracking susceptible aggregates, and is more accurate on homogenous 1 edge rock; and,
5. Generally, those aggregates that ex hi bit high absorptions are non-durable.
It is recommended that use of the sodium sulfate soundness test be continued. The test provides a relatively rapid determination of whether or not an aggregate is resistant to weathering action. The test should only be used in strict accordance with applicable recommended standard procedures. Any deviation from the standard procedures may have adverse effects on test results. If there are any doubts concerning any single soundness 1 oss for an aggregate, an average of three tests should be used. Present soundness 1 oss 1 imi ts for aggregates contained in concrete, as set by the Department, are considered satisfactory at this time. However, re-evaluations should be made periodically based upon data obtained to date.
The unconfined freeze-thaw test does not provide as rapid results as the sodium sulfate soundness test, but is more rapid than confined freezethaw tests. Because losses associated with the test are generally low, limits would be difficult to establish. Use as a supplemental test is not recommended at this time. Additional research may yield a good correlation between results of this test and sodium sulfate soundness test results for the smaller sized limestone aggregates.
Although no correlation was performed between field performance and results of the confined freeze-thaw test, the test is considered the best test to relate an aggregate's durability in concrete to field performance. The continued use of the confined freeze-thaw test is recommended. A criterion for durability factor should be established for confined freezethaw testing of aggregate particles. This may be accomplished by reviewing all data to date and setting a minimum level. Present limits for expansion of concrete, as set by the Department, are considered satisfactory at this time. Re-evaluations should be made periodically based upon data obtained to date. With regard to the relationship between confined freeze-thaw durability and percent crushed, crushing to a smaller size will generally improve the durability of both 1 imestone and gravel aggregates. The Department should establish a minimum percent crushed requirement for gravels used in portland cement concrete through addi tiona 1 research in this area. It is further recommended that the Department institute a longterm investigation into correlation of field performance of concrete pavements, bridges and bridge decks with results of the confined freezethaw test.
31
The pore index test should be used for testing ledge rock or to detect changes in working benches being crushed. Any criterion limits established by the Department with regards to this test should be examined carefully. D-cracking of concrete pavements usually takes 10 to 20 years to show up.
The limits for soundness loss currently employed by the Department generally assure that only durable aggregates are utilized in highway pavement structures. Some exceptions do exist. As shown in Table No. 5, aggregates from source number 170 {size No. 8) had a 16 percent loss associated with the sodium sulfate test while it also had less than 0.01 percent expansion in the confined freeze-thaw test. As shown in Table No. 6, source number 170 {size No. 57) met current requirements for use in portland cement concrete mixes in terms of losses associated with the sodium sulfate soundness test but exceeded the maximum percent expansion associated with the confined freeze-thaw test as currently set by the Department. Therefore it may be noted that some aggregates having high sodium sulfate soundness losses do perform well in concrete that undergoes freeze-thaw cycling. Also, it may be concluded that some aggregates having low soundness losses perform poorly in concrete that undergoes freeze-thaw cycling. A percentage of weak aggregate particles as low as 6 to 8 percent has been shown to have an adverse affect on the expansion of a concrete test specimen { 30).
The benefits associated with a rigorous aggregate testing program are aggregates that are high in quality and thus provide better transportation facilities for the general public with longer life expectancies. High quality aggregates for use in portland cement concrete mixes will generally be assured by using the combination of sodium sulfate soundness testing and confined freeze-thaw testing. Although, in order to find a better predictor of the in-service performance of aggregates used in concrete ·pavements, bridges and bridge decks, results of any candidate test being considered for adoption should be correlated with field performance and not results of the sodium sulfate soundness test.
32
1. Traylor, M. L.; Transportation Board, 1982.
REFERENCES
"Efforts to Eliminate D-Cracking in Illinois," Research Record No. 853, Transportation Research
2. Kaneuji, M.; "Correlation Between Pore Size Distribution and FreezeThaw Durability of Coarse Aggregate in Concrete," Joint Highway Research Project, Report No. JHRP-78-15, Purdue University, Indiana State Highway Commission, August, 1978.
3. Kaneuji, M. et. al.; "The Relationship Between an Aggregate's Pore Size Di stri buti on and Its Freeze-Thaw Durabi 1 i ty in Concrete," Cement and Concrete Research, Volume 10, 1980.
4. Havens, J. H.; "Freeze-and-Thaw Phenomena in Concretes and Aggregates," Research Report No. 287, Division of Research, Kentucky Department of Highways, r~arch, 1970.
5. Verbeck, G., and Landgren, R.; "Influence of Physical Characteristics of Aggregates on Frost Resistance of Concrete," Proceedings, American Society for Testing and Materials, Vol_ume 60, (1960).
6. Hunsucker, D.Q., "Survey of States' Aggregate Soundness Test Methods and Specifications," Research Report UKTRP-87-25, University of Kentucky Transportation Research Program, October, 1987.
7. Newlon, Jr., H., "Resistance to Weathering, Significance of Tests and Properties of Concrete and Concrete-Making Materials," American Society for Testing and Materials, STP 1698, 1978.
8. Dol ar-Mantuani, L., "Soundness and Deleterious Substances," Si gni fi cance of Tests and Properties of Concrete and Concrete-Making r4aterial s, American Society for Testing and Materials, STP 1698, 1978.
9. Larson, T., Cady, P., Fransen, M., and Reed, J.; "A Critical Review of Literature Treating Methods of Identifying Aggregates Subject to Destructive Volume Change When Frozen in Concrete and A Proposed Program of Research," Highway Research Board Special Report 80, 1964.
10. Neville, A.M.; Properties of Concrete, Third Edition, Publishing, Inc., London, 1982.
33
Pitman
REFERENCES (CONT) 11. Larson, T., Cady, P.; "Identification of Frost Susceptible Particles
in Concrete Aggregates," NCHRP Report No. 66, Highway Research Board, 1969.
12. Verbeck, G., "Pore Structure, Si gni fi cance of Tests and Properties of Concrete and Concrete-Making Materials," American Society for Testing and Materials, STP 169B, 1978.
13. Kl ieger, P., Monfore, G., Stark, D. and Teske, W., "D-Cracking of Concrete Pavements in Ohio, Final Report,'' Portland Cement Association, 1974.
14. Thompson, M.R., and Dempsey, B.J., "Durability Testing of Stabilized Materials," Final Report, Illinois Cooperative Highway Research Program, Series No.152, University of Illinois, Urbana, 1974.
15. Axon, E. D., Murray, L.T., and Rucker, R.M., "Laboratory Freeze-Thaw Tests Versus Outdoor Exposure Tests," Highway Research Record 268, Highway Research Board, 1969.
16. Lindgren, M.N., "The Prediction of the Freeze-Thaw Durability of Coarse Aggregate in Concrete by Mercury Intrusion Porosimetry," Joint Highway Research Project, Report No. JHRP-80-14, Purdue University,
Indiana State Highway Commission, October 1980.
17. Dolch, W.L., "Porosity, Significance of Tests and Properties of Concrete and Concrete-Making Materia 1 s," American Society for Testing and Materials, STP 169A, 1966.
18. Marks, V.J., and Dubberke, w., "Durability of Concrete and The Iowa Pore Index Test," Transportation Research Record No. 853, Transportation Research Board, 1982.
19. Bukovatz, J.E., Crumpton, C.F., and Worley, H.E., "Kansas Concrete Pavement Performance as Related to D-Cracking," Transportation Research Record No. 525, Transportation· Research Board, 1974.
20. Cady, P. D., "Upgrading Pavements," 1979.
Blankenhorn, P.R., Kune, D.E. and Anderson, D.A.; of Low Quality Aggregates for PCC and Bituminous NCHRP Report No. 207, Transportation Research Board, July
34
REFERENCES (CONT)
21. ASTM E-ll; Standard Specification for Wire-cloth Sieves for Testing Purposes; Annual Book of Standards, American Society for Testing and Materials, Philadelphia, U. s. A.
22. ASTM E-100; Standard Specification for ASTM Hydrometers; Annual Book of Standards, American Society for Testing and Materials, Philadelphia, u. s. A.
23. ASTM C-136; Standard Test Method for Sieve or Screen Analysis of Fine and Coarse Aggregates; Annual Book of Standards, American Society for Testing and Materials, Philadelphia, U. S. A.
24. ASTM C-215; Standard Test Method for Fundamental Transverse, Longitudinal, and Torsional Frequencies of Concrete Specimens; Annual Book of Standards, American Society for Testing and Materials, Philadelphia, u. s. A.
25. Havens, J.H., and Deen, R.C.; "Freeze and Thaw of Concretes and Aggregates," Research Report No. 454, Di vision of Research, Kentucky Department of Highways, June 1976.
26. ASTM C 127, Standard Test Method for Specific Gravity and Absorption of Coarse Aggregate, ASTM Annual Book of Standards, Part 14, American Society for Testing and Materials, Philadelphia, u.s.A.
27. ASTM C 128, Standard Test Method for Specific Gravity and Absorption of Fine Aggregate, ASTM Annual Book of Standards, Part 14, American Society for Testing and Materials, Philadelphia, U.S.A.
28. KM 64-604; Determination of the Percentage of Shale in Aggregate, Kentucky Methods, Kentucky Transportation Cabinet, Frankfort, Kentucky.
29. Sharpe, G. W., Allen, D. L., and Hunsucker, D. Q.; Memorandum Report to R. C. Deen, Director, Kentucky Transportation Research Program, University of Kentucky, December 12, 1984.
30. Miracle, D.; Memorandum Report to John McChord, Director, Division of Materials, Kentucky Department of Highways, Kentucky Transportation Cabinet, June 16, 1986.
35
APPENDIX A
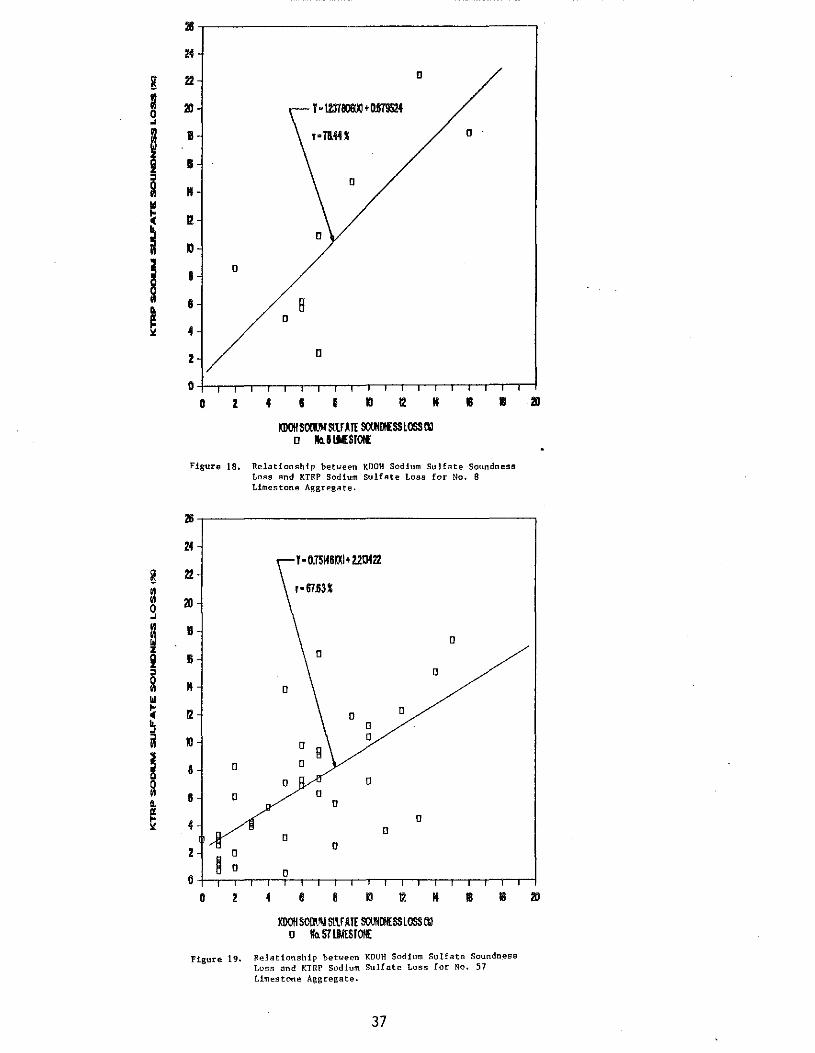
l!l
24
g 22 D
~ 20 l•l2JTIIOWJ + om524 ~
I II D
• a D
" Ill
~ 12
a .,
~ • D
8 8 ~
e D 4
2 D
0
0 2 4 I • ., 12 " • • Ill
KDOIISO!t"' SlUATE SOOti!£SS LOOS rll D lla.IIKSIOI£
Figure 18. RelationRhip betwe~n KDOH Sodium Sulfate Soundness toRs and KTRP Sodium Sulfate Loss for No. 8 Limestone Aggregate.
l!l
24 l•O.TSM&!XI+ 2213422
~ 22
~ r·67Ba
2 20
a B D
z i li ~ 0
~ M 0 w ~ 12 0
D b. 0 ~
~ ., 0 0
2 8 ! a 0 0
~ 0 0
8 0 0 ~ 0
~ 4 0
0 D
z 0 0
8 0 0 0
0 2 4 6 a ., 12 M • Ill Ill
KDOIISO\JIJ\15\UAIE 500t1MSSLOOS 00 0 II<>. 511.M:SIOI£
Figure 19. Relationship between KDOH Sodium Sulfate Soundness Loss and KTRP Sodium Sulfate Loss for No. 57 Limestone Aggregate.
37
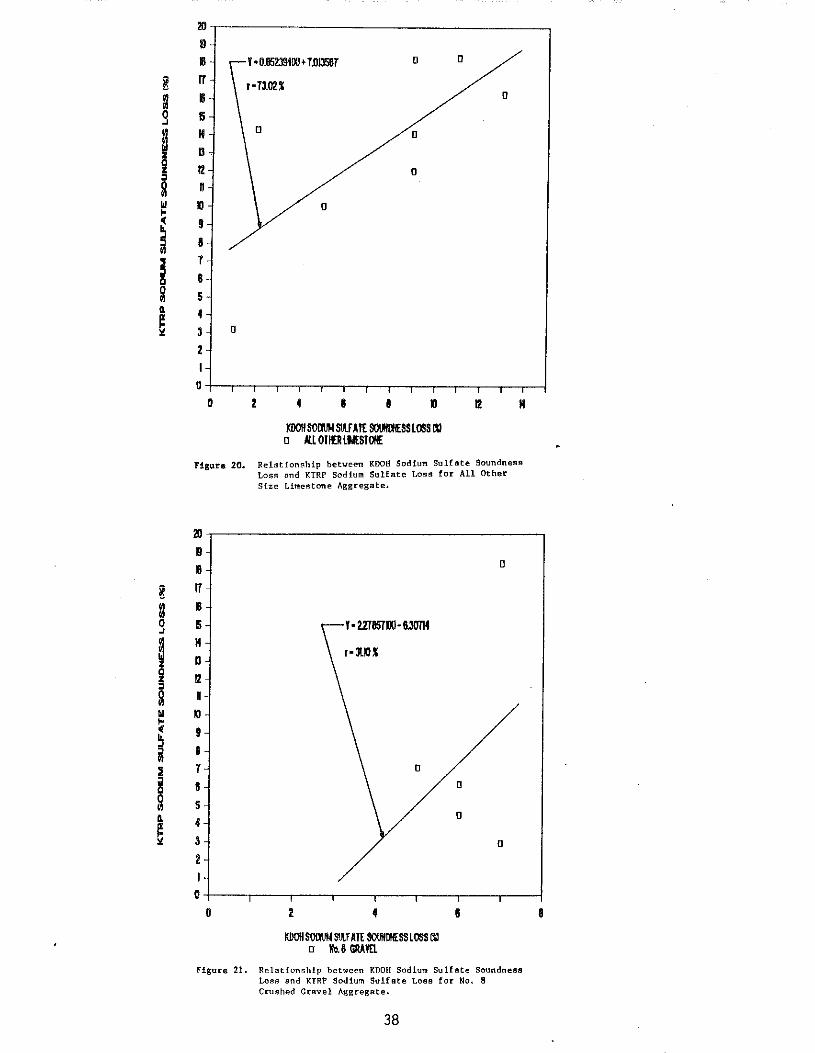
~ R 0 ~
i i ~
a w '" ~ ~ 2 ! g ~
~
~ ~ 0 ~
~ i " a w ~ ~ i ~
~ ~
e
20
D II
11 E &
II 0
12 n
10
9
8
T
8
5
4 3 0
2
0
0
Figure 20.
20
II
8
11 B
6 K D
12
n 10
9
I T
8
5
4 3
2
0
0
I •0.1!52.19t00 t T.DIJ58T D
D
D D
2
D
D
4 I I ., KOOIISOIIIINS\UA!I SO\If!MSSL!mt'll o II.I.OIIERLIMI:SIOI£
12 II
Relationghip between KDOH Sodium Sulfate Soundness Los~ 8nd KTRP Sodium Sulfate Lose for All Other Size LimeAtone Aggregate.
2 4
KOOI!Sil!MfS\lfAI£ SOUHIHSSLOSS t'll o N~8 GRAVEL
D
D
Figure 21. Relationship between KDOH Sodium Sulfate Soundness Loss and KTRP Sodium Sulfate Loss for No. 8 Crushed Gravel Aggregate.
38
8
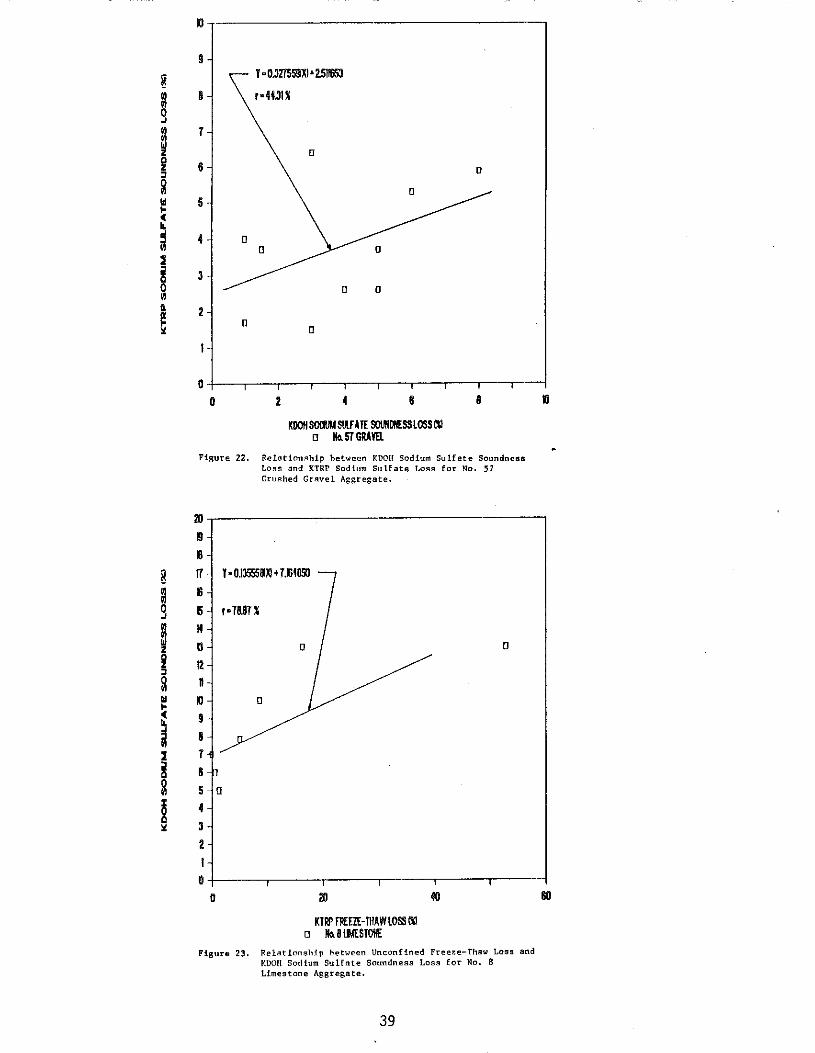
~ ~ 0 ~
~ i " a ~ ~ ( b. ~
~ l ! 0 ~ ~
~
g ~ 9
~ i , a ~ ~ ~
~ 2 ~ g g ~
Ill
9
8
T
6
5
4 " 3
2
"
0
I• 0.3275511XJ +7.511653
r•41.31'
"
2
"
" "
4 8
KDOHSOilUIIStl.fAIE SUI.IIflllf£SSLOSS l'll o llo.57GRAYa
"
a
Figure 22. Relotionflhip het1Jeen KDOH Sodium Sulfate Soundness Lo.<~~ and KTRP Sodium Sulfate Loss for No. 57 Crushed Gravel Aggregate.
20
!I
B
IT m 5 ~
D
12 n II 9
8 T
8
5 " 4 3
2
0 0
r•78.8U
0
20
KIRI' FIIHZE-n!AWLOSSOO o llo.BIMSJOII£
0
40
Figure 23. Relationship hetween Unconfined Freeze-Thaw Loss and KDOH Sodium Sulfate Soundness Loss for No, 8 Limestone Aggregate.
39
II
80
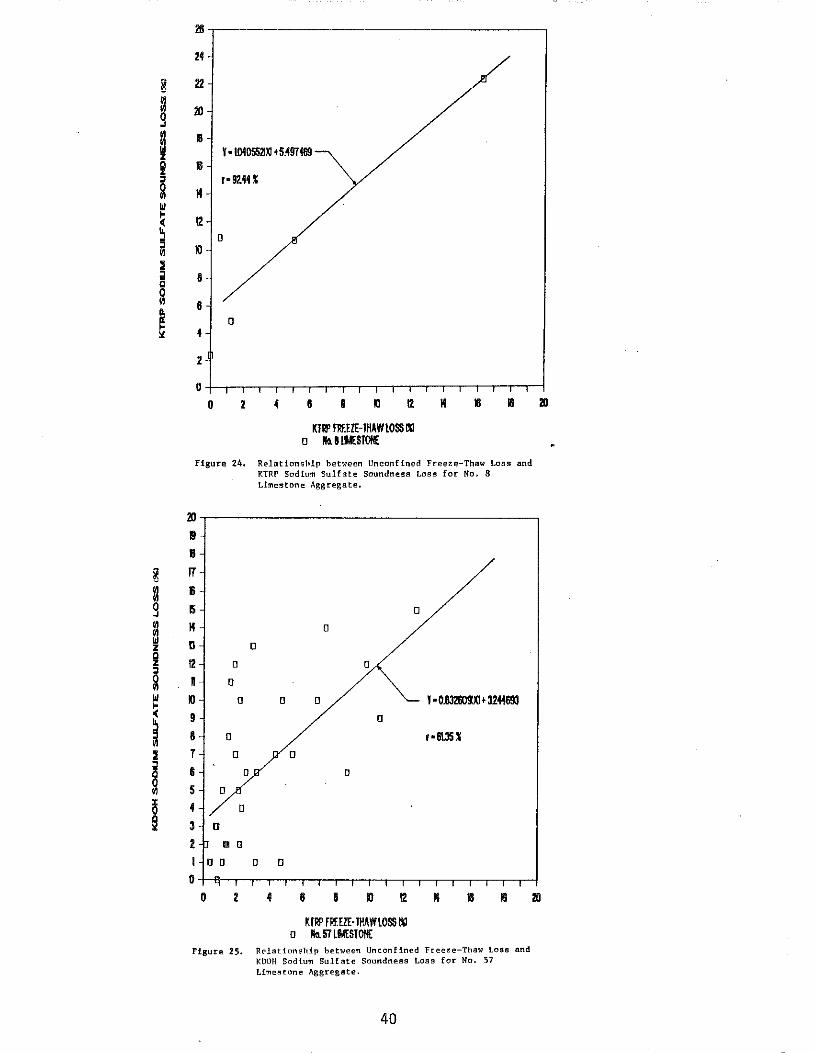
g ~ ~
9 ~ z 0 z , ~ w ~ ~ ~ 2 ! g g ~
211
24
22
20
B
&
M
12
10
8
6
4
2 -
l•l04055ZX!+5.49T469
r•91.4U
0
0
K!Rl' FRF.EZE-!HAI'ILOSS 00 o llo. 8lt.IES101£
/
Figure 24. Rel.:ltionship bet1~een Unconfined Freeze-Thaw Loss and Kl'RP Sodium Sulfate Soundness Loss for No. 8 Limestone Aggregate.
20
!I
8
IT Jj
15 K n 0
12 0
n 0
10 0
9
8 0
T 0
6 0
5 0
4 0
3. D
2 " 0
D 0 0
0
0 I
0
0
4
0
0
0
0
0
0
8 D I) 12
KIR!' FIIHZE-lliAI'IlOSS 00 o llo. 5TlfAESIO!fE
0
1•0.832ro!IXJ+ 3244693
r•m.:u
M Ill Ill
Figure !5. Relntionship between Unconfined Freeze-Thaw Loss and KDOH Sodium Sulfate Soundness Loss for No. 57 Limestone Aggregate.
40
m
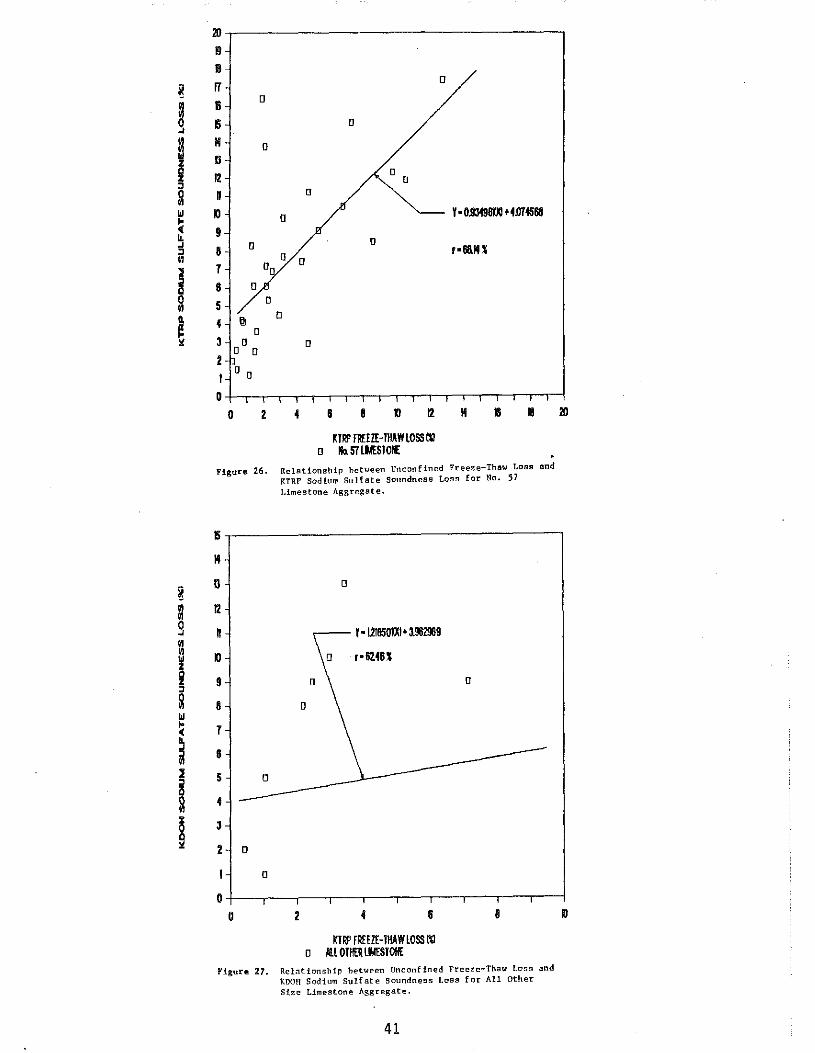
~
~ ~ z i ~
Q w ~ ~ ~ :l 0
~ g ~
~ ~
~ m 9 0 0
~ i ~
Q w ~ ~
a 2
~ ~ ~
20
!I B
f7
E 5 N D
12 n
10
9 8 0
T
8 0
5 4 I!
0 3 0
0 2 -
0
0 0
0
0
0
0 0 0
0
0
0
0
0 0
0
KIRP FliHZE-IHAWLOSS 00 o llo. 57LNESIONE
0
y • 0.931!181JII+ 4.1!1 4568
r•liii.U
Figure 26. Relationship between Unconfined Freeze-Thaw Loss and KTRP Sodium Sulfate Soundness Loss for No. 57 Limestone Aggregate.
II
14
D
12
n II
9
8
T
8
5 0
4
3
2 0
0
0
0 1
0
Y-121050IXI+1962969
r·624U
0
0
4 6
KIRP FIIHZHHAWLOSSOO o All OTHER LM:STOIIE
0
Figure 27. Relntionship hetw!"en Unconfined Freeze-Thaw Loss and KDOH Sodium Sulfate Soundness Loss for All Other Size Limestone Aggregate.
41
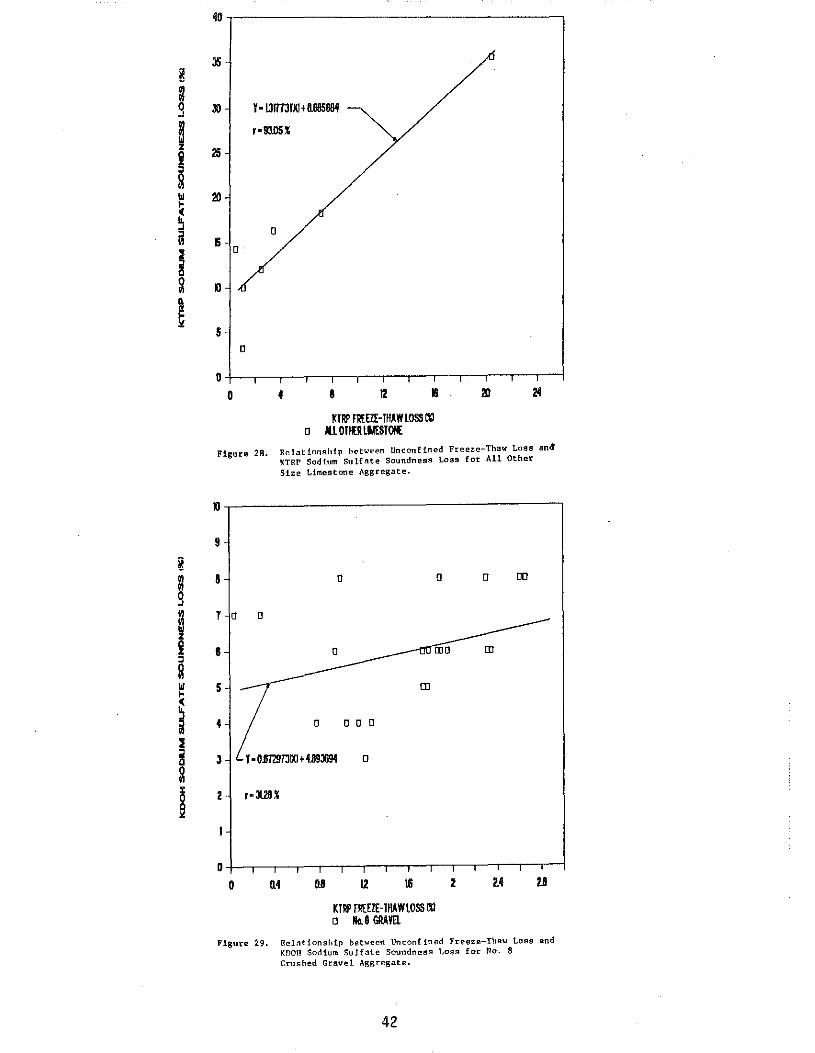
~ ~ 9 B i ~
~ w ~ ~ ~ 2 ~ g
~
40
35
30
25
20
& -0
XI
5 0
0
0
Y-l31TTJ!XI + !1185884
r·93.05~
0
4 8 12 Ill
Kill!' FRt:E!HHAYtLOSSOO o Ill OlllR Lt.lESIO!E
20
Figure 28. Relationship between Unconfined Freeze-Thaw Loss and' KTRr Sodium Sul(ate Soundness Loss for All Other Size Limestone Aggregate.
~~~----------------------------,
9
8 0 00
T o 0
6 tD
5 00
4 0 0 0 0
3 I· Om!I!JIXJ + 4.893694 0
2
Of-,--,-,-,-,-,--.-.-~.--.-.-.-.~ 0 0.4 L2 16 2.4
Kill!' FRt:E!E-IHAYtlOSS 00 0 "" 8 GilA YEl
Figure 29. Relationship between Unconfined Freeze-Thaw toss and KnOH Sodium Sulfate Soundness Loss for No. 8 Crushed Gravel Aggregate.
42
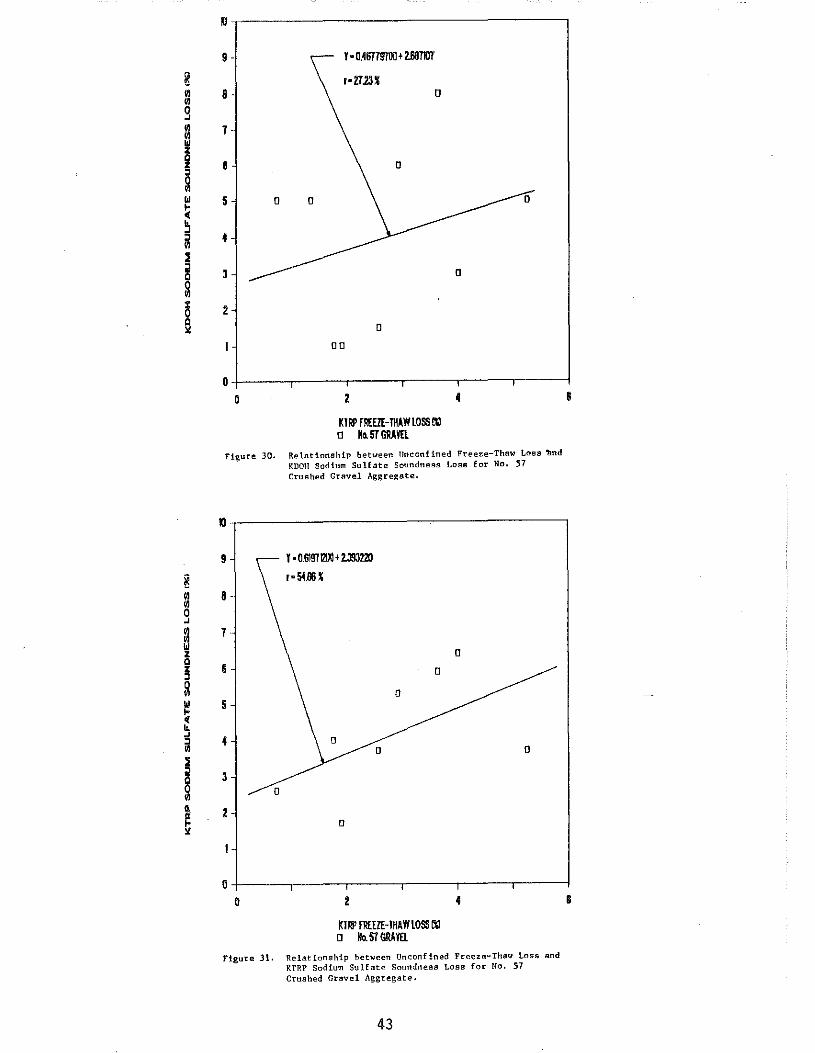
~ 0 0 g
~ z i , Q w ~ ~ ~ 2 g g g ¥
~ 0 0 0
" ~ w z Q z , ~ w ~ ( ~
" ~ 1 ~ g • ~ ~
10
9- Y· o.46Tm1XI + m711l1
r•Z7.23% 8 0
7-
6 0
5 0 0
4
3 0
2 0
00
0+-----,----.-----r----.-----,---~ 0 2
Kl~ fiiEEZE-JHAYILOSSOO o M• 5T GRA YEl
4
Figure 30. Relationship between Unconfined Freeze-Thaw Loss "lmd KDOH Sodium Sulfate Soundness Loss for No. 57 Crushed Gravel Aggregate.
10
9 I• 0.61!11rul + 2.l9J220
r·51.11U
8-
7
0
6 0
0 5
4 0 0 0
3 0
2 0
8
ot----.----.----,----,----.--~ 0 2
Kl~ fiiEElE-IHAYILOSSOO o No 5T GRA YEl
4
Figure 31. Relationship between Unconfined Freeze-Thaw Loss and KTRP Sodium Sulfate Soundness Loss for No. 57 Crushed Gravel Aggregate.
43
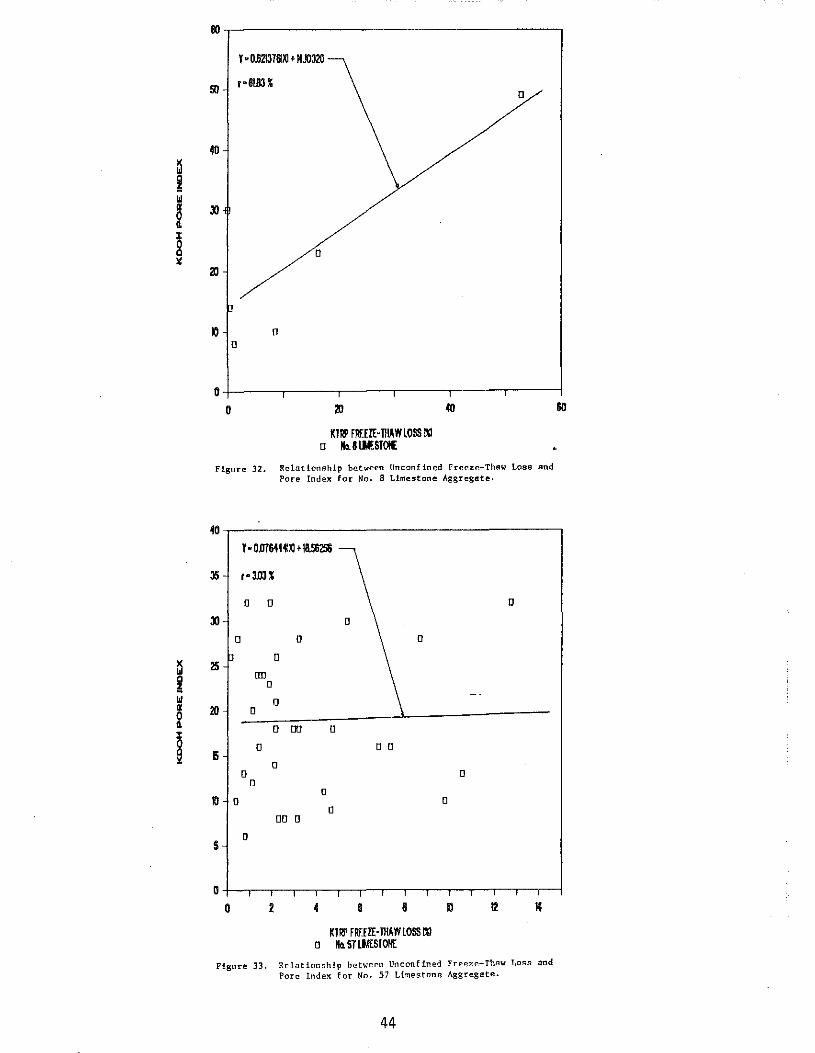
~ i w m ~ %
~
~~-------------------------------.
40
20
10 0
I• 0.621376~ + M.I0310
r·61.83%
0
0
0
o+-----.----.-----.----.-----.---~ 0 20
Kllll' FRf.EZE-niAW LOSS 1%1
0 "• 8111!.810!£
40
Figure 32. Relationship between Unconfined Freeze-Thaw Loss and Pore Index for No. 8 Limestone Aggregate.
60
40,----------------------------------.
35 r•:JJXU
0 0
0 0 0
0 25
an 0
10 0 0
0 DO 0
5 0 0 0
0 0
D 0
10 0 0
00 0
5 0
Kllll' FIIHZHHAYILOSS 1%1 o No. 57LI.4ESIOHE
0
0
0
Figure 33. Relationsh:lp be.tween Unconfined Freeze-thaw Loss and Pore Index for No. 57 Limestone Aggregate.
44
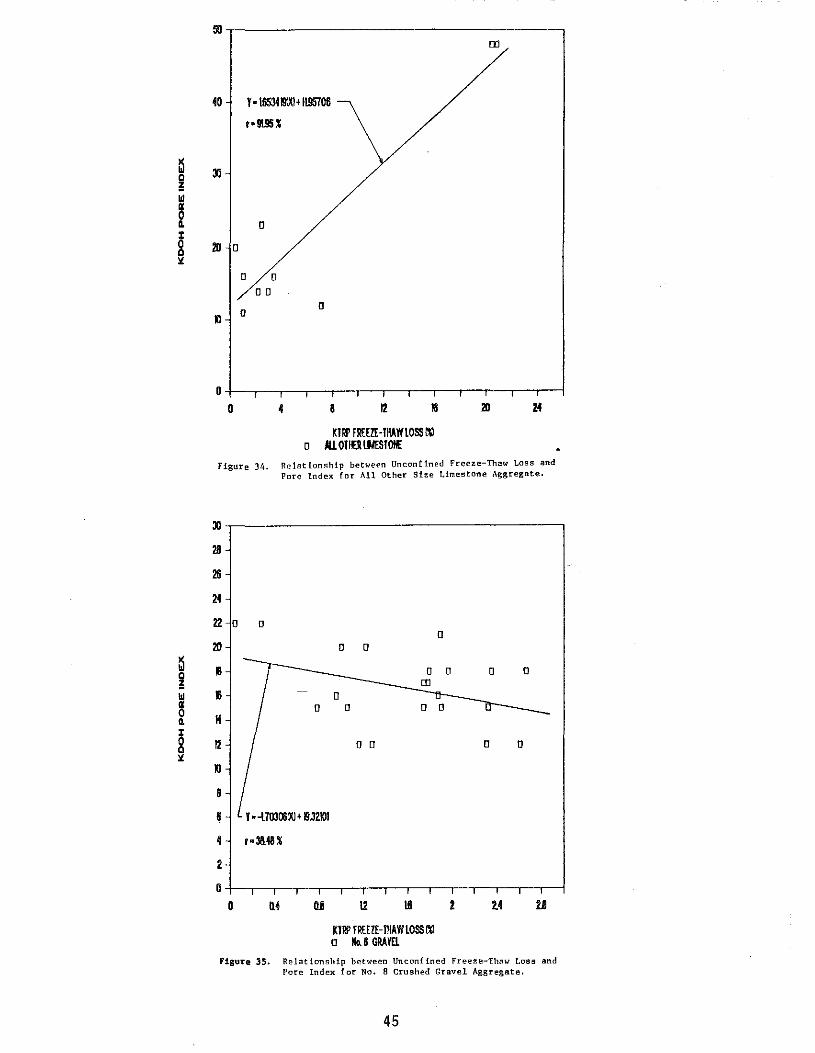
~ c ! w ~
i % g ~
~ ~ w ~ 0 ~
g ~
40
:kl
lll 0
Wl
0
T •IB534191XI • 100011
r·9t95~
0
0 0
0 0
0
4
0
8 12 Ill
Kllll' FR£E!HHA\'ILOSSN o ltlOIIOLNESIOffE
rn
lll 24
Figure J4. RclatlonHhip between Unconfined Freeze-Thaw Loss and Pore Index for All Other Size Limestone Aggregate.
:kl
2B
26
24
22 0 0
lll
B
II 0
H
12
Wl
8
6 T •-l7030000< OJ2101
4 r•31l4U
2
0
0 fi4 WI
0 0
0 0
0 0
12 Ill
Kllll' FR£E!HIA\'ILOSS N o K~8 GRAYU
0
0 0 0
0 0
2 u
Figure 3S. Relationship between Unconfined Freeze-Thaw Loss and Pore Index for No. 8 Crushed Gravel Aggregate.
45
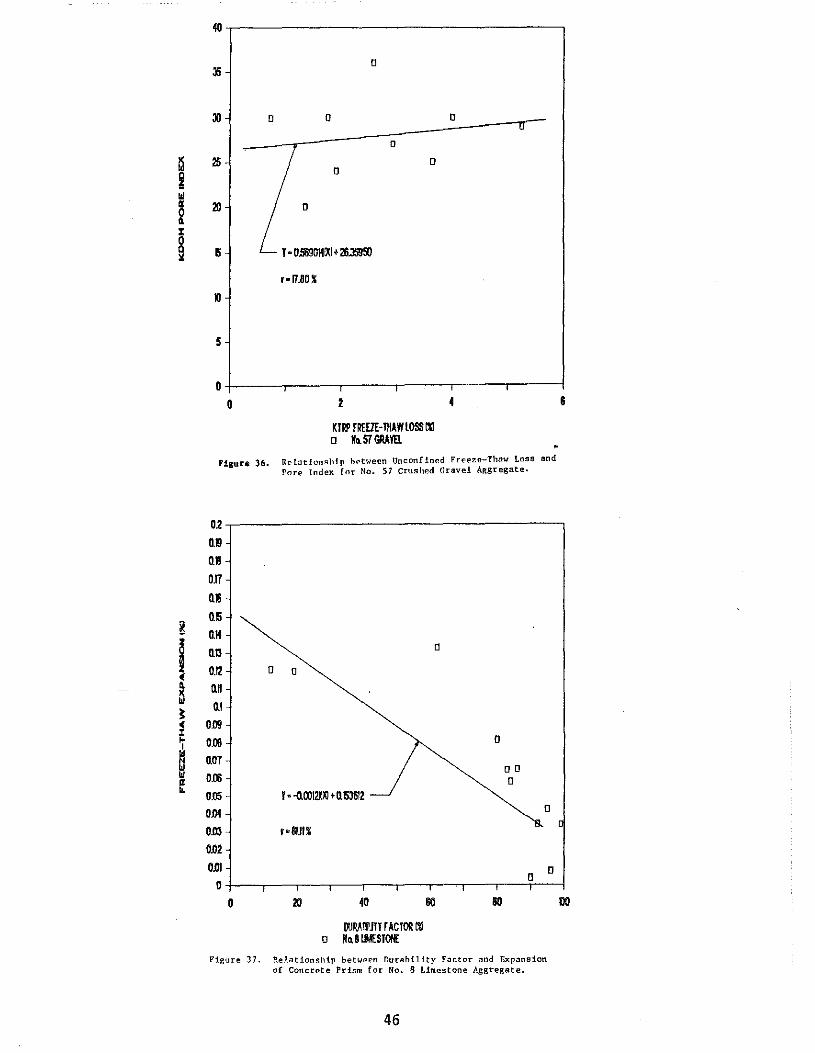
~ ~ w « ~ % g ~
~
i (
~ ~ ~ ~
~ w « ~
40
0 35-
0 0 u
0
25 0 0
20 0
T • 0.9i!!OHIXI + 26.J5950
r·rr~O%
10
5
0
0 2 4
Kill!' fRHlE-TIIAW lOSS 00 0 K•5TGRAIEL
Figure 36. Rt'tntionshlp between Unconfined Freeze-Thnw Loss Pore Index for No. 57 Crushed Gravel Aggregate.
and
02 na nu 0.17
u ns nK nn 0
0.12 0 0
nn 0.1
O.D!J
O.D!J 0
nor 0 0
0.00 0
OJJ5 I• ~00121~ +QISJ61Z
om 0
0.00 r•81.11~
O.D2
om 0
0 0
0 20 40 liO 60
~JI!Ail'JTI fACTOR 00 0 K• 81J.lESTOIIE
Figure 37. Relationship between Durability Factor and Expansion of Concrete Prism for No, 8 Limestone Aggregate.
46
6
llO
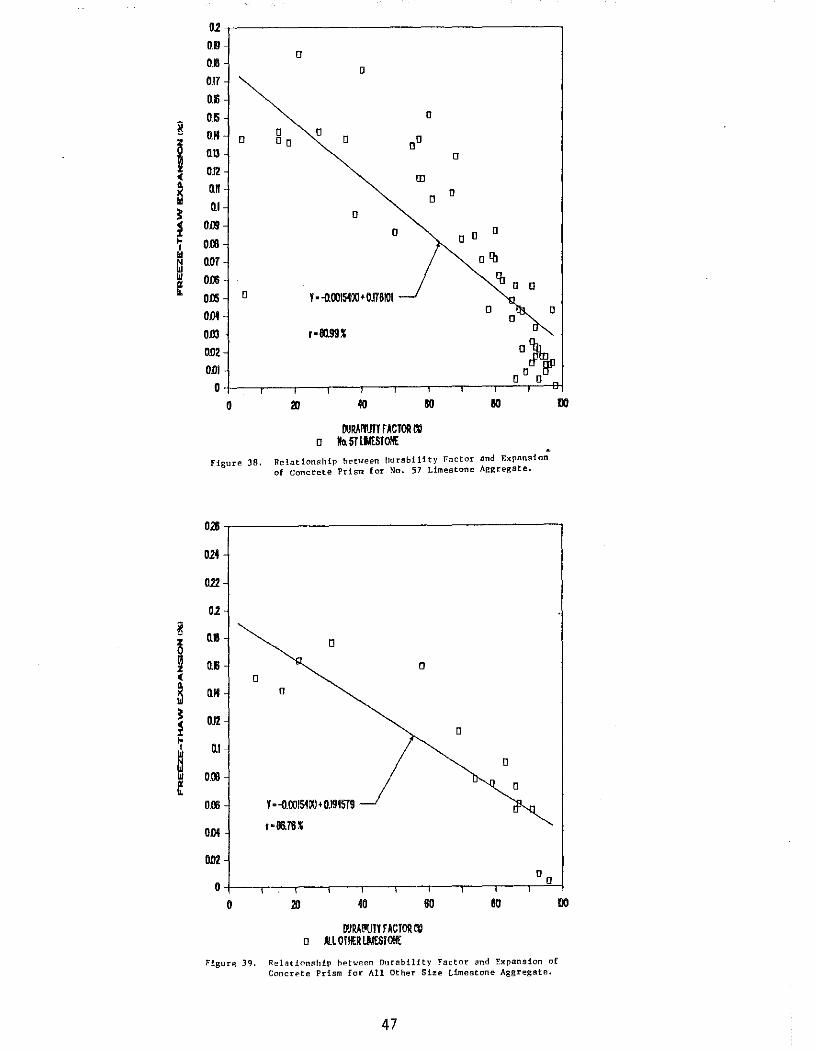
~
; (
s ~ ~
~ w ~ ~
~
i (
~ ~ ~ ~
~ w ~ ~
01-
0.0 0
0.8 0
0.11 Qfi
n5 0
O.K 0 0 0 0 0 0 00
OJ3 0
0.12 m nn- 0
n1 0
0 0.00 0 0.00 0 0
QO! o'b 0.00 'b 0 0 0.00 0 I• -i100154~1+01TBIOI
OJil 0 0 0
0.00 r·ln99X
M2 0~ 0.01 o 0 of!!'
0
0 20 40 60 110 IX)
OORAilUIHACIOII ~ 0 llo. 51lt.IESTOHE
Figure JB. Relationship between nurability Factor '"' Expansio;
of Concrete Prism for No. 57 Limestone Aggregate.
0.16
024
n22
0.2
nB 0
n6 0 0
nM 0
0.12
n1 0
0.00 0
0.00 I· -ll00154~1 + 0.191519
O.D4 r·Bii!U
O.D2
0 00
0 20 40 60 IX)
~JRAl'UII FACIO\l 00 0 Ill OIHER lt.IESIO!IE
Figure 39. RelatiQnship between Durability Factor and Expansion of Concrete Prism for All Other Size Limestone Aggregate.
47
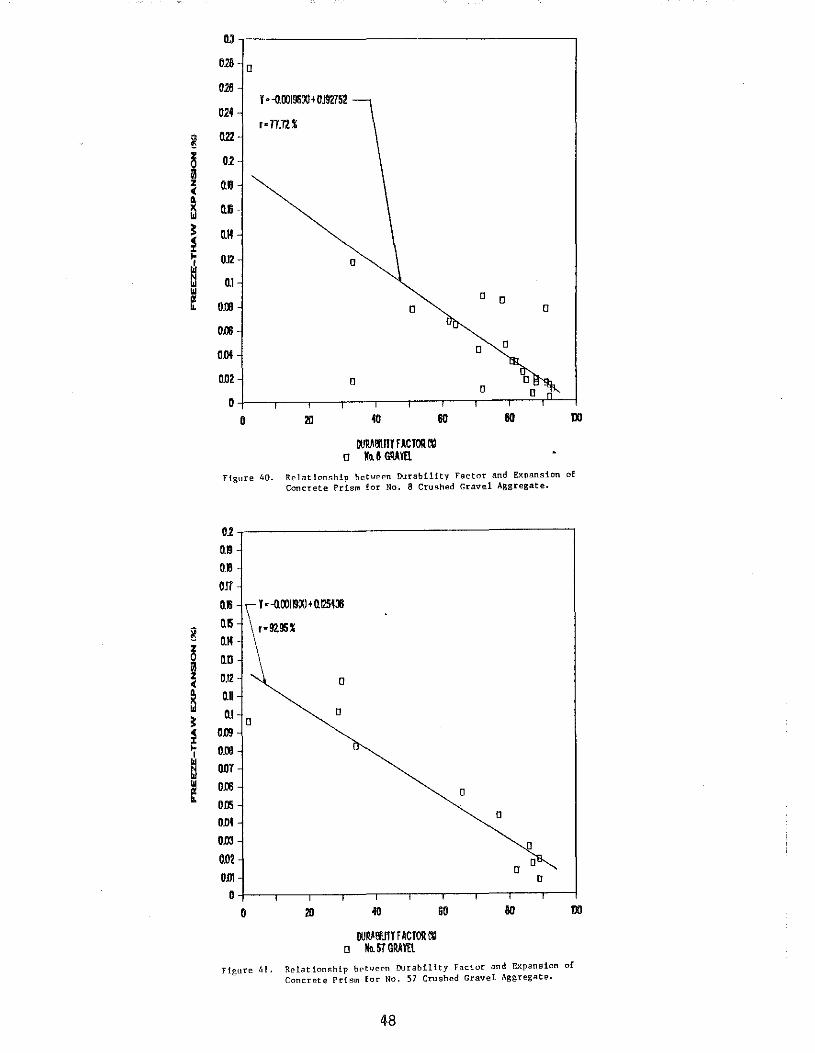
~
i ~
~ ~ ~
~ • ~ ~
ro~----------------------------,
02B- a
016
024
Q22-
02-
nu
0.6
nM
OJ2
OJ
om O.lli
OJJ4
OD!
0
0
I• -([0019600 + 0.192752
r•TT.12%
10
a
0
40
OORAIIIn!FACIOI! Ill o N•& GAAI!l.
a 0 0
0 a
0
60 60 00
Figure 40. Relat ion~hip bet\~een Durability Factor and Expansion of Concrete Prism for No. 8 Crushed Gravel Aggregate.
01 0.9 0.8-
orr 0.6
O.fi O.K
no 0.12
nn 0.1 a
0119
0.00 MT O.lli
0115
ODI
0.00
0.02 om
0 0
l•-(l0019:XI+O.I2Sili
0
0
10 40
OOR.AII\JIIFACIOI! Ill a No5TGRAI!l.
60
0
a
0 0
D
60 00
Figure td. Relatlonr:;hip bPtWeC'n Durability Factor and Expansion of Concrete Prism for No. 57 Crushed Gravel Aggregate.
48
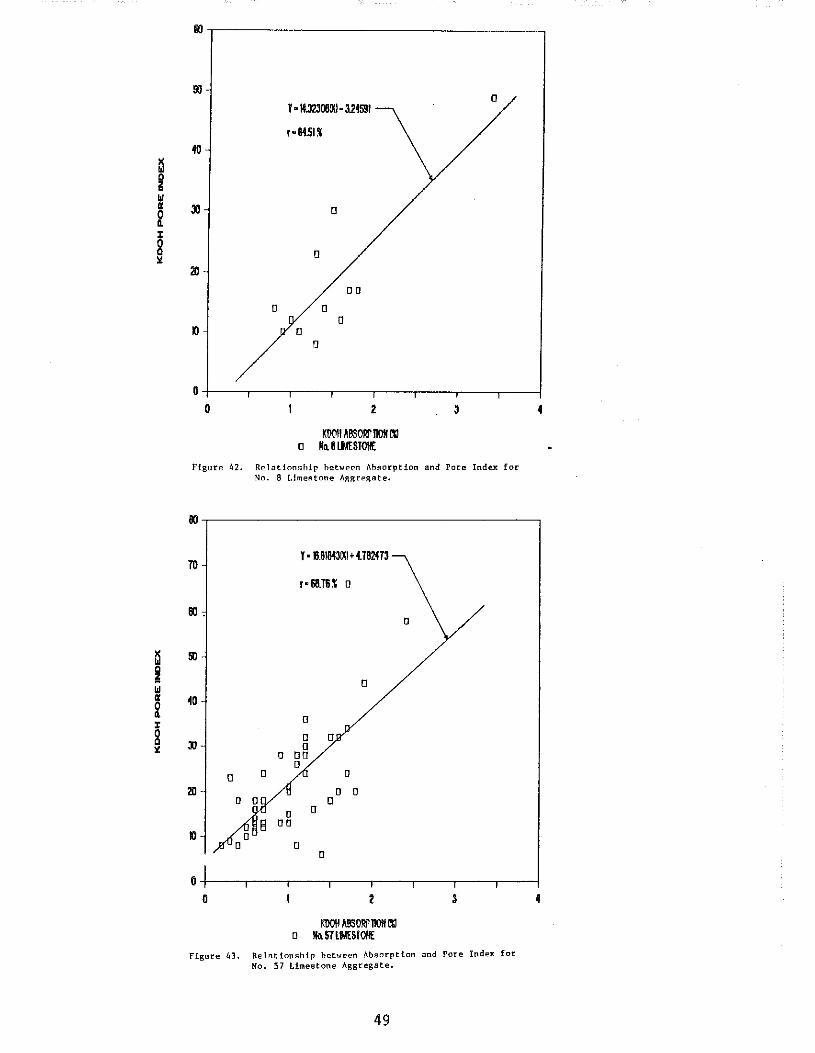
00~----------------------------.
50
40
20
Xl
0
I• M.32300~1- 324591
r•8l51%
00
0 0 0
0 0
2
!0011 ~llSORrOO!fOO o ~. 8LIAES!Oht
0
3
Figure "2. Relationship between 1\b~orption and Pore Index for No. 8 Lime!'ltone Aggrl"gate.
4
00,--------------------------------.
70
00.
50
ll·
0 0
20
Ill
I· 6]1843~1 + U82413
r•68.TU o
0
0 0 0
0 00 0
0 00
0
0
0
0 0 0
0
0
Ot---.---,---,----.---,---.---.--~
0 2
KDOil AllSORrOO!fOO o No. 51lM:SIOIIE
Figure 43. Relntlonship bet1~een Absorption and Pore Index for No. 57 Limestone Aggregate.
49
4
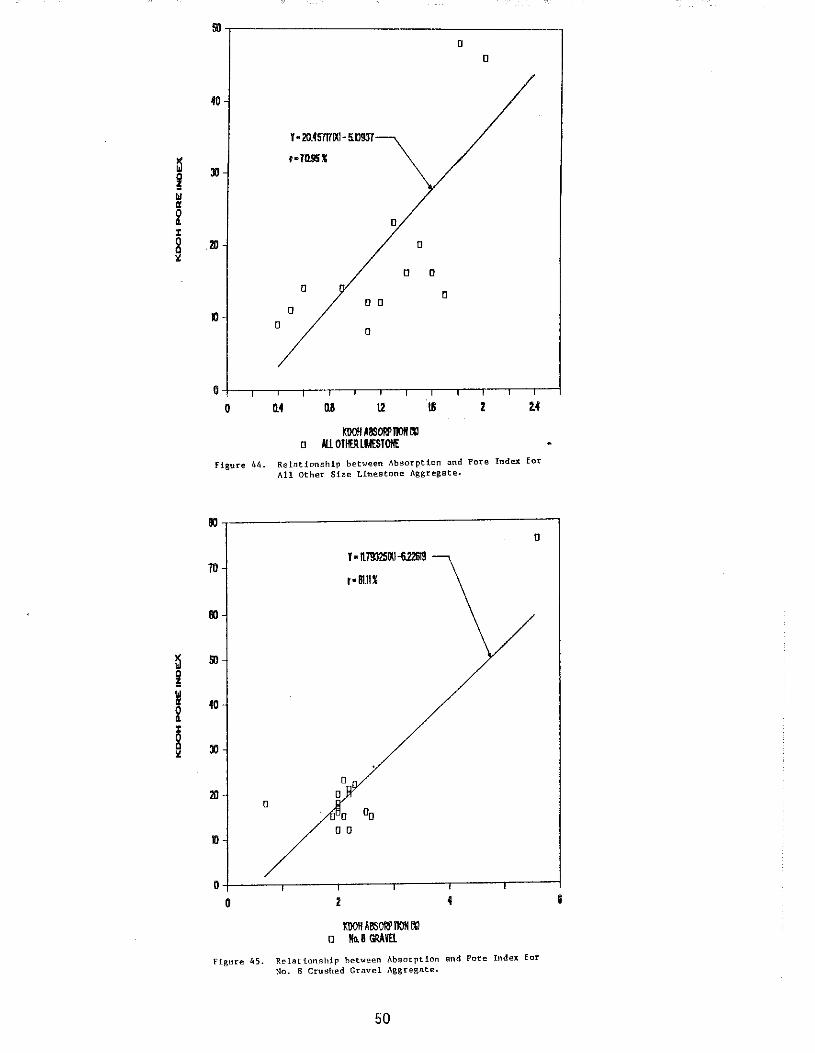
~ i Ill a ~ %
8 ~
40
30
2lJ
10 a
Y • 20. 45717~1-5.D931
r•TII.9U
a
a
a a
a a a
a
!0011 AI!SOF.PIJOft 00 a IU OiliER LM:SIOIIE
0
a
0
0
Figure 44. Relntionship between Absorption and Pore Index for All Other Size t.imestone Aggregate.
11l
40
0
10
a 0
a aa a o
a
ot-----.----,-----.----.-----.---~ 0 2 4
Figure 45. Relationship hetween Absorption and Pore Index for No. 8 Crushed Gravel Aggregate.
50
6
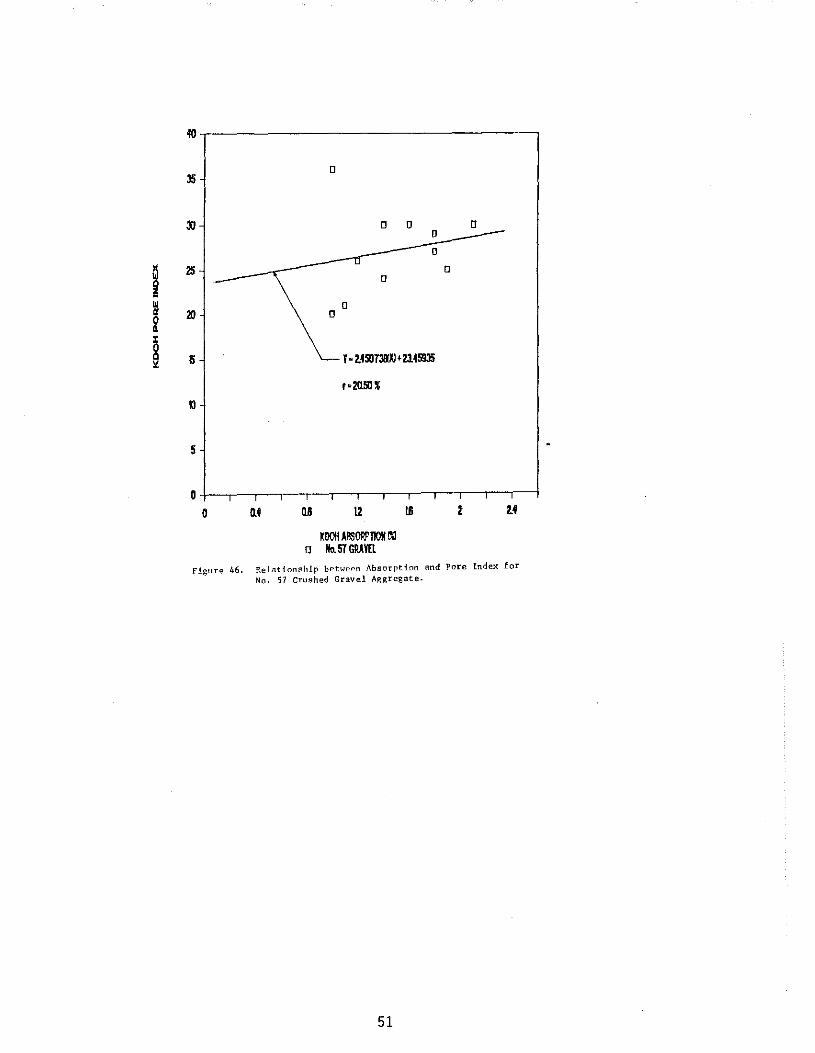
40
0 35
0 0 0 0 -0
~ 25 -u
0
~ - 0
w 0 a 20 0 0
• %
8 6 I· W07311XI+21459J5 ~
r•20.SO ~
10
5
0 I I I
0 0.4 OJ 12 !6 2 2.4
KOO!l AIISOIIPTIO!Hil 0 Ho.57GRAffi
Figure 46. Relationf1hlp between Absorption and Pore Index for No. 57 Crushed Gravel Aggregate.
51
APPENDIX B
•FREEZE-AND-THAW PHENOMENA IN CONCRETES AND AGGREGATES" Havens, J, H., Research Report No. 287, Division of Research, Kentucky Department of Highways, March, 1970.
In conducting 1 aboratory freeze-thaw test on concrete, it is customary to monitor weight, natural frequency, and temperature. Temperature records are usually obtai ned by thermocouples embedded in companion specimens of concrete under test. Automatic recording instruments have proved desirable. Using such equipment in a study on the freeze-thaw durability of concrete made with a highly porous aggregate, a rather wide isothermal step in the time-temperature curves was detected -- which, except for a slight depression of the freezing point, corresponds to the normal phase transition from water to ice. While the effects, there, were magnified by the large quantity of absorbed water in the porous aggregate, it was obvious that they also portrayed certain fundamental physical principles involved in the disruptive action of freeze-thaw on ordinary concrete. The isothermal steps were truly manifestations of the latent heat of fusion of water absorbed in the concrete, and the freezing point depressions were apparently manifestations of pressure. These findings suggested that time-temperature records, if accurate, could provide information concerning the amount of freezable water in concrete undergoing freezethaw, the progress of saturation, permeability, the internal pressures induced by freezing at various levels of saturations, and the progress of damage to the concrete.
Current test methods for aggregates employ composite samples and results of such tests provide average values. In order to obtain objective data pertaining to the freeze-thaw characteristics of aggregate -- that is, to establish more definitive relationships between effects of freezing and thawing of an aggregate and its physical properties of porosity, absorption, and bulk specific gravity -- a method of test was de vi sed whereby the discrete conditions previously mentioned were fulfi 11 ed. A freezing medi urn was sought whereby each particle could be frozen quickly. The quickly frozen surface would form a seal about the particle and retain the pore water. Also, the medium did not contaminate the pore water. Chilled mercury was chosen as the freezing medium -- it has high thermal conductivity, it is immiscible with water, and it has a low freezing point. The test consisted of submerging the aggregate particle in pre-chilled mercury. From preliminary testing, it was determined that if a particle did not show visual distress at the end of 4 cycles -- which could be performed in a matter of minutes -- it would withstand innumerable cycles.
Results of tests on discrete aggregate particles showed the following relationships:
53
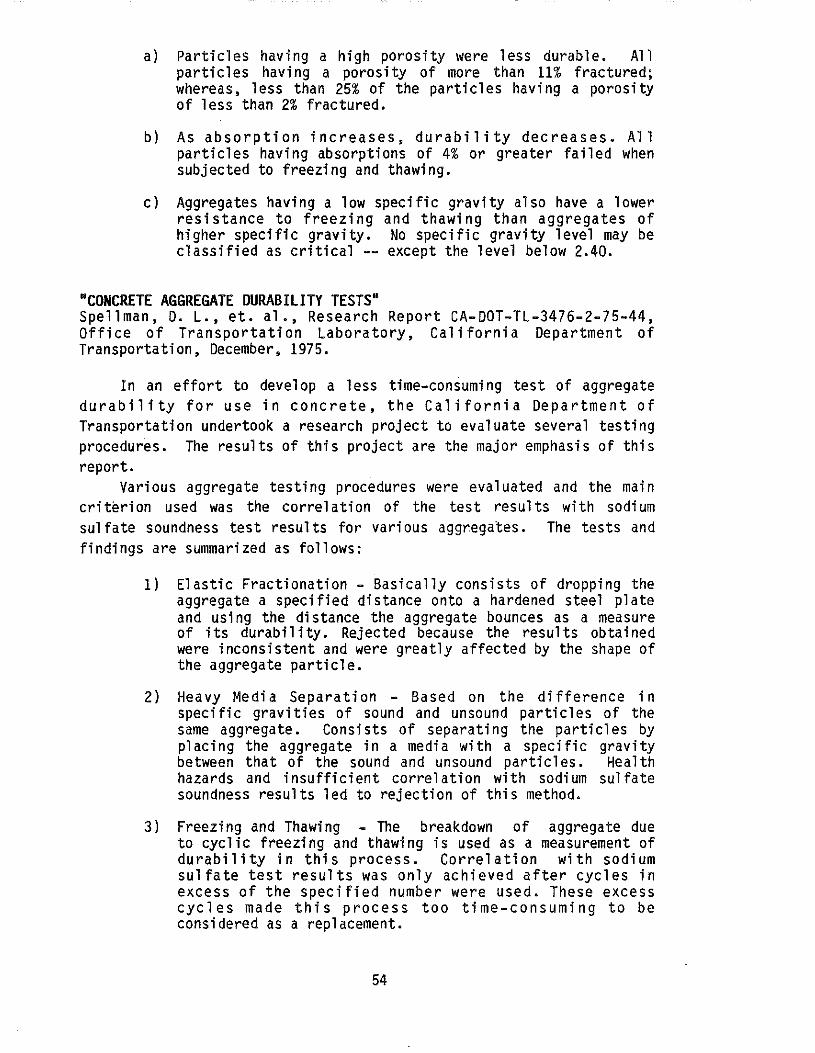
a) Particles having a high porosity were less durable. All particles having a porosity of more than 11% fractured; whereas, less than 25% of the particles having a porosity of less than 2% fractured.
b) As absorption increases, durability decreases. All particles having absorptions of 4% or greater failed when subjected to freezing and thawing.
c) Aggregates having a low specific gravity also have a lower resistance to freezing and thawing than aggregates of higher specific gravity. No specific gravity level may be classified as critical -- except the level below 2.40.
"CONCRETE AGGREGATE DURABILITY TESTS" Spellman, 0. L., et. al ., Research Report CA-DOT-TL-3476-2-75-44, Office of Transportation Laboratory, California Department of Transportation, December, 1975.
In an effort to develop a less time-consuming test of aggregate durability for use in concrete, the California Department of Transportation undertook a research project to evaluate several testing procedures. The results of this project are the major emphasis of this report.
Various aggregate testing procedures were evaluated and the main criterion used was the correlation of the test results with sodium sulfate soundness test results for various aggregates. The tests and findings are summarized as follows:
1) Elastic Fractionation - Basically consists of dropping the aggregate a specified distance onto a hardened steel plate and using the distance the aggregate bounces as a measure of its durability. Rejected because the results obtained were inconsistent and were greatly affected by the shape of the aggregate particle.
2) Heavy Media Separation - Based on the difference in specific gravities of sound and unsound particles of the same aggregate. Consists of separating the particles by placing the aggregate in a media with a specific gravity between that of the sound and unsound particles. Health hazards and insufficient correlation with sodium sulfate soundness results led to rejection of this method.
3) Freezing and Thawing - The breakdown of aggregate due to cyclic freezing and thawing is used as a measurement of durability in this process. Correlation with sodium sulfate test results was only achieved after cycles in excess of the specified number were used. These excess cycles made this process too time-consuming to be considered as a replacement.
54
4) Durability Index - Correlation between Durability Index and sodi urn sulfate soundness test results for fine aggregate was anticipated to carry over to coarse aggregate. The end products from the Durability Index Gradation and the Sodium Sulfate Degradation were observed to be so dissimilar that it was meaningless to attempt to correlate the tests. The durability index was rejected for this reason.
5) Autoclave Degradation - This process attempts to reduce the pressure dissipation which occurs in freeze-thaw when water migrates into small void spaces. This is accompli shed by conducting tests with saturated aggregate in a pressurized environment. Instantaneous release of pressure in the autoclave would cause water within the pores and cracks to expand and form steam. The resulting internal pressure causes degradation of the aggregate. Carrel ati on between results from this test and the Sodi urn Sulfate Soundness test was only achieved when degradation was completed by rotating the aggregate with rubber balls in a drum. The correlation did not exist for all aggregates; thus, this test was rejected.
6) Detrition Value Test- This test utilizes abrasive degradation through the shaking of aggregate and water in a five gallon can. This test indicated good correlation overall with sodium sulfate soundness results, although this correlation varied somewhat with aggregate type.
Conclusions:
The main conclusion of this project as listed In the report is that the Detrition Value Test is the most promising in terms of replacing the Sodium Sulfate Soundness test for durability of aggregate.
•coNCRETE AGGREGATES" New Zealand Concrete Research Association, July 1976
There is no clear cut method for the selection of aggregate in a concrete mixture. It appears that the only basis the New Zealanders have is one that employs a "wait and see method." They base their judgments about specific aggregates on the performance of the concrete which contains the particular aggregate.
Here they test the concrete's compressive strength. The aggregate is deemed to be good when its compressive strength is not less than 33 MPa at 28 days. Another useful test proposed would measure the dimensional stability of the aggregate by the drying shrinkage of concrete at a specific rate.
55
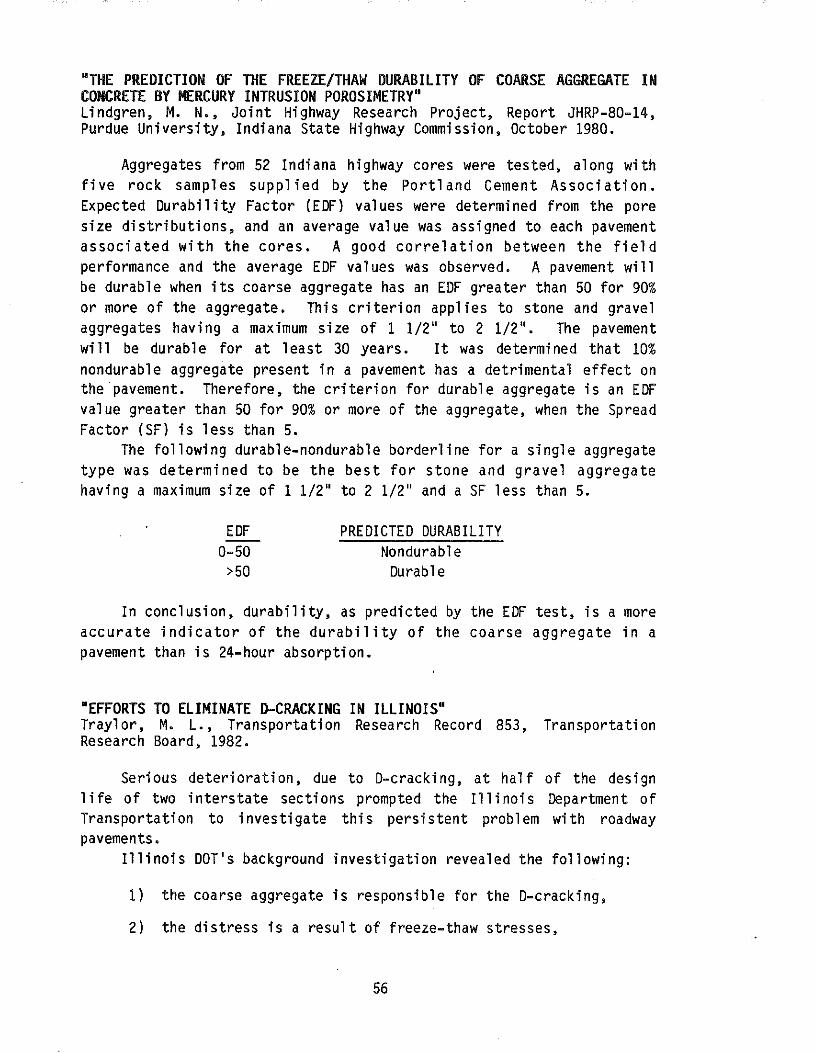
"THE PREDICTION OF THE FREEZE/THAW OURABILITY OF COARSE AGGREGATE IN CONCRETE BY MERCURY INTRUSION POROSIMETRY" Lindgren, M. N., Joint Highway Research Project, Report JHRP-80-14, Purdue University, Indiana State Highway Commission, October 1980.
Aggregates from 52 Indiana highway cores were tested, along with five rock samples supplied by the Portland Cement Association. Expected Durability Factor ( EDF) values were determined from the pore size distributions, and an average value was assigned to each pavement associated with the cores. A good correlation between the field performance and the average EDF values was observed. A pavement wi 11 be durable when its coarse aggregate has an EDF greater than 50 for 90% or more of the aggregate. This criterion applies to stone and gravel aggregates having a maximum size of 1 1/2" to 2 1/2". The pavement will be durable for at least 30 years. It was determined that 10% nondurable aggregate present in a pavement has a detrimental effect on the ·pavement. Therefore, the criterion for durable aggregate is an EDF value greater than 50 for 90% or more of the aggregate, when the Spread Factor (SF) is less than s.
The following durable-nondurable borderline for a single aggregate type was determined to be the best for stone and gravel aggregate having a maximum size of 1 1/2" to 2 1/2'' and a SF less than 5.
EDF 0-50
>50
PREDICTED DURABILITY Nondurable Durable
In conclusion, durability, as predicted by the EDF test, is a more accurate indicator of the durability of the coarse aggregate in a pavement than is 24-hour absorption.
"EFFORTS TO ELIMINATE D-CRACKING IN ILLINOIS" Traylor, M. L., Transportation Research Record 853, Transportation Research Board, 1982.
Serious deterioration, due to D-cracking, at half of the design life of two interstate sections prompted the Illinois Department of Transportation to investigate this persistent problem with roadway pavements.
Illinois DOT's background investigation revealed the following:
1) the coarse aggregate is responsible for the D-cracking,
2) the distress is a result of freeze-thaw stresses,
56
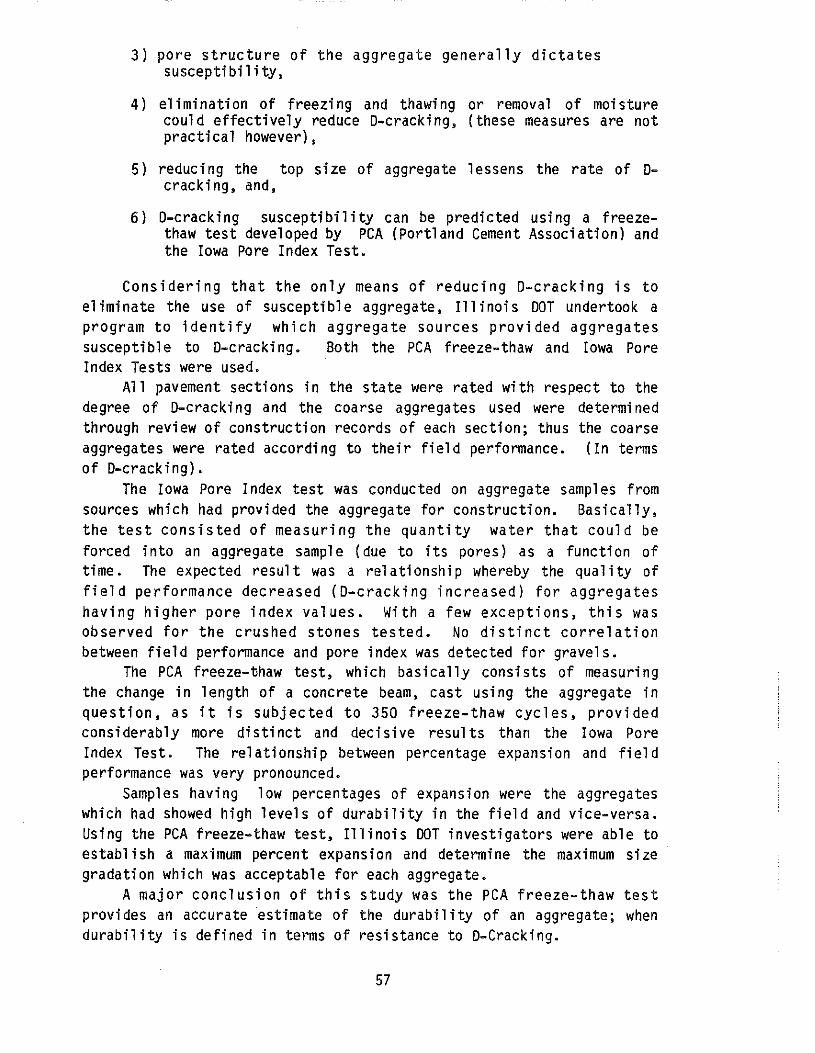
3) pore structure of the aggregate generally dictates suscepti bi 1 i ty,
4) elimination of freezing and thawing or removal of moisture could effectively reduce D-cracking, (these measures are not practical however),
5) reducing the top size of aggregate lessens the rate of acracking, and,
6) D-e racking susceptibility can be predicted using a freezethaw test developed by PCA (Portland Cement Association) and the Iowa Pore Index Test.
Considering that the only means of reducing D-cracking is to eliminate the use of susceptible aggregate, Illinois DOT undertook a program to identify which aggregate sources provided aggregates susceptible to D-cracki ng. Both the PCA freeze-thaw and Iowa Pore Index Tests were used.
All pavement sections in the state were rated with respect to the degree of D-cracking and the coarse aggregates used were determined through review of construction records of each section; thus the coarse aggregates were rated according to their field performance. (In terms of D-cracking).
The Iowa Pore Index test was conducted on aggregate samples from sources which had provided the aggregate for construction. Basically, the test consisted of measuring the quantity water that could be forced into an aggregate sample (due to its pores) as a function of time. The expected result was a relationship whereby the quality of field performance decreased (D-cracking increased) for aggregates having higher pore index values. With a few exceptions, this was observed for the crushed stones tested. No distinct correlation between field performance and pore index was detected for gravels.
The PCA freeze-t:haw test, which basically consists of measuring the change in length of a concrete beam, cast using the aggregate in question, as it is subjected to 350 freeze-thaw cycles, provided considerably more di sti net and decisive results than the Iowa Pore Index Test. The rel ati onshi p between percentage expansion and field performance was very pronounced.
Samples having 1 ow percentages of expansion were the aggregates which had showed high levels of durability in the field and vice-versa. Using the PCA freeze-thaw test, Illinois DOT investigators were able to establish a maximum percent expansion and determine the maximum size gradation which was acceptable for each aggregate.
A major conclusion of this study was the PCA freeze-thaw test provides an accurate estimate of the durability of an aggregate; when durability is defined in terms of resistance to D-Cracking.
57
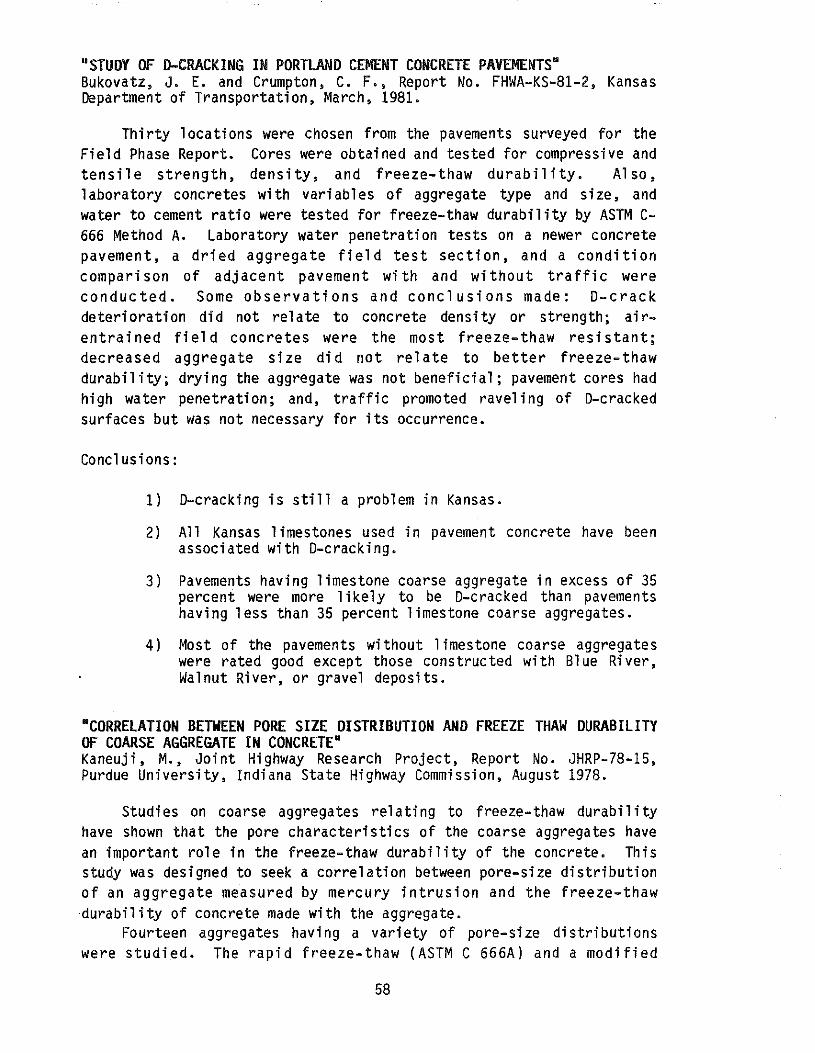
"STUDY Of D-CRACKING IN PORTLAND CEMENT CONCRETE PAVEMENTS• Bukovatz, J. E. and Crumpton, C. F., Report No. FHWA-KS-81-2, Kansas Department of Transportation, March, 1981.
Thirty locations were chosen from the pavements surveyed for the Field Phase Report. Cores were obtained and tested for compressive and tensile strength, density, and freeze-thaw durability. Also, 1 aboratory concretes with variables of aggregate type and size, and water to cement ratio were tested for freeze-thaw durability by ASTM C-666 Method A. Laboratory water penetration tests on a newer concrete pavement, a dried aggregate field test section, and a condition comparison of adjacent pavement with and without traffic were conducted. Some observations and conclusions made: D-crack deterioration did not relate to concrete density or strength; airentrained field concretes were the most freeze-thaw resistant; decreased aggregate size did not relate to better freeze-thaw durability; drying the aggregate was not beneficial; pavement cores had high water penetration; and, traffic promoted raveling of D-cracked surfaces but was not necessary for its occurrence.
Conclusions:
1) D-cracking is still a problem in Kansas.
2) All Kansas limestones used in pavement concrete have been associated with D-cracking.
3) Pavements having limestone coarse aggregate in excess of 35 percent were more 1 ikely to be D-e racked than pavements having less than 35 percent limestone coarse aggregates.
4) Most of the pavements without 1 imestone coarse aggregates were rated good except those constructed with Blue River, Walnut River, or gravel deposits.
•coRRELATION BETWEEN PORE SIZE DISTRIBUTION AND FREEZE THAW DURABILITY OF COARSE AGGREGATE IN CONCRETE" Kaneuj i, M., Joint Highway Research Project, Report No. JHRP-78-15, Purdue University, Indiana State Highway Commission, August 1978.
Studies on coarse aggregates relating to freeze-thaw durabi 1 i ty have shown that the pore characteristics of the coarse aggregates have an important role in the freeze-thaw durability of the concrete. This study was designed to seek a correlation between pore-size distribution of an aggregate measured by mercury intrusion and the freeze-thaw ·durability of concrete made with the aggregate.
Fourteen aggregates having a variety of pore-size distributions were studied. The rapid freeze-thaw (ASTM C 666A) and a modified
58
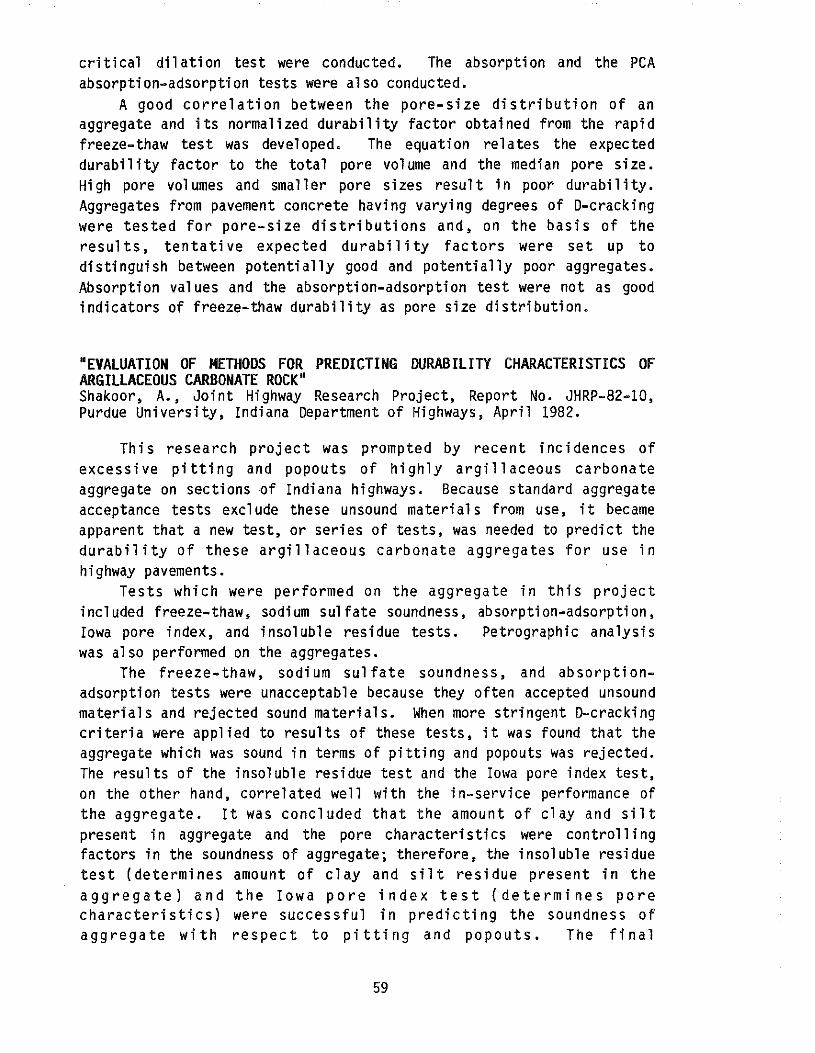
critical dilation test were conducted. The absorption and the PCA absorption-adsorption tests were also conducted.
A good correlation between the pore-size distribution of an aggregate and its normalized durability factor obtained from the rapid freeze-thaw test was developed. The equation relates the expected durability factor to the total pore volume and the median pore size. High pore volumes and smaller pore sizes result in poor durability. Aggregates from pavement concrete having varying degrees of D-cracking were tested for pore-size distributions and, on the basis of the results, tentative expected durabi 1 i ty factors were set up to di sti ngui sh between potentially good and potentially poor aggregates. Absorption values and the absorption-adsorption test were not as good indicators of freeze-thaw durability as pore size distribution.
"EVALUATION OF METHODS FOR PREDICTING DURABILITY CHARACTERISTICS OF ARGILLACEOUS CARBONATE ROCK" Shakoor, A., Joint Highway Research Project, Report No. JHRP-82-10, Purdue University, Indiana Department of Highways, April 1982.
This research project was prompted by recent incidences of excessive pitting and popouts of highly argillaceous carbonate aggregate on sections of Indiana highways. Because standard aggregate acceptance tests exclude these unsound materials from use, it became apparent that a new test, or series of tests, was needed to predict the durability of these argillaceous carbonate aggregates for use in highway pavements.
Tests which were performed on the aggregate in this project included freeze-thaw, sodium sulfate soundness, absorption-adsorption, Iowa pore index, and insoluble residue tests. Petrographic analysis was also performed on the aggregates.
The freeze-thaw, sodi urn sulfate soundness, and absorptionadsorption tests were unacceptable because they often accepted unsound materials and rejected sound materials. When more stringent D-cracking criteria were applied to results of these tests, it was found that the aggregate which was sound in terms of pitting and popouts was rejected. The results of the insoluble residue test and the Iowa pore index test, on the other hand, carrel a ted well with the in-service performance of the aggregate. It was concluded that the amount of clay and silt present in aggregate and the pore characteristics were controlling factors in the soundness of aggregate; therefore, the insoluble residue test (determines amount of clay and silt residue present in the aggregate) and the Iowa pore index test (determines pore characteristics) were successful in predicting the soundness of aggregate with respect to pitting and popouts. The final
59
recommendation resulting from this project was to institute a program of testing of argi 11 aceous carbonate aggregates using the i nsol ubl e residue test supplemented by the Iowa pore index test in questionable cases.
"IDENTIFICATION OF CONCRETE AGGREGATES EXHIBITING FROST SUSCEPTIBILITY" Larson, T. D., et.al ., NCHRP Interim Report 15, Highway Research Board, 1965.
Inadequacy of sodium (or magnesium) sulfate tests and unconfined freeze-thaw tests led to a search for better methods of predicting the freeze-thaw suscepti bi 1 ity of aggregates used in concrete. In this project, the technique investigated was length change measurement of aggregate specimens having known field freeze-thaw performance when these specimens were subjected to freezing and thawing in the 1 aboratory.
The test procedure consisted of soaking the specimens in water (at 70°F) for a period of 24-hours and making initial length determinations during this period. Following this step, the specimens were immersed in a kerosene cooling bath at 35°F and the temperature of the bath was lowered to 15°F at a rate of S°F per hour, then raised rapidly to 35°F. The lengths of the specimens were continuously monitored and recorded during cooling and reheating. The specimens were then returned to the water bath at 70°F for the final length measurement. Weights of the specimens were obtai ned immediately before and after the cooling and reheating cycle and also after oven-drying the sample. These weight determinations facilitated moisture content calculations.
In analyzing the data, an attempt was made to correlate aggregate 1 ength change with freeze-thaw destruction of concrete made with the aggregate. Using the data for all specimens, the correlation was not significant. However, data for two of the specimens were very inconsistent with data for the other specimens. When these data were neglected, the level of correlation was very significant.
The investigators concluded that a very simple test based upon aggregate length change could be developed with more work in this area.
"THE RELATIONSHIP BETWEEN AN AGGREGATES' PORE SIZE DISTRIBUTION AND ITS FREEZE-THAW DURABILITY IN CONCRETE" Kaneuji, M., et.al., Cement and Concrete Research, Vol. 10, 1980.
The aim of this study was to measure the pore structure of coarse aggregate as completely as possible and to examine a sufficiently large number of different aggregates so that a correlation between pore structure and expected D-cracking resistance could be formula ted.. The
60
technique of mercury instrusion porosimetry was used to determine the pore structure of the aggregates because it offers the prospect of measuring both pore volume and size of pores over the widest possib 1 e range. The porosimeter that was used was an Ami nco Mode 1 J5-7125D which could measure pores having diameters ranging from about 500 micro-meters to about 2.5 nano meters.
Freeze-thaw tests were conducted in accordance with ASTM C-666, Procedure A; i.e., both freezing and thawing in water. On approximately 5-cycle intervals, they were removed for resonant frequency measurements conducted in accordance with ASTM C-215. The durability factor of each type aggregate was calculated in accordance with procedures designated in ASTM C-666.
The durability data and the pore size distributions of the aggregates show some obvious qualitative carrel ati ons. For aggregates having more or 1 ess the same total pore volume, those having sma 11 er pore sizes have lower durabil ities. Total pore volume also affects durabi 1 i ty of an aggregate. Aggregates having more or 1 ess the same predominate pore sizes, become less durable as total pore volume increases. The sample suite provided many other comparisons similar to the two cited and, in every case, the same trends were observed, namely the durability of an aggregate is associated with both the predominant size and the total volume of its pores.
The qualitative influences of pore structure upon durability were developed into a quantitative correlation by multiple regression analysis. The two numerical parameters that were extracted from each distribution were the· median pore diameter and the total intruded pore volume. The equation developed was determined to be the best for predicting the durability factors obtained from the freeze-thaw test.
The data provide for calculation of an expected durability factor of an aggregate when its median pore size and total pore volume are known. If the minimum EDF that would provide acceptable field performance were known, the aggregates caul d be tested to identify potentially non-durable aggregates. The use of the EDF criterion provides a different, and perhaps better, way for selecting aggregates than the absorption criterion.
Conclusions:
1) A correlation exists between the pore size distribution of a coarse aggregate and its durability toward freezing damage in concrete, and
2) The expected Durability Factor, EDF, calculated from the pore size distribution curve, may be used to distinguish between aggregates that are durable or non-durable with respect to D-cracking in concrete pavements.
61
•THE RELATIONSHIP OF AGGREGATE DURABILITY TO TRACE ELEMENT CONTENTo Dubberke, W. and Marks, V. J., Interim Report HR-266, Iowa Highway Research Board, January 1984.
This report is a brief overview of recent Iowa Department of Transportation research in the area of durability of Portland Cement Concrete (PCC) Pavements.
a) Pore Size Distribution and the Iowa Pore Index Text
This research has shown that with some exceptions, most nondurable aggregates analyzed exhibit a predominance of pore sizes in the 0.04-to 0.2-micron diameter range.
b) Aggregate X-Ray Analysis Systems
The X-Ray fluorescence system has been utilized to evaluate the elemental composition of various aggregates. X-Ray diffraction techniques were used to determine the compound compositions of the aggregates. A scanning electron microscope has been used to observe the pore-sizes and crystal sizes of the aggregates in addition to elemental chemical identification and analysis.
c) The Chemical Effects on Concrete Durability
Much of Iowa's current research stems from the fact that some aggregates have inconsistent service records. The same aggregate placed on primary and secondary roads deteriorates differently. Major differences in the winter maintenance practices of secondary and primary roads may be the reason for the difference in performance.
Current Iowa DOT Research
a) Identification of Detrimental Chemical Elements
Magnesium, iron, and sulfur may contribute a detrimental effect to durability and may be a factor in the accelerated deterioration on salted primary roads. Initial findings indicate that pyrite or marcasite, both iron-sulfur compounds, may contribute to accelerated deterioration of salted primary roads.
b) Salt Treatment Preparation Prior to Freeze and Thaw Testing
A salt treatment preparation was developed in an effort to duplicate the observed accelerated deterioration on primary roads as opposed to secondary roads. The salt treatment of the coarse aggregate was developed to be used prior to addition of the coarse aggregate to the concrete mixture. The ASTM C 666 Method B, "Freezing in Air -- Thawing in Water" testing of concrete mixtures with and without sodium chloride coarse aggregate pretreatment prior to being incorporated into the concrete has correlated very well with field performance. With
62
limited experience, Iowa DOT geologists have developed some confidence in predicting which aggregates will be adversely affected by salt treatment. Aggregates having a finely dispersed system of an iron-sulfur compound and sufficient porosity to allow the movement of brine are adversely affected. This has been the criterion for Iowa geologist predictions.
c} Concrete Mixture Ingredients Affecting Salt Treatment Durabi 1 i ty
After verifying that the salt treatment preparation did cause the ASTM C 666 durabilities to correspond to field performance, it was decided to conduct research to determine if various ingredients would either adversely or beneficially affect the durability factor. Three different ingredients, use of Type V Portland Cement rather than Type I, fine 1 i me stone with 1 ow magnesium content, and dolomitic fines were used. Type V cement exhibited a significant beneficial effect on the concrete durabi 1 i ty· after sa 1 t treatment preparation. The addition of 5% limestone fines yielded a greater beneficial effect than did the Type V cement. The addition of 5% of dolomitic fines yielded an adverse effect on the salt treated durability beams. It would appear that magnes i urn is an element that aggravated the adverse effect in the freeze-thaw durability of concrete mixtures containing porous, pyritic carbonate coarse aggregate.
"A REVIEW OF AGGREGATE RESEARCH IN NEW ZEALAND" Bartley, F. G., Road Research Bulletin No. 50, New Zealand National Roads Board, 1980.
The main characteristics of an aggregate which affect its performance are:
A. Rock type B. Particle size distribution C. Confinement within the metal course D. Moisture sensitivity E. Resistance to weathering
A. Rock type-- every rock type has a different hardness, texture, and compressive strength. These factors influence the grading and frictional characteristics of the aggregate mass.
B. Particle size distribution -- it is essential that the distribution be uniform in order that the maximum particle surface area is in contact and the space between particles is kept to a minimum. On the other hand, the aggregate should have an adequate permeability to ensure drainage. If the grading of the aggregate complies with the formula:
63
where;
P = ( d/D) n
P = percent passing sieve size d D = maximum particle size
and where n = 0.45 to 0.50, the two criteria appear to be satisfied.
Research shows that aggregates having large (40 mm) maximum size particles are more rigid than those having small (20 mm) maximum size particles.
C. Confinement within the metal course -- a metal course distributes an applied load by mobilizing shear resistance within its mass. As a load is applied to a metal course, the constituent particles will tend to move away from the loaded area. This movement will be resisted by adjacent particles and a force tending to confine the 1 oaded aggregate will be generated. If the confining pressure is not sufficient to adequately support the load, the aggregate particles will continue to move until the load is removed. Such movements will be so large that the aggregate will dilate.
D. Moisture sensi ti vi ty -- up to a 1 evel of about 60% saturation there was little effect on the rigidity of a sample under repetitive triaxial loading; but above 80%, the rate of accumulation of permanent deformation increased.
E. Resistance to weathering -- studies have demonstrated that some aggregates may weather under an environment similar to that of a pavement. Under such conditions, some aggregates could release highly plastic minerals. Aggregates should be evaluated on the basis of the likely products of weathering and those which could release unsatisfactory minerals should be either treated to alleviate the effect of plasticity or should be used in the low-stress situation possibly as in a subbase.
"LITERATURE REVIEW: CRUSHED ROCK AND AGGREGATE FOR ROAD CONSTRUCTION• Wylde, L. J., Research Report No. 43, Australian Research Board, January 1976.
Findings of a literature search conducted in support of a research project addressing mineralogical factors in the durability of basalts are presented. One portion of the review dealt with currently used standard testing procedures and the emphasis was placed on the correlation between test results and in-service performance.
The absolute significance of the results of standard test methods was not apparent. There was apparently a consensus that the results of
54
a range of test methods should be interpreted in 1 i eu of experience with the rock in service. The literature supports the view that rock properties and performance as a construction material depend on the mineralogy, petrographic texture, and the geological history of the rock. Clay minerals appeared to be of particular significance.
"THE INFLUENCE OF ENVIRONMENT AND MATERIALS ON D-CRACKING" Klieger, P., Stark, D., and Teske, w., Construction Technology Laboratories, Portland Cement Association, October lg78.
A three-phased program was undertaken to determine the effectiveness of reduced aggregate particle sizes in mi nimi zing Dcracking in field exposures, to determine the importance of source of fine aggregate and quantity of maximum permissible aggregate particle size on freeze thaw durability, and to evaluate the relative importance of certain field environmental conditions on D-cracking. The objectives were approached through 1 aboratory freeze-thaw testing of concretes, resurveys of existing pavements in Ohio, and the construction and monitoring of a test road near Vermillion.
Field surveys indicated that reducing maximum aggregate particle sizes was beneficial, while the laboratory tests indicated that the proportion of coarser aggregate had a significant effect on durability; The 1 aboratory test also showed that the source of fine aggregate had essentially no bearing on durability, even when the fine aggregate was derived from coarse aggregates having known 1 ow durability. Outdoor test plot studies and moisture determinations on existing pavement concrete revealed the overriding importance of aggregate pore structure on concrete durability.
No data were included concerning the test road and the development of D-cracking as the road was only 3-4 years old and D-cracking had not developed.
Freeze-thaw testing of concrete containing coarse aggregates revealed that expansions were directly related to the maximum particle size of the coarse aggregate and the quantity present of the coarser sizes containing the maximum size.
Slow freeze-thaw cycling, at a rate of two cycles per day, was the more severe test procedure, cycle for cycle, than rapid cycling at the rate of seven cycles per day. Apparently, it was due to the higher degrees of saturation reached by the concrete during slow cycling.
Laboratory freeze-thaw testing of concrete prisms provided an indication of the relative durability of the various concretes in the road.
65
0 DURABIUTY Of CONCRETE AND THE IOWA PORE INDEX TEST" Marks, v. J. and Dubberke, W., Transportation Research Record No. 853, Transportation Research Board, 1982.
The objective of the report was to provide an overview of the PCC D-cracking problem and evaluate the Pore Index test which was used to determine the quality of coarse aggregate for concrete.
The Iowa Pore Index test was developed to evaluate the durability of coarse aggregates. The test measures the amount of water that may be injected into oven-dried aggregate. The test was very effective in identifying aggregates having a substantial pore system of the 0.04-to 2-micron diameter size and correlated well with service records.
Iowa studies of other tests, including the sodium sulphate, magnesium sulphate, absorption-adsorption and freeze-thaw of aggregates, resulted in poor correlation with aggregate service records. A modified ASTM C-666 Method B procedure correlated well but took nearly five months to evaluate an aggregate.
•INfLUENCE Of CEMENT ON MOISTURE MIGRATION IN PASTE AND CONCRETE AS RELATED TO THE DURABILITY Of CONCRETE" Lankard, D. R., et.al, FHWA-RD-74-54, Battelle Columbus Laboratories, June 1974.
This report summarizes an investigation of the influence of cement on moisture migration in cement paste and simulated concrete as related to the prob 1 em of D-cracki ng of portland cement concrete pavements. The conclusions of the research are as follows:
1) Cement source had a statistically significant influence on the moisture migration properties (rate of moisture change and total moisture change) and on linear dimensional change of cement pastes subjected to three different absorptiondesorption conditions.
2) Cement source had a statistically significant influence on the moisture migration properties (rate of moisture change and total moisture change) and on linear dimensional change of simulated concretes subjected to three different adsorption-desorption conditions. The influence of cement source on these properties was not as marked for the concretes as it was for the cement pastes.
3) The correlation between the moisture migration properties and the related dimensional change behavior of cement pastes and those of concretes prepared with the same cements was not statistically significant.
4) Cement source did not significantly influence the time of onset of dilation during freezing of concretes prepared with 1 imestone from the two D-crack-prone sources. The
66
significance of this finding is that for a given set of environmental conditions, cement source will not significantly affect the time at which potentially disruptive forces become operative in the concrete. The actual rate at which subsequent structural damage occurs in the concrete wi 11 depend on the number of freeze-thaw cycles and on the magnitude of the dilation.
5) Cement source had a statistically significant influence on the magnitude of dilation during freezing of concretes prepared with limestone from the two D-crack-prone sources. But the differences in dilation values were not due to cement-controlled differences in the saturation coefficient of the aggregate at the time freezing took place.
"DURABILITY OF AGGREGATES" Wylde, L. J., Research Report No. 98, Australian Road Research Board, 1980.
r~any standard specifications contain a general requirement, e.g., that aggregates shall be crushed from hard durable rock, together with specific requirements relating to particle size distribution, pore index, particle shape, and mechanical properties such as strength or abrasion resistance. These specific requirements are usually expressed in terms of empirical test methods and limiting values of test results. The durability of aggregates is often assessed t>y interpreting these test results on the basis of experience or opinion.
Test methods were grouped into three main groups: dry abrasion/strength tests, wet abrasion/strength tests, and other tests. The main question concerns which tests are required to predict or assess durability and what si gni fi cance do they have regarding durabi 1 i ty?
The tests normally used to assess aggregates are usually performed close to the time of delivery and their relevance to durability are not obvious in many cases. Although aggregates for different end uses are exposed to different service conditions, the same test methods are employed to assess them and the limiting values of test results are similar or even identical in many cases.
•EFFECT OF DEICING AGENTS AND SULPHATE SOLUTIONS ON CONCRETE AGGREGATES" Gillott, J. E., Q. J. Eng. Geol. Vol. 11, 1978.
The following conclusions were offered:
1. Some 1 imestones show dimensional change during continuous soaking in salt solutions at constant temperature;
67
2. Studies with the scanning electron microscope showed that the surfaces of limestones scaled and disintegrated after successive treatments in salt solutions;
3. The progress of the reactions was most often controlled by cleavages and grain boundaries and the morphological results depended on the angle between the plane of weakness and the surface;
4. Both calcite and dolomite showed changes in morphology but calcite was more rapidly attacked than dolomite, particularly by solutions of MgS04; and,
5. Use of aggregate containing little carbonate may reduce the susceptibility of concrete to durability failure under attack by sulphate or chloride solutions.
"AN INTRODUCTION TO THE INFLUENCE OF NATURAL AGGREGATES ON THE PERFORMANCE AND DURABILITY OF CONCRETE" Fookes, P. G., Q. J, Eng. Geol. London, Vol. 13, 1980.
Concrete was the first bui 1 ding and construction materia 1 used. It is thought of as a man made rock. The absolute volume of cement is usually between 6-18% and the water from 14 to 22%. Aggregate makes up 60 to 80% of the concrete.
Tensile cracking presents one of the biggest detriments in concrete construction. Chemical reactions also cause problems with disintegrating concrete. There are two types of cracks. Progressive cracks enlarge due to a chemical or physical reaction. Non-progressive cracks remain the same size, once formed.
Concrete has a high extensi bi 1 i ty rate because it can deform yet remain uncracked. An elastic stress will develop if the concrete is restrained. Creep of the concrete relieves this stress.
The water content in cement is directly related with the shrinkage rate. Therefore, to reduce cracking the water content must be reduced.
Concrete expands as its temperature rises and contracts as its temperature falls. Thermal expansion and contraction of concrete are greatly influenced by the aggregate type.
Grading is the most important characteristic of the aggregate. The cement paste requirement is proportional to the void content within the concrete and should be minimized. Grading is determined by sieving.
Particle shape and surface texture of the aggregate have a greater effect on the properties of fresh, wet concrete than hardened concrete. Shape depends upon the nature of the material and the processing. Texture depends predominantly on the characteristics of the material.
When an aggregate is used in abrasive situations, its resistance should be known. Factors involved are hardness, brittleness, and the
68
constituent minerals of the aggregate particle, the minerals cleavage and strength of intergranular bond.
The strength of concrete is influenced by the aggregate and is the same regardless if testing is performed in tension or compression. The modulus of elasticity of aggregate affects the magnitude of creep and shrinkage that may be experienced by the concrete.
Soundness is the ability of aggregate to resist change in volume resulting from change in physi ca 1 conditions. The genera 1 test for unsoundness of aggregate is described by the American test ASTM C-88, Soundness of Aggregates by Use of Sodium Sulfate or r~agnesi um Sulfate.
Freeze-thaw resistance of an aggregate is related to its porosity, absorption, and pore structure. Predictions of performance may be based upon two things: past performance and freeze-thaw tests of concrete specimens.
A test to evaluate the effects of salt weathering is the sodium or magnesium sulfate soundness test. This test is more re 1 i ab 1 e than the freeze-thaw test method.
The most common form of chemical reactivity is the alkaliaggregate reactivity. A chemical reaction with the alkalis in seawater or cement may cause abnorma 1 expansion 1 eadi ng to concrete breakup disruption.
Coal, clay, silt, salts, mica, and other minerals are harmful substances in aggregates. Organic impurities may delay hardening of concrete. Clay and silt weaken bond between the cement paste and aggregate particles. Salts alter the hydration characteristics of the cement. The cube strength of concrete is reduced in the presence of some micas.
Weathering of rock is divided into two processes: 1) mechanical breakdown, not involving the minerals, is called physical disintegration, and 2) chemical rotting, involving the minerals, is called chemical decomposition. Grade classification for weathering is divided into six parts from fresh to residual soil. Weathering intensity and climates are directly related.
Concrete is a versatile material and performs well under most circumstances. Poor performance is directly related to the aggregate quality. Testing of the aggregate helps to determine the most suitable one to use.
"PROPERTIES OF CONCRETE• Neville, A. M., Pitman Publishing Inc., 1982.
Certain aggregates are known to be susceptible to frost damage. These are porous cherts, shales, some limestones, particularly laminated limestones, and some sandstones. A common characteristic of
69
these rocks having a poor service records is their high absorption. However, it should be emphasized that many durab 1 e rocks also ex hi bit high absorption.
For frost damage to occur, critical conditions of water content and lack of drainage must exist. These conditions are controlled by size, shape and continuity of pores in the aggregate. In most aggregates, pores of various sizes are present. The distribution of pore sizes should be considered. Characteristics of the pores control the rate and amount of absorption and the rate at which water may escape. They are more important than their total volume as reflected by the magnitude of the aggregates absorption.
A test for soundness of aggregate is prescribed by ASTM Standard C 88-76. Mr. ~Jeville indicates the test is qualitative for predicting the behavior of aggregates under actual site conditions. "Specifically, there is no clear reason why soundness as tested by ASTM Standard C 88-76 should be related to performance in concrete subjected to freezing and thawing." Furthermore, "there are no tests which could satisfactorily predict the durabi 1 ity of aggregate in concrete under conditions of freezing and thawing."
•AGGREGATE ABSORPTION FACTOR AS AN INDICATOR OF THE FREEZE-THAW DURABILITY OF STRUCTURAL LIGHTWEIGHT CONCRETE" Ledbetter, W. B., and Buth, E., Report 81-3, Texas Transportation Institute, Texas A&M University; February 1967.
The purpose of the investigation was to correlate freeze-thaw research results at the Texas Transportation Institute with ASTM Standard freeze-thaw results and to develop preliminary durability acceptance criteria for concrete using synthetic aggregates based on freeze-thaw tests.
A coarse aggregate absorption factor (AAF) is defined as the change in percent absorption of the coarse aggregate ~etween 100 minutes and 1,000 minutes of elapsed immersion time, based on dry weight. This interval represents the time interval during the hardening of concrete when water is still available for absorption.
Two concrete freeze-thaw tests were used in the i nvesti ga ti on. The first test was an in-house test designated the Texas Transportation Institute (TTI) freeze-thaw test. The second test employed was the standard ASTM test for rapid freezing and thawing of concrete in water (ASTM Designation C 290-63T).
Analyzing the data defined a clear trend. The higher the aggregate absorption factor (AAF), the greater the percent loss after freeze-thaw cycling. The authors formed the hypothesis that the AAF is a good indicator of the potential durability of aggregates to the disruptive action of freezing and thawing while in the presence of
70
water. Both tests indicated that when the AAF of lightweight aggregates is greater than about 2.5, the resulting concretes are not durable.
•ooRABILITY TESTING OF STABILIZED MATERIALS" Thompson, M. R., and Dempsey, B. J., Illinois Department of Transportation, June 1974.
The purpose of this project was to develop a satisfactory and realistic procedure for evaluating the freeze-thaw durability of partially cemented highway materials (soil-cement, lime-fly ashaggregate, lime-soil mixtures, etc.). The information, concepts, and procedures de vel oped during this study form a comprehensive and realistic technical base for considering freeze-thaw durability and related problems in a rational manner.
Data, concepts, and information from this study have been used to:
1) develop a realistic and accurate heat-transfer model,
2) develop procedures for quantifying the field freeze-thaw environment,
3) generate typical freeze-thaw data representative of various Illinois locations
4). develop automatic freeze-thaw testing equipment for simulating field temperature conditions,
5) establish a standard freeze-thaw cycle for Illinois climate conditions,
6) evaluate the freeze-thaw durability of typical Illinois stabilized materials,
7) develop procedures for predicting freeze-thaw strength,
8) establish tentative procedures and criteria for evaluating freeze-thaw durability, and
9) suggest an approach for applying the study findings in practice.
"PREDICTING MOISTURE-INDUCED DAMAGE TO ASPHALTIC CONCRETE" Lottman, R. P., NCHRP Report No. 192, Transportation Research Board, 1978.
The main intent of this project was to devise a predictive, practical moisture-damage test system for asphaltic concrete. Many attempts have been made previously to develop tests that may be of aid
71
in identifying asphaltic concrete mixtures susceptible to moisture damage. Some have achieved success in local areas but none have received widespread acceptance.
This study made a strong attempt to reproduce in laboratory specimens the same conditions that are experienced by mixtures exposed to moisture in the field and it appears to have been reasonably successful. The split tensile strength test was adopted as the principal measure of mixture response to moisture exposure. Test procedures are neither complex nor excessively time consuming, and may be conducted with equipment, presently available in most highway materials laboratories.
"UPGRADING OF LOW QUALITY AGGREGATES FOR PCC AND BITUMINOUS PAVEMENTS" Cady, P. D., Blankenhorn, P. R., Kline, D. E. and Anderson, D. A., NCHRP Report No. 207, Transportation Research Board, July 1979.
The objective of this study was to advance methods of upgrading coarse aggregates for use in bituminous and PCC pavement mixtures. The upgrading procedures studied were impregnation, coating, and chemica 1 treatment. The benefi cation addressed recognized problems such as freeze-thaw damage, stripping, degradation, alkali-aggregate reactions, and D-cracki ng.
The following generalized conclusions were drawn from results of the study:
1) freeze-thaw sensitive aggregates may be rendered innocuous by impregnation or coating, using a variety of treatment materials;
2) aggregates susceptible to D-cracking problems may be successfully upgraded with certain polymeric impregnates;
3) expansion of concrete due to alkali-carbonate reactivity can__be significantly reduced by means of admixtures that provide suitable interfering cations, in solution;
4) aggregate coating treatments appear to reduce susceptibility to alkali-silica reaction; and
5) several treatment materials appear to have detrimental effects upon the mechani ca 1 properties of portland cement concrete mixtures. However, this may be remedied by taking appropriate corrective action in mixture design procedures.
72
"FREEZE AND THAW OF CONCRETES AND AGGREGATES" Havens, J. H. and Deen, R. C., Research Report No. 454, Division of Research, Kentucky Department of Transportation, June 1976.
The endurance of concrete generally depends upon the severity of exposure .as well as characteristics of the concrete. Aggregates which are highly absorptive have generally performed poorly. On the other hand, some aggregates which are not highly absorptive have performed poorly also. The authors attributed those failures to mechanisms other than freeze-thaw. Voids which are easily saturated affect durability unfavorably while those which are 1 ess permeab 1 e are highly favorab 1 e to durability. Concrete which has been allowed to dry following curing and prior to the onset of freezing performed quite well. The drying process evidently helps render some pores impermeable.
To observe the freeze-thaw resistance of aggregates, the authors devised a test whereby the relationships between effects of freezing and thawing and the physi ca 1 properties of porosity, absorption, and bulk specific gravity could be evaluated. A freezing medium was sought where each aggregate could be frozen quickly. Chilled mercury was chosen - it has high thermal conductivity, it is immiscible with water, and it has a low freezing point. From preliminary testing, it was determined that if a particle did not show visual distress at the end of four cycles, it would withstand innumerable cycles.
Absorption values for each particle were determined after freezethaw testing. Porosity (n) calculations were made using the following relationship:
n = 100Gssd x w/(100+w)
where w = absorption, expressed as a percent, and Gssd = bulk specific gravity (saturated surface dry). It should be noted that the equation applies only for saturated aggregates.
As expected, particles in the higher porosity range were less durable than particles in the lower range. All particles having a porosity of more than 11 percent fractured during the freeze-thaw test and, less than 25 percent of the particles having a porosity of less than two percent fractured. All particles having absorptions of four percent or greater failed when subjected to freezing and thawing. Very few specimens having absorptions of less than one percent failed. Aggregates in the lower specific gravity ranges have lower resistance to freezing and thawing than aggregates in the higher specific gravity ranges. The level that was classed as critical was 2.40.
73
It was suggested that the sodi urn sulfate soundness test could be supplanted altogether by specific gravity and absorption or porosity tests. Porosity (volumes of absorbed water) is a purer parameter than absorption (percent by weight).
"LABORATORY FREEZE-THAW TESTS VERSUS OUTDOOR EXPOSURE TESTS" E. 0. Axon, L. T. Murray and R. M. Rucker, Highway Research Record Number 268, 1969.
Over a period of twenty years, PCC Beams were tested and compared in two basic ways. The two methods are Laboratory Freeze-Thaw testing, and Outdoor Exposure testing. Two questions are asked at the onset of this experiment. The first is, ''Is the indicated improvements in durability realistic in terms of field exposure in pavements?" The second question is, "What are the comparisons of the Freeze-Thaw Test verses Outdoor Exposure based on air-entrainment and the degree of saturation of coarse aggregate?"
Thirteen different coarse aggregates were used in the test. All thirteen were used in a partially saturated condition. In addition, four of the thirteen were also used in a saturated state. A beam of all thirteen aggregates was made with and without air-entrainment. The materials used for both the Freeze-Thaw test and the Exposure test were from the same sources. Sufficient quantity of cement and fine aggregate was blended into the mix. The slump factor, cement factor, and absolute volume of coarse aggregate was kept nearly constant as possible. The air content of the air-entrained mixes appear low by today's standards, but was approximated at three percent.
All of the beams for the Outdoor Exposure _test were cured by the following methods:
1. Some were kept in a moist room for seven days and then in water until the 35th day. They were then broken in flexure.
2. Others were kept in the moist room for the first seven days and then placed in wooden forms in the outdoor exposure pits. The beams were situated in the wooden forms where they would be exposed to the weather on the surface. The bottom of the beam was in contact with wet sand. The sand in the test pit remained saturated by occasionally adding water.
The accelerated 1 aboratory freezing and thawing test was simi 1 ar to ASTM Specification C 310-61 T. There was, however, some differences. Under the "Missouri" procedure, specimens were frozen by placing in the air of a cold room (0°F for 10 hours). In return, thawed in water (at 40°F for 2 hours).
74
Results from Freeze-Thaw test indicate that air-entrainment increased the frost resistance of the concrete. The amount of increases varies from slight to very. The data also indicated that frost resistance of the concrete was increased by reducing the degree of saturation of the coarse aggregate.
Prisms from the Outdoor Exposure test were tested by dynamic modulus. All of the concretes containing coarse aggregate showed a greater loss in dynamic modulus than the companion concretes containing partially saturated coarse aggregate. Although the dynamic modulus of the concrete tended to increase for several years, the dynamic modulus of 24 of the 34 concretes tested was 1 ess than the 35 day va 1 ue after 20 winters of exposure. Of the ten concretes having a dynamic modulus greater than or equal to the 35 day value, all were made with partially saturated coarse aggregate. The effect of air-entrainment varied from definitely detrimental to slightly beneficial. With none of the concretes was there an indication that air-entrainment had improved the resistance of the concrete to this type of exposure. Remember, no deicers were used.
In interpreting these results, the worst condition of exposure was designed to be representative of the climate.
Comparing the results, from the standpoint of durability, the 1 aboratory test show that air-entrainment is always beneficia 1. In contrast, the results of the benefit or malignant results. detrimental.
outdoor exposure test show no absolute In fact, they varied from beneficial to
It is here that considerable doubt is raised concerning the use of air-entrainment in concretes subject to frost action. These results would indicate that air-entrained concrete is not desirable in certain places.
The results of the laboratory Freeze-Thaw test showed that the use of partially saturated coarse aggregate improved the frost resistance of the concrete, and greater resistance was obtained with air-entrained concrete. The Outdoor test agreed with the 1 aboratory test when it concerned resistance and partially saturated aggregate.
The important points to be drawn for conclusion are:
1} Use of air-entrainment did not si gni fi cantly improve the resistance of any of the concretes subjected to outdoor freezing and thawing in the absence of de-icers; it did, however, significantly decrease the frost resistance of concretes containing coarse aggregates of low resistance to freezing and thawing.
2} Although the frost resistance of concretes prepared with partially saturated coarse aggregates is generally greater than those in which saturated aggregates were used, the amount of improvement appears to vary with some unknown property {probably pore structure} of the coarse aggregate.
75
"IDENTIFICATION OF FROST-SUSCEPTIBLE PARTICLES IN CONCRETE AGGREGATES" T. D. Larson and P. D. Cady, National Cooperative Highway Research Program Report #66, 1969.
The authors state that a trained petrographer is essential in studies of this nature due to the small percentage of deleterious particles in a frost susceptible aggregate.
The slow coo 1 i ng method is recommended as the best approach to test for frost susceptibility in aggregates. This test can be varied in such a way as to best approximate the actual field conditions. While an earlier problem with this method was defining the end of the period of frost immunity, it has now been determined as the point at which the dilation of the concrete equals the elastic strain limit of the concrete in tension. Drawbacks to this experiment is that it is time consuming and expensive in terms of equipment and labor, but it is the only test now available to test aggregate under field conditions.
The authors mention two rapid test methods. One method is the percentage vo 1 umetri c expansion of aggregate particles in combination with permeability. It is described as the best rapid indicator of frost suscepti bi 1 i ty. The volume percent expansion multiplied by 1 og 10 (permeability coefficient times 106) is the indicating variable with values from 0- .75 indicating durable aggregates, .75- 2.00 indicates low-to-moderate frost susceptibility, and values above 2.00 are high susceptible aggregates. It is stressed, however, that no rapid method can predict actual field behavior.
The second method, vacuum saturated absorption, is described as "an excellent indicator of highly durable and highly frost sensitive aggregates." Aggregates with absorption values below 1% are invariably durable while those with values above 5% offer poor frost resistance.
No procedure was recommended over the others as the objectives of the testing agency will differ. Instead, the method, or combination of methods that best provides the required information should be used.
•KANSAS CONCRETE PAVEMENT PERFORMANCE AS RELATED TO D-CRACKING" J. E. Bukkovatz, C. F. Crumpton, H. E. Worley, Transportation Research Record 525, 1974.
An investigation of D-line or D-cracking of Kansas concrete included surveying 1,170 miles over 27 years. It was found that there was a true relationship between the cracking and coarse aggregate and changes were made to reduce the size being used.
Another survey by the Kansas State Highway Commission and Portland Cement Association studied 1,165 in-service bare concrete pavement constructed between 1921 and 1949 and 248 miles of covered concrete pavement constructed between 1919 and 1937. It was found that older
76
pavements had poorer rating than new, except for those with low cement factors (1.25 bbl /cubic yard3). From 1951 to 1952 the studies showed that Ervine Creek, Plattsmouth, and Stoner 1 imestones were unsatisfactory for good pavement performance.
Around 1962 it was found that there was a 1 ot of stain patterns around joints or at uncontrolled cracks, which often developed into Dcracki ng. In 1964 a study was done to determine extent of damage, reason of occurrence and most effective repair.
Procedure
The procedure included a walking examination of 1,200 miles of base concrete pavements. Cores were taken at random deterioration sites, with a core taken from the best and worst part of the deteriorated areas.
Results
Comparing surveys (1964-1965, 1951-1952):
a. Nine percent increase in good pavement, but still 18% of pavement rated poor.
b. Early signs of D-cracking for the period between the two surveys can be linked to salts applied to remove ice.
c. When more than 35% of Kansas limestone is used in concrete it has about as great of chance of being poor as being good.
d. When less than 35% Kansas Limestone is used the concrete is usually good.
e. All Kansas 1 imestones have been found to produce Dcracking, with the worst being; Argentine, Bethany Falls, Ervine Creek, Plattsmount, stoner, and Winterset.
f. Most pavements made without limestone is in the good category.
Other Observations
Cores taken were found to still have the subgrade paper attached, with the side close to the subgrade having a clay slickenside which indicated the slab moved as a unit on the clay subgrade. This could be cause for a decrease in tensile strength (reducing cracking).
It should not be overlooked that most of the D-cracki ng occurred at joints where water is most likely concentrated. The water can
77
either help form calcium carbonate hexodrate, apparent in D-cracking, or, carry salts into the concrete.
Changes Made
1. Subgrade - Lime treatment required.
2. Methods - Vibrators required, slip-form pavers encouraged.
3. Materials - Type II cement required, for most cases the percent 1 imestone must be bel ow 30% and coarse aggregate size less than 0.5 inch.
4. Joints- Preformed neoprene transverse joint sealers required.
"SOUNDNESS AND DELETERIOUS SUBSTANCES" Dol ar-Mantouni , L., Si gni fi cance of Tests and Properties of Concrete and Concrete-Making Materials, ASTM Special Technical Publication 1698, 1978.
This abstract summarizes the insights of the sodi urn sulfate and magnesium sulfate tests. It considers the interpretation of the results from the tests and correlates the two tests to the results obtai ned from other soundness tests. The other tests for soundness include: absorption, freeze-thaw, copper nitrate and petrography. Most of the paper spends its time looking at the sodium sulfate and freeze-thaw tests. These tests are designed to predict the overall performance of an aggregate in concrete.
The second part of this paper covers various tests that determine the presence of specific harmful substances of particles which effect the performance of the concrete in any way. In addition, the paper identifies the various deleterious materials.
It is desirable to try and obtain a criteria for the acceptance of an aggregate. A method of conveniently determining useful data and obtaining a meaningful relationship between test results and the quality of the concrete made from the aggregates is desired. The most frequently used method for measuring overall aggregate quality is ASTM C88. The sulfate test and its procedure are summarized by DolarMantouni.
Explanations and interpretations vary among authors by which the sulfate test disrupts the aggregate. There is evidence that destructive forces other than pressure caused by crystal growth must be involved. Some of these forces are; the number of cycles, the use of distilled water instead of sulfate solution, and the amount of water absorbed by carbonate rocks. These results indicate that wetting and drying are also destructive forces in the sulfate test. Finally, the
78
severity of the test increases when the drying time is extended beyond that needed to dehydrate the crystals.
The author states that various authors have mentioned that there is little or no experimental support to assume that the sulfate test simulates exposure to freeze-thaw of concrete or supports field performance s imul ati on. Dol ar-Mantouni further quotes other authors about deleting the sulfate and magnesium test as soon as a replacement is available. However, Dolar-f4antouni believes that the test does indicate weaknesses in aggregates. Much emphasis is also placed on variations of the test; the reproducibility.
The absorption test is suggested to give better corre 1 ati on with the resistance of concrete to laboratory freezing and thawing than the sulfate test. However, Dolar-Mantouni makes no more comments about this other than a footnote. The laboratory freeze thaw test is considered logical but is not confined. Therefore, it does not fully correlate the field performance. Confined freeze-thaw tests on aggregates in the confined state in concrete is the most satisfactory method for predicting the field performance of aggregates as stated by the author but then refers the reader to other publications discussed elsewhere. A copper nitrate test was used to obtain data on argi 11 aceous 1 imestones and sha 1 es. The damage done to the aggregate is similar to that of the sodium sulfate test.
Deleterious substances are classified by the author in four groups: clay and silt; clay lumps; friable, soft and lightweight; and finally organic impurities. Clay and silt is the material passing a no. 200 sieve. Clay lumps are lumps that remain cohesive. Friable and soft particles have poor bonds between grains while lightweight pieces are highly porous. Organic impurities consist of coal, lignite, plant roots, twigs, and other vegetable matter.
The deleterious substances are harmful to the concrete. A large amount of fines (No. 200} in an aggregate increase water requirements which result in excessive drying, shrinkage, and lower strength of the concrete. Clay minerals cause swelling. Clay lumps can cause excessive wearing with surface pits and popouts. Friable and soft particles break down easily causing concrete deterioration and reduced strength. Organic impurities effect the concrete in many of the ways already stated by the other impurities including retardance of hardening. The author has a list of various tests to determine the deleterious substances.
These tests, especially the sulfate test, seem to be acceptable by the majority. Suggestions have been made to replace the tests but, until a suitable replacement is found, they will still be used.
79
•poRE STRUCTURE" Verbeck, G., Significance of Tests and Properties of Concrete and Concrete - Making Materials, ASTM Special Technical Publication 1698, 1978.
Important properties of hardened concrete are related to the quantity and the characteristics of the various types of pores in the concrete. Engineering properties are influenced by the amounts, sizes, and different types of pores. These properties are strength, durability, creep, shrinkage, and permeability.
Concrete that has water in its pores is often damaged when exposed to cold temperatures by freeze-thaw action. The internal pressure resulting when the water freezes effects all components of the concrete. For the most part, only the paste is considered in this publication.
The test methods for freeze-thaw durabi 1 i ty of concrete are ASTM C-666 and ASTM C-671. They are respectively, Test for Resistance of Concrete to Rapid Freezing, and Test for Critical Dilation of Concrete Specimens Subject to Freezing. Non durable concrete is usually indicated when excessive expansion and/or a large decrease in sonic modulus of elasticity occurs.
Absorption of the concrete is a factor that must be considered to determine concrete susceptibility to freeze-thaw action. The absorption of concrete is measured by ASTM C642, which is the Test for Specific Gravity, Absorption, and Voids in Hardened Cone; rete. The ratio of the water absorbed to the dry weight is the absorption. Verbeck states various factors of absorption to be the curing history, w/c ratio, aggregate characteristics, air content, cement type and fineness.
As stated above, this article covers the characteristics of pore structures in the concrete, predominately in the paste. Therefore not much consideration was given concerning the pore structure and porosity of aggregates. Useful information was obtained from this article relating to the behavior of aggregates.
"INFLUENCE OF PHYSICAL CHARACTERISTICS OF AGGREGATES ON FROST RESISTANCE OF CONCRETE,• Verbeck, G. and Landgreen, R., Proceedings, American society of Testing and Materials, Volume 60, 1960.
The suscepti bi 1 i ty to saturation of aggregates in concrete is related to the physical characteristics of the aggregate and the concrete. Some of the more important characteristics are "porosity and pore size distribution of the aggregate and the permeability and thickness of the mortar cover." Saturated aggregate of low porosity may fail as a result. Varied reactions 1 ike these are why the characteristics of the materials must be known.
80
•A CRITICAl REVIEW OF LITERATURE TREATING METHODS OF IDENTIFYING AGGREGATES SUBJECT TO DESTRUCTIVE VOLUME CHANGE WHEN FROZEN IN CONCRETE AND A PROPOSED PROGRAM Of RESEARCH," Layson, T., Cady, P., Franzen, M., Reed, J., Special Report 80, 1964.
This report describes and evaluates the many methods of identifying frost-susceptible aggregates including, freeze-thaw, and the Powers method. Sulfate tests were determined to be unreliable since they do not duplicate natural weathering and are difficult to reproduce. The freeze-thaw test was expanded to include 1 i near and volumetric expansion. However, it was recommended that no further research be done on this method due to the "high degree of judgment for interpretation of tests," lack of a uniform test, and cost of equipment. The authors finally recommended the Powers method as the most logical route of research and implementation.
"RESISTANCE TO WEATHERING,• Newlan, H. Jr., Significance of Tests and Properties of Concrete and Concrete Making Materials, 1698, 1978.
This paper discusses the significance of current methods for testing the weathering resistance of concrete. The historical evolution of soundness and freeze-thaw tests are presented from the first recorded test to the present. The differences between rapid and slow freeze-thaw are discussed and their·various correlations to other parameters such as pore size di stri buti ons. Finally, discussions on dilation methods and scaling resistance are presented.
"POROSITY" Dolch, W. L., Significance of Tests and Properties of Concrete and Concrete - Making Materials, American Society for Testing and Materials, STP 169A, 1966.
A distinction is made between the effective and total porosity. For a lot of aggregates the two are equivalent, but in many volcanic rocks and some slags there are isolated cavities which make the effective porosity less than the total porosity. With the effective porosity being different than the total porosity the durability factors would change but the density and strength would not.
In determining the porosity in aggregates absorption is usually used. The aggregate is saturated completely and then the surface area is dried. The aggregate is weighed before saturation and then again after and the porosity is determined. There are two questions of this method that may alter the accuracy. One is that it is very di ffi cult to obtain complete saturation and secondly, when removing the surface water is there any water removed from the pores?
81
Another method for determining porosity is by photomicrographic method. Most aggregates have a random orientation of their pores. Using visual aids, the area of void space is determined. Since the porosity of a solid is proportional to the area of the void space of a plane passed through the solid, the porosity is obtained. One problem with using this method is that the visual magnification devices used can not see voids sma 11 er than one micron and many aggregates have a large portion of their pore space smaller than one micron.
When finding the pore size or specific surface, a method commonly used is photomicrography, as is used to find porosity. This method is mostly used to group the pores into mi cropores and macropores. The most common way to determine pore size is by the sorption method. This method involves taking the magnitude of uptake of a vapor by the solid as a function of the vapor pressure at a constant temperature, or the absorption isotherm. This data is then used with theories like that of Brunauer, Emmett, and Teller to determine the specific surfaces.
A second major way of determining the pore size is by permeability measurements. This is done by measuring the drag in a viscous flow of gas or 1 i quid through the solid. The retard is proportion a 1 to the amount of solid surface.
It is seen that determining the pore size by permeability might be pointless because permeability itself has a larger effect on questions of frost durability.
82
APPENDIX C
83
KENTUCKY TRANSPORTATION RESEARCH PROGRAM UNIVERSITY OF KENTUCKY College of Engineering
Transportation Researcl1 Building 533 South limestone
Lexington, Kentucky 40506-0043 Telephone: 606-257-4513
H.2.100
MEMORANDUM
to:
FROM:
DATE:
SUBJECT:
Robert C. Deen Director
Gary W. Sharpe d.JJ Chief Research Engineerfl
David L. AllenfP.Ifl. Chief Research Engineer
David Q. Hunsucker ~. Assistant Research Engineer
December 12, 1984
Kentucky Method 64-603-83 "Determination of the Percentage of Shale in Aggregate"
A 12,000 gram sample of #32 Vulcan Materials was received by the Transportation Research Program for testing in accordance with Kentucky Method 64-603-83. The sample was split into 8 uniform samples using a sample splitter and tested by eight individuals with various qualifications. The percentage of shale in each sample was determined as;
SamEle No. % Shale
'1 6.9 2 9.6 3 2.9 4 34.8 5 9.4 6 18.4 7 4.8 8 36.2
Sample Mean; X = 15.375
Standard Deviation;S = 13.247
84
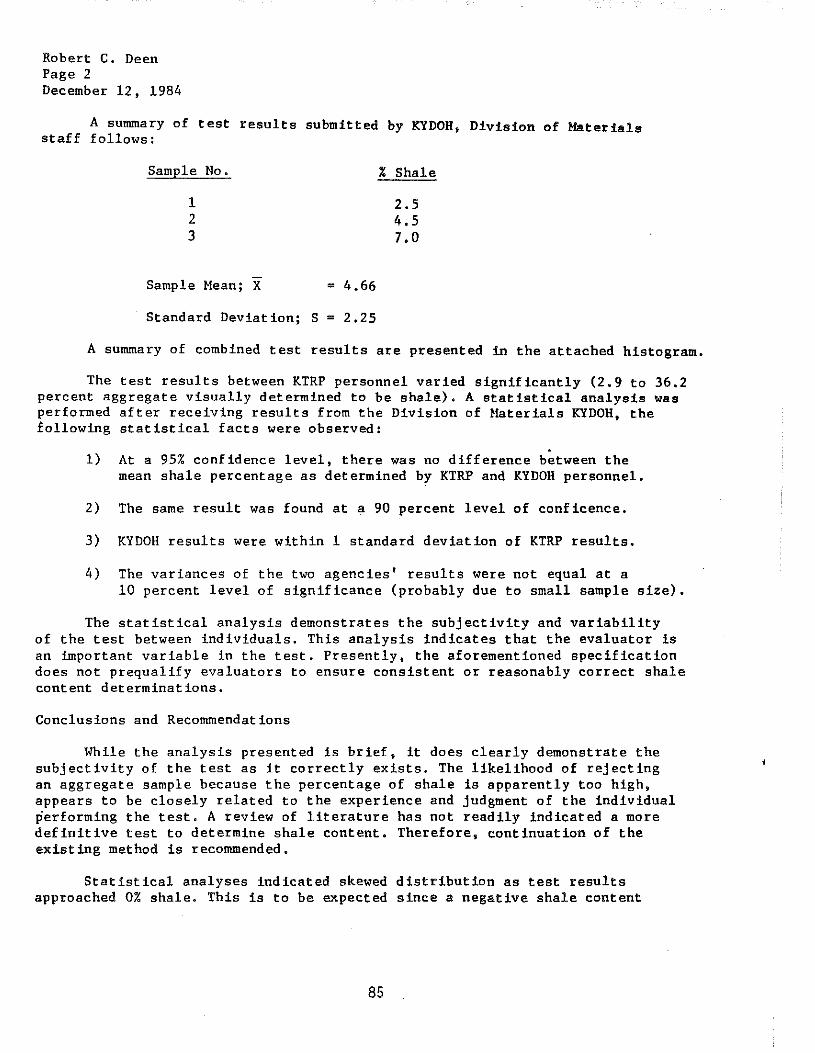
Robert C. Deen Page 2 December 12, 1984
A summary of test results submitted by KYDOH, Division of Materials staff follows:
Sample No.
1 2 3
Sample Mean; X = 4.66
Standard Deviation; S = 2.25
% Shale
2.5 4.5 7.0
A summary of combined test results are presented in the attached histogram.
The test results between KTRP personnel varied significantly (2.9 to 36.2 percent aggregate visually determined to be shale). A statistical analysis was performed after receiving results from the Division of Materials KYDOH, the following statistical facts were observed:
. 1) At a 95% confidence level, there was no difference between the
mean shale percentage as determined by KTRP and KYDOH personnel.
2) The same result was found at a 90 percent level of conficence.
3) KYDOH results were within 1 standard deviation of KTRP results.
4) The variances of the two agencies' results were not equal at a 10 percent level of significance (probably due to small sample size).
The statistical analysis demonstrates the subjectivity and variability of the test between individuals. This analysis indicates that the evaluator is an important variable in the test. Presently, the aforementioned specification does not prequalify evaluators to ensure consistent or reasonably correct shale content determinations.
Conclusions and Recommendations
While the analysis presented is brief, it does clearly demonstrate the subjectivity of the test as it correctly exists. The likelihood of rejecting an aggregate sample because the percentage of shale is apparently too high, appears to be closely related to the experience and judgment of the individual performing the test. A review of literature has not readily indicated a more definitive test to determine shale content. Therefore, continuation of the existing method is recommended.
Statistical analyses indicated skewed distribution as test results approached 0% shale. This is to be expected since a negative shale content
85
Robert C. De en Page 3 December 12, 1984
cannot be computed. Therefore, it may not be practical to determine confidence limits of test values on the basis of a simple mean ± some multiple of the standard deviation. In lieu of detailed statistical analyses, the following is recommended:
1) Conduct all evaluations to determine percentage shale using two raters working independent of each other,
2) Average the results,
3) If the results indicate the sample meets specification requirements, discontinue testing,
4) If the sample fails to meet specifications, conduct evaluations using three additional raters, and average all results.
Future Work
Research personnel will continue to review other procedures to determine shale content in aggregate samples. Three areas that appear promising are:
1) X-Ray analyses to determine mineralogy of the sample,
2) Freeze and thaw testing to identify physical break down and durability characteristics, and
3) Use of some form of chemical characteristics of limestone versus shales.
Equipment is available to perform X-ray analyses to determine the mineralogy of an aggregate sample. Unfortunately, the equipment at the-University capable of these analyses is not operable at this time. The scanning electron-microscope is available at the University. The scanning electron microscope has the capability to determine the elemental composition of a sample. While each of these devices and the associated techniques are useful, their sophistication and uniqueness will limit their practical application.
Freeze-thaw testing may be a beneficial alternative. It has been demonstrated that many shales will deteriorate during slaking, thus the slake durability test is used to determine the quality of shales. Other shales do not deteriorate as rapidly during slaking. It is speculated that many of these shales may form the basis for the marginal material now determined ("the third pile") using the existing method of determining shale content. Freezing and thawing may be used to differentiate these marginal materials. The principal disadvantages of the freezethaw test for this application are:
1) There is no standardized method available for this application. Thus research and development is needed to verify and refine techniques and interpretations.
2) The test is likely to be time comsuming.
Therefore, some form of a chemical analyses may be more beneficial, particularly from the "time" perspective.
86
Robert C. Deen Page 4 December 12, 1984
Because of the difference in chemical characteristics of limestones and shales, the possibility of using some form of a chemical marker test will be investigated. It is obvious that the bonding characteristics of the two materials is considerably different. The most obvious test would be to test the material for CaC03, however there are a number of calcareous shales that could confuse the results of such a test. Another possible test would be one that could break down the weaker chemical bond of the shales but leave the stronger limestone bonds intact.
Any test that is chosen, however, must be relatively simple to run and provide quick results. Consequently, this objective may require considerable time and effort to accomplish. The first step in this process' will be to identify the chemical and mineralogical nature of a number of limestones and shales. The mineralogical analysis of a large number of Kentuckyshales is already available. This same analysis will be performed on a number of limestones.
It is also known that clays will absorb glycerols on their surfaces. This tends to cause the shales to slake. Consequently some researchers have had some success in identifying shales by boiling the samples in glycerin. This method will also be attempted.
/jfh Attachment
87
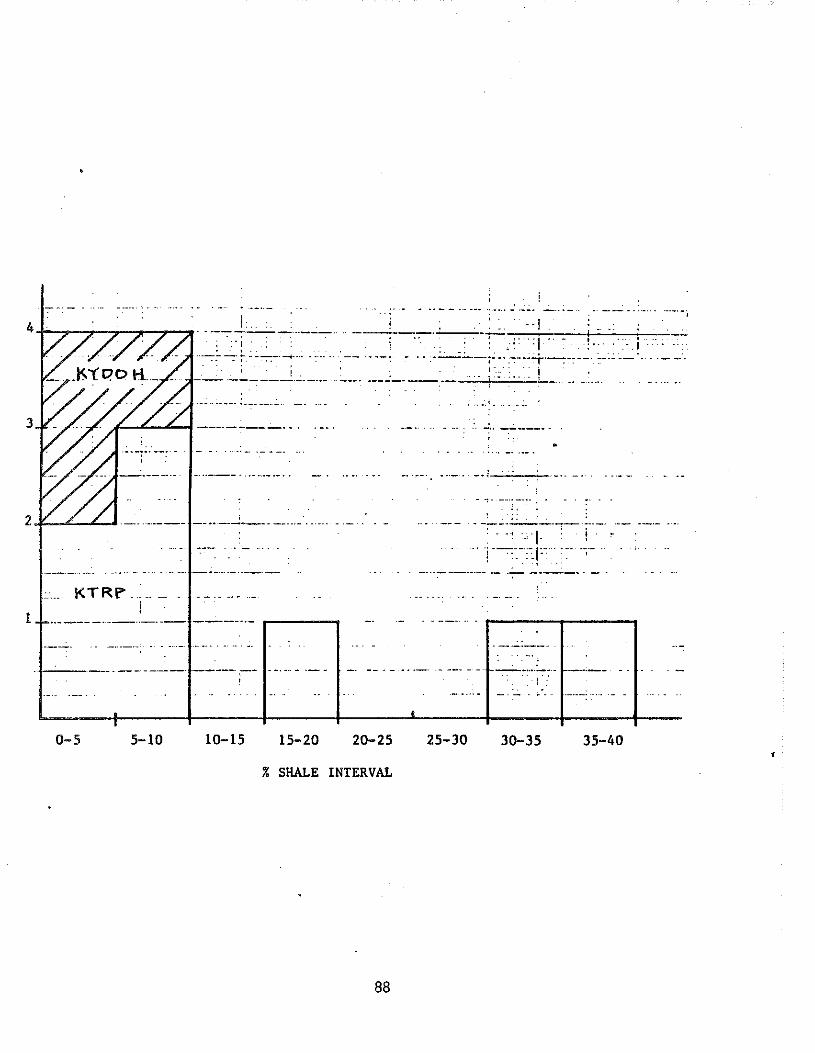
-----·-'-------'-. ·I
. , . . :I . . - !, .. . i ···-:-;--:·;- ----:-:-·-···· ··-··. - .. :------·j-·•• -~--+·-. -~--- :-·- ·-
l'. i '
I --- -----------------· :.I.
3
- ·:- -
' ---·--------- ------ ...... .
KTRi"'.
l
-- -----·-'· ·-. ···- ---- ... ·-. --
-1-'-----· --- --·--· -------
0-5 5-10 1Q-15 15-20 20-25 25-30 3Q-35 35-40
% SHALE INTERVAL
88