Embed Size (px)
Citation preview
EVALUATION OF PERFORMANCE OF
SOLAR POWERED FLASHING BEACONS AT SEVERE TEMPERATURE CONDITIONS
Prepared By
Ali Hajbabaie Rahim Benekohal
Juan Medina
University of Illinois at Urbana Champaign
Research Report ICT-11-084
A report of the findings of ICT-R27-59
Evaluation of Performance of Solar Powered Flashing Beacons
Illinois Center for Transportation
June 2011
CIVIL ENGINEERING STUDIES Illinois Center for Transportation Series No. 11-084
UILU-ENG-2011-2010 ISSN: 0197-9191
Technical Report Documentation Page
1. Report No. FHWA-ICT-11-084
2. Government Accession No. 3. Recipient's Catalog No.
4. Title and Subtitle Evaluation of Performance of Solar Powered Flashing Beacons at Severe Temperature Conditions
5. Report Date
June 2011 6. Performing Organization Code
8. Performing Organization Report N o. 7. Author(s) Ali Hajbabaie, Rahim Benekohal, Juan Medina
ICT-11-084 UILU-ENG-2011-2010 9. Performing Organization Name and Address
Illinois Center for Transportation Department of Civil and Environmental Engineering University of Illinois at Urbana-Champaign 205 N. Mathews Ave, MC 250 Urbana, IL 61801
10. Work Unit ( TRAIS)
11. Contract or Grant No. ICT R27-59 13. Type of Report and Period Covered
12. Sponsoring Agency Name and Address
Illinois Department of Transportation Bureau of Materials and Physical Research 126 E. Ash Street Springfield, IL 62704
14. Sponsoring Agency Code
15. Supplementary Notes
16. Abstract This report contains the results of 34 tests for JSF and 26 tests for Carmanah solar-powered flashing beacons operating in mild cold temperature (-6.6 oC), severe cold temperature (-20 oC), and hot temperature (+70 oC) conditions. In addition, it contains two tests for JSF modules and two for Carmanah operating under “real world” conditions. In mild temperature condition, red and yellow modules of JSF flashed in MUTCD pattern for at least 11 and 8.5 days, respectively. The red and yellow modules of Carmanah flashed in MUTCD pattern for at least 11 and 8 days, respectively. Reducing the temperature to -20 0C resulted in a significant decrease in the duration of flashing in MUTCD pattern for JSF modules; however, that duration did not decrease for Carmanah. Red and yellow modules of JSF flashed in MUTCD pattern for at least 18 and 24 hours in severe cold temperature condition. For Carmanah, red and yellow modules lasted in MUTCD flashing pattern for at least 14 and 11.5 days, respectively. In hot temperature condition, red and yellow modules of JSF flashed in MUTCD pattern for at least 6.5 and 5.5 days, respectively. Red and yellow modules of Carmanah lasted in MUTCD flashing pattern for at least 8.5 and 7 days, respectively. The “real world” condition test indicated that in certain conditions (e.g. solar panels covered with snow), the solar panels may not be able to generate enough power for the LEDs to keep them flashing in MUTCD pattern. In this condition, the flashing pattern changes to a power saver mode. The red modules of JSF and Carmanah were visible when the distance was at least 1500 ft in a sunny and very bright day. The yellow modules of JSF and Carmanah were visible up to a distance of about 1000 ft in the same day. If solar panels are accidently disconnected when the modules are outdoors and batteries are fully charged, the JSF and Carmanah modules were visible at a distance of 700 ft, in a cloudy but bright day. 17. Key Words
Solar Power Flashing Beacon Module, Flashing Beacon Hot Cold Temperature, MUTCD Flashing Pattern, Battery Duration, Red Yellow LED Traffic Light, Warning Light, Light Intensity Visibility Distance
18. Distribution Statement No restrictions. This document is available to the public through the National Technical Information Service, Springfield, Virginia 22161.
19. Security Classif. (of this report) Unclassified
20. Security Classif. (of this page) Unclassified
21. No. of Pages
40
22. Price
Form DOT F 1700.7 (8-72) Reproduction of completed page authorized
i
ACKNOWLEDGMENT AND DISCLAIMER
This publication is based on the results of ICT-R27-59, Evaluation of Performance of Solar Powered Flashing Beacons. ICT-R27-59 was conducted in cooperation with the Illinois Center for Transportation; the Illinois Department of Transportation; and the U.S. Department of Transportation, Federal Highway Administration.
Members of the Technical Review Panel are the following: Yogesh Gautam, IDOT (Chair) Eric Howald, IDOT David Burkybile, IDOT Dean Mentjes, FHWA Stan Milewski, ICC
The contents of this report reflect the view of the authors, who are responsible for the facts and the accuracy of the data presented herein. The contents do not necessarily reflect the official views or policies of the Illinois Center for Transportation, the Illinois Department of Transportation, or the Federal Highway Administration. This report does not constitute a standard, specification, or regulation.
Trademark or manufacturers’ names appear in this report only because they are considered essential to the object of this document and do not constitute an endorsement of product by the Federal Highway Administration, the Illinois Department of Transportation, or the Illinois Center for Transportation.
ii
EXECUTIVE SUMMARY This study was conducted in the Traffic Operations Lab (TOL) of the University of Illinois at Urbana-Champaign to complement a previous study (FHWA-ICT-10-069) on evaluating the performance of solar powered flashing beacons at room temperature. This study determines the time the solar powered flashing beacons continued flashing in Manual on Uniform Traffic Control Devices (MUTCD) pattern without being recharged at three conditions: a) mild cold temperature (-6 0C), b) severe cold temperature (-20 0C), and c) hot temperature (+70 0C). The beacons were provided by Carmanah Technologies Corporation and JSF Electronics.
In mild temperature condition, red and yellow modules of JSF flashed in MUTCD pattern for at least 11 and 8.5 days, respectively. The red and yellow modules of Carmanah flashed in MUTCD pattern for at least 11 and 8 days, respectively.
Reducing the temperature to -20 0C resulted in a significant decrease in the duration of flashing in MUTCD pattern for JSF modules; however, that duration did not decrease for Carmanah. Red and yellow modules of JSF flashed in MUTCD pattern for at least 18 and 24 hours in severe cold temperature condition. For Carmanah, red and yellow modules lasted in MUTCD flashing pattern for at least 14 and 11.5 days, respectively.
In hot temperature condition, red and yellow modules of JSF flashed in MUTCD pattern for at least 6.5 and 5.5 days, respectively. Red and yellow modules of Carmanah lasted in MUTCD flashing pattern for at least 8.5 and 7 days, respectively.
The “real world” condition test indicated that in certain conditions (e.g. solar panels covered with snow), the solar panels may not be able to generate enough power for the LEDs to keep them flashing in MUTCD pattern. In this condition, the flashing pattern changes to a power saver mode.
The red modules of JSF and Carmanah were visible when the distance was at least 1500 ft on a sunny and very bright day. The yellow modules of JSF and Carmanah were visible up to a distance of about 1000 ft in the same day. If solar panels are accidently disconnected when the modules are outdoors and batteries are fully charged, the JSF and Carmanah modules were visible at a distance of 700 ft, on a cloudy but bright day.
iii
TABLE OF CONTENTS 1. INTRODUCTION ....................................................................................................... 1
2. LITERATURE REVIEW ............................................................................................. 2
3. TEST DESCRIPTION................................................................................................ 3
3.1. VOLTAGE LEVEL OF BATTERY .......................................................................... 3
3.2 FLASHING PATTERN AND DURATION ................................................................ 4
3.3 CHOOSING THE PROPER TEMPERATURE FOR EACH CONDITION ............... 4
4. RESULTS .................................................................................................................. 6
4.1. MILD COLD TEMPERATURE CONDITION .......................................................... 6
4.1.1. JSF Red Duration ............................................................................................ 6
4.1.2. JSF Red Charging Time .................................................................................. 7
4.1.3. JSF Yellow Duration ........................................................................................ 8
4.1.4. JSF Yellow Charging Time .............................................................................. 9
4.1.5. Carmanah Red Duration ............................................................................... 10
4.1.6. Carmanah Red Charging Time ..................................................................... 10
4.1.7. Carmanah Yellow Duration ........................................................................... 11
4.1.8. Carmanah Yellow Charging Time ................................................................. 13
4.2. SEVERE COLD TEMPERATURE CONDITION .................................................. 13
4.2.1. JSF Red Duration .......................................................................................... 13
4.2.2. JSF Red Charging Time ................................................................................ 14
4.2.3. JSF Yellow Duration ...................................................................................... 15
4.2.4. JSF Yellow Charging Time ............................................................................ 16
4.2.5. Carmanah Red Duration ............................................................................... 16
4.2.6. Carmanah Red Charging Time ..................................................................... 18
4.2.7. Carmanah Yellow Duration ........................................................................... 18
4.2.8. Carmanah Yellow Charging Time ................................................................. 19
4.3. HOT TEMPERATURE CONDITION .................................................................... 21
4.3.1. JSF Red Duration .......................................................................................... 21
4.3.2. JSF Red Charging Time ................................................................................ 22
4.3.3. JSF Yellow Duration ...................................................................................... 22
4.3.4. JSF Yellow Charging Time ............................................................................ 23
4.3.5. Carmanah Red Duration ............................................................................... 24
4.3.6. Carmanah Red Charging Time ..................................................................... 25
4.3.7. Carmanah Yellow Duration ........................................................................... 26
4.3.8. Carmanah Yellow Charging Time ................................................................. 27
4.3. REAL WORLD TEST IN ADVERSE WEATHER CONDITION ............................ 27
4.4. INTENISTY MEASUREMENTS ........................................................................... 30
iv
5. CONCLUSIONS ...................................................................................................... 32
6. APPENDIX .............................................................................................................. 33
1
1. INTRODUCTION
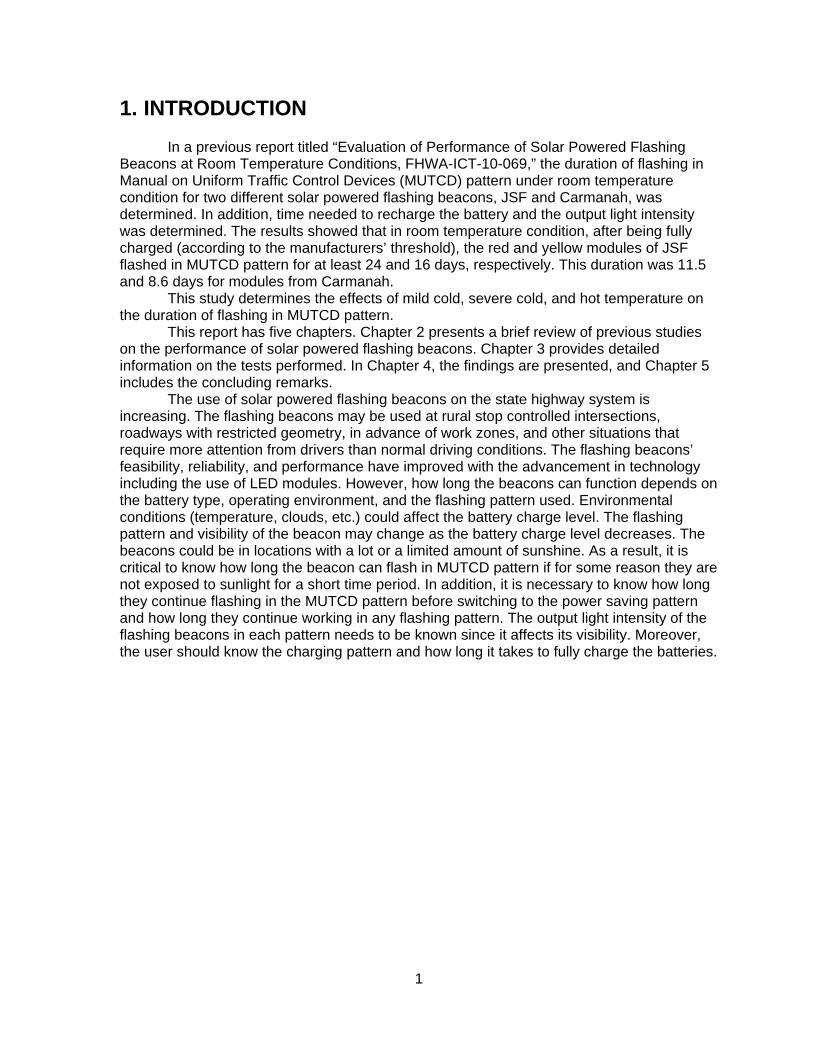
In a previous report titled “Evaluation of Performance of Solar Powered Flashing Beacons at Room Temperature Conditions, FHWA-ICT-10-069,” the duration of flashing in Manual on Uniform Traffic Control Devices (MUTCD) pattern under room temperature condition for two different solar powered flashing beacons, JSF and Carmanah, was determined. In addition, time needed to recharge the battery and the output light intensity was determined. The results showed that in room temperature condition, after being fully charged (according to the manufacturers’ threshold), the red and yellow modules of JSF flashed in MUTCD pattern for at least 24 and 16 days, respectively. This duration was 11.5 and 8.6 days for modules from Carmanah.
This study determines the effects of mild cold, severe cold, and hot temperature on the duration of flashing in MUTCD pattern. This report has five chapters. Chapter 2 presents a brief review of previous studies on the performance of solar powered flashing beacons. Chapter 3 provides detailed information on the tests performed. In Chapter 4, the findings are presented, and Chapter 5 includes the concluding remarks. The use of solar powered flashing beacons on the state highway system is increasing. The flashing beacons may be used at rural stop controlled intersections, roadways with restricted geometry, in advance of work zones, and other situations that require more attention from drivers than normal driving conditions. The flashing beacons’ feasibility, reliability, and performance have improved with the advancement in technology including the use of LED modules. However, how long the beacons can function depends on the battery type, operating environment, and the flashing pattern used. Environmental conditions (temperature, clouds, etc.) could affect the battery charge level. The flashing pattern and visibility of the beacon may change as the battery charge level decreases. The beacons could be in locations with a lot or a limited amount of sunshine. As a result, it is critical to know how long the beacon can flash in MUTCD pattern if for some reason they are not exposed to sunlight for a short time period. In addition, it is necessary to know how long they continue flashing in the MUTCD pattern before switching to the power saving pattern and how long they continue working in any flashing pattern. The output light intensity of the flashing beacons in each pattern needs to be known since it affects its visibility. Moreover, the user should know the charging pattern and how long it takes to fully charge the batteries.
2
2. LITERATURE REVIEW While there are many studies on the effectiveness of various flashing beacons on safety, no existing study specifically evaluates the performance of the solar powered flashing beacons’ batteries over time at different temperatures. However, some existing studies determine the battery life of Uninterrupted Power Supply (UPS) systems used at intersections. Chitturi and Benekohal (2005) measured the charge and discharge times of the above-mentioned UPS systems. Chitturi and Benekohal (2003) conducted similar studies to determine the time a UPS system can power an intersection with LED modules when there is a power outage. In this study, a similar approach to determine the discharge time of solar powered flashing beacons is used.
3
3. TEST DESCRIPTION Two companies that have sold a substantial number of flashing beacons in Illinois, J S F Electronics (JSF) and Carmanah Technologies Corporation (Carmanah), were asked to provide a sample of their yellow and red flashing beacons for this evaluation. The model numbers of the tested beacons are: 46319 R24730 for Carmanah red and yellow colors and FL-12R-1412 for JSF red and yellow colors.
The research team made sure the devices were working properly and charging and discharging as expected. To determine the duration of flashing in MUTCD pattern under different temperature conditions, an industrial freezer and an industrial oven were used and the following items were monitored:
a. Voltage level of battery b. Flashing pattern and duration
The beacons were placed in the freezer or oven for different tests in the Traffic Operations Lab (TOL) and were prepared for testing. Data collection equipment (multimeter, computer, monitor, video recorder, software, etc.) were assembled and tested to be sure they were working properly.
The investigators took a look at 10-year temperature data at three cities in Illinois to choose proper temperatures for mild cold, severe cold, and hot temperatures. Details on choosing the temperature are presented in section 3.3.
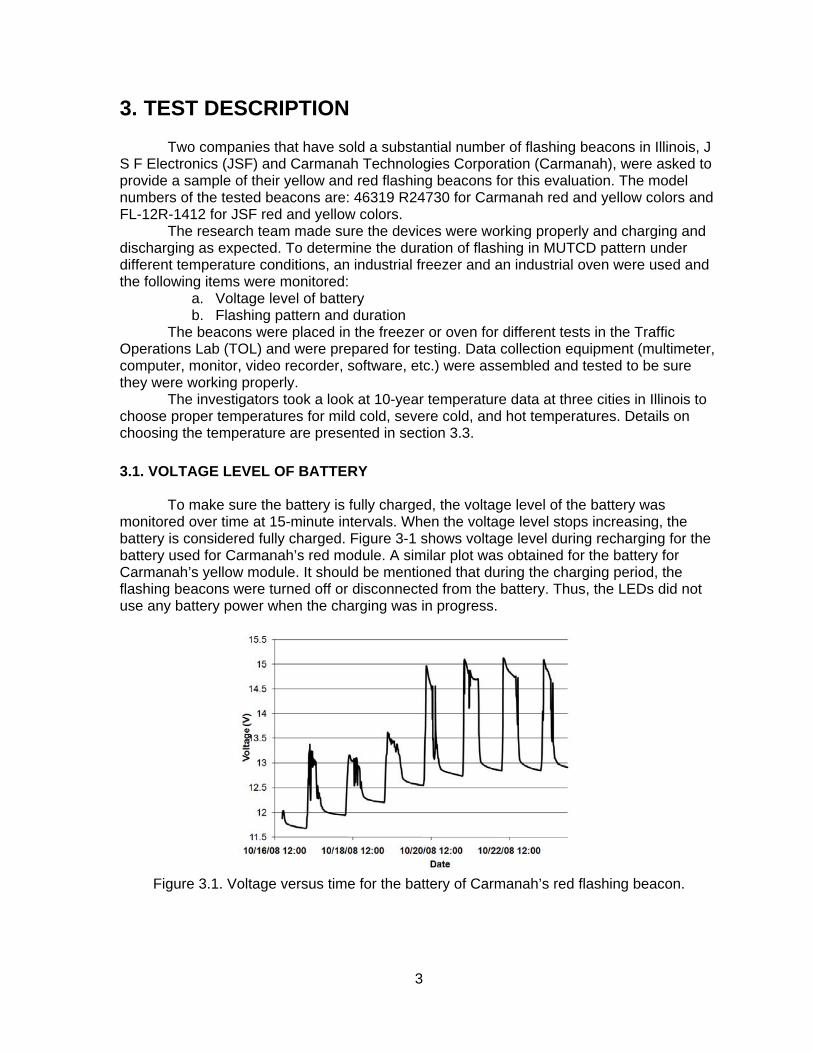
3.1. VOLTAGE LEVEL OF BATTERY To make sure the battery is fully charged, the voltage level of the battery was monitored over time at 15-minute intervals. When the voltage level stops increasing, the battery is considered fully charged. Figure 3-1 shows voltage level during recharging for the battery used for Carmanah’s red module. A similar plot was obtained for the battery for Carmanah’s yellow module. It should be mentioned that during the charging period, the flashing beacons were turned off or disconnected from the battery. Thus, the LEDs did not use any battery power when the charging was in progress.
Figure 3.1. Voltage versus time for the battery of Carmanah’s red flashing beacon.
4
3.2 FLASHING PATTERN AND DURATION
Once the battery was fully charged according to the manufacturer’s recommendation, it was allowed to remain inside the lab for about an hour so the charge level was “stabilized.” Then, the flashing beacon was connected to the battery and the voltage level was monitored. A multimeter was connected to the battery poles showing the voltage of the battery. This multimeter was also connected to the computer so that it was sending the voltages at 1-minute intervals to the computer. The voltage and its time stamp were recorded in the computer and used to plot voltage versus time. A summary of findings is presented for each module later in this section. In addition, a video recording device capable of time lapsed recording was used to record the flashing pattern to confirm the time the flashing pattern was changed. The recording was made in three-hour time intervals for a period of one minute. 3.3 CHOOSING THE PROPER TEMPERATURE FOR EACH CONDITION
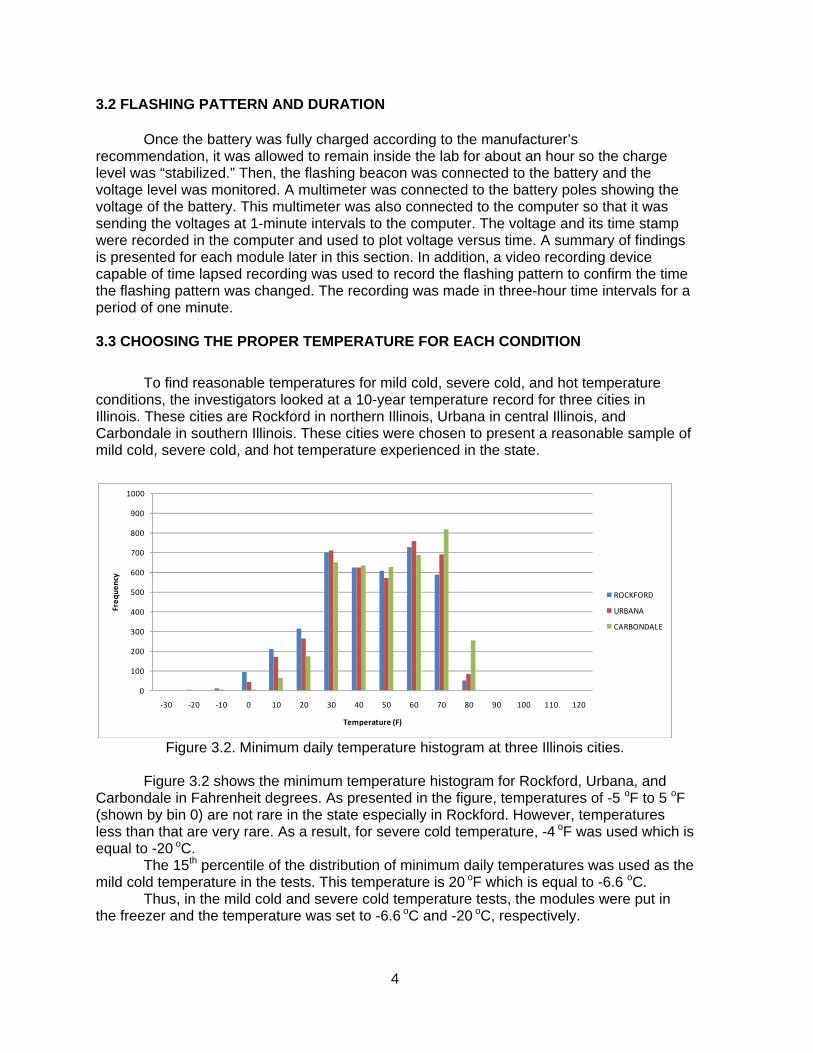
To find reasonable temperatures for mild cold, severe cold, and hot temperature conditions, the investigators looked at a 10-year temperature record for three cities in Illinois. These cities are Rockford in northern Illinois, Urbana in central Illinois, and Carbondale in southern Illinois. These cities were chosen to present a reasonable sample of mild cold, severe cold, and hot temperature experienced in the state.
Figure 3.2. Minimum daily temperature histogram at three Illinois cities.
Figure 3.2 shows the minimum temperature histogram for Rockford, Urbana, and
Carbondale in Fahrenheit degrees. As presented in the figure, temperatures of -5 oF to 5 oF (shown by bin 0) are not rare in the state especially in Rockford. However, temperatures less than that are very rare. As a result, for severe cold temperature, -4 oF was used which is equal to -20 oC.
The 15th percentile of the distribution of minimum daily temperatures was used as the mild cold temperature in the tests. This temperature is 20 oF which is equal to -6.6 oC.
Thus, in the mild cold and severe cold temperature tests, the modules were put in the freezer and the temperature was set to -6.6 oC and -20 oC, respectively.
0
100
200
300
400
500
600
700
800
900
1000
‐30 ‐20 ‐10 0 10 20 30 40 50 60 70 80 90 100 110 120
Frequency
Temperature (F)
ROCKFORD
URBANA
CARBONDALE
5
0
100
200
300
400
500
600
700
800
900
1000
‐30 ‐20 ‐10 0 10 20 30 40 50 60 70 80 90 100 110 120
Frequency
Temperature (F)
ROCKFORD
URBANA
CARBONDALE
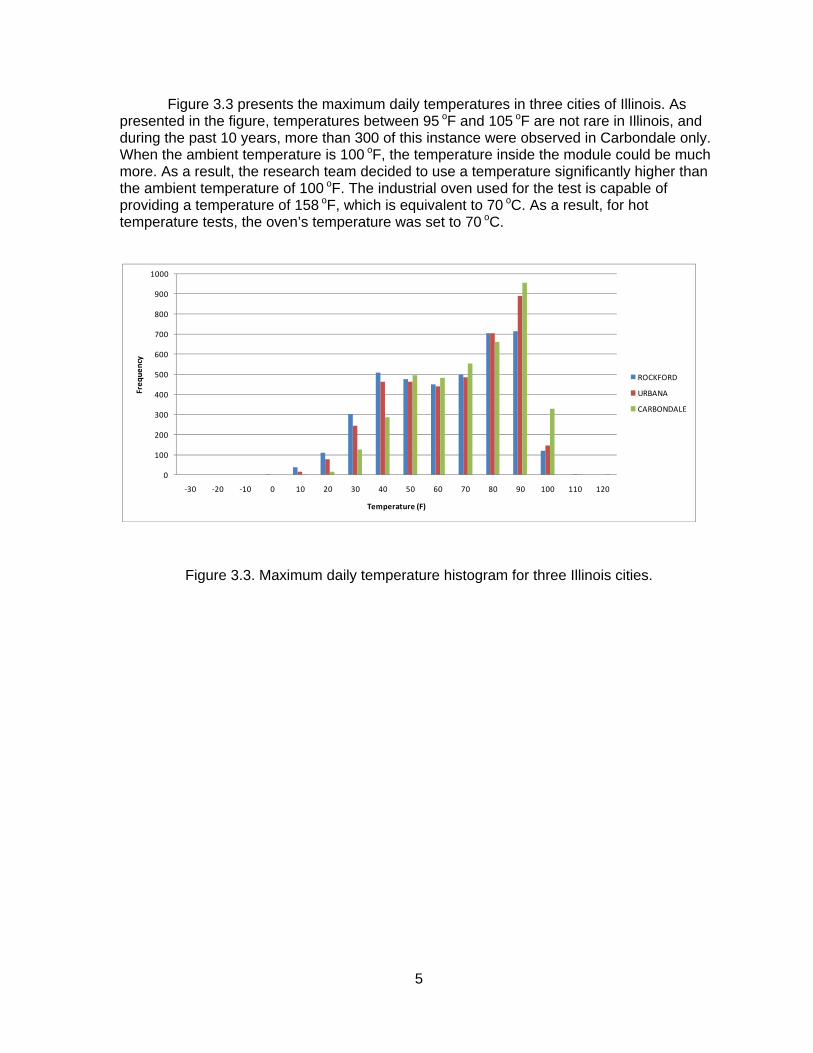
Figure 3.3 presents the maximum daily temperatures in three cities of Illinois. As presented in the figure, temperatures between 95 oF and 105 oF are not rare in Illinois, and during the past 10 years, more than 300 of this instance were observed in Carbondale only. When the ambient temperature is 100 oF, the temperature inside the module could be much more. As a result, the research team decided to use a temperature significantly higher than the ambient temperature of 100 oF. The industrial oven used for the test is capable of providing a temperature of 158 oF, which is equivalent to 70 oC. As a result, for hot temperature tests, the oven’s temperature was set to 70 oC.
Figure 3.3. Maximum daily temperature histogram for three Illinois cities.
6
4. RESULTS This section is divided into three sub-sections. Findings of the mild cold temperature condition are presented first. Then, the results of severe cold and finally hot temperature condition are presented. In each sub-section, first the results for JSF (red and then yellow) are discussed followed by findings for Carmanah (red and then yellow). 4.1. MILD COLD TEMPERATURE CONDITION 4.1.1. JSF Red Duration
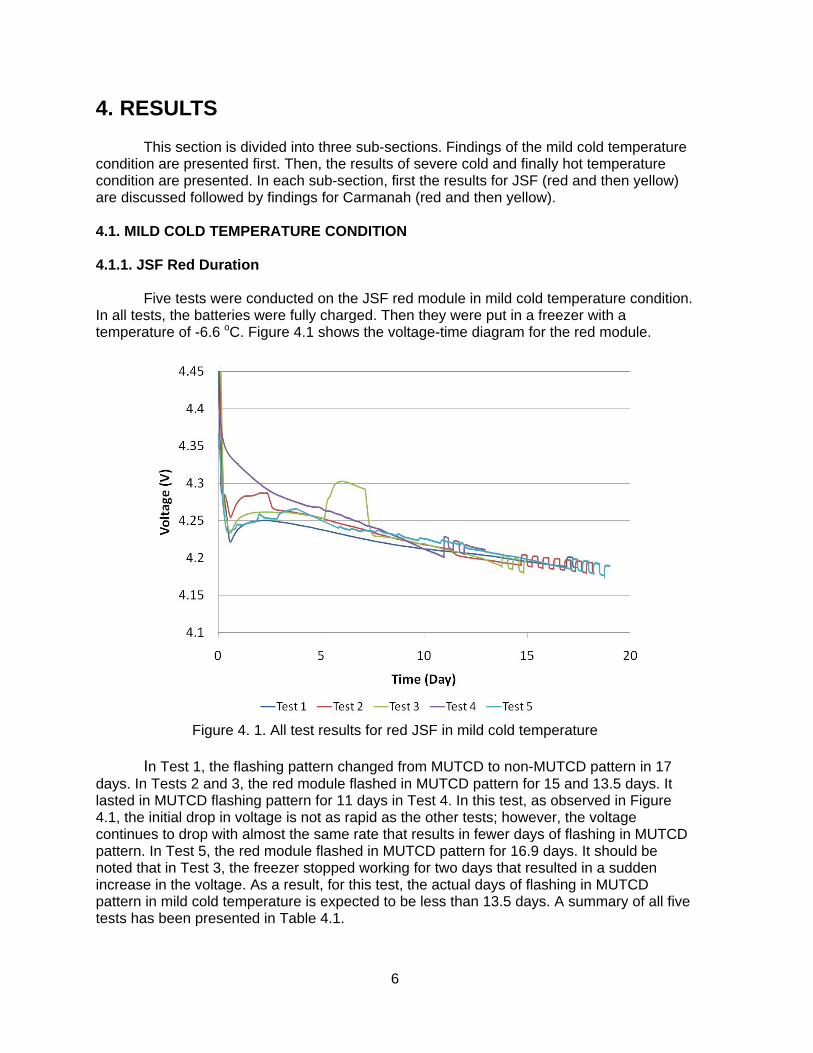
Five tests were conducted on the JSF red module in mild cold temperature condition. In all tests, the batteries were fully charged. Then they were put in a freezer with a temperature of -6.6 oC. Figure 4.1 shows the voltage-time diagram for the red module.
Figure 4. 1. All test results for red JSF in mild cold temperature
In Test 1, the flashing pattern changed from MUTCD to non-MUTCD pattern in 17
days. In Tests 2 and 3, the red module flashed in MUTCD pattern for 15 and 13.5 days. It lasted in MUTCD flashing pattern for 11 days in Test 4. In this test, as observed in Figure 4.1, the initial drop in voltage is not as rapid as the other tests; however, the voltage continues to drop with almost the same rate that results in fewer days of flashing in MUTCD pattern. In Test 5, the red module flashed in MUTCD pattern for 16.9 days. It should be noted that in Test 3, the freezer stopped working for two days that resulted in a sudden increase in the voltage. As a result, for this test, the actual days of flashing in MUTCD pattern in mild cold temperature is expected to be less than 13.5 days. A summary of all five tests has been presented in Table 4.1.
7
Table 4. 1. Summary of Tests for Red JSF.
Test No. Initial Voltage (V) Days Flashed in MUTCD Pattern
1 4.55 V (Fully charged: 4.30 V) 17
2 4.62 V (Fully charged: 4.30 V) 15
3 4.70 V (Fully charged: 4.30 V) 13.5
4 4.42 V (Fully charged: 4.30 V) 11
6 4.34 V (Fully charged: 4.30 V) 16.9
4.1.2. JSF Red Charging Time
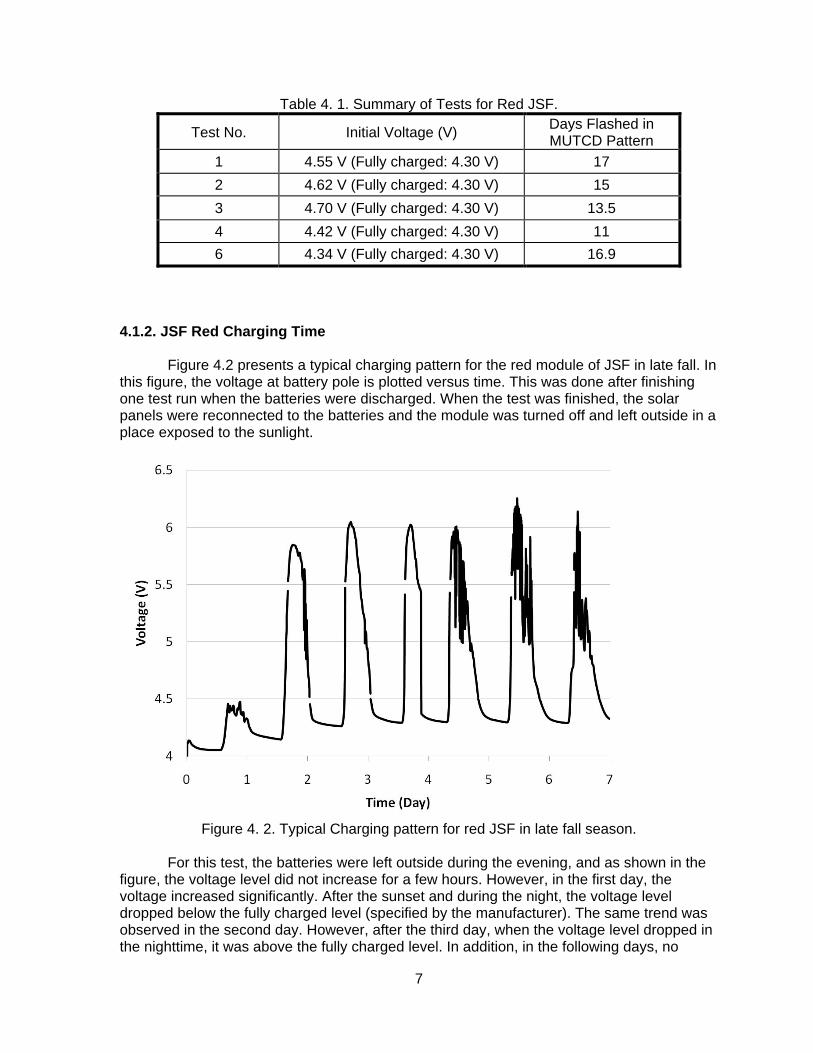
Figure 4.2 presents a typical charging pattern for the red module of JSF in late fall. In this figure, the voltage at battery pole is plotted versus time. This was done after finishing one test run when the batteries were discharged. When the test was finished, the solar panels were reconnected to the batteries and the module was turned off and left outside in a place exposed to the sunlight.
Figure 4. 2. Typical Charging pattern for red JSF in late fall season.
For this test, the batteries were left outside during the evening, and as shown in the
figure, the voltage level did not increase for a few hours. However, in the first day, the voltage increased significantly. After the sunset and during the night, the voltage level dropped below the fully charged level (specified by the manufacturer). The same trend was observed in the second day. However, after the third day, when the voltage level dropped in the nighttime, it was above the fully charged level. In addition, in the following days, no
8
significant decrease in the voltage level during the nighttime was observed. These observations indicated that in the late fall season, the red module of JSF needs three days of sun exposure to reach its fully charged level (after being drained). 4.1.3. JSF Yellow Duration
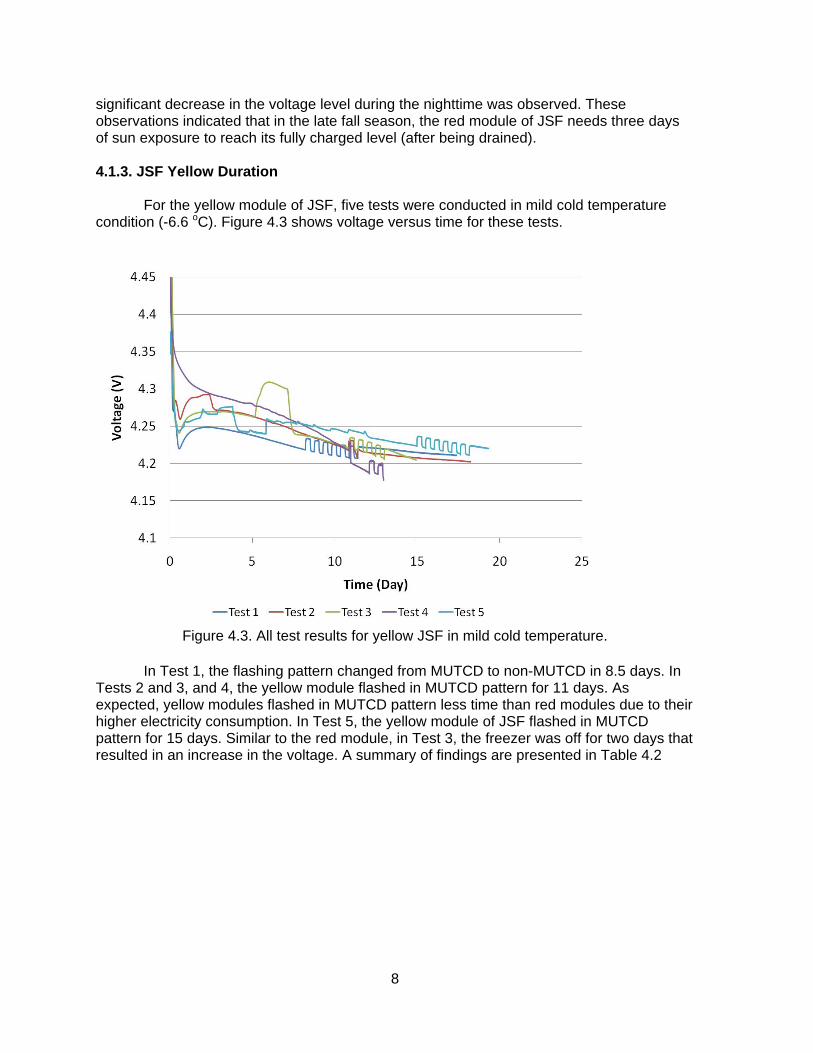
For the yellow module of JSF, five tests were conducted in mild cold temperature condition (-6.6 oC). Figure 4.3 shows voltage versus time for these tests.
Figure 4.3. All test results for yellow JSF in mild cold temperature.
In Test 1, the flashing pattern changed from MUTCD to non-MUTCD in 8.5 days. In
Tests 2 and 3, and 4, the yellow module flashed in MUTCD pattern for 11 days. As expected, yellow modules flashed in MUTCD pattern less time than red modules due to their higher electricity consumption. In Test 5, the yellow module of JSF flashed in MUTCD pattern for 15 days. Similar to the red module, in Test 3, the freezer was off for two days that resulted in an increase in the voltage. A summary of findings are presented in Table 4.2
9
Table 4. 2. Summary of Tests for Yellow JSF.
Test No. Initial Voltage (V) Days Flashed in MUTCD Pattern
1 4.54 (Fully Charged level = 4.3) 8.5
2 4.66 (Fully Charged level = 4.3) 11
3 4.70 (Fully Charged level = 4.3) 11
4 4.45 (Fully Charged level = 4.3) 11
5 4.34 (Fully Charged level = 4.3) 15
4.1.4. JSF Yellow Charging Time
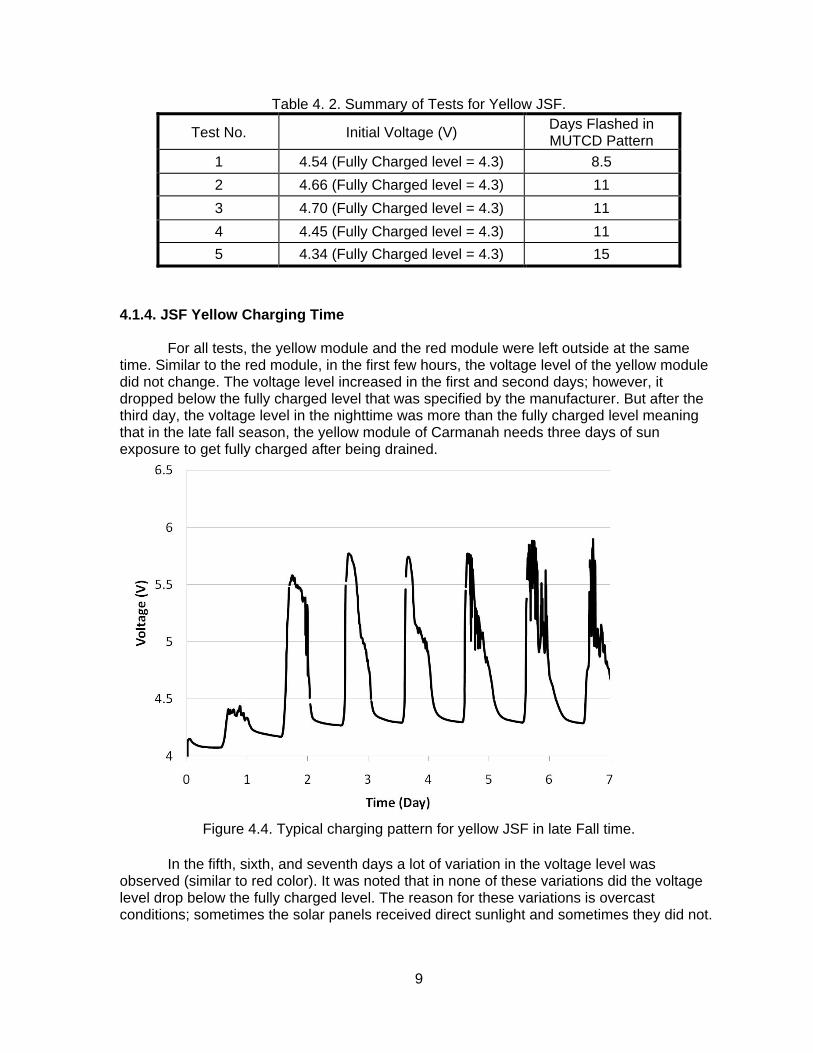
For all tests, the yellow module and the red module were left outside at the same time. Similar to the red module, in the first few hours, the voltage level of the yellow module did not change. The voltage level increased in the first and second days; however, it dropped below the fully charged level that was specified by the manufacturer. But after the third day, the voltage level in the nighttime was more than the fully charged level meaning that in the late fall season, the yellow module of Carmanah needs three days of sun exposure to get fully charged after being drained.
Figure 4.4. Typical charging pattern for yellow JSF in late Fall time.
In the fifth, sixth, and seventh days a lot of variation in the voltage level was
observed (similar to red color). It was noted that in none of these variations did the voltage level drop below the fully charged level. The reason for these variations is overcast conditions; sometimes the solar panels received direct sunlight and sometimes they did not.
10
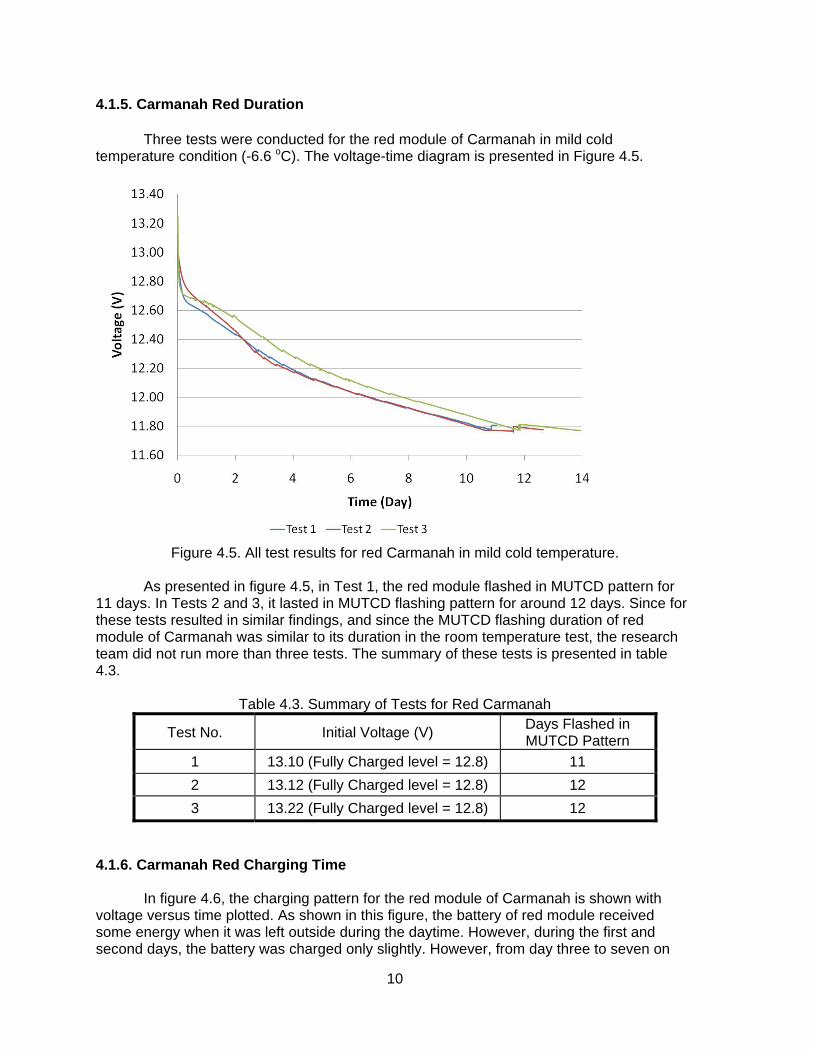
4.1.5. Carmanah Red Duration
Three tests were conducted for the red module of Carmanah in mild cold temperature condition (-6.6 oC). The voltage-time diagram is presented in Figure 4.5.
Figure 4.5. All test results for red Carmanah in mild cold temperature.
As presented in figure 4.5, in Test 1, the red module flashed in MUTCD pattern for
11 days. In Tests 2 and 3, it lasted in MUTCD flashing pattern for around 12 days. Since for these tests resulted in similar findings, and since the MUTCD flashing duration of red module of Carmanah was similar to its duration in the room temperature test, the research team did not run more than three tests. The summary of these tests is presented in table 4.3.
Table 4.3. Summary of Tests for Red Carmanah
Test No. Initial Voltage (V) Days Flashed in MUTCD Pattern
1 13.10 (Fully Charged level = 12.8) 11
2 13.12 (Fully Charged level = 12.8) 12
3 13.22 (Fully Charged level = 12.8) 12
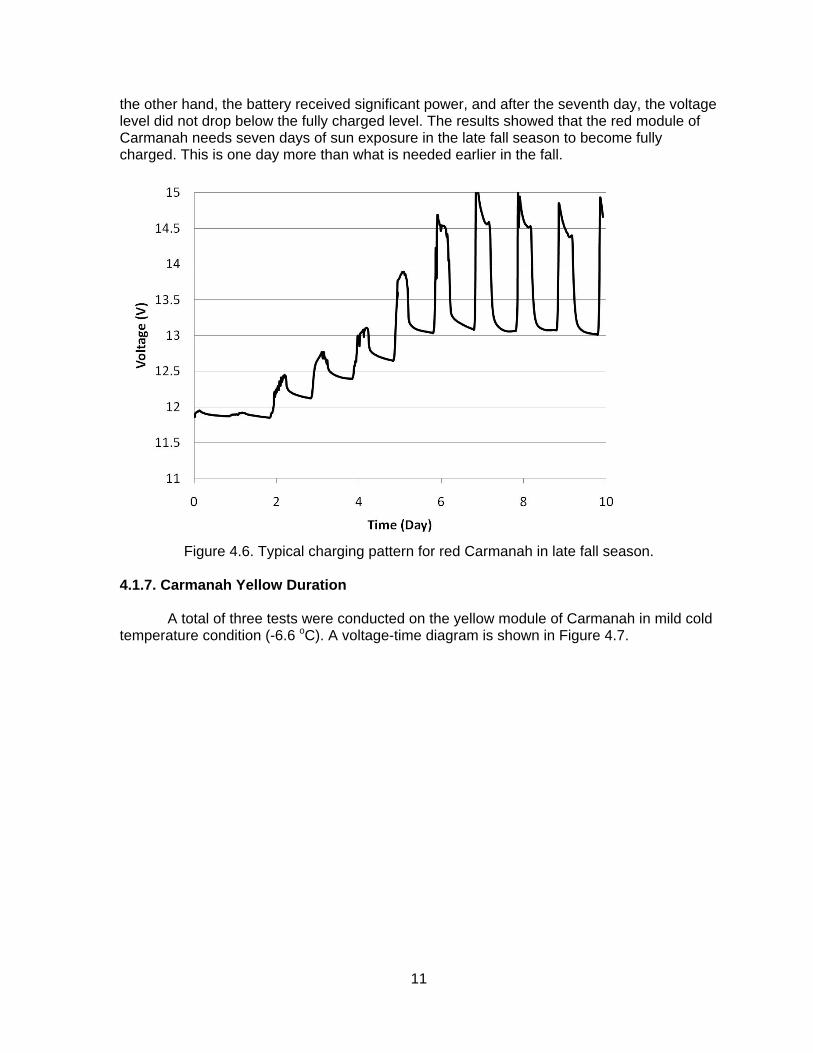
4.1.6. Carmanah Red Charging Time
In figure 4.6, the charging pattern for the red module of Carmanah is shown with voltage versus time plotted. As shown in this figure, the battery of red module received some energy when it was left outside during the daytime. However, during the first and second days, the battery was charged only slightly. However, from day three to seven on
11
the other hand, the battery received significant power, and after the seventh day, the voltage level did not drop below the fully charged level. The results showed that the red module of Carmanah needs seven days of sun exposure in the late fall season to become fully charged. This is one day more than what is needed earlier in the fall.
Figure 4.6. Typical charging pattern for red Carmanah in late fall season.
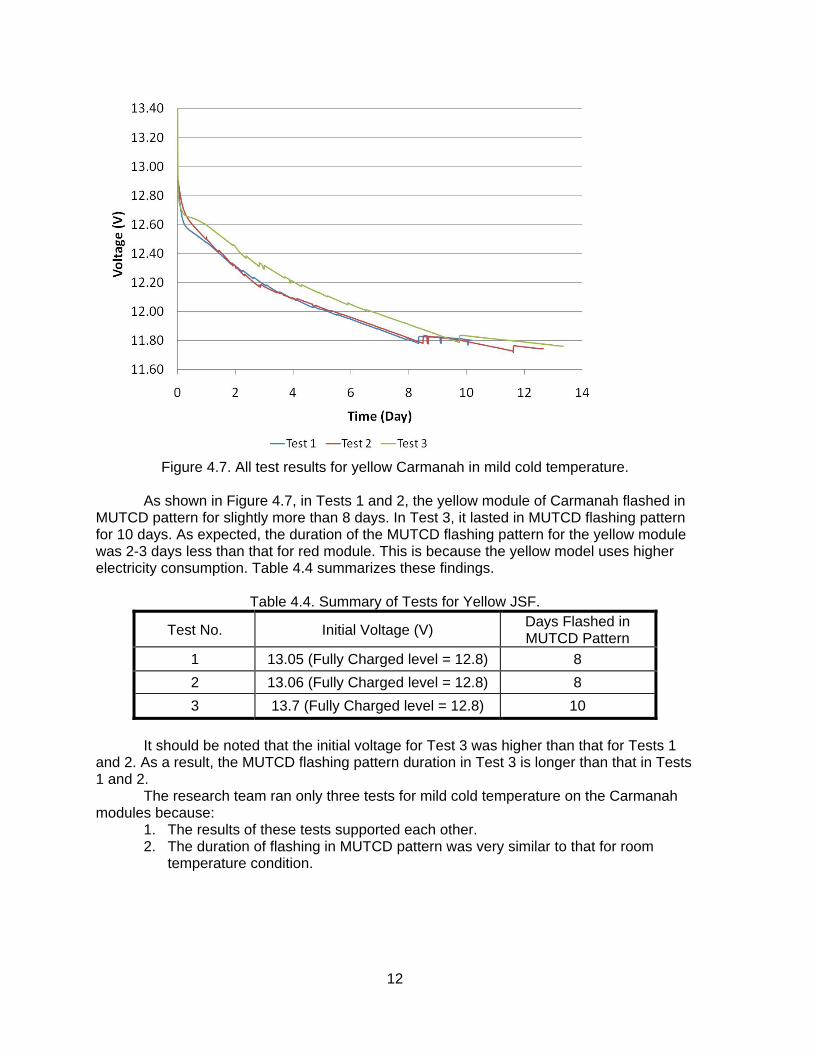
4.1.7. Carmanah Yellow Duration
A total of three tests were conducted on the yellow module of Carmanah in mild cold temperature condition (-6.6 oC). A voltage-time diagram is shown in Figure 4.7.
12
Figure 4.7. All test results for yellow Carmanah in mild cold temperature.
As shown in Figure 4.7, in Tests 1 and 2, the yellow module of Carmanah flashed in MUTCD pattern for slightly more than 8 days. In Test 3, it lasted in MUTCD flashing pattern for 10 days. As expected, the duration of the MUTCD flashing pattern for the yellow module was 2-3 days less than that for red module. This is because the yellow model uses higher electricity consumption. Table 4.4 summarizes these findings.
Table 4.4. Summary of Tests for Yellow JSF.
Test No. Initial Voltage (V) Days Flashed in MUTCD Pattern
1 13.05 (Fully Charged level = 12.8) 8
2 13.06 (Fully Charged level = 12.8) 8
3 13.7 (Fully Charged level = 12.8) 10
It should be noted that the initial voltage for Test 3 was higher than that for Tests 1
and 2. As a result, the MUTCD flashing pattern duration in Test 3 is longer than that in Tests 1 and 2. The research team ran only three tests for mild cold temperature on the Carmanah modules because:
1. The results of these tests supported each other. 2. The duration of flashing in MUTCD pattern was very similar to that for room
temperature condition.
13
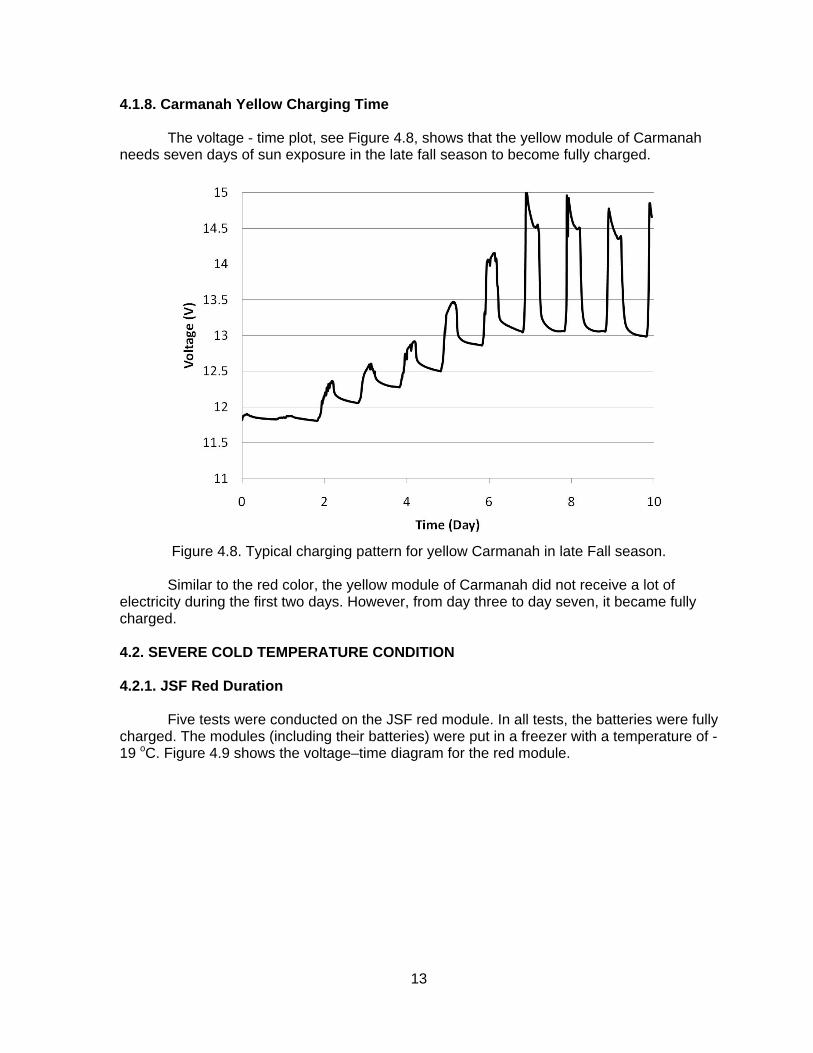
4.1.8. Carmanah Yellow Charging Time
The voltage - time plot, see Figure 4.8, shows that the yellow module of Carmanah needs seven days of sun exposure in the late fall season to become fully charged.
Figure 4.8. Typical charging pattern for yellow Carmanah in late Fall season.
Similar to the red color, the yellow module of Carmanah did not receive a lot of
electricity during the first two days. However, from day three to day seven, it became fully charged. 4.2. SEVERE COLD TEMPERATURE CONDITION 4.2.1. JSF Red Duration Five tests were conducted on the JSF red module. In all tests, the batteries were fully charged. The modules (including their batteries) were put in a freezer with a temperature of -19 oC. Figure 4.9 shows the voltage–time diagram for the red module.
14
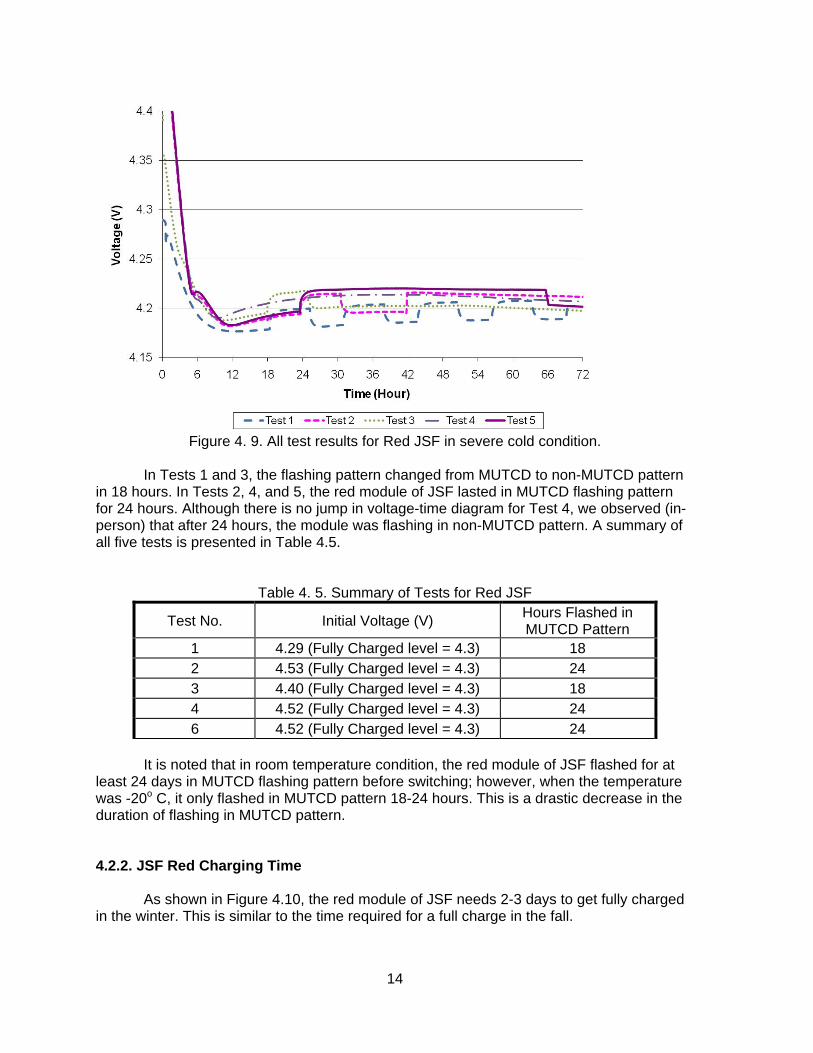
Figure 4. 9. All test results for Red JSF in severe cold condition.
In Tests 1 and 3, the flashing pattern changed from MUTCD to non-MUTCD pattern
in 18 hours. In Tests 2, 4, and 5, the red module of JSF lasted in MUTCD flashing pattern for 24 hours. Although there is no jump in voltage-time diagram for Test 4, we observed (in-person) that after 24 hours, the module was flashing in non-MUTCD pattern. A summary of all five tests is presented in Table 4.5.
Table 4. 5. Summary of Tests for Red JSF
Test No. Initial Voltage (V) Hours Flashed in MUTCD Pattern
1 4.29 (Fully Charged level = 4.3) 18 2 4.53 (Fully Charged level = 4.3) 24 3 4.40 (Fully Charged level = 4.3) 18 4 4.52 (Fully Charged level = 4.3) 24 6 4.52 (Fully Charged level = 4.3) 24
It is noted that in room temperature condition, the red module of JSF flashed for at least 24 days in MUTCD flashing pattern before switching; however, when the temperature was -20o C, it only flashed in MUTCD pattern 18-24 hours. This is a drastic decrease in the duration of flashing in MUTCD pattern. 4.2.2. JSF Red Charging Time
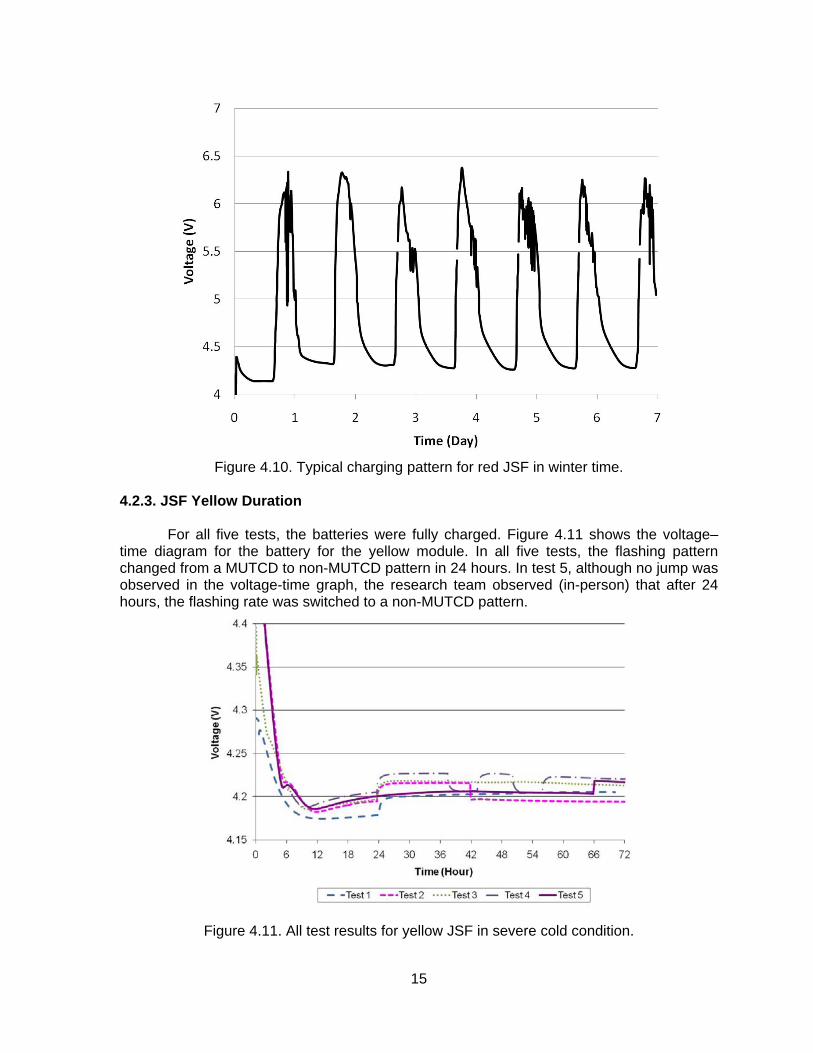
As shown in Figure 4.10, the red module of JSF needs 2-3 days to get fully charged in the winter. This is similar to the time required for a full charge in the fall.
15
Figure 4.10. Typical charging pattern for red JSF in winter time.
4.2.3. JSF Yellow Duration
For all five tests, the batteries were fully charged. Figure 4.11 shows the voltage–
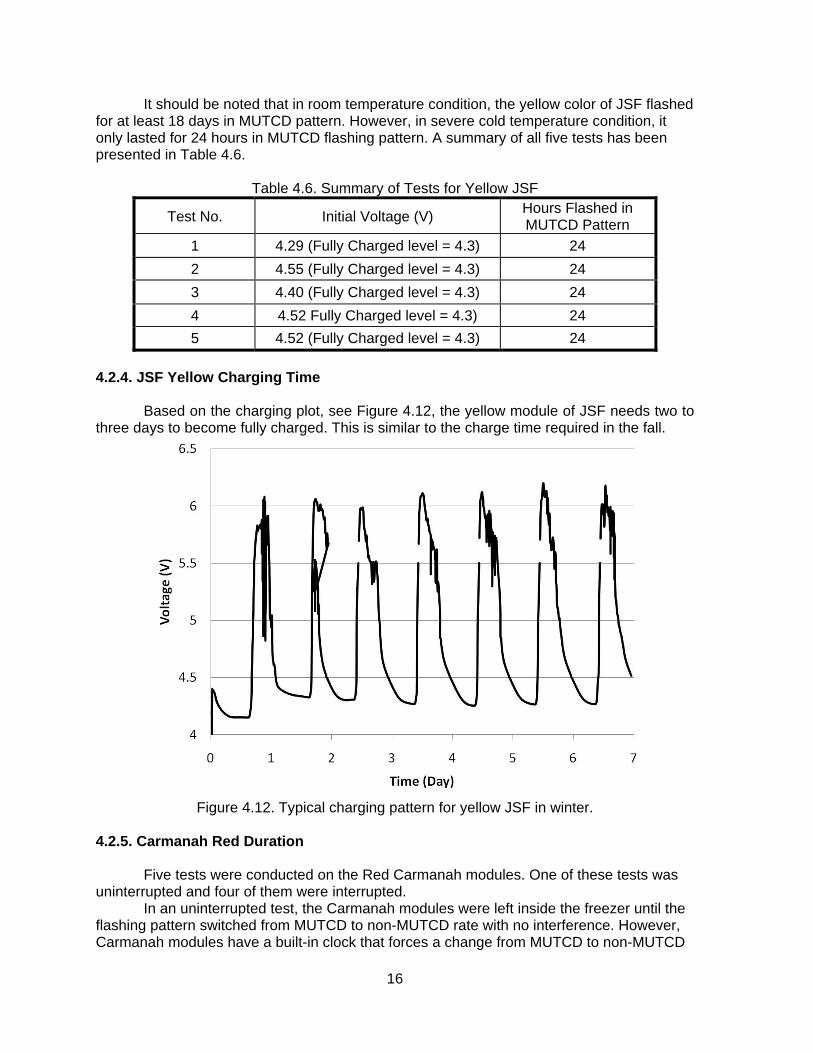
time diagram for the battery for the yellow module. In all five tests, the flashing pattern changed from a MUTCD to non-MUTCD pattern in 24 hours. In test 5, although no jump was observed in the voltage-time graph, the research team observed (in-person) that after 24 hours, the flashing rate was switched to a non-MUTCD pattern.
Figure 4.11. All test results for yellow JSF in severe cold condition.
16
It should be noted that in room temperature condition, the yellow color of JSF flashed for at least 18 days in MUTCD pattern. However, in severe cold temperature condition, it only lasted for 24 hours in MUTCD flashing pattern. A summary of all five tests has been presented in Table 4.6.
Table 4.6. Summary of Tests for Yellow JSF
Test No. Initial Voltage (V) Hours Flashed in MUTCD Pattern
1 4.29 (Fully Charged level = 4.3) 24
2 4.55 (Fully Charged level = 4.3) 24
3 4.40 (Fully Charged level = 4.3) 24
4 4.52 Fully Charged level = 4.3) 24
5 4.52 (Fully Charged level = 4.3) 24
4.2.4. JSF Yellow Charging Time
Based on the charging plot, see Figure 4.12, the yellow module of JSF needs two to three days to become fully charged. This is similar to the charge time required in the fall.
Figure 4.12. Typical charging pattern for yellow JSF in winter.
4.2.5. Carmanah Red Duration
Five tests were conducted on the Red Carmanah modules. One of these tests was
uninterrupted and four of them were interrupted. In an uninterrupted test, the Carmanah modules were left inside the freezer until the
flashing pattern switched from MUTCD to non-MUTCD rate with no interference. However, Carmanah modules have a built-in clock that forces a change from MUTCD to non-MUTCD
flashireseaflashipowe
test (beca
flashipowein MU
conddrop the roin sevlonge4.7.
ing pattern ifarch team reing pattern.
er to keep thFigure 4.1
Test 1) showuse the batt
In Test 2,ing pattern. A
er outage. InUTCD flashin
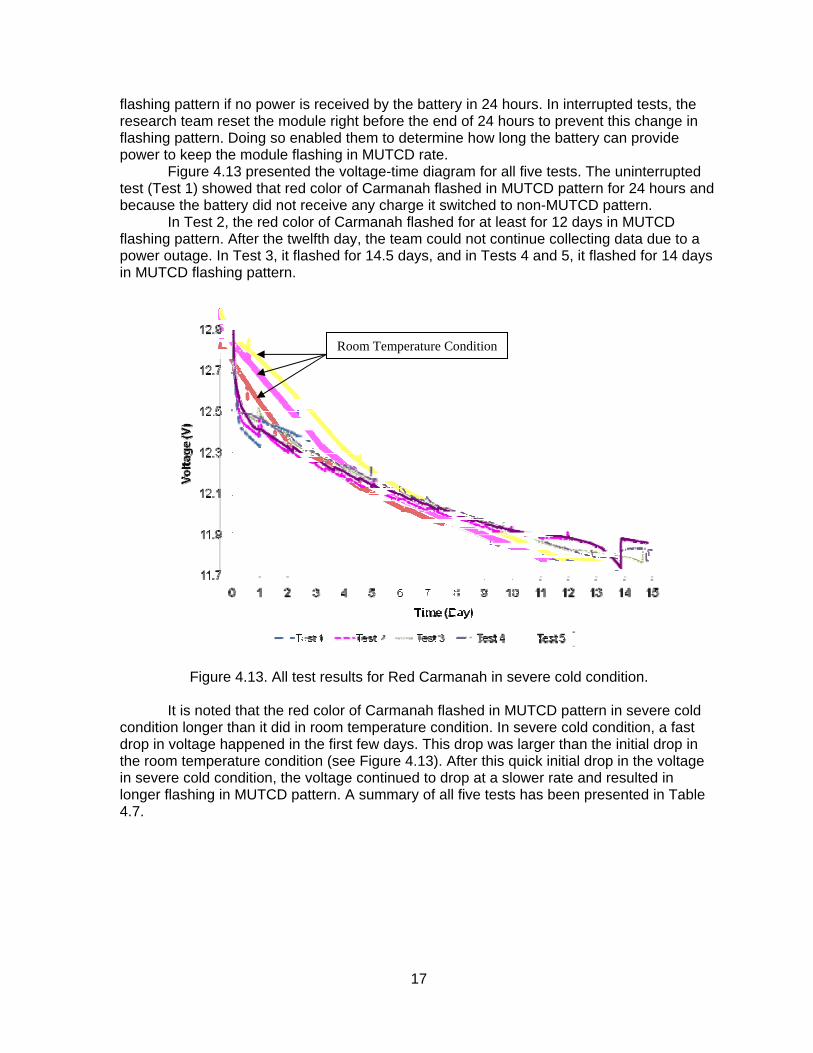
Figure It is noted
ition longer tin voltage h
oom temperavere cold coer flashing in
f no power iseset the modDoing so ene module fla13 presentedwed that redery did not r the red coloAfter the twe Test 3, it flang pattern.
e 4.13. All te
d that the redthan it did inappened in ature condit
ondition, the n MUTCD pa
s received bdule right befnabled themashing in MUd the voltage
d color of Careceive any cor of Carmanelfth day, theashed for 14
st results for
d color of Can room tempthe first few ion (see Figvoltage cont
attern. A sum
Room T
17
by the batteryfore the endto determine
UTCD rate. e-time diagrarmanah flascharge it swnah flashed e team could
4.5 days, and
r Red Carma
armanah flaserature conddays. This dure 4.13). Atinued to dro
mmary of all
Temperature Co
y in 24 hours of 24 hourse how long t
am for all fivshed in MUTwitched to no
for at least fd not continud in Tests 4
anah in seve
shed in MUTdition. In sevdrop was lar
After this quicop at a slowefive tests ha
ondition
s. In interrups to prevent tthe battery c
ve tests. TheTCD pattern f
n-MUTCD pfor 12 days iue collectingand 5, it flas
ere cold con
TCD pattern vere cold corger than theck initial droper rate and ras been pres
pted tests, ththis change
can provide
e uninterruptfor 24 hours
pattern. in MUTCD
g data due toshed for 14 d
dition.
in severe condition, a fase initial drop p in the voltaresulted in sented in Ta
he in
ted s and
o a days
old st in
age
able
18
Table 4.7. Summary of Tests for Red Carmanah
Test No. Initial Voltage (V)
Days Flashed in MUTCD Pattern
UninterruptedTest
1 13.13 (Fully Charged level = 12.8) 1
Interrupted tests
2 13.50 (Fully Charged level = 12.8) At least 12*
3 13.34 (Fully Charged level = 12.8) 14.5
4 13.34 (Fully Charged level = 12.8) 14
5 13.06 (Fully Charged level = 12.8) 14
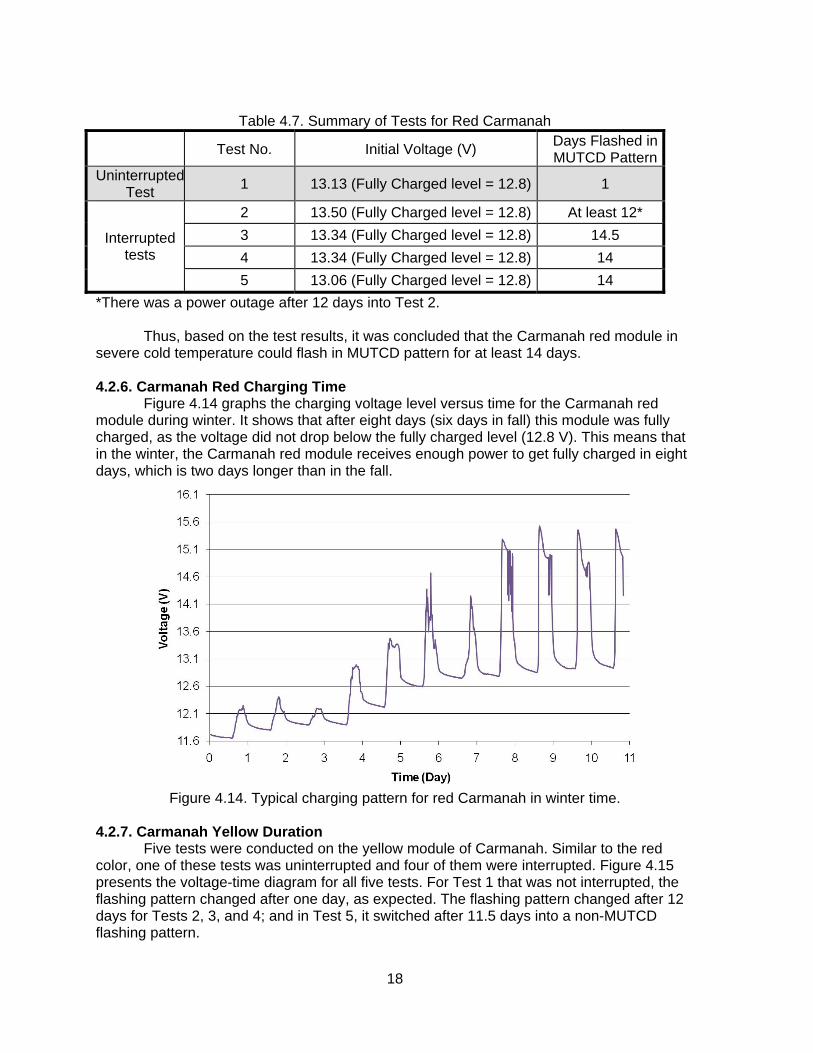
*There was a power outage after 12 days into Test 2. Thus, based on the test results, it was concluded that the Carmanah red module in severe cold temperature could flash in MUTCD pattern for at least 14 days. 4.2.6. Carmanah Red Charging Time Figure 4.14 graphs the charging voltage level versus time for the Carmanah red module during winter. It shows that after eight days (six days in fall) this module was fully charged, as the voltage did not drop below the fully charged level (12.8 V). This means that in the winter, the Carmanah red module receives enough power to get fully charged in eight days, which is two days longer than in the fall.
Figure 4.14. Typical charging pattern for red Carmanah in winter time.
4.2.7. Carmanah Yellow Duration
Five tests were conducted on the yellow module of Carmanah. Similar to the red color, one of these tests was uninterrupted and four of them were interrupted. Figure 4.15 presents the voltage-time diagram for all five tests. For Test 1 that was not interrupted, the flashing pattern changed after one day, as expected. The flashing pattern changed after 12 days for Tests 2, 3, and 4; and in Test 5, it switched after 11.5 days into a non-MUTCD flashing pattern.
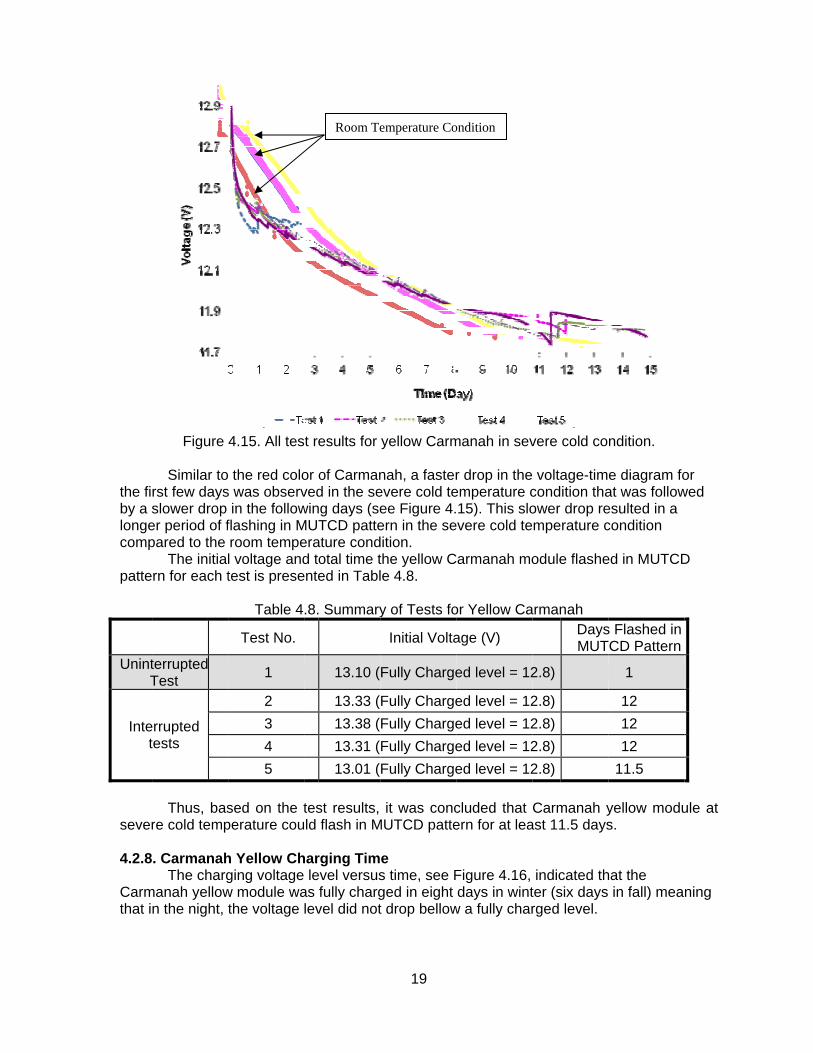
the fiby a slongecomp patte
UnintT
Intet
sever 4.2.8 Carmthat i
Figure Similar to
rst few daysslower drop er period of fpared to the
The initialrn for each t
terruptedTest
errupted tests
Thus, basre cold temp
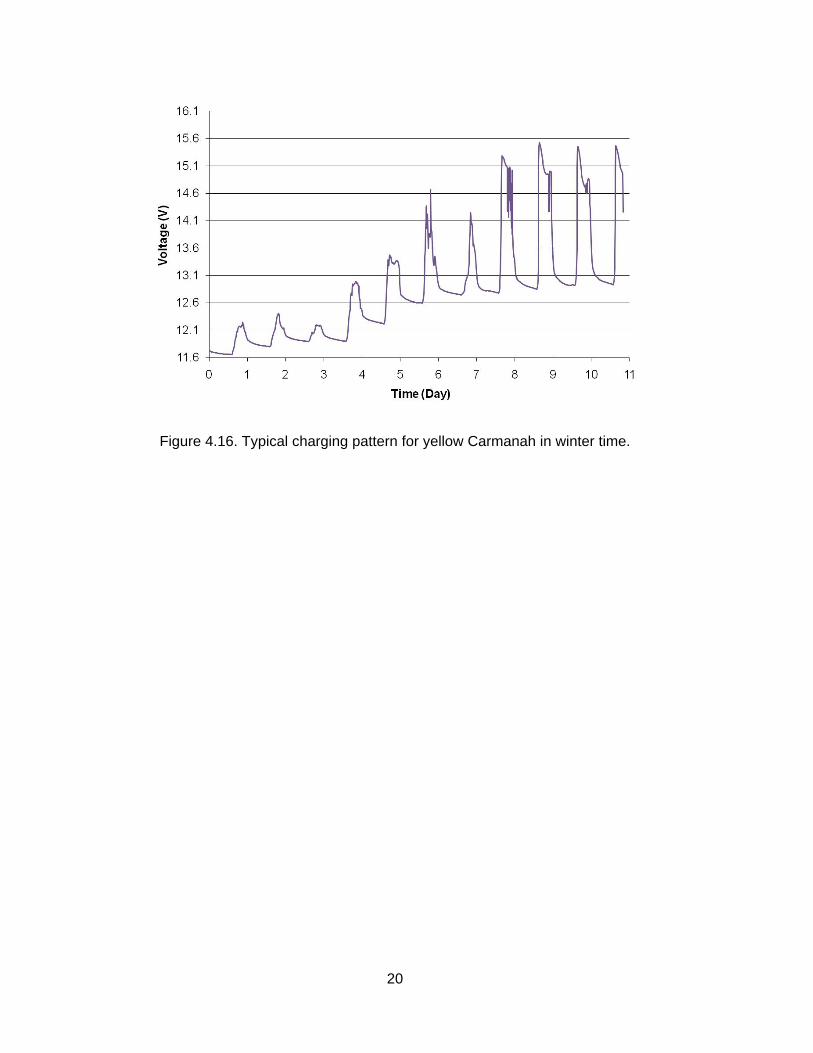
. CarmanahThe charg
manah yellown the night,
4.15. All tes
the red colos was observ
in the followflashing in Mroom tempel voltage andtest is prese
Table 4
Test No.
1
2
3
4
5
sed on the tperature cou
h Yellow Chging voltage w module wathe voltage
t results for
or of Carmanved in the sewing days (seMUTCD patteerature condd total time t
ented in Tabl
.8. Summary
13.10 (
13.33 (
13.38 (
13.31 (
13.01 (
test results,ld flash in M
harging Tim level versus
as fully charglevel did not
Room Te
19
yellow Carm
nah, a fasterevere cold teee Figure 4.ern in the sedition. the yellow Cle 4.8.
y of Tests fo
Initial Volta
Fully Charge
Fully Charge
Fully Charge
Fully Charge
Fully Charge
it was concMUTCD patte
e s time, see Fged in eight t drop bellow
emperature Co
manah in sev
r drop in theemperature c15). This slo
evere cold te
Carmanah mo
or Yellow Ca
age (V)
ed level = 12
ed level = 12
ed level = 12
ed level = 12
ed level = 12
cluded that ern for at lea
Figure 4.16, days in wint
w a fully char
ondition
vere cold co
voltage-timcondition thaower drop remperature c
odule flashe
armanah DaysMUT
2.8)
2.8)
2.8)
2.8)
2.8)
Carmanah yast 11.5 days
indicated thter (six daysrged level.
ndition.
e diagram foat was followesulted in a condition
ed in MUTCD
s Flashed in TCD Pattern
1
12
12
12
11.5
yellow modus.
hat the in fall) mea
or wed
D
ule at
ning
20
Figure 4.16. Typical charging pattern for yellow Carmanah in winter time.
21
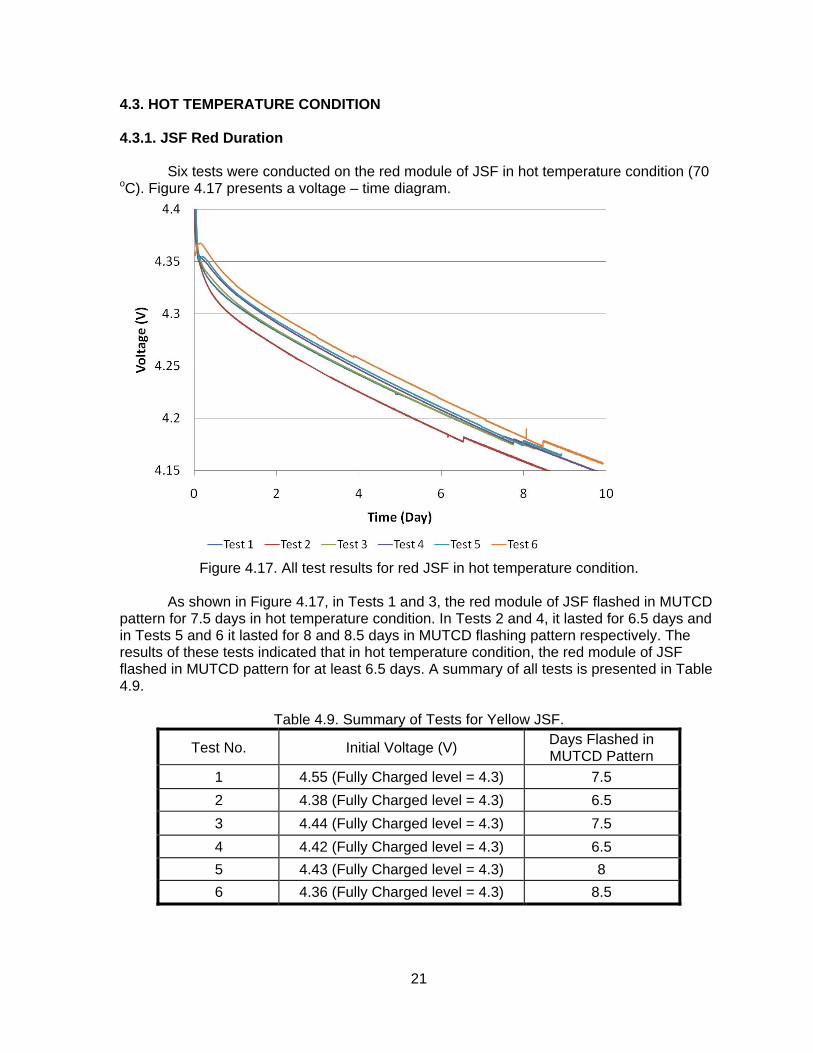
4.3. HOT TEMPERATURE CONDITION 4.3.1. JSF Red Duration
Six tests were conducted on the red module of JSF in hot temperature condition (70
oC). Figure 4.17 presents a voltage – time diagram.
Figure 4.17. All test results for red JSF in hot temperature condition.
As shown in Figure 4.17, in Tests 1 and 3, the red module of JSF flashed in MUTCD
pattern for 7.5 days in hot temperature condition. In Tests 2 and 4, it lasted for 6.5 days and in Tests 5 and 6 it lasted for 8 and 8.5 days in MUTCD flashing pattern respectively. The results of these tests indicated that in hot temperature condition, the red module of JSF flashed in MUTCD pattern for at least 6.5 days. A summary of all tests is presented in Table 4.9.
Table 4.9. Summary of Tests for Yellow JSF.
Test No. Initial Voltage (V) Days Flashed in MUTCD Pattern
1 4.55 (Fully Charged level = 4.3) 7.5
2 4.38 (Fully Charged level = 4.3) 6.5
3 4.44 (Fully Charged level = 4.3) 7.5
4 4.42 (Fully Charged level = 4.3) 6.5
5 4.43 (Fully Charged level = 4.3) 8
6 4.36 (Fully Charged level = 4.3) 8.5
22
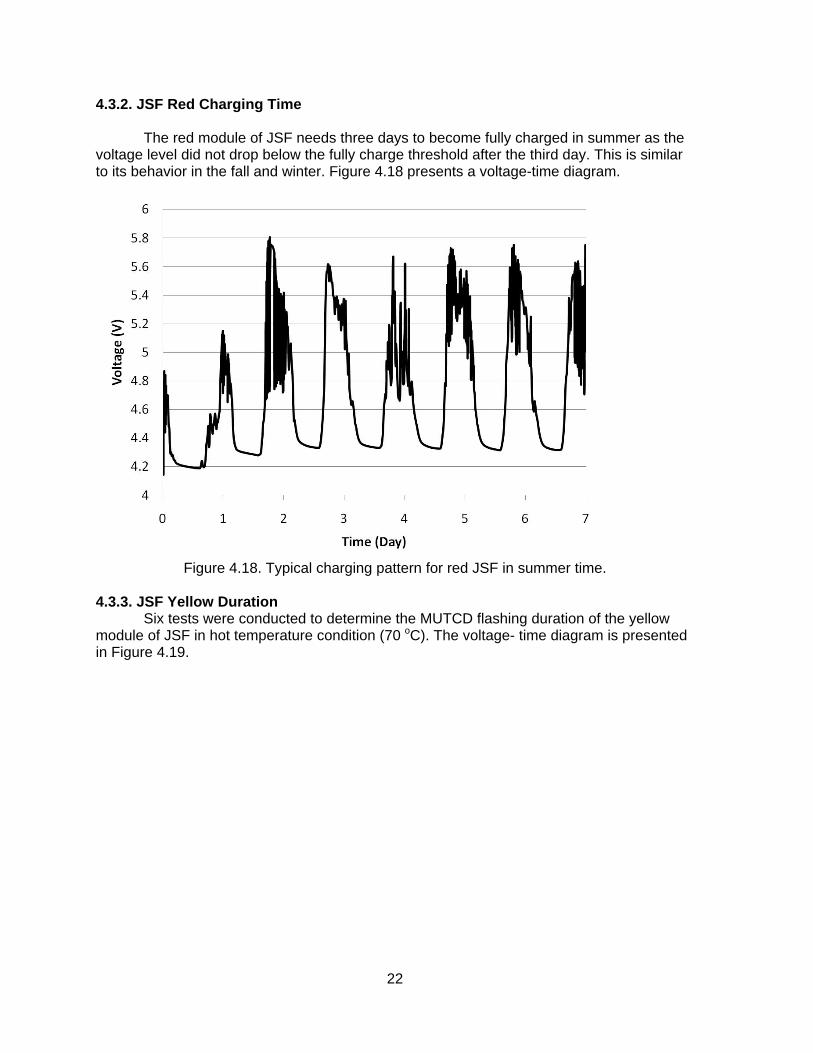
4.3.2. JSF Red Charging Time
The red module of JSF needs three days to become fully charged in summer as the voltage level did not drop below the fully charge threshold after the third day. This is similar to its behavior in the fall and winter. Figure 4.18 presents a voltage-time diagram.
Figure 4.18. Typical charging pattern for red JSF in summer time.
4.3.3. JSF Yellow Duration Six tests were conducted to determine the MUTCD flashing duration of the yellow module of JSF in hot temperature condition (70 oC). The voltage- time diagram is presented in Figure 4.19.
23
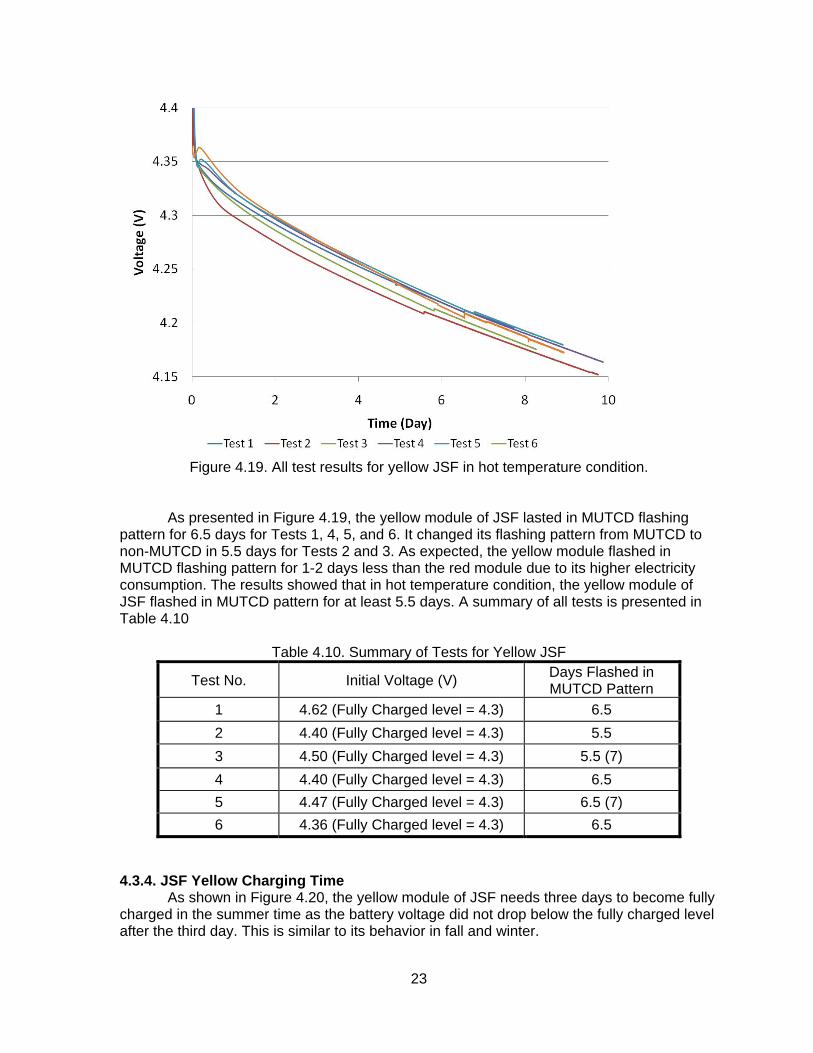
Figure 4.19. All test results for yellow JSF in hot temperature condition.
As presented in Figure 4.19, the yellow module of JSF lasted in MUTCD flashing pattern for 6.5 days for Tests 1, 4, 5, and 6. It changed its flashing pattern from MUTCD to non-MUTCD in 5.5 days for Tests 2 and 3. As expected, the yellow module flashed in MUTCD flashing pattern for 1-2 days less than the red module due to its higher electricity consumption. The results showed that in hot temperature condition, the yellow module of JSF flashed in MUTCD pattern for at least 5.5 days. A summary of all tests is presented in Table 4.10
Table 4.10. Summary of Tests for Yellow JSF
Test No. Initial Voltage (V) Days Flashed in MUTCD Pattern
1 4.62 (Fully Charged level = 4.3) 6.5
2 4.40 (Fully Charged level = 4.3) 5.5
3 4.50 (Fully Charged level = 4.3) 5.5 (7)
4 4.40 (Fully Charged level = 4.3) 6.5
5 4.47 (Fully Charged level = 4.3) 6.5 (7)
6 4.36 (Fully Charged level = 4.3) 6.5
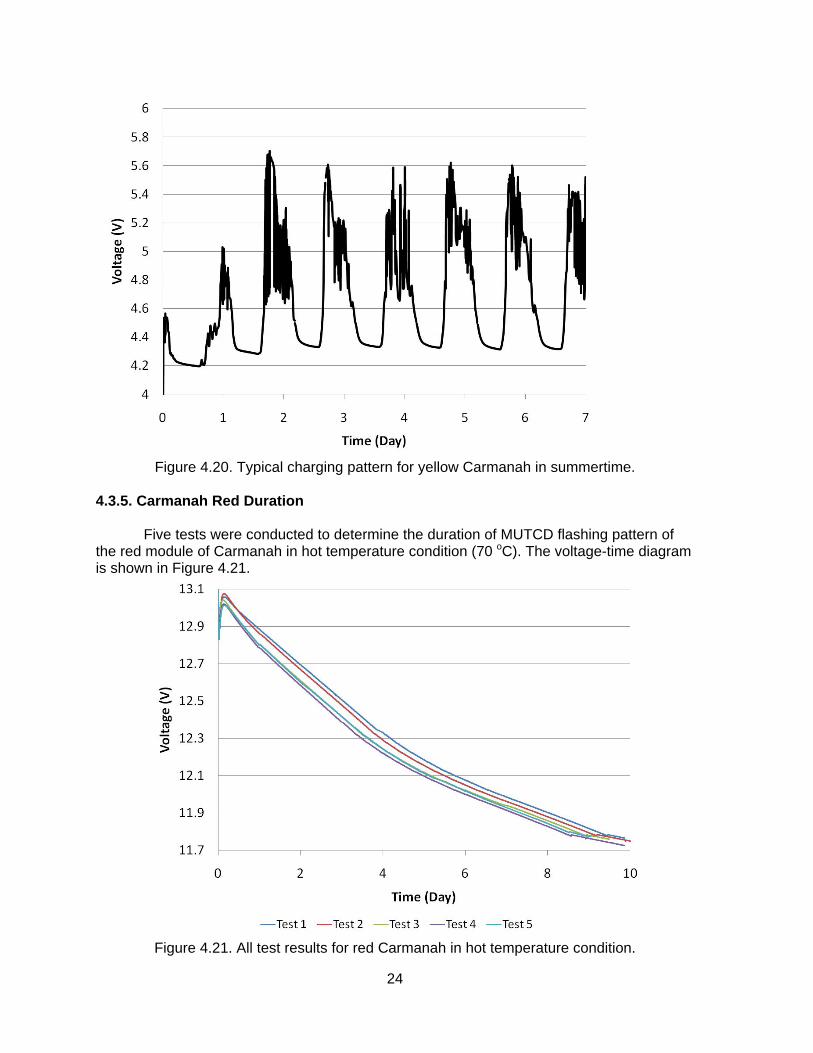
4.3.4. JSF Yellow Charging Time As shown in Figure 4.20, the yellow module of JSF needs three days to become fully charged in the summer time as the battery voltage did not drop below the fully charged level after the third day. This is similar to its behavior in fall and winter.
24
Figure 4.20. Typical charging pattern for yellow Carmanah in summertime.
4.3.5. Carmanah Red Duration Five tests were conducted to determine the duration of MUTCD flashing pattern of the red module of Carmanah in hot temperature condition (70 oC). The voltage-time diagram is shown in Figure 4.21.
Figure 4.21. All test results for red Carmanah in hot temperature condition.
25
As presented in Figure 4.21, in Test 1, the red module of Carmanah switched from MUTCD flashing pattern to non-MUTCD in 9.5 days. It flashed in MUTCD pattern for 9 days in Tests 2 and 3, and for 8.5 days in tests 4 and 5. These findings indicated that the red module of Carmanah was able to flash in MUTCD pattern for at least 8.5 days when no electricity is received from the solar panel in hot temperature condition. A summary of findings is presented in Table 4.11.
Table 4.11. Summary of Tests for Red Carmanah.
Test No. Initial Voltage (V) Days Flashed in MUTCD Pattern
1 13.37 (Fully Charged level = 4.3) 9.5 (9.4)
2 13.33 (Fully Charged level = 4.3) 9 (9.1)
3 13.16 (Fully Charged level = 4.3) 9 (8.8)
4 13.13 (Fully Charged level = 4.3) 8.5
5 13.18 (Fully Charged level = 4.3) 8.5
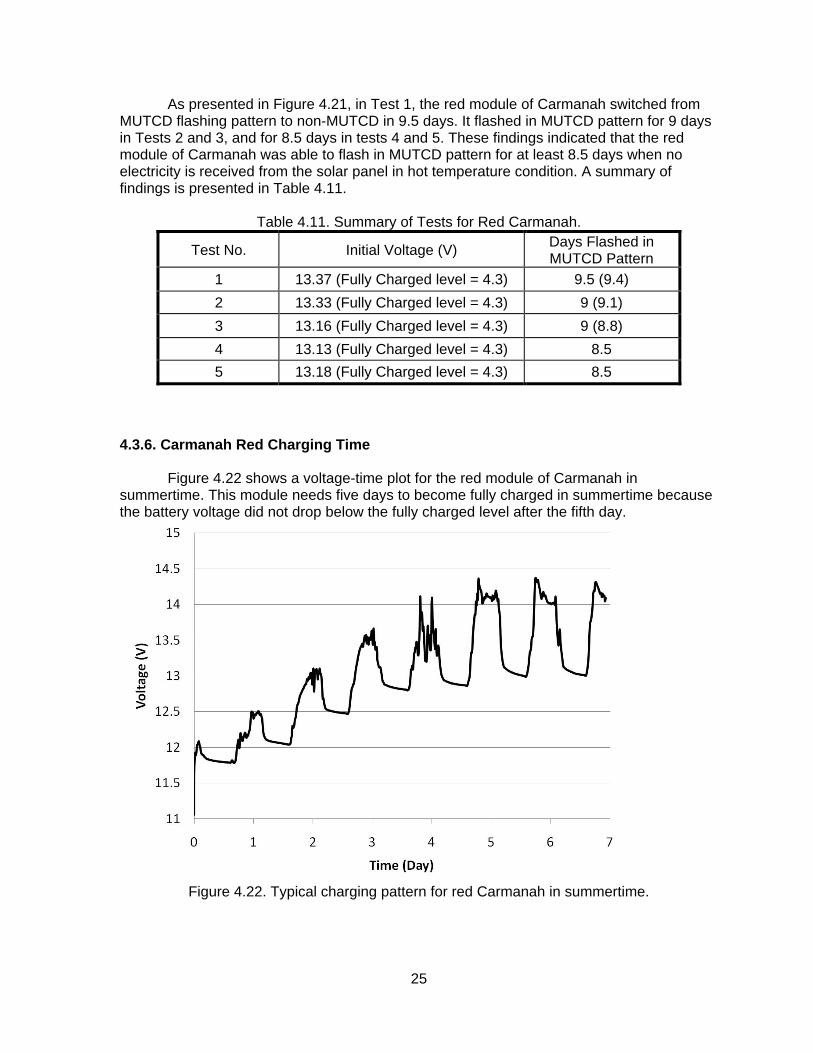
4.3.6. Carmanah Red Charging Time Figure 4.22 shows a voltage-time plot for the red module of Carmanah in summertime. This module needs five days to become fully charged in summertime because the battery voltage did not drop below the fully charged level after the fifth day.
Figure 4.22. Typical charging pattern for red Carmanah in summertime.
26
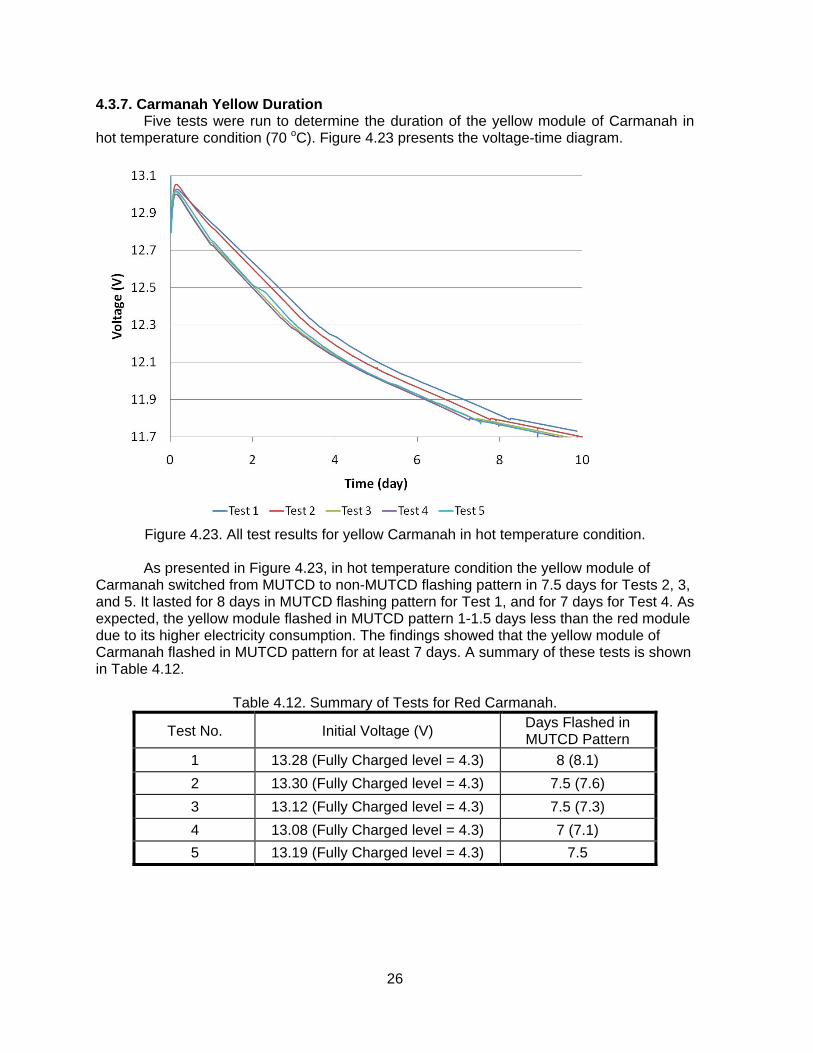
4.3.7. Carmanah Yellow Duration Five tests were run to determine the duration of the yellow module of Carmanah in hot temperature condition (70 oC). Figure 4.23 presents the voltage-time diagram.
Figure 4.23. All test results for yellow Carmanah in hot temperature condition.
As presented in Figure 4.23, in hot temperature condition the yellow module of Carmanah switched from MUTCD to non-MUTCD flashing pattern in 7.5 days for Tests 2, 3, and 5. It lasted for 8 days in MUTCD flashing pattern for Test 1, and for 7 days for Test 4. As expected, the yellow module flashed in MUTCD pattern 1-1.5 days less than the red module due to its higher electricity consumption. The findings showed that the yellow module of Carmanah flashed in MUTCD pattern for at least 7 days. A summary of these tests is shown in Table 4.12.
Table 4.12. Summary of Tests for Red Carmanah.
Test No. Initial Voltage (V) Days Flashed in MUTCD Pattern
1 13.28 (Fully Charged level = 4.3) 8 (8.1)
2 13.30 (Fully Charged level = 4.3) 7.5 (7.6)
3 13.12 (Fully Charged level = 4.3) 7.5 (7.3)
4 13.08 (Fully Charged level = 4.3) 7 (7.1)
5 13.19 (Fully Charged level = 4.3) 7.5
27
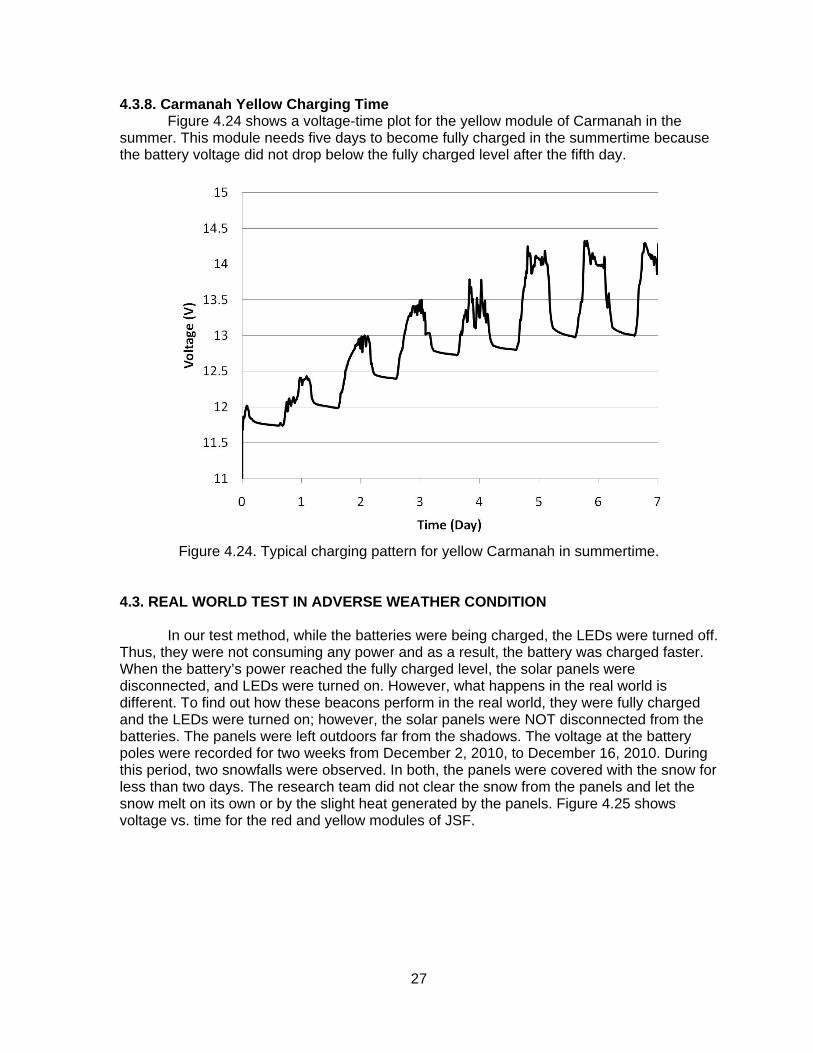
4.3.8. Carmanah Yellow Charging Time Figure 4.24 shows a voltage-time plot for the yellow module of Carmanah in the summer. This module needs five days to become fully charged in the summertime because the battery voltage did not drop below the fully charged level after the fifth day.
Figure 4.24. Typical charging pattern for yellow Carmanah in summertime.
4.3. REAL WORLD TEST IN ADVERSE WEATHER CONDITION
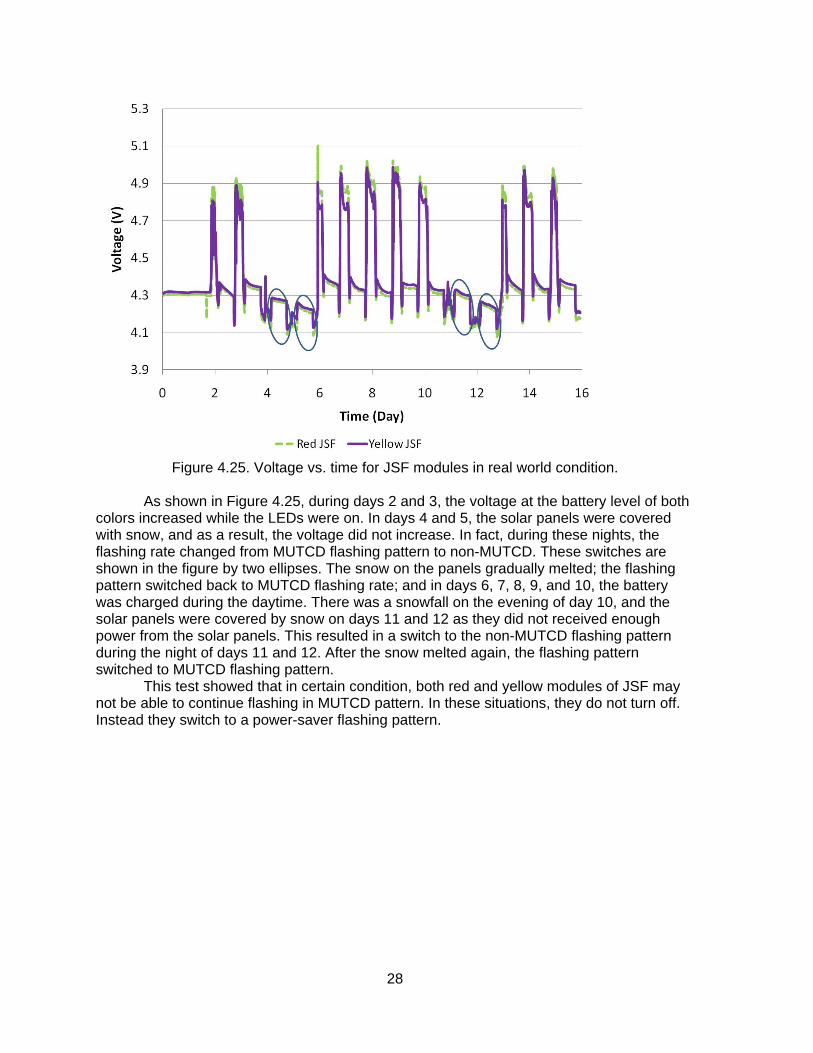
In our test method, while the batteries were being charged, the LEDs were turned off. Thus, they were not consuming any power and as a result, the battery was charged faster. When the battery’s power reached the fully charged level, the solar panels were disconnected, and LEDs were turned on. However, what happens in the real world is different. To find out how these beacons perform in the real world, they were fully charged and the LEDs were turned on; however, the solar panels were NOT disconnected from the batteries. The panels were left outdoors far from the shadows. The voltage at the battery poles were recorded for two weeks from December 2, 2010, to December 16, 2010. During this period, two snowfalls were observed. In both, the panels were covered with the snow for less than two days. The research team did not clear the snow from the panels and let the snow melt on its own or by the slight heat generated by the panels. Figure 4.25 shows voltage vs. time for the red and yellow modules of JSF.
28
Figure 4.25. Voltage vs. time for JSF modules in real world condition.
As shown in Figure 4.25, during days 2 and 3, the voltage at the battery level of both colors increased while the LEDs were on. In days 4 and 5, the solar panels were covered with snow, and as a result, the voltage did not increase. In fact, during these nights, the flashing rate changed from MUTCD flashing pattern to non-MUTCD. These switches are shown in the figure by two ellipses. The snow on the panels gradually melted; the flashing pattern switched back to MUTCD flashing rate; and in days 6, 7, 8, 9, and 10, the battery was charged during the daytime. There was a snowfall on the evening of day 10, and the solar panels were covered by snow on days 11 and 12 as they did not received enough power from the solar panels. This resulted in a switch to the non-MUTCD flashing pattern during the night of days 11 and 12. After the snow melted again, the flashing pattern switched to MUTCD flashing pattern. This test showed that in certain condition, both red and yellow modules of JSF may not be able to continue flashing in MUTCD pattern. In these situations, they do not turn off. Instead they switch to a power-saver flashing pattern.
29
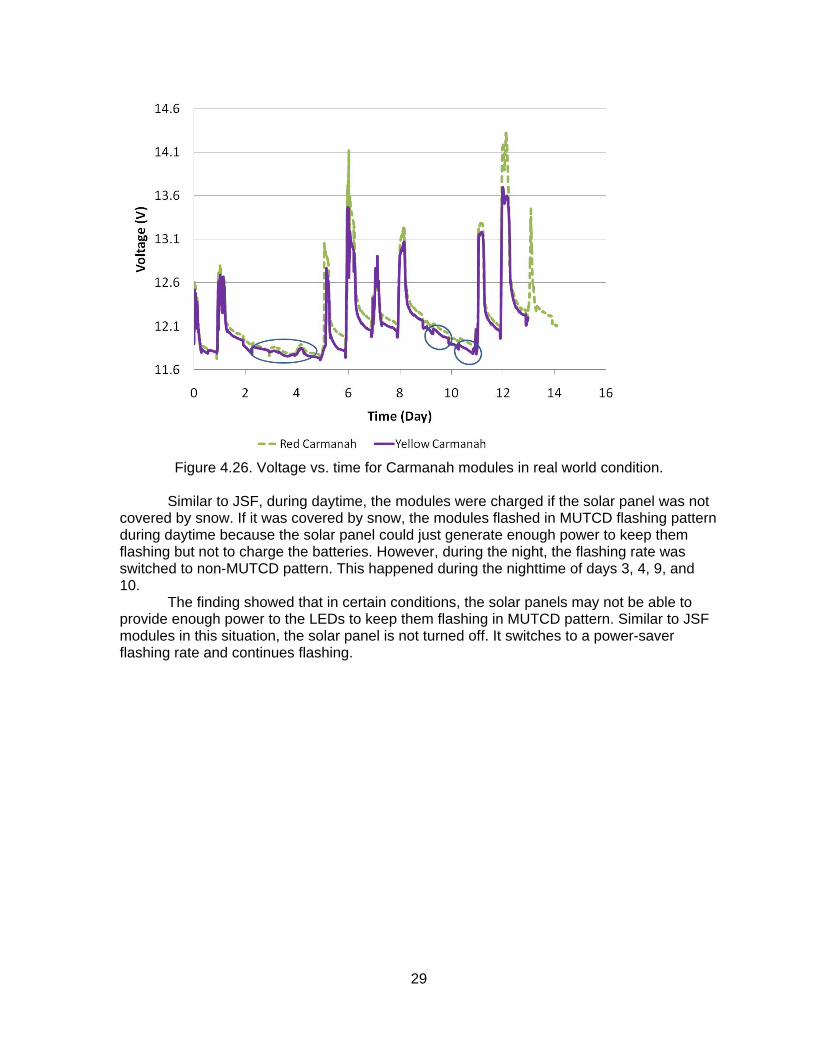
Figure 4.26. Voltage vs. time for Carmanah modules in real world condition.
Similar to JSF, during daytime, the modules were charged if the solar panel was not
covered by snow. If it was covered by snow, the modules flashed in MUTCD flashing pattern during daytime because the solar panel could just generate enough power to keep them flashing but not to charge the batteries. However, during the night, the flashing rate was switched to non-MUTCD pattern. This happened during the nighttime of days 3, 4, 9, and 10. The finding showed that in certain conditions, the solar panels may not be able to provide enough power to the LEDs to keep them flashing in MUTCD pattern. Similar to JSF modules in this situation, the solar panel is not turned off. It switches to a power-saver flashing rate and continues flashing.
30
4.4. INTENISTY MEASUREMENTS
The flashing beacons’ output light intensities reported in the first report of this study, “Evaluation of Performance of Solar Powered Flashing Beacons at Room Temperature Conditions,” were measured inside the lab when the solar panels were disconnected from the batteries. When the solar panels are disconnected, the output light intensity might be reduced by an internal logic to extend the battery life. To find out whether or not this was the case, the output light intensity of all modules were measured inside the lab when the solar panels were connected, and again when they were disconnected. Similarly, the intensity measurements were taken when the modules were outside of the lab (batteries connected and disconnected).
4.4.1. JSF Modules
The average light intensity for the red module of JSF in the lab when the solar panels
were connected was 29.17 ft-candles (average of 37 measurements). Disconnecting the solar panels from the battery did not change the light intensity, as it was 29.17 ft-candle (average of 37 measurements). For the yellow module of JSF, the light intensity was 37.33 ft-candle (average of 33 measurements) when it was inside the lab and solar panels were connected to the battery. When the solar panels were disconnected, the light intensity was 36.17 ft-candles (average of 27 measurements). Thus, it was concluded that when the modules are indoors, the output light intensity remains the same regardless of solar panels being connected or disconnected.
When the red and yellow modules were taken outdoors (outside of the lab) and solar panels were disconnected from the batteries, the measured light intensities were similar to the indoors measurements. However, when the solar panels were connected to the batteries, the light intensities significantly increased to 251.25 ft-candles (average of 96 measurements taken over 3 days) for red, and to 302.56 ft-candles (average of 106 measurements taken over 3 days) for the yellow module of JSF. Thus, the light intensity when the JSF modules are outdoors and the solar panels are connected to the batteries is about 8-9 times greater than when the solar panels are disconnected.
4.4.2. Carmanah Modules
As presented in the previous report titled “Evaluation of Performance of Solar
Powered Flashing Beacons at Room Temperature Conditions, FHWA-ICT-10-069,” the output light intensity of the red module of Carmanah, when it was inside the lab with solar panels disconnected from the batteries, ranged from 20 to 100 ft-candles depending on the voltage level of the battery. To determine if the output light intensity changes when the solar panels are connected and disconnected, we measured the light intensities for both conditions. When the red module was inside the lab with solar panels connected to the batteries, the output light intensity was 21.67 ft-candles (average of 10 measurements). Disconnecting the solar panels did not significantly change the output light intensity as it was 21.62 ft-candles (average of 10 measurements). This indicates that inside the lab, the light intensity of the red module of Carmanah does not change by connecting or disconnecting the solar panels.
For the yellow module the light intensity ranged from 40 to 160 ft-candles as presented in the previous report. When the solar panels were connected to the yellow module of Carmanah inside the lab, the output light intensity was 40.2 ft-candles (average of 10 measurements). Disconnecting them did not significantly change the light intensity as it was 40.17 ft-candles (average of 10 measurements). This indicates that the output light
31
intensity of the yellow module of Carmanah does not change by connecting and disconnecting the solar panels from the batteries when the module is inside the lab (similar to red).
When the red and yellow modules were taken outdoors (outside of the lab) and solar panels were disconnected from the batteries, the measured light intensities were similar to the indoors measurements. However when the red module of Carmanah was outdoors with solar panels connected to the battery, the output light intensity was 180 ft-candle (average of 111 measurements taken over 3 days). The reason the intensity was high is because the voltage of the battery was high (about 15 volts outdoors compared to about 13 volts indoors) when solar panel was connected outdoors. Similarly, when the yellow module was outdoors with solar panels connected, the light intensity was 184 ft-candles (average of 109 measurements taken over 3 days). The reason for higher intensity when solar panels were connected is the higher voltage.
4.5. VISIBILITY OF THE BEACONS
This project did not include a comprehensive visibility study for the flashing beacons.
However, the research team wanted to know approximately how far the lights were visible to young observers (graduate students) in daytime. To estimate the distance that the modules could clearly be seen in the field, all four fully charged modules were put outdoors and were flashing for two days under the sunlight with solar panels connected to the battery. Then, they were placed at the roadside on a sunny day at 2:00 p.m. (trying to create a situation normally seen by drivers). Two graduate research assistants looked at the modules at different distances. The longest distance used was 1500 ft. The red modules of JSF and Carmanah were easily visible from a distance of at least 1500 ft. The yellow modules were visible up to a distance of about 1000 ft. When the distance became more than 1000 ft, they were hardly visible. These distances are much longer than the stopping sight distance of 645 ft for a 65 mph design speed.
If solar panels are accidently disconnected when the modules are outdoors and batteries are fully charged, the light intensity for JSF and Carmanah modules drops and consequently the visibility will reduce. Under this condition and on a day that was cloudy but still bright, the red and yellow modules of JSF were easily visible up to a distance of 700 ft. The reason for this drop in visibility distance is that the solar panels were disconnected. However, when the solar panels were connected the modules, they were again visible from a distance of at least 1500 ft. Carmanah modules are expected to be visible at least at 700 ft when solar panels are disconnected because the light intensity of Carmanah models would be greater than that of JSF modules.
32
5. CONCLUSIONS
This report contains the results of 34 tests for JSF and 26 tests for Carmanah solar powered flashing beacons operating in mild cold temperature (-6.6 oC), severe cold temperature (-20 oC), and hot temperature (+70 oC) conditions. In addition, it contains two tests for JSF modules and two for Carmanah operating under “real world” conditions.
In mild temperature condition, red and yellow modules of JSF flashed in MUTCD pattern for at least 11 and 8.5 days, respectively. The red and yellow modules of Carmanah flashed in MUTCD pattern for at least 11 and 8 days, respectively.
Reducing the temperature to -20 0C resulted in a significant decrease in the duration of flashing in MUTCD pattern for JSF modules; however, that duration did not decrease for Carmanah. Red and yellow modules of JSF flashed in MUTCD pattern for at least 18 and 24 hours in severe cold temperature condition. For Carmanah, the red and yellow modules lasted in MUTCD flashing pattern for at least 14 and 11.5 days, respectively.
In hot temperature condition, red and yellow modules of JSF flashed in MUTCD pattern for at least 6.5 and 5.5 days, respectively. The red and yellow modules of Carmanah lasted in MUTCD pattern for at least 8.5 and 7 days, respectively.
The “real world” condition test indicated that in certain conditions (e.g. solar panels covered with snow), the solar panels may not be able to generate enough power for the LEDs to keep them flashing in MUTCD pattern. In this condition, the flashing pattern changes to a power saver mode.
The red modules of JSF and Carmanah were visible when the distance was at least 1500 ft in a sunny and very bright day. The yellow modules of JSF and Carmanah were visible up to a distance of about 1000 ft in the same day. If solar panels are accidently disconnected when the modules are outdoors and batteries are fully charged, the JSF and Carmanah modules were visible at a distance of 700 ft, in a cloudy but bright day,
33
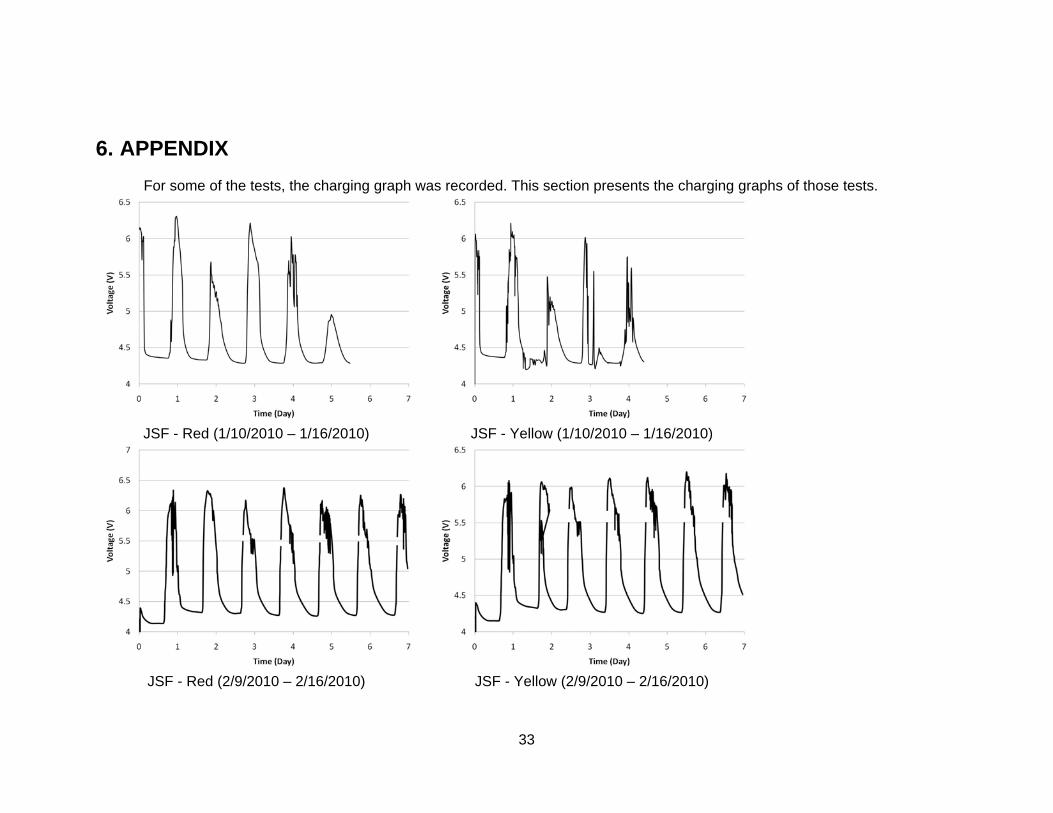
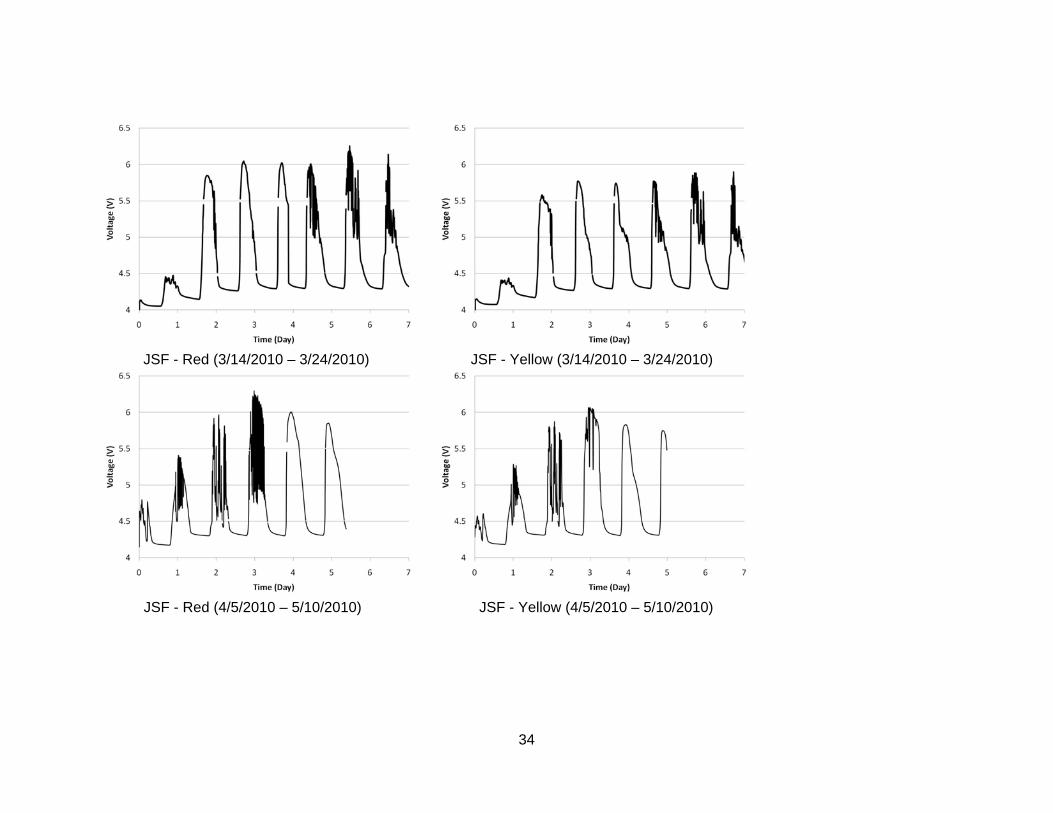
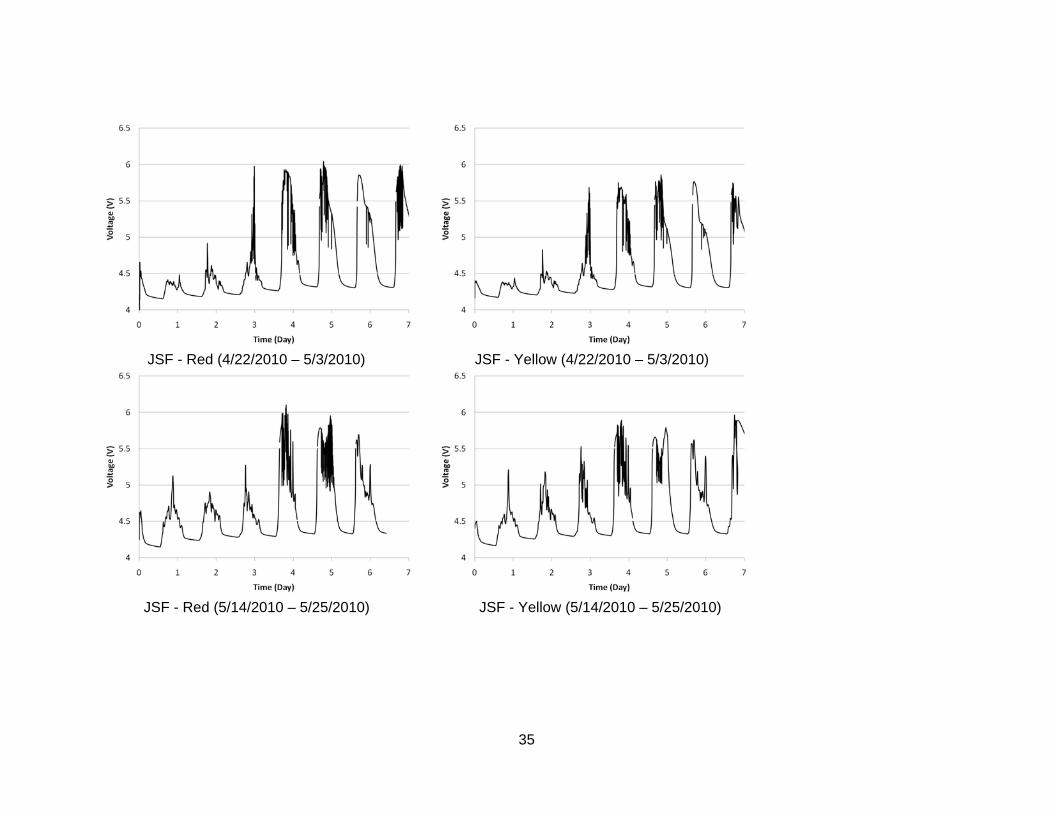
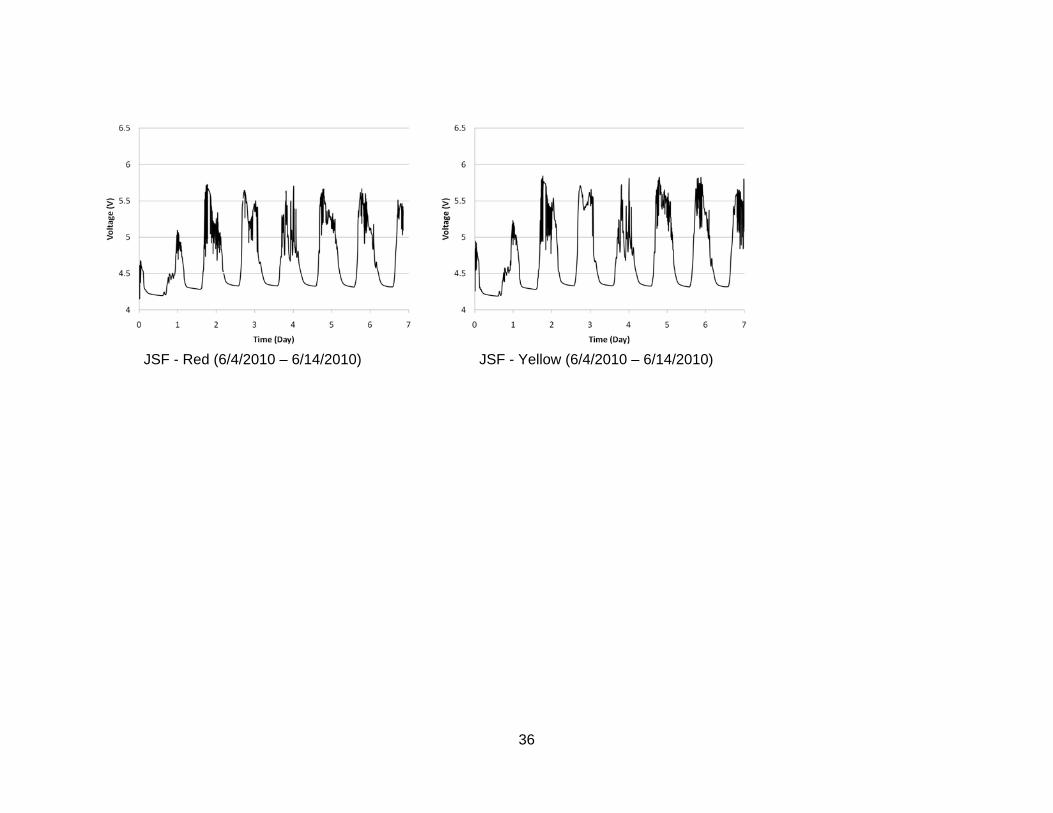
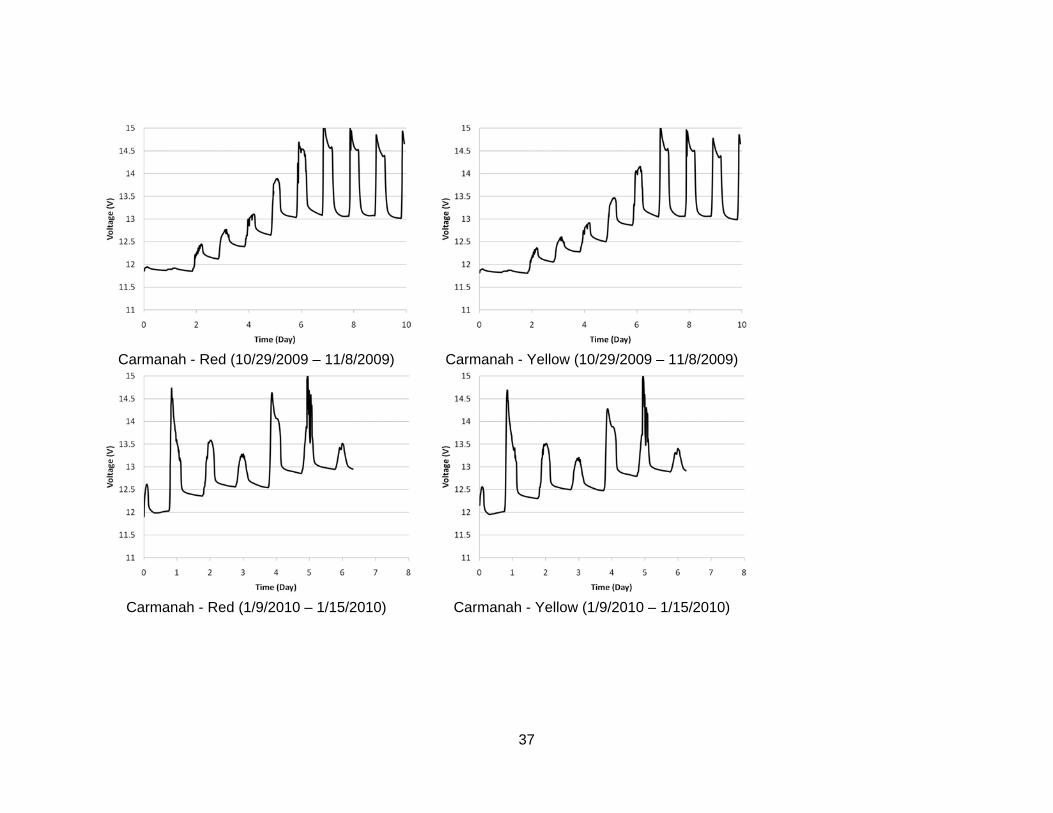
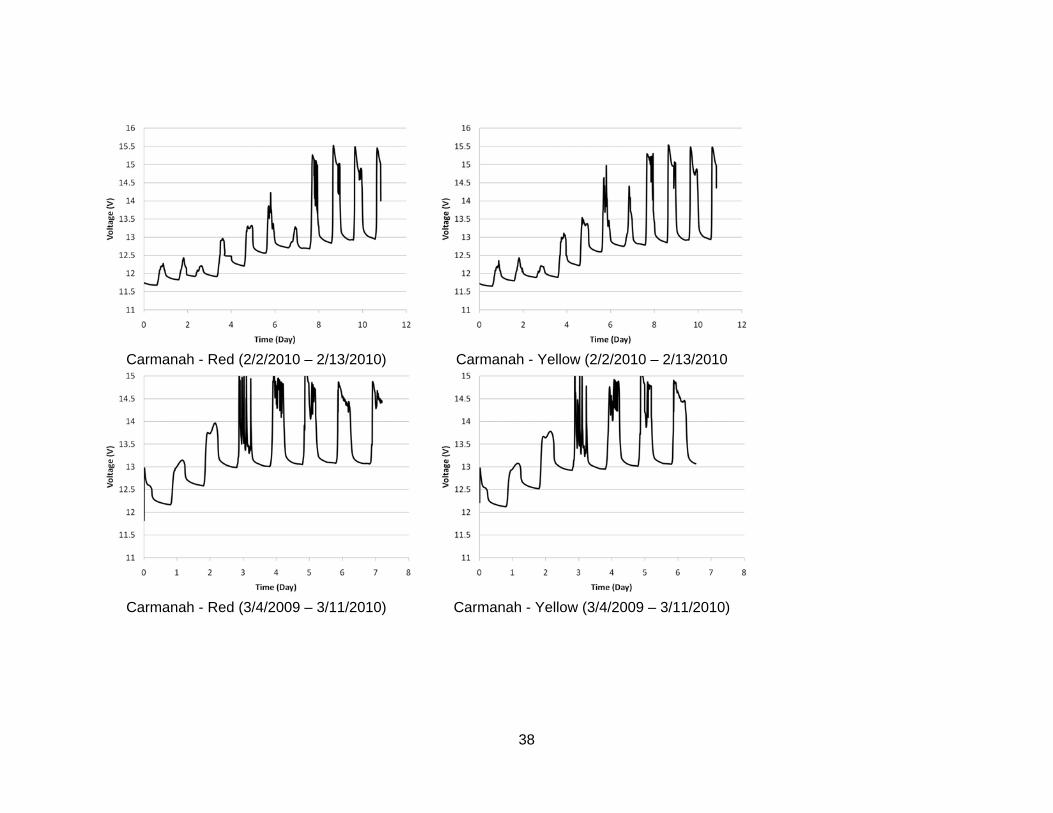
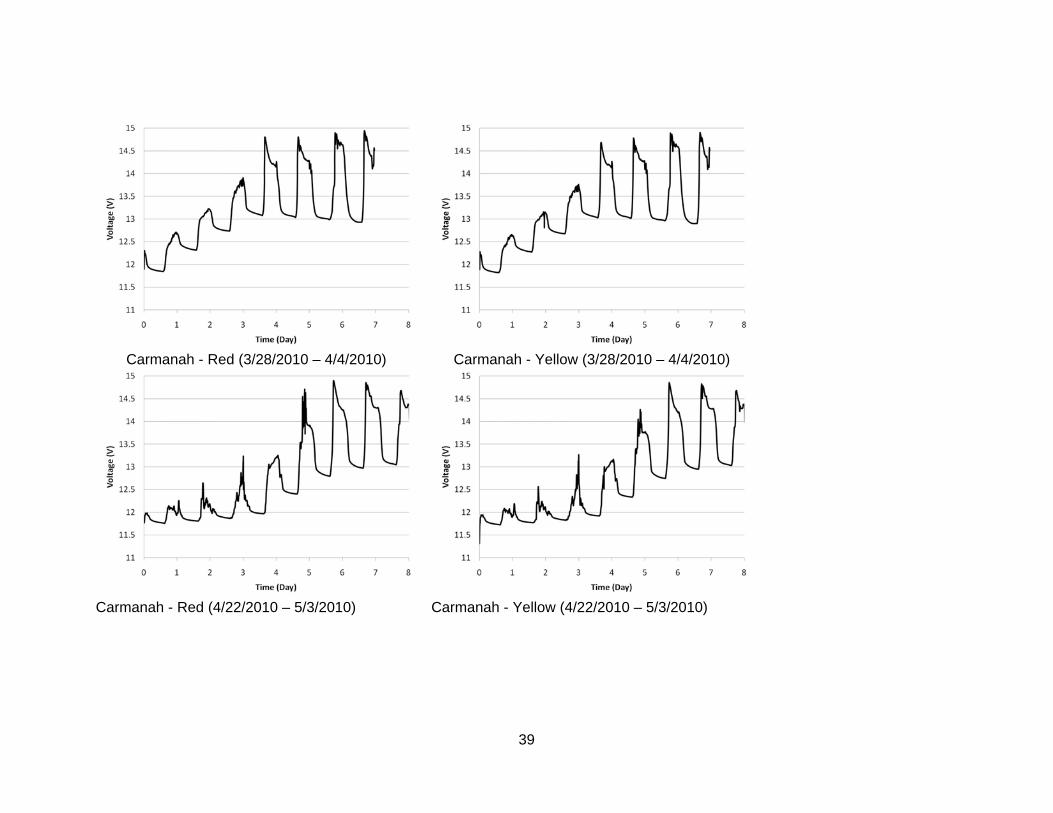
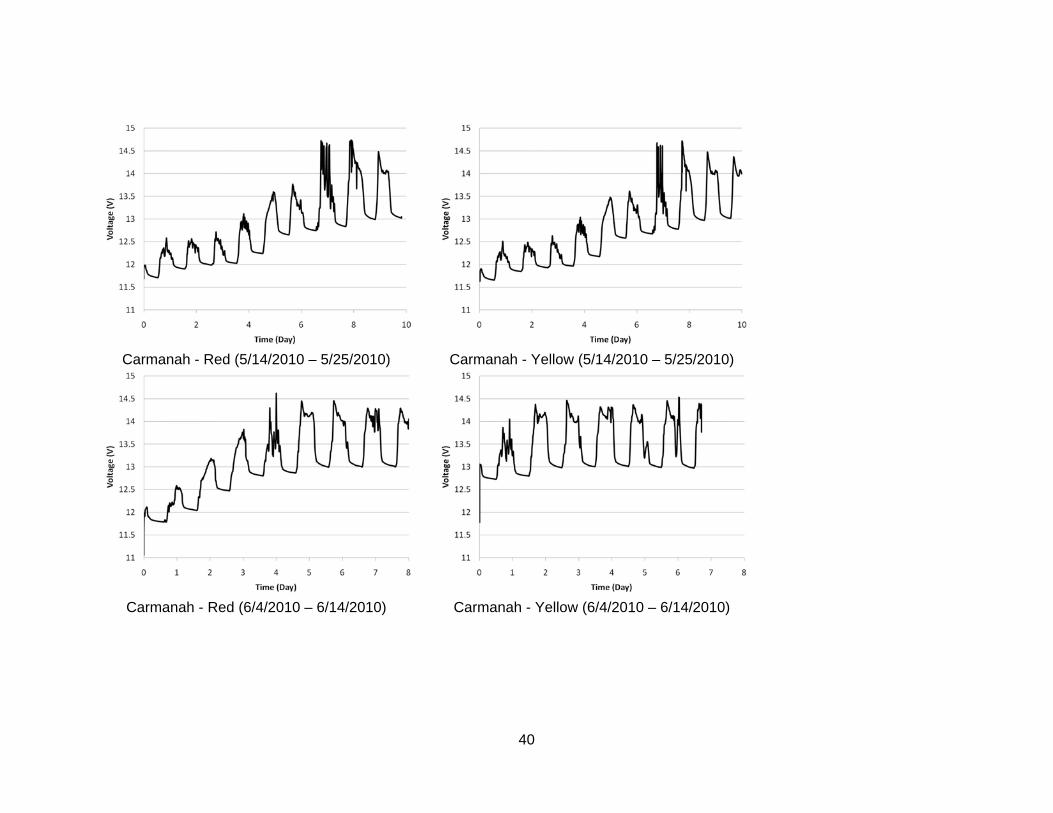
6. APPENDIX For some of the tests, the charging graph was recorded. This section presents the charging graphs of those tests.
JSF - Red (1/10/2010 – 1/16/2010) JSF - Yellow (1/10/2010 – 1/16/2010)
JSF - Red (2/9/2010 – 2/16/2010) JSF - Yellow (2/9/2010 – 2/16/2010)
34
JSF - Red (3/14/2010 – 3/24/2010) JSF - Yellow (3/14/2010 – 3/24/2010)
JSF - Red (4/5/2010 – 5/10/2010) JSF - Yellow (4/5/2010 – 5/10/2010)
35
JSF - Red (4/22/2010 – 5/3/2010) JSF - Yellow (4/22/2010 – 5/3/2010)
JSF - Red (5/14/2010 – 5/25/2010) JSF - Yellow (5/14/2010 – 5/25/2010)
36
JSF - Red (6/4/2010 – 6/14/2010) JSF - Yellow (6/4/2010 – 6/14/2010)
37
Carmanah - Red (10/29/2009 – 11/8/2009) Carmanah - Yellow (10/29/2009 – 11/8/2009)
Carmanah - Red (1/9/2010 – 1/15/2010) Carmanah - Yellow (1/9/2010 – 1/15/2010)
38
Carmanah - Red (2/2/2010 – 2/13/2010) Carmanah - Yellow (2/2/2010 – 2/13/2010
Carmanah - Red (3/4/2009 – 3/11/2010) Carmanah - Yellow (3/4/2009 – 3/11/2010)
39
Carmanah - Red (3/28/2010 – 4/4/2010) Carmanah - Yellow (3/28/2010 – 4/4/2010)
Carmanah - Red (4/22/2010 – 5/3/2010) Carmanah - Yellow (4/22/2010 – 5/3/2010)
40
Carmanah - Red (5/14/2010 – 5/25/2010) Carmanah - Yellow (5/14/2010 – 5/25/2010)
Carmanah - Red (6/4/2010 – 6/14/2010) Carmanah - Yellow (6/4/2010 – 6/14/2010)