Embed Size (px)
Citation preview
1
Evaluation of Ohio’s Program of All Inclusive Care for the Elderly (PACE)
SHAHLA MEHDIZADEH ROBERT APPLEBAUM SUZANNE KUNKEL PATRICIA FAUST August 2012

2

This report was funded by a grant from the Ohio Department of Aging.
Evaluation of Ohio’s Program of All Inclusive Care for the Elderly (PACE)
Shahla Mehdizadeh Robert Applebaum
Suzanne Kunkel Patricia Faust
Scripps Gerontology Center Miami University
August 2012


TABLE OF CONTENTS Acknowledgments .......................................................................................................................... i
Executive Summary ...................................................................................................................... ii
Background for the Study ............................................................................................................ 1
Previous Evaluations of PACE ................................................................................................... 3 Research Design and Results ....................................................................................................... 4
Research Question 1 - How does PACE Operate? ..................................................................... 5 Methods................................................................................................................................... 5 Results: Description of PACE ............................................................................................... 5 PACE Participant Characteristics ........................................................................................... 8 PACE Costs and Utilization ................................................................................................. 10 PACE Comparison to Ohio Long-Term Care Medicaid Programs ...................................... 12 National PACE Comparisons ............................................................................................... 13
Research Question 2 - Is the program effective in terms of costs and outcomes? .................... 16 Study Design ......................................................................................................................... 16 Study Participants and Data Sources .................................................................................... 17 Medical Complexity.............................................................................................................. 22 Results of the Outcomes Analysis ........................................................................................ 25
Research Question 3 - How Can PACE be Improved? ............................................................. 37 References .................................................................................................................................... 44
Appendix A .................................................................................................................................. 46
Appendix B .................................................................................................................................. 51


i
ACKNOWLEDGMENTS
There are many people who helped to make this report possible. First we would like to thank the many dedicated staff members of Ohio’s two PACE sites. At both locations staff provided us with critical information and important insights about PACE. In particular, Brett Kirkpatrick and Lori Aronson at SeniorLink and Rob Hilton and Tangi McCoy at McGregor PACE responded to our detailed requests in a timely and effective manner. We also appreciate the support of Gayle Lee at the Ohio Department of Aging, who provided important background information about PACE and assisted us in getting some additional records data. From the Ohio Department of Job and Family Services, Brooke Trisel was superb in getting us the necessary Medicaid data, and Karen Langer-Gault provided some important history about PACE. We acknowledge our important collaboration with the University of Cincinnati, Office of Geriatric Medicine. Drs. Gregg Warshaw and Elizabeth Bragg conducted our medical complexity analysis, providing us with important findings for the study. At the Scripps Gerontology Center we would like to thank Lisa Grant, who ably produced this document. It is our hope that the results of this study can help Ohio to better meet the needs of older people requiring assistance with long-term services and supports.

ii
EXECUTIVE SUMMARY
The Program of All-Inclusive Care for the Elderly (PACE) combines in one organization the provision and management of acute care services funded typically by Medicare with long-term services usually paid for by Medicaid. Designed for individuals age 55 and older who are determined to be nursing home eligible under Medicaid, the program is responsible for an array of long-term services including adult day health services, personal care and home health services, transportation, meals, and nursing home care, as well as a range of health related services, such as physician care, inpatient hospital, prescription drugs, occupational and physical therapies, and nursing. In exchange for a monthly capitated payment from Medicaid and, in most instances, Medicare, the PACE provider organization assumes full financial risk for participant care. PACE is one of the few programs in the U.S. that has as its goal to fully integrate acute and long-term services for older consumers.
In the 2012/2013 budget the General Assembly requested that the Scripps Gerontology
Center, Miami University, conduct an evaluation of Ohio’s two PACE sites. The research and policy question for this study is whether the PACE model should be expanded to other sites across the state, and if so what modifications should be made to the program in preparation for an expansion? The evaluation addresses three primary areas: (1) How does PACE operate? (2) Is the program effective in terms of costs and outcomes? (3) How can Ohio’s PACE program be improved? The PACE study included both a process and outcome evaluation. The process component involved more than 30 in-person interviews at PACE sites and a review of program records and materials. To determine program outcomes we compared PACE participants to a matched sample comprised of PASSPORT participants-- Ohio’s Medicaid waiver home and community based care program-- from the same region of the state.
Program Description
Ohio has two PACE sites, TriHealth SeniorLink serving the Cincinnati region and McGregor PACE serving Cuyahoga County. Both sites have been in existence since the late 1990s (SeniorLink, 1997, McGregor, 1998), but their operational histories have been quite different. SeniorLink has operated under the same management structure throughout the existence of the program, while McGregor PACE is a new host agency, taking over in 2010. CMS and the Ohio Department of Aging had determined that the previous host agency did not meet the quality goals of the program. This transition not only presented management challenges for the new host, McGregor PACE, but also created evaluation difficulties for this study; in many instances, complete data records for the time period prior to the transition were not available. Both PACE organizations operate a main site and a satellite branch; each location has an adult day health center and a clinic. Services provided for PACE are discussed and planned for by an interdisciplinary team that includes a physician, nurse, social worker, therapists, dietician, home care liaison, health care workers/aides, and transportation drivers.

iii
Profile of PACE Participants
The general profile of PACE participants in Ohio’s two sites is similar, but there are some noteworthy differences across the programs. SeniorLink has a higher proportion of enrollees under age 65 (three in ten) compared to one in ten for McGregor in that younger age group. About one-quarter of McGregor participants are age 85 and older, compared to 7% for SeniorLink. McGregor participants had higher levels of functional impairment as measured by the activities of daily living (ADL) (2.9 vs. 2.4), and were more likely to be severely impaired (36% had four or more ADL impairments compared to 12% for SeniorLink), and were more likely to need 24-hour supervision (43% vs. 6% for SeniorLink). Both serve a high proportion of blacks, six in ten for SeniorLink and eight in ten for McGregor.
PACE is unique in that it provides both acute and long-term care services, but it does
share some commonalities with the state’s other long-term care programs, including PASSPORT, assisted living waiver, Choices, and nursing homes. PACE is similar to all of the other long-term care programs in that the majority (four of five) of individuals served are older women. One major difference between PACE and the other state programs is that PACE serves a much higher proportion of minority participants (greater than 60% are black), compared to 10% to 30% for the other programs. Although PACE participants average between two and three impairments in activities of daily living, PACE and Assisted Living Waiver Program participants have the lowest average functional disability levels when compared to other state programs. PACE records the highest proportion of individuals among the home care programs who require 24-hour supervision.
Using the National DataPACE resource base, we compared SeniorLink to a national peer
group. SeniorLink served a younger population, with one in three below age 65 compared to one in six for the peer group sites. SeniorLink served a much higher proportion of black participants than the peer group sites (56% vs. 35%). SeniorLink participants were slightly higher than the peer group consumers on the acuity indicator, which is a measure of medical complexity, and slightly lower on the frailty index, which is a measure of functional disability. There were some utilization differences with SeniorLink reporting lower use of hospitals, including the emergency room, admissions, and overall days, than the peer group sites. Long-stay nursing home use was considerably lower for SeniorLink compared to a national peer group. Because of the change in management, national comparison data were not available for McGregor PACE in 2010.
Program Costs
The PACE payment rates are separate for Medicare and Medicaid, and there is a third rate for Medicaid individuals who are not Medicare eligible. The Medicare rate is based on the acuity score given to each participant, with a dollar amount allocated accordingly. The Medicare rate ranges from a low of $500 per month to a high of $8,000 per month, depending on the individual’s condition. Medicare payments do vary by site, with SeniorLink having an average Medicare monthly rate of $2,181 and McGregor having a Medicare average of $2,450 in 2010.

iv
The Medicaid rate methodology, which was last modified in 2005 in response to implementation of the Medicare PART D drug benefit, is based on Medicaid nursing home and waiver reimbursement levels of the PACE region. Under this methodology, the Medicaid rate today at SeniorLink is $2,694 per month and the McGregor rate is $2,394. For those individuals who are not Medicare eligible, the Medicaid monthly rate is higher: $3,769 for SeniorLink and $3,553 for McGregor.
In 2007, SeniorLink participants averaged $3,780 per month in acute and long-term
services expenditures. Home health services, medications, transportation, hospital, and physician services were the top expenditure categories. Perhaps as a result of the high availability of health services in PACE, two of the lowest expenditure categories were outpatient services and emergency room costs. The McGregor PACE participants had monthly costs of $4,100. Home health care services, nursing home services, personal care services, and physician services were the top expenditure categories. Inpatient hospital care was in the low expenditure category. Study Outcomes
Using a statistical technique, propensity score matching, we generated a comparison group from PASSPORT participants as a way to evaluate PACE outcomes and costs. These comparisons found that SeniorLink PACE had the lowest disenrollment rate over the five-year period (45%), while the SeniorLink region PASSPORT sample had a disenrollment rate of 66.4%. McGregor PACE and its PASSPORT comparison group also had a higher rate of disenrollment than SeniorLink PACE, but they were similar to each other, with disenrollment rates of about 60%. The reasons for disenrollment vary by program and by site. SeniorLink PACE has the lowest proportion of disenrollments attributable to death (37%) compared to all three other research samples (49%, 51%, 55%), but also serves a younger age group than the McGregor PACE site. SeniorLink did have a higher proportion of disenrollments to nursing homes outside of the PACE network compared to the McGregor PACE site (33.5% and 13.2%, respectively).
For the participants who remained in their respective programs (PACE or PASSPORT)
throughout the five-year period, there are several notable differences between the PACE participants and their within-region comparison groups. In both PACE sites the functional status of participants remained stable over the five-year study period, while there was an increase in ADL impairment level for both PASSPORT groups. Average instrumental activities of daily living (IADL) impairments showed the opposite pattern: both PACE groups showed a slight increase, while the PASSPORT groups showed no change or slight improvement in IADL abilities.
The comparison of the PACE and PASSPORT research samples show that per member,
per month Medicaid costs over the four-year time period were higher for PACE. Average monthly expenditures for SeniorLink were $3,488 and average monthly expenditures for the Cincinnati PASSPORT sample was $2,226, or $1,262 higher per month for SeniorLink PACE.

v
For the Cleveland region we see a smaller overall difference. The McGregor PACE research sample had average monthly Medicaid expenditures of $3,087, compared to $2,369 for the Cleveland PASSPORT sample, for a monthly difference of $718. Although the Medicaid monthly nursing home expenditures were higher for the PASSPORT sample, the cost differences between the two samples were not large enough to offset the higher PACE capitation rate.
We also examined data for each individual year in addition to the four-year average
presented above. In 2007, SeniorLink research sample members recorded per member, per month Medicaid expenditures of $3,008, and the PASSPORT comparison group had per member, per month Medicaid expenditures of $1,983; SeniorLink participants had monthly Medicaid expenditures that were $1,025 higher. Comparison data for the McGregor region in 2007 were somewhat similar. The monthly expenditures for PACE participants at $2,648 were $725 higher than the PASSPORT average monthly costs of $1,923. By 2010, the Medicaid per member, per month expenditures for the Cincinnati PACE sample was $3,412, and Cincinnati PASSPORT sample monthly average Medicaid expenditures were $2,487, for a $925 difference. For the Cleveland region comparison, the 2010 McGregor PACE sample had per member, per month Medicaid expenditures of $3,004, with the PASSPORT sample recording $2,877 in average monthly Medicaid expenditures, resulting in a $127 monthly gap between PACE and PASSPORT sample members.
Because PACE integrates Medicaid and Medicare funded services, we also examined to the extent possible Medicare expenditures for the research sample. We did not have access to the complete Medicare records for sample members, but rather had to rely on the Medicare crossover claims file and national utilization estimates. The Medicare four-year monthly average for the SeniorLink region PASSPORT sample was $3,138, compared to $2,214 for the SeniorLink PACE sample, for a $924 difference. We believe that we have underestimated the Medicare costs incurred by the PASSPORT research sample, yet even so, the SeniorLink PASSPORT monthly Medicare expenditures were consistently higher than the PACE averages. This finding highlights the importance of examining both Medicare and Medicaid costs in evaluating PACE. For the McGregor region the Medicare costs for the PACE sample were slightly higher ($478), although in the last study year the Medicare cost differences were comparable. Given our incomplete Medicare data, we view the Medicare costs for McGregor PACE and PASSPORT to be comparable. Recommendations to Improve PACE
The following recommendations suggest potential improvements to the effectiveness of PACE, based on the outcome and process evaluation results of the study. We categorize our recommendations into three groupings: (1) development of programmatic goals; (2) improved operations; and (3) factors for program expansion.

vi
Development of Programmatic Goals
First and foremost it is critical for Ohio policy makers to come to agreement on the programmatic goals of the PACE model. What is the major objective of PACE for Ohio? Is the primary goal of the program to coordinate care for a very medically complex population at high risk of negative health outcomes and high health care costs? Or is the program designed to coordinate the health and long-term care costs for frail individuals at high risk of nursing home placement? Both goals could have positive outcomes for participants but can result in different outcomes for PACE. For example, our findings indicate that SeniorLink appears to be targeting enrollees with high medical complexity. For these individuals PACE did significantly decrease healthcare utilization, and while small reductions in nursing home use were realized, they were not large enough to offset the additional Medicaid expenditures associated with the program. This means that while they have been able to generate considerable savings for Medicare, they have added costs to the state Medicaid program. McGregor PACE, which has targeted a more traditional long-term care population, was able to almost break even on Medicaid expenditures during the final year of the study, but did not have an impact on Medicare. Whatever program goals are selected, they should align with state Medicaid policy goals, and, in our view, such goals should not vary from site to site. This is particularly important if the state is considering program expansion. We recommend that state policy makers clarify the programmatic goals of the PACE program and develop the appropriate targeting criteria to achieve those goals.
The finding that PACE participants had higher overall Medicaid expenditures than a comparison group of home care waiver enrollees is consistent with the results of previous studies. Because the majority of PACE and PASSPORT participants are eligible for both Medicare and Medicaid, reduced acute health care expenditures impact Medicare rather than Medicaid. Results from the SeniorLink PACE site showed significantly lower Medicare costs when compared to the PASSPORT research sample. Thus, for PACE to be a cost-effective program for the state, the federal Centers for Medicare and Medicaid Services (CMS) must be willing to share cost savings achieved by Medicare. In its recent efforts to encourage state-level development of better integrated care programs for individuals receiving Medicare and Medicaid, CMS has agreed to share Medicare savings with the states. It appears that the time is right for Ohio Medicaid officials to enter into these same discussion with CMS surrounding the PACE program. We recommend that state Medicaid officials pursue an agreement with CMS to share Medicare savings in the PACE model in the same way as the proposed integrated care demonstrations will attempt to capture Medicare savings for Ohio.

vii
The PACE model is one of the most comprehensive attempts to integrate acute and long-term services in the nation. Our interviews at both sites reinforced the integrated care philosophy. The linkage between health care needs and long-term services and supports were essential to the functioning of both sites. One PACE physician characterized the model by saying, “I had been a geriatrician outside of PACE for almost two decades. I have never been able to ensure that my patients got the needed health and long-term services and supports until my work on PACE. It is the way care should be provided.” Other interviewees described PACE as a neighborhood program and a family program. Daily stand-up meetings with the majority of staff and communication between team members contribute to the integration of care across settings and services. State initiatives to integrate care, either through the health home model or the large integrated care demonstration, should build on the experiences of the state’s PACE model. We recommend that the state consider how to involve the PACE model as it continues its efforts to better integrate acute and long-term services for older people with disability. Improved Operations
Even if Ohio is able to share Medicare cost savings with CMS, the PACE program will continue to face Medicaid efficiency challenges. PACE sites could be more cost-effective for Medicaid if they are able to lower nursing home use and maintain enrollment in PACE. Our Medicaid cost analysis for McGregor PACE showed that in the final study year, the PACE and PASSPORT research sample Medicaid costs were comparable. Savings, or at least comparability, can occur because the PACE Medicaid capitated rate is lower than the state’s average Medicaid nursing home rate. If PACE is able to impact traditional nursing home use then it can be a more cost-effective program in regard to Medicaid. However, when a PACE participant leaves the program to enter a nursing home out of network, the potential cost savings to the state is lost. For example, the disenrollment analysis found that SeniorLink had a lower overall disenrollment rate, which was a positive outcome; but, they were more likely to have participants leave the program for an out-of-network nursing home. Thirty-four percent of those disenrolling from SeniorLink left the program to use an out-of-network nursing facility, compared to 13% for McGregor PACE.
The use of out-of-network nursing homes provides an example of the policy and management conflicts inherent in the PACE model. On one hand, because PACE is designed and obligated to manage participants after nursing home placement, it is necessary for PACE case managers and physicians to be actively involved with the nursing home provider. Ongoing visits to the nursing home and good communication are critical, so the fewer nursing homes PACE has to work with the more efficient they can be with staff resources. However, a small number of nursing homes under contract to PACE means less choice for participants and possibly more out-of-network nursing home terminations for PACE. The quality and level of reimbursement of the nursing homes under contract could also be a reason for out-of-network placement, and again PACE sites have to balance costs to the program versus quality and continued participation. A
viii
high out-of-network disenrollment rate has negative cost implications for Ohio’s Medicaid program. We recommend that out-of-network nursing home use be reviewed carefully by both the PACE sites and by state administration.
The PACE Medicaid reimbursement system used by the state is out of date. Last modified in 2005, the current rate-setting methodology relies on the regional variation in nursing home and PASSPORT waiver expenditures. This approach results in a lower Medicaid rate for McGregor PACE compared to SeniorLink. The state did not use this regional variation rate in the newly developed assisted living Medicaid waiver rate and has worked to reduce variation in both nursing facility and home care reimbursement across the state. There does not appear to be any differences between the two sites that would justify the rate differentials. In fact, the McGregor PACE participants are older, more likely to have dementia, and are as disabled or more so compared to SeniorLink. We recommend that the Medicaid rate be comparable for the two PACE sites. The Ohio Departments of Aging and Job and Family Services should review the mechanism used to set the monthly rates.
Once PACE has clarified program goals on the target population to be served, a major operational question that must be addressed is: Should PACE, as a provider funded by a capitated payment, be the entity determining eligibility for its own program? The argument in favor of internal eligibility determination is that it is easier for the consumer and more efficient for the system for an applicant to meet with a representative of PACE to receive an overview of the program and an eligibility determination process during the same visit. On the other hand, under the financing approach in PACE, the pressures to enroll individuals is substantial, and allowing each site to determine eligibility has at least the appearance of conflict of interest. Even though a state inspection of PACE applicants is built into the process, typically through a paper review of the assessment form, PACE is consistently criticized for serving a population with lower levels of disability compared to other long-term care programs. Recent questions about whether PACE participants met level of care on their annual review have also been raised by state officials.
One other related problem involves the PACE relationship with the area agencies on aging. SeniorLink has a strained relationship with the area agency in Cincinnati and McGregor has a cordial one, but in neither site is there a good collaborative relationship between the organizations. If the objective of the long-term services system is to ensure that individuals have the choice to enroll in the program that best meets their needs, the partnership between PACE and PASSPORT Administrative Agencies should be a priority for both organizations. In a high-functioning community based care system, there would be a strong partnership between these two entities.
ix
We recommend that the eligibility determination for PACE be done by an independent entity. This change would be beneficial to the PACE sites and the overall system. Using one front door to the system could also improve the coordination and partnership between PACE and the area agencies on aging.
A problem with data comparability across PACE sites and with PASSPORT was identified during the study. In some instances it appeared that the two PACE sites, although using the same assessment instrument, defined and measured items in different ways. We also saw examples, such as medication administration and need for 24-hour supervision, where PACE and PASSPORT were not collecting comparable data. Compounding these challenges were years where much of the PACE data were recorded on paper forms only, rather than in an electronic system. Although electronic records are now being used, data comprehensiveness and comparability issues remain. We recommend that common assessment data be collected across the array of programs that serve similar long-term populations, and that the Ohio Departments of Aging and Job and Family Services establish sound quality review mechanisms to monitor data collection performance on these measures. Factors for Expansion
Both sites discussed the tremendous financial commitment required by the host organization. SeniorLink operated at a financial loss for the first eight years of operation, and McGregor PACE, operating in some ways like a new start-up site, continues to operate at a loss as of the writing of this report. Administrative staff suggested that a new PACE site would need a $4–5 million investment to begin the program.
In addition to the commitment of the host organization, the need for a strong commitment from the state to the PACE model was identified as a key issue by both sites. Respondents wanted to be assured that the PACE model fits into the state’s overall long-term services and supports system. The PACE interface with the new integrated care programs and health home intervention is critical to future success. The development of a new PACE site should include involvement with the long-term services network, including the integrated care demonstrations, PASSPORT and Assisted Living Waiver Program. These programs should not be seen as competitors, but as partners in the long-term services system.
Should the state explore expansion, staff at both sites talked about their willingness to assist a new organization in program design and implementation. The two sites currently share information. The McGregor PACE site administrative staff talked positively about the assistance that they received from SeniorLink during their transition start-up period. PACE is a very

x
different type of program, and staff education about the philosophy and management of the model is considered to be essential.
A final planning issue for both the state and a new PACE site involves size of the program. Because PACE sites receive capitated funding, there is a strong incentive to build enrollment. Having adequate enrollment is important to keep administrative costs and overhead low, and also to spread catastrophic risk over a higher number of covered lives, since PACE sites are financially responsible for all participant costs. On the other hand, the PACE model is a very intense, hands-on, participant-specific intervention. At the daily “stand-up meeting,” staff talk about every person who is in a special circumstance that day, such as those in a nursing home, hospital, or even sick at home. Thus, PACE finds itself in the difficult position of needing to be big enough to manage risk, but small enough to manage quality. To achieve that optimum number requires the state and the PACE sites to be working in partnership. We recommend that the state make a clear decision on how PACE fits in to the overall long-term services and integrated care plan for Ohio and that it build on the expertise of the current operators if efforts are put in place for expansion.
The lack of complete Medicare data for this evaluation is a serious limitation. Although CMS has committed to making Medicare data available to the state, this did not happen in the short time frame for the study. A review of Medicare costs is essential to presenting a complete picture of the cost effectiveness of PACE. A second limitation of this study was that we did not have time to access or track and compare individual-level data in which health and functional status over time could be analyzed. We did not have individual linked data on functional ability and total costs of care, which have been shown in previous studies to be impacted by PACE enrollment. We also did not collect data on quality of life, which has been referenced in previous studies. All of the assessment data used in the study were collected by the program. Because these data are used to determine eligibility, they appear to vary across the two PACE sites. Verification of the assessment information collected by the PACE sites was not part of the evaluation. Another major limitation was a very small sample size for McGregor in the later years of the analysis. Finally, our site visit to McGregor PACE painted a portrait of a dedicated staff working to improve a program that had been found to be inadequate by state and federal regulators, but the evaluation time period meant that the results generated were driven by much of the work done by the previous host organization. We recommend that a more extensive evaluation of PACE be undertaken by the state that includes: complete Medicare cost data; the ability to track linked individual level data over time; inclusion of quality of life measures; and a mechanism to better evaluate the effects on participants in McGregor PACE.

1
BACKGROUND FOR THE STUDY
The Program of All-Inclusive Care for the Elderly, (PACE) combines in one organization the provision and management of acute care services funded typically by Medicare with long-term services usually paid for by Medicaid. Designed for individuals age 55 and older who are determined to be nursing home eligible under Medicaid, the program is responsible for an array of long-term services including adult day health services, personal care and home health services, transportation, meals, and nursing home care, and also a range of health-related services such as physician care, inpatient hospital, prescription drugs, occupational and physical therapies, and nursing. In exchange for a monthly capitated payment from Medicaid and, in most instances, Medicare, the PACE provider organization assumes full financial risk for participant care. PACE is one of the few programs in the U.S. that has as its goal to fully integrate acute and long-term services for older consumers. Ohio has two PACE sites, TriHealth SeniorLink serving the Cincinnati region, and McGregor PACE serving Cuyahoga County. The Ohio Department of Aging, through an agreement with the Ohio Department of Job and Family Services, is responsible for monitoring PACE performance.
In the 2012/2013 budget the General Assembly requested that the Scripps Gerontology Center, Miami University, conduct an evaluation of Ohio’s two PACE sites. The research and policy question for this study is whether the PACE model should be expanded to other sites across the state and, if so, what modifications should be made to the program in preparation for an expansion? The evaluation addresses three primary areas:
(1) How does PACE operate including goals, structure, and regulations? (2) Is the program effective in terms of costs and outcomes? (3) How can Ohio’s PACE program be improved?
Ohio is facing a series of challenges associated with providing and funding health and long-term services and supports for its citizens experiencing disability. As one of the largest states in the nation, Ohio has 1.1 million individuals with a long-term disability and more than 315,000 with severe disability (Mehdizadeh et al., 2012). Almost four in ten individuals with severe disability of all ages rely on the Medicaid program. The resources required to assist individuals with severe disability represent a substantial and growing budgetary challenge. As is the case nationally, total Medicaid spending comprises about one-quarter of the entire state general revenue budget. In Ohio, individuals with disability comprise about 20% of Medicaid beneficiaries, but account for 68% of expenditures. Long-term services alone comprise 36% of total state Medicaid expenditures in Ohio (Eiken et al., 2011). A particularly challenging group for state Medicaid programs includes individuals who are eligible for both Medicaid and Medicare. Nationally, individuals who are “dual” eligible account for about 40% of Medicaid spending, but represent about 15% of beneficiaries. Long-term services and supports account for more than 70% of the Medicaid costs for these individuals (Kaiser Family Foundation, 2012). People with functional limitations also present challenges to the Medicare program, with the

2
15% of disabled persons accounting for about one-third of Medicare total expenditures in the U.S. (Komisar & Feder, 2011). The growing older population in Ohio, currently the seventh largest in the U.S., includes those individuals most likely to be dual eligible. This group is estimated to increase by more than 50% in the next two decades (Mehdizadeh et al., 2012). With continuing cost pressures on both Medicare and Medicaid, the need to make the system more efficient and effective will be paramount.
The increased Medicaid and Medicare costs have gained national attention in light of state and federal budget pressures, but concerns about coordination and quality of care may be even more problematic. Under the current fragmented funding streams, Medicaid and Medicare operate as separate entities. Despite sharing a federal home at the Centers for Medicare and Medicaid Services (CMS), the two programs have operated differently. Medicare has operated as a federal program with no state involvement, and Medicaid has primarily operated at the state level, albeit with federal rules and oversight. There has been extremely limited integration between the two programs at either the administrative or operational levels. This lack of integration has created care access and quality problems for the consumer, operational constraints for providers and cost inefficiencies for the federal government and the states. Most importantly, the uncoordinated funding streams results in a non-system where physicians, hospitals, nursing homes, home care and home health agencies all focus on their part of care delivery, with limited communication and cooperation between each area. This presents major difficulties for older consumers and their families, who often find themselves trying to navigate between an array of providers and settings with conflicting rules and incentives.
Although examples of the lack of coordination between and within the health and long-term care services are well-documented, the solution is difficult (Leutz, 1999). Since the 1980s there has been interest in, and some development of, integrated care programs. The initial programs were hampered by regulatory and administrative barriers. In 2003 the Medicare Modernization Act made integration more feasible through the Special Needs Program (SNP). This option enabled relationships between health plans and the state Medicaid agencies, allowing states to offer all services from Medicare and Medicaid in one plan. The financial challenge faced by integrative care programs is noteworthy, as many states are hesitant to establish programs because the initial cost savings accrue to Medicare, rather than Medicaid. CMS has now committed to sharing Medicare savings with states. In response, a number of states are now exploring a managed care approach to integrate acute and long-term services and supports under Medicaid. A recent study by AARP and the National Association of States United for Aging and Disabilities found that 12 states had existing Medicaid managed care plans and 11 states (including Ohio) were planning such efforts (AARP, 2012). Most of these initiatives are designed to include Medicare beneficiaries, although their participation in the Medicare managed care component will be optional. States will likely require all Medicaid recipients who receive long-term services and supports in either nursing homes or waivered home care programs to enroll in the Medicaid managed care program in order to receive a benefit. These proposed and newly implemented programs have generated many questions from the consumer and provider

3
community, but they are viewed as attractive by states because they may be able to assure more stable expenditures for this large and growing component of state government. Evaluation data on the outcomes of these efforts are quite limited.
A second solution to integrating acute and long-term care is PACE. Designed to provide all of the necessary health and long-term services to older people who meet nursing home level of care, PACE is very different from the large, state level integrated care models: it is a targeted intervention designed to serve a relatively small number of individuals with an intensive level of services. The PACE model revolves around an adult day health setting. The typical program in the U.S. serves around 400–500 participants. The first PACE site – On Lok – began as an adult day health and home care service provider in San Francisco in 1973. Complete medical care was added to the model in 1978. By 1983 On Lok received approval to test a capitated financing system, and in 1986 funding for the model was included in federal legislation. With start-up support from private foundations, the first official PACE replication site began in 1990, and by 1996 there were 21 PACE sites in operation in 15 states (including Ohio). In 1997 PACE was established as a permanently recognized provider type in federal statute. By 2012 there were 82 PACE programs operating in 29 states (National PACE Association, 2012). PACE is funded through capitated payments from Medicare, determined by the Centers for Medicare and Medicaid Services (CMS), and from Medicaid, set by each participating state.
PREVIOUS EVALUATIONS OF PACE
As part of this project, we reviewed 10 previous studies evaluating PACE programs across the U.S.; there were six outcome and four process studies, (See Appendix A Table 1.). Because PACE participants must meet nursing home level of care criteria, PACE has typically been compared to home and community based services to determine the cost effectiveness and quality of the program. The outcome evaluations use quasi-experimental designs, which are most relevant to this evaluation study, and these are the focus of our review. These studies include a range of outcomes including: health and functional status, quality of life, hospital and nursing home use, satisfaction with care, mortality rates, and costs.
Two of the PACE outcome studies were conducted on demonstration projects. These looked at the impact of PACE on health services utilization, health and functional outcomes, quality of life, and satisfaction with services (Chatterji et al., 1998; White et al., 2000). Both studies compared PACE participants with individuals who went through the application process but decided not to enroll in the program. These studies found improvements in health status and functioning, fewer hospital admissions, fewer nursing home days, and higher satisfaction with quality of life. Participants in both studies had lower mortality rates. One of the studies compared the expected medical and program costs of PACE demonstration enrollees in their initial year of participation to the actual payments made under the fixed Medicare and Medicaid capitation rates. PACE represented a savings for Medicare in the first year of enrollment, while the Medicaid portion of the capitation rate was higher than the amount that Medicaid would have actually spent (White, 2000).

4
Evaluation studies continued after PACE received permanent provider status. Two of the studies were state-level evaluations of PACE in Washington and South Carolina, (Mancuso et al., 2005; Weiland et al., 2010). They compared PACE participants with a home and community based waiver group; the Washington study used propensity score matching methodology. In both states, the functional status of PACE participants remained stable over time, while the functional status of the home and community-based group declined significantly over the same four years. PACE participants had a statistically significant survival advantage over the waiver group (Mancuso et al., 2005; Weiland et al., 2010). The Washington study examined Medicaid costs and found that PACE enrollees spent $2,791 per member, per month, in the first follow-up year, compared to $1,349 per member, per month, for the HCBS comparison group. The gap in Medicaid expenditures was reduced from $1,442 in year one to $1,018 per member, per month, by the fourth follow-up year. The study was not able to include Medicare expenditures (Mancuso et al., 2005).
The remaining two studies were national evaluations that relied on propensity score matching methodology to identify a comparison group of individuals enrolled in home and community waivers. One of the projects — a study of PACE in nine different states — looked at outcomes associated with care management, healthcare utilization, health status, and satisfaction with care. The findings of this study showed that PACE participants had better health outcomes, reduced hospital use, improved preventive health care utilization, and more satisfaction with their quality of their life (Beauchamp et al., 2008). The second study focused on Medicare and Medicaid expenditures in 17 PACE sites. Monthly Medicare expenditures were similar for both groups; however, monthly Medicaid expenditures for the PACE group exceeded those for the matched comparison group. The effects on Medicaid for the first six months found PACE costs to be significantly higher: $2,072 per member, per month for PACE, in contrast to $1,146 per member, per month for the comparison group, for a monthly difference of $926. For months 19-24 of the study, the Medicaid gap was reduced but continued, with PACE costs at $2,328 and the comparison group at $1,792, for a $536 difference (Foster et al., 2007).
Despite the limited number of outcome studies, the results were generally consistent. PACE has a positive impact on functional status, quality of life, and mortality. These findings also indicate that PACE either saves money for Medicare or at least breaks even, but that the Medicaid expenditures of PACE participants exceeded those of the comparison group.
RESEARCH DESIGN AND RESULTS
The research focuses on three major areas: a description about how PACE operates, an assessment of the effectiveness of PACE, and the development of recommendations to state policy makers about next steps for the program.

5
RESEARCH QUESTION 1 - HOW DOES PACE OPERATE?
Methods
Data sources for this research question include: a review of the PACE regulations as established by CMS; an analysis of the earlier research studies that describe PACE operations, implementation barriers, and successes; an examination of Ohio PACE program documentation and web information generated by SeniorLink PACE and McGregor PACE; on-site interviews with 30 program staff members and observations at the two PACE sites; interviews with state program staff at the Departments of Aging and Job and Family Services; data from the PACE intake and assessment form; cost information from the PACE site data systems and Tri-State Benefit Solutions; information from Ohio’s Long-Term Care Profile; and national comparative information from DataPACE system made available through the National PACE Association.
Results: Description of PACE
The PACE program is designed to meet medical and long-term service and support needs through an interdisciplinary team approach, functioning out of an adult day health center. Appropriate in-home services, hospital, or nursing home care are also utilized to meet participant needs. PACE provides or arranges acute and long-term care services for individuals residing within the PACE defined service area who are deemed nursing home eligible by Medicaid state criteria and who are able to live safely in the community.
The PACE intervention contains a set of core elements that are governed by federal regulations. In this section, we provide a description of PACE, highlighting similarities and differences across Ohio’s two programs. Although Ohio’s PACE sites have been in existence since the late 1990s (SeniorLink, 1997, McGregor, 1998), their operational histories have been quite different. The SeniorLink program has operated under the same management structure throughout the existence of the program, and many staff members, including the Medical Director, have been on the job since the early days of implementation. McGregor PACE is a new host agency, taking over in 2010 because CMS and the Ohio Department of Aging decided that the previous host agency was not meeting the quality goals of the program. This transition not only presented management challenges for the new host, McGregor PACE, but also created evaluation difficulties for this study; in many instances, complete data records for the time period prior to the transition were not available.
Both PACE organizations operate a main site and a satellite branch; each location has an adult day health center and a clinic. Services provided for PACE participants include: primary care, encompassing physicians and nursing services; social services; restorative therapies, including physical therapy and occupational therapy; personal care and supportive services; nutritional counseling; recreational therapy; medications, and meals. Services for the participants are discussed and planned for by the interdisciplinary team. The team includes a physician, nurse, social worker, physical therapist, occupational therapist, recreational therapist or activity

6
coordinator, the PACE center manager, home care liaison, health care workers/aides, dietitian, and transportation drivers. At both programs there are approximately 55 participants assigned to each interdisciplinary team. These teams typically meet once a week to discuss participant care, ongoing services, special cases, family issues, and grievances.
The adult day health center is a core element of the PACE model. Participant use of this service varies from once a week to daily. McGregor has a higher proportion of participants who use the service every day of the week. At the center, participants engage in social and recreational activities, see medical professionals, have meals, and receive assistance with personal care and medications. The primary PACE locations in both regions have separate areas for participants needing dementia care. Each of the PACE program sites, both primary and satellite, has a health clinic. These clinics function like physician offices. Wellness checks, any specialty procedures, medication passes, vision checks, podiatry, and dental appointments are scheduled during the day. Time is left open for emergencies and walk-in appointments. A level- of-care review and ongoing assessments are scheduled semi-annually in the clinic. A physician and a nurse practitioner are on call for emergency room visits and hospital and nursing home admissions. The PACE physicians report that they interact directly with the emergency room doctor and work hard to avert avoidable hospital admissions. There are PACE case managers who are assigned to work directly with staff at the hospital. The case managers and physicians at both sites discussed how much effort they put into controlling the number of days a person is in the hospital. The PACE physicians and case managers in both programs report that they continue to follow individuals with a specific case manager after admission to nursing facilities.
Communication is a critical component of the PACE model, and this principle was emphasized repeatedly in both program locations. A “stand-up” meeting is held at the start of every morning in both sites. The purpose of this daily meeting is to discuss events from the day before such as emergency room visits, hospitalized participants, discharges, review of individuals in nursing facilities, participant call-offs for the day, employee matters, and other need-to-know information. All members of the interdisciplinary team are expected to attend these meetings, with conference call arrangements for individuals unable to make the meeting in person.
Any medications that participants require are provided to them as part of the PACE benefit. SeniorLink and McGregor differ in their pharmacy approach. SeniorLink has an in-house pharmacy, while McGregor contracts out for pharmacy service. Medications are distributed in the day health center and at home. The federal regulations for PACE require that physical therapy and occupational therapy services be available and provided, and again the process for delivery varies by site. At SeniorLink, most therapies are provided by internal employees, while therapy at McGregor is subcontracted to an outside group.
Transportation is a critical department in PACE. The drivers are responsible for bringing the participants into the day health center and to any outside medical appointments. Drivers often deliver meals to participants at home, as well as any medications on days they do not attend the center. Both sites reported that the drivers know the participants well. They are the first person to

7
see them during the day and often the first to know if anything is wrong. The drivers are an important part of the interdisciplinary team.
A Quality Assessment Performance Improvement (QAPI) Committee at each PACE site is composed of senior managers from such areas as medical, social work, nursing, and administration. Data are collected on an array of indicators such as ER visits, hospital admissions and discharges, length of hospital stays, falls, infections, wounds, adverse events, and mortality rates. These data are reviewed monthly and evaluated for trends. Outside contractors also go through a quality review annually. All grievance issues are part of the QAPI process. There are grievance forms throughout the day health center and any outside locations affiliated with PACE. Under CMS rule, the staff is to help and encourage participants to complete the grievance forms if there is a problem.
Financing PACE
PACE is a permanent provider under Medicare, and a state option under Medicaid. Monthly Medicare capitated payments are paid by the Center for Medicare and Medicaid Services (CMS) to the PACE provider. Rates are calculated using a risk-adjusted payment methodology, beginning with the Medicare Advantage payment rates for Medicare Part A and Part B, to which a PACE frailty adjustor is applied. Payments are individually calculated for each PACE participant. The Medicaid rate is negotiated between the state agency administering the program and the PACE organization. The amount was initially based on nursing home and home and community based waiver rates in the respective regions and has not been modified since 2005, even though the rates could technically be negotiated annually. Along with other Medicaid providers, PACE received a 3% cut in 2011. The overall rate does not change based on the individual case mix of the PACE participants. The PACE organization assumes all financial risk for delivering services within the capitated reimbursement system. Some participants have a co-pay based on Medicaid income guidelines, but most are not required to contribute. Two individuals were entirely private pay participants.
Contracts
Both PACE centers have a number of outside service contracts. SeniorLink contracts with two hospitals, three nursing facilities, two assisted living facilities, 12 home care agencies, one psychiatrist, and numerous medical specialists. McGregor has outside service contracts with a hospital group (also includes team physicians), four nursing homes, (one being the McGregor nursing home), three assisted living facilities, four group homes, eight home care agencies, pharmacy, and numerous medical specialists. Unlike SeniorLink, McGregor PACE also uses an outside service contract for staff physicians and therapists working within the day health center.
Enrollment
Both sites have employees dedicated to educating referral sources (including health, long-term and social service providers and community members) about PACE and the services it

8
provides. After a referral or an inquiry comes into PACE, an intake coordinator initiates the paperwork and gets detailed financial information. An intake nurse then makes a home visit and does the initial level-of-care assessment. While all of this is in process, an insurance eligibility specialist is reviewing all financial information to determine Medicaid eligibility. The two PACE sites had dramatically different views of the Medicaid eligibility process. McGregor reported few problems in working through the county Medicaid eligibility worker. SeniorLink reported substantial challenges in getting timely Medicaid eligibility decisions and indicated that the ability to determine presumptive eligibility, as is allowed in the PASSPORT program, was necessary.
If the intake nurse determines that the potential enrollee meets level of care, then that person is invited to the PACE center for a visit and additional assessments from other interdisciplinary team members. About 80% of those receiving this initial visit agree to a tour of the PACE center where they receive an orientation to the program, get assessed by interdisciplinary team members, and have a care-plan meeting with the team prior to enrollment. The vast majority of these individuals do select PACE, and their plan is then submitted to the Ohio Department of Aging for a paper review. If everything is approved by the state, the enrollee is brought in as a new PACE participant on the first day of the next month.
PACE Participant Characteristics
Using data from 2010 assessments, we created a profile of all PACE participants enrolled in that year, including demographic and social characteristics, functional limitations, health status, service use and costs. We also provide a comparison of PACE to the other Medicaid long-term care programs in the state serving older adults. Finally, this section includes a comparison to other PACE programs around the nation. Two limitations to the data in this section must be noted. First, because of data availability and comprehensiveness, the service use and cost data are from 2007, while the remaining data are presented for 2010. Second, data for McGregor PACE for 2010 were not available from the DataPACE organization, so our national comparisons are limited to SeniorLink.
PACE Profile
To be eligible for PACE, applicants must be age 55 and older and must meet functional impairment criterion (Medicaid nursing home level of care); they must also be residing in a specific geographic area. Although the general profile of PACE participants in Ohio’s two sites is similar, there are some noteworthy differences across the programs (See Table 1). SeniorLink has a higher proportion of enrollees under age 65 (three in ten) compared to only one in ten for McGregor in that younger age group. About one-quarter of McGregor participants are age 85

9
Table 1 Profile of Participants in the Two Ohio PACE Programs, 2010
SeniorLink McGregor
Demographic Characteristics
Average Age 70.4 77.4
Gender (Percent Female) 75.2% 85.5%
Race (Percent Black) 56.6% 83.3%
Current Living Arrangement
Own/Family/Friends 89.1% 78.0%
NF 6.6% 13.0%
Other 4.3% 9.0%
Usual Living Arrangement
Own/Family/Friends 88.9% 79%
NF 3.8% 12.5%
Other 7.3% 8.5%
Number of ADL Impairment/Needing Hands-On Assistance with Activities of Daily Living (ADL)
0 .5% 9.0%
1 26.9% 13.6%
2 21.5% 26.0%
3 38.7% 15.8%
4 or More 12.4% 35.6%
Average Number of ADL Impairments 2.4 2.9
Needing Hands-On Assistance with Instrumental Activities of Daily Living (IADL)
5 or More 94.9% 89%
Average Number of IADL Impairments 5.7 5.6 Percentage Needing Hands-On Assistance with Medication 97.7% 80.3%
Percentage Needing 24-Hour Supervision 6.3% 42.5%
Medicaid Average Capitation (monthly) $2,985 $2,544
Dual Eligibles $2,777 $2,395
Medicaid Only $3,886 $3,554 Medicare Average Rate (monthly) $2,181 $2,450
Number of Participants 594* 234*
* Based on the number of participants in the PACE programs irrespective of their length of stay in the program. Source: Annual Participant’s assessment records provided by PACE sites. Ohio Department of Job and Family Services, Medicaid Decision Support System, 2010.
10
and older, compared to 7% for SeniorLink. This results in a higher average age for McGregor participants (77 vs. 70). Perhaps reflecting the age differences, 13% of McGregor participants were actually residing in nursing homes in 2010, compared to 4% for SeniorLink. McGregor participants had higher levels of functional impairment as measured by the activities of daily living (ADL) (2.9 vs. 2.4), and were more likely to be severely impaired (36% had four or more ADL impairments compared to 12% for SeniorLink), and were more likely to need 24-hour supervision (43% vs. 6% for SeniorLink). Both programs report a very high proportion of participants needing assistance with medication (98% for SeniorLink, 80% for McGregor), and both have comparably high average levels of instrumental activity limitations. PACE serves a high proportion of blacks, six in ten for SeniorLink and eight in ten for McGregor.
The Medicare and Medicaid 2010 monthly capitation rates for PACE participants are also shown in Table 1. The PACE rates are separate for Medicare and Medicaid, and there is a third rate for Medicaid individuals who are not Medicare eligible. The Medicare rate is based on the acuity score given to each participant, with a dollar amount allocated accordingly. The Medicare rate, adjusted every six months, ranges from a low of $500 per month to a high of $8,000 per month depending on the individual’s condition. Overall average Medicare payments do vary by site, with SeniorLink having a Medicare monthly capitation rate of $2,181 and McGregor having a Medicare average of $2,450. The Medicaid rate is based on Medicaid nursing home and waiver reimbursement levels of the PACE region. Under this methodology, the Medicaid rate in 2010 at SeniorLink was $2,985 per month, and the McGregor rate was $2,544. For those individuals who are not Medicare eligible, the Medicaid monthly rate is higher, at $3,886 for SeniorLink and $3,554 for McGregor. The lower rate for the Cleveland area is attributed to lower Medicaid nursing home and waiver costs that existed in 2005 when the rates were last set. In the 2011/2012 budget, PACE rates were cut by 3%, as they were for all home and community based care Medicaid providers.
PACE Costs and Utilization
To get a better picture of how the program operates, we reviewed the costs and service utilization data for the internal and external services provided to PACE participants. As described earlier, some of the services are provided through staff employed directly by the program, while others are delivered by external organizations under contract. We examined use and cost data for 2007, because it serves as the base year for the follow-up evaluation that we will use in the outcome component of the study. Services are classified under two categories: health care, which includes hospitals, physicians, and home health; and long-term services, which includes both nursing home and home and community based care (See Table 2). Cost data, presented as per member, per month (PMPM), are available for the full array of services, but for some internal services, such as the day heath center, transportation, social work, and dietary, unit use rates are not available. The cost data presented in this section do not include administrative expenditures or

11
Table 2 PACE Average Cost and Utilization by Category of Services, 2007
PACE TriHealth
PACE TriHealth Use
Per year
PACE McGregor
PACE McGregor Use
Per Year
Health Care Services
Percent Admitted to Hospital (Annually) 25 26
Hospital Days Per Admission 6.6 3.8 Hospital Admission Rate Per Year .41 .48 Average Hospital Days Per Year (All) 2.7 1.8
Average Hospital Costs (PMPM) $406 $161
Percent Admitted to ER (Annually) 27 28
ER Rate Per Year (PM) .42 .46
ER Costs (PMPM) $29 $39
Outpatient Costs (PMPM and # Visits) $85 1.6 $277 14.4
Physician Services (PMPM and # Visits) $388* 15.1 $475* 11.2
Home Health Services (PMPM and # Visits) $479* 8.6 $896* 8.9
Hospice (PMPM) $0.1 $23
Medication (PMPM and # of Medications) $572* 20.0 $347* 14.0
Therapy (PMPM) $306 $122
Nursing Home Services
Percent Admitted to NF (Annually) 30 29
NF Days Per Admission 23 21
NF Admission Rate Per Year 1.5 1.2
Average NF Days (PMPM) 2.9 2.1
Average NF Costs (PMPM) $283 $505 Home and Community Based Services (PMPM)
Day Center** (PMPM) $201 NA $237 NA
Home Care Services** (PMPM) $220 NA $531 NA
Other Home Care Services** (PMPM) (Social Work, Dietary)
$362
NA
$159
NA
Transportation** $424 NA $365 NA
Total Expenditures $3,755*** -- $4,137*** --
Number of Participants 429 429 265 265 *Includes the cost of services provided in-house, but the use per year is based on the contracted services only. ** In-house services are averaged for all participants. *** Some categories of services such as durable medical equipment are not included in the total. Source: Tristate Benefit Solutions, the financial entity that processes claims for Ohio’s PACE Programs. And the PACE
centers data for in-house services.

12
overhead. SeniorLink participants averaged $3,750 per month in acute and long-term services. Home health services, medications, transportation, hospital, and physician services were the top expenditure categories. Inpatient hospital care, physician services, other home care services, and therapy represented a mid-tier level of expenditures. Perhaps as a result of the high availability of health services in PACE, two of the lowest expenditure categories were outpatient services and emergency room costs.
The McGregor PACE participants had monthly costs of $4,100. Home health care services, nursing home services, personal care services, and physician services were the top expenditure categories. Medications, transportation, and outpatient hospital care comprise the middle tier of expenditures. Interestingly, inpatient hospital care was in the low expenditure category.
Utilization patterns for SeniorLink for 2007 showed that, over the course of the year, 25% of participants were admitted to the hospital, with an average length of stay of 6.6 days. Some individuals were admitted more than once, generating an overall rate of 4.1 admissions per 10 participants per year. The admission rate is calculated as the total raw number of hospital admissions (including multiple admissions for some participants) compared to the total person-days of program enrollment. During the same time period, 27% of participants visited the emergency room. Analysis of nursing facility use shows 30% of participants with an admission over the course of the year. For many of these individuals, the nursing home was used for a short rehabilitation stay, and these individuals recorded a high number of readmissions such that the annual use rate was greater than one admission per participant (1.5). Overall per member, per month nursing home use was 2.9 days.
At the Cleveland site for 2007, 26% of participants had been hospitalized, and those individuals had an average length of stay of 3.8 days. Some individuals were admitted more than once, generating an overall rate of 4.8 admissions per 10 participants per year. As above, this rate is calculated by dividing total participant days enrolled by number of admissions. During the same time period, 28% of participants used the emergency room. Nursing facility use was 29% over the course of the year. As with SeniorLink, some individuals in McGregor PACE used nursing facilities for short-stay rehabilitation care, so the use rate was greater than one per participant per year (1.2). Overall in 2007, per member, per month nursing home use was 2.1 days.
PACE Comparison to Ohio Long-Term Care Medicaid Programs
PACE is unique in that it provides both acute and long-term care services, but it does share some commonalities with the state’s other long-term care programs. PACE uses the same Medicaid level-of-care definitions, and the Medicaid PACE capitated rate is calculated based on nursing home and home care waiver costs. There are also some differences across programs, such as age criterion, which is 55 for PACE, 60 for PASSPORT, Choices, and Aging Carve Out, 18 for Assisted Living, and no age restrictions for nursing facilities. As shown in Table 3, PACE is similar to all of the other long-term care programs in that the majority (four of five) of individuals served are older women. One major difference between PACE and the other state programs is that PACE serves a much higher proportion of minority participants (greater than 60% are black), compared to 10–30% for the other programs. Although PACE participants

13
average between two and three impairments in activities of daily living, PACE and Assisted Living Waiver Program participants have the lowest average functional disability levels. More than 25% of PACE participants have zero or one activity of daily living impairment, compared to 5% for PASSPORT, 2.1% for Choices, and 1.4% for the Aging Carve-Out waiver. Assisted living with 17% and nursing homes with 13% are the two other programs with the highest proportion of individuals in the very low functional impairment group. PACE and Choices record the highest proportion of individuals requiring 24-hour supervision (16.5% and 16.1%, respectively).
With respect to overall program costs and Medicaid per member, per month expenditures in 2010, PACE was at the cost midpoint ($2,813). PASSPORT ($1,545), assisted living ($1,798), and Choices ($2,372) have Medicaid costs lower than PACE, while the Aging Carve-Out waiver ($4,461) and nursing homes ($4,308) have higher program expenditures. For most Medicaid long-term service recipients, the bulk of Medicaid expenditures are for long-term services. The one exception to this is the aging carve out waiver, which serves a high number of non-Medicare participants. In 2010, the two PACE sites served about 700 individuals, compared to more than 30,000 in the PASSPORT and Choices waiver and more than 59,000 individuals on Medicaid aged 60 and older served by nursing homes.
National PACE Comparisons
Using the National DataPACE resource base, we compared SeniorLink to a national peer group (Table 4). As noted earlier, comparison information was not available for McGregor for this time period. PACE peer groups are selected based on years in operation, region, and size of program. A review of the comparative data showed SeniorLink served a younger population, with one in three below age 65 compared to one in six for the peer group sites. SeniorLink served a much higher proportion of black participants than the peer group sites (56% vs. 35%). Likely reflecting the age differences, SeniorLink served a higher proportion of enrollees who were Medicaid only (16.5% vs. 6.5%) and a lower proportion of dual-eligible individuals (83.5% vs. 90%). SeniorLink participants were slightly higher than the peer group consumers on the acuity indicator, which is a measure of medical complexity, and slightly lower on the frailty index, which is a measure of functional disability. SeniorLink had a lower rate of voluntary disenrollments than their peer group sites.

14
Table 3 Characteristics of Medicaid Waiver Consumers,
Medicaid Nursing Facility Residents, and PACE Program Participants, 2010
PASSPORT1
Choices1
Assisted Living
Waiver1
PACE2
Aging Carve-Out3
Medicaid Nursing Facility4
Average Age 75.6 75.6 80.6 72.3 NA 76.7
Gender (Percent) Female 76.7 80.4 80.1 79.4 73.7 68.7
Race (Percent) White 68.4 83.1 88.6 35.8 66.5 82.2 Black 25.8 12.7 9.0 63.0 31.3 16.4 Other 5.8 4.2 2.4 1.2 2.2 1.4
Number of ADL Impairments 0 1.3 0.1 3.6 3.1 0.4 7.1 1 4.0 2.0 13.6 22.4 1.0 4.6 2 35.6 19.3 35.0 23.5 12.1 3.5 3 33.5 27.5 27.3 32.4 34.4 4.1 4 or more 25.6 51.1 20.5 18.6 52.1 80.7
Average Number of ADL Impairments
2.9 3.6 2.6 2.5 3.8 4.5
Supervision Needed
24-Hour 8.6 16.1 13.9 16.5 NA NA
Partial time 10.9 15.0 23.4 NA NA NA
Cognitive Impairment NA NA NA NA 10.9 67.6 Per Member, Per Month Long-Term Care Services & Supports5
$1,147 $1,901 $1,614 -- $3,290 $4,278
Per Member, Per Month Medicaid Expenditures6
$1,545 $2,372 $1,798 $2,813 $4,461 $4,308
Number of Consumers/Residents
29,749 608 2632 712 1703 59,006
NA = Not available
1PASSPORT Information Management System (PIMS), 2010. 2Ohio has two PACE sites. TriHealth SeniorLink in the Cincinnati area and McGregor PACE Center in the Cleveland area. Data is based on the initial and/or annual level of care assessments of the participants. Data presented here is based on 76% of the enrollees. 3Unpublished data for Calendar year FY 2010, Ohio Department of Job & Family Services, Ohio Health Plans, Bureau of Home and Community Services, Nov. 2010. 4Quarterly nursing facility. MDS, April-June, 2009. 5Home and community based care nursing home expenditures for 60+ participants. 6Total Medicaid expenditures for long-term services and supports as well as health care services.
Source: Mehdizadeh, S., Applebaum, R., Nelson, I.M., & Straker, J. (2011). Coming of Age: Tracking the progress and challenges in delivering long-term services and supports in Ohio. Oxford, OH: Scripps Gerontology Center, Miami University.

15
Table 4 SeniorLink PACE Participants in Comparison to National PACE Data,
2010
PACE SeniorLink1
SeniorLink Peer Group1
Demographic Characteristics
% of Participants 55-64 33.6 16.4
% Male 22.1 26.1
% Black 58.8 35.3
Payer Source
% that are Medicare & Medicaid (Dual Only) 83.5 90.0
% that are Medicare Only 0.0 3.2
% that are Medicaid Only 16.5 6.5
% that are Private Pay Only 0.0 0.4
Acuity & Frailty
Acuity Index (HCC Risk Adjustor) 2.31 2.2
Frailty Index 0.19 0.32
Voluntary Disenrollments Rate 0.02 1.7 % of Participants Not Living in the Community (permanent placement) 2.5 5.2
Utilization Acute Hospital Admissions Per Member, Per Annum 0.58 0.73 Acute Hospital Days Per 1000 Members Per Annum 2488 7913
ER Visits Per Member, Per Annum 0.41 0.65 Psychiatric Hospital Admissions Per Member, Per Annum 0.02 0.01 Psychiatric Hospital Days Per 1000 Members Per Annum 189 136
Short-term NF Days PMPM 0.82 0.53
Long-term NF Days PMPM 0.78 2.21 Long-term NF Days Per 1000 Members Per Annum 8503 22,153
Skilled Home Care Visits PMPM 1.53 1.14
Social Work Encounters PMPM 1.72 1.77
1Data is for the fourth quarter of 2010.
Source: National PACE Association. (2010). DataPACE. Alexandria, VA: National PACE Association.
16
There were some utilization differences between SeniorLink and the peer group sites. SeniorLink reported lower use of hospitals, including the emergency room, admissions, and overall days than the peer group sites. The number of days in the hospital was considerably lower for SeniorLink when compared to the peer group sites (2488 days per 1000 participants per year, compared to 7913 per 1000). Short-term stays in the nursing home, as measured by per member, per month, were higher for SeniorLink (.82 vs .53), perhaps indicating some substitution of nursing home rehabilitation stays for hospital use. Skilled home health visits were also higher for SeniorLink compared to the peer group sites. Finally, long stay nursing home use was considerably lower for SeniorLink (8503 per 1000 participants per year, compared to a national peer group with 22,153 per 1000 participants per year).
RESEARCH QUESTION 2 - IS THE PROGRAM EFFECTIVE IN TERMS OF COSTS AND
OUTCOMES?
Study Design
To assess the cost effectiveness and consumer outcomes of the PACE program, this evaluation selected all PACE participants from the two sites who were enrolled in 2007. We followed all participants over the study period (2007 to 2011) to track health status, disenrollments, service utilization, and costs. To know whether the costs of the program and the status of the PACE participants were different from what would have happened if they hadn’t been enrolled in the program, we needed to compare them to a group as similar as possible. A randomized experiment is ideal for establishing groups that are identical at the outset of the study; differences at the end of the study can then be attributed to the intervention. However, this design was not ethically or pragmatically possible; evaluating an established program with participants who have benefited from their services for many years precludes the possibility of randomly assigning people either to the program or to the control group. Instead, we took several steps to select a population that would be the best possible comparison to the PACE participants in this study.
To decide where to find the comparison group, we examined all Medicaid programs that are alternatives to PACE in Ohio and have the same eligibility criteria as PACE (meeting Ohio’s nursing home level of care). The comparison group could feasibly come from nursing homes, Assisted Living Waiver Program, Choices, or PASSPORT. Each possibility was considered. We determined that nursing home residents would not be an appropriate population for two reasons: 1) nursing home care is facility-based and PACE is community based care; 2) long-stay nursing home residents are considerably more impaired than the PACE participants in Ohio. Next, we considered the Assisted Living Waiver Program, which serves a population similar to PACE in terms of level of impairment. However, the aim of this study is to select PACE-comparable samples in 2007 and follow the participants for five years to evaluate the extended impact of the PACE program; the Assisted Living Waiver Program, which started in 2007, was too small to yield a comparison group large enough to follow over the five-year time frame of the evaluation.

17
Choices, Ohio’s consumer-directed home and community based care program, was not a suitable comparison population because the program is limited in size and is not available in any of the regions of the state where PACE operates. Eliminating all other alternatives, the comparison group was selected from the universe of consumers receiving services from PASSPORT, Ohio’s home and community based Medicaid waiver program. PASSPORT has been serving Ohioans for more than 20 years, is available in all regions of the state, and served more than 26,000 individuals in 2008 (Mehdizadeh et al., 2009). We narrowed this universe to those PASSPORT consumers residing in the two PACE regions: Cuyahoga County for the McGregor PACE program and Hamilton County, along with certain zip codes in Butler, Clermont, and Warren Counties, for the SeniorLink PACE Program. For simplicity, these two regions will be referred to as McGregor PACE region and SeniorLink PACE region.
In summary, to study the effectiveness of PACE, we used an aggregated cohort comparative change design. We drew a sample from PASSPORT that matched the PACE groups at the beginning of the period under study (fiscal years 2007 through 2011). All participants were followed for the five years of the study period; their outcomes related to demographics, health and functional status, disenrollment, and service utilization and costs were tracked.
Study Participants and Data Sources
The original intent of the design was to include all PACE participants who were enrolled in 2007. For McGregor, that number was 353, and for SeniorLink it was 476. However, eligibility for the PASSPORT program begins at age 60 and for the PACE program it begins at age 55. To achieve as much comparability as possible, we limited our PACE groups to all participants age 60 and older in 2007. The original 2007 populations also included people who were determined to be eligible but had not enrolled, and some participants who had disenrolled before the start date of the study. After eliminating participants under age 60 and cleaning the original lists, the final population size was 271 for the PACE McGregor study population and 420 for SeniorLink.
To build the data sets necessary to track outcomes and costs for the PACE program, we requested from the two PACE programs the following information for 2007 through 2011: annual assessment documents, enrollment and disenrollment data, utilization of services, and expenditures. This information was requested for all 420 of SeniorLink’s study population, and for all 271 members of the McGregor study population. As stated earlier, McGregor has been under new management since 2010; some of the assessment documents that provide information on demographic, functional, health conditions, need for 24-hour supervision, hands-on assistance with medication, and cognitive status were not accessible to the new program. Even though the expenditure and utilization data were fully available for all participants for all years, the unavailability of data on participant characteristics and care needs limited our PACE McGregor region study group; we had the 2007 assessment records for only about half of the baseline group of 271 participants. To increase the size of the PACE McGregor study population, we expanded the group to any 2007 PACE participants (age 60 and older) in this region for whom we had their

18
assessment from either 2007 or from the first two quarters of 2008. This modification gave us a total of 200 members of the McGregor PACE study population. Figure 1 shows the steps in the construction of the baseline groups from the two PACE programs.
For the process of drawing the matched PASSPORT samples and constructing the comparative data sets, we extracted from PASSPORT Information Management System (PIMS) the assessment, enrollment, and disenrollment data for all 2007 PASSPORT consumers in SeniorLink and McGregor PACE regions. A request for data on Medicaid expenditures and utilization of services was made to Ohio Department of Job and Family Services, Office of Health Plans, and Bureau of Home and Community Services. Further, we asked the Ohio Department of Aging liaison to the Office of Health Plans to engage the Center for Medicare and Medicaid Services in acquiring Medicare utilization data for all PASSPORT consumers in the two regions. The PASSPORT populations to be used for the comparison sample selection were 4161 in the McGregor PACE region and 2319 in the SeniorLink region.
Comparison Groups from SeniorLink and McGregor PASSPORT Regions
As discussed above, in the absence of the possibility of random assignment, we decided to select matched comparison groups from the PASSPORT program consumers in the PACE regions. The variables used to draw the PASSPORT consumers for the comparison group were: age, gender, race, need for 24-hour supervision, and ADL level. All of these variables were measured uniformly in both programs. We used age and sex as standard control variables; race was an important matching variable, since both PACE programs are serving a higher proportion of blacks than PASSPORT (67.1% vs. 37.8%). In addition, total Activities of Daily Living (ADL) score and need for 24-hour supervision were used in the sample selection to make the groups as comparable as possible. Using propensity-score matching, we drew samples from each region’s PASSPORT consumers that were most similar to their respective PACE participants on these variables as of 2007 (Beauchamp et al., 2008). Other variables, such as Instrumental Activities of Daily Living (IADL) total score and need for hands-on assistance with medication, were considered as matching criteria, but they were both highly correlated with need for 24-hour supervision and activities of daily living.

19
Figure 1 Deriving the PACE Site Study Populations
SeniorLink
476
McGregor
420
411
Excluded under 60 & not enrolled
= 56
353
Assessment from 2007 = 138Assessment from 2008 = 62
Excluded those with missing
values = 9
271
200
197
Final Study PopulationAt Baseline (2007)
Medicaid 2007 Eligibility File
Excluded under 60 & not enrolled
= 82
Excluded those with missing
values = 3

20
Propensity score matching uses logistic regression to calculate the likelihood of an individual being in the PACE program based solely on their characteristics (in this case, age, gender, race, ADL, and 24-hour supervision), not on their actual program status. Everyone — the PACE participants and all of the PASSPORT consumers in the comparison population — gets a propensity score based on their values on the selection variables. To create the matched comparison group for the PACE participants, the propensity-score technique finds a PASSPORT consumer who had identical or nearly identical propensity score (likelihood of being in PACE) based on their scores on the matching variables. A total of 2305 PASSPORT consumers in the SeniorLink region with a valid value on the five measures (age, sex, race, ADL, and need 24-hour supervision) were compared with 411 PACE participants with no missing data on these variables; 411 PASSPORT consumers were selected as the comparison group. Each matched comparison had a nearly identical propensity score as one of the SeniorLink PACE participants. The same process was used to draw a comparison group for McGregor PACE. Four thousand fifty one (4051) PASSPORT consumers in McGregor PACE region were used to select 197 matches for the 197 McGregor PACE participants.
Table 5 shows the characteristics of the sample participants in the two PACE programs and their respective matched PASSPORT consumers. The comparability of each PASSPORT group to their PACE counterparts on the selection variables (age, race, gender, ADLs, and need for supervision) reflects the effectiveness of the propensity matching technique. At the start of the study period (2007), the two SeniorLink region groups are comparable to each other, and the two McGregor region groups are comparable to each other. Therefore, any differences between these groups at the end of the study cannot be “explained away” by the fact that the two programs might enroll individuals who are different on these variables.
The within-region groups are also similar on IADL level at baseline. They are quite different on need for hands-on medication assistance and on number of days enrolled in the program prior to 2007. PACE participants in both sites are reported to be considerably more likely to need medication assistance and have been enrolled in the program longer than their PASSPORT comparisons. We believe that the medication disparity between PACE and PASSPORT may be the result of differences in measurement and data collection approaches, rather than actual differences in the samples.

21
Table 5 Comparison of the PACE Participants and the Matched Sample of PASSPORT Consumers, 2007
PACE SeniorLink
PASSPORT SeniorLink
Region PACE
McGregor
PASSPORT McGregor
Region
Demographic Characteristics
Average Age* 72.0 71.8 76.5 77.4
Percent Female* 76.4 75.7 78.2 82.7
Percent Black* 57.9 57.7 83.2 83.8
Current Living Arrangement
Own/Family/Friends 87.9 96.6 83.7 95.4
Nursing Facility (NF) 9.7 2.7 8.2 3.6
Usual Living Arrangement
Own/Family/Friends 89.7 88.7
Nursing Facility (NF) 7.9 4.6 Number of ADL Impairment/Needing Hands-On Assistance with Activities of Daily Living (ADL)*
0 .5 .7 5.1 2.0
1 22.9 12.4 11.2 5.1
2 22.4 33.3 27.0 31.0
3 33.1 33.1 26.5 27.9
4 or More 21.1 20.4 30.1 34.0
Average Number of ADL Impairments 2.7 2.7 2.9 3.1 Average Number of IADL Impairments 5.5 5.3 5.4 5.3
Percentage with 5 or 6 IADLs 86.4 88.8 88.2 85.2
Percentage Needing Hands-On Assistance with Medication 93.4 44.3 79.4 54.3 Percentage Needing 24-Hour Supervision* 8.8 10.7 43.1 46.7 Average Days in Program Prior to 2007 815 525 881 752
Number of Consumers/Participants 411 411 197 197
*Variables used in propensity score matching. Source: Annual assessment records from the PACE Programs and PASSPORT Information Management System (PIMS).

22
Medical Complexity
The propensity score matching process required data that was comparable across programs. The amount of medical information meeting this criterion was quite limited. For example, health conditions and health care needs of a PACE applicant do not play a role in eligibility determination and therefore are not part of the assessment file for participants. Interviews with the two Ohio PACE sites indicated that, even though they are serving a population fairly similar to PASSPORT in terms of long-term care service needs, their participants typically have more complicated medical circumstances.
To examine medical complexity in PACE, we compared PACE participants to those enrolled in PASSPORT. Using the 2007 research sample described above, we randomly selected 25 individuals from each of the four study samples; SeniorLink PACE, SeniorLink region PASSPORT, McGregor PACE, and McGregor region PASSPORT. We attempted to limit the sample to those individuals with an initial enrollment occurring within 30 days of their assessment in 2007. This was not possible for the McGregor sample because of data availability problems, so for that sample, half were newly enrolled in 2007 and the other half were new enrollees in 2011. Details of the medical complexity sampling design are presented in Appendix B. A medical profile of each participant was created from existing records; the profile summarized the participants’ conditions, diagnoses, type and dosage of medications, and needs for supervision as documented in the very first assessment. Table 6 summarizes the content included in each assembled medical profile.
Once the profiles were created by the Scripps research team, they were sent to a medical team for review. The profiles were stripped of all program identifying information, such that the medical team (Dr. Gregg Warshaw and Dr. Elizabeth Bragg of University of Cincinnati, Office of Geriatric Medicine) could not identify participant program affiliation. Reviewers used the Modified Cumulative Illness Rating Scale (CIRS) as the tool to rate the medical complexity of the research sample (Salvi et al., 2008). This tool involved a rating of 14 body systems on a scale of 0–4 (no problem to extremely severe problem). Because of the variability of data available for each participant’s medical profile, if a participant scored a 0 or 1 for a body system, their score was recoded as 0; if they received a 2, 3, or 4, their score was recoded to 1; therefore, total scores for all 14 systems could range from 0 to 14. The body systems included: Cardiac; Hypertension; Vascular; Respiratory; EENT (eye, ear, nose, throat); Upper GI; Lower GI; Hepatic; Renal; Other GU; Musculo-skeletal-integumentary; Neurological; Endocrine-Metabolic, and Psychiatric/Behavioral. Dementia was scored as either present or not, and was also included in the total score. Individuals with a diagnosis of dementia might look less impaired functionally but still require a high level of hands-on care, and so it was deemed important to include in the scoring. Each member of the medical team rated each member of the total research sample (N=100) on the 14 body systems and calculated a total score independently. Next they compared their individual total to verify the consistency of their scoring assessment.

23
Table 6 Characteristics Included in the Medical Profiles
Demographics Age, race, gender
Mental & Behavioral Conditions/Diagnosis Whether any mental illness is present
Diagnosis ICD9 code, primary or not
Conditions, System Names Whether treated for the condition or not; source of information
Medication Name, dosage, frequency, route (prescribed or over the counter)
Hospital/Nursing Home Utilization Last Year Admission date, primary diagnosis, secondary diagnosis, discharged date
If there were any discrepancies in their total rating by two points or less, they calculated an average score for that participant. For three participants, the total scores differed by more than two points, and these three were re-evaluated together by the medical review team.
The results of the scoring along with the demographic and functional characteristics of the sample are summarized in Table 7. Scores on the Modified Cumulative Illness Rating Scale (CIRS) ranged from 2.5 to 11.0, with high score indicating greater medical complexity. The SeniorLink sample participants had a significantly higher score indicating more medical complexity (an average CIRS of 6.9 vs. 4.9) than their PASSPORT comparison group, The McGregor PACE sample had a higher CIRS score than McGregor region PASSPORT sample (6.2 vs. 5.5), but the difference was not significant. Both McGregor PACE and the McGregor region PASSPORT sample were serving a population with high proportion of dementia. The proportion of the population with dementia served by McGregor PACE, however, was significantly higher than the comparison sample (80% vs. 44%).
Although the sample size for this sub-analysis was limited, results indicate that the PACE participants appeared to be more medically complex (SeniorLink) or experienced a higher prevalence of dementia (McGregor).

24
Table 7 Comparison of a Random Sample of Study Participants for Medical Complexity, 2007
PACE
SeniorLink
PASSPORT SeniorLink
Region PACE
McGregor
PASSPORT McGregor
Region
Demographic Characteristics
Average Age 70.6 68.5 74.9 76.3
Gender (Percent Female) 76.0 68.0 80.0 80.0
Race (Percent Black) 60.0 56.0 -- 72.0 Average Number of ADL Impairment/Needing Hands-On Assistance with Activities of Daily Living (ADL) 3.2 2.3 2.7 2.5 Average Number of IADL Impairment/Needing Hands-On Assistance with Instrumental Activities of Daily Living (IADL) 5.6 5.0 4.8 5.2
Percentage Needing Hands-On Assistance with Medication 84.0 36.0 12.0 44.0 Percentage Needing 24-Hour Supervision 8.0 4.0 92.0 24.0
Medical Complexity Score Average 6.9* 4.9 6.2 5.5
Percentage with Dementia 24.0 28.0 80.0** 44.0
Number of Consumers/Participants 25 25 25 25
T-Test was used to determine significant differences between Medical Complexity Score, and two-proportion z-test was used to determine significant difference between the proportions with dementia. *The PACE SeniorLink medical complexity score was significantly higher than that for their PASSPORT comparison group (p = .000). **The PACE McGregor group was significantly more likely than their PASSPORT comparison group to have dementia (p<.08).

25
Results of the Outcomes Analysis
Participant Outcomes Over Time
In this section we present outcome data for PACE participants and the comparison sample over the course of the study. Figure 2 shows the attrition that occurred during the study for the two SeniorLink region groups, and Figure 3 gives that same information for the McGregor region groups. Comparing the groups to each other at baseline and over time allows us to track changes in health status for participants in PACE contrasted to PASSPORT. Disenrollment rates and patterns are an important part of this picture. Table 8 describes the disenrollment rates and patterns for the two programs, the characteristics of the participants who were in the study in 2007, and the characteristics of those who remained in the program throughout the entire study period.
While the average length of stay for people who disenrolled is comparable across all four groups, the overall rate of disenrollment and reasons for disenrollment vary. SeniorLink PACE has the lowest disenrollment rate over the five-year period (45%), while the SeniorLink region PASSPORT had a disenrollment rate of 66.4%. McGregor PACE and its PASSPORT comparison group also had a higher rate of disenrollment than SeniorLink PACE, but they were similar to each other, with disenrollment rates of about 60%. The reasons for disenrollment vary by program and by site. SeniorLink PACE has the lowest proportion of disenrollments attributable to death (37.3%) compared to all three other research samples (49%, 51%, 55%), but also serves a younger age group than the McGregor PACE site. SeniorLink did have a higher proportion of disenrollments to nursing homes outside of the PACE network compared to the McGregor PACE site (33.5% and 13.2%, respectively).
For the participants who remained in the study throughout the five-year period, there are several notable differences between the PACE participants and their within-region comparison groups. Since the within-region groups were comparable to each other at the outset of the study (on the selection variables), these changes emerged over the course of the study. Differences in 2011 have two possible explanations: differences in the characteristics of those who left either PACE or PASSPORT, or changes experienced by those who remained in each program. For both PACE sites, the functional status of participants remained stable over the five-year study period, while there was an increase in ADL impairment level for both PASSPORT groups. Average IADL impairments showed the opposite pattern: both PACE groups showed a slight increase, while the PASSPORT groups showed no change or slight improvement (decline in score) in IADL abilities. Both PASSPORT sites have a slightly lower percentage of participants in 2011 who need 24-hour supervision than they did in 2007; the PACE groups showed little change in this characteristic.

26
Figure 2
SeniorLink Sample Design and Disenrollment Pattern
Number of people aged 60 and older participated in PACE and a matched sample of PASSPORT consumers with no missing assessments or values on essential fields.

27
Figure 3 McGregor Sample Design and Disenrollment Pattern
Number of people aged 60 and older participated in PACE and a matched sample of PASSPORT consumers with no missing assessments or values on essential fields.

28
Table 8
Participant Outcomes, 2007 to 2011, by Program
PACE SeniorLink
PASSPORT SeniorLink
Region
PACE McGregor
PASSPORT McGregor Region
Average Age
2007 72.0 71.8 76.5 77.4
2011 73.8 73.7 78.2 80.2
Mean ADL
2007 2.7 2.7 2.9 3.1
2011 2.6 2.9 2.9 3.6
Mean IADL
2007 5.5 5.3 5.4 5.3
2011 5.8 5.1 5.7 5.3
% Needing Hands-On Medication
Administration
2007 93.4 44.3 79.4 54.3
2011 96.7 39.1 84.0 50.8
% Needing 24-Hour Supervision
2007 8.8 10.7 43.1 46.7
2011 9.3 5.3 42.0 41.0
Cumulative Disenrollments
N (%)
2011
185 (45.0 %)
273 (66.4%)
121 (61.4%)
118 (59.9%)
Average Length of Stay for Disenrollees (Days)
2011 2,260 2,206 2,273 2,341
Cumulative Disenrollments to
Nursing Home N (%)*
2011
62 (33.5%)
82 (30.0%)
16 (13.2%)
38 (32.2%)
Cumulative Disenrollments Due to
Death N (%)
2011
69 (37.3%)
135 (49.5%)
62 (51.2%)
65 (55.1%)
*For the PACE Program disenrollment to nursing home implies leaving the PACE Program and entering a long-stay nursing home. Source: Annual assessment records from the PACE Programs and PASSPORT Information Management System (PIMS).

29
In looking at the need for 24-hour supervision we see that the within-region comparisons show only a slight difference between PACE and their PASSPORT matches. However, a much larger variation across regions is observable throughout the study period. In 2007 and in 2011, McGregor PACE participants had a much higher need for 24-hour supervision than did the participants in the SeniorLink PACE program (42% for McGregor PACE in 2011 compared to 9.3% for SeniorLink PACE). This finding is consistent with the findings in the sub-sample medical complexity analysis where we found a much higher proportion of McGregor PACE participants with dementia. Finally, the marked difference in 2007 in the proportion of participants in PACE who need hands-on medication assistance compared to their PASSPORT matches grows even larger by 2011. Both PACE groups have an increase in these proportions, and both PASSPORT groups have a decrease, making the divergence greater in 2011 than in 2007. This divergence appears to be partly due to data collection differences between PACE and PASSPORT assessors. Some of the PACE participants were found eligible for the program in part because of their need for assistance with medication administration.
Participant Outcomes: Medicaid Costs
In addition to tracking participant outcomes, we also examined Medicaid costs for the PACE and PASSPORT program. In this section we present data for two different samples. We initially present Medicaid costs for PASSPORT and PACE sample members who remained enrolled in their respective programs during our study years (2007–2010)1. However, we also wanted to capture total costs over the entire study period, even for those who may have left their original program. For example, if a PASSPORT sample member left the program and moved to a nursing home, we want to capture those costs, since long-term nursing home care is part of the PACE benefit package. To address this aspect of the study we present comprehensive cost outcome data for the full research sample, both PACE and PASSPORT, regardless of current enrollment status. We include total Medicaid costs and Medicare expenditures to the extent that it is tracked by crossover data in the Medicaid claims. The crossover file does not represent all Medicare claims, just those where there is a Medicaid co-pay. We follow sample members for as long as they remain in Medicaid. Medicaid expenditures for ongoing program participants - In Table 9 we present per member, per month Medicaid expenditures for ongoing PASSPORT and PACE program recipients for both regions. For PACE, because the program receives a capitated Medicaid payment for each enrollee monthly, we present the average amount for the entire active caseload. For PASSPORT, data are presented for home and community based waiver services, case management, nursing home care, Medicaid premium expenses, and general Medicaid covered health services.
1 Medicaid data for 2011 was not available in time to include in this study.

30
Table 9 Average Per Member, Per Month Medicaid Expenditures for Study Participants
who Remained in PASSPORT and PACE, 2007-2010
Year
Expenditures (PMPM) (in Dollars)
PACE
SeniorLink
PASSPORT SeniorLink
Region
PACE
McGregor
PASSPORT McGregor
Region
2007
Health Care -- 670 -- 279 HCBS Waiver -- 781 -- 1,188 Nursing Facility 35 25 Care Management -- 103 -- 103 Medicare Premiums -- 217 -- 217 Total Expenditures 2,954 1,806 2,633 1,812 Number of Consumers* 364 398 196 181
2008
Health Care 641 388 HCBS Waiver 801 1,274 Nursing Facility 30 20 Care Management 112 112 Medicare Premiums 217 217 Total Expenditures 2,941 1,801 2,689 2,011 Number of Consumers* 347 344 192 163
2009
Health Care 643 455 HCBS Waiver 934 1,514 Nursing Facility 29 46 Care Management 110 110 Medicare Premiums 217 217 Total Expenditures 3,007 1,933 2,609 2,342 Number of Consumers* 290 269 155 130
2010
Health Care 630 622 HCBS Waiver 1,036 1,716 Nursing Facility 22 68 Care Management 100 100 Medicare Premiums 217 217 Total Expenditures 2,828 2,005 2,483 2,723 Number of Consumers* 241 221 130 109
*Number of program participants traceable in the Medicaid Decisions Support System. Forty-seven of SeniorLink PACE participants identifying information did not match with the Medicaid eligibility file and were excluded from all Medicaid cost analysis. Source: Ohio Department of Job and Family Services, Medicaid Decision Support System (2007-2010).

31
In 2007, total Medicaid expenditures for PASSPORT participants, per member, per month at both sites were just over $1,800. In the PASSPORT site in the Cincinnati region, home and community based waiver expenditures represented just under half of the monthly total per member costs (49%). Although the 2007 Cleveland PASSPORT site recorded a similar Medicaid total, the waiver expenditures accounted for 71% of the total. These differences reflect the higher average age and the higher proportion of Medicare beneficiaries in the Cleveland region; with Medicaid expenditures on health care a substantially lower proportion of the total expenditures. Monthly Medicaid costs increased over the four-year time period, again reflecting the aging of these individuals. By 2010, the total expenditure line had increased to $2,005 in the Cincinnati region and $2,723 in the Cleveland region. Waiver expenditures had grown to 57% of the total Medicaid expenditures in the Cincinnati region, while actually dropping to 67% in the Cleveland region.
The average per member, per month payment to PACE through the capitated Medicaid amount in 2007 was $2,954 for SeniorLink and $2,633 for McGregor. This amount was $1,148 higher for SeniorLink and $821 higher for McGregor. Over the four-year time period we do see some changes in the expenditure patterns. In 2010, the average Medicaid per member, per month payment was $2,828 for SeniorLink; $823 per month higher than the PASSPORT enrollees in the comparison group. The biggest change occurs in 2010 at the Cleveland site, where McGregor PACE monthly expenditure of $2,483 actually dips below the PASSPORT enrollees’ monthly expenditures by $240. Although following those remaining in the program is a useful exercise in helping us to understand how PACE and PASSPORT operate, following all sample members regardless of continued enrollment is the more important analysis for the evaluation.
Medicaid expenditures for the full research sample - Because individuals left each of the programs during the study period, it was essential for the evaluation to track all members of the research sample over the study time period. For example, if a PASSPORT participant left the program to enter a nursing home, then the evaluation would need to include those Medicaid nursing home costs in the total. In similar fashion if an individual leaves PACE we capture their non-PACE expenditures as well. This is particularly important because the PACE program covers nursing home care as a program benefit. Table 10 shows the four-year average Medicaid expenditures for research sample members, regardless of whether they continued to receive services from PACE or PASSPORT. Medicaid expenditures include all program costs, but also any other services reimbursed by Medicaid.
The comparison of the PACE and PASSPORT research samples show that per member, per month Medicaid costs over the four-year time period were higher for PACE. Average monthly expenditures for SeniorLink were $3,488, with PACE expenditures accounting for 88% of the total. Average monthly expenditures for the Cincinnati PASSPORT sample was $2,226, with waiver expenditures accounting for 51% of the total. The costs over the entire project period were $1,262 higher per month for SeniorLink PACE. For the Cleveland region we see a smaller overall difference. The McGregor PACE research sample had average monthly Medicaid expenditures of $3,087, compared to $2,369 for the Cleveland PASSPORT sample, for a
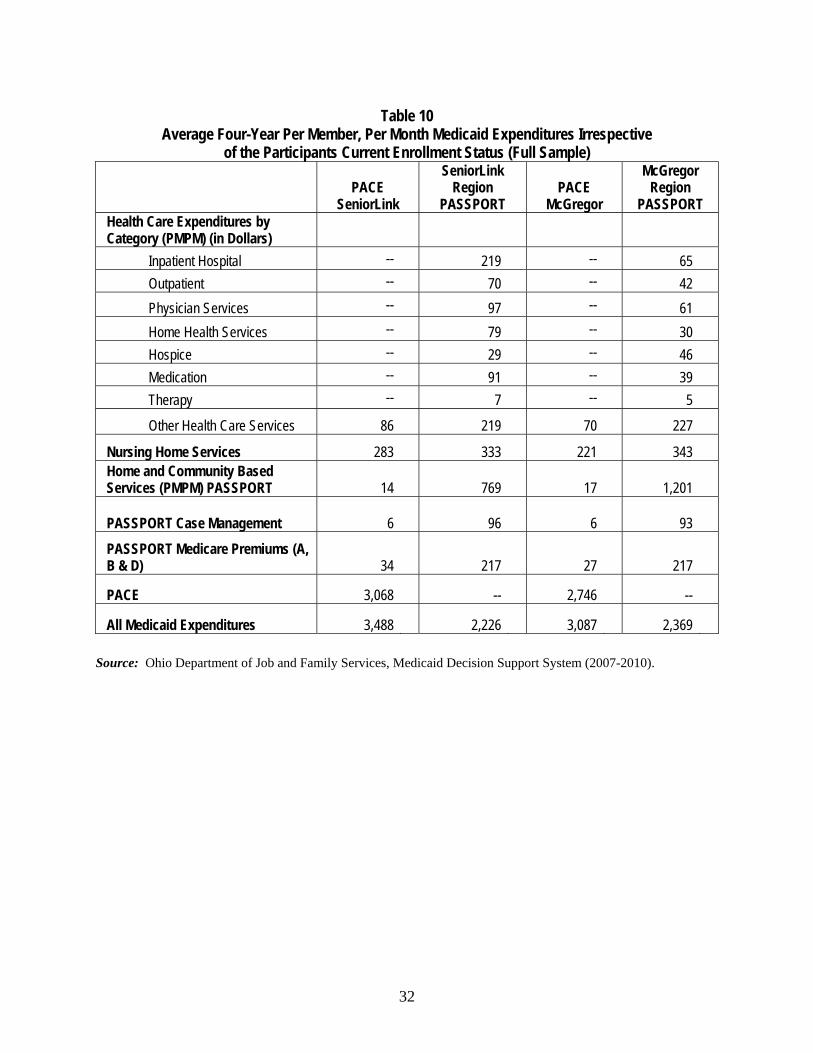
32
Table 10 Average Four-Year Per Member, Per Month Medicaid Expenditures Irrespective
of the Participants Current Enrollment Status (Full Sample)
PACE
SeniorLink
SeniorLink Region
PASSPORT PACE
McGregor
McGregor Region
PASSPORT Health Care Expenditures by Category (PMPM) (in Dollars)
Inpatient Hospital -- 219 -- 65
Outpatient -- 70 -- 42
Physician Services -- 97 -- 61
Home Health Services -- 79 -- 30
Hospice -- 29 -- 46
Medication -- 91 -- 39
Therapy -- 7 -- 5
Other Health Care Services 86 219 70 227
Nursing Home Services 283 333 221 343 Home and Community Based Services (PMPM) PASSPORT 14 769 17 1,201
PASSPORT Case Management 6 96 6 93
PASSPORT Medicare Premiums (A, B & D) 34 217 27 217
PACE 3,068 -- 2,746 --
All Medicaid Expenditures 3,488 2,226 3,087 2,369 Source: Ohio Department of Job and Family Services, Medicaid Decision Support System (2007-2010).
33
monthly difference of $718. Although the Medicaid monthly nursing home expenditures were higher for the PASSPORT sample, the cost differences between the two samples were not large enough to offset the higher PACE capitation rate. For example, the average monthly Medicaid nursing home costs for the Cincinnati PASSPORT sample was $333, but the PACE sample was $283. Because most of the PASSPORT sample members are also eligible for Medicare, expenditures for health services represent a low proportion of overall Medicaid expenditures (36% SeniorLink, 22% McGregor). This reduces the ability of PACE to impact acute care Medicaid expenditures and highlights the importance of examining Medicare costs as well.
To gain more insight into the Medicaid cost comparisons, we examined data for each individual year in addition to the four-year average presented above (see Table 11). In 2007, SeniorLink research sample members recorded per member, per month Medicaid expenditures of $3,008, with more than 98% of those funds allocated through the Medicaid capitated rate. The PASSPORT comparison group had per member, per month Medicaid expenditures of $1,983, of which 40% were for PASSPORT services. Thus, during 2007 on average SeniorLink participants had monthly Medicaid expenditures that were $1,025 higher than the PASSPORT regional comparison group. Comparison data for the McGregor region in 2007 were somewhat similar. The monthly expenditures for PACE participants at $2,648 were $725 higher than the PASSPORT average monthly costs of $1,923.
By 2010, the Medicaid per member, per month expenditures for the Cincinnati PACE sample was $3,412, of which 79% were paid via the PACE Medicaid capitation amount. The Cincinnati PASSPORT sample monthly average Medicaid expenditures were $2,487 for $925 difference. For the Cleveland region comparison, the 2010 McGregor PACE sample had per member, per month Medicaid expenditures of $3,004, with PACE accounting for 79% of expenditures. The PASSPORT sample recorded $2,877 in average monthly Medicaid expenditures, of which 46% were waiver expenditures. This means that in 2010, monthly Medicaid expenditures for the PACE research sample were $127 higher than the PASSPORT sample monthly average. This year-by-year analysis provides a slightly different perspective for the McGregor result compared to the four-year average and suggests that the program could be approaching a break-even point for Medicaid program expenditures. The bottom line, however, is that on the Medicaid side, PACE monthly sample member expenditures were higher than the PASSPORT comparison group sample. In both sites, Medicaid fee-for-service nursing home use expenditures were higher for the PASSPORT sample members, but the differences were not large enough to offset the enhanced Medicaid reimbursement received by the PACE program. Medicare Cost Estimates - Because PACE integrates Medicaid and Medicare funded services, we also examined to the extent possible Medicare expenditures for the research sample. As noted earlier we did not have access to the complete Medicare records for sample members, but rather had to rely on the Medicare crossover claims file. The biggest limitation of the crossover data is that the file includes only those Medicare services that require a cost share from Medicaid. Medicare services without a cost share, such as skilled nursing, home health services, and

34
Table 11 Per Member, Per Month Expenditures by Program and Type of Expenditures (Full sample)
Expenditures (PMPM) (in Dollars)
PACE SeniorLink
PASSPORT SeniorLink
PACE McGregor
PASSPORT McGregor
2007
Health Care 39 803 4 396
Nursing Home 15 72 -- 113
PASSPORT Services 788 11 1,101
Care Management -- 103 -- 96
Medicare Premiums -- 217 -- 217
PACE Expenditures 2,954 -- 2,633 --
Total Medicaid 3,008 1,983 2,648 1,923
Sample Size* 364 404 197 195
2008
Health Care 46 968 20 519
Nursing Home 218 245 187 246
PASSPORT Services 5 709 -- 1,138
Care Management -- 103 -- 100
Medicare Premiums -- 217 -- 217
PACE 2,768 -- 2,551 --
Total Medicaid 3,037 2,242 2,758 2,220
Sample Size* 342 378 182 184
2009
Health Care 101 722 98 550
Nursing Home 461 453 389 524
PASSPORT Services 20 813 -- 1,285
Care Management 6 95 7 92 Medicare Premiums 40 217 33 217 PACE Expenditures 2,849 -- 2,563 --
Total Medicaid 3,477 2,300 3,090 2,668
Sample Size* 280 316 146 155
2010
Health Care 157 707 241 656
Nursing Home 468 707 338 589
PASSPORT Services 32 773 7 1,333
Care Management 5 83 7 82
Medicare Premiums 44 217 40 217
PACE Expenditures 2,706 -- 2,371 --
Total Medicaid 3,412 2,487 3,004 2,877
Sample Size* 233 272 126 133
*Number of program participants traceable in the Medicaid Decisions Support System. Forty-seven of SeniorLink PACE participants identifying information did not match with the Medicaid eligibility file and were excluded from all Medicaid cost analysis.
Source: Ohio Department of Job and Family Services, Medicaid Decision Support System (2007-2010).
35
medications could be substantial but are excluded from the crossover file since they do not require a Medicaid contribution. To address this omission, we use national utilization data available from CMS. These numbers are based on the entire aged Medicare beneficiary file and underestimate Medicare expenditures for a population with severe disability typically served by PASSPORT. These should be thought of as a minimum estimate and an under value of the Medicare costs in these areas. This analysis is limited to individuals 65 and older.
As shown in Table 12 the Medicare four-year monthly average for the SeniorLink region PASSPORT sample was $3,138, compared to $2,214 for the SeniorLink PACE sample, for a $924 difference. Because the Medicare totals for the PASSPORT sample rely on national estimates for nursing home, home health, and medications, as noted above, we believe that these totals actually underestimate total Medicare expenditures for the PASSPORT sample, suggesting that the differential is probably greater than the $924 amount. This finding highlights the importance of examining both Medicare and Medicaid costs in evaluating PACE. The McGregor PACE region showed different results. The four-year monthly average was $2,527 for McGregor PACE and $2,049 for the PASSPORT comparison sample. Because of the Medicare estimation techniques required for this analysis, we believe that despite the monthly difference the overall four-year Medicare costs are comparable for the McGregor region samples.

36
Table 12 Estimated Medicare Expenditures for PACE and PASSPORT Full Sample 65 Years and Older
Expenditures (PMPM) (in Dollars)
PACE SeniorLink
SeniorLink Region
PASSPORT
PACE McGregor
McGregor Region
PASSPORT 2007
Medicare Based on Medicaid Crossover Claims
25 1,637 4 833
Estimated Short Stay Skilled Nursing Home, Home Health, Medication*
7 313 3 313
CMS/PACE Agreed Amount 1,736 2,140
Total Estimated Medicare 1,768 1,950 2,147 1,146
2008
Medicare Based on Medicaid Crossover Claims
86 4,107 196 1,948
Estimated Short Stay Skilled Nursing Home, Home Health, Medication*
101 327 79 327
CMS/PACE Agreed Amount 1,598 2,296
Total Estimated Medicare 1,785 4,434 2,571 2,275
2009
Medicare Based on Medicaid Crossover Claims
253 2,730 225 1,635
Estimated Short Stay Skilled Nursing Home, Home Health, Medication*
186 342 149 342
CMS/PACE Agreed Amount 2,044 2,402
Total Estimated Medicare 2,483 3,072 2,776 1,977
2010
Medicare Based on Medicaid Crossover Claims
357 2,821 155 2,296
Estimated Short Stay Skilled Nursing Home, Home Health, Medication*
274 349 191 349
CMS/PACE Agreed Amount 2,181 2,450
Total Estimated Medicare 2,812 3,170 2,796 2,645
Four Year Average
Medicare Based on Medicaid Crossover Claims
181 2,806 148 1,717
Estimated Short Stay Skilled Nursing Home, Home Health, Medication*
143 332 104 32
CMS/PACE Agreed Amount 1,890 2,280
Total Estimated Medicare 2,214 3,138 2,527 2,049
*These Medicare costs are based on national utilization by all Medicare beneficiaries.

37
RESEARCH QUESTION 3 - HOW CAN PACE BE IMPROVED?
Evaluation results of Ohio’s PACE program found that participants at both sites had slightly less functional decline. Additionally, the SeniorLink participants were less likely to disenroll from the program and less likely to disenroll because of death. Combined with data indicating that a sub-sample of PACE participants were more medically complex than the PASSPORT comparison sample, these findings indicate that the intense integration of health and long-term services, the hallmark of the PACE intervention, had a small beneficial impact on program participants. The analysis of Medicaid costs showed that overall per member, per month expenditures were higher for PACE compared to the PASSORT comparison sample. In the final year of the study period, the cost differential at the McGregor site was reduced to $127 per month. Because most members of the research sample were enrolled in both Medicaid and Medicare, and Medicare is the primary acute care funder, these system integration improvements do not create savings for Medicaid and highlight the importance of examining Medicare costs as well. Although Ohio was not able to receive complete Medicare data from the Center for Medicare and Medicaid Services (CMS) during the timeframe for this study, we were able to use Medicare crossover data from the Medicaid claims file. Despite being an underestimate of total Medicare service costs for our comparison group, the Medicare analysis did show considerably lower Medicare costs for SeniorLink PACE ($924 lower each month). Medicare costs for McGregor PACE were comparable.
The following recommendations suggest potential improvements to the effectiveness of
PACE, based on the outcome and process evaluation results of the study. We categorize our recommendations into three groupings: (1) development of programmatic goals; (2) improved operations; and (3) factors for program expansion.
Development of Programmatic Goals
First and foremost it is critical for Ohio policy makers to come to agreement on the programmatic goals of the PACE model. What is the major objective of PACE for Ohio? Is the primary goal of the program to coordinate care for a very medically complex population at high risk of negative health outcomes and high health care costs? Or is the program designed to coordinate the health and long-term care costs for frail individuals at high risk of nursing home placement? Both goals could have positive outcomes for participants but can result in different outcomes for PACE. For example, our findings indicate that SeniorLink appears to be targeting enrollees with high medical complexity. For these individuals PACE can and did decrease healthcare utilization, but did not lower nursing home placement. This means that while they have been able to generate considerable savings for Medicare, they have added costs to the state Medicaid program. McGregor PACE, which has targeted a more traditional long-term care population was able to almost break even on Medicaid expenditures

38
during the final year of the study, but did not have an impact on Medicare. Whatever program goals are selected, they should align with state Medicaid policy goals and in our view such goals should not vary from site to site. This is particularly important if the state is considering program expansion. We recommend that state policy makers clarify the programmatic goals of the PACE program and develop the appropriate targeting criteria to achieve those goals.
The finding that PACE participants had higher overall Medicaid expenditures than a comparison group of home care waiver enrollees is consistent with the results of previous studies. Because the majority of PACE and PASSPORT participants are eligible for both Medicare and Medicaid, reduced acute health care expenditures impact Medicare rather than Medicaid. Results from the SeniorLink PACE site showed significantly lower Medicare costs when compared to the PASSPORT research sample. Thus, for PACE to be a cost-effective program for the state, the federal Centers for Medicare and Medicaid Services (CMS) must be willing to share cost savings achieved by Medicare. In its recent efforts to encourage state-level development of better integrated care programs for individuals receiving Medicare and Medicaid, CMS has agreed to share Medicare savings with the states. It appears that the time is right for Ohio Medicaid officials to enter into these same discussion with CMS surrounding the PACE program. We recommend that state Medicaid officials pursue an agreement with CMS to share Medicare savings in the PACE model in the same way as the proposed integrated care demonstrations will attempt to capture Medicare savings for Ohio.
The PACE model is one of the most comprehensive attempts to integrate acute and long-term services in the nation. Our interviews at both sites reinforced the integrated care philosophy. The linkage between health care needs and long-term services and supports were essential to the functioning of both sites. One PACE physician characterized the model by saying, “I had been a geriatrician outside of PACE for almost two decades, I have never been able to ensure that my patients got the needed health and long-term services and supports until my work on PACE. It is the way care should be provided”. Other interviewees described PACE as a neighborhood program and a family program. Daily stand-up meetings with the majority of staff and communication between team members contribute to the integration of care across settings and services. State initiatives to integrate care, either through the health home model or the large integrated care demonstration, should build on the experiences of the state’s PACE model.

39
We recommend that the state consider how to involve the PACE model as it continues its efforts to better integrate acute and long-term services for older people with disability. Improved Operations
Even if Ohio is able to share Medicare cost savings with CMS, the PACE program will continue to face Medicaid efficiency challenges. PACE sites could be more cost-effective for Medicaid if they are able to lower nursing home use and maintain enrollment in PACE. Our Medicaid cost analysis for McGregor PACE showed that in the final study year the PACE and PASSPORT research sample Medicaid costs were comparable. Savings or at least comparability can occur because the PACE Medicaid capitated rate is lower than the state’s average Medicaid nursing home rate. If PACE is able to impact traditional nursing home use then it can be a more cost effective program in regards to Medicaid. However, when a PACE participant leaves the program to enter a nursing home out of network, the potential cost savings to the state is lost. For example, the disenrollment analysis found that SeniorLink had a lower overall disenrollment rate, which was a positive outcome; but, they were more likely to have participants leave the program for an out-of-network nursing home. Thirty-four percent of those disenrolling from SeniorLink left the program to use an out-of-network nursing facility, compared to 13% for McGregor PACE.
The use of out-of-network nursing homes provides an example of the policy and management conflicts inherent in the PACE model. On one hand, because PACE is designed and obligated to manage participants after nursing home placement, it is necessary for PACE case managers and physicians to be actively involved with the nursing home provider. Ongoing visits to the nursing home and good communication are critical, so the fewer nursing homes PACE has to work with the more efficient they can be with staff resources. However, a small number of nursing homes under contract to PACE means less choice for participants and possibly more out-of-network nursing home terminations for PACE. The quality and level of reimbursement of the nursing homes under contract could also be a reason for out-of-network placement and again PACE sites have to balance costs to the program versus quality and continued participation. A high out-of-network disenrollment rate has negative cost implications for Ohio’s Medicaid program. We recommend that out-of-network nursing home use be reviewed carefully by both the PACE sites and by state administration.

40
The PACE Medicaid reimbursement system used by the state is out of date. Last modified in 2005, the current rate setting methodology relies on the regional variation in nursing home and PASSPORT waiver expenditures. This approach results in a lower Medicaid rate for McGregor PACE compared to SeniorLink. The state did not use this regional variation rate in the newly developed assisted living Medicaid waiver rate, and has worked to reduce variation in both nursing facility and home care reimbursement across the state. There does not appear to be any differences between the two sites that would justify the rate differentials. In fact, the McGregor PACE participants are older, more likely to have dementia and are as disabled or more so compared to SeniorLink. And the CMS payment rate for Medicare, based on severity of the case-mix, is actually higher for McGregor. We recommend that the Medicaid rate be comparable for the two PACE sites. The Ohio Departments of Aging and Job and Family Services should review the mechanism used to set the monthly rates.
Once PACE has clarified program goals on the target population to be served a major operational question that must be addressed is: Should PACE, as a provider funded by a capitated payment, be the entity determining eligibility for its own program? The argument in favor of internal eligibility determination is that it is easier for the consumer and more efficient for the system for an applicant to meet with a representative of PACE to receive an overview of the program and an eligibility determination process during the same visit. On the other hand, under the financing approach in PACE, the pressures to enroll individuals is substantial, and allowing each site to determine eligibility has at least the appearance of conflict of interest. Even though a state inspection of PACE applicants is built into the process, typically through a paper review of the assessment form, PACE is consistently criticized for serving a population with lower levels of disability compared to other long-term care programs. Recent questions about whether PACE participants met level of care on their annual review have also been raised by state officials.
One other related problem involves the PACE relationship with the area agencies on aging. SeniorLink has a strained relationship with the area agency in Cincinnati and McGregor has a cordial one, but in neither site is there a good collaborative relationship between the organizations. If the objective of the long-term services system is to ensure that individuals have the choice to enroll in the program that best meets their needs, the partnership between PACE and PASSPORT Administrative Agencies should be a priority for both organizations. In a high-functioning community based care system, there would be a strong partnership between these two entities.

41
We recommend that the eligibility determination for PACE be done by an independent entity. This change would be beneficial to the PACE sites and the overall system. Using one front door to the system could also improve the coordination and partnership between PACE and the area agencies on aging.
A problem with data comparability across PACE sites and with PASSPORT was identified during the study. In some instances it appeared that the two PACE sites, although using the same assessment instrument, defined and measured items in different ways. We also saw examples, such as medication administration and need for 24-hour supervision, where PACE and PASSPORT were not collecting comparable data. Compounding these challenges were years where much of the PACE data were recorded on paper forms only, rather than in an electronic system. Although electronic records are now being used, data comprehensiveness and comparability issues remain. We recommend that common assessment data be collected across the array of programs that serve similar long-term populations and the Ohio Departments of Aging and Job and Family Services establish sound quality review mechanisms to monitor data collection performance on these measures. Factors for Expansion
Both sites discussed the tremendous financial commitment required by the host organization. SeniorLink operated at a financial loss for the first eight years of operation and McGregor PACE, operating in some ways like a new start-up site, continues to operate at a loss as of the writing of this report. Administrative staff suggested that a new PACE site would need a four-to-five million dollar investment to begin the program.
In addition to the commitment of the host organization, the need for a strong commitment from the state to the PACE model was identified as a key issue by both sites. Respondents wanted to be assured that the PACE model fits into the state’s overall long-term services and supports system. The PACE interface with the new integrated care programs and health home intervention is critical to future success. The development of a new PACE site should include involvement with the long-term services network, including the integrated care demonstrations, PASSPORT and Assisted Living Waiver Program. These programs should not be seen as competitors, but as partners in the long-term services system.

42
Should the state explore expansion, staff at both sites talked about their willingness to assist a new organization in program design and implementation. The two sites currently share information. The McGregor PACE site administrative staff talked positively about the assistance that they received from SeniorLink during their transition start-up period. PACE is a very different type of program, and staff education about the philosophy and management of the model is considered to be essential.
A final planning issue for both the state and a new PACE site involves size of the program. Because PACE sites receive capitated funding, there is a strong incentive to build enrollment. Having adequate enrollment is important to keep administrative costs and overhead low, and also to spread catastrophic risk over a higher number of covered lives, since PACE sites are financially responsible for all participant costs. On the other hand, the PACE model is a very intense, hands-on, participant-specific intervention. At the daily “stand-up meeting,” staff talk about every person who is in a special circumstance that day, such as those in a nursing home, hospital or even sick at home. Thus, PACE finds itself in the difficult position of needing to be big enough to manage risk, but small enough to manage quality. To achieve that optimum number requires the state and the PACE sites to be working in partnership. We recommend that the state make a clear decision on how PACE fits in to the overall long-term services and integrated care plan for Ohio and that it build on the expertise of the current operators if efforts are put in place for expansion.
The lack of complete Medicare data for this evaluation is a serious limitation. Although CMS has committed to making Medicare data available to the state, this did not happen in the short time frame for the study. A review of Medicare costs is essential to presenting a complete picture of the cost effectiveness of PACE. A second limitation of this study was that we did not have time to access or track and compare individual-level data in which health and functional status over time could be analyzed. We did not have individual linked data on functional ability, and total costs of care, which have been shown in previous studies to be impacted by PACE enrollment. We also did not collect data on quality of life, which has been impacted in previous studies. All of the assessment data used in the study were collected by the program. Because these data are used to determine eligibility they appear to vary across the two PACE sites. Verification of the assessment information collected by the PACE sites, was not part of the evaluation. Another major limitation was a very small sample size for McGregor in the later years of the analysis. Finally, our site visit to McGregor PACE painted a portrait of a dedicated staff working to improve a program that

43
had been found to be inadequate by state and federal regulators, but the evaluation time period meant that the results generated were driven by much of the work done by the previous host organization. We recommend that a more extensive evaluation of PACE be undertaken by the state that includes: complete Medicare cost data; the ability to track linked individual level data over time; inclusion of quality of life measures, and a mechanism to better evaluate the effects on participants in McGregor PACE.

44
REFERENCES
AARP. (2012). On the verge: The transformation of long-term services and supports. Research report. Washington, DC.: AARP Public Policy Institute.
Beauchamp, J., Cheh, V., Schmitz, R., Kemper, R., & Hall, J. (2008). The effects of the program
of all-inclusive care for the elderly (PACE) on quality. Princeton, NJ.: Mathematica Policy Research, Inc.
Chatterji, P., Burstein, N.R., Kidder, D. & White, A. (1998). Evaluation of the program of all-inclusive care for the elderly (PACE) demonstration. The impact of PACE on participant outcomes. Final. Cambridge, MA: Abt Associates, Inc.
Eiken, S., Sredl, K., Burwell, B., & Gold, L. (2011). Medicaid long-term expenditures in FY
2010. Boston, MA: Thomson-Reuters. Foster, L., Schmitz, R., & Kemper, P. (2007). The effect of PACE on Medicare and Medicaid
expenditures. Princeton, NJ.: Mathematica Policy Research, Inc. Gross, D., Temkin-Greener, H., Kunitz, K., & Mukamel, D. (2004). The growing pains of
integrated healthcare for the elderly: lessons from the expansion of PACE. The Millbank Quarterly, 82(2), 257-282.
Health Care Financing Review. (2012). Statistical Supplement. Retrieved May 23, 2012 from
http://www.cms.gov/MedicareMedicaidStatSupp. Irvin, C., Massey, S., & Dorsey, T.C. (1998). Evaluation of PACE demonstration determinants
of enrollment among applicants to the PACE program. Cambridge, MA: Abt Associates, Inc.
Kaiser Family Foundation. (2011). Dual eligibles: Medicaid’s role for low income Medicare
beneficiaries. Retrieved May 28, 2012 from http://www.kaiserhealthnews.org. Komisar,H.L., & Feder.J. (2011). Transforming care for Medicaid beneficiaries with chronic
conditions and long-term care needs: Coordinating care across all services. Washington DC.: Georgetown Public Policy Institute, Georgetown University.
Leutz, W.N. (1999). Five laws for integrating medical and social services: Lessons from the
United States and the United Kingdom. The Millbank Quarterly, 77(1), 77-110. Mancuso, D., Yamashiro, G., & Filver, B. (2005). PACE an evaluation. Olympia, WA:
Department of Social and Health Services, Research and Data Analysis Division. McGregor PACE. (2012). http://www.mcgregorpace.org. Mehdizadeh, S. and Applebaum, R. (2012). Providing data to improve Ohio’s long-term services
and supports system (First Three Indicators). Oxford, OH: Scripps Gerontology Center, Miami University.

45
Mehdizadeh S., Applebaum, R., Deacon, M., & Straker, J. (2010). Providing long-term services and supports to an aging Ohio: Progress and challenges. Oxford, OH: Scripps Gerontology Center, Miami University.
Mehdizadeh, S., Applebaum, R., Nelson, I.M., & Straker, J. (2011). Coming of age: Tracking the
progress and challenges of delivering long-term services and supports in Ohio. Oxford, OH: Scripps Gerontology Center, Miami University.
Mukamel, D.B., Peterson, D.R., Temkin-Greener, H., Delaven, R,. Gross, D., Kunitz, S.J., &
Williams, T.F. (2007). Program characteristics and enrollees outcomes in the program of all-inclusive care for the elderly (PACE). The Millbank Quarterly, 83(3), 499-531.
Mukamel, D.B., Peterson, D.R., Temkin-Greener, H., Delaven, R,. Gross, D., Kunitz, S.J., &
Williams, T.F. (2006). Team performance and risk adjusted health outcomes in the program of all-inclusive care for the elderly (PACE). The Gerontologist, 46(2), 227-237.
National PACE Association. (2012). What is PACE? Available at http://www.npaonline.org.
Salvi, F., Miller, M.D., Grilli, A., Giorgi, R., Towers, A.L., Norichi, V., Spazzafumo, L., Manicinelli, L., Espinosa, E., Rappelli, A., & Dessi-Fulgheri. (2008). A manual of guidelines to score the modified cumulative illness rating scale and its validation in acute hospitalized elderly patients. Appendix S1. Manual of guidelines for scoring the modified cumulative illness rating scale (CIRS). Journal of the American Geriatrics Society, 56: 1926-1931.
TriHealth Seniors Health (2012). SeniorLink. Available at http://www.trihealthseniorshealth.com/seniorlink/.
Weiland, D., Boland, R., Baskins, J., & Kinosian, B. (2010). Five year survival in PACE compared with alternative institutional and home and community based care. J Gerontol Sci Med Sci Doi: 10.1093/Gerona/glq040
White, A.J., Abel, Y., & Kidder, D. (2000). Evaluation of the program of all-inclusive care for
the elderly (PACE) demonstration. A comparison of the PACE capitation rates to projected costs in the first year of enrollment. Final report. Baltimore, MA: Abt Associates, Inc.

46
APPENDIX A
Table 1 Literature Review of PACE Evaluation Studies (1998-2010) Outcome Studies
Title/Citation
Research Methodology
Outcome Measures
Research Findings
Evaluation of the Program of All-Inclusive Care for the Elderly (PACE) Demonstration The Impact of PACE on Participant Outcomes Final P.Chatterji; N.R.Burstein; D.Kidder; A.White 1998
Quasi-experimental Comparison of PACE enrollees to PACE applicants who declined enrollment
-Impact of PACE on health services utilization and several measures of outcomes: Health and functional status, quality of life and satisfaction with services
-Lower rate of hospitalization and nursing home utilization than comparison group; higher utilization of ambulatory services; less deterioration of physical functioning; lower mortality rate; magnified for those participants with high levels of physical impairment
Evaluation of the Program of All-Inclusive Care for the Elderly (PACE) Demonstration A Comparison of the PACE Capitation Rates to Projected Costs in the First Year of Enrollment Final Report A.J.White; Y.Abel; D.Kidder 2000
Quasi-experimental Comparison of PACE enrollees to PACE applicants who declined enrollment
-Comparison of capitation payments by PACE sites to estimate of costs of first year in FFS system. -Outcomes associated with participation in PACE: measures of health status and quality of life.
-In the first 12 months following enrollment, the Medicare capitation rate was 42% lower than the projected Medicare payments in the absence of PACE. Payments were lower than best estimate of what payments would have been had PACE enrollees remained in the FFS setting in the first year of enrollment. -We found that participation in PACE was associated with improvements in several measures of health status and quality of life, including increased life expectancy, fewer hospital and nursing home days, better (self-reported) health status, higher general satisfaction with life, and greater satisfaction with overall care

47
Title/Citation
Research Methodology
Outcome Measures
Research Findings
PACE: An Evaluation D.Mancuso; G.Yamashiro; B.Filver 2005
Quasi-experimental Compare outcomes for PACE clients to outcomes for clients receiving care in other LTC service modalities Propensity score matching methodology
-Assess mortality functional status -Cost outcomes of clients enrolled in PACE compared to outcomes of clients who receive other LTC services
-PACE participants have lower risk of dying -PACE participants experience greater stability in physical functioning -PACE participants are much more expensive than HCBS clients -Gap between PACE and HCBS clients narrows due to rising nursing home costs for HCBS group -Desirable for PACE to enroll participants who face greater risk of institutionalization
The Effect of PACE on Medicare and Medicaid Expenditures L.Foster; R.Schmitz; P.Kemper 2007
Quasi-experimental Comparison of expenditures for participants in any of 17 PACE organizations to expenditures predicted from a comparison sample of enrollees in HCBS under Medicaid waivers in PACE market area Propensity score matching methodology
-Estimates of the impact of PACE on Medicare and Medicaid expenditures in the first 60 and 24 months, respectively, after beneficiaries entered the PACE program relative to the expenditures that would have prevailed had they not enrolled in PACE
Two sets of findings: 1.Contrasting mean per-person-per-month expenditures: -Monthly Medicare expenditures similar for the two groups -Monthly Medicaid for PACE exceeded matched group – large and significant but diminishing from first to fourth quarter 2.Comparing actual PMPM of PACE group with predicted expenditures using regression model: -Differences in Medicare: insignificant -Differences in Medicaid: large but diminished over time with PACE having higher Medicaid expenditures

48
Title/Citation
Research Methodology
Outcome Measures
Research Findings
The Effects of the Program of All-Inclusive Care for the Elderly (PACE) on Quality J.Beauchamp; V.Cheh; R.Schmitz; P.Kemper; J.Hall 2008
Quasi-experimental Compared survey responses from PACE enrollees to responses from a comparable group of enrollees in HCBS waiver programs in the same states as the PACE programs Propensity score matching methodology
Four major topic areas: -Outcomes associated with care management -Healthcare utilization -Health status and symptoms -Satisfaction with care
-PACE improved healthcare management outcomes; better health outcomes; improved preventive healthcare utilization; reduced hospital use; few depressive symptoms; more behavioral incidents -HCBS and PACE clients satisfied with quality of life; medical and personal care
Five-Year Survival in PACE Compared With Alternative Institutional and HCBS D.Weiland; R.Boland; J.Baskins; B.Kinosian 2010
Quasi-experimental Two county region in S. Carolina contrast long-term survival among entrants to an aged and disabled waiver program, PACE, and nurs. homes.
-Years to Death –HCBS -Years to Death– PACE -Years to Death – Nursing Home -Years to Death – low risk -Years to Death – mod. risk -Years to Death – high risk
-At admission: PACE participants significantly higher mortality risk than HCBS clients and greater burden of cognitive impairments and disabilities -Stratifying for mortality risk – PACE participants has substantiated long-term survival advantage compared to HCBS into fifth year follow-up

49
Process Studies
Title/Citation Research
Methodology
Outcome Measures
Research FindingsEvaluation of PACE Demonstration Determinants of Enrollment Among Applicants to the PACE Program C.Irvin; S.Massey; T.C.Dorsey 1998
Qualitative Comparison Survey of PACE applicants in 10 PACE demonstration sites; characteristics of applicants described and compared to samples of elders described in the literature
-Demographics -Measures of health -Physical dependencies -Prior access to care
-PACE demonstration applicants disproportionately represent minority groups and have low educational attainment levels and income compared to samples of elders in other innovative programs. -Demographic characteristics associated with enrollment: gender, low educational attainment, home ownership. -Number of dependencies in ADLs was not found to be associated with enrollment. -Applicant’s access to medical care significantly influences enrollment
The Growing Pains of Integrated Health Care for the Elderly: Lessons from the Expansions of PACE D.Gross; H.Temkin-Greener; S.Kunitz; D.Mukamel 2004
Qualitative; Secondary Data Analysis Three Sources of Data: DataPACE Interviews with administrators, medical directors, financial officers at 27 PACE sites Follow-up surveys to administrators
-Enrollment trends -Program, governmental and environmental factors that impede growth
-Model of care serving vulnerable, costly population with demonstrated efficacy and cost effectiveness, PACE is important component of LTC options that offer elders and caregivers access to high quality care. -Foster development of integrated healthcare delivery programs and commitment of funds to encourage programs like PACE. -Barriers to expansion include: Competition; PACE model characteristics; poor understanding of model among referral sources; lack of financing for expansion.

50
Title/Citation Research
Methodology
Outcome Measures
Research FindingsTeam Performance and Risk Adjusted Health Outcomes in PACE D.B.Mukamel; D.R.Peterson; H.Temkin-Greener; R.Delaven; D.Gross; S.J.Kunitz; T.F.Williams 2006
Quasi-experimental Examine association between interdisciplinary teams and overall performance and risk adjusted health outcomes of program enrollees
-Interdisciplinary team provides better care -Persons enrolled with better functioning teams will experience better health outcomes -The effect of the interdisciplinary team on health outcomes -The effect of the interdisciplinary team on mortality rates
-Team performance is associated with better participant outcomes -Communication among team members is an important aspect of good team functioning -Team effectiveness improves patient quality of life -There was a lack of association between interdisciplinary teams and mortality rates
Program Characteristics and Enrollees Outcomes in PACE D.B.Mukamel; D.R.Peterson; H.Temkin-Greener; R.Delaven; D.Gross; S.J.Kunitz; T.F.Williams 2007
Quasi-experimental Combined individual data on health outcomes and risk factors at enrollment with characteristics of each PACE program
-Identify program characteristics associated with better risk-adjusted health outcomes: mortality, functional status, level of self-assessed health after enrollment
-Persons enrolled in programs with a geriatrician had better functional outcomes -Programs with more effective teams were associated with better functional outcomes at 12 months -Staff with more aides than professionals; more ethnic similarities between aides/enrollees was associated with better functional outcomes -Better outcomes associated with larger/older programs -Higher percentage of enrollees living alone – worse outcomes -Lower mortality rate: more professionals -Lower mortality rate: higher concentration of services

51
APPENDIX B

52