Embed Size (px)
Citation preview

Evaluation of Norway’s Bilateral Agricultural Support to Food Security
Report 9/2012
NoradNorwegian Agency forDevelopment Cooperation
Postal addressP.O. Box 8034 Dep. NO-0030 OSLOVisiting addressRuseløkkveien 26, Oslo, Norway
Tel: +47 23 98 00 00 Fax: +47 23 98 00 99
No. of Copies: 220 [email protected] www.norad.no
Evaluation Department
landbruk og matsikkerhet omslag til trykk.indd 1 15.04.13 11:28

NoradNorwegian Agency for Development CooperationP.O.Box 8034 Dep, NO-0030 OsloRuseløkkveien 26, Oslo, Norway
Tel: +47 23 98 00 00 Fax: +47 23 98 00 99
Photo: IstockPhotoDesign: Siste Skrik KommunikasjonPrint: Network Broking/Bjerch TrykkeriISBN: 978-82-7548-686-6
EVALUATION REPORTS
2.00 Norwegian Support to the Education Sector. Overview of Policies and Trends 1988–1998
3.00 The Project “Training for Peace in Southern Africa”4.00 En kartlegging av erfaringer med norsk bistand gjennomfrivillige
organisasjoner 1987–19995.00 Evaluation of the NUFU programme6.00 Making Government Smaller and More Efficient.The Botswana
Case7.00 Evaluation of the Norwegian Plan of Action for Nuclear Safety
Priorities, Organisation, Implementation8.00 Evaluation of the Norwegian Mixed Credits Programme9.00 “Norwegians? Who needs Norwegians?” Explaining the Oslo Back
Channel: Norway’s Political Past in the Middle East10.00 Taken for Granted? An Evaluation of Norway’s Special Grant for the
Environment1.01 Evaluation of the Norwegian Human Rights Fund2.01 Economic Impacts on the Least Developed Countries of the
Elimination of Import Tariffs on their Products3.01 Evaluation of the Public Support to the Norwegian NGOs Working in
Nicaragua 1994–19993A.01 Evaluación del Apoyo Público a las ONGs Noruegas que Trabajan
en Nicaragua 1994–19994.01 The International Monetary Fund and the World Bank Cooperation
on Poverty Reduction5.01 Evaluation of Development Co-operation between Bangladesh and
Norway, 1995–20006.01 Can democratisation prevent conflicts? Lessons from sub-Saharan
Africa7.01 Reconciliation Among Young People in the Balkans An Evaluation of
the Post Pessimist Network1.02 Evaluation of the Norwegian Resource Bank for Democracyand
Human Rights (NORDEM)2.02 Evaluation of the International Humanitarian Assistance of the
Norwegian Red Cross3.02 Evaluation of ACOPAMAn ILO program for “Cooperative and
Organizational Support to Grassroots Initiatives” in Western Africa 1978 – 1999
3A.02 Évaluation du programme ACOPAMUn programme du BIT sur l’« Appui associatif et coopératif auxInitiatives de Développement à la Base » en Afrique del’Ouest de 1978 à 1999
4.02 Legal Aid Against the Odds Evaluation of the Civil Rights Project (CRP) of the Norwegian Refugee Council in former Yugoslavia
1.03 Evaluation of the Norwegian Investment Fund for Developing Countries (Norfund)
2.03 Evaluation of the Norwegian Education Trust Fund for Africain the World Bank
3.03 Evaluering av Bistandstorgets Evalueringsnettverk1.04 Towards Strategic Framework for Peace-building: Getting Their Act
Togheter.Overview Report of the Joint Utstein Study of the Peacebuilding.
2.04 Norwegian Peace-building policies: Lessons Learnt and Challenges Ahead
3.04 Evaluation of CESAR´s activities in the Middle East Funded by Norway
4.04 Evaluering av ordningen med støtte gjennom paraplyorganiasa-joner. Eksemplifisert ved støtte til Norsk Misjons Bistandsnemda og Atlas-alliansen
5.04 Study of the impact of the work of FORUT in Sri Lanka: Building CivilSociety
6.04 Study of the impact of the work of Save the Children Norway in Ethiopia: Building Civil Society
1.05 –Study: Study of the impact of the work of FORUT in Sri Lanka and Save the Children Norway in Ethiopia: Building Civil Society
1.05 –Evaluation: Evaluation of the Norad Fellowship Programme2.05 –Evaluation: Women Can Do It – an evaluation of the WCDI
programme in the Western Balkans3.05 Gender and Development – a review of evaluation report
1997–20044.05 Evaluation of the Framework Agreement between the Government
of Norway and the United Nations Environment Programme (UNEP)5.05 Evaluation of the “Strategy for Women and Gender Equality in
Development Cooperation (1997–2005)”1.06 Inter-Ministerial Cooperation. An Effective Model for Capacity
Development?2.06 Evaluation of Fredskorpset1.06 – Synthesis Report: Lessons from Evaluations of Women and
Gender Equality in Development Cooperation1.07 Evaluation of the Norwegian Petroleum-Related Assistance1.07 – Synteserapport: Humanitær innsats ved naturkatastrofer:En
syntese av evalueringsfunn1.07 – Study: The Norwegian International Effort against Female Genital
Mutilation2.07 Evaluation of Norwegian Power-related Assistance2.07 – Study Development Cooperation through Norwegian NGOs in
South America3.07 Evaluation of the Effects of the using M-621 Cargo Trucks in
Humanitarian Transport Operations4.07 Evaluation of Norwegian Development Support to Zambia (1991
- 2005)5.07 Evaluation of the Development Cooperation to Norwegion NGOs in
Guatemala1.08 Evaluation: Evaluation of the Norwegian Emergency Preparedness
System (NOREPS)1.08 Study: The challenge of Assessing Aid Impact: A review of
Norwegian Evaluation Practise1.08 Synthesis Study: On Best Practise and Innovative Approaches to
Capasity Development in Low Income African Countries
2.08 Evaluation: Joint Evaluation of the Trust Fund for Enviromentally and Socially Sustainable Development (TFESSD)
2.08 Synthesis Study: Cash Transfers Contributing to Social Protection: A Synthesis of Evaluation Findings
2.08 Study: Anti- Corruption Approaches. A Literature Review3.08 Evaluation: Mid-term Evaluation the EEA Grants4.08 Evaluation: Evaluation of Norwegian HIV/AIDS Responses5.08 Evaluation: Evaluation of the Norwegian Reasearch and Develop-
ment Activities in Conflict Prevention and Peace-building6.08 Evaluation: Evaluation of Norwegian Development Cooperation in
the Fisheries Sector1.09 Evaluation: Joint Evaluation of Nepal´s Education for All 2004-2009
Sector Programme1.09 Study Report: Global Aid Architecture and the Health Millenium
Development Goals2.09 Evaluation: Mid-Term Evaluation of the Joint Donor Team in Juba,
Sudan2.09 Study Report: A synthesis of Evaluations of Environment Assistance
by Multilateral Organisations3.09 Evaluation: Evaluation of Norwegian Development Coopertation
through Norwegian Non-Governmental Organisations in Northern Uganda (2003-2007)
3.09 Study Report: Evaluation of Norwegian Business-related Assistance Sri Lanka Case Study
4.09 Evaluation: Evaluation of Norwegian Support to the Protection of Cultural Heritage
4.09 Study Report: Norwegian Environmental Action Plan5.09 Evaluation: Evaluation of Norwegian Support to Peacebuilding in
Haiti 1998–20086.09 Evaluation: Evaluation of the Humanitarian Mine Action Activities of
Norwegian People’s Aid7.09 Evaluation: Evaluation of the Norwegian Programme for Develop-
ment, Research and Education (NUFU) and of Norad’s Programme for Master Studies (NOMA)
1.10 Evaluation: Evaluation of the Norwegian Centre for Democracy Sup-port 2002–2009
2.10 Synthesis Study: Support to Legislatures3.10 Synthesis Main Report: Evaluation of Norwegian Business-related
Assistance4.10 Study: Evaluation of Norwegian Business-related Assistance South
Africa Case Study5.10 Study: Evaluation of Norwegian Business-related Assistance
Bangladesh Case Study6.10 Study: Evaluation of Norwegian Business-related Assistance
Uganda Case Study7.10 Evaluation: Evaluation of Norwegian Development Cooperation with
the Western Balkans8.10 Evaluation: Evaluation of Transparency International9.10 Study: Evaluability Study of Partnership Initiatives10.10 Evaluation: Democracy Support through the United Nations11.10 Evaluation: Evaluation of the International Organization for
Migration and its Efforts to Combat Human Trafficking12.10 Evaluation: Real-Time Evaluation of Norway’s International Climate
and Forest Initiative (NICFI)13.10 Evaluation: Real-Time Evaluation of Norway’s International Climate
and Forest Initiative. Country Report: Brasil14.10 Evaluation: Real-Time Evaluation of Norway’s International Climate
and Forest Initiative. Country Report: Democratic Republic of Congo15.10 Evaluation: Real-Time Evaluation of Norway’s International Climate
and Forest Initiative. Country Report: Guyana16.10 Evaluation: Real-Time Evaluation of Norway’s International Climate
and Forest Initiative. Country Report: Indonesia17.10 Evaluation: Real-Time Evaluation of Norway’s International Climate
and Forest Initiative. Country Report: Tanzania18.10 Evaluation: Real-Time Evaluation of Norway’s International Climate
and Forest Initiative1.11 Evaluation: Results of Development Cooperation through
Norwegian NGO’s in East Africa2.11 Evaluation: Evaluation of Research on Norwegian Development
Assistance3.11 Evaluation: Evaluation of the Strategy for Norway’s Culture and
Sports Cooperation with Countries in the South4.11 Study: Contextual Choices in Fighting Corruption: Lessons Learned5.11 Pawns of Peace. Evaluation of Norwegian peace efforts in Sri
Lanka, 1997-20096.11 Joint Evaluation of Support to Anti-Corruption Efforts, 2002-20097.11 Evaluation: Evaluation of Norwegian Development Cooperation to
Promote Human Rights8.11 Norway’s Trade Related Assistance through Multilateral Organiza-
tions: A Synthesis Study9.11 Activity-Based Financial Flows in UN System: A study of Select UN
Organisations Volume 1 Synthesis Volume 2 Case Studies10.11 Evaluation of Norwegian Health Sector Support to Botswana1.12 Mainstreaming disability in the new development paradigm.
Evaluation of Norwegian support to promote the rights of persons with disabilities.
2.12 Hunting for Per Diem. The uses and Abuses of Travel Compensa-tion in Three Developing Countries
3.12 Evaluation of Norwegian Development Cooperation with Afghani-stan 2001-2011
4.12 Evaluation of the Health Results Innovation Trust Fund5.12 Real-Time Evaluation of Norway’s International Climate and Forest
Initiative. Lessons Learned from Support to Civil Society Organisations.6.12 Facing the Resource Curse: Norway’s Oil for Development Program7.12 A Study of Monitoring and Evaluation in Six Norwegian Civil Society
Organisations8.12 Use of Evaluations in the Norwegian Development Cooperation
System
The report is the product of its authors, and responsibility for the accuracy of data included in this report rests with the authors. The findings, interpretations and conclusions presented do not necessarily reflect the views of Norad Evaluation Department.
Evaluation of Norway’s Bilateral Agricultural Support to Food Security
April 2013Particip
Disclaimer:The report is the product of its authors, and responsibility for the accuracy of data included in this report rests with the authors. The findings, interpretations and conclusions presented do not necessarily reflect the views of Norad Evaluation Department.
Note on layout and languageThe layout of the document has tried to conform to guidelines for accessibility and ease of reading, which require Arial font and left (not full) justification of the text.
The report has tried to avoid unnecessary use of acronyms and abbreviations.
Evaluation of Norwegian support to agriculture and food security iii
Preface
The paths to food security are many. Some of them are linked to agriculture. This evaluation was commissioned to find out to what extent Norwegian bilateral assistance to agriculture has contributed to food security. We wanted to assess this regardless of whether food security figured as a prominent goal of a given agricultural program or not.
The evaluators were asked to concentrate on the big money – the largest recipient organisations, institutions and programs of Norwegian support. As a result, we think the evaluation is more representative of the overall agricultural support than the sheer number of projects or programs directly studied – 25 – indicates.
Of the report’s 11 annexes, only one – the terms of reference of the evaluation - is included in the printed report. Annexes 2 to 11 contain extensive documentation of methods, findings and how the evaluation was carried out. They can be found on www.norad.no/evaluering.
The evaluation was commissioned and managed by the Evaluation Department of Norad (the Norwegian Agency for Development Cooperation) and carried out by the consultancy company Particip GmbH. The company is responsible for the content of the report, including the findings, conclusions and recommendations.
Oslo, April 2013
Hans Peter Melby Acting Head, Evaluation Department

Evaluation of Norwegian support to agriculture and food securityiv
Evaluation of Norwegian support to agriculture and food security v
Acknowledgements
The evaluation team wishes to thank all people who contributed to this evaluation by making themselves available to answer our numerous questions, often at very short notice. We thank them for their willingness to share information and to discuss the challenges and successes of their work. It has been a privilege to meet the various beneficiaries, project management teams, stakeholders, Governmental staff, donors and consultants.
We would also like to express our gratitude to Norad, the Ministry of Foreign Affairs and the Embassies that were part of the study, as well as Norfund and Fredskorpset Norway (FK Norway) for the support given to the evaluation team during the entire evaluation exercise. We thank especially the Evaluation Department of Norad (EVAL) for their assistance and flexibility during this evaluation.
The Evaluation of Norwegian support to agriculture and the contribution to food security was conducted by Particip GmbH (www.particip.de), with the following Evaluation Team:
Core teamPernille Nagel Sørensen, Team Leader (Independent Consultant) Vincent Lefebvre, Agricultural Expert (Independent Consultant) Charles Wright, PETS Expert (Independent Consultant)
National TeamBethel Nakakonda, Agricultural Expert (Independent Consultant), Zambia Martina Perino, PETS Expert (Independent Consultant), Zambia Edward Chisala, Agricultural Expert (Independent Consultant), Malawi Willie Kachaka, PETS Expert (Independent Consultant), Malawi Omari Selemani, Agricultural and PETS Expert (Independent Expert), Tanzania
Management and AssistanceGeorg Ladj (Project Director, Particip) Sarah Seus (Project Manager, Particip)

Evaluation of Norwegian support to agriculture and food securityvi
Quality AssuranceFerko Bodnar, Peer Reviewer (Food Security and Agricultural Expert) Hampus Pihl, Peer Reviewer (Financial Analysis, International Business Administration)
This report is the product of its authors, and responsibility for the accuracy of data included in this report rests with the authors. The findings, interpretations, and conclusion presented in this report do not necessarily reflect the views of EVAL.
Evaluation of Norwegian support to agriculture and food security vii
Table of Contents
Preface xii Acknowledgements v Table of Contents vii List of Acronyms and Abbrevations xi Executive summary xiii 1 Introduction 3 1.1 Objective and scope of evaluation 3 1.2 Evaluation Questions 3 2 Methodology and analytical framework 5 2.1. Analytical framework 5 2.2 Overall methodology and main tools 7 2.3 Evaluation process 9 2.4 Selection of projects 10 2.5 Challenges and constraints 14 3 Overview of Norwegian Support to Agriculture 2005-2011 16 3.1 Strategies and policies 16 3.2 The Norwegian Agriculture Portfolio (2005-2011) 19 4 Evaluation Questions: Results and analysis 27 4.1 Cluster 1: Contribution to food security 27 4.1.1 Relevance (EQ1) 28 4.1.2 Design/programme theories (EQ2) 32 4.1.3 Actual or expected contribution to food security (EQ3) 46 4.2 Cluster 2: Monitoring & evaluation (M&E) and documentation 53 4.2.1 M&E (EQ4) 53 4.2.2 Documentation (EQ5) 60 4.3 Cluster 3: Sustainability and scaling-up 62 4.3.1 Sustainability (EQ6) 63 4.3.2 Scaling-up (EQ7) 68 4.4 Cluster 4: Financial analysis, including PETS 71 4.4.1 Fungibility (EQ8) 71 4.4.2 Funds reaching target groups (EQ9) 74 5 Conclusions and recommendations 97 5.1 Overall Conclusions (Clusters 1-3) 97 5.2 Conclusions for Cluster 4 (Financial analysis) 100 5.3 Overall recommendations (Clusters 1-3) 101 6 Annexes 107 Annex 1: Terms of Reference (ToR) 108
Evaluation of Norwegian support to agriculture and food securityviii
For the following annexes see www.norad.no/evaluation
Annex 2: Survey instruments (evaluation matrix, including project fiche M&E online survey questionnaire)
Annex 3: Sampling of projects (from the Inception Report)
Annex 4: Overview of Norwegian support to agriculture, by country
Annex 5: In-depth case study reports
Annex 6: Light case study reports
Annex 7: Results of the online survey
Annex 8: PETS background information
Annex 9: Bibliography
Annex 10: List of people met
Annex 11: Itineraries

Evaluation of Norwegian support to agriculture and food security ix
List of Figures
Figure 1 Evaluation approach 8 Figure 2 Evaluation process and phases 9 Figure 3 Norwegian aid for the agriculture sector: Geographic distribution of funds − DAC sector 311 (Agriculture), 2005-2011 20 Figure 4 Norwegian aid for the agriculture sector: Disbursements per year (2005-2011), DAC sector 311 agriculture (in NOK) 21 Figure 5 Norwegian aid for the agriculture sector: Disbursed agricultural funds of the main recipient countries, 2005-2011 (in NOK) 22 Figure 6 Norwegian aid for the agriculture sector: Disbursement per extending agency, 2005-2011 (in NOK) 23 Figure 7 Norwegian aid for the agriculture sector: Extending agencies and their preferred type of channel (agreement partner), 2005-2011 23 Figure 8 Norwegian aid for the agriculture sector: Disbursement per type of agreement & implementing partners, 2005-2011 (in NOK) 25 Figure 9 Norwegian aid for the agriculture sector: Allocation of funds per implementing partner and geographical zone, 2005-2011 (in %) 26 Figure 10 Impact pathways for the selected programmes 34 Figure 11 Zambia: Comparison of changes in Government Expenditure and Donor Expenditure on Agriculture from 2006-2011 (in ZK billions) 72 Figure 12 Tanzania: Comparison of changes in government expenditure and donor expenditure on agriculture from 2005-2012/13 (in TZS billions) 73 Figure 13 Malawi: Comparison of changes in government expenditure and donor expenditure on agriculture from 2006-2012 (in MK millions) 74 Figure 14 CAP I: Model structure of a Regional Office 79 Figure 15 Malawi: NASFAM development expenditure by category (FY 2010/2011) 84 Figure 16 Malawi: NASFAM expenditure for Front Office and Back Office (FY 2010/201; in MK million) 85

Evaluation of Norwegian support to agriculture and food securityx
Figure 17 Malawi: Value of direct benefits to farmer − from NASFAM & NASCOMEX (2011, in US$ millions) 85 Figure 18 Nasfam, Staff employment by entity, 2011 86 Figure 19 Malawi: NASFAM group staffing analysis 2011 87 Figure 20 Tanzania: Mngeta Farm expenditure analysis: Front Office vs Back Office (FY 2010/2011; in US$) 93 Figure 21 Tanzania: Mngeta Rice Farm organigram 94
List of Tables Table 1 Evaluation Questions 4 Table 2 Five parameters of the sampled interventions 11 Table 3 List of 24 selected interventions + FK Norway thematic case study 12 Table 4 Sectoral distribution of Norwegian aid 2005-2011: DAC sector 311 and 410 19 Table 5 Likelihood and evidence of food security of the selected programmes 36 Table 6 Allocation of expenditure between Front Office and Back Office 78 Table 7 Allocation of staff between Front Office and Back Office 79 Table 8 Programme Outputs 80 Table 9 Comparison of rain-fed commercial farming vs SRISH profitability 92 Table 10 Tanzania: Mngeta Rice Farm: Department staffing levels – Front Office vs Back Office 94 Table 11 Tanzania: Mngeta Rice Farm: Cost-Benefit of the SRISH scheme 96
List of Boxes Box 1 Example of co-ordination problems: Norwegian support in Zambia 30 Box 2 Overview of FK Norway’s activities related to agriculture 35 Box 3 Example of FISP, Malawi 48 Box 4 Tanzania: Mngeta Rice Farm: Organisation of farming operations 95

Evaluation of Norwegian support to agriculture and food security xi
Acronyms and abbreviations ACE Agriculture Commodity Exchange for Africa ACF Agricultural Consultative Forum (Zambia) ARKFor African Wildlife Foundation - Advancing REDD in the Kolo Hills Forests ASP Agricultural Support Programme CA Conservation Agriculture CAP II Conservation Agriculture Programme II CASSP FAO-MACO Conservation Agriculture CATIE Centro Agronómico Tropical de Investigación y Enseñanza (The Tropical Agricultural Research and Higher Education Centre) CCIAM Climate Change Impacts, Adaptation and Mitigation in Tanzania CFU Conservation Farming Unit, Zambia COMACO Community Markets for Conservation DAC Development Assistance Committee (of the OECD) EPINAV Enhancing pro-poor innovations in natural resources EQ Evaluation Questions FAO Food and Agriculture Organisation FISP Farm Inputs Subsidy Programme GART Golden Valley Agricultural Research Trust, Zambia GCDT Adapting Agriculture to Climate Change: Collecting, Protecting and Preparing Crop Wild Relatives GDP Gross Domestic Product HH Household ICIMOD International Centre for Integrated Mountain Development IMCS Independent Management Consulting Services JC Judgment Criteria LDT Livestock Development Trust (Zambia) LSC Large Scale Commercial M&E Monitoring & Evaluation M&E system Monitoring & Evaluation system MACO Ministry of Agriculture and Co-operatives MAP Meso-American Agro-environmental Program MFA Ministry of Foreign Affairs, Norway MLBP Malawi Lake Basin Programme NASCOMEX NASFAM Commodity Marketing Exchange
NASFAM National Association of Smallholder Farmers in Malawi NEPAD The New Partnership for Africa's Development NGO Non-Governmental Organisation
Evaluation of Norwegian support to agriculture and food securityxii
NOK Norwegian Kroner Norad Norwegian Agency for Development Co-operation Norfund Norwegian Investment Fund for Developing Countries NTFE Non-Traditional Farm Enterprises NZTT Zambian Training Trust within Agricultural Support Intervention OECD Organisation for Economic Co-operation and Development PETS Public Expenditure Tracking Surveys PRSP Poverty Reduction Strategy Papers REDD Reducing Emissions from Deforestation and Degradation RFSP Rumphi Food Security Programme RO Regional Offices SMART Specific, Measurable, Accessible, Realistic, Time bound SRI System of Rice Intensification SRISH System of Rice Intensification for Smallholders scheme TAP Tanzanian Agricultural Partnership Programme TFESSD Environment & Socially Sustainable Development Trust Fund ToR Terms of Reference UN United Nations UNCCD United Nations Convention to Combat Desertification ZNFU Zambia National Farmers Union

Evaluation of Norwegian support to agriculture and food security xiii

Evaluation of Norwegian support to agriculture and food securityxiv
Evaluation of Norwegian support to agriculture and food security xv
Executive summary IntroductionThe purpose of this evaluation was “to assess to what extent Norwegian funds for agriculture have contributed to food security, with a view to get recommendations for future support”. The period under evaluation was 2005-2011. The evaluation focused on four aspects (clusters):
1. Contribution to food security. 2. Monitoring, evaluation and documentation. 3. Sustainability and scaling-up. 4. Financial analysis.
The programmes under review were chosen in accordance with the selection criteria outlined in the terms of reference (ToR), reflecting the project size, as well as the size of the agreement partner implementing projects classified as OECD/DAC 311 (agriculture) and DAC 410 (general environmental protection).
For the first three clusters, the evaluation focused on 25 programmes: 19 country-level programmes (in Malawi, Zambia, Tanzania, Nicaragua and Ethiopia), three regional programmes, two global programmes, and a case study of Fredskorpset Norway (FK Norway). For the Financial Analysis (Cluster 4), the three largest programmes under DAC 311 and DAC 410 were chosen in the three pre-selected countries, Zambia, Malawi and Tanzania (in accordance with the ToR). These countries were also included in the analysis of the first three clusters.
The evaluation took place during the period September 2012 to March 2013. The evaluation applied an evidence-based methodology by using triangulation of methods, combining quantitative and qualitative data collection tools, and primary and secondary data. Case study reports were prepared for all selected programmes, based on an Evaluation Matrix. Field visits were conducted in Zambia, Malawi and Tanzania, and in-depth case study reports were prepared for these programmes. For the programmes not visited (Ethiopia, Nicaragua, regional and global programmes, and FK Norway), light case study reports were prepared.
The Evaluation Team experienced a number of challenges and constraints during the evaluation process: 1) Identifying projects adhering to the selection criteria in the ToR was lengthy; 2) Time spent on the collection of project

Evaluation of Norwegian support to agriculture and food securityxvi
documentation was underestimated during the planning of the evaluation; 3) The loss of institutional memory, due to the long period under evaluation, led to problems in obtaining information in some instances; 4) Availability of data was limited in some cases; 5) Contribution Analysis was an overarching challenge, in particular in relation to regional, research and global programmes; 6) External validity of selected programmes represented a challenge, due to the relatively limited number of programmes within each sub-category (national, regional, global) and the diverse nature of the programmes (e.g. NGO, government, investment programmes) − particularly in the case of regional and global programmes (five programmes in total); 6) Problems with retrieving data from the database on Norwegian Aid for agriculture and environment constrained the project selection process.
Findings and conclusions Cluster 1: Contribution to food securityOverall, the evaluation found that Norway’s strong focus on country-level interventions was positive. The analysis of the selected programmes showed that this type of intervention was more likely to contribute directly to food security and was, to a greater extent, co-ordinated and aligned with the national policy framework of the targeted countries than regional-level interventions. During the period 2005-2011, 75% of the bilateral aid to agriculture was channelled directly to country-level interventions. Nevertheless, Norwegian aid to agriculture and environment 2005-2011 was disbursed to a relatively high number of extending agencies (Norad, MFA, FK Norway, Norfund, and embassies), and the evaluation team found limited collaboration and co-ordination between the various extending agencies, both at central level (Norway) and at country level. This was the case even if the same type of programmes were funded by different agencies (e.g. in the case of Conservation Agriculture/Farming − CA/CF), and this clearly limited synergy effects.
The selected country-level programmes were found to be well-aligned with national food security/agricultural strategies and policies. The majority of country-level programmes were relatively well co-ordinated by the implementing partners. NGO programmes were, in most cases, co-ordinated with other NGO projects and food security platforms, but to a less extent with government offices. Government-implemented programmes were reasonably well co-ordinated at donor level, but less so with NGOs. Regional and global programmes appeared less well co-ordinated both within the implementing countries and with other programmes.
The selected programmes were noticeably aligned with the Norwegian policy framework: the “Norwegian Plan of Action for Agriculture in Norwegian Development Policy” (2004), and White Paper 14 (2010-2011): “Towards Greener Development: on a Coherent Environmental and Development Policy” (2011). The main relevance of the White Paper is the reference to past interventions and the links to the proposed strategic interventions from 2011 onwards. Regardless
Evaluation of Norwegian support to agriculture and food security xvii
of whether food security/improved livelihoods were explicit objectives, there was a clear poverty alleviation emphasis focusing on small-holder farmers and partly on pastoralists, and/or on the adaptation to climate change − including, as a main component, climate-adapted agricultural methods (e.g. CA) and research (global crop diversity). The programmes funded by Norfund reflected the development of the agricultural sector as part of private sector development, which was also part of the 2004 Action Plan for Agriculture. However, the emphasis on the right to adequate food and adequate living in the 2004 Plan of Action was not well reflected in the selected programmes. In addition, the strong focus on gender − defined as women’s rights and participation in agricultural development − was not well integrated. Even though several programmes included activities focusing on women, only two programmes explicitly focused on women’s participation in agriculture at objective and results levels.
Due to their poverty alleviation focus and the emphasis on smallholders, Norwegian programmes were, in general, highly relevant for final beneficiaries, as programmes were either targeting smallholders directly through agriculture, food security or livelihood programmes, or indirectly and in a long-term perspective through research programmes with a focus on innovation (e.g. in relation to climate change adapted food crops).
As a result of the strong focus on food production, Norwegian-supported programmes were found to be well-designed with a view to contributing to food security at household level. The selected programmes were assessed in relation to the four aspects of food security: food availability, food accessibility, food stability, and food utilisation. All country-level programmes were likely to lead to increased food availability, which was not the case for all regional and global programmes (e.g. ICIMOD and TFESSD). The global programme GCDT, focusing on research into climate change adaptation of food crops, was found to be particularly important for future food production. Most large-scale country-level programmes focused mainly on staple food production (CASPP, CAP I and FISP). In contrast, most NGOs focused on a broader portfolio of livelihood activities, including staple crop production, and these programmes were thus likely to lead to increased food accessibility. With regard to food stability, the Norwegian-supported programmes showed a strong focus on livelihood security/diversification, and/or climate change adaptation, or, more generally, sustainable management of resources. These are all important elements in relation to achieving long-term food stability. The only exception was FISP in Malawi, which provided agro-inputs on an annual basis for selected beneficiaries, and thus represented a more short-term strategy for individual households. The selected programmes, however, showed limited focus on the nutritional aspects of food security and agriculture − and, where they did, it was based mainly on increased food intake, rather than on dietary diversity.
Despite the fact that the majority of the selected Norwegian programmes were likely to contribute to enhanced food security, evidence of such a contribution could be established in only a few cases, due to a lack of systematic measuring. The evidence of actual contribution was strongest for food availability, and
Evaluation of Norwegian support to agriculture and food securityxviii
weakest for food utility. With regard to food availability (increased food production), evidence of contribution was found in a considerable number of cases. However, this was not the case with regard to increased food accessibility, despite the fact that, to a large extent, the sampled programmes were likely to lead to increased food accessibility. The lack of documentation was particular problematic for programmes with food security objectives (Rural Development in Ethiopia, and CASPP in Zambia). The Norwegian-supported programmes generally scored high with regard to food stability, due to the strong focus on livelihood and climate change adaptation. However, only ten out of the 25 programmes were able to document increased food stability based on indicators (e.g. decreased length of food shortage). Overall, the lack of focus on nutrition as part of agriculture, food security and livelihood was striking and was observed across all types of programmes. Only two programmes were able to document increased nutritional security.
Cluster 2: Monitoring and evaluation (M&E) and documentation The degree of efficiency of M&E systems for Norwegian-funded programmes varied widely. However, overall, ineffective M&E systems were one of the direct consequences of the absence of well-prepared logical frameworks with Specific, Measurable, Achievable, Realistic and Time-bound (SMART) indicators. The lack of baseline and, on occasion, end-of-programme surveys constrained the analysis of the programme contribution to food security (as noted above) and also, more generally, an assessment of the achievement of programme objectives.
Ineffective M&E systems were often the result of a mismatch between allocated resources and the functions assigned to them. In some cases, there were no provisions at all for collecting programme data. Programme adjustments took place only in cases where the M&E system of the intervention was operational, or when external reviewers suggested amendments. The most effective programme M&E systems were those that took advantage of existing expertise within the implementing organisation, and which were also able to adapt accordingly to the programme requirements.
In contrast, effective dissemination strategies were set up for many interventions. Mass media was often used, but no assessments were made as to whether these strategies were cost-effective and actually reaching their goals. Activities related to dissemination and communication were systematically the first to suffer from budget cuts. This had serious repercussions for programmes focused on research, and for which dissemination of research results was an objective in itself.
Cluster 3: Sustainability and scaling-upIn general, financial and economic sustainability of institutions and results lacked sufficient attention from extending agencies and implementing partners, and thus was not ensured in most cases. This was particularly true for programmes including infrastructure components. Technical sustainability was usually ensured for governmental institutions. However, in most cases, the institutions
Evaluation of Norwegian support to agriculture and food security xix
would be unable to continue the activities at the same level when the funding was discontinued. By their nature, subsidies and hand-outs did not ensure the sustainability of results, as the implementation relied on external financial support. This also created dependency problems for beneficiaries, especially when no exit system from funding support was envisaged or in place. Sustainability of public-private partnerships (PPPs) was also often hampered because such partnerships remained too public-oriented or indirectly Government controlled, thus not creating true bridges between the public and private sectors.
Environmental sustainability was considered to be achieved by the stakeholders for DAC 410 programmes (environmental interventions), although it was rarely quantitatively measured. There was no relevant information on environmental sustainability for most DAC 311 programmes (agriculture interventions). In these cases, the sustainability was taken for granted by the implementing partners, based on external sources of information (e.g. other programmes, literature).
The evaluation found that there was no formal exit strategy for over 70% of the reviewed programmes. Exit strategies were alternatively defined as: additional fundraising capability or lobbying donors for new phases; accelerating capacity building efforts by programme’s end; or ensuring ownership of immaterial results. Programmes involved in commercial ventures had systematically formulated a clear exit strategy.
Scaling-up results proved to be a low priority in programmes, although, where it took place, it substantially increased impact and made programmes more cost efficient. Far too often, scaling-up was considered only after the programme had been phased out, and was therefore not part of the intervention.
Cluster 4: Financial analysis The evaluation found mixed evidence as to whether or not international aid funding for agriculture was additional to national funding in the case of Zambia, Malawi and Tanzania. In Zambia, increases in aid corresponded with increases in Government expenditure (in four out of five years). In Malawi, the opposite pattern prevailed, whereby aid increases were offset by reductions in Government expenditure (in five out of six years). Tanzania was mixed. In three years, aid increases corresponded with increases in Government expenditure, but in two years aid increases were offset by reductions in Government expenditure. Therefore, no consistent pattern of additionality emerged across the board, and it varied greatly by country.
The Public Expenditure Tracking Survey done with the three selected programmes − CAP I in Zambia, NASFAM in Malawi, and Mngeta Rice Farm in Tanzania − showed that the programmes were well organised and managed, included good systems of accounting, control and reporting, and were allocated sufficient human and financial resources. However, each of the programmes had at least one issue of concern.
Evaluation of Norwegian support to agriculture and food securityxx
CAP I, Zambia. It appeared to have far fewer Conservation Farming (CF) adopters, and less land under CF than hitherto reported1. Its M&E arrangements, while providing a wealth of data, were not optimally organised, the money granted to two of its service institutions was not producing the desired outputs, and two areas had high “back office costs”. In general, however, CAP I was well managed, efficiently run, was producing a satisfactory level of output, and generated a laudable Cost-Benefit Ratio.
NASFAM, Malawi The weak points found related to inadequate crop finance (not under Management Control). Furthermore, the programme will need to be financed by development partners for eight years or more, due to the fact that the National Smallholders Commodity Exchange’s (NASCOMEX) profitability (to fund NASFAM) is constrained by insufficient crop finance. This means that NASFAM can buy only a small proportion of members’ crops, and their trading volumes are limited. In addition, their membership is declining for a variety of reasons, and the numbers of “back office” staff appears slightly on the high side. Apart from those points, the NASFAM companies were well managed and were producing a satisfactory level of output (within stated constraints).
Mngeta Rice Farm, Tanzania Mngeta Rice Farm had not yet succeeded in attaining its expected yields in either the rain-fed or the irrigated sections of the farm. This led to larger start-up losses, and therefore higher funding requirements than anticipated, and caused the major irrigation investment to be postponed. Until the yield issues are resolved there is an element of risk (described by management as “moderate”), which could result in a major reduction to the scale of operations, investment and expected returns. A tremendous amount of effort and resources had already been put into this ambitious investment, and its management was in capable hands − managerially and technically. However, the multiplicity of financial and technical risks ahead was moderate at best. Senior management was aware of these challenges and risks, and was taking mitigation measures at their disposal. The opinion of the evaluation team is that there is a good probability that they should succeed, provided that the mitigation measures are successful.
Overall recommendations
Based on the above findings and conclusions, and in line with the new Food Security Strategy “Matsikkerhet i et Klimaperspektiv ” (Food Security in a Climate Perspective) from 2012, the following measures are recommended:
1 Comment by the Norwegian Embassy in Lusaka: The Embassy disagrees with the strong wording in the summary that there are “far fewer Conservation Farming (CF) adapters, and less land under CF than hitherto reported”. The Embassy recognizes the uncertainty in terms of numbers as disclosed by the evaluation, and the need to improve monitoring of the number of adopters, as is being done in the present phase of the programme. But given the weak and limited basis for the figures estimated by the evaluators, this does not justify the way this issue is highlighted in the executive summary.
Evaluation of Norwegian support to agriculture and food security xxi
Contribution to food security 1. A higher level of co-ordination and experience sharing of Norwegian-
supported aid should be ensured. It is recommended that MFA plays a more active role as co-ordinator and harmoniser of development aid across the various extending agencies (MFA, embassies, FK Norway, Norfund, and Norad).
2. Co-ordination of Norwegian-supported programmes at country level should be strengthened, regardless of the funding modality. It is recommended that the embassies be assigned the role as co-ordinating body, and that an annual country plan is prepared for the main recipient countries.
With a view to improving the operationalising of the new Food Security Strategy, MFA should ensure the preparation of the strategies and guidelines listed below, and their dissemination to Norwegian extending agencies and implementing partners. Where possible and relevant, the introduction of guidelines should be accompanied by training for the main relevant stakeholders, both in Norway and in partner countries.
1. Strategy and a manual for operationalising rights in development work, including in agriculture and food security. These could include guidance on how to apply a Rights-Based Approach.
2. Strategy and a manual on gender and climate-smart agriculture. An analysis of women’s role in agriculture − including the gendered division of labour, right of disposal (e.g. of crops or livestock) and division of labour − and how to operationalise these aspects should be part of the manual.
3. Strategy and a manual on the nutritional aspect of food security and agricultural interventions, in order to assure nutrition security as an integrated part of food security.
4. Compile and incorporate lessons learned and best practices in relation to conservation agriculture (CA). CA is a flagship of Norwegian support to agriculture in Southern and Eastern Africa, so it is crucial to compile lessons learned and best practices in order to further develop the concept ensuring an appropriate strategy for adoption by follow farmers, and for a proper reporting system.
Monitoring & evaluation (M&E) With a view to achieving improved M&E systems, the following actions are recommended for all extending agencies (excluding Norfund):
1. A common template for proposals should be jointly prepared by the extending agencies (under the guidance of MFA). It should include a template for logical framework, and these should be as simple as

Evaluation of Norwegian support to agriculture and food securityxxii
possible, with indicators that are Specific, Measurable, Achievable, Relevant, and Time bound (SMART). The design of a logframe should be based on a situation and problem analysis.
2. In accordance with the template, the proposal should include a plan for monitoring and evaluation. An operational M&E system will require human and financial means, whether or not an existing system is already in place within the implementing institution. A specific budget should be allocated for routinely monitoring and evaluating programmes and projects.
The following process is proposed after the approval of a proposal:
1. The agreement partner should be given e.g. two months to prepare an inception report, during which the logframe and proposal will be revised if required. In addition, a plan (including a questionnaire) for the baseline survey and end-of programme surveys should be prepared. The inception report is required as changes often occur between the time of the preparation of the proposal and its approval, and there might be a need to revise the logframe or fine-tune resource allocation. If this is not done, there is a risk that the programmes will have to rely on poor logframes, thereby jeopardising the implementation and monitoring of the programmes, or necessitating a logframe revision at a later stage.
2. After approval of the inception report, the project should be launched and the baseline survey should be conducted.
3. M&E systems should include collection of gender-disaggregated data.
4. M&E systems should ensure that communication activities are assessed as part of routine monitoring activities.
5. M&E systems should ensure that relevant environmental data is being collected.
6. As all these suggested efforts for strengthening M&E systems are substantial, it is recommended that a working group − composed of representatives from all extending agencies and some implementing partners − is created for co-ordinating the process. Preparation of strategies and guidelines should be accompanied by additional assistance (e.g. in the form of training and online courses).
Sustainability and scaling-upGiven the observed shortcomings in relation to sustainability and scaling-up, the extending agencies (excluding Norfund) should ensure the following:
1. Overall financial and economic sustainability of programme results should be systematically reviewed at programme formulation stage, and

Evaluation of Norwegian support to agriculture and food security xxiii
budget provisions should be made to secure sustainability, especially for programmes that include infrastructure components. Ownership should be clarified and a financial scheme prepared before phasing out of this type of interventions.
2. For public-private partnerships, extending agencies should, prior to support, analyse the modus operandi of these institutions and ensure that linkages between the private and public sectors are balanced and not exclusively driven by one stakeholder.
3. An exit strategy should be devised by the time each programme starts. This inevitably requires financial resources and technical input from programme staff so that results are disseminated, adopted, and activities continued by the end of the programme through relevant local stakeholders.
4. Environmental impact assessment of programmes through quantitative methods, wherever relevant, should be adopted at formulation stage and integrated within the M&E system.
5. At programme formulation stage, a scaling-up approach that covers methodology, means, capacity building of staff and monitoring should be considered to ensure a multiplication effect (wherever relevant).
Financial analysis CAP I, Zambia 1. A review should be undertaken by the Conservation Farming Unit (CFU)
to establish whether the law of diminishing returns is reducing the number of “new adopters” in jurisdictions where the programme has been running for several years. Consideration should then be given to gradually taking conservation farming into new areas, and reallocating resources accordingly. Apparently, this issue has been addressed in CAP II, the successor programme.
2. The CFU should set up its own internal M&E function at Head Office, which should then complete and implement the Data Management System. This system should make provision for a full census of adopters, hectares planted, crops and yields, and be fully maintained, including recording new adopters annually.
3. Relationships with the Ministry of Agriculture and Livestock (and their funding partner, the EU) and FAO should be strengthened, with more attention given to achieving closer collaboration.
National Association of Smallholder Farmers Malawi (NASFAM) project, Malawi
Evaluation of Norwegian support to agriculture and food securityxxiv
1. NASFAM, and its Development Partners, should consider options to increase substantially the amount of crop finance available to the National Smallholders Commodity Exchange (NASCOMEX), including the possible role of Development Finance Institutions.
2. NASFAM should review the non-core services provided, as well as the number of back office staff employed, and then allocate a higher proportion of budget (say, 30%) into Extension Services, so as to: 1) double the number of Field Extension Officers; and 2) increase the number of lead farmers and review their incentives. Thereafter, NASFAM should refocus the thrust of the extension services, and become a market leader in Conservation Farming.
3. NASFAM should conduct a feasibility study of adopting Mobile Money to optimise services to members to:
a. Make crop purchase payments.
b. Create crop collection schedules, and/or enable more buying points to be created.
c. Launch a member loyalty programme, whereby members can be granted “bonuses” as a reward for reaching selling value benchmarks.
This will assist in attracting large numbers of new members, increase trading volumes and profitability, and provide scope to offer better prices for members.
4. NASFAM should consider the level of communication and co-ordination with the Department of Extension in the Ministry of Agriculture, and develop closer relationships.
5. NASFAM management should review the M&E Performance Framework, with a view to rationalising the number of Key Result Areas (20) and the Performance Indicators (83).
Mngeta Rice Farm, Tanzania 1. A pilot programme should be set up by the farm management to test the
viability of leasing out of the rain-fed portion of the rice farm to the smallholder farmers involved in the System of Rice Intensification (SRI) programme. The case is a strong one, and could create a resounding win/win situation for shareholders’ profitability, SRI farmers’ prosperity, Tanzania’s economic development, and Agrica’s international profile.
2. Lessons learned on improving rice agronomy, under both irrigated and rain-fed conditions at Mngeta, should be formally documented by the crop production manager, and thereafter updated.


Evaluation of Norwegian support to agriculture and food security2
Evaluation of Norwegian support to agriculture and food security 3
1. Introduction
1.1 Objective and scope of evaluation
According to the Terms of Reference (ToR), the purpose of the evaluation is: “to assess to what extent Norwegian funds for agriculture have contributed to food security, with a view to get recommendations for future support”. The main audience of the evaluation are institutions responsible for development co-operation in Norway, and the main actors include: the embassies managing agricultural and environmental interventions, the Ministry of Foreign Affairs (MFA), Norwegian Agency for Development Co-operation (Norad), Norwegian Investment Fund for Developing Countries (Norfund), and Fredskorpset Norway (FK Norway). It is also expected that the evaluation will provide useful knowledge for international audiences that increasingly view food security as a priority in development. In line with the ToR, the period under evaluation is 2005-2011.
1.2 Evaluation Questions
The ToR outlines 10 Evaluation Questions (EQs). These have been slightly reordered by the evaluation team. EQ8 should be answered through a study of available data on international aid funds and public expenditure in Zambia, Malawi and Tanzania, and EQ9 through “tailored” public expenditure tracking surveys (PETS) of the largest projects1 in the same three countries. The remaining EQs should be answered based on selected projects at global level.
In order to arrive at a more coherent analysis of the EQs, these have been grouped in four clusters as outlined in the table below:
1 Throughout the report, the terms “programme” and “project” are used interchangeably.

Evaluation of Norwegian support to agriculture and food security4
Table 1 Evaluation Questions
Cluster 1: Contribution to Food Security
EQ1: To what extent have supported programmes been relevant for achieving food security, regardless of whether or not they have food security as an explicit objective?
EQ2: To what extent have programme theories (rationale) of supported activities − explicitly or implicitly related to food security − been based on evidence and are realistic?
EQ3: To what extent have programmes reached, or are likely to reach, their goals with respect to food security?
Cluster 2: M&E and Documentation
EQ4: To what extent have programmes been designed to allow monitoring and evaluation, including breakdown on gender in order to know the inclusion of female farmers, and to what extent have ongoing programmes been revised according to evidence emerging from within or outside the programmes during their execution? (former EQ4 & EQ9)
EQ5: To what extent have programme results been documented?
Cluster 3: Sustainability and Scaling-up
EQ6: To what extent have programmes been sustainable?
EQ7: To what extent have programmes lent themselves to scaling-up?
Cluster 4: Financial Analysis
EQ8: To what extent have Norwegian and international aid funds for agriculture been additional to national funds (i.e. to what extent have external funds been used to replace national funds or to finance other sectors)?
EQ9: To what extent have the funds reached income-poor farmers, women and other grassroots target groups?
Evaluation of Norwegian support to agriculture and food security 5
2. Methodology and analytical framework
2.1 Analytical framework
The ToR do not define food security. However, the Evaluation Team has applied the following definition − commonly used by the UN Food and Agriculture Organisation (FAO) − of food security:
“Food security exists when all people, at all times, have physical, social and economic access to sufficient safe and nutritious food that meets their dietary needs and food preferences for an active and healthy life” (FAO, 2002: “The state of food insecurity in the world 2001”).
In line with the ToR, the evaluation focuses on the “contribution” of Norwegian agricultural support to food security. EuropeAid has described a “contribution analysis”2 as a specific analysis assigning the contribution of an intervention to impacts, intended and not intended (not all of the selected projects will have food security as an objective). Its aim is to paint a credible picture of the contribution of an intervention (in this case, to enhanced food security) by trying to demonstrate what EuropeAid terms a “plausible association”. A plausible association refers to whether a reasonable person − on the basis of information about the input, output and results levels, and the context in which the intervention is implemented − agrees that the intervention contributed to effects at the higher levels of impacts. The mapping of the intervention logic is a key element of such an analysis. A contribution analysis aims to demonstrate whether or not the evaluated intervention is one of the causes of observed change.
The ToR also refer to identifying “impact paths”. The main challenge with regard to identifying impact paths is determining causality, and attributing any observed changes to the intervention under evaluation, in the absence of counterfactual evidence. Thus, identification of “impact paths” in many ways corresponds to the contribution analysis by aiming to demonstrate cause-and-effect chains, and by gathering evidence to confirm this.3
Due to time constraints, and the fact that the 25 programmes were spread over five countries and three regions, it was not possible to analyse the various factors contributing to the observed change for each specific case (programme).
2 EuropeAid Evaluation Guidelines – Methodological bases: Cause-and-effect analysis (2006). Roche, Chris: “Impact Assessment for Development Agencies – Learning to Value Change”. Oxfam GB 2005.
3 The concept of contribution analysis was further described in the Inception Report.
Evaluation of Norwegian support to agriculture and food security6
The contribution analysis was thus based on an overall understanding of the constitution of food security, its four pillars (availability, accessibility, stability and utility), and the impact paths.
The four pillars of food security are defined as follows4:
� Food availability: The availability of sufficient quantities of food of appropriate quality, supplied through domestic production or imports, including food aid.
� Food accessibility: Access by individuals to adequate resources (entitlements) for acquiring appropriate food for a nutritious diet.
� Food stability: To be food secure, a population, household or individual must have access to adequate food at all times. They should not risk losing access to food as a consequence of sudden shocks (e.g. an economic or climatic crisis) or cyclical events (e.g. seasonal food insecurity). The concept of food stability can therefore refer both to the availability and the access dimensions of food security.
� Food utilisation: Utilisation of food through adequate diet, clean water, sanitation and health care to reach a state of nutritional well-being, where all physiological needs are met.
With regard to the fourth pillar, food utilisation, the current evaluation focused entirely on project activities related to adequate diet (improved nutrition). Thus, water, sanitation and healthcare activities are not included under the DAC sectors 311 and 410 (agriculture and environmental protection), from which the evaluated programmes were selected.
Food security impact indicators used in the current evaluation were, for example: food availability − production (for home consumption or cash cropping/commercial production for the market); food accessibility − number of meals per day (same type/size); food stability − length of food security on an annual basis; food utilisation − malnourishment. In the absence of food security impact indicators, proxy indicators − household income or household food production − were used.5 In addition, information on livelihood/security resilience and coping strategies were included, as about one-third of the selected programmes applied a livelihood approach.
Initially, as described in the inception report, the plan was to assess observed changes in national statistics and various types of food security information systems. However, despite the fact that the current evaluation primarily focused on the larger (in terms of finance) programmes, the Norwegian contribution was not visible in national statistics, at national or district levels. This was due to the fact that the selected programmes in most cases were spread over several districts, and the impact was therefore diluted and not reflected in national
4 Source: FAO Policy Brief. June 2006, Issue 2: “Food Security”.5 The same food security impact indicators were used in the Ministry of Foreign Affairs of the Netherlands, Poli-
cy and Operations Evaluation Department (IOB) Study: Improving Food Security. A Systematic Review of the Impact of Interventions in Agricultural Production, Value Chains, Market Regulation, and Land Security. December 2011.

Evaluation of Norwegian support to agriculture and food security 7
statistics − the only exception being the Farm Inputs Subsidy Programme (FISP) in Malawi, with a target group of 1.4 million people.
The contribution of Norwegian programmes could therefore be identified only through the programmes’ own monitoring and evaluation (M&E) systems. Contribution analysis was thus based on the available data for each programme, mainly baseline and end-of-programme surveys (before-after), while programmes had, in a few cases, included the use of control groups (with-without). Evidence of change was cross-checked and triangulated by applying different methods of assessing the same changes (such as, observation/interviews, quantitative/qualitative methods, comparing different sources). Based on this information, case study reports were prepared, with detailed information on each selected project (general and in relation to the EQs). These case study reports form the basis for the entire evaluation and can be found in Annexes 5 and 6. In line with the ToR, assessing the M&E system therefore forms an important part of each case study report.
2.2 Overall methodology and main tools
The methodology of the evaluation was evidence-based, using a mixed methods approach. An Evaluation Matrix was prepared, outlining the EQs and the related Judgment Criteria (JCs), Indicators (I) and Sources. EQs, as set out in the ToR and outlined above, were explored, using a triangulation of methods, combining quantitative and qualitative data collection tools, and primary and secondary data, depending on data availability and the issues being evaluated. Primary data came from interviews, focus groups, and surveys. Secondary qualitative data was gathered from documents such as programme reports, policies, strategies, evaluations, and studies. A specific focus of the team was to use independent sources. For this, external evaluation reports (see Annex 9: Bibliography) were consulted, and interviews were conducted with stakeholders not directly involved and benefiting from the interventions (see Annex 10: List of people met).
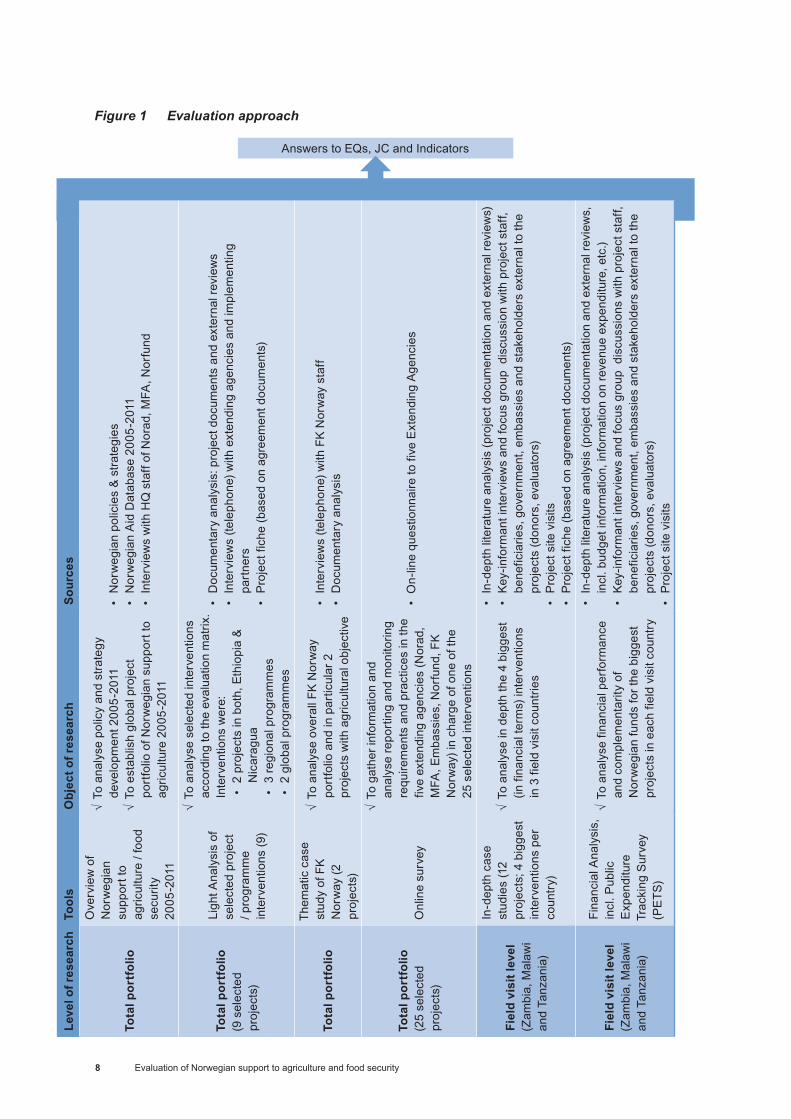
Figure 1 presents the evaluation approach, consisting of six different components, according to level of research, object of research, and tools used. The set of methods and tools was selected in order to ensure a high level of data reliability and validity of conclusions.
For each programme, a case study report was prepared, based on an evaluation matrix and a project fiche. The project fiche includes general data (such as budget, stakeholders, background) and project objectives, activities and expected results. The case study report synthesises for each indicator the evidence from different data sources, namely: project documents, external reviews and evaluations, as well as interviews with project stakeholders (extending agencies, implementing partners, beneficiaries) and external stakeholders (e.g. donors, partners, evaluators).
Evaluation of Norwegian support to agriculture and food security8
Figure 1 Evaluation approach
Leve
l of r
esea
rch
Tool
sO
bjec
t of r
esea
rch
Sour
ces
Tota
l por
tfol
io
Ove
rvie
w o
f N
orw
egia
n su
ppor
t to
agric
ultu
re /
food
se
curit
y20
05-2
011
√To
ana
lyse
pol
icy
and
stra
tegy
de
velo
pmen
t 200
5-20
11 √To
est
ablis
h gl
obal
pro
ject
po
rtfo
lio o
f Nor
weg
ian
supp
ort t
o ag
ricul
ture
200
5-20
11
• N
orw
egia
n po
licie
s &
stra
tegi
es•
Nor
weg
ian
Aid
Dat
abas
e 20
05-2
011
• In
terv
iew
s w
ith H
Q s
taff
of N
orad
, MFA
, Nor
fund
Tota
l por
tfol
io(9
sel
ecte
d pr
ojec
ts)
Ligh
t Ana
lysi
s of
se
lect
ed p
roje
ct
/ pro
gram
me
inte
rven
tions
(9)
√To
ana
lyse
sel
ecte
d in
terv
entio
ns
acco
rdin
g to
the
eval
uatio
n m
atrix
. In
terv
entio
ns w
ere:
• 2
proj
ects
in b
oth,
Eth
iopi
a &
N
icar
agua
• 3
regi
onal
pro
gram
mes
• 2
glob
al p
rogr
amm
es
• D
ocum
enta
ry a
naly
sis:
pro
ject
doc
umen
ts a
nd e
xter
nal r
evie
ws
• In
terv
iew
s (te
leph
one)
with
ext
endi
ng a
genc
ies
and
impl
emen
ting
part
ners
• P
roje
ct fi
che
(bas
ed o
n ag
reem
ent d
ocum
ents
)
Tota
l por
tfol
io
Them
atic
cas
e st
udy
of F
K
Nor
way
(2
proj
ects
)
√To
ana
lyse
ove
rall
FK N
orw
ay
port
folio
and
in p
artic
ular
2
proj
ects
with
agr
icul
tura
l obj
ectiv
e
• In
terv
iew
s (te
leph
one)
with
FK
Nor
way
sta
ff•
Doc
umen
tary
ana
lysi
s
Tota
l por
tfol
io(2
5 se
lect
ed
proj
ects
)O
nlin
e su
rvey
√To
gat
her i
nfor
mat
ion
and
anal
yse
repo
rting
and
mon
itorin
g re
quire
men
ts a
nd p
ract
ices
in th
e fiv
e ex
tend
ing
agen
cies
(Nor
ad,
MFA
, Em
bass
ies,
Nor
fund
, FK
N
orw
ay) i
n ch
arge
of o
ne o
f the
25
sel
ecte
d in
terv
entio
ns
• O
n-lin
e qu
estio
nnai
re to
five
Ext
endi
ng A
genc
ies
Fiel
d vi
sit l
evel
(Zam
bia,
Mal
awi
and
Tanz
ania
)
In-d
epth
cas
e st
udie
s (1
2 pr
ojec
ts; 4
big
gest
in
terv
entio
ns p
er
coun
try)
√To
ana
lyse
in d
epth
the
4 bi
gges
t (in
fina
ncia
l ter
ms)
inte
rven
tions
in
3 fi
eld
visi
t cou
ntrie
s
• In
-dep
th li
tera
ture
ana
lysi
s (p
roje
ct d
ocum
enta
tion
and
exte
rnal
revi
ews)
• Ke
y-in
form
ant i
nter
view
s an
d fo
cus
grou
p d
iscu
ssio
n w
ith p
roje
ct s
taff,
be
nefic
iarie
s, g
over
nmen
t, em
bass
ies
and
stak
ehol
ders
ext
erna
l to
the
proj
ects
(don
ors,
eva
luat
ors)
• P
roje
ct s
ite v
isits
• P
roje
ct fi
che
(bas
ed o
n ag
reem
ent d
ocum
ents
)
Fiel
d vi
sit l
evel
(Zam
bia,
Mal
awi
and
Tanz
ania
)
Fina
ncia
l Ana
lysi
s,
incl
. Pub
lic
Exp
endi
ture
Tr
acki
ng S
urve
y (P
ETS
)
√To
ana
lyse
fina
ncia
l per
form
ance
an
d co
mpl
emen
tarit
y of
N
orw
egia
n fu
nds
for t
he b
igge
st
proj
ects
in e
ach
field
vis
it co
untry
• In
-dep
th li
tera
ture
ana
lysi
s (p
roje
ct d
ocum
enta
tion
and
exte
rnal
revi
ews,
in
cl. b
udge
t inf
orm
atio
n, in
form
atio
n on
reve
nue
expe
nditu
re, e
tc.)
• Ke
y-in
form
ant i
nter
view
s an
d fo
cus
grou
p d
iscu
ssio
ns w
ith p
roje
ct s
taff,
be
nefic
iarie
s, g
over
nmen
t, em
bass
ies
and
stak
ehol
ders
ext
erna
l to
the
proj
ects
(don
ors,
eva
luat
ors)
• P
roje
ct s
ite v
isits
Answers to EQs, JC and Indicators
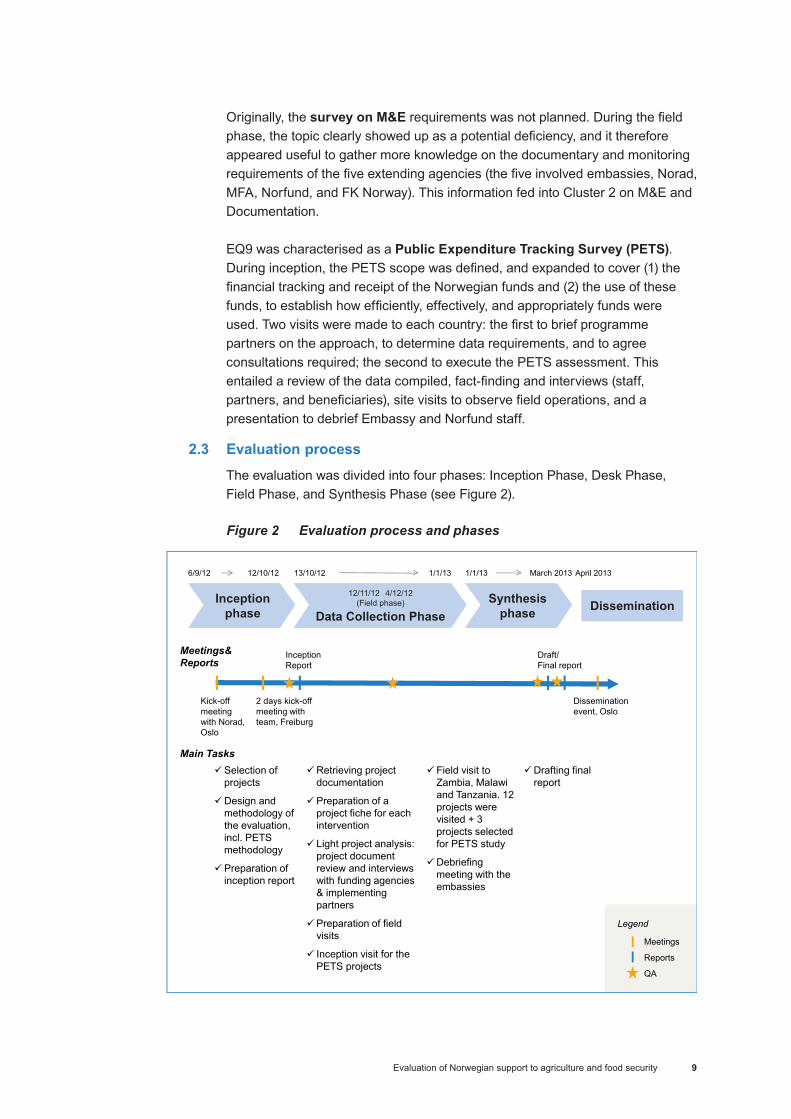
Evaluation of Norwegian support to agriculture and food security 9
Originally, the survey on M&E requirements was not planned. During the field phase, the topic clearly showed up as a potential deficiency, and it therefore appeared useful to gather more knowledge on the documentary and monitoring requirements of the five extending agencies (the five involved embassies, Norad, MFA, Norfund, and FK Norway). This information fed into Cluster 2 on M&E and Documentation.
EQ9 was characterised as a Public Expenditure Tracking Survey (PETS). During inception, the PETS scope was defined, and expanded to cover (1) the financial tracking and receipt of the Norwegian funds and (2) the use of these funds, to establish how efficiently, effectively, and appropriately funds were used. Two visits were made to each country: the first to brief programme partners on the approach, to determine data requirements, and to agree consultations required; the second to execute the PETS assessment. This entailed a review of the data compiled, fact-finding and interviews (staff, partners, and beneficiaries), site visits to observe field operations, and a presentation to debrief Embassy and Norfund staff.
2.3 Evaluation process
The evaluation was divided into four phases: Inception Phase, Desk Phase, Field Phase, and Synthesis Phase (see Figure 2).
Figure 2 Evaluation process and phases
Leve
l of r
esea
rch
Tool
sO
bjec
t of r
esea
rch
Sour
ces
Tota
l por
tfol
io
Ove
rvie
w o
f N
orw
egia
n su
ppor
t to
agric
ultu
re /
food
se
curit
y20
05-2
011
√To
ana
lyse
pol
icy
and
stra
tegy
de
velo
pmen
t 200
5-20
11 √To
est
ablis
h gl
obal
pro
ject
po
rtfo
lio o
f Nor
weg
ian
supp
ort t
o ag
ricul
ture
200
5-20
11
• N
orw
egia
n po
licie
s &
stra
tegi
es•
Nor
weg
ian
Aid
Dat
abas
e 20
05-2
011
• In
terv
iew
s w
ith H
Q s
taff
of N
orad
, MFA
, Nor
fund
Tota
l por
tfol
io(9
sel
ecte
d pr
ojec
ts)
Ligh
t Ana
lysi
s of
se
lect
ed p
roje
ct
/ pro
gram
me
inte
rven
tions
(9)
√To
ana
lyse
sel
ecte
d in
terv
entio
ns
acco
rdin
g to
the
eval
uatio
n m
atrix
. In
terv
entio
ns w
ere:
• 2
proj
ects
in b
oth,
Eth
iopi
a &
N
icar
agua
• 3
regi
onal
pro
gram
mes
• 2
glob
al p
rogr
amm
es
• D
ocum
enta
ry a
naly
sis:
pro
ject
doc
umen
ts a
nd e
xter
nal r
evie
ws
• In
terv
iew
s (te
leph
one)
with
ext
endi
ng a
genc
ies
and
impl
emen
ting
part
ners
• P
roje
ct fi
che
(bas
ed o
n ag
reem
ent d
ocum
ents
)
Tota
l por
tfol
io
Them
atic
cas
e st
udy
of F
K
Nor
way
(2
proj
ects
)
√To
ana
lyse
ove
rall
FK N
orw
ay
port
folio
and
in p
artic
ular
2
proj
ects
with
agr
icul
tura
l obj
ectiv
e
• In
terv
iew
s (te
leph
one)
with
FK
Nor
way
sta
ff•
Doc
umen
tary
ana
lysi
s
Tota
l por
tfol
io(2
5 se
lect
ed
proj
ects
)O
nlin
e su
rvey
√To
gat
her i
nfor
mat
ion
and
anal
yse
repo
rting
and
mon
itorin
g re
quire
men
ts a
nd p
ract
ices
in th
e fiv
e ex
tend
ing
agen
cies
(Nor
ad,
MFA
, Em
bass
ies,
Nor
fund
, FK
N
orw
ay) i
n ch
arge
of o
ne o
f the
25
sel
ecte
d in
terv
entio
ns
• O
n-lin
e qu
estio
nnai
re to
five
Ext
endi
ng A
genc
ies
Fiel
d vi
sit l
evel
(Zam
bia,
Mal
awi
and
Tanz
ania
)
In-d
epth
cas
e st
udie
s (1
2 pr
ojec
ts; 4
big
gest
in
terv
entio
ns p
er
coun
try)
√To
ana
lyse
in d
epth
the
4 bi
gges
t (in
fina
ncia
l ter
ms)
inte
rven
tions
in
3 fi
eld
visi
t cou
ntrie
s
• In
-dep
th li
tera
ture
ana
lysi
s (p
roje
ct d
ocum
enta
tion
and
exte
rnal
revi
ews)
• Ke
y-in
form
ant i
nter
view
s an
d fo
cus
grou
p d
iscu
ssio
n w
ith p
roje
ct s
taff,
be
nefic
iarie
s, g
over
nmen
t, em
bass
ies
and
stak
ehol
ders
ext
erna
l to
the
proj
ects
(don
ors,
eva
luat
ors)
• P
roje
ct s
ite v
isits
• P
roje
ct fi
che
(bas
ed o
n ag
reem
ent d
ocum
ents
)
Fiel
d vi
sit l
evel
(Zam
bia,
Mal
awi
and
Tanz
ania
)
Fina
ncia
l Ana
lysi
s,
incl
. Pub
lic
Exp
endi
ture
Tr
acki
ng S
urve
y (P
ETS
)
√To
ana
lyse
fina
ncia
l per
form
ance
an
d co
mpl
emen
tarit
y of
N
orw
egia
n fu
nds
for t
he b
igge
st
proj
ects
in e
ach
field
vis
it co
untry
• In
-dep
th li
tera
ture
ana
lysi
s (p
roje
ct d
ocum
enta
tion
and
exte
rnal
revi
ews,
in
cl. b
udge
t inf
orm
atio
n, in
form
atio
n on
reve
nue
expe
nditu
re, e
tc.)
• Ke
y-in
form
ant i
nter
view
s an
d fo
cus
grou
p d
iscu
ssio
ns w
ith p
roje
ct s
taff,
be
nefic
iarie
s, g
over
nmen
t, em
bass
ies
and
stak
ehol
ders
ext
erna
l to
the
proj
ects
(don
ors,
eva
luat
ors)
• P
roje
ct s
ite v
isits

Evaluation of Norwegian support to agriculture and food security10
2.4 Selection of projects This chapter describes the selection criteria for 25 interventions selected as a sample for the evaluation. The interventions were funded by the five extending agencies of Norwegian aid: MFA, embassies, Norad, Norfund, and FK Norway. In line with the ToR, EQ9 focused only on the largest project in the three field visit countries. Table 3 depicts the 21 projects selected for in-depth or light analysis, the thematic study of FK Norway, and the three “PETS” projects.
Thematic selection according to Development Assistance Committee (DAC) sectors: The ToR stipulates EQs1-7 to be answered based on projects selected under two DAC sectors, with particular selection criteria as described below.
� “DAC Sector 311 Agriculture: Under all agreement partners that received 30 million Norwegian Kroner (NOK) or more during the period 2005-2011: the largest programme used to finance agricultural activities specified by thematic or geographical area. Projects receiving less than five million NOK are excluded.”
� “DAC Sector 410 General Environmental Protection: Projects with agricultural activities specified by thematic or geographical area, receiving more than 5 million NOK during the seven-year period 2005-2011. Only the largest project under each agreement partner is included.”
With regard to DAC Sector 311 Agriculture, 26 agreement partners receiving more than 30 million NOK during 2005-2011 were identified, and the largest projects under each agreement partner (above 5 million NOK) were selected. 26 projects were therefore identified, including the three largest projects in Zambia, Malawi and Tanzania already selected for the PETS.
With regard to DAC Sector 410 General Environmental Protection, 93 agreement partners implementing projects above 5 million NOK were identified. These projects were systematically scrutinised through descriptions in the database and website information in order to establish whether they included agricultural activities. This manual selection resulted in the identification of 32 environmental programmes with agricultural activities (for example, rural livelihoods, agricultural aspects, food security, rural development). Furthermore, the project Enhancing Pro-poor Innovations in Natural Resources (EPINAV) in Tanzania (DAC sector 20 – higher education) was included following discussions with Norad Evaluation Department, as it was considered to be relevant for the agricultural sector (research on agriculture).
Annex 3 presents a lists of projects adhering to the two above selection criteria specified in the ToR. A total of 59 projects were identified. However, given the period of time allocated for the evaluation, it was not feasible to include the entire project portfolio in the evaluation. Five countries, three regional projects and two global projects were selected, as this was regarded as being manageable, as well as providing a reasonable coverage of the global project portfolio.
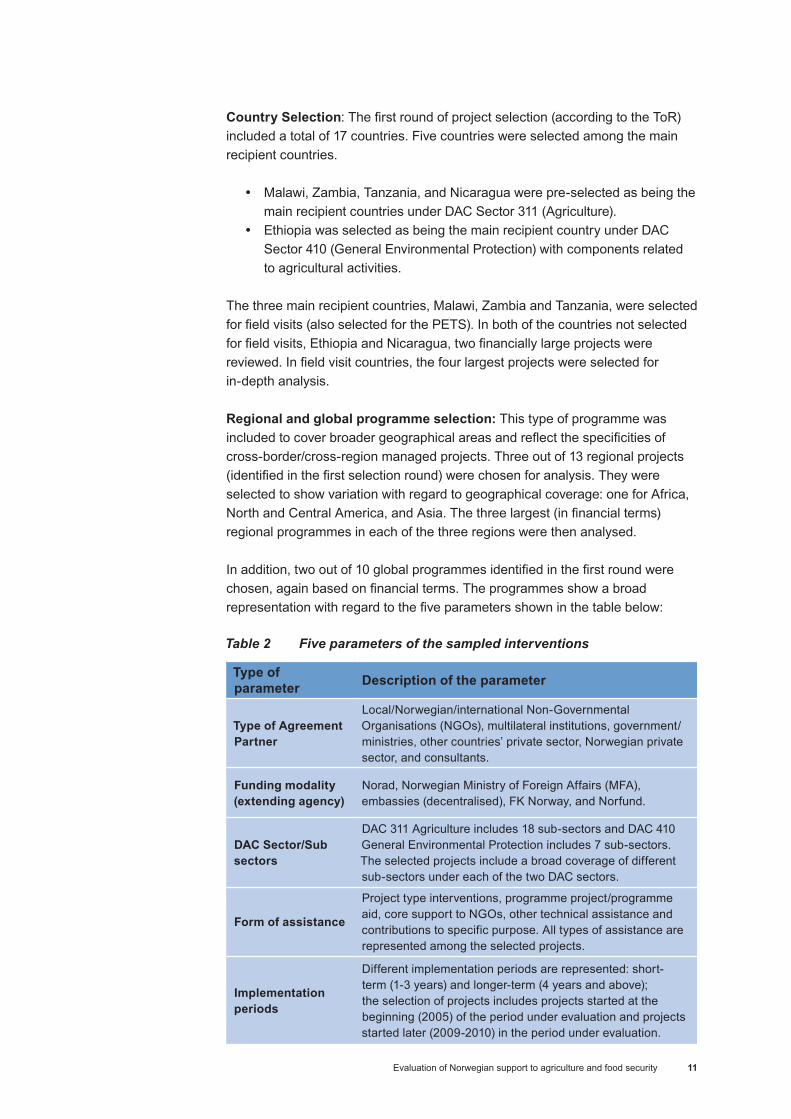
Evaluation of Norwegian support to agriculture and food security 11
Country Selection: The first round of project selection (according to the ToR) included a total of 17 countries. Five countries were selected among the main recipient countries.
� Malawi, Zambia, Tanzania, and Nicaragua were pre-selected as being the main recipient countries under DAC Sector 311 (Agriculture).
� Ethiopia was selected as being the main recipient country under DAC Sector 410 (General Environmental Protection) with components related to agricultural activities.
The three main recipient countries, Malawi, Zambia and Tanzania, were selected for field visits (also selected for the PETS). In both of the countries not selected for field visits, Ethiopia and Nicaragua, two financially large projects were reviewed. In field visit countries, the four largest projects were selected for in-depth analysis.
Regional and global programme selection: This type of programme was included to cover broader geographical areas and reflect the specificities of cross-border/cross-region managed projects. Three out of 13 regional projects (identified in the first selection round) were chosen for analysis. They were selected to show variation with regard to geographical coverage: one for Africa, North and Central America, and Asia. The three largest (in financial terms) regional programmes in each of the three regions were then analysed.
In addition, two out of 10 global programmes identified in the first round were chosen, again based on financial terms. The programmes show a broad representation with regard to the five parameters shown in the table below:
Table 2 Five parameters of the sampled interventions
Type of parameter Description of the parameter
Type of Agreement Partner
Local/Norwegian/international Non-Governmental Organisations (NGOs), multilateral institutions, government/ministries, other countries’ private sector, Norwegian private sector, and consultants.
Funding modality (extending agency)
Norad, Norwegian Ministry of Foreign Affairs (MFA), embassies (decentralised), FK Norway, and Norfund.
DAC Sector/Sub sectors
DAC 311 Agriculture includes 18 sub-sectors and DAC 410 General Environmental Protection includes 7 sub-sectors. The selected projects include a broad coverage of different sub-sectors under each of the two DAC sectors.
Form of assistance
Project type interventions, programme project/programme aid, core support to NGOs, other technical assistance and contributions to specific purpose. All types of assistance are represented among the selected projects.
Implementation periods
Different implementation periods are represented: short-term (1-3 years) and longer-term (4 years and above); the selection of projects includes projects started at the beginning (2005) of the period under evaluation and projects started later (2009-2010) in the period under evaluation.
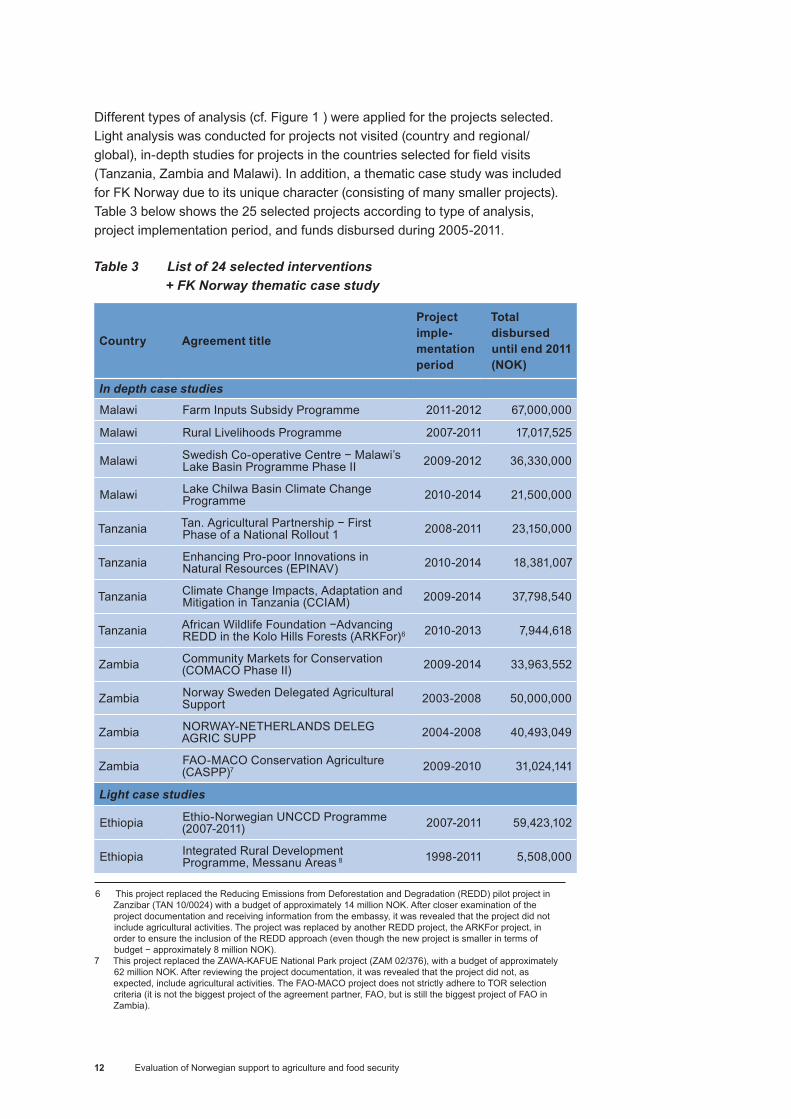
Evaluation of Norwegian support to agriculture and food security12
Different types of analysis (cf. Figure 1 ) were applied for the projects selected. Light analysis was conducted for projects not visited (country and regional/global), in-depth studies for projects in the countries selected for field visits (Tanzania, Zambia and Malawi). In addition, a thematic case study was included for FK Norway due to its unique character (consisting of many smaller projects). Table 3 below shows the 25 selected projects according to type of analysis, project implementation period, and funds disbursed during 2005-2011.
Table 3 List of 24 selected interventions + FK Norway thematic case study 6 77
Country Agreement title
Project imple- mentation period
Total disbursed until end 2011 (NOK)
In depth case studies
Malawi Farm Inputs Subsidy Programme 2011-2012 67,000,000
Malawi Rural Livelihoods Programme 2007-2011 17,017,525
Malawi Swedish Co-operative Centre − Malawi’s Lake Basin Programme Phase II 2009-2012 36,330,000
Malawi Lake Chilwa Basin Climate Change Programme 2010-2014 21,500,000
Tanzania Tan. Agricultural Partnership − First Phase of a National Rollout 1 2008-2011 23,150,000
Tanzania Enhancing Pro-poor Innovations in Natural Resources (EPINAV) 2010-2014 18,381,007
Tanzania Climate Change Impacts, Adaptation and Mitigation in Tanzania (CCIAM) 2009-2014 37,798,540
Tanzania African Wildlife Foundation −Advancing REDD in the Kolo Hills Forests (ARKFor)6 2010-2013 7,944,618
Zambia Community Markets for Conservation (COMACO Phase II) 2009-2014 33,963,552
Zambia Norway Sweden Delegated Agricultural Support 2003-2008 50,000,000
Zambia NORWAY-NETHERLANDS DELEG AGRIC SUPP 2004-2008 40,493,049
Zambia FAO-MACO Conservation Agriculture (CASPP)7 2009-2010 31,024,141
Light case studies
Ethiopia Ethio-Norwegian UNCCD Programme (2007-2011) 2007-2011 59,423,102
Ethiopia Integrated Rural Development Programme, Messanu Areas 8 1998-2011 5,508,000
6 This project replaced the Reducing Emissions from Deforestation and Degradation (REDD) pilot project in Zanzibar (TAN 10/0024) with a budget of approximately 14 million NOK. After closer examination of the project documentation and receiving information from the embassy, it was revealed that the project did not include agricultural activities. The project was replaced by another REDD project, the ARKFor project, in order to ensure the inclusion of the REDD approach (even though the new project is smaller in terms of budget − approximately 8 million NOK).
7 This project replaced the ZAWA-KAFUE National Park project (ZAM 02/376), with a budget of approximately 62 million NOK. After reviewing the project documentation, it was revealed that the project did not, as expected, include agricultural activities. The FAO-MACO project does not strictly adhere to TOR selection criteria (it is not the biggest project of the agreement partner, FAO, but is still the biggest project of FAO in Zambia).
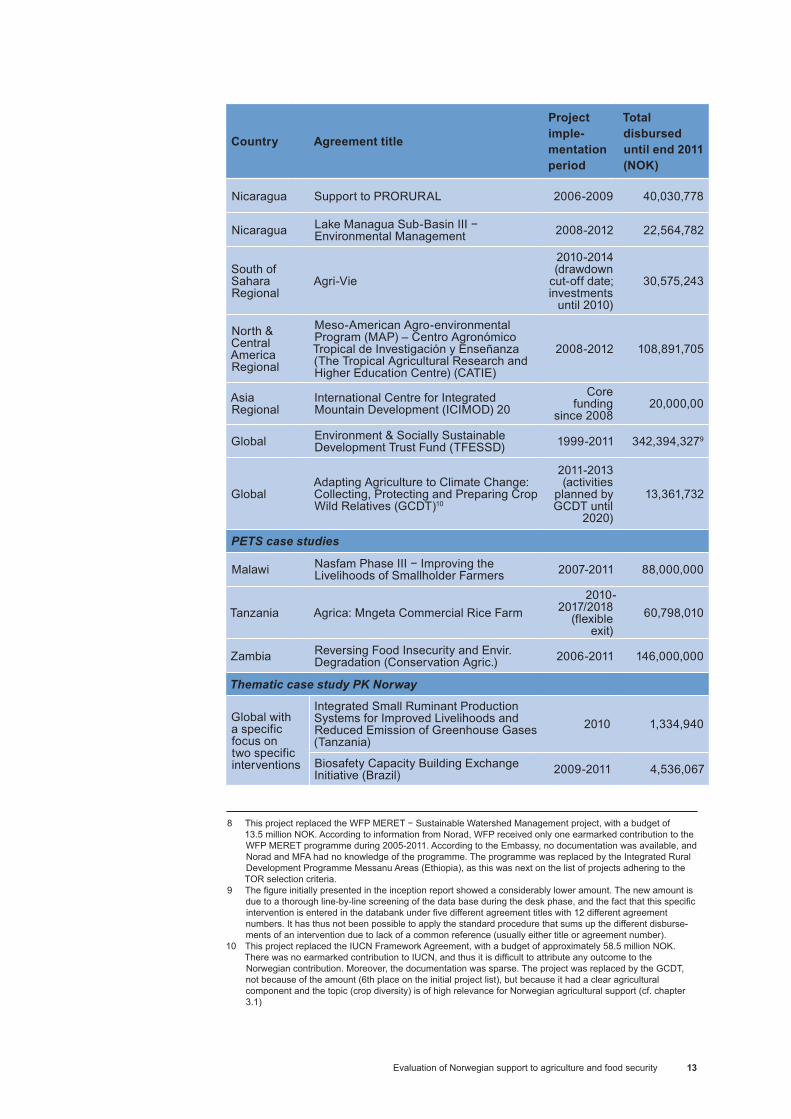
Evaluation of Norwegian support to agriculture and food security 13
Country Agreement title
Project imple- mentation period
Total disbursed until end 2011 (NOK)
Nicaragua Support to PRORURAL 2006-2009 40,030,778
Nicaragua Lake Managua Sub-Basin III − Environmental Management 2008-2012 22,564,782
South of Sahara Regional
Agri-Vie
2010-2014 (drawdown
cut-off date; investments
until 2010)
30,575,243
North & Central America Regional
Meso-American Agro-environmental Program (MAP) – Centro Agronómico Tropical de Investigación y Enseñanza (The Tropical Agricultural Research and Higher Education Centre) (CATIE)
2008-2012 108,891,705
Asia Regional
International Centre for Integrated Mountain Development (ICIMOD) 20
Core funding
since 200820,000,00
Global Environment & Socially Sustainable Development Trust Fund (TFESSD) 1999-2011 342,394,3279
GlobalAdapting Agriculture to Climate Change: Collecting, Protecting and Preparing Crop Wild Relatives (GCDT)10
2011-2013 (activities
planned by GCDT until
2020)
13,361,732
PETS case studies
Malawi Nasfam Phase III − Improving the Livelihoods of Smallholder Farmers 2007-2011 88,000,000
Tanzania Agrica: Mngeta Commercial Rice Farm2010-
2017/2018 (flexible
exit)60,798,010
Zambia Reversing Food Insecurity and Envir. Degradation (Conservation Agric.) 2006-2011 146,000,000
Thematic case study PK Norway
Global with a specific focus on two specific interventions
Integrated Small Ruminant Production Systems for Improved Livelihoods and Reduced Emission of Greenhouse Gases (Tanzania)
2010 1,334,940
Biosafety Capacity Building Exchange Initiative (Brazil) 2009-2011 4,536,067
8 99 1010
8 This project replaced the WFP MERET − Sustainable Watershed Management project, with a budget of 13.5 million NOK. According to information from Norad, WFP received only one earmarked contribution to the WFP MERET programme during 2005-2011. According to the Embassy, no documentation was available, and Norad and MFA had no knowledge of the programme. The programme was replaced by the Integrated Rural Development Programme Messanu Areas (Ethiopia), as this was next on the list of projects adhering to the TOR selection criteria.
9 The figure initially presented in the inception report showed a considerably lower amount. The new amount is due to a thorough line-by-line screening of the data base during the desk phase, and the fact that this specific intervention is entered in the databank under five different agreement titles with 12 different agreement numbers. It has thus not been possible to apply the standard procedure that sums up the different disburse-ments of an intervention due to lack of a common reference (usually either title or agreement number).
10 This project replaced the IUCN Framework Agreement, with a budget of approximately 58.5 million NOK. There was no earmarked contribution to IUCN, and thus it is difficult to attribute any outcome to the Norwegian contribution. Moreover, the documentation was sparse. The project was replaced by the GCDT, not because of the amount (6th place on the initial project list), but because it had a clear agricultural component and the topic (crop diversity) is of high relevance for Norwegian agricultural support (cf. chapter 3.1)

Evaluation of Norwegian support to agriculture and food security14
2.5 Challenges and constraintsThe Evaluation Team experienced a number of challenges and constraints that had to be dealt with:
Identifying projects adhering to the selection criteria spelled out in the ToR was a lengthy process. This was especially the case for projects under DAC 410 General Environmental Protection. The project titles did not always summarise project activities; therefore, the evaluation team had to review all projects under DAC 410 (checking descriptions in the database, as well as websites) in order to establish if the projects did include agricultural activities. In several cases, when receiving and analysing project documents, it transpired that the projects did not fit the ToRs selection criteria. Even after submitting the inception report, three projects had to be replaced, as a more detailed analysis of the documents and discussion with the extending agencies revealed that the ToRs criteria were not met.
The time spent on collection of project documentation was underestimated during the planning of the evaluation. Getting access to project documentation is normally not a very time-consuming process; in most cases, the client provides the evaluation team with the documents, or a general database exists. In the case of the current evaluation, the evaluation team first had to contact the extending agencies, then the implementing partners, in order to get access to the documentation of the selected projects. This delayed the preparation of case study reports of the nine projects selected for light analysis. With regard to the projects reviewed during the field visits, no electronic archives existed at embassy level, and the team’s request to receive scanned documents from the embassies was generally not fulfilled. For several projects, the team had no access to relevant project documentation before the field visits, and thus had to spend considerable time during the visits collecting and reviewing project documentation. This delayed the writing of the in-depth case studies.
Loss of institutional memory was a problem due to the rather long period (2005-2011) under evaluation. To some extent, this was due to staff turnover, and could only partially be compensated for by written records and reports, and data from functioning M&E systems.
Availability of data was limited. Overall, as will be seen in the analysis of the Evaluation Questions (chapters 4.1. and 4.2), availability of reliable impact and outcome data on intervention level was a huge problem that seriously impeded the analysis of the extent to which Norwegian agricultural support contributed to food security.
Contribution analysis was a challenge in relation to regional, research and global programmes. This was due to the fact that the bilateral funds to multi-donor programmes were not earmarked and separately monitored, and it was therefore not possible to attribute results to the Norwegian aid. An additional problem was that the global funds/regional programmes consisted of several sub-projects − for instance, TFESSD funded 450 activities and no overview
Evaluation of Norwegian support to agriculture and food security 15
existed. In these cases, the assessment concentrated on the monitoring and reporting requirements between the extending agency and the agreement partner, but did not investigate the impact level. With regard to research programmes (e.g. EPINAV and CCIAM in Tanzania), the same problem of several sub-projects prevailed. Moreover, attributing outcomes directly to the research programmes was difficult as the contribution to enhanced food security is a long-term process.
Knowing the external validity of selected programmes was difficult. In total, 25 programmes were selected for the evaluation, including national, regional and global programmes. The relatively limited number of programmes within each sub-category, as well as their diverse nature (e.g. NGO, government-implemented, investment programmes) made generalisation difficult. This was particularly the case for regional and global programmes (five programmes in total).
Database11 on Norwegian Aid for agriculture and environment was inadequate. As with most databases, the main problem is the way in which data is entered, usually leading to non-harmonised data. This is mainly due to discretionary filling in of project data or the choice of pre-given categorisation (e.g. identification of sectors, implementing partners). Only limited cleaning up or cross-checking of the data are done, so the possibility of some inadequate classification of projects could therefore not be excluded. In the actual database, a project can be coded under different agreement numbers or agreement titles (often related to disbursements). The lack of a unique project reference code, valid for the whole lifecycle of the project (e.g. if project amendments or extensions are signed), made it difficult to retrieve all disbursement related to one project. For bigger projects, this has been done manually12.
11 This database is used for the OECD-DAC annual reporting and gets its data from two sources − the PTA management system of Norwegian aid (used by Norad), and the MFA (including the embassies) − and is designed to provide the information in the Creditor Reporting System of the OECD-DAC. FK Norway and Norfund do not use the PTA system, and the information on financial flows shown in the database is collected by the statistical units of Norad via spreadsheets. The PTA system is an information system mainly used for day-to-day management. Information on a project and its categorisation is entered by the desk officers in charge of the project, according to guidelines such as the Statistical Classification Manual of Norad, 2011.
12 The evaluation team took the project title as the reference code to link annual disbursement to a project. This is only possible if the titles remain the same over the years (see footnote 7 for the example of TFESSD). Some of these harmonisation problems might also originate from the fact that the MFA started using the PTA only in 2009, while Norad and the embassies have been using it since the 1990s. Data between 2005 and 2009 from the MFA seems to have been less rigorously categorised.
Evaluation of Norwegian support to agriculture and food security16
3. Overview of Norwegian Support to Agriculture 2005-2011
3.1 Strategies and policies
“Fighting Poverty through Agriculture. Norwegian Plan of Action for Agriculture in Norwegian Development Policy” from 2004 constituted the main policy for Norwegian support to agriculture during the period under evaluation. No food security strategy was in place for this period, and thus this Action Plan constitutes the only policy framework for the evaluation.
The objective of the Norwegian Plan of Action for Agriculture was to: “make a greater contribution to agricultural development in developing countries as part of the fight against poverty”. The support was based on the following principles:
� The right to adequate food and an adequate standard of living (International Covenant on Economic, Social and Cultural Rights, Article 11).
� Agricultural development as a means of reducing poverty and one of several means of achieving Millennium Development Goals (MDGs).
� Norwegian-supported agriculture should be adapted to recipient countries’ strategies/policies and be provided in co-operation with other donors and civil society.13
� Measures for agricultural development should be co-ordinated with other important measures targeting small farmers.
� Agricultural development should be seen as a central part of a broader strategy for private sector development.
� Agricultural development should be carried out in an environmentally sustainable way.
The Plan of Action highlights seven priority areas:
� Policy and reforms for poverty-oriented agricultural development: focus on dry-land areas; influence multilateral organisations to adapt to the above-mentioned principles; support regional development banks; co-operate with civil society on the implementation of the Plan of Action.
� Food security: participate in the FAO process of guidelines for the right to food; technical/economic support to countries realising the right to food; untie Norwegian food assistance by 2006; continue restrictive policy on genetically modified organisms and food.
13 This is in line with the Paris Declaration (2005) of ownership and alignment.

Evaluation of Norwegian support to agriculture and food security 17
� Strengthening of women’s rights and their participation in agricultural development: secure women’s rights in policy-making, at country level/multilateral organisations; give priority to ensuring women’s interests and participation when selecting co-operation partners; intensify efforts to ensure that partner countries carry out reforms for formalising women’s access to land and other natural resources.
� Promotion of the sustainable use of natural resources: focus on NGOs and civil society in partner countries; investment in innovations among small producers should be parallel with investment in larger producers; engagement in Central and South America to be continued; Sub-Saharan Africa and Asia to be new priority areas; ensure that the International Treaty on Plant Genetic Resources for Food and Agriculture comes into force.
� Strengthening of basic services and poor people’s rights of use and property rights to land and water: ensure that women in rural areas, particularly in Africa, have access to land and livestock; ensure that poor people have access to financial services.
� Strengthening of education and research: assist universities to develop capacity for agriculture-related research relevant for small-scale farmers; encourage processing of agricultural products; emphasise the right of small farmers to participate in the development of extension services.
� Promotion of market development: through the World Trade Organization (WTO), ensure improved access to world markets of the agricultural sector in partner countries; through Norfund, promote the development of the agricultural sector as part of private sector development; support measures to improve infrastructure and basic services; provide support to increase export by increasing productivity and product quality; increase volume of exports to Norway; assist in increasing south-south trade.
More recently, a document in 2010 from a working group looking at climate adaption in development (“Klimatilpasning i Utviklingssamarbeidet”) added a new aspect to Norwegian-supported agriculture and environment. The report was prepared as an input to the MFA White Paper 14 (2010-2011): “Towards a Greener Development: On a Coherent Environmental and Development Policy” (2011)14. The working group discussion analysed the past and suggested the following focus for future Norwegian action:
� Strengthen focus on climate adaptation and reducing emissions: mainstream climate adaptation into planned and ongoing interventions, as well as providing support to areas and sectors particularly affected by climate change.
� Increase (from 2011) support to climate resilient agriculture, with a special focus on Africa, small-scale production, and women. The support should be given through regional organisations − such as the African Union (AU),
14 Melding til Stortinget 14 (2010-2011): “Mot en grønnere utvikling – om sammenhængen I miljø-og utviklings-politikken”.
Evaluation of Norwegian support to agriculture and food security18
The New Partnership for Africa’s Development (NEPAD), Economic Community of West African States (ECOWAS) and Common Market for Eastern and Southern Africa (COMESA) − and through business co-operation, support to agricultural research and development in relation to plant genetic resources − e.g. Multi Donor Trust Fund for Agricultural Research (CGIAR) and Global Crop Diversity Trust (GCDT) − and increased bilateral support to agriculture.15
� Strengthen development of food crops specifically adapted to climate change (e.g. floods, drought) through collaboration with, for example, GCDT. However, Norway has a clear policy of not supporting interventions using Genetically Modified Organisms (GMOs).
� Maintain focus on conservation agriculture (CA16). Since the end of 1990s, Norway has been financing the development of a toolbox of climate-adapted agricultural methods (e.g. CA for small-scale farmers in Zambia). Similar interventions were supported in Malawi, Ethiopia, Uganda, Eritrea, India, Central America and Southern Africa (through COMESA). The support to CA in Africa has been linked to regional and international organisations − for instance, the CAADP Pillar 1 and NEPAD Environmental Action Plan.
In general, and with regard to all proposed areas, activities have already been taking place for some time (e.g. CA). With regard to the conservation/preservation of genetic diversity of agricultural crops, Norway is already an important actor on the international scene, according to the 2010 working group paper, which therefore argues mainly for increased funding and a more structured approach.
Building on the 2010 Paper, the Norwegian government’s White Paper 14 presented a common orientation from the Foreign and Defence Committee with regard to a greener development and a higher level of coherence between development and climate policy. A main point was that the strengthening of climate initiatives should not be at the expense of the development aid. The common orientation advocated enhanced effort in relation to three (inter-related) areas: the forest initiative; renewable energy and climate adaptation (mainly agriculture); and prevention of natural disasters. The White Paper was approved in November 2011. As the current evaluation covers the period 2005-2011, and the Working Paper and the White Paper focus on proposed interventions from 2011, the main relevance of the papers is the reference to past interventions and the links to the proposed strategic interventions from 2011 and onwards.
A food security strategy called “Matsikkerhet i et Klimaperspektiv” (“Food security in a Climate Perspective”) was launched in December 2012 (further discussed under Chapter 5).
15 In addition, it was proposed to focus on support to the international Climate Change Adaptation Fund, as well as water resource management in Southern African and in the Himalaya area. These areas are, however, not part of the evaluation.
16 Throughout the report the terms conservation agriculture (CA) and conservation farming (CF) are used interchangeably.
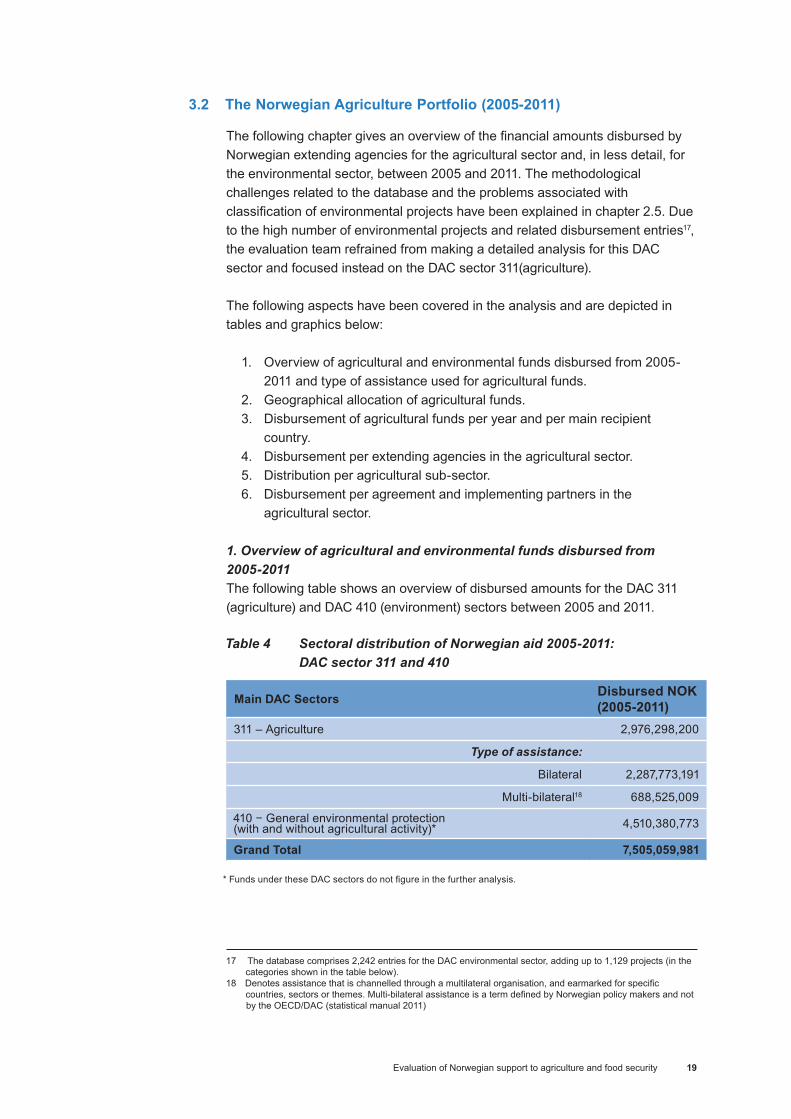
Evaluation of Norwegian support to agriculture and food security 19
3.2 The Norwegian Agriculture Portfolio (2005-2011)
The following chapter gives an overview of the financial amounts disbursed by Norwegian extending agencies for the agricultural sector and, in less detail, for the environmental sector, between 2005 and 2011. The methodological challenges related to the database and the problems associated with classification of environmental projects have been explained in chapter 2.5. Due to the high number of environmental projects and related disbursement entries17, the evaluation team refrained from making a detailed analysis for this DAC sector and focused instead on the DAC sector 311(agriculture).
The following aspects have been covered in the analysis and are depicted in tables and graphics below:
1. Overview of agricultural and environmental funds disbursed from 2005-2011 and type of assistance used for agricultural funds.
2. Geographical allocation of agricultural funds.3. Disbursement of agricultural funds per year and per main recipient
country.4. Disbursement per extending agencies in the agricultural sector.5. Distribution per agricultural sub-sector.6. Disbursement per agreement and implementing partners in the
agricultural sector.
1. Overview of agricultural and environmental funds disbursed from 2005-2011The following table shows an overview of disbursed amounts for the DAC 311 (agriculture) and DAC 410 (environment) sectors between 2005 and 2011.
Table 4 Sectoral distribution of Norwegian aid 2005-2011: DAC sector 311 and 410 1818
Main DAC Sectors Disbursed NOK (2005-2011)
311 – Agriculture 2,976,298,200
Type of assistance:
Bilateral 2,287,773,191
Multi-bilateral18 688,525,009
410 − General environmental protection (with and without agricultural activity)* 4,510,380,773
Grand Total 7,505,059,981
* Funds under these DAC sectors do not figure in the further analysis.
17 The database comprises 2,242 entries for the DAC environmental sector, adding up to 1,129 projects (in the categories shown in the table below).
18 Denotes assistance that is channelled through a multilateral organisation, and earmarked for specific countries, sectors or themes. Multi-bilateral assistance is a term defined by Norwegian policy makers and not by the OECD/DAC (statistical manual 2011)
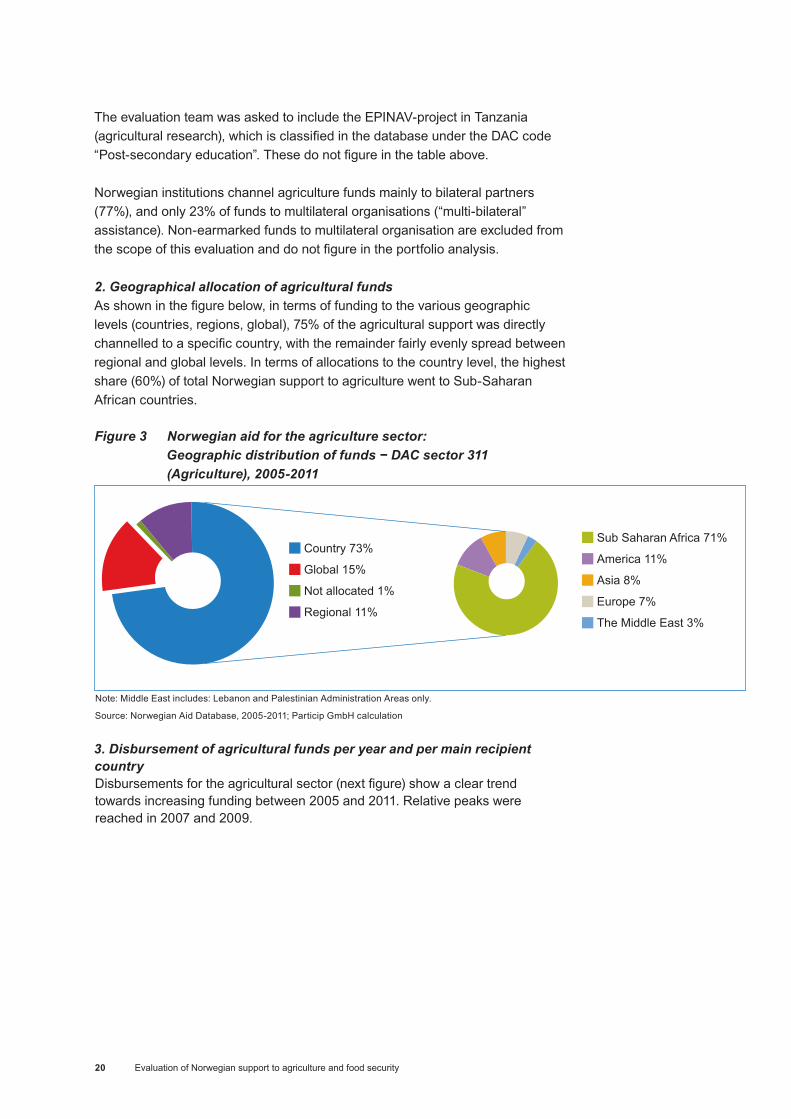
Evaluation of Norwegian support to agriculture and food security20
The evaluation team was asked to include the EPINAV-project in Tanzania (agricultural research), which is classified in the database under the DAC code “Post-secondary education”. These do not figure in the table above.
Norwegian institutions channel agriculture funds mainly to bilateral partners (77%), and only 23% of funds to multilateral organisations (“multi-bilateral” assistance). Non-earmarked funds to multilateral organisation are excluded from the scope of this evaluation and do not figure in the portfolio analysis.
2. Geographical allocation of agricultural fundsAs shown in the figure below, in terms of funding to the various geographic levels (countries, regions, global), 75% of the agricultural support was directly channelled to a specific country, with the remainder fairly evenly spread between regional and global levels. In terms of allocations to the country level, the highest share (60%) of total Norwegian support to agriculture went to Sub-Saharan African countries.
Figure 3 Norwegian aid for the agriculture sector: Geographic distribution of funds − DAC sector 311 (Agriculture), 2005-2011
Note: Middle East includes: Lebanon and Palestinian Administration Areas only.
Source: Norwegian Aid Database, 2005-2011; Particip GmbH calculation 3. Disbursement of agricultural funds per year and per main recipient country Disbursements for the agricultural sector (next figure) show a clear trend towards increasing funding between 2005 and 2011. Relative peaks were reached in 2007 and 2009.
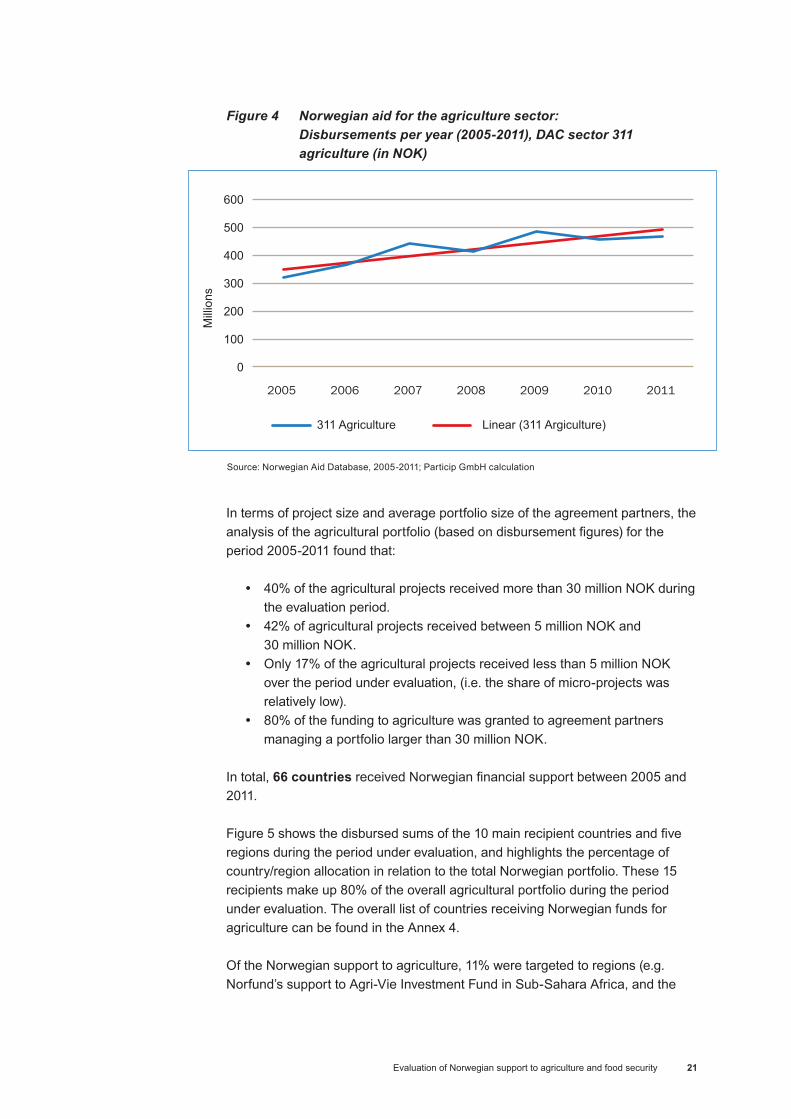
Evaluation of Norwegian support to agriculture and food security 21
Figure 4 Norwegian aid for the agriculture sector: Disbursements per year (2005-2011), DAC sector 311 agriculture (in NOK)
Source: Norwegian Aid Database, 2005-2011; Particip GmbH calculation
In terms of project size and average portfolio size of the agreement partners, the analysis of the agricultural portfolio (based on disbursement figures) for the period 2005-2011 found that:
� 40% of the agricultural projects received more than 30 million NOK during the evaluation period.
� 42% of agricultural projects received between 5 million NOK and 30 million NOK.
� Only 17% of the agricultural projects received less than 5 million NOK over the period under evaluation, (i.e. the share of micro-projects was relatively low).
� 80% of the funding to agriculture was granted to agreement partners managing a portfolio larger than 30 million NOK.
In total, 66 countries received Norwegian financial support between 2005 and 2011.
Figure 5 shows the disbursed sums of the 10 main recipient countries and five regions during the period under evaluation, and highlights the percentage of country/region allocation in relation to the total Norwegian portfolio. These 15 recipients make up 80% of the overall agricultural portfolio during the period under evaluation. The overall list of countries receiving Norwegian funds for agriculture can be found in the Annex 4.
Of the Norwegian support to agriculture, 11% were targeted to regions (e.g. Norfund’s support to Agri-Vie Investment Fund in Sub-Sahara Africa, and the
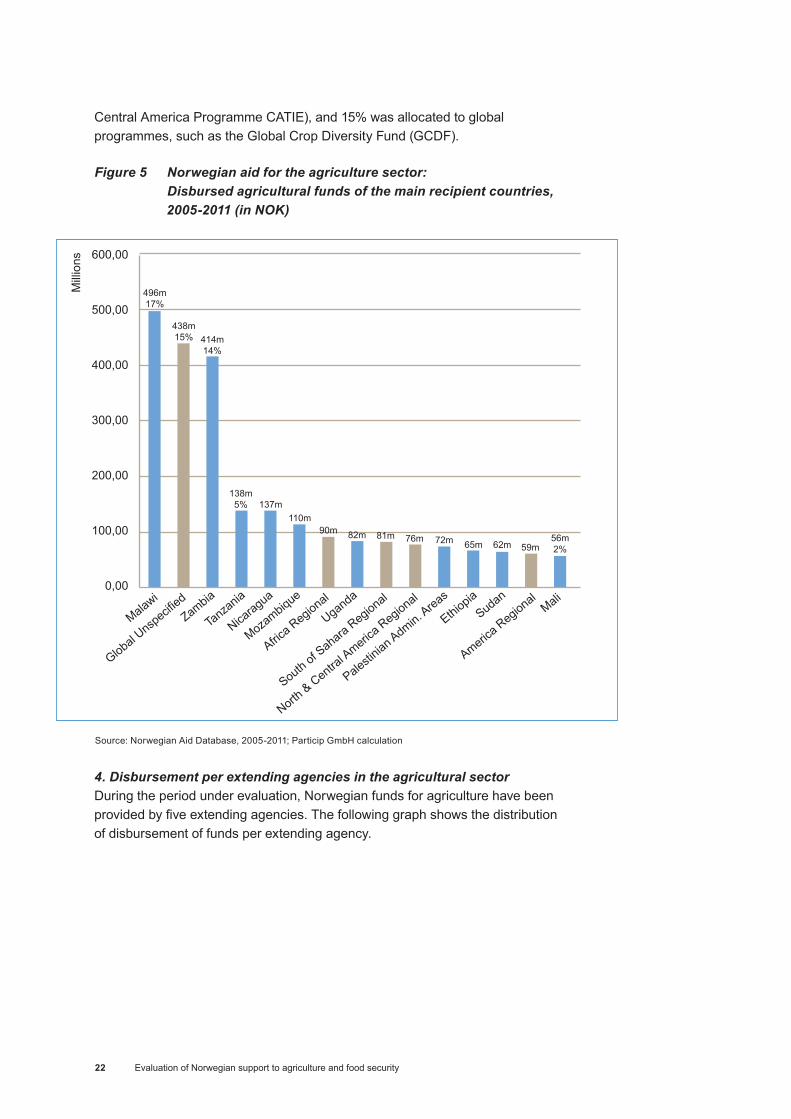
Evaluation of Norwegian support to agriculture and food security22
Central America Programme CATIE), and 15% was allocated to global programmes, such as the Global Crop Diversity Fund (GCDF).
Figure 5 Norwegian aid for the agriculture sector: Disbursed agricultural funds of the main recipient countries, 2005-2011 (in NOK)
Source: Norwegian Aid Database, 2005-2011; Particip GmbH calculation
4. Disbursement per extending agencies in the agricultural sector During the period under evaluation, Norwegian funds for agriculture have been provided by five extending agencies. The following graph shows the distribution of disbursement of funds per extending agency.
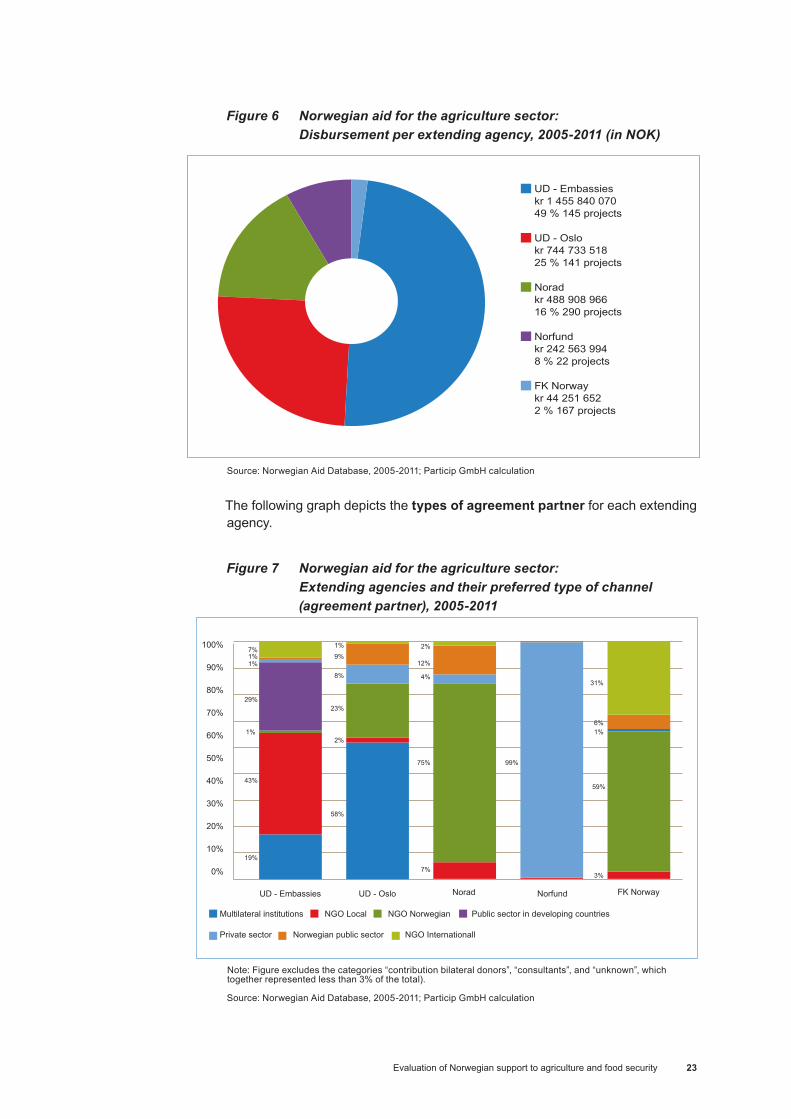
Evaluation of Norwegian support to agriculture and food security 23
Figure 6 Norwegian aid for the agriculture sector: Disbursement per extending agency, 2005-2011 (in NOK)
Source: Norwegian Aid Database, 2005-2011; Particip GmbH calculation
The following graph depicts the types of agreement partner for each extending agency.
Figure 7 Norwegian aid for the agriculture sector: Extending agencies and their preferred type of channel (agreement partner), 2005-2011
Note: Figure excludes the categories “contribution bilateral donors”, “consultants”, and “unknown”, which together represented less than 3% of the total). Source: Norwegian Aid Database, 2005-2011; Particip GmbH calculation

Evaluation of Norwegian support to agriculture and food security24
Norfund channelled its entire funding through private sector companies. FK Norway and Norad, respectively, channelled 60% and 75% of their funds for agriculture through Norwegian NGOs. Overall, and across all channels, the NGOs that received the highest amounts are (all figures indicate total disbursement 2005-2011):
� Norsk Folkehjelp (132.9 million), funded mainly by the MFA Oslo. � Det Kgl. Selskap for Norges Vel (104 million), funded mainly by Norad and
MFA Oslo; � Utviklingsfondet (91 million), funded mainly by FK Norway and Norad; � Kirkens Nødhjelp (58.8 million), funded mainly by Norad; � Digni (previously Bistandsnemnda) (49.5 million), funded mainly by Norad; � Drylands Co-ordination Group, Norway (Tørrlands-koordineringsgruppen)
(2 million), funded mainly by Norad. The embassies funded local NGOs (43%) or the Government (29%) − two categories that received only very limited attention from other types of extending agencies.
The MFA Oslo channelled the majority of its support through multilateral organisations, the main recipients being:
� FAO − 280.7 million from the MFA, and another 202.6 million from other funding agencies, mainly embassies.
� Biodiversity International (International Plant Genetic Resources Institute) − seven million from the MFA.
� UNDP − 28 million from the MFA, and 25.7 million from embassies.
5. Distribution per agricultural sub-sectorNorwegian funds to agriculture are classified in 18 different sub-categories, in accordance with OECD-DAC classification. The highest percentage (21.8%) of the funds disbursed for agricultural support went to the category “Agricultural development” (DAC sector 20), and amounted to 650 million NOK. This was followed by 16.8% (498 million NOK) to “agricultural policy”. All other categories each accounted for less than 10% of the overall agricultural portfolio. Overall, more than 85% of the support was allocated to nine sub-sectors. An overview of the distribution per DAC sector can be found in Annex 4.
In terms of regional distribution of agricultural support according to DAC sectors, while support under the umbrella of “agricultural development” was equally distributed between all geographic regions, support to “agricultural extension” was almost exclusively given to Africa. In contrast, Asia received almost one-third of total support for “agricultural inputs”, while “food crop production” support was predominantly to the Middle East. Almost all funds classified under “agricultural research” went to global interventions.
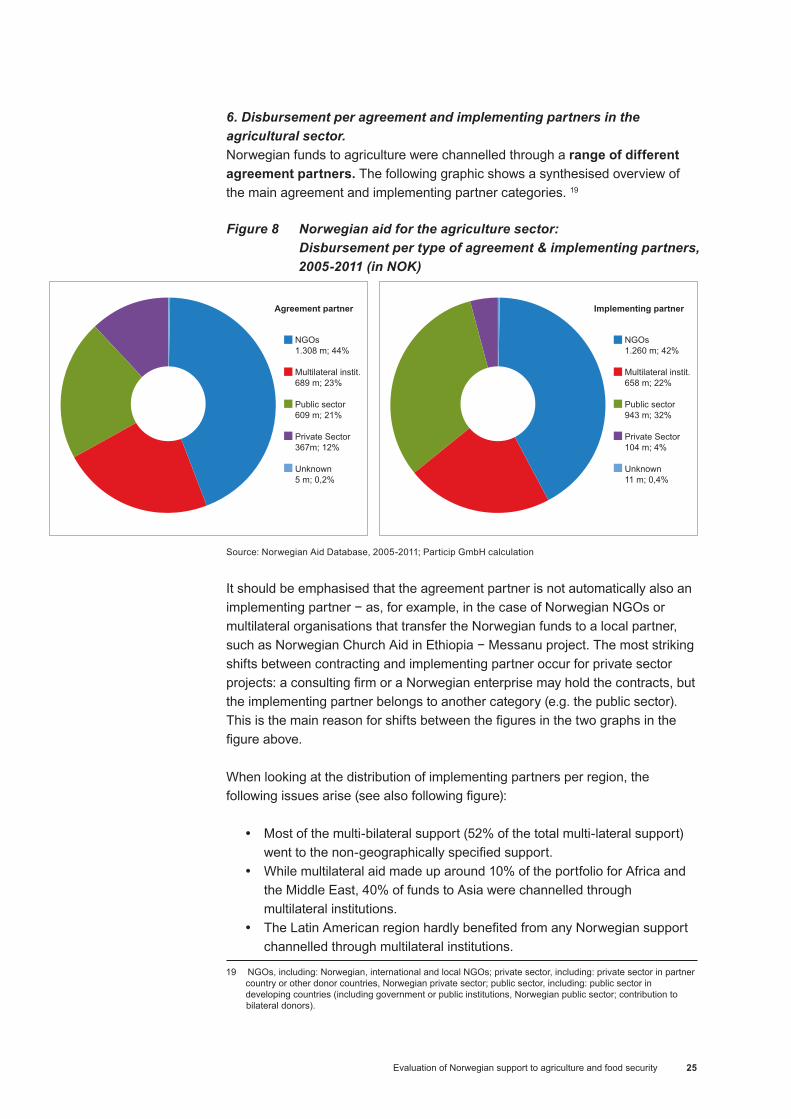
Evaluation of Norwegian support to agriculture and food security 25
6. Disbursement per agreement and implementing partners in the agricultural sector.Norwegian funds to agriculture were channelled through a range of different agreement partners. The following graphic shows a synthesised overview of the main agreement and implementing partner categories. 19
Figure 8 Norwegian aid for the agriculture sector: Disbursement per type of agreement & implementing partners, 2005-2011 (in NOK)
Source: Norwegian Aid Database, 2005-2011; Particip GmbH calculation
It should be emphasised that the agreement partner is not automatically also an implementing partner − as, for example, in the case of Norwegian NGOs or multilateral organisations that transfer the Norwegian funds to a local partner, such as Norwegian Church Aid in Ethiopia − Messanu project. The most striking shifts between contracting and implementing partner occur for private sector projects: a consulting firm or a Norwegian enterprise may hold the contracts, but the implementing partner belongs to another category (e.g. the public sector). This is the main reason for shifts between the figures in the two graphs in the figure above.
When looking at the distribution of implementing partners per region, the following issues arise (see also following figure):
� Most of the multi-bilateral support (52% of the total multi-lateral support) went to the non-geographically specified support.
� While multilateral aid made up around 10% of the portfolio for Africa and the Middle East, 40% of funds to Asia were channelled through multilateral institutions.
� The Latin American region hardly benefited from any Norwegian support channelled through multilateral institutions.
19 NGOs, including: Norwegian, international and local NGOs; private sector, including: private sector in partner country or other donor countries, Norwegian private sector; public sector, including: public sector in developing countries (including government or public institutions, Norwegian public sector; contribution to bilateral donors).
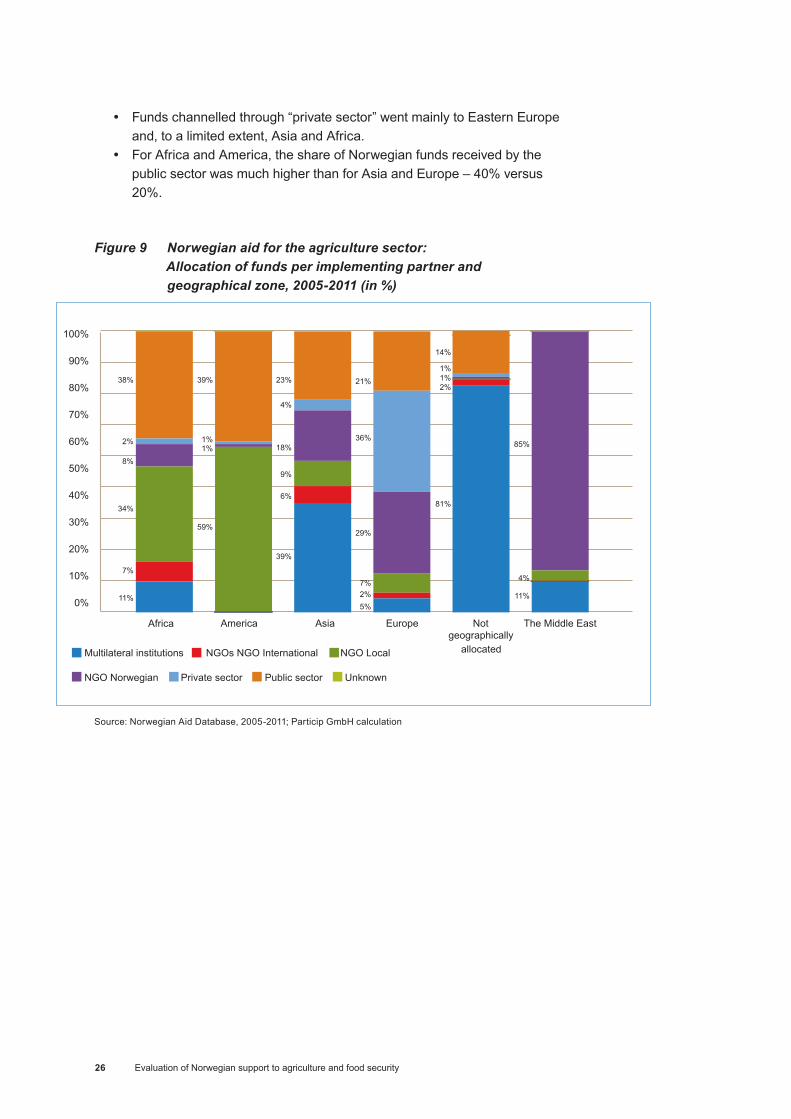
Evaluation of Norwegian support to agriculture and food security26
� Funds channelled through “private sector” went mainly to Eastern Europe and, to a limited extent, Asia and Africa.
� For Africa and America, the share of Norwegian funds received by the public sector was much higher than for Asia and Europe – 40% versus 20%.
Figure 9 Norwegian aid for the agriculture sector: Allocation of funds per implementing partner and geographical zone, 2005-2011 (in %)
Source: Norwegian Aid Database, 2005-2011; Particip GmbH calculation
Evaluation of Norwegian support to agriculture and food security 27
4. Evaluation Questions: results and analysis
Based on “light” analysis of selected project interventions, in-depth analysis of projects visited in Malawi, Zambia and Tanzania, and the case study of FK Norway, three clusters of Evaluation Questions (EQs) will be discussed below:
� Cluster 1: Contribution to Food Security. � Cluster 2: Monitoring and Evaluation (M&E) and Documentation. � Cluster 3: Sustainability and Scaling-up.
4.1 Cluster 1: Contribution to food security This cluster is at the heart of the evaluation as it assesses the extent to which Norwegian funds for agriculture were designed to and actually contributed to food security. Three EQs were clustered to address this issue.
EQ 1: To what extent have supported programmes been relevant for achieving food security, regardless of whether or not they have food security as an explicit objective?
EQ 2: To what extent have programme theories (rationale) of supported activities – explicitly or implicitly related to food security – been based on evidence and realistic?
EQ 3: To what extent have programmes reached, or are likely to reach, their goals with respect to food security?
The EQs were interpreted in the following way:
EQ1 focuses on relevance in relation to the national context and to the final beneficiaries − hence, the JCs focus on the extent to which the interventions were aligned with/coherent with national food security policies and programmes, and whether the interventions were regarded as relevant to the final beneficiaries.
EQ2 focuses on the design of the interventions (programme theories) and whether these were based on evidence and were realistic in relation to the four aspects of food security: availability, accessibility, stability and utilisation (defined in 2.1). Based on an analysis of the programme theories and the impact paths, the central question analysed under EQ2 is whether the inventions were likely to lead to increased food availability, accessibility, stability and utility.
Evaluation of Norwegian support to agriculture and food security28
EQ3 focuses on whether the programmes will reach, or had already reached, their goal with respect to food security. However, as noted in Table 5, less than 25% of the programmes had “food security” as a main objective. This was the case only for the following programmes: FISP in Malawi, CASPP and CAP I in Zambia, and the Integrated Rural Development Programme in Ethiopia. With regard to the global programme TFESSD, some sub-projects focused on food security. However, no data was available on project level (see methodological discussion in chapter 2. Norway-Netherlands Delegated Agricultural Support implicitly included a food security objective. Taking into consideration that relatively few programmes had objectives focusing on food security, it was decided to assess whether evidence of contribution to food security existed (focusing on the food security indicators mentioned in 2.1), rather than to measure the achievement of the food security objectives (which is how EQ3 is formulated). This is also necessary to be able to fulfil the purpose of the evaluation (“to assess to what extent Norwegian funds have contributed to food security). Rather than searching only for evidence on the ultimate achievement at the food utilisation level, the team also searched for achievements at lower levels (contributing to food utilisation), such as food access and access stability, household food production, income and food prices, and food availability (as presented in the impact pathways). As mentioned earlier, evidence (of contribution to the four aspects of food security) was understood as presence of project documentation (mainly in the form of baseline and end-of programme surveys), triangulated with other sources of information.
In the following, the discussion of each of the above EQs will be presented. In line with the Evaluation Matrix, each EQ includes a number of Judgment Criteria (JC). The discussion of each EQ is structured according to these JCs. The system of enumeration of the JCs is as follows: EQ 1 includes JC 11, 12; EQ2 includes JC 21, 22, etc.
4.1.1 Relevance (EQ1)
Alignment with national food security policies/strategies (JC11)The Norwegian-supported country level programmes were largely aligned with national food security strategies/policies (if available), agricultural policies, and Poverty Reduction Strategy Papers (PRSPs). In contrast, the evaluation found that the selected regional and global programmes were only partly aligned with national strategies in the countries selected for implementation.
In Zambia, the Norwegian-supported programmes (CAP I, CASPP) focusing on conservation agriculture (CA) were particularly central to the national agricultural Plan of Action (2004), in which CA is one of the main sustainable and environmentally-sound agricultural practices to be promoted. In Tanzania, the Mngeta rice farm in Kilombero Valley had a
Evaluation of Norwegian support to agriculture and food security 29
commercial purpose (development of rice business), which is line with the Norwegian Plan of Action for Agriculture (2004). The rice farm’s supply of rice for the domestic market contributed to food security for urban consumers, and middle/higher class consumers. The project support to 5,000 farmers − specifically, training in rice intensification, with the aim of achieving higher yield − was in line with the objectives in the 2008 PRSP of Tanzania.
For global programmes such as the TFESSD, which had been implementing 450 projects in various countries, it was not always possible to assess the alignment with national policies. The Global Crop Diversity Trust (GCDT) had collected data in around 20 countries, but had a highly relevant food security objective: to collect and adapt (modify) the most important food crops globally to be productive in future climates. As mentioned in chapter 3.1, the 2010 Working Paper (“Klimatilpasning i Utviklingssamarbeidet”) proposed that support to development of food crops adapted to climate change should be included as a central part of the new climate and development aid policy of Norway.
The primary objective of the regional programme in Africa, the Agri-Vie (Africa Ago-business Investment Fund) funded by Norfund, was to invest in and develop the African commercial agri-business, whether for export or for the national/regional market. Due to time constraints, it was not possible to assess the policy alignment in the specific countries where the programme was implemented. However, it should be mentioned that, overall, commercial agri-business (export/regional/national markets) contributed to food security through enhancing food availability and purchasing power. With regard to the regional programme in the Himalaya region, the International Centre for Integrated Mountain Development (ICIMOD), documentation revealed that a large number of ICIMOD’s initiatives were not well aligned with the regional countries’ priorities, and that there was insufficient knowledge and analysis of priorities, policies and development issues of member countries (commented on in Appropriation Document, 2007, Quinquennial Review 2006). The criticism was taken seriously, and enhanced alignment to stakeholder priorities was pursued in the strategy 2008-2012 (Strategic framework for ICIMOD, Oct 2007). In contrast, the regional programme in Central America, MAP, and its overall objective − that Meso-American societies should use sustainable land management strategies that reduce rural poverty − was well-aligned with national food security strategies in all implementing countries of Central America. This reflected a well-designed programme that had the potential to produce results in all the implementing countries.
Summing up: The selected country-level programmes were found to be well aligned with national food security/agricultural strategies policies. With regard to the Norfund programmes, these had (in line with the 2004 Plan of Action) a commercial purpose, but were also likely to contribute to food security through enhanced food availability and purchasing power. With regard to regional/global programmes, it was not possible in most cases to assess the relevance for the end-users, farmers or pastoralists.

Evaluation of Norwegian support to agriculture and food security30
Co-ordination and coherence with national/donor food security programmes (JC12)To a varying degree, country-level programmes were co-ordinated with food security programmes or food security platforms (if available) or other relevant forums. Local/international NGO projects (e.g. ARKFor and TAP in Tanzania, the FAIR programme and Lake Chilwa Programme in Malawi, and COMACO in Zambia) were to a large extent co-ordinated with other NGO projects, various food security/agriculture/climate change forums, but to a lesser extent with government offices. For instance, NASFAM (a smallholder association in Malawi), participated widely in various development forums, but the extension services of Ministry of Agriculture found that the NASFAM extension activities were not sufficiently co-ordinated with those of the Ministry. In the same country, some projects (for example, the DF programme) were well co-ordinated with government structures at district level (for example, training of lead farmers in sustainable agriculture had been delegated to the district level extension unit), and this ensured a higher level of impact, as well as sustainability. Government-implemented programmes, such as FISP in Malawi, also appeared to be relatively well-co-ordinated with other government programmes, as well as those of donors. Norwegian support through FISP was an integral part of the national food security programme co-ordinated by Government of Malawi, and was also supported by other donors (e.g. Irish Aid, DFID).
Box 1 shows an example of problems of co-ordination of two programmes, both funded by the Norwegian Embassy. In this case, the programmes were “designed” for co-ordination, but did not succeed in this, primarily due to conflicts over beneficiaries and the urge to show results.
Box 1 Example of co-ordination problems: Norwegian support in Zambia In Zambia, tensions arose between different conservation agriculture (CA) projects funded by the Norwegian Embassy. The Embassy had provided support to CA through the Climate Change Facility implemented by the Conservation Farming Unit (CFU), a local NGO, for decades. The Embassy, however, wanted to mainstream CA into government extension services under the Ministry of Agriculture and Co-operatives (MACO) and secure national policy support. FAO was contracted to support in the facilitation and monitoring of the CASPP launched in 2008. The intention was to implement the CASPP in partnership with the ongoing CAP I, implemented by ZFNU/CFU. CASPP was purposely implemented in the same 12 districts where CFU implemented the CAP I, in order to ensure synergy and experience sharing. The idea was that within the same districts the two programmes should cover different agricultural camps. The CASPP was planned to cover 12 camps in each district − a total of 144 camps. This led later to conflicts, as CFU alleged that CASPP duplicated the training to farmers already trained by CFU. The immediate problem was resolved, but collaboration resulting in synergy never evolved. The Noragric monitoring report 2012 (monitoring CAP I) also highlighted the lack of co-ordination between the two programmes. The report explained the problems of different incentives structures in the two programmes, which led farmers to select the programme with the best incentive, or to benefit from the incentives of both programmes.

Evaluation of Norwegian support to agriculture and food security 31
Regional programmes, global programmes and also research programmes (such as EPINAV and CCIAM) were designed to co-ordinate various sub-projects, but some also had the objective of forging partnerships globally or regionally. In terms of the internal co-ordination, there appeared to be room for improvement for several of the programmes − for example, with regard to the UN Convention to Combat Desertification (UNCCD) in Ethiopia, co-ordinating 14 projects aimed at strengthening pastoral livelihoods. According to the final evaluation of the UNCCD, there was insufficient collaboration and synergy between the partners who were implementing similar projects in different geographical areas.
The majority of regional/global and research programmes were not well-co-ordinated with other programmes or organisations. This was, for example, the case with TFESSD, a Trust Fund implemented by the World Bank, with the additional objective of forging partnerships globally, in donor countries, and in recipient countries. The 2012 evaluation concluded that the fund did not sufficiently foster co-ordination on the ground with other sources of aid.
Norfund’s projects (the rice farm in Tanzania and the regional programme Agri-Vie) were generally not co-ordinated with food security programmes as the project purpose was mainly commercial.
Summing up: Overall, the majority of country-level programmes were relatively well co-ordinated. NGO programmes were largely co-ordinated with other NGO projects and food security platforms, if available, but to a less extent with government offices. Government-implemented programmes were reasonably well co-ordinated at donor level, but less so with NGOs. In a few cases, Norway also supported organisations that were co-ordinating food security actions of Government and donors; this was, for example, the role of Agricultural Consultative Forum (ACF) under the Norway-Netherlands Delegated Support Programme in Zambia. Regional and global programmes appeared less well co-ordinated both within the implementing countries and with other programmes.
Relevance of interventions according to final beneficiaries (JC13) All Norwegian-supported country-level projects programmes were regarded by the evaluation team as being relevant for the final beneficiaries. With regard to the majority of the programmes, the final beneficiaries were small-holder farmers or pastoralists, who benefited directly from the results (increased productivity, enhanced purchasing power, climate change adaptation). In the cases where the programmes were applying a participatory approach, the activities could be further fine-tuned to beneficiary needs (e.g. ASP in Zambia).
Analysing the relevance of research, regional and global programmes was challenging, as these often consisted of a high number of sub-projects − and not all were necessarily directly related to agriculture. In these cases, it was also difficult to assess the needs and priorities of the final beneficiaries (i.e. end-users such as farmers or local stakeholders) as Norwegian funds did not have them as their primary target group. For instance, the target group of TFESSD was departments of the World Bank, whereas the target group of GCDT was climate change experts. However, the results of the GCDT (climate-adapted food crops) were found to benefit the end-users in the long-term. In the case of
Evaluation of Norwegian support to agriculture and food security32
TFESSD, the projects focused on studies, capacity building, pilot projects and tool kits. In 2010, the theme was “Climate Change Impacts and Response” (food insecurity); in 2011 “Shocks and Vulnerability”. Under these topics, programmes highly relevant for final beneficiaries (smallholders/pastoralists) were implemented, (e.g. programmes focusing on cash transfer, the Productive Safety Net Programme in Ethiopia), and nutrition. However, neither an overall list of activities financed nor a sectoral overview of activities (e.g. food security) existed, and it was therefore not possible to assess the overall relevance (and theories of change) of the programme.
With regard to research programmes such as EPINAV and CCIAM in Tanzania, the primary target groups were farmers/pastoralist, as well as such groups as students and policy makers. EPINAV and CCIAM both included “Strategic Interventions”, which comprised: learning centres for the transfer of best practices/technologies/innovation; training of farmers; establishment of value chain platforms (EPINAV); or demonstration farms in a private-public partnership (CCIAM). The evaluation team found the research programmes to be relevant to the beneficiaries, both in the short term, through these interventions (the ones related to agriculture), and in the long term, through the research.
Summing up: Broadly speaking, the level of relevance for final beneficiaries was thus high for the various types of Norwegian-supported programmes. This was, to a large extent, the result of the strong focus on smallholders − either targeting smallholders directly through agriculture, food security or livelihood programmes, or indirectly and long-term through research programmes with a focus on innovation (e.g. in relation to climate change adapted food crops).
4.1.2 Design/programme theories (EQ2)
As earlier mentioned, relatively few programmes had food security as an explicit objective: two CA programmes (CASPP and CAP I in Zambia), an agro-subsidy programme in Malawi (FISP), a rural development project in Ethiopia, and partly the TFESSD. For some programmes, capacity building was the exclusive objective (e.g. all PPPs and platforms under the Norway-Netherlands Delegated Support). It was then assumed that improved services would indirectly improve food security and/or agricultural productivity/production. Prorural, a major programme in Nicaragua, providing a package of livestock, seeds, material and tools to very poor smallholders, had implicitly a food security objective (poverty reduction). A slightly higher number of the programmes analysed (9 out of 25) focused on improving/diversifying livelihoods (agricultural/pastoralist). This included both NGO projects in Malawi and Ethiopia, but also a research programme (EPINAV), the regional programmes in Asia and North/Central America, and the Norway-Sweden Delegated Agricultural Support. The remaining programmes had the objectives of sustainable management of natural resources or adaptation to climate change.
The selected programmes were noticeably aligned with the 2004 Plan of Action for Agriculture in Norwegian Development Policy and the more recent 2010
Evaluation of Norwegian support to agriculture and food security 33
Working Group input to White Paper 14 (concerning linking development and climate policies). Overall, regardless of whether food security/improved livelihoods were explicit objectives, there was a clear poverty alleviation emphasis focusing on smallholder farmers and, partly, pastoralists, and/or on the adaptation to climate change, including, as a main component, climate adapted agricultural methods such as conservation agriculture (CA). Other programmes focused on agriculture-related research relevant for small-scale farmers and (global) on crop diversity, which was also central in the Norwegian discussion about climate adaptation (cf. White Paper 14). The programmes funded by Norfund reflected the development of the agricultural sector as part of private sector development, which was also part of the 2004 Action Plan for Agriculture.
The strong focus on rights to food and adequate living20 in the 2004 Plan of Action was, however, not well reflected in the selected programmes. The majority of programmes (e.g. those by NGOs) did not focus explicitly on rights − for example, through using a Rights-Based Approach (RBA) or focusing on securing rights as part of the objective − and only a limited number of programmes were involved in advocacy at policy level.
The 2004 Action Plan also included a strong focus on gender, defined as women’s rights and participation in agricultural development. Even though many programmes − mainly those by NGOs (e.g. Lake Chilwa, Malawi and Messanu, Ethiopia), but also the research programme CCIAM in Tanzania − did include activities focusing on women, only two programmes (DF in Malawi and Messanu in Ethiopia) explicitly focused on women’s participation in agriculture at objective and results level. Generally, targeted households were dealt with as entities, even if households in many parts of the world (e.g. East Africa) consist of different economic spheres for men and women, with gender-specific rights such as disposal of different crops, and types of livestock. If this aspect is not addressed at programme level, the risk is that programmes activities might focus on crops and/or livestock to which only men have the right of disposal, and thus the programme would not benefit women. The lack of focus on intra-household gender relations was reflected in the lack of M&E data on this aspect.
The figure below illustrates the pathways for the selected programmes, in accordance with a more specific classification of the programmes based on objectives and approaches applied, as discussed above. The programmes can be classified according to eight approaches, as seen below:
20 In accordance with the International Covenant on Economic, Social and Cultural Rights, Article 11, as described in the 2004 Plan of Action for Agriculture.

Evaluation of Norwegian support to agriculture and food security34
Figure 10 Impact pathways for the selected programmes21
As seen from figure 10 above, even if only very few of the selected programmes had food security as a direct objective, the programmes focusing on such aspects as income, climate change adaptation, value chain, livelihood, and farming business were likely to contribute to food security. The two main impact pathways identified were: 1) through supporting household food production (e.g. CASPP, FISP and CAP I); 2) through supporting increased household income (e.g. based on livelihood diversification programmes, livestock production, vegetable production, cash cropping and commercial production), leading to increased purchasing power (depending on the food prices). Most of the programmes were based on both impact pathways; thus, programmes aimed at increase of food production (e.g. CA programmes) also focused on cash cropping, and livelihood diversification programmes generally also focused on production for home consumption. As seen in the figure, the ultimate indicator of food security is individual food security. However, none of the evaluated programmes included intra-household information, including gender equity (as discussed earlier), and thus this aspect could not be assessed.
FK Norway presents a specific case with limited contribution to food security, as seen from the box below. The case is, therefore, not included in Figure 10 and is not further discussed under EQ2 and EQ3.
21 FK Norway and the global programme TFESSD are not included in the figure as they both comprise a high level of sub-projects, of which the majority did not include agricultural activities.

Evaluation of Norwegian support to agriculture and food security 35
Box 2 Overview of FK Norway’s activities related to agriculture The main activities of FK Norway were exchanges of personnel between Norway and the South, as well as South-South exchanges. Agriculture and environment/sustainable development were, however, relatively minor in FK’s annual portfolio; for example, of over 130 projects supported in 2012, only nine projects were related to environment (DAC410) and six to agriculture (DAC311). An assessment of agriculture-related projects showed that the projects under FK Norway focused on applied research, with very indirect effects on food security and the smallholders (or no effect at all). One of the two reviewed projects, research on goat production systems in Tanzania, had potentially indirect effects on food security, although at a small scale. It resulted in capacity building of Tanzanian specialists in relation to goat farming systems, building linkages between both participating organisations, and it resulted, anecdotally, in the founding of an NGO on dairy goat production in Tanzania. More importantly, the project contributed directly to the implementation of several Norwegian-supported programmes, such as the Programme for Agricultural and Natural Resources Transformation for Improved Livelihoods (PANTIL), EPINAV and CCIAM in Tanzania. There was potential for contributing indirectly to improved food security (although on a very short-term basis of 12-24 months) through personnel exchanges.
Table 5 shows the likely contribution of the selected programmes to the four aspects of food security (availability, accessibility, stability and utility), as will be discussed under EQ2 (programme theories). The table also presents the analysed programmes in terms of whether evidence of achievement of the four food security aspects was in place (as discussed under EQ3). The sources of information for the below review are the case study reports of the selected programmes. As mentioned earlier, these case study reports synthesise all the available information (quantitative/qualitative, primary/secondary).

Evaluation of Norwegian support to agriculture and food security36
Tabl
e 5
Like
lihoo
d an
d ev
iden
ce o
f foo
d se
curit
y of
the
sele
cted
pro
gram
mes
Agr
eem
ent t
itle
Mai
n O
bjec
tive?
Food
A
vaila
bilit
y (L
ikel
y/Ev
iden
ce)
Food
A
cces
sibi
lity
(Lik
ely/
Evid
ence
)
Food
Sta
bilit
y (L
ikel
y/Ev
iden
ce)
Food
util
isat
ion
(ade
quat
e di
et)
(Lik
ely/
Evid
ence
)N
umbe
r of
bene
ficia
ries
Sum
di
sbur
sed
(end
of 2
011)
N
OK
Mal
awi
Farm
Inpu
ts S
ubsi
dy
Pro
gram
me
(FIS
P)Fo
od s
ecur
ity
Evid
ence
: in
crea
sed
food
pr
oduc
tion
Evid
ence
: ho
useh
olds
w
ith a
cces
s
Evid
ence
: red
uced
le
ngth
of a
nnua
l foo
d sh
orta
ge/H
Hs
less
pr
one
to s
hock
(cop
ing
stra
tegy
inde
x)
Evid
ence
: cro
ss-s
ectio
n an
alys
is b
etw
een
acce
ss to
sub
sidi
es a
nd
cons
umpt
ion
of m
aize
, ve
geta
bles
, fru
it an
d m
eat
prod
ucts
.
1.4m
farm
ers
67,0
00,0
00
Rur
al L
ivel
ihoo
ds
Pro
gram
me
(DF)
Im
prov
ed
livel
ihoo
d
Evid
ence
: in
crea
sed
food
pr
oduc
tion
(RFS
P)
Evid
ence
: R
FSP
Evid
ence
: RFS
P a
nd
Mal
awi P
rogr
amm
eEv
iden
ce: i
ncre
ased
ac
cess
to d
iver
se &
nu
tritio
us fo
od (R
FSP)
20,0
00 h
h (a
gri)
6000
hh
(live
stoc
k )
300
lead
farm
ers
17,0
17,5
25
SC
C −
Mal
awi’s
Lak
e B
asin
Pro
gram
me
Pha
se II
Impr
oved
liv
elih
ood
Evid
ence
: in
crea
sed
food
pr
oduc
tion
Like
ly; n
o ev
iden
ce
Evid
ence
: inc
reas
ed
acce
ssLi
kely
; no
evid
ence
15,5
21 fa
rmer
s41
82 p
rs. i
n sa
ving
/lo
an c
lubs
437
prod
ucer
gro
ups
52 li
vest
ock
grou
ps
36,3
30,0
00
Lake
Chi
lwa
Bas
in
Clim
ate
Cha
nge
Pro
gram
me
Impr
oved
liv
elih
ood
Evid
ence
: in
crea
sed
food
pr
oduc
tion
(pilo
t)Li
kely
; no
evid
ence
Like
ly; n
o ev
iden
ce
Like
ly; n
o ev
iden
ce1.
5 m
ill. p
eopl
eP
ilot:
40 p
eopl
e 21
,500
,000
Impr
ovin
g th
e Li
velih
oods
of
Mal
awia
n S
mal
lhol
der
Farm
ers
(NA
SFA
M) –
P
ETS
Pro
mot
ing
farm
ing
as
busi
ness
Like
ly; n
o sp
ecifi
c da
ta fo
r fo
od c
rops
Like
ly; n
o ev
iden
ce o
f nu
mbe
r of
mea
ls p
er
day
(but
en
hanc
ed
year
ly fo
od
secu
rity,
cf.
stab
ility
)
Evid
ence
: enh
ance
d ye
arly
food
sec
urity
, fro
m 6
7% to
80%
of
mem
bers
Like
ly; n
o ev
iden
ce
50,1
00 m
embe
rs95
,000
,000
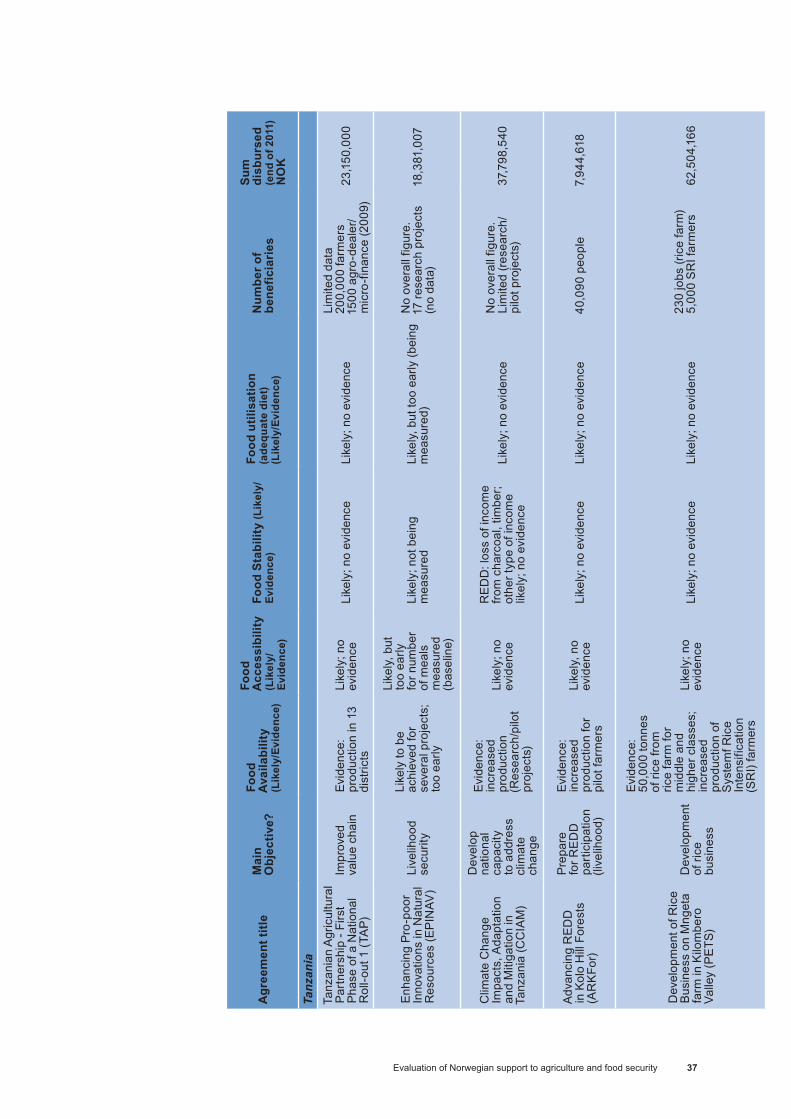
Evaluation of Norwegian support to agriculture and food security 37
Agr
eem
ent t
itle
Mai
n O
bjec
tive?
Food
A
vaila
bilit
y (L
ikel
y/Ev
iden
ce)
Food
A
cces
sibi
lity
(Lik
ely/
Evid
ence
)
Food
Sta
bilit
y (L
ikel
y/Ev
iden
ce)
Food
util
isat
ion
(ade
quat
e di
et)
(Lik
ely/
Evid
ence
)N
umbe
r of
bene
ficia
ries
Sum
di
sbur
sed
(end
of 2
011)
N
OK
Tanz
ania
Tanz
ania
n A
gric
ultu
ral
Part
ners
hip
- Firs
t P
hase
of a
Nat
iona
l R
oll-o
ut 1
(TA
P)
Impr
oved
va
lue
chai
n
Evid
ence
: pr
oduc
tion
in 1
3 di
stric
ts
Like
ly; n
o ev
iden
ce
Like
ly; n
o ev
iden
ce
Like
ly; n
o ev
iden
ceLi
mite
d da
ta20
0,00
0 fa
rmer
s15
00 a
gro-
deal
er/
mic
ro-fi
nanc
e (2
009)
23,1
50,0
00
Enha
ncin
g P
ro-p
oor
Inno
vatio
ns in
Nat
ural
R
esou
rces
(EPI
NAV
)Li
velih
ood
secu
rity
Like
ly to
be
achi
eved
for
seve
ral p
roje
cts;
to
o ea
rly
Like
ly, b
ut
too
early
fo
r num
ber
of m
eals
m
easu
red
(bas
elin
e)
Like
ly; n
ot b
eing
m
easu
red
Like
ly, b
ut to
o ea
rly (b
eing
m
easu
red)
N
o ov
eral
l fig
ure.
17
rese
arch
pro
ject
s (n
o da
ta)
18,3
81,0
07
Clim
ate
Cha
nge
Impa
cts,
Ada
ptat
ion
and
Miti
gatio
n in
Ta
nzan
ia (C
CIA
M)
Dev
elop
na
tiona
l ca
paci
ty
to a
ddre
ss
clim
ate
chan
ge
Evid
ence
: in
crea
sed
prod
uctio
n (R
esea
rch/
pilo
t pr
ojec
ts)
Like
ly; n
o ev
iden
ce
RE
DD
: los
s of
inco
me
from
cha
rcoa
l, tim
ber;
othe
r typ
e of
inco
me
likel
y; n
o ev
iden
ce
Like
ly; n
o ev
iden
ceN
o ov
eral
l fig
ure.
Lim
ited
(rese
arch
/pi
lot p
roje
cts)
37,7
98,5
40
Adv
anci
ng R
ED
D
in K
olo
Hill
For
ests
(A
RK
For)
Pre
pare
fo
r RE
DD
pa
rtici
patio
n (li
velih
ood)
Evid
ence
: in
crea
sed
prod
uctio
n fo
r pi
lot f
arm
ers
Like
ly, n
o ev
iden
ce
Like
ly; n
o ev
iden
ce
Like
ly; n
o ev
iden
ce40
,090
peo
ple
7,94
4,61
8
Dev
elop
men
t of R
ice
Bus
ines
s on
Mng
eta
farm
in K
ilom
bero
Va
lley
(PE
TS)
Dev
elop
men
t of
rice
bu
sine
ss
Evid
ence
: 50
,000
tonn
es
of ri
ce fr
om
rice
farm
for
mid
dle
and
high
er c
lass
es;
incr
ease
d pr
oduc
tion
of
Sys
tem
f Ric
e In
tens
ifica
tion
(SR
I) fa
rmer
s
Like
ly; n
o ev
iden
ce
Like
ly; n
o ev
iden
ce
Like
ly; n
o ev
iden
ce23
0 jo
bs (r
ice
farm
)5,
000
SR
I far
mer
s62
,504
,166
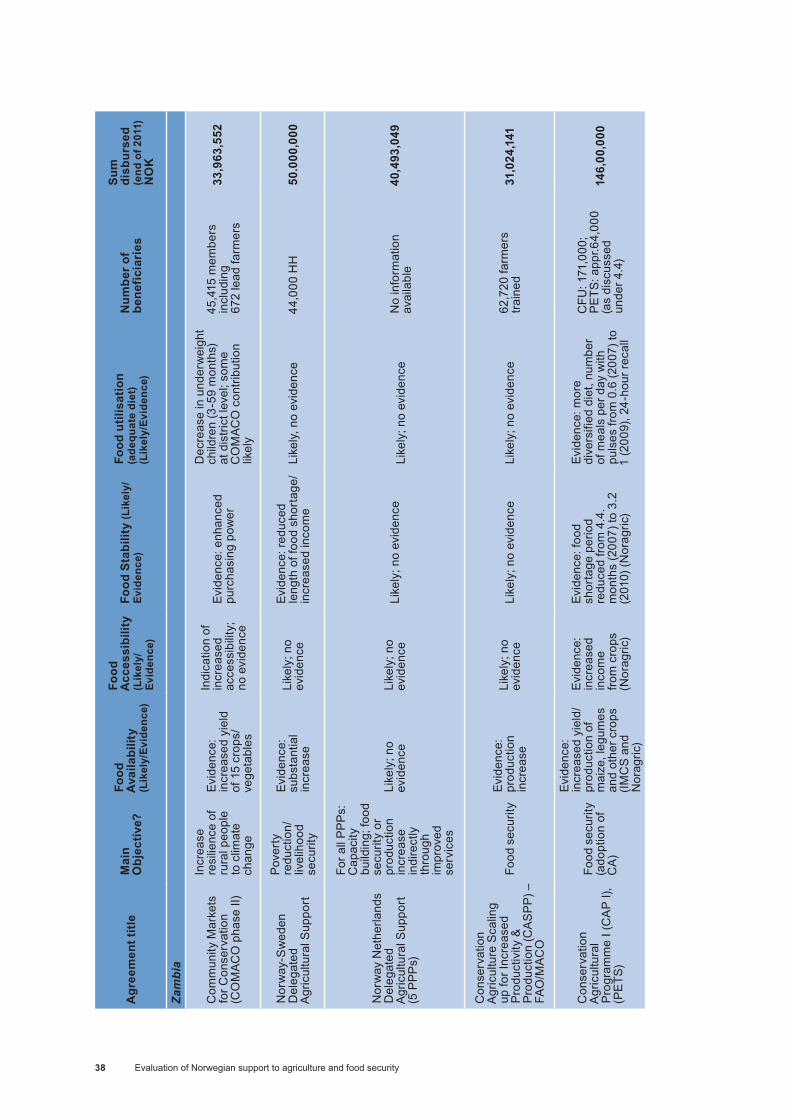
Evaluation of Norwegian support to agriculture and food security38
Agr
eem
ent t
itle
Mai
n O
bjec
tive?
Food
A
vaila
bilit
y (L
ikel
y/Ev
iden
ce)
Food
A
cces
sibi
lity
(Lik
ely/
Evid
ence
)
Food
Sta
bilit
y (L
ikel
y/Ev
iden
ce)
Food
util
isat
ion
(ade
quat
e di
et)
(Lik
ely/
Evid
ence
)N
umbe
r of
bene
ficia
ries
Sum
di
sbur
sed
(end
of 2
011)
N
OK
Zam
bia
Com
mun
ity M
arke
ts
for C
onse
rvat
ion
(CO
MAC
O p
hase
II)
Incr
ease
re
silie
nce
of
rura
l peo
ple
to c
limat
e ch
ange
Evid
ence
: in
crea
sed
yiel
d of
15
crop
s/ve
geta
bles
Indi
catio
n of
in
crea
sed
acce
ssib
ility
; no
evi
denc
e
Evid
ence
: enh
ance
d pu
rcha
sing
pow
er
Dec
reas
e in
und
erw
eigh
t ch
ildre
n (3
-59
mon
ths)
at
dis
trict
leve
l; so
me
CO
MAC
O c
ontri
butio
n lik
ely
45,4
15 m
embe
rs
incl
udin
g 67
2 le
ad fa
rmer
s33
,963
,552
Nor
way
-Sw
eden
D
eleg
ated
A
gric
ultu
ral S
uppo
rt
Pove
rty
redu
ctio
n/
livel
ihoo
d se
curit
y
Evid
ence
: su
bsta
ntia
l in
crea
se
Like
ly; n
o ev
iden
ceEv
iden
ce: r
educ
ed
leng
th o
f foo
d sh
orta
ge/
incr
ease
d in
com
e Li
kely
, no
evid
ence
44,0
00 H
H50
.000
,000
Nor
way
Net
herla
nds
Del
egat
ed
Agr
icul
tura
l Sup
port
(5 P
PP
s)
For a
ll P
PP
s:
Cap
acity
bu
ildin
g; fo
od
secu
rity
or
prod
uctio
n in
crea
se
indi
rect
ly
thro
ugh
impr
oved
se
rvic
es
Like
ly; n
o ev
iden
ce
Like
ly; n
o ev
iden
ceLi
kely
; no
evid
ence
Li
kely
; no
evid
ence
No
info
rmat
ion
avai
labl
e 40
,493
,049
Con
serv
atio
n A
gric
ultu
re S
calin
g up
for I
ncre
ased
P
rodu
ctiv
ity &
P
rodu
ctio
n (C
AS
PP)
–
FAO
/MAC
O
Food
sec
urity
Ev
iden
ce:
prod
uctio
n in
crea
seLi
kely
; no
evid
ence
Li
kely
; no
evid
ence
Li
kely
; no
evid
ence
62,7
20 fa
rmer
s tra
ined
31
,024
,141
Con
serv
atio
n A
gric
ultu
ral
Pro
gram
me
I (C
AP
I),
(PE
TS)
Food
sec
urity
(a
dopt
ion
of
CA)
Evid
ence
: in
crea
sed
yiel
d/
prod
uctio
n of
m
aize
, leg
umes
an
d ot
her c
rops
(IM
CS
and
N
orag
ric)
Evid
ence
: in
crea
sed
inco
me
from
cro
ps
(Nor
agric
)
Evid
ence
: foo
d sh
orta
ge p
erio
d re
duce
d fro
m 4
.4.
mon
ths
(200
7) to
3.2
(2
010)
(Nor
agric
)
Evid
ence
: mor
e di
vers
ified
die
t, nu
mbe
r of
mea
ls p
er d
ay w
ith
puls
es fr
om 0
.6 (2
007)
to
1 (2
009)
, 24-
hour
reca
ll
CFU
: 171
,000
; P
ETS
: app
r.64,
000
(as
disc
usse
d
unde
r 4.4
) 14
6,00
,000
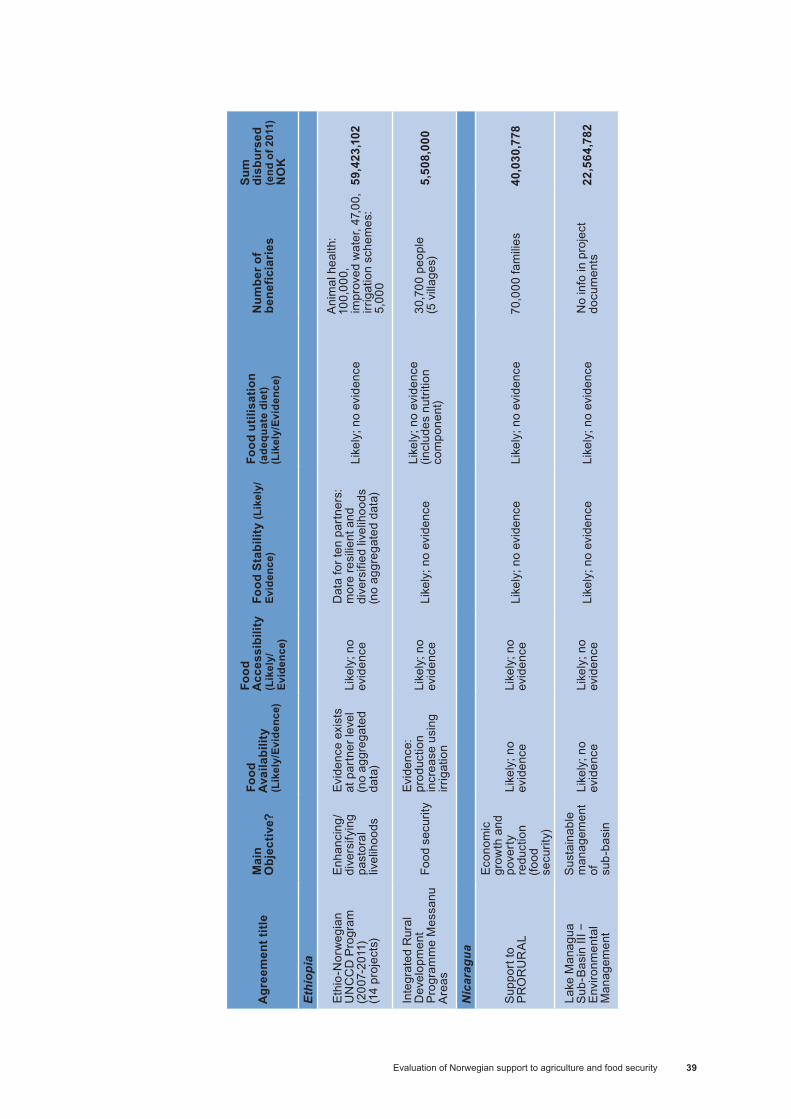
Evaluation of Norwegian support to agriculture and food security 39
Agr
eem
ent t
itle
Mai
n O
bjec
tive?
Food
A
vaila
bilit
y (L
ikel
y/Ev
iden
ce)
Food
A
cces
sibi
lity
(Lik
ely/
Evid
ence
)
Food
Sta
bilit
y (L
ikel
y/Ev
iden
ce)
Food
util
isat
ion
(ade
quat
e di
et)
(Lik
ely/
Evid
ence
)N
umbe
r of
bene
ficia
ries
Sum
di
sbur
sed
(end
of 2
011)
N
OK
Ethi
opia
Ethi
o-N
orw
egia
n U
NC
CD
Pro
gram
(2
007-
2011
)(1
4 pr
ojec
ts)
Enha
ncin
g/di
vers
ifyin
g pa
stor
al
livel
ihoo
ds
Evid
ence
exi
sts
at p
artn
er le
vel
(no
aggr
egat
ed
data
)
Like
ly; n
o ev
iden
ce
Dat
a fo
r ten
par
tner
s:
mor
e re
silie
nt a
nd
dive
rsifi
ed li
velih
oods
(n
o ag
greg
ated
dat
a)
Like
ly; n
o ev
iden
ce
Ani
mal
hea
lth:
100,
000,
im
prov
ed w
ater
, 47,
00,
irrig
atio
n sc
hem
es:
5,00
0
59,4
23,1
02
Inte
grat
ed R
ural
D
evel
opm
ent
Pro
gram
me
Mes
sanu
A
reas
Food
sec
urity
Evid
ence
: pr
oduc
tion
incr
ease
usi
ng
irrig
atio
n
Like
ly; n
o ev
iden
ceLi
kely
; no
evid
ence
Like
ly; n
o ev
iden
ce
(incl
udes
nut
ritio
n co
mpo
nent
) 30
,700
peo
ple
(5 v
illag
es)
5,50
8,00
0
Nic
arag
ua
Sup
port
to
PR
OR
UR
AL
Econ
omic
gr
owth
and
po
vert
y re
duct
ion
(food
se
curit
y)
Like
ly; n
o ev
iden
ce
Like
ly; n
o ev
iden
ce
Like
ly; n
o ev
iden
ce
Like
ly; n
o ev
iden
ce
70,0
00 fa
mili
es40
,030
,778
Lake
Man
agua
S
ub-B
asin
III −
En
viro
nmen
tal
Man
agem
ent
Sus
tain
able
m
anag
emen
t of
su
b-ba
sin
Like
ly; n
o ev
iden
ce
Like
ly; n
o ev
iden
ceLi
kely
; no
evid
ence
Li
kely
; no
evid
ence
N
o in
fo in
pro
ject
do
cum
ents
22
,564
,782

Evaluation of Norwegian support to agriculture and food security40
Agr
eem
ent t
itle
Mai
n O
bjec
tive?
Food
A
vaila
bilit
y (L
ikel
y/Ev
iden
ce)
Food
A
cces
sibi
lity
(Lik
ely/
Evid
ence
)
Food
Sta
bilit
y (L
ikel
y/Ev
iden
ce)
Food
util
isat
ion
(ade
quat
e di
et)
(Lik
ely/
Evid
ence
)N
umbe
r of
bene
ficia
ries
Sum
di
sbur
sed
(end
of 2
011)
N
OK
Sout
h of
Sah
ara
Reg
iona
l
Agr
i-Vie
Com
mer
cial
(A
gri-
busi
ness
). A
frica
JUIC
E:
prod
uctio
n of
food
ju
ice,
mai
nly
expo
rt;
Hyg
rote
ch:
vege
tabl
e se
ed
mar
ketin
g/
dist
ribut
ion
Afri
caJU
ICE:
lik
ely,
som
e in
terc
ropp
ing
with
veg
etab
les.
H
ygro
tech
: lik
ely,
no
evi
denc
e
Like
ly fo
r bot
h co
mpa
nies
; no
evi
denc
e
Afri
caJU
ICE:
Impr
oved
liv
elih
oods
(Inc
reas
ed
juic
e pr
oduc
tion,
em
ploy
men
t, in
terc
ropp
ing)
H
ygro
tech
: lik
ely,
no
evid
ence
Like
ly fo
r bot
h co
mpa
nies
; no
evi
denc
e A
frica
JUIC
E: 1
,000
H
HH
ygro
tech
: no
info
30,5
75,2
43
Nor
th &
Cen
tral
A
mer
ica
Reg
iona
l
Mes
o-A
mer
ican
A
gro-
Envi
ronm
enta
l P
rogr
amm
e (M
AP)
–
CAT
IE
Sus
tain
able
la
nd u
se fo
r im
prov
ed
livel
ihoo
ds
Like
ly; n
o ev
iden
ceLi
kely
; no
evid
ence
Som
e in
form
atio
n on
liv
elih
ood
dive
rsifi
catio
n (7
50 h
h in
MA
P
Focu
enca
s)
Like
ly; n
o ev
iden
ceC
ount
ry le
vel:
437
to
7,50
0 fa
mili
es
108,
891,
705
Asi
a R
egio
nal
Inte
rnat
iona
l Cen
tre
for I
nteg
rate
d M
ount
ain
Dev
elop
men
t (IC
IMO
D)
Sus
tain
able
m
anag
emen
t of
wat
er/
eco-
syst
ems
for i
mpr
oved
liv
elih
oods
No
food
cro
p pr
oduc
tion
Like
ly, n
o ev
iden
ce
Like
ly; n
o ev
iden
ce(li
vest
ock/
hone
y pr
oduc
tion)
Like
ly; n
o ev
iden
ceN
o da
ta a
vaila
ble
20,0
00,0
0
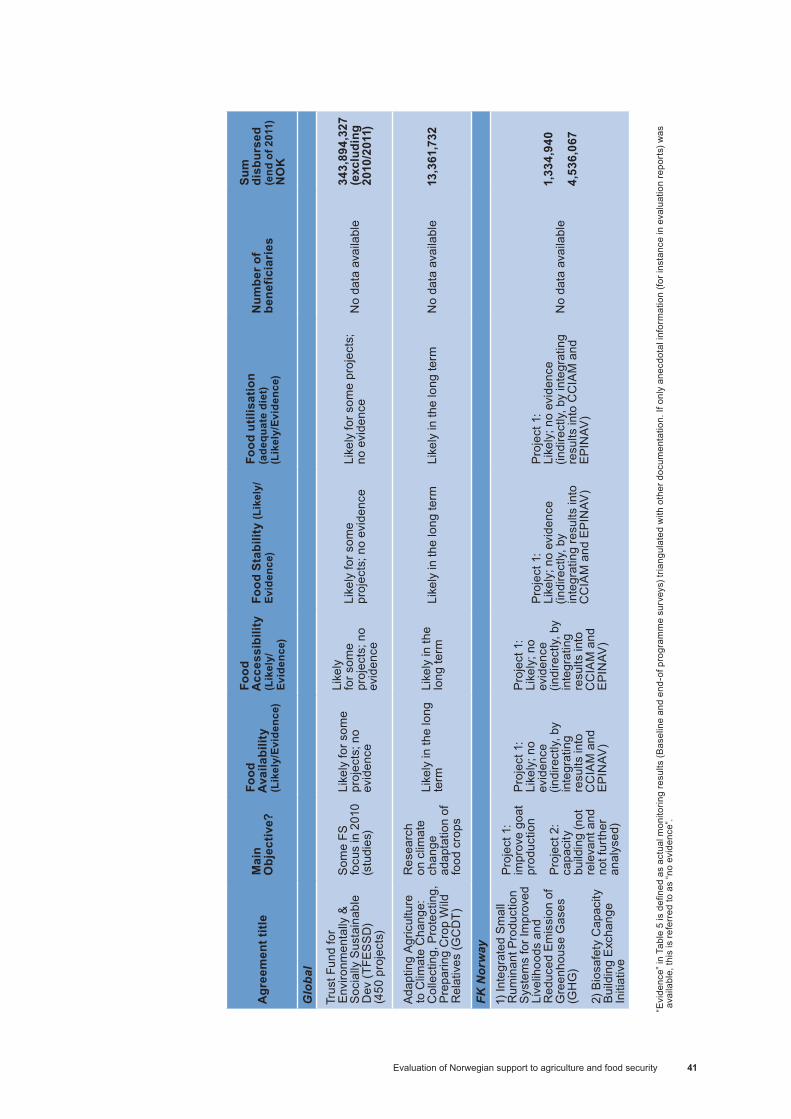
Evaluation of Norwegian support to agriculture and food security 41
Agr
eem
ent t
itle
Mai
n O
bjec
tive?
Food
A
vaila
bilit
y (L
ikel
y/Ev
iden
ce)
Food
A
cces
sibi
lity
(Lik
ely/
Evid
ence
)
Food
Sta
bilit
y (L
ikel
y/Ev
iden
ce)
Food
util
isat
ion
(ade
quat
e di
et)
(Lik
ely/
Evid
ence
)N
umbe
r of
bene
ficia
ries
Sum
di
sbur
sed
(end
of 2
011)
N
OK
Glo
bal
Trus
t Fun
d fo
r En
viro
nmen
tally
&
Soc
ially
Sus
tain
able
D
ev (T
FES
SD
)(4
50 p
roje
cts)
Som
e FS
fo
cus
in 2
010
(stu
dies
)
Like
ly fo
r som
e pr
ojec
ts; n
o ev
iden
ce
Like
ly
for s
ome
proj
ects
; no
evid
ence
Like
ly fo
r som
e pr
ojec
ts; n
o ev
iden
ce
Like
ly fo
r som
e pr
ojec
ts;
no e
vide
nce
No
data
ava
ilabl
e34
3,89
4,32
7 (e
xclu
ding
20
10/2
011)
Ada
ptin
g A
gric
ultu
re
to C
limat
e C
hang
e:
Col
lect
ing,
Pro
tect
ing,
P
repa
ring
Cro
p W
ild
Rel
ativ
es (G
CD
T)
Res
earc
h on
clim
ate
chan
ge
adap
tatio
n of
fo
od c
rops
Like
ly in
the
long
te
rmLi
kely
in th
e lo
ng te
rm
Like
ly in
the
long
term
Like
ly in
the
long
term
No
data
ava
ilabl
e 13
,361
,732
FK N
orw
ay
1) In
tegr
ated
Sm
all
Rum
inan
t Pro
duct
ion
Sys
tem
s fo
r Im
prov
ed
Live
lihoo
ds a
nd
Red
uced
Em
issi
on o
f G
reen
hous
e G
ases
(G
HG
)
2) B
iosa
fety
Cap
acity
B
uild
ing
Exc
hang
e In
itiat
ive
Pro
ject
1:
impr
ove
goat
pr
oduc
tion
Pro
ject
2:
capa
city
bu
ildin
g (n
ot
rele
vant
and
no
t fur
ther
an
alys
ed)
Pro
ject
1:
Like
ly; n
o ev
iden
ce
(indi
rect
ly, b
y in
tegr
atin
g re
sults
into
C
CIA
M a
nd
EPI
NAV
)
Pro
ject
1:
Like
ly; n
o ev
iden
ce
(indi
rect
ly, b
y in
tegr
atin
g re
sults
into
C
CIA
M a
nd
EPI
NAV
)
Pro
ject
1:
Like
ly; n
o ev
iden
ce
(indi
rect
ly, b
y in
tegr
atin
g re
sults
into
C
CIA
M a
nd E
PIN
AV)
Pro
ject
1:
Like
ly; n
o ev
iden
ce(in
dire
ctly
, by
inte
grat
ing
resu
lts in
to C
CIA
M a
nd
EPI
NAV
)
No
data
ava
ilabl
e 1,
334,
940
4,53
6,06
7
“Evi
denc
e” in
Tab
le 5
is d
efine
d as
act
ual m
onito
ring
resu
lts (B
asel
ine
and
end-
of p
rogr
amm
e su
rvey
s) tr
iang
ulat
ed w
ith o
ther
doc
umen
tatio
n. If
onl
y an
ecdo
tal i
nfor
mat
ion
(for i
nsta
nce
in e
valu
atio
n re
port
s) w
as
avai
labl
e, th
is is
refe
rred
to a
s “n
o ev
iden
ce”.
Evaluation of Norwegian support to agriculture and food security42
Likelihood of increased food availability (JC21) Table 5 above shows that the majority of the Norwegian-supported programmes had the potential to contribute to increased food availability, and in most cases there was also evidence in the form of M&E data (as discussed under EQ3). For most NGO projects, increased food production was one out of several expected results. For example, TAP in Tanzania focused on the provision of agro-input and market development, and DF in Malawi and Messanu Development in Ethiopia on food security through adoption of sustainable agricultural methods, income-generating activities, as well as the strengthening of community-based organisations, increased women’s participation, and stronger collective action to deal with HIV/AIDS.
Government-owned programmes had their main focus on increasing agricultural production. In Malawi, the multi-donor programme FISP was aimed at increasing production nationwide through provision of agro-input, and a doubling of the yield was expected (from 1 tonne/ha to 2 tonnes/ha), with a target group of 1.4 million people. For programmes promoting conservation agriculture (CA), increased agricultural production was also the main objective (CASPP and CAP I in Zambia), and increased food availability for the target group was likely.
In contrast to the country-level programmes, the regional programmes varied with regard to the likelihood of increased food availability. ICIMOD in Asia did not include food production; the two Agri-Vie companies assessed in the evaluation (Hygrotech and AfricaJUICE) were likely, respectively, to contribute to increased food availability through production of seeds, and inter-cropping of fruit trees and vegetables. MAP in Central America had a clear focus on sustainable land management and was expected to contribute to increased food availability. Some programmes were not likely to contribute to increased food availability within the project period, such as the GCDT research programme focusing on adaptation of crop wild relatives to climate change. The programme is, however, important as it is likely to contribute to enhanced food security in the long term.
The Mngeta rice farm in Tanzania (funded by Norfund) also had the potential to lead to increased availability of rice for the domestic market. The expected 50,000 tonnes could contribute a further 6%-7% to the availability of rice at national level. However, rice is a relatively high-priced commodity and mainly consumed by middle and upper income Tanzanians, and is thus not likely to lead directly to increased food availability for poor Tanzanians. However, the support to 5,000 farmers (SRI programme, under the Mngeta rice farm) was likely to lead to increased food accessibility for this group. Based on training in rice intensification, these farmers were likely to achieve 400%-600% increases in yield. The rice would presumably be marketed rather than kept for home consumption (except for special occasions) due to its high market value (thereby contributing to enhanced purchasing power). With regard to TAP, Tanzania, maize and rice value chains were supported, mainly for export (e.g. Kenya and Zambia).
Evaluation of Norwegian support to agriculture and food security 43
Summing up: Overall, the Norwegian-supported programme presented a strong focus on food production. All country-level programmes were likely to lead to increased food availability. Although this was not the case for all regional and global programmes (e.g. ICIMOD and TFESSD), the global programme GCDT, focusing on research on climate change adaptation of food crops, was found to be particularly important for future food production.
Likelihood of increased food accessibility (JC22)Most programmes dealing with food production were based on smallholder production, and thus increased food availability was likely to lead in most cases to increased food accessibility as the food, or a proportion of it, presumably would be kept for home consumption. The only exception was the commercial and 100% mechanised Mngeta rice farm in Tanzania.
However, when assessing the impact paths in relation to food accessibility, it is crucial to keep in mind that whereas staple food (e.g. maize) is likely to be kept for home consumption, this is not necessarily the case for high-value crops (e.g. rice), vegetables or livestock products if markets are available. Thus, increased production of milk, meat or vegetables might contribute to increased food accessibility and improved nutritional status, it is just as likely that the increased production is marketed to buy less expensive crops (e.g. maize) or to cover other pressing needs (such as school fees, tax, debt) or for asset creation. Food is not always the first priority of people, but rather one of many objectives in situations of food stress, weighing their short-term needs against the long-term sustainability of the households. Moreover, as mentioned earlier, the right of disposal of crops and livestock is an important issue. In some areas (e.g. East African countries), income from crops disposed of by men (e.g. most cash crops) might not be used for the overall benefit of the family.22
All the selected country-level programmes focused on production of staple crops − for example, large-scale agricultural intensification programmes such as conservation agriculture programmes (CASPP, CAP I) and the subsidy programme FISP (although other crops were also promoted). Most NGO projects had broader portfolios of livelihood activities, but did also include training in sustainable agriculture methods used for staple crop production (e.g. DF in Malawi, ASP in Zambia). In these cases, food availability was likely to lead to increased food accessibility. Other activities, such as irrigation and livestock production (e.g. UNCDD in Ethiopia and the Beef and Milk Project under EPINAV), were also likely to lead to increased food accessibility, but would need a more specific analysis that could not be done during this evaluation.
Summing up: Most large-scale country-level programmes focused mainly on staple food production (CASPP; CAP I and FISP), whereas many NGO programmes focused on broader portfolios of livelihood activities, as well as staple crop production. Both types of programmes were thus likely to lead to increased food accessibility. However, as increased food accessibility does not follow automatically from increased food availability, evidence is needed − for example, based on number of meals per day (as discussed under EQ3).
22 Generally, an analysis of the household economy, including gender relations (right of disposal, division of labour, and decision-making), is central to understanding how income affects food security.
Evaluation of Norwegian support to agriculture and food security44
Likelihood of increased food stability (JC23) The evaluation found that the main part of the Norwegian-supported programmes was likely to lead to increased food stability. Food stability is based on increased food availability and accessibility, and also, to a large extent, on resilient and sustainable livelihoods and the absence of sudden shocks in the form of food shortages caused by crises (financial or climate) or cyclical events (seasonal food insecurity). Internationally, the previous focus on, (and terminology of) preparedness for natural disasters (e.g. flooding, drought) has recently been replaced to some extent by a broader approach focusing on climate change adaptation. Adaptation to global warming and to climate change aim to reduce the vulnerability of biological systems to climate change effects. This change of approach was also observed with regard to the Norwegian-supported programmes. Examples of climate change adaptation programmes were: sustainable agricultural methods such as conservation agriculture (CA), found in both Southern and Eastern Africa (CAP I, CASPP; DF; ASP); research on climate change mitigation and adaptation strategies (CCIAM); research on climate change adaptation of food crops (GCDT); and, more generally, sustainable management of natural resources in Lake Basin areas (Malawi) and pastoral societies (Ethiopia). Overall, the evaluation team found a relatively strong focus on climate change adaptation methods among the selected programmes, even if not always labelled this way.
Table 5 highlights that more than one-third of the selected programmes focused on livelihood security or diversification for either farming or pastoral livelihoods. UNCCD in Ethiopia, for instance, emphasized livelihood diversification activities for pastoral livelihoods through irrigation and various types of small-scale income-generation, while the DF Rural Livelihood programme in Malawi included various income-generation activities, as well as training in sustainable agricultural methods. Several environmental programmes also included a livelihood component − for example, the Lake Chilwa Basin Climate Change programme in Malawi (introduction of conservation agriculture, fishing) and the REDD project in Tanzania.
In contrast to the above programmes, which aimed at long-term household sustainability, FISP in Malawi represented a short-term solution for the individual household. According to the Ministry of Agriculture, approximately 11% of people (1.8. million) are food insecure in Malawi, and generally more people qualify for subsidies than the subsidies available. FISP only had resources to target 1.4 million people, and their beneficiaries were selected for provision of agro-input on an annual basis (seeds and fertiliser). Thus, although many beneficiaries were re-selected and some re-distribution of the agro-inputs took place at village level (see Box 3), the benefits of FISP were relatively unpredictable and short-term for the individual households.
A number of programmes had a strong focus on enhanced purchasing power as the means to improve food security. For example, NASFAM in Malawi aimed at promoting farming as a business, with access to competitive input and output
Evaluation of Norwegian support to agriculture and food security 45
markets. Nevertheless, as mentioned above, monetary income at household level does not necessarily translate into enhanced food security.
Summing up: The assessed Norwegian-supported programmes showed a strong focus on livelihood diversification and livelihood security, climate change adaptation, or sustainable management of resources. These are important elements to achieve long-term food stability. The only exception was FISP in Malawi, which provided agro-inputs on an annual basis for selected beneficiaries, and thus represented a more short-term strategy for individual households. Prorural in Nicaragua also provided agro-inputs, but more long-term.
Likelihood of enhanced food utilisation (adequate diet) (JC24) Overall, analysis shows that, among the selected programmes, there has been only very limited focus on the nutritional aspects. Several programmes were likely to contribute to enhanced nutritional status, but this was more by coincidence than by design, and was based on increased food intake rather than on dietary diversity. None of the assessed programmes had nutrition security as an objective, and only few interventions included activities focusing on improved nutrition. NASFAM in Malawi had included some food utilisation activities, such as food processing and food safety, and generally promoted the use of vegetables and grains for nutritional purposes23.
Malnutrition is related to: 1) low food intake, leading to stunting (chronic malnutrition), wasting (current malnutrition) and underweight (chronic and current malnutrition); and 2) lack of dietary diversity, leading to various deficiencies – most commonly, vitamin A and iron deficiencies. Lack of dietary diversity is related to the mono-cropping culture − for example, maize production in Zambia and Malawi. The overemphasis on maize production in these countries was partially addressed through the promotion of conservation agriculture, which included crop diversification as one of the components. Dietary diversity can also be promoted through fruit and vegetables (for instance, through orchards and irrigation projects), and through livestock production, as for example in the UNCCD programme in Ethiopia or the EPINAV Beef and Milk project in Tanzania. However, unless these projects are accompanied by awareness-raising with regard to nutrition and an adequate diet, there is a risk that these high-value crops will be sold and will thus not improve nutrition.
Summing up: The Norwegian-supported programmes had limited focus on the nutritional aspects of food security and agriculture. Several programmes (e.g. CA programmes) were likely to contribute to enhanced nutrition through crop diversification, but nutritional activities were in most cases not included. Unless nutritional aspects are addressed in future interventions, nutritional security will be at risk.
23 In addition, the Integrated Rural Development Programme Messanu Areas in Ethiopia had a nutrition component where “model mothers” were trained in the promotion of nutrition for pregnant and lactating mothers. However, this is an activity that would normally not be classified under DAC sector 311 (agriculture); the activity is therefore less relevant for this evaluation.
Evaluation of Norwegian support to agriculture and food security46
4.1.3 Actual or expected contribution to food security (EQ3)
Despite the fact that the majority of the selected Norwegian programmes were likely to contribute to enhanced food security, evidence of such a contribution could not always be established. As discussed earlier, evidence is defined in the current evaluation as the availability of data in the form of baseline and end-of programme surveys, triangulated by other sources of information. This chapter mentions only the main trends. Monitoring and evaluation (M&E) practices are discussed under chapter 4.2. For several programmes, some evidence could be found related to increased food availability, but such evidence was available to a very limited extent for food accessibility and food stability, and hardly existed for food utilisation (adequate diet).
NGO projects varied between having relatively good documentation of outcomes and, in few cases, also impact (e.g. Malawi Lake Basin and COMACO in Zambia) to relatively poor documentation. For instance, some NGO projects mainly reported at output level and had no evidence of achieved outcomes/results (e.g. the Integrated Rural Development Programme in Ethiopia implemented by REST/NCA). The UNCCD programme in Ethiopia, co-ordinating 14 projects implemented by 14 different partners, conducted neither baseline nor end-of programme surveys. Moreover, the progress reports reported only on individual partner level and hardly at aggregated and outcome levels, thus rendering impossible the production of an overview of the achievements of this programme. Another example of incompleteness is NASFAM, where end-of programme data was in place (coping strategy and sources of income), but no baseline had been conducted, so it was therefore not possible to assess the impact.
Some programmes were likely to contribute to food security, but it was too early in the project cycle to see results. This was for example the case with the research programme EPINAV implemented during the period 2010-2014 and the REDD project implemented during the period 2010-2013, both in Tanzania.
In this context, it is important to emphasise again the concept of “contribution”, which implies that other factors are influencing the observed change. In the case of Malawi, for instance, many beneficiaries were both beneficiaries of the large-scale FISP programme (subsidising agro-input) and NGO projects promoting sustainable agriculture (e.g. DF Rural Livelihood Programme).
Contribution to increased (achieved or expected) availability of food (JC31) As mentioned above, food availability represented the food security aspect that was best documented. The trend of slightly more documentation for food availability (with the proxy indicator “increased food production, locally or nationally”) can also be seen from Table 5 (above). Below, cases of increased food production of the selected programmes are presented and discussed.
Conservation agriculture (CA) has been a central pillar in the Norwegian agricultural support since the end of the 1990s (cf. chapter 3.1), and was
Evaluation of Norwegian support to agriculture and food security 47
implemented in both Southern and Eastern Africa. In Zambia and Malawi, the approach also constituted an important part of the national agricultural strategy. The CASPP in Zambia showed an increased production of maize by beneficiaries − in particular, for lead farmers. Production data for follow farmers was, however, either lacking or was collected at farm level but not compiled at national level. The baseline and follow-up study of the CASPP showed an increase from 1.3 tonnes/ha to 2.5 tonnes/ha (using planning basins) and to 2.4 tonnes/ha (ripping).
With regard to CAP I in Zambia, there was evidence of increased food production for maize and other crops. Survey results of the external monitoring agency, Independent Management Consulting Services (IMCS) and Noragric, Norwegian University of Life Sciences − commissioned by the Conservation Farming Unit (CFU) and the Norwegian Embassy to undertake monitoring and evaluation − showed the same overall trend of increased production. The figures were, however, difficult to compare as different samples, research methods and reporting were used (the different results are elaborated in the CAP I case study, Annex 5). Here, we shall mention only the Noragric results (based on a sample of 440 farmers). According to the Noragric report 2012, the average production of the major crops increased from 6,557 kg in the 2006/2007 season to 7,631 kg in the 2009/2010 season. Maize yields increased for CA, but since the area under CA was still small, it did not translate into higher total maize production at the farm level. However, there was a clear increase in production for sweet potato (+191%), cassava (+1100%), cowpeas (+102%), groundnuts (+68%) and soybeans (+73%). The actual production increase was highest for groundnut, which increased from 330 kg to 557 kg during the four-year period. The increase of legume production was also shown in the IMCS study of 2010. Thus, overall, there was sign of increased and diversified crop production.
Several NGO projects (e.g. the Lake Chilwa Basin Climate Change Programme) also applied the CA methodology. This programme supported 950 households with farm inputs (seed, fertiliser, herbicides) and technical support, and an increase from 200 kg to a minimum 750 kg per annum was reported (Lake Chilwa Basin Climate Change Adaptation Programme: A Summary of Achievements on Food Security, November 2011).
Box 3 (next page) elaborates the case of FISP in Malawi, and shows that the results were well documented (cf. chapter 4.2.2).
The Agricultural Support Programme (ASP) in Zambia was one of the few programmes with well-documented contribution to several aspects of food security. ASP was a five-year programme under the auspices of the Ministry of Agriculture and Co-operatives (MACO), funded by the Swedish International Development Co-operation Agency (SIDA), and implemented by a consortium of consulting companies. ASP was managed by the Swedish Embassy, while the Norwegian Embassy remained a “silent partner”, contributing approximately 50 million NOK out of a budget of 346 million NOK. ASP targeted 44,000 household and, of these, 10% (4,440) were closely monitored. A substantial

Evaluation of Norwegian support to agriculture and food security48
Box 3 Example of FISP, Malawi FISP was embarked on in 2005/2006 after a severe food shortage in 2004/2005 left five million people in dire need of food aid. The programmes aimed at increasing smallholder agricultural productivity through provision of fertiliser, maize and legume seeds. Since the introduction of FISP, there has been a two-fold increase of productivity and a maize surplus every year, leading to maize export. The Norwegian Embassy contributed 67 million NOK during the studied period (2011) out of a total budget of 174 million NOK. Critics of FISP perceived the programme to be a short-term solution for two reasons: 1) The main part of the national agricultural budget was spent on this programme (the percentage spent in 2011 was estimated to be over 85%, although no official information exists), leaving limited scope for long-term investment in such things as infrastructure; 2) The use of fertiliser was considered a “quick fix”, as compared to the introduction of sustainable agricultural methods. The beneficiaries received subsidies in the form of seeds to cultivate ½ ha of land, and one bag of fertiliser. As not all farmers in need were targeted, some villages were sharing the subsidised inputs among all villagers, which led to even further dilution of the resources and outputs. This was, for example, observed in Rumphi District. This had the effect that the villagers had to combine agriculture based on the subsidised inputs with more sustainable agricultural methods. However, this will be beneficial in the case of the discontinuation of FISP.
increase in food production was witnessed: maize production doubled, and the production of other crops (e.g. cassava, ground nuts, beans, and millet) increased between fivefold and tenfold. Although other factors might have been involved, ASP (focusing on crop diversification and improved land husbandry) was likely to have contributed to the increased production.
The final evaluation review of the NASFAM project in Malawi highlighted a fourfold increase in agricultural production from 218 million Malawian Kwacha to 876 million Malawian Kwacha in the value of non-tobacco crops. There was, however, no disaggregation of food and cash crop and the source was not indicated, as highlighted in the Final Evaluation Review. NASFAM was 100% financed by the Norwegian Embassy. The case of NASFAM is further discussed in Cluster 4.
The two country-level research programmes, CCIAM and EPINAV, carried out by the Sokoine Agricultural University (SUA) in Tanzania, implemented projects on a pilot basis, and planned these projects to be scaled up to neighbouring villages or to be adopted by neighbouring farmers. The CCIAM project “Small-holder Production Systems in Tanzania − Striking a balance between intensification, sustainability, food security and climate” had the aim of increasing yields of maize and rice on given farm land through better use of fertiliser and herbicides and improved seeds, in a public-private partnership. The project included seven demonstration farms in Kilombero District and Dakawa, and six maize crop demonstration farms in Njombe district and on SUA campus. After only one year, the maize and rice yield had increased − rice from 1,438 kg/ha to 5,400 kg/ha, and maize from 2,625 kg/ha to 4,375 kg/ha. These results have already encouraged neighbouring farmers to adopt the new technique, but no
Evaluation of Norwegian support to agriculture and food security 49
data on the adoption rate was available. Overall, the two country research programmes were found to be highly innovative, with a participatory approach. The projects aimed at food production were likely to lead to increased food availability, as in the case of the demonstration farms mentioned above. This is, however, on a small-scale, and the evidence for scaling up is yet to be seen.
The impact of a large part of the Norwegian-funded programmes was based on an expected multiplication effect of the programme activities (e.g. conservation agriculture and various pilot projects). The adoption rate (in relation to new methods/technologies) of both the primary beneficiaries and also follow farmers/villagers is here an important indicator. Four general trends were identified with regard to adoption and multiplication effects, as shown below:
1. Adoption based on a participatory approach was most successful. There is sufficient evidence to conclude that the use of participatory methods and the effective (or potential) scaling-up of successful activities are positively correlated. Approaches such as “lead farmer/follow farmer” approach, contact farmer, “farming as a business” approach, CA, sustainable environment/land management extensively relied on decision-making by the beneficiaries. In these cases, the farmers effectively participated in the activity, including the planning, in order to maximise benefits (e.g. DF Malawi, CAP I and ASP, Zambia).
2. The multiplication effect based on hand-outs or supporting subsidies was limited. For programmes providing hand-outs or supporting subsidies, the adoption rate was usually very high during programme implementation, but multiplication effects were generally very low (e.g. FISP, Malawi, Delegated Agriculture Support in Zambia for LDT & Zambian Training Trust within Agricultural Support Intervention (NZTT), and NASFAM, Malawi). In the case of FISP, Malawi, output subsidies and associated improved farming systems resulted in wide-scale adoption among beneficiaries, but no multiplication effect was found among non-beneficiaries (in some cases, the agro-inputs were shared at village level, as noted earlier). For CCIAM, Tanzania, demonstration plots and divulgation activities were successfully established, as the inputs were provided free of charge to contact farmers. There was, however, no scaling-up of the intervention as the effective adoption of the new agricultural practices required supplementary funds from the farmers (fertilisers and herbicides), demonstrating the gap between applied research and large-scale implementation. For TAP in Tanzania, inputs for micro demonstration plots were funded by the private sector, while overall management was provided by sub-contracted NGOs. Although no free inputs were given to farmers, the project substantially increased the number of beneficiaries who integrated the input value chain. This enabled local input retailers/outlets to increase their sales volumes.
3. Strategies for adoption and multiplication of effects were not always well-elaborated. A lack of strategy for scaling-up (multiplication of effects) was noted for programmes promoting CA or other types of sustainable
Evaluation of Norwegian support to agriculture and food security50
agriculture methods through the lead farmer/follow farmer approach, and for various types of pilot projects and demonstration plots (for example, in the EPINAV and CCIAM programmes). In most cases, there were over-optimistic assumptions related to adoption rates of the new methods by neighbouring farmers, pastoralists, or villages. In the cases mentioned, lead farmers and pilot projects were well trained and the adoption rate was generally high, but it was seldom clear exactly how the multiplication effect was going to be achieved. A clear definition of a follow farmer was lacking in many cases, the only exception being DF in Malawi, which had developed a definition (adopting three out of seven sustainable agriculture methods).
4. Lack of proper definition and reporting on the adoption rate and multiplication effect prevailed. Generally, the lead farmers were relatively well monitored, and the expected multiplication effect was based on the assumption that the lead farmers would train a certain number of follow farmers. In the case of CASPP, for instance, the lead farmers were expected to train 15 follow farmers. The actual figure, however, was only 5-7 follow farmers, according to the Terminal Review. The actual number of follow farmers trained, and the extent to which the follow farmers adopted the new technology, was not monitored and documented. The evaluation found hardly any confirmed information on the adoption rate of new technologies or on scaling-up or multiplication effects (e.g. UNCCD, Ethiopia, TFESSD, global, NASFAM, Malawi, Agri-Vie, CCIAM, Tanzania).
Summing up: As shown in the above-mentioned cases of increased production, Norwegian-supported programmes contributed to increased (achieved and expected) availability of food. The extent to which new agricultural methods were adopted depended on a number of factors: the implementation strategy (participatory/non-participatory); whether the achieved results would be easily replicated by non-beneficiaries (low-cost input); and the existence of an appropriate scaling-up strategy. Lack of proper reporting of the multiplication effect was a general problem.
Contribution to increased (achieved or expected) accessibility of food (JC 32) Increased accessibility of food can be measured by the increased number of meals per day (same size), or by proxy indicators such as enhanced purchasing power based on high value crop production (e.g. rice), livestock production, cash crop production, commercial production, and stable food production (costs and prices). Overall, and as indicated in Table 5, relatively few programmes had M&E evidence of increased food accessibility. Conservation agriculture interventions, for instance, were likely to have led to increased accessibility of food; in the case of CASPP, food accessibility was not measured, which is particularly noteworthy as the interventions had food security listed as a programme objective. In the case of CAP I, the number of meals per day was not measured, but there was evidence of enhanced purchasing power. According to the 2012 Noragric report, income from crops increased from 1.6 million ZMK in 2006/2007 to 2.47 million ZMK in 2009/2010, representing a 54% increase in income from crops.
Evaluation of Norwegian support to agriculture and food security 51
Despite the impressive results of FISP in Malawi with regard to increased production, the evaluation found only limited evidence of increased food accessibility (also in this case, the programme objective was food security) as no quantitative data were available. In an anecdotal way, the 2011 Impact Study referred to data such as “(…) households pointed out that the subsidy has enabled them to produce a ‘bit more’ food, particularly among poor and vulnerable households”24. The same study showed that households that have had access to subsidies, particularly those with access in five-six seasons, tend to consume more maize, vegetables and meat products compared to non-recipients of subsidies.
With regard to COMACO in Zambia, the 2011 Annual Report notes that a yield comparison survey was conducted in 2011 in both West and East areas to ascertain farmers’ yields. The survey indicated that 74% of households in the region were food secure (9,870 farmers sampled), compared to only 34% of households being food secure in 2001 (baseline study with 1,059 households). However, it is not clear how food security was measured.
Summing up: Despite the fact that Norwegian-supported programmes to a large extent were likely to lead to increased food accessibility, this could not be supported by evidence in most cases. The lack of documentation was particularly noteworthy for programmes with food security objectives (Rural Development in Ethiopia, and CASPP in Zambia).
Contribution to enhanced food stability (JC33)The main indicators of enhanced food stability are reduced periods of food shortage at household or individual level (annually), decreasing use of coping strategies, and more resilient and sustainable livelihood systems. As seen in Table 5, there is slightly more evidence of this aspect of food security than of food accessibility.
With regard to FISP Malawi, there was evidence of more resilient livelihoods of beneficiaries. The coping strategy index25, number of shocks experienced by households, and incidence of severe agriculture-related shocks was statistically significant in relation to FISP; households were less prone to shocks when they were FISP beneficiaries. According to the FISP Impact Study of 2011, the annual food secure period of very poor farmers improved by one month, from 7.5 to 8.5 months. In the case of NASFAM, Malawi, the 2011 Impact Assessment (based on a sample of 2580 members) showed that 80% of members indicated that they had food lasting to the next harvest, as compared to the 67% at the time of the baseline.
With regard to CASPP in Zambia, there was no evidence of enhanced food stability using the above mentioned indicators. For CAP I, according to the Noragric survey 2012, the number of months with food shortage was reduced
24 Ephraim W.Chirwa, et.al (2011). Impacts of the Farm input Subsidy Programme, Malawi. Working Draft. 25 A series of questions about how households manage to cope with a shortfall in food for consumption,
resulting in a simple numeric score.
Evaluation of Norwegian support to agriculture and food security52
from 4.4 months in the baseline year (2007) to 3.2 months in 2010 in the sampled households benefiting from the programme.
In ASP in Zambia, income from crops, livestock and non-traditional farm enterprises (NTFE) more than doubled (targeting 44,000 households) during the period 2005-2007 leading to diversified livelihood systems (M&E results of 4,400 households).
As seen in Table 5, few other programmes also presented evidence on increased food availability. For example, in the case of UNCCD Ethiopia, 10 partners presented data that indicated more resilient and diversified livelihoods. However, there was no aggregated data at programme level.
Summing up: Overall, as discussed in relation to food stability under EQ1, the Norwegian-supported programmes generally scored quite high when it came to food stability, due to the strong focus on livelihood and climate change adaptation. However, as in the case of food accessibility, lack of documentation is a problem, with only 10 out of the 25 programmes able to verify increased food stability.
Contribution to improved food utilisation (adequate diet) (JC34)As mentioned earlier, the current evaluation focuses only on one aspect of food utilisation − adequate diet − that is likely to lead to improved nutritional status. The main food security impact indicators here are a reduced level of stunting, wasting, and underweight. A proxy indicator is access to diverse and nutritious food. As mentioned in relation to EQ2, the Norwegian programmes supported under agriculture and environment have limited focus on nutrition. As shown in Table 5, a number of projects were likely to contribute to enhanced diet, but this aspect was not part of their programme theory, nor was it measured.
The problem of the mono-cropping maize culture in, for example, Malawi and Zambia was partially addressed through the promotion of conservation agriculture, which included crop diversification as one of the components. An exemplary case was CASPP in Zambia, which, in principle, promoted crop diversification (including legumes). However, the actual production focused mainly on maize and tobacco. This was in contrast to CAP I, where crop diversification was achieved (increased production of, for example, cassava, sweet potato, beans), as mentioned earlier. This also led to dietary diversity. According to a 24-hour recall study, the number of meals including a pulse, per day, increased from 0.6 in 2007 to 1 in 2010. The percentage of households having a diet with pulses increased from 46% to 62% during the same period (Noragric 2012).
The DF-supported and EC-funded Rumphi Food Security Programme (RFSP) project in Malawi26 used the proxy indicator, “access to diverse and nutritious food”, and 65.5% of the sampled households in the baseline, compared to 95.5% in the evaluation survey, had increased access to vegetables. Moreover,
26 DF contributed 10% of the total budget of the Rumphi Food Security Programme, as well as providing additional granting. DF funded all field staff and provided grants for pass-on of livestock.
Evaluation of Norwegian support to agriculture and food security 53
access to legumes increased from 28% to 39.7%, whereas access to animal protein decreased from 59.9% to 53.8%.
Finally, the research programme EPINAV in Tanzania was measuring nutrition for all 17 research programmes (nutrition indicators were included in the baseline surveys for all research projects). Unfortunately, it was too early in the project cycle to see results, for example with regard to nutrition.
Summing up: The lack of focus on nutrition as part of agriculture, food security and livelihood was a general problem, which was observed across all types of programmes. A limited number of NGOs, however, included a few nutrition-related activities. Two programmes (DF Malawi and CAP I Zambia presented evidence of increased dietary diversity. The research programme EPINAV showed a good understanding of the importance of this aspect, although it was too early to see results.
4.2 Cluster 2: Monitoring & evaluation (M&E) and documentation
This cluster focuses on monitoring & evaluation (M&E) and documentation, based on two evaluation questions (EQs):
EQ4: To what extent have programmes been designed to allow monitoring and evaluation, including breakdown on gender in order to know the inclusion of female farmers, and to what extent have ongoing programmes been revised according to evidence emerging from within or outside the programmes during their execution?
EQ5: To what extent have programme results been documented? EQ4 focuses on the following aspects in relation to M&E: the appropriateness of the design; the presence and appropriateness of an M&E strategy and its implementation; whether adjustments have been made in programmes as a result of the M&E. As part of the response to the EQ, an online survey on extending agencies’ requirements to include M&E was conducted (see Annex 7).
EQ5 analyses the availability of documentation of results, and the extent to which intervention results have been disseminated.
4.2.1 M&E (EQ4)
M&E design, strategy and implementation, including gender disaggregation (JC41 and JC42)The analysis of the online survey responses, with regard to the programmes’ formulation stage, showed that templates proposed by the extending agencies and manuals for proposals existed for less than half of the programmes. According to the survey results, all agencies required a logical framework. This contradicts what the evaluation team found in some of the programmes it reviewed; as seen below, logframes were not in place for several programmes. This might be due to the fact that practices are improving over time and survey
Evaluation of Norwegian support to agriculture and food security54
results refer mainly to recent practices, whereas the evaluation focused on the period 2005-2011.
The lack of templates had repercussions on M&E systems. A substantial number of programmes lacked a logframe or result framework, resulting in rather sketchy M&E systems and the inability to adjust the programmes as appropriate. Evidence gathered revealed that programme proposals came in a wide variety of formats, and that contents varied considerably in terms of quantity and quality. The reviewed interventions showed a wide variety of M&E designs and systems in place: these ranged from none (no M&E foreseen, but checks being made during implementation − i.e. measuring the degree of completion of activities) to elaborated inter-sectoral, regional/nationwide M&E systems.
Overall, the effective operationalisation of M&E systems was conditioned by the existence of: 1) a logical framework or results framework; 2) baseline and end-of programme surveys; and 3) adequate human/ financial resources. The selected programmes are assessed in relation to these three factors below.
Logical framework or results framework: Where a logframe or results framework was absent, no reasonable implementation strategy was in place to achieve the programme goals. This resulted in yearly variations of implemented activities and, in consequence, of achieved results, and a loss of programme focus (e.g. activities overlapping in Messanu in Ethiopia, and no clear strategy for calls for proposals within TFESSD). While a logframe existed for Prorural, in Nicaragua, impact indicators and a baseline study were absent, and the M&E was unable to assess the effectiveness of the carried out activities. In the case of the Lake Managua project, Nicaragua, monitoring results proved to be difficult due to the absence of a logframe, and expensive, as no baseline prior to programme implementation had been established. To remedy the problem, an ad-hoc M&E system was set up, but faced difficulties in assessing any impact and comparing data prior and after the intervention.
However, in the programme sample analysed, a number of success stories exist in terms of M&E. In Zambia, ASP and COMACO designed a clear logframe at the start of implementation, and baseline studies were carried out. Also, monitoring was based on results and extensive resources made available (including database production). This finally resulted in detailed monitoring of the programme results and relevant programme adjustments. On the other hand, in cases such as TAP in Tanzania, the combination of M&E staff rotation and a late baseline study (made available after nearly two years of implementation) led directly to a defective M&E system.
As for regional programmes, the M&E system at ICIMOD, in Asia, relied on a strategic framework, but lacked a proper results framework. As a consequence, unclear objectives, weak indicators and missing baseline data did not enable M&E staff to establish a cause-effect relationship between the sub-components’ achievements, or to further assess the degree of achievement of the overall goals and objectives of the programme. The findings also revealed the absence

Evaluation of Norwegian support to agriculture and food security 55
of results frameworks for other multi-country programmes, such as TFESSD and CATIE, in Central America, for which specific objectives and indicators were missing, although both managed to prepare a performance matrix (based on completion of activities) during implementation.
Baseline and end-of-programme surveys: Despite the knowledge of logframe or result-based frameworks concepts, M&E remained deficient with regard to impact analysis in a vast majority of interventions. The M&E function was limited to comparing the planned and carried-out activities, and the expenditures. Overall, impact indicators were missing and it was impossible to analyse whether the intervention changed the situation of the beneficiaries (cf. the discussion in Cluster 1).
In the reviewed interventions, at design stage, the logframe formulation process appeared to have taken two very divergent routes:
1. The logframe was “overlooked”, resulting in poorly defined objectives and results, combined with non-SMART27 indicators, or
2. The logframe was very detailed, with precise results and outcomes, but also with numerous indicators.
In both cases, outcome monitoring was impossible as indicators did not provide relevant information or the monitoring of many indicators was too resource-consuming. The UNCDD project (Ethiopia) and the Lake Chilwa project (Malawi), with respectively over 100 and 50 indicators, can be seen as prominent examples of the latter. In the case of CCIAM, in Tanzania, the myriad indicators could not be measured at activity level, or aggregated from activity to programme outcome level. Instead, a reporting of selected programme achievements was carried out in an anecdotal way. Among the rare exceptions is, again, the ASP, Zambia, with an M&E system that was considered as central to the intervention and which managed effectively to monitor in detail food security changes, including at impact level. However, this system was very expensive − possibly the major reason why it was never adopted or replicated by the government.
Adequate human/financial resources: Analysis across the selected programmes and results of the survey reveal that M&E requirements were largely overlooked at design stage, and programmes therefore lacked adequate budget. This, in turn, resulted in limited human resources and inadequate means of ensuring a proper monitoring function. While, for several interventions analysed, M&E was mentioned at design stage (in the project proposal), neither human nor budgetary resources were foreseen for carrying out this function. Cases in point are Messanu, in Ethiopia, where 0.04% of the budget was allocated to monitoring, or TFESSD, where no specific budget was allocated at all. There are, however, also more reasonable examples with a very moderate 2% to 5% of resources devoted to M&E. In COMACO, Zambia, a system was put
27 Specific, Measurable, Accessible, Relevant, Time bound

Evaluation of Norwegian support to agriculture and food security56
in place with appropriate feedback mechanisms, and this enabled the programme to be adjusted on the basis of observed and analysed data and trends. However, allocated resources for M&E remained altogether low, and this area might have been overlooked by the funding agency when approving the programmes.
Local M&E systems (using local human resources and existing structures) proved to be a more efficient way of enabling results ownership and empowerment than external M&E. There were several cases of ineffective programme monitoring as a result of simply extracting data using the existing M&E procedures of the implementing institution. On the other hand, positive examples could be noted for the Norway-Netherlands Delegated Support programme in Zambia. Their own M&E system relied on the expertise of each participating institution − for example, Zambia National Farmers Union (ZNFU) and Golden Valley Agricultural Research Trust, Zambia (GART) − and was strengthened as part of the programme. Reliable data on results and impact could be obtained in that case. In the case of those participating institutions − for example, the Livestock Development Trust (LDT), Zambia, and the NRDC28-ZEGA29 Training Trust (NZTT), Zambia − for which M&E reinforcement was not an objective per se, monitoring remained basic (activity completion) and provided little information on any benefit of the support.
External monitoring through sub-contracting of M&E proved mostly ineffective (e.g. TAP in Tanzania) because interventions underestimated the required level of financial resources for this, as data had to be obtained under market conditions. It was also more challenging for external consultants to gather data from intervention stakeholders. An exception in this regard is FISP, in Malawi. The M&E of operations was carried out by a semi-autonomous logistics unit; the M&E of impact (on poverty and food security) was carried out by a range of donors and NGOs (with no relation to Norwegian aid); and the overall monitoring of agricultural production (increased global tonnage production from subsidies support) was carried out by the Ministry of Agriculture. The logistics unit was almost entirely funded by donors (although under the supervision of the Ministry of Agriculture), and was the sole source of information for assessing the degree of implementation of the programme. External studies funded by donors and NGOs focused on impact and Government on global results, as mentioned above. For other programmes (e.g. MLBP II in Malawi), an internal M&E system was designed, but already deemed insufficient by the time the programme started. Hence, it had to be improved during implementation with the inclusion of better (SMART) indicators. The global programmes, GCDT and TFESSD, relied on annual work plans for monitoring results and activities and had no overall (multi-annual) M&E plan.
Gender disaggregated data was collected in about only one-third of the reviewed interventions (e.g. REDD, EPINAV in Tanzania, ASP, COMACO and CAP I in Zambia, and NASFAM in Malawi). However, even in these cases, only a few
28 Natural Resources Development College29 Zambia Export Growers Association

Evaluation of Norwegian support to agriculture and food security 57
indicators were gender specific. Further analysis of the programmes by the evaluation team also revealed a tendency not to consider gender-specific data collection at the start of programme implementation. However, for these cases, it became clear for the programme management teams that gender data was necessary, and therefore it was collected during implementation (but with no reference to the initial situation, making impossible any before/after comparison for the programme). This was, for example, the case for MLBP II in Malawi (planned to be done in future surveys), CASPP in Zambia (surveys carried out by the end of the programme implementation were gender disaggregated), and for TAP in Tanzania (sub-contracted institutions reported data per gender during the programme cycle). The lack of gender-specific data is to be viewed in relation to the logframe approach, and in particular to the tendency of multiplying indicators to be collected. Adding gender specific-information might have been seen as an additional burden at a high cost.
The analysis of the selected programmes showed two main systems of data collection in use: 1) a system of periodic data collection to feed in reports; 2) data collection based on the use of specific surveys. In the first approach, used in nearly all the programmes, data was collected as part of the regular M&E system, focusing on activities and outputs through simple indicators. The second approach was adopted in some interventions to assess impact and long-term effects. In this case, data collection was based on surveys initiated by management staff, focusing on impact indicators and done at mid-term and final stages, independently of external evaluations. This was the case for TAP and EPINAV in Tanzania, DF in Malawi, and CASPP in Zambia.
Wherever different organisations were working together under a single programme or sub-components were managed independently in a programme, the M&E system required harmonisation. Examples where this had not happened were found in the MAP programme (Central America) and the Norway-Netherlands Delegated Support (Zambia):
� The MAP programme in Central America combined a series of existing interventions, each with its own M&E system. Eight regional units were set up to co-ordinate each project M&E system, so as to feed relevant data into MAP. However, soon after implementation started it became obvious that the sub-projects were not monitoring MAP results, but their own results.
� The Norway-Netherlands Delegated Support in Zambia used the existing M&E systems of five participating institutions. This resulted in very different M&E modalities of data collection: field visits by staff (travel reports), periodic feedback by sub-contractors or beneficiaries; and dedicated human resources specifically contracted for monitoring the results.
For some large-scale programmes containing different sub-projects, the use of the implementing institution’s M&E system proved to be efficient. An example

Evaluation of Norwegian support to agriculture and food security58
was ICIMOD, which successfully devised a specific strategic planning and monitoring system and unit.
Monitoring systems of smaller institutions varied from ad-hoc systems to full departments dedicated to M&E. The implementation of the Lake Chilwa project, Malawi, was successfully monitored by the project stakeholders (local government officers) and beneficiaries (lead farmers) under the supervision of an M&E specialist in the project management team. However, for Messanu, Ethiopia, participatory monitoring by the beneficiaries, as proposed initially in the project document, was later deemed too complex to implement due to the knowledge gap of beneficiaries. To resolve the issue, the M&E function was finally handed over to Government (the local administration).
In general, impact monitoring was challenging for short-duration programmes (e.g. three years) due to the lack of already visible effects. Even for longer-term interventions, impact monitoring was mostly skipped during implementation, as no impact indicators had been included in the logframe (e.g. Prorural, Nicaragua), or the indicators were not measurable or too expensive to measure − for example, requiring full-scale surveys. Surprisingly, the lack of information on impact data was not questioned by the extending agencies, although it was systematically noted by mid-term and final evaluations. Many programmes lacked programme baselines. Over half of the extending agency respondents to the online survey indicated that no baseline was required, and nearly half said that there were no M&E guidelines.
M&E strategies were implemented most effectively when a specific and reasonable budget and staffing level had been allocated for M&E. Several set-ups were observed:
1. No specific expertise was allocated for M&E and the function was covered by the regular management team (e.g. NZTT30 within the Norway-Netherlands Delegated Support programme, Zambia).
2. M&E was outsourced with a specific budget (e.g. UNCCD, Ethiopia; DF, Malawi; CAP I, Zambia).
3. M&E was carried out independently without Norwegian funds (e.g. the multi-programme FISP, Malawi). The monitoring system was efficient possibly because it was independent from the institutions implementing the programme. It was, however, expensive and did not allow ownership and empowerment of the specific M&E function by the institutional beneficiaries (Government).
4. The implementing organisation had specific expertise, but no or insufficient budget had been allocated for monitoring (e.g. TFESSD; CASPP, Zambia).
30 NRDC (Natural Resources Development College) ZEGA (Zambia Export Growers Association) Training Trust
Evaluation of Norwegian support to agriculture and food security 59
5. The implementing organisation had expertise and a budget was allocated for M&E (e.g. NASFAM, Malawi; ASP, Zambia; EPINAV and REDD, Tanzania). This set-up seems to be the most efficient and effective. The M&E function was well staffed, operational and provided information to decision takers in a timely fashion − provided that there were not too many indicators to monitor. For ICIMOD, the attempt to monitor too many indicators made it difficult for decision makers to get an overview of progress and impact.
Summing up: Most of the reviewed interventions were poorly designed. This directly impacted on the quality of the M&E system. A basic logframe design (including SMART indicators), combined with an adequate budget for M&E at the formulation stage, could make the M&E system a powerful tool to assess results and impact. However, gender disaggregation turned out to be, at best, only of secondary priority for most interventions. The M&E system was in most cases limited to collecting activity and output data. A few interventions also collected data related to impact, but only through surveys. However, indicators were usually not suited to impact analysis. Large organisations’ M&E systems seemed more efficient, provided that they took sufficient account of the programme requirements. However, their monitoring of sub-components of the interventions were often inefficient. In general, and across all types of support, successful M&E depended on sufficient staffing and money.
Amendment of programmes (JC43)When an intervention was carried out on a long-term basis (over five years, or with multiple phases), there was time to provide information for successive adjustments and overall improvement of the implementation process. For FISP (Malawi), the Ministry of Agriculture took into consideration many recommendations from the semi-autonomous logistics unit over the years and issues were progressively being solved (beneficiaries’ selection process, implementation strategies).
Overall, the lack of adjustments in several interventions reflected the inadequacy of the M&E systems in flagging up problematic implementation issues. Suggestions for programme adjustments or the design of new phases were often made by external stakeholders, such as donors, independent reviews, or final evaluations. For Messanu, Ethiopia, the appropriation of the final evaluation recommendations resulted in designing new phases. Mid-term evaluations often yielded adjustments of logframes − such as for UNCCD, in Ethiopia, or for Prorural, in Nicaragua.
In some cases, despite the fact that mid-term and final reviews highlighted major implementation weaknesses, the interventions were not adjusted by programme management staff (e.g. Lake Managua, Nicaragua; ICIMOD, Asia Regional; TAP, Tanzania). In contrast, weaknesses were noted for the first phase of the CAP I programme (Zambia), and the subsequent phase (CAP II) took these into consideration in order to improve the implementation of the programme. In some cases, mid-term reviews identified pathways for improvements (often logframes and reviews of indicators), but action by programme staff was not ensured (e.g. UNCCD, Ethiopia).
Evaluation of Norwegian support to agriculture and food security60
An operational M&E system could result in programme adjustments. For ASP, Zambia, the M&E system that gathered data from beneficiaries enabled the programme to switch activities from crop intensification to crop and livestock diversification. COMACO’s achievements were found to be higher than anticipated, resulting in the formulation of new priorities, reflected in budget allocation. In the case of MLBP II, Malawi, the establishment of a functional M&E system during programme implementation identified potential implementation improvements that were subsequently adopted.
Summing up: Adjustments of programmes were mostly effective for longer-term programmes, resulting in smoother implementation with more operational M&E systems in place. For long-term programmes lacking adjustments, the M&E system was systematically defective. In some cases, non-existent or inoperative M&E systems actually impaired the overall implementation of the programmes, resulting in external stakeholders (including the donor) requesting major adjustments.
4.2.2 Documentation (EQ5)
Availability of documentation of results (JC51)In line with the requirements of the extending agencies, all scrutinised programmes produced periodic (progress and annual) reports. Annual plans were not systematically formulated and disseminated, but were sometimes part of the previous narrative annual report, often in the form of an attachment. Moreover, annual reports often revealed a gap in or lack of relationship between the activities effectively carried out and the objectives of the intervention. For example, the collected data did not correspond to the programme objectives (e.g. CASPP, Zambia) or the logframe indicators.
With regard to mid-term and final evaluations, the evaluation identified only a limited amount of information on impact. Evaluations of, for example, REDD and CCIAM in Tanzania, and Prorural in Nicaragua, had difficulties in assessing the impact of the programmes, as indicators were absent or not measurable. Even when impact assessments were carried out through data collection (e.g. UNCCD and Messanu, Ethiopia, and CAP I, Zambia) or comprehensive evaluations, the link between the findings and the programme activities was not clear (e.g. Messanu, Ethiopia).
In addition to the above, desk and field research revealed two (complementary) types of technical documents, produced by the programme management teams:
� Internal documents with the aim of improving the implementation of the programme or helping it to achieve its objectives, such as training manuals, handbooks for facilitators, manuals for impact assessments, technical manuals for beneficiaries introducing new techniques.
� Technical documents or reports dedicated to transmitting some form of knowledge to external stakeholders not necessarily directly associated with the programme (lessons learned, success stories) to create awareness or ownership among relevant stakeholders.
Evaluation of Norwegian support to agriculture and food security 61
Summing up: Periodic reports were produced for all programmes, but only a small fraction contained subsequent annual plans. Several cases showed a knowledge gap between collected data and programme objectives − a sign of deficient M&E systems. Assessing impact through evaluations was also difficult due to a lack of relevant data. Programme management teams produced internal documents as a tool to improve implementation, and technical documents for dissemination.
Dissemination of programme results (JC52)Although, for several programmes, the evaluation could not identify any information on how results have been disseminated or divulged, communication strategies were usually set up using various means, including exposure visits, study circles (e.g. ASP, Zambia), magazines and policy papers for (non-) members (e.g. ZNFU, ACF, GART within Norway-Netherlands Delegated Support Programme in Zambia), videos (e.g. CAP I, Zambia). For all these activities, comprehensive budgets had been allocated either at formulation stage or at the start of the implementation.
Devising a communication strategy through the mass media to increase outreach and awareness was relevant for many interventions, but its effectiveness remained unknown for most cases. Several programmes had plans to create awareness of external stakeholders through media channels (TV, radio, websites − e.g. CASPP in Zambia). However, periodic reports and evaluation reports never assessed the impact of these activities (e.g. through surveys). The usefulness of these strategies was always assumed as positive, but no comprehensive assessment was ever made to analyse whether the activities were cost-effective in reaching the supposed target groups.
Whenever programme funds had to be reduced during implementation, communication activities were the first to be terminated and staff were discharged (e.g. ACF within Norway-Netherlands Delegated Support, and TAP in Tanzania). The situation was similar for institutions focusing on research and producing scientific papers (GART, within the Norway-Netherlands Delegated Support programme, in Zambia, and ICIMOD, regional Asia). Cutting communication budgets resulted in reducing the divulgation efforts of their primary products. To bypass this issue of trying to maintain impact as financial resources for communication were systematically being cut back in most programmes, some organisations (e.g. GART) concentrated their efforts on applied research, creating a close relationship between the researcher and the farmer as a strategy to get better value for money in dissemination efforts.
Programmes were more efficient in disseminating results to institutions at local level than to institutions at national level. Ownership of results was stronger at local level. Governments at national level often appeared either not interested (e.g. ASP, Zambia) or unaware (COMACO, Zambia) of programme results that directly benefited local institutions. Moreover, district and local government officials appeared to have systematically more knowledge of the programme status than their central counterparts (e.g. EPINAV in Tanzania, Lake Managua in Nicaragua, and Lake Chilwa in Malawi), most likely due to their proximity to
Evaluation of Norwegian support to agriculture and food security62
field activities − even though counterparts at central level were often represented within steering and management committees.
Finally, institutions that promoted new concepts or approaches were found to be very efficient in disseminating them to central governments, through lobbying and support in the drafting of policies and strategies. TAP, in Tanzania, successfully carried out lobbying activities to increase government awareness about a value chain approach for agricultural development. ZNFU and ACF, within Norway-Netherlands Delegated Support in Zambia, contributed significantly towards spreading conservation agriculture in the country and putting the approach high on the government’s agenda.
Summing up: Effective dissemination strategies were set up for many interventions. Mass media were often used, but no assessments were made as to whether these strategies were cost-effective and actually reached their goals. Activities related to dissemination and communication were systematically the first to suffer from budget cuts. This had negative repercussions for programmes concentrating on research, for which dissemination of results was an objective in itself. Most efficient were the organisations that spread new concepts and methods oriented towards governments through lobbying and support in policy and strategy elaboration.
4.3 Cluster 3: Sustainability and scaling-up
This cluster focuses on assessing to what extent results are likely to be maintained after the end of the intervention. Are the results financially and technically sound, the organisations strengthened in order to provide support to existing beneficiaries or new ones (scaling-up), are there any negative environmental effects that would impede adoption of results? These issues are addressed in two evaluation questions, namely:
EQ6: To what extent have interventions been sustainable? EQ7: To what extent have programmes lent themselves to scaling-up?
EQ6 focuses on assessing the extent to which Norwegian-funded interventions has ensured that the realised benefits are maintained and continue after the end of the operation. In order to do so, four dimensions were considered: financial, economic, technical, and institutional sustainability. In addition, exit strategies, where existing, were also reviewed, as they can be paramount for ensuring sustainability.
EQ7 deals with the extent to which the selected programmes were scaled up. Scaling-up can be an efficient way to increase the impact of successfully tested innovations so as to benefit more people and to foster policy and programme development on a long-term basis31.
31 Source : Nine steps for developing a scaling-up strategy - ExpandNet
Evaluation of Norwegian support to agriculture and food security 63
4.3.1 Sustainability (EQ6) Financial and economic sustainability (JC61) Financial sustainability refers mainly to the implementing organisation, while economic sustainability is analysed both for the implementing organisation and the project beneficiaries.
The evaluation found that most interventions did not address properly either financial or economic sustainability. About one-third of the reviewed projects had either no relevant information on their degree of sustainability, or sustainability was not ensured at all (e.g. TFESSD and UNCCD, Ethiopia). In both cases, periodic (annual or final) reports and evaluation reports lacked meaningful information on the sustainability of results. Often, the problem was bypassed, and the implementing partner focused instead on negotiating additional resources or a new project phase as a way to ensure the sustainability of previous phase products and results (through continued support; e.g. “consolidation”).
Policy changes could, in different ways, affect the financial sustainability of results. Governments implementing programmes were obviously affected, as were institutions that carried out activities in parallel with other government-sponsored programmes. Several major activities of TAP, Tanzania, were negatively affected by new government policies (e.g. a maize export ban) or programmes (competition between Governmental farm input subsidy programme and TAP’s activities on the seed and fertiliser value chain). Prorual, Central America, and Lake Managua, Nicaragua, were both affected by government changes (e.g. inclusion of food security as a major component of the government in Nicaragua). Therefore, some executing institutions invested in lobbying or kept new governments informed of their project activities to ensure a smooth transition at the end of the programme. This reflected strong ownership of project results by the executing organisations.
Interestingly, for most interventions, immaterial results − such as policies conceived, new methods, concepts or strategies developed − tended to survive implementation. The case studies showed that, in cases where the project was owned by the (institutional) beneficiaries, sustainability of such immaterial results was likely, often leading to the internalisation of the benefits by the institution. For instance, many activities from MAP implemented by CATIE in Central America were related to promoting sustainable land management, and the project outcomes were incorporated into government policies. Although the approaches of farming as a business and the individual monitoring of farmers in ASP, Zambia, were not adopted by the government itself, the concepts were widely adopted by other donor and government-sponsored programmes.
On the other hand, projects did not manage to systematically sustain their practical results, such as new land husbandry techniques, use of improved seeds or fertilisers, agro-business and/or transformation activities. While many projects ensured that their results were financially sustainable, the adoption rate commonly used as an indicator for sustainability varied widely, with the highest being observed for conservation agriculture by follow farmers. As for
Evaluation of Norwegian support to agriculture and food security64
infrastructure established with Norwegian support, and the subsequent maintenance that would be required, ownership by beneficiaries was weak. By the end of Norwegian support, the maintenance of infrastructures required financial resources sought through external support, as with the Messanu and UNCCD programmes in Ethiopia. For research results, where infrastructure played a minor role (e.g. CCIAM and EPINAV in Tanzania), the sustainability of (immaterial) results was viewed almost exclusively through the adoption rate. Results were financially sustainable as long as the results could be adapted to real conditions and be affordable for the final beneficiaries.
Norway also supported numerous multilateral institutions and governments. Here, it is striking from the analysis made that these remained highly dependent on additional funds for maintaining benefits after the end of the intervention. Core funding of organisations, such as CATIE in Central America and ICIMOD in Asia, or regularly supported government programmes, such as FISP in Malawi, required – and received − continuous donor support through extensions or new phases. The principle of sustainability was thus poorly embedded.
Summing up: In about one-third of reviewed programmes, periodic or evaluation reports did not address the financial and economic sustainability. The financial sustainability of results was affected either positively or negatively by policy changes, with several implementing institutions investing a lot of resources into lobbying, indicating strong ownership of programme results. New policies, approaches and concepts, often internalised by the benefiting stakeholders, were most likely to survive implementation. The adoption rate for practical results varied; lowest for infrastructures and highest for CA. Research results were likely to be sustainable for applied research with a clear linkage between farmers and research institutions. Multilateral institutions and Governments remained highly dependent on additional financial resources to sustain their results.
Institutional and technical sustainability (JC62)It is likely that the sustainability of an institution will be improved through activities that will strengthen its capacity to function as an independent organisation. Activities included staff upgrading, provision of new (live) material and tools, and infrastructures rehabilitation. Many interventions (e.g. Prorural and Lake Managua, in Nicaragua) included activities that strengthened the local, regional or national governmental institutions, such as: human resources capacity building (improved planning, management, fundraising, and technical capabilities); infrastructure capacity building; and materials that extended the outreach of the institutions and made them indispensable. This resulted in better public services for programmes in Central America − for example, operational environmental units with adequate staff and material within the municipalities following Lake Managua’s programme and new policies drafted by the government, through MAP’s support.
As for multilateral organisations, their specific geographical coverage made them attractive for donors and enabled them to access funds relatively easily, possibly because of their outreach. Support to MAP/CATIE, Regional America, and ICIMOD, Regional Asia, were aimed at strengthening the expertise and specific focus of the organisation (promotion of sustainable land management
Evaluation of Norwegian support to agriculture and food security 65
and capacity improvement as a learning and knowledge centre for mountainous regions, respectively). GART PPP in Zambia took advantage of Norwegian support by increasing its research capability and conducting staff training on various topics (e.g. technical and financial, and HIV awareness), becoming a major research centre in Zambia.
The analysis made from document review and from field visits reveals that large NGOs (e.g. ZNFU Zambia) or commercial ventures were de facto sustainable, as they had increased their capacity to raise funds through other channels (donors, private initiatives, commercial side activities). However, the project management staff and evaluation teams still insisted on long-term support, preferably with decreasing budgets or phased support to ensure institutional sustainability for these non-state actors.
As for technical sustainability, the analysis reveals that, in many cases, technical knowledge was acquired in interventions implemented by or benefiting governments. However, these were often unable to maintain the required intensity of efforts to achieve the results or benefits after the end of the project, due to a lack of human and material resources. For such institutions, the intervention was a welcome additional task (e.g. ASP, COMACO and CASPP, in Zambia), as long as funding was maintained, but in some cases it was perceived rather as a burden when funding had terminated, with a subsequent reduction of activities or complete stop altogether (e.g. ASP in Zambia). This was not the case for government-sponsored programmes that were viewed as strategic/critical (e.g. FISP in Malawi). In cases where, in the framework of government-implemented projects, substantial resources had been invested into human resources development, the technical sustainability of project results was more likely to occur. In that case, it was found that on-field technical staff was likely to continue to provide advice, such as the innovative methodology to support farmers (“farming as a business”) through ASP, Zambia, which was taken up by district and camp32 staff (but not by central government). Also, Prorural in Nicaragua and MAP, Regional America, were two interventions that invested substantial financial resources in capacity building to ensure that project benefits would continue at the projects’ end (with financial resources from other donors).
Norway also devoted resources to strengthening public-private partnerships (PPPs). The success or failure of PPPs as implementing institutions depended greatly on their degree of autonomy from the Government, and whether their goals were clearly defined. The evaluation found that, most of the time, PPPs were government-driven to fill in a gap or core function that could not be taken up by Government. When the added value of PPP in relation to Government was not clearly formulated at design level, PPPs were more likely to be unsuccessful. This was the case for several Zambian PPPs (e.g. Netherland-Norway Delegated Support for LDT, NZTT), which were unable to become financially independent and were either dissolved or remained institutionally weakened and dependent on Government. In contrast, the intervention goal for TAP Tanzania
32 Cluster of villages
Evaluation of Norwegian support to agriculture and food security66
was very clear, and the private sector (agricultural input suppliers) was fully involved in the project. Another successful example is GART in Zambia, a research institute that sought to improve its financial basis through commercial activities in order to finance its divulgation efforts.
Overall, the strength of PPPs relied heavily on their leaders’ capacity to mobilise human and financial resources to support their institution in an independent way from the government. Norway supported several PPPs in Zambia (LDT, ACF, GART), with very different results:
� LDT maintained a close relationship with Government, which impacted on its management system and impeded it from adopting a commercial approach.
� ACF management was unable to adapt to a situation without donor support, and went into decline.
� GART, in addition to its research activities, took steps to become independently viable as a commercial agricultural operation; the PPP, with its massive crop production, even resulted at some point during programme implementation in it competing with local farmers.
The sustainability of programme results located in isolated regions has been assessed as low, due to the lack of institutional stakeholders. The case of UNCCD in Ethiopia showed the importance of focusing efforts on local institutions such as NGOs, or on strong communities when government presence was weak in isolated regions. This was less likely for large-scale interventions supported by multilateral organisations (e.g. ICIMOD active in isolated areas of Nepal, or MAP providing support at the border of Guatemala, Honduras and El Salvador) as they have the capacity to phase out gradually, or maintain their presence on a long-term basis through other donor support.
Summing up: Donor support was used to strengthen participating public institutions through capacity building, provision of material, and infrastructures. It increased their outreach and resulted in improved public services. Multilateral institutions took advantage of resources devoted to strengthen their own internal expertise and specific focus. Large-scale NGOs and private sector initiatives were also sustainable through increased fundraising capacity and income generation. Technical knowledge was acquired by the time the programmes ended, but the institutions were unable to sustain the same intensity of activities thereafter. Public private partnerships were most likely to be sustainable when their core functions were clearly defined and independent from Government. The remoteness of programmes can become a concern in terms of sustainability because of a lack of stakeholders to take over, especially with small-scale programmes. Large organisations can afford to maintain their presence on a much longer term through additional support or new phases.
Environmental sustainability (JC63)The programmes selected for evaluation included two categories: those aiming directly to protect the environment (mainly classified as 410 DAC general environmental protection interventions), and projects that were supposed to impact indirectly on the environment by reducing degradation (311 DAC agriculture interventions) through better land husbandry.
Evaluation of Norwegian support to agriculture and food security 67
In all DAC 410 (environment) interventions, the benefits for the environment were not quantitatively measured; no quantitative statement can therefore be made here. The benefits of, for example, reforestation, CO2 credit schemes, and activities to combat desertification were somehow taken for granted and systematically assumed as being positive (e.g. ICIMOD, Regional Asia and REDD in Tanzania). These interventions focused on activities increasing population resilience to induced shocks and changes, whether natural (climate) or human (deforestation, erosion). Results were documented in detail when a new concept was being tested, as was the case for Lake Chilwa, Malawi, which introduced the “eco-system” approach − a holistic/integrated approach to development.
The analysis of documentation revealed no meaningful data on environmental sustainability for DAC 311 (agriculture) projects indirectly benefiting the environment. These were farming intensification/productivity increase, crop(ping) diversification, conservation agriculture, and erosion control measures. Project documentation always assumed that the pressure on the environment was reduced because of net productivity gains (against agricultural expansion) or because of measures to control environmental degradation on agricultural lands (e.g. MAP, Regional America). This assumption was based on external information (from other projects or from research), and not verified within the project. There were also no relevant technical assessments of the long-term impact of agricultural intensification (such as higher use of fertilisers, water use, single cropping, crop rotation) in most projects (e.g. FISP, Malawi, and Agrica, Tanzania).
Despite the apparent lack of any meaningful analyses of environmental impact in the programmes assessed, environmental sustainability seems to be more likely to be achieved when agreements are signed between government, economic operators, farmers, and companies. Defining sets of rules, regulations and informal practices through the signing of a memorandum of understanding, letter of agreement, or code of conduct (e.g. Lake Managua, Nicaragua, and Agri-Vie programmes) morally binds the stakeholders.
Summing up: Environmental sustainability was considered to be achieved by the stakeholders for DAC 410 programmes (environmental interventions), although it was rarely quantitatively measured. There was no relevant information on environmental sustainability for most DAC 311 programmes (agriculture interventions). In these cases, the sustainability was taken for granted, based on external sources of information (e.g. other programmes, literature). In order to maintain environmental results, several programmes exploited the concept of formal agreements between relevant stakeholders.
Quality of exit strategy (JC64)Over 70% of the programmes scrutinised did not mention any exit strategy. Most of the time, exiting just meant closing the intervention or ensuring that another organisation would take over (e.g. government or multilateral institution). Alternatively, the exit strategy was associated with activities that had already been formulated and that, at some point during implementation, were labelled as “exit strategy”. Examples are:

Evaluation of Norwegian support to agriculture and food security68
� Looking for more funds (e.g. GCDT, Ethiopia; Prorural, Nicaragua; ICIMOD, Regional Asia).
� Accelerate or enhance capacity building efforts (e.g. Lake Chilwa, Malawi; CCIAM, Tanzania).
� Prepare a new phase to be presented to donors (e.g. NASFAM, Malawi; TAP, Tanzania; CAP I, Zambia).
� Ensure that institutional documents (policies, strategies, new methods and concepts) are owned by relevant stakeholders (e.g. MAP, Regional America).
It is also striking that in nearly all of the programmes studied and implemented by NGOs and Governments alike, exit strategies had not been developed at formulation stage, and usually were not discussed during implementation, unless a mid-term or final evaluation made specific recommendations. Even in that case, exit strategies were not formulated before programme closure (e.g. MLBP II, Malawi; REDD, Tanzania).
On the positive side, successful exit strategies were formulated and implemented in cases where interventions were designed to benefit the private sector and earn a profit. Then, design systematically contained an exit strategy, with data on how best to achieve it, and also an agenda for handing over the intervention and responsibilities to the relevant stakeholders. Agri-Vie is a case in point in that regard, having formulated and regularly adapted the exit strategy for each investment during its lifetime. In Agrica, Tanzania, the exit strategy considered stock market launch (IPO) or trade sale.
Summing up: There was no formal exit strategy for over 70% of the reviewed programmes. However, it was alternatively defined as additional fundraising capability or lobbying donors for new phases, accelerating capacity building efforts by programme’s end, or ensuring ownership and empowerment of immaterial results. Exit strategies were discussed neither at formulation nor during implementation stages. Programmes involving commercial ventures had systematically formulated a clear exit strategy.
4.3.2 Scaling-up (EQ7)
Programme design and actual scaling-up (JC71 and JC72) Overall, in the intervention sample reviewed, programmes have not systematically been designed with a view to scaling them up. For around 50% of interventions, no scaling-up strategy was designed at formulation stage. For seven of the 25 programmes, no information was provided on scaling-up (e.g. UNCCD, Ethiopia; Lake Managua and Prorural, Nicaragua) or only few references were given that were not relevant for the project (NASFAM, Malawi, and Agri-Vie). For another five interventions (Messanu, Ethiopia; MLBP II, Malawi; and Netherlands-Norway Delegated Support for GART and ZNFU, Zambia), the analysis of activities made by programme evaluation teams showed that these would have lent themselves well to scaling-up, but no effective scaling-up strategy was produced by the programme management team.

Evaluation of Norwegian support to agriculture and food security 69
It appears that programme formulation teams and subsequent management teams were not prospective enough to adequately consider scaling-up. This also meant that the activities (in terms of design, approach and methodology) were not necessarily appropriate to create a multiplication effect. As a consequence, the direct impact from the intervention was not scaled-up to reach more beneficiaries. It seems that management teams often recognised, through periodic reports, that the activities could be scaled-up, but did not consider themselves responsible for planning this. When no scaling-up strategy had been formulated at the design phase, the actual scaling-up of activities depended on the initiative of project staff to start discussions with the stakeholders who were most likely to scale-up the activities (e.g. government, local authorities, other donors) to create ownership and empowerment.
Multilateral institutions and large-scale NGOs active in different countries were found to be more likely to systematically include provisions for scaling-up successful activities, either during the implementation or in subsequent phases (e.g. MAP, Regional America; ICIMOD, Regional Asia). These programmes tested new concepts and methods on-site, suggested priorities of actions, and indirectly influenced relevant institutions in the scaling-up of successful activities. They participated in the elaboration of strategies and policies, fostering the adoption of new methodologies, and divulgation of knowledge of the most successful and innovative results. These institutions and international NGOs directed their scaling-up efforts mainly towards member countries, institutions and governments.
Some types of activities proved easier to scale-up than others, regardless of whether a strategy was formulated at design stage or during implementation (e.g. REDD, Tanzania; PK Norway; GCDT, Messanu, Ethiopia). In descending order, the ease of scaling-up was found to be as follows:
1. Clearly demand-driven projects − such as conservation agriculture (CA) in Zambia and sustainable land management in Central America, as well as ways to improve agricultural productivity (e.g. solar fish driers for Lake Chilwa, Malawi) − were most likely to be scaled-up. These responded to specific needs from potential beneficiaries, such as: honey; livestock enclosures for Messanu, Ethiopia; bee and fish keeping for REDD, Tanzania; increased productivity with low inputs for CA. Interventions successfully responding to local problems resulted in the elaboration of best practices and subsequent divulgation of success stories through scaling-up (e.g. PK Norway; MAP, Central America).
2. Some projects with low costs but high benefits (from the beneficiary perspective) were also likely to be scaled-up. These included conservation agriculture, improved land husbandry techniques, crop and livestock diversification (benefiting farmers). It was the case for programmes that favoured both improved soil and improved crop
Evaluation of Norwegian support to agriculture and food security70
productivity (e.g. mulching33, ridge formation34 for FISP, Malawi; agro-forestry, CA used in MLBP II, Malawi, Lake Managua, Nicaragua, ZNFU and CAP I, Zambia) as farmers tended to avoid risky choices.
3. High-input methods such as crop or livestock intensification requiring, for example, fertilisers and improved genetic material (benefiting farmers).
4. Institutional results in the form of policies, strategies, documents benefiting governments or other institutions.
5. Infrastructure (e.g. culverts, bridges, erosion control measures) and long-term investments (e.g. reforestation) that mostly benefited entire communities.
In most of these cases, the proximity between programme management teams and the beneficiaries seemed to favour scaling-up. Beneficiaries with whom a close relationship had been established by the programme management team were much more likely to scale-up successful results than if the intervention had been managed remotely.
While ownership was paramount for scaling-up, infrastructures and reforestation schemes were the most difficult to expand, due to the high financial investments required. The situation was similar for high-input methods that required continuous government support (e.g. subsidies). For these interventions, the evaluation found little or no multiplication effect of the benefits at the time of programme closure.
The likelihood of scaling-up was also higher for activities with an added value that could be recognised by institutional or final beneficiaries. This required:
1. Testing that showed the added value in different environments (TFESSD, global; EPINAV, Tanzania).
2. An efficient divulgation strategy (MAP, Regional America).
3. Sufficient capacity and ownership of the benefiting institutions to scale-up.
These conditions were not systematically met, with the exception of ICIMOD, Regional Asia, and MAP, Regional America, for which the combination of an efficient divulgation strategy component in the programme, successful testing of new approaches and methods (integrated sustainable land management for MAP, or value chain approach for beekeeping and medicinal plants in the case of ICIMOD), and the presence, in both cases, of a robust organisation able to continue existing actions, resulted in a strong scaling-up effect. In comparison,
33 Protective covering of rotting vegetable matter spread over the ground to conserve moisture, suppress weeds and maintain a good soil texture.
34 Arable land formed into raised strips separated by furrows.
Evaluation of Norwegian support to agriculture and food security 71
ASP in Zambia successfully tested the concept of ”farming as a business” and divulged it widely to its target beneficiaries, but failed to enable scaling-up by the end of the programme, due to lack of central government interest. In that particular case, it was at the time a deliberate strategy by SIDA, the lead donor, to have the programme managed by an external firm to boost programme effectiveness and impact, following several less positive experiences with Government as the implementing agency. It resulted in little or no government ownership of the programme, and therefore no subsequent scaling-up.
Summing up: Around half of the reviewed programmes had an appropriate design for scaling-up activities. For one-third of interventions, there was no strategy at all during the programme, and for another 20%, scaling-up potential was recognised during implementation, but no strategy was designed by programme’s end. Programme formulation teams were not contemplating scaling-up as a priority. Implementation management teams were crucial as to whether or not to address this issue. The most likely to scale-up activities are, in descending order: demand-driven projects focusing directly on beneficiary needs; low-cost results with high benefits; high-input methods; institutional results such as policies; infrastructure. The proximity between programme management teams and the beneficiaries was critical for successfully scaling- up activities, and was most prominent when these had been tested, divulged, and the beneficiaries empowered. Scaling-up was least effective for programmes that provided hand-outs and subsidies. When scaling- up was successful, there was little information available on its actual impact.
4.4 Cluster 4: Financial analysis, including PETS
The financial analysis cluster comprises Evaluation Questions 8 and 9 as follows:
EQ8: To what extent have international aid funds for agriculture been additional to national funds − i.e. to what extent have external funds been used to replace national funds or to finance other sectors35? EQ9: To what extent have the funds reached income-poor farmers, women, and other grassroots target groups?
4.4.1 Fungibility (EQ8)
The team obtained data from the respective partner countries’ Ministries of Finance of the level of Government Recurrent and Capital Expenditure on the Agricultural Sector (excluding any funding for subsidies) for the years 2005 to 2011. The comparable data was obtained from the same ministries for the aggregate amount of donor expenditure over the same period.
These two sets of expenditure data were compared and graphed. If increases in aid funds are indeed being used to replace national funds, then when aid expenditure increases, government expenditure should decrease. This will cause the graph lines to converge. The opposite should also hold true − that is, if aid
35 The question contains an implied hypothesis that when aid funds to a sector are increased, government’s expenditure will decrease. This hypothesis is tested in the analysis.

Evaluation of Norwegian support to agriculture and food security72
funds decrease then government expenditure should increase, and the lines will diverge. However, when the lines run parallel (up or down), then both aid funding and government expenditure are increasing or decreasing simultaneously. In this case, the hypothesis implied in EQ8 fails. Thus, converging or diverging lines conceptually support the hypothesis, while parallel lines negate it.
The results for the three countries were quite mixed:
� Zambia lies at one extreme, with only one year in five being convergent (20%), largely negating the hypothesis. (Figure 11)
� Tanzania was in middle ground, with five years convergent/divergent, and three parallel years (62%). (Figure 12)
� Malawi was at the other extreme, with five out of six years being convergent/ divergent (83%), apparently supporting the hypothesis, but see further comment below. (Figure 13)
The data for each country is set out in the graphs below. Based on the data and the hypothesis, there was no clear-cut evidence either way to show whether or not international aid funds were additional to national funds. It seemed to be very much a country by country situation and not a general trend across countries. In the total of 19 years reviewed across all three countries, there was only one year in which there was evidence of Government expenditure declining in response to a large increase in donor funding.
Figure 11 Zambia: Comparison of changes in Government Expenditure and Donor Expenditure on Agriculture from 2006-2011 (in ZK billions)
Source: Government of Zambia Official Budgets
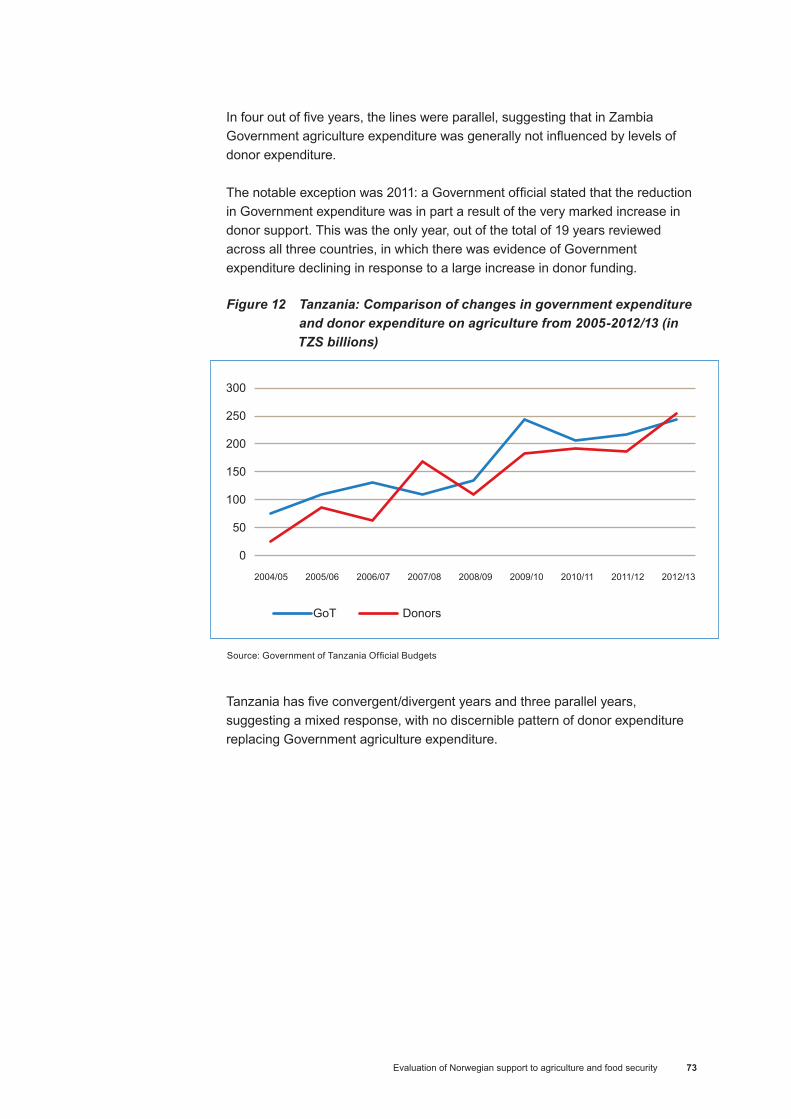
Evaluation of Norwegian support to agriculture and food security 73
In four out of five years, the lines were parallel, suggesting that in Zambia Government agriculture expenditure was generally not influenced by levels of donor expenditure.
The notable exception was 2011: a Government official stated that the reduction in Government expenditure was in part a result of the very marked increase in donor support. This was the only year, out of the total of 19 years reviewed across all three countries, in which there was evidence of Government expenditure declining in response to a large increase in donor funding.
Figure 12 Tanzania: Comparison of changes in government expenditure and donor expenditure on agriculture from 2005-2012/13 (in TZS billions)
Source: Government of Tanzania Official Budgets
Tanzania has five convergent/divergent years and three parallel years, suggesting a mixed response, with no discernible pattern of donor expenditure replacing Government agriculture expenditure.
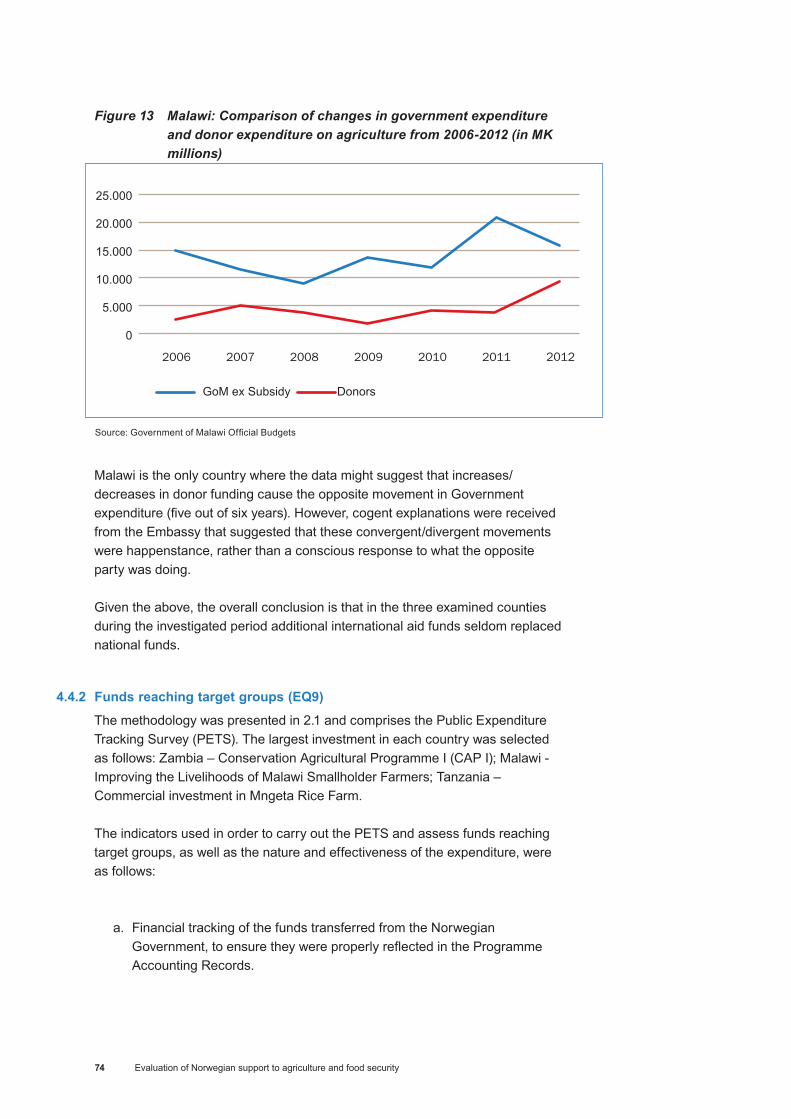
Evaluation of Norwegian support to agriculture and food security74
Figure 13 Malawi: Comparison of changes in government expenditure and donor expenditure on agriculture from 2006-2012 (in MK millions)
Source: Government of Malawi Official Budgets
Malawi is the only country where the data might suggest that increases/decreases in donor funding cause the opposite movement in Government expenditure (five out of six years). However, cogent explanations were received from the Embassy that suggested that these convergent/divergent movements were happenstance, rather than a conscious response to what the opposite party was doing.
Given the above, the overall conclusion is that in the three examined counties during the investigated period additional international aid funds seldom replaced national funds.
4.4.2 Funds reaching target groups (EQ9)
The methodology was presented in 2.1 and comprises the Public Expenditure Tracking Survey (PETS). The largest investment in each country was selected as follows: Zambia – Conservation Agricultural Programme I (CAP I); Malawi - Improving the Livelihoods of Malawi Smallholder Farmers; Tanzania – Commercial investment in Mngeta Rice Farm.
The indicators used in order to carry out the PETS and assess funds reaching target groups, as well as the nature and effectiveness of the expenditure, were as follows:
a. Financial tracking of the funds transferred from the Norwegian Government, to ensure they were properly reflected in the Programme Accounting Records.
Evaluation of Norwegian support to agriculture and food security 75
b. The ratio between “front office” (services directly benefiting citizens), and “back office” expenditure (administration and support costs).
c. Programme organisation, staffing numbers, and the ratio of front office and back office staff.
d. Budgeting procedures, cost control and procurement.
e. Outputs produced.
f. The cost-benefit value achieved.
Each analysis commences with a description of the major finding of the PETS review, referred to as the “stand-out” issue.
4.4.2.1 Zambia PETS: Conservation Agricultural Programme I (CAP I)
CAP I, with a budget of 146 million NOK, was implemented by the Conservation Farming Unit (CFU) in the period 2007-2010.
The stand-out issue: number and adoption rate of new methods by farmersThe CFU kept detailed records of farmer attendances at numerous CFU training events throughout the country. The total number of training attendees reported for the five-year programme amounted to 555,000. However, our findings showed that:
� The full conservation farming (CF) course comprised four individual training events, so a farmer would normally have attended four training sessions in completing a course.
� Some farmers attended courses more than once, for refresher training, while other farmers may not have attended all four courses. For the purposes of this calculation, it is assumed that these two factors approximately cancel each other out.
� This means that the total number of 555,000 “training attendances” needs to be divided by four to arrive at an approximate number of farmers trained. This gives an adjusted figure of approximately 139,000 farmers who have undertaken a full CF training programme.
Discussions with CFU Management, and confirmed at Mumbwa regional office, indicated that approximately 40%-60% of farmers adopt the new methods. The reason given is that the new methods are more labour intensive in the first year. On this basis, the number of adopters was likely to be between 55,600 and 83,400, rather than the number of 171,780 reported in the final report on CAP I. A notable anomaly is that the 171,000 adopter figure is more than the total number of approximately 139,000 farmers who appear to have attended training.
Evaluation of Norwegian support to agriculture and food security76
The lower adopter figures are supported by the results of the Mumbwa Regional Office’s census exercise. The Mumbwa office is one of four regional offices, and therefore accounts for a substantial 25% (approximately) of CFU’s activity. The census was carried out by each of Mumbwa’s 390 farming co-ordinators, whereby each co-ordinator had listed each of their adopters, and the hectares under CF. The following results were recorded:
� The average number of CF adopters per farming co-ordinator was 12.7. � The average number of hectares per farming co-ordinator was 16.4,
which includes his or her own hectares.
These results were discussed by the evaluation team with CFU management, and then extrapolated (with adjustment) across all the CFU’s regional offices. The extrapolation was made with inputs from CFU management, in order to take account of and adjust for factors that could cause Mumbwa figures to be lower than the other three regions. These adjustments gave rise to an increase of 110% in overall adopter numbers.36
The resultant (rough) adjusted numbers were a total of 63,953 adopters and 58,058 hectares across the whole CAP programme. This compares to the respective figures of 171,780 adopters and 134,160 hectares mentioned in the CFU final report for the programme, and the 173,000 adopters mentioned in the end review by Orgut, the firm conducting the evaluation. However, it is noteworthy that in the 2006 programme design document, the target was 64,400, so the above number is remarkably close to the objective. The figure of 64,000 is considered by the evaluation team to be a reasonable ‘order of magnitude’ approximation of the number of adopters recruited under CAP I.
Subsequent further investigation revealed that the figure of 171,780 (or 173,000 depending on the source), was in fact the cumulative number of adopters since the CFU started its conservation farming programmes back in 1996, but this is not clear from the respective reports. Furthermore the baseline at the start of this CAP I programme seems to vary depending on source, and figures of 23,560, 45,000 and 55,600 have subsequently been seen. Deducting the baseline would result in a net gain of CAP I adopters which would vary between 117,000 and 150,000 depending on the data selected. This is still well in excess of the 64,000 estimated above.
While, at first glance, the figures may appear to be a setback, the cost-benefit analysis carried out (see section Value Generated) shows that, even with these reduced results, the programme has generated a laudable cost:total benefit ratio of approximately 1:5.7 (considering several key assumptions set out in Annex 8).
36 The reported figures for Mumbwa are low for two main reasons: 1) Mumbwa region includes a “west wing” (area) that borders on a game park, where the adoption rate is lower than average because game poaching is an easier way to make a living; 2) The census figures reported exclude big farms, spontaneous (farmer to farmer) adopters, and late mechanised tillers. The impact of these factors was roughly estimated with CFU management, and a combined adjustment of an additional 110% was factored into the results reported above. The adjustments result in a higher average hectare figure per adopter (approximately 1 ha) than is normally experienced when only smallholders are considered.

Evaluation of Norwegian support to agriculture and food security 77
The large discrepancies are most probably caused by the programme not having an in-house function for data collection, monitoring and evaluation, and no central database of lead farmers and adopters. These suboptimal M&E arrangements are described in more detail in the case study report (see Annex 5), but there is clearly an overall need to invest in accurate data collection, consolidation, and analysis at Head Office, and to carry out a full census of current CF adopters, CF hectares, and crop mix. It should be noted, however, that valuable data (e.g. on aspects of food security) was generated by Noragric and IMCS, mainly through surveys.
Transfer and receipt of Norwegian fundsEleven transfers over four years, totalling 146 million NOK, were traced from Embassy schedule of transfers (provided by the Embassy) into Audited Accounts of CAP I. The transfer timings were made on an “as needed” basis, which prevented an unnecessary build-up of bank balances, and, consequently, year end bank balances were low.
Service delivery expenditure: Front Office vs. Back OfficeThe following table reflects the major items of CAP I expenditures for 2010, the latest year for which data was available.
The key points of analysis were:
� 28.3% of all expenditure was spent directly on beneficiaries (ZK 10.4bn ). Given the intense technical assistance nature of the project, and the necessary administration thereof, this percentage seems reasonable.
� Contingencies represented a substantial amount, with most of this being spent on expanding conservation farming into neighbouring countries, with agreement with the Embassy.
Overall, back office expenditure of 48% was very high, compared to the generally accepted benchmark of approximately 20%. The main reasons were:
� The 11.4% contributions to “Partner Organisations” − namely, GART (Research), Cotton Association, and COMACO. This is an unusual cost item that would not appear in the benchmark37.
� The cost of expanding conservation farming into neighbouring countries (9%) is an unusual item of expense, but the expansion had been approved by the Embassy.
� Head office management and staff salaries, as well as staff welfare, were on the high side at 11.6% of total cost. However, the directors who introduced and refined the intellectual property on which the conservation farming was founded were well remunerated accordingly, and the success of the organisation was substantially attributable to their knowledge and commitment.
37 From discussions with CFU Management, it appeared that CFU was not satisfied with the services from GART (received 7.5% of all expenditure), and this arrangement has now ended.
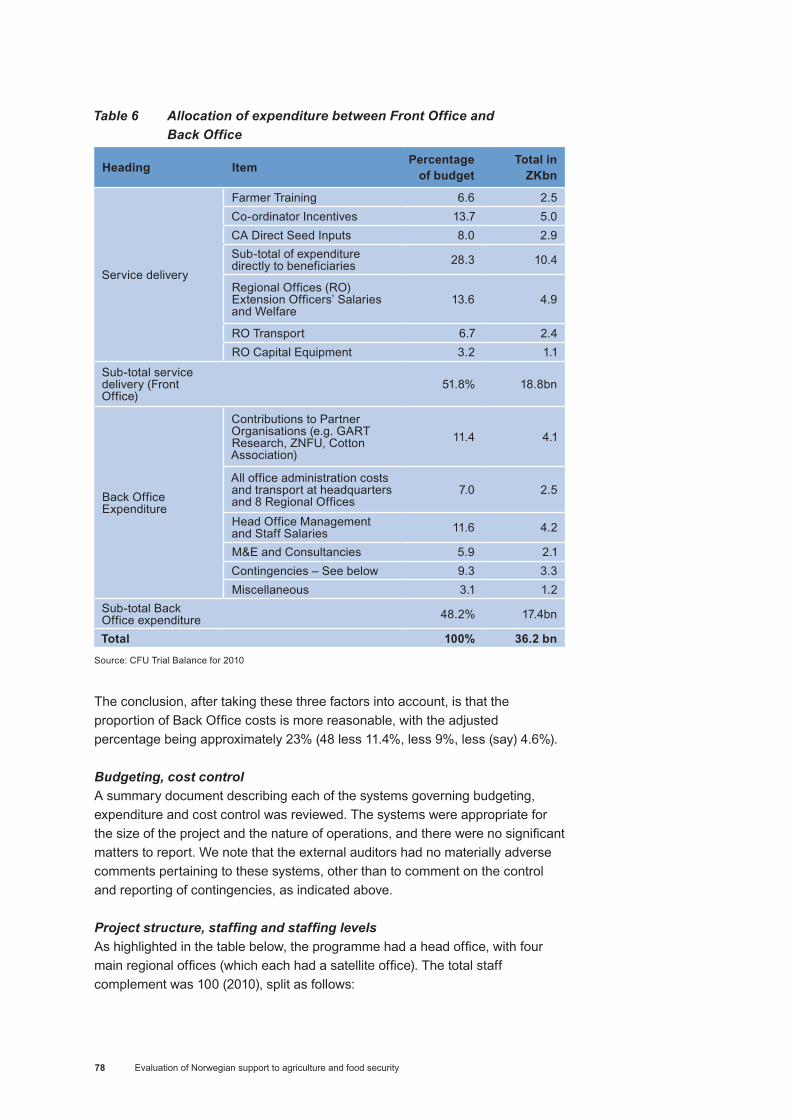
Evaluation of Norwegian support to agriculture and food security78
Table 6 Allocation of expenditure between Front Office and Back Office
Heading Item Percentage of budget
Total in ZKbn
Service delivery
Farmer Training 6.6 2.5Co-ordinator Incentives 13.7 5.0CA Direct Seed Inputs 8.0 2.9Sub-total of expenditure directly to beneficiaries 28.3 10.4
Regional Offices (RO) Extension Officers’ Salaries and Welfare
13.6 4.9
RO Transport 6.7 2.4RO Capital Equipment 3.2 1.1
Sub-total service delivery (Front Office)
51.8% 18.8bn
Back Office Expenditure
Contributions to Partner Organisations (e.g. GART Research, ZNFU, Cotton Association)
11.4 4.1
All office administration costs and transport at headquarters and 8 Regional Offices
7.0 2.5
Head Office Management and Staff Salaries 11.6 4.2
M&E and Consultancies 5.9 2.1Contingencies – See below 9.3 3.3Miscellaneous 3.1 1.2
Sub-total Back Office expenditure 48.2% 17.4bn
Total 100% 36.2 bn Source: CFU Trial Balance for 2010
The conclusion, after taking these three factors into account, is that the proportion of Back Office costs is more reasonable, with the adjusted percentage being approximately 23% (48 less 11.4%, less 9%, less (say) 4.6%).
Budgeting, cost controlA summary document describing each of the systems governing budgeting, expenditure and cost control was reviewed. The systems were appropriate for the size of the project and the nature of operations, and there were no significant matters to report. We note that the external auditors had no materially adverse comments pertaining to these systems, other than to comment on the control and reporting of contingencies, as indicated above.
Project structure, staffing and staffing levelsAs highlighted in the table below, the programme had a head office, with four main regional offices (which each had a satellite office). The total staff complement was 100 (2010), split as follows:
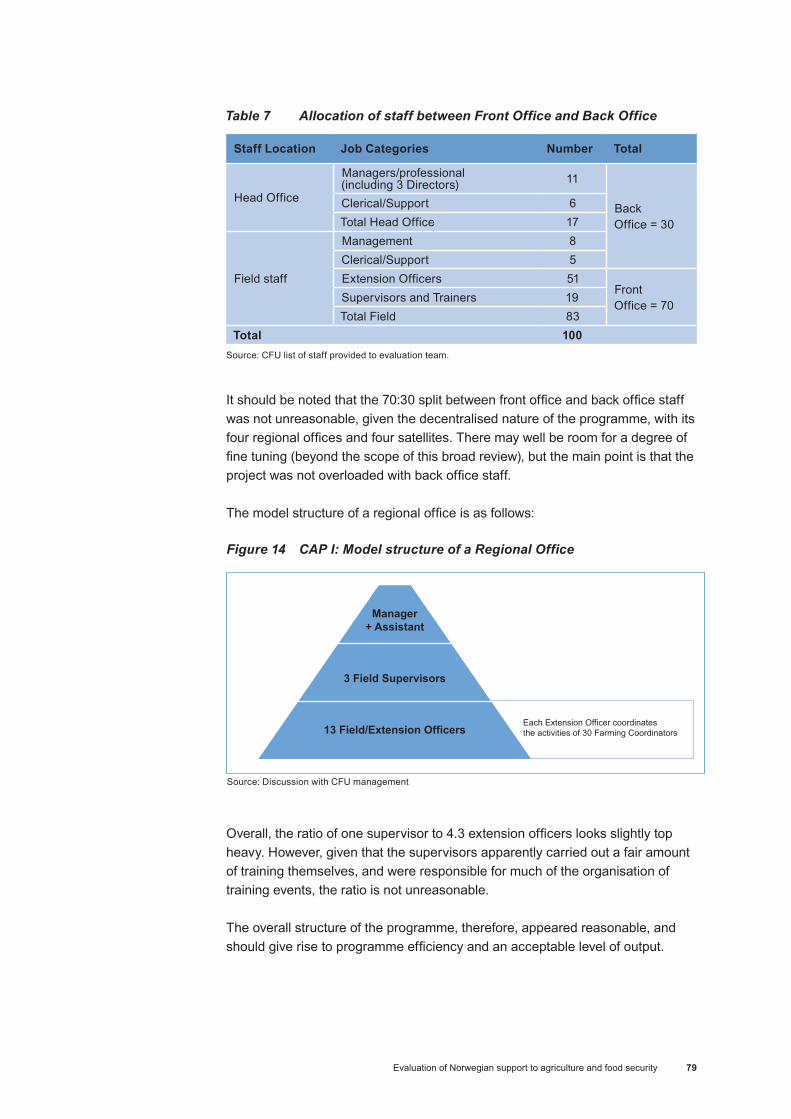
Evaluation of Norwegian support to agriculture and food security 79
Table 7 Allocation of staff between Front Office and Back Office
Staff Location Job Categories Number Total
Head Office
Managers/professional (including 3 Directors) 11
Back Office = 30
Clerical/Support 6Total Head Office 17
Field staff
Management 8Clerical/Support 5Extension Officers 51
Front Office = 70
Supervisors and Trainers 19Total Field 83
Total 100 Source: CFU list of staff provided to evaluation team.
It should be noted that the 70:30 split between front office and back office staff was not unreasonable, given the decentralised nature of the programme, with its four regional offices and four satellites. There may well be room for a degree of fine tuning (beyond the scope of this broad review), but the main point is that the project was not overloaded with back office staff.
The model structure of a regional office is as follows:
Figure 14 CAP I: Model structure of a Regional Office
Source: Discussion with CFU management
Overall, the ratio of one supervisor to 4.3 extension officers looks slightly top heavy. However, given that the supervisors apparently carried out a fair amount of training themselves, and were responsible for much of the organisation of training events, the ratio is not unreasonable.
The overall structure of the programme, therefore, appeared reasonable, and should give rise to programme efficiency and an acceptable level of output.
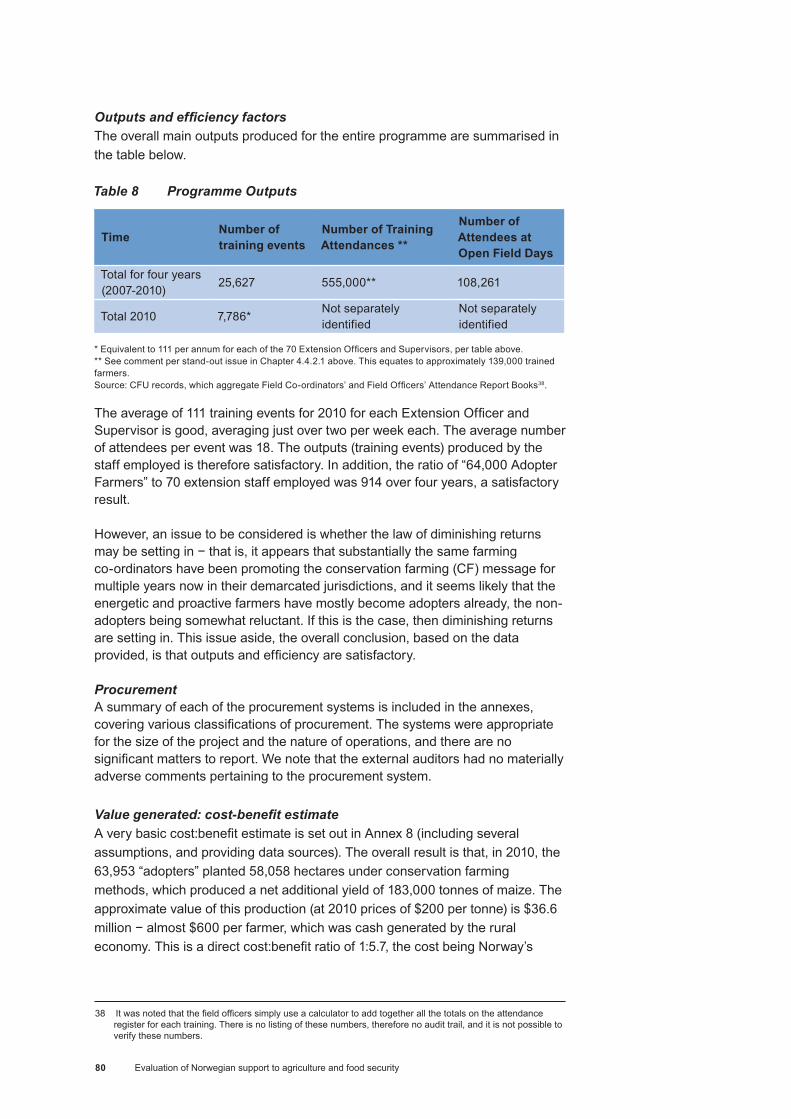
Evaluation of Norwegian support to agriculture and food security80
Outputs and efficiency factorsThe overall main outputs produced for the entire programme are summarised in the table below.
Table 8 Programme Outputs
Time Number of training events
Number of Training Attendances **
Number of Attendees at Open Field Days
Total for four years (2007-2010)
25,627 555,000** 108,261
Total 2010 7,786*Not separately identified
Not separately identified
* Equivalent to 111 per annum for each of the 70 Extension Officers and Supervisors, per table above. ** See comment per stand-out issue in Chapter 4.4.2.1 above. This equates to approximately 139,000 trained farmers. Source: CFU records, which aggregate Field Co-ordinators’ and Field Officers’ Attendance Report Books38.
The average of 111 training events for 2010 for each Extension Officer and Supervisor is good, averaging just over two per week each. The average number of attendees per event was 18. The outputs (training events) produced by the staff employed is therefore satisfactory. In addition, the ratio of “64,000 Adopter Farmers” to 70 extension staff employed was 914 over four years, a satisfactory result. However, an issue to be considered is whether the law of diminishing returns may be setting in − that is, it appears that substantially the same farming co-ordinators have been promoting the conservation farming (CF) message for multiple years now in their demarcated jurisdictions, and it seems likely that the energetic and proactive farmers have mostly become adopters already, the non-adopters being somewhat reluctant. If this is the case, then diminishing returns are setting in. This issue aside, the overall conclusion, based on the data provided, is that outputs and efficiency are satisfactory. Procurement A summary of each of the procurement systems is included in the annexes, covering various classifications of procurement. The systems were appropriate for the size of the project and the nature of operations, and there are no significant matters to report. We note that the external auditors had no materially adverse comments pertaining to the procurement system.
Value generated: cost-benefit estimateA very basic cost:benefit estimate is set out in Annex 8 (including several assumptions, and providing data sources). The overall result is that, in 2010, the 63,953 “adopters” planted 58,058 hectares under conservation farming methods, which produced a net additional yield of 183,000 tonnes of maize. The approximate value of this production (at 2010 prices of $200 per tonne) is $36.6 million − almost $600 per farmer, which was cash generated by the rural economy. This is a direct cost:benefit ratio of 1:5.7, the cost being Norway’s
38 It was noted that the field officers simply use a calculator to add together all the totals on the attendance register for each training. There is no listing of these numbers, therefore no audit trail, and it is not possible to verify these numbers.
Evaluation of Norwegian support to agriculture and food security 81
average funding of $6.5 million per annum over four years. This is considered a reasonable ratio39.
However, the wider economic impact is much higher, namely:
� The “value added” to this maize (mainly), before it is purchased and consumed, is approximately $29.3 million – which constitutes additional gross domestic product (GDP).
� The “multiplier effect” in the economy of an increase in cash earned by rural farmers has been assumed to be 340. This generates a further $110 million of GDP.
� When the direct marginal production of $36.6 million above is added, the combined economic value (GDP) amounts to $176 million.
This produces an indicative ratio of Cost to Total Economic Benefit of 1:27, a most laudable result.
Summing up: Apart from the shortcomings in relation to the monitoring and evaluation function and the two areas of high back office costs (namely, the contributions to partner organisations and the cost of expansion into neighbouring countries), the overall conclusion of this PETS review is that CAP I was well managed, efficiently run, was producing a satisfactory level of output, and is generating a laudable cost:benefit ratio.
4.4.2.2 Malawi PETS: National Association of Smallholder Farmers Malawi (NASFAM)
The Improving the Livelihoods of Malawi Smallholder Farmers project, with a budget of 95 million NOK, was implemented by NASFAM during the period 2007-2011, with 50,100 beneficiaries.
The stand-out issue: sustainability of the programme Under SDP I (2001-2006), the intention was that the profits from NASFAM Commodity Marketing Exchange (NASCOMEX) – that is, the commercial agricultural commodity trading arm of NASFAM − would eventually fund the cost of NASFAM, with the development activities arm thus creating self-sustainability and allowing development partners to withdraw. In SDP II this objective shifted to accepting the need for long-term support from development partners. This shift is realistic, because under the status quo it would take possibly a decade before NASCOMEX’s profits could be sufficient to fund the current level of development expenditure. The reasons for this are:
39 There is very little easily accessible data on cost:direct benefit benchmarks. The evaluation team’s opinion is that anything over 5 is acceptable, with 10 good and 15 exceptional. Note also that this is a “one year” benefit assessment, while in reality the cost:benefits would build up over the programme, and even if the programme funding was withdrawn, the benefits would (in the main) continue. This would increase the ratio.
40 A ‘Multiplier’ of 3 is an indicative and fairly standard benchmark used by economists, but has not been validated for Zambia.
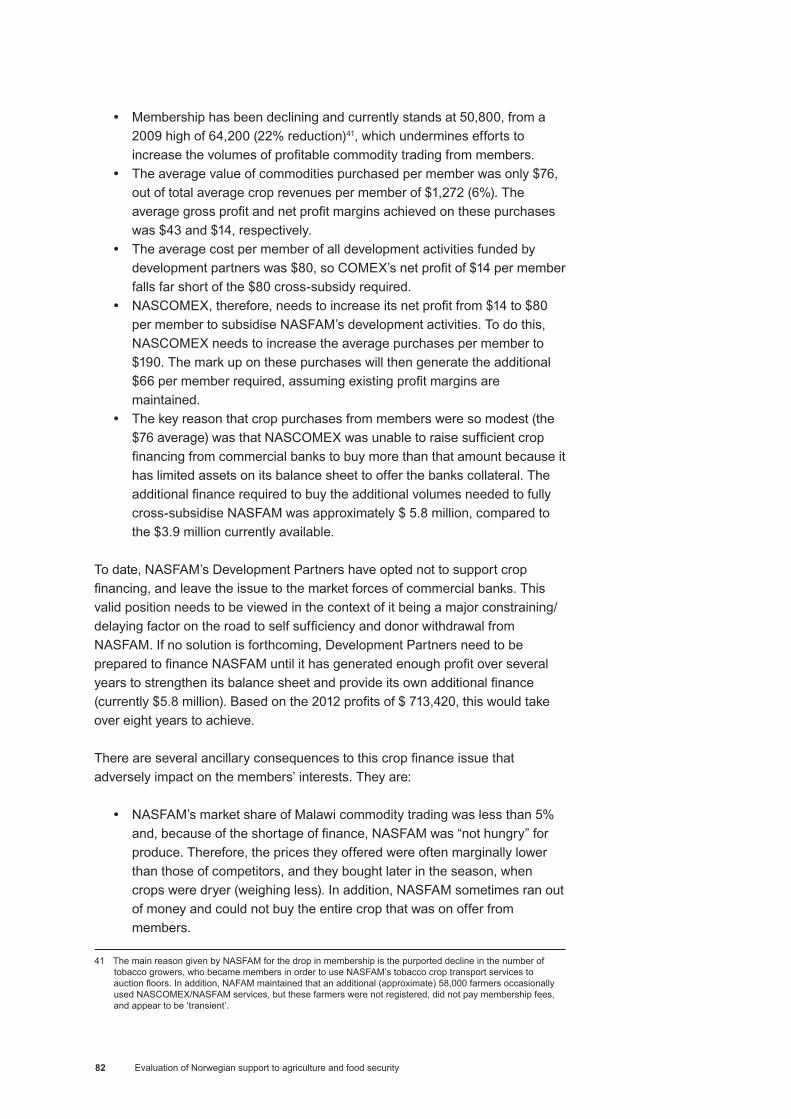
Evaluation of Norwegian support to agriculture and food security82
� Membership has been declining and currently stands at 50,800, from a 2009 high of 64,200 (22% reduction)41, which undermines efforts to increase the volumes of profitable commodity trading from members.
� The average value of commodities purchased per member was only $76, out of total average crop revenues per member of $1,272 (6%). The average gross profit and net profit margins achieved on these purchases was $43 and $14, respectively.
� The average cost per member of all development activities funded by development partners was $80, so COMEX’s net profit of $14 per member falls far short of the $80 cross-subsidy required.
� NASCOMEX, therefore, needs to increase its net profit from $14 to $80 per member to subsidise NASFAM’s development activities. To do this, NASCOMEX needs to increase the average purchases per member to $190. The mark up on these purchases will then generate the additional $66 per member required, assuming existing profit margins are maintained.
� The key reason that crop purchases from members were so modest (the $76 average) was that NASCOMEX was unable to raise sufficient crop financing from commercial banks to buy more than that amount because it has limited assets on its balance sheet to offer the banks collateral. The additional finance required to buy the additional volumes needed to fully cross-subsidise NASFAM was approximately $ 5.8 million, compared to the $3.9 million currently available.
To date, NASFAM’s Development Partners have opted not to support crop financing, and leave the issue to the market forces of commercial banks. This valid position needs to be viewed in the context of it being a major constraining/delaying factor on the road to self sufficiency and donor withdrawal from NASFAM. If no solution is forthcoming, Development Partners need to be prepared to finance NASFAM until it has generated enough profit over several years to strengthen its balance sheet and provide its own additional finance (currently $5.8 million). Based on the 2012 profits of $ 713,420, this would take over eight years to achieve.
There are several ancillary consequences to this crop finance issue that adversely impact on the members’ interests. They are:
� NASFAM’s market share of Malawi commodity trading was less than 5% and, because of the shortage of finance, NASFAM was “not hungry” for produce. Therefore, the prices they offered were often marginally lower than those of competitors, and they bought later in the season, when crops were dryer (weighing less). In addition, NASFAM sometimes ran out of money and could not buy the entire crop that was on offer from members.
41 The main reason given by NASFAM for the drop in membership is the purported decline in the number of tobacco growers, who became members in order to use NASFAM’s tobacco crop transport services to auction floors. In addition, NAFAM maintained that an additional (approximate) 58,000 farmers occasionally used NASCOMEX/NASFAM services, but these farmers were not registered, did not pay membership fees, and appear to be ‘transient’.

Evaluation of Norwegian support to agriculture and food security 83
� NASFAM had established buying locations at only 10% (approximately) of their group action committees, which meant that distance for farmers to travel to market is quite high. In addition, the lower volumes meant that NASFAM was unable to create high volume efficiencies, which, in turn, would have enabled NASFAM to offer members slightly higher prices for their crops.
A related opportunity is that the process of buying crops used traditional methods of a team of buyers going out into the rural areas, carrying cash and hoping to find sufficient sellers. This contained risks and inefficiencies, and did not utilise modern mobile money technology available.
All the above factors impacted on NASFAM’s ability to serve its members’ interests in an optimum way.
Transfer/receipt of Norwegian fundsTwelve transfers, totalling 95 million NOK, were tracked from the schedule provided by the Embassy into the audited accounts, between March 2007 and August 2012. The amount comprised:
� The original contract between the Embassy and NASFAM (dated 16 Feb 2007), which stipulated 80 million NOK, expiring December 2011.
� The contract addendum, which provided for an additional 15 million NOK.
The Embassy’s listing of their Malawi projects by value, however, showed this project at 88 million NOK. This listing appears to omit the last release of 7 million NOK, made in August 2012 − a minor point, duly noted by the Embassy.
Funds provided by Norway accounted for approximately 66% of NASFAM’s total grant income in 2011. NASFAM had a healthy balance sheet, and the aggregate value of its General Fund and Deferred Income Account (i.e. unused funds) was approximately 19.4 million NOK, of which approximately 5.5 million NOK was attributable to Norway. While the 19.4 million NOK represents approximately one year’s advance funding, Norway’s 5.5 million NOK represents 4.1 months’ expenditure. This amount is congruent with the biannual grant release arrangement.
Service delivery expenditure: Front Office vs. Back OfficeAs highlighted in the figure below, NASFAM expenditure totalled MK 599 million (25 million NOK) in the year ended September 2011, broadly classified into the following three areas:
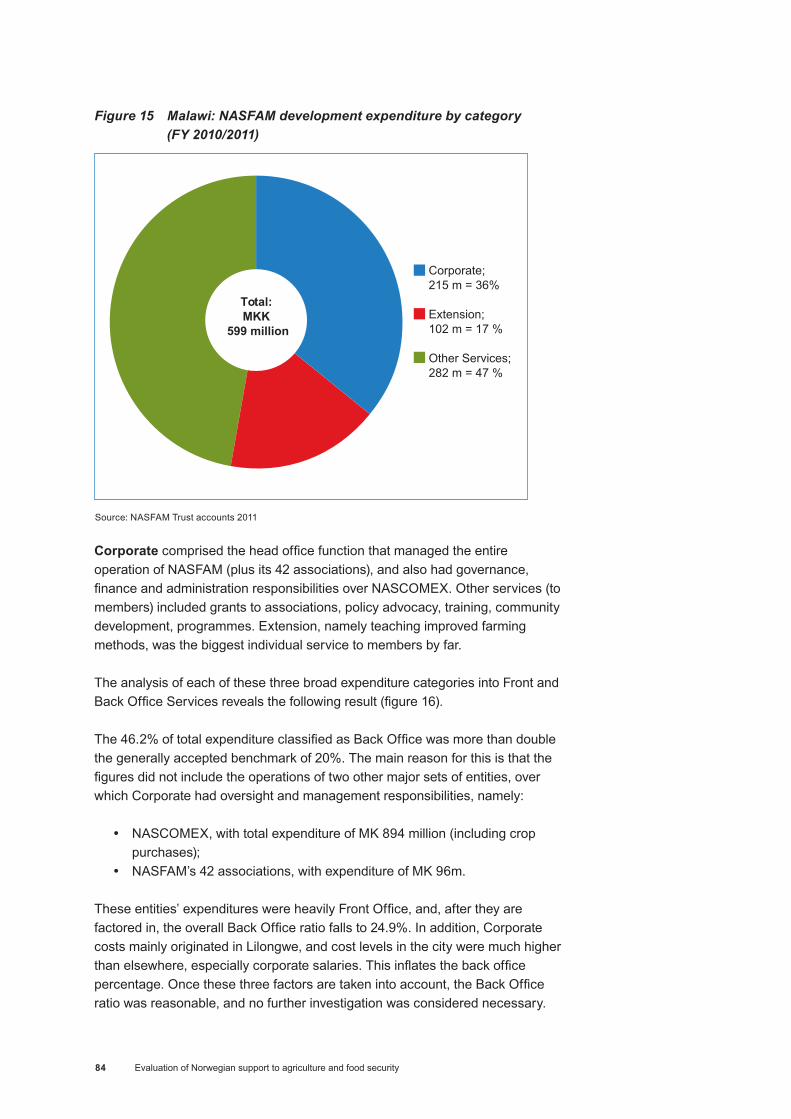
Evaluation of Norwegian support to agriculture and food security84
Total: MKK
599 million
Figure 15 Malawi: NASFAM development expenditure by category (FY 2010/2011)
Source: NASFAM Trust accounts 2011
Corporate comprised the head office function that managed the entire operation of NASFAM (plus its 42 associations), and also had governance, finance and administration responsibilities over NASCOMEX. Other services (to members) included grants to associations, policy advocacy, training, community development, programmes. Extension, namely teaching improved farming methods, was the biggest individual service to members by far.
The analysis of each of these three broad expenditure categories into Front and Back Office Services reveals the following result (figure 16).
The 46.2% of total expenditure classified as Back Office was more than double the generally accepted benchmark of 20%. The main reason for this is that the figures did not include the operations of two other major sets of entities, over which Corporate had oversight and management responsibilities, namely:
� NASCOMEX, with total expenditure of MK 894 million (including crop purchases);
� NASFAM’s 42 associations, with expenditure of MK 96m.
These entities’ expenditures were heavily Front Office, and, after they are factored in, the overall Back Office ratio falls to 24.9%. In addition, Corporate costs mainly originated in Lilongwe, and cost levels in the city were much higher than elsewhere, especially corporate salaries. This inflates the back office percentage. Once these three factors are taken into account, the Back Office ratio was reasonable, and no further investigation was considered necessary.
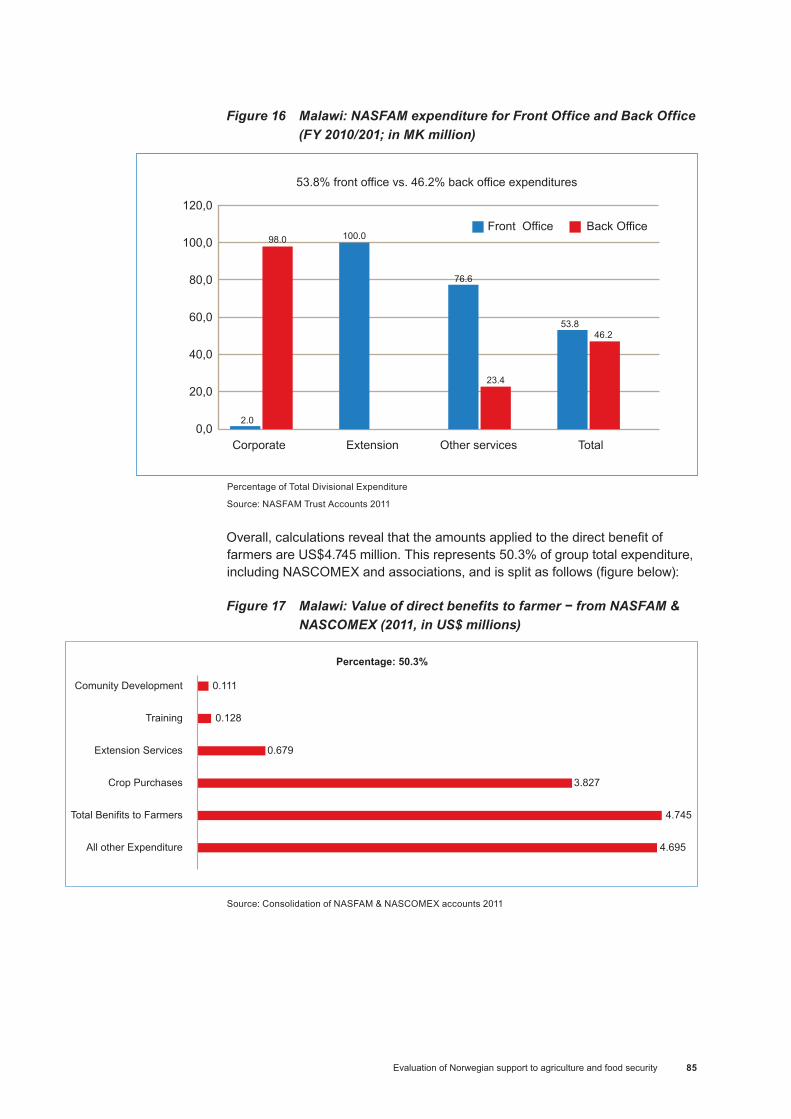
Evaluation of Norwegian support to agriculture and food security 85
Figure 16 Malawi: NASFAM expenditure for Front Office and Back Office (FY 2010/201; in MK million)
Percentage of Total Divisional Expenditure
Source: NASFAM Trust Accounts 2011 Overall, calculations reveal that the amounts applied to the direct benefit of farmers are US$4.745 million. This represents 50.3% of group total expenditure, including NASCOMEX and associations, and is split as follows (figure below):
Figure 17 Malawi: Value of direct benefits to farmer − from NASFAM & NASCOMEX (2011, in US$ millions)
Source: Consolidation of NASFAM & NASCOMEX accounts 2011

Evaluation of Norwegian support to agriculture and food security86
Budgeting, cost control NASFAM provided the evaluation team with a document setting out their accounting, budgeting and cost control procedures. The software used for accounting (named CODA) is sophisticated, with flexibility for multi-layered reporting. This allows for financial analysis and reporting by cost element, by donor, by key result area, by department, or by cost nature. The systems are appropriate for the size of the project and the nature of operations, and there are no significant systems matters to report. We note that the external auditors had no materially adverse comments pertaining to these systems.
Project structure, staffing levels in Front Office and Back Office functionsNASFAM Corporate had oversight of NASFAM Commercial and NASFAM Development, the latter having oversight of 14 regional management centres and 42 NASFAM associations.
As shown in the figure below, this group of entities employed a total of 481 staff, split as follows:
Figure 18 NASFAM, Staff employment by entity, 2011
Source:NASFAM personnel list 2011
A list of all employees in each entity was obtained and each post was classified into Front Office or Back Office, with the resultant ratios. Note that NASCOMEX and the associations fund most of their salaries from own revenue sources, and NASFAM donors fund most of the salaries for Corporate and Development.
Evaluation of Norwegian support to agriculture and food security 87
Figure 19 Malawi: NASFAM group staffing analysis 2011
Source: NASFAM personnel list 2011
As shown in the figure above, the initial analysis reflects a very high Back Office staff percentage of 66%. The situation was analysed further and the number of unskilled/semi-skilled workers − for example, guards, drivers, office attendants (all classified as Back Office) − was found to be 179. After removing these unskilled categories, the adjusted percentages are 54.3% (Front) and 45.7% (Back). Further investigation showed that the highly decentralised operations (i.e. 14 regional management centres, and 42 associations) were proportionately heavily staffed in the administrative categories (e.g. regional managers, accounts clerks, data officers). Overall payroll costs amounted to 24% of the budget − lower than in many development agencies42.
Nevertheless, even after taking these issues into consideration, the residual Back Office percentage (say, approximately 40%) remains on the high side, but it was beyond the scope of the PETS to investigate the matter further.
42 The evaluation team was unable to determine how many staff were paid for out of Norwegian funds, or whether Norway funded a specific percentage of payroll, as the accounting data was not presented in this manner.
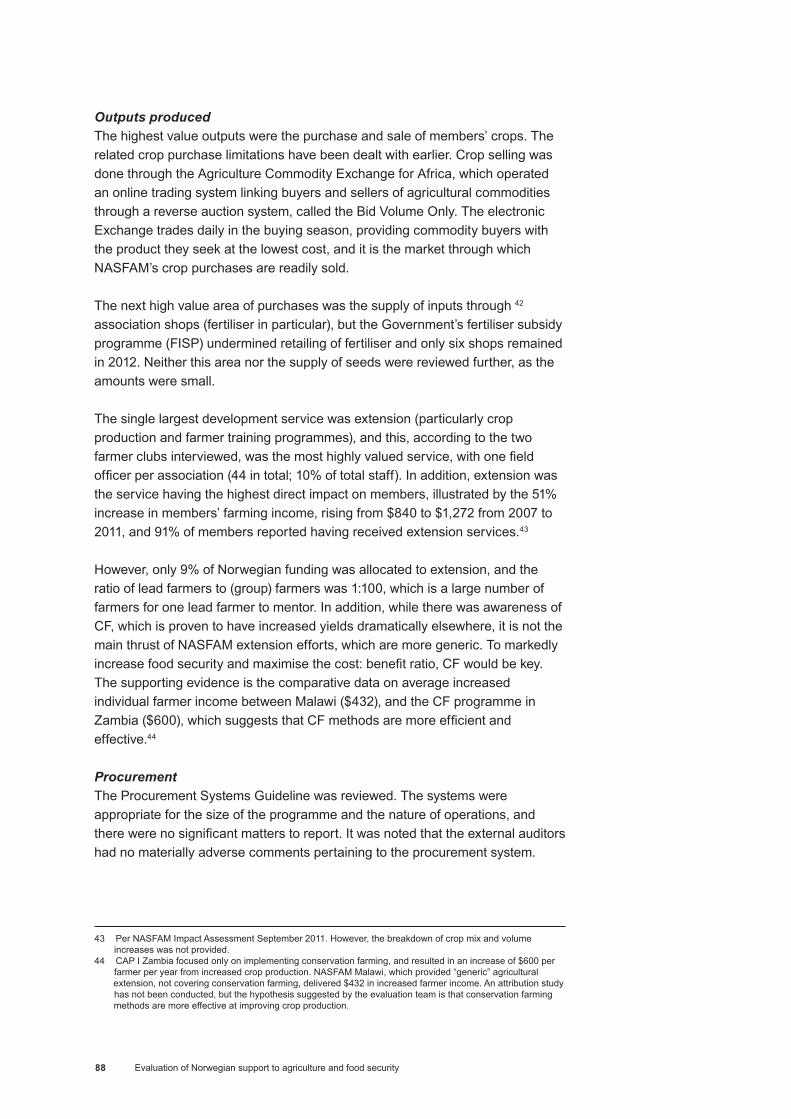
Evaluation of Norwegian support to agriculture and food security88
Outputs producedThe highest value outputs were the purchase and sale of members’ crops. The related crop purchase limitations have been dealt with earlier. Crop selling was done through the Agriculture Commodity Exchange for Africa, which operated an online trading system linking buyers and sellers of agricultural commodities through a reverse auction system, called the Bid Volume Only. The electronic Exchange trades daily in the buying season, providing commodity buyers with the product they seek at the lowest cost, and it is the market through which NASFAM’s crop purchases are readily sold.
The next high value area of purchases was the supply of inputs through 42 association shops (fertiliser in particular), but the Government’s fertiliser subsidy programme (FISP) undermined retailing of fertiliser and only six shops remained in 2012. Neither this area nor the supply of seeds were reviewed further, as the amounts were small.
The single largest development service was extension (particularly crop production and farmer training programmes), and this, according to the two farmer clubs interviewed, was the most highly valued service, with one field officer per association (44 in total; 10% of total staff). In addition, extension was the service having the highest direct impact on members, illustrated by the 51% increase in members’ farming income, rising from $840 to $1,272 from 2007 to 2011, and 91% of members reported having received extension services.43
However, only 9% of Norwegian funding was allocated to extension, and the ratio of lead farmers to (group) farmers was 1:100, which is a large number of farmers for one lead farmer to mentor. In addition, while there was awareness of CF, which is proven to have increased yields dramatically elsewhere, it is not the main thrust of NASFAM extension efforts, which are more generic. To markedly increase food security and maximise the cost: benefit ratio, CF would be key. The supporting evidence is the comparative data on average increased individual farmer income between Malawi ($432), and the CF programme in Zambia ($600), which suggests that CF methods are more efficient and effective.44
Procurement The Procurement Systems Guideline was reviewed. The systems were appropriate for the size of the programme and the nature of operations, and there were no significant matters to report. It was noted that the external auditors had no materially adverse comments pertaining to the procurement system.
43 Per NASFAM Impact Assessment September 2011. However, the breakdown of crop mix and volume increases was not provided.
44 CAP I Zambia focused only on implementing conservation farming, and resulted in an increase of $600 per farmer per year from increased crop production. NASFAM Malawi, which provided “generic” agricultural extension, not covering conservation farming, delivered $432 in increased farmer income. An attribution study has not been conducted, but the hypothesis suggested by the evaluation team is that conservation farming methods are more effective at improving crop production.

Evaluation of Norwegian support to agriculture and food security 89
Value generated: cost-benefit analysis The cost:benefit ratio was based only on the 51% increase in members’ farming income − an increase of $432, from $840 to $127245. A very basic cost:benefit estimate shows that the total cumulative value, building up evenly over six years (i.e. five programme years, plus the first year post-programme) is $82.3 million (See Annex 8 for calculations and assumptions). This is a direct cost:benefit ratio of 1:4.16, the cost being the total of all NASFAM (development) costs over the five years. This is a slightly below the “par ratio” of 5 (see earlier footnote regarding Zambia).
However, the wider economic impact was much higher, namely:
� The “multiplier effect” in the economy of an increase in cash earned by rural farmers was assumed to be 3.46 This generates a further $247 million of GDP.
� The “value added” to this crop production before it is purchased and consumed is approximately $123 million additional GDP (substantially tobacco).
The combined economic value (GDP) comes to $453 million − i.e. a Cost to Total Economic Benefit of 1:23, a laudable result.
Summing up: Apart from the two issues of inadequate crop finance (not under management control), and the need to review the number of Back Office staff, the overall conclusion of the PETS review is that NASFAM companies were well managed and were producing a satisfactory level of output within the stated constraints. While the cost:direct benefit ratio was modest, NASFAM was generating a laudable wider cost:benefit ratio.
4.4.2.3 Tanzania PETS: Mngeta Rice Farm The Tanzania PETS focuses on a commercial investment of US$10 million in the 5,800 hectare (ha) Mngeta Rice Farm, owned (eventually) by Agrica Limited, a company based in Guernsey. The main beneficiaries are Tanzanian rice con-sumers, as well as the eventual 5,000 rice outgrowers.
This PETS review was somewhat different from the previous two, because this is a commercial investment, with very different dynamics and performance measures. Adding to the complexity is that the investment was a little over halfway through its seven-year start-up phase, and was thus still several years away from full production and being able to generate the required and expected profit margins. The future operations and financing of the farm present several risks, which are being carefully managed, but not all are under direct control of management. It is possible, therefore, to envisage two scenarios emerging: one the “high road”, with projections being attained, the other the “low road”, where the investment runs into difficulties. What follows, and the conclusion we draw,
45 The assessment was based on a survey of 2,580 members (out of 50,800) and 1,209 non-members. Note: there is a multiplicity of other indirect benefits, but these are not factored in.
46 A “multiplier” of 3 is a fairly standard benchmark, confirmed as reasonable by a senior Malawian economist.

Evaluation of Norwegian support to agriculture and food security90
reflects the “high road” scenario, which is considered by the evaluation team to be the more likely.
Stand-out issues: higher than expected start-up losses, and the viability of pivot irrigation. At the time of the evaluation mission, the farm had been in operation for four years and each year the start-up losses were higher than planned in the Investment Committee (IC) document. The Earnings Before Income Tax, Depreciation and Amortisation (EBITA) loss at farm level for 2012 was 2.5 times higher than the amount contained in the IC document. This meant that the value of shareholders’ equity at October 2012 would be only $11-$11.5 million (subject to finalisation of the 2012 accounts). This amount is approximately half of what had been projected in the IC document, the other half having been consumed by the higher-than-planned losses. Agrica have advised that these higher than expected start-up losses will not require an additional injection of capital to make up the shortfall, but will be offset by a lower than (originally) planned investment in the planned irrigation system.
The main reason that start-up losses exceeded planned losses was that actual yields fell short of expected yields (e.g. 2.9 vs. 3.0 t/ha respectively in 2012 − a particularly problematic season). This was due to a variety of factors, the main ones being erratic rainfall patterns, new pests, and diseases. In addition, there was ongoing experimentation with different seed varieties and fertiliser combinations, and optimum combinations were still somewhat elusive. Therefore, expected average yields had, by and large, not been attained, and were still some way off the 3.5 t/ha reflected in current revised budgets and the 4 t/ha that forms the basis of IC financial projections in later years.
The profitability of the entire farm and the investment is wholly dependent on 60% of the farm (3,000 ha) being irrigated, which provided two rice crops per year, plus a legume crop. However, because the expected irrigation yields had not yet been attained during the trials undertaken, and because the forthcoming irrigation investment is so large ($20 million), a decision has been taken to defer the irrigation investment for a year, or until the required yields are achieved. Management remained confident that the yield issue would be resolved, but nevertheless rated the risk of having to change the irrigation plans as “medium”. In the meantime, the deferment has created a degree of uncertainty, meaning that losses will be incurrred for at least an additional year.
The programme was about to require a large injection of fresh capital, in line with its updated financial projections. This comprised $15 million more share capital and $27 million in long-term loans to fund the irrigation investment, the completion of the hydro power investment, additional capital equipment, and the higher-than-expected operating losses (past and future). Although various potential investors and lending institutions had been approached, no commitments had yet been secured. Capricorn, the primary investor in Agrica, had, however, given an undertaking to other shareholders that, if the capital could not be raised externally (a risk rated as ‘medium’), they would step in to

Evaluation of Norwegian support to agriculture and food security 91
provide up to $37 million of the $42 million funding required, leaving the other shareholders, in effect, to make up the $5m balance. Capricorn has recently provided $ 8m and Norfund has agreed to invest an additional $2m, both in convertible bridge financing.
Revised financial projections had been prepared showing that the farm should start earning reasonable profits in 2016, and that, by 2017, full production of 49,000 tonnes should be reached, earning a reasonable return on the capital invested by investors, if the planned profits are indeed achieved. However, this is dependent on irrigated land producing 7t/ha and rain-fed land 3.75 t/ha. Neither of these average yields had yet been achieved, but they remain probable after more research and trials are conducted, and lessons are progressively learnt.
Agrica data on yields achieved, provided by smallholders, shows that an average of 3.6t/ha was ‘officially’ achieved in 2012. However the evaluator was advised by farm officials that the smallholder actual yields were likely to be significantly higher than 3.6t/ha, as smallholders’ repayment of their loans was tied to their size of harvest, that is, a lower yield leads to a lower repayment. Note also that 2012 was a low yield year due to poor rains and high incidence of wood borer pests. Anecdotal information provided by farm officials indicates that good and competent smallholder farmers practising the System of Rice Intensification (the SRISH scheme) for more than one year were actually achieving yields of high-quality rice of 4-8+ tonnes per ha.
This well exceeded the 2.9 tonnes average per ha that the large-scale commercial (LSC) rain-fed plantation47 produced, and its quality was significantly higher. In addition, the nature and source of input costs was different. While LSC major inputs were machines, fuels, fertilisers and chemicals (benefits accrue to overseas economies), SRISH inputs were substantially local labour, benefiting the local Tanzanian economy, although some limited external inputs are also required. Added to this was the crucial subsequent “x3 multiplier impact” on the economy. These two factors combined to provide what could turn out to be a resounding win/win proposition for shareholders, growers and the Tanzanian economy − namely, gradually to lease out an increasing number of blocks of the 2,000 ha rain-fed crop to selected SRISH groups, provided that pilot schemes prove the concept is viable and attractive48.
A rough assessment was conducted by the evaluation team of the potential additional profit that could be generated if all 2,000 ha were to be leased to SRISH and no lease fee is charged, as shown in the table below. Assuming that all related factors remain constant, the analysis shows that a leasing out arrangement could generate an additional $785,000 in profit for shareholders –
47 Compared to large-scale commercial farming methods, SRISH growers achieve considerably higher yields because they have much more flexibility in applying all the processes involved in rice farming (especially with regard to planting only after rains established), and can apply the husbandry requirements more precisely and effectively.
48 It is well understood that a leasing out arrangement to groups of competent smallholders would face a multiplicity of challenges. However, the potential upside is enormous and may well be worth a concerted effort being made, albeit starting with a pilot programme.
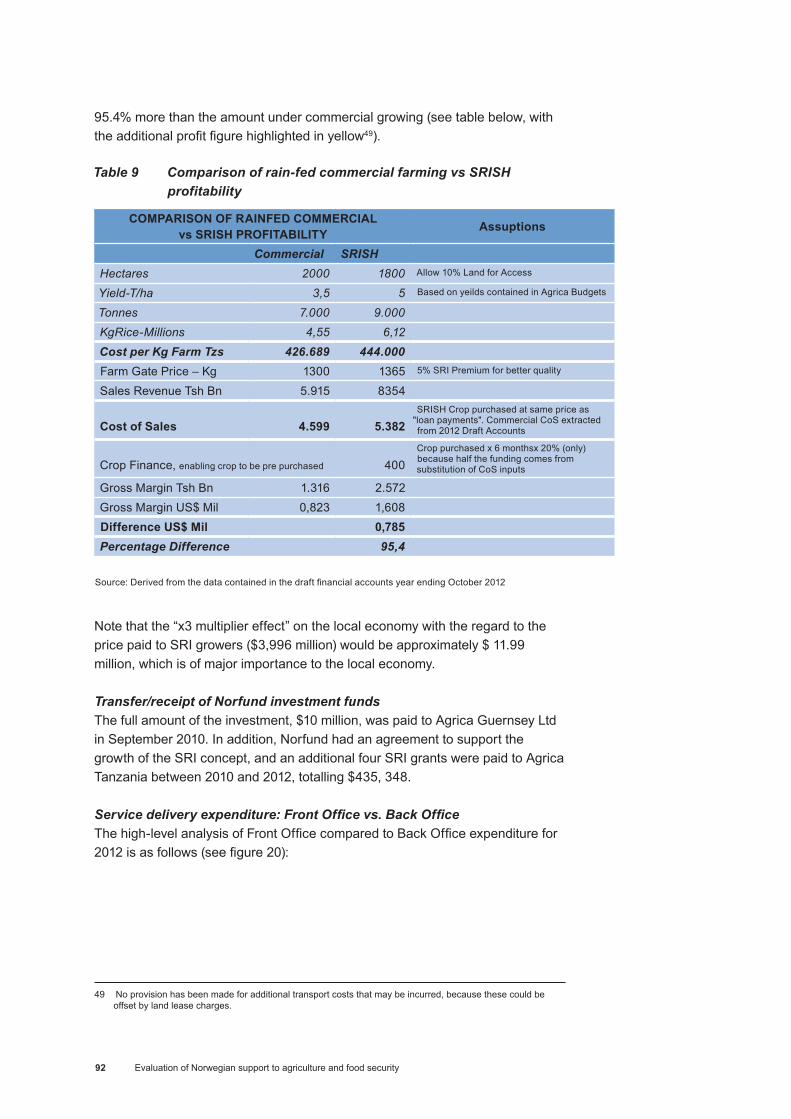
Evaluation of Norwegian support to agriculture and food security92
95.4% more than the amount under commercial growing (see table below, with the additional profit figure highlighted in yellow49).
Table 9 Comparison of rain-fed commercial farming vs SRISH profitability
COMPARISON OF RAINFED COMMERCIAL vs SRISH PROFITABILITY Assuptions
Commercial SRISHHectares 2000 1800 Allow 10% Land for Access
Yield-T/ha 3,5 5 Based on yeilds contained in Agrica Budgets
Tonnes 7.000 9.000KgRice-Millions 4,55 6,12Cost per Kg Farm Tzs 426.689 444.000Farm Gate Price – Kg 1300 1365 5% SRI Premium for better quality
Sales Revenue Tsh Bn 5.915 8354
Cost of Sales 4.599 5.382SRISH Crop purchased at same price as
"loan payments". Commercial CoS extracted from 2012 Draft Accounts
Crop Finance, enabling crop to be pre purchased 400Crop purchased x 6 monthsx 20% (only) because half the funding comes from substitution of CoS inputs
Gross Margin Tsh Bn 1.316 2.572Gross Margin US$ Mil 0,823 1,608Difference US$ Mil 0,785Percentage Difference 95,4
Source: Derived from the data contained in the draft financial accounts year ending October 2012
Note that the “x3 multiplier effect” on the local economy with the regard to the price paid to SRI growers ($3,996 million) would be approximately $ 11.99 million, which is of major importance to the local economy.
Transfer/receipt of Norfund investment fundsThe full amount of the investment, $10 million, was paid to Agrica Guernsey Ltd in September 2010. In addition, Norfund had an agreement to support the growth of the SRI concept, and an additional four SRI grants were paid to Agrica Tanzania between 2010 and 2012, totalling $435, 348.
Service delivery expenditure: Front Office vs. Back OfficeThe high-level analysis of Front Office compared to Back Office expenditure for 2012 is as follows (see figure 20):
49 No provision has been made for additional transport costs that may be incurred, because these could be offset by land lease charges.
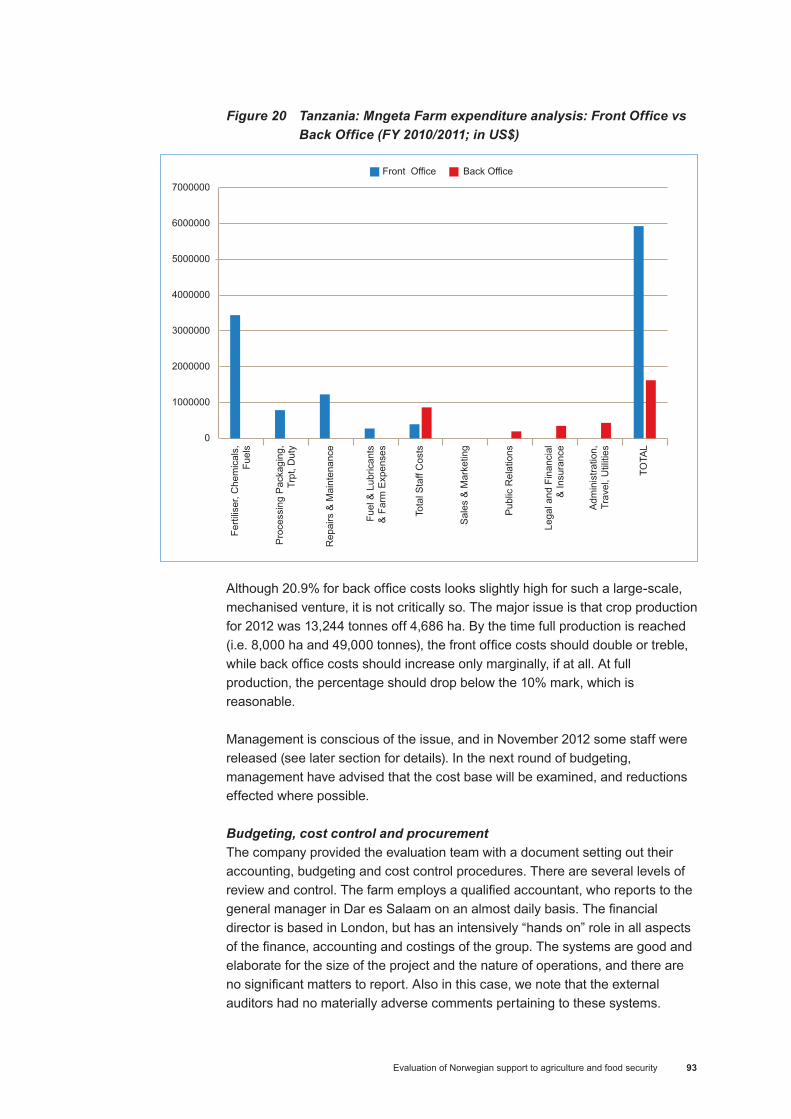
Evaluation of Norwegian support to agriculture and food security 93
Figure 20 Tanzania: Mngeta Farm expenditure analysis: Front Office vs Back Office (FY 2010/2011; in US$)
Although 20.9% for back office costs looks slightly high for such a large-scale, mechanised venture, it is not critically so. The major issue is that crop production for 2012 was 13,244 tonnes off 4,686 ha. By the time full production is reached (i.e. 8,000 ha and 49,000 tonnes), the front office costs should double or treble, while back office costs should increase only marginally, if at all. At full production, the percentage should drop below the 10% mark, which is reasonable.
Management is conscious of the issue, and in November 2012 some staff were released (see later section for details). In the next round of budgeting, management have advised that the cost base will be examined, and reductions effected where possible.
Budgeting, cost control and procurement The company provided the evaluation team with a document setting out their accounting, budgeting and cost control procedures. There are several levels of review and control. The farm employs a qualified accountant, who reports to the general manager in Dar es Salaam on an almost daily basis. The financial director is based in London, but has an intensively “hands on” role in all aspects of the finance, accounting and costings of the group. The systems are good and elaborate for the size of the project and the nature of operations, and there are no significant matters to report. Also in this case, we note that the external auditors had no materially adverse comments pertaining to these systems.
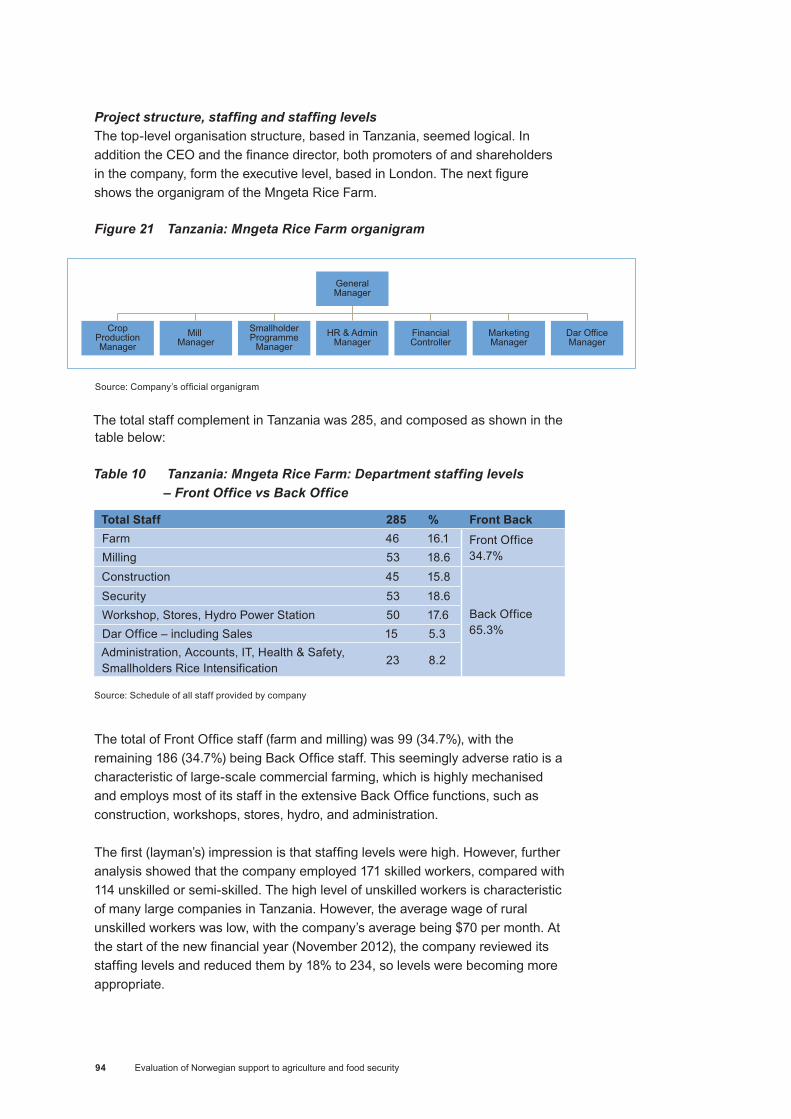
Evaluation of Norwegian support to agriculture and food security94
Project structure, staffing and staffing levelsThe top-level organisation structure, based in Tanzania, seemed logical. In addition the CEO and the finance director, both promoters of and shareholders in the company, form the executive level, based in London. The next figure shows the organigram of the Mngeta Rice Farm.
Figure 21 Tanzania: Mngeta Rice Farm organigram
Source: Company’s official organigram The total staff complement in Tanzania was 285, and composed as shown in the table below:
Table 10 Tanzania: Mngeta Rice Farm: Department staffing levels – Front Office vs Back Office
Total Staff 285 % Front BackFarm 46 16.1 Front Office
34.7%Milling 53 18.6Construction 45 15.8
Back Office65.3%
Security 53 18.6Workshop, Stores, Hydro Power Station 50 17.6Dar Office – including Sales 15 5.3Administration, Accounts, IT, Health & Safety, Smallholders Rice Intensification
23 8.2
Source: Schedule of all staff provided by company
The total of Front Office staff (farm and milling) was 99 (34.7%), with the remaining 186 (34.7%) being Back Office staff. This seemingly adverse ratio is a characteristic of large-scale commercial farming, which is highly mechanised and employs most of its staff in the extensive Back Office functions, such as construction, workshops, stores, hydro, and administration.
The first (layman’s) impression is that staffing levels were high. However, further analysis showed that the company employed 171 skilled workers, compared with 114 unskilled or semi-skilled. The high level of unskilled workers is characteristic of many large companies in Tanzania. However, the average wage of rural unskilled workers was low, with the company’s average being $70 per month. At the start of the new financial year (November 2012), the company reviewed its staffing levels and reduced them by 18% to 234, so levels were becoming more appropriate.
Evaluation of Norwegian support to agriculture and food security 95
Outputs produced and operations managementOverall, the farm is extensively organised, with diligent planning, execution and monitoring of all the farming processes. However, commercial-scale rice farming in Tanzania, using overhead pivot-based irrigation, is relatively new and complex, and considerable research and development is still required to raise yields to anticipated levels (see box below). Box 4 Tanzania: Mngeta Rice Farm: Organisation of farming operations
The farm was organised into 227 “blocks” of 25 ha, managed by a crop production manager, with support from a field manager and four section heads. Software had been developed and installed to manage all operations on each block, including land preparation, planting, fertilising, weeding, chemical application, harvesting, moisture, yields. The data recording for each function was extensive.
Production managers and farm managers meet late every afternoon to determine the following day’s activities, re-programme as necessary, and take remedial action where needed. In the planting and harvesting season, the machinery and staff work in shifts around the clock.
Research, development and trials are continuously running, in order to test seed varieties, fertiliser combinations and quantities, and optimum planting density.
Irrigation is organised into 5 ha trial plots, which are planted/harvested at two-week intervals, when results are examined. There is a continuous learning of lessons, and extensive data is stored throughout the system. However, the knowledge gained is apparently not being formally documented in a compact and easily digestible form, possibly a best practice document, creating a risk should the current management leave service.
As a Primary Output, in 2011/2012 the company produced 13,244 tonnes off 4,686 ha 50 − an average yield of 2.83 t/ha, compared to the revised budget of 3.5t/ha and the IC document of 3.0t/ha. This, together with slight price variations on budget, meant that revenue was 21% below the IC document projections, and this variance carried through to the bottom-line profit. The adverse yields were caused mainly by two unusual and prolonged dry spells in the rainy season, plus an infestation of wood borer, a pest that caused significant damage51.
Formal crop reports are issued by the crop production manager in early, mid, and late season.
Management has been experiencing several problematic issues with the milling processes, and is not fully satisfied with the “mill out ratio” (the output weight of milled rice, as a percentage of the input weight of raw harvested rice). At the time of the farm visit, an international rice milling specialist was being contracted to review the efficiency of the milling processes and the plant.
The Secondary output from the programme was the System of Rice50 51 Intensification for Smallholders scheme (SRISH), which had inducted and trained 1,615 farmers from 2010 to 2012. A further 2,700 were being trained in 2013, with the eventual target being the training of 5,000 farmers by 2015. The intention (and the evidence to date) is that these farmers increase their yields by
50 Slightly different figures were recorded in various sources, but the differences were not significant and will have no impact on this report.
51 One of the significant risks of an irrigated crop is that a vast green plantation growing in the middle of otherwise dry winter landscape is reputed to be a food magnet for pests.
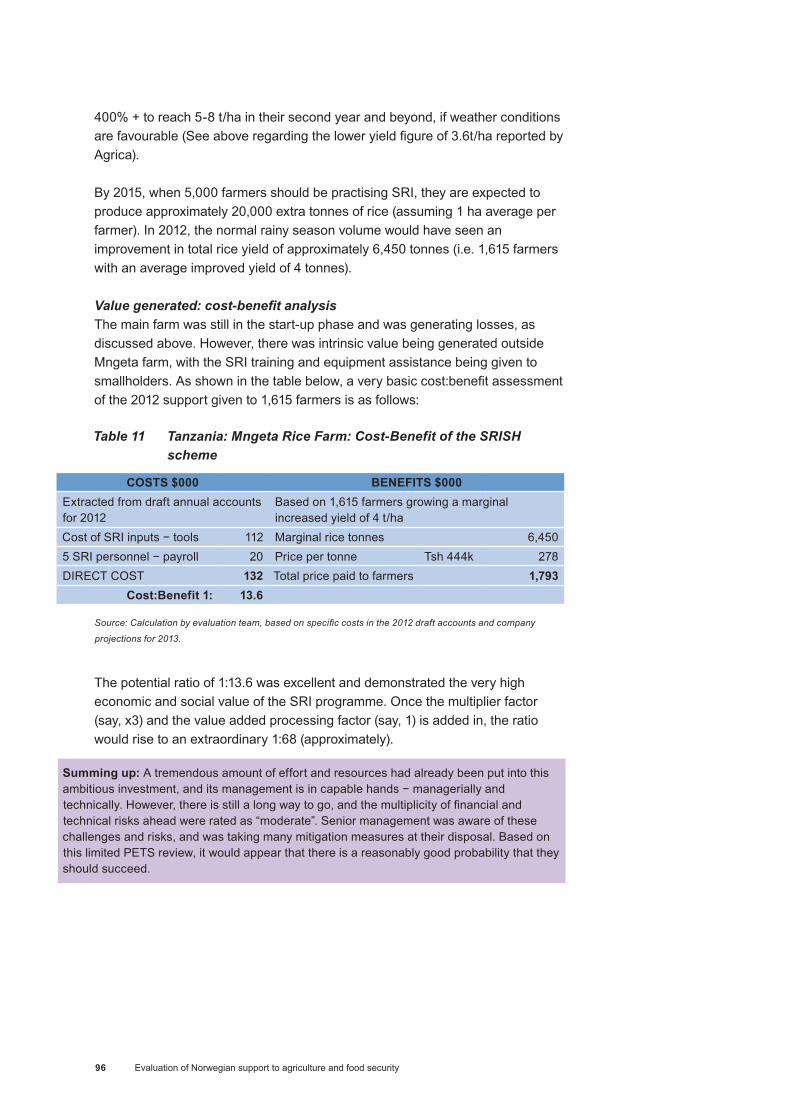
Evaluation of Norwegian support to agriculture and food security96
400% + to reach 5-8 t/ha in their second year and beyond, if weather conditions are favourable (See above regarding the lower yield figure of 3.6t/ha reported by Agrica).
By 2015, when 5,000 farmers should be practising SRI, they are expected to produce approximately 20,000 extra tonnes of rice (assuming 1 ha average per farmer). In 2012, the normal rainy season volume would have seen an improvement in total rice yield of approximately 6,450 tonnes (i.e. 1,615 farmers with an average improved yield of 4 tonnes).
Value generated: cost-benefit analysis The main farm was still in the start-up phase and was generating losses, as discussed above. However, there was intrinsic value being generated outside Mngeta farm, with the SRI training and equipment assistance being given to smallholders. As shown in the table below, a very basic cost:benefit assessment of the 2012 support given to 1,615 farmers is as follows:
Table 11 Tanzania: Mngeta Rice Farm: Cost-Benefit of the SRISH scheme
COSTS $000 BENEFITS $000Extracted from draft annual accounts for 2012
Based on 1,615 farmers growing a marginal increased yield of 4 t/ha
Cost of SRI inputs − tools 112 Marginal rice tonnes 6,4505 SRI personnel − payroll 20 Price per tonne Tsh 444k 278DIRECT COST 132 Total price paid to farmers 1,793
Cost:Benefit 1: 13.6
Source: Calculation by evaluation team, based on specific costs in the 2012 draft accounts and company
projections for 2013.
The potential ratio of 1:13.6 was excellent and demonstrated the very high economic and social value of the SRI programme. Once the multiplier factor (say, x3) and the value added processing factor (say, 1) is added in, the ratio would rise to an extraordinary 1:68 (approximately).
Summing up: A tremendous amount of effort and resources had already been put into this ambitious investment, and its management is in capable hands − managerially and technically. However, there is still a long way to go, and the multiplicity of financial and technical risks ahead were rated as “moderate”. Senior management was aware of these challenges and risks, and was taking many mitigation measures at their disposal. Based on this limited PETS review, it would appear that there is a reasonably good probability that they should succeed.

Evaluation of Norwegian support to agriculture and food security 97
5. Conclusions and recommendations In this chapter, overall conclusions and recommendations are drawn, based on the 25 programmes selected under the three clusters: 1) contribution to food security; 2) monitoring and evaluation (M&E) and documentation; and 3) sustainability and scaling-up. The previously mentioned challenge of external validity (due to the relatively limited number of programmes within each sub-category and the diverse nature of these) should again be emphasised, in particular with regard to regional and global programmes.
In the case of the financial analysis (Cluster 4), three programmes were analysed in more depth. With regard to these three programmes, conclusions and recommendations focus at programme level, and will be presented in a separate section.
5.1 Overall Conclusions (Clusters 1-3)
Strong focus on country-level interventions considered positive and likely to contribute most to food security During the period 2005-2011, 75% of the bilateral aid to agriculture was channelled directly to country-level interventions. The main actor at country level was the Norwegian embassies, which administered 49% of the bilateral funds to agriculture in 2005-2011. The strong Norwegian focus on country-level interventions (as compared to regional and global) was considered positive. The analysis of the selected programmes showed that, overall, this type of intervention was more likely to contribute directly to food security and was, to a greater extent than regional-level interventions, co-ordinated and aligned with the national policy framework of the targeted countries. Norwegian agricultural programme portfolio was highly relevant and well-designed for contributing to food security in the targeted countriesThe evaluation team found that the assessed Norwegian agricultural programme portfolio was highly relevant and had high potential in terms of contributing to food security in the targeted countries. Due to its strong focus on small-holders, sustainable agriculture (in particular, conservation agriculture) and climate change adaptation (mainly of small-holder farmers and pastoralists), the Norwegian support to agriculture was found to be well-designed to contribute directly to household food security.

Evaluation of Norwegian support to agriculture and food security98
Evidence of actual contribution to food security could be established in only a few cases due to lack of systematic measuringWith regard to increased food availability, the majority of assessed programmes could provide evidence of contribution to increased food production. This was, however, not the case with regard to food accessibility (defined as the number of meals per day), even for programmes that had a food security objective. Due to the strong focus of the supported programmes on livelihood security and livelihood diversification, there was slightly more documentation of improved food stability (defined as, for example, livelihood resilience, decreased length of lean period). Lastly, the food utilisation aspect of food security was rarely integrated into food security and agricultural programmes, let alone measured. Overall, Norwegian-supported programmes were found to make limited contribution to nutrition security.
Despite the fact that the design and programme theories of the Norwegian-supported programmes pointed towards a significant contribution to food security in the targeted countries, evidence for this was largely missing. Monitoring and evaluation (M&E) reporting, particularly on outcomes and impact, was generally poor for many programmes, which resulted in weak evidence of results. This was mainly related to the lack of baseline and follow-up surveys. The surveys that had been conducted were often based on inappropriate indicators, or food security indicators were simply missing. Insufficient focus on nutrition security in relation to agriculture and livelihood programmes was a problem across almost all programmes.
Limited collaboration between extending agencies, both centrally (Norway) and at country level, limited impact on the ground Norwegian aid to agriculture and environment 2005-2011 was disbursed to Norad, MFA, FK Norway, Norfund and the embassies. The evaluation team found limited collaboration between, and co-ordination of, the various extending agencies. This was the case both at central level (Norway) and at country level. As a result, the same types of programmes were funded by different agencies (e.g. in the case of conservation agriculture), yet, there appeared to be no experience sharing, and therefore limited synergies. Being the main actor at national level, the embassies could have played a more central role with regard to collaboration between Norwegian-supported programmes, although one constraint might have been the relatively limited human resources at embassy level (as also noted by the embassies in the online survey conducted). There appears to be a need for a co-ordination framework on a more operational level.
Insufficient focus on nutrition security in agriculture and livelihood programmes prevailed The evaluation revealed an insufficient focus on the nutritional aspects of agriculture and livelihoods in most programmes. Several programmes were likely to contribute to enhanced nutritional status, but this was more by coincidence than by design, and was based on increased food intake rather than on dietary diversity. None of the evaluated projects had nutrition security as an objective, and only few programmes included activities focusing on improved nutrition (e.g.
Evaluation of Norwegian support to agriculture and food security 99
in the form of promoting an adequate diet). In the case of conservation agriculture programmes, even if designed to promote crop diversification replacing mono-cropping, this was not always reflected in the actual production (e.g. CASPP). Moreover, Norwegian support had limited focus on the aspect of awareness raising in relation to the importance of using high-value crops (vegetable/fruits) and livestock products for home consumption to have a positive impact on nutrition (rather than only for marketing).
Strategic focus of the 2004 Plan of Action for Agriculture relating to the right to adequate food and living, as well as gender and women rights, was not well reflected in the programmes All programmes assessed applied a needs-based approach, rather than a rights-based one, and there appeared to be relatively limited focus on activities related to poor people’s rights to land and water or advocacy work for more poverty-oriented agricultural development (except in UNCCD, the DF pastoralist programme in Ethiopia). The 2004 Action Plan also included a strong focus on gender, defined as women’s rights and participation in agricultural development. Even if many programmes included activities focusing on women, only two programmes (DF in Malawi, and Messanu in Ethiopia) explicitly focused on women’s participation in agriculture at objective and results level. Overall, the evaluation revealed that most programmes had limited focus on women’s ownership and heritage rights, their role in agriculture, and intra-household relations (including gender equity).
Scaling-up and multiplication strategies were not always well elaborated Despite the fact that scaling-up and multiplication of new methods − such as through the lead farmer and follow farmer approach (e.g. in conservation agriculture) or pilot projects or demonstration farms (e.g. EPINAV or CCIAM) − was an inherent part of many programmes, in many cases, the strategy for multiplication was not well-elaborated. Usually, the adoption of new methods was expected to take place more or less automatically, and there was generally poor monitoring of the adopters, both in terms of the number of follow farmers and the adoption rate of new methods. In many cases, no clear definition of a “follow farmer” existed.
Considerable number of interventions had poor monitoring and evaluation (M&E) systems, including logical frameworks, and lacked financial and human resources to ensure good monitoring and evaluationThe degree of efficiency of M&E systems for Norwegian-funded programmes varied widely. However, overall, ineffective M&E systems were linked to the absence or bad design of, logframes, especially missing SMART indicators. When an M&E strategy was devised, implementation and monitoring were highly dependent on the level of allocated resources. In addition, the lack of baseline and end-of-programme surveys in many cases constrained the analysis of the programme contribution to food security (as noted above) and an assessment of the achievement of programme objectives, whether or not an operational M&E system was in place. Ineffective M&E systems were often the result of a
Evaluation of Norwegian support to agriculture and food security100
mismatch between allocated resources and the functions assigned to them. In some cases, there were no provisions at all for collecting programme data.
Effective communication and dissemination of the programmes’ activities and achievements depended highly on the availability of financial resources Effective dissemination strategies were set up for many interventions. Mass media was often used, but no assessments were made as to whether these strategies were cost-effective and actually reaching their goals. Activities related to dissemination and communication were systematically the first to suffer from budget cuts. This had serious implications for programmes focused on research, and for which dissemination of research results was an objective in itself. Economic and financial sustainability was not sufficiently ensured for the main part of programmesFinancial and economic sustainability of institutions and results was not sufficiently taken into account by project stakeholders. Therefore, sustainability was not ensured for several programmes − in particular, for programmes including infrastructure components. Subsidies and hand-outs did not ensure the sustainability of results, as the implementing partner needed support from donors to continue operations. Subsidies and hand-outs also created dependency of beneficiaries.
Scaling-up proved to be low priority in programmes Too often, scaling-up was considered an activity only after the implementation, and therefore not part of the intervention. Overall, scaling-up results proved to be a low priority in programmes, although, where it materialised, it substantially increased impact and made programmes more cost efficient.
5.2 Conclusions for Cluster 4 (Financial analysis)
The three assessed programmes (CAP I in Zambia, NASFAM in Malawi, and Mngeta Rice Farm in Tanzania) proved to be well organised and managed, including good systems of accounting, control and reporting, and sufficient human and financial resources. However, each of them had significant issues, including:
� CAP I, Zambia, appeared to have far fewer CF adopters and less land under CF than reported in the documents. Its M&E arrangements, while providing a wealth of data, were not optimally organised, and the money granted to two of its “partners” was not producing the desired outputs.
� NASFAM, Malawi, will need to be financed by development partners for eight years or more, due to the fact that NASCOMEX’s profitability (to fund NASFAM) is constrained by insufficient crop finance from the banks, or from its own retained profits. This means NASFAM can buy only a small proportion of members’ crops, and their trading volumes are limited. In addition, their membership is declining for a variety of reasons, and the numbers of back office staff appears slightly on the high side.

Evaluation of Norwegian support to agriculture and food security 101
� Mngeta Rice Farm, Tanzania, had not yet succeeded in attaining its expected yields in either the rain-fed or the irrigated sections of the farm. This led to larger start-up losses, and therefore to higher funding requirements than anticipated, causing the major irrigation investment to be postponed. Until the yield issues are resolved, there is an element of risk (described by management as “moderate”), which could result in a major reduction to the scale of operations, investment and expected returns.
Despite the above, the direct cost:benefit ratios ranged from “adequate” (NASFAM) to “good” (CAP I), to “excellent” for the Mngeta farm’s SRISH scheme (not its commercial operations), and the wider economic benefits were very good. All this indicates that the related finances were well spent, and enabled ordinary citizens living in poverty to improve substantially their livelihoods, incomes, and food security.
5.3 Overall recommendations (Clusters 1-3)
Towards the end of 2012, a new food security strategy was launched: “Matsikkerhet i et Klimaperspektiv ” (Food Security in a Climate Perspective). One of its core elements is climate-adapted agriculture for small-holders in Africa, as poor small-holders are particularly vulnerable to the effects of climate changes. The strong focus on rights found in the 2004 Plan of Action has been further enforced in the new strategy, which has a stronger focus on women’s rights, climate smart agriculture, and nutrition.
“Climate Smart Agriculture” (e.g. conservation agriculture) remains a core component in Norwegian support to agriculture and food security. Nutrition is mentioned as an aspect of food security, but the main partner referred to in this area is the World Health Organisation (WHO), and the aspect of nutritional security will therefore not necessarily be integrated into agriculture, livelihood and climate change programmes. With regard to gender, the strategy argues for better gender equity as a precondition for a successful implementation of climate-adapted agriculture and increasing productivity and reduced poverty, as women have an important role in agriculture. The principle is that gender must be mainstreamed in agricultural policy.
To a large extent, the new strategy can be considered a continuation of the 2004 Plan of Action and the work on climate (e.g. in relation to White Paper 14), but with a sharper focus on international collaboration and climate smart agriculture, gender, and rights52. The risk is that unless practical guidance on how to operationalise these aspects in agricultural programmes is developed and disseminated to the implementing partners, the strategy will remain a declaration of intent rather than an effective contribution to the fulfilment of the universal right to food. Thus, unless the previously mentioned shortcomings of the
52 At the international level, the new strategy includes continued support to global collaboration − for instance, among the three Rome-based agencies, IFAD, WFP and FAO. As the current evaluation focuses on bilateral aid only, this collaboration will not be further elaborated here.
Evaluation of Norwegian support to agriculture and food security102
Norwegian-supported programmes are addressed, the new strategy might not prove successful.
The following measures are recommended:
Contribution to food security 1. A higher level of co-ordination and experience sharing of Norwegian-
supported aid should be ensured. It is recommended that MFA plays a more active role as co-ordinator and harmoniser of development aid across the various extending agencies (MFA, embassies, FK Norway, Norfund, and Norad).
2. Co-ordination of Norwegian-supported programmes at country level should be strengthened, regardless of the funding modality. It is recommended that the embassies be assigned the role as co-ordinating body, and that an annual country plan is prepared for the main recipient countries.
With a view to improving the operationalising of the new Food Security Strategy, MFA should ensure the preparation of the strategies and guidelines listed below, and their dissemination to Norwegian extending agencies and implementing partners. Where possible and relevant, the introduction of guidelines should be accompanied by training for the main relevant stakeholders, both in Norway and in partner countries.
1. Strategy and a manual for operationalising rights in development work, including in agriculture and food security. These could include guidance on how to apply a Rights-Based Approach.
2. Strategy and a manual on gender and climate-smart agriculture. An analysis of women’s role in agriculture − including the gendered division of labour, right of disposal (e.g. of crops or livestock) and division of labour − and how to operationalise these aspects should be part of the manual.
3. Strategy and a manual on the nutritional aspect of food security and agricultural interventions, in order to assure nutrition security as an integrated part of food security.
4. Compile and incorporate lessons learned and best practices in relation to conservation agriculture (CA). CA is a flagship of Norwegian support to agriculture in Southern and Eastern Africa, so it is crucial to compile lessons learned and best practices in order to further develop the concept ensuring an appropriate strategy for adoption by follow farmers, and for a proper reporting system.

Evaluation of Norwegian support to agriculture and food security 103
Monitoring & evaluation (M&E) With a view to achieving improved M&E systems, the following actions are recommended for all extending agencies (excluding Norfund):
1. A common template for proposals should be jointly prepared by the extending agencies (under the guidance of MFA). It should include a template for logical framework, and these should be as simple as possible, with indicators that are Specific, Measurable, Achievable, Relevant, and Time bound (SMART). The design of a logframe should be based on a situation and problem analysis.
2. In accordance with the template, the proposal should include a plan for monitoring and evaluation. An operational M&E system will require human and financial means, whether or not an existing system is already in place within the implementing institution. A specific budget should be allocated for routinely monitoring and evaluating programmes and projects.
The following process is proposed after the approval of a proposal:
1. The agreement partner should be given e.g. two months to prepare an inception report, during which the logframe and proposal will be revised if required. In addition, a plan (including a questionnaire) for the baseline survey and end-of programme surveys should be prepared. The inception report is required as changes often occur between the time of the preparation of the proposal and its approval, and there might be a need to revise the logframe or fine-tune resource allocation. If this is not done, there is a risk that the programmes will have to rely on poor logframes, thereby jeopardising the implementation and monitoring of the programmes, or necessitating a logframe revision at a later stage.
2. After approval of the inception report, the project should be launched and the baseline survey should be conducted.
3. M&E systems should include collection of gender-disaggregated data.
4. M&E systems should ensure that communication activities are assessed as part of routine monitoring activities.
5. M&E systems should ensure that relevant environmental data is being collected.
6. As all these suggested efforts for strengthening M&E systems are substantial, it is recommended that a working group − composed of representatives from all extending agencies and some implementing partners − is created for co-ordinating the process. Preparation of strategies and guidelines should be accompanied by additional assistance (e.g. in the form of training and online courses).
Evaluation of Norwegian support to agriculture and food security104
Sustainability and scaling-upGiven the observed shortcomings in relation to sustainability and scaling-up, the extending agencies (excluding Norfund) should ensure the following:
1. Overall financial and economic sustainability of programme results should be systematically reviewed at programme formulation stage, and budget provisions should be made to secure sustainability, especially for programmes that include infrastructure components. Ownership should be clarified and a financial scheme prepared before phasing out of this type of interventions.
2. For public-private partnerships, extending agencies should, prior to support, analyse the modus operandi of these institutions and ensure that linkages between the private and public sectors are balanced and not exclusively driven by one stakeholder.
3. An exit strategy should be devised by the time each programme starts. This inevitably requires financial resources and technical input from programme staff so that results are disseminated, adopted, and activities continued by the end of the programme through relevant local stakeholders.
4. Environmental impact assessment of programmes through quantitative methods, wherever relevant, should be adopted at formulation stage and integrated within the M&E system.
5. At programme formulation stage, a scaling-up approach that covers methodology, means, capacity building of staff and monitoring should be considered to ensure a multiplication effect (wherever relevant).
Financial analysisCAP I, Zambia
1. A review should be undertaken by the Conservation Farming Unit (CFU) to establish whether the law of diminishing returns is reducing the number of “new adopters” in jurisdictions where the programme has been running for several years. Consideration should then be given to gradually taking conservation farming into new areas, and reallocating resources accordingly. Apparently, this issue has been addressed in CAP II, the successor programme.
2. The CFU should set up its own internal M&E function at Head Office, which should then complete and implement the Data Management System. This system should make provision for a full census of adopters, hectares planted, crops and yields, and be fully maintained, including recording new adopters annually.
Evaluation of Norwegian support to agriculture and food security 105
3. Relationships with the Ministry of Agriculture and Livestock (and their funding partner, the EU) and FAO should be strengthened, with more attention given to achieving closer collaboration.
National Association of Smallholder Farmers Malawi (NASFAM) project, Malawi
1. NASFAM, and its Development Partners, should consider options to increase substantially the amount of crop finance available to the National Smallholders Commodity Exchange (NASCOMEX), including the possible role of Development Finance Institutions.
2. NASFAM should review the non-core services provided, as well as the number of back office staff employed, and then allocate a higher proportion of budget (say, 30%) into Extension Services, so as to: 1) double the number of Field Extension Officers; and 2) increase the number of lead farmers and review their incentives. Thereafter, NASFAM should refocus the thrust of the extension services, and become a market leader in Conservation Farming.
3. NASFAM should conduct a feasibility study of adopting Mobile Money to optimise services to members to:
a. Make crop purchase payments. b. Create crop collection schedules, and/or enable more buying points to
be created. c. Launch a member loyalty programme, whereby members can be
granted “bonuses” as a reward for reaching selling value benchmarks.This will assist in attracting large numbers of new members, increase trading volumes and profitability, and provide scope to offer better prices for members.
4. NASFAM should consider the level of communication and co-ordination with the Department of Extension in the Ministry of Agriculture, and develop closer relationships.
5. NASFAM management should review the M&E Performance Framework, with a view to rationalising the number of Key Result Areas (20) and the Performance Indicators (83).
Mngeta Rice Farm, Tanzania 1. A pilot programme should be set up by the farm management to test the
viability of leasing out of the rain-fed portion of the rice farm to the smallholder farmers involved in the System of Rice Intensification (SRI) programme. The case is a strong one, and could create a resounding win/win situation for shareholders’ profitability, SRI farmers’ prosperity, Tanzania’s economic development, and Agrica’s international profile.
2. Lessons learned on improving rice agronomy, under both irrigated and rain-fed conditions at Mngeta, should be formally documented by the crop production manager, and thereafter updated.

Evaluation of Norwegian support to agriculture and food security106


Evaluation of Norwegian support to agriculture and food security108
Terms of Reference
Evaluation of the contribution of Norway’s bilateral agricultural support to food security
1. Background, rationale
Agriculture is a vital development tool for achieving the Millennium Development Goal that calls for halving by 2015 the share of people suffering from extreme poverty and hunger. (…) Three out of every four poor people in developing countries live in rural areas, and most of them depend directly or indirectly on agriculture for their livelihoods.1
Many areas of agriculture and related services contribute to food security, including efforts connected to policy development, research and extension services, nutritional quality, wastage, non-farm development, value chain development, market reforms, price volatility, emergency preparedness, financial services, land security, and markets for rental or sharecropping.
Food security was one of the eight priority areas in the Norwegian government’s action plan for agriculture in development (2004) – Fighting Poverty through Agriculture. Norwegian Plan of Action for Agriculture in Norwegian Development Policy. Other defined areas were also relevant for achieving food security: Policy and reforms for poverty-oriented agricultural development, women’s rights and participation, sustainable use of natural resources, basic services and poor people’s rights of use and properties, rights to land and water, education and research, and market development.
In 2004, agriculture and food production had received reduced attention in international and Norwegian development assistance for some years. The world’s food production had broadly kept pace with the population increase. Sub-Saharan Africa was the only development region where per capita food production had not risen during the last 30 years and was a priority in the plan. The right to food was as much a priority as increased food production. Other elements were continued participation in the Food and Agriculture Organisation
1 Agriculture for Development. World Development Report 2008 (Foreword). The World Bank 2007.
Evaluation of Norwegian support to agriculture and food security 109
of the United Nations (FAO) process of preparing guidelines for realising the right to food; technical and economic support to countries seeking to realise the right to food at the national level; untying of Norwegian food assistance by 2006 in order to use resources more effectively and support local and regional food production, e.g. substituting cash for food in kind; and continued restrictive position on genetically modified organisms and food.
Norway’s bilateral support to agriculture amounted to 2 976 million kroner during the seven years from 2005 to 2011, with and increase in support (Annex, Table 1) broadly in line with the increase of the general Norwegian aid budget2. Bilateral agricultural support represented approximately 2 % of total Norwegian funds for development assistance. Core funds to multilateral institutions engaged in agriculture are not included in this figure and not part of the evaluation.
The action plan may have lost some attention due to the change of government in 2005. Two reports to the parliament indicated the new centre-left government’s priorities. Climate, Conflict and Capital. Norwegian development policy adapting to change (Meld. St. 13 (2008-2009)) does not mention agriculture or food security. Towards greener development: On a coherent environmental and development policy (Meld. St. 14 (2010-11)), Chapter 5 Climate adaption reduces vulnerability discusses briefly several aspects of food security, with emphasis on genetic resources, water security and agriculture adapted to climate change.
Development assistance to agricultural development takes place against a background of agricultural subsidies in many donor countries. On average, 18 % of farm receipts in countries of the Organisation for Economic Co-operation and Development (OECD) come from governments subsidies. Measured in this way, Norway is the largest subsidiser of its domestic agriculture, with 60 % of farm receipts from subsidies. Trade barriers add to the difficulties developing countries face when trying to export to Norway.
The composition of the bilateral support is shown in the annexed Tables 1 to 4. Table 1 shows that agricultural development, agricultural policy and administrative management, and agricultural extension were the three largest subsectors under the OECD/Development Assistance Committee (DAC) Sector 311 Agriculture. Malawi and Zambia were the largest recipient countries, followed by Tanzania, Nicaragua and Mozambique. These five countries represented 46 % of the funds (Table 2). Table 3 shows that multilateral, local non-governmental and Norwegian non-governmental organisations were the three types of recipient organisations receiving most funds, representing 63 % of total funds. Table 4 lists the 26 agreement partners that received more than 30 million kroner, representing 77 % of total funds.
2 Official Norwegian aid statistics, Norad. Agriculture: DAC sector 311 agriculture.
Evaluation of Norwegian support to agriculture and food security110
Rationale Norwegian bilateral assistance to agriculture amounted to almost three billion kroner in the period 2005 to 2011. Food security is a main objective of some of this support, while it is an over-arching or indirect goal of many other programmes3. Food-security has regained attention in international development and is important in the discussion of new development goals after 2015. There are plans to increase the level of Norwegian support to agriculture and food security. No broad evaluation of Norwegian support to agriculture has been performed since the government’s action plan for agriculture in development was launched in 2004.
2. Purpose, Audience, Questions and Scope PurposeThe purpose of the evaluation is to assess to what extent Norwegian funds for agriculture have contributed to food security, with a view to get recommendations for future support.
AudienceThe institutions responsible for development cooperation in Norway are the primary audience for the evaluation. The evaluation should also provide useful knowledge for international audiences that increasingly see food security as a priority in development.
QuestionsTo achieve the purpose, the evaluation should assess to what extent:
1. Norwegian and international aid funds for agriculture have been additional to national funds, i.e. to what extent external funds have been used to replace national funds or finance other sectors
2. supported programmes are relevant for achieving food security, regardless of whether they have food security as an explicit objective or not
3. programme theories (rationale) of supported activities - explicitly or implicitly related to food security - are based on evidence and realistic
4. programmes have been designed to allow monitoring and evaluation, including breakdown on gender in order to know the inclusion of female farmers
5. programme results have been documented
6. programmes have reached or are likely to reach their goals with respect to food security
7. programmes are sustainable
3 The terms programme and project are used interchangeably in this document.
Evaluation of Norwegian support to agriculture and food security 111
8. programmes lend themselves to scaling-up
9. on-going programmes have been revised according to evidence emerging from within or outside the programmes during their execution
10. the funds reach income-poor farmers, women and other grassroots target groups
When answering the questions, information on gender and other groups should be included where possible.
ScopeQuestion 1Question 1 should be answered through a study of available data on international aid funds and public expenditure in Malawi, Zambia and Tanzania.
Question 10Question 10 should be answered through public expenditure tracking surveys4 of the largest project in each of the countries Malawi, Zambia and Tanzania. Deviation from this selection of projects needs to be well founded and approved by Norad.
Questions 2-9Questions 2-9 should be answered through the study of programmes meeting the following criteria specified under either DAC sector 311 Agriculture or DAC sector 410 General Environmental Protection:
DAC sector 311 Agriculture. Under all agreement partners that received 30 million kroner or more during the seven-year period 2005-2011: The largest programme used to finance agricultural activities specified by thematic or geographic area. Projects receiving less than five million kroner are excluded.
DAC Sector 410 General environmental protection: Projects with agricultural activities specified by thematic or geographic area, receiving more than five million kroner during the seven-year period 2005-11. Only the largest such project under each agreement partner is included.
3. Methods and data collection
The evaluation team shall adhere to OECD/DAC’s Evaluation Quality Standards, including its ethical standards. The team is responsible for obtaining necessary permissions to collect data in the countries.
It will be part of the assignment to develop a methodological framework to ensure objective, transparent, evidence-based and impartial assessments as well as ensuring learning during the course of the evaluation.
4 The web pages of the World Bank and other international development banks have information about Public Expenditure Tracking Surveys.
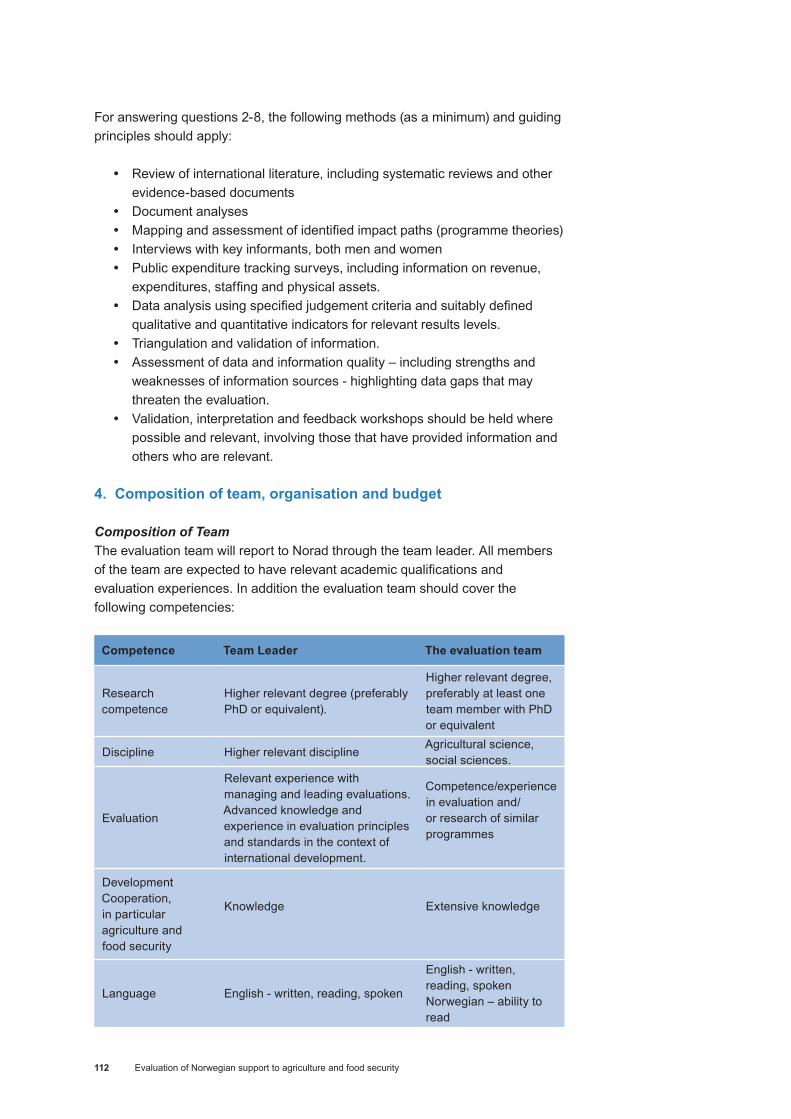
Evaluation of Norwegian support to agriculture and food security112
For answering questions 2-8, the following methods (as a minimum) and guiding principles should apply:
� Review of international literature, including systematic reviews and other evidence-based documents
� Document analyses � Mapping and assessment of identified impact paths (programme theories) � Interviews with key informants, both men and women � Public expenditure tracking surveys, including information on revenue,
expenditures, staffing and physical assets. � Data analysis using specified judgement criteria and suitably defined
qualitative and quantitative indicators for relevant results levels. � Triangulation and validation of information. � Assessment of data and information quality – including strengths and
weaknesses of information sources - highlighting data gaps that may threaten the evaluation.
� Validation, interpretation and feedback workshops should be held where possible and relevant, involving those that have provided information and others who are relevant.
4. Composition of team, organisation and budget Composition of TeamThe evaluation team will report to Norad through the team leader. All members of the team are expected to have relevant academic qualifications and evaluation experiences. In addition the evaluation team should cover the following competencies:
Competence Team Leader The evaluation team
Research competence
Higher relevant degree (preferably PhD or equivalent).
Higher relevant degree, preferably at least one team member with PhD or equivalent
Discipline Higher relevant disciplineAgricultural science, social sciences.
Evaluation
Relevant experience with managing and leading evaluations.Advanced knowledge and experience in evaluation principles and standards in the context of international development.
Competence/experience in evaluation and/or research of similar programmes
Development Cooperation, in particular agriculture and food security
Knowledge Extensive knowledge
Language English - written, reading, spoken
English - written, reading, spokenNorwegian – ability to read
Evaluation of Norwegian support to agriculture and food security 113
Quality assurance shall be provided by the company delivering the consultancy services, including a person that is external to the evaluation team. Further specifications for quality assurance is given in Part 3, Annex 1. Specifications for Preparing Technical Proposal.
The team will be responsible for collection of data. Access to archives and statistics will be facilitated by Norad.
OrganisationThe evaluation will be managed by Norad’s Evaluation Department. An independent team of researchers or consultants will be assigned the evaluation according to the standard procurement procedures of Norad (including open international call for tenders). The team leader shall report to Norad on the team’s progress, including any problems that may jeopardise the assignment.
The team is entitled to consult widely with stakeholders pertinent to the assignment. All decisions concerning these Terms of Reference, the inception report and other reports are subject to approval by the Evaluation Department.
The evaluation team shall take note of the comments from stakeholders. In case of significant divergence of views between the evaluation team and stakeholders, this should be reflected in the final report.
BudgetThe evaluation is budgeted with a tentative maximum of 2,9 million kroner. The team leader is expected to participate in the following three meetings in Oslo: a contract-signing meeting, a meeting to present the work in progress, and a meeting to present the final report.
The team is supposed to undertake field studies in Malawi, Zambia and Tanzania of approximately one week in each country.
The budget shall be specified as explained in Part 3, Annex 3, Price.
The consultants may be requested to make additional presentations, in which case the cost will be covered by Norad outside the tender budget.
5. Reporting and Outputs
The Consultant shall undertake the following:
1. Prepare an inception report providing a detailed plan for the assignment. 2. Prepare a draft final report presenting findings, conclusions and
recommendations and an executive summary. 3. After receiving comments, prepare a final report.
Inception and final report requirements are further described in Part 3, Annex 3 Guidelines for Reports.
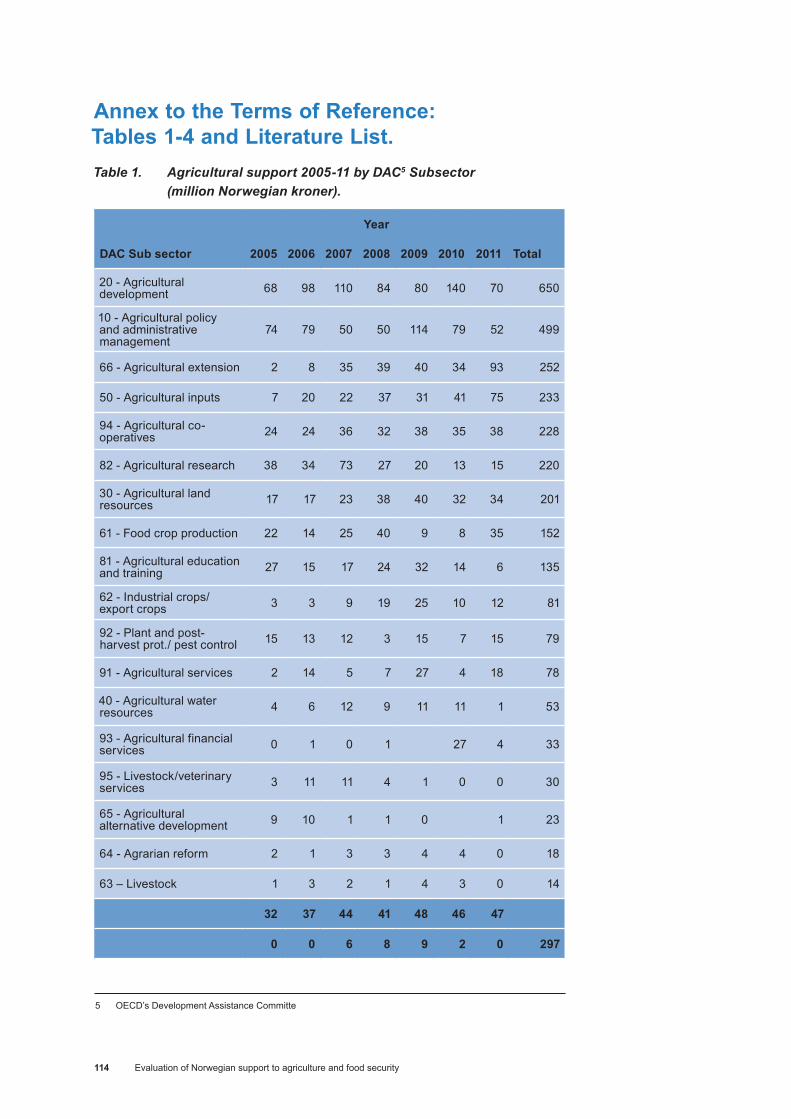
Evaluation of Norwegian support to agriculture and food security114
Annex to the Terms of Reference: Tables 1-4 and Literature List. Table 1. Agricultural support 2005-11 by DAC5 Subsector (million Norwegian kroner).
Year
DAC Sub sector 2005 2006 2007 2008 2009 2010 2011 Total
20 - Agricultural development 68 98 110 84 80 140 70 650
10 - Agricultural policy and administrative management
74 79 50 50 114 79 52 499
66 - Agricultural extension 2 8 35 39 40 34 93 252
50 - Agricultural inputs 7 20 22 37 31 41 75 233
94 - Agricultural co-operatives 24 24 36 32 38 35 38 228
82 - Agricultural research 38 34 73 27 20 13 15 220
30 - Agricultural land resources 17 17 23 38 40 32 34 201
61 - Food crop production 22 14 25 40 9 8 35 152
81 - Agricultural education and training 27 15 17 24 32 14 6 135
62 - Industrial crops/export crops 3 3 9 19 25 10 12 81
92 - Plant and post-harvest prot./ pest control 15 13 12 3 15 7 15 79
91 - Agricultural services 2 14 5 7 27 4 18 78
40 - Agricultural water resources 4 6 12 9 11 11 1 53
93 - Agricultural financial services 0 1 0 1 27 4 33
95 - Livestock/veterinary services 3 11 11 4 1 0 0 30
65 - Agricultural alternative development 9 10 1 1 0 1 23
64 - Agrarian reform 2 1 3 3 4 4 0 18
63 – Livestock 1 3 2 1 4 3 0 14
32 37 44 41 48 46 47
0 0 6 8 9 2 0 297
5 OECD’s Development Assistance Committe

Evaluation of Norwegian support to agriculture and food security 115
Table 2. Agricultural support (million Norwegian kroner). By countries or regions receiving 50 million kroner or more, representing 2376 million kroner or 80 % of total.
Year
Recipient country 2005 2006 2007 2008 2009 2010 2011 Total
Malawi 19 37 66 78 64 88 144 496
Global Unspecified 75 82 106 63 59 23 31 438
Zambia 18 54 60 63 84 52 83 414
Tanzania 9 2 6 9 9 82 21 138
Nicaragua 10 17 21 27 20 22 19 137
Mozambique 2 1 7 40 9 20 31 110
Africa Regional 12 15 2 19 24 5 13 90
Uganda 7 14 23 5 15 13 5 82
South of Sahara Regional 5 2 5 3 3 30 33 81North & Central America Regional
14 18 19 16 4 3 3 76
Palestinian Admin. Areas 10 8 14 3 22 15 72
Ethiopia 10 12 15 8 14 4 3 65
Sudan 16 19 17 4 3 2 1 62
America Regional 2 2 55 0 0 59
Mali 2 2 2 3 2 24 20 56
Table 3. Agricultural support by type of organisation (million Norwegian kroner).
YearType of Agreement Partner 2005 2006 2007 2008 2009 2010 2011 TotalMultilateral institutions 100 127 122 81 128 80 49 689NGO Local 33 54 83 100 111 93 149 623NGO Norwegian 100 85 98 66 69 82 68 567Governments/Ministries in developing countries 20 29 45 74 33 56 122 378
Other countries private sector 2 47 77 51 41 218
Norwegian public sector 14 11 47 20 19 12 9 132
NGO International 11 12 12 12 19 26 26 117Public sector other donor countries 16 37 23 9 19 -5 -5 94
Norwegian private sector 24 12 10 9 14 5 6 80
Consultants 1 1 2 0 0 61 3 68Public sector in developing countries 0 1 1 1 1 0 1 5
Unknown 2 1 0 0 0 1 5 320 370 446 418 489 462 470 2976
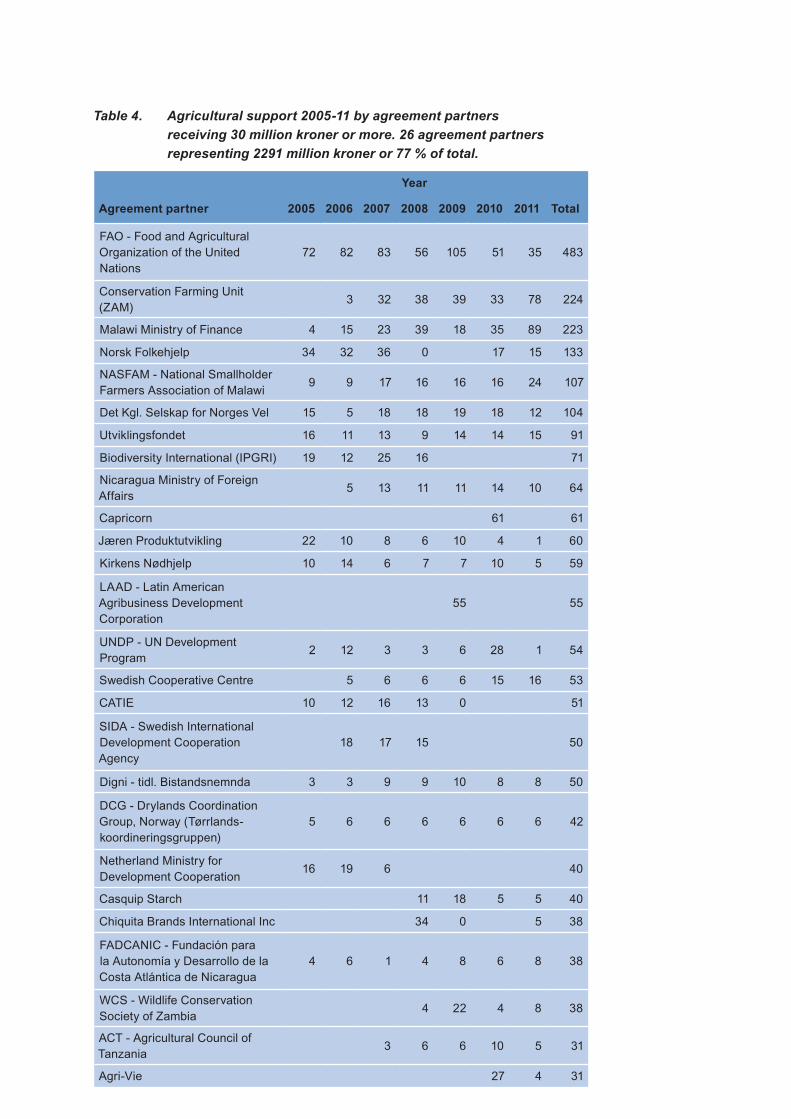
Evaluation of Norwegian support to agriculture and food security116
Table 4. Agricultural support 2005-11 by agreement partners receiving 30 million kroner or more. 26 agreement partners representing 2291 million kroner or 77 % of total.
Year
Agreement partner 2005 2006 2007 2008 2009 2010 2011 Total
FAO - Food and Agricultural Organization of the United Nations
72 82 83 56 105 51 35 483
Conservation Farming Unit (ZAM)
3 32 38 39 33 78 224
Malawi Ministry of Finance 4 15 23 39 18 35 89 223
Norsk Folkehjelp 34 32 36 0 17 15 133
NASFAM - National Smallholder Farmers Association of Malawi
9 9 17 16 16 16 24 107
Det Kgl. Selskap for Norges Vel 15 5 18 18 19 18 12 104
Utviklingsfondet 16 11 13 9 14 14 15 91
Biodiversity International (IPGRI) 19 12 25 16 71
Nicaragua Ministry of Foreign Affairs
5 13 11 11 14 10 64
Capricorn 61 61
Jæren Produktutvikling 22 10 8 6 10 4 1 60
Kirkens Nødhjelp 10 14 6 7 7 10 5 59
LAAD - Latin American Agribusiness Development Corporation
55 55
UNDP - UN Development Program
2 12 3 3 6 28 1 54
Swedish Cooperative Centre 5 6 6 6 15 16 53
CATIE 10 12 16 13 0 51
SIDA - Swedish International Development Cooperation Agency
18 17 15 50
Digni - tidl. Bistandsnemnda 3 3 9 9 10 8 8 50
DCG - Drylands Coordination Group, Norway (Tørrlands-koordineringsgruppen)
5 6 6 6 6 6 6 42
Netherland Ministry for Development Cooperation
16 19 6 40
Casquip Starch 11 18 5 5 40
Chiquita Brands International Inc 34 0 5 38
FADCANIC - Fundación para la Autonomía y Desarrollo de la Costa Atlántica de Nicaragua
4 6 1 4 8 6 8 38
WCS - Wildlife Conservation Society of Zambia
4 22 4 8 38
ACT - Agricultural Council of Tanzania
3 6 6 10 5 31
Agri-Vie 27 4 31
Evaluation of Norwegian support to agriculture and food security 117
List of some relevant literature.Fighting Poverty through Agriculture. Norwegian Plan of Action for Agriculture in Norwegian Development Policy. Ministry of Foreign Affairs 2004.
Climate, Conflict and Capital. Norwegian development policy adapting to change. Ministry of Foreign Affairs, Meld. St. 13 (2008-2009).
Towards greener development: On a coherent environmental and development policy. Ministry of Foreign Affairs, Meld. St. 14 (2010-11).
Danida Evaluation Study 2011/2. Agricultural input subsidies in Sub-Saharan Afrika.
Improving food security. A systematic review of the impact of interventions in agricultural production, value chains, market regulation, and land security. IOB Study. Ministry of Foreign Affairs of the Netherlands 2011.
Agriculture for Development. World Development Report 2008. The World Bank 2007.
Climate Smart Agriculture: Possible Roles of Agricultural Universities in a Strengthened Climate Change Engagement in Africa. Eds. G. Synnevåg and J Lambrou. Norwegian University of Life Sciences 2012.
Global Hunger Index 2011. IFPRI/Concern/Welt Hunger Hilfe.
El estado de la inseguridad alimentaria en el mundo. FAO/IFAD/WFP 2011.
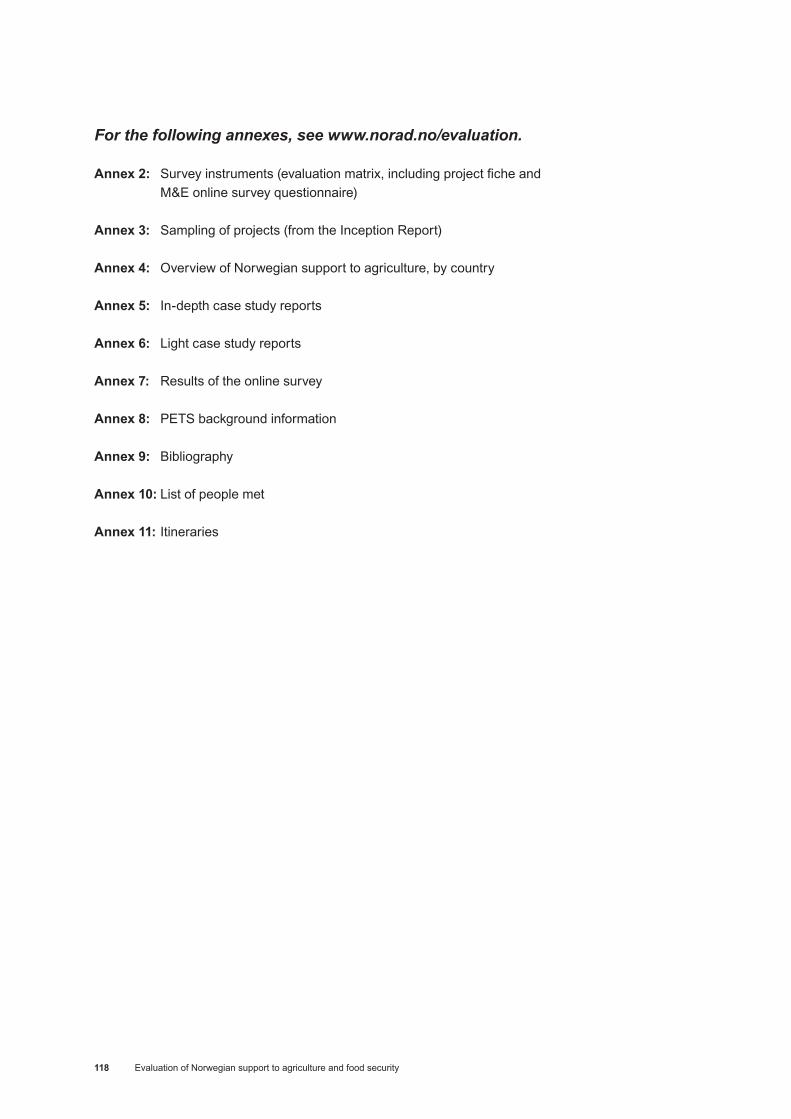
Evaluation of Norwegian support to agriculture and food security118
For the following annexes, see www.norad.no/evaluation.
Annex 2: Survey instruments (evaluation matrix, including project fiche and M&E online survey questionnaire)
Annex 3: Sampling of projects (from the Inception Report)
Annex 4: Overview of Norwegian support to agriculture, by country
Annex 5: In-depth case study reports
Annex 6: Light case study reports
Annex 7: Results of the online survey
Annex 8: PETS background information
Annex 9: Bibliography
Annex 10: List of people met
Annex 11: Itineraries

Evaluation of Norwegian support to agriculture and food security 119

Evaluation of Norwegian support to agriculture and food security120

NoradNorwegian Agency for Development CooperationP.O.Box 8034 Dep, NO-0030 OsloRuseløkkveien 26, Oslo, Norway
Tel: +47 23 98 00 00 Fax: +47 23 98 00 99
Photo: IstockPhotoDesign: Siste Skrik KommunikasjonPrint: Network Broking/Bjerch TrykkeriISBN: 978-82-7548-686-6
EVALUATION REPORTS
2.00 Norwegian Support to the Education Sector. Overview of Policies and Trends 1988–1998
3.00 The Project “Training for Peace in Southern Africa”4.00 En kartlegging av erfaringer med norsk bistand gjennomfrivillige
organisasjoner 1987–19995.00 Evaluation of the NUFU programme6.00 Making Government Smaller and More Efficient.The Botswana
Case7.00 Evaluation of the Norwegian Plan of Action for Nuclear Safety
Priorities, Organisation, Implementation8.00 Evaluation of the Norwegian Mixed Credits Programme9.00 “Norwegians? Who needs Norwegians?” Explaining the Oslo Back
Channel: Norway’s Political Past in the Middle East10.00 Taken for Granted? An Evaluation of Norway’s Special Grant for the
Environment1.01 Evaluation of the Norwegian Human Rights Fund2.01 Economic Impacts on the Least Developed Countries of the
Elimination of Import Tariffs on their Products3.01 Evaluation of the Public Support to the Norwegian NGOs Working in
Nicaragua 1994–19993A.01 Evaluación del Apoyo Público a las ONGs Noruegas que Trabajan
en Nicaragua 1994–19994.01 The International Monetary Fund and the World Bank Cooperation
on Poverty Reduction5.01 Evaluation of Development Co-operation between Bangladesh and
Norway, 1995–20006.01 Can democratisation prevent conflicts? Lessons from sub-Saharan
Africa7.01 Reconciliation Among Young People in the Balkans An Evaluation of
the Post Pessimist Network1.02 Evaluation of the Norwegian Resource Bank for Democracyand
Human Rights (NORDEM)2.02 Evaluation of the International Humanitarian Assistance of the
Norwegian Red Cross3.02 Evaluation of ACOPAMAn ILO program for “Cooperative and
Organizational Support to Grassroots Initiatives” in Western Africa 1978 – 1999
3A.02 Évaluation du programme ACOPAMUn programme du BIT sur l’« Appui associatif et coopératif auxInitiatives de Développement à la Base » en Afrique del’Ouest de 1978 à 1999
4.02 Legal Aid Against the Odds Evaluation of the Civil Rights Project (CRP) of the Norwegian Refugee Council in former Yugoslavia
1.03 Evaluation of the Norwegian Investment Fund for Developing Countries (Norfund)
2.03 Evaluation of the Norwegian Education Trust Fund for Africain the World Bank
3.03 Evaluering av Bistandstorgets Evalueringsnettverk1.04 Towards Strategic Framework for Peace-building: Getting Their Act
Togheter.Overview Report of the Joint Utstein Study of the Peacebuilding.
2.04 Norwegian Peace-building policies: Lessons Learnt and Challenges Ahead
3.04 Evaluation of CESAR´s activities in the Middle East Funded by Norway
4.04 Evaluering av ordningen med støtte gjennom paraplyorganiasa-joner. Eksemplifisert ved støtte til Norsk Misjons Bistandsnemda og Atlas-alliansen
5.04 Study of the impact of the work of FORUT in Sri Lanka: Building CivilSociety
6.04 Study of the impact of the work of Save the Children Norway in Ethiopia: Building Civil Society
1.05 –Study: Study of the impact of the work of FORUT in Sri Lanka and Save the Children Norway in Ethiopia: Building Civil Society
1.05 –Evaluation: Evaluation of the Norad Fellowship Programme2.05 –Evaluation: Women Can Do It – an evaluation of the WCDI
programme in the Western Balkans3.05 Gender and Development – a review of evaluation report
1997–20044.05 Evaluation of the Framework Agreement between the Government
of Norway and the United Nations Environment Programme (UNEP)5.05 Evaluation of the “Strategy for Women and Gender Equality in
Development Cooperation (1997–2005)”1.06 Inter-Ministerial Cooperation. An Effective Model for Capacity
Development?2.06 Evaluation of Fredskorpset1.06 – Synthesis Report: Lessons from Evaluations of Women and
Gender Equality in Development Cooperation1.07 Evaluation of the Norwegian Petroleum-Related Assistance1.07 – Synteserapport: Humanitær innsats ved naturkatastrofer:En
syntese av evalueringsfunn1.07 – Study: The Norwegian International Effort against Female Genital
Mutilation2.07 Evaluation of Norwegian Power-related Assistance2.07 – Study Development Cooperation through Norwegian NGOs in
South America3.07 Evaluation of the Effects of the using M-621 Cargo Trucks in
Humanitarian Transport Operations4.07 Evaluation of Norwegian Development Support to Zambia (1991
- 2005)5.07 Evaluation of the Development Cooperation to Norwegion NGOs in
Guatemala1.08 Evaluation: Evaluation of the Norwegian Emergency Preparedness
System (NOREPS)1.08 Study: The challenge of Assessing Aid Impact: A review of
Norwegian Evaluation Practise1.08 Synthesis Study: On Best Practise and Innovative Approaches to
Capasity Development in Low Income African Countries
2.08 Evaluation: Joint Evaluation of the Trust Fund for Enviromentally and Socially Sustainable Development (TFESSD)
2.08 Synthesis Study: Cash Transfers Contributing to Social Protection: A Synthesis of Evaluation Findings
2.08 Study: Anti- Corruption Approaches. A Literature Review3.08 Evaluation: Mid-term Evaluation the EEA Grants4.08 Evaluation: Evaluation of Norwegian HIV/AIDS Responses5.08 Evaluation: Evaluation of the Norwegian Reasearch and Develop-
ment Activities in Conflict Prevention and Peace-building6.08 Evaluation: Evaluation of Norwegian Development Cooperation in
the Fisheries Sector1.09 Evaluation: Joint Evaluation of Nepal´s Education for All 2004-2009
Sector Programme1.09 Study Report: Global Aid Architecture and the Health Millenium
Development Goals2.09 Evaluation: Mid-Term Evaluation of the Joint Donor Team in Juba,
Sudan2.09 Study Report: A synthesis of Evaluations of Environment Assistance
by Multilateral Organisations3.09 Evaluation: Evaluation of Norwegian Development Coopertation
through Norwegian Non-Governmental Organisations in Northern Uganda (2003-2007)
3.09 Study Report: Evaluation of Norwegian Business-related Assistance Sri Lanka Case Study
4.09 Evaluation: Evaluation of Norwegian Support to the Protection of Cultural Heritage
4.09 Study Report: Norwegian Environmental Action Plan5.09 Evaluation: Evaluation of Norwegian Support to Peacebuilding in
Haiti 1998–20086.09 Evaluation: Evaluation of the Humanitarian Mine Action Activities of
Norwegian People’s Aid7.09 Evaluation: Evaluation of the Norwegian Programme for Develop-
ment, Research and Education (NUFU) and of Norad’s Programme for Master Studies (NOMA)
1.10 Evaluation: Evaluation of the Norwegian Centre for Democracy Sup-port 2002–2009
2.10 Synthesis Study: Support to Legislatures3.10 Synthesis Main Report: Evaluation of Norwegian Business-related
Assistance4.10 Study: Evaluation of Norwegian Business-related Assistance South
Africa Case Study5.10 Study: Evaluation of Norwegian Business-related Assistance
Bangladesh Case Study6.10 Study: Evaluation of Norwegian Business-related Assistance
Uganda Case Study7.10 Evaluation: Evaluation of Norwegian Development Cooperation with
the Western Balkans8.10 Evaluation: Evaluation of Transparency International9.10 Study: Evaluability Study of Partnership Initiatives10.10 Evaluation: Democracy Support through the United Nations11.10 Evaluation: Evaluation of the International Organization for
Migration and its Efforts to Combat Human Trafficking12.10 Evaluation: Real-Time Evaluation of Norway’s International Climate
and Forest Initiative (NICFI)13.10 Evaluation: Real-Time Evaluation of Norway’s International Climate
and Forest Initiative. Country Report: Brasil14.10 Evaluation: Real-Time Evaluation of Norway’s International Climate
and Forest Initiative. Country Report: Democratic Republic of Congo15.10 Evaluation: Real-Time Evaluation of Norway’s International Climate
and Forest Initiative. Country Report: Guyana16.10 Evaluation: Real-Time Evaluation of Norway’s International Climate
and Forest Initiative. Country Report: Indonesia17.10 Evaluation: Real-Time Evaluation of Norway’s International Climate
and Forest Initiative. Country Report: Tanzania18.10 Evaluation: Real-Time Evaluation of Norway’s International Climate
and Forest Initiative1.11 Evaluation: Results of Development Cooperation through
Norwegian NGO’s in East Africa2.11 Evaluation: Evaluation of Research on Norwegian Development
Assistance3.11 Evaluation: Evaluation of the Strategy for Norway’s Culture and
Sports Cooperation with Countries in the South4.11 Study: Contextual Choices in Fighting Corruption: Lessons Learned5.11 Pawns of Peace. Evaluation of Norwegian peace efforts in Sri
Lanka, 1997-20096.11 Joint Evaluation of Support to Anti-Corruption Efforts, 2002-20097.11 Evaluation: Evaluation of Norwegian Development Cooperation to
Promote Human Rights8.11 Norway’s Trade Related Assistance through Multilateral Organiza-
tions: A Synthesis Study9.11 Activity-Based Financial Flows in UN System: A study of Select UN
Organisations Volume 1 Synthesis Volume 2 Case Studies10.11 Evaluation of Norwegian Health Sector Support to Botswana1.12 Mainstreaming disability in the new development paradigm.
Evaluation of Norwegian support to promote the rights of persons with disabilities.
2.12 Hunting for Per Diem. The uses and Abuses of Travel Compensa-tion in Three Developing Countries
3.12 Evaluation of Norwegian Development Cooperation with Afghani-stan 2001-2011
4.12 Evaluation of the Health Results Innovation Trust Fund5.12 Real-Time Evaluation of Norway’s International Climate and Forest
Initiative. Lessons Learned from Support to Civil Society Organisations.6.12 Facing the Resource Curse: Norway’s Oil for Development Program7.12 A Study of Monitoring and Evaluation in Six Norwegian Civil Society
Organisations8.12 Use of Evaluations in the Norwegian Development Cooperation
System
Evaluation of Norway’s Bilateral Agricultural Support to Food Security
Report 1/2013
NoradNorwegian Agency forDevelopment Cooperation
Postal addressP.O. Box 8034 Dep. NO-0030 OSLOVisiting addressRuseløkkveien 26, Oslo, Norway
Tel: +47 23 98 00 00 Fax: +47 23 98 00 99
No. of Copies: 220 [email protected] www.norad.no
Evaluation Department


![Thurston County Agricultural Land Pocket Gopher Evaluation · [THURSTON COUNTY AGRICULTURAL LAND POCKET GOPHER EVALUATION] March 30, 2014 3 Thurston County Agricultural Land Pocket](https://img.pdfslide.us/doc/110x75/5b00b2377f8b9a256b90627a/thurston-county-agricultural-land-pocket-gopher-evaluation-thurston-county-agricultural.jpg)