Embed Size (px)
Citation preview
Evaluation of Movement Patterns and Space Use in Reintroduced Eastern Indigo Snakes
(Drymarchon couperi) in the Florida Panhandle
by
Sara E. Piccolomini
A thesis submitted to the Graduate Faculty of
Auburn University
in partial fulfillment of the
requirements for the Degree of
Master of Science
Auburn, Alabama
August 8, 2020
Key Words: Eastern Indigo Snake, Drymarchon couperi, Species Reintroduction, Home Range,
Dispersal
Copyright 2020 by Sara E. Piccolomini
Approved by
Dr. Mary Mendonca, Chair, Professor, Department of Biological Science
Dr. Lora Smith, Co-chair, Jones Center at Ichauway
Dr. David Steen, U.S. Fish and Wildlife Research Institute, Florida Fish and Wildlife
Conservation Commission
i
Abstract
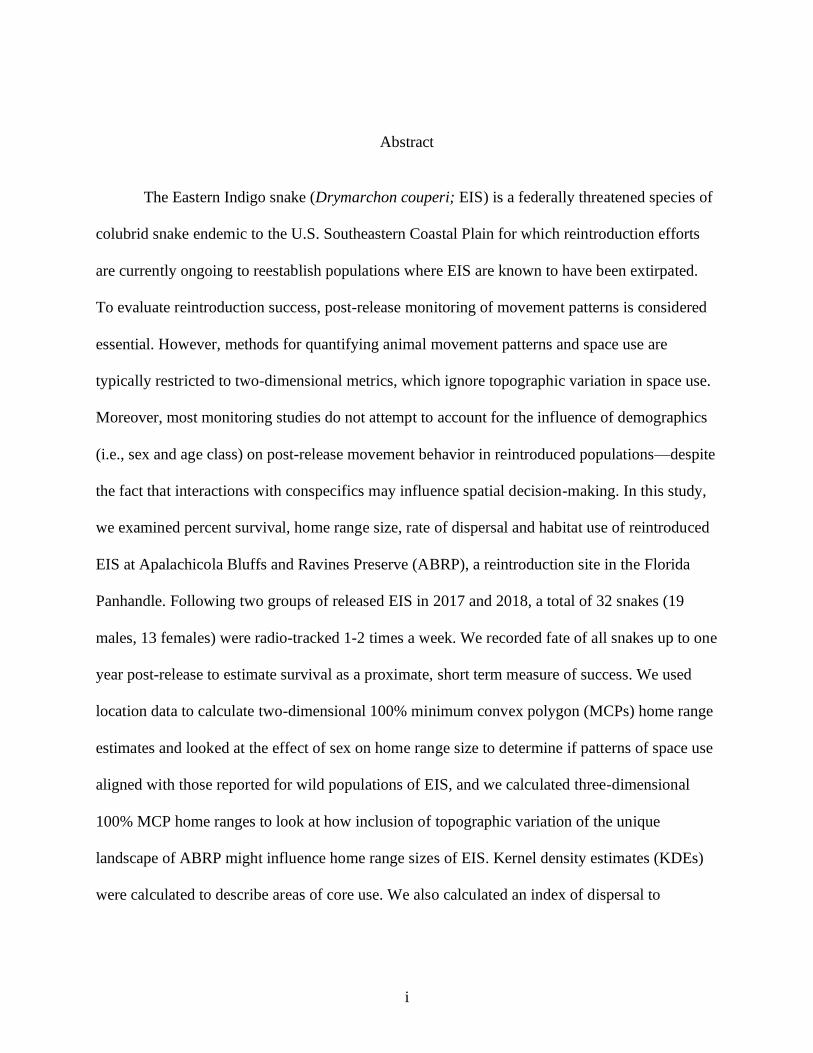
The Eastern Indigo snake (Drymarchon couperi; EIS) is a federally threatened species of
colubrid snake endemic to the U.S. Southeastern Coastal Plain for which reintroduction efforts
are currently ongoing to reestablish populations where EIS are known to have been extirpated.
To evaluate reintroduction success, post-release monitoring of movement patterns is considered
essential. However, methods for quantifying animal movement patterns and space use are
typically restricted to two-dimensional metrics, which ignore topographic variation in space use.
Moreover, most monitoring studies do not attempt to account for the influence of demographics
(i.e., sex and age class) on post-release movement behavior in reintroduced populations—despite
the fact that interactions with conspecifics may influence spatial decision-making. In this study,
we examined percent survival, home range size, rate of dispersal and habitat use of reintroduced
EIS at Apalachicola Bluffs and Ravines Preserve (ABRP), a reintroduction site in the Florida
Panhandle. Following two groups of released EIS in 2017 and 2018, a total of 32 snakes (19
males, 13 females) were radio-tracked 1-2 times a week. We recorded fate of all snakes up to one
year post-release to estimate survival as a proximate, short term measure of success. We used
location data to calculate two-dimensional 100% minimum convex polygon (MCPs) home range
estimates and looked at the effect of sex on home range size to determine if patterns of space use
aligned with those reported for wild populations of EIS, and we calculated three-dimensional
100% MCP home ranges to look at how inclusion of topographic variation of the unique
landscape of ABRP might influence home range sizes of EIS. Kernel density estimates (KDEs)
were calculated to describe areas of core use. We also calculated an index of dispersal to
ii
investigate the potential influence of demographic factors (i.e., age class, sex) and release year
on post-release movements.
The Kaplan-Meier survival estimates for EIS in 2017 was 45% after 49 weeks, and only 2
of the 12 snakes released were known to have survived (the fate of 4 additional EIS was not
confirmed because transmitter signals were lost). In 2018, survival estimates for EIS were 46%,
where 7 of the 20 snakes released were known to have survived after 42 weeks, and an additional
5 EIS could not be located (signals were lost). At the end of the two year study, 9 of the 32
snakes released were confirmed alive, resulting in a 28% estimate of survival.
Two-dimensional MCP home ranges for 16 EIS (5 males and 11 females) using the first
11 relocations averaged 15.0 ha, but varied among individuals (1.6 ha to 34.8 ha). There was a
significant effect of sex on home range size (F= 4.129; df= 9; p=0.01) with males, on average,
maintaining larger home ranges (ranging from 9.2 to 34.8 ha and averaging 23.2 ha) than females
(ranging from 1.6 to 28.1 ha and averaging 11.56 ha), respectively. Three-dimensional MCP
home ranges for 28 EIS (15 males, 13 females) using all relocations from snakes tracked 1-2
times per week ranged from 1.6 ha to 243.82 ha with a mean of 61.78 ha (Appendix 1). Our
paired t-test to compare whether 2D and 3D revealed no difference (df = 54; p = 0.9551).
Average 95 and 50% kernel density estimates and areas of core use for 8 EIS (2 males, 6
females) were 96.1 m (ranging from 15.2 to 345.8 m) and 16.0 m (ranging from 3.0 to 46.7 m),
respectively (Table 3). We found a three-way interaction of sex, age class and release year (F=
4.961; df = 9) where young males released in year 2 dispersed more quickly (32.3 m/day) than
all other groups (p = 0.004).
Snakes tracked throughout the study exhibited a seasonal shift in habitat use during the
winter months, where EIS were exclusively found in upland sandhills habitat as opposed to the

iii
rest of the year when they were found using both upland sandhills and ravine/wetland habitat.
These data align with season shifts in habitat use reported for wild populations of EIS,
suggesting reintroduced EIS in our study exhibiting similar habitat use similar to wild snakes.

iv
Acknowledgements
I would first like to thank Craig Guyer for his constant guidance and encouragement over
the last three years, from making time to sit down with me to go over analyses to helping me
reign in my thoughts when I was feeling overwhelmed throughout the writing process, Craig was
always there to help. His willingness to invest his time in me and my project (even though he is
“retired”) was instrumental to the completion of my thesis.
I would also like to thank Dave Steen and Auburn University for taking me on as a
student and putting me on the Indigo project. I would like to thank Lora Smith as well for co-
advising me and with the Jones Center at Ichauway for funding my research and the necessary
equipment for all of my data collection, and for coming out in the field to help me troubleshoot
some of my snake telemetry. I would also like to thank Mary Mendonça for taking me in as a
part of her lab, and for her help with literally everything pertaining to my project (finances,
paperwork, guidance, emotional support) and for helping me push through my own mental
blocks and self-doubt throughout the writing process of my thesis.
I would like to thank David Printiss and The Nature Conservancy for providing me with
additional funding for my research and for providing me with a place to stay on site during the
field season. I would like to thank Dr. James Bogan and the Central Florida Zoo staff for
performing all of the snake transmitter surgeries for my project. Also, I would like to thank
Michelle Hoffman and The Orianne Center for Indigo Conservation for breeding and raising the
snakes, and for constantly being available whenever I had questions or concerns about the snakes
while I was out tracking. As Craig would say, Michelle is the glue that keeps the Indigo

v
repatriation together, and I couldn’t agree more. I’m proud to call such an awesome person like
Michelle not only a colleague, but a close friend as well.
I would like to thank Deborah Burr and Florida Fish and Wildlife Conservation
Commission for providing me with additional funds for my research, and for the constant effort
to help assist in any way needed (i.e., coordinating help with telemetry, setting up chains of
transportation to get snakes back to the OCIC). Also, I would like to thank Michele Elmore and
the U.S. Fish and Wildlife Service for providing permits, and for overseeing and approving the
reintroduction of EIS at ABRP. I would also like to thank Justin Fowler for all of his help with
GIS over the years. Specifically, for helping to bring my vision of incorporating the
topographically diverse landscape of ABRP into my home range analyses to life.
Finally, I would like to thank those who assisted with telemetry data collection over the
last two years. Pierson Hill really helped me to get my bearing on telemetry, coming out to help
troubleshoot equipment issues and navigate the challenges of the floodplain snakes whenever he
was able (and even fighting off an alligator to avenge the death of my favorite snake, Butters). I
would like to thank Annie Schmidt for being the best field technician I could have ever asked
for. Her constant excitement and passion for chasing the snakes through the forest, even amidst
some of the most challenging circumstances (i.e., waist deep in the floodplain being swarmed by
thousands of mosquitos on a daily basis) is rare. I will miss having post-fieldwork drinks on the
porch with you, Blackie Bear, and Jack. Those nights spent out by the music room listening to
Jack play the drums were something I will always cherish.
vi
Table of Contents
Abstract………………………………………………………………………………………..i
Acknowledgements……………………………………………………………………………iv
List of Tables………………………………………………………………………………….vii
List of Figures…………………………………………………………………………………viii
List of Abbreviations………………………………………………………………………….ix
Chapter 1. Introduction………………………………………………………………………...1
Conservation Background……………………………………………………………..1
Eastern Indigo Snakes…………………………………………………………………3
Chapter 2. Movement Ecology of Reintroduced Eastern Indigo Snakes…...............................7
Introduction……………………………………………………………………..........10
Methods………………………………………………………………………………15
Results……………………………………………………………………………......21
Discussion……………………………………………………………………………23
Tables………………………………………………………………………………...29
Figures……………………………………………………………………………….31
References…………………………………………………………………………………...37

vii
List of Tables
Chapter 2
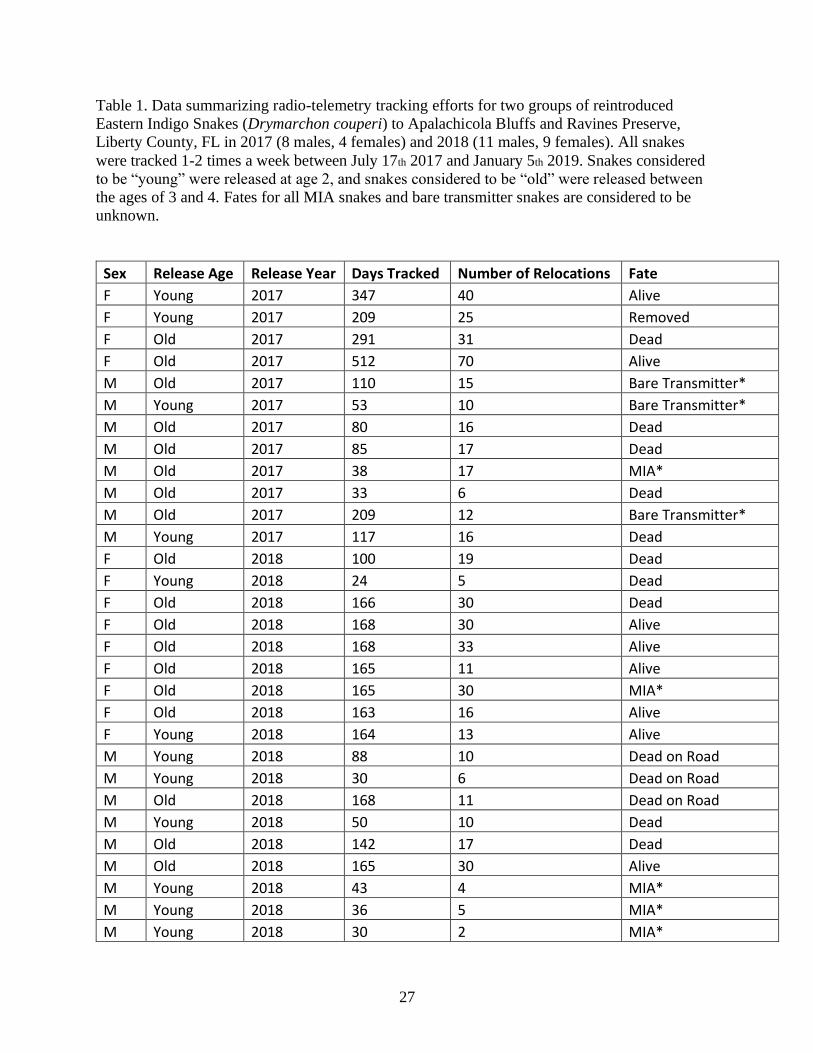
Table 1. Data summarizing radio-telemetry tracking efforts for two groups of reintroduced
Eastern Indigo Snakes (Drymarchon couperi) to Apalachicola Bluffs and Ravines Preserve,
Liberty County, FL ……………………………………………………………………………29
Table 2. Comparison of linear models for rate of dispersal in Eastern indigo snakes (Drymarchon
couperi) reintroduced to Apalachicola Bluffs and Ravines Preserve, Liberty County, FL in 2017
and 2018 using a corrected Akaike Information Criterion (AICc)…………………………….30
Table 3. Comparison of 100% MCP home range size, 95% KDEs and 50% area of core use for 8
EIS (2 males, 6 females)……………………………………………………………………….30

viii
List of Figures
Chapter 2
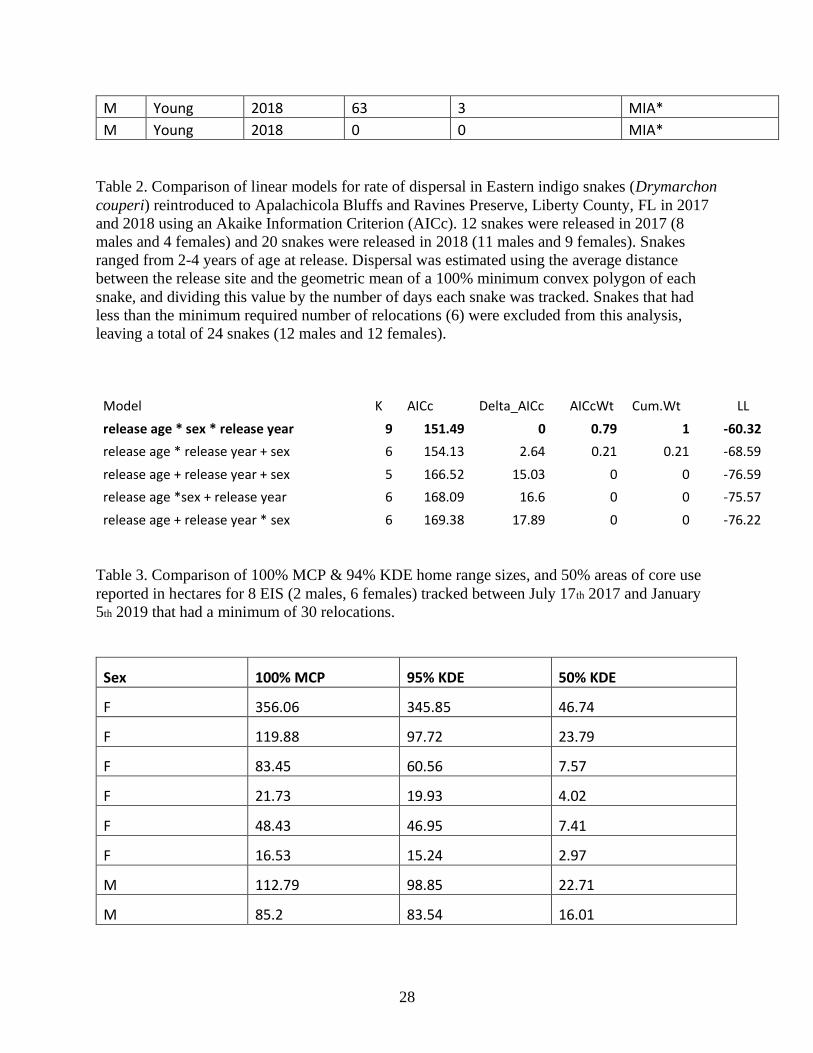
Figure 1. Map of The Nature Conservancy’s Apalachicola Bluffs and Ravines Preserve and
surrounding areas (Torreya State Park and Beaver Dam Creek Wildlife Management Area)
representing suitable habitat for Eastern Indigo Snake reintroduction………………………..31
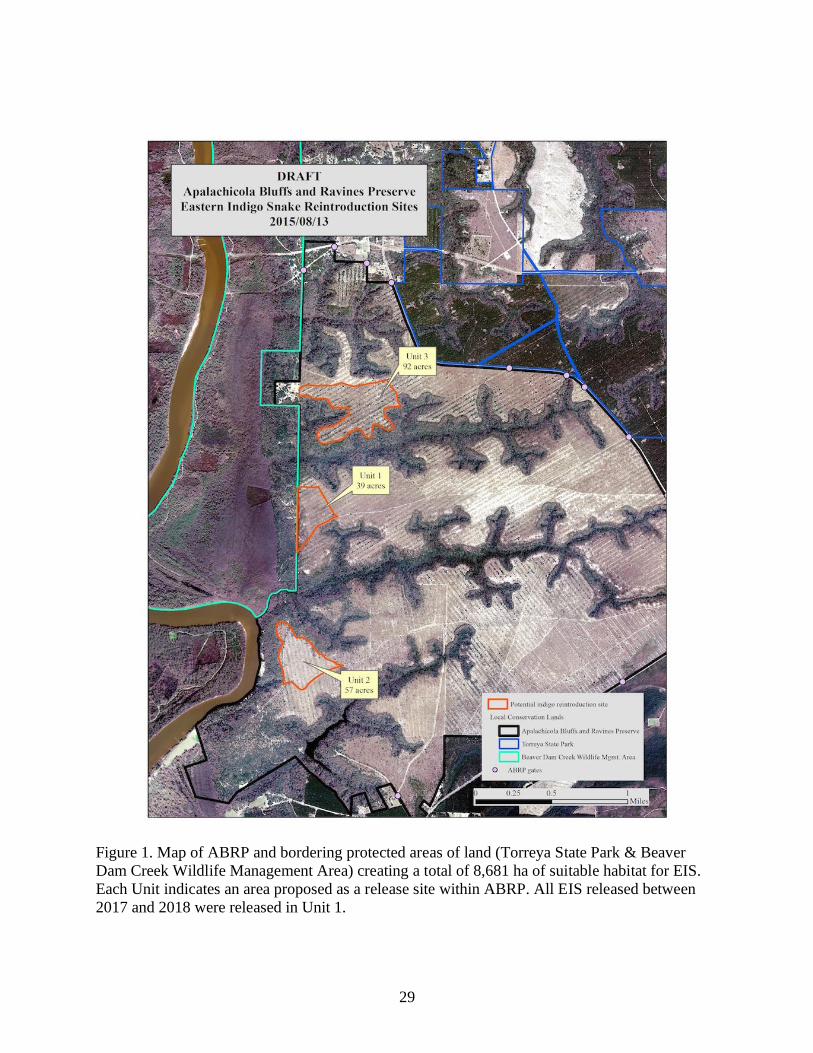
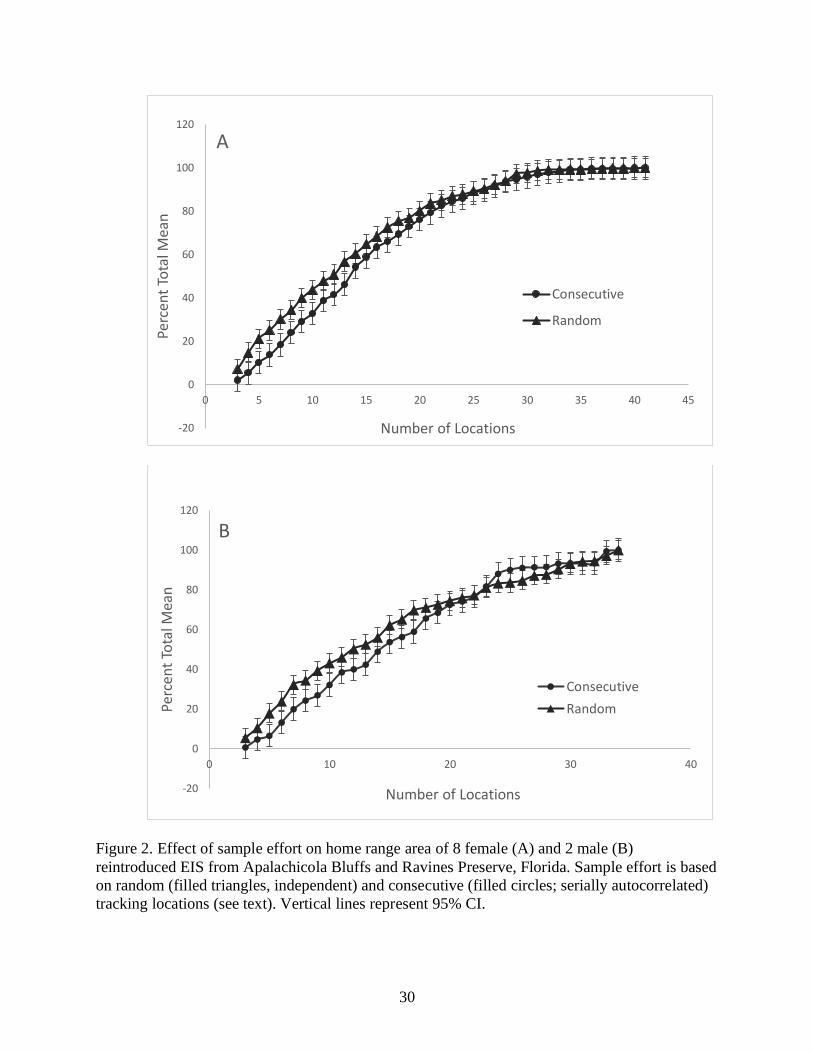
Figure 2. Effect of sample effort on home range size of 8 female (A) and 2 male (B) reintroduced
EIS from Apalachicola Bluffs and Ravines Preserve, FL………………...…………………...32
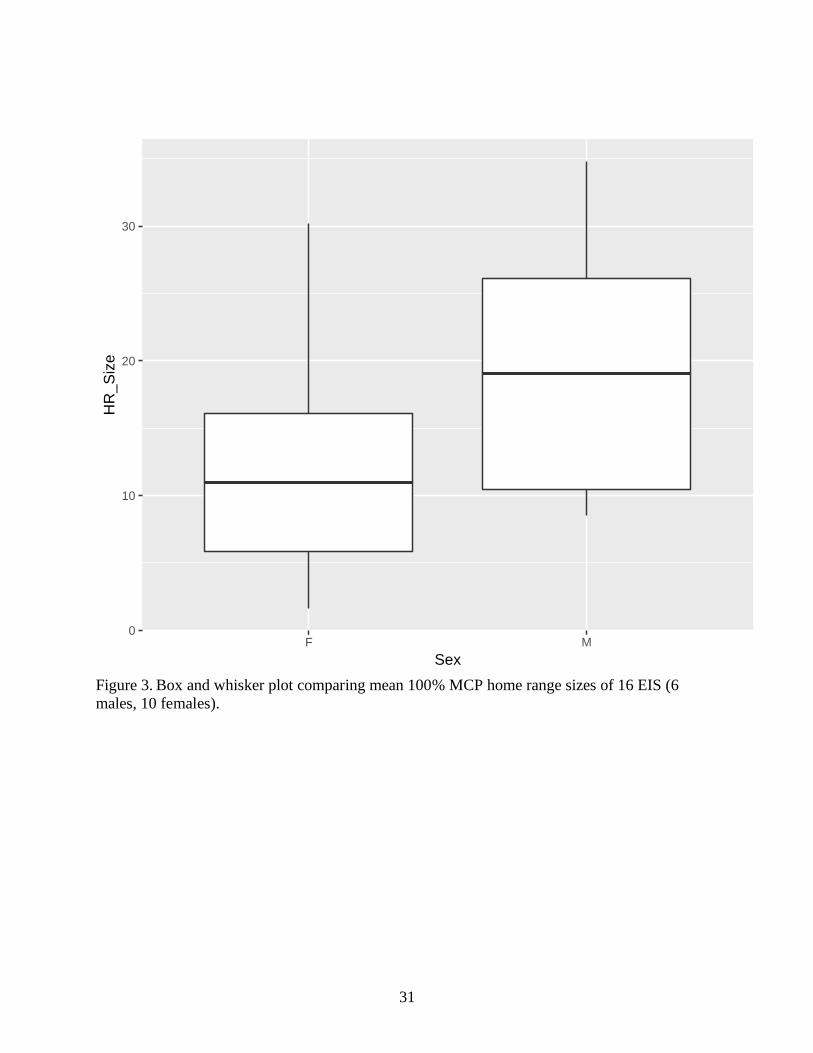
Figure 3. Box and whisker plot comparing mean 100% MCP home range sizes of 16 EIS (6
male, 10 females)………………………………………………………………………………33
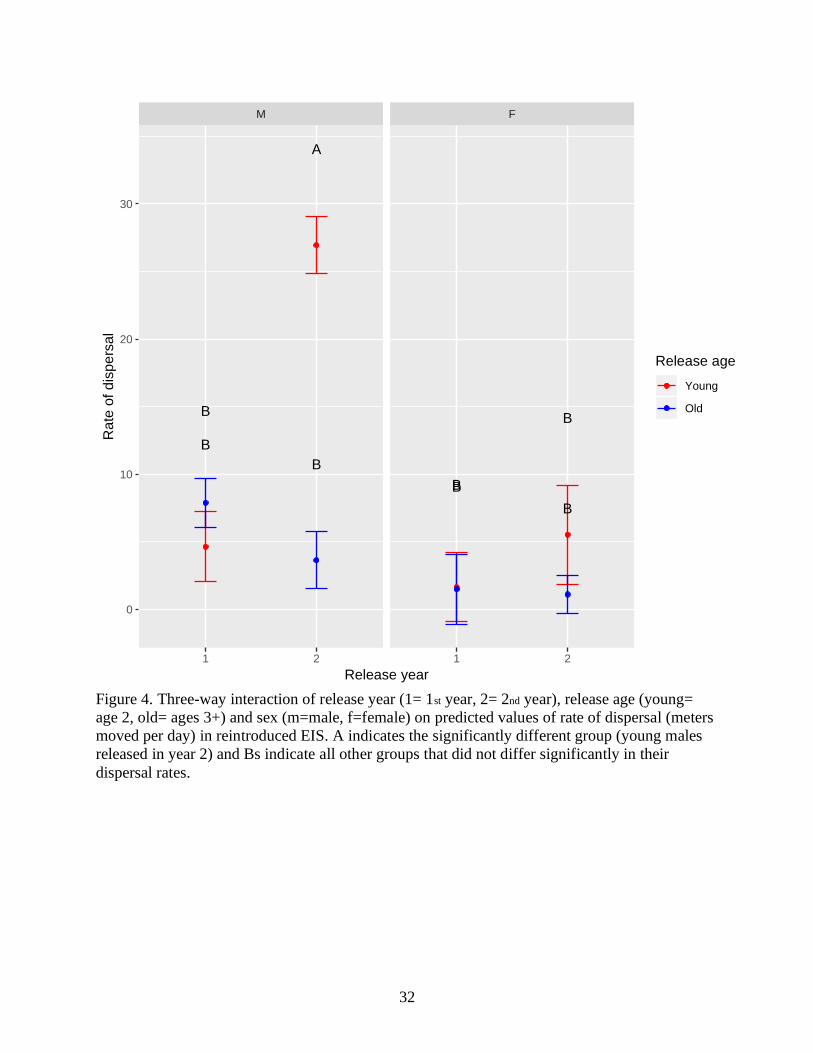
Figure 4. Three-way interaction of release year (1= 1st year, 2= 2nd year), release age (young=
age 2, old= ages 3+) and sex (m=male, f=female) on rate of dispersal (meters moved per day) in
reintroduced EIS……………………………………………………………………………….34
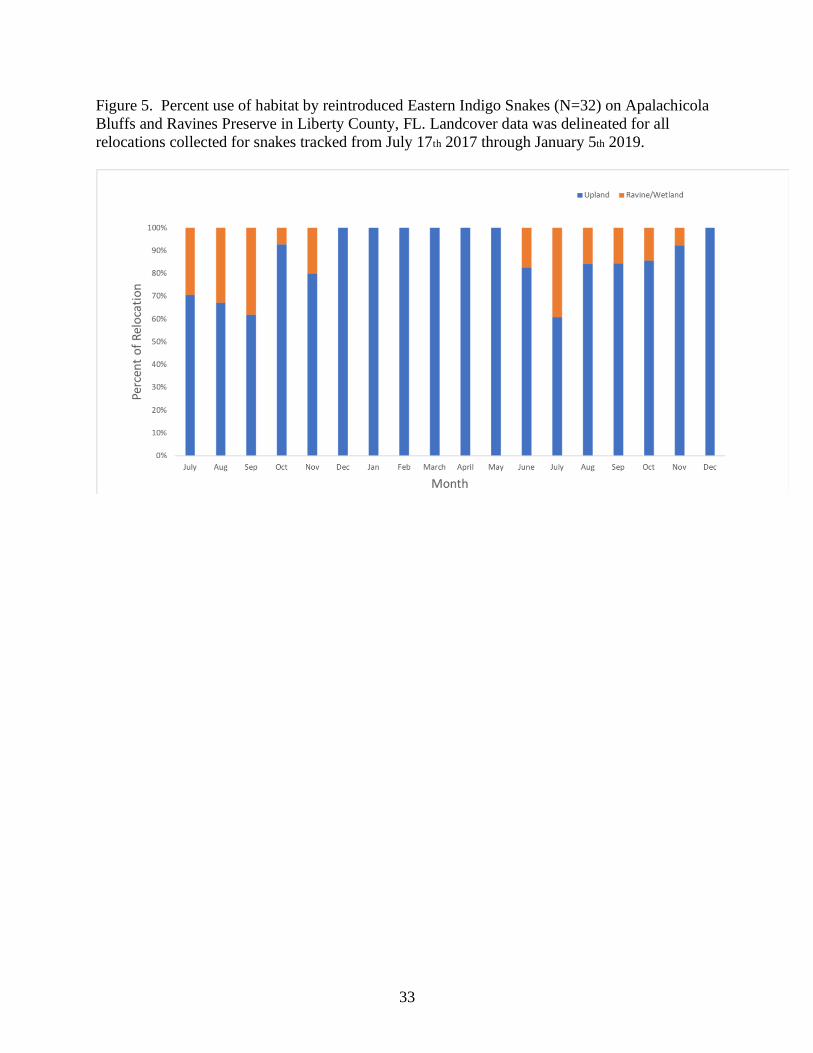
Figure 5. Percent of relocations for reintroduced EIS found in upland sandhills vs.
ravine/wetland habitat by month from July 17th 2017 through January 5th 2019……………...35
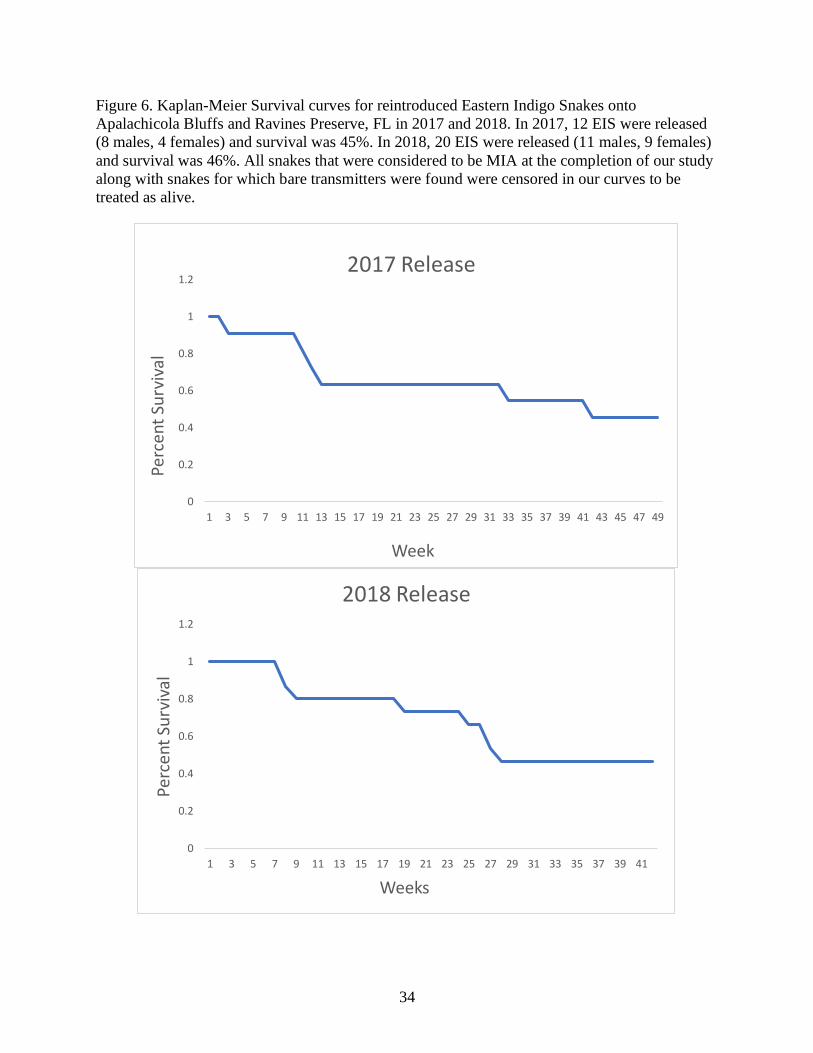
Figure 6. Kaplan-Meir survival curves for Eastern indigo snakes released in 2017 and 2018...36

ix
List of Abbreviations
2D Two-Dimensional
3D Three-Dimensional
ABRP Apalachicola Bluffs and Ravines Preserve
AIC Akaike Information Criterion
CFZ Central Florida Zoo
CNF Conecuh National Forest
DEM Digital Elevation Map
EIS Eastern Indigo Snake
ESA Endangered Species Act
KDE Kernel Density Estimates
MCP Minimum Convex Polygon
OCIC Orianne Center for Indigo Conservation
TIN Triangular Irregular Networks
TNC The Nature Conservancy
USFWS United States Fish and Wildlife Service

x
1
Chapter 1
INTRODUCTION
Conservation background
Loss of habitat is one of the primary causes of ongoing biodiversity declines around the
world (Wilson 1999; Noss et al. 2006). Reduction of natural habitat by anthropogenic land-use
often leaves imperiled species unable to persist—thus, furthering their already-eminent risk of
extinction (Bruner et al. 2001; Ervin 2003; Gibbons et al. 2000.) In the United States, habitat loss
has been identified as the primary cause of decline in >97% of imperiled herpetofauna (Wilcove
et al. 1998). In the U.S. Southeastern Coastal Plain, which supports the highest diversity of
herpetofaunal species in the country, an estimated 70% of amphibian and reptile species are in
peril—many of which are intimately tied to longleaf pine (Pinus palustris) ecosystems (Trani-
Griep 2002; Guyer and Bailey 1993; Means 2006).
Originally comprising nearly 30 million hectares, longleaf pine forests were once
dominant throughout the U.S. Southeastern Coastal Plain (Frost 1993; Landers et al. 1995; Van
Lear et al. 2005). Having suffered a near 97% loss, the longleaf pine is now considered one of
the most imperiled ecosystems in the world (Noss and Peters 1995). In addition to severe loss in
area, the exclusion of fire from the landscape led to further degradation of remaining intact
longleaf habitat (Frost 1993; Van Lear et al. 2005). Without frequent, low-to-moderate-intensity
fire, hardwood encroachment produces unsuitable habitat for many endemic species (Engstrom
et al. 1984; Mushinsky and McCoy 1985; Van Lear et al. 2005).
Protection and maintenance of high-quality habitat has been identified as the primary
focus of conservation for species in decline (Van Lear et al. 2005), which is based on the
2
assumption that restoration of degraded ecosystems promotes a return of native biotic
communities to the landscape (Litt et al. 2001). However, in some cases, densities may be too
low to rebound naturally or populations may be completely extirpated (Dodd 1987). As a result,
establishment of additional populations may be necessary to aid recovery efforts.
Species reintroductions have become a popular tool to conserve imperiled species
(Germano and Bishop 2009) and have been employed for a variety of vertebrates in an attempt to
delist many species, spanning from smaller taxa like crested toads (Peltophryne lemur) to large
megafauna like the Arabian oryx (Oryx leucoryx (Jachowski et al. 2016)). The term
‘reintroduction’ refers to the translocation of individuals to areas within their native range where
they have been previously extirpated (Fischer and Lindenmayer 2000; IUCN/SSC 2013); the
end-goal of such projects is reestablishment of self-sustaining populations. However,
achievement of this benchmark can be difficult (Dodd and Siegel 1991) as reintroductions are
complicated, expensive, and laborious.
For reintroduction to be considered an appropriate tool to help combat defaunation,
habitat at sites being considered for release must first be evaluated in order to determine whether
they are suitable to support the species. Once habitat has been deemed suitable and threats that
originally lead to the species becoming extirpated have been alleviated, sites are therefore
considered to be suitable for reintroduction.
Following release into the wild, reintroduced animals may exhibit abnormal/excessive
dispersal—which can result in reduced fidelity to release sites and decreased population
viability. In an attempt to minimize excessive dispersal, soft-release methods (i.e., enclosing
animals at release sites for some period of time before freeing them (e.g. Wallace 2000:
Kingsbury and Attum 2009)) are often employed. It has been suggested that these methods
3
increase interactions with conspecifics thought to influence settlement behavior (Campomizzi et
al. 2008). In contrast, when animals are released directly into the wild it is considered to be a
hard-release. However, despite the popularity of soft-release methods, they can be expensive to
implement and individuals may escape enclosures—making it difficult for researchers to
accurately evaluate their influence on post-release movements.
Once reintroductions have been implemented (i.e., individuals have been released into the
wild), post-release monitoring is essential to evaluate the status of these efforts as they work
towards establishing self-sustaining populations (Nichols and Armstrong 2012; Gitzen et al.
2016). It is often considered a sign of success in the short term when reintroduced individuals not
only survive, but are observed behaving similarly (i.e., via movement and habitat selection) to
wild individuals (Stiles et al. 2013); while signs of reproduction at recipient sites are considered
to be indicative that long-term goals (i.e., reestablishment of self-sustaining populations) of the
project are being met (Dodd and Siegel 1991). However, for species with certain life history and
behavioral characteristics, monitoring for success can be difficult. For example, reproductive
behavior in long-lived species may be delayed (Mertz 1971) and the large spatial requirements of
elusive, free-ranging species such as snakes can result in large movements and overall decreased
fidelity to release sites (Steen 2010; Durso et al. 2011)—further compromising the ability of
researchers to accurately monitor for success.
Study species
The Eastern Indigo Snake (Drymarchon couperi; EIS) is a large-bodied (>2m), bluish-
black colubrid native to the U.S. Southeastern Coastal Plain, most notable for its extensive
movements and large home ranges (Hyslop et al. 2009). EIS exhibit male-biased sexual size

4
dimorphism and females reproduce annually once they reach sexual maturity [(3-4 years) Speake
et al. 1978; Stevenson et al. 2009]. The breeding season for this species spans from October
through March (Groves 1960; Speake et al. 1978; Stiener et al. 1983) and gestation lasts 100-150
days (Smith 1987; O’Connor 1991) with eggs typically being laid in May and June (Moulis
1976; Stiener et al. 1983; Moler 1992; Speake et al. 1987). The EIS is a diurnal, active-foraging
species that preys on a multitude of vertebrates year-round and is considered an apex predator in
longleaf pine ecosystems; however, a large portion of their diet consists of other snakes
(Stevenson et al. 2010; Steen et al. 2016).
Historically, EIS were widespread throughout the U.S. Southeastern Coastal Plain (Enge
et al. 2013) with their occurrence often overlapping that of the Gopher Tortoise (Gopherus
polyphemus) in xeric longleaf pine sandhills (Diemer and Speake 1983). EIS use different
vegetation types such as oak sandhills, pine and scrub flatwoods, dry prairie, freshwater
wetlands, and mixed hardwood forests in addition to xeric sandhills (Speake, McGlincy and
Colvin 1978; Hyslop 2009; Stiles 2013). During the winter months the presence of thermally
stable refugia, such as Gopher Tortoise burrows, drives their almost exclusive use of upland
sandhills habitat; for the remainder of the year EIS largely shift to utilizing hydric bottomlands
(i.e., wetlands, creek drainages, floodplain swamps (Smith 1987; Hyslop et al. 2014)). Further,
the breeding season drives increased movements in male EIS, as they must expand their home
ranges in order to acquire access to multiple mates (Layne and Steiner 1996; Hyslop et al. 2014).
The sizeable home ranges that EIS maintain are thought to be largely attributable to both
seasonal shifts in habitat use and reproductive behavior (Hyslop et al. 2014).
By 1978, EIS had experienced dramatic population declines (USFWS, 1978) with habitat
loss, over-collection for the pet trade, and mortality associated with gassing of Gopher Tortoise
5
burrows for the collection of Eastern Diamondback Rattlesnakes (Crotalus adamanteus (Speake
and McGlincy 1981)) ultimately leading to their listing as a threatened species by the U.S. Fish
and Wildlife Service under the U.S. Endangered Species Act (ESA) (Enge et al. 2013; USFWS,
1978). In 1982, a recovery plan was established to maintain and protect existing populations of
EIS. The recovery plan outlined the need to establish additional EIS populations in portions of
the historic range (Speake et al. 1982). Despite listing under ESA and development of a recovery
plan, EIS populations continued to decline (USFWS 2008). As a result, implementation of
reintroductions for EIS were put into action to help recover the species in areas where
populations were believed to be extirpated.
In accordance with recovery plans for the species, sites being considered for
reintroduction must be comprised of large, intact longleaf pine habitat to support the spatial
requirements of EIS and must also contain established populations of Gopher Tortoises, with
which EIS are closely tied (USFWS 1978; Hyslop et al. 2014). In the late 1970’s-1990’s, captive
EIS were raised and released throughout parts of southern Alabama and Georgia thought to be
suitable for reintroduction; however, the number of snakes released was small and no snakes
have recently been recaptured from this effort (Guyer et al. 2019). More recently, a second
attempt to reestablish populations of EIS in Alabama began in Conecuh National Forest (CNF) in
2010. The CNF reintroduction effort is ongoing, and evidence of persistence have been reported
(i.e., the recapture of multiple individuals at the release sandhills during the winter/breeding
months, recent evidence of successful breeding (J. Godwin, Alabama Natural Heritage Program,
personal communication).
Following the framework of the CNF reintroduction, an attempt to reestablish a
population of EIS was initiated at The Nature Conservancy’s (TNC) Apalachicola Bluffs and
6
Ravines Preserve (ABRP) in Liberty County, Florida. As with the CNF reintroduction program
the intention at ABRP was to release of 30 captive born EIS every year for the next 10 years
beginning in 2017. The last known records of EIS in ABRP occurred more than 25 years ago; the
last confirmed individual observed in the Florida Panhandle occurred approximately 150km from
ABRP in 1999 (Enge et al. 2013). The extirpation of EIS from ABRP and the surrounding lands
was likely caused by the conversion from natural longleaf sandhills to pine plantation, and the
suppression of fire (Enge et al. 2013). Following its acquisition by TNC, ABRP has undergone
intensive restoration over the last two decades. The return of frequent fire, establishment of
longleaf pine and native ground cover, especially wiregrass (Aristida stricta), has resulted in a
recent increase in Gopher Tortoise abundance on the property (D. Printiss, The Nature
Conservancy, personal communication), making it suitable for EIS reintroduction. In this thesis,
I report survival (snakes known to be alive approximately 1 year post-release), seasonal habitat
use and examine movement patterns and space use of EIS as a part of a management effort to
reintroduce snakes at TNC’s ABRP; I use these data to judge preliminary measures of
reintroduction success.
7
Chapter 2
Post-release monitoring of reintroduced Eastern Indigo Snakes (Drymarchon couperi) to the
Florida Panhandle: Evaluating survival, dispersal and space and habitat use of reintroduced
snakes
INTRODUCTION
Habitat loss has been identified as the primary driver of imperilment in herpetofaunal
species worldwide (Wilcove et al. 1998; Alford and Richards 1999). In the United States, the
near 97% loss of intact longleaf pine (Pinus palustris) forests in the southeastern Coastal Plain
has resulted in a decline in abundance of roughly 70% of southern herpetofaunal species,
(Gibbons et al. 1997) including the federally threatened Eastern Indigo Snake (Drymarchon
couperi; EIS).
EIS is the largest (>2m in length) native snake species in the United States and is
considered an apex predator in longleaf pine ecosystems where the species consumes a multitude
of prey (Stevenson et al. 2010). In 1978, the EIS was listed as threatened under the U.S.
Endangered Species Act (ESA) after experiencing significant population declines resulting from
extensive habitat loss, overcollection, and mortality associated with the gassing of Gopher
Tortoise burrows (Speake 1993), where EIS frequently seek shelter in winter—most notably in
the northern portions of their range. Restoration of large parcels of intact longleaf pine habitat is
critical to conservation of the EIS, however in some cases it may be too late for these efforts to
promote populations to rebound naturally. Therefore, reintroducing individuals to areas within
their range where they have been previously extirpated is one strategy being implemented for
recovery of EIS (Fischer and Lindenmayer 2000) in hopes of reestablishing self-sustaining
populations in these areas.

8
In order to assess success of a reintroduction, in addition to measuring survival of
individuals, implementation of monitoring programs aimed at quantifying movement and activity
patterns following release into the wild is essential (Nichols and Armstrong 2012; Gitzen et al.
2016). Movement and activity patterns are considered fundamental characteristics of an animal’s
life history (Nathan et al. 2008), often reflecting the availability of resources (i.e., food, mates
and shelter) throughout the landscape (Waser and Wiley 1979). When reintroduced animals
exhibit similar movement behavior to those of wild animals (i.e., home range size, dispersal
patterns and habitat use) it is often considered a sign of preliminary success (Armstrong and
Seddon 2008) whereas abnormal movement patterns (i.e, excessive dispersal) often lead to
decreased population viability at release sites—making attainment of established self-sustaining
populations difficult.
One of the biggest reasons thought to be responsible for excessive dispersal following
release into the wild for reptile reintroduction efforts is poor habitat quality at release sites
(Germano and Bishop 2009; Stiles 2013). EIS not only have large spatial requirements, but they
also use multiple different habitat types (e.g., wetlands, floodplains and upland sandhills, pine
forests, or scrubby flatwoods). If either upland or wetland habitat is lacking at release sites, it
may drive abnormal dispersal behavior. However, demographic factors (i.e, presence/absence of
others) are also thought to influence dispersal and settlement behavior (Campomizzi et al. 2008;
Gitzen et al. 2016) by mediating intraspecific interactions.
Recent studies suggest that snakes can determine the sex and body size of conspecifics
from information in chemical cues (Shine et al. 2003; Scott et al. 2013) eliciting social
interactions such as kin recognition (Clark et al. 2012), reproductive tactics (Shine and Mason
2012; Doody et al. 2013), and cryptic social organization (Shine et al. 2005). Despite the

9
growing body of literature pertaining to social interactions in snakes, few studies have formally
investigated how decisions regarding space use are affected by the presence/absence of
conspecifics; however there is some evidence to suggest that the presence of conspecifics may
have significant impacts on movements and habitat use in snakes (Gregory et al. 1987; Carpenter
1984). Further, it has been suggested that interspecific interactions (i.e., competitive exclusion)
may influence patterns of co-occurrence in snakes (Steen et al. 2014) –suggesting that snakes
may have the ability to detect the presence of others and thus, inform spatial decision-making.
This may be of particular importance in regard to reintroduction efforts for species like the EIS,
where some snakes are released in areas that lack the presence of conspecifics (i.e., first release
group), while others are released in an areas heavily used by conspecifics (i.e., following release
groups) and thus may result in differences in dispersal and settlement behavior following release
into the wild.
Differences in release methods employed for EIS (i.e., soft vs. hard releases) have also
suggested that presence of conspecifics may have an influence on post-release dispersal
behavior. For example, data from the CNF reintroduction suggest that dispersal of reintroduced
female EIS are not sensitive to the type of release method employed but that in order to
encourage males to settle, the presence of established females in the release area may be needed
(Stiles, J. 2013). Specifically, Stiles (2013) speculates that if snakes of both sexes are released in
multiple groups over time, males in the first release group will disperse more quickly than males
in the second group because first-group males encounter few, if any, females, whereas second-
group males could experience physical encounters and chemical trails of newly established first-
group females. While sex of conspecifics may play a role in encouraging settlement behavior in
10
male EIS, other demographic factors such as differences in age class (i.e., sexually mature vs.
immature) of released individuals may also influence dispersal.
Recently it has been suggested to release juvenile (ages 1-2) EIS instead of sub-adults
(ages 3-4) in an attempt to eliminate financial burdens associated with rearing snakes in captivity
(C. Guyer, Pers. Communication). However, releasing individuals of this age class poses
challenges to monitoring efforts. For example, if the end-goal of reintroduction efforts for EIS is
the establishment of self-sustaining populations—the longer animals must survive before being
able to participate in reproductive behavior, the more delayed achievement of this goal becomes.
The longer it takes to achieve reproductive success, the more expensive monitoring efforts
become (Folt et al. 2019). As a result, additional data are needed to evaluate the effect of
demographic factors, such as age class (i.e., juvenile vs. sub-adult) on post-release dispersal and
establishment.
While quantifying patterns of space use to evaluate behavior of reintroduced animals is
critical to monitoring efforts, methods of home range estimation considered suitable for
herpetofauna are highly debated with minimum convex polygons (MCPs) being recommended
for behavioral reasons (Row and Blouin-Demers 2006) and kernel density estimates (KDEs)
being recommended for statistical reasons (Calange 2011) –along with whether assumptions that
influence these estimations are biologically meaningful (White and Garrot 1990). Despite their
popularity in use, each have their own setbacks. For example, 100% MCPs which encapsulate
all animal locations have a tendency to over-estimate home ranges, because they can incorporate
extreme, atypical movements and areas not used by the animal, while KDEs, which are weighted
by intensity of use of particular areas, can be biased for animals snakes, which tend to use the
same sites repeatedly (Row and Blouin-Demers 2006).

11
As typically implemented in studies of snakes, both of these methods are typically
restricted to two-dimensional (2D) estimates of space use, despite the fact that three-dimensional
(3D) estimates may be more appropriate for landscapes that are topographically diverse
(Greenberg and McClintock 2008)

12
. While the incorporation of topography has been used in home range estimation for
many species of mammals (i.e., flying squirrels, woodrats, and deer (Stone et al., 1997;
Castleberry et al., 2001; and Campbell et al., 2004)) the third dimension has received
considerably less attention among herpetofauna (Greenburg and McClintock 2008). As a result,
relying on standard two-dimensional estimates of space use alone may limit our understanding of
spatial ecology across a multitude of vertebrates, including large, active foraging snakes that
potentially use a variety of topographically diverse habitats, like the EIS.
This study is part of a range-wide recovery effort for EIS and is the first attempt to
reestablish a population of EIS in the state of Florida. Following the framework of the CNF
reintroduction, we used radio-telemetry to track post-release survival, dispersal patterns, and
habitat and space use of hard-released EIS to ABRP. Our objectives were to report annual
survival of reintroduced EIS, determine whether male EIS had larger home ranges than females,
to explore the use of three-dimensional home range estimation, and to evaluate the influence of
demographic factors (i.e., sex, age class) and release year on dispersal rate. We hypothesize that:
1. Male EIS will have larger home ranges than females
2. EIS will traverse across a topographic gradient unique to our field site (i.e., ravine
slopes during the active season to access wetland/swamp habitat) causing 3D home
ranges to be larger than 2D home ranges.
3. EIS in the first release group will disperse more than EIS in the second release group
because first group snakes will be released onto a landscape lacking conspecifics
13
METHODS
Study Area
This study was conducted at The Nature Conservancy’s (TNC) Apalachicola Bluffs and
Ravines Preserve (ABRP) in the Florida Panhandle. This site consists of 2,548 ha of upland
sandhills and steephead ravines bordering Torreya State Park (5,600 ha) and Beaver Dam Creek
Wildlife Management Area (533 ha), for a total of 8,681 ha of habitat thought to be suitable for
the reintroduction of EIS. Over the last 30 years, the sandhills of ABRP have been transformed.
The return of prescribed fire coupled with novel groundcover restoration tactics implemented by
TNC allowed for establishment of longleaf pine and native groundcover, such as wiregrass
(Astrida stricta). Additionally, recent increases in Gopher Tortoise abundance (David Printiss,
The Nature Conservancy, pers. Communication) have been observed throughout the property,
with which EIS are intimately tied in North Florida. Having addressed the reasons thought to be
responsible for the historic extirpation of EIS on the property, ABRP was selected as the second
reintroduction site as a part of a range-wide recovery effort for the species.
Telemetry
Thirty-two captive-bred Eastern Indigo Snakes were surgically implanted with Holohil
SI-2 radio-transmitters (Holohil Systems Ltd., Ontario, Canada) and PIT tags (AVID, Norco,
California; Reinert and Zappalorti 1982) in 2017 (12 snakes) and 2018 (20 snakes). These
surgeries were performed by Dr. James Bogan, the Central Florida Zoo vet at the Orianne Center
14
for Indigo Conservation (OCIC) when snakes were approximately 944 grams in weight.
Surgeries occurred 1-2 months prior to release onto ABRP, to allow for a heal time of at least 2
sheds. Transmitters weighed 13.5 grams, were 50 mm in length, and 11 mm in width, and
contained batteries designed for 24 months of signal transmission. Twelve snakes (8 males, 4
females) were released between July and August of 2017 and 20 snakes (12 males, 8 females) of
varying release ages (2 to 4) were released between June and August of 2018 (Appendix 1).
Transmitter weight was less than 2.5% of the snake’s weight. All snakes were released during
the day into tortoise burrows selected within the release area (Unit 2; Figure 1) which met the
following specifications: adult-sized (>20 cm), signs of recent tortoise use, and at least 20 m
distance from any other release burrow. All burrows selected for the 2017 release were reused
for the 2018 release. All procedures that involved handling of live snakes were covered under the
following Florida Fish and Wildlife permit: LSSC-16-00041.
A Communications Specialist, Inc. R-1000 Telemetry Receiver (Communications
Specialist Inc., Orange, CA) coupled with a directional 3 element folding Yagi antenna
(Advanced Telemetry Systems, Inc. Isanti, MN) were used to locate snakes via homing 1-2 times
per week. The transmitter range was approximately 300 m. All snake locations were recorded to
the nearest 5m using a hand-held Garmin GPS unit (Garmin Ltd., Olathe, KS). Upon location,
time, date, habitat and refuge type (if below ground) were recorded along with notes on any
behavior observed when snakes were visible.
Sampling Effort
Radio-telemetry studies often suffer from serially autocorrelated data because
observations (or relocations) are not independent in time or space and therefore these data

15
violate assumptions for statistical inferences (De Solla et al. 1999). As a result, many reptile
home range studies advocate for the attempted removal of autocorrelation (Swihart and Slade
1985; Worton 1987). In order to account for this in our data, we used the method of O’Conner et
al. (1994) in a post-hoc analysis to assess the number of recaptures needed to eliminate spatial
autocorrelation allowing us to select a minimum number of locations to achieve a reasonable
estimate of annual home range size for EIS. While the methods of O’Conner et al. (1994) differ
from most conventional methods to handle serial autocorrelation in the data, we chose it because
it was best suited to account for the inconsistencies often associated with exploratory movements
(i.e., short movements interspersed with infrequent, longer movements). We used a custom
program (BASIC programming language) to randomize the first 20 relocations for 10 EIS (8
females, 2 males), generating 10 randomized data sets for each individual. Snakes that had fewer
than 20 relocations were excluded from this analysis, as that was our cut-off for inclusion. We
then calculated 100% minimum convex polygons (MCPs) for each set of randomized locations
for each animal. The program then selected 10 random starting points within the observed
sequence of 20 locations registered for each of the 10 EIS. From each random starting point, a
sequence of 20 locations was generated by concatenating the locations from the random starting
point to the end of the observed sequence and the locations from the first observed location to the
random starting point. Each concatenated sequence was used to calculate 100% MCPs (10
sequential estimates of home range size per animal).
Means and 100% confidence limits were calculated for home ranges generated from the
randomized and concatenated localities of each sample size (Fig. 2). The sample size of
sequential localities large enough to be unaffected by serial autocorrelation was estimated to be
the sample size for which home ranges estimated from concatenated samples no longer were
16
smaller than those estimated from randomized samples of comparable size. Confidence limits for
male and female EIS start to overlap at 11 locations (Fig. 2) which indicates an appropriate
number of locations for sampling effort to truncate our data, leaving us with a total of 16 EIS (10
females, 6 males) to be included in home range analyses. Because no evidence of an asymptote
in home range size was indicated as relocation number increased beyond 11 locations (Fig. 2), all
comparisons of home range size were made for the first 11 relocations.
Survival
In order to examine annual survival for EIS following release, we generated Kaplan-
Meier survival curves for snakes released in each year (2017 and 2018). In 2017, we released a
total of 12 snakes (8 males, 4 females) and censored 5 individuals because they were MIA at the
end of our study and thus we were unable to determine whether they were alive or not. In 2018,
we released 20 snakes (11 males, 9 females) and censored 5 individuals because they were MIA
at the end of our study and again we were unable to determine whether they were alive or not.
Home Range Size
To examine home range size of reintroduced EIS, we calculated 100% minimum convex
polygon (MCP) home ranges (Mohr 1947) for 16 individuals and restricted our analysis to only
include the first 11 relocations which allowed us to maximize our sample size while minimizing
the effects of serial autocorrelation in the data (Figure 2). We also calculated 95% kernel density
estimates (KDEs) and 50% areas of core use (i.e., established areas of familiarity within a home
range where a majority of time is spent (Girard et al. 2002)). EIS with less than 30 relocations
were excluded from these calculations to decrease bias from individuals with fewer observations

17
(Girard et al. 2002), leaving a total of 8 EIS (6 females, 2 males). Program R (R Foundation for
Statistical Computing 2018) was used to calculate 100% MCP home ranges, 95% KDEs and core
areas using 50% UD with the package adehabitatHR (Calenge 2011). We used a reference
bandwidth (h ref) for our smoothing parameter to generate utilization distributions because the h
ref is more likely to include areas used but may have gone undetected due to a lower sampling
regime (Bauder et al. 2015) like the 1-2 times per week tracking regime implemented in our
study for EIS.
Linear regression of 100% MCP (dependent variable) on 95% KDEs (independent
variable), evaluated against a null hypothesis of a slope of 1.0, was used to determine the degree
to which the two methods consistently measured the target entity (Appendix 4) justifying our use
of MCPs instead of KDEs in other analyses. We then used a linear regression to test for an effect
of sex on home range size in EIS using 100% MCP home range estimates. We then plotted our
data, which showed a significant fit to a normal distribution, justifying our use of parametric
statistics.
We also calculated 3D home range estimates (Greenberg and McClintock 2008) using 1/3
arc-second Digital Elevation Model (DEM) data for the study area which were retrieved from the
USGS National Map 3DEP Downloadable Data Collection
(https://viewer.nationalmap.gov/basic/) on April 19th, 2019. The raster DEM layer was imported
into ArcMap 10.5.1 and converted to a Triangular Irregular Networks (TIN) layer using the
Raster to TIN tool. The MCPs for 28 EIS (15 males, 13 females) using all relocations were used
in conjunction with the TIN layer of the study site to determine the three-dimensional home
range area of each snake using the Polygon Volume tool. A custom model was used to iterate the
process for each feature class containing a snake’s home range and to calculate two-dimensional
18
and three-dimensional area statistics, including percent increase of the three-dimensional area
(Appendix 2). A paired t-test was used to determine if home range estimators were significantly
different.
Dispersal
To quantify the rate at which reintroduced EIS dispersed following release, we first used
Program R (R Foundation for Statistical Computing) to calculate 100% MCP (hereafter, MCP)
home ranges for 24 EIS (12 males, 12 females) using the package adehabitatHR (Calenge 2011:
Table 1). MCPs encompassed all locations of individual snakes, excluding their release location.
We included all locations here because we wanted to base our calculation of dispersal on the
entirety of space used by EIS during our study. We then calculated the centroid of each MCP
polygon, and the distance between the MCP centroid and release location for each snake, and
divided this value by the number of days (ranging from 38 to 512 days) over which each snake
was tracked. We considered this value to represent the rate each snake dispersed from its point of
release to create its MCP polygon over the total number of days it was tracked. EIS that had less
than 6 relocations were excluded from these analyses because 6 is the minimum number of
relocations required for the MCP centroid calculation (Calange 2011). We used three-factor
anovas to look at the effect of sex (male and female), release age (age 2 = young; ages 3-4 = old)
and release year (2017 and 2018) on rate of dispersal, and used a corrected sample size Akaike
Information Criterion (AICc) to determine the best model because our sample sizes were small
among our groups. We then ran a post-hoc analysis (TukeyHSD) to test for differences among all
groups.
19
Habitat Use
To summarize habitat use of reintroduced EIS, we extracted landcover data for
Apalachicola Bluffs and Ravines Preserve, in Liberty County, FL from USGS and then used the
landcover data to delineate two habitat types for our field site; uplands and ravine/wetlands.
Habitat types included in the uplands category were forest regeneration areas and upland mixed –
coniferous/hardwood, whereas habitat types included in our ravine/wetlands category were titi
swamps, gum swamps, mixed wetland forest, and bottomland swamps. We calculated the percent
of relocations for all snakes (N = 32) found in either habitat type throughout the course of our
study (July 17th 2017 through January 5th 2019) by month.
RESULTS
Survival
Kaplan-Meier survival estimates for 12 EIS released in 2017 (8 males, 4 females) was
45%, whereas survival estimates for 20 EIS released in 2018 (12 males, 8 females) was 46%
(Figure 6). In 2017, we had 2 females snakes known to be alive, 1 female that died in a
prescribed burn, and 1 female that was removed from the study due to severe injury. We also had
4 males known to have died, 3 more males for which we found bare transmitters for but no
body/remains, and 1 male still remains MIA. In 2018, we had 5 female snakes known to be alive,
3 females known to have died, and 1 female that was considered MIA. We had 1 male known to
be alive, 3 males that died getting hit by cars, 2 other males known to be dead for unknown
reasons, and 5 males considered MIA.
20
Home Range Size
Minimum convex polygon home ranges for EIS using the first 11 relocations (n = 16)
ranged from 1.6 and 34.8 ha, with a mean of 15.0 ha. Female MCPs (n = 11) ranged from 1.6 to
28.1 ha, with a mean of 11.4 ha. Male MCPs (n = 5) ranged from 9.2 to 34.8 ha, with a mean of
23.2 ha (Fig. 3). Our data indicate that MCP home range sizes of reintroduced EIS varied by sex
(F=4.129; df=14; p=0.01) with males on average using larger home ranges than females. Further,
regression of 100% MCP on 95% KDE area was strongly linear (R2 = 0.99) with a slope that did
not differ from 1.0. Similarly, regression of 50% areas of core use on 95% KDE area was
strongly linear (R2 = 0.85) with a slope of 0.15. Thus, the core use area of the home range was
15% of the 100% MCP. Fifty percent areas of core use and 95% KDE areas were calculated for
8 EIS with 30 relocations or more (2 males, 6 females). 50% areas of core use ranged from 3.0 to
46.7 ha, with a mean of 16.0. 50% areas of core use for females (n = 6) ranged from 3.0 to 46.7
with a mean of 15.4. 50% areas of core use for males (n = 2) ranged from 16.0 to 22.7 with a
mean of 19.4. 95% KDE areas ranged from 15.2 to 345.8 with a mean of 96.1. 95% KDE areas
for females (n = 6) ranged from 15.2 to 345.8 with a mean of 97.7. 95% KDEs areas for males (n
= 2) ranged from 83.5 to 98.8 with a mean of 92.
Three-dimensional 100% MCP home ranges calculated for EIS 28 EIS (15 males, 13
females) using all relocations for snakes tracked 1-2 times per week between July 17th 2017 and
January 5th 2019 ranged from 1.62 ha to 271.13 ha, with a mean of 61.78 ha whereas two-
dimensional estimates ranged from 1.6 ha to 266.79 ha with a mean of 60.68 ha (Appendix1)
The paired t-test returned a significant value (df = 54; p = 0.9551) indicating the two home range
estimators are not significantly different from each other.
21
Dispersal
Dispersal rate was best predicted by a three-way interaction between sex, release age and
release year (Table 2). Our post-hoc analysis (TukeyHSD) of the best-fitting ANOVA model (p=
0.004) revealed that younger males released in year 2 dispersed away from the release site more
rapidly than all other groups (Figure 4).
Habitat
Percent use of each habitat type by EIS showed that reintroduced EIS utilized both the
upland sandhills and ravine/wetland habitat on ABRP (Figure 5). However, from December
through May EIS exhibited a shift to exclusive use of sandhills habitat.
DISCUSSION
Two-dimensional 100% MCP home range sizes of EIS released onto ABRP varied by sex
(p = 0.01), with males, on average, maintaining larger home ranges than females (mean: 20.99
vs. 11.38 ha) than females ( mean of 11.38 ha) aligning with patterns of space use reported for
EIS from wild populations and for those reintroduced into CNF (Hyslop et al. 2014; Stiles, J.
2013; Breininger et al. 2011). However, our home range estimates only included the first 11
relocations due to constraints associated with serial autocorrelation in our data. Therefore, our
estimates may not be entirely representative of what constitutes a more conventionally
determined home range calculation. This may be in part why estimates for EIS in our study were
22
considerably smaller than those reported by Stiles (2013) for both soft and hard released EIS into
CNF (mean: 155.7 vs. 61 ha for males and females, respectively) and for those reported by
Breininger et al. (2011; e.g. 156 vs. 44 ha for males and females, respectively). However, the
Breininger et al. study had a much larger sample size of snakes with a much higher number of
fixes for EIS, which may have influenced their results.
Radio-tracked EIS in our study show a seasonal shift in habitat use, explicitly using
upland sandhills habitat during the winter months (December—May), and using a combination
of upland sandhills and ravine/wetland habitat during the summer and autumn months
(November—June). This is similar to the findings of Hyslop (2014) which indicated that while
the presence of thermally stable refugia such as tortoise burrows might drive their exclusive use
of sandhills habitat during the winter and breeding months, that sandhills habitat is used
consistently across every month of tracking in addition to wetland/ravine habitat in the summer
months. However, it is important to note that our release strategies for EIS were structured
around releasing snakes in the middle of summer into tortoise burrows, when they typically only
use these burrows in the winter months. This may have influenced our results, because snakes
were forced to start off in the uplands habitat before they could find their way to wetland
habitats. While we did not do any formal habitat analyses, the data show that the habitat of
ABRP is suitable to support both the wetland habitat needs as well as the overwintering needs of
reintroduced EIS which is vital for snakes.
A paired t-test did not reveal a significant difference in 2D and 3D home range estimates
for EIS in our study (df = 54; p = 0.9551) with a mean of 60.68 ha for 2D estimates and a mean
of 61.78 ha for 3D estimates. One potential explanation for this may be that the use terrain
modeling is more appropriate for the topographic diversity of mountain slopes, much like the

23
Greenburg and McClintock study (2008) whereas ABRP consists of more lower-elevations (i.e.,
floodplain and ravine bottoms) which may be more difficult to represent. However, there may be
fine scale differences in habitat use that could be highlighted in 3D estimations of home range
size—which could be particularly valuable in helping to characterize topographic complexity in
landscapes that snakes occupy (Heard et al. 2004; Moore and Gillingham 2006).
Dispersal data for EIS in our study indicated that young males released in year two
dispersed away from the release sandhills more quickly than all other snakes (p = 0.004). One
possible explanation for this may be that younger, subordinate males released in year 2 of our
study were avoiding the release sandhills that were occupied by larger, more dominant snakes
(Powell 1979; Bauder et al. 2016). Multiple studies have demonstrated that snakes can ascertain
information about conspecifics (i.e., sex and body size) from information in chemical cues
(Powell 1979; Shine et al. 2003; Scott et al. 2013) potentially influencing how individuals
distribute themselves in relation to the presence/absence of others. This may be of particular
importance when thinking about release strategies for EIS in which changes in abundances of
conspecifics (i.e., sex and age class) occur with each release. For example, individuals in the first
release group for a reintroduction effort will experience an “empty” environment (no
conspecifics present), whereas, individuals in subsequent release groups may be exposed to
varying abundances of conspecifics (i.e., age class and sex) (Mihoub et al. 2011; Richardson and
Ewen 2016) that may influence settlement behavior. However, it is important to note that our
dispersal analysis was not set up to formally evaluate intraspecific interactions and that our
sample size was small due to constraints on the assemblage of snakes able to be reintroduced
each year (i.e., sex, age class and total number of individual snakes available for release) –and
therefore our results must be interpreted with some caution.
24
Another potential explanation may be due to differences in body sizes. For example,
many studies indicate a relationship between body size and dispersal behavior in snakes (Hyslop
et al. 2009; Hyslop et al. 2014). Unfortunately we do not have specific size data for EIS in our
study, but if older animals are thought to be larger in size, the EIS we saw with the greatest
dispersal were the younger (potentially smaller) individuals. Further, the associated risks of
exploratory behavior may also be playing a role in dispersal of EIS reintroduced at our field site.
It is common for animals to spend some time exploring their surroundings following release into
the wild before they start to meaningfully move throughout it. As a result, snakes that had longer
periods of exploratory behavior would have inherently dispersed at a greater rate away from the
release sandhills, and it is possible that younger males may exhibit longer exploratory periods
following release when conspecifics are present on the landscape.
Monitoring for survival can be challenging for many wildlife populations. This is
especially true for elusive species like snakes that often occur in low densities, and whose
secretive nature enables them to evade detection (Hyslop et al. 2009; Parker and Plummer 1987).
While the use of radio-telemetry has drastically improved our ability to estimate survival by
allowing researchers to consistently monitor individuals, the behavioral challenges that are
associated with monitoring large, active-foraging snakes like the EIS may still yield incorrect
assessments of survival as the large movements that EIS are capable of making may subject
researchers to lose track of individuals easily and thus being unable to confirm fate of snakes.
Further complicating these assessments are the associated complications with transmitter
surgeries (White and Garrot 1990). For example, some snakes in our study were believed to have
expelled their transmitters, while others had antennae become broken on the inside of snakes –
both of which can influence movement behavior. Further, there may be residual infection as a
25
result of transmitter surgeries (C. Guyer, Pers. Communication) which may further compromise
animal movements.
Kaplan-Meier survival estimates of reintroduced EIS in our study were 45% for 12 EIS (8
males, 4 females) released in 2017, and 46% for 20 EIS (11 males, 9 females) released in 2018.
However, these estimates censored all snakes with unknown fates (i.e., MIA snakes) and in both
years we had a total of 5 individuals that fell under this category. We often assume that snakes
we can no longer detect are likely fine but have just dispersed far from where they were released.
However, these individuals can no longer contribute to reproductive behavior needed in order to
achieve the long-term goal of establishing self-sustaining populations. In comparison to other
studies of snake survival, estimates for EIS at ABRP are considerably lower. For example,
Parker and Plummer (1987) report annual survival of 70% for late-maturing colubrids and 77%
for late-maturing viperids. One potential explanation for why survival estimates in our study are
so low might be due to increased exploratory behavior in reintroduced snakes. For example, two
males in our study that were released in 2018 were hit by cars within a month of release
(probably as a result of abnormal dispersal behavior following release). The more exploratory
movements there are, the more likely snakes are to encounter risky situations (i.e., encounters
with predators, crossing roads) and because these snakes were released into novel environments,
we might speculate that initial exploratory dispersal from the release site can be linked with the
low survival for EIS in our study. It is also important to consider that while we treat MIA snakes
as alive in these survival estimates, they are functionally dead in regards to the main goal of the
reintroduction: to establish self-sustaining populations at release sites. If snakes are dispersing so
far from the release site that we are unable to detect them, they are not contributing to
achievement of this goal.
26
In contrast, survival data reported for EIS by Hyslop (2009) indicated a
disproportionately higher mortality in female snakes while our study documented a
disproportionately higher mortality of males. Physiological stressors brought on by breeding
behavior (i.e., gestation and oviposition) have been identified as contributing factors to higher
female mortality in some snakes (Bonnet et al. 1999; Parker and Plummer 1987). Despite the
higher female mortality reported by Hyslop (2009) they were unable to report direct observations
of mortality related to reproductive behaviors. However it is important to note that even with the
help of radio-telemetry EIS is an incredibly elusive species that spends most of its time in
tortoise burrows during the breeding season, which could make it difficult for researchers to
appropriately collect meaningful data on deaths occurring during these times. This is important
to consider as we think about what success looks like for EIS reintroductions. For example,
because male survival has been almost non-existent (only 1 male known to be alive) the
opportunities for females to participate in reproductive behavior are incredibly low. Therefore,
the risks associated with gestation and oviposition that have been identified as driving factors of
lower survival in breeding female snakes are not coming in to play in our study yet. Once males
survive long enough to breed with females, we might speculate that female survival would suffer
decreases as a result. Therefore, we should identify a number of female snakes that need to be
released every year in order to best account for this in the beginning stages of EIS
reintroductions to ensure continued reproductive success. Further, Hyslop (2009) data also
indicated lower survival associated with larger snakes. While we did not collect data on EIS
body size per se, if we assume that body size and age are correlative (i.e., the older the animal
the larger it should be) our survival data suggest the opposite to be true. Of all known surviving
EIS at ABRP, all survivors except one were reproductively mature individuals.
27
Table 1. Data summarizing radio-telemetry tracking efforts for two groups of reintroduced
Eastern Indigo Snakes (Drymarchon couperi) to Apalachicola Bluffs and Ravines Preserve,
Liberty County, FL in 2017 (8 males, 4 females) and 2018 (11 males, 9 females). All snakes
were tracked 1-2 times a week between July 17th 2017 and January 5th 2019. Snakes considered
to be “young” were released at age 2, and snakes considered to be “old” were released between
the ages of 3 and 4. Fates for all MIA snakes and bare transmitter snakes are considered to be
unknown.
Sex Release Age Release Year Days Tracked Number of Relocations Fate
F Young 2017 347 40 Alive
F Young 2017 209 25 Removed
F Old 2017 291 31 Dead
F Old 2017 512 70 Alive
M Old 2017 110 15 Bare Transmitter*
M Young 2017 53 10 Bare Transmitter*
M Old 2017 80 16 Dead
M Old 2017 85 17 Dead
M Old 2017 38 17 MIA*
M Old 2017 33 6 Dead
M Old 2017 209 12 Bare Transmitter*
M Young 2017 117 16 Dead
F Old 2018 100 19 Dead
F Young 2018 24 5 Dead
F Old 2018 166 30 Dead
F Old 2018 168 30 Alive
F Old 2018 168 33 Alive
F Old 2018 165 11 Alive
F Old 2018 165 30 MIA*
F Old 2018 163 16 Alive
F Young 2018 164 13 Alive
M Young 2018 88 10 Dead on Road
M Young 2018 30 6 Dead on Road
M Old 2018 168 11 Dead on Road
M Young 2018 50 10 Dead
M Old 2018 142 17 Dead
M Old 2018 165 30 Alive
M Young 2018 43 4 MIA*
M Young 2018 36 5 MIA*
M Young 2018 30 2 MIA*
28
M Young 2018 63 3 MIA*
M Young 2018 0 0 MIA*
Table 2. Comparison of linear models for rate of dispersal in Eastern indigo snakes (Drymarchon
couperi) reintroduced to Apalachicola Bluffs and Ravines Preserve, Liberty County, FL in 2017
and 2018 using an Akaike Information Criterion (AICc). 12 snakes were released in 2017 (8
males and 4 females) and 20 snakes were released in 2018 (11 males and 9 females). Snakes
ranged from 2-4 years of age at release. Dispersal was estimated using the average distance
between the release site and the geometric mean of a 100% minimum convex polygon of each
snake, and dividing this value by the number of days each snake was tracked. Snakes that had
less than the minimum required number of relocations (6) were excluded from this analysis,
leaving a total of 24 snakes (12 males and 12 females).
Model K AICc Delta_AICc AICcWt
Cum.Wt LL
release age * sex * release year 9 151.49 0 0.79 1 -60.32
release age * release year + sex 6 154.13 2.64 0.21 0.21 -68.59
release age + release year + sex 5 166.52 15.03 0 0 -76.59
release age *sex + release year 6 168.09 16.6 0 0 -75.57
release age + release year * sex 6 169.38 17.89 0 0 -76.22
Table 3. Comparison of 100% MCP & 94% KDE home range sizes, and 50% areas of core use
reported in hectares for 8 EIS (2 males, 6 females) tracked between July 17th 2017 and January
5th 2019 that had a minimum of 30 relocations.
Sex 100% MCP 95% KDE 50% KDE
F 356.06 345.85 46.74
F 119.88 97.72 23.79
F 83.45 60.56 7.57
F 21.73 19.93 4.02
F 48.43 46.95 7.41
F 16.53 15.24 2.97
M 112.79 98.85 22.71
M 85.2 83.54 16.01
29
Figure 1. Map of ABRP and bordering protected areas of land (Torreya State Park & Beaver
Dam Creek Wildlife Management Area) creating a total of 8,681 ha of suitable habitat for EIS.
Each Unit indicates an area proposed as a release site within ABRP. All EIS released between
2017 and 2018 were released in Unit 1.
30
Figure 2. Effect of sample effort on home range area of 8 female (A) and 2 male (B)
reintroduced EIS from Apalachicola Bluffs and Ravines Preserve, Florida. Sample effort is based
on random (filled triangles, independent) and consecutive (filled circles; serially autocorrelated)
tracking locations (see text). Vertical lines represent 95% CI.
-20
0
20
40
60
80
100
120
0 5 10 15 20 25 30 35 40 45
Perc
ent
Tota
l Mea
n
Number of Locations
A
Consecutive
Random
-20
0
20
40
60
80
100
120
0 10 20 30 40
Perc
ent
Tota
l Mea
n
Number of Locations
B
Consecutive
Random
31
Figure 3. Box and whisker plot comparing mean 100% MCP home range sizes of 16 EIS (6
males, 10 females).
0
10
20
30
F M
Sex
HR
_S
ize
32
Figure 4. Three-way interaction of release year (1= 1st year, 2= 2nd year), release age (young=
age 2, old= ages 3+) and sex (m=male, f=female) on predicted values of rate of dispersal (meters
moved per day) in reintroduced EIS. A indicates the significantly different group (young males
released in year 2) and Bs indicate all other groups that did not differ significantly in their
dispersal rates.
B
B
A
B
BB
B
B
M F
1 2 1 2
0
10
20
30
Release year
Ra
te o
f dis
pe
rsal
Release age
Young
Old
33
Figure 5. Percent use of habitat by reintroduced Eastern Indigo Snakes (N=32) on Apalachicola
Bluffs and Ravines Preserve in Liberty County, FL. Landcover data was delineated for all
relocations collected for snakes tracked from July 17th 2017 through January 5th 2019.
34
Figure 6. Kaplan-Meier Survival curves for reintroduced Eastern Indigo Snakes onto
Apalachicola Bluffs and Ravines Preserve, FL in 2017 and 2018. In 2017, 12 EIS were released
(8 males, 4 females) and survival was 45%. In 2018, 20 EIS were released (11 males, 9 females)
and survival was 46%. All snakes that were considered to be MIA at the completion of our study
along with snakes for which bare transmitters were found were censored in our curves to be
treated as alive.
0
0.2
0.4
0.6
0.8
1
1.2
1 3 5 7 9 11 13 15 17 19 21 23 25 27 29 31 33 35 37 39 41 43 45 47 49
Perc
ent
Surv
ival
Week
2017 Release
0
0.2
0.4
0.6
0.8
1
1.2
1 3 5 7 9 11 13 15 17 19 21 23 25 27 29 31 33 35 37 39 41
Perc
ent
Surv
ival
Weeks
2018 Release
35
References
Alford, R.A., and S.J., Richards. (1999). Global amphibian declines: a problem in applied
ecology. Annual Review of Ecology and Systematics 30:133-165
Armstrong, D.P., & Seddon, P.J. (2008). Directions in reintroduction biology. Trends in
ecology & evolution, 23(1), 20-25.
Bauder, J.M., Breinniger, D.R., Bolt, M.R., Legare, M.L., Jenkins, C.L., Rothermel, B.B.,
McGarigal, K. (2016). Seasonal variation in Eastern Indigo Snake (Drymarchon couperi)
movement patterns and space use in peninsular Florida at multiple temporal scales.
Herpetologica, 72(3): 214-226
Bauder, J. M., Breininger, D. R., Bolt, M. R., Legare, M. L., Jenkins, C. L., Rothermel, B. B., &
McGarigal, K. (2016). The influence of sex and season on conspecific spatial overlap in a
large, actively-foraging colubrid snake. PLoS One, 11(8), e0160033.
Bauder, J. M., Breininger, D. R., Bolt, M. R., Legare, M. L., Jenkins, C. L., & McGarigal, K.
(2015). The role of the bandwidth matrix in influencing kernel home range estimates for
snakes using VHF telemetry data. Wildlife Research, 42(5), 437-453.
Bonnet, X., Naulleau, G., & Shine, R. (1999). The dangers of leaving home: dispersal and
mortality in snakes. Biological conservation, 89(1), 39-50
Brown, G. P., & Weatherhead, P. J. (1999). Female distribution affects mate searching and
sexual selection in male northern water snakes (Nerodia sipedon). Behavioral Ecology
and Sociobiology, 47(1-2), 9-16.
Breininger, D. R., Bolt, M. R., Legare, M. L., Drese, J. H., & Stolen, E. D. (2011). Factors
influencing home-range sizes of eastern indigo snakes in central Florida. Journal of
Herpetology, 45(4), 484-490.*
36
Bruner, A.G., R.E. Gullison, R.E. Rice, and G.A.B. DA Fonesca. 2001. Effectiveness of parks in
protecting tropical biodiversity. Science 291: 125-128
Calenge, C. (2011). Home range estimation in R: the adehabitatHR package. Office national de
la classe et de la faune sauvage: Saint Benoist, Auffargis, France.
Campbell, T. A., Laseter, B. R., Ford, W. M., & Miller, K. V. (2004). Topographic home ranges
of white-tailed deer in the central Appalachians. Southeastern Naturalist, 3(4), 645-652.
Castleberry, S. B., Ford, W. M., Wood, P. B., Castleberry, N. L., & Mengak, M. T. (2001).
Movements of Allegheny woodrats in relation to timber harvesting. The Journal of
wildlife management, 148-156.
Clark, R. W., Brown, W. S., Stechert, R., & Greene, H. W. (2012). Cryptic sociality in
rattlesnakes (Crotalus horridus) detected by kinship analysis. Biology Letters, 8(4), 523-
525.
De Solla, S. R., Bonduriansky, R., & Brooks, R. J. (1999). Eliminating autocorrelation reduces
biological relevance of home range estimates. Journal of animal ecology, 68(2), 221-234.
Diemer, J. E., & Speake, D. W. 1983. The distribution of the eastern indigo snake, Drymarchon
corais couperi, in Georgia. Journal of Herpetology, 256-264.
Dodd, C. K., Jr, & Seigel, R. A. (1991). Relocation, repatriation, and translocation of amphibians
and reptiles: are they conservation strategies that work? Herpetologica, 336-350.
Dodd, C.K., Jr. (1987). Status, conservation and management. In: R.A. Seigel, J.T. Collins, and
S.S. Novak (eds.), Snakes: Ecology and Evolutionary Biology, pp. 478-513. McGraw-
Hill, New York, USA.
Doody, J. S., Burghardt, G. M., & Dinets, V. (2013). Breaking the social–non‐social dichotomy:
a role for reptiles in vertebrate social behavior research?. Ethology, 119(2), 95-103.
37
Durso A.M., Willson J.D., and Winne C.T. 2011. Needles in haystacks: Estimating detection
probability and occupancy of rare and cryptic snakes. Biological Conservation 144:1508-
1515
Enge, K. M., Stevenson, D. J., Elliott, M. J., & Bauder, J. M. 2013. The historical and current
distribution of the eastern indigo snake (Drymarchon couperi). Herpetological
Conservation and Biology, 8(2), 288-307.
Engstrom, R.T., R.L. Crawford, and W.W. Baker. (1984). Breeding bird populations in relation
to changing forest structure following fire exclusion – a 15-year study. Wilson Bulletin
96:437-450.
Ervin, J. (2003). Protected area assessments in perspective. Bioscience 53: 819-822
Fischer, J., & Lindenmayer, D. B. (2000). An assessment of the published results of animal
relocations. Biological conservation, 96(1), 1-11.
Folt, B., McGowan, C. P., Steen, D. A., Piccolomini, S., Hoffman, M., Godwin, J. C., & Guyer,
C. (2020). Modeling strategies and evaluating success during repatriations of elusive and
endangered species. Animal Conservation, 23(3), 273-285.
Frost, C.C. (1993). Four centuries of changing landscape patterns in the longleaf pine ecosystem.
Tall Timbers Fire Ecol. Conf. 18: 17-44.
Germano, J. M., & Bishop, P. J. (2009). Suitability of amphibians and reptiles for
translocation. Conservation Biology, 23(1), 7-15.
Gibbons, J.W., D.E. Scott, T.J. Ryan, K.A., Buhlmann, T.D. Tuberville, B.S. Metts, J. L. Greene,
T. Mills, Y. Leiden, S. Poppy, and C.T. Winne. 2000. The global decline of reptiles, déjà
vu amphibians. Bioscience 50:653-666
Gibbons, J.W., V.J., Burke, J.E., Lovich, R.D., Semlitsch, T.D., Tuberville, J.R., Bodie, J.L.,
38
Greene, P.H., Niewiarowski, H.H., Whiteman, D.E., Scott, J.H., Pechmann, C.R.,
Harrison, S.H., Bennet, J.D., Krenz, M.S., Mills, T., Lamb, M.E., Dorcas, J.D., Congdon,
M.H., Smith, D.H., Nelson, M.B., Dietsch, H.G., Hanlin, J.A., Ott, and D.J., Karapatakis.
(1997). Perceptions of species abundance, distribution, and diversity: Lessons from four
decades of sampling on a government-managed reserve. Environmental Management
21:259-268
Girard, I., Ouellet, J. P., Courtois, R., Dussault, C., & Breton, L. (2002). Effects of sampling
effort based on GPS telemetry on home-range size estimations. The Journal of Wildlife
Management, 1290-1300
Gitzen R.A., Keller B.J., Miller M.A., Goetz S.M., Steen D.A., Jachowski D.D., Godwin J.C.,
and Millspaugh J.J. (2016). Effective and Purposeful Monitoring of Species
Reintroduction. Page 395 in D. Jachowski, J.J. Millspaugh, P.L. Angermeier, and R.H.
Slotow, editors. Reintroduction of Fish and Wildlife Populations, University of California
Press.
Greenberg, D. B., & McClintock, W. J. (2008). Remember the third dimension: terrain modeling
improves estimates of snake home range size. Copeia, 2008(4), 801-806.
Griffith, B., Scott, J. M., Carpenter, J. W., & Reed, C. (1989). Translocation as a species
conservation tool: status and strategy. Science, 245(4917), 477-480.
Groves, F. 1960. The eggs and young of Drymarchon corais couperi. Copeia 1960:51-53.
Guyer, C., & Bailey, M. A. (1993, May). Amphibians and reptiles of longleaf pine communities.
In Proceedings of the Tall Timbers fire ecology conference (Vol. 18, pp. 139-158).
Guyer, C., M.A. Bailey, and R.H. Mount. 2019. Lizards and Snakes of Alabama. University of
Alabama Press.
39
Heard, G. W., Black, D., & Robertson, P. (2004). Habitat use by the inland carpet python
(Morelia spilota metcalfei: Pythonidae): seasonal relationships with habitat structure and
prey distribution in a rural landscape. Austral Ecology, 29(4), 446-460.
Hemson, G., Johnson, P., South, A., Kenward, R., Ripley, R., & McDonald, D. (2005). Are
kernels the mustard? Data from global positioning system (GPS) collars suggests
problems for kernel home-range analyses with least-squares cross-validation. Journal of
Animal Ecology, 455-463.
Hyslop, N. L., Meyers, J. M., Cooper, R. J., & Stevenson, D. J. (2014). Effects of body size and
sex of Drymarchon couperi (eastern indigo snake) on habitat use, movements, and home
range size in Georgia. The Journal of Wildlife Management, 78(1), 101-111.
Hyslop N.L., Cooper R.J., and Meyers J.M. 2009. Seasonal shifts in shelter and microhabitat
use of the threatened Eastern Indigo snake (Drymarchon couperi) in Georgia. Copeia
2009:460-466.
Jachowski, D. S., Millspaugh, J. J., Angermeier, P. L., & Slotow, R. (Eds.).
(2016). Reintroduction of fish and wildlife populations. Univ of California Press.
Litt, A. R., Provencher, L., Tanner, G. W., & Franz, R. (2001). Herpetofaunal responses to
restoration treatments of longleaf pine sandhills in Florida. Restoration Ecology, 9(4),
462-474.
Landers J.L., and D.W. Speake. 1980. Management needs of sandhill reptiles in southern
Georgia. Proceedings Annual of the Conference of the Southeastern Association of Fish
and Wildlife Agencies. 34:515-529
Layne, J.N., and T.M. Steiner. 1996 Eastern Indigo Snake (Drymarchon corais couperi):
40
Summary of Research Conducted on Archbold Biological Station. Report 43910-6-0134.
U.S. Fish and Wildlife Service, Jackson, MO.
McCartney, J. M., Gregory, P. T., & Larsen, K. W. (1988). A tabular survey of data on
movements and home ranges of snakes. Journal of Herpetology, 61-73.
Means, D.B. 2006. Vertebrate faunal diversity of longleaf pine ecosystems. Pp. xxx-xxx in S.
Jose, E.J. Jokela, and D.L. Miller (eds) The Longleaf Pine Ecosystem: Ecology,
Silviculture, and Restoration. Springer
Mertz, D. B. (1971). The mathematical demography of the California Condor population. The
American Naturalist, 105(945), 437-453.
Mihoub, J. B., Robert, A., Le Gouar, P., & Sarrazin, F. (2011). Post-release dispersal in animal
translocations: social attraction and the “vacuum effect”. PLoS One, 6(12), e27453.
Moler, P.E. 1992. Eastern Indigo Snake Drymarchon corias couperi (Holbrook). Pp. 181-186 In
Rare and Endangered Biota of Florida, Volume 3, Amphibians and Reptiles. Moler, P.
(Ed.). University Press of Florida, Gainesville, Florida, USA.
Moore, J. A., & Gillingham, J. C. (2006). Spatial ecology and multi-scale habitat selection by a
threatened rattlesnake: the eastern massasauga (Sistrurus catenatus
catenatus). Copeia, 2006(4), 742-751.
Moulis, R.A. 1976. Autecology of the Eastern Indigo Snake, Drymarchon corais couperi.
Bulletin of New York Herpetological Society 12:14-23.
Mushinsky, H.R., and E.D. McCoy. (1985). On the relationship between fire periodicity, plant
structure and herpetofaunal communities in Florida. American Zoologist 25:A9-A9.
Nathan, R., Getz, W. M., Revilla, E., Holyoak, M., Kadmon, R., Saltz, D., & Smouse, P. E.
41
(2008). A movement ecology paradigm for unifying organismal movement
research. Proceedings of the National Academy of Sciences, 105(49), 19052-19059.
Nichols, J.D., and Armstrong, D.P. 2012. Monitoring for Reintroductions. Pages 223-255.
Reintroduction Biology: Integrating Science and Management
Noss, R.F., B. Csuiti, and M.J. Groom. 2006. Habitat Fragmentation. Pp. 213-252 in M.J.
Groom, G.K. Meffe, and C.R. Caroll (eds.), Principles of Conservation Biology. Sinauer
Associates, Inc., USA.
Noss R.F., LaRoe, E.T., Scott., J.M. 1995. Endangered ecosystems of the United States: a
preliminary assessment of loss and degradation. USDI National Biological Service,
Biological Report 28.
Noss R.F., and R.L., Peters. 1995. Endangered ecosystems: a status report on America’s
vanishing habitat and wildlife. Defenders of Wildlife, Washington, D.C.
O'Connor, M. P., Zimmerman, L. C., Ruby, D. E., Bulova, S. J., & Spotila, J. R. (1994). Home
range size and movements by desert tortoises, Gopherus agassizii, in the eastern Mojave
Desert. Herpetological Monographs, 60-71.
O’Connor, P.F. 1991. Captive propagation and post-copulatory plugs of the eastern indigo snake,
Drymarchon corais couperi. Vivarium 3:32-35.
Parker, W., & Plummer, M. (1987). Population ecology. In ‘Snakes: Ecology and Evolutionary
Biology’.(Eds RA Seigel, JT Collins, and SS Novak.) pp. 253–301.
Powell, R. A. (1979). Mustelid spacing patterns: variations on a theme by Mustela. Zeitschrift für
Tierpsychologie, 50(2), 153-165.
R Foundation for Statistical Computing (2018). Program R version 3.4.4. R Foundation for
Statistical Computing
42
Reinert, H. K., & Zappalorti, R. T. (1988). Timber rattlesnakes (Crotalus horridus) of the Pine
Barrens: their movement patterns and habitat preference. Copeia, 964-978.
Richardson, K. M., & Ewen, J. G. (2016). Habitat selection in a reintroduced population:
social effects differ between natal and post‐release dispersal. Animal Conservation, 19(5),
413-421.
Richardson, K. M., Doerr, V., Ebrahimi, M., Lovegrove, T. G., & Parker, K. A. (2015).
Considering dispersal in reintroduction and restoration planning. Advances in
reintroduction biology of Australian and New Zealand fauna, 59-72.
Row, J. R., & Blouin-Demers, G. 2006. Kernels are not accurate estimators of home range size
for herpetofauna. Copeia 2006:797-802.
Seaman, D. E., Millspaugh, J. J., Kernohan, B. J., Brundige, G. C., Raedeke, K. J., & Gitzen, R.
A. (1999). Effects of sample size on kernel home range estimates. The journal of wildlife
management, 739-747.
Scott ML, Whiting MJ, Webb JK, Shine R (2013) Chemosensory discrimination of social cues
mediates space use in snakes, Cryptophis nigrescens (Elapidae). Anim Behav 85: 1493–
1500.
Seddon, P. J., Armstrong, D. P., & Maloney, R. F. (2007). Developing the science of
reintroduction biology. Conservation Biology, 21(2), 303-312.
Shine, R., & Mason, R. T. (2012). An airborne sex pheromone in snakes. Biology letters, 8(2),
183-185.
Shine, R., Shine, T., Shine, J. M., & Shine, B. G. (2005). Synchrony in capture dates suggests
cryptic social organization in sea snakes (Emydocephalus annulatus,
Hydrophiidae). Austral Ecology, 30(7), 805-811.
43
Shine R, Phillips B, Waye H, LeMaster M, Mason RT (2003) Chemosensory cues allow courting
male garter snakes to assess body length and body condition of potential mates. Behav
Ecol Sociobiol 54: 162–166.
Smith C.R. 1978. Ecology of juvenile and gravid eastern indigo snakes in north Florida. Thesis,
Auburn University, Auburn, Alabama, USA.
Silva, I., Crane, M., Marshall, B. M., & Strine, C. T. (2020). Revisiting reptile home ranges:
moving beyond traditional estimators with dynamic Brownian Bridge Movement
Models. bioRxiv.
Speake D.W., J. Diemer, and J. McGlincy. 1982. Eastern indigo snake recovery plan. U.S. Fish
and Wildlife Service, Atlanta, Georgia, USA.
Speake D.W. and McGlincy J.A. 1981. Response of eastern indigo snakes to gassing their dens.
Proc Annu Conf Southeast Assoc Fish Wildl Agencies 35:135-138
Speake D.W., J.A. McGlincy, and T.R. Colvin. 1978. Ecology and management of the eastern
indigo snake in Georgia: a progress report. In: Odum R.R., Landers J.L. (eds) Rare and
endangered wildlife symposium. Georgia Department of Natural Resources, Game and
Fish Division Technical Bulliten WL 4. Social Circle, Georgia, pp 64-67.
Steen, D. A., Stiles, J. A., Stiles, S. H., Godwin, J. C., & Guyer, C. R. A. I. G. (2016).
Observations of feeding behavior by reintroduced Indigo Snakes in southern
Alabama. Herpetological Review, 47(1), 11-13.
Steen, D. A., McClure, C. J., Brock, J. C., Craig Rudolph, D., Pierce, J. B., Lee, J. R., ... &
Baxley, D. L. (2014). Snake co‐occurrence patterns are best explained by habitat and
hypothesized effects of interspecific interactions. Journal of Animal Ecology, 83(1), 286-
295.
44
Steen, D.A. 2010. Snakes in the grass: Secretive natural histories defy both conventional and
progress statistics. Herpetological Conservation and Biology 5:183-188
Stevenson, D. J., Bolt, M. R., Smith, D. J., Enge, K. M., Hyslop, N. L., Norton, T. M., & Dyer,
K. J. (2010). Prey records for the eastern indigo snake (Drymarchon
couperi). Southeastern Naturalist, 9(1), 1-18.
Stevenson, D. J., Enge, K. M., Carlile, L. D., Dyer, K. J., Norton, T. M., Hyslop, N. L., & Kiltie,
R. A. (2009). An eastern indigo snake (Drymarchon couperi) mark-recapture study in
southeastern Georgia. Herpetological Conservation and Biology, 4(1), 30-42.
Stiener, T.M. J.O.L., Bass and J.A. Kushlan. 1983. Status of the eastern indigo snake in southern
Florida National Parks and vicinity. South Florida Research Center Report SFRC-83/01,
Everglades National Park, Homestead, Florida, USA.
Stiles, J. (2013). Evaluating the Use of Enclosures to Reintroduce Eastern Indigo
Snakes (Masters thesis).
Stiles, S. (2013). Seasonal habitat and shelter selection by reintroduced eastern indigo snakes in
Conecuh National Forest, Alabama (Masters thesis).
Stiles, S. H., Stiles, J. A., Godwin, J. C., Jenkins, C., Rush, E. M., Lock, B., Johnson, V. M.,
Wines, M., and Guyer, C. (2013). Repatriation of eastern indigo snakes to conservation
lands in South Alabama, USA. 37-41. In Soorae, P. S. (ed.) Global Re-introduction
Perspectives: 2013. Further case studies from around the globe. Gland, Switzerland:
IUCN/SSC Re-introduction Specialist Group and Abu Dhabi, UAE: Environmental
Agency-Abu Dhabi
Stone, K. D., Heidt, G. A., Caster, P. T., & Kennedy, M. L. (1997). Using geographic
45
information systems to determine home range of the southern flying squirrel (Glaucomys
volans). American Midland Naturalist, 106-111.
Swihart, R. K., & Slade, N. A. (1985). Influence of sampling interval on estimates of home-
range size. The Journal of Wildlife Management, 1019-1025.
Trani-Griep, M.K. (2002). Maintaining species in the south. Pages 1-45 in D.N. Wear, and J. G.
Gries, editors. The Southern Forest Resource Assessment. U.S. Forest Service General
Technical Report SRS-54, Southern Research Station, Asheville, North Carolina, USA.
U.S. Fish and Wildlife Service (USFWS). 1978. Endangered and threatened wildlife and plants:
listing of the eastern indigo snake as a threatened species. Federal Register 43:4026-4028
Van Lear, D.H., W.D. Carroll, P.R. Kapeluck, and R. Johnson. 2005. History and restoration of
the longleaf pine-grassland ecosystem: implications for species at risk. Forest Ecology
and Management. 211:150-156.
Worton, B. J. (1989). Kernel methods for estimating the utilization distribution in home‐range
studies. Ecology, 70(1), 164-168.
Waser, P. M., & Wiley, R. H. (1979). Mechanisms and evolution of spacing in animals. In Social
behavior and communication (pp. 159-223). Springer, Boston, MA.
Wilcove, D. S., Rothstein, D., Dubow, J., Phillips, A., & Losos, E. (1998). Quantifying threats to
imperiled species in the United States. BioScience, 48(8), 607-615.
Wilson, E.O. (1999). The Diversity of Life. W.W. Norton and Company, USA.
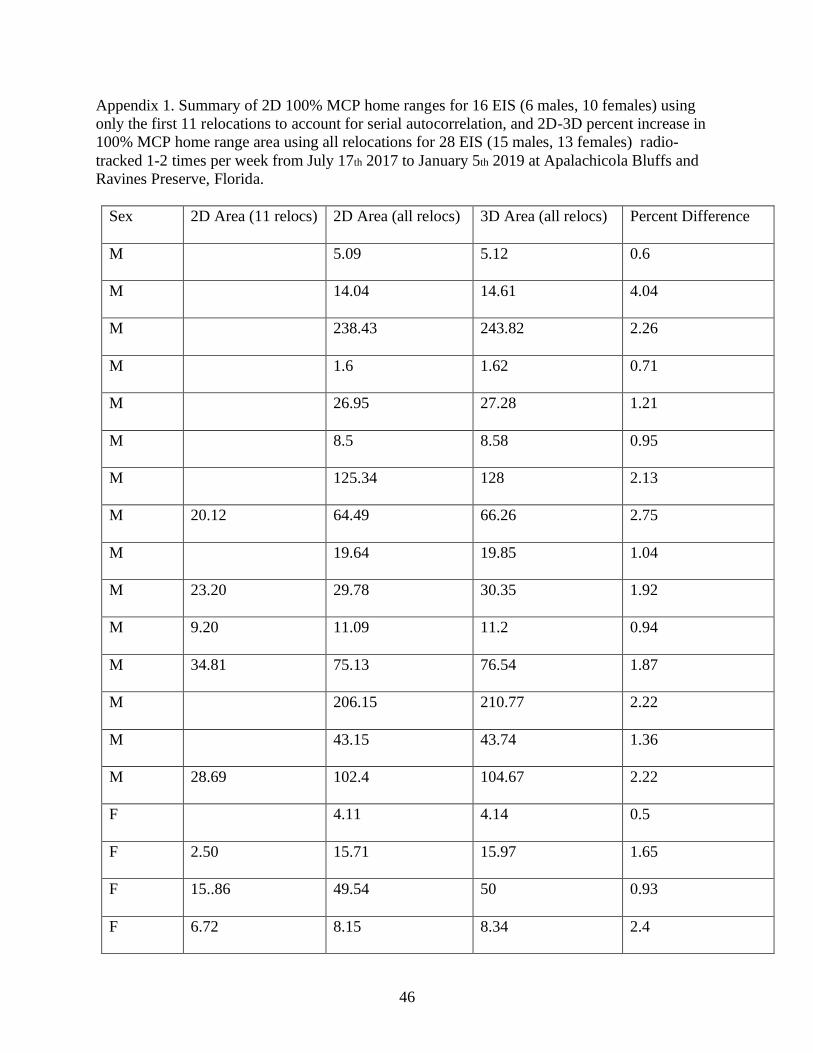
46
Appendix 1. Summary of 2D 100% MCP home ranges for 16 EIS (6 males, 10 females) using
only the first 11 relocations to account for serial autocorrelation, and 2D-3D percent increase in
100% MCP home range area using all relocations for 28 EIS (15 males, 13 females) radio-
tracked 1-2 times per week from July 17th 2017 to January 5th 2019 at Apalachicola Bluffs and
Ravines Preserve, Florida.
Sex 2D Area (11 relocs) 2D Area (all relocs) 3D Area (all relocs) Percent Difference
M 5.09 5.12 0.6
M 14.04 14.61 4.04
M 238.43 243.82 2.26
M 1.6 1.62 0.71
M 26.95 27.28 1.21
M 8.5 8.58 0.95
M 125.34 128 2.13
M 20.12 64.49 66.26 2.75
M 19.64 19.85 1.04
M 23.20 29.78 30.35 1.92
M 9.20 11.09 11.2 0.94
M 34.81 75.13 76.54 1.87
M 206.15 210.77 2.22
M 43.15 43.74 1.36
M 28.69 102.4 104.67 2.22
F 4.11 4.14 0.5
F 2.50 15.71 15.97 1.65
F 15..86 49.54 50 0.93
F 6.72 8.15 8.34 2.4
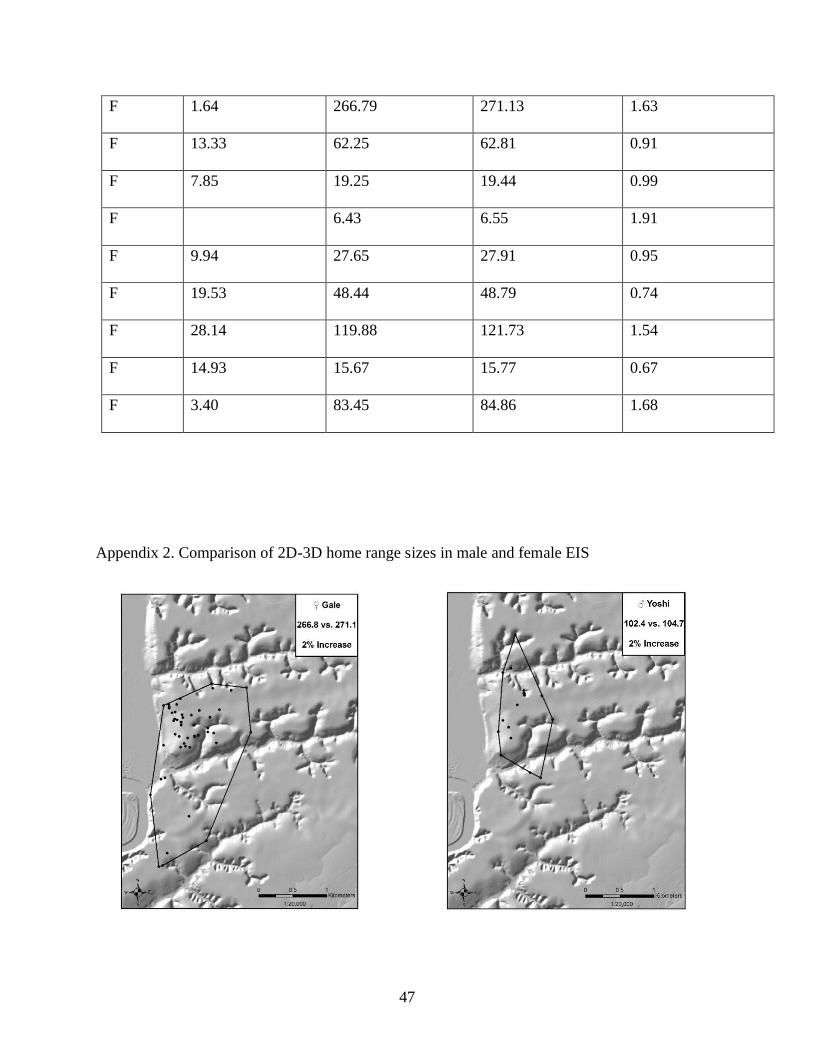
47
F 1.64 266.79 271.13 1.63
F 13.33 62.25 62.81 0.91
F 7.85 19.25 19.44 0.99
F 6.43 6.55 1.91
F 9.94 27.65 27.91 0.95
F 19.53 48.44 48.79 0.74
F 28.14 119.88 121.73 1.54
F 14.93 15.67 15.77 0.67
F 3.40 83.45 84.86 1.68
Appendix 2. Comparison of 2D-3D home range sizes in male and female EIS
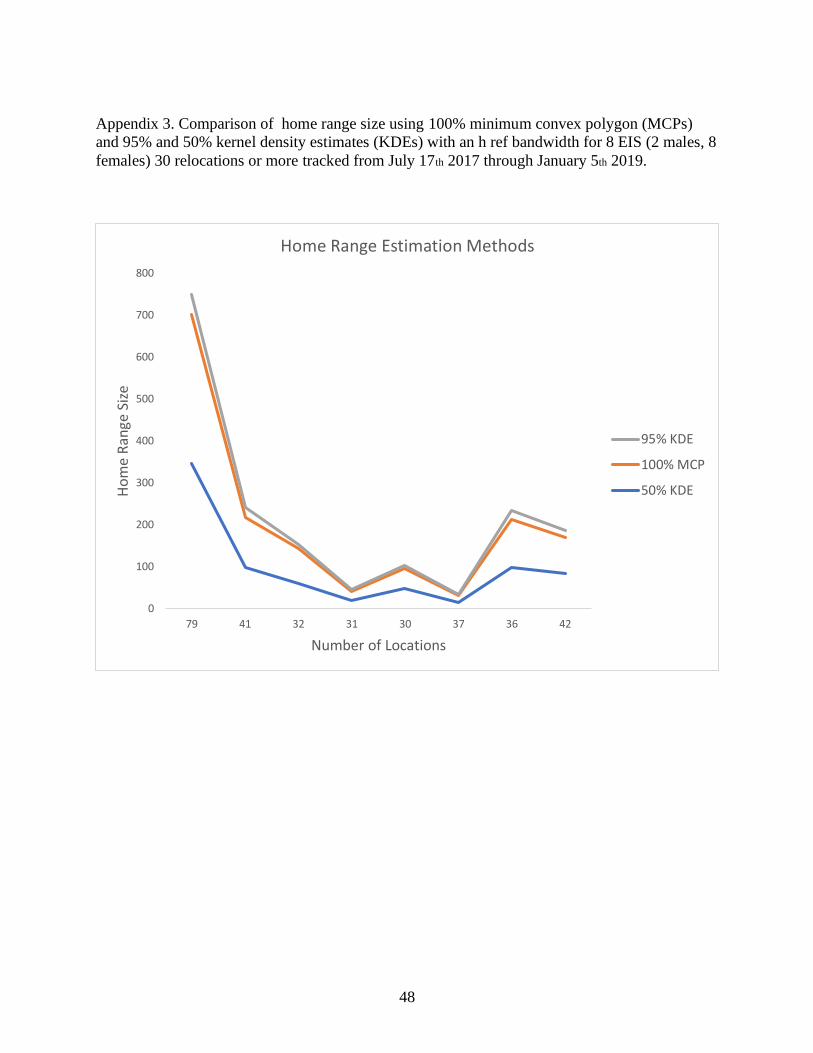
48
Appendix 3. Comparison of home range size using 100% minimum convex polygon (MCPs)
and 95% and 50% kernel density estimates (KDEs) with an h ref bandwidth for 8 EIS (2 males, 8
females) 30 relocations or more tracked from July 17th 2017 through January 5th 2019.
0
100
200
300
400
500
600
700
800
79 41 32 31 30 37 36 42
Ho
me
Ran
ge S
ize
Number of Locations
Home Range Estimation Methods
95% KDE
100% MCP
50% KDE

49


![Uncovering Patterns of Suspension of Movement Patterns of Suspension of Movement D ... monica.wachowicz, henjo.deknegt, arend.ligtenberg, arnold.bregt] ... Kuijpers B, Macedo JAF,](https://img.pdfslide.us/doc/110x75/5aa34a5d7f8b9ada698e0e75/uncovering-patterns-of-suspension-of-movement-patterns-of-suspension-of-movement.jpg)