Embed Size (px)
Citation preview
Technical Report Documentation Page
1. Report No.
FHWA/TX-02/1473-S
2. Government Accession No. 3. Recipient’s Catalog No.
4. Title and Subtitle
Evaluation of Minimum Longitudinal Reinforcement
5. Report Date
October 1998
Requirements for Reinforced Concrete Columns 6. Performing Organization Code
7. Author(s) 8. Performing Organization Report No.
Paul H. Ziehl, Jeffrey E. Cloyd, and Michael E. Kreger Research Report 1473-S
9. Performing Organization Name and Address 10. Work Unit No. (TRAIS)
Center for Transportation Research
The University of Texas at Austin
3208 Red River, Suite 200
Austin, TX 78705-2650
11. Contract or Grant No.
Research Study 0-1473
12. Sponsoring Agency Name and Address
Texas Department of Transportation�
Research and Technology Implementation Office
P.O. Box 5080
13. Type of Report and Period Covered
Final
Austin, TX 78763-5080 14. Sponsoring Agency Code
15. Supplementary Notes
Project conducted in cooperation with the U.S. Department of Transportation, Federal Highway Administration,
and the Texas Department of Transportation.
16. Abstract
Existing minimum longitudinal reinforcement requirements for columns were developed to prevent passive yielding
of reinforcement resulting from creep deformations in the concrete. Tests used to support this limit were conducted
decades ago when steel yield strengths for reinforcing bars were approximately half of what is common today. The
design of a very large percentage of columns in TxDOT bridges is typically controlled by minimum eccentricity of
loads, implying a substantial reduction in column steel and resulting economic savings might be possible with
present-day materials.
.
17. Key Words
concrete, creep, reinforcing steel, shrinkage
18. Distribution Statement
No restrictions. This document is available to the public through the National Technical Information Service, Springfield, Virginia 22161.
19. Security Classif. (of report)
Unclassified
20. Security Classif. (of this page)
Unclassified
21. No. of pages
128
22. Price
Form DOT F 1700.7 (8-72) Reproduction of completed page authorized

Evaluation of Minimum Longitudinal Reinforcement
Requirements for Reinforced Concrete Columns
by
Paul H. Ziehl, Jeffrey E. Cloyd, and Michael E. Kreger
Research Report 1473-S
Research Project 0-1473
��������������
TEXAS DEPARTMENT OF TRANSPORTATION
in cooperation with the
U.S. DEPARTMENT OF TRANSPORTATION
Federal Highway Administration
by the
Center for Transportation Research
Bureau of Engineering Research
The University of Texas at Austin
����������
iv
DISCLAIMERS
The contents of this report reflect the views of the authors, who are responsible for the facts
and the accuracy of the data presented herein. The contents do not necessarily reflect the
official views or policies of the Federal Highway Administration or the Texas Department of
Transportation. This report does not constitute a standard, specification, or regulation.
There was no invention or discovery conceived or first actually reduced to practice in the
course of or under this contract, including any art, method, process, machine, manufacture,
design or composition of matter, or any new and useful improvement thereof, or any variety
of plant which is or may be patentable under the patent laws of the United States of America
or any foreign country.
NOT INTENDED FOR CONSTRUCTION,
BIDDING OR PERMIT PURPOSES
Michael E. Kreger, P.E., Texas #65541
Research Supervisor
IMPLEMENTATION
This research study was conducted with the intent of reducing the required minimum
longitudinal reinforcement ratio for columns subjected to axial load in combination with
minimal bending moment. However, although simple concrete creep models suggest that
longitudinal reinforcement ratios reduced below the current 1 percent requirement will
prevent passive yielding of longitudinal reinforcement, results of the long-term creep tests
reported herein do not support this hypothesis. Therefore, the current AASHTO requirement
for minimum longitudinal reinforcement in columns should remain at 1 percent of gross-
section area.
ACKNOWLEDGEMENTS
The research study reported herein involved the long-term monitoring of reinforced concrete
columns under sustained axial load. The report is based on portions of theses published at
The University of Texas by Paul H. Ziehl and Jeffrey E. Cloyd. In addition to these co-
authors of the report, the authors are indebted to a number of other graduate students and
undergraduate students who assisted with fabrication of testing apparatuses and specimens,
and loading of the specimens. The overall project was greatly enhanced by the technical
assistance provided during the planning stages of the testing program by Mr. David W.
McDonnold (TxDOT Project Director) of the TxDOT Design Division.
v
SUMMARY
Existing minimum longitudinal reinforcement requirements for columns were developed to
prevent passive yielding of reinforcement resulting from creep deformations in the concrete.
Tests used to support this limit were conducted decades ago when steel yield strengths for
reinforcing bars were approximately half of what is common today. The design of a very
large percentage of columns in TxDOT bridges is typically controlled by minimum
eccentricity of loads, implying a substantial reduction in column steel and resulting economic
savings might be possible with present-day materials.
Twenty-four reinforced concrete column specimens were cast and subjected to a sustained
axial load of 0.4fc'Ag. Long-term axial deformations of the column specimens were
monitored using electronic and mechanical strain gages. An additional 14 unloaded
specimens were cast to monitor temperature and shrinkage-related deformations. All
specimens were housed in reduced-humidity enclosures. Test variables included nominal
concrete compressive strengths of 4000 and 8000 psi, longitudinal reinforcement ratios of
0.36, 0.54, and 0.72 percent, and eccentricity of axial load equal to zero or 0.10 times the
column diameter. Plots of measured strain versus time are presented for all specimens, and
experimental results are compared with an analytical model reported by ACI Committee 209.
Final recommendations for column longitudinal reinforcement are presented.

vi
vii
TABLE OF CONTENTS
Chapter 1: Introduction......................................................................................................... 1 1.1 Background .................................................................................................................................1
1.2 Objective and Scope of This Investigation .................................................................................1
1.2.1 Experimental ........................................................................................................................2
1.2.2 Analytical .............................................................................................................................2
Chapter 2: Review Of Literature On Creep And Shrinkage Of Reinforced Concrete
Columns............................................................................................................... 9 2.1 Introduction .................................................................................................................................9
2.2 Davis and Davis(1)
(March 1931) ...............................................................................................9
2.3 Richart and Staehle( 2)
–Second Progress Report–University of Illinois (March 1931).............10
2.4 Slater and Lyse(3)
–Second Progress Report–Lehigh University (March 1931) .......................13
2.5 Richart and Staehle(4)
–Fourth Progress Report–University of Illinois (January 1932) ............15
2.6 Lyse and Kreidler(5)
–Fourth Progress Report–Lehigh University (January 1932) ..................19
2.7 Lyse(6)
–Fifth Progress Report–Lehigh University (June 1933) ...............................................21
2.8 Richart(7)
–Tentative Final Report of Committee 105 (February 1933)....................................23
2.9 Logeman, Mensch, DiStasio(8)
–Discussion of Report of Committee 105
(Sept.–Oct. 1933).....................................................................................................................24
2.10 Richart(9)
–Discussion of Committee Report 105, Closure by Chairman,
Committee 105 (Nov.–Dec. 1933)..........................................................................................24
2.11 Conclusions .............................................................................................................................24
Chapter 3: Experimental Program...................................................................................... 27 3.1 Introduction ...............................................................................................................................27
3.2 Column Details..........................................................................................................................27
3.3 Reduced-Humidity Environment ..............................................................................................32
3.4 Materials....................................................................................................................................38
3.4.1 Concrete .............................................................................................................................38
3.4.2 Reinforcing Steel ...............................................................................................................38
3.4.3 Fiberglass Reinforced Plastic.............................................................................................38
3.5 Manufacture of Test Specimens................................................................................................39
3.5.1 Columns .............................................................................................................................39
3.5.1.1 Formwork ...................................................................................................................39
3.5.1.2 Casting ........................................................................................................................39
3.5.1.3 Curing .........................................................................................................................39
3.5.1.4 Application of Fiber-Reinforced Plastic.....................................................................39
3.5.2 Cylinders ............................................................................................................................39
3.6 Testing Appurtenances..............................................................................................................40
3.6.1 Columns .............................................................................................................................40
3.6.1.1 Test Frames.................................................................................................................40
3.6.1.2 Strain Measurements ..................................................................................................41
3.6.1.3 Testing Procedure.......................................................................................................45
3.6.2 Concrete Cylinders.............................................................................................................46
3.6.3 Reinforcing Steel ...............................................................................................................46
viii
Chapter 4: Experimental Test Results ................................................................................ 47 4.1 Introduction ...............................................................................................................................47
4.2. Individual Column Specimens .................................................................................................48
4.2.1 Concentrically Loaded Specimens.....................................................................................49
4.2.1.1 8,000 psi......................................................................................................................49
4.2.1.2 4,000 psi......................................................................................................................59
4.2.1.3 General Discussion .........................................................................................................68
4.2.2 Eccentrically Loaded Specimens .......................................................................................68
4.2.2.1 8,000 psi......................................................................................................................68
4.2.2.2 4,000 psi......................................................................................................................70
4.2.3 Unloaded Specimens..........................................................................................................72
4.2.3.1 8,000 psi......................................................................................................................72
4.2.3.2 4,000 psi......................................................................................................................79
4.3 Comparison of Concentrically Loaded Specimens ...................................................................86
4.3.1.1 8,000 psi......................................................................................................................87
4.3.1.2 4,000 psi......................................................................................................................90
4.3.1.3 General Discussion.....................................................................................................92
4.4 Concrete Cylinders....................................................................................................................93
4.5 Reinforcing Steel.......................................................................................................................97
Chapter 5: Comparison of Experimental Results with ACI 209R-86 .............................. 99 5.1 Introduction ...............................................................................................................................99
5.2 Summary of ACI 209R-86 Procedure .......................................................................................99
5.3 Comparison of Predicted and Experimental Results...............................................................105
5.4 General Discussion..................................................................................................................107
5.4.1 8,000 psi Specimens.........................................................................................................107
5.4.2 4,000 psi Specimens.........................................................................................................108
Chapter 6: Summary And Conclusions ............................................................................ 111 6.1 Introduction .............................................................................................................................111
6.2 Experimental Investigation .....................................................................................................111
6.3 Comparison of Experimental Results with Predicted Analytical Results...............................111
6.4 Conclusions .............................................................................................................................112
6.5 Further Research .....................................................................................................................113
REFERENCES.................................................................................................................... 115
ix
List of Figures
Figure 1.1 Schematic of Reinforced Concrete Column....................................................... 4
Figure 3.1 Typical ColumnEelevation............................................................................... 28
Figure 3.2 Column Specimen Cross Sections ................................................................... 29
Figure 3.3 Enclosure No. 1–Locations of Test Specimens................................................ 32
Figure 3.4 Enclosure No. 2–Locations of Test Specimens................................................ 33
Figure 3.5 Temperature and Humidity History for Group 1 Specimens ........................... 34
Figure 3.6 Temperature and Humidity History for Group 2 Specimens ........................... 35
Figure 3.7 Temperature and Humidity History for Group 3 Specimens ........................... 36
Figure 3.8 Temperature and Humidity History for Group 4 Specimens ........................... 37
Figure 3.9 Schematic Side and Front Views of Test Setup ............................................... 40
Figure 3.10 Vertical Location of Demec Points .................................................................. 42
Figure 3.11 Plan Location of Demec Points ........................................................................ 43
Figure 3.12 Vertical Location of Electrical Gages .............................................................. 44
Figure 3.13 Plan Location of Electrical Gages .................................................................... 45
Figure 4.1 Mechanical Strain Gage Data for Specimen C8-00 ......................................... 49
Figure 4.2 Mechanical Strain Gage Data for Specimen C8-36-1 ...................................... 50
Figure 4.3 Mechanical Strain Gage Data for Specimen C8-36-2 ...................................... 51
Figure 4.4 Mechanical Strain Gage Data for Specimen C8-36-3 ...................................... 52
Figure 4.5 Mechanical Strain Gage Data for Specimen C8-54-1 ...................................... 53
Figure 4.6 Mechanical Strain Gage Data for Specimen C8-54-2 ...................................... 54
Figure 4.7 Mechanical Strain Gage Data for Specimen C8-54-3 ...................................... 55
Figure 4.8 Mechanical Strain Gage Data for Specimen C8-72-1......................................... 56
Figure 4.9 Mechanical Strain Gage Data for Specimen C8-72-2......................................... 57
Figure 4.10 Mechanical Strain Gage Data for Specimen C8-72-3....................................... 58
Figure 4.11 Mechanical Strain Gage Data for Specimen C4-00 .......................................... 59
Figure 4.12 Mechanical Strain Gage Data for Specimen C4-36-1....................................... 60
Figure 4.13 Mechanical Strain Gage Data for Specimen C4-36-2....................................... 61
Figure 4.14 Mechanical Strain Gage Data for Specimen C4-36-3....................................... 62
Figure 4.15 Mechanical Strain Gage Data for Specimen C4-54-1....................................... 63
Figure 4.16 Mechanical Strain Gage Data for Specimen C4-54-2....................................... 64
Figure 4.17 Mechanical Strain Gage Data for Specimen C4-54-3....................................... 65
Figure 4.18 Mechanical Strain Gage Data for Specimen C4-72-1....................................... 66
Figure 4.19 Mechanical Strain Gage Data for Specimen C4-72-2....................................... 67
Figure 4.20 Mechanical Strain Gage Data for Specimen C4-72-3....................................... 68
Figure 4.21 Mechanical Strain Gage Data for Specimen E8-36 .......................................... 69
Figure 4.22 Mechanical Strain Gage Data for Specimen E8-72 .......................................... 70
Figure 4.23 Mechanical Strain Gage Data for Specimen E4-36 .......................................... 71
Figure 4.24 Mechanical Strain Gage Data for Specimen E4-72 .......................................... 72
Figure 4.25 Mechanical Strain Gage Data for Specimen U8-NS-1 ..................................... 73
Figure 4.26 Mechanical Strain Gage Data for Specimen U8-NS-2 ..................................... 74
Figure 4.27 Mechanical Strain Gage Data for Specimen U8-00-1........................................ 75
Figure 4.28 Mechanical Strain Gage Data for Specimen U8-00-2....................................... 76
x
Figure 4.29 Mechanical Strain Gage Data for Specimen U8-36.......................................... 77
Figure 4.30 Mechanical Strain Gage Data for Specimen U8-54.......................................... 78
Figure 4.31 Mechanical Strain Gage Data for Specimen U8-72.......................................... 79
Figure 4.32 Mechanical Strain Gage Data for Specimen U4-NS-1 ..................................... 80
Figure 4.33 Mechanical Strain Gage Data for Specimen U4-NS-2 ..................................... 81
Figure 4.34 Mechanical Strain Gage Data for Specimen U4-00-1....................................... 82
Figure 4.35 Mechanical Strain Gage Data for Specimen U4-00-2....................................... 83
Figure 4.36 Mechanical Strain Gage Data for Specimen U4--36......................................... 84
Figure 4.37 Mechanical Strain Gage Data for Specimen U4-54.......................................... 85
Figure 4.38 Mechanical Strain Gage Data for Specimen U4-72.......................................... 86
Figure 4.39 Comparison of 8 ksi Specimens........................................................................ 87
Figure 4.40 Comparison of 8 ksi Specimens–0.0036 Reinforcement Ratio ........................ 88
Figure 4.41 Comparison of 8 ksi Specimens–0.0054 Reinforcement Ratio ........................ 89
Figure 4.42 Comparison of 8 ksi Specimens–0.0072 Reinforcement Ratio ........................ 89
Figure 4.43 Comparison of 4 ksi Specimens........................................................................ 90
Figure 4.44 Comparison of 4 ksi Specimens–0.0036 Reinforcement Ratio ........................ 91
Figure 4.45 Comparison of 4 ksi Specimens–0.0054 Reinforcement Ratio ........................ 91
Figure 4.46 Comparison of 4 ksi Specimens–0.0072 Reinforcement Ratio ........................ 92
Figure 4.47 Strength and Modulus Data for Group 1........................................................... 94
Figure 4.48 Strength and Modulus Data for Group 2........................................................... 95
Figure 4.49 Strength and Modulus Data for Group 3........................................................... 96
Figure 4.50 Strength and Modulus Data for Group 4........................................................... 97
Figure 5.1 Comparison of Strains Predicted by ACI 209 and Strains Measured in
Columns of Group 1......................................................................................... 107
Figure 5.2 Comparison of Strains Predicted by ACI 209 and Strains Measured in
Columns of Group 2......................................................................................... 108
Figure 5.3 Comparison of Strains Predicted by ACI 209 and Strains Measured in
Columns of Group 3......................................................................................... 109
Figure 5.4 Comparison of Strains Predicted by ACI 209 and Strains Measured in
Columns of Group 4......................................................................................... 109
xi
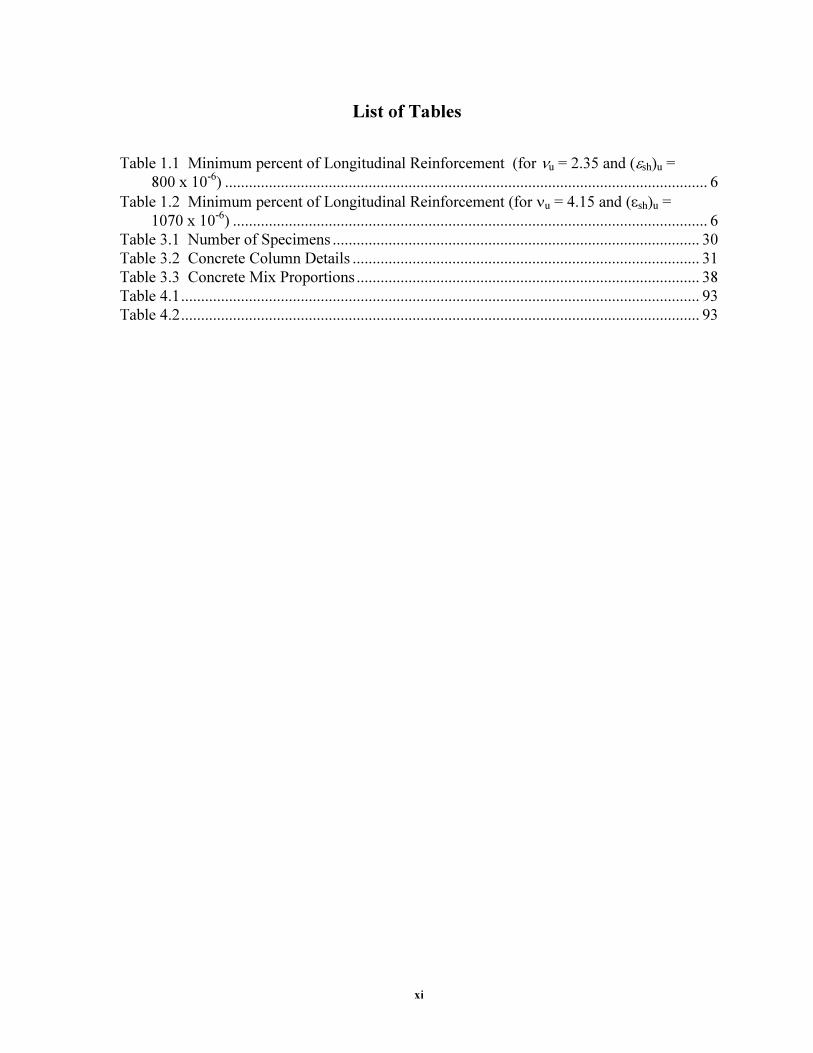
List of Tables
Table 1.1 Minimum percent of Longitudinal Reinforcement (for νu = 2.35 and (εsh)u =
800 x 10-6
) ......................................................................................................................... 6
Table 1.2 Minimum percent of Longitudinal Reinforcement (for νu = 4.15 and (εsh)u =
1070 x 10-6
) ....................................................................................................................... 6
Table 3.1 Number of Specimens ............................................................................................ 30
Table 3.2 Concrete Column Details ....................................................................................... 31
Table 3.3 Concrete Mix Proportions ...................................................................................... 38
Table 4.1.................................................................................................................................. 93
Table 4.2.................................................................................................................................. 93

xii
1
CHAPTER 1
INTRODUCTION
1.1 BACKGROUND
Since the 1930’s a minimum reinforcement ratio of 1 percent (based on cross-sectional area
computed using gross-section dimensions) has been required in reinforced concrete columns
and piers. This minimum quantity of reinforcement was intended to prevent “passive
yielding” of the longitudinal reinforcement which occurs when load is transferred gradually
from concrete to steel as the concrete deforms (creeps) under sustained axial load.
The 1 percent minimum reinforcement ratio was based on tests conducted during the 1920’s
and 30’s(1-9)
using low to medium-strength materials; nominal concrete compressive strengths
were in the range of 2,000 to 5,000 psi and the steel yield strength was in the range of 39 to
54 ksi. The 1 percent limit was first published as part of a committee document by the
American Concrete Institute–American Society of Civil Engineers (ACI-ASCE) Joint
Committee 105 in 1933(7)
, and was adopted in the Building Code(10)
published by ACI in
1935. These documents are discussed in Chapter 2.
Today, structural concrete compressive strengths below 4,000 psi are uncommon and can
easily range up to 10,000 psi. In addition, today’s common reinforcing steel has a nominal
yield strength of 60 ksi. As a result, it is possible that tests conducted more than 60 years ago
and the code limit for minimum column longitudinal reinforcement are no longer valid for
today’s columns constructed with modern construction materials.
Recent analysis of the minimum reinforcement ratio in reinforced concrete columns (ASCE-
ACI Committee 441 - Concrete Columns) indicates that it may now be appropriate to reduce
the minimum reinforcement ratio to approximately 0.5 percent. However, before such a
change is made, it is prudent to verify this limit with a comprehensive experimental study.
Because a substantial percentage of all bridge piers require less than the minimum 1 percent
longitudinal reinforcement to satisfy strength demands, use of the current minimum
reinforcement requirements may result in nearly twice as much longitudinal reinforcement in
these piers as may be needed to withstand the effects of creep. Reduction of the minimum
longitudinal reinforcement requirement would result in economic savings in the form of
reduced material and related transportation costs, savings in labor costs resulting from
placing fewer longitudinal bars and the modest added benefit of reduced congestion in piers.
1.2 OBJECTIVE AND SCOPE OF THIS INVESTIGATION
The objective of this investigation was to determine the behavior of reinforced concrete
columns which are reinforced with less than the current code-required minimum longitudinal
reinforcement ratio of 1.0 percent (AASHTO Standard Specifications for Highway Bridges18
Section 8.18.1.2 and ACI 318-9511 Section 10.9.1). It was hoped that this lower limit of
1.0 percent could be reduced for certain cases. The applicable code/specification section are
quoted below:
2
AASHTO 8.18.1.2–The minimum area of longitudinal reinforcement shall not
be less than 0.01 times the gross area, Ag, of the section.
ACI 10.9.1–Area of longitudinal reinforcement for non-composite
compression members shall not be less than 0.01 nor more than 0.08 times
gross area Ag of section.
The work described herein includes experimental tests that incorporated variable concrete
strengths, reinforcement ratios, concentric versus eccentric application of axial loads, and
comparison of experimental results with long-term responses predicted by the analytical
method recommended by ACI Committee 209R-86(12)
.
1.2.1 EXPERIMENTAL
A total of 38 conventionally-reinforced concrete columns were cast and tested. Each column
had a nominal cross-sectional diameter of 8 inches and was 4 feet long. Of the 38 columns,
24 were subjected to axial load. The applied axial load was 0.40*fc'*Ag for all but one of the
axially-loaded specimens. This load corresponds with the maximum service load which can
be derived from the AASHTO Bridge Specification 18 (Section 8.16.4.2.1) and ACI
318-95(12)
( Section 10.3.5.) for required strength of a tied column (using the approximation
Ag*fc' equal to the strength of the column). The load was maintained with heavy coil springs.
The columns were cast in cardboard forms, and the forms were stripped five days after
concrete placement. Columns were loaded between 14 and 28 days after casting. Strain
measurements were made using mechanical Demec gages and electrical strain gages.
Ambient humidity in the enclosures containing the test specimens was reduced as much as
was practical and affordable within the budget of the research project. Details of the
experimental program are discussed in greater detail in Chapter 3.
The following variables were investigated:
1. Concrete Strength
Nominal design strengths (at 28 days) of 4,000 psi and 8,000 psi.
2. Reinforcement percentage
Reinforcement percentages of 0.36 percent, 0.54 percent, and 0.72 percent.
3. Eccentricity
No eccentricity and eccentricity equal to 0.10*column diameter.
To determine material properties, several 4 by 8 inch and 6 by 12 inch cylinders were cast
with each group of columns. Cylinders were tested for modulus of elasticity and compressive
strength evaluation at 7, 14, 28, and 56 days after casting. Longitudinal steel specimens were
tested for yield and ultimate strength.
1.2.2 ANALYTICAL
Concrete exhibits pronounced visco-elastic behavior during loading and immediately
thereafter. This visco-elastic behavior tends to decrease with time, and after several years the
deformation under sustained stress tends to a limiting value(13)
.
This visco-elastic behavior is commonly referred to as creep. Two types of creep are
generally discussed. The first is referred to as basic creep. This is creep which occurs
3
without moisture exchange (i.e., the creep that would occur if specimens were stored in a
saturated environment). The second type is drying creep. Drying creep may be thought of as
shrinkage enhanced by applied stress(14)
.
The following conditions tend to increase creep in concrete(14)
:
1. Increased water-cement ratio
2. High permeability aggregates
3. Early loading
4. Increased ambient temperature
5. Reduced ambient humidity, and
6. Reduced volume-to-surface area ratio
These same factors (with the exception of early loading) tend to increase shrinkage.
The report ACI 209R-86(12)
entitled “Prediction of Creep, Shrinkage, and Temperature
Effects in Concrete Structures” presents an analytical procedure to predict creep and
shrinkage strains in unreinforced concrete. These predicted values can then be applied to
reinforced concrete members, and ultimate values for creep and shrinkage strains in the
member can be obtained. The ACI 209R-86 method is described in detail and is applied to
the test columns in Chapter 5. It is noted that the ACI 209 procedure does not distinguish
between basic and drying creep.
In the ACI Structural Journal paper entitled, “Longitudinal Steel Limits for Concrete
Columns” by C.H. Lin and R. W. Furlong(15)
, two rationales are proposed for establishing a
lower limit for longitudinal reinforcing steel. The first rationale is developed on the basis of
limiting the size of tension cracks in the concrete column. This rationale does not rely on
creep and shrinkage effects and is not considered in this report. The second rationale is based
on the prevention of passive yielding of longitudinal reinforcement. Passive yielding will
occur if strains in the concrete column due to load, creep, and shrinkage surpass the yield
strain of the reinforcing steel.
The following is a brief summary of the rationale developed in the paper “Longitudinal Steel
Limits for Concrete Columns” for preventing passive yielding of the reinforcing steel. ACI
318 load factors, which were used by Lin and Furlong in their assessment of reinforcement
limits, are used here also.
As concrete undergoes shrinkage and creep, compressive force is transferred to the
longitudinal reinforcing steel. Total stress in the longitudinal reinforcement is the sum of the
stress under service load and the stresses due to creep and shrinkage. For the prevention of
passive yielding, it is necessary to impose a lower limit on the steel ratio.
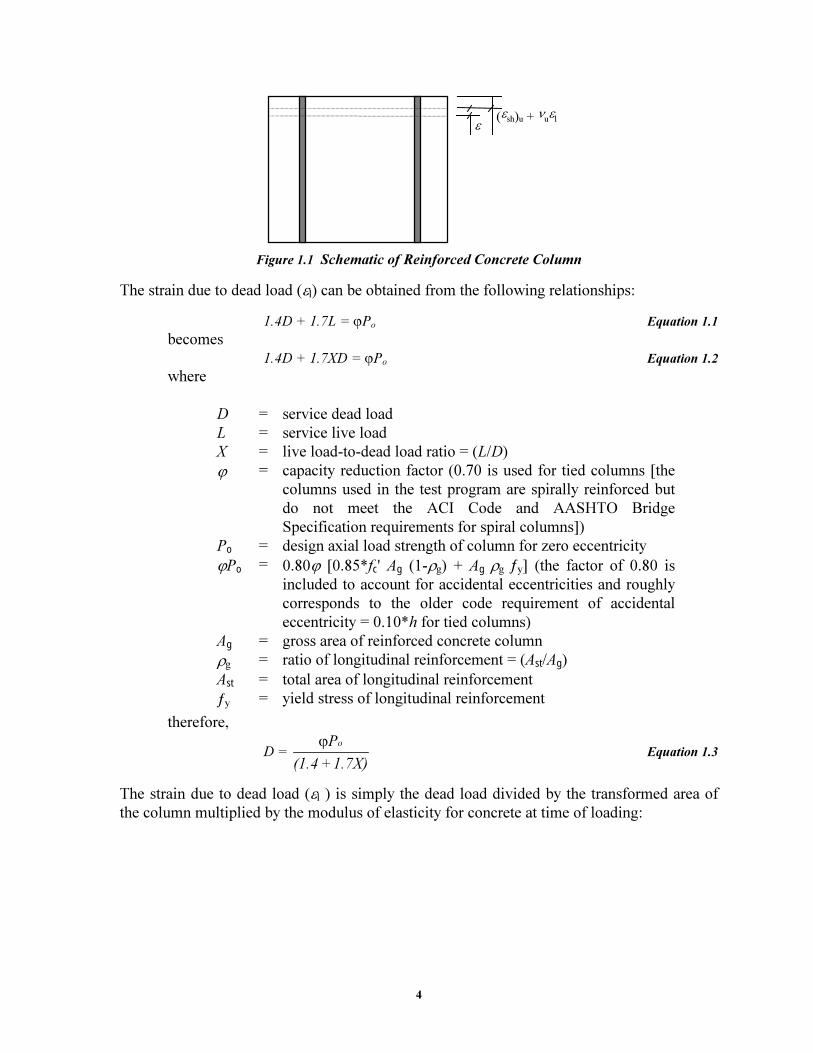
Figure 1.1 is of use in understanding the relationships developed.
4
(εsh)u + νuεlε
Figure 1.1 Schematic of Reinforced Concrete Column
The strain due to dead load (εl) can be obtained from the following relationships:
1.4D + 1.7L = ϕPo Equation 1.1
becomes
1.4D + 1.7XD = ϕPo Equation 1.2
where
D = service dead load
L = service live load
X = live load-to-dead load ratio = (L/D)
ϕ = capacity reduction factor (0.70 is used for tied columns [the
columns used in the test program are spirally reinforced but
do not meet the ACI Code and AASHTO Bridge
Specification requirements for spiral columns])
Po = design axial load strength of column for zero eccentricity
ϕPo = 0.80ϕ [0.85*fc' Ag (1-ρg) + Ag ρg ƒy] (the factor of 0.80 is
included to account for accidental eccentricities and roughly
corresponds to the older code requirement of accidental
eccentricity = 0.10*h for tied columns)
Ag = gross area of reinforced concrete column
ρg = ratio of longitudinal reinforcement = (Ast/Ag)
Ast = total area of longitudinal reinforcement
ƒy = yield stress of longitudinal reinforcement
therefore,
D =
1.7X)+(1.4
Poϕ Equation 1.3
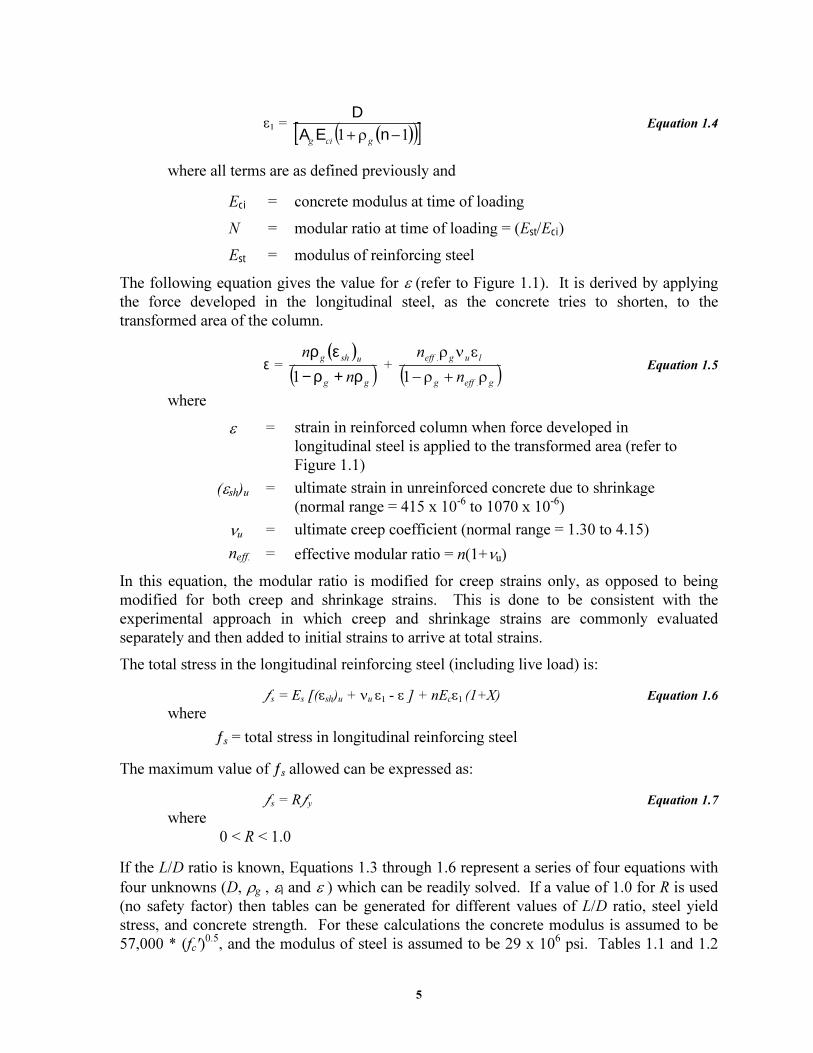
The strain due to dead load (εl ) is simply the dead load divided by the transformed area of
the column multiplied by the modulus of elasticity for concrete at time of loading:
5
ε1 =
( )( )[ ]11 −ρ+ nEA
D
gcig
Equation 1.4
where all terms are as defined previously and
Eci = concrete modulus at time of loading
N = modular ratio at time of loading = (Est/Eci)
Est = modulus of reinforcing steel
The following equation gives the value for ε (refer to Figure 1.1). It is derived by applying
the force developed in the longitudinal steel, as the concrete tries to shorten, to the
transformed area of the column.
ε =
( )
( )gg
ushg
n
n
ρ+ρ−
ερ
1 +
( )geffg
lugeff
n
n
ρ+ρ−
ενρ
.
.
1 Equation 1.5
where
ε = strain in reinforced column when force developed in
longitudinal steel is applied to the transformed area (refer to
Figure 1.1)
(εsh)u = ultimate strain in unreinforced concrete due to shrinkage
(normal range = 415 x 10-6
to 1070 x 10-6
)
νu = ultimate creep coefficient (normal range = 1.30 to 4.15)
neff. = effective modular ratio = n(1+νu)
In this equation, the modular ratio is modified for creep strains only, as opposed to being
modified for both creep and shrinkage strains. This is done to be consistent with the
experimental approach in which creep and shrinkage strains are commonly evaluated
separately and then added to initial strains to arrive at total strains.
The total stress in the longitudinal reinforcing steel (including live load) is:
ƒs = Es [(εsh)u + νu ε1 - ε ] + nEcε1 (1+X) Equation 1.6
where
ƒs = total stress in longitudinal reinforcing steel
The maximum value of ƒs allowed can be expressed as:
ƒs = Rƒy Equation 1.7
where
0 < R < 1.0
If the L/D ratio is known, Equations 1.3 through 1.6 represent a series of four equations with
four unknowns (D, ρg , εl and ε ) which can be readily solved. If a value of 1.0 for R is used
(no safety factor) then tables can be generated for different values of L/D ratio, steel yield
stress, and concrete strength. For these calculations the concrete modulus is assumed to be
57,000 * (fc')0.5
, and the modulus of steel is assumed to be 29 x 106 psi. Tables 1.1 and 1.2
6
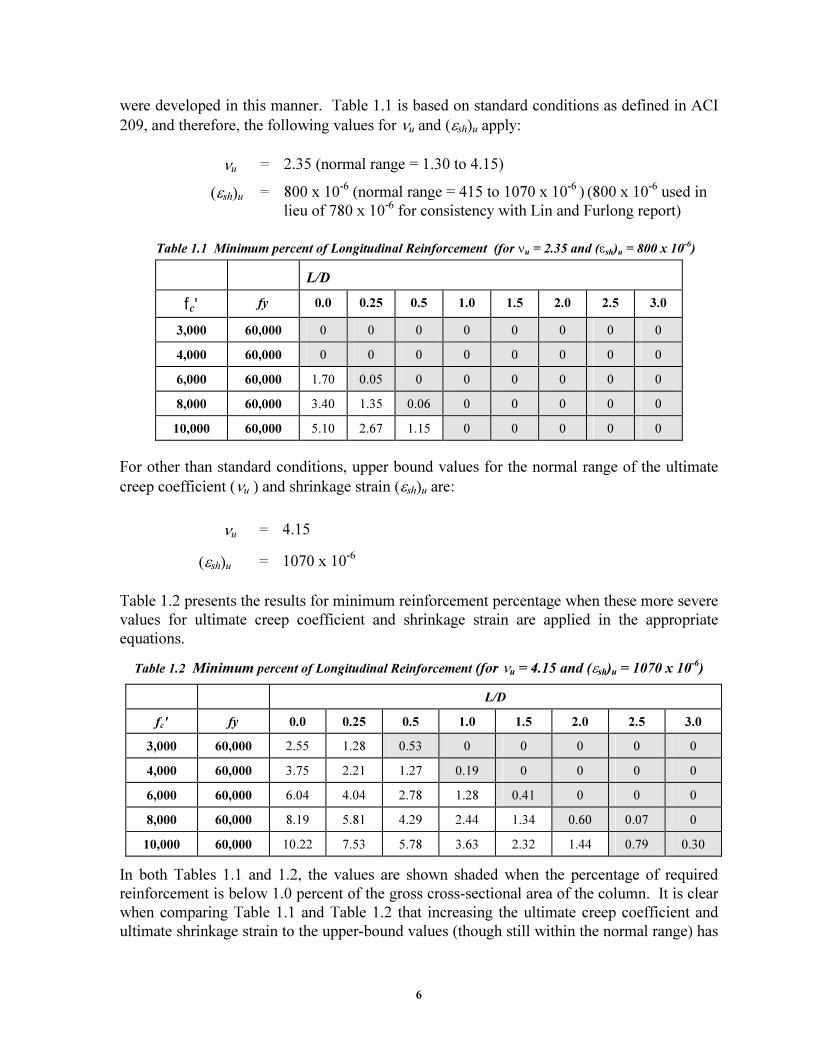
were developed in this manner. Table 1.1 is based on standard conditions as defined in ACI
209, and therefore, the following values for νu and (εsh)u apply:
νu = 2.35 (normal range = 1.30 to 4.15)
(εsh)u = 800 x 10-6
(normal range = 415 to 1070 x 10-6
) (800 x 10-6
used in
lieu of 780 x 10-6
for consistency with Lin and Furlong report)
Table 1.1 Minimum percent of Longitudinal Reinforcement (for νu = 2.35 and (εsh)u = 800 x 10-6)
L/D
fc' fy 0.0 0.25 0.5 1.0 1.5 2.0 2.5 3.0
3,000 60,000 0 0 0 0 0 0 0 0
4,000 60,000 0 0 0 0 0 0 0 0
6,000 60,000 1.70 0.05 0 0 0 0 0 0
8,000 60,000 3.40 1.35 0.06 0 0 0 0 0
10,000 60,000 5.10 2.67 1.15 0 0 0 0 0
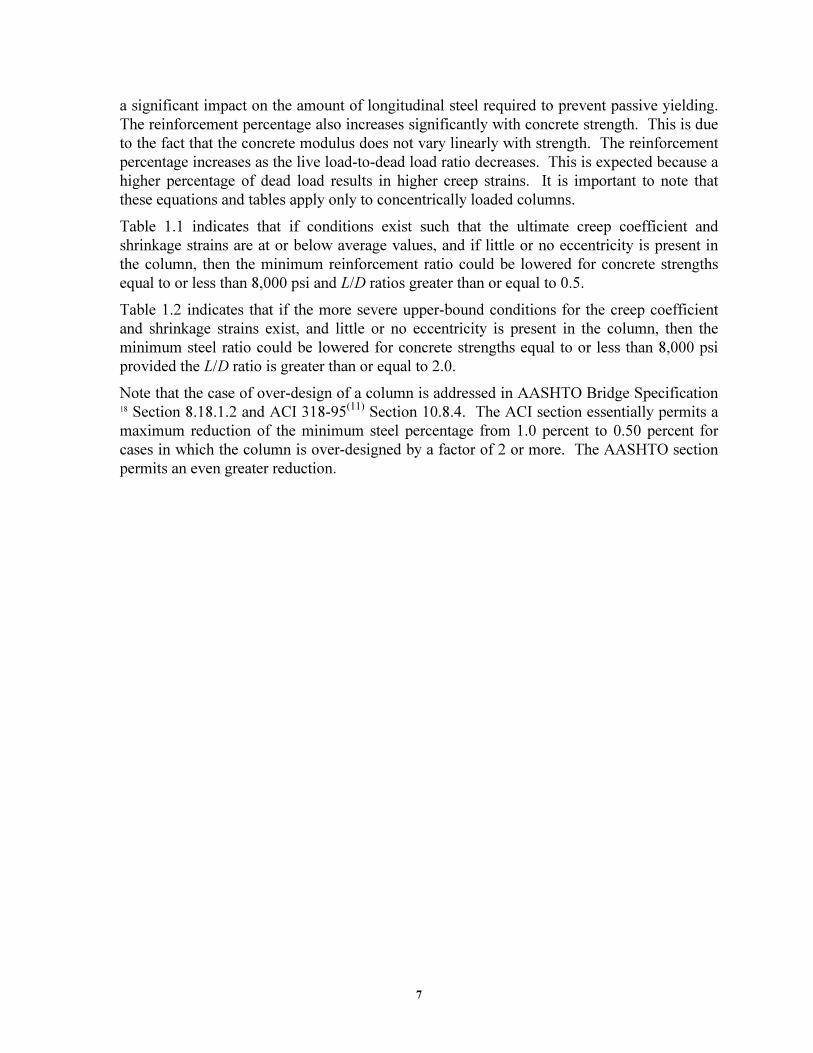
For other than standard conditions, upper bound values for the normal range of the ultimate
creep coefficient (νu ) and shrinkage strain (εsh)u are:
νu = 4.15
(εsh)u = 1070 x 10-6
Table 1.2 presents the results for minimum reinforcement percentage when these more severe
values for ultimate creep coefficient and shrinkage strain are applied in the appropriate
equations.
Table 1.2 Minimum percent of Longitudinal Reinforcement (for νu = 4.15 and (εsh)u = 1070 x 10-6
)
L/D
fc' fy 0.0 0.25 0.5 1.0 1.5 2.0 2.5 3.0
3,000 60,000 2.55 1.28 0.53 0 0 0 0 0
4,000 60,000 3.75 2.21 1.27 0.19 0 0 0 0
6,000 60,000 6.04 4.04 2.78 1.28 0.41 0 0 0
8,000 60,000 8.19 5.81 4.29 2.44 1.34 0.60 0.07 0
10,000 60,000 10.22 7.53 5.78 3.63 2.32 1.44 0.79 0.30
In both Tables 1.1 and 1.2, the values are shown shaded when the percentage of required
reinforcement is below 1.0 percent of the gross cross-sectional area of the column. It is clear
when comparing Table 1.1 and Table 1.2 that increasing the ultimate creep coefficient and
ultimate shrinkage strain to the upper-bound values (though still within the normal range) has
7
a significant impact on the amount of longitudinal steel required to prevent passive yielding.
The reinforcement percentage also increases significantly with concrete strength. This is due
to the fact that the concrete modulus does not vary linearly with strength. The reinforcement
percentage increases as the live load-to-dead load ratio decreases. This is expected because a
higher percentage of dead load results in higher creep strains. It is important to note that
these equations and tables apply only to concentrically loaded columns.
Table 1.1 indicates that if conditions exist such that the ultimate creep coefficient and
shrinkage strains are at or below average values, and if little or no eccentricity is present in
the column, then the minimum reinforcement ratio could be lowered for concrete strengths
equal to or less than 8,000 psi and L/D ratios greater than or equal to 0.5.
Table 1.2 indicates that if the more severe upper-bound conditions for the creep coefficient
and shrinkage strains exist, and little or no eccentricity is present in the column, then the
minimum steel ratio could be lowered for concrete strengths equal to or less than 8,000 psi
provided the L/D ratio is greater than or equal to 2.0.
Note that the case of over-design of a column is addressed in AASHTO Bridge Specification 18 Section 8.18.1.2 and ACI 318-95
(11) Section 10.8.4. The ACI section essentially permits a
maximum reduction of the minimum steel percentage from 1.0 percent to 0.50 percent for
cases in which the column is over-designed by a factor of 2 or more. The AASHTO section
permits an even greater reduction.

8
9
CHAPTER 2
REVIEW OF LITERATURE ON CREEP AND SHRINKAGE
OF REINFORCED CONCRETE COLUMNS
2.1 INTRODUCTION
This chapter summarizes the significant series of concrete column investigations which were
carried out in the first half of this century. The summary begins with early work performed at
the University of California. The most significant investigations, which were conducted
during the 1930’s at the University of Illinois and Lehigh University, are also reviewed here.
2.2 DAVIS AND DAVIS(1)
(MARCH 1931)
This study is one of the earliest reported investigations of creep and shrinkage of reinforced
concrete columns. Part five of the study is the most applicable. The stated purpose of this
portion of the study was to determine the effect of reinforcement on creep of concrete, and
the effect of creep of concrete on stress in the reinforcement.
Davis and Davis tested a total of eight reduced-scale columns. All columns were 10 inches
in diameter and 20 inches tall, and varied in reinforcement ratio and load condition. Two
specimens were unreinforced, two were reinforced with 1.9 percent longitudinal steel in
conjunction with 1.33 percent spiral reinforcement, and four specimens were control
specimens with no applied load.
The columns were axially loaded in a condition of constant stress. This was achieved with
steel plates and car springs. Prior to loading, the columns were stored for 50 days in
100 percent humidity and ten days in ambient conditions. Sixty days after casting, axial load
producing a stress of 800 psi was applied to the four loaded specimens. The results presented
in the report indicate a loading period of 18 months. The columns were loaded and stored in
a controlled atmosphere in which temperature was held constant at 70 degrees Fahrenheit,
plus or minus 1 degree Fahrenheit, and relative humidity was maintained at 50 percent (plus
or minus 1 percent). No mention was made of load adjustment to compensate for creep and
shrinkage of the columns.
One-half inch square internally threaded brass plugs were mounted in the forms prior to
casting. Stainless steel inserts were screwed into the brass plugs after the concrete hardened.
Three such inserts were installed around the circumference. In addition, three sets of gage
holes were made in the longitudinal reinforcing bars. Strain measurements were made with a
ten inch fulcrum type mechanical gage.
Significant conclusions were as follows:
1. For the unreinforced columns, combined creep and shrinkage after 18 months
was approximately six times greater than the instantaneous deformation that
occurred after load application.
2. For the reinforced columns, combined creep and shrinkage after 18 months
was approximately four times the instantaneous deformation.
10
3. Stress in the longitudinal steel was reported as follows:
Stress due to instantaneous deformation 5,700 psi
Stress due to creep 11,400 psi
Stress due to shrinkage 13,200 psi
Total change in steel stress 30,300 psi
4. Assuming the load not carried by longitudinal steel was uniformly distributed
over the full concrete cross-section, sustained stress in the concrete was
reduced from 775 psi to 300 psi over the 18 month period.
5. The yield point of the steel should be a design consideration when columns are
subjected primarily to dead load and conditions which cause significant
shrinkage.
The conclusions from this investigation assumed that creep and shrinkage can be treated
separately. Therefore, whatever change in length was not attributed to shrinkage was
assumed to be due to creep under sustained load.
A literature summary included with this investigation referenced a study conducted by F.R.
MacMillan(16)
. This study involved the instrumentation of columns in an actual building on
the University of Minnesota campus. The results indicated a change in steel stress in the
range of 36,000 to 45,000 psi.
2.3 RICHART AND STAEHLE( 2)
–SECOND PROGRESS REPORT–UNIVERSITY OF ILLINOIS
(MARCH 1931)
This study was part of the concrete column investigations carried out in tandem at the
University of Illinois and Lehigh University. Series 3 of this study concerned columns under
sustained load. This second progress report dealt with a loading period of 20 weeks.
Richart and Staehle tested 108 reinforced concrete columns in this series. All columns had
an outside diameter of 8¼ inches. The columns varied in reinforcement ratio and load
condition. Of the 108 columns, 60 were loaded and 48 were without load. Forty-five
unreinforced columns were added to the study. Of these 45 columns, six were subjected to
sustained load. Longitudinal steel ratios of approximately 1.5, 4 and 6 percent, and spiral
steel ratios of 1.24 and 2 percent were investigated. Longitudinal steel percentages were
based on the core area of the column. The reinforcement details are as follows:
Type of longitudinal bars Reinf. ratio Yield stress
(4) 1/2-inch dia. round 1.57 percent 45,600 psi
(8) 1/2-inch square 3.98 percent 53,400 psi
(4) 5/8-inch dia. round
and (4) 3/4-inch dia. round 5.98 percent
39,300 psi
51,100 psi
11
Type of spiral bars Reinf. ratio “Useful” limit Ultimate
No. 5 rod at 1.35 inch pitch 1.24 percent 49,400 psi 79,500 psi
1/4 inch dia. at 1.19 inch pitch 2.0 percent 48,200 psi 74,200 psi
Nominal concrete strengths of 2000, 3500 and 5000 psi were investigated. The actual
strength, modulus of elasticity, and computed modular ratios at 56 days were as follows:
Nominal strength Actual strength Modulus of Elasticity Ratio of Moduli
2,000 psi 2,200 psi 2,830,000 psi 10.6
3,500 psi 3,730 psi 3,800,000 psi 7.9
5,000 psi 5,460 psi 4,290,000 psi 7.0
The modulus of elasticity was based on the slope of the stress-strain curve taken at 30 to
50 percent of the ultimate concrete stress.
The columns were axially loaded in a condition of constant stress. Two columns were loaded
in tandem by placing them end to end. Railroad car springs were used to maintain the
applied load. Five different types of springs were used. Load was applied by hand-tightening
nuts until the appropriate spring displacement was reached. It was noted that no major
eccentricities were noticed due to the loading. The applied load varied from 38,000 pounds
to 130,400 pounds. One adjustment was made to the load at three months. The springs were
checked for permanent deformation. None was noticed.
All specimens were fabricated and cured in a high-humidity room and were stored in the
room for 56 days. Then the specimens were loaded and maintained as follows:
1) Design load, lab air
2) No load, lab air
3) Design load, high-humidity room
4) No load, high-humidity room
The lab air varied in temperature from 70 to 90 degrees Fahrenheit and from 40 to 90 percent
relative humidity. The high-humidity stored condition was a constant 70 degrees Fahrenheit
and 100 percent relative humidity.
The spiral reinforcement was manufactured to a close tolerance and had an outside diameter
of 8 inches. Steel forms were used, and were removed 24 hours after casting. The columns
were then placed in the high-humidity room or wrapped with wet burlap. The gage points
were drilled immediately after form removal.
Initial strains were read at day one. At 56 days, strains were again measured. Strains were
measured at 1, 3, 4, 7, 14 and 28 days after loading, and each 28 days thereafter. A 10-inch
Whittemore (mechanical) gage was used. Several different individuals were employed to
read the gages.
Six inch diameter by 12 inch tall concrete cylinders were made at the time of casting. Two
were tested at 56 days and two at one year.
12
Temperature was not accounted for in the results. It was noted that temperature change in a
specimen would certainly occur at a slower rate than temperature change in the laboratory air.
It was argued that accounting for such a change would only serve to complicate the results.
Furthermore, a 10 degree Fahrenheit change in temperature would lead to only a 2,000 psi
change in stress of the longitudinal steel.
Significant conclusions after 20 weeks of loading were as follows:
1. Most creep and shrinkage occurred within the first five months.
2. The 56-day modulus of elasticity for the three different concrete strengths was
as follows:
Design strength Modulus of Elasticity
2,000 psi 2,830,000 psi
3,500 psi 3,800,000 psi
5,000 psi 4,290,000 psi
3. Spiral reinforcement had little effect on longitudinal creep and shrinkage.
4. The greatest increase in steel stress (after 20 weeks of loading) was 14,800 psi.
The change in stress was generally 6,000 to 14,000 psi for the columns stored
in ambient conditions.
5. The lightly reinforced 1.5 percent columns demonstrated the highest change in
steel stress. The most highly-reinforced columns (6.0 percent) demonstrated
the lowest change in steel stress. It was speculated that this was due to the
fact that a given amount of creep decreases the concrete stress much more
rapidly in columns with a large amount of longitudinal reinforcement than in
those with a small amount.
6. No marked change in the appearance of the curves was noticed due to variation
in the concrete strength.
7. The average increase in steel stress after the first five months was as follows:
Longitudinal Reinforcement Increase in steel stress
6.0 percent 9,200 psi
4.0 percent 9,700 psi
1.5 percent 13,200 psi
8. The tests of plain concrete columns demonstrated that creep of the concrete
diminished with time.
9. A quantity referred to as the “sustained modulus of elasticity” which includes
the effects of shrinkage, creep and elastic deformation was introduced. The
values after five months were three times as great as the initial values.
13
10. Steel stresses after five months exceeded one-half the yield stress of the steel
for only one case. It was concluded that the steel yield point was not likely to
be reached.
11. More action was observed for columns stored in ambient conditions as
opposed to those stored in the high-humidity room.
12. It was noted that the modulus of elasticity for specimens stored in the high-
humidity room showed significant increase with time. This was offered as a
possible explanation for why specimens stored in ambient conditions
exhibited more creep under load than the moist-stored specimens.
13. It was speculated that if the steel did yield, large deflections would ensue and
the spiral steel would become more actively involved.
2.4 SLATER AND LYSE(3)
–SECOND PROGRESS REPORT–LEHIGH UNIVERSITY
(MARCH 1931)
This was the companion investigation to that carried out at the University of Illinois. Series 3
concerned columns under sustained load. This second progress report dealt with a loading
period of 20 weeks.
A total of 108 columns were tested. All columns were of similar dimensions to those tested
at the University of Illinois. Some of these columns were unloaded companion columns.
The length of the columns was reported to be 60 inches.
The columns were stored in conditions similar to those in the Illinois investigation. All
columns and control cylinders were initially stored in a high-humidity room for 56 days.
Temperature in the high-humidity room was kept at a constant 70 degrees Fahrenheit. The
humidity was very nearly 100 percent. Temperature in the laboratory air varied from 60 to
95 degrees Fahrenheit. No mention was made of the relative humidity.
Columns were loaded in a state of constant stress. Columns were loaded in pairs by stacking
them end-to-end. Load was applied by means of an 800-kip vertical screw-type testing
machine at 56 days. This is a different method than the manual tightening of nuts that was
used at Illinois. A small excess load was applied to compensate for the elongation of the rods
and bending of plates that was expected upon raising the loading head. The columns were
then stored in laboratory air or moist cured according to schedule.
Load on the columns stored in ambient laboratory conditions was readjusted after three
months. The entire loading rig was placed back in the loading machine and the initial loading
procedure was again carried out. At this time, the average decrease in load was found to be
seven percent. Four percent was attributed to the deformation of the columns, and three
percent to permanent set of the springs. Columns stored in the high-humidity room did not
require readjustment.
Nominal concrete strengths of 2000, 3500 and 5000 psi were investigated. The water content
was kept constant at 39.0 gallons per cubic yard. The water-cement ratio was varied as
follows:
14
Design strength Water-cement ratio
2000 psi 0.864
3500 psi 0.686
5000 psi 0.531
Concrete cylinders were cast with each column in keeping with the Illinois investigation.
The modulus of elasticity was measured at 56 days with an extensometer. The modulus was
defined as the slope of the tangent at a stress of 500 psi. The average strength and modulus
results at 56 days were as follows:
Nominal strength Actual strength Modulus of Elasticity
2,000 psi 2,230 psi 3,300,000 psi
3,500 psi 3,580 psi 3,800,000 psi
5,000 psi 5,260 psi 4,400,000 psi
Each column was instrumented with 20 gage lines for strain in the steel and 20 gage lines for
strain in the concrete. All readings were taken twice and then averaged. The steel strain was
found to be very nearly equal to the concrete strain with the possible exception of two
specimens which were off by approximately 50 millionths. When two opposing gages were
averaged, it was found that the results showed good agreement for the entire column.
As in the Illinois tests, shrinkage results were commonly subtracted from the time-deflection
curves, and the remaining deformation was attributed to creep.
Significant conclusions (after 20 weeks of loading) were as follows:
1. A large increase in strain was noticed from two to four weeks after load was
applied. After this, the rate of increase became smaller as time progressed.
2. The increase in deformation was much smaller for the moist-stored columns as
compared to the columns stored in ambient conditions.
3. The rate of increase was practically independent of the concrete strength. This
was attributed to the higher load applied to the columns with higher concrete
strength.
4. The rate of increase was found to be practically independent of the amount of
spiral steel.
5. The rate of increase was greatest for columns with the smallest steel ratio, and
smallest for those with the highest steel ratio.
6. For the first four weeks, shrinkage was approximately the same for the three
different longitudinal reinforcement ratios. After four weeks, shrinkage was
greatest for the columns with the smallest steel ratio and least for those with
the largest steel ratio. After 20 weeks, the average shrinkage results were as
follows:
15
Longitudinal reinforcement Strain due to shrinkage
1.5 percent longitudinal 300 millionths
4 percent longitudinal 240 millionths
6 percent longitudinal 190 millionths
7. The higher-strength concrete produced higher shrinkage. This was especially
true after four weeks.
8. Loaded columns (No. 47 and No. 48) exhibited a tensile stress in the concrete
of 90 psi after 20 weeks. Apparently, all load was being carried by the
longitudinal steel at this point. These specimens were reinforced with
6 percent longitudinal steel.
9. The highest steel stress recorded at the end of 20 weeks was 42,660 psi. This
was approximately four times the initial stress. This value was associated
with columns (No. 45 and No. 46) which were reinforced with 1.5 percent
longitudinal reinforcement. This stress was very near the steel yield stress of
49,500 psi.
10. For the unloaded columns, the concrete experienced significant tensile
stresses. This tensile stress was highest for those columns with 6 percent
longitudinal reinforcement. The average maximum concrete tensile stress for
columns (No. 107 and No. 108) were 450 psi. No cracks were noticed in the
concrete.
11. Strength of a column depended on the sum of the steel and concrete strengths
regardless of the modulus of elasticity of either.
The question was raised as to whether the capacity of a column will be reduced when
longitudinal steel is stressed (by time-dependent deformations) beyond its yield point. Also,
questions of the effects of eccentricity, redistribution of moment in indeterminate structures,
and deflections under indefinite periods of loading were raised.
This investigation concluded with theoretical formulations by W. H. Glanville(17)
for the
prediction of creep, shrinkage and initial elastic deformations. Other early investigations
were also discussed.
The F. R. MacMillan study was again mentioned. The MacMillan study was said to have
begun two months after casting and to have been monitored for six years by the time this
second progress report was produced. One column (column No. 19) exhibited a steel stress
of 45,000 psi by this time. It is probable that the steel had reached its yield stress. No
physical signs of distress were noticed in the column.
2.5 RICHART AND STAEHLE(4)
–FOURTH PROGRESS REPORT–UNIVERSITY OF ILLINOIS
(JANUARY 1932)
This report presented further results for the columns under sustained load discussed
previously. The second progress report dealt with a loading period of 20 weeks. This fourth
report dealt with a loading period of 52 weeks. The strength and deformations when tested to
failure were also discussed.
16
Eighteen plain and 26 reinforced columns were not tested to failure, but rather were retained
for further observation during a second year.
As a review, this series consisted of 108 reinforced concrete columns, of which 60 were
placed under sustained loads and 48 companion specimens were kept in like storage
conditions under no load. In addition to the reinforced columns, 45 unreinforced columns of
similar dimensions and materials were fabricated. Two storage conditions were investigated
as follows:
Storage Temperature Relative humidity
Ambient laboratory
conditions 70 to 85 deg. F. 40 to 90 percent
Moist room 66 to 74 deg. F. saturated
Compression in the loading springs was calibrated and adjusted at regular intervals to
compensate for strain in the columns.
Cylinders stored in ambient conditions showed an average strength increase of 15 percent
while the moist-stored cylinders showed an average strength increase of 30 percent from the
age of two months to 14 months.
Stress changes were very small from five months to 20 months. In some cases, stresses
actually decreased during the last seven months. It was noted that changes in temperature
and humidity may have affected the results to a considerable extent. The five-month
observations were made during the winter when humidity was low, and the one-year
observations were made during the summer when humidity was high. Thus, any increase in
creep may have been offset by expansion due to moisture. Some irregularities due to
seasonal variations can be noticed in the results.
The greatest steel stress in any one column after loading for one year was 30,800 psi. This
column was loaded in accordance with the New York City Building Code. The initial elastic
stress in the steel was 11,100 psi. Companion columns loaded according to the ACI Code
showed a maximum steel stress of 26,700 psi. In very few of the columns did the steel stress
exceed 50 percent of yield stress. The maximum deformation was reported to be
approximately three times the initial elastic deformation.
Regarding the effect of concrete strength and longitudinal reinforcement ratio, results were
similar to those stated in the second progress report. Deformation versus time curves were
observed to flatten as time progressed but exhibited enough increase to warrant retaining
certain specimens for at least another year.
The unreinforced columns were loaded to 500, 875, and 1250 psi, or one-fourth the nominal
56-day concrete strengths. This was considerably less than the concrete stresses in the
reinforced specimens when initially loaded, and slightly greater than concrete stresses in the
reinforced specimens after one year of sustained loading. The greatest total deformation was
found to be 0.0012 for the 3500 psi concrete. If the effects of shrinkage were deducted, the
net creep was essentially the same for the 3,500 psi and 5,000 psi columns. Shrinkage for all
three grades of concrete was nearly constant and equal to 0.0004 at eight or nine months.
17
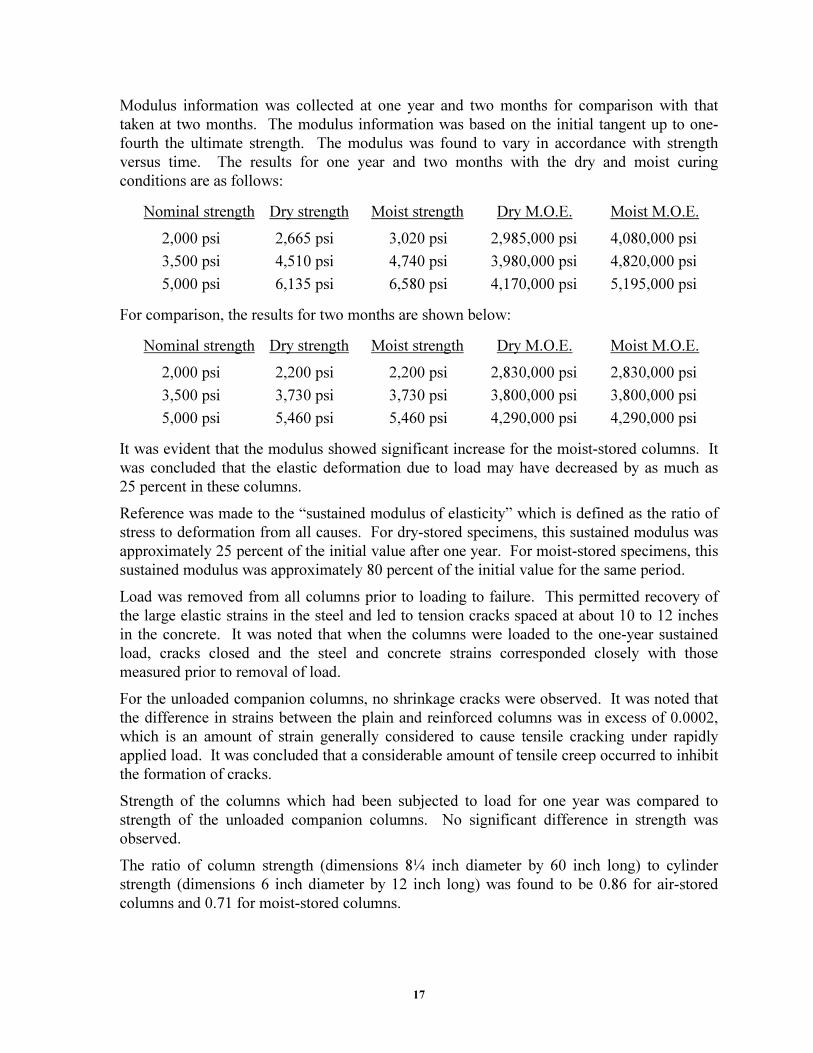
Modulus information was collected at one year and two months for comparison with that
taken at two months. The modulus information was based on the initial tangent up to one-
fourth the ultimate strength. The modulus was found to vary in accordance with strength
versus time. The results for one year and two months with the dry and moist curing
conditions are as follows:
Nominal strength Dry strength Moist strength Dry M.O.E. Moist M.O.E.
2,000 psi 2,665 psi 3,020 psi 2,985,000 psi 4,080,000 psi
3,500 psi 4,510 psi 4,740 psi 3,980,000 psi 4,820,000 psi
5,000 psi 6,135 psi 6,580 psi 4,170,000 psi 5,195,000 psi
For comparison, the results for two months are shown below:
Nominal strength Dry strength Moist strength Dry M.O.E. Moist M.O.E.
2,000 psi 2,200 psi 2,200 psi 2,830,000 psi 2,830,000 psi
3,500 psi 3,730 psi 3,730 psi 3,800,000 psi 3,800,000 psi
5,000 psi 5,460 psi 5,460 psi 4,290,000 psi 4,290,000 psi
It was evident that the modulus showed significant increase for the moist-stored columns. It
was concluded that the elastic deformation due to load may have decreased by as much as
25 percent in these columns.
Reference was made to the “sustained modulus of elasticity” which is defined as the ratio of
stress to deformation from all causes. For dry-stored specimens, this sustained modulus was
approximately 25 percent of the initial value after one year. For moist-stored specimens, this
sustained modulus was approximately 80 percent of the initial value for the same period.
Load was removed from all columns prior to loading to failure. This permitted recovery of
the large elastic strains in the steel and led to tension cracks spaced at about 10 to 12 inches
in the concrete. It was noted that when the columns were loaded to the one-year sustained
load, cracks closed and the steel and concrete strains corresponded closely with those
measured prior to removal of load.
For the unloaded companion columns, no shrinkage cracks were observed. It was noted that
the difference in strains between the plain and reinforced columns was in excess of 0.0002,
which is an amount of strain generally considered to cause tensile cracking under rapidly
applied load. It was concluded that a considerable amount of tensile creep occurred to inhibit
the formation of cracks.
Strength of the columns which had been subjected to load for one year was compared to
strength of the unloaded companion columns. No significant difference in strength was
observed.
The ratio of column strength (dimensions 8¼ inch diameter by 60 inch long) to cylinder
strength (dimensions 6 inch diameter by 12 inch long) was found to be 0.86 for air-stored
columns and 0.71 for moist-stored columns.
18
It was noted that the ultimate strength values for similar columns at Lehigh University were
somewhat lower in most cases due to the use of a spherical head at one end of the column,
whereas strength tests performed at the University of Illinois were made using flat test heads
on the columns.
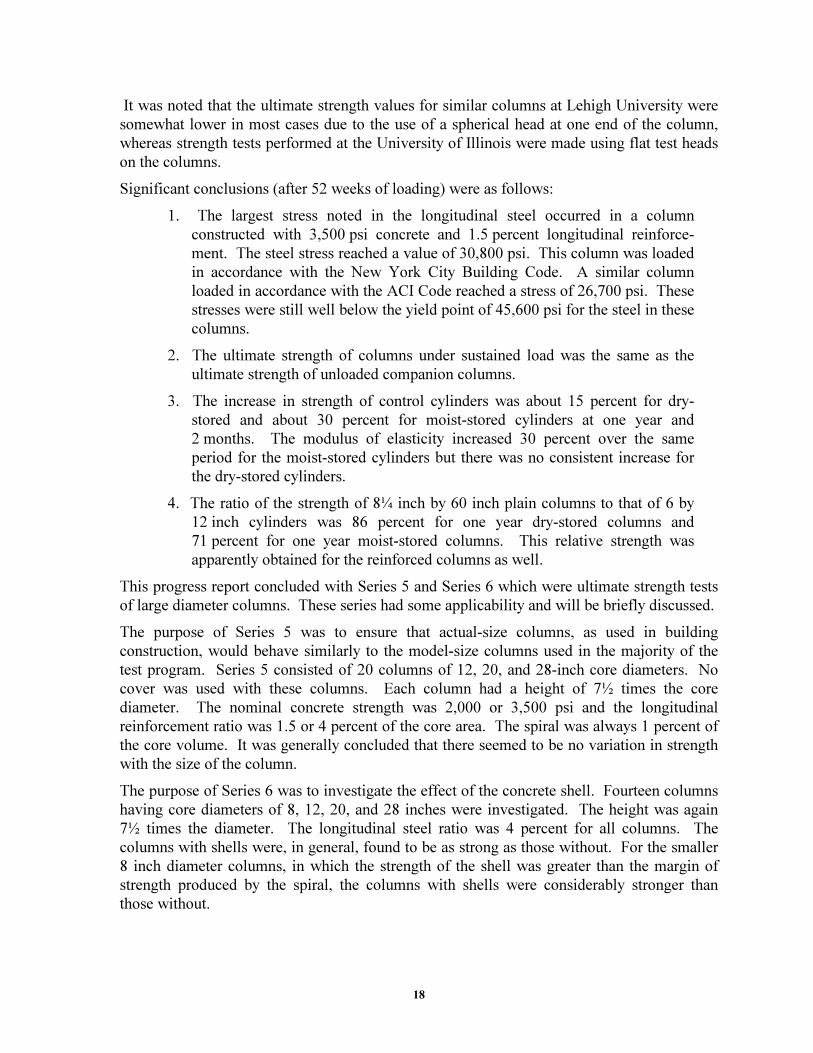
Significant conclusions (after 52 weeks of loading) were as follows:
1. The largest stress noted in the longitudinal steel occurred in a column
constructed with 3,500 psi concrete and 1.5 percent longitudinal reinforce-
ment. The steel stress reached a value of 30,800 psi. This column was loaded
in accordance with the New York City Building Code. A similar column
loaded in accordance with the ACI Code reached a stress of 26,700 psi. These
stresses were still well below the yield point of 45,600 psi for the steel in these
columns.
2. The ultimate strength of columns under sustained load was the same as the
ultimate strength of unloaded companion columns.
3. The increase in strength of control cylinders was about 15 percent for dry-
stored and about 30 percent for moist-stored cylinders at one year and
2 months. The modulus of elasticity increased 30 percent over the same
period for the moist-stored cylinders but there was no consistent increase for
the dry-stored cylinders.
4. The ratio of the strength of 8¼ inch by 60 inch plain columns to that of 6 by
12 inch cylinders was 86 percent for one year dry-stored columns and
71 percent for one year moist-stored columns. This relative strength was
apparently obtained for the reinforced columns as well.
This progress report concluded with Series 5 and Series 6 which were ultimate strength tests
of large diameter columns. These series had some applicability and will be briefly discussed.
The purpose of Series 5 was to ensure that actual-size columns, as used in building
construction, would behave similarly to the model-size columns used in the majority of the
test program. Series 5 consisted of 20 columns of 12, 20, and 28-inch core diameters. No
cover was used with these columns. Each column had a height of 7½ times the core
diameter. The nominal concrete strength was 2,000 or 3,500 psi and the longitudinal
reinforcement ratio was 1.5 or 4 percent of the core area. The spiral was always 1 percent of
the core volume. It was generally concluded that there seemed to be no variation in strength
with the size of the column.
The purpose of Series 6 was to investigate the effect of the concrete shell. Fourteen columns
having core diameters of 8, 12, 20, and 28 inches were investigated. The height was again
7½ times the diameter. The longitudinal steel ratio was 4 percent for all columns. The
columns with shells were, in general, found to be as strong as those without. For the smaller
8 inch diameter columns, in which the strength of the shell was greater than the margin of
strength produced by the spiral, the columns with shells were considerably stronger than
those without.
19
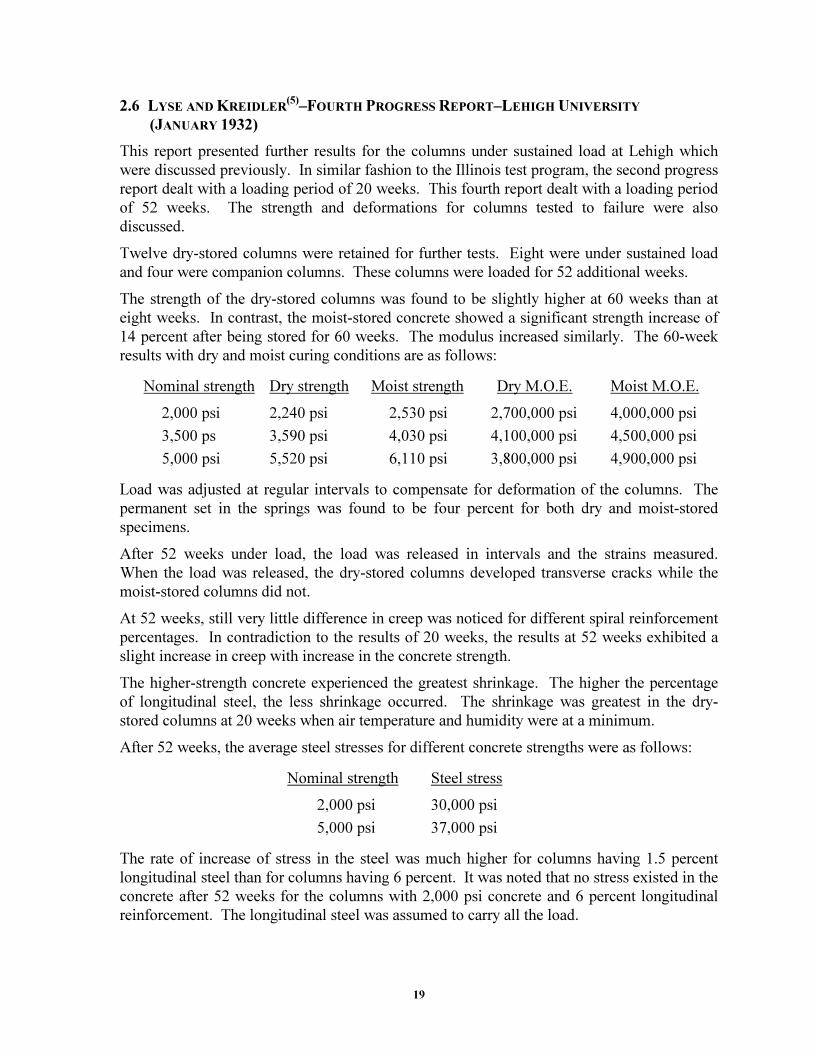
2.6 LYSE AND KREIDLER(5)
–FOURTH PROGRESS REPORT–LEHIGH UNIVERSITY
(JANUARY 1932)
This report presented further results for the columns under sustained load at Lehigh which
were discussed previously. In similar fashion to the Illinois test program, the second progress
report dealt with a loading period of 20 weeks. This fourth report dealt with a loading period
of 52 weeks. The strength and deformations for columns tested to failure were also
discussed.
Twelve dry-stored columns were retained for further tests. Eight were under sustained load
and four were companion columns. These columns were loaded for 52 additional weeks.
The strength of the dry-stored columns was found to be slightly higher at 60 weeks than at
eight weeks. In contrast, the moist-stored concrete showed a significant strength increase of
14 percent after being stored for 60 weeks. The modulus increased similarly. The 60-week
results with dry and moist curing conditions are as follows:
Nominal strength Dry strength Moist strength Dry M.O.E. Moist M.O.E.
2,000 psi 2,240 psi 2,530 psi 2,700,000 psi 4,000,000 psi
3,500 ps 3,590 psi 4,030 psi 4,100,000 psi 4,500,000 psi
5,000 psi 5,520 psi 6,110 psi 3,800,000 psi 4,900,000 psi
Load was adjusted at regular intervals to compensate for deformation of the columns. The
permanent set in the springs was found to be four percent for both dry and moist-stored
specimens.
After 52 weeks under load, the load was released in intervals and the strains measured.
When the load was released, the dry-stored columns developed transverse cracks while the
moist-stored columns did not.
At 52 weeks, still very little difference in creep was noticed for different spiral reinforcement
percentages. In contradiction to the results of 20 weeks, the results at 52 weeks exhibited a
slight increase in creep with increase in the concrete strength.
The higher-strength concrete experienced the greatest shrinkage. The higher the percentage
of longitudinal steel, the less shrinkage occurred. The shrinkage was greatest in the dry-
stored columns at 20 weeks when air temperature and humidity were at a minimum.
After 52 weeks, the average steel stresses for different concrete strengths were as follows:
Nominal strength Steel stress
2,000 psi 30,000 psi
5,000 psi 37,000 psi
The rate of increase of stress in the steel was much higher for columns having 1.5 percent
longitudinal steel than for columns having 6 percent. It was noted that no stress existed in the
concrete after 52 weeks for the columns with 2,000 psi concrete and 6 percent longitudinal
reinforcement. The longitudinal steel was assumed to carry all the load.
20
Every dry-stored column showed transverse cracking upon release of the load. The columns
with the highest percentages of reinforcement had the largest crack widths. The moist-stored
columns were carefully inspected visually and strain measurements were made. None of the
moist-stored columns exhibited cracking.
When tested to failure, transverse cracks in the dry-stored columns did not close completely.
The longitudinal steel buckled in the columns without spiral reinforcement. For columns
having no spiral reinforcement, the strength of the concrete had little effect on the load
carried by the concrete.
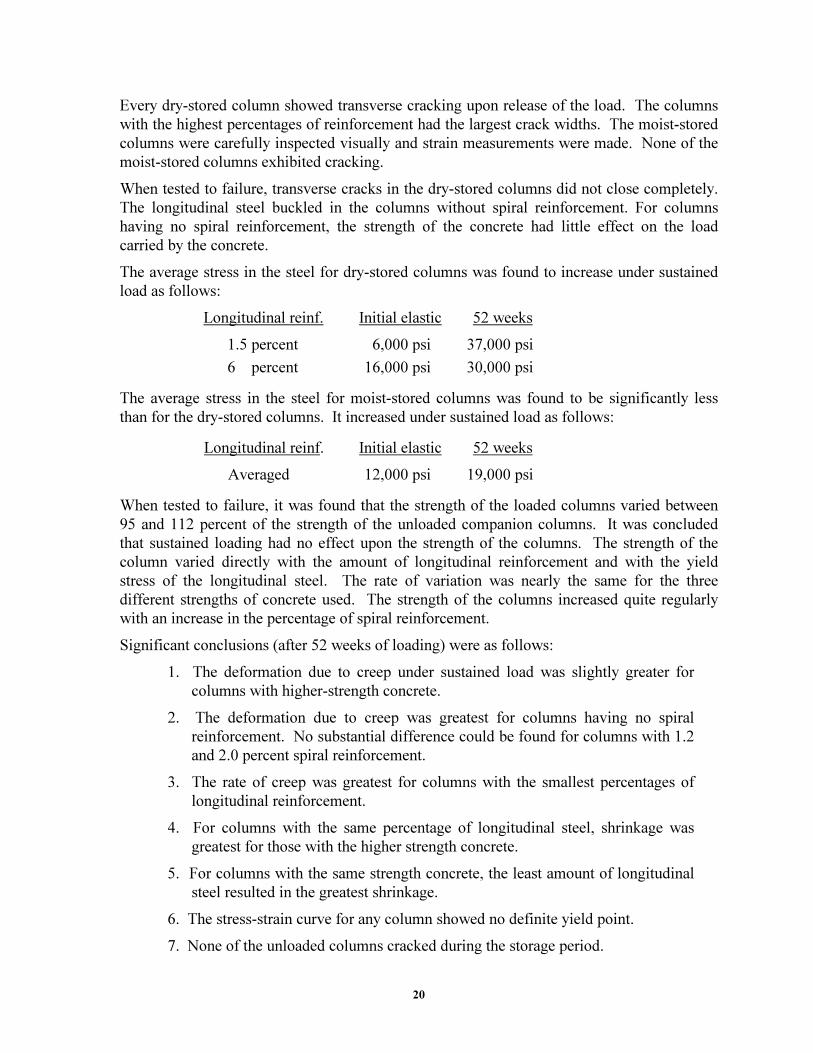
The average stress in the steel for dry-stored columns was found to increase under sustained
load as follows:
Longitudinal reinf. Initial elastic 52 weeks
1.5 percent 6,000 psi 37,000 psi
6 percent 16,000 psi 30,000 psi
The average stress in the steel for moist-stored columns was found to be significantly less
than for the dry-stored columns. It increased under sustained load as follows:
Longitudinal reinf. Initial elastic 52 weeks
Averaged 12,000 psi 19,000 psi
When tested to failure, it was found that the strength of the loaded columns varied between
95 and 112 percent of the strength of the unloaded companion columns. It was concluded
that sustained loading had no effect upon the strength of the columns. The strength of the
column varied directly with the amount of longitudinal reinforcement and with the yield
stress of the longitudinal steel. The rate of variation was nearly the same for the three
different strengths of concrete used. The strength of the columns increased quite regularly
with an increase in the percentage of spiral reinforcement.
Significant conclusions (after 52 weeks of loading) were as follows:
1. The deformation due to creep under sustained load was slightly greater for
columns with higher-strength concrete.
2. The deformation due to creep was greatest for columns having no spiral
reinforcement. No substantial difference could be found for columns with 1.2
and 2.0 percent spiral reinforcement.
3. The rate of creep was greatest for columns with the smallest percentages of
longitudinal reinforcement.
4. For columns with the same percentage of longitudinal steel, shrinkage was
greatest for those with the higher strength concrete.
5. For columns with the same strength concrete, the least amount of longitudinal
steel resulted in the greatest shrinkage.
6. The stress-strain curve for any column showed no definite yield point.
7. None of the unloaded columns cracked during the storage period.
21
8. Stress in the steel of dry-stored columns subjected to ACI working loads for
52 weeks increased from 6,000 to 37,000 psi for columns having 1.5 percent
longitudinal reinforcement, and from 16,000 to 30,000 psi for columns having
6 percent longitudinal reinforcement. For moist-stored columns the average
stress in the steel increased from approximately 12,000 to approximately
19,000 psi.
9. Sustaining an applied working load for 52 weeks had no appreciable effect on
ultimate strength of the columns.
10. Strength of columns having concrete of the same strength and the same total
yield strength for longitudinal reinforcement increased with increase in spiral
reinforcement.
11. Ultimate strength of a concrete column having no spiral reinforcement was
considered to equal 75 percent of the cylinder strength times the net core area
plus the yield strength of the steel. If a spiral was included, the yield strength
of the spiral times its effectiveness ratio was to be added.
2.7 LYSE(6)
–FIFTH PROGRESS REPORT–LEHIGH UNIVERSITY (JUNE 1933)
The intent of this series of tests was to investigate the maximum load that a concrete column
could sustain indefinitely. Therefore, all columns in this investigation were loaded to very
high percentages of the calculated ultimate load. Twenty-eight columns were loaded from
between 70 and 100 percent of the calculated ultimate load. All columns had an outside
diameter of 8¼ inches and were 60 inches long. All columns had either 4 or 6 percent
longitudinal reinforcement and 0, 1.2 or 2 percent spiral reinforcement. The nominal strength
of the concrete was 3,500 psi in all cases. The columns were in most cases loaded at 56 days.
The material properties of the reinforcing steel were as follows:
Reinforcement Yield stress Ultimate stress
4 percent long. 44,000 psi 64,400 psi
6 percent long. 44,700 psi 70,000 psi
1.2 percent spiral none 85,500 psi
2.0 percent spiral none 74,700 psi
In each case, three identical columns were failed by a “fast” loading procedure to determine
the ultimate strength of the column. Then companion columns were loaded to significant
percentages of this ultimate load and observed until failure occurred.
The loading rigs were similar to those used in previous tests at Lehigh University. Helical
springs were again used to maintain load, and initial load was again applied in an 800-kip
testing machine. The distance between the outside of the column and the vertical rods was
½ inch. Load was measured and adjusted by measuring strain in the steel rods with a
mechanical strain gage. Adjustments were made to the load by hand-tightening the nuts.
Column 7 (4 percent longitudinal, 0 percent spiral) was loaded at 56 days to 80 percent of
ultimate load for 115 days, then it was removed from the loading rig. The longitudinal steel
22
had been stressed well beyond yield but the column still failed 17 percent higher than the
calculated ultimate load.
Column 6 (4 percent longitudinal, 0 percent spiral) was loaded at 56 days to 80 percent of
ultimate for a period of 700 days. It was noted that for the first year a large increase in
deformation was observed. After the first year, the deformation increased very slowly but did
not stop entirely. Total deformation of the column was approximately four times the yield
strain of the longitudinal reinforcement. It was noted that, with the exception of a few
vertical cracks near the ends of the column (which developed shortly after the time of
loading), no signs of distress were present. It was concluded that this column could carry
80 percent of ultimate load indefinitely.
Column 11 (4 percent longitudinal, 1.2 percent spiral) was loaded at 112 days to 95 percent
of ultimate load. This column failed after 45 minutes.
Column 12 (4 percent longitudinal, 1.2 percent spiral) was loaded at 112 days to 90 percent
of ultimate load. It sustained this load for 65 hours but deflected laterally so much that it
rested against the vertical rods of the loading rig. It was removed and loaded to failure.
Column 13 (4 percent longitudinal, 1.2 percent spiral) was also loaded at 112 days to
90 percent of ultimate load. At the time of the report, the column had sustained the load for
500 days. The strain at 500 days was approximately ten times the yield strain of the
longitudinal reinforcement. It was noted that Column 13 did not appear to be in danger of
failure. The cover had spalled off in several places.
Column 14 was stored as a control column for Column 13. This column was left unloaded to
determine temperature and shrinkage strains. These strains were found to correspond to a
stress of 7,500 psi in the longitudinal reinforcement.
Column 18 (4 percent longitudinal, 1.2 percent spiral) was loaded at 56 days to 95 percent of
ultimate load. The column sustained this load for one day but buckled so badly the test was
discontinued.
Column 19 was similar except it was loaded to 90 percent of ultimate. This column also
buckled after one day.
Column 20 (4 percent longitudinal, 1.2 percent spiral) was loaded at 56 days to 85 percent of
ultimate. At the time of the report, it had sustained this load for more than 300 days. The
strain in the longitudinal steel was approximately 7 times the yield strain. This column had
also buckled and was resting on the vertical rods of the loading rig.
Column 21 (4 percent longitudinal, 1.2 percent spiral) was loaded at 56 days to 80 percent of
ultimate. At the time of the report, it had sustained this load for more than 300 days. The
strain in the longitudinal steel was approximately 5½ times the yield strain. This column also
buckled and was nearly resting on the vertical rods of the loading rig. The concrete outside
the spiral had begun to spall.
Column 25 (6 percent longitudinal, 2.0 percent spiral) was loaded at 56 days to 90 percent of
ultimate. At the time of the report, it had sustained this load for nearly 300 days. Strain in the
longitudinal steel was approximately 7½ times yield strain. This column had buckled and
23
was resting on the vertical rods of the loading rig. Concrete outside the spiral had begun to
spall.
Significant conclusions are as follows:
1. The longitudinal reinforcement carried its full yield stress at strains far in
excess of yield strain.
2. The strength of the column was not decreased by being strained far beyond the
yield point of its steel before loading to failure.
3. A reinforced concrete column will probably carry 80 percent of ultimate load
for an indefinite period of time.
4. A column having no spiral or a small amount of spiral reinforcement will carry
80 percent of ultimate load at less deformation and with fewer signs of distress
than will a column having a larger amount of spiral reinforcement.
2.8 RICHART(7)
–TENTATIVE FINAL REPORT OF COMMITTEE 105 (FEBRUARY 1933)
This report summarized the majority of the work carried out at Illinois and Lehigh.
One formula was presented for the ultimate strength of reinforced concrete columns. It was
noted that this equation applied to concrete strengths from 2,000 to 8,000 psi and for
longitudinal reinforcement of 1.5, 4.0, and 6.0 percent and longitudinal steel yield stresses of
39,000 to 68,000 psi. Other formulas were given for the yield point of all columns and the
ultimate strength of tied columns.
It was noted that in extreme cases the steel stresses reached 30,000 to 42,000 psi after five
months of load application. The average increase in steel stress was approximately
12,000 psi in the Illinois tests and about 20,000 psi in the Lehigh tests. From five months to
one year the increase was only about 2,000 psi more, and from one year to two years another
2,000 psi was measured.
Design formulas were presented for the maximum permissible load on spirally reinforced
columns, and for tied columns. A design formula for the spiral ratio was also given.
A minimum reinforcement ratio of 0.01 was set for spirally reinforced columns and a
minimum reinforcement ratio of 0.005 was set tied columns. The minimum number of bars
was set as four for both cases. Little or no justification was given for the two different
minimum reinforcement ratios.
A minority recommendation for design formulas was given by Bertin and Lyse. They also
suggested a minimum ratio of 0.01 for spirally reinforced and 0.005 for tied columns. Again
no justification was given for the difference between spiral and tied columns.
2.9 LOGEMAN, MENSCH, DISTASIO(8)
–DISCUSSION OF REPORT OF COMMITTEE 105
(SEPT.–OCT. 1933)
These discussions were primarily concerned with the split in the committee over the proposed
design formulas. In particular, to what extent the spiral could be counted on for ultimate and
24
working loads was discussed by several contributors. The concepts of elastic versus plastic
design formulas and behavior was discussed.
DiStasio pointed out the lack of support given for a minimum limit on longitudinal
reinforcement of 0.01 for spiral columns as opposed to 0.005 for tied columns. He also
called for further testing of the effects of bending prior to the acceptance of formulas for
design.
2.10 RICHART(9)
–DISCUSSION OF COMMITTEE REPORT 105, CLOSURE BY CHAIRMAN,
COMMITTEE 105 (NOV.–DEC. 1933)
This discussion again focused on the division among the committee. The majority report
allowed for a smaller contribution of the spiral reinforcement as opposed to the minority
report. This was justified by the fact that the spiral did not contribute significantly until very
large deformations had taken place.
No discussion was given to the recommended minimum longitudinal reinforcement ratios
presented in previous reports.
2.11 CONCLUSIONS
In Series 3 of the investigations carried out at Illinois and Lehigh in the 1930’s a total of 261
column specimens were fabricated. Of these columns, 126 were loaded in a state of near
constant stress for at least 52 weeks. Columns were maintained in both an approximately
100 percent-humidity environment and in ambient conditions in the laboratories.
The columns were loaded in accordance with either the New York City Building Code or the
ACI Code. Nominal concrete strengths of 2,000, 3,500 and 5,000 psi were investigated.
Longitudinal reinforcing steel varied from 45,600 psi to 51,100 psi yield strength.
Reinforcement ratios investigated were 1.5, 4 and 6 percent of the cross-sectional core area of
the column.
Regarding columns loaded in accordance with the ACI code, after 52 weeks the largest stress
in the longitudinal reinforcement at Illinois was 26,700 psi and that at Lehigh was 37,000 psi.
These values were well below the 45,600 psi yield stress of the steel. The specimens at
Lehigh had an initial elastic steel stress of 6,000 psi. These stresses were recorded in dry-
stored specimens with 1.5 percent longitudinal reinforcement.
It was noted that for columns having 6 percent longitudinal reinforcement the stress increased
from an initial stress of 16,000 psi to 30,000 psi after 52 weeks. This increase was reported
in the Lehigh results.
When the columns were unloaded and then re-loaded to failure, it was found that the
sustained period of loading had no effect on ultimate strength of the columns.
To lend some insight into the behavior of columns when the longitudinal steel is stressed
beyond the yield point, a separate series of tests was carried out at Lehigh. These tests were
discussed in the fifth progress report from Lehigh. In these tests, columns were loaded from
80 to 100 percent of their ultimate load and held until failure. Some of these specimens
exhibited strains as high as ten times the steel yield strain without failing. Stability was a
problem however and several of the specimens buckled to such an extent that they were

25
resting against vertical bars of the loading rig. One of the conclusions of this series was that
a column will probably carry 80 percent of its ultimate load indefinitely
As an outcome of these investigations, a minimum reinforcement limit of 0.01 for spiral and
0.005 for tied columns was recommended. It is assumed that the intent was to prevent
passive yielding of the longitudinal steel. Little justification for the recommended ratios was
given.

26
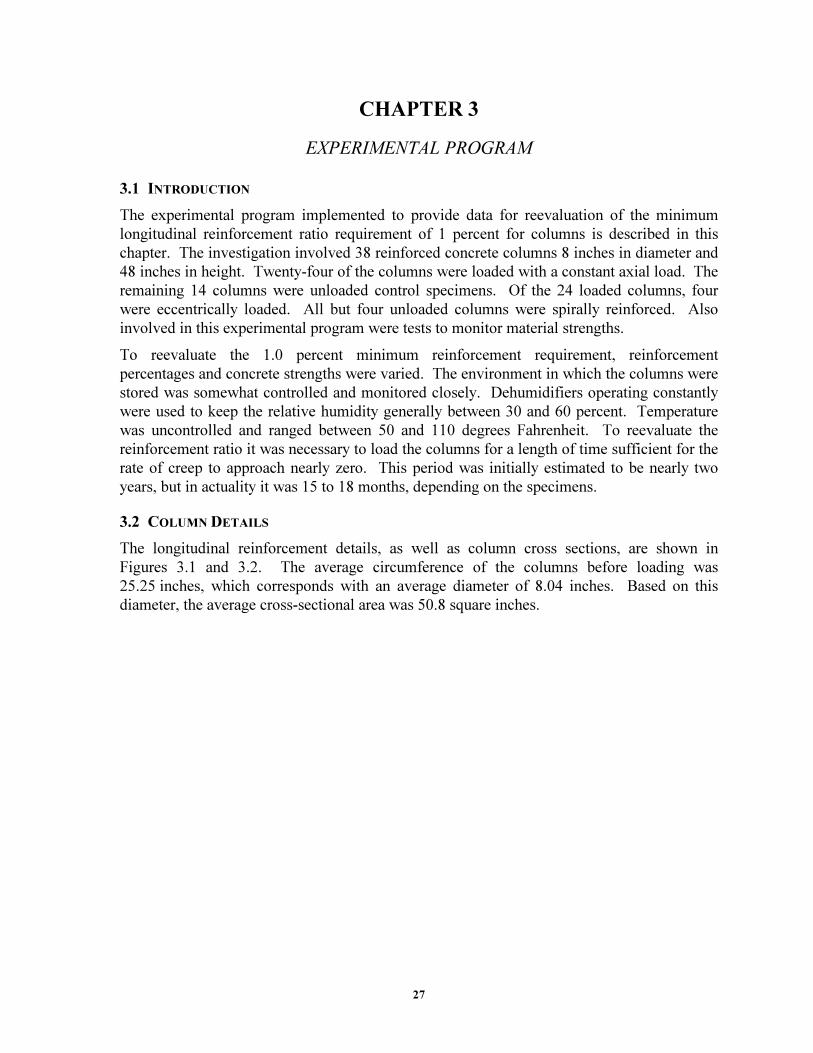
27
CHAPTER 3
EXPERIMENTAL PROGRAM
3.1 INTRODUCTION
The experimental program implemented to provide data for reevaluation of the minimum
longitudinal reinforcement ratio requirement of 1 percent for columns is described in this
chapter. The investigation involved 38 reinforced concrete columns 8 inches in diameter and
48 inches in height. Twenty-four of the columns were loaded with a constant axial load. The
remaining 14 columns were unloaded control specimens. Of the 24 loaded columns, four
were eccentrically loaded. All but four unloaded columns were spirally reinforced. Also
involved in this experimental program were tests to monitor material strengths.
To reevaluate the 1.0 percent minimum reinforcement requirement, reinforcement
percentages and concrete strengths were varied. The environment in which the columns were
stored was somewhat controlled and monitored closely. Dehumidifiers operating constantly
were used to keep the relative humidity generally between 30 and 60 percent. Temperature
was uncontrolled and ranged between 50 and 110 degrees Fahrenheit. To reevaluate the
reinforcement ratio it was necessary to load the columns for a length of time sufficient for the
rate of creep to approach nearly zero. This period was initially estimated to be nearly two
years, but in actuality it was 15 to 18 months, depending on the specimens.
3.2 COLUMN DETAILS
The longitudinal reinforcement details, as well as column cross sections, are shown in
Figures 3.1 and 3.2. The average circumference of the columns before loading was
25.25 inches, which corresponds with an average diameter of 8.04 inches. Based on this
diameter, the average cross-sectional area was 50.8 square inches.
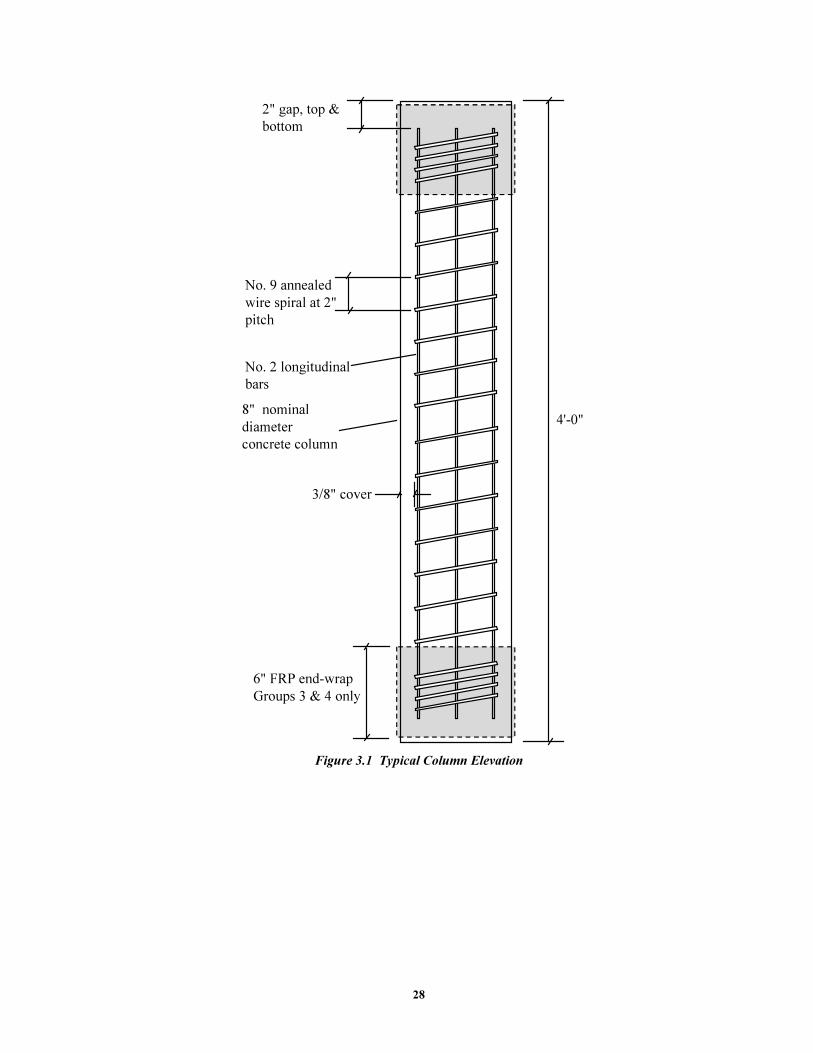
28
No. 9 annealed
wire spiral at 2"
pitch
No. 2 longitudinal
bars
8" nominal
diameter
concrete column
2" gap, top &
bottom
6" FRP end-wrap
Groups 3 & 4 only
3/8" cover
4'-0"
Figure 3.1 Typical Column Elevation
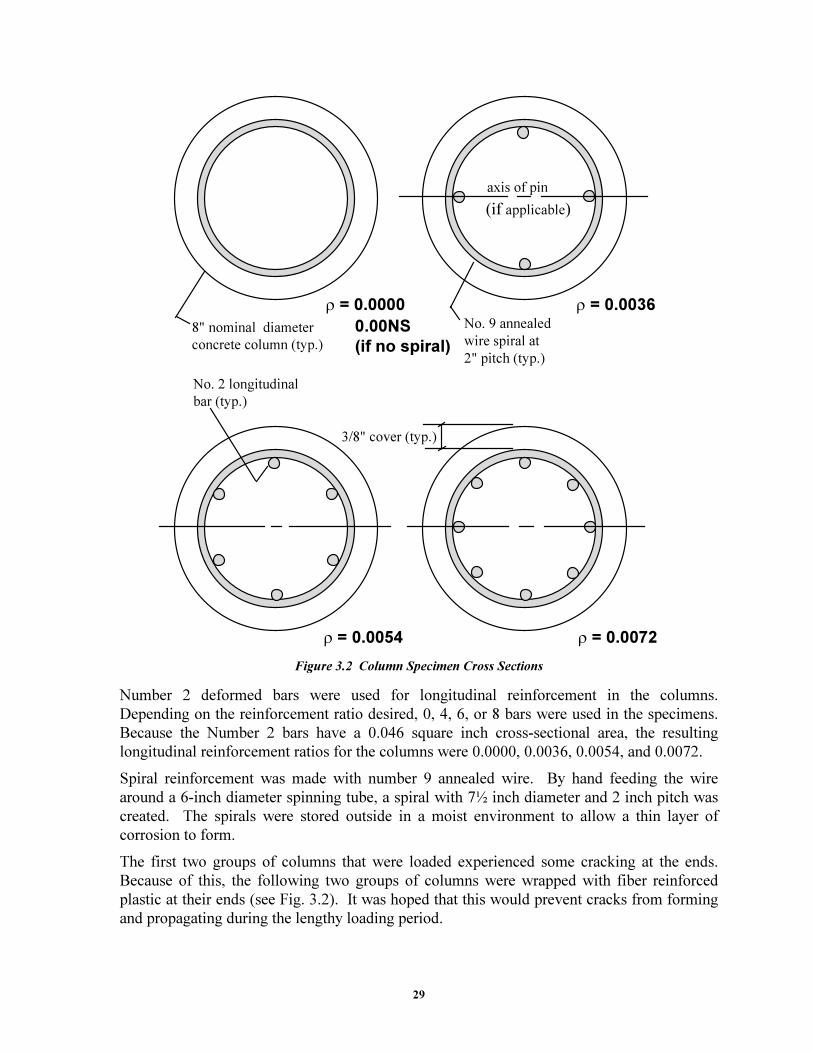
29
ρ = 0.0036
ρ = 0.0054 ρ = 0.0072
ρ = 0.0000
axis of pin
(if applicable)
No. 9 annealed
wire spiral at
2" pitch (typ.)
3/8" cover (typ.)
8" nominal diameter
concrete column (typ.)
No. 2 longitudinal
bar (typ.)
0.00NS
(if no spiral)
Figure 3.2 Column Specimen Cross Sections
Number 2 deformed bars were used for longitudinal reinforcement in the columns.
Depending on the reinforcement ratio desired, 0, 4, 6, or 8 bars were used in the specimens.
Because the Number 2 bars have a 0.046 square inch cross-sectional area, the resulting
longitudinal reinforcement ratios for the columns were 0.0000, 0.0036, 0.0054, and 0.0072.
Spiral reinforcement was made with number 9 annealed wire. By hand feeding the wire
around a 6-inch diameter spinning tube, a spiral with 7½ inch diameter and 2 inch pitch was
created. The spirals were stored outside in a moist environment to allow a thin layer of
corrosion to form.
The first two groups of columns that were loaded experienced some cracking at the ends.
Because of this, the following two groups of columns were wrapped with fiber reinforced
plastic at their ends (see Fig. 3.2). It was hoped that this would prevent cracks from forming
and propagating during the lengthy loading period.
30
A special nomenclature was used to designate each specimen. A digit representing the
nominal concrete compressive strength in ksi follows a letter indicating the type of loading
(concentric, or eccentric, or unloaded). Next are two digits to indicate the reinforcement ratio
in hundredths of percent. If the specimen had no spiral reinforcement, NS, indicating no
steel, supplants these two digits. Lastly, a single digit was used to specify a particular
specimen within a group of identical specimens. An example of this is the specimen named
E4-72-2. It is an eccentrically-loaded, 4-ksi specimen with a reinforcement ratio of 0.0072,
and is the second in a group of identical specimens.
The number of specimens examined with the various concrete strengths, reinforcement ratios,
and loading conditions is presented in Table 3.1.
Table 3.1 Number of Specimens
Design concrete
strength, psi
(& load type)
8 bars
spiral
0.0072
6 bars
spiral
0.0054
4 bars
spiral
0.0036
0 bars
spiral
0.0000
0 bars
no spiral
0.0000
8,000 (concentric) 3 3 3 1
8,000 (eccentric) 1 1
8,000 (no load) 1 1 1 2 2
4,000 (concentric) 3 3 3 1
4,000 (eccentric) 1 1
4,000 (no load) 1 1 1 2 2
Actual concrete strengths, reinforcement ratios, column end conditions, load eccentricity,
casting dates, age at loading, and group number for all 38 specimens are listed in Table 3.2.
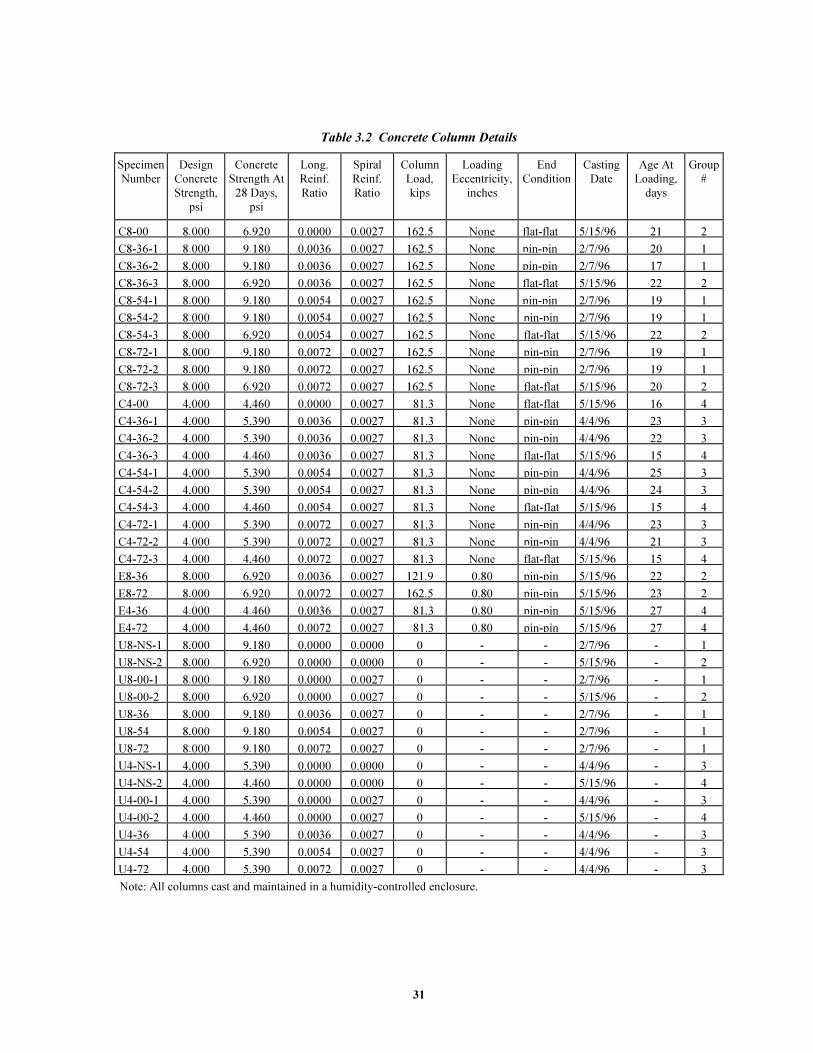
31
Table 3.2 Concrete Column Details
Specimen
Number
Design
Concrete
Strength,
psi
Concrete
Strength At
28 Days,
psi
Long.
Reinf.
Ratio
Spiral
Reinf.
Ratio
Column
Load,
kips
Loading
Eccentricity,
inches
End
Condition
Casting
Date
Age At
Loading,
days
Group
#
C8-00 8,000 6,920 0.0000 0.0027 162.5 None flat-flat 5/15/96 21 2
C8-36-1 8,000 9,180 0.0036 0.0027 162.5 None pin-pin 2/7/96 20 1
C8-36-2 8,000 9,180 0.0036 0.0027 162.5 None pin-pin 2/7/96 17 1
C8-36-3 8,000 6,920 0.0036 0.0027 162.5 None flat-flat 5/15/96 22 2
C8-54-1 8,000 9,180 0.0054 0.0027 162.5 None pin-pin 2/7/96 19 1
C8-54-2 8,000 9,180 0.0054 0.0027 162.5 None pin-pin 2/7/96 19 1
C8-54-3 8,000 6,920 0.0054 0.0027 162.5 None flat-flat 5/15/96 22 2
C8-72-1 8,000 9,180 0.0072 0.0027 162.5 None pin-pin 2/7/96 19 1
C8-72-2 8,000 9,180 0.0072 0.0027 162.5 None pin-pin 2/7/96 19 1
C8-72-3 8,000 6,920 0.0072 0.0027 162.5 None flat-flat 5/15/96 20 2
C4-00 4,000 4,460 0.0000 0.0027 81.3 None flat-flat 5/15/96 16 4
C4-36-1 4,000 5,390 0.0036 0.0027 81.3 None pin-pin 4/4/96 23 3
C4-36-2 4,000 5,390 0.0036 0.0027 81.3 None pin-pin 4/4/96 22 3
C4-36-3 4,000 4,460 0.0036 0.0027 81.3 None flat-flat 5/15/96 15 4
C4-54-1 4,000 5,390 0.0054 0.0027 81.3 None pin-pin 4/4/96 25 3
C4-54-2 4,000 5,390 0.0054 0.0027 81.3 None pin-pin 4/4/96 24 3
C4-54-3 4,000 4,460 0.0054 0.0027 81.3 None flat-flat 5/15/96 15 4
C4-72-1 4,000 5,390 0.0072 0.0027 81.3 None pin-pin 4/4/96 23 3
C4-72-2 4,000 5,390 0.0072 0.0027 81.3 None pin-pin 4/4/96 21 3
C4-72-3 4,000 4,460 0.0072 0.0027 81.3 None flat-flat 5/15/96 15 4
E8-36 8,000 6,920 0.0036 0.0027 121.9 0.80 pin-pin 5/15/96 22 2
E8-72 8,000 6,920 0.0072 0.0027 162.5 0.80 pin-pin 5/15/96 23 2
E4-36 4,000 4,460 0.0036 0.0027 81.3 0.80 pin-pin 5/15/96 27 4
E4-72 4,000 4,460 0.0072 0.0027 81.3 0.80 pin-pin 5/15/96 27 4
U8-NS-1 8,000 9,180 0.0000 0.0000 0 - - 2/7/96 - 1
U8-NS-2 8,000 6,920 0.0000 0.0000 0 - - 5/15/96 - 2
U8-00-1 8,000 9,180 0.0000 0.0027 0 - - 2/7/96 - 1
U8-00-2 8,000 6,920 0.0000 0.0027 0 - - 5/15/96 - 2
U8-36 8,000 9,180 0.0036 0.0027 0 - - 2/7/96 - 1
U8-54 8,000 9,180 0.0054 0.0027 0 - - 2/7/96 - 1
U8-72 8,000 9,180 0.0072 0.0027 0 - - 2/7/96 - 1
U4-NS-1 4,000 5,390 0.0000 0.0000 0 - - 4/4/96 - 3
U4-NS-2 4,000 4,460 0.0000 0.0000 0 - - 5/15/96 - 4
U4-00-1 4,000 5,390 0.0000 0.0027 0 - - 4/4/96 - 3
U4-00-2 4,000 4,460 0.0000 0.0027 0 - - 5/15/96 - 4
U4-36 4,000 5,390 0.0036 0.0027 0 - - 4/4/96 - 3
U4-54 4,000 5,390 0.0054 0.0027 0 - - 4/4/96 - 3
U4-72 4,000 5,390 0.0072 0.0027 0 - - 4/4/96 - 3
Note: All columns cast and maintained in a humidity-controlled enclosure.
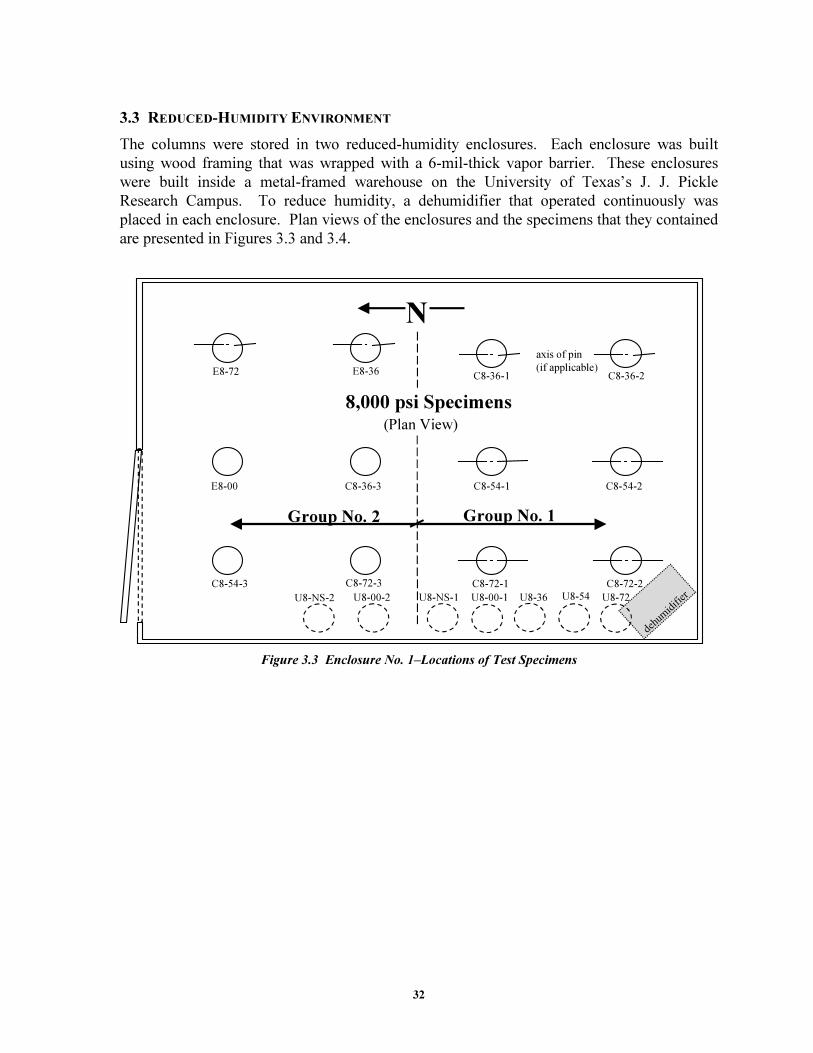
32
3.3 REDUCED-HUMIDITY ENVIRONMENT
The columns were stored in two reduced-humidity enclosures. Each enclosure was built
using wood framing that was wrapped with a 6-mil-thick vapor barrier. These enclosures
were built inside a metal-framed warehouse on the University of Texas’s J. J. Pickle
Research Campus. To reduce humidity, a dehumidifier that operated continuously was
placed in each enclosure. Plan views of the enclosures and the specimens that they contained
are presented in Figures 3.3 and 3.4.
dehumidifier
Group No. 1Group No. 2
E8-72 E8-36
E8-00 C8-36-3
C8-54-3 C8-72-3 C8-72-1 C8-72-2
C8-36-1 C8-36-2
C8-54-1 C8-54-2
U8-72U8-54U8-36U8-00-1U8-NS-1U8-NS-2 U8-00-2
axis of pin
(if applicable)
8,000 psi Specimens(Plan View)
N
Figure 3.3 Enclosure No. 1–Locations of Test Specimens
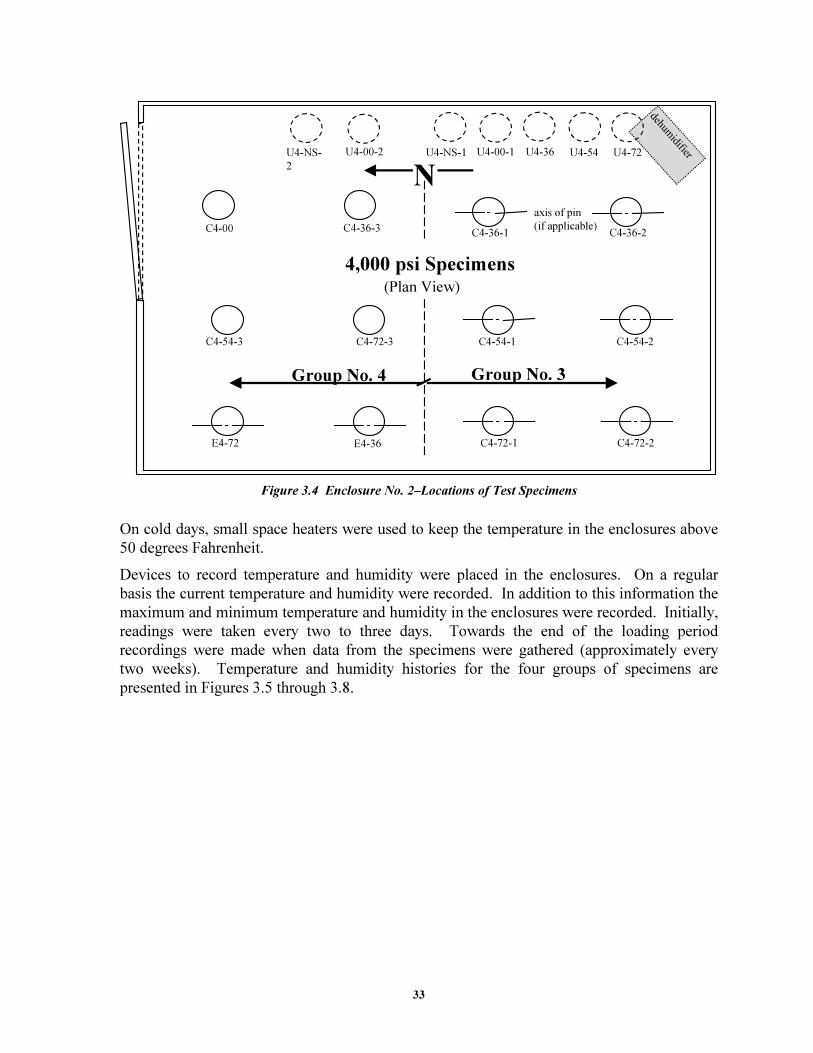
33
U4-72U4-54U4-36U4-00-1U4-NS-1dehumidifier
Group No. 3Group No. 4
C4-00 C4-36-3 C4-36-1 C4-36-2
U4-NS-
2
U4-00-2
C4-54-3 C4-72-3
E4-72 E4-36 C4-72-1 C4-72-2
C4-54-1 C4-54-2
axis of pin
(if applicable)
4,000 psi Specimens(Plan View)
N
Figure 3.4 Enclosure No. 2–Locations of Test Specimens
On cold days, small space heaters were used to keep the temperature in the enclosures above
50 degrees Fahrenheit.
Devices to record temperature and humidity were placed in the enclosures. On a regular
basis the current temperature and humidity were recorded. In addition to this information the
maximum and minimum temperature and humidity in the enclosures were recorded. Initially,
readings were taken every two to three days. Towards the end of the loading period
recordings were made when data from the specimens were gathered (approximately every
two weeks). Temperature and humidity histories for the four groups of specimens are
presented in Figures 3.5 through 3.8.
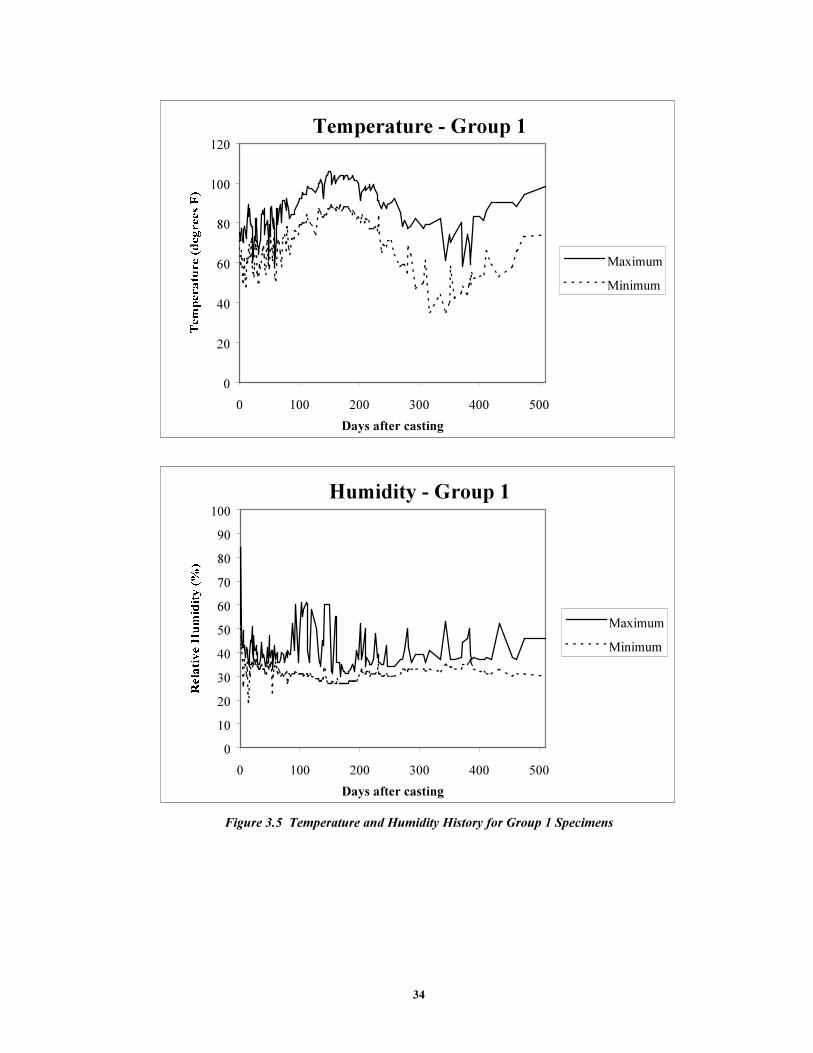
34
Temperature - Group 1
0
20
40
60
80
100
120
0 100 200 300 400 500
Days after casting
Maximum
Minimum
Humidity - Group 1
0
10
20
30
40
50
60
70
80
90
100
0 100 200 300 400 500
Days after casting
Maximum
Minimum
Figure 3.5 Temperature and Humidity History for Group 1 Specimens
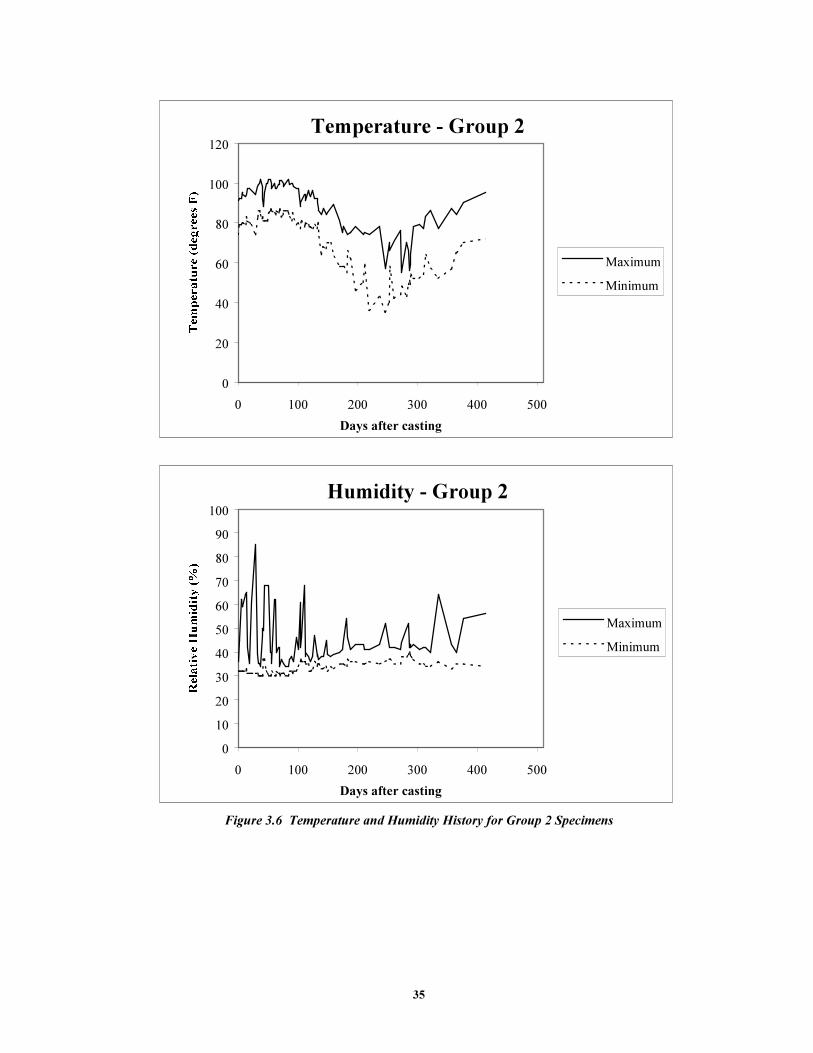
35
Temperature - Group 2
0
20
40
60
80
100
120
0 100 200 300 400 500
Days after casting
Maximum
Minimum
Humidity - Group 2
0
10
20
30
40
50
60
70
80
90
100
0 100 200 300 400 500
Days after casting
Maximum
Minimum
Figure 3.6 Temperature and Humidity History for Group 2 Specimens
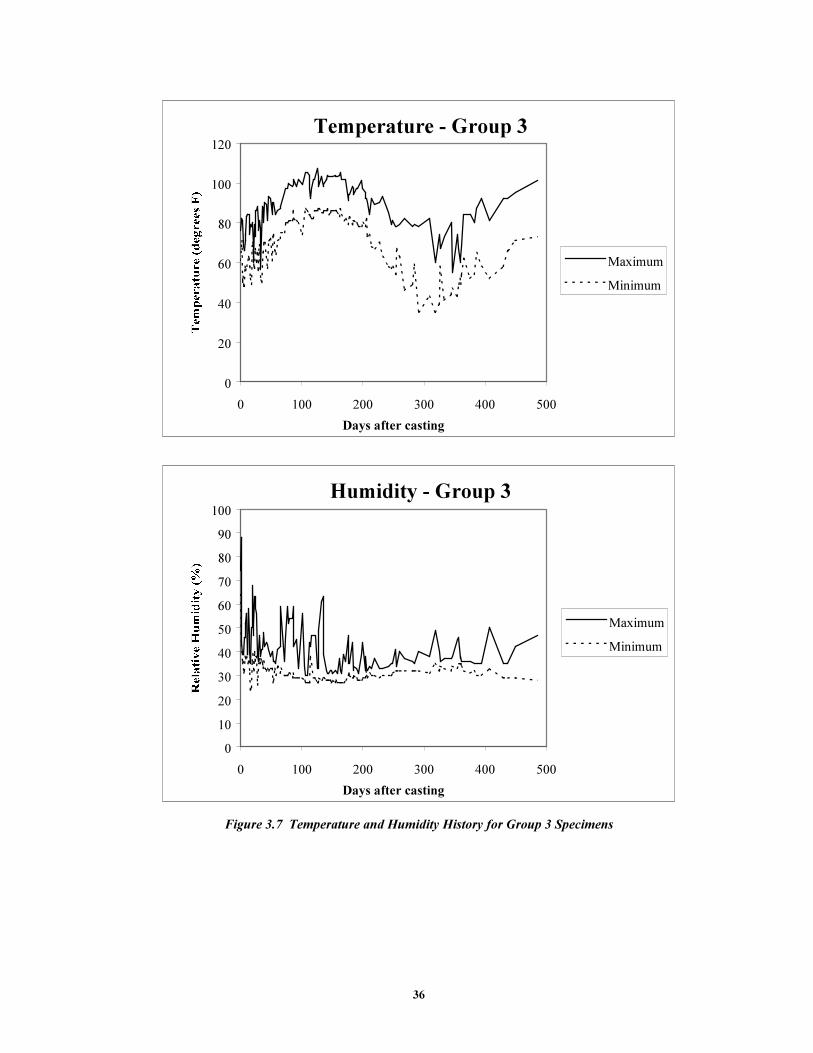
36
Temperature - Group 3
0
20
40
60
80
100
120
0 100 200 300 400 500
Days after casting
Maximum
Minimum
Humidity - Group 3
0
10
20
30
40
50
60
70
80
90
100
0 100 200 300 400 500
Days after casting
Maximum
Minimum
Figure 3.7 Temperature and Humidity History for Group 3 Specimens
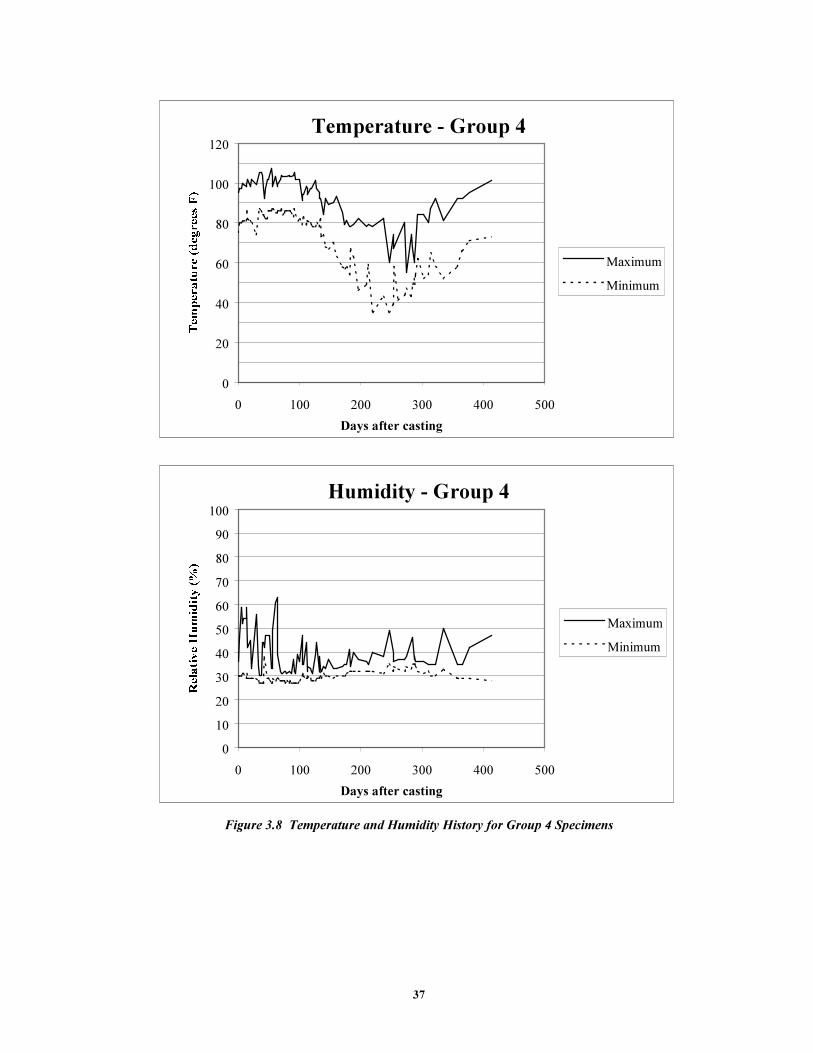
37
Temperature - Group 4
0
20
40
60
80
100
120
0 100 200 300 400 500
Days after casting
Maximum
Minimum
Humidity - Group 4
0
10
20
30
40
50
60
70
80
90
100
0 100 200 300 400 500
Days after casting
Maximum
Minimum
Figure 3.8 Temperature and Humidity History for Group 4 Specimens
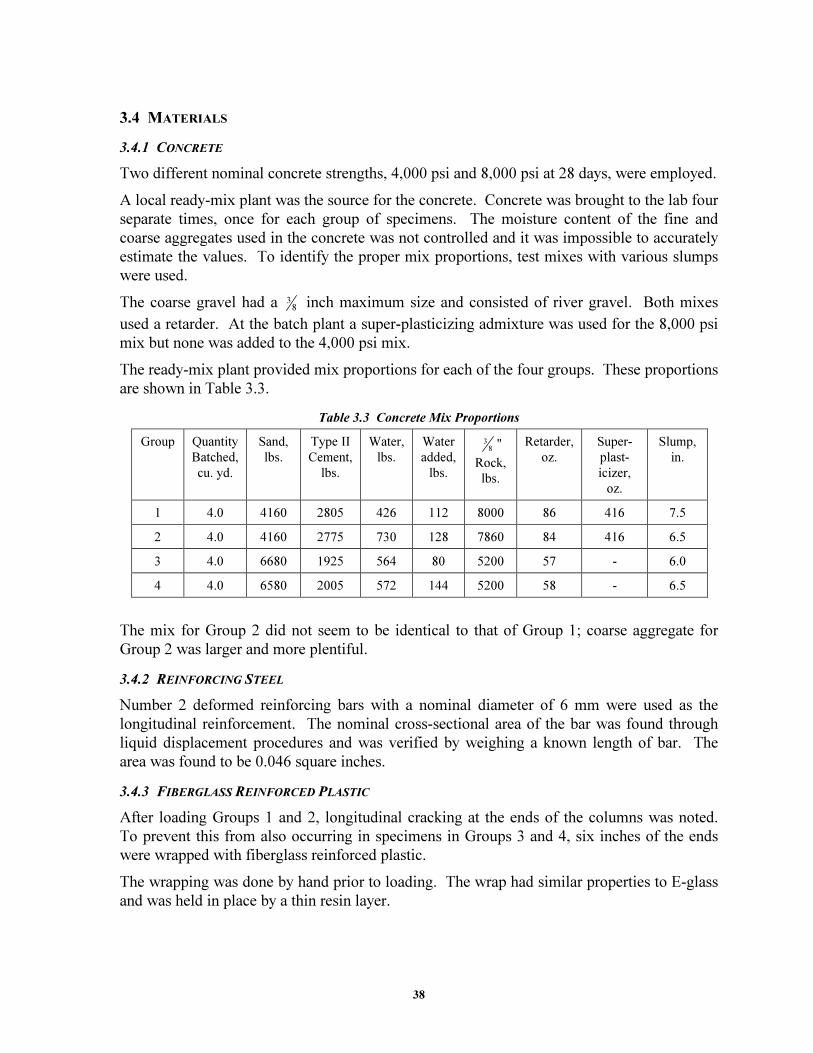
38
3.4 MATERIALS
3.4.1 CONCRETE
Two different nominal concrete strengths, 4,000 psi and 8,000 psi at 28 days, were employed.
A local ready-mix plant was the source for the concrete. Concrete was brought to the lab four
separate times, once for each group of specimens. The moisture content of the fine and
coarse aggregates used in the concrete was not controlled and it was impossible to accurately
estimate the values. To identify the proper mix proportions, test mixes with various slumps
were used.
The coarse gravel had a 83 inch maximum size and consisted of river gravel. Both mixes
used a retarder. At the batch plant a super-plasticizing admixture was used for the 8,000 psi
mix but none was added to the 4,000 psi mix.
The ready-mix plant provided mix proportions for each of the four groups. These proportions
are shown in Table 3.3.
Table 3.3 Concrete Mix Proportions
Group Quantity
Batched,
cu. yd.
Sand,
lbs.
Type II
Cement,
lbs.
Water,
lbs.
Water
added,
lbs.
8
3 ''
Rock,
lbs.
Retarder,
oz.
Super-
plast-
icizer,
oz.
Slump,
in.
1 4.0 4160 2805 426 112 8000 86 416 7.5
2 4.0 4160 2775 730 128 7860 84 416 6.5
3 4.0 6680 1925 564 80 5200 57 - 6.0
4 4.0 6580 2005 572 144 5200 58 - 6.5
The mix for Group 2 did not seem to be identical to that of Group 1; coarse aggregate for
Group 2 was larger and more plentiful.
3.4.2 REINFORCING STEEL
Number 2 deformed reinforcing bars with a nominal diameter of 6 mm were used as the
longitudinal reinforcement. The nominal cross-sectional area of the bar was found through
liquid displacement procedures and was verified by weighing a known length of bar. The
area was found to be 0.046 square inches.
3.4.3 FIBERGLASS REINFORCED PLASTIC
After loading Groups 1 and 2, longitudinal cracking at the ends of the columns was noted.
To prevent this from also occurring in specimens in Groups 3 and 4, six inches of the ends
were wrapped with fiberglass reinforced plastic.
The wrapping was done by hand prior to loading. The wrap had similar properties to E-glass
and was held in place by a thin resin layer.
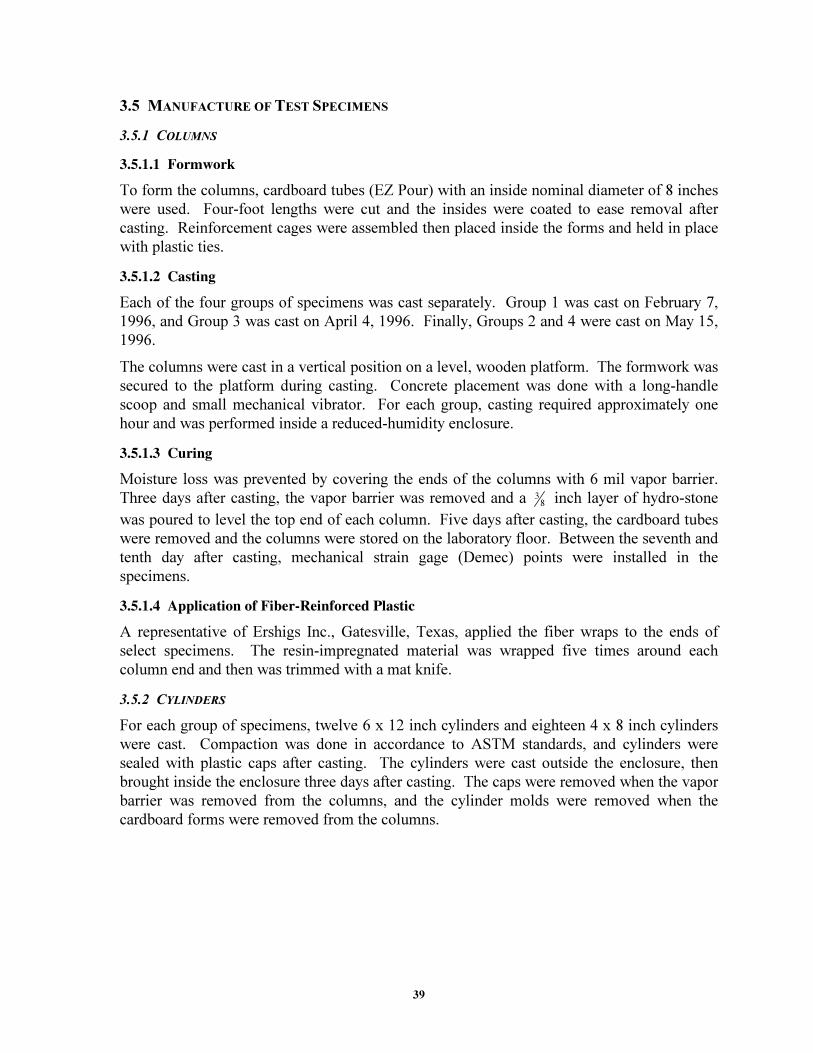
39
3.5 MANUFACTURE OF TEST SPECIMENS
3.5.1 COLUMNS
����������������
To form the columns, cardboard tubes (EZ Pour) with an inside nominal diameter of 8 inches
were used. Four-foot lengths were cut and the insides were coated to ease removal after
casting. Reinforcement cages were assembled then placed inside the forms and held in place
with plastic ties.
��������� �������
Each of the four groups of specimens was cast separately. Group 1 was cast on February 7,
1996, and Group 3 was cast on April 4, 1996. Finally, Groups 2 and 4 were cast on May 15,
1996.
The columns were cast in a vertical position on a level, wooden platform. The formwork was
secured to the platform during casting. Concrete placement was done with a long-handle
scoop and small mechanical vibrator. For each group, casting required approximately one
hour and was performed inside a reduced-humidity enclosure.
��������� ������
Moisture loss was prevented by covering the ends of the columns with 6 mil vapor barrier.
Three days after casting, the vapor barrier was removed and a 83 inch layer of hydro-stone
was poured to level the top end of each column. Five days after casting, the cardboard tubes
were removed and the columns were stored on the laboratory floor. Between the seventh and
tenth day after casting, mechanical strain gage (Demec) points were installed in the
specimens.
����������������������������������������� �������
A representative of Ershigs Inc., Gatesville, Texas, applied the fiber wraps to the ends of
select specimens. The resin-impregnated material was wrapped five times around each
column end and then was trimmed with a mat knife.
3.5.2 CYLINDERS
For each group of specimens, twelve 6 x 12 inch cylinders and eighteen 4 x 8 inch cylinders
were cast. Compaction was done in accordance to ASTM standards, and cylinders were
sealed with plastic caps after casting. The cylinders were cast outside the enclosure, then
brought inside the enclosure three days after casting. The caps were removed when the vapor
barrier was removed from the columns, and the cylinder molds were removed when the
cardboard forms were removed from the columns.
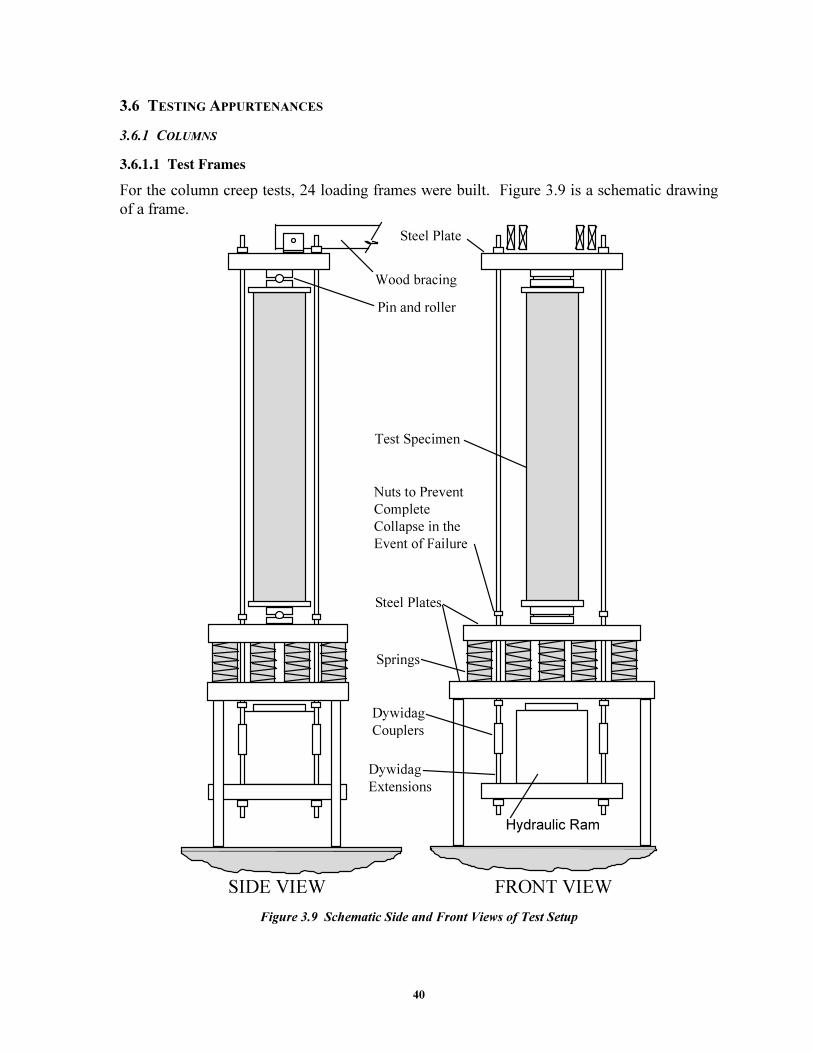
40
3.6 TESTING APPURTENANCES
3.6.1 COLUMNS
��!������"����������
For the column creep tests, 24 loading frames were built. Figure 3.9 is a schematic drawing
of a frame.
Springs
Test Specimen
Hydraulic Ram
Steel Plates
Dywidag
Couplers
Dywidag
Extensions
Wood bracing
FRONT VIEWSIDE VIEW
Pin and roller
Steel Plate
Nuts to Prevent
Complete
Collapse in the
Event of Failure
Figure 3.9 Schematic Side and Front Views of Test Setup
41
The legs of the testing frames were made from 163 inch thick steel tubes. Load was
maintained using triple-coil springs that deflected 1½ inches under 20 kips of sustained load.
Eight springs were used to maintain the 162 kip load, and four springs were needed to
maintain the 81 kip load. Deformations of the springs were monitored using a metal scale
with an accuracy of 641 inch.
Four Dywidag bars were used in all the setups. The 4,000 psi specimens used 85 inch
diameter bars and the 8,000 psi specimens used 1 inch diameter bars. The bars extended
from approximately 3 inches above the 3 inch thick steel top plate down to 9 inches below
the bottom plate. To apply load to each specimen, a hydraulic ram was placed on a 3 inch
steel plate which was positioned beneath each frame and attached to the Dywidag bars using
four coupling sleeves. Once load was applied to a specimen, nuts beneath the steel plate
holding the triple coil springs were snug-tightened to maintain the spring deflections and
thus, the load on the specimen. Using this setup, several specimens could be loaded each
day.
Groups 1 and 3 had pinned-end conditions. Two 1½ inch steel plates were separated by a
1¼ inch diameter steel rod which fit into depressions in the steel plates. This arrangement
was used on both the top and bottom of the specimens. Installation of these pins proved to be
quite difficult because it was difficult to align the two pins with the imperfections in the
columns and loading system. Because of this difficulty the concentrically-loaded specimens
in Groups 2 and 4 were not loaded using these pins. Instead, some specimens had neoprene
pads placed between the top and bottom plates and the specimens. This approach also
contained inherent problems because the pads tended to “walk” on the surface of the bottom
plate during loading, which resulted in eccentricity of the applied load. As a result, only two
of the specimens had neoprene pads. The remainder were loaded without neoprene pads.
The eccentrically-loaded specimens used the pins and had their top plates braced against
lateral movement.
��!������#������$�����������
Both mechanical and electrical strain measurements were made for all the specimens. The
mechanical measurements were made using Demec points set into the specimens. The
electrical measurements employed electrical resistance strain gages.
Each specimen had four pairs of Demec points. The pairs were oriented vertically on the
columns (parallel to the longitudinal axis), as shown in Figure 3.10, and placed 20 degrees
off the East-West axis of the columns as shown in Figure 3.11. The points were 1 inch metal
H.I.T. anchors manufactured by Hilti and were place 400 mm apart. The anchors were placed
7 to 10 days after casting in drilled holes using epoxy.
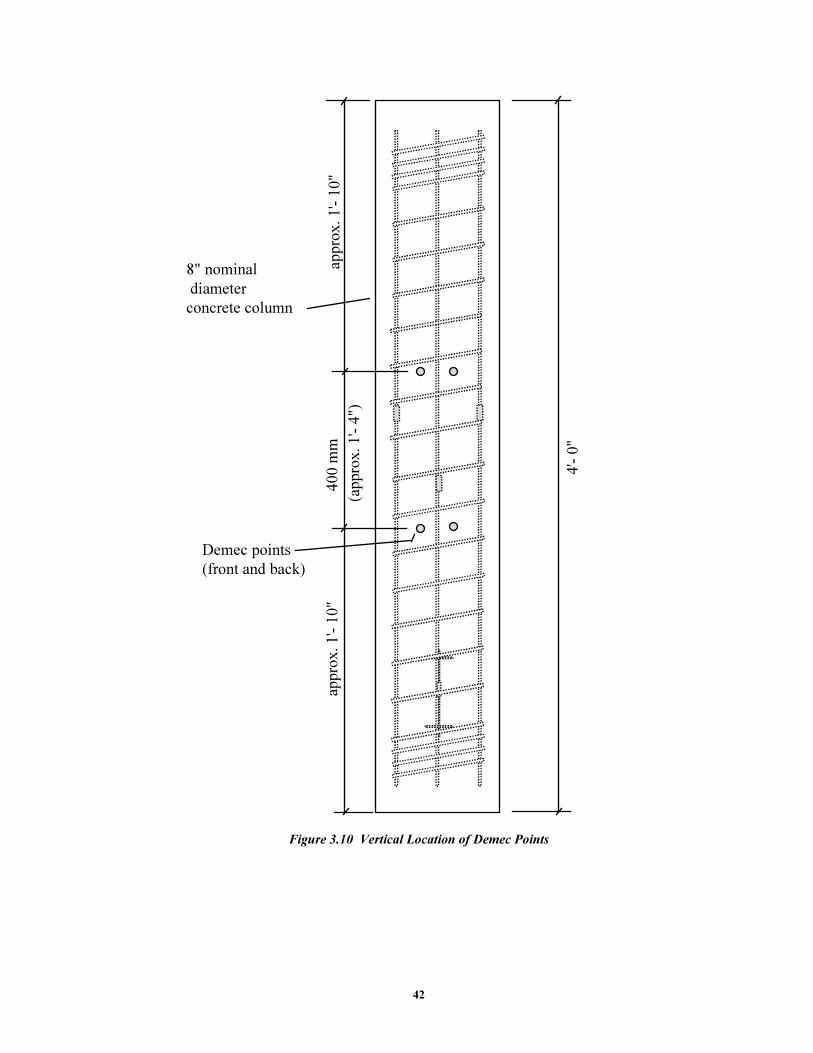
42
8" nominal
diameter
concrete column
4'-
0"
40
0 m
m
(ap
pro
x.
1'-
4")
ap
pro
x.
1'-
10
"ap
pro
x. 1
'- 1
0"
Demec points
(front and back)
Figure 3.10 Vertical Location of Demec Points
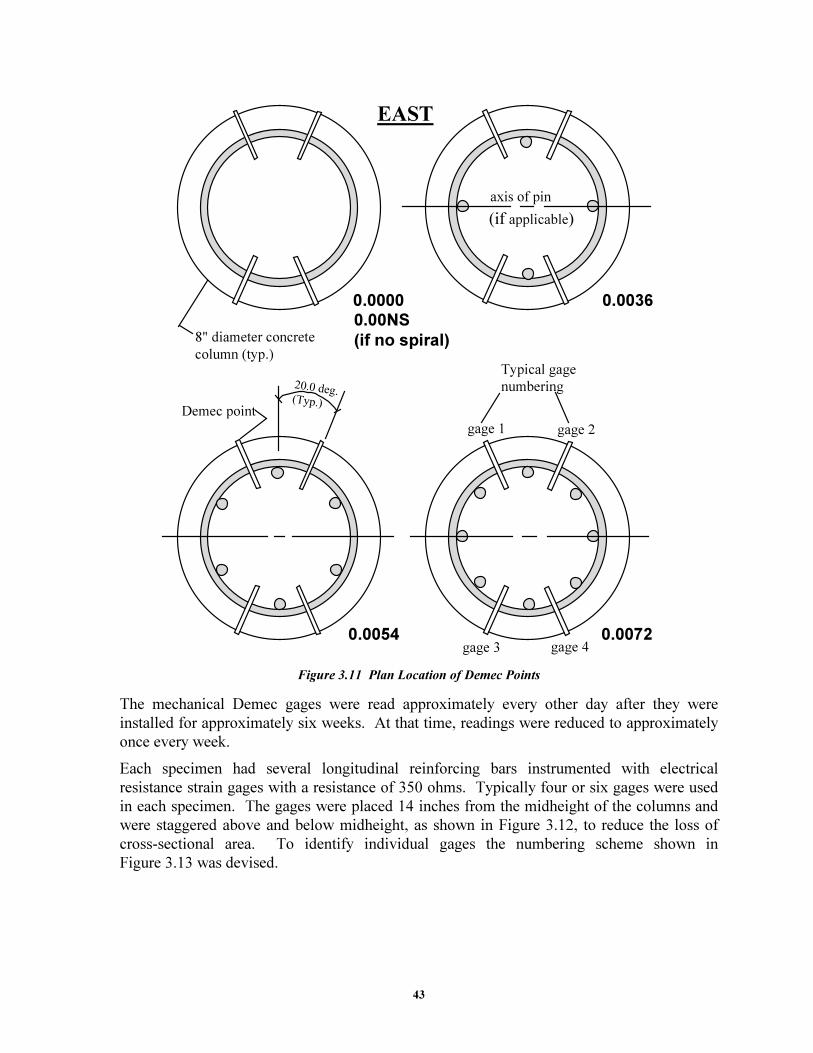
43
0.0036
0.0054 0.0072
axis of pin
(if applicable)
8" diameter concrete
column (typ.)
0.0000
0.00NS
(if no spiral)
EAST
gage 1 gage 2
gage 3 gage 4
Typical gage
numbering20.0 deg.(Typ.)
Demec point
Figure 3.11 Plan Location of Demec Points
The mechanical Demec gages were read approximately every other day after they were
installed for approximately six weeks. At that time, readings were reduced to approximately
once every week.
Each specimen had several longitudinal reinforcing bars instrumented with electrical
resistance strain gages with a resistance of 350 ohms. Typically four or six gages were used
in each specimen. The gages were placed 14 inches from the midheight of the columns and
were staggered above and below midheight, as shown in Figure 3.12, to reduce the loss of
cross-sectional area. To identify individual gages the numbering scheme shown in
Figure 3.13 was devised.
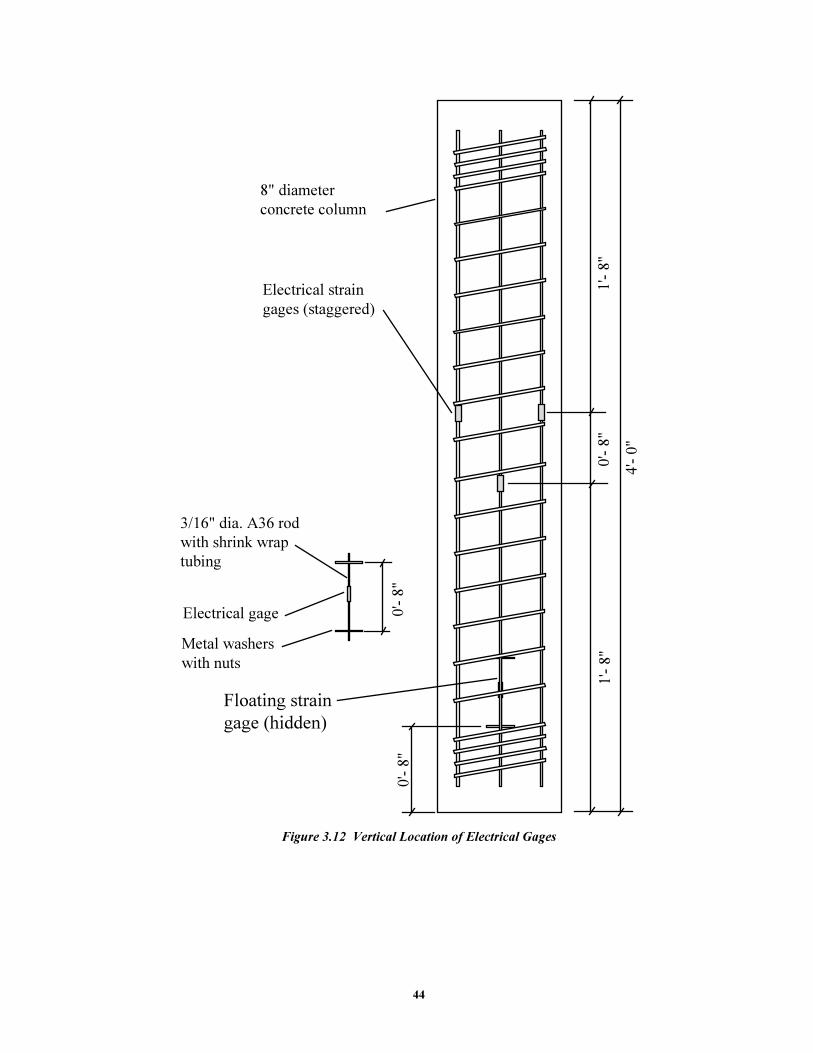
44
8" diameter
concrete column
4'-
0"
0'-
8"
Electrical strain
gages (staggered)
1'-
8"
1'-
8"
0'-
8"
Floating strain
gage (hidden)
3/16" dia. A36 rod
with shrink wrap
tubing
Electrical gage
Metal washers
with nuts
0'-
8"
Figure 3.12 Vertical Location of Electrical Gages
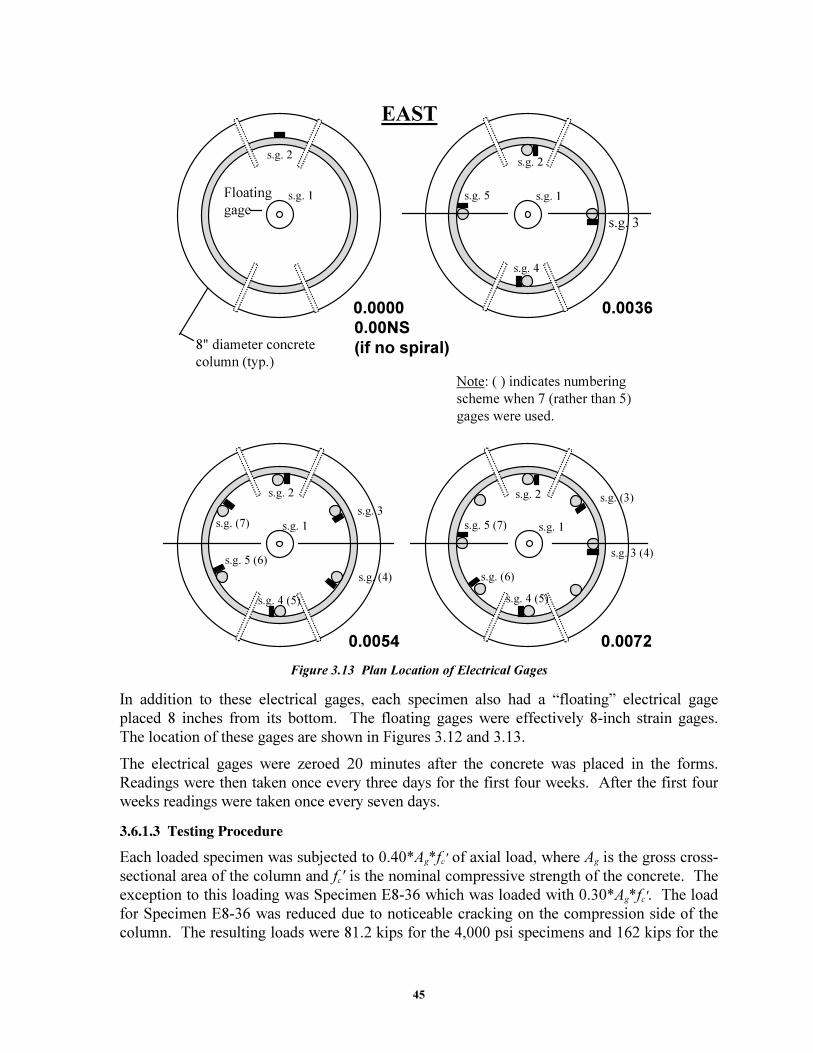
45
0.0036
0.0054 0.0072
8" diameter concrete
column (typ.)
0.0000
0.00NS
(if no spiral)
EAST
s.g. 2
s.g. 3
s.g. 4
s.g. 5 s.g. 1s.g. 1
s.g. 2
s.g. 1 s.g. 1
s.g. 2
s.g. 3
s.g. 4 (5)
s.g. 5 (6)
s.g. 2
s.g. 3 (4)
s.g. 4 (5)
s.g. 5 (7)
s.g. (3)
s.g. (6)
Note: ( ) indicates numbering
scheme when 7 (rather than 5)
gages were used.
Floating
gage
s.g. (4)
s.g. (7)
Figure 3.13 Plan Location of Electrical Gages
In addition to these electrical gages, each specimen also had a “floating” electrical gage
placed 8 inches from its bottom. The floating gages were effectively 8-inch strain gages.
The location of these gages are shown in Figures 3.12 and 3.13.
The electrical gages were zeroed 20 minutes after the concrete was placed in the forms.
Readings were then taken once every three days for the first four weeks. After the first four
weeks readings were taken once every seven days.
��������������� ���������
Each loaded specimen was subjected to 0.40*Ag*fc' of axial load, where Ag is the gross cross-
sectional area of the column and fc' is the nominal compressive strength of the concrete. The
exception to this loading was Specimen E8-36 which was loaded with 0.30*Ag*fc'. The load
for Specimen E8-36 was reduced due to noticeable cracking on the compression side of the
column. The resulting loads were 81.2 kips for the 4,000 psi specimens and 162 kips for the
46
8,000 psi specimens. The columns with eccentric load had an eccentricity of 0.80 inches
which was equivalent to the code minimum of 10 percent of the nominal column diameter.
Load was applied using a 300 kip-capacity hydraulic ram. Once the load was applied,
Dywidag nuts were hand tightened to secure the spring deformations. Pressure in the ram
was monitored using a gage accurate to 200 psi. A small additional load was applied to
account for seating of the nuts on the Dywidag bars.
The exact day on which each specimen was loaded is shown in Table 3.2, and was generally
between 14 and 28 days after casting.
3.6.2 CONCRETE CYLINDERS
Small (4 x 8 inch) and large (6 x 12 inch) cylinders were tested at 7, 14, 21, 28, 42, and
56 days. A minimum of two cylinders were tested in compression on each occasion for each
specimen group. Both load and deflection data were recorded for each cylinder at several
stress levels. These results were then averaged and used to calculate an ultimate strength and
modulus of elasticity. Strength and modulus tests were conducted in accordance with ASTM
C39-61(5) and ASTM C469-94, respectively.
3.6.3 REINFORCING STEEL
Four tensile tests were conducted on the Number 2 bars using a 60-kip capacity Tinius-Olson
universal test machine. The yield and ultimate strength of the Number 2 bars were
determined from these tests.
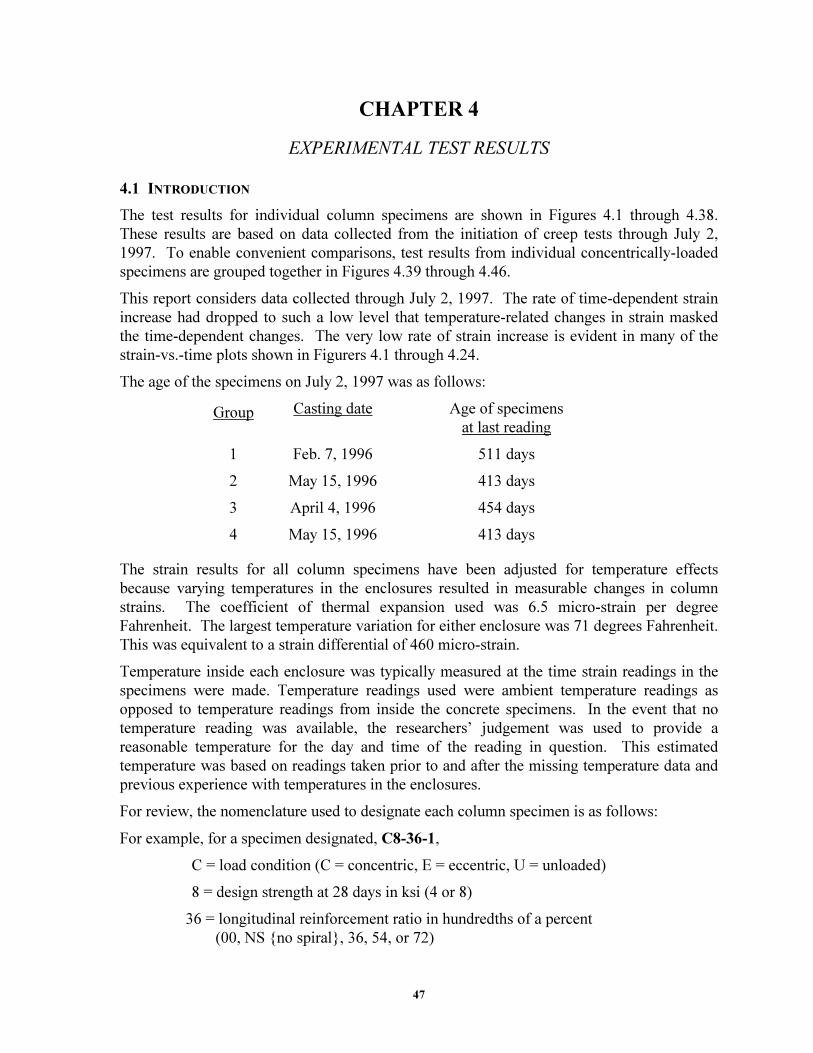
47
CHAPTER 4
EXPERIMENTAL TEST RESULTS
4.1 INTRODUCTION
The test results for individual column specimens are shown in Figures 4.1 through 4.38.
These results are based on data collected from the initiation of creep tests through July 2,
1997. To enable convenient comparisons, test results from individual concentrically-loaded
specimens are grouped together in Figures 4.39 through 4.46.
This report considers data collected through July 2, 1997. The rate of time-dependent strain
increase had dropped to such a low level that temperature-related changes in strain masked
the time-dependent changes. The very low rate of strain increase is evident in many of the
strain-vs.-time plots shown in Figurers 4.1 through 4.24.
The age of the specimens on July 2, 1997 was as follows:
Group Casting date Age of specimens
at last reading
1 Feb. 7, 1996 511 days
2 May 15, 1996 413 days
3 April 4, 1996 454 days
4 May 15, 1996 413 days
The strain results for all column specimens have been adjusted for temperature effects
because varying temperatures in the enclosures resulted in measurable changes in column
strains. The coefficient of thermal expansion used was 6.5 micro-strain per degree
Fahrenheit. The largest temperature variation for either enclosure was 71 degrees Fahrenheit.
This was equivalent to a strain differential of 460 micro-strain.
Temperature inside each enclosure was typically measured at the time strain readings in the
specimens were made. Temperature readings used were ambient temperature readings as
opposed to temperature readings from inside the concrete specimens. In the event that no
temperature reading was available, the researchers’ judgement was used to provide a
reasonable temperature for the day and time of the reading in question. This estimated
temperature was based on readings taken prior to and after the missing temperature data and
previous experience with temperatures in the enclosures.
For review, the nomenclature used to designate each column specimen is as follows:
For example, for a specimen designated, C8-36-1,
C = load condition (C = concentric, E = eccentric, U = unloaded)
8 = design strength at 28 days in ksi (4 or 8)
36 = longitudinal reinforcement ratio in hundredths of a percent
(00, NS {no spiral}, 36, 54, or 72)
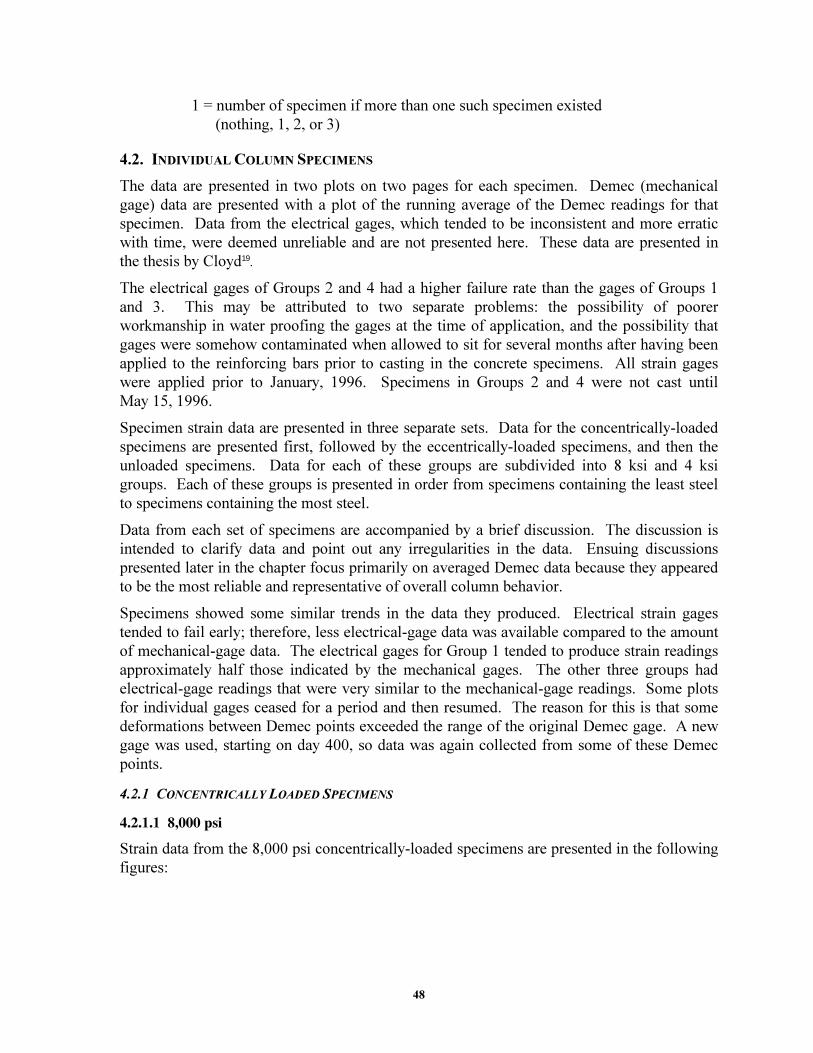
48
1 = number of specimen if more than one such specimen existed
(nothing, 1, 2, or 3)
4.2. INDIVIDUAL COLUMN SPECIMENS
The data are presented in two plots on two pages for each specimen. Demec (mechanical
gage) data are presented with a plot of the running average of the Demec readings for that
specimen. Data from the electrical gages, which tended to be inconsistent and more erratic
with time, were deemed unreliable and are not presented here. These data are presented in
the thesis by Cloyd19.
The electrical gages of Groups 2 and 4 had a higher failure rate than the gages of Groups 1
and 3. This may be attributed to two separate problems: the possibility of poorer
workmanship in water proofing the gages at the time of application, and the possibility that
gages were somehow contaminated when allowed to sit for several months after having been
applied to the reinforcing bars prior to casting in the concrete specimens. All strain gages
were applied prior to January, 1996. Specimens in Groups 2 and 4 were not cast until
May 15, 1996.
Specimen strain data are presented in three separate sets. Data for the concentrically-loaded
specimens are presented first, followed by the eccentrically-loaded specimens, and then the
unloaded specimens. Data for each of these groups are subdivided into 8 ksi and 4 ksi
groups. Each of these groups is presented in order from specimens containing the least steel
to specimens containing the most steel.
Data from each set of specimens are accompanied by a brief discussion. The discussion is
intended to clarify data and point out any irregularities in the data. Ensuing discussions
presented later in the chapter focus primarily on averaged Demec data because they appeared
to be the most reliable and representative of overall column behavior.
Specimens showed some similar trends in the data they produced. Electrical strain gages
tended to fail early; therefore, less electrical-gage data was available compared to the amount
of mechanical-gage data. The electrical gages for Group 1 tended to produce strain readings
approximately half those indicated by the mechanical gages. The other three groups had
electrical-gage readings that were very similar to the mechanical-gage readings. Some plots
for individual gages ceased for a period and then resumed. The reason for this is that some
deformations between Demec points exceeded the range of the original Demec gage. A new
gage was used, starting on day 400, so data was again collected from some of these Demec
points.
4.2.1 CONCENTRICALLY LOADED SPECIMENS
�������������������
Strain data from the 8,000 psi concentrically-loaded specimens are presented in the following
figures:
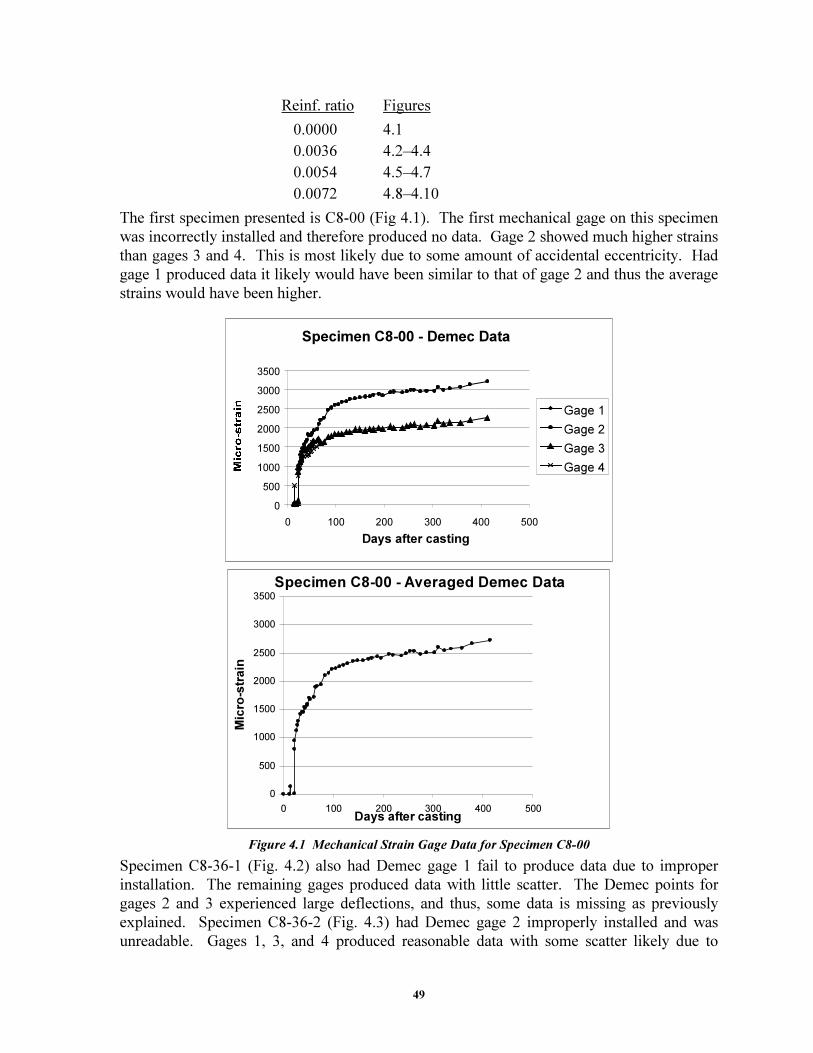
49
Reinf. ratio Figures
0.0000 4.1
0.0036 4.2–4.4
0.0054 4.5–4.7
0.0072 4.8–4.10
The first specimen presented is C8-00 (Fig 4.1). The first mechanical gage on this specimen
was incorrectly installed and therefore produced no data. Gage 2 showed much higher strains
than gages 3 and 4. This is most likely due to some amount of accidental eccentricity. Had
gage 1 produced data it likely would have been similar to that of gage 2 and thus the average
strains would have been higher.
Specimen C8-00 - Demec Data
0
500
1000
1500
2000
2500
3000
3500
0 100 200 300 400 500
Days after casting
Gage 1
Gage 2
Gage 3
Gage 4
Specimen C8-00 - Averaged Demec Data
0
500
1000
1500
2000
2500
3000
3500
0 100 200 300 400 500Days after casting
Micro-strain
Figure 4.1 Mechanical Strain Gage Data for Specimen C8-00
Specimen C8-36-1 (Fig. 4.2) also had Demec gage 1 fail to produce data due to improper
installation. The remaining gages produced data with little scatter. The Demec points for
gages 2 and 3 experienced large deflections, and thus, some data is missing as previously
explained. Specimen C8-36-2 (Fig. 4.3) had Demec gage 2 improperly installed and was
unreadable. Gages 1, 3, and 4 produced reasonable data with some scatter likely due to
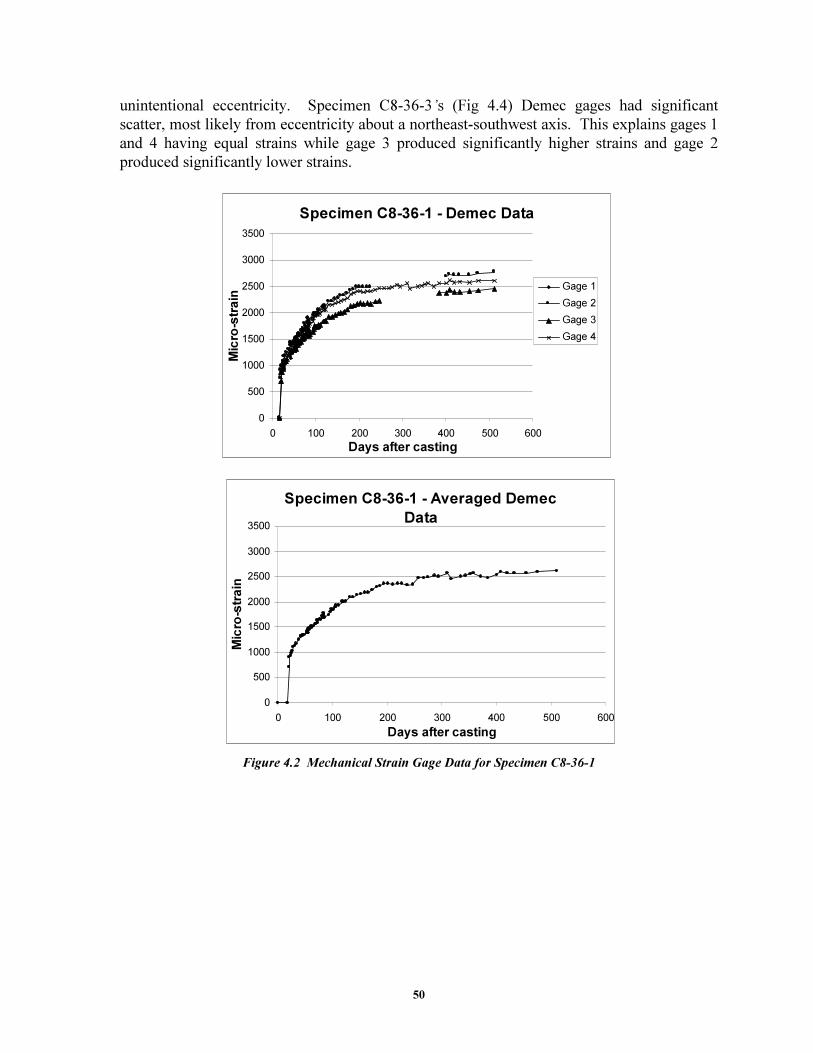
50
unintentional eccentricity. Specimen C8-36-3’s (Fig 4.4) Demec gages had significant
scatter, most likely from eccentricity about a northeast-southwest axis. This explains gages 1
and 4 having equal strains while gage 3 produced significantly higher strains and gage 2
produced significantly lower strains.
Specimen C8-36-1 - Demec Data
0
500
1000
1500
2000
2500
3000
3500
0 100 200 300 400 500 600
Days after casting
Micro-strain
Gage 1
Gage 2
Gage 3
Gage 4
Specimen C8-36-1 - Averaged Demec
Data
0
500
1000
1500
2000
2500
3000
3500
0 100 200 300 400 500 600
Days after casting
Micro-strain
Figure 4.2 Mechanical Strain Gage Data for Specimen C8-36-1
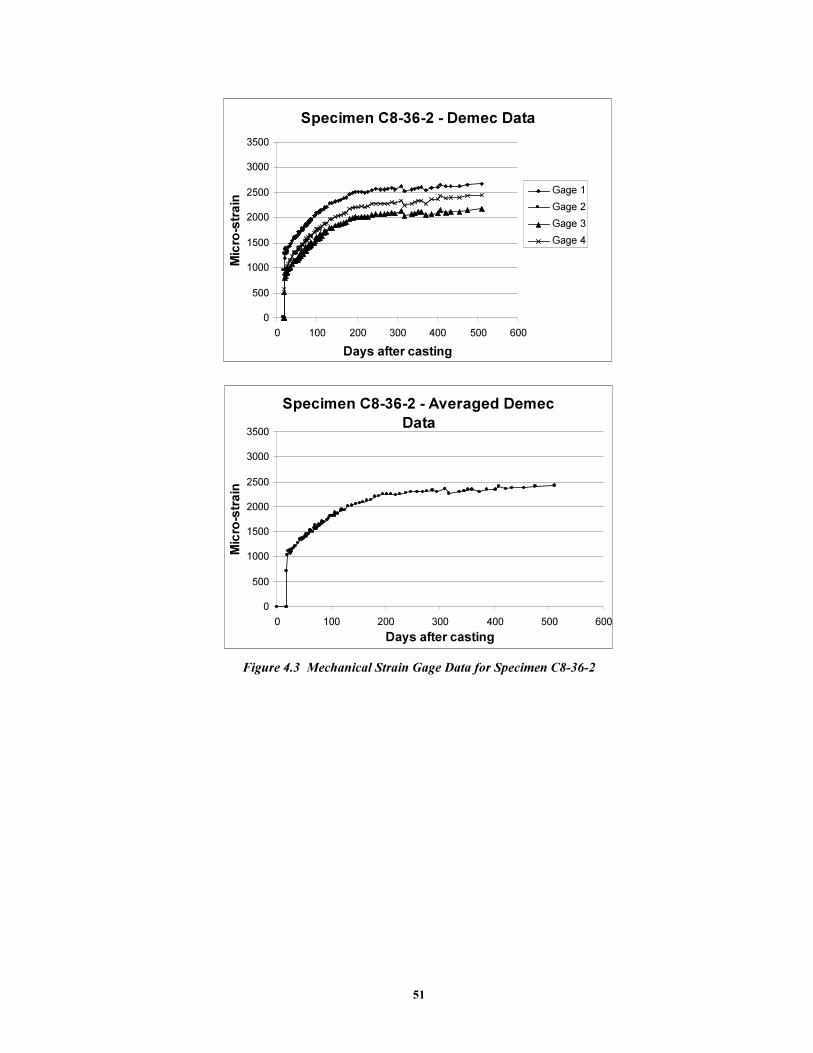
51
Specimen C8-36-2 - Demec Data
0
500
1000
1500
2000
2500
3000
3500
0 100 200 300 400 500 600
Days after casting
Micro-strain
Gage 1
Gage 2
Gage 3
Gage 4
Specimen C8-36-2 - Averaged Demec
Data
0
500
1000
1500
2000
2500
3000
3500
0 100 200 300 400 500 600
Days after casting
Micro-strain
Figure 4.3 Mechanical Strain Gage Data for Specimen C8-36-2
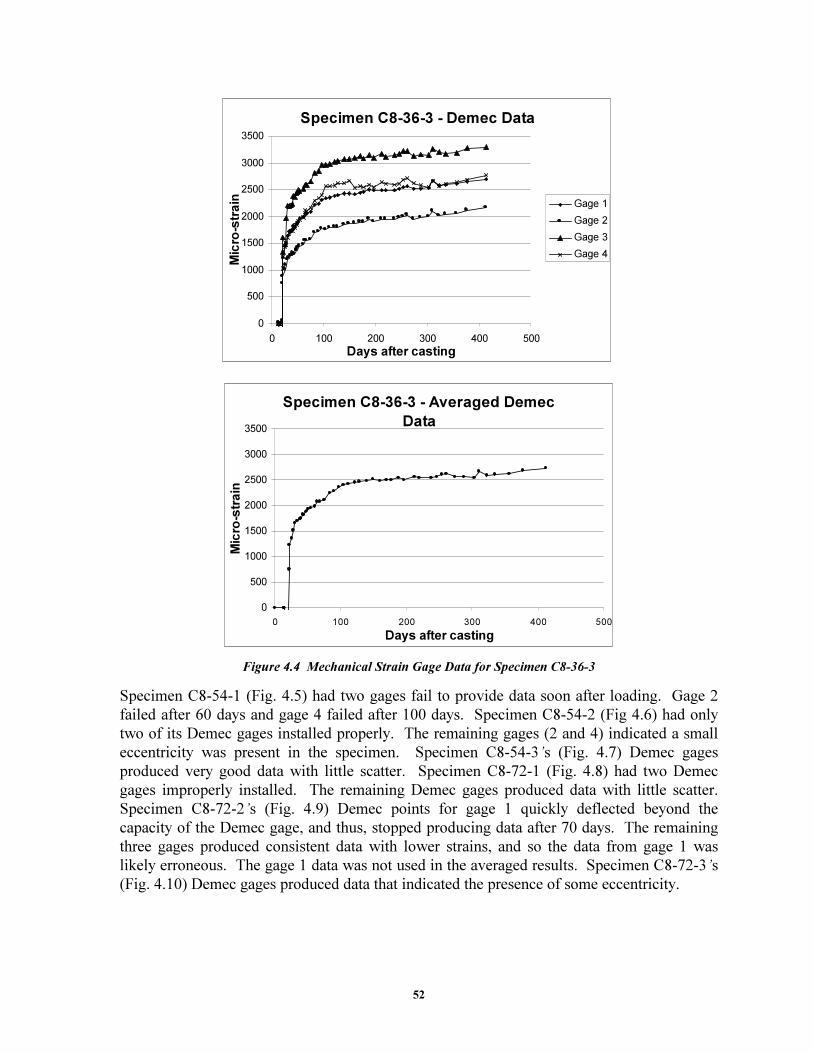
52
Specimen C8-36-3 - Demec Data
0
500
1000
1500
2000
2500
3000
3500
0 100 200 300 400 500
Days after casting
Micro-strain Gage 1
Gage 2
Gage 3
Gage 4
Specimen C8-36-3 - Averaged Demec
Data
0
500
1000
1500
2000
2500
3000
3500
0 100 200 300 400 500
Days after casting
Micro-strain
Figure 4.4 Mechanical Strain Gage Data for Specimen C8-36-3
Specimen C8-54-1 (Fig. 4.5) had two gages fail to provide data soon after loading. Gage 2
failed after 60 days and gage 4 failed after 100 days. Specimen C8-54-2 (Fig 4.6) had only
two of its Demec gages installed properly. The remaining gages (2 and 4) indicated a small
eccentricity was present in the specimen. Specimen C8-54-3’s (Fig. 4.7) Demec gages
produced very good data with little scatter. Specimen C8-72-1 (Fig. 4.8) had two Demec
gages improperly installed. The remaining Demec gages produced data with little scatter.
Specimen C8-72-2’s (Fig. 4.9) Demec points for gage 1 quickly deflected beyond the
capacity of the Demec gage, and thus, stopped producing data after 70 days. The remaining
three gages produced consistent data with lower strains, and so the data from gage 1 was
likely erroneous. The gage 1 data was not used in the averaged results. Specimen C8-72-3’s
(Fig. 4.10) Demec gages produced data that indicated the presence of some eccentricity.
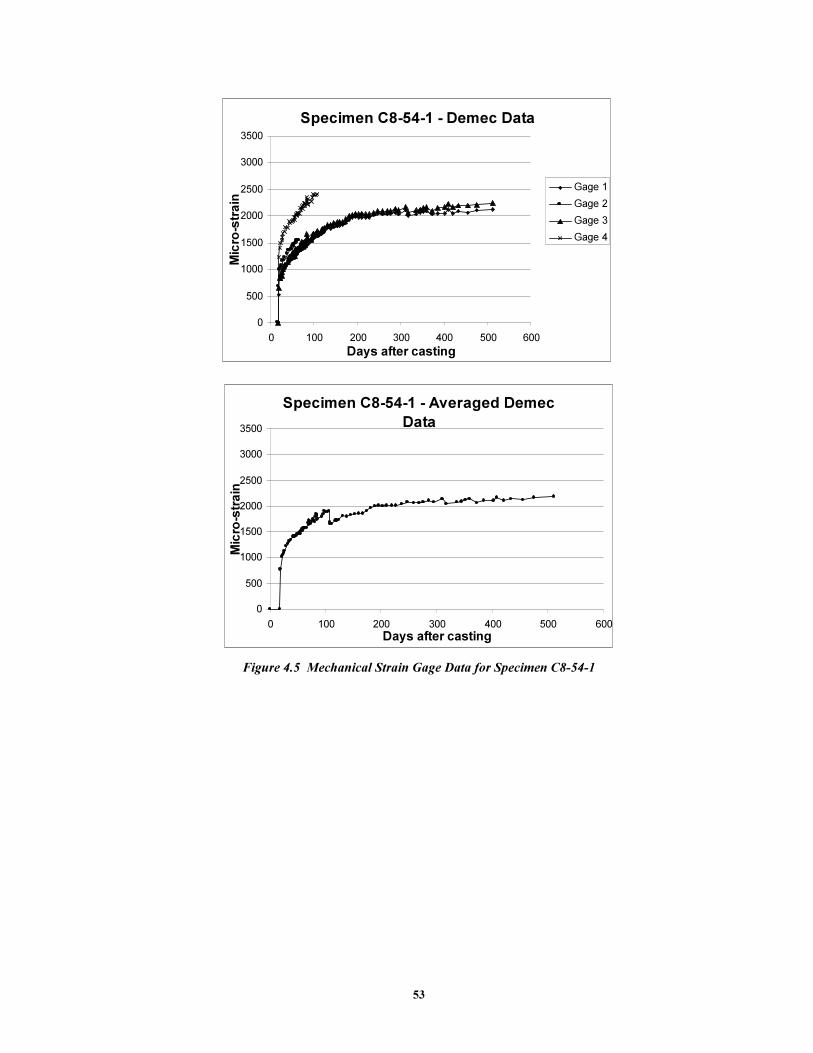
53
Specimen C8-54-1 - Demec Data
0
500
1000
1500
2000
2500
3000
3500
0 100 200 300 400 500 600
Days after casting
Micro-strain
Gage 1
Gage 2
Gage 3
Gage 4
Specimen C8-54-1 - Averaged Demec
Data
0
500
1000
1500
2000
2500
3000
3500
0 100 200 300 400 500 600
Days after casting
Micro-strain
Figure 4.5 Mechanical Strain Gage Data for Specimen C8-54-1
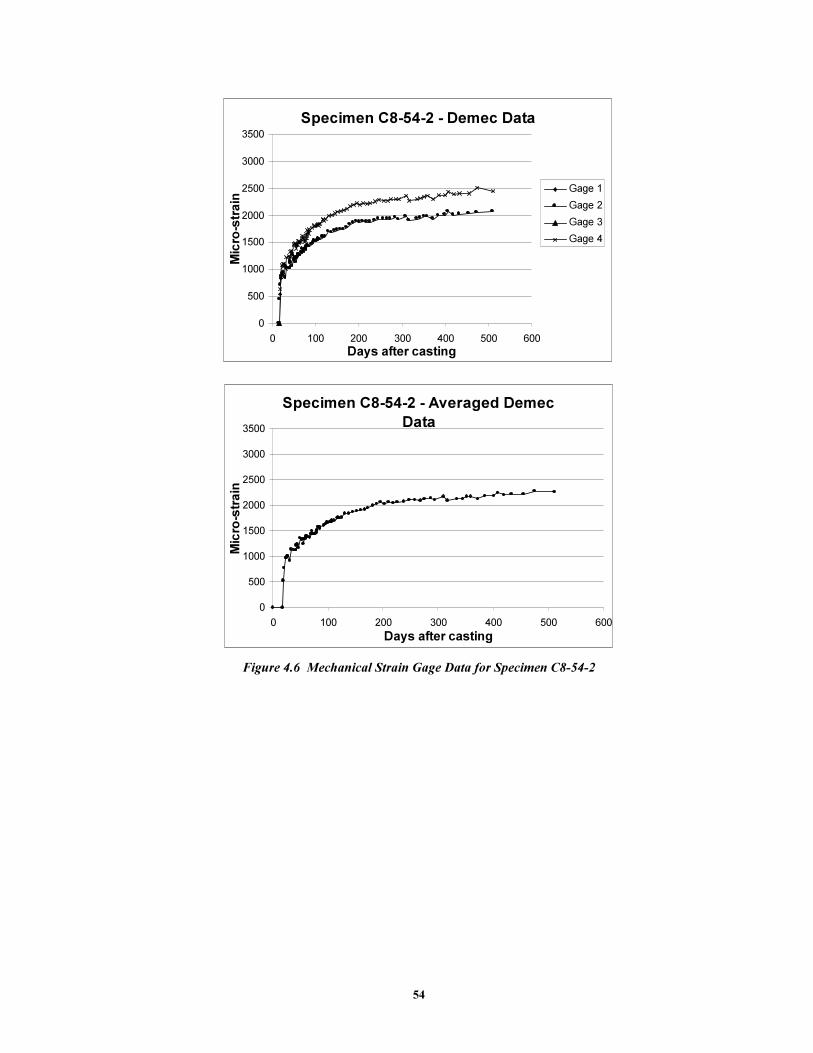
54
Specimen C8-54-2 - Demec Data
0
500
1000
1500
2000
2500
3000
3500
0 100 200 300 400 500 600
Days after casting
Micro-strain
Gage 1
Gage 2
Gage 3
Gage 4
Specimen C8-54-2 - Averaged Demec
Data
0
500
1000
1500
2000
2500
3000
3500
0 100 200 300 400 500 600
Days after casting
Micro-strain
Figure 4.6 Mechanical Strain Gage Data for Specimen C8-54-2
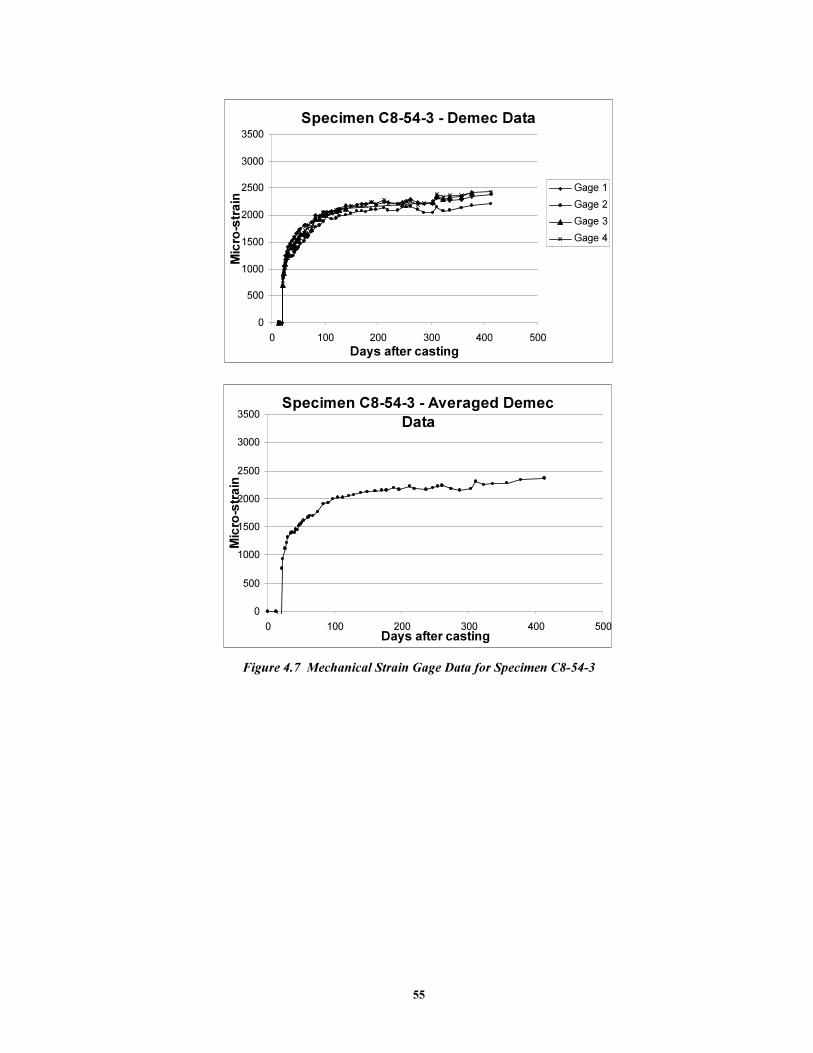
55
Specimen C8-54-3 - Demec Data
0
500
1000
1500
2000
2500
3000
3500
0 100 200 300 400 500
Days after casting
Micro-strain
Gage 1
Gage 2
Gage 3
Gage 4
Specimen C8-54-3 - Averaged Demec
Data
0
500
1000
1500
2000
2500
3000
3500
0 100 200 300 400 500Days after casting
Micro-strain
Figure 4.7 Mechanical Strain Gage Data for Specimen C8-54-3
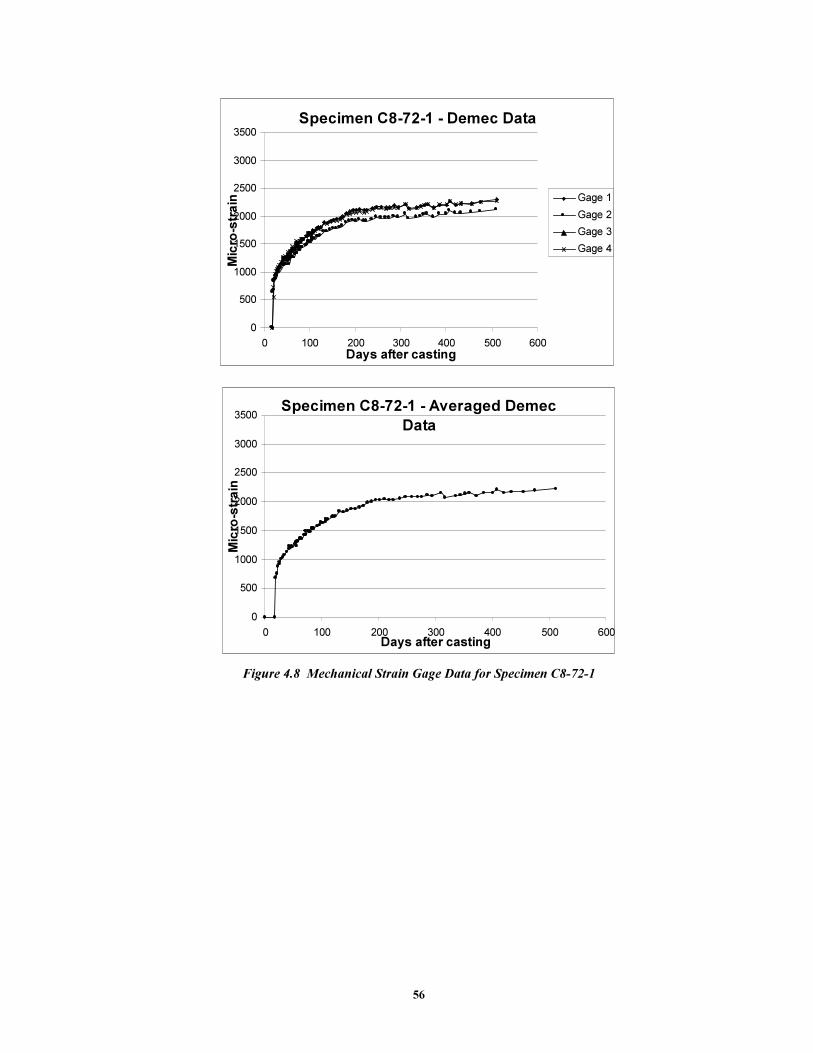
56
Specimen C8-72-1 - Demec Data
0
500
1000
1500
2000
2500
3000
3500
0 100 200 300 400 500 600Days after casting
Micro-strain Gage 1
Gage 2
Gage 3
Gage 4
Specimen C8-72-1 - Averaged Demec
Data
0
500
1000
1500
2000
2500
3000
3500
0 100 200 300 400 500 600Days after casting
Micro-strain
Figure 4.8 Mechanical Strain Gage Data for Specimen C8-72-1
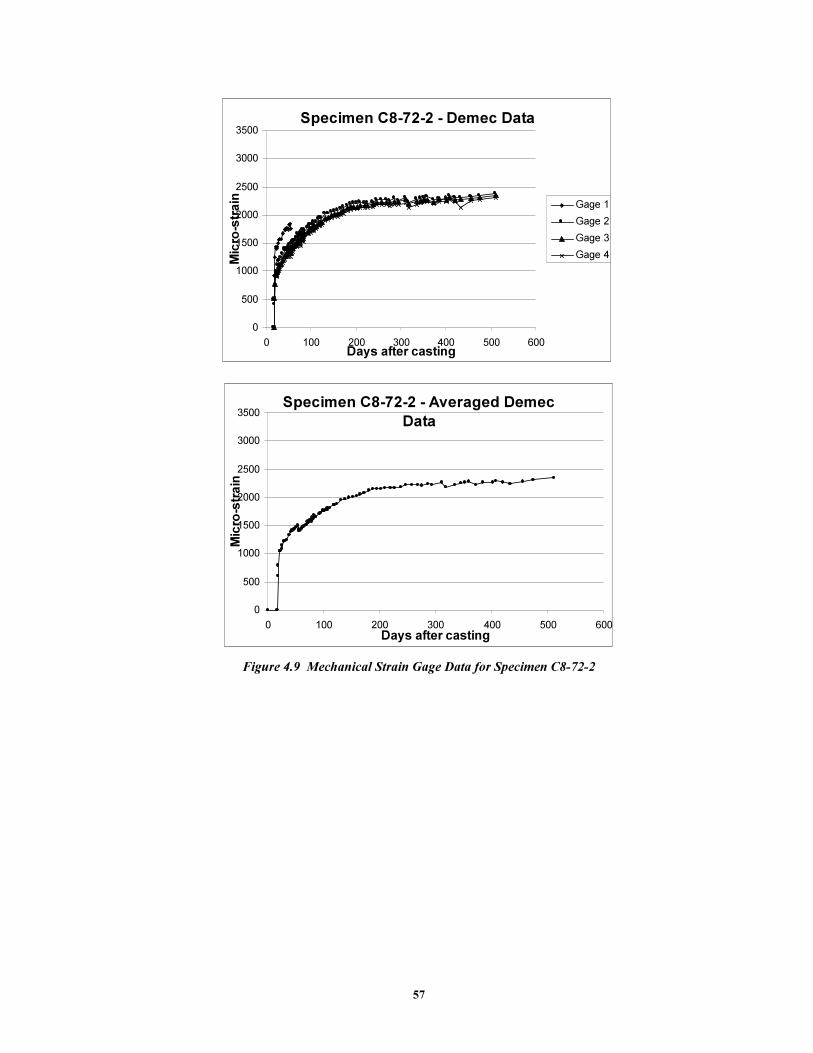
57
Specimen C8-72-2 - Demec Data
0
500
1000
1500
2000
2500
3000
3500
0 100 200 300 400 500 600Days after casting
Micro-strain Gage 1
Gage 2
Gage 3
Gage 4
Specimen C8-72-2 - Averaged Demec
Data
0
500
1000
1500
2000
2500
3000
3500
0 100 200 300 400 500 600Days after casting
Micro-strain
Figure 4.9 Mechanical Strain Gage Data for Specimen C8-72-2
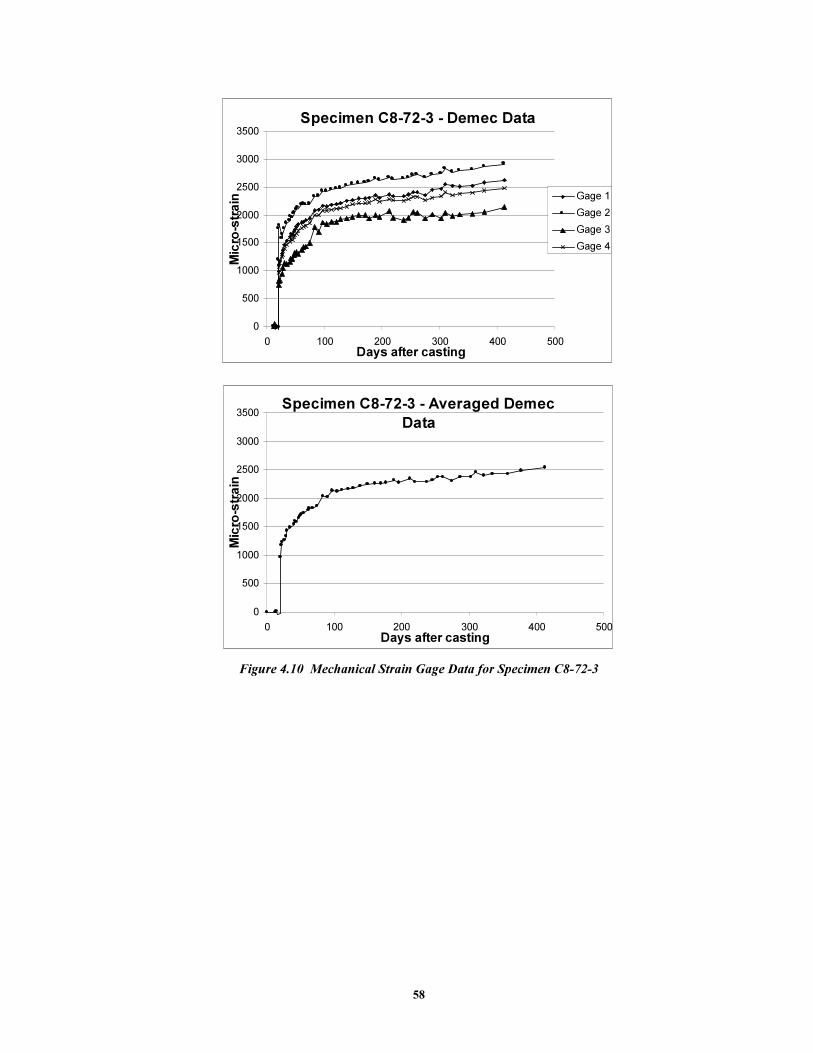
58
Specimen C8-72-3 - Demec Data
0
500
1000
1500
2000
2500
3000
3500
0 100 200 300 400 500Days after casting
Micro-strain
Gage 1
Gage 2
Gage 3
Gage 4
Specimen C8-72-3 - Averaged Demec
Data
0
500
1000
1500
2000
2500
3000
3500
0 100 200 300 400 500Days after casting
Micro-strain
Figure 4.10 Mechanical Strain Gage Data for Specimen C8-72-3
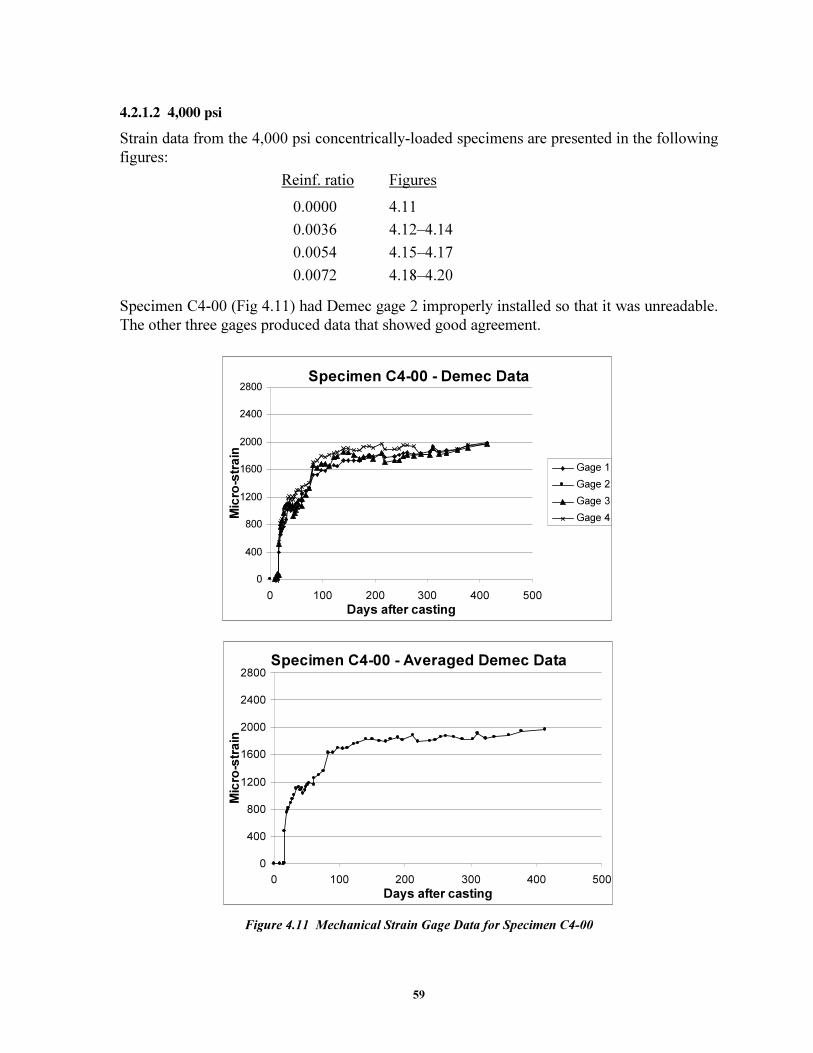
59
�����������������
Strain data from the 4,000 psi concentrically-loaded specimens are presented in the following
figures:
Reinf. ratio Figures
0.0000 4.11
0.0036 4.12–4.14
0.0054 4.15–4.17
0.0072 4.18–4.20
Specimen C4-00 (Fig 4.11) had Demec gage 2 improperly installed so that it was unreadable.
The other three gages produced data that showed good agreement.
Specimen C4-00 - Demec Data
0
400
800
1200
1600
2000
2400
2800
0 100 200 300 400 500
Days after casting
Micro-strain
Gage 1
Gage 2
Gage 3
Gage 4
Specimen C4-00 - Averaged Demec Data
0
400
800
1200
1600
2000
2400
2800
0 100 200 300 400 500
Days after casting
Micro-strain
Figure 4.11 Mechanical Strain Gage Data for Specimen C4-00
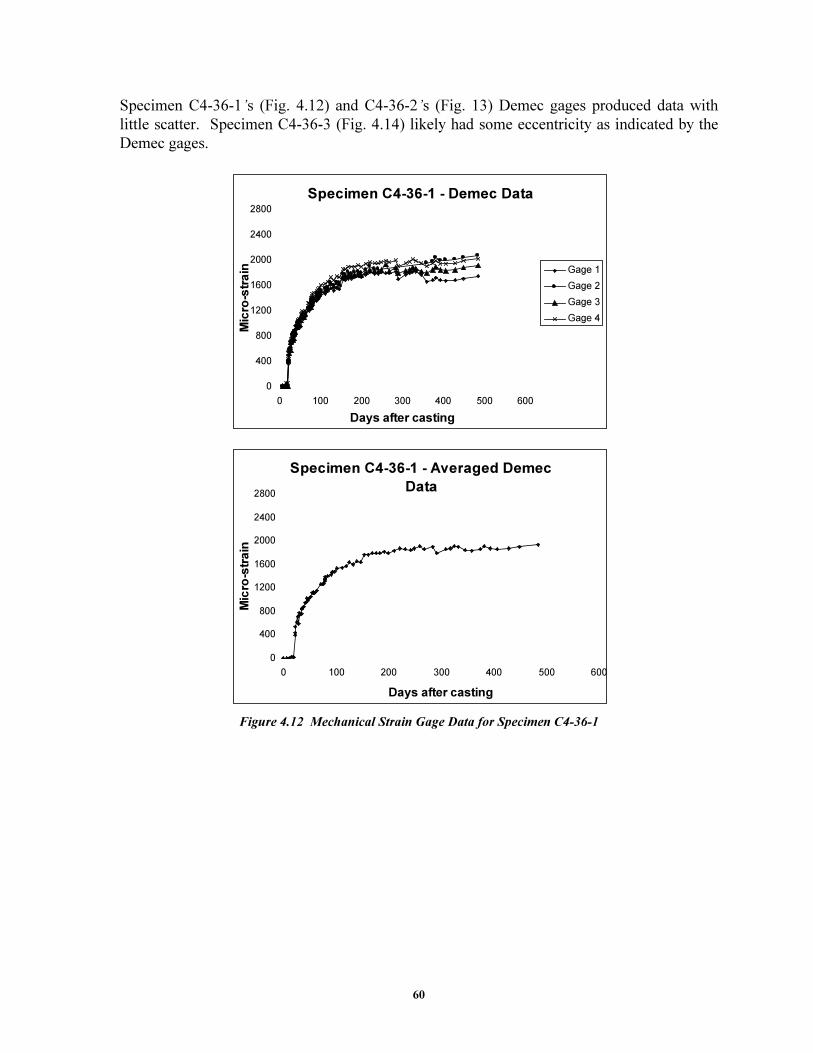
60
Specimen C4-36-1’s (Fig. 4.12) and C4-36-2’s (Fig. 13) Demec gages produced data with
little scatter. Specimen C4-36-3 (Fig. 4.14) likely had some eccentricity as indicated by the
Demec gages.
Specimen C4-36-1 - Demec Data
0
400
800
1200
1600
2000
2400
2800
0 100 200 300 400 500 600
Days after casting
Micro-strain Gage 1
Gage 2
Gage 3
Gage 4
Specimen C4-36-1 - Averaged Demec
Data
0
400
800
1200
1600
2000
2400
2800
0 100 200 300 400 500 600
Days after casting
Micro-strain
Figure 4.12 Mechanical Strain Gage Data for Specimen C4-36-1

61
Specimen C4-36-2 - Demec Data
0
400
800
1200
1600
2000
2400
2800
0 100 200 300 400 500 600
Days after casting
Micro-strain Gage 1
Gage 2
Gage 3
Gage 4
Specimen C4-36-2 - Averaged Demec
Data
0
400
800
1200
1600
2000
2400
2800
0 100 200 300 400 500 600
Days after casting
Micro-strain
Figure 4.13 Mechanical Strain Gage Data for Specimen C4-36-2
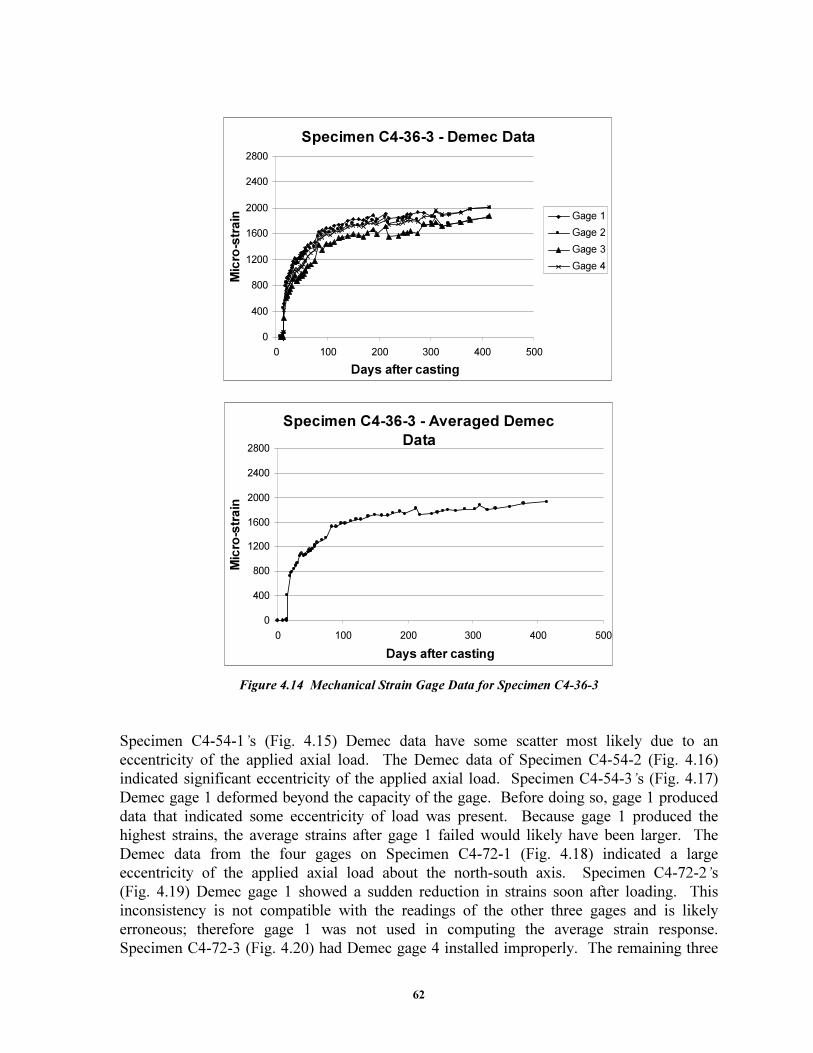
62
Specimen C4-36-3 - Demec Data
0
400
800
1200
1600
2000
2400
2800
0 100 200 300 400 500
Days after casting
Micro-strain Gage 1
Gage 2
Gage 3
Gage 4
Specimen C4-36-3 - Averaged Demec
Data
0
400
800
1200
1600
2000
2400
2800
0 100 200 300 400 500
Days after casting
Micro-strain
Figure 4.14 Mechanical Strain Gage Data for Specimen C4-36-3
Specimen C4-54-1’s (Fig. 4.15) Demec data have some scatter most likely due to an
eccentricity of the applied axial load. The Demec data of Specimen C4-54-2 (Fig. 4.16)
indicated significant eccentricity of the applied axial load. Specimen C4-54-3’s (Fig. 4.17)
Demec gage 1 deformed beyond the capacity of the gage. Before doing so, gage 1 produced
data that indicated some eccentricity of load was present. Because gage 1 produced the
highest strains, the average strains after gage 1 failed would likely have been larger. The
Demec data from the four gages on Specimen C4-72-1 (Fig. 4.18) indicated a large
eccentricity of the applied axial load about the north-south axis. Specimen C4-72-2’s
(Fig. 4.19) Demec gage 1 showed a sudden reduction in strains soon after loading. This
inconsistency is not compatible with the readings of the other three gages and is likely
erroneous; therefore gage 1 was not used in computing the average strain response.
Specimen C4-72-3 (Fig. 4.20) had Demec gage 4 installed improperly. The remaining three
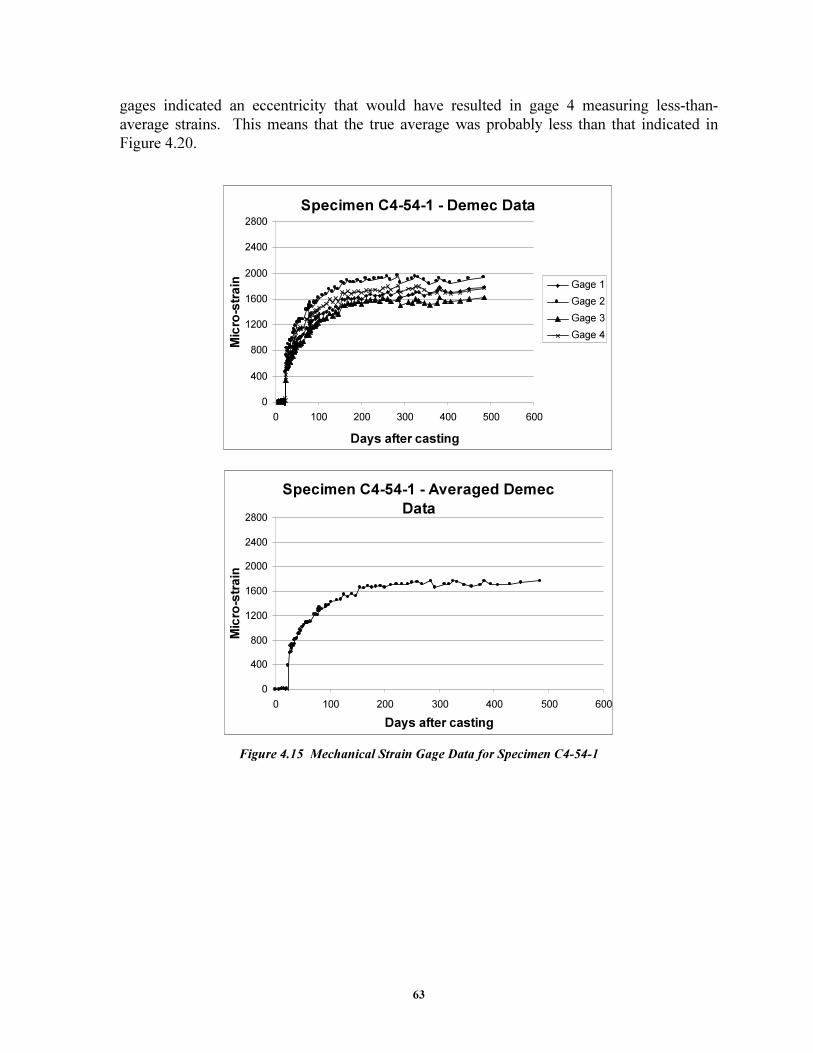
63
gages indicated an eccentricity that would have resulted in gage 4 measuring less-than-
average strains. This means that the true average was probably less than that indicated in
Figure 4.20.
Specimen C4-54-1 - Averaged Demec
Data
0
400
800
1200
1600
2000
2400
2800
0 100 200 300 400 500 600
Days after casting
Micro-strain
Specimen C4-54-1 - Demec Data
0
400
800
1200
1600
2000
2400
2800
0 100 200 300 400 500 600
Days after casting
Micro-strain Gage 1
Gage 2
Gage 3
Gage 4
Figure 4.15 Mechanical Strain Gage Data for Specimen C4-54-1
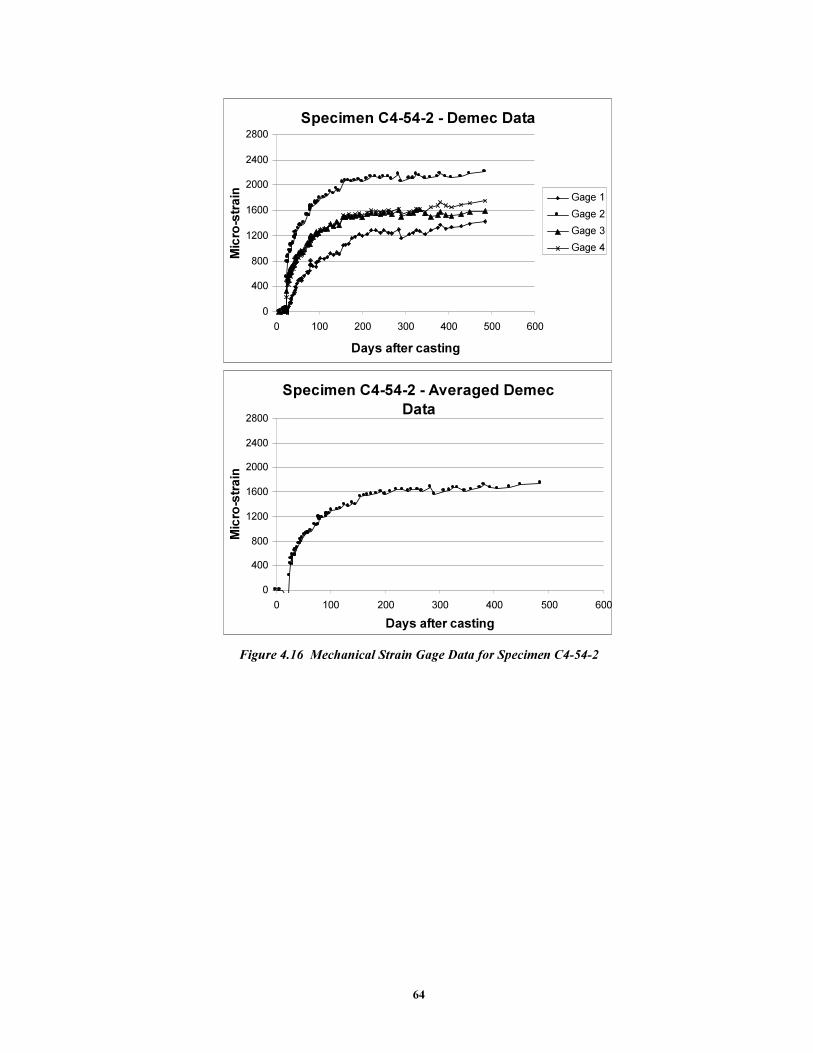
64
Specimen C4-54-2 - Demec Data
0
400
800
1200
1600
2000
2400
2800
0 100 200 300 400 500 600
Days after casting
Micro-strain Gage 1
Gage 2
Gage 3
Gage 4
Specimen C4-54-2 - Averaged Demec
Data
0
400
800
1200
1600
2000
2400
2800
0 100 200 300 400 500 600
Days after casting
Micro-strain
Figure 4.16 Mechanical Strain Gage Data for Specimen C4-54-2
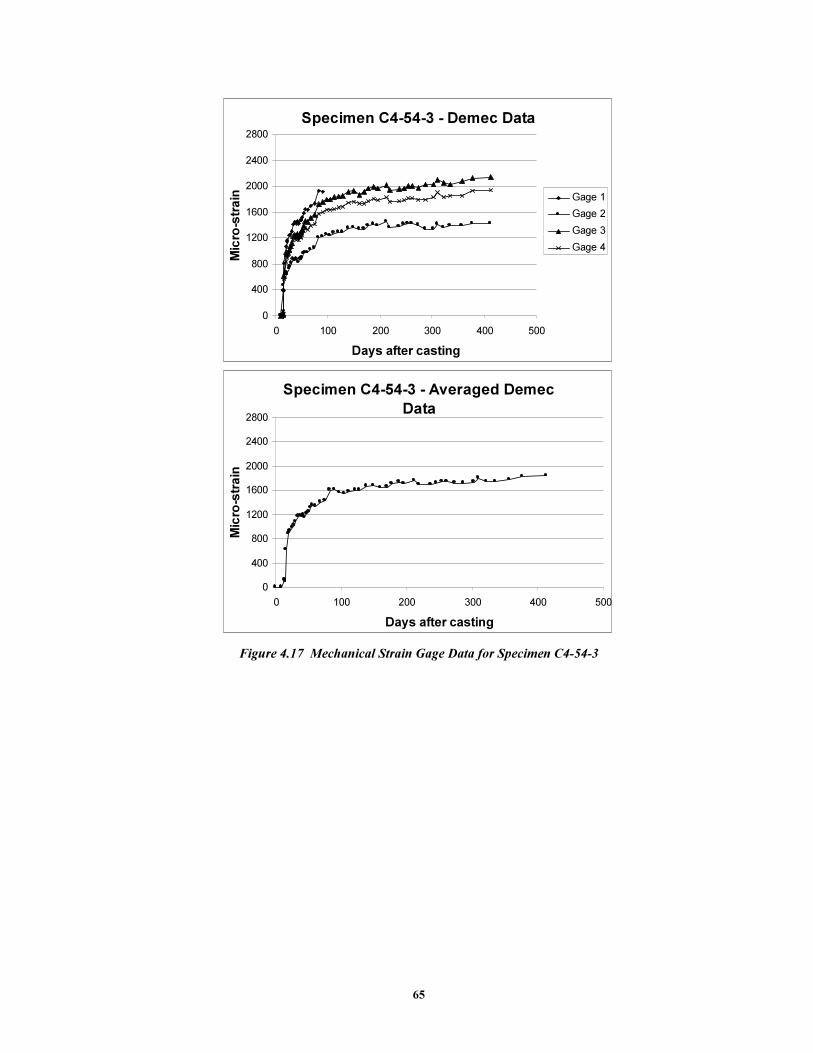
65
Specimen C4-54-3 - Demec Data
0
400
800
1200
1600
2000
2400
2800
0 100 200 300 400 500
Days after casting
Micro-strain Gage 1
Gage 2
Gage 3
Gage 4
Specimen C4-54-3 - Averaged Demec
Data
0
400
800
1200
1600
2000
2400
2800
0 100 200 300 400 500
Days after casting
Micro-strain
Figure 4.17 Mechanical Strain Gage Data for Specimen C4-54-3
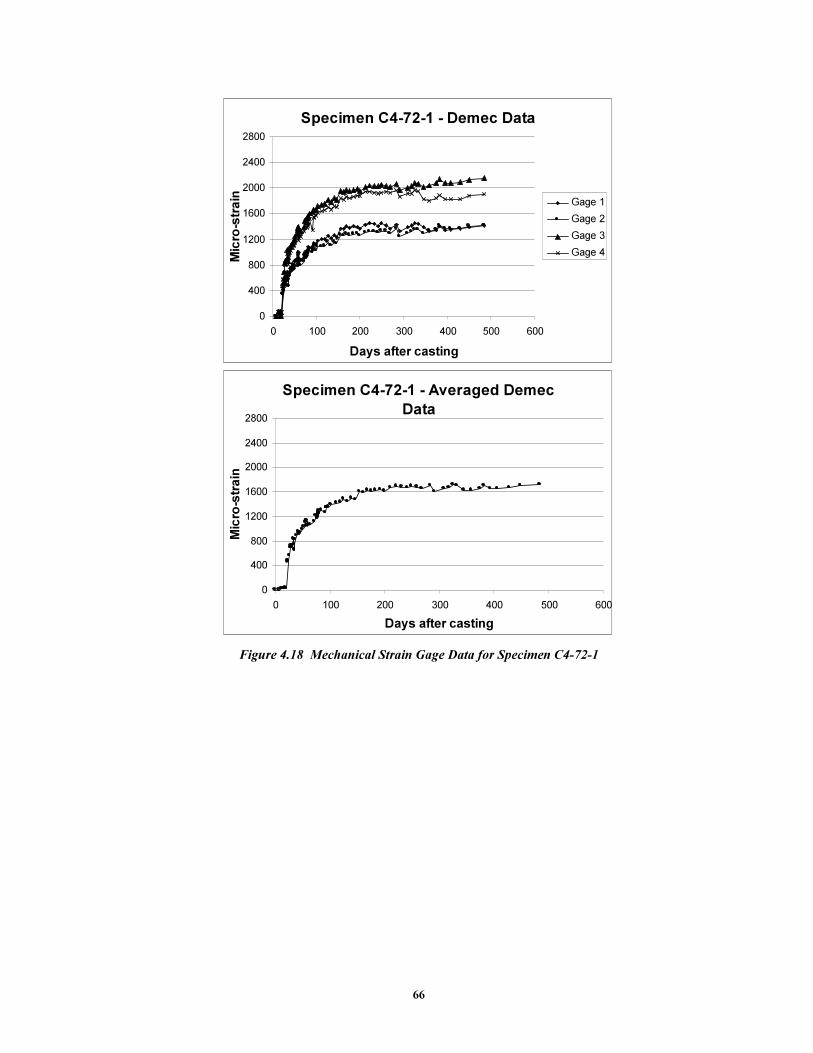
66
Specimen C4-72-1 - Demec Data
0
400
800
1200
1600
2000
2400
2800
0 100 200 300 400 500 600
Days after casting
Micro-strain Gage 1
Gage 2
Gage 3
Gage 4
Specimen C4-72-1 - Averaged Demec
Data
0
400
800
1200
1600
2000
2400
2800
0 100 200 300 400 500 600
Days after casting
Micro-strain
Figure 4.18 Mechanical Strain Gage Data for Specimen C4-72-1
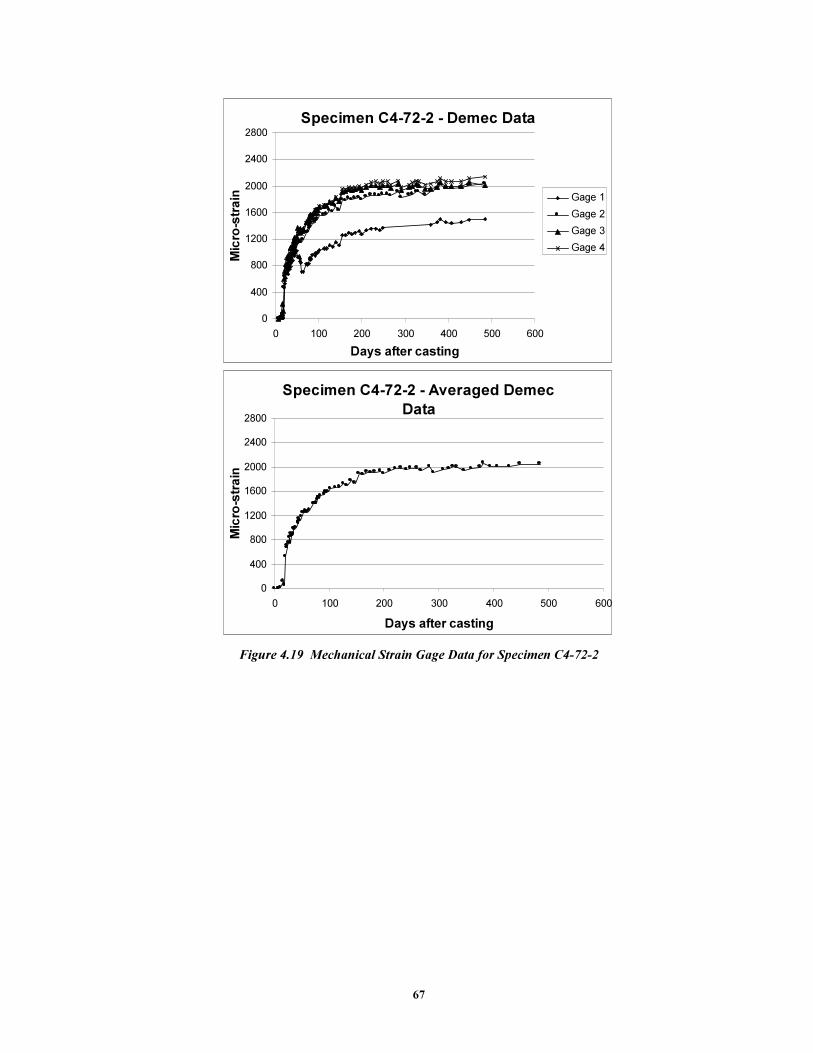
67
Specimen C4-72-2 - Demec Data
0
400
800
1200
1600
2000
2400
2800
0 100 200 300 400 500 600
Days after casting
Micro-strain Gage 1
Gage 2
Gage 3
Gage 4
Specimen C4-72-2 - Averaged Demec
Data
0
400
800
1200
1600
2000
2400
2800
0 100 200 300 400 500 600
Days after casting
Micro-strain
Figure 4.19 Mechanical Strain Gage Data for Specimen C4-72-2
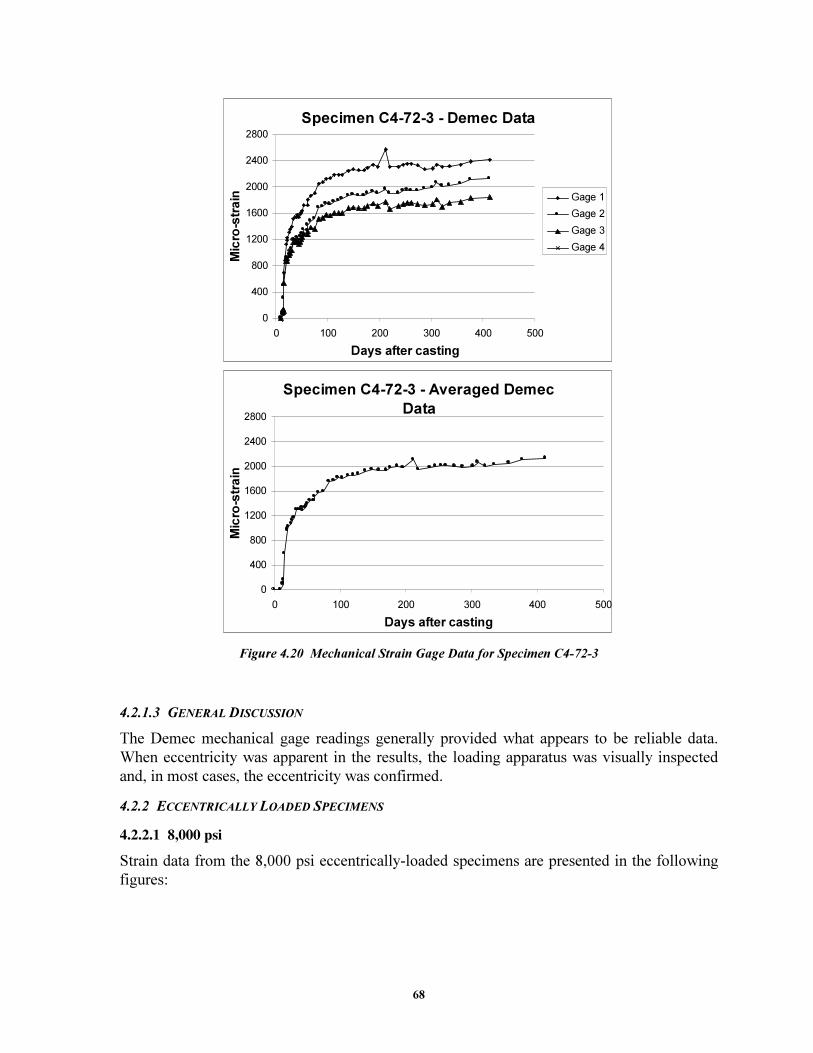
68
Specimen C4-72-3 - Demec Data
0
400
800
1200
1600
2000
2400
2800
0 100 200 300 400 500
Days after casting
Micro-strain Gage 1
Gage 2
Gage 3
Gage 4
Specimen C4-72-3 - Averaged Demec
Data
0
400
800
1200
1600
2000
2400
2800
0 100 200 300 400 500
Days after casting
Micro-strain
Figure 4.20 Mechanical Strain Gage Data for Specimen C4-72-3
4.2.1.3 GENERAL DISCUSSION
The Demec mechanical gage readings generally provided what appears to be reliable data.
When eccentricity was apparent in the results, the loading apparatus was visually inspected
and, in most cases, the eccentricity was confirmed.
4.2.2 ECCENTRICALLY LOADED SPECIMENS
������������������
Strain data from the 8,000 psi eccentrically-loaded specimens are presented in the following
figures:
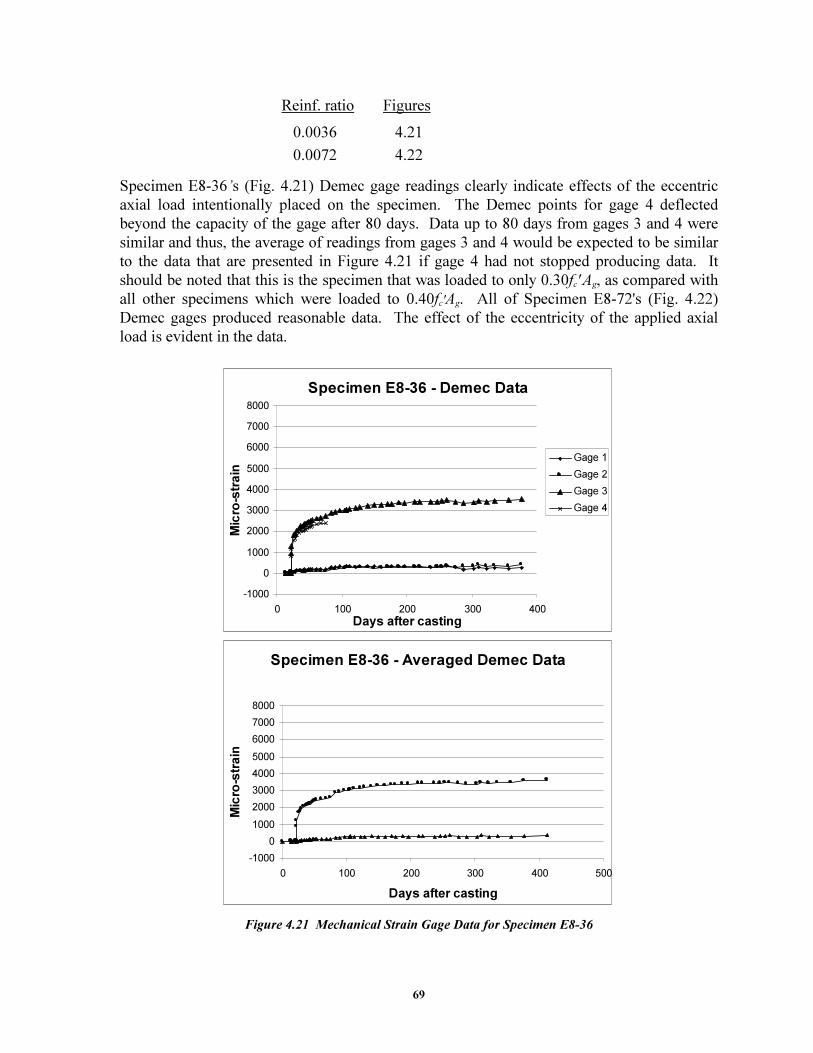
69
Reinf. ratio Figures
0.0036 4.21
0.0072 4.22
Specimen E8-36’s (Fig. 4.21) Demec gage readings clearly indicate effects of the eccentric
axial load intentionally placed on the specimen. The Demec points for gage 4 deflected
beyond the capacity of the gage after 80 days. Data up to 80 days from gages 3 and 4 were
similar and thus, the average of readings from gages 3 and 4 would be expected to be similar
to the data that are presented in Figure 4.21 if gage 4 had not stopped producing data. It
should be noted that this is the specimen that was loaded to only 0.30fc' Ag, as compared with
all other specimens which were loaded to 0.40fc'Ag. All of Specimen E8-72's (Fig. 4.22)
Demec gages produced reasonable data. The effect of the eccentricity of the applied axial
load is evident in the data.
Specimen E8-36 - Demec Data
-1000
0
1000
2000
3000
4000
5000
6000
7000
8000
0 100 200 300 400
Days after casting
Micro-strain
Gage 1
Gage 2
Gage 3
Gage 4
Specimen E8-36 - Averaged Demec Data
-1000
0
1000
2000
3000
4000
5000
6000
7000
8000
0 100 200 300 400 500
Days after casting
Micro-strain
Figure 4.21 Mechanical Strain Gage Data for Specimen E8-36
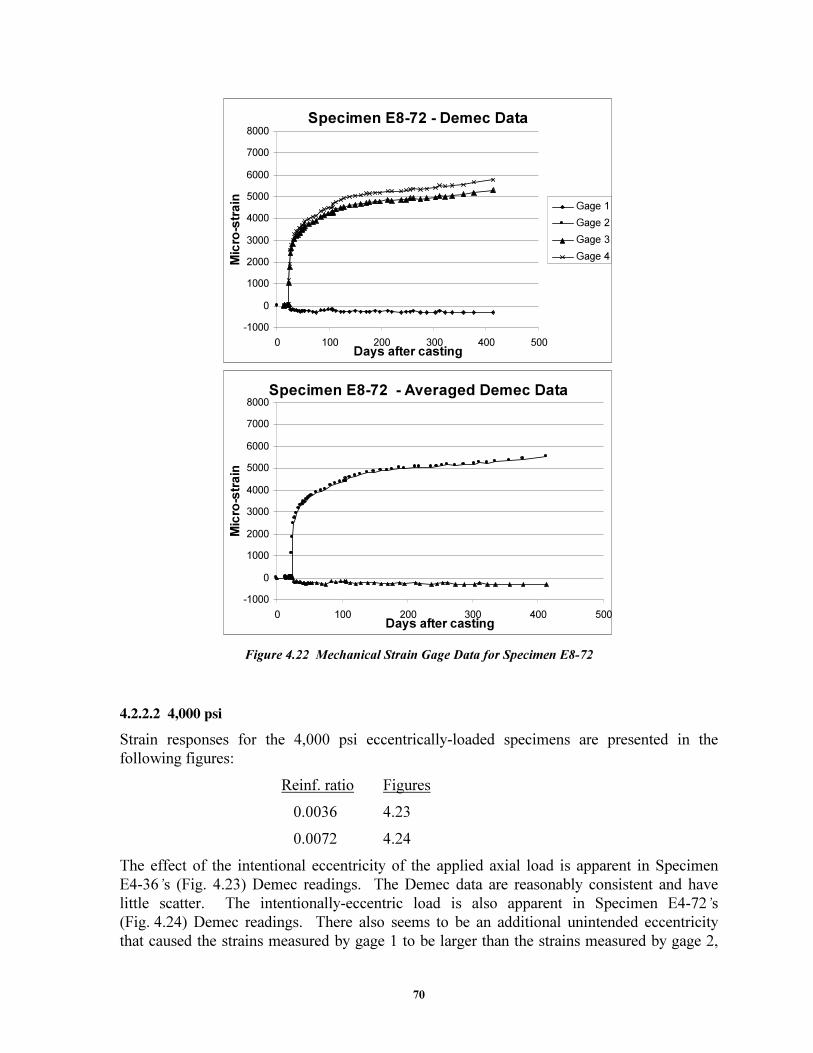
70
Specimen E8-72 - Demec Data
-1000
0
1000
2000
3000
4000
5000
6000
7000
8000
0 100 200 300 400 500Days after casting
Micro-strain Gage 1
Gage 2
Gage 3
Gage 4
Specimen E8-72 - Averaged Demec Data
-1000
0
1000
2000
3000
4000
5000
6000
7000
8000
0 100 200 300 400 500Days after casting
Micro-strain
Figure 4.22 Mechanical Strain Gage Data for Specimen E8-72
�����������������
Strain responses for the 4,000 psi eccentrically-loaded specimens are presented in the
following figures:
Reinf. ratio Figures
0.0036 4.23
0.0072 4.24
The effect of the intentional eccentricity of the applied axial load is apparent in Specimen
E4-36’s (Fig. 4.23) Demec readings. The Demec data are reasonably consistent and have
little scatter. The intentionally-eccentric load is also apparent in Specimen E4-72’s
(Fig. 4.24) Demec readings. There also seems to be an additional unintended eccentricity
that caused the strains measured by gage 1 to be larger than the strains measured by gage 2,
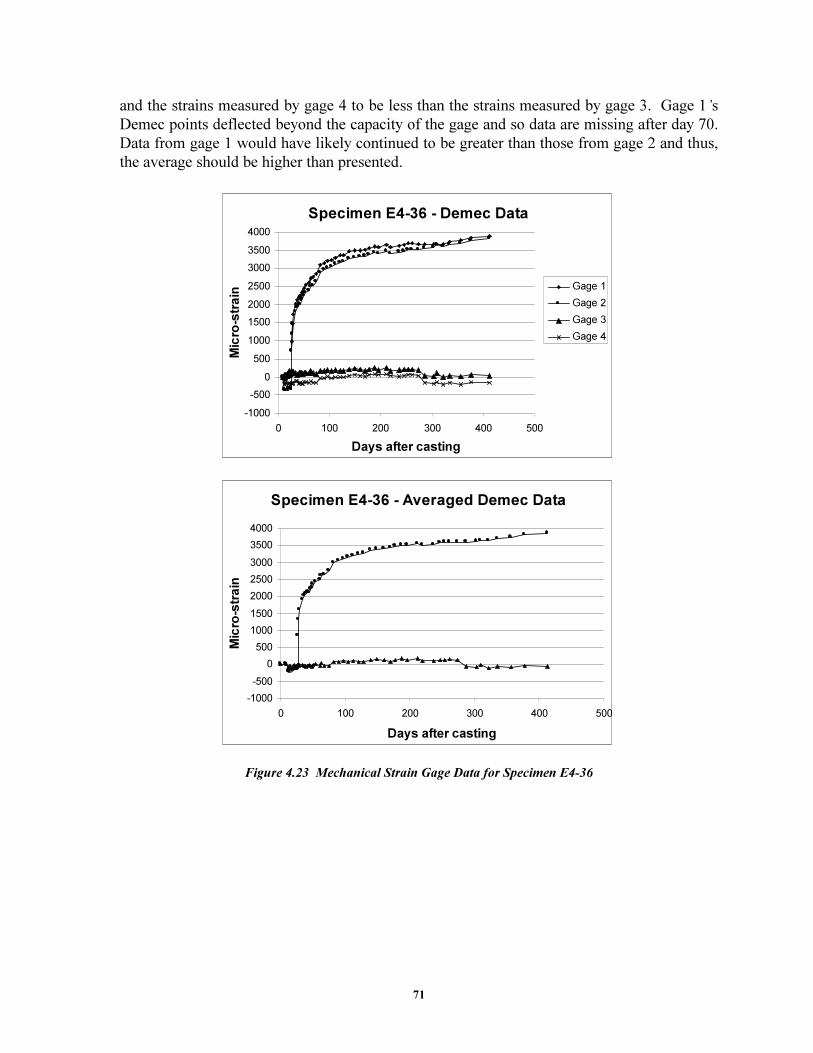
71
and the strains measured by gage 4 to be less than the strains measured by gage 3. Gage 1’s
Demec points deflected beyond the capacity of the gage and so data are missing after day 70.
Data from gage 1 would have likely continued to be greater than those from gage 2 and thus,
the average should be higher than presented.
Specimen E4-36 - Demec Data
-1000
-500
0
500
1000
1500
2000
2500
3000
3500
4000
0 100 200 300 400 500
Days after casting
Micro-strain
Gage 1
Gage 2
Gage 3
Gage 4
Specimen E4-36 - Averaged Demec Data
-1000
-500
0
500
1000
1500
2000
2500
3000
3500
4000
0 100 200 300 400 500
Days after casting
Micro-strain
Figure 4.23 Mechanical Strain Gage Data for Specimen E4-36
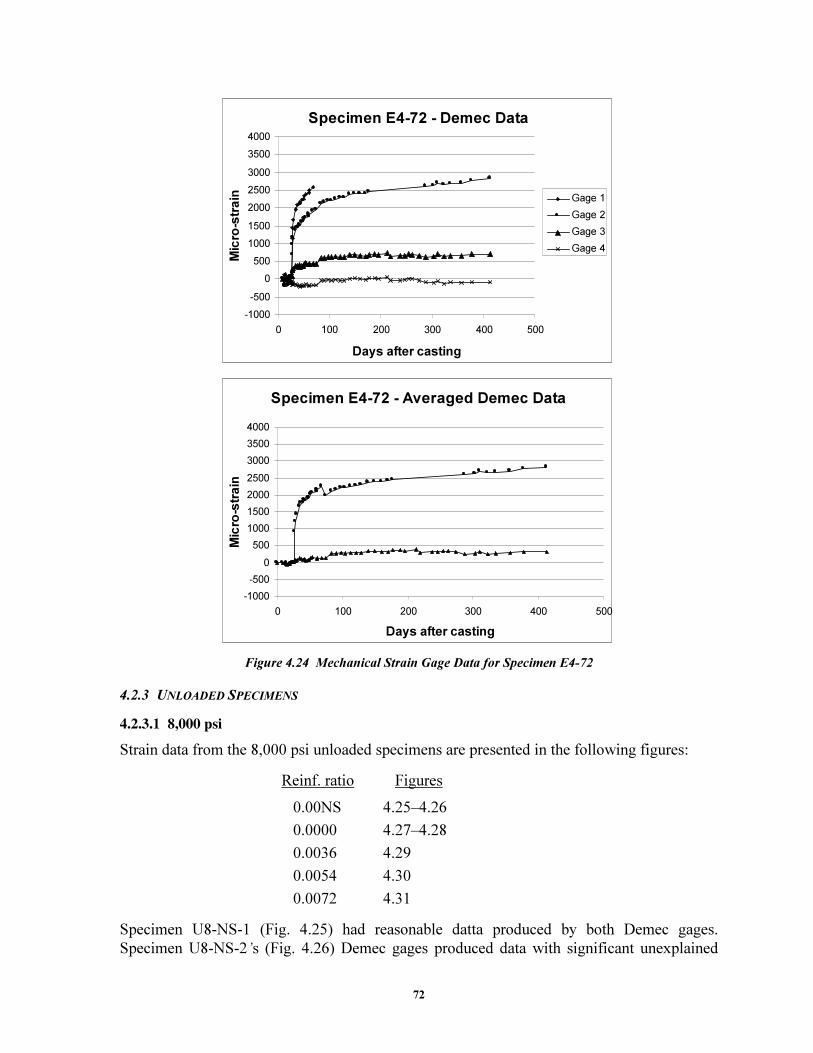
72
Specimen E4-72 - Demec Data
-1000
-500
0
500
1000
1500
2000
2500
3000
3500
4000
0 100 200 300 400 500
Days after casting
Micro-strain Gage 1
Gage 2
Gage 3
Gage 4
Specimen E4-72 - Averaged Demec Data
-1000
-500
0
500
1000
1500
2000
2500
3000
3500
4000
0 100 200 300 400 500
Days after casting
Micro-strain
Figure 4.24 Mechanical Strain Gage Data for Specimen E4-72
4.2.3 UNLOADED SPECIMENS
�����������������
Strain data from the 8,000 psi unloaded specimens are presented in the following figures:
Reinf. ratio Figures
0.00NS 4.25–4.26
0.0000 4.27–4.28
0.0036 4.29
0.0054 4.30
0.0072 4.31
Specimen U8-NS-1 (Fig. 4.25) had reasonable datta produced by both Demec gages.
Specimen U8-NS-2’s (Fig. 4.26) Demec gages produced data with significant unexplained
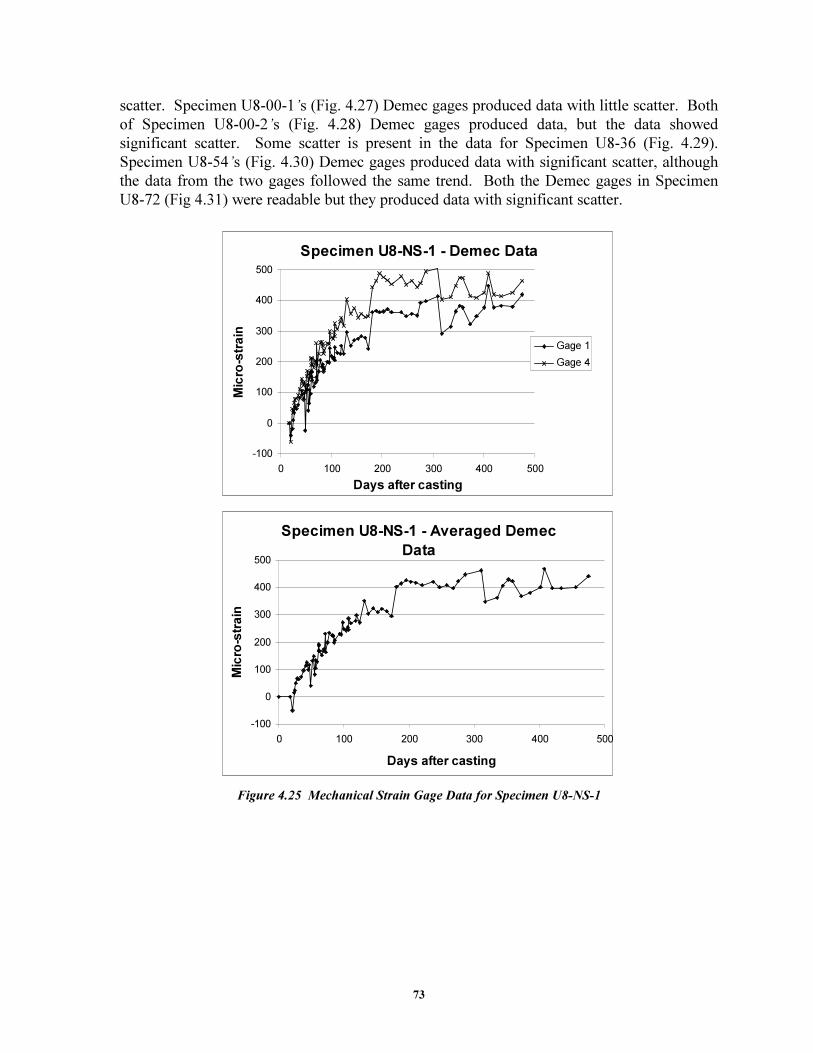
73
scatter. Specimen U8-00-1’s (Fig. 4.27) Demec gages produced data with little scatter. Both
of Specimen U8-00-2’s (Fig. 4.28) Demec gages produced data, but the data showed
significant scatter. Some scatter is present in the data for Specimen U8-36 (Fig. 4.29).
Specimen U8-54’s (Fig. 4.30) Demec gages produced data with significant scatter, although
the data from the two gages followed the same trend. Both the Demec gages in Specimen
U8-72 (Fig 4.31) were readable but they produced data with significant scatter.
Specimen U8-NS-1 - Demec Data
-100
0
100
200
300
400
500
0 100 200 300 400 500
Days after casting
Micro-strain
Gage 1
Gage 4
Specimen U8-NS-1 - Averaged Demec
Data
-100
0
100
200
300
400
500
0 100 200 300 400 500
Days after casting
Micro-strain
Figure 4.25 Mechanical Strain Gage Data for Specimen U8-NS-1
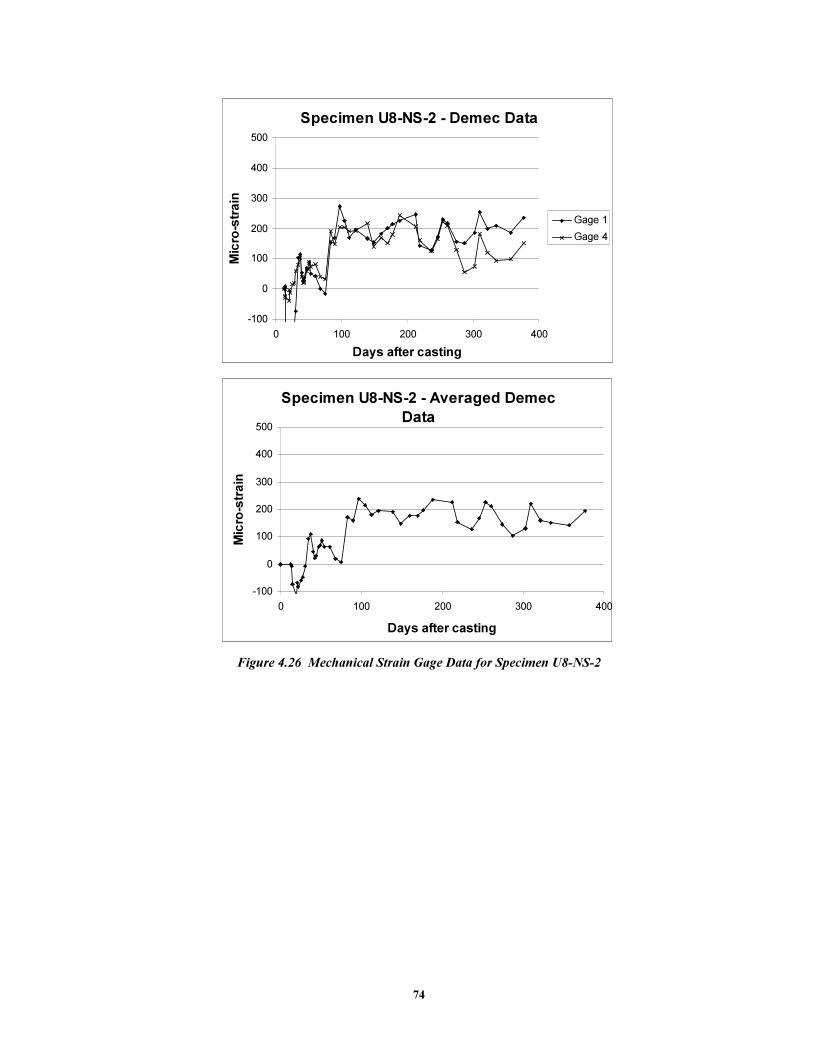
74
Specimen U8-NS-2 - Demec Data
-100
0
100
200
300
400
500
0 100 200 300 400
Days after casting
Micro-strain
Gage 1
Gage 4
Specimen U8-NS-2 - Averaged Demec
Data
-100
0
100
200
300
400
500
0 100 200 300 400
Days after casting
Micro-strain
Figure 4.26 Mechanical Strain Gage Data for Specimen U8-NS-2
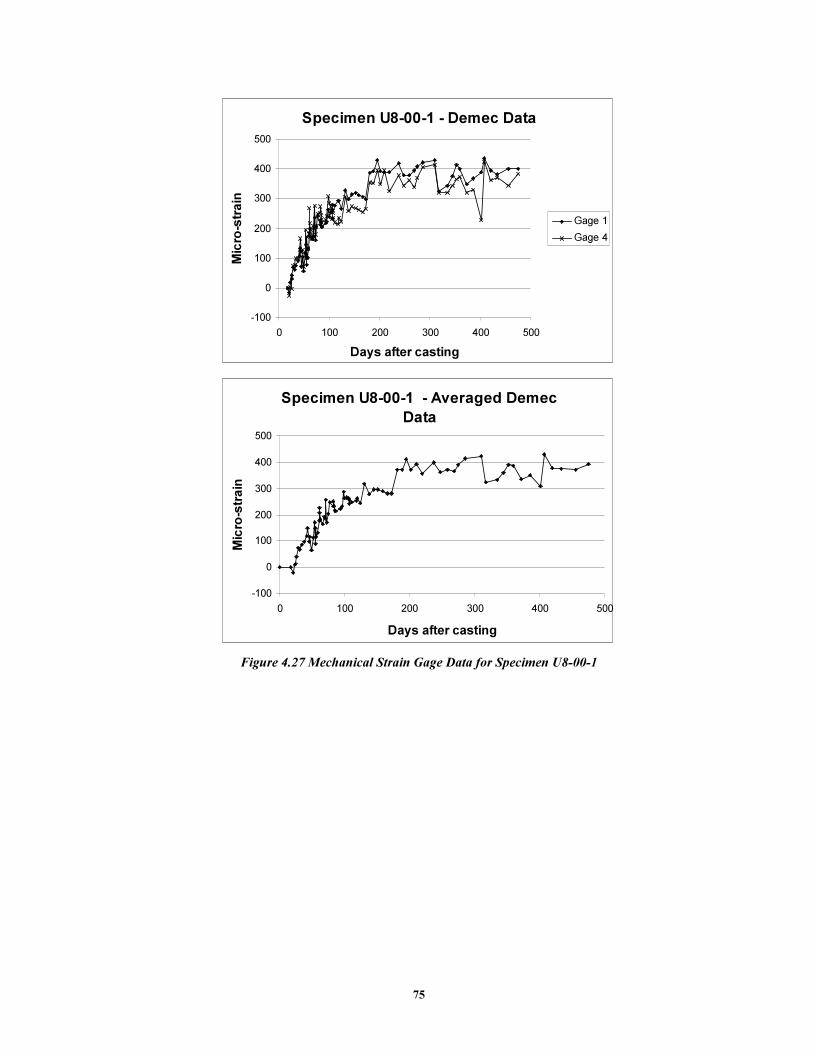
75
Specimen U8-00-1 - Demec Data
-100
0
100
200
300
400
500
0 100 200 300 400 500
Days after casting
Micro-strain
Gage 1
Gage 4
Specimen U8-00-1 - Averaged Demec
Data
-100
0
100
200
300
400
500
0 100 200 300 400 500
Days after casting
Micro-strain
Figure 4.27 Mechanical Strain Gage Data for Specimen U8-00-1
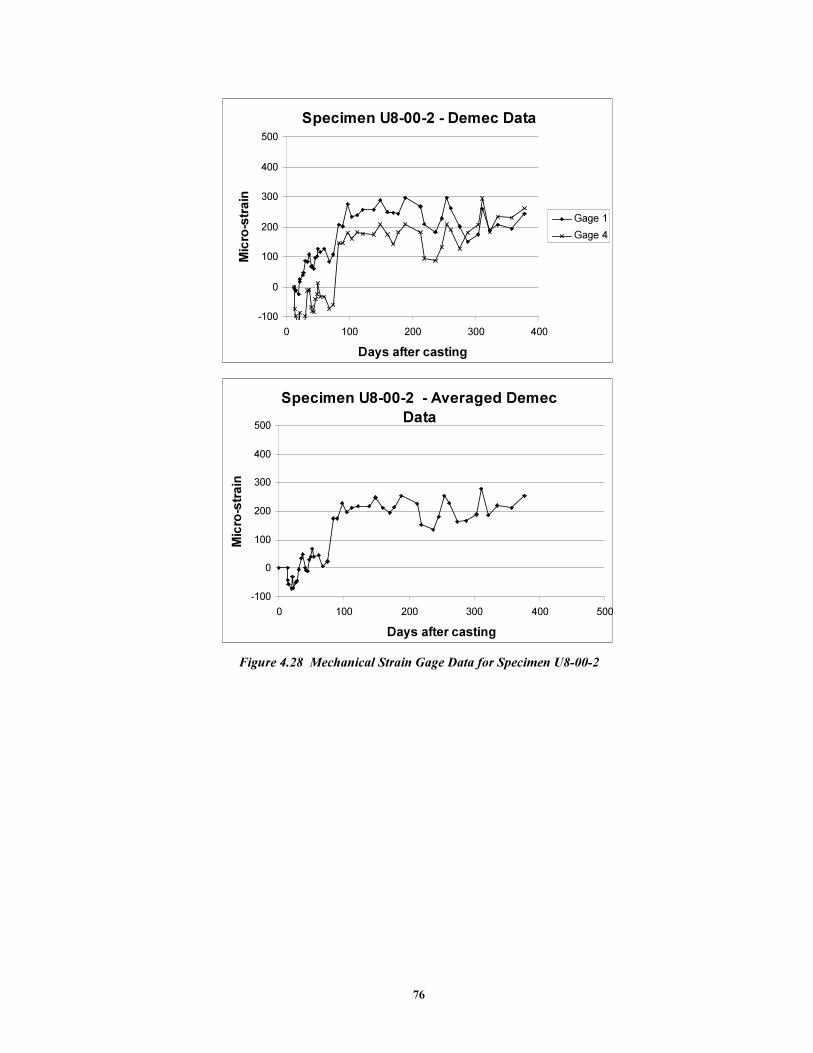
76
Specimen U8-00-2 - Demec Data
-100
0
100
200
300
400
500
0 100 200 300 400
Days after casting
Micro-strain
Gage 1
Gage 4
Specimen U8-00-2 - Averaged Demec
Data
-100
0
100
200
300
400
500
0 100 200 300 400 500
Days after casting
Micro-strain
Figure 4.28 Mechanical Strain Gage Data for Specimen U8-00-2
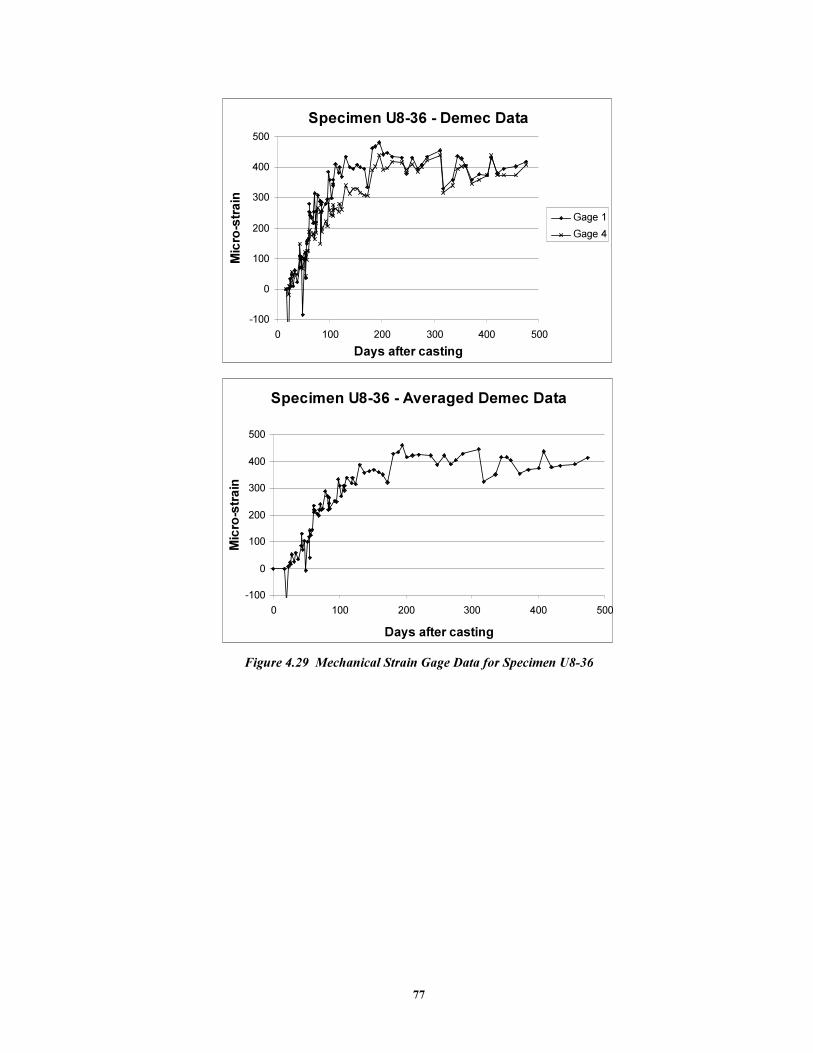
77
Specimen U8-36 - Demec Data
-100
0
100
200
300
400
500
0 100 200 300 400 500
Days after casting
Micro-strain
Gage 1
Gage 4
Specimen U8-36 - Averaged Demec Data
-100
0
100
200
300
400
500
0 100 200 300 400 500
Days after casting
Micro-strain
Figure 4.29 Mechanical Strain Gage Data for Specimen U8-36
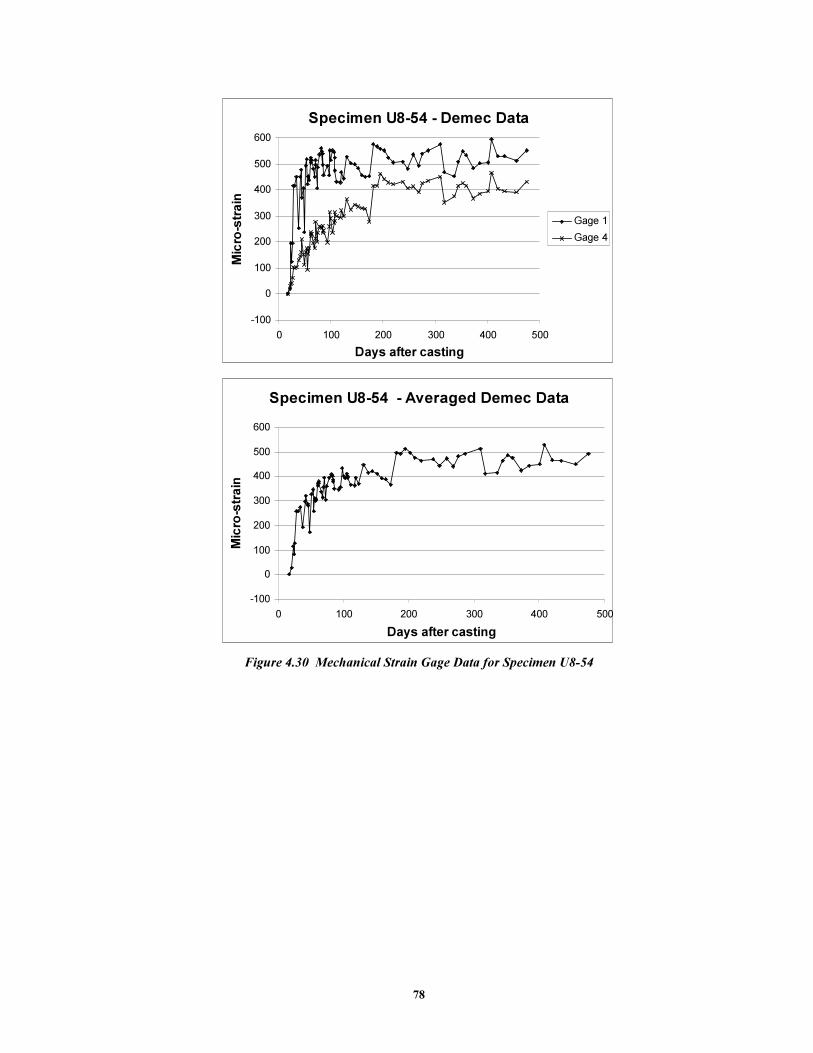
78
Specimen U8-54 - Demec Data
-100
0
100
200
300
400
500
600
0 100 200 300 400 500
Days after casting
Micro-strain
Gage 1
Gage 4
Specimen U8-54 - Averaged Demec Data
-100
0
100
200
300
400
500
600
0 100 200 300 400 500
Days after casting
Micro-strain
Figure 4.30 Mechanical Strain Gage Data for Specimen U8-54
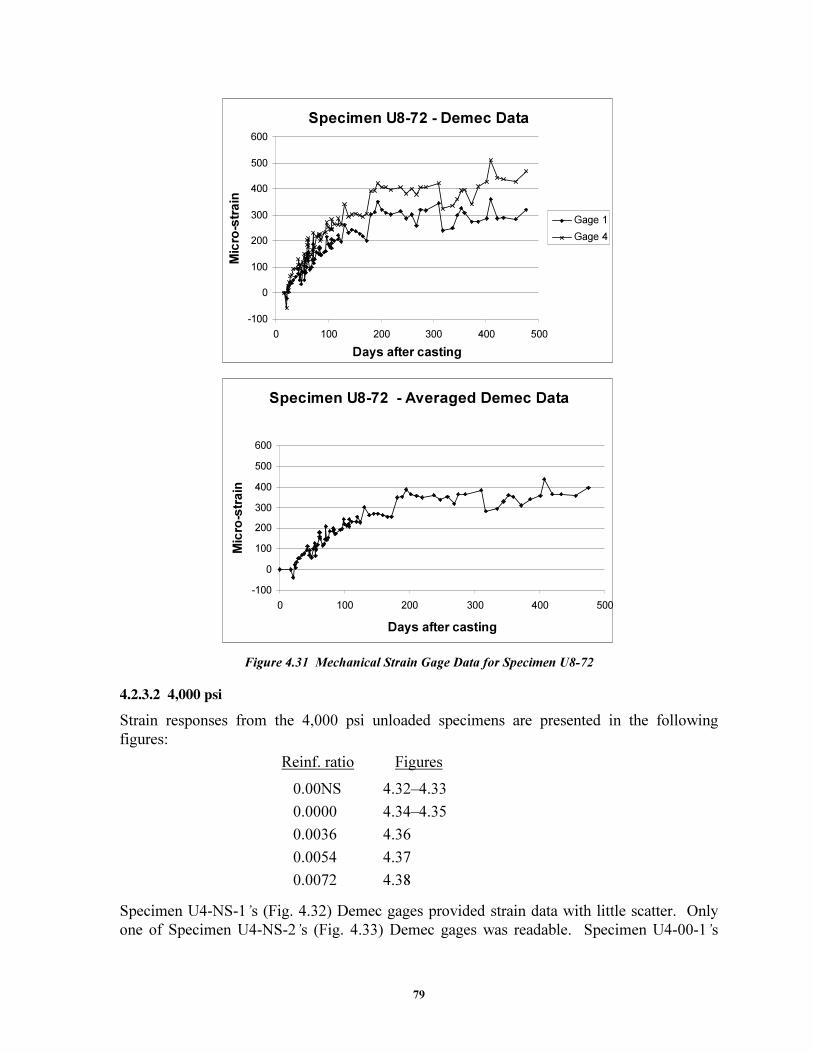
79
Specimen U8-72 - Demec Data
-100
0
100
200
300
400
500
600
0 100 200 300 400 500
Days after casting
Micro-strain
Gage 1
Gage 4
Specimen U8-72 - Averaged Demec Data
-100
0
100
200
300
400
500
600
0 100 200 300 400 500
Days after casting
Micro-strain
Figure 4.31 Mechanical Strain Gage Data for Specimen U8-72
�����������������
Strain responses from the 4,000 psi unloaded specimens are presented in the following
figures:
Reinf. ratio Figures
0.00NS 4.32–4.33
0.0000 4.34–4.35
0.0036 4.36
0.0054 4.37
0.0072 4.38
Specimen U4-NS-1’s (Fig. 4.32) Demec gages provided strain data with little scatter. Only
one of Specimen U4-NS-2’s (Fig. 4.33) Demec gages was readable. Specimen U4-00-1’s
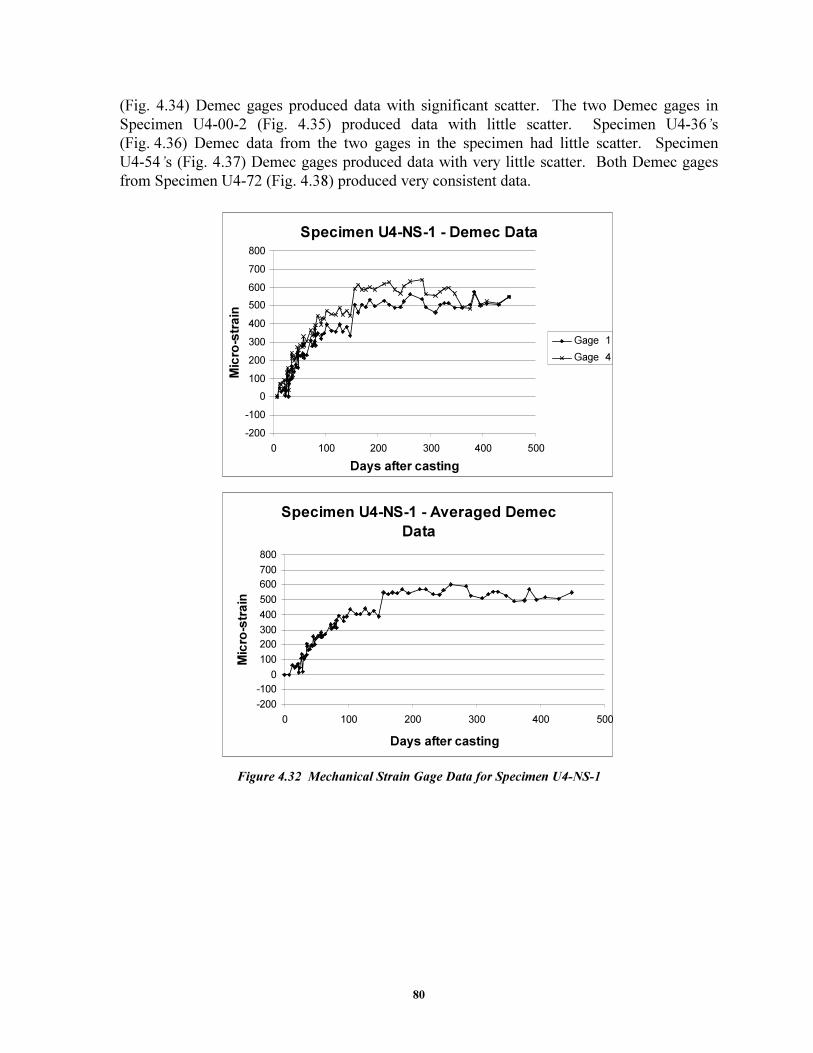
80
(Fig. 4.34) Demec gages produced data with significant scatter. The two Demec gages in
Specimen U4-00-2 (Fig. 4.35) produced data with little scatter. Specimen U4-36’s
(Fig. 4.36) Demec data from the two gages in the specimen had little scatter. Specimen
U4-54’s (Fig. 4.37) Demec gages produced data with very little scatter. Both Demec gages
from Specimen U4-72 (Fig. 4.38) produced very consistent data.
Specimen U4-NS-1 - Demec Data
-200
-100
0
100
200
300
400
500
600
700
800
0 100 200 300 400 500
Days after casting
Micro-strain
Gage 1
Gage 4
Specimen U4-NS-1 - Averaged Demec
Data
-200
-100
0
100
200
300
400
500
600
700
800
0 100 200 300 400 500
Days after casting
Micro-strain
Figure 4.32 Mechanical Strain Gage Data for Specimen U4-NS-1
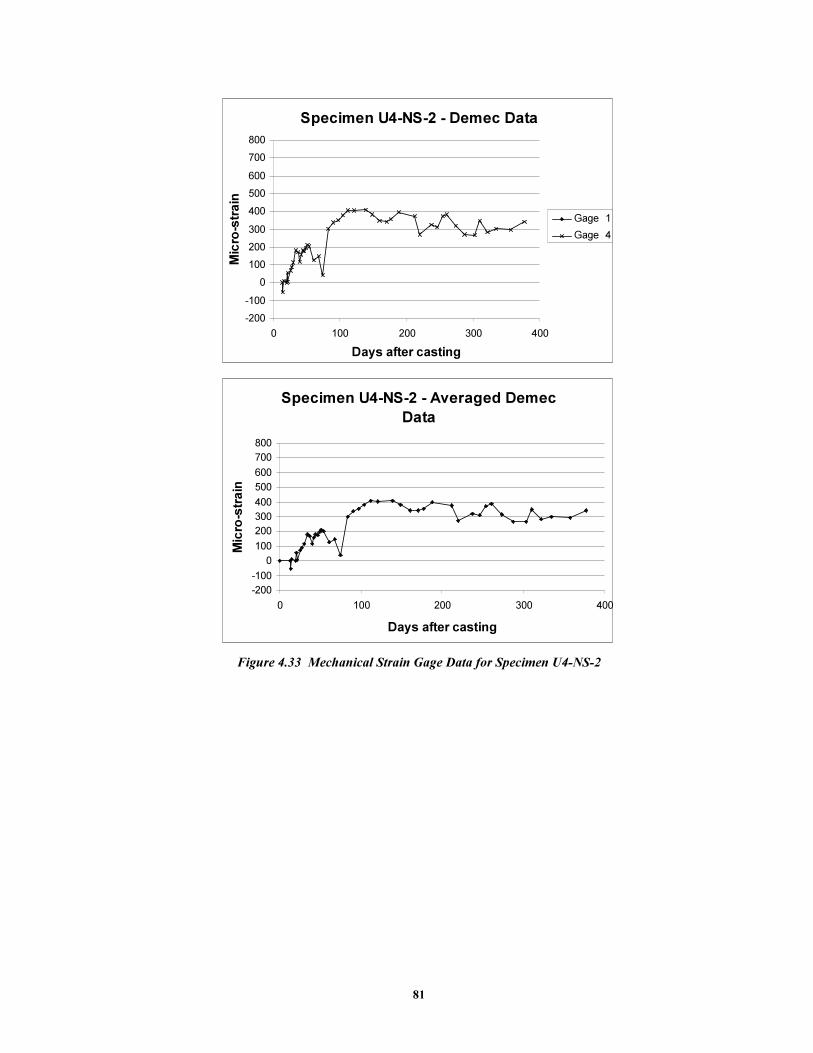
81
Specimen U4-NS-2 - Demec Data
-200
-100
0
100
200
300
400
500
600
700
800
0 100 200 300 400
Days after casting
Micro-strain
Gage 1
Gage 4
Specimen U4-NS-2 - Averaged Demec
Data
-200
-100
0
100
200
300
400
500
600
700
800
0 100 200 300 400
Days after casting
Micro-strain
Figure 4.33 Mechanical Strain Gage Data for Specimen U4-NS-2
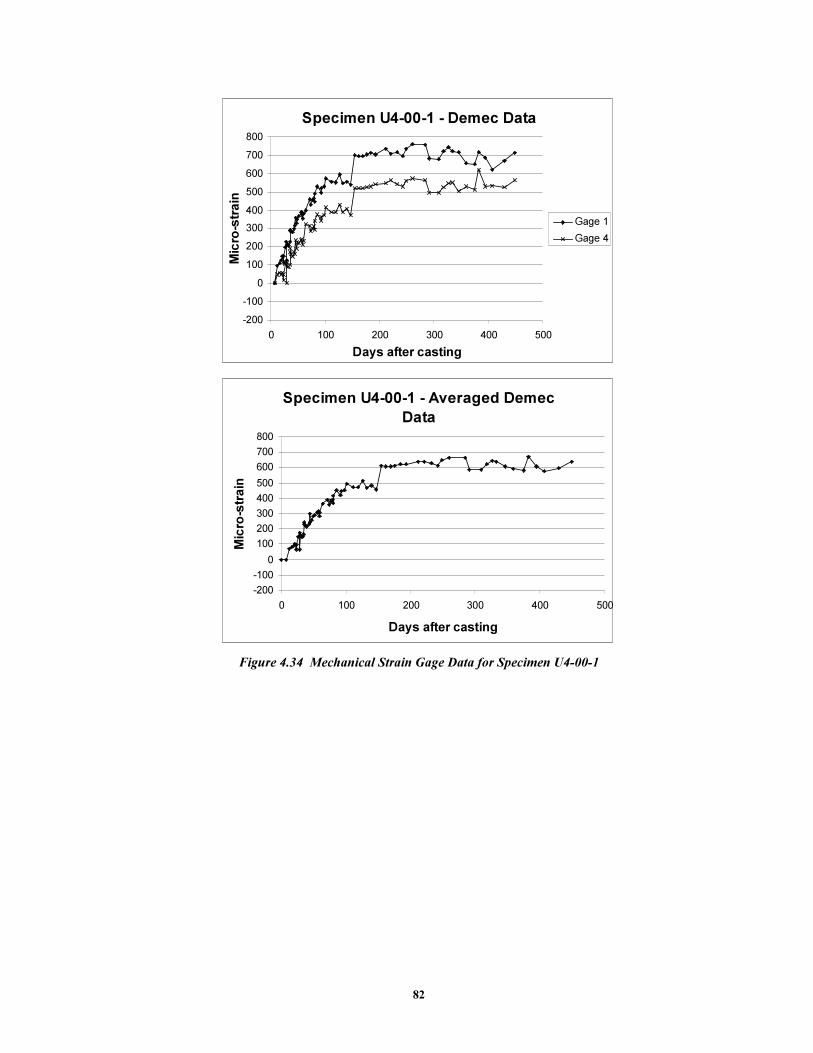
82
Specimen U4-00-1 - Demec Data
-200
-100
0
100
200
300
400
500
600
700
800
0 100 200 300 400 500
Days after casting
Micro-strain
Gage 1
Gage 4
Specimen U4-00-1 - Averaged Demec
Data
-200
-100
0
100
200
300
400
500
600
700
800
0 100 200 300 400 500
Days after casting
Micro-strain
Figure 4.34 Mechanical Strain Gage Data for Specimen U4-00-1
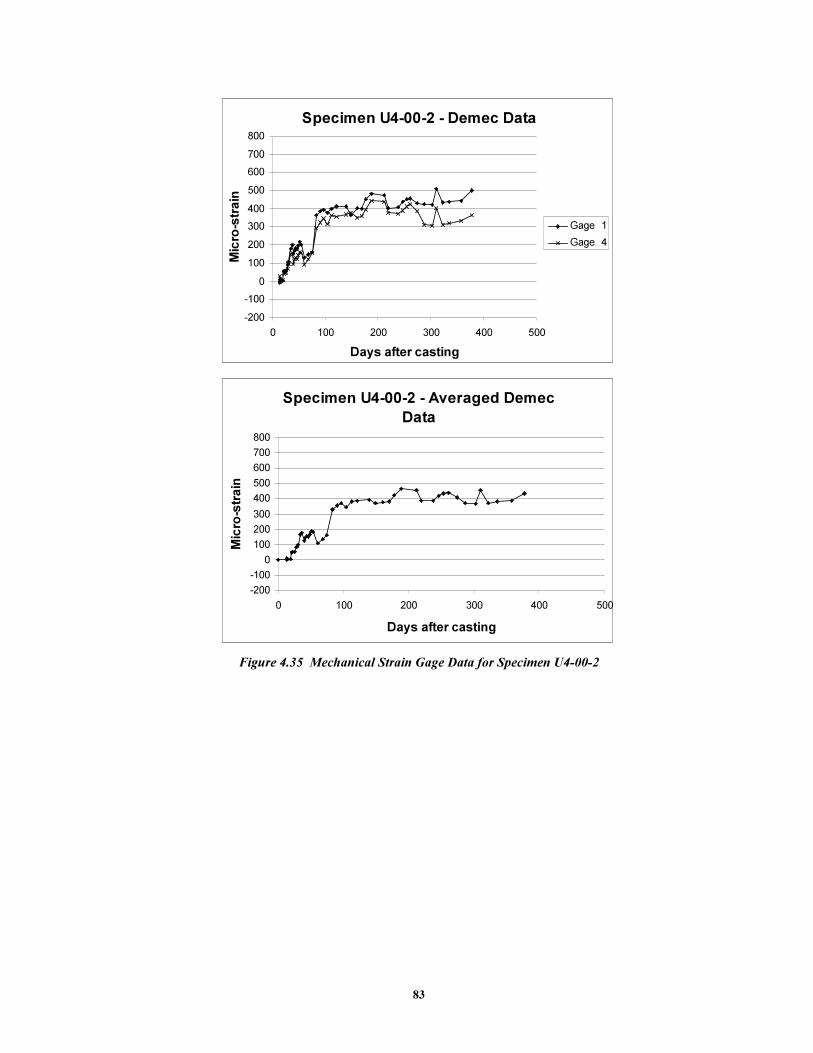
83
Specimen U4-00-2 - Demec Data
-200
-100
0
100
200
300
400
500
600
700
800
0 100 200 300 400 500
Days after casting
Micro-strain
Gage 1
Gage 4
Specimen U4-00-2 - Averaged Demec
Data
-200
-100
0
100
200
300
400
500
600
700
800
0 100 200 300 400 500
Days after casting
Micro-strain
Figure 4.35 Mechanical Strain Gage Data for Specimen U4-00-2
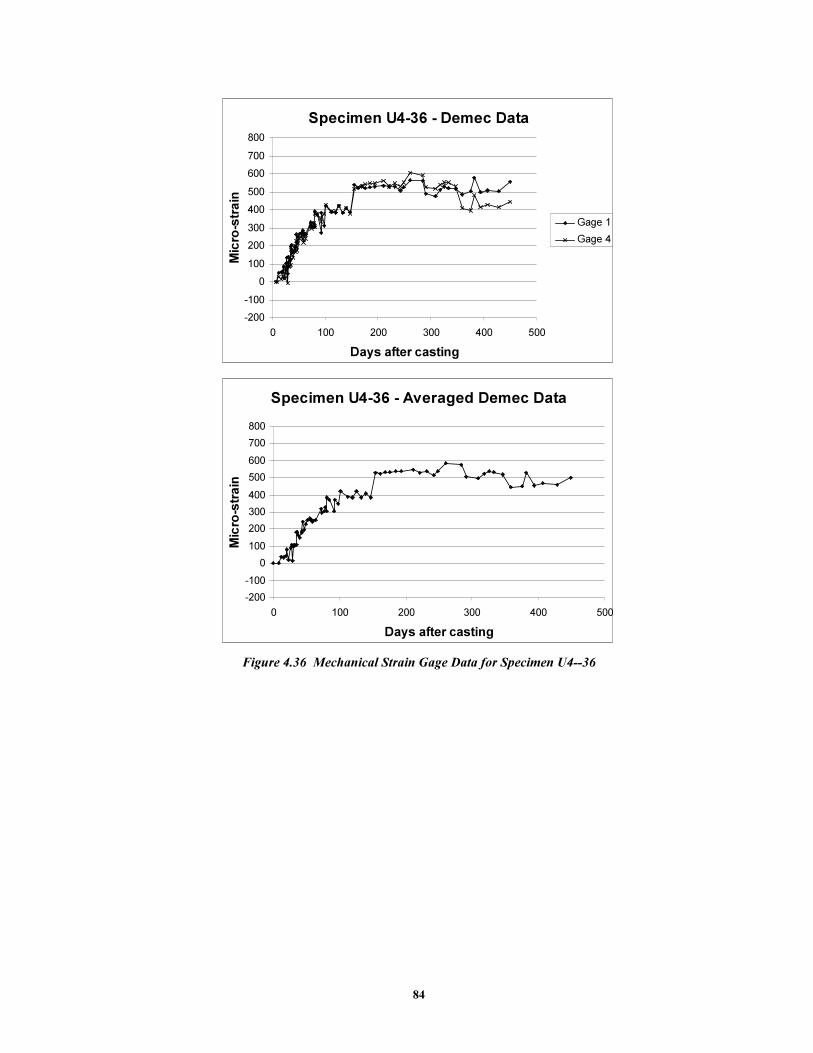
84
Specimen U4-36 - Demec Data
-200
-100
0
100
200
300
400
500
600
700
800
0 100 200 300 400 500
Days after casting
Micro-strain
Gage 1
Gage 4
Specimen U4-36 - Averaged Demec Data
-200
-100
0
100
200
300
400
500
600
700
800
0 100 200 300 400 500
Days after casting
Micro-strain
Figure 4.36 Mechanical Strain Gage Data for Specimen U4--36
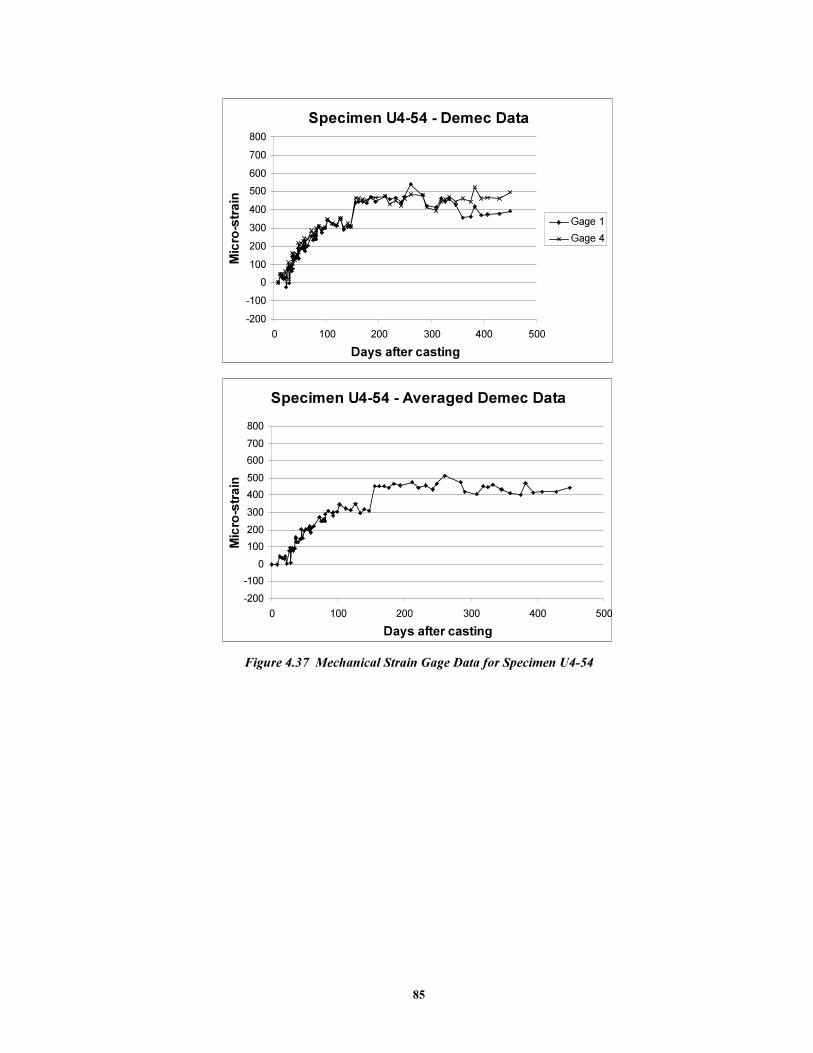
85
Specimen U4-54 - Demec Data
-200
-100
0
100
200
300
400
500
600
700
800
0 100 200 300 400 500
Days after casting
Micro-strain
Gage 1
Gage 4
Specimen U4-54 - Averaged Demec Data
-200
-100
0
100
200
300
400
500
600
700
800
0 100 200 300 400 500
Days after casting
Micro-strain
Figure 4.37 Mechanical Strain Gage Data for Specimen U4-54
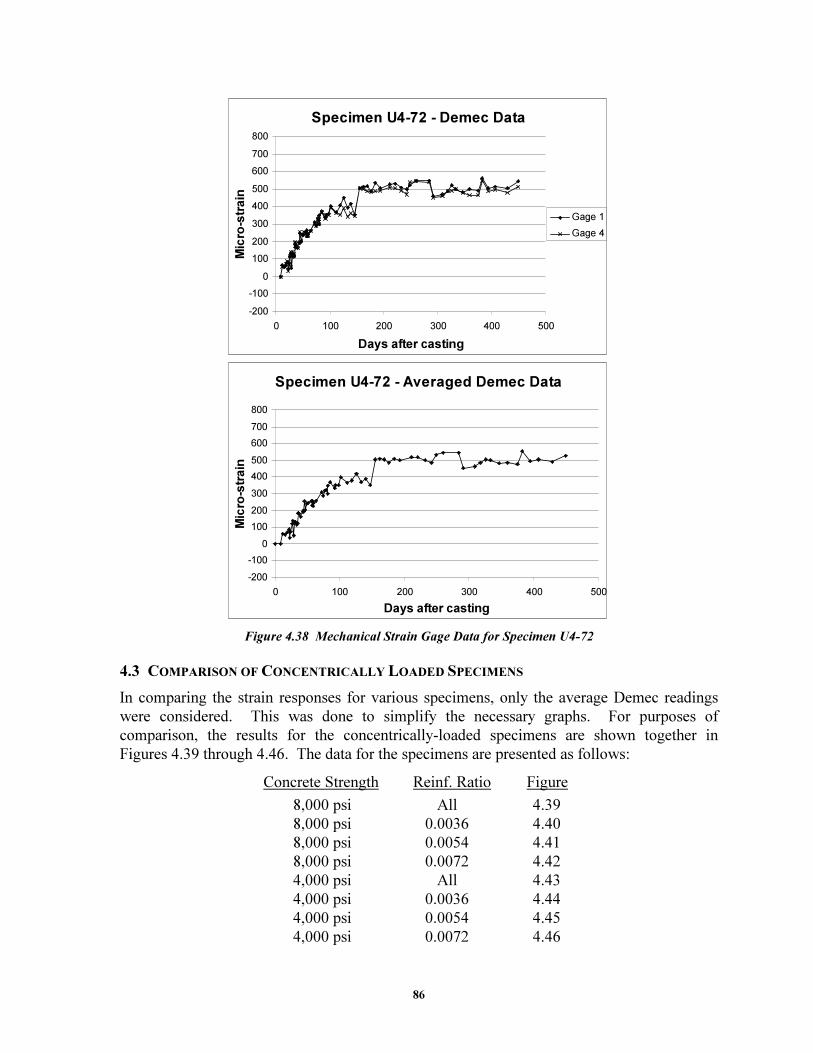
86
Specimen U4-72 - Demec Data
-200
-100
0
100
200
300
400
500
600
700
800
0 100 200 300 400 500
Days after casting
Micro-strain
Gage 1
Gage 4
Specimen U4-72 - Averaged Demec Data
-200
-100
0
100
200
300
400
500
600
700
800
0 100 200 300 400 500
Days after casting
Micro-strain
Figure 4.38 Mechanical Strain Gage Data for Specimen U4-72
4.3 COMPARISON OF CONCENTRICALLY LOADED SPECIMENS
In comparing the strain responses for various specimens, only the average Demec readings
were considered. This was done to simplify the necessary graphs. For purposes of
comparison, the results for the concentrically-loaded specimens are shown together in
Figures 4.39 through 4.46. The data for the specimens are presented as follows:
Concrete Strength Reinf. Ratio Figure
8,000 psi All 4.39
8,000 psi 0.0036 4.40
8,000 psi 0.0054 4.41
8,000 psi 0.0072 4.42
4,000 psi All 4.43
4,000 psi 0.0036 4.44
4,000 psi 0.0054 4.45
4,000 psi 0.0072 4.46
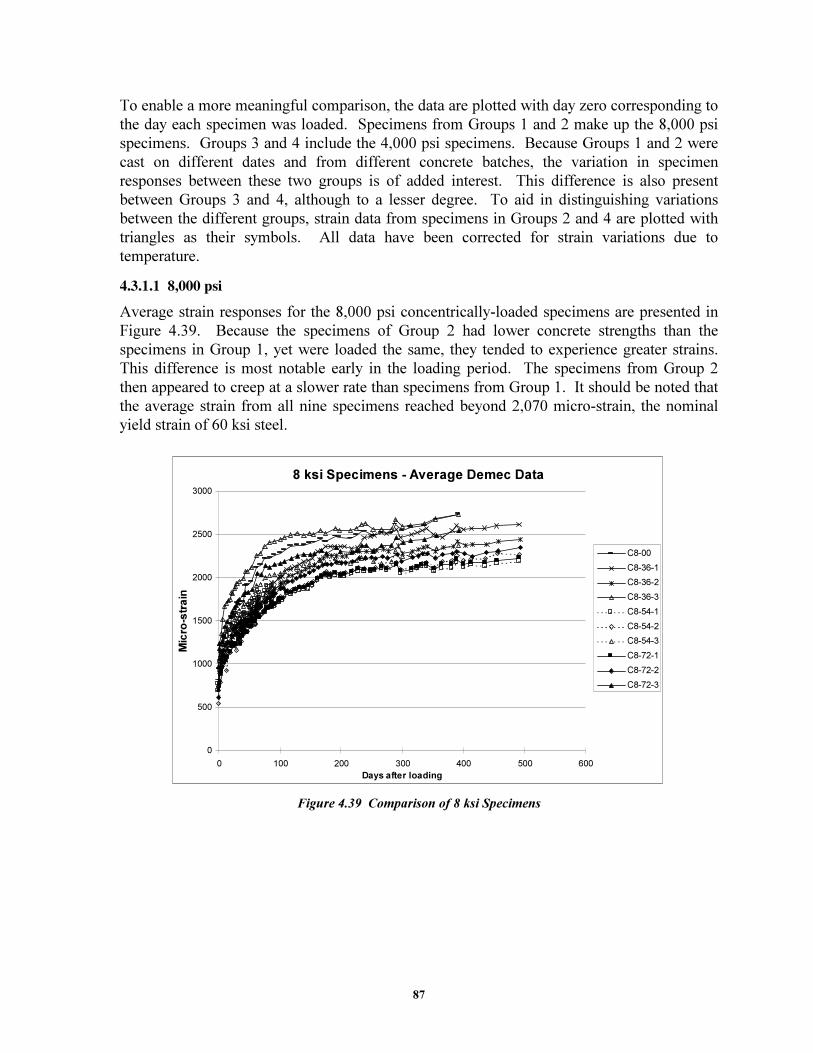
87
To enable a more meaningful comparison, the data are plotted with day zero corresponding to
the day each specimen was loaded. Specimens from Groups 1 and 2 make up the 8,000 psi
specimens. Groups 3 and 4 include the 4,000 psi specimens. Because Groups 1 and 2 were
cast on different dates and from different concrete batches, the variation in specimen
responses between these two groups is of added interest. This difference is also present
between Groups 3 and 4, although to a lesser degree. To aid in distinguishing variations
between the different groups, strain data from specimens in Groups 2 and 4 are plotted with
triangles as their symbols. All data have been corrected for strain variations due to
temperature.
������������������
Average strain responses for the 8,000 psi concentrically-loaded specimens are presented in
Figure 4.39. Because the specimens of Group 2 had lower concrete strengths than the
specimens in Group 1, yet were loaded the same, they tended to experience greater strains.
This difference is most notable early in the loading period. The specimens from Group 2
then appeared to creep at a slower rate than specimens from Group 1. It should be noted that
the average strain from all nine specimens reached beyond 2,070 micro-strain, the nominal
yield strain of 60 ksi steel.
8 ksi Specimens - Average Demec Data
0
500
1000
1500
2000
2500
3000
0 100 200 300 400 500 600
Days after loading
Micro-strain
C8-00
C8-36-1
C8-36-2
C8-36-3
C8-54-1
C8-54-2
C8-54-3
C8-72-1
C8-72-2
C8-72-3
Figure 4.39 Comparison of 8 ksi Specimens
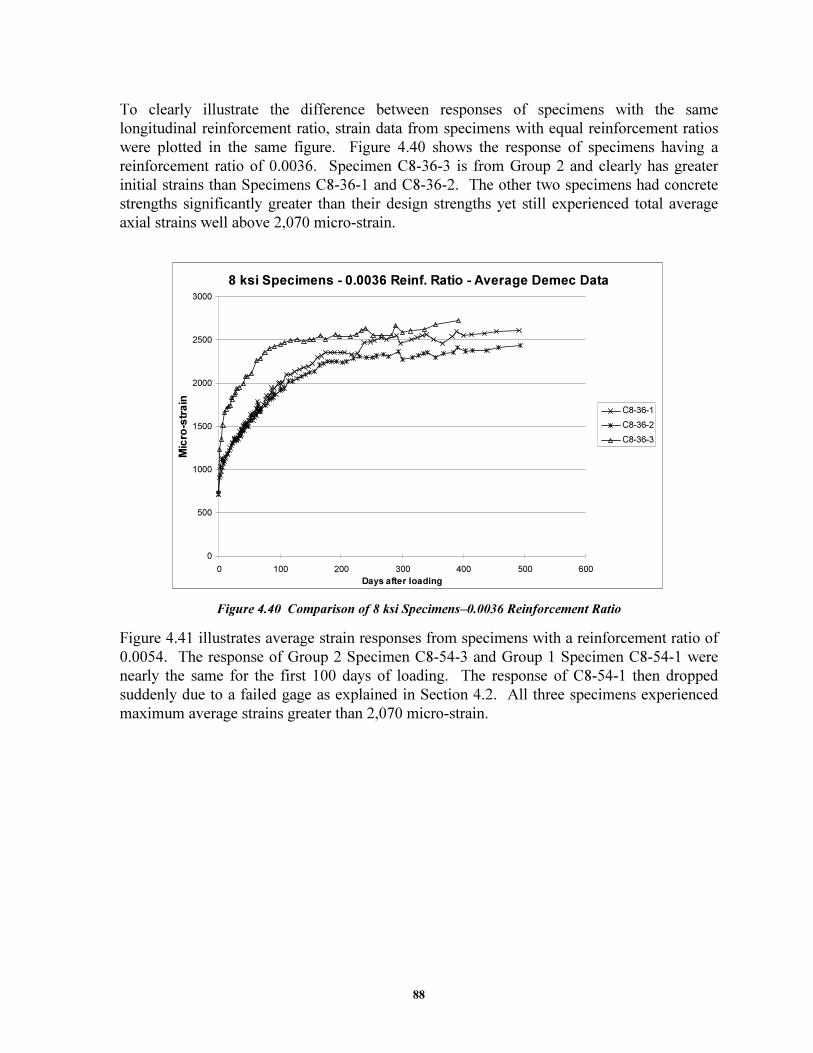
88
To clearly illustrate the difference between responses of specimens with the same
longitudinal reinforcement ratio, strain data from specimens with equal reinforcement ratios
were plotted in the same figure. Figure 4.40 shows the response of specimens having a
reinforcement ratio of 0.0036. Specimen C8-36-3 is from Group 2 and clearly has greater
initial strains than Specimens C8-36-1 and C8-36-2. The other two specimens had concrete
strengths significantly greater than their design strengths yet still experienced total average
axial strains well above 2,070 micro-strain.
8 ksi Specimens - 0.0036 Reinf. Ratio - Average Demec Data
0
500
1000
1500
2000
2500
3000
0 100 200 300 400 500 600
Days after loading
Micro-strain
C8-36-1
C8-36-2
C8-36-3
Figure 4.40 Comparison of 8 ksi Specimens–0.0036 Reinforcement Ratio
Figure 4.41 illustrates average strain responses from specimens with a reinforcement ratio of
0.0054. The response of Group 2 Specimen C8-54-3 and Group 1 Specimen C8-54-1 were
nearly the same for the first 100 days of loading. The response of C8-54-1 then dropped
suddenly due to a failed gage as explained in Section 4.2. All three specimens experienced
maximum average strains greater than 2,070 micro-strain.
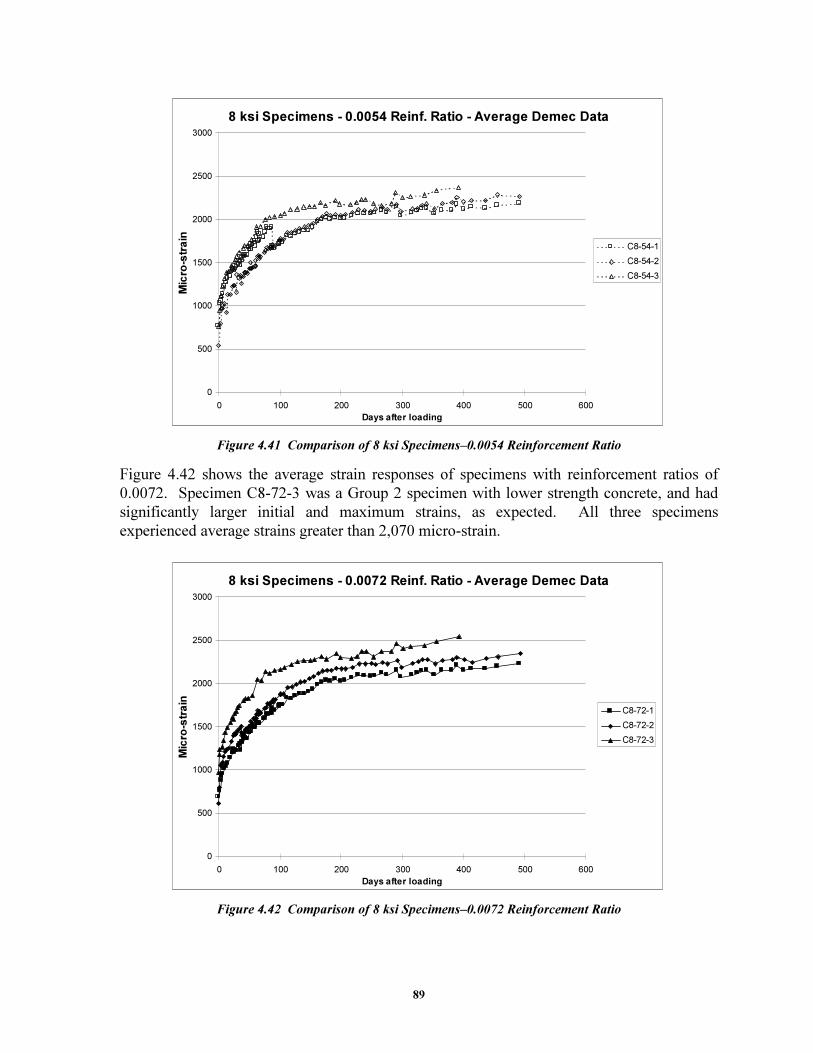
89
8 ksi Specimens - 0.0054 Reinf. Ratio - Average Demec Data
0
500
1000
1500
2000
2500
3000
0 100 200 300 400 500 600
Days after loading
Micro-strain
C8-54-1
C8-54-2
C8-54-3
Figure 4.41 Comparison of 8 ksi Specimens–0.0054 Reinforcement Ratio
Figure 4.42 shows the average strain responses of specimens with reinforcement ratios of
0.0072. Specimen C8-72-3 was a Group 2 specimen with lower strength concrete, and had
significantly larger initial and maximum strains, as expected. All three specimens
experienced average strains greater than 2,070 micro-strain.
8 ksi Specimens - 0.0072 Reinf. Ratio - Average Demec Data
0
500
1000
1500
2000
2500
3000
0 100 200 300 400 500 600
Days after loading
Micro-strain
C8-72-1
C8-72-2
C8-72-3
Figure 4.42 Comparison of 8 ksi Specimens–0.0072 Reinforcement Ratio
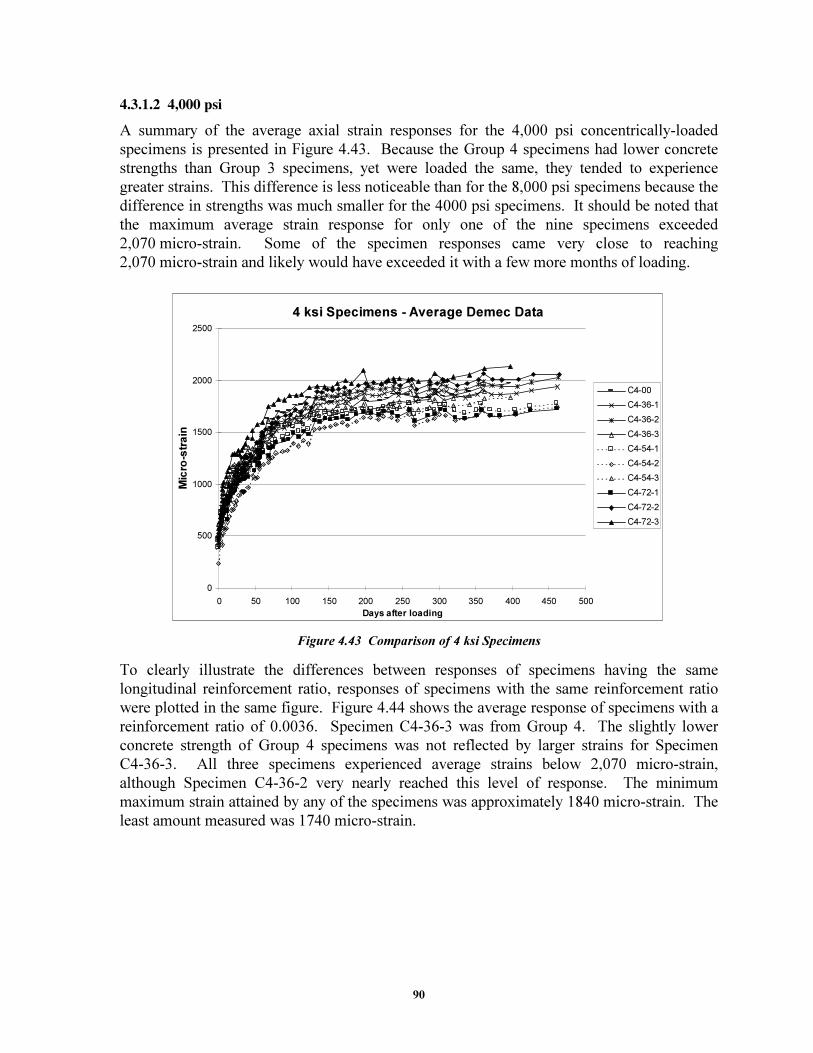
90
������������������
A summary of the average axial strain responses for the 4,000 psi concentrically-loaded
specimens is presented in Figure 4.43. Because the Group 4 specimens had lower concrete
strengths than Group 3 specimens, yet were loaded the same, they tended to experience
greater strains. This difference is less noticeable than for the 8,000 psi specimens because the
difference in strengths was much smaller for the 4000 psi specimens. It should be noted that
the maximum average strain response for only one of the nine specimens exceeded
2,070 micro-strain. Some of the specimen responses came very close to reaching
2,070 micro-strain and likely would have exceeded it with a few more months of loading.
4 ksi Specimens - Average Demec Data
0
500
1000
1500
2000
2500
0 50 100 150 200 250 300 350 400 450 500
Days after loading
Micro-strain
C4-00
C4-36-1
C4-36-2
C4-36-3
C4-54-1
C4-54-2
C4-54-3
C4-72-1
C4-72-2
C4-72-3
Figure 4.43 Comparison of 4 ksi Specimens
To clearly illustrate the differences between responses of specimens having the same
longitudinal reinforcement ratio, responses of specimens with the same reinforcement ratio
were plotted in the same figure. Figure 4.44 shows the average response of specimens with a
reinforcement ratio of 0.0036. Specimen C4-36-3 was from Group 4. The slightly lower
concrete strength of Group 4 specimens was not reflected by larger strains for Specimen
C4-36-3. All three specimens experienced average strains below 2,070 micro-strain,
although Specimen C4-36-2 very nearly reached this level of response. The minimum
maximum strain attained by any of the specimens was approximately 1840 micro-strain. The
least amount measured was 1740 micro-strain.
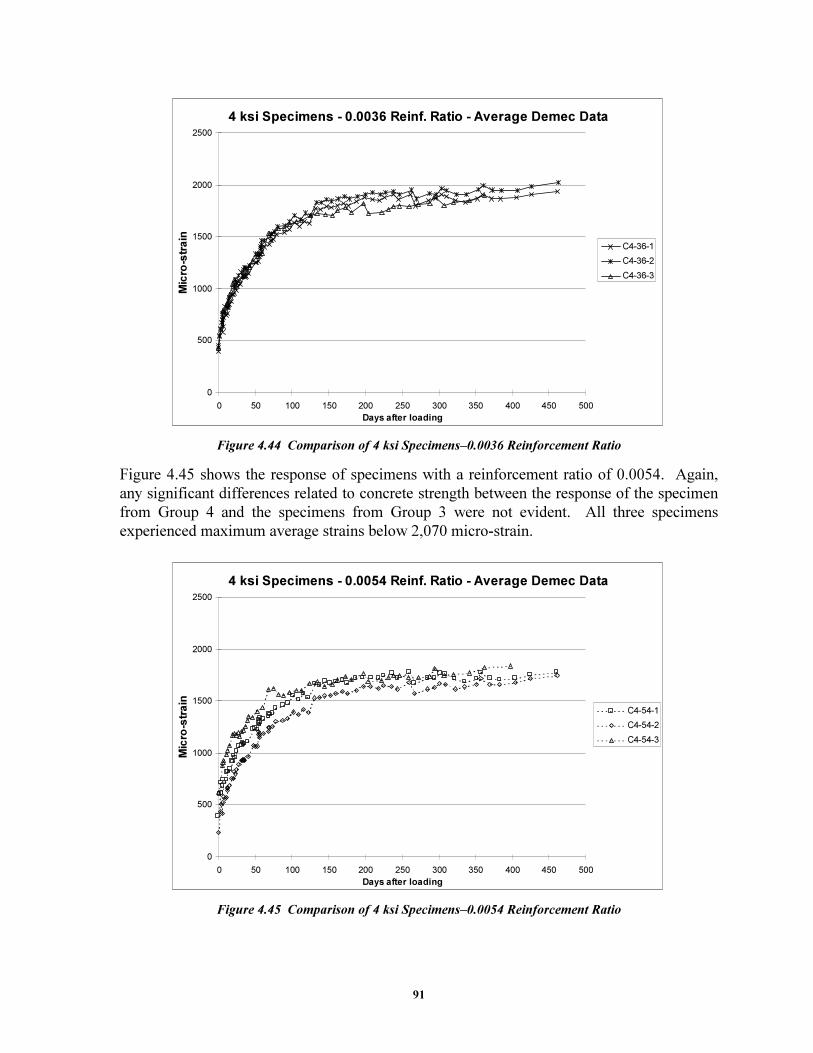
91
4 ksi Specimens - 0.0036 Reinf. Ratio - Average Demec Data
0
500
1000
1500
2000
2500
0 50 100 150 200 250 300 350 400 450 500
Days after loading
Micro-strain
C4-36-1
C4-36-2
C4-36-3
Figure 4.44 Comparison of 4 ksi Specimens–0.0036 Reinforcement Ratio
Figure 4.45 shows the response of specimens with a reinforcement ratio of 0.0054. Again,
any significant differences related to concrete strength between the response of the specimen
from Group 4 and the specimens from Group 3 were not evident. All three specimens
experienced maximum average strains below 2,070 micro-strain.
4 ksi Specimens - 0.0054 Reinf. Ratio - Average Demec Data
0
500
1000
1500
2000
2500
0 50 100 150 200 250 300 350 400 450 500
Days after loading
Micro-strain
C4-54-1
C4-54-2
C4-54-3
Figure 4.45 Comparison of 4 ksi Specimens–0.0054 Reinforcement Ratio
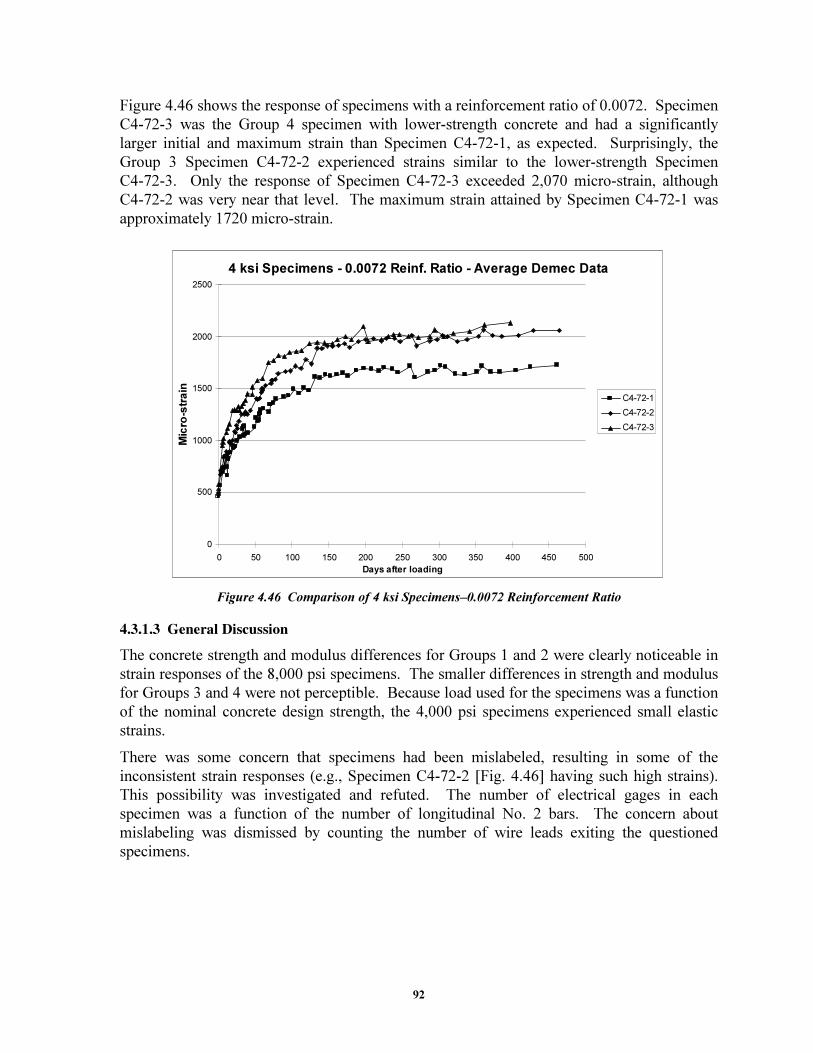
92
Figure 4.46 shows the response of specimens with a reinforcement ratio of 0.0072. Specimen
C4-72-3 was the Group 4 specimen with lower-strength concrete and had a significantly
larger initial and maximum strain than Specimen C4-72-1, as expected. Surprisingly, the
Group 3 Specimen C4-72-2 experienced strains similar to the lower-strength Specimen
C4-72-3. Only the response of Specimen C4-72-3 exceeded 2,070 micro-strain, although
C4-72-2 was very near that level. The maximum strain attained by Specimen C4-72-1 was
approximately 1720 micro-strain.
4 ksi Specimens - 0.0072 Reinf. Ratio - Average Demec Data
0
500
1000
1500
2000
2500
0 50 100 150 200 250 300 350 400 450 500
Days after loading
Micro-strain
C4-72-1
C4-72-2
C4-72-3
Figure 4.46 Comparison of 4 ksi Specimens–0.0072 Reinforcement Ratio
��������� ���������������
The concrete strength and modulus differences for Groups 1 and 2 were clearly noticeable in
strain responses of the 8,000 psi specimens. The smaller differences in strength and modulus
for Groups 3 and 4 were not perceptible. Because load used for the specimens was a function
of the nominal concrete design strength, the 4,000 psi specimens experienced small elastic
strains.
There was some concern that specimens had been mislabeled, resulting in some of the
inconsistent strain responses (e.g., Specimen C4-72-2 [Fig. 4.46] having such high strains).
This possibility was investigated and refuted. The number of electrical gages in each
specimen was a function of the number of longitudinal No. 2 bars. The concern about
mislabeling was dismissed by counting the number of wire leads exiting the questioned
specimens.
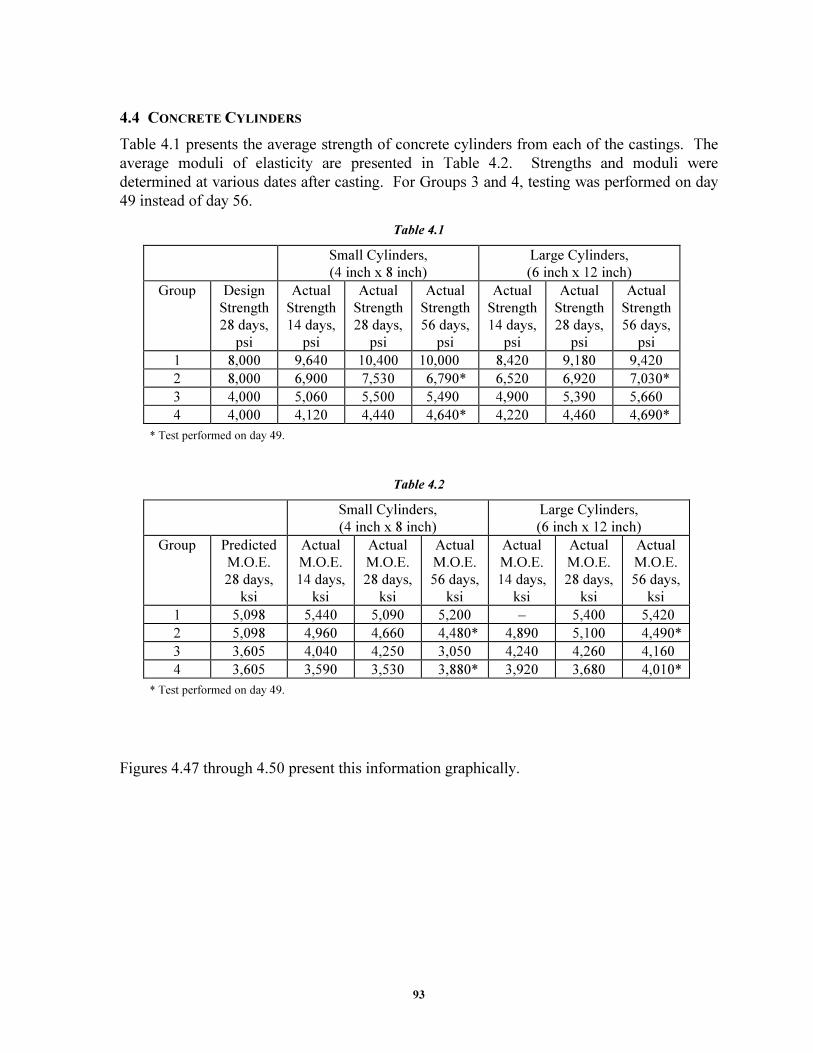
93
4.4 CONCRETE CYLINDERS
Table 4.1 presents the average strength of concrete cylinders from each of the castings. The
average moduli of elasticity are presented in Table 4.2. Strengths and moduli were
determined at various dates after casting. For Groups 3 and 4, testing was performed on day
49 instead of day 56.
Table 4.1
Small Cylinders,
(4 inch x 8 inch)
Large Cylinders,
(6 inch x 12 inch)
Group Design
Strength
28 days,
psi
Actual
Strength
14 days,
psi
Actual
Strength
28 days,
psi
Actual
Strength
56 days,
psi
Actual
Strength
14 days,
psi
Actual
Strength
28 days,
psi
Actual
Strength
56 days,
psi
1 8,000 9,640 10,400 10,000 8,420 9,180 9,420
2 8,000 6,900 7,530 6,790* 6,520 6,920 7,030*
3 4,000 5,060 5,500 5,490 4,900 5,390 5,660
4 4,000 4,120 4,440 4,640* 4,220 4,460 4,690*
* Test performed on day 49.
Table 4.2
Small Cylinders,
(4 inch x 8 inch)
Large Cylinders,
(6 inch x 12 inch)
Group Predicted
M.O.E.
28 days,
ksi
Actual
M.O.E.
14 days,
ksi
Actual
M.O.E.
28 days,
ksi
Actual
M.O.E.
56 days,
ksi
Actual
M.O.E.
14 days,
ksi
Actual
M.O.E.
28 days,
ksi
Actual
M.O.E.
56 days,
ksi
1 5,098 5,440 5,090 5,200 – 5,400 5,420
2 5,098 4,960 4,660 4,480* 4,890 5,100 4,490*
3 3,605 4,040 4,250 3,050 4,240 4,260 4,160
4 3,605 3,590 3,530 3,880* 3,920 3,680 4,010*
* Test performed on day 49.
Figures 4.47 through 4.50 present this information graphically.
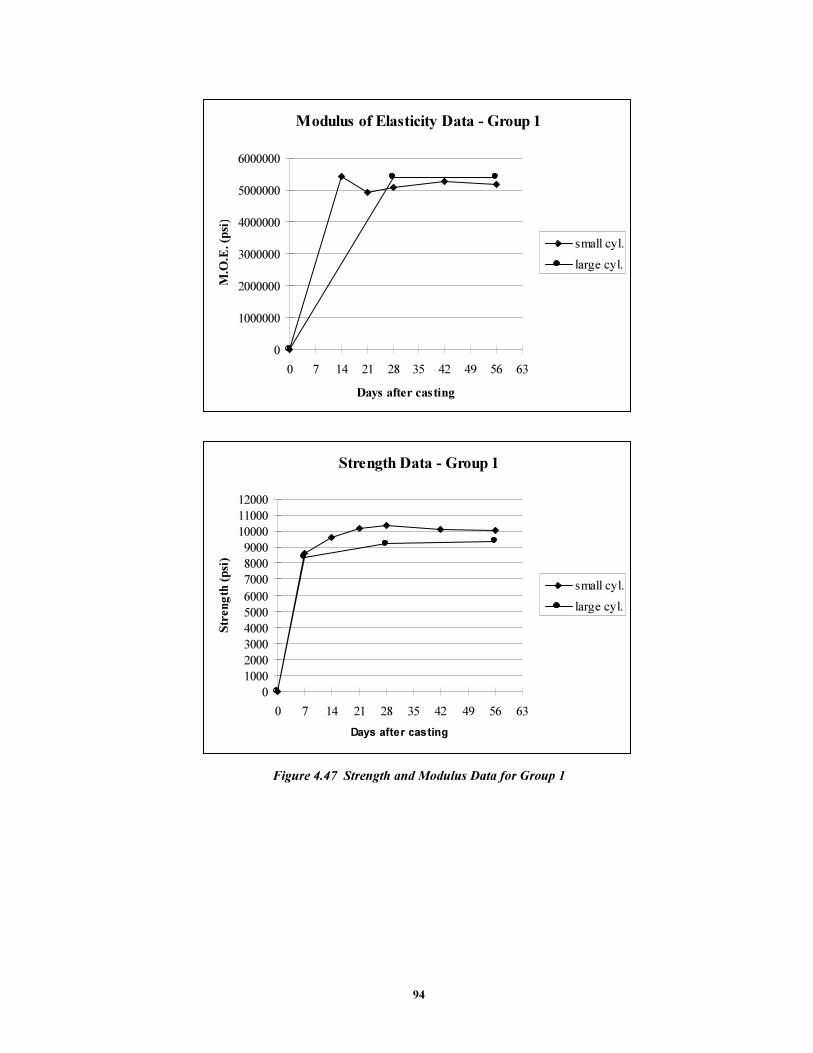
94
Modulus of Elasticity Data - Group 1
0
1000000
2000000
3000000
4000000
5000000
6000000
0 7 14 21 28 35 42 49 56 63
Days after casting
M.O
.E. (p
si)
small cyl.
large cyl.
Strength Data - Group 1
0
1000
2000
3000
4000
5000
6000
7000
8000
9000
10000
11000
12000
0 7 14 21 28 35 42 49 56 63
Days after casting
Str
en
gth
(p
si)
small cyl.
large cyl.
Figure 4.47 Strength and Modulus Data for Group 1
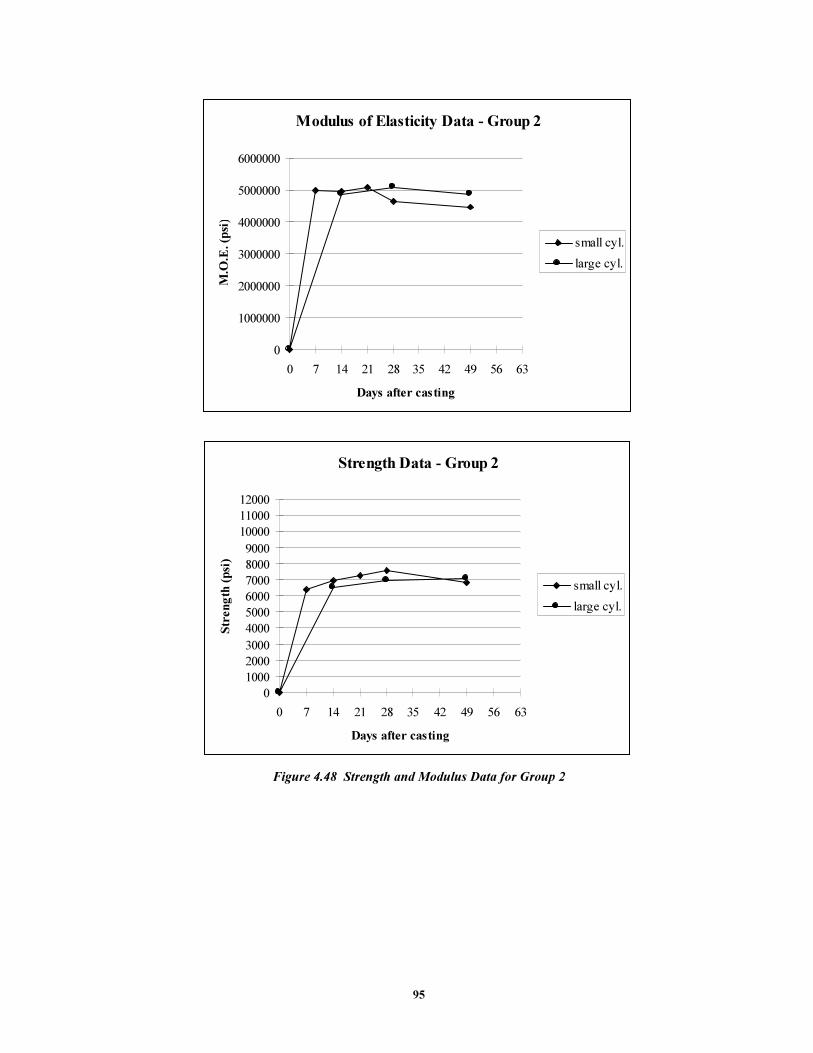
95
Modulus of Elasticity Data - Group 2
0
1000000
2000000
3000000
4000000
5000000
6000000
0 7 14 21 28 35 42 49 56 63
Days after casting
M.O
.E. (p
si)
small cyl.
large cyl.
Strength Data - Group 2
0
1000
2000
3000
4000
5000
6000
7000
8000
9000
10000
11000
12000
0 7 14 21 28 35 42 49 56 63
Days after casting
Str
en
gth
(p
si)
small cyl.
large cyl.
Figure 4.48 Strength and Modulus Data for Group 2
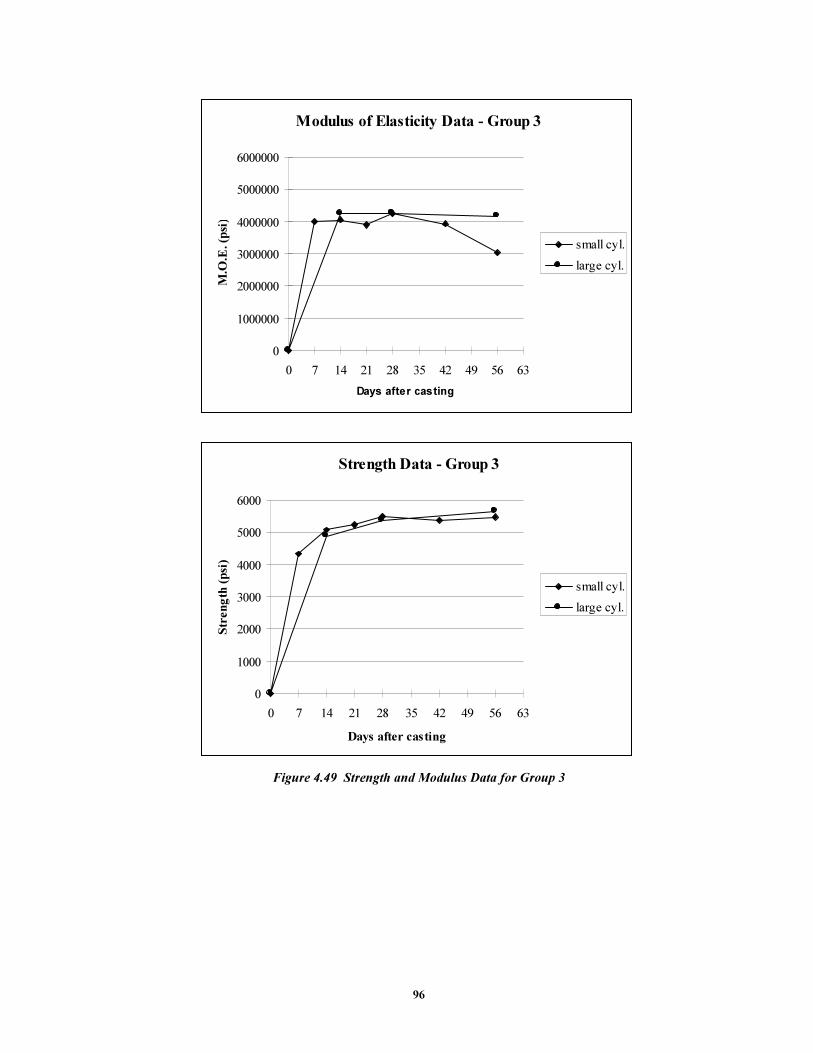
96
Modulus of Elasticity Data - Group 3
0
1000000
2000000
3000000
4000000
5000000
6000000
0 7 14 21 28 35 42 49 56 63
Days after casting
M.O
.E. (p
si)
small cyl.
large cyl.
Strength Data - Group 3
0
1000
2000
3000
4000
5000
6000
0 7 14 21 28 35 42 49 56 63
Days after casting
Str
en
gth
(p
si)
small cyl.
large cyl.
Figure 4.49 Strength and Modulus Data for Group 3
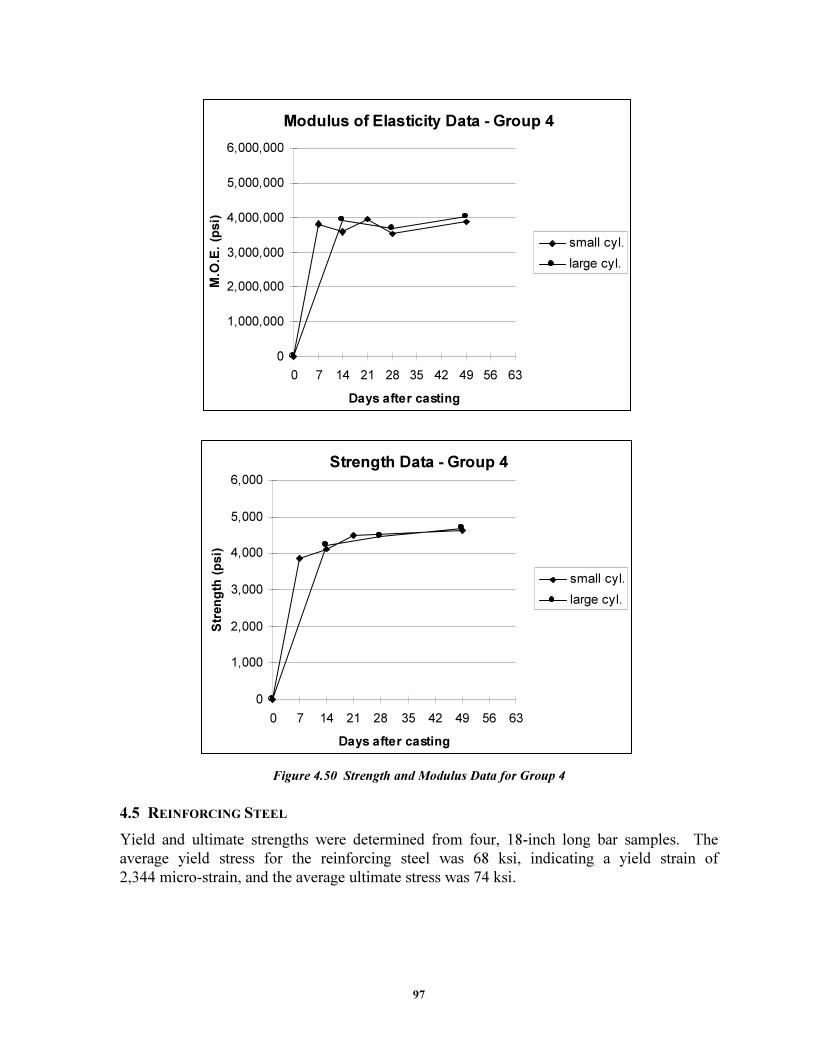
97
Modulus of Elasticity Data - Group 4
0
1,000,000
2,000,000
3,000,000
4,000,000
5,000,000
6,000,000
0 7 14 21 28 35 42 49 56 63
Days after casting
M.O
.E.
(psi)
small cyl.
large cyl.
Strength Data - Group 4
0
1,000
2,000
3,000
4,000
5,000
6,000
0 7 14 21 28 35 42 49 56 63
Days after casting
Str
en
gth
(p
si)
small cyl.
large cyl.
Figure 4.50 Strength and Modulus Data for Group 4
4.5 REINFORCING STEEL
Yield and ultimate strengths were determined from four, 18-inch long bar samples. The
average yield stress for the reinforcing steel was 68 ksi, indicating a yield strain of
2,344 micro-strain, and the average ultimate stress was 74 ksi.

98
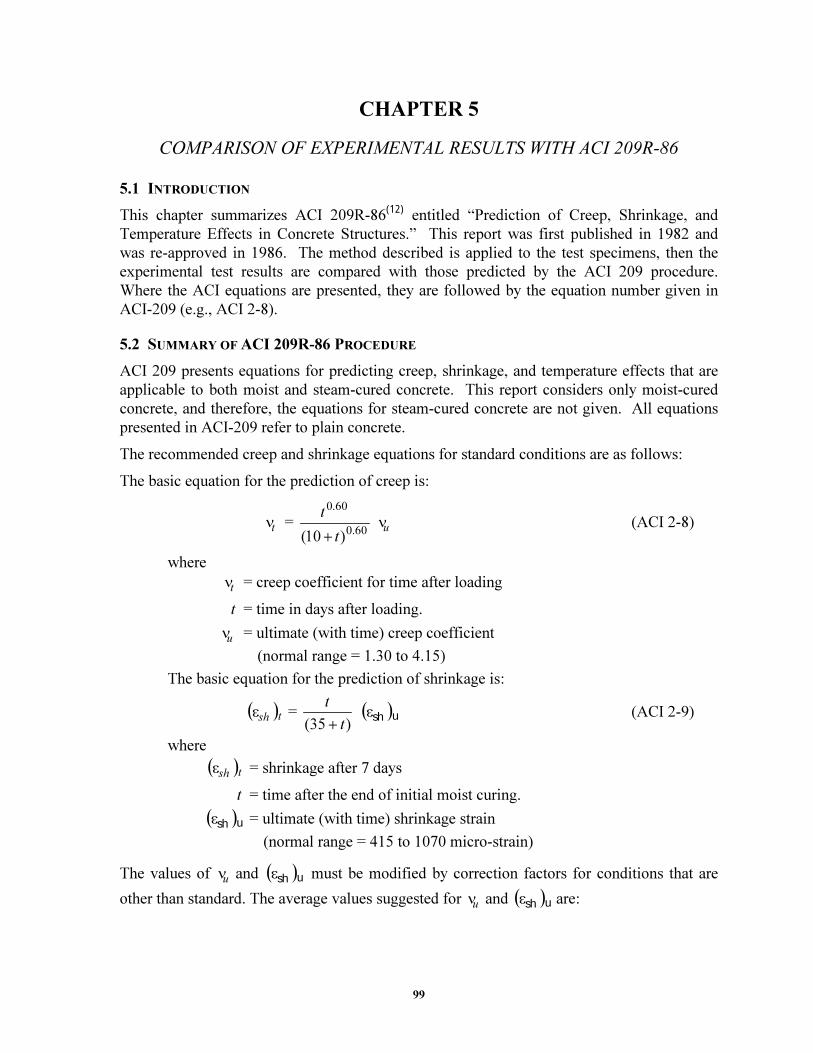
99
CHAPTER 5
COMPARISON OF EXPERIMENTAL RESULTS WITH ACI 209R-86
5.1 INTRODUCTION
This chapter summarizes ACI 209R-86(12)
entitled “Prediction of Creep, Shrinkage, and
Temperature Effects in Concrete Structures.” This report was first published in 1982 and
was re-approved in 1986. The method described is applied to the test specimens, then the
experimental test results are compared with those predicted by the ACI 209 procedure.
Where the ACI equations are presented, they are followed by the equation number given in
ACI-209 (e.g., ACI 2-8).
5.2 SUMMARY OF ACI 209R-86 PROCEDURE
ACI 209 presents equations for predicting creep, shrinkage, and temperature effects that are
applicable to both moist and steam-cured concrete. This report considers only moist-cured
concrete, and therefore, the equations for steam-cured concrete are not given. All equations
presented in ACI-209 refer to plain concrete.
The recommended creep and shrinkage equations for standard conditions are as follows:
The basic equation for the prediction of creep is:
tν =
60.0
60.0
)10( t
t
+
uν (ACI 2-8)
where
tν .= creep coefficient for time after loading
t .= time in days after loading.
uν .= ultimate (with time) creep coefficient
(normal range = 1.30 to 4.15)
The basic equation for the prediction of shrinkage is:
( )tshε = )35( t
t
+
( )ushε (ACI 2-9)
where
( )tshε .= shrinkage after 7 days
t .= time after the end of initial moist curing.
( )ushε .= ultimate (with time) shrinkage strain
(normal range = 415 to 1070 micro-strain)
The values of uν and ( )ushε must be modified by correction factors for conditions that are
other than standard. The average values suggested for uν and ( )ushε
are:
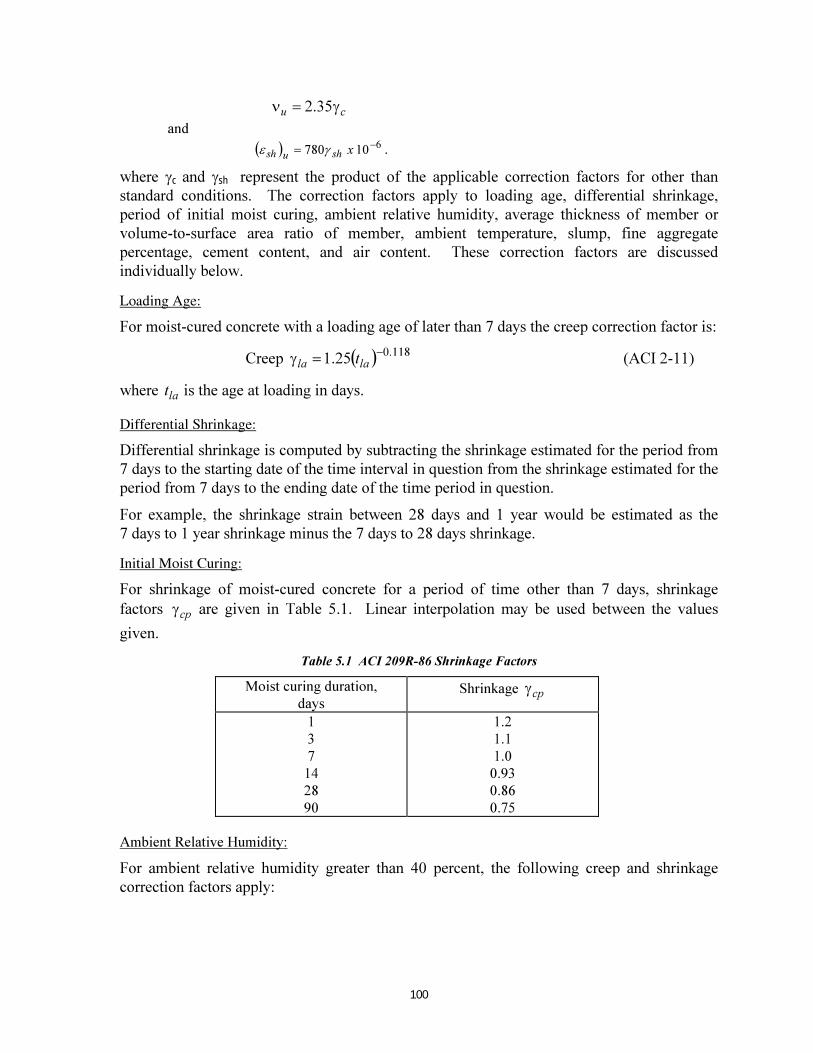
100
cuγ=ν 35.2
and
( ) 610780
−
= xshush γε .
where γc and γsh represent the product of the applicable correction factors for other than
standard conditions. The correction factors apply to loading age, differential shrinkage,
period of initial moist curing, ambient relative humidity, average thickness of member or
volume-to-surface area ratio of member, ambient temperature, slump, fine aggregate
percentage, cement content, and air content. These correction factors are discussed
individually below.
�����������
For moist-cured concrete with a loading age of later than 7 days the creep correction factor is:
Creep ( ) 118.025.1
−
=γ lala t (ACI 2-11)
where lat is the age at loading in days.
�� �����������������
Differential shrinkage is computed by subtracting the shrinkage estimated for the period from
7 days to the starting date of the time interval in question from the shrinkage estimated for the
period from 7 days to the ending date of the time period in question.
For example, the shrinkage strain between 28 days and 1 year would be estimated as the
7 days to 1 year shrinkage minus the 7 days to 28 days shrinkage.
����������������������
For shrinkage of moist-cured concrete for a period of time other than 7 days, shrinkage
factors cpγ are given in Table 5.1. Linear interpolation may be used between the values
given.
Table 5.1 ACI 209R-86 Shrinkage Factors
Moist curing duration,
days Shrinkage
cpγ
1
3
7
14
28
90
1.2
1.1
1.0
0.93
0.86
0.75
Ambient Relative Humidity:
For ambient relative humidity greater than 40 percent, the following creep and shrinkage
correction factors apply:
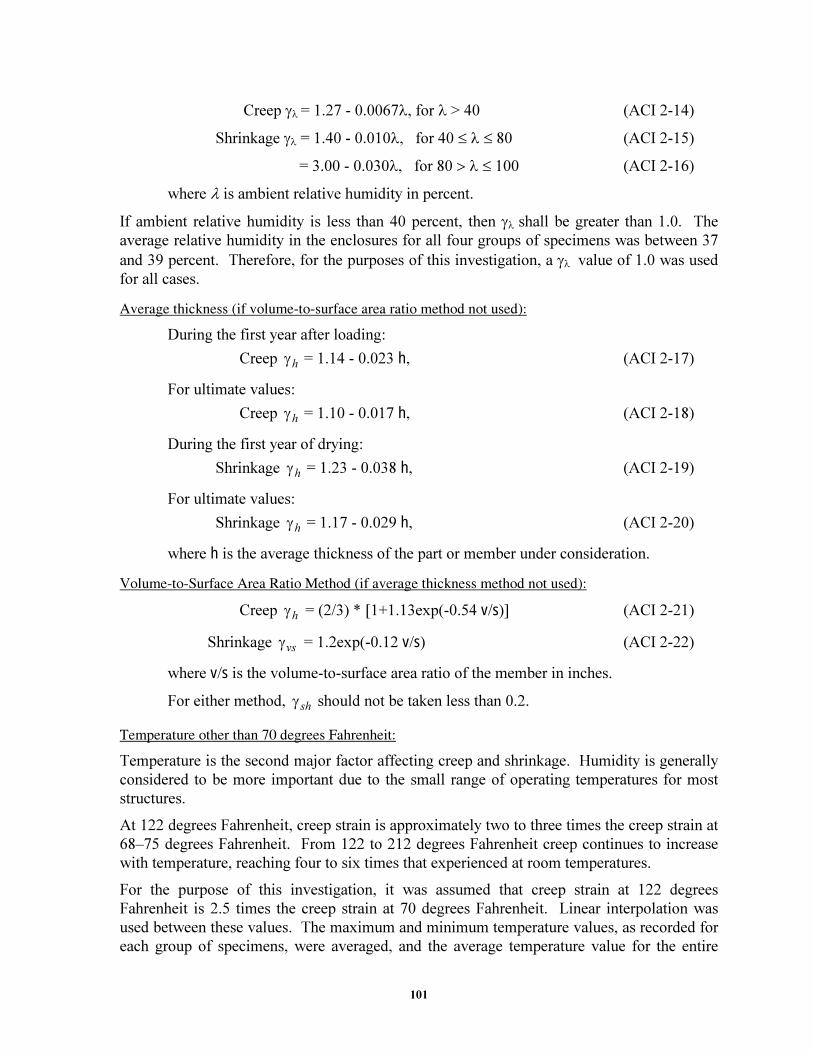
101
Creep γλ = 1.27 - 0.0067λ, for λ > 40 (ACI 2-14)
Shrinkage γλ = 1.40 - 0.010λ, for 40 ≤ λ ≤ 80 (ACI 2-15)
= 3.00 - 0.030λ, for 80 > λ ≤ 100 (ACI 2-16)
where λ is ambient relative humidity in percent.
If ambient relative humidity is less than 40 percent, then γλ shall be greater than 1.0. The
average relative humidity in the enclosures for all four groups of specimens was between 37
and 39 percent. Therefore, for the purposes of this investigation, a γλ value of 1.0 was used
for all cases.
���������������� ������������� �����������������������������
During the first year after loading:
Creep hγ = 1.14 - 0.023 h, (ACI 2-17)
For ultimate values:
Creep hγ = 1.10 - 0.017 h, (ACI 2-18)
During the first year of drying:
Shrinkage hγ = 1.23 - 0.038 h, (ACI 2-19)
For ultimate values:
Shrinkage hγ = 1.17 - 0.029 h, (ACI 2-20)
where h is the average thickness of the part or member under consideration.
������������ ������ ������������� ��������������������������������
Creep hγ = (2/3) * [1+1.13exp(-0.54 v/s)] (ACI 2-21)
Shrinkage vsγ = 1.2exp(-0.12 v/s) (ACI 2-22)
where v/s is the volume-to-surface area ratio of the member in inches.
For either method, shγ should not be taken less than 0.2.
!�"����������������#$������%���������
Temperature is the second major factor affecting creep and shrinkage. Humidity is generally
considered to be more important due to the small range of operating temperatures for most
structures.
At 122 degrees Fahrenheit, creep strain is approximately two to three times the creep strain at
68–75 degrees Fahrenheit. From 122 to 212 degrees Fahrenheit creep continues to increase
with temperature, reaching four to six times that experienced at room temperatures.
For the purpose of this investigation, it was assumed that creep strain at 122 degrees
Fahrenheit is 2.5 times the creep strain at 70 degrees Fahrenheit. Linear interpolation was
used between these values. The maximum and minimum temperature values, as recorded for
each group of specimens, were averaged, and the average temperature value for the entire
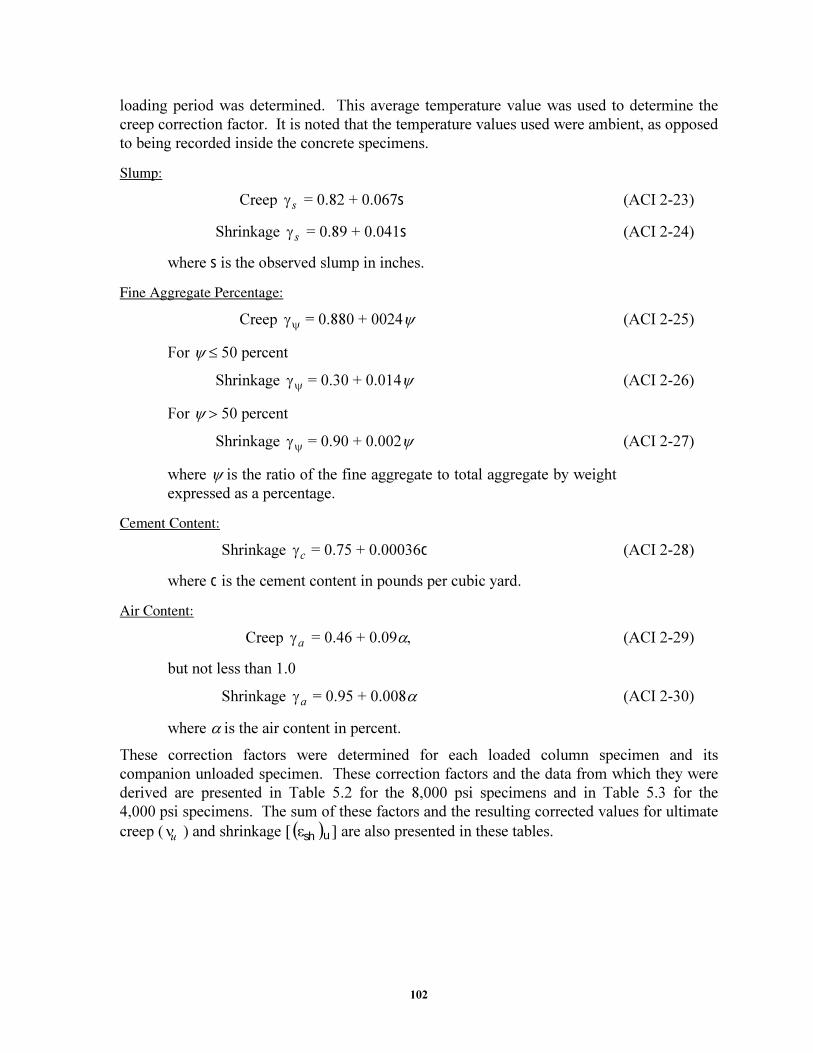
102
loading period was determined. This average temperature value was used to determine the
creep correction factor. It is noted that the temperature values used were ambient, as opposed
to being recorded inside the concrete specimens.
����"��
Creep sγ = 0.82 + 0.067s (ACI 2-23)
Shrinkage sγ = 0.89 + 0.041s (ACI 2-24)
where s is the observed slump in inches.
%����������&��������
Creep ψγ = 0.880 + 0024ψ (ACI 2-25)
For ψ ≤ 50 percent
Shrinkage ψγ = 0.30 + 0.014ψ (ACI 2-26)
For ψ > 50 percent
Shrinkage ψγ = 0.90 + 0.002ψ (ACI 2-27)
where ψ is the ratio of the fine aggregate to total aggregate by weight
expressed as a percentage.
�������������
Shrinkage cγ = 0.75 + 0.00036c (ACI 2-28)
where c is the cement content in pounds per cubic yard.
������������
Creep aγ = 0.46 + 0.09α, (ACI 2-29)
but not less than 1.0
Shrinkage aγ = 0.95 + 0.008α (ACI 2-30)
where α is the air content in percent.
These correction factors were determined for each loaded column specimen and its
companion unloaded specimen. These correction factors and the data from which they were
derived are presented in Table 5.2 for the 8,000 psi specimens and in Table 5.3 for the
4,000 psi specimens. The sum of these factors and the resulting corrected values for ultimate
creep ( uν ) and shrinkage [ ( )ushε ] are also presented in these tables.
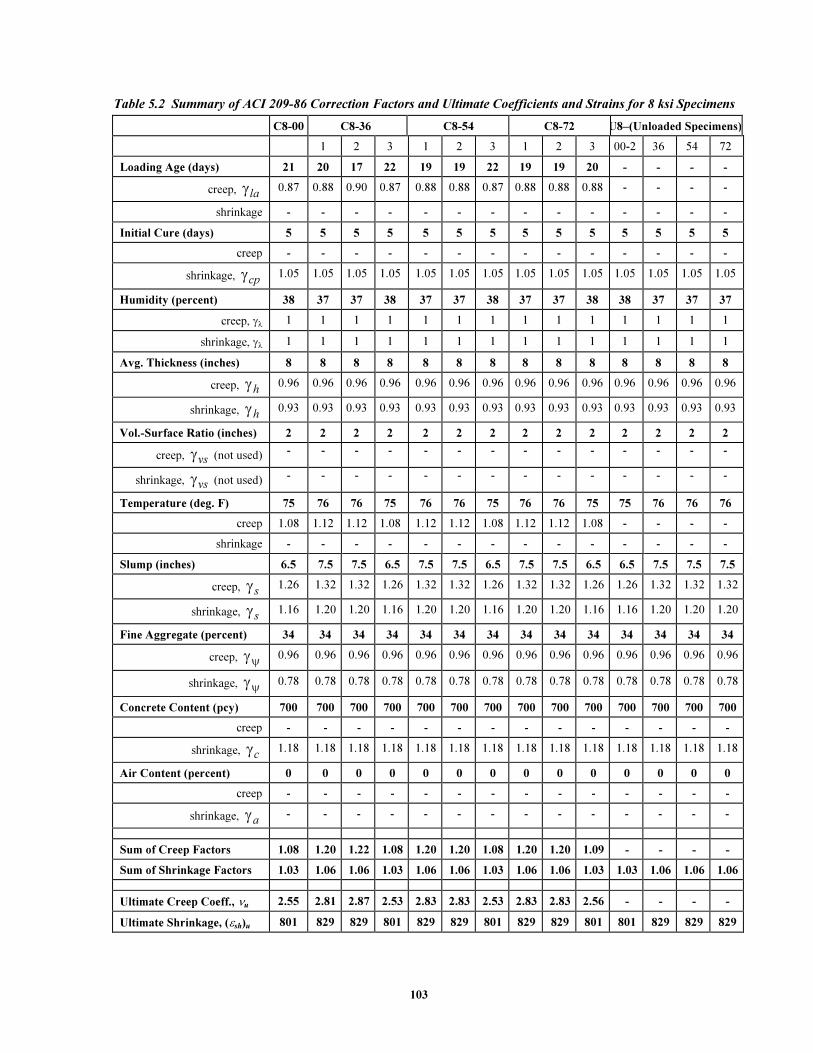
103
Table 5.2 Summary of ACI 209-86 Correction Factors and Ultimate Coefficients and Strains for 8 ksi Specimens
C8-00 C8-36 C8-54 C8-72 U8–(Unloaded Specimens)
1 2 3 1 2 3 1 2 3 00-2 36 54 72
Loading Age (days) 21 20 17 22 19 19 22 19 19 20 - - - -
creep, laγ 0.87 0.88 0.90 0.87 0.88 0.88 0.87 0.88 0.88 0.88 - - - -
shrinkage - - - - - - - - - - - - - -
Initial Cure (days) 5 5 5 5 5 5 5 5 5 5 5 5 5 5
creep - - - - - - - - - - - - - -
shrinkage, cpγ 1.05 1.05 1.05 1.05 1.05 1.05 1.05 1.05 1.05 1.05 1.05 1.05 1.05 1.05
Humidity (percent) 38 37 37 38 37 37 38 37 37 38 38 37 37 37
creep, γλ 1 1 1 1 1 1 1 1 1 1 1 1 1 1
shrinkage, γλ 1 1 1 1 1 1 1 1 1 1 1 1 1 1
Avg. Thickness (inches) 8 8 8 8 8 8 8 8 8 8 8 8 8 8
creep, hγ 0.96 0.96 0.96 0.96 0.96 0.96 0.96 0.96 0.96 0.96 0.96 0.96 0.96 0.96
shrinkage, hγ 0.93 0.93 0.93 0.93 0.93 0.93 0.93 0.93 0.93 0.93 0.93 0.93 0.93 0.93
Vol.-Surface Ratio (inches) 2 2 2 2 2 2 2 2 2 2 2 2 2 2
creep, vsγ
(not used) - - - - - - - - - - - - - -
shrinkage, vsγ
(not used) - - - - - - - - - - - - - -
Temperature (deg. F) 75 76 76 75 76 76 75 76 76 75 75 76 76 76
creep 1.08 1.12 1.12 1.08 1.12 1.12 1.08 1.12 1.12 1.08 - - - -
shrinkage - - - - - - - - - - - - - -
Slump (inches) 6.5 7.5 7.5 6.5 7.5 7.5 6.5 7.5 7.5 6.5 6.5 7.5 7.5 7.5
creep, sγ 1.26 1.32 1.32 1.26 1.32 1.32 1.26 1.32 1.32 1.26 1.26 1.32 1.32 1.32
shrinkage, sγ 1.16 1.20 1.20 1.16 1.20 1.20 1.16 1.20 1.20 1.16 1.16 1.20 1.20 1.20
Fine Aggregate (percent) 34 34 34 34 34 34 34 34 34 34 34 34 34 34
creep, ψγ 0.96 0.96 0.96 0.96 0.96 0.96 0.96 0.96 0.96 0.96 0.96 0.96 0.96 0.96
shrinkage, ψγ 0.78 0.78 0.78 0.78 0.78 0.78 0.78 0.78 0.78 0.78 0.78 0.78 0.78 0.78
Concrete Content (pcy) 700 700 700 700 700 700 700 700 700 700 700 700 700 700
creep - - - - - - - - - - - - - -
shrinkage, cγ 1.18 1.18 1.18 1.18 1.18 1.18 1.18 1.18 1.18 1.18 1.18 1.18 1.18 1.18
Air Content (percent) 0 0 0 0 0 0 0 0 0 0 0 0 0 0
creep - - - - - - - - - - - - - -
shrinkage, aγ - - - - - - - - - - - - - -
Sum of Creep Factors 1.08 1.20 1.22 1.08 1.20 1.20 1.08 1.20 1.20 1.09 - - - -
Sum of Shrinkage Factors 1.03 1.06 1.06 1.03 1.06 1.06 1.03 1.06 1.06 1.03 1.03 1.06 1.06 1.06
Ultimate Creep Coeff., νu 2.55 2.81 2.87 2.53 2.83 2.83 2.53 2.83 2.83 2.56 - - - -
Ultimate Shrinkage, (εsh)u 801 829 829 801 829 829 801 829 829 801 801 829 829 829
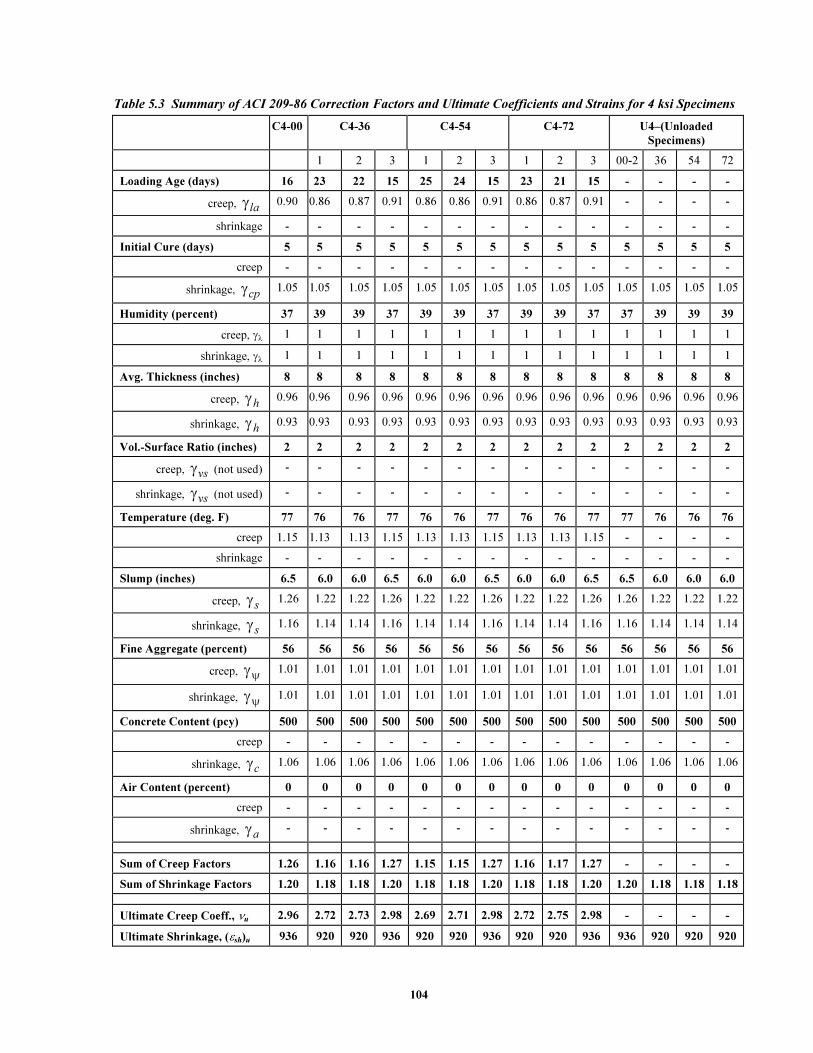
104
Table 5.3 Summary of ACI 209-86 Correction Factors and Ultimate Coefficients and Strains for 4 ksi Specimens
C4-00 C4-36 C4-54 C4-72 U4–(Unloaded
Specimens)
1 2 3 1 2 3 1 2 3 00-2 36 54 72
Loading Age (days) 16 23 22 15 25 24 15 23 21 15 - - - -
creep, laγ 0.90 0.86 0.87 0.91 0.86 0.86 0.91 0.86 0.87 0.91 - - - -
shrinkage - - - - - - - - - - - - - -
Initial Cure (days) 5 5 5 5 5 5 5 5 5 5 5 5 5 5
creep - - - - - - - - - - - - - -
shrinkage, cpγ 1.05 1.05 1.05 1.05 1.05 1.05 1.05 1.05 1.05 1.05 1.05 1.05 1.05 1.05
Humidity (percent) 37 39 39 37 39 39 37 39 39 37 37 39 39 39
creep, γλ 1 1 1 1 1 1 1 1 1 1 1 1 1 1
shrinkage, γλ 1 1 1 1 1 1 1 1 1 1 1 1 1 1
Avg. Thickness (inches) 8 8 8 8 8 8 8 8 8 8 8 8 8 8
creep, hγ 0.96 0.96 0.96 0.96 0.96 0.96 0.96 0.96 0.96 0.96 0.96 0.96 0.96 0.96
shrinkage, hγ 0.93 0.93 0.93 0.93 0.93 0.93 0.93 0.93 0.93 0.93 0.93 0.93 0.93 0.93
Vol.-Surface Ratio (inches) 2 2 2 2 2 2 2 2 2 2 2 2 2 2
creep, vsγ
(not used) - - - - - - - - - - - - - -
shrinkage, vsγ
(not used) - - - - - - - - - - - - - -
Temperature (deg. F) 77 76 76 77 76 76 77 76 76 77 77 76 76 76
creep 1.15 1.13 1.13 1.15 1.13 1.13 1.15 1.13 1.13 1.15 - - - -
shrinkage - - - - - - - - - - - - - -
Slump (inches) 6.5 6.0 6.0 6.5 6.0 6.0 6.5 6.0 6.0 6.5 6.5 6.0 6.0 6.0
creep, sγ 1.26 1.22 1.22 1.26 1.22 1.22 1.26 1.22 1.22 1.26 1.26 1.22 1.22 1.22
shrinkage, sγ 1.16 1.14 1.14 1.16 1.14 1.14 1.16 1.14 1.14 1.16 1.16 1.14 1.14 1.14
Fine Aggregate (percent) 56 56 56 56 56 56 56 56 56 56 56 56 56 56
creep, ψγ 1.01 1.01 1.01 1.01 1.01 1.01 1.01 1.01 1.01 1.01 1.01 1.01 1.01 1.01
shrinkage, ψγ 1.01 1.01 1.01 1.01 1.01 1.01 1.01 1.01 1.01 1.01 1.01 1.01 1.01 1.01
Concrete Content (pcy) 500 500 500 500 500 500 500 500 500 500 500 500 500 500
creep - - - - - - - - - - - - - -
shrinkage, cγ 1.06 1.06 1.06 1.06 1.06 1.06 1.06 1.06 1.06 1.06 1.06 1.06 1.06 1.06
Air Content (percent) 0 0 0 0 0 0 0 0 0 0 0 0 0 0
creep - - - - - - - - - - - - - -
shrinkage, aγ - - - - - - - - - - - - - -
Sum of Creep Factors 1.26 1.16 1.16 1.27 1.15 1.15 1.27 1.16 1.17 1.27 - - - -
Sum of Shrinkage Factors 1.20 1.18 1.18 1.20 1.18 1.18 1.20 1.18 1.18 1.20 1.20 1.18 1.18 1.18
Ultimate Creep Coeff., νu 2.96 2.72 2.73 2.98 2.69 2.71 2.98 2.72 2.75 2.98 - - - -
Ultimate Shrinkage, (εsh)u 936 920 920 936 920 920 936 920 920 936 936 920 920 920
105
5.3 COMPARISON OF PREDICTED AND EXPERIMENTAL RESULTS
The equations for creep and shrinkage discussed above were applied to the specimens, and
the predicted results are plotted with the experimental results. Results are shown for each of
the four groups of specimens because the environmental conditions and concrete composition
varied significantly from group to group.
The predicted initial strains due to axial load were computed using the transformed section.
The 28-day modulus for the concrete was obtained from the compressive-strength data for the
average of three 6 x 12 inch cylinders. The value used for the 28-day modulus of concrete
was 57,000 * (fc')
0.5, and the modulus used for the reinforcing steel was 29,000 ksi. The initial
strain calculation based on the transformed section is as follows:
initialε =
cigggg EAnA
P
⋅ρ+ρ− ])1([ Equation 5.1
where
initialε.
= initial strain in reinforced concrete specimen due to applied
load
P.= applied axial load
g
A.
= gross cross-sectional area of concrete column
ciE.
= concrete modulus at time of loading (taken as 28-day concrete
modulus)
stA.
= total area of longitudinal reinforcing steel
n.= modular ratio ( stE / ciE )
stE.
= modulus of steel reinforcement
gρ .= stA /
gA
The effective modulus was used in conjunction with the transformed section to predict strains
due to creep and load. In this approach, the effective concrete modulus is simply substituted
for the initial concrete modulus when computing strains. The calculation for the effective
modulus is as follows:
.effE = )1(t
ciE
ν+
(ACI 3-1)
where
.effE .= Effective modulus of concrete at time considered after loading
ciE.
= modulus of concrete at time of loading (taken as 28-day concrete modulus)
t
ν.
= creep coefficient at time t
t.= time after load (in days)
106
therefore
initialε + ( )tcreepε =
..
])1([ effeffgggg EnAA
P
⋅ρ+ρ− Equation 5.2
where all values are as before except:
( )tcreepε
.
= strain in reinforced specimen due to creep at time considered after loading
.effn.
= modular ratio at time considered after loading (Est /Eeff.)
Shrinkage strains were obtained by applying the resisting force in the longitudinal steel to the
transformed area of the concrete column specimen. The resisting force due to the steel as the
concrete attempts to shrink is computed as:
resistingP = ( )tshε st
E gA
gρ Equation 5.3
where all terms are as before except:
resistingP
= resisting force developed in longitudinal reinforcing
steel due to shrinkage of concrete.
Applying this resisting force to the transformed column section results in the following
equation for strain due to shrinkage:
(εshrinkage )t = (εsh)t – }])1([
)({
.. effeffgggg
ggsttsh
EnAA
AE
⋅ρ+ρ−
ρε Equation 5.4
Total strain is obtained by summing the initial, creep, and shrinkage strains.
( ) ( )[ ] ( )tshrinkagetcreepinitialttotal ε+ε+ε=ε Equation 5.5
These equations where used to predict strain histories for the specimens by varying time after
loading and calculating total strain at that time. Predicted responses are presented with
measured strain data presented previously in Chapter 4 of this report. Results of the
comparisons are presented in the following figures:
Design Concrete Strength Group Figure
8,000 psi 1 5.1
8,000 psi 2 5.2
4,000 psi 3 5.3
4,000 psi 4 5.4
Curves plotted with solid lines represent the measured Demec strains modified for
temperature with the loading day plotted as day zero. Dashed curves represent the responses
predicted using ACI 209-86 considering the measured conditions (e.g., temperature and
slump).
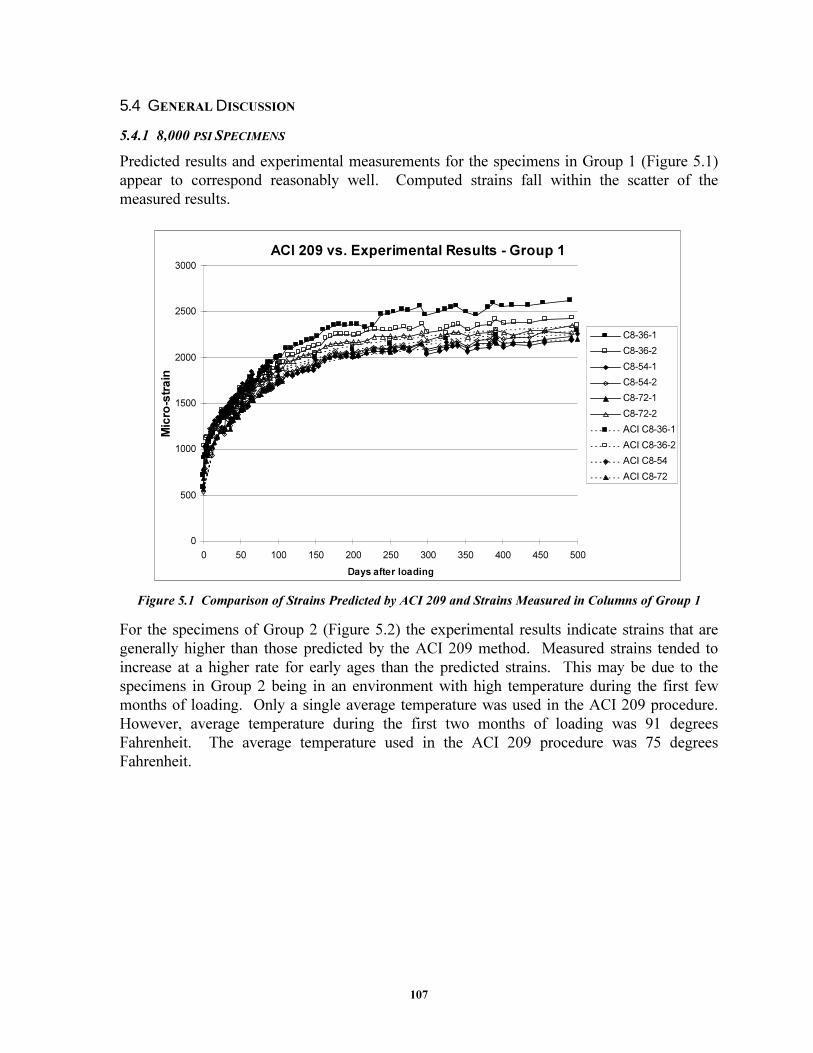
107
5.4 GENERAL DISCUSSION
5.4.1 8,000 PSI SPECIMENS
Predicted results and experimental measurements for the specimens in Group 1 (Figure 5.1)
appear to correspond reasonably well. Computed strains fall within the scatter of the
measured results.
ACI 209 vs. Experimental Results - Group 1
0
500
1000
1500
2000
2500
3000
0 50 100 150 200 250 300 350 400 450 500
Days after loading
Micro-strain
C8-36-1
C8-36-2
C8-54-1
C8-54-2
C8-72-1
C8-72-2
ACI C8-36-1
ACI C8-36-2
ACI C8-54
ACI C8-72
Figure 5.1 Comparison of Strains Predicted by ACI 209 and Strains Measured in Columns of Group 1
For the specimens of Group 2 (Figure 5.2) the experimental results indicate strains that are
generally higher than those predicted by the ACI 209 method. Measured strains tended to
increase at a higher rate for early ages than the predicted strains. This may be due to the
specimens in Group 2 being in an environment with high temperature during the first few
months of loading. Only a single average temperature was used in the ACI 209 procedure.
However, average temperature during the first two months of loading was 91 degrees
Fahrenheit. The average temperature used in the ACI 209 procedure was 75 degrees
Fahrenheit.
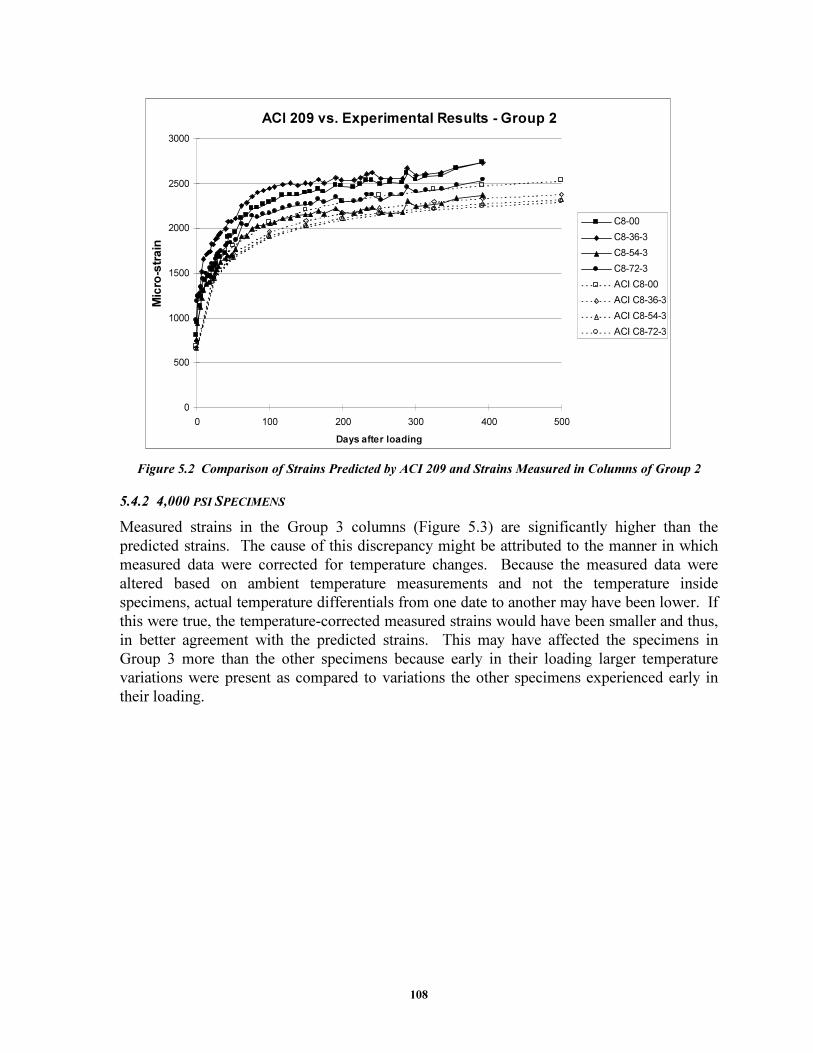
108
ACI 209 vs. Experimental Results - Group 2
0
500
1000
1500
2000
2500
3000
0 100 200 300 400 500
Days after loading
Micro-strain
C8-00
C8-36-3
C8-54-3
C8-72-3
ACI C8-00
ACI C8-36-3
ACI C8-54-3
ACI C8-72-3
Figure 5.2 Comparison of Strains Predicted by ACI 209 and Strains Measured in Columns of Group 2
5.4.2 4,000 PSI SPECIMENS
Measured strains in the Group 3 columns (Figure 5.3) are significantly higher than the
predicted strains. The cause of this discrepancy might be attributed to the manner in which
measured data were corrected for temperature changes. Because the measured data were
altered based on ambient temperature measurements and not the temperature inside
specimens, actual temperature differentials from one date to another may have been lower. If
this were true, the temperature-corrected measured strains would have been smaller and thus,
in better agreement with the predicted strains. This may have affected the specimens in
Group 3 more than the other specimens because early in their loading larger temperature
variations were present as compared to variations the other specimens experienced early in
their loading.
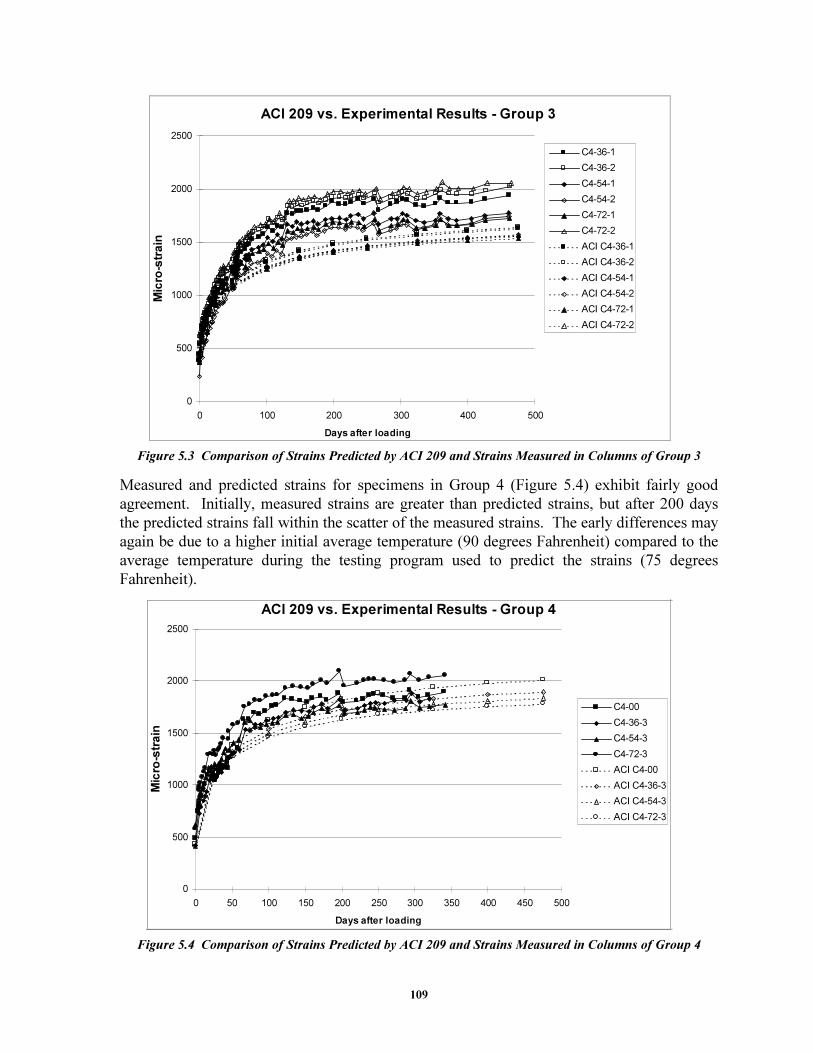
109
ACI 209 vs. Experimental Results - Group 3
0
500
1000
1500
2000
2500
0 100 200 300 400 500
Days after loading
Micro-strain
C4-36-1
C4-36-2
C4-54-1
C4-54-2
C4-72-1
C4-72-2
ACI C4-36-1
ACI C4-36-2
ACI C4-54-1
ACI C4-54-2
ACI C4-72-1
ACI C4-72-2
Figure 5.3 Comparison of Strains Predicted by ACI 209 and Strains Measured in Columns of Group 3
Measured and predicted strains for specimens in Group 4 (Figure 5.4) exhibit fairly good
agreement. Initially, measured strains are greater than predicted strains, but after 200 days
the predicted strains fall within the scatter of the measured strains. The early differences may
again be due to a higher initial average temperature (90 degrees Fahrenheit) compared to the
average temperature during the testing program used to predict the strains (75 degrees
Fahrenheit).
ACI 209 vs. Experimental Results - Group 4
0
500
1000
1500
2000
2500
0 50 100 150 200 250 300 350 400 450 500
Days after loading
Micro-strain
C4-00
C4-36-3
C4-54-3
C4-72-3
ACI C4-00
ACI C4-36-3
ACI C4-54-3
ACI C4-72-3
Figure 5.4 Comparison of Strains Predicted by ACI 209 and Strains Measured in Columns of Group 4

110
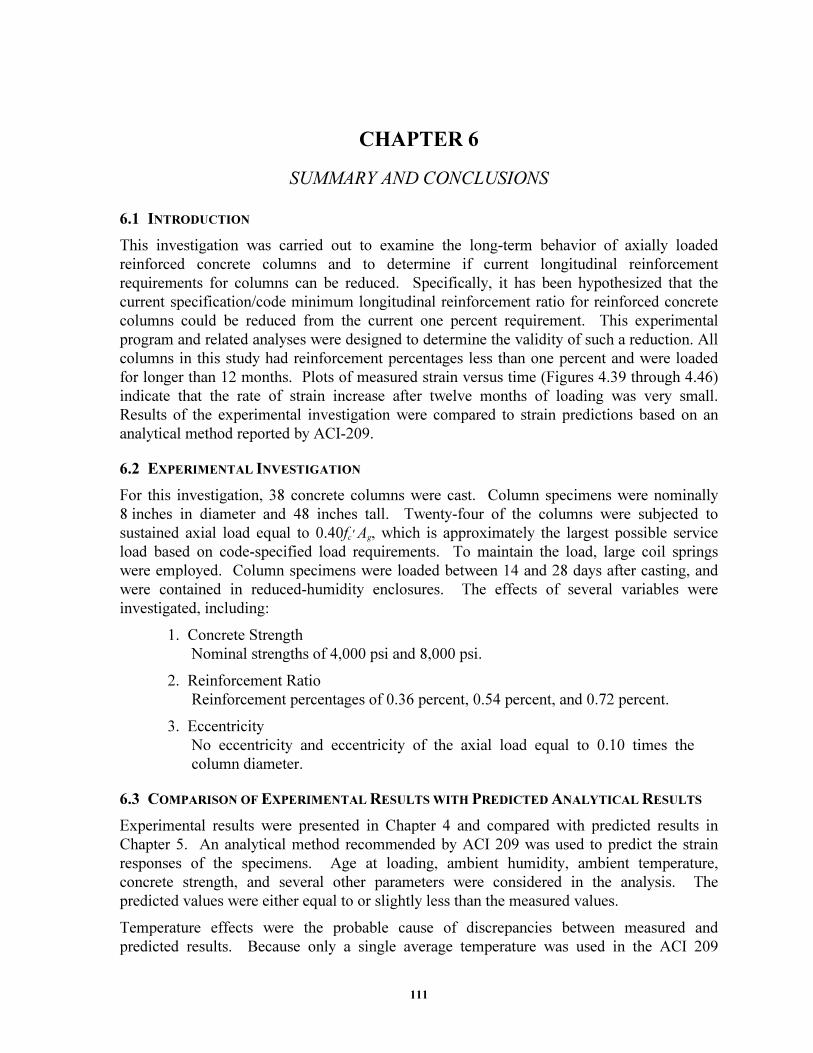
111
CHAPTER 6
SUMMARY AND CONCLUSIONS
6.1 INTRODUCTION
This investigation was carried out to examine the long-term behavior of axially loaded
reinforced concrete columns and to determine if current longitudinal reinforcement
requirements for columns can be reduced. Specifically, it has been hypothesized that the
current specification/code minimum longitudinal reinforcement ratio for reinforced concrete
columns could be reduced from the current one percent requirement. This experimental
program and related analyses were designed to determine the validity of such a reduction. All
columns in this study had reinforcement percentages less than one percent and were loaded
for longer than 12 months. Plots of measured strain versus time (Figures 4.39 through 4.46)
indicate that the rate of strain increase after twelve months of loading was very small.
Results of the experimental investigation were compared to strain predictions based on an
analytical method reported by ACI-209.
6.2 EXPERIMENTAL INVESTIGATION
For this investigation, 38 concrete columns were cast. Column specimens were nominally
8 inches in diameter and 48 inches tall. Twenty-four of the columns were subjected to
sustained axial load equal to 0.40fc' Ag, which is approximately the largest possible service
load based on code-specified load requirements. To maintain the load, large coil springs
were employed. Column specimens were loaded between 14 and 28 days after casting, and
were contained in reduced-humidity enclosures. The effects of several variables were
investigated, including:
1. Concrete Strength
Nominal strengths of 4,000 psi and 8,000 psi.
2. Reinforcement Ratio
Reinforcement percentages of 0.36 percent, 0.54 percent, and 0.72 percent.
3. Eccentricity
No eccentricity and eccentricity of the axial load equal to 0.10 times the
column diameter.
6.3 COMPARISON OF EXPERIMENTAL RESULTS WITH PREDICTED ANALYTICAL RESULTS
Experimental results were presented in Chapter 4 and compared with predicted results in
Chapter 5. An analytical method recommended by ACI 209 was used to predict the strain
responses of the specimens. Age at loading, ambient humidity, ambient temperature,
concrete strength, and several other parameters were considered in the analysis. The
predicted values were either equal to or slightly less than the measured values.
Temperature effects were the probable cause of discrepancies between measured and
predicted results. Because only a single average temperature was used in the ACI 209
112
method, elevated temperatures experienced by specimens in groups 2 and 4 during the initial
two months of loading were not reflected in the computed responses. The early high
temperatures tended to increase early strains measured in the specimens. Additionally,
measured data were corrected for temperature differentials, but temperatures used were
ambient temperatures, not internal column temperatures.
6.4 CONCLUSIONS
Although the specimens had not ceased creeping when data collection was discontinued, the
rate of creep had dropped to a sufficiently low level to provide confidence in any conclusions
drawn from the recorded data. Several conclusions can be made from the experimental and
analytical results.
1. Temperature and humidity affect creep and shrinkage significantly.
2. Strain response predictions made using the ACI 209 method agreed reasonably
well with measured data but tended to under-predict strains when higher
temperatures were encountered early in the loading period.
3. It was necessary to correct measured strains for temperature effects to produce
reasonable results.
4. As the ratio of dead-to-live load increases, the amount of steel required to
prevent passive yielding increases.
5. As concrete compressive strength increases, the amount of steel needed to
prevent passive yielding increases.
6. If the conditions which cause creep in concrete are at the standard values as
defined by ACI Committee 209, then for many material strengths and live
load-to-dead load ratios, the minimum percentage of longitudinal
reinforcement can be reduced below one percent. This is demonstrated in
Table 1.1 in Chapter 1.
7. If the conditions which cause creep in concrete are at the upper-bound values
as reported by ACI Committee 209, then for many material strengths and live
load-to-dead load ratios, the minimum percentage of longitudinal
reinforcement cannot be reduced below one percent. This is demonstrated in
Table 1.2 in Chapter 1.
8. From Conclusions 6 and 7, it appears that it may be acceptable to reduce the
minimum reinforcement requirement for certain conditions, but in general, it
cannot be reduced. To permit the minimum amount of steel to be reduced, a
design equation or table that accounts for material strengths, live load-to-dead
load ratio, and creep and shrinkage factors could be developed. Unfortunately,
the factors that affect creep and shrinkage are not typically within the
designer’s control (e.g., loading age, temperature, humidity, air content, and
cement content). If the worst case is assumed for these factors, the minimum
amount of steel that is needed in nearly all cases to preclude passive yielding
of longitudinal reinforcement is more than one percent of the gross cross
section.
113
9. The compression steel in all eccentrically-loaded columns reached strains well
beyond yield strain. None of the columns failed, but significant visible
curvature was present in all four. Test specimens had significant concrete
cover ( 83 inch or 1.5 db) and transverse reinforcement (ρs = .025). Had the
specimens been fabricated with less cover and reduced transverse
reinforcement with larger spacing, it is possible that spalling of cover and
instability of longitudinal reinforcement might have occurred for the
curvatures experienced in theses specimens.
6.5 FURTHER RESEARCH
A set of specifications could be developed to reduce the amount of creep in columns. These
specifications would likely require low water-cement ratios (possibly employing super-
plasticizers), low-permeability aggregates, and require longer periods before loading. Based
on these specifications a worst-case scenario for creep effects could be determined for
various loading conditions and material strengths. Recommendations could then be made for
reduced percentages of steel when these specifications are followed. A testing program to
verify the performance of columns designed with these specifications would be prudent.
Further research could also be directed towards determining the behavior of longitudinal
reinforcement after passive yielding occurs. The amount of cover required to prevent
buckling of longitudinal reinforcement between transverse ties could be determined.

114
115
REFERENCES
1. Raymond E Davis and Harmer E. Davis, “Flow of Concrete Under the Action of Sustained
Loads,” Journal of the American Concrete Institute, Vol. 2 - No. 7, Proceedings Vol. 27, p. 837,
March 1931.
2. F. E. Richart and G. C. Staehle, “Second Progress Report on Column Tests at the University of
Illinois,” Journal of the ACI, Vol. 2 - No. 7, Proceedings Vol. 27, p. 761, March 1931.
3. W. A. Slater and Inge Lyse, “Second Progress Report on Column Tests Made at Lehigh
University,” Journal of the ACI, Vol. 2 - No. 7, Proceedings Vol. 27, p. 791, March 1931.
4. F. E. Richart and G. C. Staehle, “Fourth Progress Report on Column Tests at the University of
Illinois,” Journal of the ACI, Vol. 3 - No. 5, Proceedings Vol. 28, p. 279, January 1932.
5. Inge Lyse and C. L. Kreidler, “Fourth Progress Report on Column Tests Made at Lehigh
University,” Journal of the ACI, Vol. 3 - No. 5, Proceedings Vol. 28, p. 317, January 1932.
6. Inge Lyse, “Fifth Progress Report on Column Tests Made at Lehigh University,” Journal of the
ACI, Vol. 4 - No. 9, Proceedings Vol. 29, p. 433, June 1933.
7. F. E. Richart (Chairman), R. L. Bertin and Inge Lyse, “‘Reinforced Concrete Column
Investigation’– Tentative Final Report of Committee 105, and Minority Recommendations for
Design Formula of Reinforced Concrete Columns,” Journal of the ACI, Vol. 4 - No. 6,
Proceedings Vol. 29, February 1933.
8. R. T. Logeman, Walter H. Wheeler, L. J. Mensch and J. Di Stasio, “Discussion of Report of
Committee 105: ‘Reinforced Concrete Column Investigation’– Tentative Final Report of
Committee 105 and Minority Recomendations for Design Formulas of Reinforced Concrete
Columns,” Journal of the ACI, Proceedings Vol. 30, p. 78, Sept.–Oct. 1933.
9. F. E. Richart (Chairman), “Discussion of Report of Committee 105: ‘Reinforced Concrete
Column Investigation’– Closure by Chairman, Committee 105,” Journal of the ACI,
Proceedings Vol. 30, p. 153, Nov.–Dec. 1933.
10. ACI 318-35, Committee 318, “Building Code requirements for Reinforced Concrete and
Commentary,” (ACI 318-35), ACI, Detroit, Michigan, 1935.
11. ACI Committee 318, “Building Code Requirements for Reinforced Concrete and
Commentary,” (ACI 318-95), ACI, Detroit, Michigan, 1995.
12. ACI 209-R86, “Prediction of Creep, shrinkage, and Temperature Effects in Concrete
Structures,” ACI, Detroit, Michigan, 1986.
13. S. Mindess and J.F. Young, “Concrete,” Prentice-Hall, Inc., Englewood Cliffs, New Jersey,
1981.
14. R. Green, “Behavior of Unrestrained Reinforced concrete columns Under Sustained Load,”
Dissertation, The University of Texas at Austin, January 1966.
15. C. H. Lin and R. W. Furlong, “Longitudinal Steel Limits for Concrete Columns,” ACI
Structural Journal, Vol. 92 - No. 3, p. 282, May–June 1995.
16. F. R. McMillan, “A Study of Column Test Data,” Journal of the American Concrete Institute,
Proceedings Vol. 17, p. 150, 1921.
116
17. W. H. Glanville, “Shrinkage Stresses” and “The Creep or Flow of Concrete Under Load,”
Technical Papers No. 11 and 12, Building Research Technical Papers, Dept. of Industrial
Research, England.
18. American Association of State Highway and Transportation Officials, “Standard Specification
for Highway Bridges,” Fifteenth Edition, Washington, DC, 1992.
19. J.E. Cloyd, “Investigation of Minimum Longitudinal Reinforcing Requirements for Concrete
Columns,” M.S. Thesis, The University of Texas at Austin, May 1998.